
Automated Traffic Signal Performance Measures
62
Automated Traffic Signal Performance Measures: UDOT’s Experience Mark Taylor, P.E., PTOE Traffic Signal Operations Engineer Utah Department of Transportation [email protected] EDC-4 • Regional Summit • October 25, 2016
-
Upload
khangminh22 -
Category
Documents
-
view
0 -
download
0
Transcript of Automated Traffic Signal Performance Measures

Automated Traffic Signal Performance
Measures: UDOT’s Experience
Mark Taylor, P.E., PTOETraffic Signal Operations Engineer
Utah Department of [email protected]
EDC-4 • Regional Summit • October 25, 2016

�2012 Traffic Signals in the State of Utah
�1192 owned and operated by UDOT (59%)
�820 owned and operated by cities /counties (41%)
�All cities share same ITS communications
�93% of UDOT signals connected
�79% of non-UDOT signals connected
�All cities in Utah & UDOT share same ATMS
Brief Utah Update

Wasatch Front
UtahGreen = UDOT Comm.
Blue = City Comm.
Red = No Comm.

UDOT’s Road Map
Vision: Keeping Utah Moving
Mission: Innovating transportation solutions that strengthen Utah’s economy and enhance quality of life.
Strategic Goals:
1. Zero Crashes, Injuries and FatalitiesYellow & Red Actuations, Speed, Preemption Details
2. Optimize MobilityPCD, Split Monitor, Volumes, Purdue Link Pivot, Purdue Split Failure
3. Preserve InfrastructurePurdue Phase Termination, Daily Detector Problem Email
4

Approach Volumes
Turning M
ovement Counts
Split Monitor
Purdue Phase Term
ination
Purdue Coordination Diagram
Purdue Travel Tim
e Diagram
Purdue Link Pivot
Purdue Split Failu
re
Percent Arrivals on G
reen
Detector Error Alarm
s
Executive R
eports
Yellow & Red Actuations
Approach Delay
Arrivals on R
ed
Speed
Pedestrian Delay
Preemption D
etails
Improve Traffic Flows X X X X X X X X
Improve Capacity Allocation X X X X X
Improve Pedestrian Service X X X X
Improve Bicycle Service X X X
Maintain Vehicle & Pedestrian Detection X X X X
Maintaning Preemption X
Minimize Pollution and Noise X X X X X X
Automate Traffic Counts & Studies X X X X
Develop Origin-Destination Data X
Improve Safety X X X X X
ObjectiveObjectiveObjectiveObjective
Automated Traffic Signal Performance MeasuresAutomated Traffic Signal Performance MeasuresAutomated Traffic Signal Performance MeasuresAutomated Traffic Signal Performance Measures
Source: UDOT Traffic Signal Management Plan -Table 4 Page 13: http://www.udot.utah.gov/main/uconowner.gf?n=29256708738824069
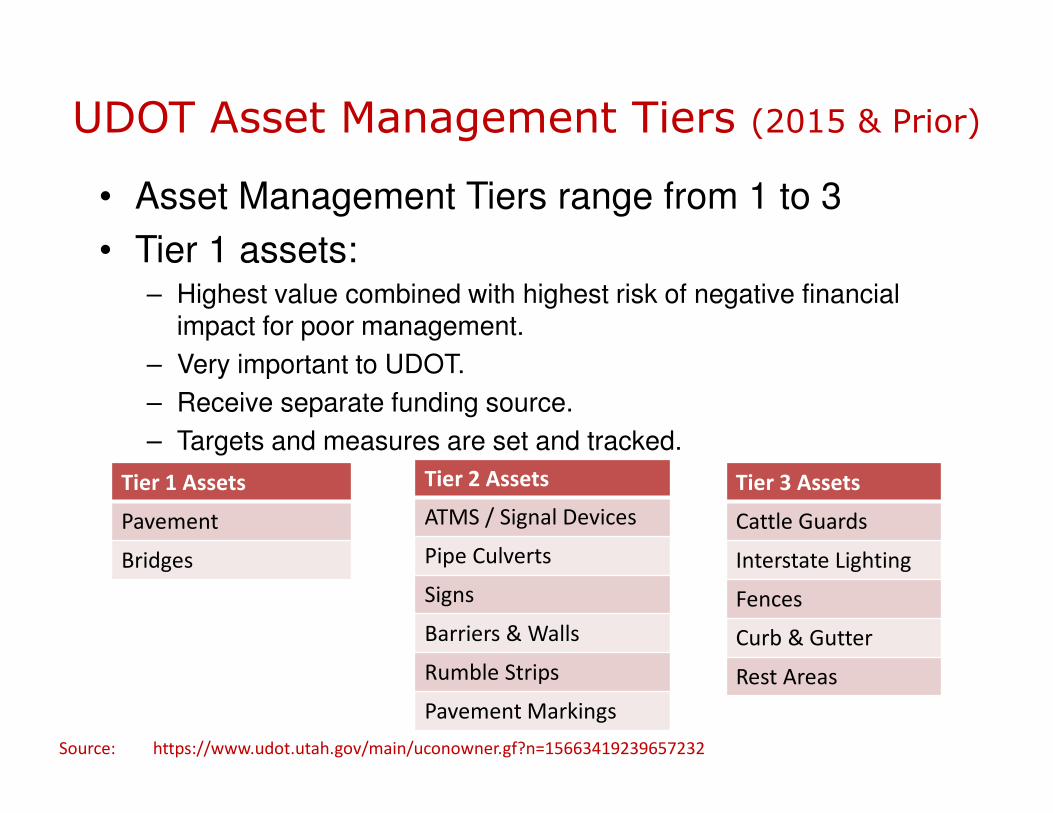
UDOT Asset Management Tiers (2015 & Prior)
• Asset Management Tiers range from 1 to 3
• Tier 1 assets:– Highest value combined with highest risk of negative financial
impact for poor management.
– Very important to UDOT.
– Receive separate funding source.
– Targets and measures are set and tracked.
Source: https://www.udot.utah.gov/main/uconowner.gf?n=15663419239657232
Tier 2 Assets
ATMS / Signal Devices
Pipe Culverts
Signs
Barriers & Walls
Rumble Strips
Pavement Markings
Tier 1 Assets
Pavement
Bridges
Tier 3 Assets
Cattle Guards
Interstate Lighting
Fences
Curb & Gutter
Rest Areas

UDOT Asset Management Tiers (2016 & Future)
• Asset Management Tiers range from 1 to 3
• Tier 1 assets:– Highest value combined with highest risk of negative financial
impact for poor management.
– Very important to UDOT.
– Receive separate funding source.
– Targets and measures are set and tracked.
Source: https://www.udot.utah.gov/main/uconowner.gf?n=15663419239657232
Tier 2 Assets
Pipe Culverts
Signs
Barriers & Walls
Rumble Strips
Pavement Markings
Tier 1 Assets
Pavement
Bridges
ATMS / Signal Devices
Tier 3 Assets
Cattle Guards
Interstate Lighting
Fences
Curb & Gutter
Rest Areas

ATSPM Basic Concept
- Signal controller- Probe source
- Signal- Corridor- System
Automated Data
Collection
Useful Information
about Performance
Why Model what you can Measure?
Does NOT require Central Traffic Signal Management Software!

Standard Controller Enumerations
http://docs.lib.purdue.edu/jtrpdata/3/

Standard Controller Enumerations
http://docs.lib.purdue.edu/jtrpdata/3/
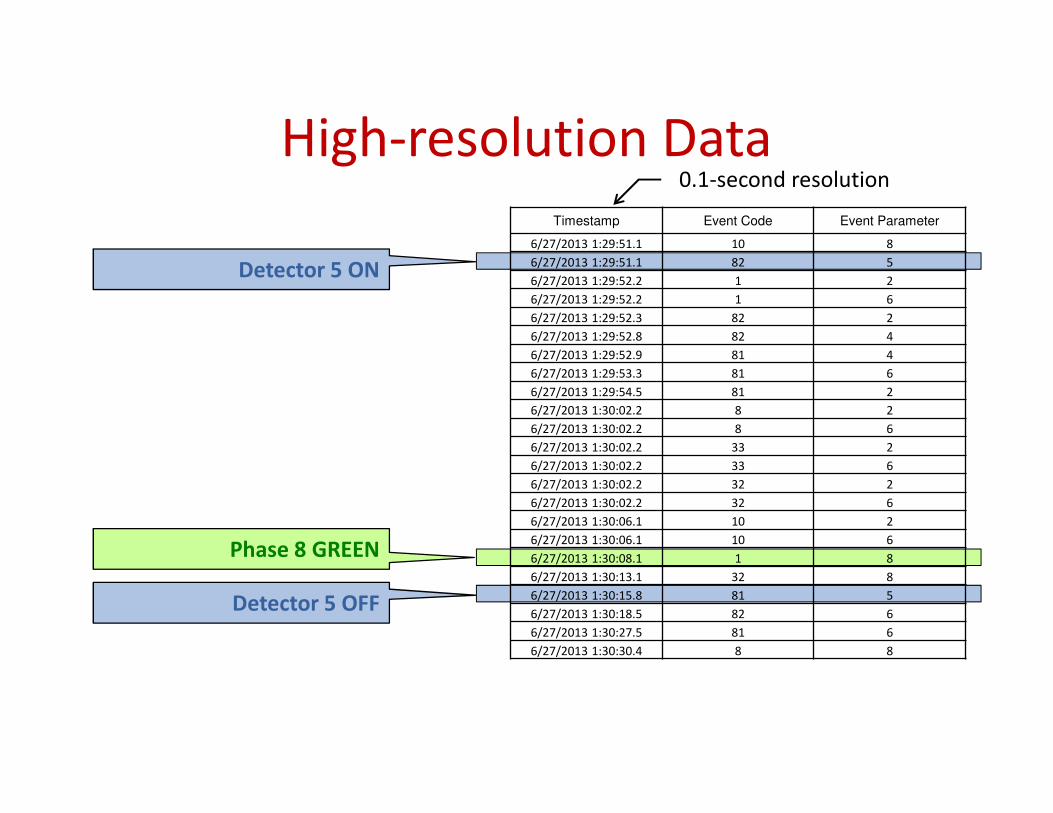
High-resolution Data
Detector 5 OFF
Phase 8 GREEN
Detector 5 ON
Timestamp Event Code Event Parameter
6/27/2013 1:29:51.1 10 8
6/27/2013 1:29:51.1 82 5
6/27/2013 1:29:52.2 1 2
6/27/2013 1:29:52.2 1 6
6/27/2013 1:29:52.3 82 2
6/27/2013 1:29:52.8 82 4
6/27/2013 1:29:52.9 81 4
6/27/2013 1:29:53.3 81 6
6/27/2013 1:29:54.5 81 2
6/27/2013 1:30:02.2 8 2
6/27/2013 1:30:02.2 8 6
6/27/2013 1:30:02.2 33 2
6/27/2013 1:30:02.2 33 6
6/27/2013 1:30:02.2 32 2
6/27/2013 1:30:02.2 32 6
6/27/2013 1:30:06.1 10 2
6/27/2013 1:30:06.1 10 6
6/27/2013 1:30:08.1 1 8
6/27/2013 1:30:13.1 32 8
6/27/2013 1:30:15.8 81 5
6/27/2013 1:30:18.5 82 6
6/27/2013 1:30:27.5 81 6
6/27/2013 1:30:30.4 8 8
0.1-second resolution

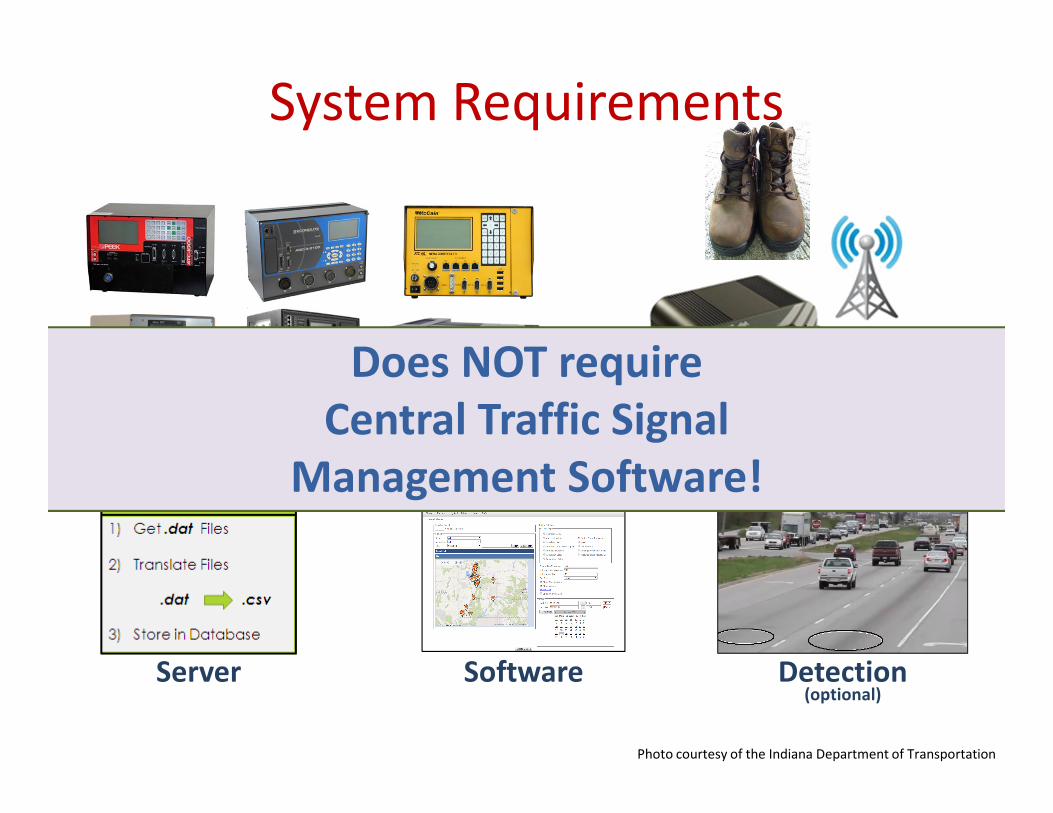
System Requirements
SoftwareServer
Communications
Photo courtesy of the Indiana Department of Transportation
Detection(optional)
High-resolution Controller
System Requirements
SoftwareServer
Communications
Photo courtesy of the Indiana Department of Transportation
Detection(optional)
High-resolution Controller
Does NOT require
Central Traffic Signal
Management Software!


http://udottraffic.utah.gov/signalperformancemetrics
1710 (85%) Utah’s traffic signals
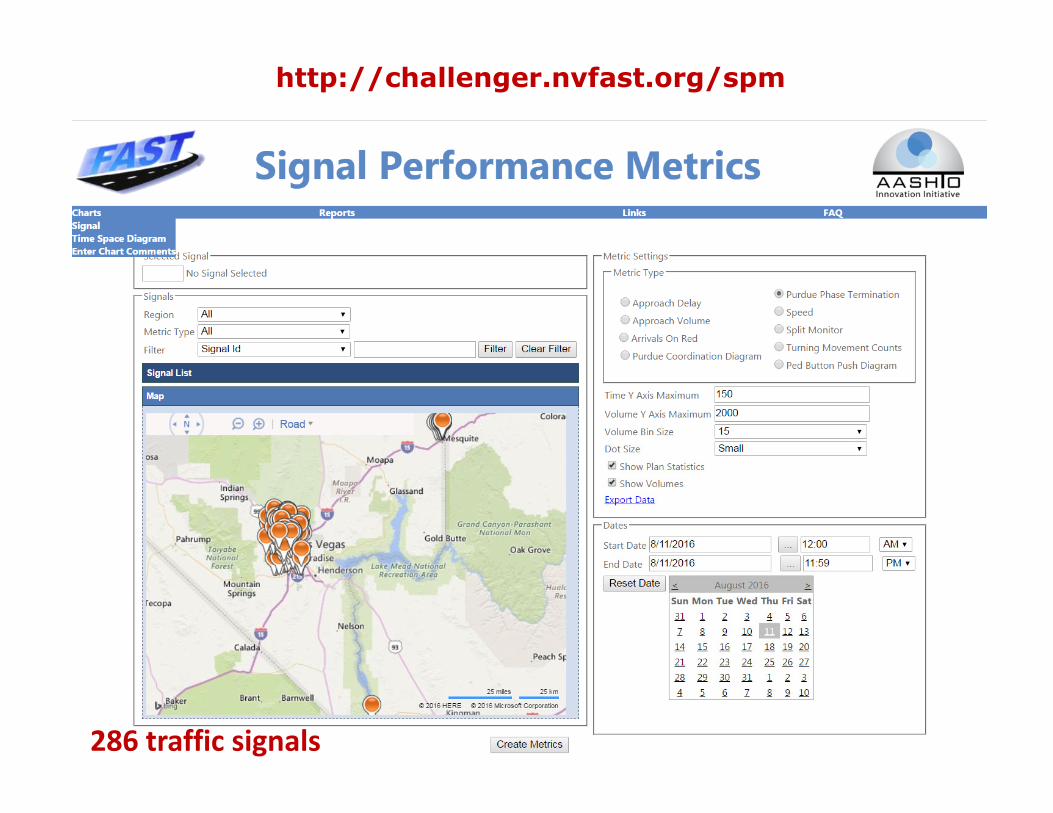
http://challenger.nvfast.org/spm
286 traffic signals

http://spm.seminolecountyfl.gov/signalperformancemetrics
316 traffic signals

http://signalmetrics.ua.edu
45 traffic signals

Agencies using SPMs – Separate systems deployed
(16 and growing)
MnDOT
OverlandPark, KS
All of Utah
INDOT
FDOT
Seminole County, FL
WISDOT
VDOT
GDOT
Tuscon, AZ
College Station, TX
Richardson, TX
PennDOT
Pocatello, ID
Las Vegas (FAST)
Tuscaloosa, AL
ODOT
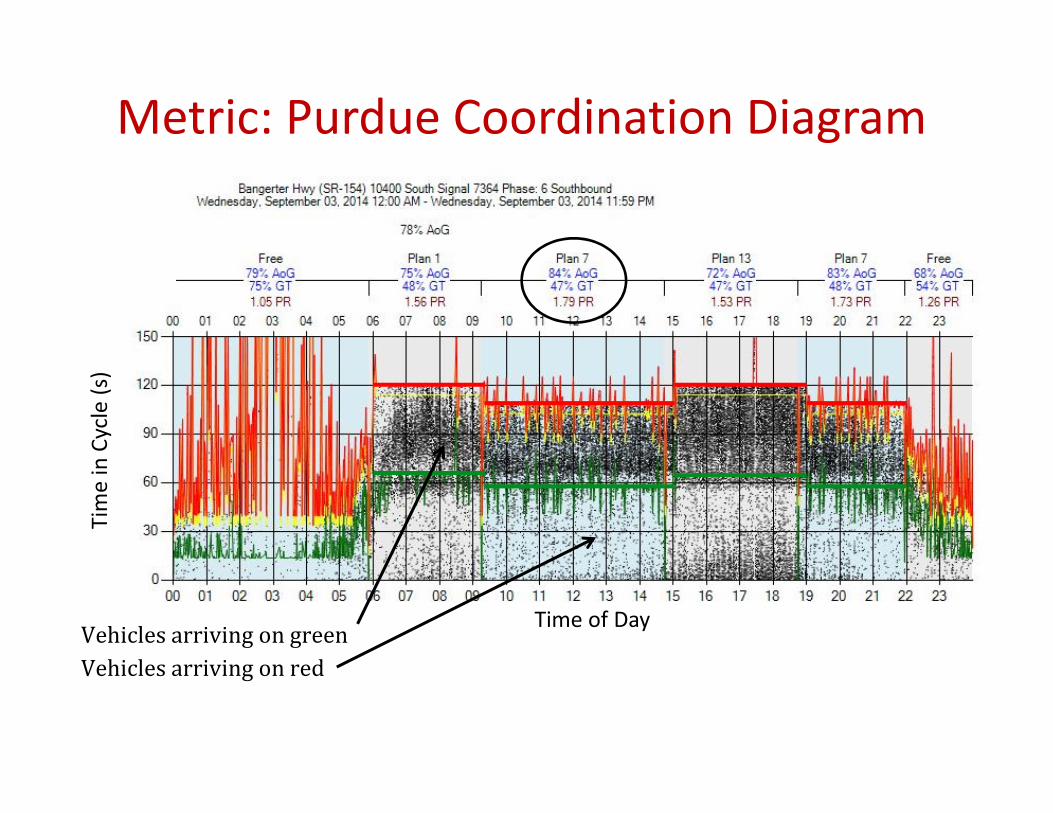
Metric: Purdue Coordination Diagram
Vehicles arriving on green
Tim
e in
Cyc
le (
s)
Time of Day
Vehicles arriving on red

Metric: Approach Volume
Vo
lum
e (
vph
)
Time of Day
Dire
ction
al Sp
lit
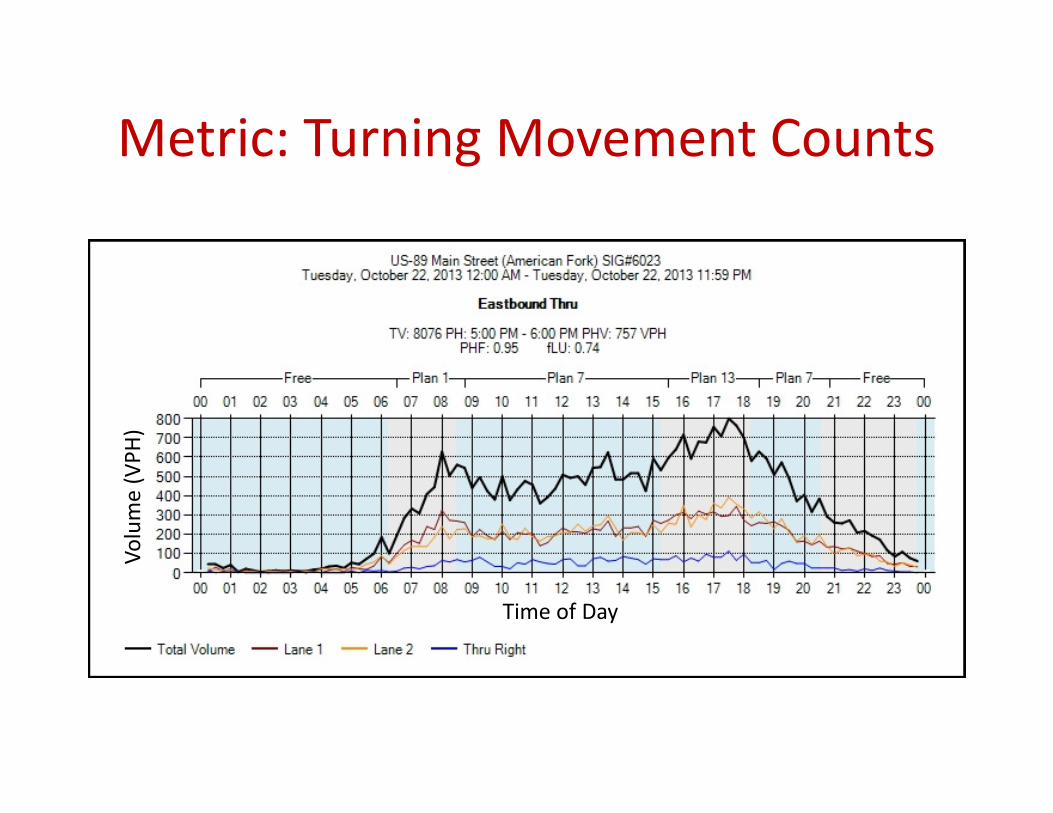
Metric: Turning Movement CountsV
olu
me
(V
PH
)
Time of Day

Metric: Approach Speed
Spe
ed
(M
PH
)
Time of Day
Snow storm starts

24
Freeway Closure Example using SPMs - Nevada
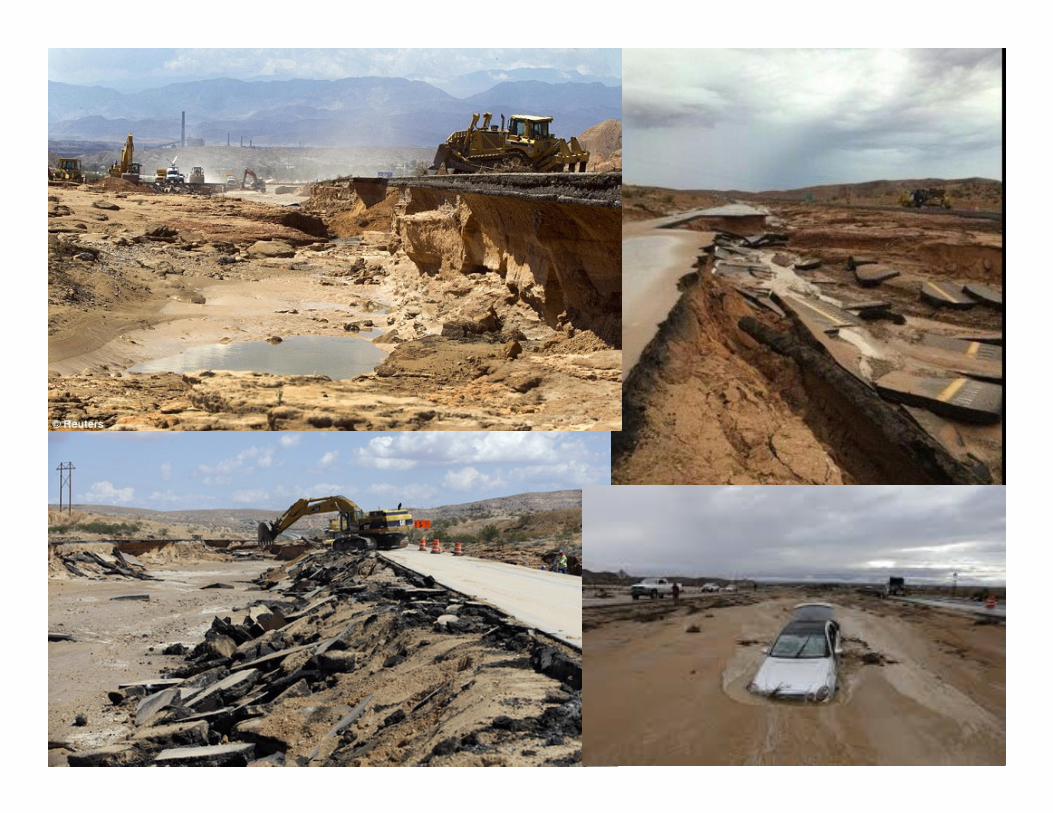
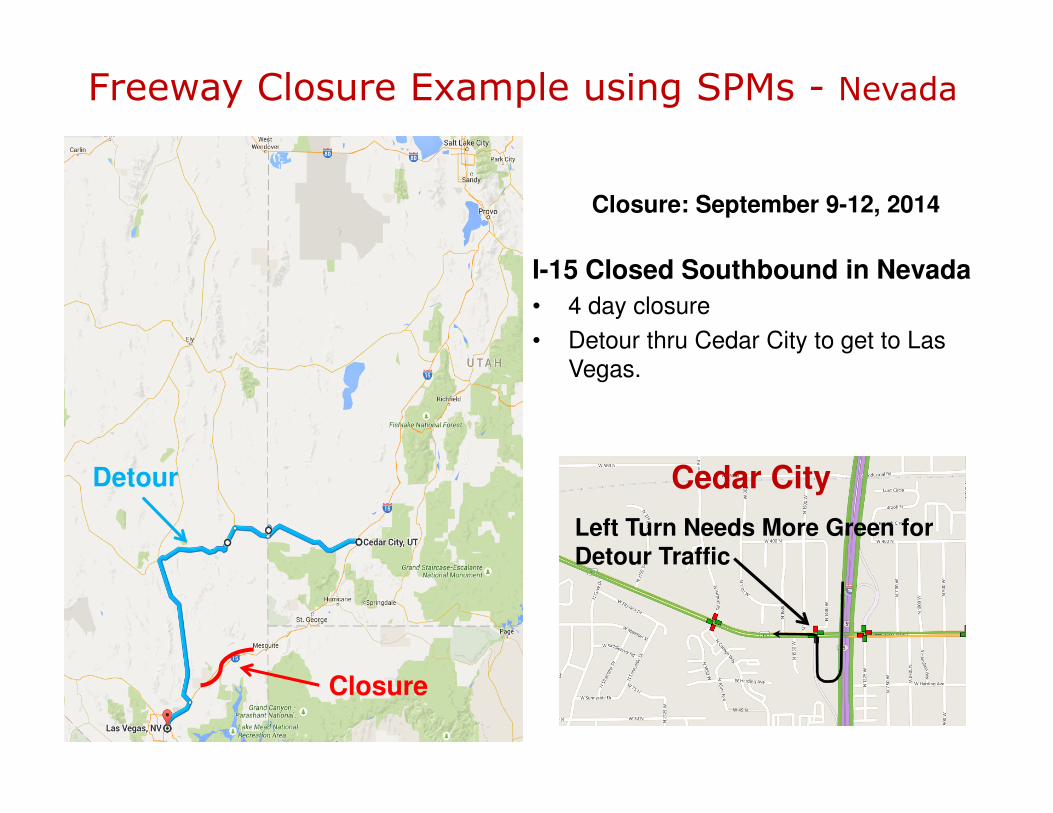
Closure: September 9-12, 2014
I-15 Closed Southbound in Nevada
• 4 day closure
• Detour thru Cedar City to get to Las
Vegas.
Freeway Closure Example using SPMs - Nevada
Closure
Detour
Left Turn Needs More Green for
Detour Traffic
Cedar City

Gap out
Max out
Force off
Pedestrian activation
Skip
Phase 4 Split Monitor - (Thru & Left Turn for SB off-ramp)
Freeway off-ramp - One week of data
Normal Traffic on
Sunday and Monday
Increased traffic beginning Tuesday morning
due to freeway washout in Nevada
as shown by more frequent force-off
and higher split being used
Implemented special timing plan to provide extra splitSB freeway reopened on Friday afternoon
as shown by more frequent gap-out
and lower split being used
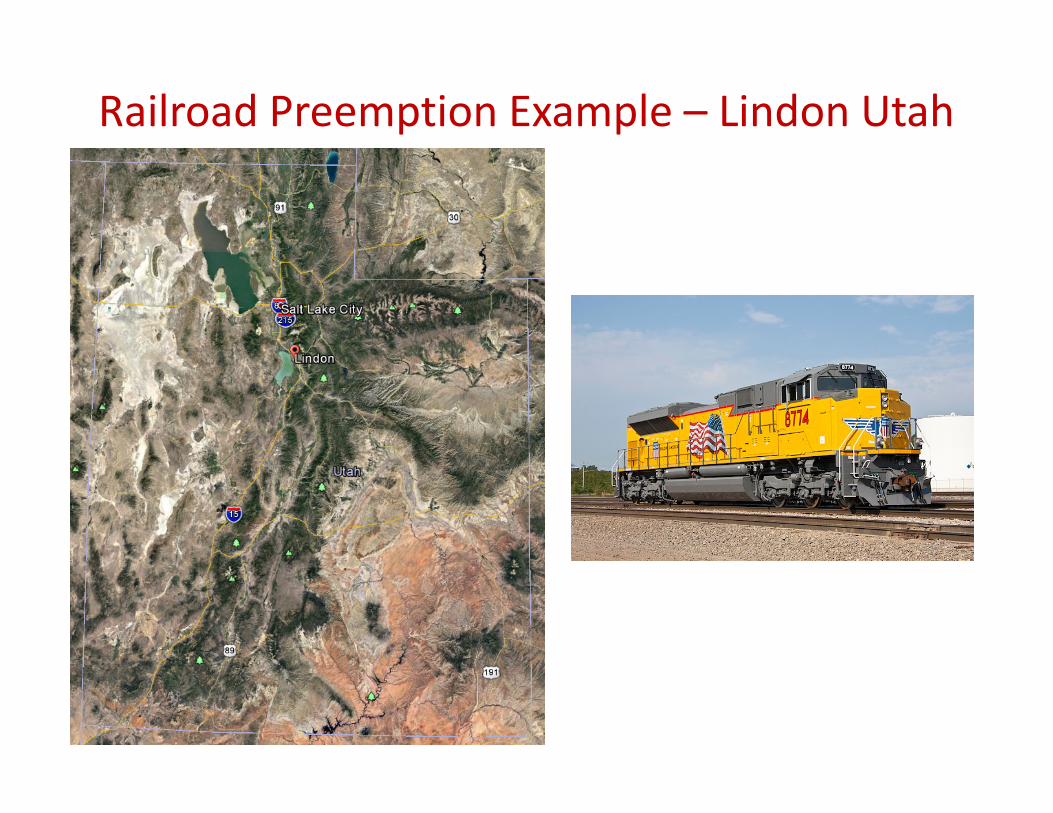
Railroad Preemption Example – Lindon Utah

City of Lindon, Utah
200 South


City of Lindon, Utah
200 South
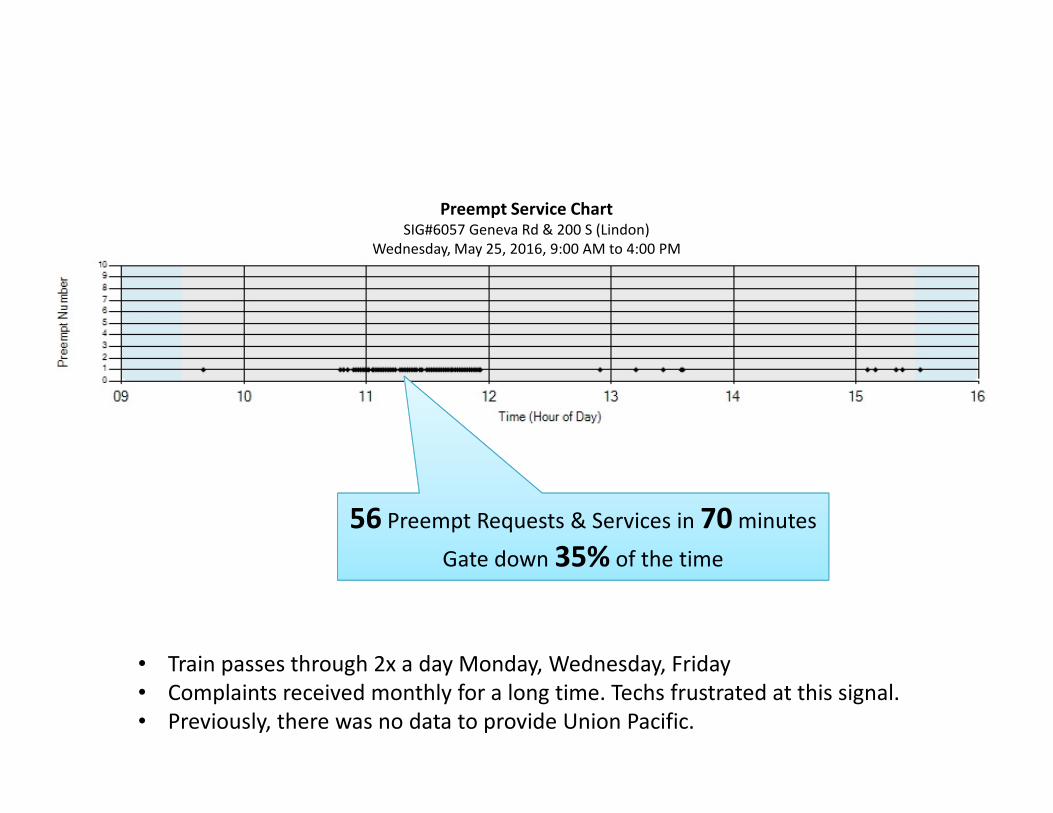
Preempt Service ChartSIG#6057 Geneva Rd & 200 S (Lindon)
Wednesday, May 25, 2016, 9:00 AM to 4:00 PM
56 Preempt Requests & Services in 70 minutes
Gate down 35% of the time
• Train passes through 2x a day Monday, Wednesday, Friday
• Complaints received monthly for a long time. Techs frustrated at this signal.
• Previously, there was no data to provide Union Pacific.
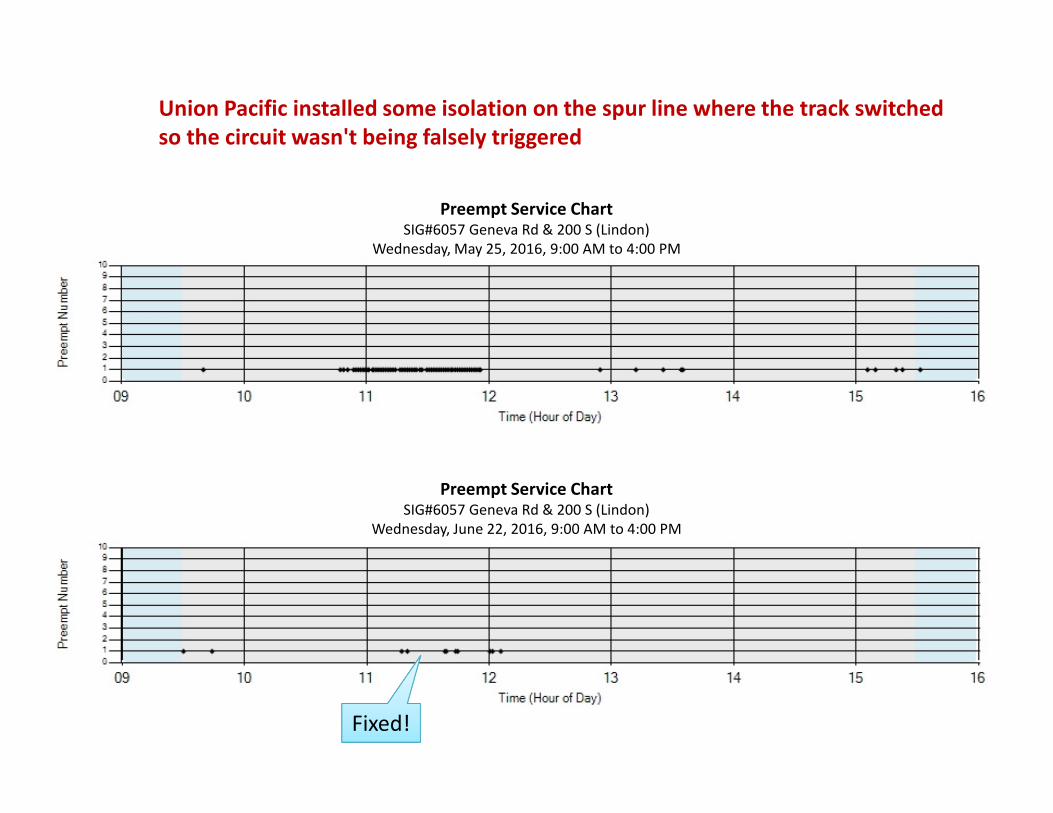
Preempt Service ChartSIG#6057 Geneva Rd & 200 S (Lindon)
Wednesday, May 25, 2016, 9:00 AM to 4:00 PM
Preempt Service ChartSIG#6057 Geneva Rd & 200 S (Lindon)
Wednesday, June 22, 2016, 9:00 AM to 4:00 PM
Fixed!
Union Pacific installed some isolation on the spur line where the track switched
so the circuit wasn't being falsely triggered

Tim
e s
ince
Pre
em
pt
Ca
ll
Preemption DetailsSIG#6057 Geneva Rd & 200 S (Lindon)
Wednesday, September 7, 2016, 9:00 AM to 11:00 AM
Preempt 1
Added 15s entry delay
Gate Down
SPMs also provide information on how long the gate is down. Ono September 7th,
it ranged from 18 seconds to 57 seconds.

Outcome Assessment of
Peer-to-Peer Adaptive Control
Adjacent to a National Park
Lucy Richardson
Christopher Day
Darcy BullockMatthew Luker
Mark Taylor
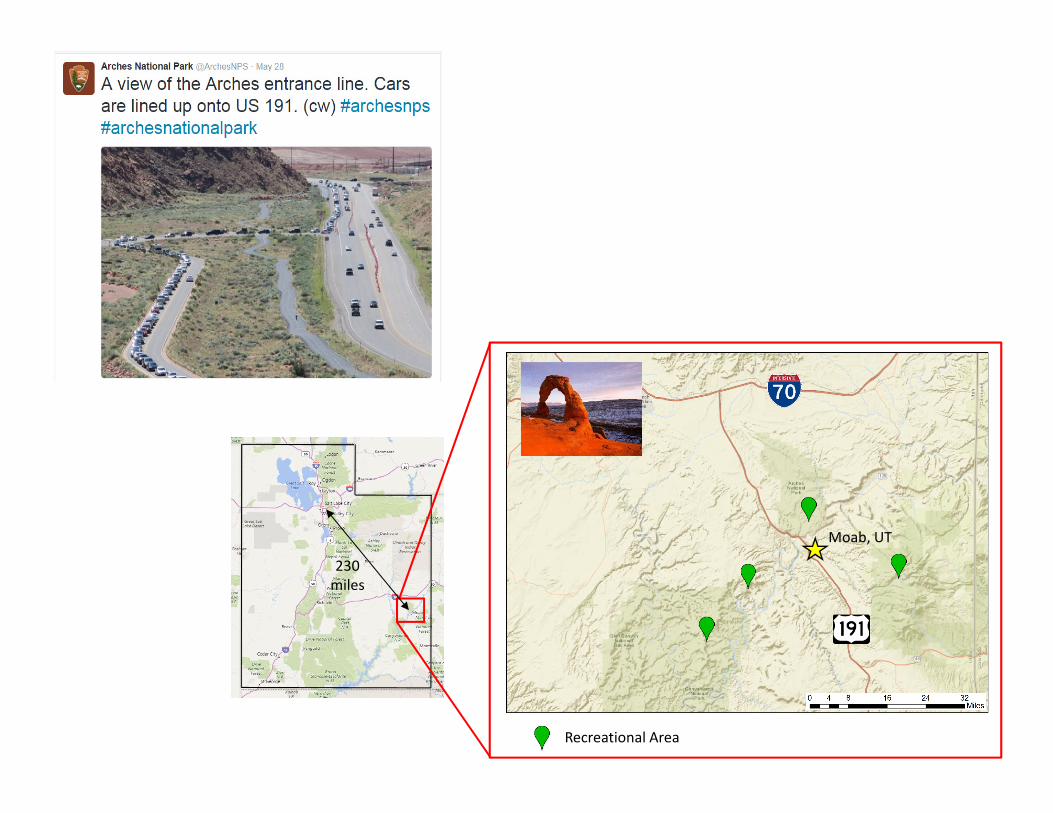
Recreational Area
Moab, UT
230
miles

Case Study: Moab, Utah
• The Adventure Capital of the U.S.A.
• Two National Parks within 20 miles
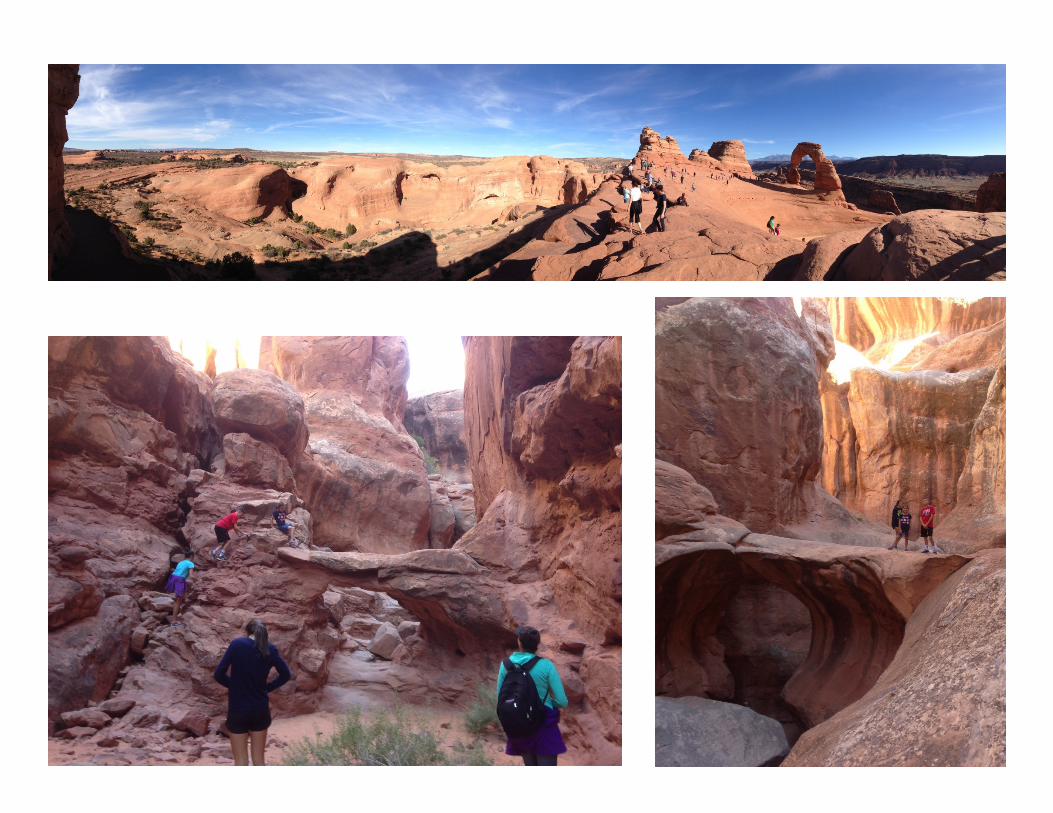

Corona Arch & Balanced Rock - Moab

Unpredictable Traffic – Very Seasonal

41
Arches
National
Park
Canyonlands
National Park
US-191/
Main Street
1
2
3
4
5

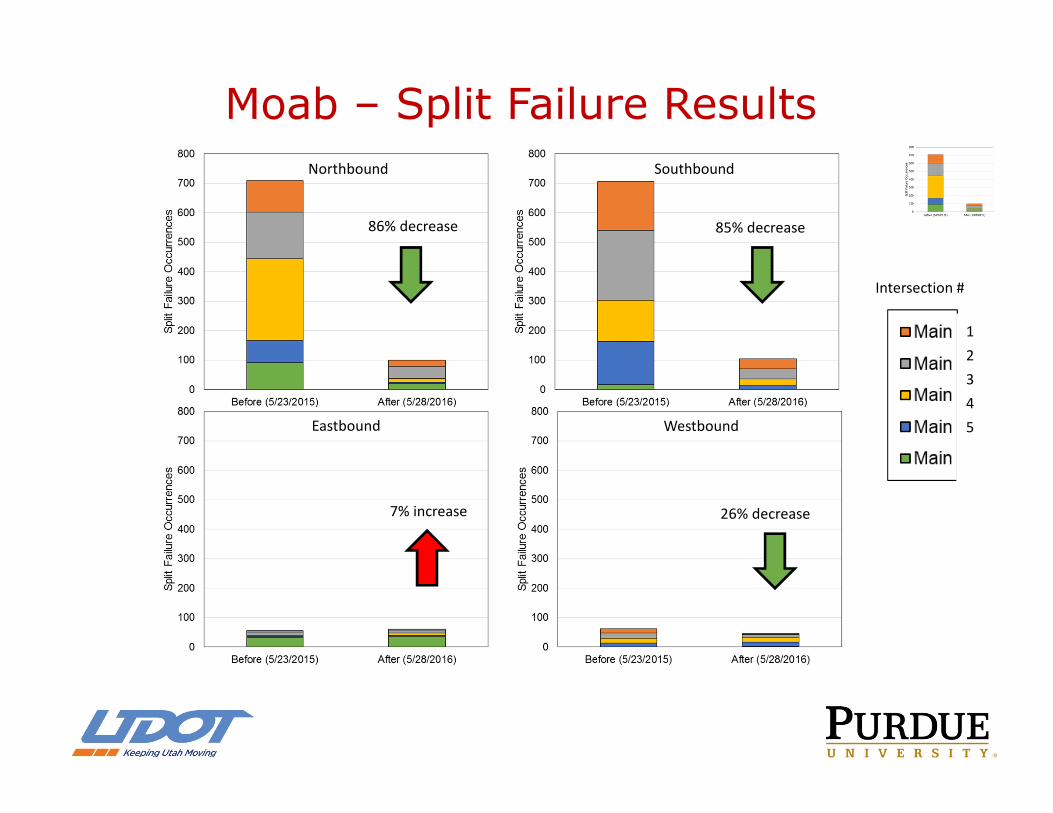
Memorial Day 2015 vs. 2016
Northbound Southbound

Allocation of Green Time
Northbound Southbound
Eastbound Westbound
1 2 3 4 5Intersection #
1 2 3 4 5Intersection #
1 2 3 4 5Intersection #
1 2 3 4 5Intersection #

Corridor Progression: PCDs
0
30
60
90
120
6:00 8:00 10:00 12:00 14:00 16:00 18:00 20:00 22:00
Tim
e In
Cycle
(s)
Northbound
Before
After
0
30
60
90
120
6:00 8:00 10:00 12:00 14:00 16:00 18:00 20:00 22:00
Tim
e In
Cycle
(s)
Beginning of Green End of Green Green Interval Vehicle Arrival
0
30
60
90
120
6:00 8:00 10:00 12:00 14:00 16:00 18:00 20:00 22:00T
ime
In
Cycle
(s)
0
30
60
90
120
6:00 8:00 10:00 12:00 14:00 16:00 18:00 20:00 22:00
Tim
e In
Cycle
(s)
Southbound
2015
2016
Memorial Day
Northbound Southbound
Eastbound Westbound
86% decrease 85% decrease
7% increase 26% decrease
1
2
3
4
5
Intersection #
Moab – Split Failure Results

System Health
Alerts
Too many max outs22
No SPM Data11
Too many force offs33
Too many ped calls44
High PCD detector count66
Low PCD detector count55
1710 traffic signals
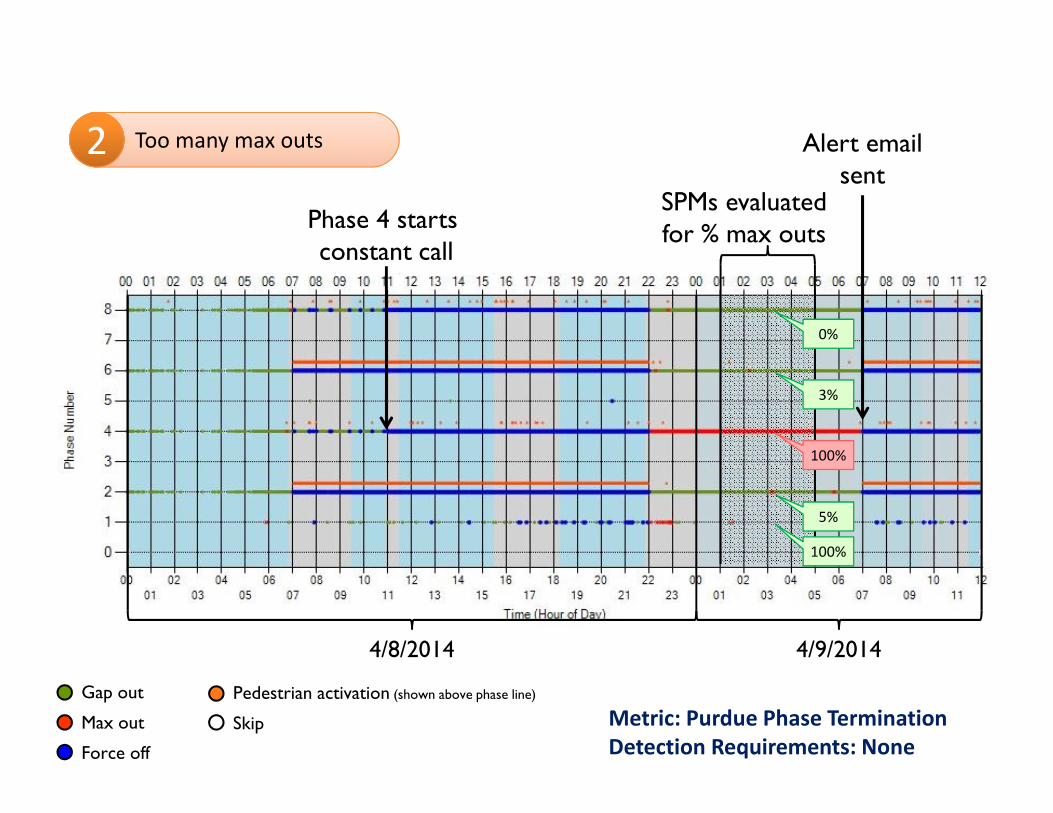
Metric: Purdue Phase Termination
Detection Requirements: None
Phase 4 starts constant call
4/8/2014 4/9/2014
SPMs evaluated for % max outs
Alert emailsent
Gap out
Max out
Force off
Pedestrian activation (shown above phase line)
Skip
Too many max outs22
0%
100%
3%
5%
100%

Purdue Split Failure – Center St & Main St – Moab, Utah
Memorial Day Weekend – Saturday
2015
2016
NORTHBOUND
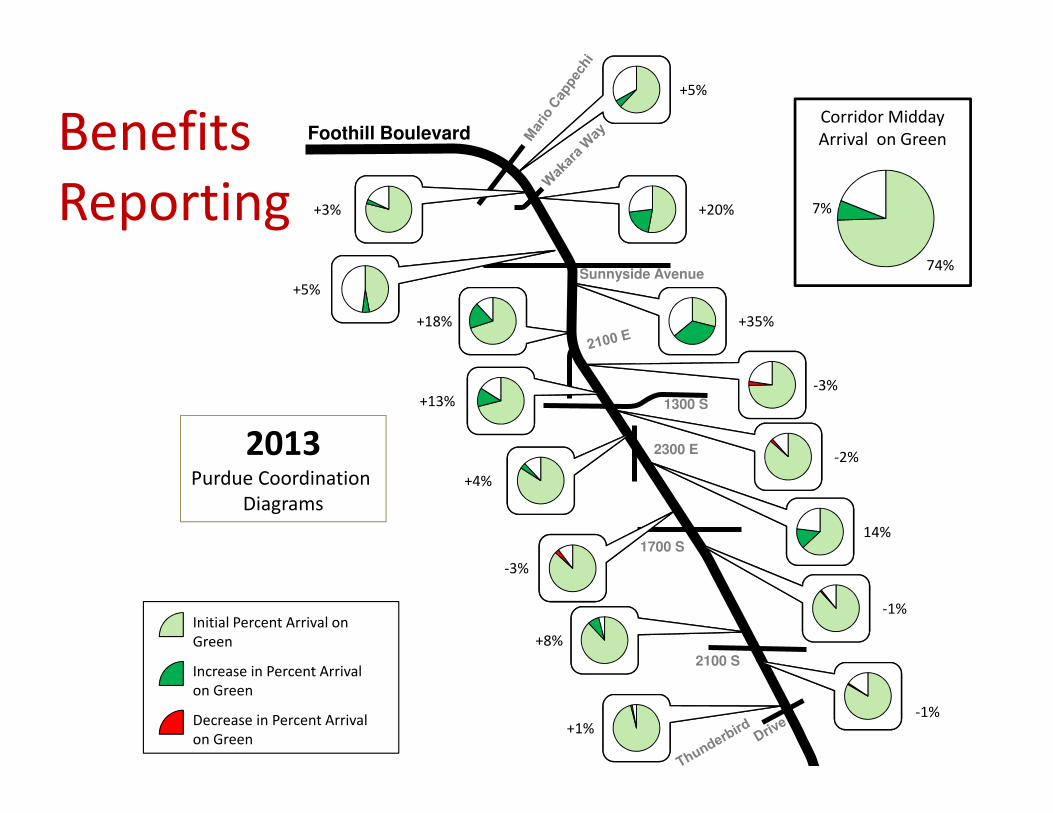
Sunnyside Avenue
1300 S
2300 E
1700 S
2100 S
Foothill Boulevard
+3%
+18%
+13%
+4%
-3%
+8%
+1%
+5%
+20%
+35%
-3%
-2%
-1%
+5%
14%
-1%
Initial Percent Arrival on
Green
Increase in Percent Arrival
on Green
Decrease in Percent Arrival
on Green
Corridor Midday
Arrival on Green
74%
7%
2013Purdue Coordination
Diagrams
Benefits
Reporting

Monitor Trends
Retiming Project

SPM Source Code –> Open Source
Mid Nov. 2016

Salt Lake SPM Workshop Participants – Jan 2016
170 Representatives from 85 Different Organizations, 28 States, DC, & Canada
20 State & Federal Agencies
25 Public Agencies
5 Universities
35 Private Sector Locations

Train the Trainer Workshop
When: Salt Lake City: January 18 & 19, 2017
For Whom: Consultants, Vendors, IT Personnel
Learning Objectives: Installing UDOT ATSPM Source Code,
Server/Network Requirements, Configuration, Q&A.
Register: https://www.eventbrite.com/e/udot-train-the-
trainer-workshop-for-atspm-tickets-
28563394883?aff=es2
Attendance is free.

ITE 3-part WebinarApril, May, June 2014
ITE Journal, March 2014
ITE Journal, August 2016
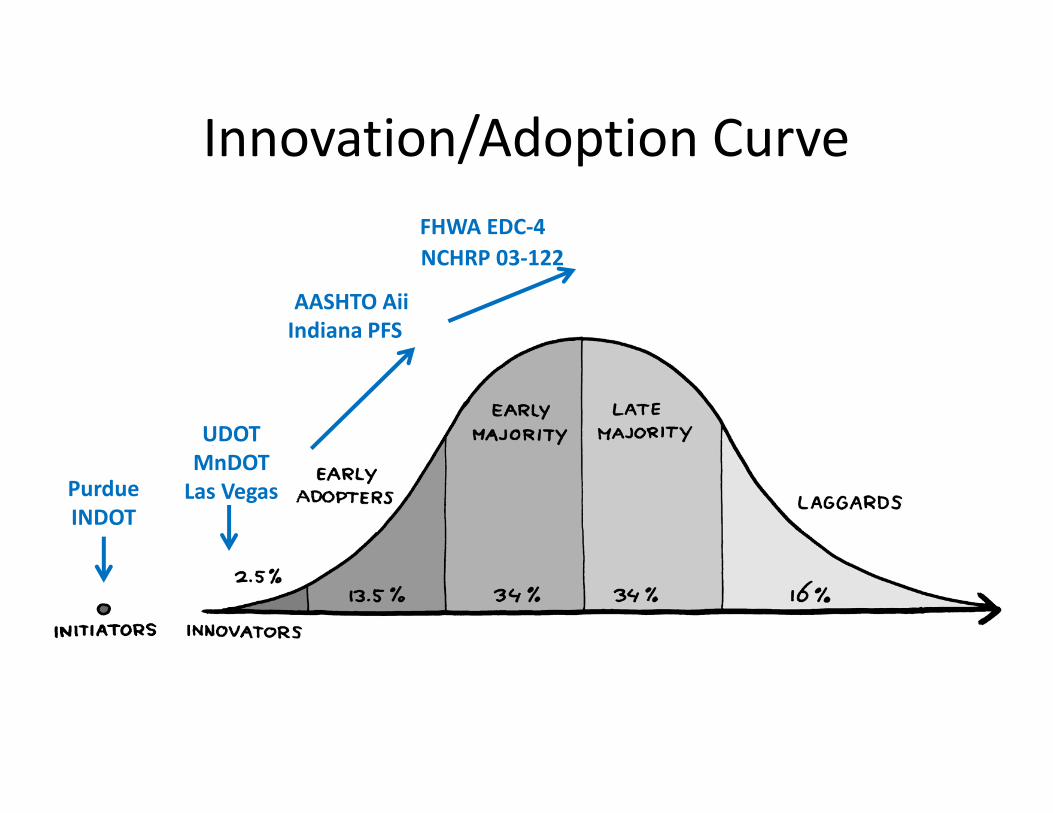
Innovation/Adoption Curve
Purdue
INDOT
UDOT
MnDOT
Las Vegas
AASHTO Aii
FHWA EDC-4
Indiana PFS
NCHRP 03-122

What does it take to get ATSPM’s?
• Controller with Purdue hi-res data
• Comm to intersection or external memory (Raspberry Pi)
• Server
– Price ranges from $3K to $20K (UDOT: $15K on a 20 TB server)
• SQL Database License: Free (Express) to $100K (Enterprise)
• ATSPM Software: Free: (http://www.itsforge.net/)
• Consultant to do installation: $5K to $10K
Total Price for ATSPM’s: $3K to $130K+
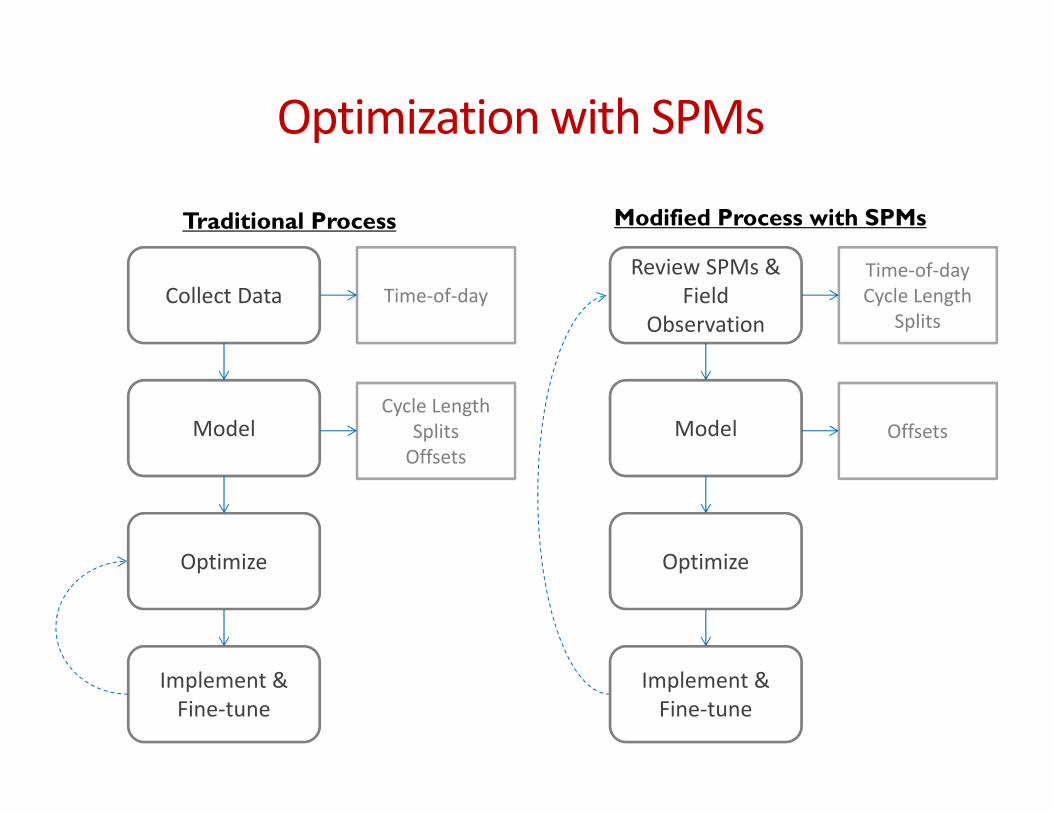
Traditional Process Modified Process with SPMs
Collect Data
Model
Optimize
Implement &
Fine-tune
Time-of-day
Cycle Length
Splits
Offsets
Review SPMs &
Field
Observation
Model
Optimize
Implement &
Fine-tune
Time-of-day
Cycle Length
Splits
Offsets
Optimization with SPMs

UDOT Signal Timing Focus Group (July 2014)
• How do you feel about UDOT?
• How do traffic signals make you feel?

Focus Group Key Findings (July 2014)
UDOT is perceived positively, with innovationas the primary driver of positive impressions.
Drivers believe traffic signal synchronizationis improving.
Drivers feel UDOT should be open about its accomplishments in a way that protects its credibility.
59

60 S Commercial –Love green lights? So do UDOT traffic engineers
http://udot.utah.gov/greenlights

ATSPM Basic Concept
Hi Def Data Logger
included in controller
firmware
A Central Signal System is NOT used or Needed!
Why Model what you can Measure?
Hi Def logs retrieved
every 10-60 minutes
from controller to server
Website to display
SPM’s
(Or…Retrieve data logs
from controller manually
using Raspberry Pi)