
Lecture 25 - Traffic Loading
33
Introduction to Transportation Engineering Prof. K. Sudhakar Reddy Department of Civil Engineering Indian Institute of Technology, Kharagpur Lecture - 25 Traffic Loading - I Hello viewers. Welcome to lesson 4.2, Traffic loading- Part 1 of pavement design which is being covered under Module-4. (Refer Slide Time: 00:00:55 min) We would be covering traffic loading in two different parts. This lesson pertains to Part 1 of traffic loading parameters. In the last class which was on principles of pavement design, we had discussed about 3 very important external parameters which are external to the pavement that need to be consider for design of pavement. First one was update, second one was traffic parameters and third one was climatic parameters. So, for the next two classes including this, we will be covering various traffic related parameters which is a very important input for pavement design. 1
-
Upload
khangminh22 -
Category
Documents
-
view
6 -
download
0
Transcript of Lecture 25 - Traffic Loading

Introduction to Transportation Engineering Prof. K. Sudhakar Reddy
Department of Civil Engineering Indian Institute of Technology, Kharagpur
Lecture - 25 Traffic Loading - I
Hello viewers. Welcome to lesson 4.2, Traffic loading- Part 1 of pavement design which is being covered under Module-4. (Refer Slide Time: 00:00:55 min)
We would be covering traffic loading in two different parts. This lesson pertains to Part 1 of traffic loading parameters. In the last class which was on principles of pavement design, we had discussed about 3 very important external parameters which are external to the pavement that need to be consider for design of pavement. First one was update, second one was traffic parameters and third one was climatic parameters. So, for the next two classes including this, we will be covering various traffic related parameters which is a very important input for pavement design.
1

(Refer Slide Time: 00:01:45 min)
In this lesson we will be covering various aspects of traffic related parameters. So after gone through the contents of this lesson, it is expected that the student would be able to appreciate the need to consider various traffic related parameters in pavement design; what is the importance of considering different parameters that pertain to traffic loads in pavement design, and also will be able to learn and understand about the different configurations of commercial vehicles, understand the mode of load transfer to the pavement, and learn in general about the procedure that is followed for estimation of design traffic for pavement design. (Refer Slide Time: 00:02:40 min)
2

When we consider a traffic loading obviously we are referring to vehicles. We also know that there are different types of vehicles with wide ranging sizes, wide ranging load magnitude and ability to travel at different speeds. We can start with bicycles, two wheelers, passenger cars, we have vans of different sizes and shapes, buses, different types of trucks; single unit trucks multi unit trucks. We will have various combinations and various types of vehicles that ply on roads or highways. We have to consider which one of these vehicles is important for pavement design and which specific parameters need to be considered as inputs for pavement design. (Refer Slide Time: 00:03:38 min)
For example in evaluating the traffic condition the quality of flow on a given road and also in assessing the adequacy of geometric design features. All these aspects we have studied in the earlier lessons. It would be necessary to consider all these vehicles that I have listed in the previous slide, whether it is small or big, whether it carries small load or heavy load. All those things, all these vehicles are important from the point of a geometric design consideration. Because we provide specific geometric design features for specific design vehicles, that could be bigger vehicle that could be smaller vehicle and many a time we understand that it is a mixed traffic that has to be utilizing the facility. So accordingly the geometric design requirements of each one of these vehicles is taken into consideration and these specifications are accordingly provided. Similarly, when we are assessing what is the quality of flow; what is the effect of small vehicle, and what is the effect of big vehicle on the quality of flow has to be taken into account. So under those situations all vehicles are important. But whereas, when we are trying to design pavement as a structure, the loads that these vehicles carry is of more relevance to us. So as a result we normally do not consider the smaller vehicles in pavement design. For example bicycles; we normally never consider for pavement design because they do not carry any significant load and even we would not consider the passenger cars. So what we consider is, only commercial vehicles.
3

Indian Roads Congress defines commercial vehicles as the vehicles having a laden weight more than 3 tons including its self weight. So the type of vehicles that carry including self weight more than 3 tons, we can consider them to be commercial vehicles. We normally consider only these vehicles which we call them as commercial vehicles for designing pavements. And in a given traffic composition, what is the percentage of these vehicles, how many are there; that is what we are going to be interested in. (Refer Slide Time: 00:05:58 min)
Typically commercial vehicles can be trucks, buses, and vans. And when we refer to a commercial vehicle we talk about its gross load, we talk about its axle load and we also are interested in the wheel loads. Ultimately it is through the wheels that the load is transported to the pavement. But isn’t it such as the road transport and other people such as commercial tax are usually interested in the gross load that is carried? For example in this case, if we consider gross load of 200 kilo Newton that as you can see and this vehicle has got 2 axles and the load is distributed over these 2 axles. It is assumed the first front axle carriers about 80 kilo Newton load and the rear axle obviously carries the remaining load that is 120 kilo Newton. Hence gross load 200 kilo Newton, front axle load is 80 kilo Newton and rear axle load is 120 kilo Newton. Most of these weigh bridges that you see on highways are only meant to weigh the gross load because that is what most people are interested in. But as pavement designers, we are interested in what is the load that is coming on each one of the axles. And if in fact we are interested in what is the load that is coming on each individual wheel.
4

(Refer Slide Time: 00:07:36 min)
For example, let us assume the front axle of this particular vehicle had one wheel on either side. Then as indicated there it was carrying 80 kilo Newton. So if you assume the load to be equally or uniformly distributed over the entire vehicle from left to right, then we can assume the load to be distributed equally on both wheels and it should be about 40 kilo Newton each. (Refer Slide Time: 00:08:08 min)
These axles can be of different configuration. They can have single wheel on either end or they can have what is known as dual wheel set.
5

(Refer Slide Time: 00:08:21 min)
As you can see this is a set of two wheels. We have one dual wheel set in one side and another dual wheel set on the other side. Now, on each one of these dual wheel sets we have 60 kilo Newton applied because we considered about 120 kilo Newton on the rear axle. (Refer Slide Time: 00:08:51 min)
Besides the axles that have single wheel on either side dual wheels on either side, we can also have what is known as a tandem axle as shown above. Tandem axle is nothing but two separate dual wheel axles but working as one single unit. There will be a mechanism to ensure that the load transport is there on both the axles and both these axles together will function as one single unit called as tandem axle.
6

So we normally have axle having single wheels on either side axle having dual wheels on either side or a tandem axle unit. Any vehicle will have a combination of these three types of axles. (Refer Slide Time: 00:09:33 min)
It could be only two axles or it could be multiple axles. But whatever is the combination of axles that is there on a given vehicle, we will decide the load that particular vehicle can carry. As you can see here, commercial vehicles can come either in single or multiple units. It can be one single unit or it can be number of units also. So accordingly we call it as either a single unit truck having two or more axles. Or vehicle trailer combination which is either a semi-trailer tractor combinations or tractor trailer combination. We will see what these combinations are in the next slide. So basically we have single unit vehicles, we have semi trailer combinations and we have tractor trailer combinations.
7

(Refer Slide Time: 00:10:26 min)
This is typically the loading configurations that Indian Road Congress considers. The first two types of vehicles are single unit type. The first one is a vehicle having two axles; single unit and you can see it as a single unit in the picture. The second one has got type three, it has got three axles and in fact in the rear it is a tandem axle. We have single axle in the front and a tandem axle at the rear which is consider as three axles. The next one is a semi trailer having two axles. The fourth one is a semi trailer axle having two axles in the trailer. The fifth is Type 3-S1 which has 3 axles in the tractor and then one in the trailer. Accordingly we have different combinations of axles, different combinations of whether it is a single unit, tractor trailer unit etc. The sixth one is an example for semi trailer unit and the ninth one is an example for Tractor-Trailer unit which has a tractor and a trailer. In a semi trailer unit a major portion of the load is carried by the tractor unit. As you can see (Refer Slide Time: 11:44) it is transferred on to the tractor unit, whereas in the case of tractor-trailer unit we have an independent tractor unit and a trailer unit. And the tractor unit only tows the trailer unit. So you can have different combinations of these vehicles.
8

(Refer Slide Time: 00:12:15 min)
Indian Road Congress also gives us what is a permissible limit on each one of these axles or each one of these types of vehicles. For example if we have an axle having single tyre on each side then the permissible limit is 6 tones. So if we have a vehicle having two axles both having single wheels, then the front axle weight can be maximum 6 tons and rear axle weight can be 6 tons. So naturally the gross weight of the vehicle will be 12 tons. But if a truck has two axles and front axle being single wheel axle and rear axle having dual wheel sets, then the maximum weight that can be put in the front axle is 6 tones. If we have a dual wheel sets on either side of the rear axle, then the permissible limit is 10.2 tons. Then that particular vehicle can have a total of 16.2 ton as permissible total gross weight. Similarly if we have tandem axle, then 18 ton on tandem axle is permissible. So single axle plus tandem axle is 24 tons. If single axle plus two dual wheels set - one on the tractor and one on the trailer, then the total is 26.4 ton. If one single axle having single wheels on either side, one tandem axle and these two are there on the tractor unit and you have one tandem axle and then one axle having dual wheel sets in trailer unit, then the total would be about 52.2 tons. If you going on adding more axles of different types the total gross weight that is permitted on a given vehicle will be increasing. The load transfer through wheels that we have seen that there is a gross load, gross load is transferred through number of axles and each axle in turn has got two sets of wheels on either side, whether the single wheel or dual wheel.
9
(Refer Slide Time: 00:14:17 min)
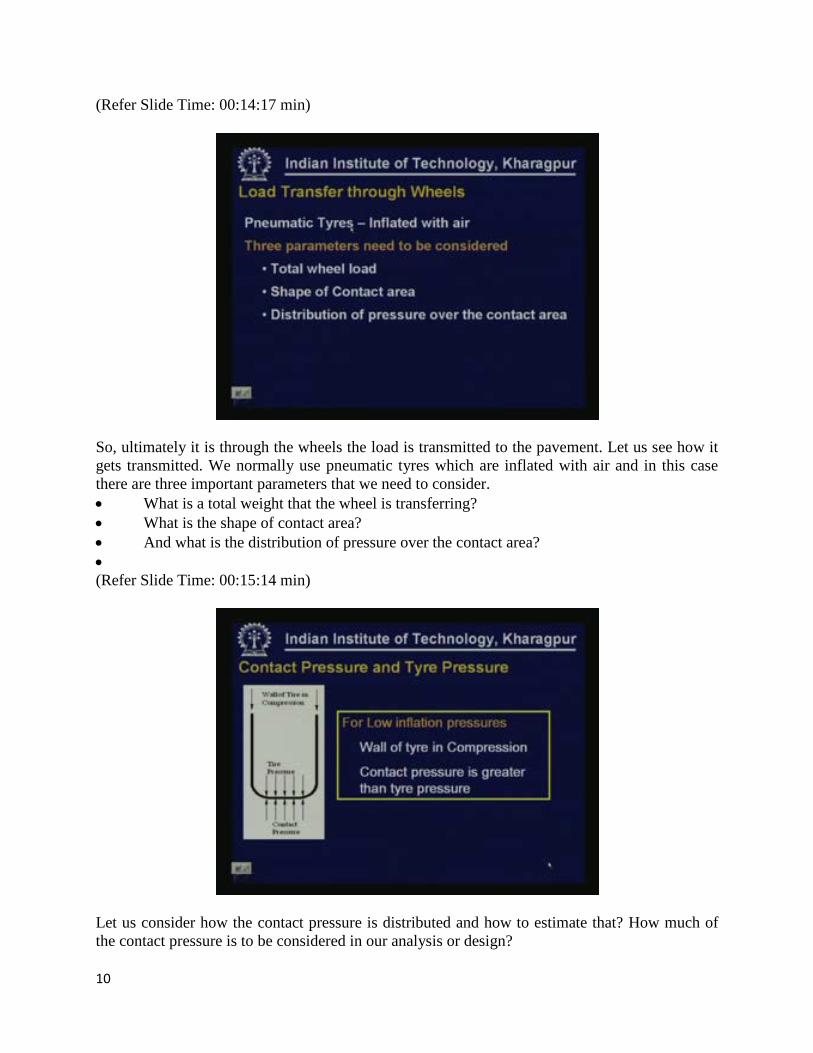
So, ultimately it is through the wheels the load is transmitted to the pavement. Let us see how it gets transmitted. We normally use pneumatic tyres which are inflated with air and in this case there are three important parameters that we need to consider. • What is a total weight that the wheel is transferring? • What is the shape of contact area? • And what is the distribution of pressure over the contact area? • (Refer Slide Time: 00:15:14 min)
Let us consider how the contact pressure is distributed and how to estimate that? How much of the contact pressure is to be considered in our analysis or design?
10

If the tyre inflation pressure is low, then how much would below is a function of what is a type of tyre that we are using? : What is a type of pavement that we have there? So considering all those things, if the pressure is low then the walls of tyres will be in compression. So as a result the contact pressure is going to be greater than the tyre pressure. And obviously the contact pressure cannot be taken exactly equal to the tyre pressure. It has to be something different and that will have more than the tyre pressure. On the other hand, if the tyre inflation pressure is high, again we have to define what is high, which is again a function of; what is the type of pavement and the type of tyre that we are referring to. In this case the walls of tyre are in tension. As a result the contact pressure will be less than the tyre pressure. So if you want to take accurately the contact pressure, the contact pressure has to be taken as somewhat less than the tyre pressure. (Refer Slide Time: 00:16:35 min)
There are some rough guidelines available as to how to select this. This can be represented in the form of rigidity factor which can be defined as contact pressure by tyre pressure. If the tyre pressure is about 0.7 MPa, then we can assume the rigidity factor to be 1, which means the contact pressure, would approximately be equal to tyre pressure. That is the situation when we are going to have about 0.7 MPa tyre pressure. So the rigidity factor will be about 1. But if the tyre pressure is low being less than 0.7 Mpa, then the contact pressure is going to be more than tyre pressure as we have seen in the previous diagrams. Then the rigidity factor is going to be more than 1. If the tyre pressure is more than 0.7 Mpa, then the contact pressure is going to be less than tyre pressure. So the rigidity factor is going to be less than 1. Obviously for all these we need to get complete information about if it is 0.6, then what will be the rigidity factor, and how much the contact pressure can be assumed to. But normally we consider tyre pressure to be equal to inflation pressure. And then rather the contact pressure to be equal to tyre pressure which is in turn equal to the inflation pressure. And we normally calculate contact pressure to be wheel load divided by the area of tyre imprint. So, important thing is we
11

make an assumption that the contact pressure is equal to tyre pressure although we know that it is not always the case. (Refer Slide Time: 00:18:33 min)
The load is transmitted to the pavement surface in different modes, we can have vertical stresses, we can have unidirectional surface shear stresses, and we can have centripetal stresses. So in a given situation you can have a combination of these modes for transfer of load to the pavement surface. Vertical stresses: It is obvious that a load is acting vertical on the pavement surface most of the time. So the pavement is going to be subjected to vertical stress, but it is possible that unidirectional shear stresses can be applied to the pavement surface. Especially when the vehicle starts accelerating, there is braking action. Or when the vehicle starts from a stop condition, there is unidirectional shear stress applied on the pavement surface. So we would need to be considering these stresses also.
12

(Refer Slide Time: 00:19:44 min)
We can also have centripetal stresses on the pavement surface acting within the contact area. These occur because of the inflation pressure acting in different directions and then trying to push the tyre away. As a result we have this centripetal shear stress acting within the contact area. (Refer Slide Time: 00:20:16 min)
13

(Refer Slide Time: 00:20:23 min)
The pressure distribution within the contact area, whether it is vertical centripetal or unidirectional, is not normally uniform. The tyre imprints that have taken by several researchers in different situations show that it is never uniform. But we normally consider only the uniformly distributed vertical stress which in turn is equal to the tyre pressure. This simple equation is made for most of the analysis. But for rigorous analysis, if somebody is trying to identify whether any failure of the pavement is associated with a non-uniform distribution of tyre pressure on the pavement surface, then exact distribution can be obtained and that can be used in the analysis. Now, let us talk about the shape of the contact area. (Refer Slide Time: 00:21:20 min)
14

Typically what you see on the left side of this slide it would be something similar. The shape of this contact area depends on the inflation pressure, the age of the tyre, the load that is carried and also the pavement surface. In a typical tyre imprint you may see it to be in elliptical shape or you may see it as a rectangle in the centre and on the either end you can have semicircles and you may not see it’s fully contact surface, because tyre is not going to be in full contact with the pavement surface. Many a time there are going to be gaps between the tyres. As you can see in the diagram that is there on the left hand side, between the treads there are gaps. So this is not a fully contacted area that we have here. There are going to be gaps but normally we consider it to be in complete contact. (Refer Slide Time: 00:22:49 min)
And the general shapes that we consider are circular, rectangular, and rectangular with semicircular ends. If you want to have more rigorous analysis more exact shapes can be considered. The most commonly considered shape is circular as we told. So the area of this circular contact by simple calculations will be wheel load divided by the contact pressure. If you are considering this to be circular contact area, the radius of contact area is the parameter that is going to be used in the analysis of pavements and in the design of pavements.
15

(Refer Slide Time: 00:23:06 min)
For example if you have a 20 kilo Newton wheel load transmitted through a pressure of 0.7MPa tyre pressure, then the corresponding radius of contact can be obtained by equating applied load to pi into radius of contact area square into 0.7. This will give you the radius of contact area of 95.365 millimeter. This is the parameter that we are going to use in pavement design. So, if you note the applied load also know the pressure which we assumed to be uniformly distributed and which also assumed to be equal to the inflation pressure, then we can find out the radius of contact area, provided we are making an assumption of circular contact area. (Refer Slide Time: 00:24:47 min)
16

But a very popularly used shape for tyre contact area is a rectangular having circular ends on both sides. This is assumption that is made that the total length of the tyre imprint to be L, the radius of the end semi circular circles will be taken as 0.3L and width would naturally be taken as 0.6L. Then the width of the central rectangle will be 0.4 with a dimensions of the rectangle will be 0.4L multiplied by 0.6L. So we can work out the area of this in terms of the L and once you get the L we can get the shape of this diagram, we can draw that. So the area will be given as 0.4L into 0.6L for the rectangle plus 2 into 1 by 2 pi into 0.3L square. This will be equal to 0.5227 into L square. This in terms of L which of course will be equal to applied load divided by the contact pressure. So L can be worked out if you know what the load that we are referring to is and what is the pressure that we have assumed. Once we have L we can draw this diagram in terms of this L. (Refer Slide Time: 00:26:37 min)
Let us take an example of whether we can draw this diagram for a given data of P 20 and then tyre pressure of 0.7 MPa. So for this P, L will be calculated as square root of 20000 divided by 0.5227 into 0.7. This gives us 233.8 millimeters. The total length of the tyre imprint is 233.8 and radius of this will be 0.3L, which is equal to 70.14. So we can also obtain the other dimensions as 93.52 and 140.3 millimeters. So, once we made this assumption, we are in a position to draw the complete shape. There is analysis where in we can use the exact shape of the diagram. So there it is necessary that we draw the shape, making assumptions like this.
17

(Refer Slide Time: 00:28:40 min)
We can also consider this to be rectangular contact area making the same assumption of 0.6L to be the width; we can make slight adjustment to the total length, so then if the total area as we have seen earlier is 0.5227L square. The length that we can say here would be 0.8712L. So instead of particular purpose we want to further simplify the load contact area. This can be simplified as a rectangular area given by 0.6L as the width and then 0.8712L as a length. (Refer Slide Time: 00:29:17 min)
Among the design consideration that we have to have for selecting design loading, we have to appreciate that traffic loads are applied over several years. These several years could be design life; 10 years or 15 years that we select. And traffic volumes normally increase each year in most
18

cases. In some cases because of certain reasons there is a new road that is constructed near by, the traffic has been diverted there, and it is quite possible that the traffic volumes on a given road can get reduced also. While in normal situations unless there are no such major activities that are taking place, traffic volumes gradually increase. We also need to appreciate that all these vehicles do not carry the same amount of load. Each vehicle carries different load and also the vehicles on different facilities as we just said carry different loads. Each vehicle has got different load carrying capability. The wheel loads are applied over different portions of the pavement. All these wheels do not pass through the same point. That means a particular point on the pavement do not carry all the wheel loads of all the vehicles. They get distributed over various points on the pavement. Also the manner of transmission of load to the pavement depends on the speed of the vehicle. (Refer Slide Time: 00:30:55 min)
So we need to consider what type of vehicles use the facility, what is the type of load that they carry, how these vehicles are distributed across the pavement width and also what is the speed at which these vehicles are traveling? Are they slow moving vehicles, are they fast moving vehicles or are they stationary vehicles? Accordingly we will be selecting appropriate input parameters for design. Pavement is designed to carry traffic loads over a specified period which was mentioned earlier. Thus it is very important to have an accurate estimate or the total number of vehicles that are expected to use the facility during the design life period. If we consider the design life period to be 10/15 years, then how many vehicles are going to be utilizing the facility? We have to estimate; naturally we will not be in a position to observe these things because this is future on the basis of the information that is available today either on this facility or on similar facilities elsewhere, we should be able to make prediction about how many vehicles will be utilizing this facility and then how many commercial vehicles will be utilizing this facility. Because as far as
19

the pavement is as concerned we are interested in the number of commercial vehicles that are going to utilize the facility. (Refer Slide Time: 00:32:19 min)
This is what we called as traffic forecast. I am sure that you have learned something about traffic forecast and traffic volumes in your previous lectures. It will also be very useful in the design if the traffic volumes can be estimated for the different design periods, where if the total design period is 20 years. What to do with the traffic volume during the next 5 years or next 10 years or next 15 years? If you can have predictions that can be made for different periods, sub periods of the total period that will help us in making various strategies like going for the high initial cost, different types of maintenance strategies at 5 years and 10 years intervals. Or other strategies which we can make based on how the traffic is going to be distributed over the entire design period. The traffic estimates can be done from the traffic volumes prevailing in a base year on the particular facility or on similar facilities elsewhere in a base year and by selecting appropriate growth factors and appropriate projection techniques.
20

(Refer Slide Time: 00:33:32 min)
For forecasting traffic, a typical approach followed by Indian Roads Congress given by IRC: 37 code, for projection of traffic over the design life period is given as; this is in terms of a cumulative traffic, total number of commercial vehicles for the design period given as, N which is 365 multiplied by A and we also take into consideration the factor r and small n is the design period (Refer Slide Time: 34:02). Where A is the initial design traffic in the year of completion of construction in terms of number of commercial vehicles per day. At this moment we are only taking about number of commercial vehicles per day and we are also only trying to estimate over the design life period, how many total numbers of cumulative commercial vehicles are going to be. In fact the actual design parameter that we need is these numbers of commercial vehicles will have to be converted into equivalent number of standard loads. But we are not going to discuss that aspect in this lesson, and that will be followed in the next lesson. At this stage we are only trying to estimate what is the cumulative number of commercial vehicles that will be there during the design life period, and design life period being N number of years. We also use it on initial design traffic. When you say design, this A has been appropriately selected. This is not just a number that we have accounted. It is appropriately selected by taking into consideration how these vehicles get distributed across the width of the pavement. Also taking into consideration that all the wheels are not placed along a particular line because all those loads are placed across the pavement width. We also need to take this into consideration and select the design traffic.
21

(Refer Slide Time: 00:35:41 min)
So the parameter are that was used in the previous expression is the annual growth rate of commercial vehicles expressed as a fraction. The annual rate growth rate will be different for different states, different for different facilities. This can be estimated or if it is very difficult to estimate we can follow the IRC guidelines that are available. I also suggest that we can consider this to be about 7.5 percent in case no other data is available. Small n is the design period given in terms of years; 15 years or 20 years. The traffic in the year of completion of construction which is A that is what we have used in the previous expression. Because we might have measured the traffic in the year 2005, but the construction of pavement would be complete by 2007 and the pavement is subjected to actual number of loads would have to be counted from the year 2007. So the initial traffic in the year of 2007 have to estimated. From that year onwards what will be the cumulative number of commercial vehicles can be estimated from the previous expression. So the traffic in the year of completion of construction can be estimated using the following expression: A is equal to P into 1 + r to the power x where, P is the number of commercial vehicles as per the last count. Either the traffic has been taken 2 years back or either it has been taken this year. So ‘when the traffic was counted’, with reference to that ‘what was the traffic volume in that year’ and x is the number of years between the last count and the year of completion of construction. If the traffic count was taken in 2003 and we have started the process now and the pavement is going to be constructed in 2007, x would be 4.
22

(Refer Slide No: 00:37:43 min)
The cumulative traffic which is in terms of commercial vehicles for design period N will have to be adjusted for the directional distribution of traffic. Normally the parameter A is projected as a total to the traffic. We are not going to be making projections for each lane for each direction. Normally what we get is the total to the volume projected. So naturally that has to be adjusted for how much traffic is going to be going in one direction. You can assume it to be 50% in each direction. But during peak periods one of these directions may be carrying more and more traffic. It could be 60% in one direction and 40% in other direction. So 60% of the traffic is going to be travelling in the peak direction and it is going to be utilizing may be 50% of the pavement area. So we need to consider that 60% being critical. So we have to have some understanding of what is the directional distribution of traffic. We also have to have some information about how the vehicles are going to be placed across the carriage way width, which means we have to have information on lateral placement characteristics of these vehicles on the pavement. We also have to have some idea about the load spectrum. What are the loads that are carried by different types of vehicle? Some of these vehicles may be empty, some may be very heavy loaded, some may be loaded to extent that are weigh above the legally permissible loads that we have mentioned earlier. For different types of vehicles having different axles, what are the legally permissible limits would be obtained by the values given by IRC. But most of the time many of these vehicles carry more loads. Over loading is always there. So we have to have an idea about the load spectrum of the loads that are carried by different vehicles. This is essential to get the design traffic which we used to design pavements.
23

(Refer Slide Time: 00:39:46 min)
Let us take an example of typical traffic forecast that we can do. For example, we are trying to estimate design traffic where the average two-way traffic volume per day; we are referring to two-way traffic and in per day volume, it is a commercial traffic on an existing two lane highway, the traffic was counted in 2000. So the number of commercial vehicles total number of vehicles counted in 2005 is 4000. We have assumed the annual rate of growth of commercial vehicles to be 7%, r is equal to 7%. And we are going to design the pavement for 15 year design life period and the construction of the road is expected to be completed in the year 2007. Let us see how we estimate the cumulative traffic. First of all we will try to estimate what would be the traffic in the base year or that in the year of construction of the road, which is given as 1+ r to the power x. And r is the traffic that we have counted in the year of count which was in 2005. So it is given as 4000 into 1 + rate of growth expressed as fraction to the power 2. The difference between the year of construction and the year of count is 2 years. So this will give us 4580 commercial vehicle per day, CVPD. So the cumulative traffic over this 15 year period will be estimated as 365 into A which is 4580 into ‘1 + rate of traffic growth’ to the power design number of years which is 15, - 1 divided by rate of growth (Refer Slide Time: 42:29). This is equal to 42 million commercial vehicles. Of course in this case we have not considered two important features of traffic. What is the lateral distribution out of this 4580, and how they are spread across the pavements. Those features we have not considered at this stage. We have also not considered the load spectrum of these vehicles that also has to be adjusted. As I said, that aspect we are not going to cover in this lesson.
24

(Refer Slide Time: 00:43:17 min)
Coming to the lateral distribution of wheel loads, we have been talking about this that we cannot expect all the wheels will be travelling along the same path or they follow the same path. They are going to be distributed laterally, taking different positions on the pavement depending on the traffic volumes, depending on whether it is one lane road, two lane road, three lane road or multi lane road. All the commercial vehicles do not take the same lateral position on the highway. Depending on the type of facility (whether it is two way or multi lanes) the number of lanes, etc the facility has got the paths that the wheels of commercial vehicle tread differ. As a result, all the wheels of all the commercial vehicles utilizing the pavement during the design period do not stress or do not load the same point on the pavement. So a particular stretch, particular portion of the pavement carries only a certain portion of all the wheel loads. We have to identify which is the critical portion of the pavement that carries the maximum percentage of wheel loads and what is that percentage. If we know what the total commercial vehicles are, we have to take only certain percentage of the total commercial vehicles as that is there in the traffic. And we also identify which portion is more critical. It is actually, we can easily identify on many highways. If you see a certain portion of the road is more damaged compared to any other portion, you can also see or if you observe that the wheel loads, most of the wheel loads would be travelling along that damaged path only, unless we have serious potholes and other things there, normally that is the portion that gets stressed most of the time. As a result, that is the portion that gets damaged also more frequently. So each part of the pavement gets different repetitions of loads. We have to identify what is the percentage of these repetitions out of the total. And also may be which portion is more critical.
25

(Refer Slide Time: 00:45:22 min)
To understand the lateral distribution of wheel loads, for example if you take a two lane road and if you consider vehicle moving in one direction and there is another vehicle moving in the other direction depending on the width of the carriage way, depending on the width of each lane and also depending on the size of each vehicle, the position of these wheel loads with reference to the other wheel can be assessed. So we can see each portion of this two lane carriage way would be carrying number of wheel loads. At times a portion of this can be having wheel loads from both the directions. So there is going to be some overlap between the wheel loads placed for the vehicles travelling in both the directions. So we have to identify which portion of the two lane road has got maximum overlap. Most of the time it is the central portion that carries wheel loads travelling in this direction and also wheel loads travelling in the other direction. But we have to make some observations about how the wheel loads are placed across the carriage way and which portion carries maximum wheel loads, what percentage that has to be identified.
26

(Refer Slide Time: 00:47:13 min)
For example if we have a typical multi lane, this is a four lane divided carriage way. We can have two vehicles travelling in this direction and simultaneously we can have two vehicles travelling in the opposite direction. But it is a separated carriage way having the median in between. So these vehicles which are in left side are physically separated from the vehicles that are there on the right side. So there can be only overlap of vehicle, pass of the vehicles travelling in particular direction. So as you can see here the central portion gets loaded by the left hand side and right hand side wheels of the vehicles travelling in the same direction. So we have to identify that patch and also may be we have to estimate what is the percentage of vehicles having their wheels in this patch. (Refer Slide Time: 00:48:04 min)
27

This shows a typical distribution of wheel load placement across the carriage way width of the two lane road which was about 7 meter wide which was divided into 25 centimeter patches. As you can see that the most of the wheel loads were placed at the centre of the two lane carriage way at a distance of about 3.5 from the pavement edge. This is because wheel loads from left, wheel loads from right get overlapped around that portion. So that is the portion which carries maximum wheel loads. So we identify whether it is a central 1 meter that is important, central half a meter that is important and what is the percentage. Considering the central 1 meter to be important, about 51% of the total traffic assumes positions within the centre 1 meter of the 7 meter carriage way width. (Refer Slide Time: 00:48:59 min)
Let us see the Indian Roads Congress recommendations for the percentage of traffic that is to be considered, taking into consideration the lateral placement characteristics of different types of vehicles on different types of facilities. If you consider single lane roads the design is based on the total number of commercial vehicles in both the directions, because single lane roads do not really have enough space for the wheels to be placed at different locations. So we find them more or less to be channelised. They follow more or less the same path. So it is a fair assumption to make that 100% of the vehicles can be considered for design. Similarly for considering two lanes single carriage way roads, about 75 percent of the total two way traffic can be considered for design purpose.
28

(Refer Slide Time: 00:49:52 min)
For four lane single carriage way roads the design has to be based on 40% of the total number of commercial vehicles in both the directions. Four lane single carriageway roads means we have four lanes but these are not divided there is no median between them. So there is a possibility of overlap of vehicles travelling in both the direction. We normally assume that two lanes will be utilized by vehicles travelling in one direction and other two lanes by vehicles travelling from the other direction. But there is always a possibility of overlap of these vehicles going into the other lanes. So it is 40% of the total two way volume that is what we have to consider in the case of four lanes single carriage way road. If we have dual carriage roads, the road lanes that are meant for a single direction are separate and similarly there will be separate lanes which are exclusively meant for traffic coming from the other direction. There cannot be any interaction between the traffic from either direction. In such a case if we are designing dual two lane carriage ways that means in each direction we have two lanes, 75% of the number of commercial vehicles in each direction has to be taken for designing that, whereas in the earlier case it was 40% of the total two way volume. In this case it is 75% of the traffic travelling in that direction. For dual three lane carriage way in each direction, we have three lanes separated and dual four lane carriage way the percentage that we have to take is about 60% and 40% respectively.
29

(Refer Slide Time: 00:51:31 min)
To summarize, in this lesson we have discussed about different configurations of commercial vehicles. We also discussed about the manner in which the load is transmitted to a pavement through a pneumatic tyre. We also discussed about the need to consider the lateral placement characteristics of wheel loads of commercial vehicles. And we have also seen about the methods or approaches that can be used for estimating the design traffic. (Refer Slide Time: 00:52:03 min)
But it is true that we have not completely covered the aspect of how to exactly estimate the total design traffic because we have not discussed the aspect of converting the given number of commercial vehicles into equivalent standard loads. This is an aspect that we are going to discuss
30

in the next lecture. Let us take up some questions from Lesson 4.2. As a customary, we will provide answers to these questions in the next lesson. The first question is, what are commercial vehicles? Why do we consider only these commercial vehicles for pavement design? The second question is, what is the legally permissible gross weight for a vehicle having two axles (front axle has single wheels and rear axle has dual wheels). So what is the total legally permissible gross weight for this vehicle having two axles; front axle having two single wheels on either end and rear axle having dual wheels on either end? The third question is work out different typical load contact shapes that can be considered for a single wheel load of 20 kilo Newton load and a tyre pressure of 0.6MPa? It is circular, rectangle and other shapes that we have discussed earlier. So we have to work out different shapes for a given load and given contact area; what are the different shapes that we consider and what are the dimensions? Question four: For a 6 lane divided highway carrying a total two way volume of 8000 commercial vehicles per day with a 50-50 directional split, in each direction the traffic is 50% percent; what is the design daily traffic in terms of commercial vehicles? (Refer Slide Time: 00:54:10 min)
Now let us discuss the answers for the questions that I have asked in lesson 4.1 which was on principles of pavement design. 1. Are pavements important enough to demand the services of specialists for design? We had discussed in the last lesson. Most often pavement design is neglected, because the failures are not spectacular, they do not create so much of may be nuisance or immediate danger for users. But the deterioration is very slow.
31

It is very important considering the amount of money that is invested in constructing the pavements and money that is spent for maintaining them in proper shape on a regular basis, is huge amount of money. And also money that is lost because of improperly constructed roads or improperly designed roads. Lot of money is lost in terms of road user cost. It is a very essential that the resources that are utilized in terms as the materials. What is the contribution of each layer? What happens if a thicker layer is used? What happens if better materials are used? What is the contribution? - We need to understand these thoroughly. As a result it is not a layman’s job this has to be a specialist job for design. 2. How do you differentiate between flexible and rigid pavements? Flexible and rigid pavements are typically differentiated in terms of the load spreading capabilities. Typically flexible pavements have materials that distributes load from top layer to bottom layer. But the rigidity of each one of these layers, stiffness of each one of these layers top one will be more than the lower layer. But the difference will not be very significant as we compare in the case of a concrete pavement or rigid pavement. In the case of the concrete pavement it is going to be much stiffer than the foundation and as a result the contribution of rigid pavement, foundation in rigid pavement is not going to be very significant. 3. How do you distinguish between functional and structural failures of pavement? Functional failure or functional performance is from the point of a road user. Road user wants comfortable and safe riding surface. So this is directly correlated to the surface characteristics of the road, whereas structural failure is caused by the loads which would be in terms of fatigue cracking, which would be in terms of permanent deformation. So this is how the performance criteria and failures are different. (Refer Slide Time: 00:57:00 min)
4. What are the main external parameters influencing pavement design?
32

This we have discussed in this lesson also. The main external parameters are sub grade, traffic loads and climatic factors. 5. What is the difference between empirical and mechanistic approaches of pavement design? Empirical is the design that it is developed or criteria that is developed based on experience and some simple parameters, whereas the mechanistic approach the experience is correlated to some mechanistic parameters like stress, strain and other critical parameters. 6. What are the main disadvantages of designing pavements following empirical criteria? As this is based on past experience and based on some statistical correlation, this cannot be extra correlated to new conditions, new materials, and new traffic conditions. It can be done, but not with a great rate of confidence. So with this we conclude lesson 4.2. Thank you.
33