Interactions of waves in the speed-gradient traffic flow model
Upload
khangminh22Category
view
4download
0
Notes on traffic flow
Stephen Childress
March 29, 2005
1 The modeling of automobile traffic
When one thinks of modeling automobile traffic, it is natural to reason frompersonal experience and to visualize the car and driver as a coupled system, thedriver responding to the surrounding vehicles and operating the car to make itbecome a part of the flow of freeway and city traffic. Thus the traffic is not justa mechanical process but one in which human decisions are involved, decisionswhich we have all experienced and can understand.
In our analysis of traffic we shall however step back from this personal viewto take a broader perspective. Think of a traffic helicopter pilot looking downon the NYC highway grid. Looking at four miles of highway, the pilot will see aline of cars moving with various speeds. On some stretches, the traffic may belight and fast, on other stretches heavy and slow. To this observer the individualvehicles are not as important as the sense of overall flow of the cars. The reasonwhy the cars in the lighter traffic move faster is clear to any driver, but to theobserver in the helicopter it seems to be a property of the spacing of the cars.The closer they are together, the slower they move. Models of traffic flow try toexploit these observations and use them to formulate a set of assumptions whichproduce models which can be used to try to understand the peculiar and oftenfrustrating occurences of daily driving. Have you ever experienced an hour ofcreeping traffic on a freeway, only to realize upon passing a patch of water onthe road that this puddle is the cause of the problem, with every driver slowingdown as they pass it? What is the effect of the closing of one lane one a four-lane throughway going to do to the traffic at rush hour? (We all know too well.)One ought to be able to understand some of the large effects of seemingly smallcauses.
In the picture just suggested, the cars are viewed in the large, almost as amoving gas or liquid. This kind of picture we will call a continuum model oftraffic flow. We shall spend much of our time working from such a point ofview. There is however another body of traffic theory based upon the point ofview of the individual driver responding to surrounding traffic- just the way wewould naturally want to think about driving. This kind of study is called car-following theory. We shall also look at some examples of this approach, whichcan be thought of as analogous to studying a gas by analyzing the motion ofthe individual molecules.
1

2 Formulation
Ultimately the traffic engineer is interested in how fast cars move through thetraffic grid. Every car has a speedometer, and we all want to know how long itwill take to go from A to B. Certainly one of the main quantitative measures oftraffic is the speed of the cars in the traffic. Consider, for the sake of argument,a one-lane highway with cars in a line moving in the same direction. Since thereis no passing, and cars cannot move through each other, the order of the cars ispreserved, although they can move at slightly different speeds. Let the velocityof car “i′′ be ui. If the x-axis coincides with the road and the position of thiscar is xi(t) at time t, then the calculus tells us how ui and xi are related: ui isthe derivative with respect to time of xi. Thus
ui =dxi
dt(1)
Any discussion of traffic on our single-lane road must deal with a collectionof vehicles, with positions xi(t), i = 1, 2, . . . , N and velocities ui = dxi
dt , i =1, 2, . . . , N . The continuum approach to traffic takes the view that this collectionof discrete objects should be replaced by a “moving continuum”, a kind of fluidof vehicles. Such a fluid has a velocity at every value of x and at every time,and so we may define a velocity field by a function u(x, t). The idea is that thevariation of u(x, t) with x should be on a scale of length (say a hundred yards)which is large compared to the size of a typical vehicle. Thus the value of u(x, t)at a certain time t∗ and a certain position x∗ on the road should be the velocityof cars on that particular part of the road at that time.
If we know the velocity field for our road, how do we find the movementof an individual car? First we must specify the car. One way to do that is tochoose a particular time, say t = t0, and a particular position on the road, sayx = x0, and identify a car as being at that spot at that time. If we then wantto know where this car is located at times t > t0, we must use our knowledgeof the velocity field, which tells us how fast any car is going when at position xand time t. Thus if x(t) is the position of our car, we know that x(t0) = x0 butalso that
dx
dt= u(x(t), t). (2)
This last equation is the crucial one, since it relates the overall velocity field tothe function x(t) for the particular car which was located at x0 at time t0. Wesometime will call x(t) the Lagrangian coordinate of the car. This name paysrespect to the French mathematician Lagrange (1736-1813), who introducedthe description of a fluid by tracking the motion of individuals particles of thefluid. Also, u(x, t) is sometimes called the Eulerian velocity field, after theSwiss mathematician Euler (1707-1783), who introduced the description of fluidmotion using a velocity field.
Note that the problem of locating the position of our car, summarized as
dx
dt= u(x(t), t), x(t0) = x0, (3)
2

where u(x, t) is a given function, amounts to solving an ordinary differentialequation of first order with an initial condition at the time t0.
Problem 1: Consider the units of x to be in miles. On the stretch of road0 < x < 4 cars are accelerating from a red light, and the velocity field is foundto be u(x, t) = 10x+30t miles per hour where t > 0 is measured in hours. Whatis the Lagrangian coordinate of the car which was located at x = 1.5 at timet = 0? To answer this we must solve
dx
dt= 10x + 30t, x(0) = 1.5. (4)
Using the integrating factor e−10t, we have ddt (e
−10tx) = 30te−10t. Integratingby parts, we get e−10tx = −(.3 + 3t)e−10t + C or x = −(.3 + 3t) + Ce10t.From our initial condition x(0) = 1.5 = −.3 + C, or C = 1.8. Thus x(t) =−(.3 + 3t) + 1.8e10t.
We shall make frequent use of the x − t plane in describing traffic flow. Infigure 1 we show the velocity field just discussed, represented by the familyof vehicle trajectories, each curve being the path of a car. (Note: the textsometimes uses the very nonstandard t − x diagram instead of the standardx − t diagram we use throughout here. Watch for this in your redading.)
Figure 1. The vehicle trajectories for the velocity field u(x, t) = 10x + 30t,0 < x < 4. The dashed line is the path of the vehicle initially at x = 1.5 miles.
If a vehicle is traveling at constant velocity u, then in the x − t plane itspath is the straight line x = u(t − t0) + x0.
3

If we know the trajectories of all of the vehicles in a traffic flow, then weought to be able to determine the velocity field of the flow. This is the probleminverse to the one we just solved, which was to find the car trajectory given thevelocity field.
Problem 2 Let the cars’ trajectories be given by x = t2 + 2tx0 + x0. Notethat x(0) = x0, identifying the parameter x0 as the initial position. Find thevelocity field for this flow. To do this first compute the velocity, then use thetwo equations to eliminate x0. Thus we have dx
dt= u = 2t + 2x0, where the first
equation tells us that x0 = x−t2
1+2t . Therefore u(x, t) = 2t + 2x−2t2
1+2t = 2t+2t2+2x1+2t .
We point out that the parameter which determines which car we pick neednot be the initial position.
Problem 3 let a family of vehicle trajectories be given by x = aet + a2, a >0. Find the corresponding velocity field u(x, t). We have u = aet and a =(√
e2t + 4x − et)/2. Thus u(x, t) = et(√
e2t + 4x− et)/2.Problem 4 (See text, problem 57.6, page 264). Since every car has constant
acceleration β, and starts (at t = 0 with zero velocity, we have u = βt = dxdt .
Since x(0) = β, we obtain x = βt2/2 + β. To get the velocity field we elminateβ between u = βt and x = βt2/2 + β. This gives u(x, t) = xt
1+t2/2.
3 Traffic density
The second basic measure of traffic in a continuum model, in addition to thevelocity field, is the traffic density. We again imagine a one-lane road with carsspread along it. The traffic density on this road associated with a given positionx and time t, is the average number of vehicles per unit legnth of road at theposition and time specified. Clearly to measure a density we need a stretch ofroad with enough cars on it to allow a reasonable statistical average. At thesame time, we want to talk about the spatial variation of traffic density alongthe road, so the length over which we average should not be too long either,or else we will be getting to the natural scale of variation of the density. (Youshould read section 58 of the text for further discussion of this issue.)
We will use the traditional symbol for fluid density, namely ρ, for the trafficdensity. Thus ρ(x, t) is the average number of cars per unit length at the positionx and time t.
If all vehicles have length L (or else L is a good average length, and thespacing (or average spacing) between the cars is d, then each vehicle takes upL + d units of road, so that approximates 1
L+d vehicles will be present per unitlength of road. Thus the constant density of the traffic in this case is ρ = 1
L+d .
4 Traffic flux
Again we think of our one-lane road, now having traffic with a certain densityand velocity field. Another thing we need to think about is the common usageof the term traffic flow.We mean by this the rate at which What this is refering
4

to is the rate at which cars an observer on the edge of the road, i.e. the numberof cars per unit time which cross a given point on the road. We have seen theline accross a road that counts passing vehicles. This is being used to determinethe traffic flow. Actually we shall prefer to use another term: traffic flux. Theflux of cars is the wame as the flow (or better, the flow rate) of cars–i.e. thenumber of vehicles going by per unit time.
A key equation: Flux equals velocity times density If there are 100cars per mile on a road, and each car is going 60 mph, then in one hour 60 milesworth of cars will pass an observer at the side of the foad, or 60 × 100 = 6000cars per hour. This is the flux in this example., with u = 60 miles per hour andρ = 100 vehicles per mile. The flux is ρu = 60 × 100 vehicles per hours (in theunits, the “miles” cancel out).
We shall use the symbol q for flux. The flux is another key function whichin general will depend, like u and ρ, upon x and t. thus
q(x, t) = ρ(x, t)u(x, t), (5)
Problem 5 Assume that cars cannot leave or enter a one-way, two lanethoroughfare. At some point one lane is closed. After some confusion, thesituation settles down to a steady state. The conditions well before the laneclosing are seen to be constant and uniform; both lanes have the same densityρ1 and the same velocity u1. Note that ρ1 is the density in each lane. Wellafter the closing of one lane, conditions are again uniform on the single lanewith u = u2 and ρ = ρ2. What relation must exist between ρ1, ρ2, u1, u2? Sincethere are two lanes before the closing, the flux of cars on the throughfare thereis q1 = 2ρ1u1. Well downstream of the closing the flux is q2 = ρ2u2. Sinceeverthing is steady, and cars cannot leave or enter, the flux into the closingregion must equal to that out of the region. Thus we have 2ρ1u1 = ρ2u2.
Thus if the speed stays the same (u2 = u1), the density must double. In fact,higher density generally forces drivers to go slower, which drives the density upeven further in order to preserve flux, leading to extreme slowdowns. To reallyexmine this problem, however, we need to study how flux and density are relatedthrough “conservation of vehicles” in roads without entrance or exit.
5 Conservation of the number of vehicles
Again we consider our ‘bare” one-lane road (no entrances or exits). If we selectsome stretch of the road, between points x = A and x = B > A say, we knowthat the number of cars found to lie between A and B at some time t will ingeneral depend upon the time t. If more cars flow into the segment AB than flowout of it, the number of vehicles within the segment will increase, and similarif more flow out than in, it will decrease. We can express this mathematicallyin terms of the flux at A and B. Namely, the rate of change of the number ofvehicles in the segment, with respect to time, should equal the difference in flow
5

rate or flux. If NAB(t) is this number of vehicles, then
dNAB
dt= −q(B, t) + q(A, t). (6)
On the other hand we know that NAB can be comuted from the density byintegration:
NAB(t) =∫ B
A
ρ(x, t)dx, (7)
Thus we can rewrite our relation as
d
dt
∫ B
A
ρ(x, t)dx = −q(B, t) + q(A, t). (8)
We say that this last result is a global conservation law for the vehicles on theroad. Note that the signs on the right are consistent. If q(B, t) > q(A, t) themore calls flow out than in, so NAB will decrease in time.
For example, in problem 5 we considered the effect of a lane closing, andassume that the road had “settled into a steady state”; we then deduced thatthe fluxes were the same. We can see from our conservation law (8) that q(B, t)−q(A, t) whenever ρ becomes independent of time. This is because
d
dt
∫ B
A
ρ(x, t)dx =∫ B
A
∂ρ
∂tdx, (9)
since A, B are constants. Note the use of the partials on the right, since ρ alsodepends upon x.
The global conservation law implies a local conservation law, expressing theconservation of vehicle number on any stretch of road sufficiently long to allowus to assign a meaningful velocity and density function. To get the local relationwe use the fundamental theorem of the calculus:
∫ B
A
∂q(x, t)∂x
dx = q(B, t) − q(A, t). (10)
Note that we have used a partial derivative with respect to x here, since qdepends on both x and t. Otherwise this is the calculus I theorem.
Using (8),(9), and (10), we have∫ B
A
[∂ρ(x, t)
∂t+
∂q(x, t)∂x
]dx = 0. (11)
Now this relation holds over an interval AB. We now use the following result(which we do not prove here): Let f(x) be continuous on some closed interval[α, β] and assume that ∫ B
A
fdx = 0 (12)
for any interval AB ∈ (α, β). Then f = 0 for α < x < β.
6

Using this result, we see that (11) implies that
∂ρ(x, t)∂t
+∂q(x, t)
∂x= 0. (13)
Using (5) we can write (13) as
∂ρ
∂t+
∂(ρu)∂x
= 0. (14)
Problem 6 let xA(t) be the position of one car on our one-lane road, andxB(t) be the position of another car many miles ahead. Then the number ofcars between cars A and B is a constant, independent of time.
Of course this is obvious physically, but we can show it using calculus:
d
dt
∫ xB(t)
xA(t)
ρ(x, t)dx =∫ xB(t)
xA(t)
dρ(x, t)dt
dx+ρ(xB(t), t)dxB(t)
dt−ρ(xA(t), t)
dxA(t)dt
.
(15)But the right-hand-side of the last equation is just
∫ xB(t)
xA(t)
dρ(x, t)dt
dx + q(xB(t), t) − q(xA(t), t) = 0 (16)
by (8).
6 Velocity as a function of density
.The equation we now have for vehicle conservation,
∂ρ
∂t+
∂(ρu)∂x
= 0, (17)
is one relation involving two unknowns. Conventionally, we would need anotherrelation to close the system in two unknowns. A major assumption that isoften made by traffic modelers is that velocity may be reasonably assumed tobe a function of the density alone. That is, we can assume u = u(ρ) and ourequation becomes a relation in ρ and its derivatives:
∂ρ
∂t+
∂(ρu(ρ))∂x
= 0, (18)
Such an equation is called a partial differential equation (PDE) of first order.It is a PDE because of the two variables involved, x, t, and the partial differen-tiations with respect to these variables. It is a first-order equation because onlyfirst partials are involved. To see this set F (ρ) = ρu(ρ). Then the equation (18)can be written
∂ρ
∂t+ F ′(ρ)
∂ρ
∂x= 0. (19)
7

We will focus later on how to solve this equation once u(ρ) is given. For themoment our concern is whether or not this assumption is justified, and thenwhat the function u(ρ) should be.
On a single-lane open road this assumption seems to be fairly reasonable. Anisolated car tends to have a maximum velocity of travel, either the result of speedlimits or road conditions or driver caution, call it umax Then for our functionu(ρ) we should take u(0) = umax. We know that traffic speeds tend to go downwith increasing traffic density, so we should assume that du/dρ < 0, ρ > 0.Also there is surely a density, bumper to bumper traffic say, where the speedis essentially zero. Call this density ρmax. If L is average car length, we couldtake ρmax = 1/L. One widely used relation is
u(ρ) = umax(1 − ρ/ρmax). (20)
Most of our discussion will concern the model of traffic flow which results fromusing (20).
Another argument might go as follows: assume that a deceleration rate Ais tolerable to a driver, and therefore the driver will tend to stay a distance dbehind a car so that if the car suddenly slowed to half (say) of its speed, thedriver would be able to avoid a collision. The time it takes to decelerate fromspeed u to speed u/2 is T = u
2A , and the shortening of the distance between thecars to zero in this time implies that
∫ T
0
(u − At)dt = d + uT/2, (21)
giving d = u2/(8A). If the average car length is L, then 1/(d + L) should bethe density when moving at speed u. Thus
ρ =1
L + u2/(8A), (22)
, or
u = K
√1
Lρ− 1, K =
√8AL. (23)
Since this relation goes to +∞ as ρ → 0, we must cut it off when u = umax.Thus
u =
{umax, if 0 < ρ < ρmin,√
8AL√
1Lρ
− 1, if ρ > ρmin. (24)
Here
ρmin = L−1[1 +u2
max
8AL]−1. (25)
8

In figure 2 we compare relations (20) amd (24) for some typical numbers.
Figure 2. Velocity as a function of density using (20)(dotted line) and (24)(solid line). We take L = 14feet, A = 20 ft/sec2, umax = 100 ft/sec.
9

7 Car-following theory
We insert here a few ideas from car-following theory in order to contrast themwith the continuum model we shall be looking at in more detail. There areany number of ways that modelers have tried to capture the driver responseto surrounding traffic. The simplest assumes a given vehicle responds only tothe car immediately in front of it (again restricting ourselves to the case ofa single lane with no passing). One useful approach is to assume that car nresponds to the car in front of it, car n + 1 say, according to the difference oftheir two velocities. Let a fraction λ of the velocity difference of the two cars beeliminated by acceleration (or deceleration) of car n. Clearly deceleration willapply if un > un+1. If an is acceleration, then we should have
an = −λ(un − un+1), (26)
In terms of car positions,
d2xn
dt2(t) = −λ
(dxn
dt(t) − dxn+1
dt(t)
). (27)
A somewhat more accurate model is to take into account a time delay T of theresponse of the driver in car n:
d2xn
dt2(t + T ) = −λ
(dxn
dt(t) − dxn+1
dt(t)
). (28)
If all cars mover at the same speed u and are equally space a distance d apart,so that d + L is the front to front distance between cars (L=car length), thenone integration of (27) gives, since 1/(L + d) is then the uniform car density,
u = −λ(xn − xn+1) + C = λ(L + d) + C =λ
ρ− λ
ρmax. (29)
Here we have chosen the constant of integration to make u = 0 at ρ = rhomax.This gives us a velocity-density relation from a car-following theory. Since itgoes to infinity as ρ → 0 we need to again cut this off and take
u(ρ) ={
umax, for 0 < ρ < ρmin,λ(1
ρ − 1ρmax
), for ρmin < ρ > ρmax. (30)
Here ρmin is defined in terms of umax, ρmax, λ by umax = λ( 1ρmin
− 1ρmax
).Let’s examine the likely value of λ. It is useful here to deal with the unite
feet and seconds, since we are talking about interactions between cars on thescale of seconds. It would seem reasonable to assume that a driver would tryto eliminate the velocity difference in about 5 seconds, or about 1/5 of thedifference per unit time, making λ = 1/5. To see how this plays out in a drivingsituation, suppose that two cars, car n and n+1, are both moving at 100 ft/secand at t = 0 are separated by 200 feet, with car n at x = 0. At this momentcar n + 1 begins a constant deceleration, so that un+1(t) = 100− 20t, so it will
10

come to a stop in five seconds. We shall neglect the reaction time of driver n(i.e. the delay T ), so we use (28) with λ = 1/5:
d2xn
dt2(t) +
15
dxn
dt(t) =
15(100 − 20t). (31)
The solution of this inhomogeneous first-order ODE has the form
xn = At2 + Bt + C + De−t/5. (32)
The conditions are that xn(0) = 0 and dxn/dt(0) = 100. We find (verify this!)
xn(t) = 200t − 10t2 + 500(e−t/5 − 1). (33)
Also we see by an integration, using xn+1 = 200, that
xn+1 = 100t − 10t2 + 200. (34)
At t = 5 seconds car n + 1 has come to rest at xn+1 = 450 feet while we canshow that car n is still moving and in fact will collide with car n + 1 shortlyafter 5 seconds, see figure 3. Whether this value of λ is realistic is a matterof discussion. Problem it should be somewhat larger. However this calculationillustrates one aspect of the model which is unrealistic, namely the assumptionthat there is a constant λ which describes driver response. Obviously it is onething to react calmly to speed changes, but quite another if you see a collisionis imminent. In the calculation of figure 3 surely driver n is going to hit thebrakes harder and harder into the stop.
Figure 3. Car-following calculation of a collision.
We have dealt here only with the response of one car to a given motion of thecar ahead. Clearly though if one considers N cars in a line, they will interact ina way which couples though a system of ODE’s. Car-following theory studiesthese large systems of equations to get at the collective behavior. This is clearlycomputationally intensive and quite different from the continuum approach.
11

8 Linear traffic waves
Our PDE for the traffic density,
∂ρ
∂t+
∂(ρu(ρ))∂x
= 0, (35)
will now be examined in more detail using the relation u(ρ) = umax(1−ρ/ρmax).This implies that q(ρ) = ρu(ρ) = umax(ρ−ρ2/ρmax). This is a simple quadraticfunction of ρ. We plot this in figure 4, using ρmax = 1/14 vehicles per foot or5280/14 ≈ 377 vehicles per mile , with umax = 70 mph.
Figure 4. Flux as a function of density for when u = umax(1 − ρ/ρmax).Here umax= 70 mph and rhomax =377 vehicles per mile.
We can write (35) as∂ρ
∂t+ q′(ρ)
∂ρ
∂x= 0, (36)
This is an important form of the equation. Note that q′ = dq/dρ has thedimensions of velocity. We are going to see that (36) expresses that waves,called traffic waves propagate with a velocity given by q′(ρ). For the moment,however, we shall restrict attention to linear traffic waves.1. Let us suppose thatρ = ρ0 + δρ in (36), where δρ � ρ0. That is, we want to consider s case wherethe traffic density is slightly perturbed from a constant density ρ0. Note that ifwe put this into (36), we will need to expand q′ in a Taylor series,
q′(ρ0 + δρ) = q′(ρ0) + q′′(ρ0)δρ + . . . , (37)
but we see that the terms in δ can actually be dropped wince both partialderivatives in (36) are of order δ. Thus the linearized form of (36) is
∂ρ
∂t+ q′(ρ0)
∂ρ
∂x= 0, (38)
1“When in doubt, be wise......linearize.”
12

Note that we could have written the partials as acting on δρ. We prefer toinclude the constant ρ0 to express this as an equation for the total density. Theimportant point is that q′(ρ0), having the units of a velocity, is a constant, callit v0. Now the equation
∂ρ
∂t+ v0
∂ρ
∂x= 0, (39)
has a very general solution of the form ρ = f(x − v0t) for any differentiablefunction f(x), as is easily seen by substitution in (39). To understand themathematics behind this fact, it is helpful to about a general class of first orderPDE’s, which we will do in the next section. For the moment, we note simplythat ρ = f(x − v0t) describes a wave moving with velocity v0. for v0 > 0 thewave moves to the right, the opposite sign moving to the left. For example iff(x) = sin x, so ρ = sin(x − v0t)/ The point x, t such that x − v0t = π/2 isat the crest of a wave, and it moves in the x − t plane along the straight linex = v0t + π/2. Thus the solutions of (39) represent linear traffic waves Thevelocity v0 is given by
v0 = umax(1 − 2ρ0/ρmax). (40)
It is important to realize that this velocity is relative to the road surface. Notethat when ρ0 ≈ 0 we have v0 ≈ umax. This is reasonable, since it says thatthe density changes are propagating with the velocity of the cars when thereare few cars on the road. It also means that the traffic waves move with thetraffic (again reasonable for light traffic). At the other extreme, when ρ ≈ ρmax,we see that v0 ≈ −umax. Here of course cars are moving slowly, but the wavemoves backwards relative to the car’s motion at the high speed of umax. Anexample of such a high-density wave is seen when cars are slowing moving intightly packed traffic and a car suddenly stops. The wave of red brake lightscan move toward a driver extremely quickly, the cause of many a rear-ender.
A helpful analysis and interpretation of this backward motion of the wavein terms of conservation of vehicles is given on page 311 of the text.
9 Solution of a class of first-order PDE’s using
characteristic curves
This will be a mathematical digression into solving first-order PDEs using themethod of characteristic curves. Consider a function f(x, t) satisfying a first-order linear PDE of the form
∂f
∂t+ v(x, t)
∂f
∂x= 0. (41)
We shall view this equation as saying that f is not changing along a curvex = x(t). Thus if
d
dtf(x(t), t) = 0, (42)
13

we can use the chain rule to obtain
0 =∂f
∂t+
dx
dt
∂f
∂x= 0. (43)
Comparing (41) and (43) we must have
dx
dt= v(x, t). (44)
Since v is a given function of x, t, this is an ODE for x(t). The general solutionstructure of such an ODE is as a set of integral curves φ(x, t) = constant. Onany such curve we see from (42) that f will also be constant. Since the curvesof constant φ and constant f coincide, f must be a function of φ alone,
f(x, t) = F (φ(x, t)). (45)
The function F can be selected by supplying an appropriate condition. We willgenerally be interested in applying an initial condition, e.g. f(x, 0) = f0(x). Inthat case f must be such that f0(x) = F (φ(x, 0)). This last equation can inprinciple be solved for x(φ), and then f(x, t) = f0(x(φ(x, t))).
We illustrate this method with two examples:
(1)∂f
∂t+ te−x ∂f
∂x= 0, f(x, 0) = x. (46)
Here we havedx
dt= te−x. (47)
Integrating using separation of variables, we obtain
ex − t2/2 = constant. (48)
Thus f = F (ex − t2/2) is a solution for any differentiable function F . (Verifythis by substitution.) Since f(x, 0) = x, we see that F = log, so the solution isf = log(ex − t2/2).
(2)∂f
∂t+
1 + x
1 + t
∂f
∂x= 0, f(x, 0) = sin x. (49)
From dx/dt = (1+x)/(1+ t) that φ = 1+x1+t = constant. Then F (φ) = sin(φ−1)
from the initial condition (note that we get this by solving φ = 1+x1+t with t = 0
for x as a function of φ, then put this function in sinx), and the solution is
f(x, t) = sin(x − t
1 + t
). (50)
Again, this should be checked by differentiation.The curves φ = constant along which f is constant are called characteristic
curves. Although we have considered only a special class of first-order equations,
14

the method of characteristic curves applies to first-order equations of generalform. In two variables x, t, the general equations we can consider have thegeneral nonlinear, inhomogeneous form
A(f, x, t)∂f
∂t+ B(f, x, t)
∂f
∂x= C(f, x, t) (51)
We will consider the nonlinear case, but will restrict attention to our modelof traffic flow.
10 Characteristic curves and the solution of the
traffic flow equation
We now want to consider the solution
∂ρ
∂t+ v(ρ)
∂ρ
∂x= 0, v(ρ) = umax(1 − 2ρ/ρmax) (52)
using the method of characteristics. Again we try to view this equations asconstancy of ρ(x(t), t) along a curve x = x(t) in the x − t plane. We then weethat we must have
dx
dt= v(ρ(x(t), t)). (53)
This looks like a complicated problem for x, but notice that, since ρ itself isa constant on the characteristic curve, so is v(ρ). Thus the RHS of the lastequation is in fact a constant, independent of t. Thus we have
x = vt + x0 (54)
as the characteristic curve which starts at x = x0 when t = 0. Since v isconstant, this a straight line! We can moreover identify the constant value of vwith the value at (x, t) = (x0, 0):
v = v(ρ(x0, 0)). (55)
We illustrate the situation by considering the following distribution of densityat t = 0:
ρ(x, 0) =
{ 200, for x < 0,200(1 − x/2), for 0 < x < 1,100, for x > 1.
(56)
Weadopt the values ρmax = 377 cars/mile, umax = 70 mph. Then we see thatv = 70(1− 400/377) ≈ −4.3 mph for characteristics coming out of the negativex-axis, and equals v = 70(1−200/377) ≈ 33 mph for those emerging from x > 1.
15

In between we have a gradual transition, v = −4.3 + 37.3x. We draw thesecharacteristics in figure 5.
Figure 5. Solution of the traffic flow equation by the method of charac-teristics with initial density given by (56). A time interval of 12 minutes isshown.
Notice that, since ρ is constant on each characteristic, we have a way ofcomputing the traffic density as a function of x for any time. Indeed we see thatfor x < −4.3t we have ρ = 200. for x > 1 + 33t, we have ρ = 100. In betweenwe can solve
x = (−4.3 + 37.3x0)t + x0 (57)
for x0(x, t):
x0 =x + 4.3t
1 + 37.3t. (58)
In the region in between we have ρ = 200(1−x0/2), and substituting from (58)we obtain
ρ(x, t) = 1002 + 70.3t− x
1 + 37.3t. (59)
This x−t diagram shows what happens to a gradually decreasing traffic density.The traffic waves are waves of constant density. The waves speeds carry thedensity outward. The overall pattern is of a “fan”, and in fact the phenomenonis called an expansion fan.
We have here an example of solving the nonlinear traffic flow equation usingthe method of characteristics. Note that the main way it differs from solving forlinear traffic waves is that in the linear case all of the characteristics have thesame slope, since v = v0 is the same for all characteristics. In the nonlinear casethe characteristics are still straight lines, but their slope varies and is determinedby the density at the point on the initial line where they emerge.
The method of characteristics applies to any equation of the form ∂ρ∂t
+v(ρ) ∂ρ
∂x = 0. We first express the equation for the characteristic lines in the
16

formx = v(ρ(x0, 0))t + x0. (60)
We then try to solve (60) for x0 as function of x, t. Since we know ρ(x0, 0) =ρ0(x0), rho(x, t) can be obtained by inserting the function x0(x, t):
ρ(x, t) = ρ0(x0(x, t)). (61)
To illustrate this, consider the problem
∂ρ
∂t+
√ρ∂ρ
∂x= 0, x > 0. (62)
Let the initial condition by ρ(x, 0) = x, x > 0. The characteristic curves aregiven by
x =√
ρ(x, 0)t + x0 =√
x0t + x0. (63)
Solving for√
x0 and then squaring, we get
x0(x, t) =12(t2 − t
√t2 + 4x) + x. (64)
Theρ(x, t) = x0(x, t) =
12(t2 − t
√t2 + 4x) + x. (65)
That this is a solution can then be checked by partial differentiation.In general we cannot do the inversion of x = v(ρ0(x0))t + x0 to obtain
x0(x, t). However the graphical construction of the solution in the x, t plane isstill possible using the method of characteristics.
11 Traffic flow when a red light turns green
To simplify our equations we now assume that u is measured in units of umax
and that density is measured in units of ρmax. This has the effect of making
q(ρ) = ρ(1 − ρ). (66)
If x is regarded as in miles, the unit of time is them 1/umax hours. It is thereforeuseful to make umax = 60 so that time is measured in minutes. For example,speed 1 for 60 units of time (minutes) gives 60 miles.
We are interested in the situation when a red light turns green. If this occursat t = 0, then at t = 0 the density is given by
ρ(x, 0) ={ 1, for x < 0,
0 for x > 0.(67)
Now for characteristics emerging from x < 0 we see that v(1) = 1− 2 = −1 andso the characteristics are x = −t + x0 when x0 < 0. Since v(0) = 1− 0 = 1, thecharacteristics are x = t + x0 when x0 > 0, see figure 6.. The question is, whathappens in the blank area not covered by these characteristics?
17

Figure 6. Characteristics for q = ρ(1 − ρ) when ρ = 1, x < 0, = 0x > 0.
To see what goes on we modify the problem so there is a continuous changeof density instead of a discontinuity. Let ε be a small positive number. Let theinitial density then be
ρ(x, 0) =
{ 1, for x < 0,(1 − x/ε), for 0 < x < ε,0, for x > ε.
(68)
Now in the transition region we have the characteristic curves given by
x = (1−2ρ(x0, 0))t+x0 = (1−2(1−x0/ε))t+x0 = −t+2x0t/epsilon+x0, (69)
Solving for x0(x, t),
x0 =x + t
1 + 2t/ε. (70)
The in the transition region we have
ρ(x, t) = ρ0(x0(x, t)) = 1 − x + t
ε + 2t=
ε + t − x
ε + 2t. (71)
We can now let ε → 0 to obtain
ρ(x, t) =t − x
2t. (72)
18

Note that these are straight lines coming out of the origin. The line x = −tgives ρ = 1 as it should; the line x = t gives ρ = 0 as it should. We show thisexpansion fan in figure 7
Figure 7. The expansion fan given by (72) fills in the gap of figure 6.
This function shows how the density varies smoothly from 1 to 0 as the carsaccelerate. By supposing an initial, discontinuous density at t = 0, we havein effect modeled the turning on of a green light for traffic that was initiallystopped at maximum density unity in x < 0.
We now show how the expansion fan can be computed without going throughthe exercise of using a continuous transition. We realize that the characteristicsmust emanate from (0,0) as straight lines, and so we must have ρ = R(x/t) forsome function R in the transition region. We now try to solve ρt + (1 − 2ρ)ρx
by a function R(x/t). Letting η = x/t, the partials give
t−1 dR
dη(−η + (1 − 2R)) = 0, (73)
orR =
1 − η
2=
t − x
2t. (74)
We thus obtain the transition density directly.
11.1 Some properties of the traffic from a red light
In order to see better the numbers associated with motion from a red light, wewant to restore units and let q = ρumax(1− ρ/ρmax). The first question we askis, how long do you have to wait from the time the light turns green before youstart to move? The second is, what is the path of your car once you begin tomove? The third is, how close to the red light do you have to be to insure thatyou get thorugh trhe light in one cycle?
19

We now answer each of these questions in our model. Although the q versusρ relation we are using is not the best in all situations, you will be able tosee how to answer these questions given any q(ρ), although the solution of theequations may be harder for other q.
Waiting time. The leftmost radial from the origin of the expansion fan isthe traffic wave corresponding to ρmax, having velocity −umax. If the car inquestion is a distance D behind the light, the waiting time until the wave arrivesat this position is thus D/umax. In city traffic umax might be 30 mph. Takingcar spacing as 20 feet, we compute the waiting time per car As (20/5280)(1/30)hours or (20/5280)(1/30)(3600)= .45 seconds. Typical values are larger owingto human reaction time.
The vehicle path The calculation we do now is intended to emphasizethe fact that the velocity of vehicles is completely independent of traffic wavevelocity. Once a vehicle a distance D encounters the traffic wave which moveswith velocity −umax, the car will begin to move. The density in the expansionfan (problem 6 of homework 8) is
ρ(x, t) = ρmax
(umaxt − x
2umaxt
). (75)
Now the velocity of a car is u = umax(1 − ρ/ρmax). If we insert the ρ given by(75), we obtain the velocity of a car at position x, t of the plane. The path x(t)of the car thus satisfies
dx
dt= umax
(1 − 1
ρmax
[ρmax
(umaxt − x
2umaxt
)]). (76)
This simplifies todx
dt− x
2t=
umax
2. (77)
Note that we get tghe RHS is we substitute x = umaxt on the left. Thus we canwrite x(t) = umaxt + X(t) and find the
dX
dt=
X
2t. (78)
Solving this equation by separation of variables, we get X = C√
t where C isan arbitrary constant. Thus the path of a car has the form
x = umaxt + C√
t. (79)
To find the constant C, we recall that the traffic wave with velocity −umax
reaches the car a distance D behind the light at time tD = D/umax. Up to thattime the car is stationary at x = D. Then the car begins to move. Thus wewant to solve (79) with the condition
x(tD) = −D, or − D = D + C√
D/umax. (80)
20

Thus C = −2√
umaxD and
xcar(t) = umaxt − 2√
umaxDt. (81)
We show the car path as the dotted line in figure 8 for the case where D = .2miles. The time axis is in minutes if umax = 60mph.
Figure 8. The path of the car starting a distance D = .2 miles behind thered light.
Which cars get through the light if the light is green for tG timeunits? This is easy to see from (81). The last car to get through the light isthe one starting from Dlast where Dlast makes xcar(tG) = 0. Thus
0 = umaxtG − 2√
umaxDlasttG, (82)
orDlast = umaxtG/4. (83)
In city driving, where umax = 30mph say, a light of 2 minutes or 1/30 hourswill allow 1/4 mile of cars to move though.
12 Shock waves in traffic
In the context of vehicle traffic, a shock wave is an abrupt change in trafficdensity. Because our continuum model presupposes that velocity is a functionof density, a shock wave also implies an abrupt change in velocity. This is ofcourse a common driving experience. We suddenly must reduce speed from 60mph to 30 mph, with dense traffic ahead as far as the eye can see.
A shock wave will have a velocity of propagation. The shock velocity is likethe velocity of density or traffic waves in the it is not related to the vehiclespeed. To see this in it simplest setting, we consider the shock wave that resultswhen a flow of traffic meets a line of cars which are not moving at all! Suppose
21

that at t = 0 the density is ρmax for x > 0, and say ρ = 100cars/mile for x < 0, where x is in miles. Let u = 70(1− ρ/300) mph (ρmax = 300 cars/mile.). Thethe flux of cars is at density 100 is 70(100)(1-1/3)=4667 car/hour. Each caradds 1/300 miles/car to the stationary line of cars. Thus it might appear thatthe end of the line of cars is moving backward at a speed of 4667/300 = 15.6mph, but this is wrong. Each time you add a car, the end of the line is closerto the following cars. Consider figure 9.
t=0
t=a
t=2a
Shock path
Figure 9. Cars at a density of 100 vehicles/mile meeting a line of stationarycars, umax = 70mph, ρmax = 300.
In this figure cars to the left are moving at 70(1-100/300)= 46.7 mph, withone car every 1/100 miles. The time between frames allows these cars to move1/100 mile, so a in the figure is 1
(100)(46.7)hours. Now 1.5 cars are added per
frame, indicating a speed of propagation of the shock of (1.5)(1/300) (1/a)=23.33 mph, not 15.6 mph. The error in the previous calculation is to assumethat one car is being added each time a, rather than 1.5 as we see results fromthe backward movement of the end of the line.
We will presently present the calculation which gives us a formula for theshock velocity, but first we should consider for a moment what we have intro-duced into the problem with these shocks. In effect we are saying that we areforced by observation to recognize that there may be discontinuities in the vari-ables of our model, namely the density or velocity. This is simply a fact of thebehavior of the phenomena (the traffic flow). Typically in science we tend tothink of our variables as smoothly varying or continuous, we take derivativesand so forth. In fact, when we write down our traffic flow equation we are as-suming that The partial derivatives of ρ with respect to x, t exist. Here we haveto admit discontinuous functions in order to encompass the phenomena we wantto study. How can we reconcile this with the assumption of partial derivatives?
The answer is that we must not use the local conservation law to discussshocks. We should return to the global conservation law which preceded thelocal law, and which involved integrals rather than derivatives. Integrals can be
22
calculated without difficulty across discontinuous functions, So let’s do it thatway.
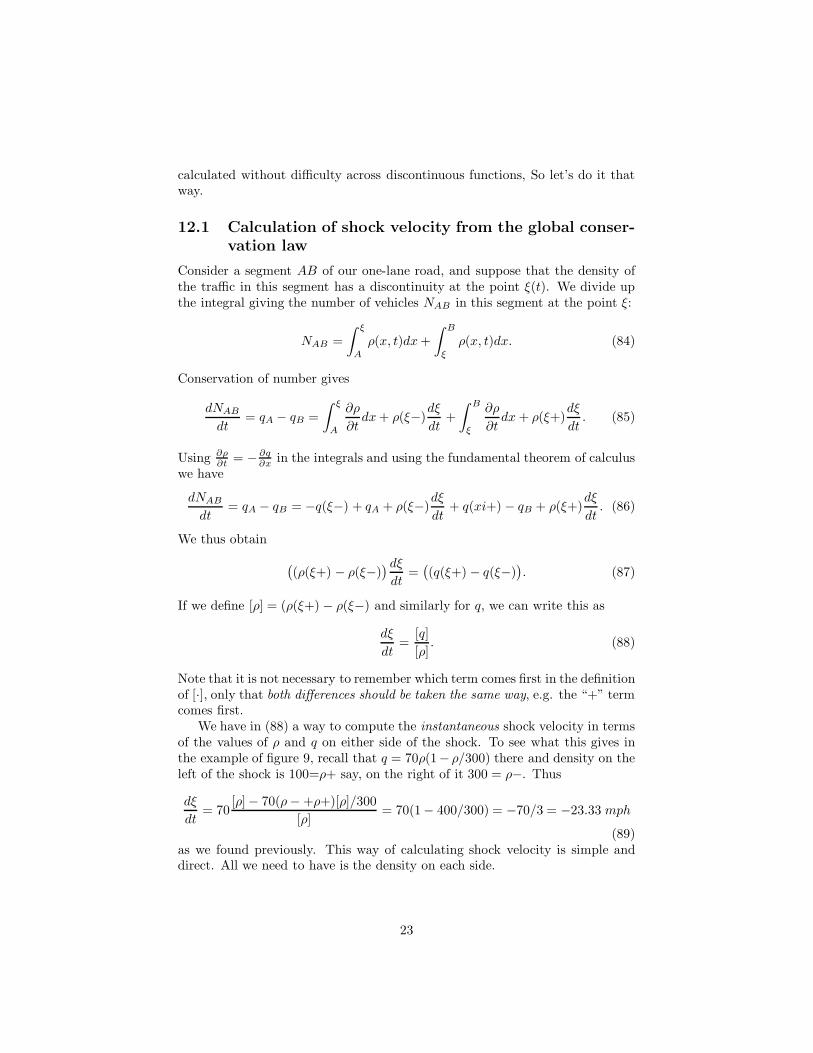
12.1 Calculation of shock velocity from the global conser-vation law
Consider a segment AB of our one-lane road, and suppose that the density ofthe traffic in this segment has a discontinuity at the point ξ(t). We divide upthe integral giving the number of vehicles NAB in this segment at the point ξ:
NAB =∫ ξ
A
ρ(x, t)dx +∫ B
ξ
ρ(x, t)dx. (84)
Conservation of number gives
dNAB
dt= qA − qB =
∫ ξ
A
∂ρ
∂tdx + ρ(ξ−)
dξ
dt+
∫ B
ξ
∂ρ
∂tdx + ρ(ξ+)
dξ
dt. (85)
Using ∂ρ∂t = − ∂q
∂x in the integrals and using the fundamental theorem of calculuswe have
dNAB
dt= qA − qB = −q(ξ−) + qA + ρ(ξ−)
dξ
dt+ q(xi+) − qB + ρ(ξ+)
dξ
dt. (86)
We thus obtain
((ρ(ξ+) − ρ(ξ−)
) dξ
dt=
((q(ξ+) − q(ξ−)
). (87)
If we define [ρ] = (ρ(ξ+) − ρ(ξ−) and similarly for q, we can write this as
dξ
dt=
[q][ρ]
. (88)
Note that it is not necessary to remember which term comes first in the definitionof [·], only that both differences should be taken the same way, e.g. the “+” termcomes first.
We have in (88) a way to compute the instantaneous shock velocity in termsof the values of ρ and q on either side of the shock. To see what this gives inthe example of figure 9, recall that q = 70ρ(1− ρ/300) there and density on theleft of the shock is 100=ρ+ say, on the right of it 300 = ρ−. Thus
dξ
dt= 70
[ρ]− 70(ρ − +ρ+)[ρ]/300[ρ]
= 70(1− 400/300) = −70/3 = −23.33 mph
(89)as we found previously. This way of calculating shock velocity is simple anddirect. All we need to have is the density on each side.
23

12.2 An example
Let q = 60ρ(1 − ρ/300) in miles/hours units. We suppose that at t = 0 thedensity on the road is given by
ρ(x, 0) =
{ 50, for x < 0,50(1 + 3x), for 0 < x < 1,200, for x > 1.
(90)
Since v(ρ) = 60(1 − ρ/150), the characteristics are
x =
40t + x0, for x0 < 0,60
(1 − 50(1+3x0)
150
)t + x0, for 0 < x0 < 1,
−20t + x0, for x0 > 1.(91)
In the transition region the characteristics are thus given by x = 60(2/3−x0)t+x0. At time t = 1/60 (i.e. one minute), these characteristics intersect at x = 2/3mile, and a shock forms. The shock velocity is given by
vshock =dξ
dt= [q]/[ρ] = 60(1 − (50 + 200)/300) = 10 mph. (92)
Consider what happens to the car at x = −1 when t = 0. The speed of thecar is initially 60(1 − 50/300) = 50 mph. At t = 1/60 it has reach x = 0 andthe shock forms at x = 2/3. Since the car’s path is given by xcar = 50t− 1 andthe shock path by xshock = 10(t− 1/60) + 2/3 the car will meet the shock whenxcar = xshock or t = 3/80 hours (2 min 15 sec). Once through the shock, thecar moves at velocity 60(1− 200/300) = 20 mph. We show the x− t diagram ofthis in figure 10.
Figure 10. Shock formation from the initial density (91). The flow-densityrelation is q = 60ρ(1 − ρ/300). The car path is for the vehicle at x = −1 whent = 0.
24

13 A green light turns red, then green
We now want to study the action of a traffic light alternately turning green andred. (To simply matters we do not allow a yellow light phase.) We have alreadyseen that a green light turning red can be represented by a shock wave describingthe cars coming to a stop behind the light. Once the light turns green again,cars start to move and this can be represented by an expansion fan. We havelooked at each of the pieces separately but now we want to put them togetherto describe the effect of traffic lights. One question we can ask (and will be ableto answer) is this: How long does the light have to stay green to insure that thecars which were stopped at the red light get through the intersection during thenext green phase?
To fix ideas we deal with a particular flow model, q = 60ρ(1 − ρ/300) andsuppose that initially the road has a uniform density of 50 cars/mile, eachmoving at speed 50 mph. At t = 0 the light (at x = 00 turns red and a stoppingshock is initiated. The light stays red for one minute, then turns green. Figure11 shows the situation just as the light turns green. The figure is based uponthe shock speed of -10 mph (verify this!).
Figure 11. The flow-density relation is q = 60ρ(1 − ρ/300). Initially thedensity is uniform at ρ = 50 cars per mile. The light at x = 0 turns red at t=0;We show the situation at t = 1/60, the light is about to turn green. The dottedline is the shock, with an equation xshock = −10t. The oblique dashed line the acontact discontinuity, coinciding with the path of the last car through the light.
13.1 The path of the shock after the light turns green
When the light turns green we have carry at ρmax waiting at the light, zerodensity ahead of the light. An expansion fan is formed at this discontinuity, as
25

we indicate in figure 12. In the expansion fan
ρ =52(60 − x
t − 1/60). (93)
(Verify this!) At time t = 1/60 the shock is located at xshock ≡ xs = −1/6 mile.At this point it sees a density 300 at xs+ and a density ρ− = 50 at xs−. It willcontinue to see these densities, hence to move with velocity -10, until it meetsthe leftmost characteristic of the expansion fan, namely x = −60(t − 1/60).But −60(t − 1/60) = −10t when t = 1/50, and the shock is at xx = −1/5.Thereafter the shock will see the fan densityρ+ = 5
2 (60− x/(t− 1/60)) and theagain ρ− = 50. According to our rule for the shock velocity
dxs
dt=
q(ρ+) − q(ρ−)ρ + − ρ−
. (94)
This expression gives
dxs
dt= 60(1 − (ρ + + ρ−)/300) = 20 +
12
x
(t − 1/60). (95)
This is a simple ODE for xs(t). The initial condition is xs(1/50) = −1/5.The solution takes the form x = A(t − 1/60) + B
√t − 1/60. Putting this into
the equation we see that A = 40. To satisfy the initial condition, −1/5 =4/30+B
√1/300, or B = −1
3
√300. We show the path of the shock in figure 12.
figure 12. The problem of figure 11 showing the path of the shock after thelight turns red. The shock path is determined by the density in the expansionfan.
26

We can see how long the light must be green in order to let the shock getthrough the intersection before the light turns red again. If this is the way thelight is timed, then again density is 50 in x < 0 when the light turns red, so thewhole process is repeated. The time of the passage of the shock through x = 0is t∗ where 40(t∗−1/60)−1/3
√300
√t∗ − 1/60 = 0. This gives t∗ = .0375 hours
or 2.25 minutes. Thus a light timed to pass the shock is red for one minute andgreen for 1.25 minutes.
We can also time the light so that the car that had just hit the shock whenthe light turned green is the last one to get through before it turns red again.This car was located at −1/6 mile at t = 1/60. This car is stopped until theleftmost expansion wave of the fan, moving from x = 0 at −60 mph, gets to it(at x = −1/6).This take 1/360 hour or about 16 seconds. The the car beginsto move in a way determined by the density in the exp[ansion fan. We do notdo the calculation here.
14 Change of road conditions
As another illustration of the use of our model, consider the following problem.Suppose that a pack of cars at density ρ0 is moving along a paved lane, withq = 60ρ(1 − ρ/300). When the head of the pack gets to x = 0, the pavementchanges to gravel. What happens then? We can try to model this by supposingthat the flow-density relation on the gravel surface is such that the speed isreduced, i.e. that u = 60(1 − ρ/300) is replaced by u = k60(1 − ρ/300) where0 < k < 1.
This model takes some thought. To fix ideas we take k = 1/2. Now themaximum flow rate of kumaxρmax/4 is, on the gravel surface, just 30(300)/4 =2250 car/hour. If the flow rate is less than this on the paved surface, we canadopt the following “flow matching” principle: If the slower road can accom-modate the flow rate of the faster road, then the density of traffic on the slowerroad is such that flow rate q is continuous at the change of surface. Thus, forexample, if ρ = 30, then q = 60(30)(9/10) = 1620 cars per hour < 2250. Thusthe matching of flow rate makes ρ on the gravel surface equal to the smaller ofthe two roots of the equation 1620 = 30ρ(1 − ρ/300), or ρ ≈ 70.6. The speedgoes from 54 mph to about 23 mph.
But suppose that q on the fast road exceeds 2250. Then we know there isno way for the slow road to accommodate this flow. Therefore a shock wavemust form since flow matching is not possible. Consider for example a packarriving at the gravel surface with 3000 cars/mile, corresponding to a densityof about 63.4 cars/mile. Cars will pile up at the start of the gravel. The firstcar across will race off at 30 mph, but succeeding cars form an expansion fan(see figure 13b). This expansion fan is calculated for the flow-density relation30ρ(1 − ρ/300). The ray x/t = 0 corresponds to ρ = 150 and coincides withthe transition from fast to slow surface. The cars there, on the gravel, aretraveling 30(1 − 150/300) = 15 mph. Thus the flow rate on the gravel sideis 15(150) = 2250 cars/hour, i.e. the maximum possible. By flow matching,
27

the flow on the pavement side x = 0− must be such that the density there islarger than 150 and that 60ρ(1 − ρ/300) = 2250, see figure 13a. This gives adensity behind the shock of 256, almost maximum density. Thus the cars arebarely moving, the velocity being 60(44/300)=8.8 mph. The shock velocity isus = 60(1 − (256 + 63.4)/300) = 3.9 mph.
Consider a car which hits the shock 2 miles from the gravel. It will take(2/8.8) hours or 13.6 minutes to get to the gravel. After that the car speedsup to 15 mph, the gradually accelerates to the maximum speed of 30 mph as itmoves through the expansion fan.
Figure 13. A change of pavement to gravel occurs at x=0. In x < 0 q =60ρ(1−ρ/300) and in x > 0 q = 30ρ(1−ρ/300). In (a) we show a flow matchingtransition for light traffic. Point A corresponds to an oncoming density of 30.Point B then gives the density on the gfravel surface. Point D is gives the densitythat will occur on the pavement behind the shock in order to match the densityof 150 developed in the transition by tbhe expansion fan. Thus is crossing togravel the density goes from D to C. The density at D and that of the oncomingpack determine the shock velocity. In (b) we show the configuration of fan andshock.
28
Copyright © 2022 FDOKUMEN