
Selection of Significant On-Road Sensor Data for Short-Term Traffic Flow Forecasting Using the...
12
IEEE TRANSACTIONS ON INDUSTRIAL INFORMATICS, VOL. 8, NO. 2, MAY 2012 255 Selection of Significant On-Road Sensor Data for Short-Term Traffic Flow Forecasting Using the Taguchi Method Kit Yan Chan, Member, IEEE, Saghar Khadem, Tharam S. Dillon, Life Fellow, IEEE, Vasile Palade, Senior Member, IEEE, Jaipal Singh, Member, IEEE, and Elizabeth Chang, Senior Member, IEEE Abstract—Over the past two decades, neural networks have been applied to develop short-term traffic flow predictors. The past traffic flow data, captured by on-road sensors, is used as input pat- terns of neural networks to forecast future traffic flow conditions. The amount of input patterns captured by the on-road sensors is usually huge, but not all input patterns are useful when trying to predict the future traffic flow. The inclusion of useless input patterns is not effective to developing neural network models. Therefore, the selection of appropriate input patterns, which are significant for short-term traffic flow forecasting, is essential. This can be conducted by setting an appropriate configuration of input nodes of the neural network; however, this is usually conducted by trial and error. In this paper, the Taguchi method, which is a robust and systematic optimization approach for designing reliable and high-quality models, is proposed for the purpose of determining an appropriate neural network configuration, in terms of input nodes, in order to capture useful input patterns for traffic flow forecasting. The effectiveness of the Taguchi method is demonstrated by a case study, which aims to develop a short-term traffic flow predictor based on past traffic flow data captured by on-road sensors located on a Western Australia freeway. Three advantages of using the Taguchi method were demonstrated: 1) short-term traffic flow predictors with high accuracy can be designed; 2) the development time for short-term traffic flow predictors is reasonable; and 3) the accuracy of short-term traffic flow predictors is robust with respect to the initial settings of the neural network parameters during the learning phase. Index Terms—Input patterns, neural network configuration, neural networks, sensor data, Taguchi method, traffic flow fore- casting. I. INTRODUCTION F ORECASTING accurate traffic flow conditions has long been identified as a proactive approach to regional traffic control [28]. The approach can be broadly classified under: i) short-term and ii) long-term traffic flow forecasting [1]. Manuscript received August 10, 2011; revised September 25, 2011; accepted November 14, 2011. Date of publication December 09, 2011; date of current version April 11, 2012. Paper no. TII-11-410. K. Y. Chan and J. Singh are with the Department of Electrical and Com- puter Engineering, Curtin University, Western Australia, Australia (e-mail: kit. [email protected]; [email protected]). S. Khadem, T. S. Dillon, and E. Chang are with Curtin University, Western Australia, Australia (e-mail: [email protected]; [email protected]; [email protected]). V. Palade is with the Computing Laboratory, Oxford University, OX1 3QD, Oxford, U.K. (e-mail: [email protected]). Color versions of one or more of the figures in this paper are available online at http://ieeexplore.ieee.org. Digital Object Identifier 10.1109/TII.2011.2179052 Long-term forecasting provides monthly or yearly traffic flow forecasting conditions and is commonly used for long-term planning of transportation or construction. Short-term fore- casting focuses on making predictions about the likely traffic flow changes in the short-term, typically within ten minutes ahead. It provides traffic forecasting required for traffic opera- tions and control, with a lead time of a few minutes based on traffic flow data, which is captured by a set of on-road sensors installed along the freeway. It also assists the proactive traffic control centre to anticipate traffic congestion and improve the mobility of transportation [37]. This paper focuses on the development of robust and accurate short-term traffic flow pre- dictors, concerned with producing real-time forecasts for a few minutes ahead, after the short-term traffic flow predictor has received past traffic flow data captured from on-road sensors within the past few minutes. The short-term traffic flow predictor represents a multi- input-single-output system, which relates the past traffic flow conditions to the future traffic flow conditions. Prior to devel- oping the short-term traffic flow predictor, the amount of input patterns of the short-term traffic flow predictor, which repre- sents the amount of past traffic flow conditions captured by on-road sensors, has to be determined. Subsequently, traditional time-series forecasting methods, such as filtering methods [23], moving average methods [29], k-nearest-neighbor methods [7] and Kalman filters [37], can be used to develop a short-term traffic flow predictor. Results show that short-term traffic flow predictors developed by these traditional forecasting methods can achieve reasonable accuracy in predicting future traffic flow conditions, but their ability to capture the strongly nonlinear characteristics of short-term traffic flow data is questionable. Also, the determination of the amount of past traffic flow conditions used as input patterns of the models is based on a trial and error method, which is very much time-consuming. Another commonly used approach, namely, neural networks (NNs) [11], [13], [22], has been applied to develop short-term traffic flow predictors [4], [8], [19], in order to address the non- linear traffic flow characteristics. To further enhance the gener- alization capability of NNs, research has been conducted by in- corporating NNs with other computational intelligence methods or statistical prediction methods, such as fuzzy systems [12], [26], [38], Kalman filter [31], fuzzy clustering method [30], and the autoregression moving average method [35], etc. Even if hybrid NNs can achieve better traffic flow forecasting results than those obtained by using only NNs, the limitation of determining useful input patterns to NNs for traffic flow fore- casting is still not resolved. In fact, there are huge amount of 1551-3203/$26.00 © 2011 IEEE
Transcript of Selection of Significant On-Road Sensor Data for Short-Term Traffic Flow Forecasting Using the...
IEEE TRANSACTIONS ON INDUSTRIAL INFORMATICS, VOL. 8, NO. 2, MAY 2012 255
Selection of Significant On-Road Sensor Data forShort-Term Traffic Flow Forecasting
Using the Taguchi MethodKit Yan Chan, Member, IEEE, Saghar Khadem, Tharam S. Dillon, Life Fellow, IEEE,
Vasile Palade, Senior Member, IEEE, Jaipal Singh, Member, IEEE, and Elizabeth Chang, Senior Member, IEEE
Abstract—Over the past two decades, neural networks havebeen applied to develop short-term traffic flow predictors. The pasttraffic flow data, captured by on-road sensors, is used as input pat-terns of neural networks to forecast future traffic flow conditions.The amount of input patterns captured by the on-road sensorsis usually huge, but not all input patterns are useful when tryingto predict the future traffic flow. The inclusion of useless inputpatterns is not effective to developing neural network models.Therefore, the selection of appropriate input patterns, which aresignificant for short-term traffic flow forecasting, is essential. Thiscan be conducted by setting an appropriate configuration of inputnodes of the neural network; however, this is usually conductedby trial and error. In this paper, the Taguchi method, which isa robust and systematic optimization approach for designingreliable and high-quality models, is proposed for the purposeof determining an appropriate neural network configuration, interms of input nodes, in order to capture useful input patterns fortraffic flow forecasting. The effectiveness of the Taguchi method isdemonstrated by a case study, which aims to develop a short-termtraffic flow predictor based on past traffic flow data captured byon-road sensors located on a Western Australia freeway. Threeadvantages of using the Taguchi method were demonstrated:1) short-term traffic flow predictors with high accuracy can bedesigned; 2) the development time for short-term traffic flowpredictors is reasonable; and 3) the accuracy of short-term trafficflow predictors is robust with respect to the initial settings of theneural network parameters during the learning phase.
Index Terms—Input patterns, neural network configuration,neural networks, sensor data, Taguchi method, traffic flow fore-casting.
I. INTRODUCTION
F ORECASTING accurate traffic flow conditions has longbeen identified as a proactive approach to regional traffic
control [28]. The approach can be broadly classified under:i) short-term and ii) long-term traffic flow forecasting [1].
Manuscript received August 10, 2011; revised September 25, 2011; acceptedNovember 14, 2011. Date of publication December 09, 2011; date of currentversion April 11, 2012. Paper no. TII-11-410.
K. Y. Chan and J. Singh are with the Department of Electrical and Com-puter Engineering, Curtin University, Western Australia, Australia (e-mail: [email protected]; [email protected]).
S. Khadem, T. S. Dillon, and E. Chang are with Curtin University,Western Australia, Australia (e-mail: [email protected];[email protected]; [email protected]).
V. Palade is with the Computing Laboratory, Oxford University, OX1 3QD,Oxford, U.K. (e-mail: [email protected]).
Color versions of one or more of the figures in this paper are available onlineat http://ieeexplore.ieee.org.
Digital Object Identifier 10.1109/TII.2011.2179052
Long-term forecasting provides monthly or yearly traffic flowforecasting conditions and is commonly used for long-termplanning of transportation or construction. Short-term fore-casting focuses on making predictions about the likely trafficflow changes in the short-term, typically within ten minutesahead. It provides traffic forecasting required for traffic opera-tions and control, with a lead time of a few minutes based ontraffic flow data, which is captured by a set of on-road sensorsinstalled along the freeway. It also assists the proactive trafficcontrol centre to anticipate traffic congestion and improvethe mobility of transportation [37]. This paper focuses on thedevelopment of robust and accurate short-term traffic flow pre-dictors, concerned with producing real-time forecasts for a fewminutes ahead, after the short-term traffic flow predictor hasreceived past traffic flow data captured from on-road sensorswithin the past few minutes.
The short-term traffic flow predictor represents a multi-input-single-output system, which relates the past traffic flowconditions to the future traffic flow conditions. Prior to devel-oping the short-term traffic flow predictor, the amount of inputpatterns of the short-term traffic flow predictor, which repre-sents the amount of past traffic flow conditions captured byon-road sensors, has to be determined. Subsequently, traditionaltime-series forecasting methods, such as filtering methods [23],moving average methods [29], k-nearest-neighbor methods [7]and Kalman filters [37], can be used to develop a short-termtraffic flow predictor. Results show that short-term traffic flowpredictors developed by these traditional forecasting methodscan achieve reasonable accuracy in predicting future traffic flowconditions, but their ability to capture the strongly nonlinearcharacteristics of short-term traffic flow data is questionable.Also, the determination of the amount of past traffic flowconditions used as input patterns of the models is based on atrial and error method, which is very much time-consuming.
Another commonly used approach, namely, neural networks(NNs) [11], [13], [22], has been applied to develop short-termtraffic flow predictors [4], [8], [19], in order to address the non-linear traffic flow characteristics. To further enhance the gener-alization capability of NNs, research has been conducted by in-corporating NNs with other computational intelligence methodsor statistical prediction methods, such as fuzzy systems [12],[26], [38], Kalman filter [31], fuzzy clustering method [30], andthe autoregression moving average method [35], etc.
Even if hybrid NNs can achieve better traffic flow forecastingresults than those obtained by using only NNs, the limitation ofdetermining useful input patterns to NNs for traffic flow fore-casting is still not resolved. In fact, there are huge amount of
1551-3203/$26.00 © 2011 IEEE
256 IEEE TRANSACTIONS ON INDUSTRIAL INFORMATICS, VOL. 8, NO. 2, MAY 2012
input patterns captured by the on-road sensors. Using all inputpatterns which includes useless input patterns is not most effec-tive in developing NNs. Zhang et al. [39], and Lachtermacherand Fuller [18] mentioned that the determination of an appro-priate amount of input patterns for the NN is a significant designfactor for time-series forecasting. Too many or too few inputpatterns may significantly affect their forecasting effectiveness.Apart from this, an optimal NN configuration, which includesan optimal number of hidden nodes, is also closely correlatedwith the amount of input patterns [39]. The specification of ap-propriate input patterns can be configured with appropriate inputnodes of the neural network, which is usually conducted by trialand error. Therefore, it is desirable to develop a methodical ap-proach for determining the appropriate amount of input patternsof short-term traffic flow predictors, so that designers can iden-tify a feasible solution-searching region, in order to improve thequality of traffic flow forecasting.
In quality control, the Taguchi method has been successfullyused to design reliable and high-quality products at low costfor various items, such as automobiles and consumer elec-tronics [14], [32]. Based on our observation, the determinationof topologies of short-term traffic flow predictors with highaccuracy and robustness can be considered as the design of ahigh quality product, or the design of robust manufacturingprocesses [21], where both designs aim to produce the resultantfunctionality which approximates the ideal function as closelyas possible. In fact, the Taguchi method has also been used forthe design of configurations of NNs for various manufacturingprocesses [16], [17], [24], [27], [52] and material characteristics[20], [41]. In this paper, we propose the Taguchi method as ameans of developing optimal topologies of short-term trafficflow predictors by optimizing the configuration and the inputsof NN models.
The present research, which adopts the Taguchi method toinvestigate the significance of the design factors for short-termtraffic flow predictors, can be classified into two types: a) pasttraffic flow conditions used as input patterns to the NN andb) NN configurations, such as the number of hidden nodes,the number of hidden layers, the activation functions betweennodes, etc. In accordance with the Taguchi method, these designfactors are arranged in an inner orthogonal array. The Taguchimethod conducts systematic trials based on orthogonal arraysto study the design factors using a small number of trials, andthen it estimates the appropriate values of the design factorsthat can optimize a given performance measure, typicallythe differences between the actual data and the responses ofthe short-term traffic flow predictors. The Taguchi method isintended to achieve the following objectives, which are crit-ical factors for the development of the short-term traffic flowpredictors: 1) high accuracy, which is required for short-termtraffic flow predictors; 2) reasonable time for the developmentof short-term traffic flow predictors; and 3) robust accuracyof short-term traffic flow predictors, which can withstand theinitial setting of the NN weights during the learning phase, inorder to reduce the chance of settling at local minima.
The rest of this paper is organized as follows. Section IIprovides a brief description of the Taguchi method. Section IIIdefines and describes the topology of the short-term traffic flowpredictor. In Section IV, the main operations of the Taguchimethod for short-term traffic flow predictor design, which
involve the identification of design factors, the specification ofobjective functions, the trial design, and analysis of accuraciesand reliabilities are discussed. Finally, the discussion of theresults and some conclusions, regarding short-term traffic flowpredictor design using the Taguchi method, is presented inSection V.
II. ROBUST DESIGN USING TAGUCHI METHOD
In this section, the Taguchi method, which has been widelyused for the robust design of products [14], [32], is briefly de-scribed. To develop a product, the basic functional prototypedesign, which defines the configuration and attributes of theproduct undergoing analysis or development, is first initiatedbased on the designers’ knowledge of the product. The initialdesign is usually far from optimal in terms of quality or robust-ness. Therefore, it is necessary to identify the settings of designfactors that optimize the performance characteristics and min-imize the sensitivity of engineering designs to the sources ofvariation.
A common approach to design optimization is to experimentwith the design factors one at time or by the trial and errormethod, until a reasonable design with certain qualities is found.However, with the trial and error method, it may take a very longtime to complete the design optimization. To determine the op-timum conditions, a “full factorial” approach can be used, whereall possible combinations of levels in all parameters are consid-ered. When a product has design factors and each of them has
levels, the total number of combinations of levels for the “fullfactorial” approach is . When the number of design factors islarge, it is almost impossible to test all possible combinationsof levels in all design factors. For example, if the designer isstudying 15 design factors with two levels, a full factorial ap-proach requires examining 32768 (i.e.: ) experiments.
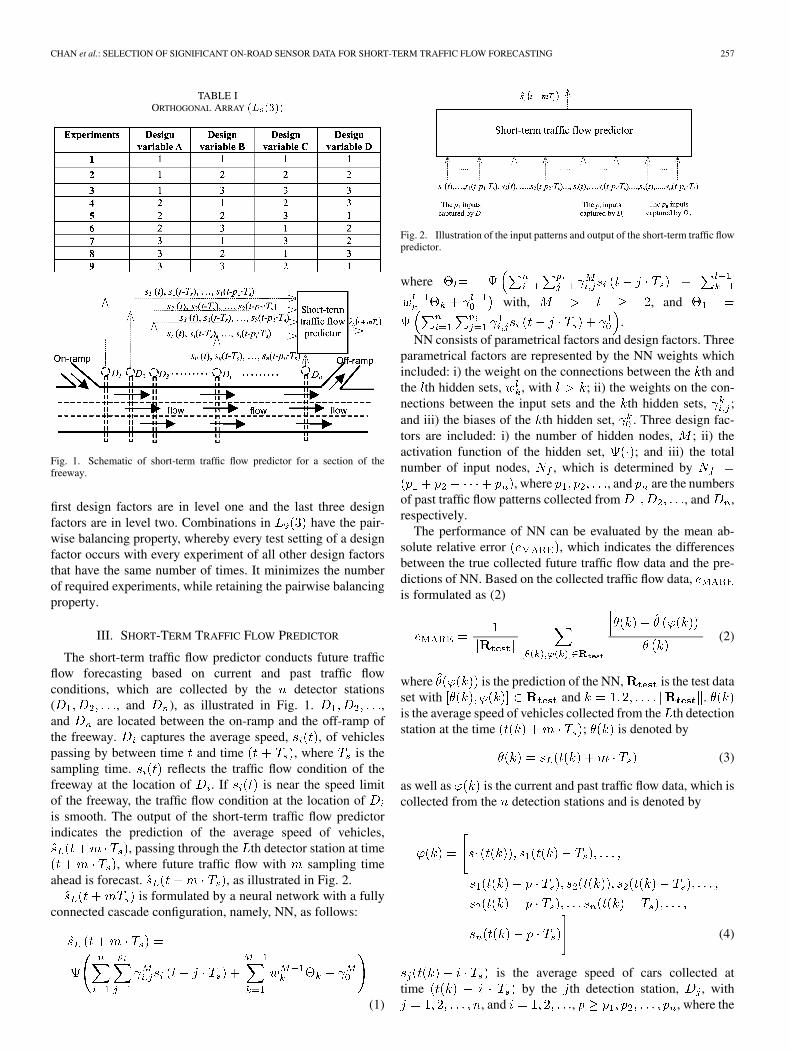
In quality engineering, the Taguchi method is extremely ef-fective to improve product quality while keeping the cost ofdesign optimization low. In particular, experimental configura-tions are a systematic and efficient mechanism for exploring thedomain of the design factors. It studies the effect of design fac-tors simultaneously by planning matrix experiments using anorthogonal array, which studies a design factor domain withthe smallest number of experiments [34]. For a product withfour design factors with each design factor having three levels,a full factorial design requires (i.e.: 81 ) experiments. Onlynine experiments are sufficient to evaluate the main effect ofeach design factor in order to determine the optimum condition,when an orthogonal array, (shown in Table I), is used.Therefore, 72 (i.e.: ) experiments are saved, comparedwith the full factorial design. In , there are four columnsrepresenting the design factors A, B, C, and D, each of whichhas three levels. The number of rows represents the configu-rations of the product to be tested with respect to the experi-mental level defined by the row. The number of columns repre-sents the maximum number of design factors which is studied,where the experimental levels defined by the columns are mu-tually orthogonal.
For example, in the first experiment, the four design factorshave respective levels of one; in the second experiment, the fourdesign factors have respective levels of either one or two. The
CHAN et al.: SELECTION OF SIGNIFICANT ON-ROAD SENSOR DATA FOR SHORT-TERM TRAFFIC FLOW FORECASTING 257
TABLE IORTHOGONAL ARRAY �� ����
Fig. 1. Schematic of short-term traffic flow predictor for a section of thefreeway.
first design factors are in level one and the last three designfactors are in level two. Combinations in have the pair-wise balancing property, whereby every test setting of a designfactor occurs with every experiment of all other design factorsthat have the same number of times. It minimizes the numberof required experiments, while retaining the pairwise balancingproperty.
III. SHORT-TERM TRAFFIC FLOW PREDICTOR
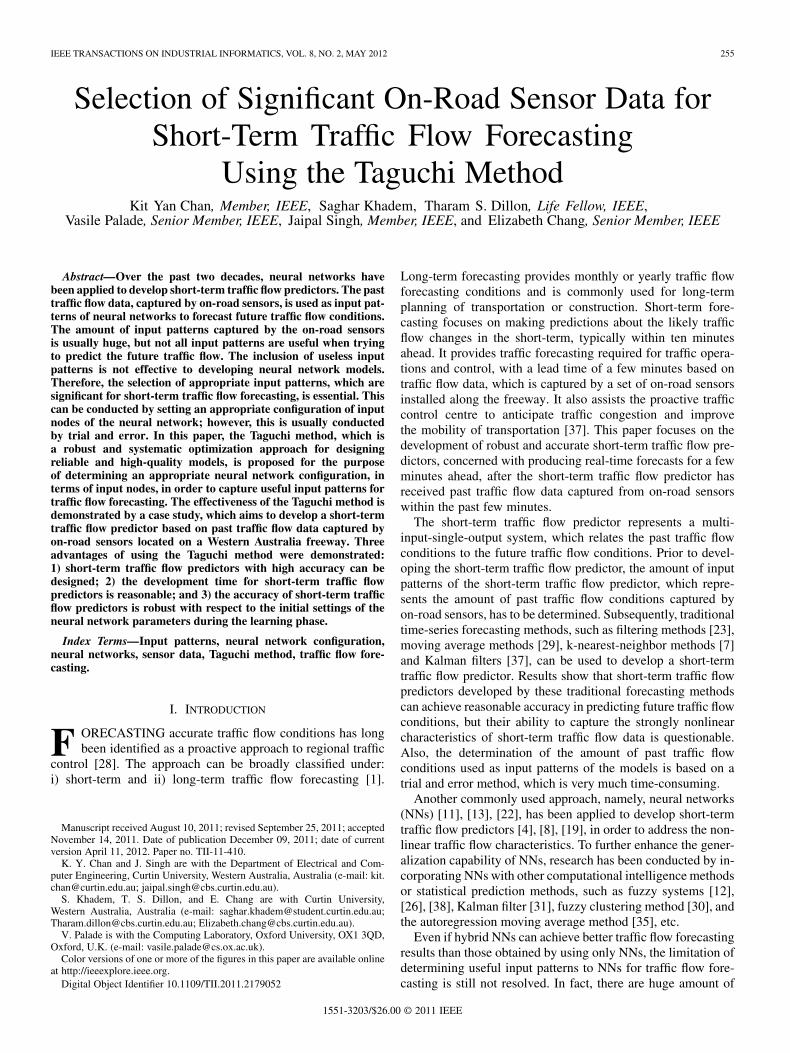
The short-term traffic flow predictor conducts future trafficflow forecasting based on current and past traffic flowconditions, which are collected by the detector stations( , and ), as illustrated in Fig. 1. ,and are located between the on-ramp and the off-ramp ofthe freeway. captures the average speed, , of vehiclespassing by between time and time , where is thesampling time. reflects the traffic flow condition of thefreeway at the location of . If is near the speed limitof the freeway, the traffic flow condition at the location ofis smooth. The output of the short-term traffic flow predictorindicates the prediction of the average speed of vehicles,
, passing through the th detector station at time, where future traffic flow with sampling time
ahead is forecast. , as illustrated in Fig. 2.is formulated by a neural network with a fully
connected cascade configuration, namely, NN, as follows:
(1)
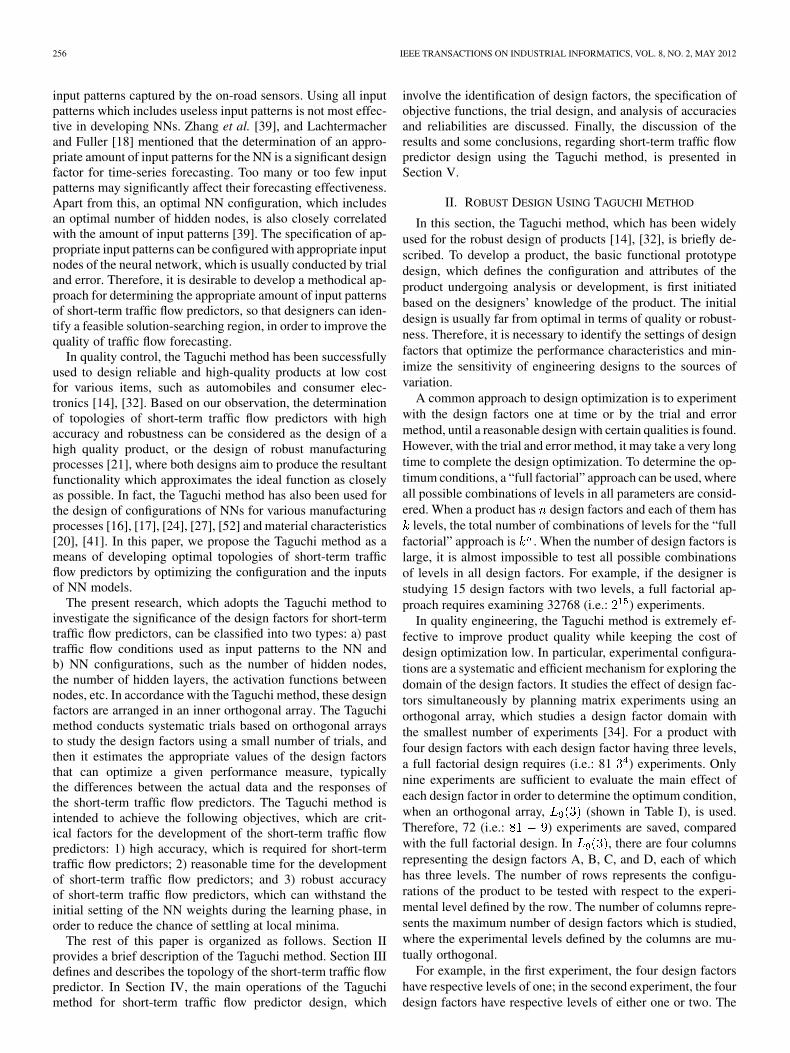
Fig. 2. Illustration of the input patterns and output of the short-term traffic flowpredictor.
where
with, , and
.NN consists of parametrical factors and design factors. Three
parametrical factors are represented by the NN weights whichincluded: i) the weight on the connections between the th andthe th hidden sets, , with ; ii) the weights on the con-nections between the input sets and the th hidden sets, ;and iii) the biases of the th hidden set, . Three design fac-tors are included: i) the number of hidden nodes, ; ii) theactivation function of the hidden set, ; and iii) the totalnumber of input nodes, , which is determined by
, where , and are the numbersof past traffic flow patterns collected from , and ,respectively.
The performance of NN can be evaluated by the mean ab-solute relative error , which indicates the differencesbetween the true collected future traffic flow data and the pre-dictions of NN. Based on the collected traffic flow data,is formulated as (2)
(2)
where is the prediction of the NN, is the test dataset with and .is the average speed of vehicles collected from the th detectionstation at the time ; is denoted by
(3)
as well as is the current and past traffic flow data, which iscollected from the detection stations and is denoted by
(4)
is the average speed of cars collected attime by the th detection station, , with
, and , , where the

258 IEEE TRANSACTIONS ON INDUSTRIAL INFORMATICS, VOL. 8, NO. 2, MAY 2012
number of input nodes of the NN is equal to .is the number of pieces of past traffic flow data collected from
all the detection stations.The determination of the optimal NN involves two main
tasks: predefining the design factors and optimizing the para-metrical factors. When the design factors are predefined, theoptimization of the parametrical factors can be carried. Theliterature indicates that much research has been conducted onthe optimization of parametrical factors of NN. For example,the back-propagation algorithm is a commonly used method totrain NNs for short-term traffic flow forecasting from the past[4], [9], [10] and recent research [15], [42].
However, the trial and error method is still usually used forpredefining the design factors. The values of , anddetermine the number of input nodes of the NN which may sig-nificantly affect the NN in forecasting future traffic flow. To pre-define the design factors, a systematical and effective method,namely, the Taguchi method [33], [34], is proposed. It has beenpreviously widely used to reduce variation in the quality char-acteristics of products and improve manufacturing robustness.The operations of the Taguchi method for designing short-termtraffic flow predictors are detailed in Section IV.
IV. DESIGN OF SHORT-TERM TRAFFIC FLOW PREDICTORS
USING TAGUCHI METHOD
In order to illustrate the use of the Taguchi method for de-signing short-term traffic flow predictors, a case study was con-ducted based on a real configuration of detection stations in-stalled along a section of the Mitchell Freeway, Western Aus-tralia. Three detection stations, , , and are located atthe intersection of Reid Highway and Mitchell Freeway: islocated at the off-ramp of Reid Highway; is located betweenthe off-ramp and on-ramp of Reid Highway; as well as is lo-cated at the off-ramp of Reid Highway. Four detection stations,
, , , and are located at the intersection of HuttonStreet and Mitchell Freeway: is located at the off-ramp ofHutton Street; and are located between the off-ramp andon-ramp of Hutton Street; also is located at the off-ramp ofHutton Street. The distance between Reid Highway and HuttonStreet is about 7 kilometers. The short-term traffic flow pre-dictor is developed to forecast future traffic flow conditions withtwosampling times ahead.
The traffic flow data sets were collected from the sixth weekof 2009. They were collected over the 2-hour peak traffic pe-riod (6.30–10.30 am) on the five business days of the week,Monday, Tuesday, Wednesday, Thursday, and Friday. Sixty sec-onds (1 minute) of sampling time were used and a total of 600observations were included in each set of traffic flow data. Eachtraffic flow data set was divided into two subsets. The first subsetof traffic flow data, namely the training data, collected fromMonday to Thursday (comprising 80% of all the observationsor 480 observations), was used for training the neural networkmodels. The second subset of traffic flow data, namely the testdata, collected from Friday (comprising 20% of all the obser-vations or 120 observations), was used to evaluate the gener-alization capability of the trained neural network models. Datacollected on Friday was used as test data and data collected fromMonday to Thursday was used as training data, because we can
TABLE IIDESIGN FACTORS OF THE SHORT-TERM TRAFFIC FLOW PREDICTORS
use only the past data (collected from Monday to Thursday) totrain the short-term traffic flow predictors and use the future data(collected on Friday) to evaluate the generalization capabilitiesof the short-term traffic flow predictors. It is not possible to usefuture data to train the short-term traffic flow predictors.
In the short-term traffic flow predictor, a complex relation-ship exists between the past and current traffic flow conditionswhich are captured by the seven detection stations, as well asthe forecasted future traffic flow condition. The main objectiveof the proposed short-term traffic flow predictor is to accuratelyand reliably forecast future traffic flow conditions. The Taguchimethod involving the following steps is proposed to optimizethe topology of the short-term traffic flow predictor:
(A) Identification of design factors of short-term traffic flowpredictors.
(B) Specification of object functions for short-term trafficflow predictors.
(C) Trial design for developing short-term traffic flow predic-tors.
(D) Analysis of accuracies and reliabilities achieved by short-term traffic flow predictors.
A. Identification of Design Factors
In the design of short-term traffic flow predictors, the de-sign factors under consideration and their alternative levels areshown in Table II.
These design factors are mostly related to determining theoptimal topology of the short-term traffic flow predictor. Designfactor A and Design factor B are critical for developing a NNfor time series forecasting [2]. Design factor C to Design I areregarding the input nodes of the short-term traffic flow predictor,which are more significant for the design of NN configurationthan is the determination of the number of hidden nodes for timeseries forecasting [39]. They are described by the following.
— Design factor A: The number of hidden nodes in thehidden layers is an important design factor, which deter-mines the size of the NN for the short-term traffic flowpredictor. The number of hidden nodes recommended by[36] is . The maximum number of hiddennodes of 50 is recommended by [6] to model a set ofbenchmark modeling problems. Therefore, Level 1, Level2, and Level 3 are set between these two settings. Ten
CHAN et al.: SELECTION OF SIGNIFICANT ON-ROAD SENSOR DATA FOR SHORT-TERM TRAFFIC FLOW FORECASTING 259
hidden nodes, 20 hidden nodes, and 50 hidden nodes areset as Level 1, Level 2, and Level 3, respectively.
— Design factor B: For the activation functions of the hiddenset, , Tansig, Logsig, and Purelin functions are com-monly used. Level 1, Level 2, and Level 3 are defined asTansig, Logsig, and Purelin functions, respectively.
— Design factors C to Design factor I: The amounts of inputpatterns of the short-term traffic flow predictor, are deter-mined by , and , with respect to the seven de-tection stations, , and , respectively. Theyrepresent the number of time sampling lags that are cap-tured by the detection stations. One time sampling lags,five time sampling lags, and ten time sampling lags areconsidered as Level 1, Level 2, and Level 3, respectively.
B. Specification of Objective Functions
The performance measure represents two aspects of the short-term traffic flow predictor: the accuracy of traffic flow fore-casting and the robustness against the noise factors. The objec-tive function in terms of the signal-to-noise ratio (S/N) is shownin (5). It is intended to address these two aspects by defining atype of signal-target problem [25]. It evaluates the accuracy ofthe traffic flow predictor by comparing the outputs of the trafficflow predictor with the actual traffic flow conditions. It also eval-uates the level of robustness against the noise factors. The idealdifferences in terms of network accuracy should be zero. If theS/N is larger, then the error between the actual traffic flow con-ditions and the forecasting is smaller, as well as the robustnessof accuracy is larger
(5)
where is the S/N ratio for the accuracy of the short-term trafficflow predictor; is the number of trials with different initialvalues of NN weights; is the mean value of ; and
is defined by (2) which indicates the differences be-tween the actual traffic flow conditions and the forecasts. Basedon (5), noise factors, including the varieties of initial values ofthe NN weights between neural net nodes, can be addressed asexternal to the short-term traffic flow predictors.
C. Trial Design
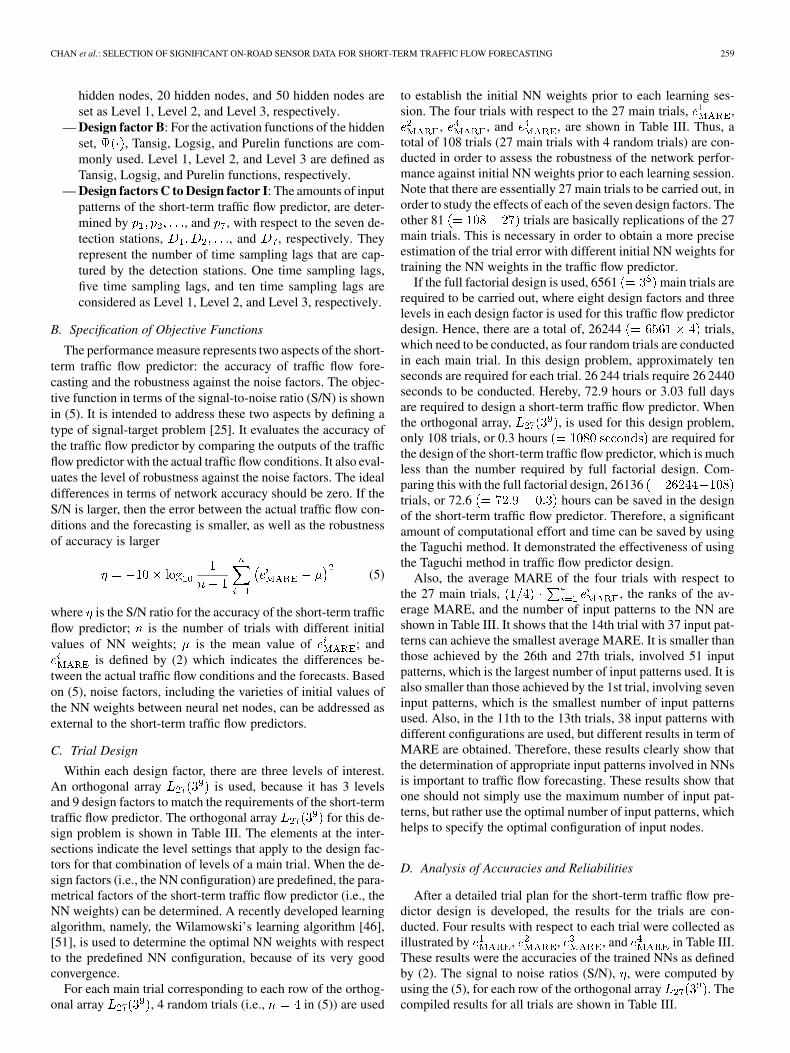
Within each design factor, there are three levels of interest.An orthogonal array is used, because it has 3 levelsand 9 design factors to match the requirements of the short-termtraffic flow predictor. The orthogonal array for this de-sign problem is shown in Table III. The elements at the inter-sections indicate the level settings that apply to the design fac-tors for that combination of levels of a main trial. When the de-sign factors (i.e., the NN configuration) are predefined, the para-metrical factors of the short-term traffic flow predictor (i.e., theNN weights) can be determined. A recently developed learningalgorithm, namely, the Wilamowski’s learning algorithm [46],[51], is used to determine the optimal NN weights with respectto the predefined NN configuration, because of its very goodconvergence.
For each main trial corresponding to each row of the orthog-onal array , 4 random trials (i.e., in (5)) are used
to establish the initial NN weights prior to each learning ses-sion. The four trials with respect to the 27 main trials, ,
, , and , are shown in Table III. Thus, atotal of 108 trials (27 main trials with 4 random trials) are con-ducted in order to assess the robustness of the network perfor-mance against initial NN weights prior to each learning session.Note that there are essentially 27 main trials to be carried out, inorder to study the effects of each of the seven design factors. Theother 81 trials are basically replications of the 27main trials. This is necessary in order to obtain a more preciseestimation of the trial error with different initial NN weights fortraining the NN weights in the traffic flow predictor.
If the full factorial design is used, 6561 main trials arerequired to be carried out, where eight design factors and threelevels in each design factor is used for this traffic flow predictordesign. Hence, there are a total of, 26244 trials,which need to be conducted, as four random trials are conductedin each main trial. In this design problem, approximately tenseconds are required for each trial. 26 244 trials require 26 2440seconds to be conducted. Hereby, 72.9 hours or 3.03 full daysare required to design a short-term traffic flow predictor. Whenthe orthogonal array, , is used for this design problem,only 108 trials, or 0.3 hours are required forthe design of the short-term traffic flow predictor, which is muchless than the number required by full factorial design. Com-paring this with the full factorial design, 26136trials, or 72.6 hours can be saved in the designof the short-term traffic flow predictor. Therefore, a significantamount of computational effort and time can be saved by usingthe Taguchi method. It demonstrated the effectiveness of usingthe Taguchi method in traffic flow predictor design.
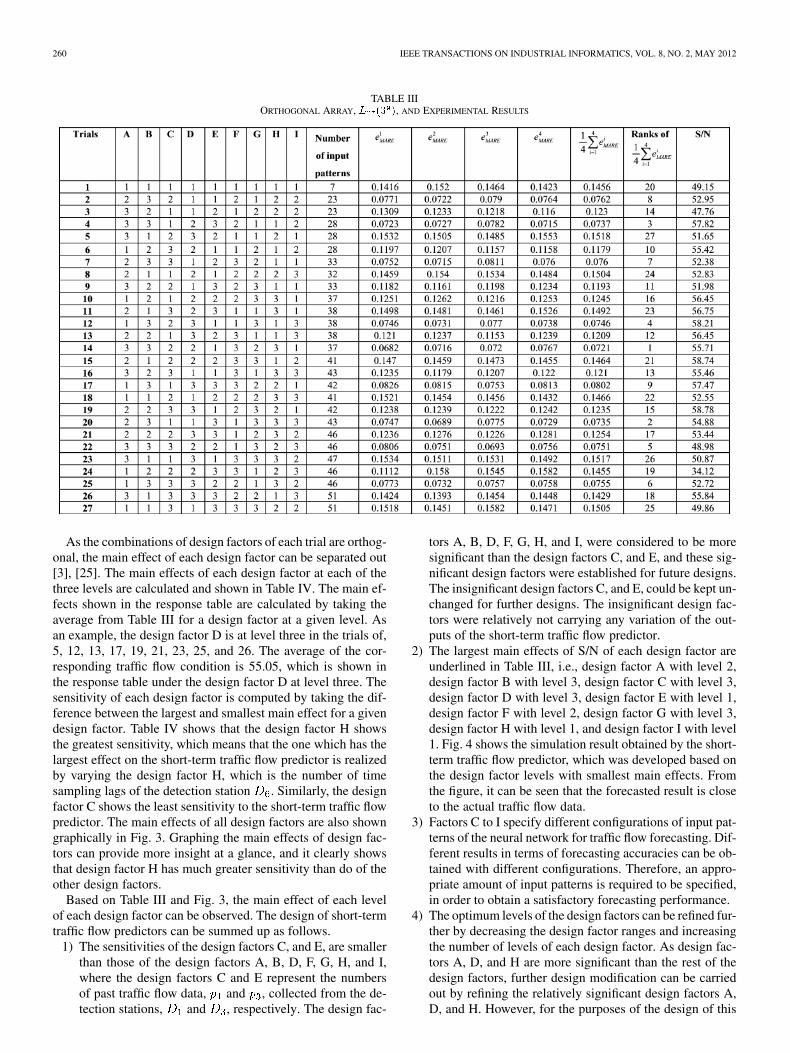
Also, the average MARE of the four trials with respect tothe 27 main trials, , the ranks of the av-erage MARE, and the number of input patterns to the NN areshown in Table III. It shows that the 14th trial with 37 input pat-terns can achieve the smallest average MARE. It is smaller thanthose achieved by the 26th and 27th trials, involved 51 inputpatterns, which is the largest number of input patterns used. It isalso smaller than those achieved by the 1st trial, involving seveninput patterns, which is the smallest number of input patternsused. Also, in the 11th to the 13th trials, 38 input patterns withdifferent configurations are used, but different results in term ofMARE are obtained. Therefore, these results clearly show thatthe determination of appropriate input patterns involved in NNsis important to traffic flow forecasting. These results show thatone should not simply use the maximum number of input pat-terns, but rather use the optimal number of input patterns, whichhelps to specify the optimal configuration of input nodes.
D. Analysis of Accuracies and Reliabilities
After a detailed trial plan for the short-term traffic flow pre-dictor design is developed, the results for the trials are con-ducted. Four results with respect to each trial were collected asillustrated by , , , and in Table III.These results were the accuracies of the trained NNs as definedby (2). The signal to noise ratios (S/N), , were computed byusing the (5), for each row of the orthogonal array . Thecompiled results for all trials are shown in Table III.
260 IEEE TRANSACTIONS ON INDUSTRIAL INFORMATICS, VOL. 8, NO. 2, MAY 2012
TABLE IIIORTHOGONAL ARRAY, � �� �, AND EXPERIMENTAL RESULTS
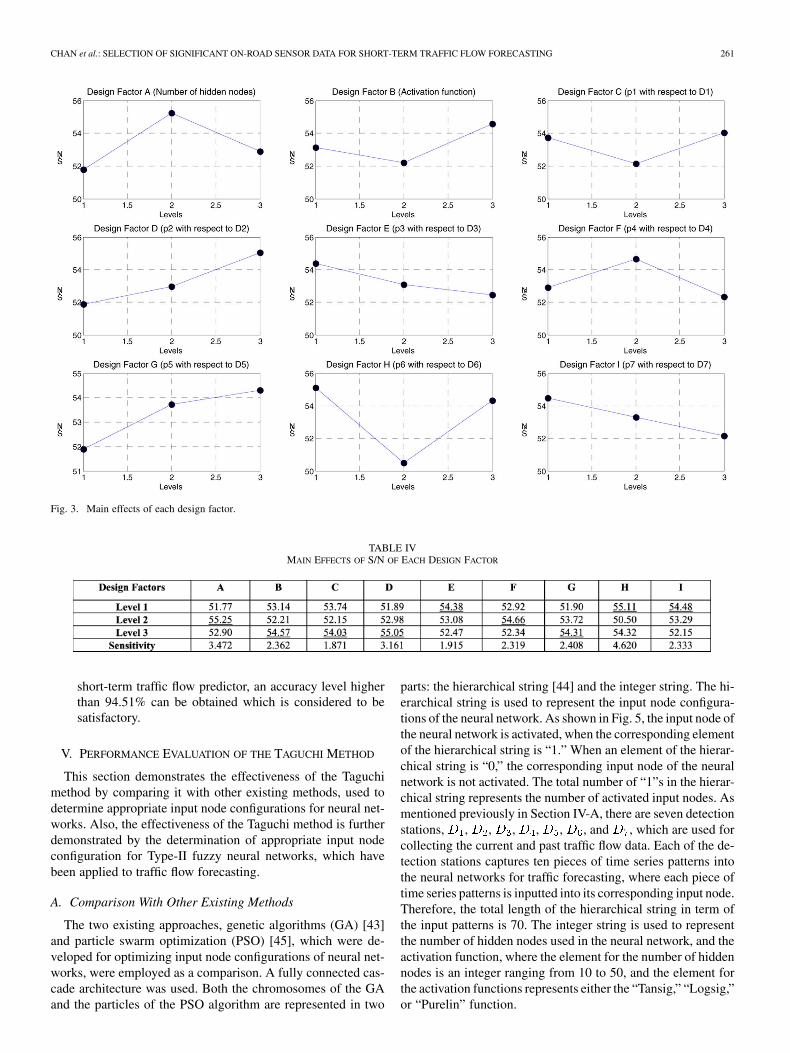
As the combinations of design factors of each trial are orthog-onal, the main effect of each design factor can be separated out[3], [25]. The main effects of each design factor at each of thethree levels are calculated and shown in Table IV. The main ef-fects shown in the response table are calculated by taking theaverage from Table III for a design factor at a given level. Asan example, the design factor D is at level three in the trials of,5, 12, 13, 17, 19, 21, 23, 25, and 26. The average of the cor-responding traffic flow condition is 55.05, which is shown inthe response table under the design factor D at level three. Thesensitivity of each design factor is computed by taking the dif-ference between the largest and smallest main effect for a givendesign factor. Table IV shows that the design factor H showsthe greatest sensitivity, which means that the one which has thelargest effect on the short-term traffic flow predictor is realizedby varying the design factor H, which is the number of timesampling lags of the detection station . Similarly, the designfactor C shows the least sensitivity to the short-term traffic flowpredictor. The main effects of all design factors are also showngraphically in Fig. 3. Graphing the main effects of design fac-tors can provide more insight at a glance, and it clearly showsthat design factor H has much greater sensitivity than do of theother design factors.
Based on Table III and Fig. 3, the main effect of each levelof each design factor can be observed. The design of short-termtraffic flow predictors can be summed up as follows.
1) The sensitivities of the design factors C, and E, are smallerthan those of the design factors A, B, D, F, G, H, and I,where the design factors C and E represent the numbersof past traffic flow data, and , collected from the de-tection stations, and , respectively. The design fac-
tors A, B, D, F, G, H, and I, were considered to be moresignificant than the design factors C, and E, and these sig-nificant design factors were established for future designs.The insignificant design factors C, and E, could be kept un-changed for further designs. The insignificant design fac-tors were relatively not carrying any variation of the out-puts of the short-term traffic flow predictor.
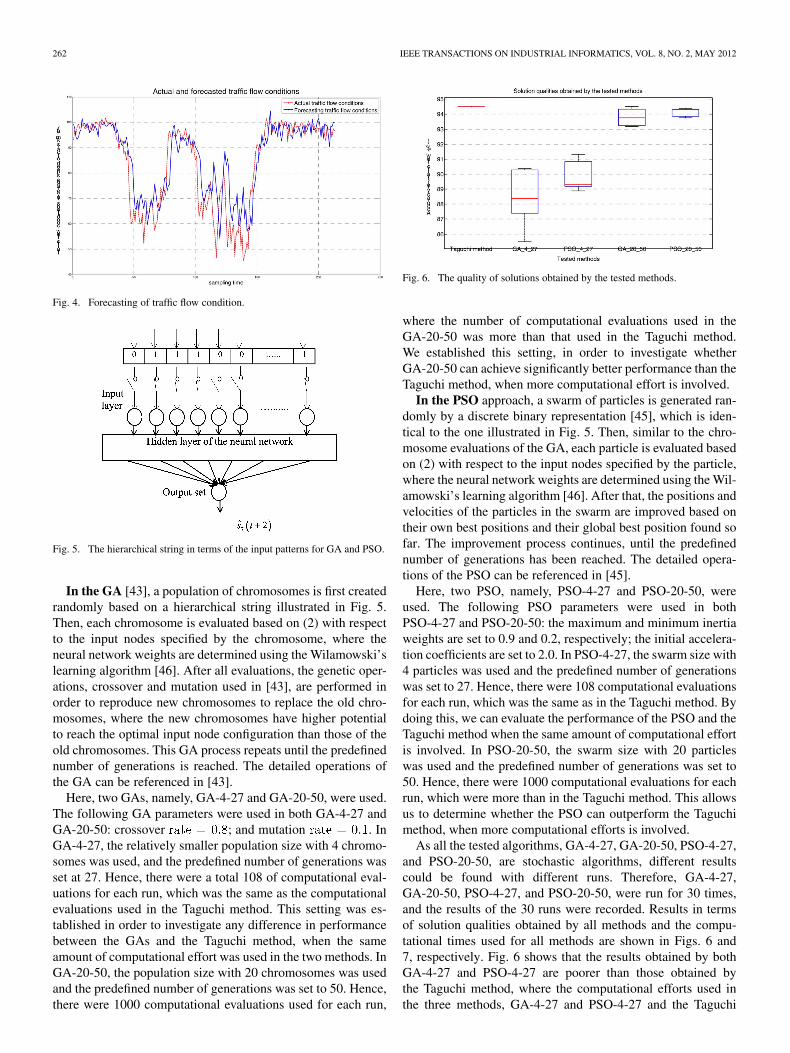
2) The largest main effects of S/N of each design factor areunderlined in Table III, i.e., design factor A with level 2,design factor B with level 3, design factor C with level 3,design factor D with level 3, design factor E with level 1,design factor F with level 2, design factor G with level 3,design factor H with level 1, and design factor I with level1. Fig. 4 shows the simulation result obtained by the short-term traffic flow predictor, which was developed based onthe design factor levels with smallest main effects. Fromthe figure, it can be seen that the forecasted result is closeto the actual traffic flow data.
3) Factors C to I specify different configurations of input pat-terns of the neural network for traffic flow forecasting. Dif-ferent results in terms of forecasting accuracies can be ob-tained with different configurations. Therefore, an appro-priate amount of input patterns is required to be specified,in order to obtain a satisfactory forecasting performance.
4) The optimum levels of the design factors can be refined fur-ther by decreasing the design factor ranges and increasingthe number of levels of each design factor. As design fac-tors A, D, and H are more significant than the rest of thedesign factors, further design modification can be carriedout by refining the relatively significant design factors A,D, and H. However, for the purposes of the design of this
CHAN et al.: SELECTION OF SIGNIFICANT ON-ROAD SENSOR DATA FOR SHORT-TERM TRAFFIC FLOW FORECASTING 261
Fig. 3. Main effects of each design factor.
TABLE IVMAIN EFFECTS OF S/N OF EACH DESIGN FACTOR
short-term traffic flow predictor, an accuracy level higherthan 94.51% can be obtained which is considered to besatisfactory.
V. PERFORMANCE EVALUATION OF THE TAGUCHI METHOD
This section demonstrates the effectiveness of the Taguchimethod by comparing it with other existing methods, used todetermine appropriate input node configurations for neural net-works. Also, the effectiveness of the Taguchi method is furtherdemonstrated by the determination of appropriate input nodeconfiguration for Type-II fuzzy neural networks, which havebeen applied to traffic flow forecasting.
A. Comparison With Other Existing Methods
The two existing approaches, genetic algorithms (GA) [43]and particle swarm optimization (PSO) [45], which were de-veloped for optimizing input node configurations of neural net-works, were employed as a comparison. A fully connected cas-cade architecture was used. Both the chromosomes of the GAand the particles of the PSO algorithm are represented in two
parts: the hierarchical string [44] and the integer string. The hi-erarchical string is used to represent the input node configura-tions of the neural network. As shown in Fig. 5, the input node ofthe neural network is activated, when the corresponding elementof the hierarchical string is “1.” When an element of the hierar-chical string is “0,” the corresponding input node of the neuralnetwork is not activated. The total number of “1”s in the hierar-chical string represents the number of activated input nodes. Asmentioned previously in Section IV-A, there are seven detectionstations, , , , , , , and , which are used forcollecting the current and past traffic flow data. Each of the de-tection stations captures ten pieces of time series patterns intothe neural networks for traffic forecasting, where each piece oftime series patterns is inputted into its corresponding input node.Therefore, the total length of the hierarchical string in term ofthe input patterns is 70. The integer string is used to representthe number of hidden nodes used in the neural network, and theactivation function, where the element for the number of hiddennodes is an integer ranging from 10 to 50, and the element forthe activation functions represents either the “Tansig,” “Logsig,”or “Purelin” function.
262 IEEE TRANSACTIONS ON INDUSTRIAL INFORMATICS, VOL. 8, NO. 2, MAY 2012
Fig. 4. Forecasting of traffic flow condition.
Fig. 5. The hierarchical string in terms of the input patterns for GA and PSO.
In the GA [43], a population of chromosomes is first createdrandomly based on a hierarchical string illustrated in Fig. 5.Then, each chromosome is evaluated based on (2) with respectto the input nodes specified by the chromosome, where theneural network weights are determined using the Wilamowski’slearning algorithm [46]. After all evaluations, the genetic oper-ations, crossover and mutation used in [43], are performed inorder to reproduce new chromosomes to replace the old chro-mosomes, where the new chromosomes have higher potentialto reach the optimal input node configuration than those of theold chromosomes. This GA process repeats until the predefinednumber of generations is reached. The detailed operations ofthe GA can be referenced in [43].
Here, two GAs, namely, GA-4-27 and GA-20-50, were used.The following GA parameters were used in both GA-4-27 andGA-20-50: crossover ; and mutation . InGA-4-27, the relatively smaller population size with 4 chromo-somes was used, and the predefined number of generations wasset at 27. Hence, there were a total 108 of computational eval-uations for each run, which was the same as the computationalevaluations used in the Taguchi method. This setting was es-tablished in order to investigate any difference in performancebetween the GAs and the Taguchi method, when the sameamount of computational effort was used in the two methods. InGA-20-50, the population size with 20 chromosomes was usedand the predefined number of generations was set to 50. Hence,there were 1000 computational evaluations used for each run,
Fig. 6. The quality of solutions obtained by the tested methods.
where the number of computational evaluations used in theGA-20-50 was more than that used in the Taguchi method.We established this setting, in order to investigate whetherGA-20-50 can achieve significantly better performance than theTaguchi method, when more computational effort is involved.
In the PSO approach, a swarm of particles is generated ran-domly by a discrete binary representation [45], which is iden-tical to the one illustrated in Fig. 5. Then, similar to the chro-mosome evaluations of the GA, each particle is evaluated basedon (2) with respect to the input nodes specified by the particle,where the neural network weights are determined using the Wil-amowski’s learning algorithm [46]. After that, the positions andvelocities of the particles in the swarm are improved based ontheir own best positions and their global best position found sofar. The improvement process continues, until the predefinednumber of generations has been reached. The detailed opera-tions of the PSO can be referenced in [45].
Here, two PSO, namely, PSO-4-27 and PSO-20-50, wereused. The following PSO parameters were used in bothPSO-4-27 and PSO-20-50: the maximum and minimum inertiaweights are set to 0.9 and 0.2, respectively; the initial accelera-tion coefficients are set to 2.0. In PSO-4-27, the swarm size with4 particles was used and the predefined number of generationswas set to 27. Hence, there were 108 computational evaluationsfor each run, which was the same as in the Taguchi method. Bydoing this, we can evaluate the performance of the PSO and theTaguchi method when the same amount of computational effortis involved. In PSO-20-50, the swarm size with 20 particleswas used and the predefined number of generations was set to50. Hence, there were 1000 computational evaluations for eachrun, which were more than in the Taguchi method. This allowsus to determine whether the PSO can outperform the Taguchimethod, when more computational efforts is involved.
As all the tested algorithms, GA-4-27, GA-20-50, PSO-4-27,and PSO-20-50, are stochastic algorithms, different resultscould be found with different runs. Therefore, GA-4-27,GA-20-50, PSO-4-27, and PSO-20-50, were run for 30 times,and the results of the 30 runs were recorded. Results in termsof solution qualities obtained by all methods and the compu-tational times used for all methods are shown in Figs. 6 and7, respectively. Fig. 6 shows that the results obtained by bothGA-4-27 and PSO-4-27 are poorer than those obtained bythe Taguchi method, where the computational efforts used inthe three methods, GA-4-27 and PSO-4-27 and the Taguchi
CHAN et al.: SELECTION OF SIGNIFICANT ON-ROAD SENSOR DATA FOR SHORT-TERM TRAFFIC FLOW FORECASTING 263
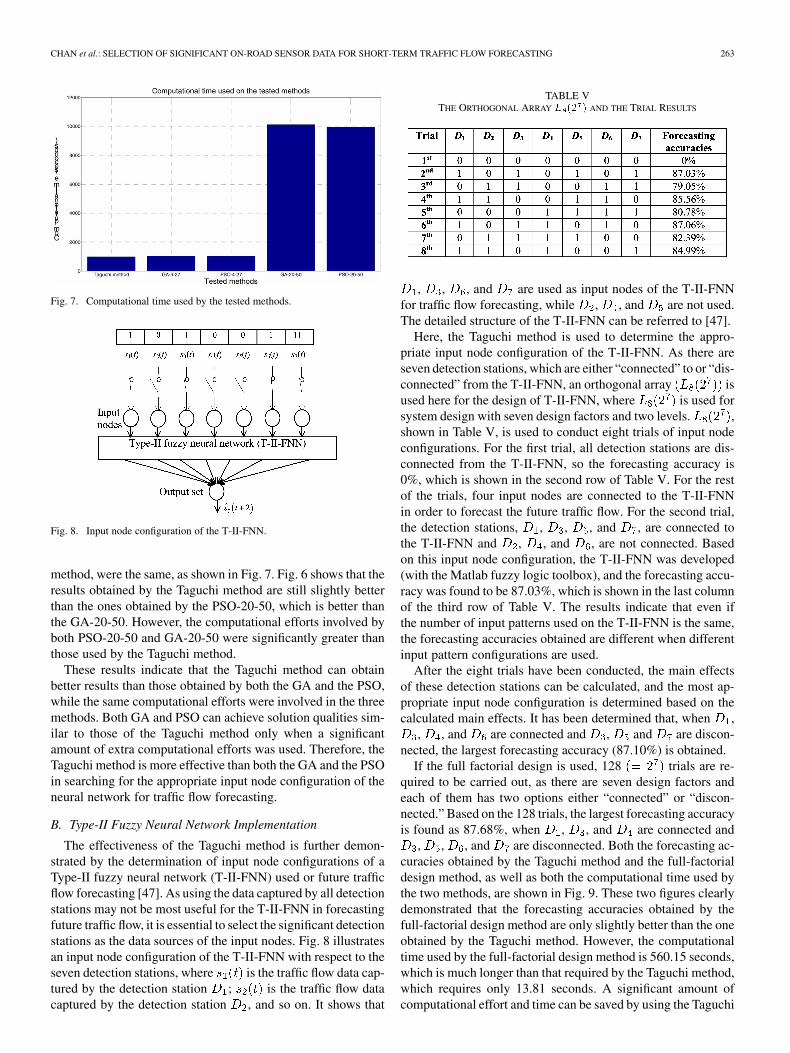
Fig. 7. Computational time used by the tested methods.
Fig. 8. Input node configuration of the T-II-FNN.
method, were the same, as shown in Fig. 7. Fig. 6 shows that theresults obtained by the Taguchi method are still slightly betterthan the ones obtained by the PSO-20-50, which is better thanthe GA-20-50. However, the computational efforts involved byboth PSO-20-50 and GA-20-50 were significantly greater thanthose used by the Taguchi method.
These results indicate that the Taguchi method can obtainbetter results than those obtained by both the GA and the PSO,while the same computational efforts were involved in the threemethods. Both GA and PSO can achieve solution qualities sim-ilar to those of the Taguchi method only when a significantamount of extra computational efforts was used. Therefore, theTaguchi method is more effective than both the GA and the PSOin searching for the appropriate input node configuration of theneural network for traffic flow forecasting.
B. Type-II Fuzzy Neural Network Implementation
The effectiveness of the Taguchi method is further demon-strated by the determination of input node configurations of aType-II fuzzy neural network (T-II-FNN) used or future trafficflow forecasting [47]. As using the data captured by all detectionstations may not be most useful for the T-II-FNN in forecastingfuture traffic flow, it is essential to select the significant detectionstations as the data sources of the input nodes. Fig. 8 illustratesan input node configuration of the T-II-FNN with respect to theseven detection stations, where is the traffic flow data cap-tured by the detection station ; is the traffic flow datacaptured by the detection station , and so on. It shows that
TABLE VTHE ORTHOGONAL ARRAY � �� � AND THE TRIAL RESULTS
, , , and are used as input nodes of the T-II-FNNfor traffic flow forecasting, while , , and are not used.The detailed structure of the T-II-FNN can be referred to [47].
Here, the Taguchi method is used to determine the appro-priate input node configuration of the T-II-FNN. As there areseven detection stations, which are either “connected” to or “dis-connected” from the T-II-FNN, an orthogonal array isused here for the design of T-II-FNN, where is used forsystem design with seven design factors and two levels. ,shown in Table V, is used to conduct eight trials of input nodeconfigurations. For the first trial, all detection stations are dis-connected from the T-II-FNN, so the forecasting accuracy is0%, which is shown in the second row of Table V. For the restof the trials, four input nodes are connected to the T-II-FNNin order to forecast the future traffic flow. For the second trial,the detection stations, , , , and , are connected tothe T-II-FNN and , , and , are not connected. Basedon this input node configuration, the T-II-FNN was developed(with the Matlab fuzzy logic toolbox), and the forecasting accu-racy was found to be 87.03%, which is shown in the last columnof the third row of Table V. The results indicate that even ifthe number of input patterns used on the T-II-FNN is the same,the forecasting accuracies obtained are different when differentinput pattern configurations are used.
After the eight trials have been conducted, the main effectsof these detection stations can be calculated, and the most ap-propriate input node configuration is determined based on thecalculated main effects. It has been determined that, when ,
, , and are connected and , and are discon-nected, the largest forecasting accuracy (87.10%) is obtained.
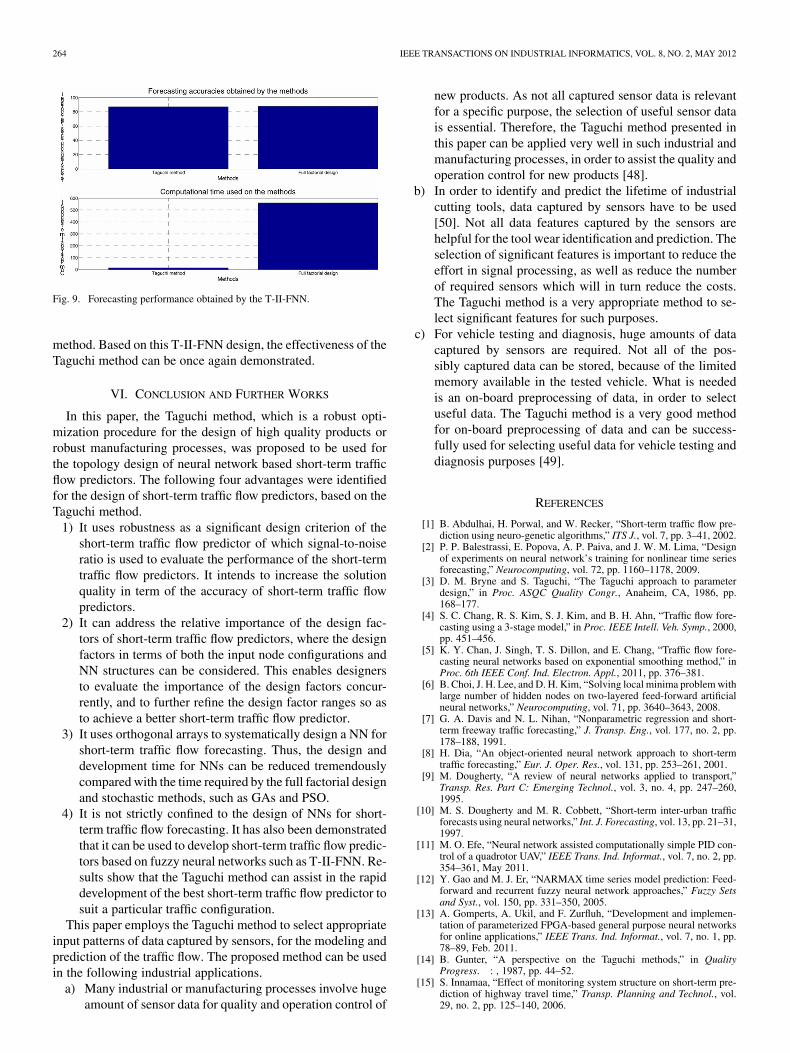
If the full factorial design is used, 128 trials are re-quired to be carried out, as there are seven design factors andeach of them has two options either “connected” or “discon-nected.” Based on the 128 trials, the largest forecasting accuracyis found as 87.68%, when , , and are connected and
, , , and are disconnected. Both the forecasting ac-curacies obtained by the Taguchi method and the full-factorialdesign method, as well as both the computational time used bythe two methods, are shown in Fig. 9. These two figures clearlydemonstrated that the forecasting accuracies obtained by thefull-factorial design method are only slightly better than the oneobtained by the Taguchi method. However, the computationaltime used by the full-factorial design method is 560.15 seconds,which is much longer than that required by the Taguchi method,which requires only 13.81 seconds. A significant amount ofcomputational effort and time can be saved by using the Taguchi
264 IEEE TRANSACTIONS ON INDUSTRIAL INFORMATICS, VOL. 8, NO. 2, MAY 2012
Fig. 9. Forecasting performance obtained by the T-II-FNN.
method. Based on this T-II-FNN design, the effectiveness of theTaguchi method can be once again demonstrated.
VI. CONCLUSION AND FURTHER WORKS
In this paper, the Taguchi method, which is a robust opti-mization procedure for the design of high quality products orrobust manufacturing processes, was proposed to be used forthe topology design of neural network based short-term trafficflow predictors. The following four advantages were identifiedfor the design of short-term traffic flow predictors, based on theTaguchi method.
1) It uses robustness as a significant design criterion of theshort-term traffic flow predictor of which signal-to-noiseratio is used to evaluate the performance of the short-termtraffic flow predictors. It intends to increase the solutionquality in term of the accuracy of short-term traffic flowpredictors.
2) It can address the relative importance of the design fac-tors of short-term traffic flow predictors, where the designfactors in terms of both the input node configurations andNN structures can be considered. This enables designersto evaluate the importance of the design factors concur-rently, and to further refine the design factor ranges so asto achieve a better short-term traffic flow predictor.
3) It uses orthogonal arrays to systematically design a NN forshort-term traffic flow forecasting. Thus, the design anddevelopment time for NNs can be reduced tremendouslycompared with the time required by the full factorial designand stochastic methods, such as GAs and PSO.
4) It is not strictly confined to the design of NNs for short-term traffic flow forecasting. It has also been demonstratedthat it can be used to develop short-term traffic flow predic-tors based on fuzzy neural networks such as T-II-FNN. Re-sults show that the Taguchi method can assist in the rapiddevelopment of the best short-term traffic flow predictor tosuit a particular traffic configuration.
This paper employs the Taguchi method to select appropriateinput patterns of data captured by sensors, for the modeling andprediction of the traffic flow. The proposed method can be usedin the following industrial applications.
a) Many industrial or manufacturing processes involve hugeamount of sensor data for quality and operation control of
new products. As not all captured sensor data is relevantfor a specific purpose, the selection of useful sensor datais essential. Therefore, the Taguchi method presented inthis paper can be applied very well in such industrial andmanufacturing processes, in order to assist the quality andoperation control for new products [48].
b) In order to identify and predict the lifetime of industrialcutting tools, data captured by sensors have to be used[50]. Not all data features captured by the sensors arehelpful for the tool wear identification and prediction. Theselection of significant features is important to reduce theeffort in signal processing, as well as reduce the numberof required sensors which will in turn reduce the costs.The Taguchi method is a very appropriate method to se-lect significant features for such purposes.
c) For vehicle testing and diagnosis, huge amounts of datacaptured by sensors are required. Not all of the pos-sibly captured data can be stored, because of the limitedmemory available in the tested vehicle. What is neededis an on-board preprocessing of data, in order to selectuseful data. The Taguchi method is a very good methodfor on-board preprocessing of data and can be success-fully used for selecting useful data for vehicle testing anddiagnosis purposes [49].
REFERENCES
[1] B. Abdulhai, H. Porwal, and W. Recker, “Short-term traffic flow pre-diction using neuro-genetic algorithms,” ITS J., vol. 7, pp. 3–41, 2002.
[2] P. P. Balestrassi, E. Popova, A. P. Paiva, and J. W. M. Lima, “Designof experiments on neural network’s training for nonlinear time seriesforecasting,” Neurocomputing, vol. 72, pp. 1160–1178, 2009.
[3] D. M. Bryne and S. Taguchi, “The Taguchi approach to parameterdesign,” in Proc. ASQC Quality Congr., Anaheim, CA, 1986, pp.168–177.
[4] S. C. Chang, R. S. Kim, S. J. Kim, and B. H. Ahn, “Traffic flow fore-casting using a 3-stage model,” in Proc. IEEE Intell. Veh. Symp., 2000,pp. 451–456.
[5] K. Y. Chan, J. Singh, T. S. Dillon, and E. Chang, “Traffic flow fore-casting neural networks based on exponential smoothing method,” inProc. 6th IEEE Conf. Ind. Electron. Appl., 2011, pp. 376–381.
[6] B. Choi, J. H. Lee, and D. H. Kim, “Solving local minima problem withlarge number of hidden nodes on two-layered feed-forward artificialneural networks,” Neurocomputing, vol. 71, pp. 3640–3643, 2008.
[7] G. A. Davis and N. L. Nihan, “Nonparametric regression and short-term freeway traffic forecasting,” J. Transp. Eng., vol. 177, no. 2, pp.178–188, 1991.
[8] H. Dia, “An object-oriented neural network approach to short-termtraffic forecasting,” Eur. J. Oper. Res., vol. 131, pp. 253–261, 2001.
[9] M. Dougherty, “A review of neural networks applied to transport,”Transp. Res. Part C: Emerging Technol., vol. 3, no. 4, pp. 247–260,1995.
[10] M. S. Dougherty and M. R. Cobbett, “Short-term inter-urban trafficforecasts using neural networks,” Int. J. Forecasting, vol. 13, pp. 21–31,1997.
[11] M. O. Efe, “Neural network assisted computationally simple PID con-trol of a quadrotor UAV,” IEEE Trans. Ind. Informat., vol. 7, no. 2, pp.354–361, May 2011.
[12] Y. Gao and M. J. Er, “NARMAX time series model prediction: Feed-forward and recurrent fuzzy neural network approaches,” Fuzzy Setsand Syst., vol. 150, pp. 331–350, 2005.
[13] A. Gomperts, A. Ukil, and F. Zurfluh, “Development and implemen-tation of parameterized FPGA-based general purpose neural networksfor online applications,” IEEE Trans. Ind. Informat., vol. 7, no. 1, pp.78–89, Feb. 2011.
[14] B. Gunter, “A perspective on the Taguchi methods,” in QualityProgress. : , 1987, pp. 44–52.
[15] S. Innamaa, “Effect of monitoring system structure on short-term pre-diction of highway travel time,” Transp. Planning and Technol., vol.29, no. 2, pp. 125–140, 2006.
CHAN et al.: SELECTION OF SIGNIFICANT ON-ROAD SENSOR DATA FOR SHORT-TERM TRAFFIC FLOW FORECASTING 265
[16] C. F. J. Kuo, C. P. Tien, and C. H. Chiu, “Analytical research on in-tellectual control of yarning characteristics for cotton collocation androtor spinning,” Int. J. Adv. Manuf. Technol., vol. 32, pp. 764–773,2007.
[17] C. F. J. Kuo and Y. S. Wu, “Application of a Taguchi-based neural net-work prediction design of the film coating process for polymer blends,”Int. J. Adv. Manuf. Technol., vol. 27, pp. 455–461, 2006.
[18] G. Lachtermacher and J. D. Fuller, “Backpropagation in time-seriesforecasting,” J. Forecasting, vol. 14, pp. 381–393, 1995.
[19] C. Ledoux, An Urban Traffic Flow Model Integrating Neural Network,Transportation Research Part C: Emerging Technologies vol. 5, 5, pp.287–300, 1997.
[20] S. S. Mahapatra and A. Patnaik, “Study on mechanical and erosionwear behavior of hybrid composites using Taguchi experimental de-sign,” Materials and Design, vol. 30, pp. 2791–2801, 2009.
[21] R. J. Mayer and P. C. Benjamin, “Using the Taguchi paradigm for man-ufacturing system design using simulation experiments,” Ind. Eng., vol.22, no. 2, pp. 195–209, 1992.
[22] A. H. Ning, H. C. W. Lau, Z. Yi, and T. T. Wong, “Fulfilment of re-tailer demand by using the mdl-optimal neural network prediction anddecision policy,” IEEE Trans. Ind. Informat., vol. 5, no. 4, pp. 495–506,Nov. 2009.
[23] I. Okutani and Y. J. Stephanedes, “Dynamic prediction of trafficvolume through Kalman filtering theory,” Transportation Research,Part B: Methodology, vol. 18, no. 1, pp. 1–11, 1984.
[24] M. S. Packianather, P. R. Drake, and H. Rowlands, “Optimizing the pa-rameters of multilayered feedforward neural networks through Taguchidesign of experiments,” Quality and Reliability Eng. Int., vol. 16, pp.461–473, 2000.
[25] M. S. Phadke, Quality Engineering Using Robust Design. EnglewoodCliffs, NJ: Prentice-Hall, 1989.
[26] C. Quek, M. Pasquier, and B. B. S. Lim, “POP-TRAFFIC: A novelfuzzy neural approach to road traffic analysis and prediction,” IEEETrans. Intell. Transp. Syst., vol. 7, no. 2, pp. 133–146, 2006.
[27] M. Sanjari, A. K. Taheri, and M. R. Movahedi, “An optimizationmethod for radial forging process using ANN and Taguchi method,”Int. J. Adv. Manuf. Technol., vol. 40, pp. 776–784, 2009.
[28] B. L. Smith and M. J. Demetsky, “Traffic flow forecasting: Comparisonof modeling approaches,” J. Transp. Eng., vol. 123, no. 4, pp. 261–266,1997.
[29] B. L. Smith, B. M. Williams, and R. K. Oswald, “Comparison of para-metric and nonparametric models for traffic flow forecasting,” Transp.Res.h Part C, vol. 19, pp. 303–321, 2002.
[30] D. Srinivasan, C. W. Chan, and P. G. Balaji, “Computational intelli-gence based congestion prediction for a dynamic urban street network,”Neurocomputing, vol. 72, pp. 2710–2716, 2009.
[31] A. Stathopoulos, L. Dimitriou, and T. Tskeris, “Fuzzy modelingapproach for combined forecasting of urban traffic flow,” Com-puter-Aided Civil and Infrastructure Engineering, vol. 23, pp.521–535, 2008.
[32] L. P. Sullivan, “The power of Taguchi methods to impact change inU.S. Companies,” Quality Progress, pp. 76–79, Summer 1987.
[33] G. Taguchi, Introduction to Quality Engineering. Tokyo, Japan:Asian Productivity Organization, 1989.
[34] G. Taguchi, Y. Yokohama, and Y. Wu, Design of Experi-ments. Tokyo, Japan: ASI Press, 1993.
[35] M. C. Tan, S. C. Wong, J. M. Xu, Z. R. Guan, and P. Zhang, “Anaggregation approach to short term traffic flow prediction,” IEEE Trans.Intell. Transp. Syst., vol. 10, no. 1, pp. 60–69, 2009.
[36] N. Wanas, G. Auda, M. Kamel, and F. Karray, “On the optimal numberof hidden nodes in a neural network,” in Proc. IEEE 11th CanadianConf. Electr. Comput. Eng., 1998, vol. 2, pp. 918–921.
[37] Y. Wang, M. Papageorgiou, and A. Messmer, “A real-time freewaynetwork traffic surveillance tool,” IEEE Trans. Control Syst. Technol.,vol. 14, no. 1, pp. 18–32, 2006.
[38] H. Yin, S. C. Wong, J. Xu, and C. K. Wong, “Urban traffic flow predic-tion using a fuzzy-neural approach,” Transp. Res. Part C, vol. 10, pp.85–98, 2002.
[39] G. P. Zhang, B. E. Patuwo, and H. Y. Michael, “A simulation studyof artificial neural networks for nonlinear time-series forecasting,”Comput. Oper. Res., vol. 28, pp. 381–396, 2001.
[40] G. Zhang, B. E. Patuwo, and M. Y. Hu, “Forecasting with artificialneural networks: The state of the art,” Int. J. Forecasting, vol. 14, pp.35–62, 1998.
[41] Z. Zhao, Y. Zhang, and H. Liao, “Design of ensemble neural networkusing the Akaike information criterion,” Eng. Appl. Artif. Intell., vol.21, pp. 1182–1188, 2008.
[42] W. Zheng, D. H. Lee, and Q. Shi, “Short-term freeway traffic flow pre-diction: Bayesian combined neural network approach,” J. Transp. Eng.,vol. 132, no. 2, pp. 114–121, 2006.
[43] F. H. F. Leung, H. K. Lam, S. H. Ling, and P. K. S. Tam, “Tuning of thestructure and parameters of neural network using an improved geneticalgorithm,” IEEE Trans. Neural Networks, vol. 14, no. 1, pp. 79–88,2003.
[44] K. S. Tang, K. F. Man, Z. F. Liu, and S. Kwong, “Minimal fuzzy mem-berships and rules using hierarchical genetic algorithms,” IEEE Trans.Ind. Electron., vol. 45, no. 1, pp. 162–169, 1998.
[45] J. Yu, S. Wang, and L. Xi, “Evolving artificial neural networks using animproved PSO and DPSO,” Neurocomputing, vol. 71, pp. 1054–1060,2008.
[46] B. M. Wilamowski, “Neural network architectures and learning algo-rithms,” IEEE Ind. Electron. Mag., vol. 3, no. 4, pp. 56–63, 2009.
[47] L. Zhao, “Short term traffic flow prediction based on interval type-2fuzzy network networks,” Commun. Comput. Inform. Sci., pp.230–237, 2010.
[48] D. Wang, J. Liu, and R. Srinivasan, “Data driven soft sensor approachfor quality prediction in a refining process,” IEEE Trans. Ind. Informat.,vol. 6, no. 1, pp. 11–17, Feb. 2010.
[49] H. Schweppe, A. Zimmermann, and D. Grill, “Flexible on-boardstream processing for autormotive sensor data,” IEEE Trans. Ind.Informat., vol. 6, no. 1, pp. 81–92, Feb. 2010.
[50] J. H. Zhou, C. K. Pang, F. L. Lewis, and Z. W. Zhong, “Intelligent diag-nosis and prognosis of tool wear using dominant feature identification,”IEEE Trans. Ind. Informat., vol. 5, no. 4, pp. 454–464, Nov. 2009.
[51] B. M. Wilamowski and H. Yu, “Improved computation for LevenbergMarquardt training,” IEEE Trans. Neural Networks, vol. 21, no. 6, pp.930–937, Jun. 2010.
[52] J. F. C. Khaw, B. S. Lim, and L. E. N. Lim, “Optimal design of neuralnetworks using the Taguchi method,” Neurocomputing, vol. 7, pp.225–245, 1995.
Kit Yan Chan (M’11) received the Ph.D. degreein computing from London South Bank University,London, U.K., in 2006.
Currently, he is a Senior Research Fellow at CurtinUniversity, Australia. His research interests includecomputational intelligence and its applications tonew product design, manufacturing process design,and traffic flow forecasting.
Saghar Khadem received the M.Sc. degrees withemphasis on network and distributed systems fromChalmers University of Technology, Göteborg,Sweden, in 2010. She is currently working to-wards the Ph.D. degree at Curtin University, Perth,Australia.
Her current research interests include artificialneural networks, traffic flow forecasting and control,and evolutionary computation.
Tharam S. Dillon (M’74–SM87–F’98–LF’10) isthe Research Professor at the Digital Ecosystems andBusiness Intelligence Institute, Curtin University,Australia. He has published more than 750 paperspublished in international conferences and journalsand is the author of five books and has another fiveedited books. His current research interests includeWeb semantics, ontologies, Internet computing,e-commerce, hybrid neurosymbolic systems, neuralnets, software engineering, database systems, anddata mining.
Dr. Dillon is a Fellow of ACS and IE (Aust). He is Head of the IFIP In-ternational Task Force WG2.12/24 on Semantic Web and Web Semantics, theChairman of the IFIP WG12.9 on computational intelligence, the IEEE/IESTechnical Committee on Industrial Informatics, and the IFIP Technical Com-mittee 12 on Artificial Intelligence.
266 IEEE TRANSACTIONS ON INDUSTRIAL INFORMATICS, VOL. 8, NO. 2, MAY 2012
Vasile Palade (M’02–SM’04) received the Ph.D. de-gree with the University of Galati, Galati, Romania,in 1999.
He is currently working as a Lecturer with the De-partment of Computer Science, University of Oxford,Oxford, U.K. He published more than 80 papers injournals and conference proceedings as well as sev-eral books. His research interests are in the area ofcomputational intelligence with application to bioin-formatics, fault diagnosis, web usage mining, amongothers.
Jaipal Singh (M’09) received the Ph.D. degreein computer science from La Trobe University,Melbourne, Australia, in 2007.
He has been doing research on network algorithmsfor more efficient routing, resource optimizationand improved quality-of-service. He is currently aResearch Fellow at Curtin University working onshort-term traffic forecasting, traffic visualizationand real-time congestion management. He is also de-veloping a new cyber-physical systems architecturesin intelligent transportation systems.
Elizabeth Chang (M’02–SM’07) received the Ph.D.degree in computer science from La Trobe Univer-sity, Bundoora, Australia, in 1996.
Since 2006, she is the Professor with the DigitalEcosystems and Business Intelligence Institute,Curtin University, Australia. She has coauthoredthree books and has published over 350 scientificpapers. Her research interest includes: ontology andmulti-agent systems, data mining for business intel-ligence, trust, security and risk in e-Business, XML,Web Services, P2P for collaborative environments,
web engineering, IT for business and commerce, IT for health informatics, andIT for education.