Traffic Flow Sensors: Technologies, Operating Principles, and ...
10
Table of Contents Preface vii 1 Data Sources 1 2 Traffic Flow Sensors 2 2.1 Traffic flow sensor selection 2 2.2 Traffic flow sensor categories 2 3 Inductive Loop Detectors 3 3.1 Operation of inductive loops 5 3.2 Speed measurement using inductive loops 5 3.3 Vehicle classification using inductive loops 7 4 Magnetometer Sensors 10 5 Magnetic Detectors 12 6 Video Detection Systems 14 6.1 VDS image processing 15 6.2 Infrared VDS 18 6.3 General guidelines for installing VDS cameras and other hardware, initializing software, and positioning detection zones 20 7 Microwave Radar Sensors 23 7.1 Presence-detecting microwave radar sensors 23 7.2 Doppler microwave sensors 24 7.3 Microwave radar operation 25 7.4 Types of transmitted waveforms 26 7.5 Range resolution 27 7.6 Range bins 28 7.7 General guidelines for installing presence-detecting microwave radars, initializing software, and positioning detection zones 29 8 Passive Infrared Sensors 31 8.1 Planck’s radiation law 33 8.2 Radiative transfer theory 34 8.3 Passive infrared sensor summary 35 iv
-
Upload
khangminh22 -
Category
Documents
-
view
0 -
download
0
Transcript of Traffic Flow Sensors: Technologies, Operating Principles, and ...

Table of Contents
Preface vii
1 Data Sources 1
2 Traffic Flow Sensors 2
2.1 Traffic flow sensor selection 22.2 Traffic flow sensor categories 2
3 Inductive Loop Detectors 3
3.1 Operation of inductive loops 53.2 Speed measurement using inductive loops 53.3 Vehicle classification using inductive loops 7
4 Magnetometer Sensors 10
5 Magnetic Detectors 12
6 Video Detection Systems 14
6.1 VDS image processing 156.2 Infrared VDS 186.3 General guidelines for installing VDS cameras and other hardware,
initializing software, and positioning detection zones 20
7 Microwave Radar Sensors 23
7.1 Presence-detecting microwave radar sensors 237.2 Doppler microwave sensors 247.3 Microwave radar operation 257.4 Types of transmitted waveforms 267.5 Range resolution 277.6 Range bins 287.7 General guidelines for installing presence-detecting microwave
radars, initializing software, and positioning detection zones 29
8 Passive Infrared Sensors 31
8.1 Planck’s radiation law 338.2 Radiative transfer theory 348.3 Passive infrared sensor summary 35
iv
9 LIDAR Sensors 36
10 Passive Acoustic Array Sensors 39
11 Ultrasonic Sensors 39
12 Sensor Technology Combinations 42
13 Sensor Output Data, Bandwidth, and Cost 42
13.1 Life-cycle cost considerations 4313.2 Relative cost of a sensor solution 45
14 Summary 46
Acknowledgments 46
References 47
Table of Contents v
1 Data Sources
Modern traffic and transportation management systems concern themselves withthe safety of travelers, efficiency in moving travelers from one point to another(often referred to as mobility), and the environmental impacts of the transportationmodes. Measures of effectiveness (MOEs) are utilized to quantify the success ofthe system in meeting these goals. The MOEs, in turn, require data for theirevaluation. Historically, data were obtained from traffic flow sensors, such asinductive loop detectors (ILDs) in the roadway, which were installed by the trafficmanagement agency. ILDs are able to provide vehicle counts, presence, passage,lane occupancy, and estimates of vehicle speed. As the variety of sensor technol-ogies increased and matured, additional types of sensors became available. Theseinclude video detection systems (VDSs), microwave radar sensors, Dopplermicrowave sensors, acoustic sensors, ultrasonic sensors, magnetometers and mag-netic sensors, passive infrared (PIR) sensors, LIDAR sensors, and sensors thatemploy combinations of these technologies. Many are capable of multilanecoverage.
However, sensors that monitor traffic flow at a given point are often ineffec-tive in supplying the data required by modern transportation managementsystems. For example, origin–destination (OD) pair data needed for planning pur-poses and vehicle density studies are not readily available from point sensors.Global positioning system (GPS) and other global navigation satellite systems’location devices, cell phone tracking through media access control addressreaders, probe vehicles, automatic license plate readers, toll-tag readers, andtrucking industry transponders are increasingly supplementing the informationprovided by conventional traffic flow sensors. GPS and inertial navigation systeminformation available on mobile devices provide travel route alternatives, traveltime information, and can track commercial, transit, rural, traffic managementagency, forestry, and emergency service provider vehicles to improve safety andoperational efficiency.
More recently, initiatives such as the Connected Vehicle Program in the U.S.,Cooperative Intelligent Transportation Systems (ITS) initiatives in Europe,and similar programs elsewhere are enabling vehicle-to-vehicle, vehicle-to-infrastructure, vehicle-to-pedestrian, and pedestrian-to-infrastructure communica-tions that promise to further increase safety and mobility and reduce theenvironmental impacts of the automobile and other types of vehicles. Theseprograms can utilize in-car sensors to monitor the status of vehicle systems andprovide a variety of data, including braking severity, hazard warning light activa-tion, time headways to vehicles surrounding the ego vehicle, and ego vehiclevelocity, acceleration, steering wheel position, traction loss, lane departure warn-ing, and windscreen wiper activation. However, this Spotlight Series monographconcerns itself only with traffic flow sensors that are installed in or above theroadway.
Klein: Traffic Flow Sensors: Technologies, Operating Principles, and Archetypes 1

Quadrupole loop configurations, which divide the cross-lane loop dimensionin half, are utilized to enhance motorcycle and bicycle detection (by increasingthe electromagnetic field strength in the center of the lane) and to eliminateadjacent lane detection in high-sensitivity inductive loop systems. The increasedfield strength of the quadrupole loop is due to the doubling of the number ofwindings at the lane center. Diamond-shaped loops also enhance motorcycledetection by extending the field to the lane edges where motorcycles sometimesdrive to avoid oil spots that are more prevalent at the lane center. The TrafficDetector Handbook12 discusses other loop configurations, such as those thatextend the detection area to full lane widths or increase the sensitivity for motor-cycle and bicycle detection.
The popularity of the ILD is due, in part, to its mature technology and lowunit cost. Reliability of the wire loop has been improved through better packagingand installation techniques. These include delivery of loops already encased bythe manufacturer in protective materials, more thorough cleaning of debris fromthe sawcut, and the use of improved sealant in the installation process. The loopdetector system, however, may still suffer from poor reliability. Contributing fac-tors are poor splice connections in the pull box between the loop wire and thelead-in cable, failure to twist wire pairs properly leading to cross talk, and faultysawcut cleaning and sealant application procedures. These problems are accentu-ated when loops are installed in poor pavement or in areas where utilitiesfrequently dig up the roadbed.12
The major steps for installing an ILD system are as follows:
1. Preparing plans and specifications.2. Securing the work zone.
ControllerCabinet
CVPull boxes forsplicing loop wireto lead-in cable
¼-inch wide sawcut filled with sealant
(a) Inductive loops installed for signal control.
(b) Inductive loops in speed-trap configuration on a California freeway. The 6 × 6 ft2 loops appear in a lighter color than the roadway.
CV
CV
Stop-line and queue detectors
Speed-trap ILDconfiguration
(Source: LAK)
Advancedetectors
Figure 1 Inductive loop configurations at a signalized intersection and a limited-access high-way (typical).
Klein: Traffic Flow Sensors: Technologies, Operating Principles, and Archetypes4

The 13 classes are based on whether the vehicle carries passengers or commod-ities. Non-passenger vehicles are further sub-divided by the number of axles andthe number of units, including both power and trailer units. The addition of atrailer to vehicle classes 1 to 5 does not change the classification of the vehicle.
(a) Tolerable vehicle length error for estimating speed within 5% over a 30-s measurement interval.
(b) Tolerable vehicle length error for estimating speed within 10% over a 30-s measurement interval.
10
20
30
40
5060
5 10 15 20 25 30 35 40 45 50Occupancy (%)
Veh
icle
Len
gth
Err
or (
%)
30-s measurement interval
1500 veh/h/ln
0
5
1015
20
25
30
5 10 15 20 25 30 35 40 45 50Occupancy (%)
Veh
icle
leng
th e
rror
(%
)
30-s measurement interval
500 veh/hr/ln
2000 veh/hr/ln0
1500 veh/h/ln
1000 veh/hr/ln500 veh/hr/ln
1000 veh/hr/ln
2000 veh/hr/ln
Figure 2. Allowable error in vehicle length estimate as a function of lane occupancy, flowrate, and desired speed measurement accuracies of 5% and 10%.
Sampling frequency 100 Hz to 5000 HzSignal bandwidth 15 kHz–150 kHz (loop signals)Loop operating modes Presence or pulse, providing count, speed, and
classClassification categories FHWA 13 vehicle classesController data output rate 300–921.6 kbps (Serial & Bluetooth®), 100 Mbps
(Ethernet),12 Mbps (SPI/USB), 100–2500 Hz (digital control lines)
Controller compatibility 170/2070 or NEMA TS-1/TS-2Frequency selections 16 (software controllable)Sensitivity selections 8 for conventional loop detectors and an optional
16 settings for the intelligent card standardFrequency and sensitivity Front panel by user or one of five communication
selection method methods: USB, Bluetooth®, SPI, UART, or Ethernet
Communication speeds USB 2.0, Ethernet 10/100, Bluetooth® to 921.6 kbps, SPI to 12 Mbit, UART to 921.6 Kbps
Concurrent communications YesOnboard flash data storage 2 Gbit (128 Mb) to 16 Gbit (2 Gb)Firmware upgradable Via USB, Bluetooth®, or EthernetPerformance Monitoring
System compatible YesCustomization Yes. On-board real-time data processing for
vehicle signature and parameter calculations via dual-core ARM Cortex 32-bit safety-core processor operating at 220 MHz.
(Photograph courtesy of CLR Analytics and Diamond Traffic Products)
I-Loop Duo Card
Figure 3 I-loop duo card for classifying and reidentifying vehicles.
Klein: Traffic Flow Sensors: Technologies, Operating Principles, and Archetypes8
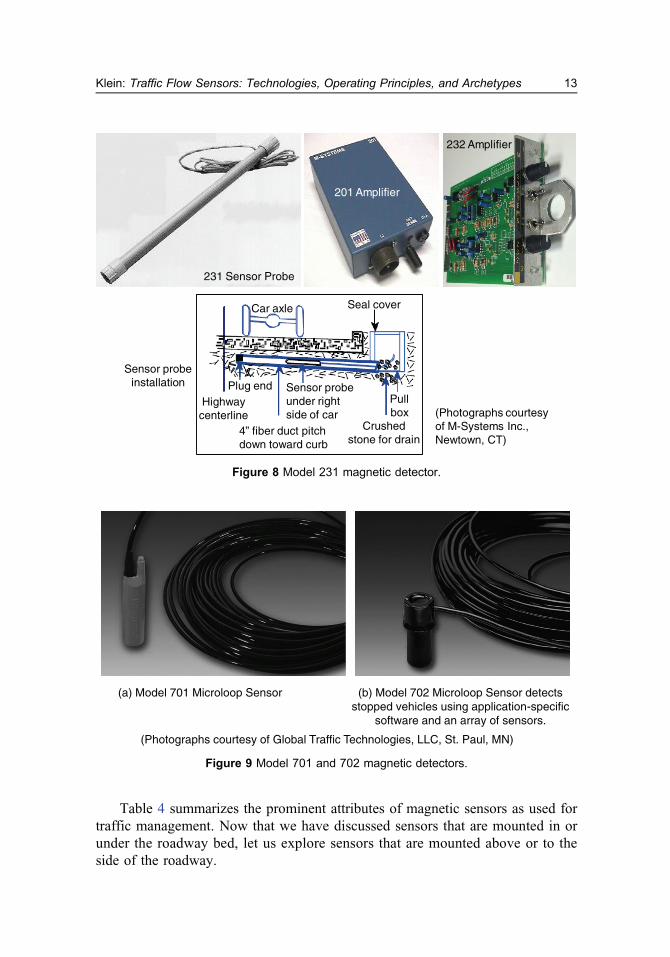
Table 4 summarizes the prominent attributes of magnetic sensors as used fortraffic management. Now that we have discussed sensors that are mounted in orunder the roadway bed, let us explore sensors that are mounted above or to theside of the roadway.
201 Amplifier
231 Sensor Probe
232 Amplifier
Sensor probe installation
Car axle
Crushed stone for drain
Pull box
Highway centerline
4” fiber duct pitch down toward curb
Seal cover
Plug end
(Photographs courtesy of M-Systems Inc., Newtown, CT)
Sensor probe under right side of car
Figure 8 Model 231 magnetic detector.
(Photographs courtesy of Global Traffic Technologies, LLC, St. Paul, MN)
(a) Model 701 Microloop Sensor (b) Model 702 Microloop Sensor detects stopped vehicles using application-specific
software and an array of sensors.
Figure 9 Model 701 and 702 magnetic detectors.
Klein: Traffic Flow Sensors: Technologies, Operating Principles, and Archetypes 13
and close a pair of isolated contacts in the controller cabinet in response to avehicle, bicycle, or pedestrian detection. The contact closure thus provides infor-mation concerning the number of vehicles passing the sensor per hour or the pres-ence of a vehicle, bicycle, or pedestrian in the detection area of the sensor.
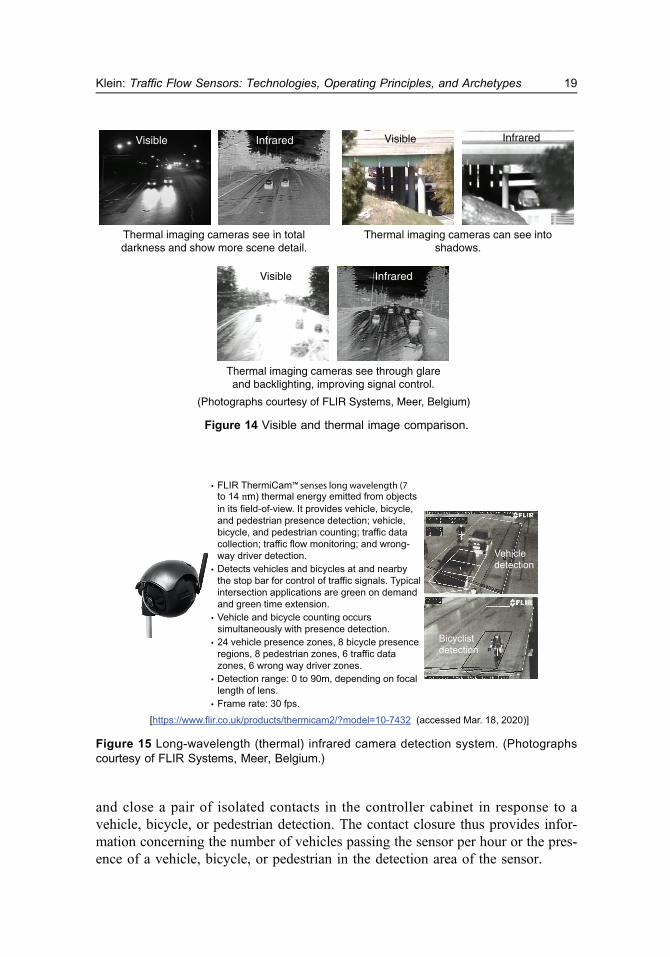
(Photographs courtesy of FLIR Systems, Meer, Belgium)
Thermal imaging cameras see in total darkness and show more scene detail.
Thermal imaging cameras can see into shadows.
Thermal imaging cameras see through glare and backlighting, improving signal control.
Visible Infrared Visible Infrared
Visible Infrared
Figure 14 Visible and thermal image comparison.
[https://www.flir.co.uk/products/thermicam2/?model=10-7432 (accessed Mar. 18, 2020)]
Vehicle detection
Bicyclist detection
• FLIR ThermiCam™ senses long wavelength (7 to 14 mm) thermal energy emitted from objects in its field-of-view. It provides vehicle, bicycle, and pedestrian presence detection; vehicle, bicycle, and pedestrian counting; traffic data collection; traffic flow monitoring; and wrong-way driver detection.
• Detects vehicles and bicycles at and nearby the stop bar for control of traffic signals. Typical intersection applications are green on demand and green time extension.
• Vehicle and bicycle counting occurs simultaneously with presence detection.
• 24 vehicle presence zones, 8 bicycle presence regions, 8 pedestrian zones, 6 traffic data zones, 6 wrong way driver zones.
• Detection range: 0 to 90m, depending on focal length of lens.
• Frame rate: 30 fps.
Figure 15 Long-wavelength (thermal) infrared camera detection system. (Photographscourtesy of FLIR Systems, Meer, Belgium.)
Klein: Traffic Flow Sensors: Technologies, Operating Principles, and Archetypes 19
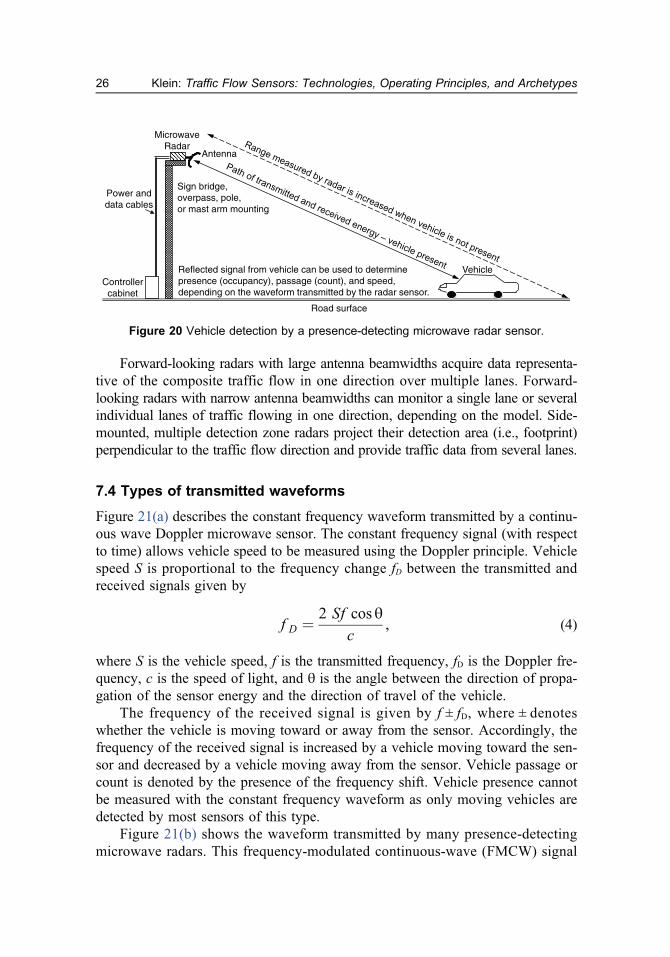
Forward-looking radars with large antenna beamwidths acquire data representa-tive of the composite traffic flow in one direction over multiple lanes. Forward-looking radars with narrow antenna beamwidths can monitor a single lane or severalindividual lanes of traffic flowing in one direction, depending on the model. Side-mounted, multiple detection zone radars project their detection area (i.e., footprint)perpendicular to the traffic flow direction and provide traffic data from several lanes.
7.4 Types of transmitted waveforms
Figure 21(a) describes the constant frequency waveform transmitted by a continu-ous wave Doppler microwave sensor. The constant frequency signal (with respectto time) allows vehicle speed to be measured using the Doppler principle. Vehiclespeed S is proportional to the frequency change fD between the transmitted andreceived signals given by
f D ¼ 2 Sf cos θc
, (4)
where S is the vehicle speed, f is the transmitted frequency, fD is the Doppler fre-quency, c is the speed of light, and θ is the angle between the direction of propa-gation of the sensor energy and the direction of travel of the vehicle.
The frequency of the received signal is given by f ± fD, where ± denoteswhether the vehicle is moving toward or away from the sensor. Accordingly, thefrequency of the received signal is increased by a vehicle moving toward the sen-sor and decreased by a vehicle moving away from the sensor. Vehicle passage orcount is denoted by the presence of the frequency shift. Vehicle presence cannotbe measured with the constant frequency waveform as only moving vehicles aredetected by most sensors of this type.
Figure 21(b) shows the waveform transmitted by many presence-detectingmicrowave radars. This frequency-modulated continuous-wave (FMCW) signal
MicrowaveRadar
Antenna
Sign bridge,overpass, pole,or mast arm mounting
Reflected signal from vehicle can be used to determine presence (occupancy), passage (count), and speed, depending on the waveform transmitted by the radar sensor.
Controllercabinet
Power anddata cables
Road surface
Vehicle
Figure 20 Vehicle detection by a presence-detecting microwave radar sensor.
Klein: Traffic Flow Sensors: Technologies, Operating Principles, and Archetypes26

reflection of energy from surfaces whose emissivity is not unity) as they viewobjects through the atmosphere. Application of radiative transfer theory allowsthe determination of the brightness temperature change caused by a vehicle pass-ing through a sensor’s field-of-view.
8.2 Radiative transfer theory
When a vehicle enters a PIR sensor’s field-of-view, the detected energy is modi-fied due to the presence of the vehicle.34 Radiative transfer theory describes thecontributions of cosmic, galactic, atmospheric, and ground-based emission sourc-es to the passive signature of the detected objects. As shown in Fig. 25, the cos-mic, galactic, and atmospheric emission sources can be combined into a termdenoted as Tsky, while the ground-based radiation sources derive from emissionfrom the road and vehicle surfaces and the reflection of the cosmic, galactic,and atmospheric sources into the sensor’s aperture.
In Fig. 25, εV and εR denote the emissivities of the vehicle and road surface inthe wavelength region of interest, while TV and TR represent their surface temper-atures in degrees Kelvin, respectively. Emission from the vehicle contributes abrightness temperature TBV given by
TBVðθ,ϕÞ ¼ εVTV þ ð1 − εV ÞT sky, (12)
where θ and ϕ are the nadir and azimuth angles, respectfully, and Tsky is a functionof the cosmic, galactic, and atmospheric emission.
Emission from the road surface contributes a brightness temperature TBR asfollows:
Road surface with emissivity R
and surface temperature TR (K)
T (Emissive term)
(1 – )Tsky (Reflectance term)
q
Vehicle with emissivity V andsurface temperature TV (K)
Tsky
Passive sensor (overhead mount)
Receiving aperture
Figure 25 Radiative transfer theory is used to calculate the change in apparent temperaturesensed by a PIR sensor when a vehicle enters its field-of-view.
Klein: Traffic Flow Sensors: Technologies, Operating Principles, and Archetypes34

transmitted at 30 frames/s. The transmission rate is also affected by the numbersof sensors, roadside information devices such as changeable message signs andhighway advisory radio, and frequency of signal timing plan updates needed toimplement traffic management strategies.
The range of purchase costs for a particular sensor technology reflects costdifferences among specific sensor models and capabilities. If multiple lanes areto be monitored on a lane-by-lane basis and a sensor is capable of only singledetection zone operation, then the sensor cost must be multiplied by the numberof monitored lanes. Installation and life-cycle maintenance costs also contributeto the true cost of any sensor selection.
13.1 Life-cycle cost considerations
Direct hardware and software purchase costs are only one portion of the expenseassociated with choosing a sensor. Installation, maintenance, and repair shouldalso be factored into the sensor selection decision. Installation costs include fullyburdened costs for technicians to prepare and perhaps upgrade the road surface orsub-surface (for inductive loops or other surface or sub-surface sensors), installthe sensor and mounting structure (if one is required), provide power if none isavailable at the site, close traffic lanes, divert traffic, implement safety measures
(Photographs courtesy of ADEC Technologies, Eschenbach, CH)
TDC3 series infrared, Doppler, ultrasound sensor provides vehicle counts, individual vehicle speed (Doppler), vehicle class (ultrasound and PIR), presence, queue and wrong-way driver detection, occupancy, headway, and time gap. K-band Doppler: 24.05–24.25 GHz Ultrasonic frequency: 40 kHz Ultrasonic pulse rate: 10–30 pulses/s PIR spectral response: 6.5–14 µm Mounting: Gantries or other overhead structures above the lane center.
TDC4 series infrared, Doppler, ultrasound, video sensor provides vehicle counts, individual vehicle speed, vehicle class, presence, queue and wrong-way driver detection, occupancy, headway, time gap, and visual verification of traffic flow anomalies. VGA color video: 640 x 480 max. (Provides snapshot pictures transmitted over 9K6 bps RS 485 for visual verification of wrong-way drivers and queues, and for outstation command.) K-band Doppler: 24.05–24.25 GHz Ultrasonic frequency: 40 kHz Ultrasonic pulse rate: 10–30 pulses/s PIR spectral response: 6.5–14 µm Mounting: Same as for TDC3.
TDC2-PIRUS infrared, ultrasound sensor provides true-presence vehicle detection at stop bar and pedestrian detection in waiting zones for objects 0.5–10 m (1.7–33 ft) away. Applications include vehicle count, traffic signal control, green signal request, vehicle direction detection, vehicle discrimination by height, i.e., cars from trucks and buses. Ultrasonic frequency: 40 kHz Ultrasonic pulse rate: 13–30 pulses/s PIR spectral response: 8–14 µm Mounting: gantries, overpasses or bridges or otherwise on a pole at the roadside.
Figure 32 Multiple technology sensors.
Klein: Traffic Flow Sensors: Technologies, Operating Principles, and Archetypes 43