Temporal Evolution of Short-Term Urban Traffic Flow: A Nonlinear Dynamics Approach
13
Computer-Aided Civil and Infrastructure Engineering 23 (2008) 536–548 Temporal Evolution of Short-Term Urban Traffic Flow: A Nonlinear Dynamics Approach Eleni I. Vlahogianni, Matthew G. Karlaftis ∗ & John C. Golias Department of Transportation Planning and Engineering, School of Civil Engineering, National Technical University of Athens, 5, Iroon Polytechniou Street, Athens, 15773, Greece Abstract: Recognizing temporal patterns in traffic flow has been an important consideration in short- term traffic forecasting research. However, little work has been conducted on identifying and associating traffic pattern occurrence with prevailing traffic con- ditions. We propose a multilayer strategy that first identifies patterns of traffic based on their structure and evolution in time and then clusters the pattern- based evolution of traffic flow with respect to pre- vailing traffic flow conditions. Temporal pattern iden- tification is based on the statistical treatment of the recurrent behavior of jointly considered volume and oc- cupancy series; clustering is done via a two-level neural network approach. Results on urban signalized arterial 90-second traffic volume and occupancy data indicate that traffic pattern propagation exhibits variability with respect to its statistical characteristics such as determinis- tic structure and nonlinear evolution. Further, traffic pat- tern clustering uncovers four distinct classes of traffic pat- tern evolution, whereas transitional traffic conditions can be straightforwardly identified. 1 INTRODUCTION Current approaches for modeling and forecasting (short-term) traffic are based on the straightforward ar- gument that traffic variables (e.g., volume, occupancy, and speed) exhibit dependence on previous measure- ments; as such, previous information—that is, measure- ments from previous time intervals—can be used to model and generate a variable’s subsequent value(s). ∗ To whom correspondence should be addressed. E-mail: mgk@ central.ntua.gr. This approach prevails in most traffic prediction re- search (Davis et al., 1991; Clark et al., 1993; Kwon and Stephanedes, 1994; Hamed et al., 1995; Smith and Demetsky, 1997; Williams et al., 1998; Park et al., 1999; Zhang, 2000; Williams, 2001; Abdulhai et al., 2002; Stathopoulos and Karlaftis, 2003; Ishak and Alecsan- dru, 2004; Jiang and Adeli, 2005; Xie and Zhang, 2006). Traffic flow’s temporal dependence is crucial to the effectiveness of a prediction system regarding its adapt- ability to shifting traffic conditions (Smith and Oswald, 2003). A system that has “captured” traffic’s evolution, in essence “knows” the traffic patterns, is more likely to predict accurately, and adjust to variable traffic condi- tions (the term traffic pattern describes the manner in which sequential measurements propagate in time and space—Kerner, 2004a). This improvement in predic- tion stems from the realization that temporal patterns in traffic data are related to traffic flow’s multiregime and transitional behavior. This behavior has been re- ported in previous studies for both freeways and signal- ized arterials (Chowdhury et al., 2000; Helbing, 2001; Nagatani, 2002; Kerner, 2004b), and has been associ- ated with queue formation and dissipation (Vlahogianni et al., 2007). A number of earlier studies have used data-driven approaches to uncover patterns before predicting traf- fic variables (Danech-Pajouh and Aron, 1991; Van Der Voort et al., 1996; Chen et al., 2001; Yin et al., 2002; Ishak and Alecsandru, 2004). These approaches com- bine a layer of pattern clustering and input dimension- ality reduction with a subsequent statistical or neural network technique to generate predictions. Recently, the temporal patterns of traffic volume were studied using wavelets (Jiang and Adeli, 2004); the idea was to decompose a time series of volume into a set of C 2008 Computer-Aided Civil and Infrastructure Engineering. Published by Blackwell Publishing, 350 Main Street, Malden, MA 02148, USA, and 9600 Garsington Road, Oxford OX4 2DQ, UK.
Transcript of Temporal Evolution of Short-Term Urban Traffic Flow: A Nonlinear Dynamics Approach

Computer-Aided Civil and Infrastructure Engineering 23 (2008) 536–548
Temporal Evolution of Short-Term Urban Traffic Flow:A Nonlinear Dynamics Approach
Eleni I. Vlahogianni, Matthew G. Karlaftis∗ & John C. Golias
Department of Transportation Planning and Engineering, School of Civil Engineering,National Technical University of Athens, 5, Iroon Polytechniou Street, Athens, 15773, Greece
Abstract: Recognizing temporal patterns in trafficflow has been an important consideration in short-term traffic forecasting research. However, little workhas been conducted on identifying and associatingtraffic pattern occurrence with prevailing traffic con-ditions. We propose a multilayer strategy that firstidentifies patterns of traffic based on their structureand evolution in time and then clusters the pattern-based evolution of traffic flow with respect to pre-vailing traffic flow conditions. Temporal pattern iden-tification is based on the statistical treatment of therecurrent behavior of jointly considered volume and oc-cupancy series; clustering is done via a two-level neuralnetwork approach. Results on urban signalized arterial90-second traffic volume and occupancy data indicatethat traffic pattern propagation exhibits variability withrespect to its statistical characteristics such as determinis-tic structure and nonlinear evolution. Further, traffic pat-tern clustering uncovers four distinct classes of traffic pat-tern evolution, whereas transitional traffic conditions canbe straightforwardly identified.
1 INTRODUCTION
Current approaches for modeling and forecasting(short-term) traffic are based on the straightforward ar-gument that traffic variables (e.g., volume, occupancy,and speed) exhibit dependence on previous measure-ments; as such, previous information—that is, measure-ments from previous time intervals—can be used tomodel and generate a variable’s subsequent value(s).
∗To whom correspondence should be addressed. E-mail: [email protected].
This approach prevails in most traffic prediction re-search (Davis et al., 1991; Clark et al., 1993; Kwonand Stephanedes, 1994; Hamed et al., 1995; Smith andDemetsky, 1997; Williams et al., 1998; Park et al., 1999;Zhang, 2000; Williams, 2001; Abdulhai et al., 2002;Stathopoulos and Karlaftis, 2003; Ishak and Alecsan-dru, 2004; Jiang and Adeli, 2005; Xie and Zhang, 2006).
Traffic flow’s temporal dependence is crucial to theeffectiveness of a prediction system regarding its adapt-ability to shifting traffic conditions (Smith and Oswald,2003). A system that has “captured” traffic’s evolution,in essence “knows” the traffic patterns, is more likely topredict accurately, and adjust to variable traffic condi-tions (the term traffic pattern describes the manner inwhich sequential measurements propagate in time andspace—Kerner, 2004a). This improvement in predic-tion stems from the realization that temporal patternsin traffic data are related to traffic flow’s multiregimeand transitional behavior. This behavior has been re-ported in previous studies for both freeways and signal-ized arterials (Chowdhury et al., 2000; Helbing, 2001;Nagatani, 2002; Kerner, 2004b), and has been associ-ated with queue formation and dissipation (Vlahogianniet al., 2007).
A number of earlier studies have used data-drivenapproaches to uncover patterns before predicting traf-fic variables (Danech-Pajouh and Aron, 1991; Van DerVoort et al., 1996; Chen et al., 2001; Yin et al., 2002;Ishak and Alecsandru, 2004). These approaches com-bine a layer of pattern clustering and input dimension-ality reduction with a subsequent statistical or neuralnetwork technique to generate predictions. Recently,the temporal patterns of traffic volume were studiedusing wavelets (Jiang and Adeli, 2004); the idea wasto decompose a time series of volume into a set of
C© 2008 Computer-Aided Civil and Infrastructure Engineering. Published by Blackwell Publishing, 350 Main Street, Malden, MA 02148, USA,and 9600 Garsington Road, Oxford OX4 2DQ, UK.

Temporal evolution of short-term urban traffic flow 537
Fig. 1. Flow diagram of the proposed multilayer traffic pattern recognition system.
subseries and obtain a simpler temporal structure. Theliterature suggests that traffic propagates in patterns andthat, when basing the analysis on patterns, predictionsare improved compared to those from other predictionalgorithms (Ishak and Alecsandru, 2004). However, theeffectiveness of these approaches has only consideredmean predictive accuracy while disregarding the man-ner in which traffic’s temporal patterns are related toprevailing traffic conditions as well as to the conditionsunder which shifts in patterns occur.
A question that naturally arises is how to distinguishthe statistical behavior of traffic patterns with respectto perceptible/measurable traffic information; further, itis important to identify the boundary conditions asso-ciated with the transitions in traffic pattern-based evo-lution. A system that can identify and relate statisticalbehavior to traffic conditions should be both accurate,as it is asked to generate predictions based on a clear
statistical behavior, as well as adaptable, as it can adjustthe predictions to the changes in traffic conditions andparticularly to extreme event occurrence (incidents) orthe onset of congestion. In this article, we provide a sta-tistical framework for clustering traffic flow conditions(joint consideration of volume and occupancy) withrespect to the statistical behavior of traffic flow’spattern-based evolution. The basic approach employedis illustrated in Figure 1; based on raw volume and occu-pancy data, the statistical characteristics of traffic’s evo-lution are identified and then associated to prevailingtraffic flow conditions.
2 IDENTIFYING TRAFFIC PATTERNS
Identifying traffic’s temporal patterns involves recon-structing traffic flow’s evolution in the phase–space

538 Vlahogianni, Karlaftis & Golias
through the series of volume and occupancy; phase–space is a vector space such that a point in the spaceof the system specifies the state of the system and viceversa (Kantz and Schreiber, 1997). In this way, the evo-lution of a system is studied through the temporal evo-lution of the points in the specific vector space. Considera traffic volume V{t} and occupancy O{t} series that areunfolded (or embedded) in a multivariate phase–spacethat is representative of the original traffic system. Thevectors created have the following form:
V {t} = {V(t), V(t − τ ), . . . , V(t − (m − 1)τ )
}
O {t} = {O(t), O(t − τ ), . . . , O(t − (m − 1)τ )
} (1)
Each of the above vectors is characterized by two pa-rameters: the embedding delay (τ ) and the embeddingdimension (m) (Kantz and Schreiber, 1997). In traffic,embedding procedures involve recreating the mannerin which traffic flow propagates (the pattern of traf-fic) by representing traffic variables such as volume, oc-cupancy, and speed in the vector-space (one can fol-low the evolution of traffic by studying the trajectoriesof the unfolded traffic parameters in the vector-space).These parameters define the look-back time window[(m − 1)τ ] that contains useful information for predic-tion purposes.
A common approach for determining the embeddingdelay τ is the first local minimum of the mutual infor-mation function as proposed by Fraser and Swinney(1986). Literature indicates that mutual information ismore robust than the autocorrelation function in re-vealing both linear and nonlinear relationships in data(Abarbanel, 1996). The selection of the minimum em-bedding dimension m of the reconstructed phase–spaceis based on the false nearest neighbor algorithm that ex-amines the behavior of near neighbors under changesin the embedding dimension from m to m + 1 (Kennelet al., 1992); both techniques are applied in traffic vol-ume series and discussed in detail in Vlahogianni et al.(2006).
2.1 Analysis of traffic’s short-term temporal evolution
Traffic flow studied through the time series of its vari-ables (volume, occupancy, and so on) encompasses dy-namic characteristics. Traffic’s temporal evolution canbe described by its structure (deterministic or stochas-tic) in a time window of study and by the evolutionof its structure in time (Kantz and Schreiber, 1997).The structure describes the (geometric) relation of asequence of traffic states (pattern) in the study win-dow. The structure is characterized by its evolution intime and thus can be persistent in time, cyclic, andso on.
Sequential traffic states can be close, suggesting thattraffic has a recurrent behavior, or can be spatially (ge-ometrically) far. The geometric closeness depends on apredefined threshold of distances ε i under which statesare said to be recurrent (Eckmann et al., 1987); recur-rence Rm,εi
i, j of a state �xi ∈ Rd in the phase–space is given
as (Marwan et al., 2007):
Rm,εi, j = (
ε − ∥∥�xi − �xj∥∥)
, �xi ∈ Rm i, j = 1, . . . , N (2)
where N is the number of states xi in the time windowof study, m is the embedding dimension, ε is a thresholdof distances, and ‖·‖ a norm (in our case the Euclideannorm). Equation (2) provides a matrix of recurrencesknown as the recurrence plot (RP) and is the basisfor recurrent quantitative analysis (RQA) proposed byZbilut and Webber (1992).
RPs can be extended to a bivariate formulationknown as the cross-recurrence plots (CRPs). In the caseof traffic flow, when both volume and occupancy arejointly investigated, Equation (2) becomes:
CRm,εi, j = (ε − ‖ �Vi − �Oj‖), �Vi ∈ R
m, �Oi ∈ Rm,
i, j = 1, . . . , N (3)
Equation (3) describes the coupling of volume and oc-cupancy in time; coupling—the cross-correlation of vol-ume and occupancy—has been a focal point of theshort-term traffic flow forecasting literature (Persaudand Hall, 1989; Stathopoulos and Karlaftis, 2003;Kamarianakis and Prastakos, 2003; Vlahogianni et al.,2005). The proposed approach for identifying the char-acteristics of traffic flow pattern evolution provides aframework for treating nonstationary and nonlinearprocesses, well established in several fields of researchsuch as biology, physics, and economics (Zbilut, 2006).Cross-recurrence quantitative analysis (CRQA) is con-sidered as more robust for studying couplings thanconventional statistical approaches such as linear cross-correlations (Shockley et al., 2002; Zbilut, 2004), be-cause it is independent of constraining statistical as-sumptions and limitations, filtering, linear detrending,and data transformations (Zbilut, 2004).
CRQA is based on the density of recurrent pointsof the joint consideration of volume and occupancy inthe time window of study (Zbilut et al., 1998). Fromrecurrent states, some occur in a predetermined man-ner (deterministically), or stochastically (isolated re-curring states) (Gao and Cai, 2000); the deterministicstates form parallel structures in the cross-recurrenceplot. Moreover, the length of these structures de-termines the degree of nonlinearity in the system.Following the mathematical formulations of Marwanet al. (2007), consider a sliding time window WT of N

Temporal evolution of short-term urban traffic flow 539
measurements of traffic variables—for example, volumeand occupancy—updated every T, and let R be the per-centage of recurrent states:
R = 1N2
N∑
i, j=1
CRm,εii, j (4)
where N is the number of states in the window of studyand Ri,j is estimated from Equation (3). In time windowWT , the deterministic structure of traffic flow is quanti-fied by the %DET statistic, which is the percentage ofpoints that form diagonal lines parallel to the main di-agonal in the recurrence plot:
DET =∑N
l=lminlP(l)
∑Ni, j=1 CRm,εi
i, j
(5)
where l is the length of the line parallel to the main di-agonal, with lmin the minimum threshold under which aline is considered as a deterministic structure (usuallyequal to 2 as explained in Webber and Zbilut, 2005)and P(l) is the frequency distribution of the lengths lof the diagonal structures in the CRP: P(l) = {li; i =1, 2, . . . N}.
Traffic’s temporal evolution is related to the persis-tence of traffic flow’s structure in the selected time win-dow; if the structure persists in the study window, acyclic behavior can be assumed whereas, in the oppositecase, the structure is nonlinear (Kantz and Schreiber,1997); in such nonlinear systems the deterministic be-havior collapses exponentially (Gao and Cai, 2000). Thetemporal evolution of the deterministic structure of traf-fic flow is quantified by the variable Lmax that equalsthe maximum duration of the parallel movement in thewindow of study WT and can be shown mathematicallyto be inversely proportional to the largest positive Lya-punov exponent, suggesting that low values for Lmax arean indication of chaos (Trulla et al., 1996). Here, Lmax iscalculated as (Marwan and Kurths, 2002):
Lmax = max ({li , i = 1, 2, . . . , N}) (6)
Both the structure and its evolution can be used tospecify what is called “patterns in traffic”; they can alsobe used to identify the statistical behavior of the changesin temporal traffic patterns by following their temporalevolution.
Several points should be made regarding the statis-tical characterization of traffic patterns. First, the con-cepts of determinism and nonlinearity are attributes ofthe pattern-based evolution of traffic flow; this clearlysuggests that traffic flow, when studied in the form ofa series of volume and occupancy, probably exhibitsdifferent behavior than when studied through its pat-
terns. Second, the notions of determinism and stochas-ticity are based on the temporal evolution of traffic andthe geometrical (in the phase–space) relation of trafficstates; this suggests that when states are recurrent and“close,” overall patterns can be characterized as deter-ministic, whereas when states are found to be recurrentbut isolated, the overall pattern can be characterized asstochastic.
The implementation of the CRQA involves a proce-dure based on two stages (Figure 1): (a) the selection ofthe sliding time window of study, and (b) the quantifica-tion of recurrences CRQA. One approach to determinethe time window of study is to iteratively search for theoptimum sliding time window that, for a fixed thresholdε, includes adequate degrees of freedom for statisticallyanalyzing recurrences and calculating recurrence statis-tics (Zbilut, 2006). For highly nonstationary data, theliterature indicates that the values of ε for which %Ris kept below 5% are the optimal choice (Zbilut et al.,2002; Webber and Zbilut, 2005).
3 TRAFFIC PATTERN CLUSTERING
The final stage of the proposed approach involves clus-tering traffic patterns in groups that have common traf-fic and statistical behavior; following the previous anal-ysis of traffic dynamics, the available information forclustering is separated into two distinct categories: (a)information on the evolution of the deterministic andnonlinear statistical properties of traffic flow patterns(%DET, Lmax), and (b) information on average val-ues of volume (V) and occupancy (O) in the tempo-ral window of study. In cases where outliers or intensefluctuations may distort clustering results, the literaturesuggests using a two-stage approach to improve on com-putational requirements and accuracy (Xu and Wunsch,2005); this two-stage approach is based on the conceptof providing an additional level of processing that actsas an information abstraction/data reduction level. Thisapproach is widely used because of its robustness tomissing values and to fluctuating data (Lampinen andOja, 1992).
The proposed clustering approach consists of two lev-els of processing: (a) Data reduction level, and (b) Fi-nal clustering level. The first level involves a data reduc-tion process for representing a four-dimensional space(O, V,%DET and Lmax) into a simpler two-dimensionalmapping. The proposed two-stage clustering approachbased on Kohonen self-organizing map (KSOM) hasbeen found to be more accurate and computationallyefficient than conventional partitioning techniques suchas k-means (Vesanto and Alhoniemi, 2000; Kuoa et al.,
540 Vlahogianni, Karlaftis & Golias
2006). The data reduction process involves the use ofa KSOM that consists of an input space where traffictemporal patterns are presented in the network in theform of vectors such as Xn = {
V, O, %DET, Lmax}
anda two-dimensional lattice of output neurons. Its outputneuron represents a prototype vector M; the purposeof KSOM’s training is to generate a structure of proto-type vectors topologically ordered in a two-dimensionalmap in such a way that the original features of thehigh-dimensional input space are preserved. Duringtraining, patterns are iteratively mapped to the out-put prototypes; prototypes “compete” among them-selves and the “winner” exhibits the smaller Euclideandistance—from x—between all output neurons; thetraining algorithm is explained in detail in Kohonen(2001). The process is repeated until a certain distancecriterion is reached and the position of prototypes in thelattice cannot be modified further.
The second level is the final stage of clustering andinvolves the implementation of a simple k-means algo-rithm to cluster the M prototypes by the KSOM. Thek-means is one of the most straightforward unsuper-vised learning algorithms in clustering. As the algorithmexhibits sensitivity to initial cluster selection, it mustbe run repeatedly (Webb, 2002). Moreover, k-meansworks with a fixed number of clusters so that the result-ing clustering needs to be evaluated in terms of the op-timal number of clusters. For this, the Davies–Bouldinindex (D–B index; Davies and Bouldin, 1979), a rela-tive index of cluster validity, is calculated for different
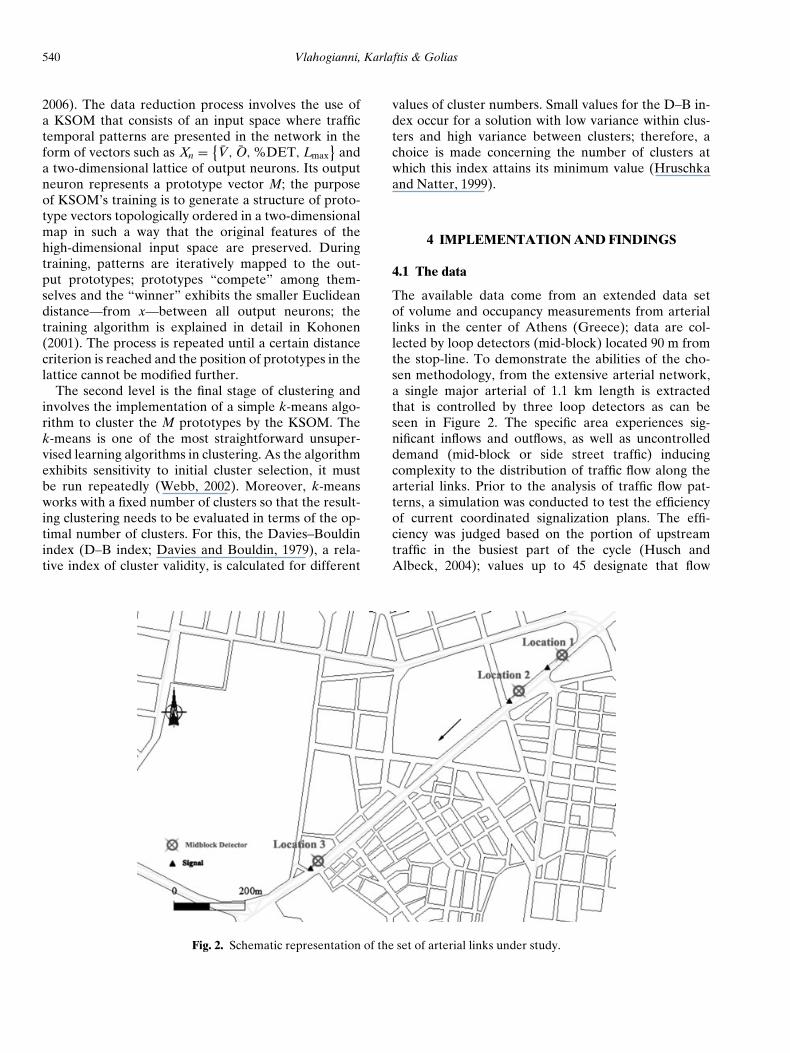
Fig. 2. Schematic representation of the set of arterial links under study.
values of cluster numbers. Small values for the D–B in-dex occur for a solution with low variance within clus-ters and high variance between clusters; therefore, achoice is made concerning the number of clusters atwhich this index attains its minimum value (Hruschkaand Natter, 1999).
4 IMPLEMENTATION AND FINDINGS
4.1 The data
The available data come from an extended data setof volume and occupancy measurements from arteriallinks in the center of Athens (Greece); data are col-lected by loop detectors (mid-block) located 90 m fromthe stop-line. To demonstrate the abilities of the cho-sen methodology, from the extensive arterial network,a single major arterial of 1.1 km length is extractedthat is controlled by three loop detectors as can beseen in Figure 2. The specific area experiences sig-nificant inflows and outflows, as well as uncontrolleddemand (mid-block or side street traffic) inducingcomplexity to the distribution of traffic flow along thearterial links. Prior to the analysis of traffic flow pat-terns, a simulation was conducted to test the efficiencyof current coordinated signalization plans. The effi-ciency was judged based on the portion of upstreamtraffic in the busiest part of the cycle (Husch andAlbeck, 2004); values up to 45 designate that flow

Temporal evolution of short-term urban traffic flow 541
arrivals are uniformly distributed across cycle, whereasvalues near 100 indicate greatly platooned traffic flow.A relevant efficiency of the existing signal coordinationplans was observed (portion of upstream traffic in thebusiest part of the cycle equals on average 64) indicat-ing that, despite the existence of substantial inflows andoutflows of traffic, the roadway maintains a relativelysmooth operation suitable for flow estimation testingand prediction.
However, due to the existence of several uncontrolledintersections between the main signalized intersectionsin the study area, as well as uncertainty regarding sig-nalization’s synchronization with the traffic flow mea-surements, information regarding the signalization wasdiscarded from the analysis of traffic patterns. Knowl-edge regarding the manner in which traffic evolves inthe study area stems from traffic volume and occupancymeasurements per 90-second intervals (average cyclelength); these variables will be used to identify trafficflow’s pattern-based evolution.
The proposed approach to identifying traffic flow’spattern-based evolution is purely data driven withoutconsidering signalization phases. This suggests that ourprimary focus is on the joint consideration of volumeand occupancy, whereas data requirements focus onthe completeness of the occupancy–volume relationshipparticularly with regards to different traffic flow condi-tions. Figure 3 depicts the volume and occupancy timeseries for a typical weekday in the study area. As canbe observed, time series from all three locations understudy exhibit temporal variability. Interestingly, the se-ries of traffic volume have, on average, similar temporalevolution, whereas occupancy’s temporal evolution dif-fers among the three control locations.
The next step is to reconstruct volume and occu-pancy series by applying the mutual information andthe false nearest neighborhood algorithms. The recon-struction process is the following: mutual informationand false nearest neighborhood algorithms are first ap-plied to various 1-day time series of volume and oc-cupancy; then, the same approach is used to shrinkingtime windows until the series reaches a 1-hour dura-tion. The resulting values of embedding delay and di-mension characterize the pattern of traffic flow within asliding hour (Equation (1)). The above process yieldedτ = 1 and m = 5 as the embedding parameters forboth volume and occupancy, suggesting that the dy-namics of traffic should be studied—following Equa-tion (1)—through the following volume and occupancyvectors:
V {t} = {V(t), V(t − 1), . . . , V(t − 4)
}
O {t} = {O(t), O(t − 1), . . . , O(t − 4)
} (7)
4.2 Statistical characteristics of temporal trafficpatterns
In this case study, an iterative preliminary process ofCRQA analysis in time window WT of different dura-tions (30 to 90 minutes) was implemented; for this weused threshold values ε i ranging from 20% to 40% ofthe mean distance separating traffic flow states in the re-constructed phase–space, to select the optimum valuesof WT and ε i (the criterion was to stabilize (%)R in lowlevels (∼5%) and provide valid statistical recurrences).This preliminary process shows that the minimum ex-tent of the time window of study WT is 1 hour; this sug-gests that the deterministic and nonlinear characteristicsof traffic flow should be studied in a 40 × 40 recurrencesmatrix (Equation (4)) updated every one interval.
The resulting series of %DET and Lmax provide ameasure of traffic’s temporal evolution in the selectedtime window. The use of a sliding window in whichthe values of %DET and Lmax are calculated, also en-compasses information on transitions in traffic becauseit provides constantly updated traffic information (win-dows “sliding” in time). Figure 4 depicts the series ofoccupancy (O) volume (V), mean occupancy (mean O),and mean volume (mean V) in the sliding windows WT ,as well as of %DET and Lmax. Variable behavior isobserved for the variables that describe traffic pattern-based dynamics (%DET and Lmax).
4.3 Two-level clustering implementationand validation
The first level of traffic clustering was to de-velop a KSOM to produce the set of prototypes.The map developed is a 2 × 90 grid, suggesting180 prototype neurons of the following form: w j =[meanVj , meanOj , %DET j , Lmax j ]. The network wastrained in two adaptive phases: the self-organizing andthe fine-tuning phase. During self-organization, the net-work was trained with a learning rate η(n) of initialvalue η0 = 0.1 decreasing to 0.01. The initial neighbor-hood width σ 0 was set to 14. During fine-tuning, thelearning rate was kept low (about 0.01) and the neigh-borhood width was decreased to 1; average quantizationerror was 0.03.
In the second level, the prototypes produced wereclustered by a k-means algorithm. As k-means needsa prefixed number of clusters to be applied, 11 differ-ent values of Ci (2 ≤ i ≤ 12), where Ci is the numberof clusters, were calculated and a clustering validationprocedure was undertaken. The calculated D–B validityindex (Davies and Bouldin, 1979) for each value of Ci
indicates that i = 4 provides optimal data partitioning.Further, the two-level clustering technique was tested

542 Vlahogianni, Karlaftis & Golias
Fig. 3. Time series of volume and occupancy for three sequential locations during a typical day.

Temporal evolution of short-term urban traffic flow 543
Fig. 4. Series of mean values of occupancy (%) and volume(veh/90seconds),%DET, and Lmax for every 1-hour sliding
window updated every 90 seconds (typical day).
against two other clustering strategies: (a) a simple k-means algorithm using only statistical information in theform of %DET and Lmax and (b) a simple k-means al-gorithm using both statistical (%DET, Lmax) and trafficinformation (mean values of volume and occupancy inthe sliding study windows WT). The Davies–Bouldin va-lidity was calculated for the two additional strategies; re-sults from all three strategies are shown in Figure 5 (i =
0.4
0.8
1.2
1.6
2 4 6 8 10 12
Dav
ies-
Bou
lin I
ndex
Number of clusters C
Two-Level Clustering Strategy II Strategy I
Fig. 5. Three applied clustering strategies.
4 gives again optimal partitioning for all strategies). Thepartitionings provided by the three tested clustering ap-proaches are compared via the relative conditional en-tropy (Vesanto and Alhoniemi, 2000). The calculationof the entropy describing the uncertainty in betweendifferent partitionings indicates that the proposed two-level approach to clustering traffic patterns is “better”—in terms of the information provided to the knowledgeof clusters—than the other strategies tested.
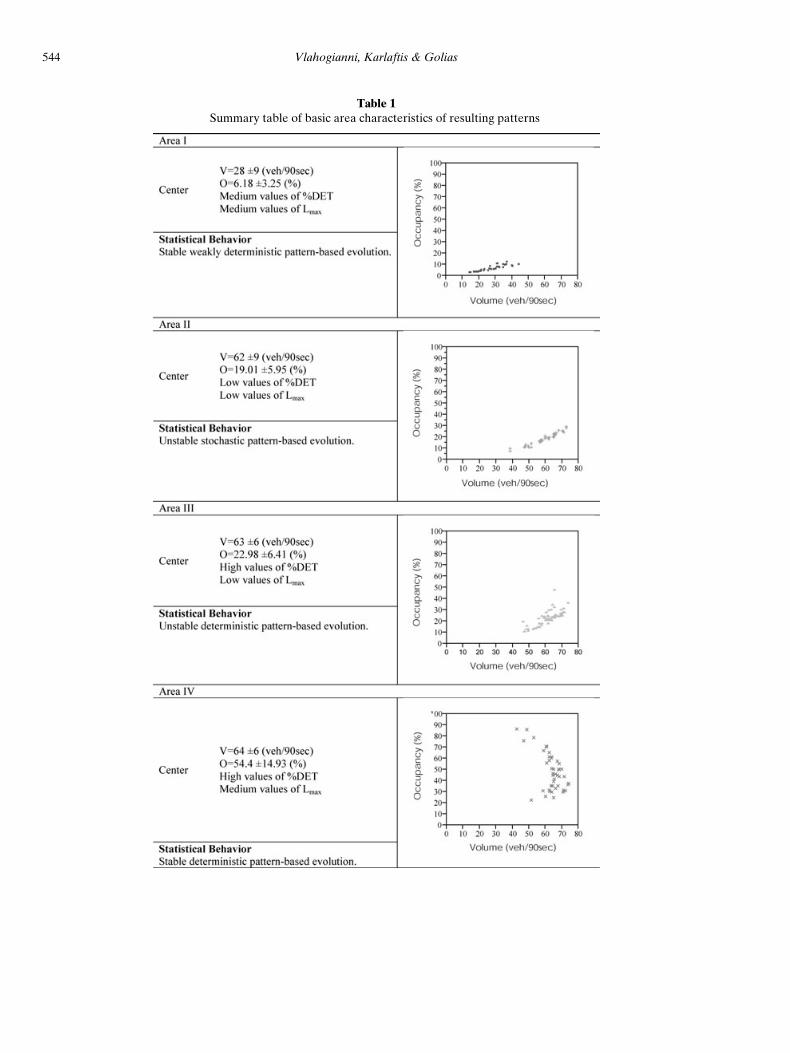
Results for the four identified regions of traffic flowwith respect to the statistical characteristics of trafficevolution are demonstrated in Table 1; further, Figure 6depicts the time series of volume (vehicle/hour) andmean occupancy (percentage) according to the trafficflow area volume and occupancy measurements they be-long to. It is evident that when flow settles at high levelsof volume and occupancy its evolution seems to be sta-ble in terms of frequency of transitions. On the otherhand, in high values of volume and medium values ofoccupancy, traffic flow has a variable evolution with re-spect to each statistical characteristic; this evolution isdecomposed into two distinct overlapping traffic flowareas.
4.4 Traffic areas of characteristic statistical behavior
From a traffic perspective, the results of the cluster-ing process are of interest; first, the three basic traf-fic areas of a volume-occupancy diagram can be iden-tified: free-flow conditions (unqueued conditions—areaI), synchronized conditions (area II and III) that reflecttraffic flow evolution near capacity where occupancyrises fast whereas volume stabilizes at high oscillating
544 Vlahogianni, Karlaftis & Golias
Table 1Summary table of basic area characteristics of resulting patterns
Temporal evolution of short-term urban traffic flow 545
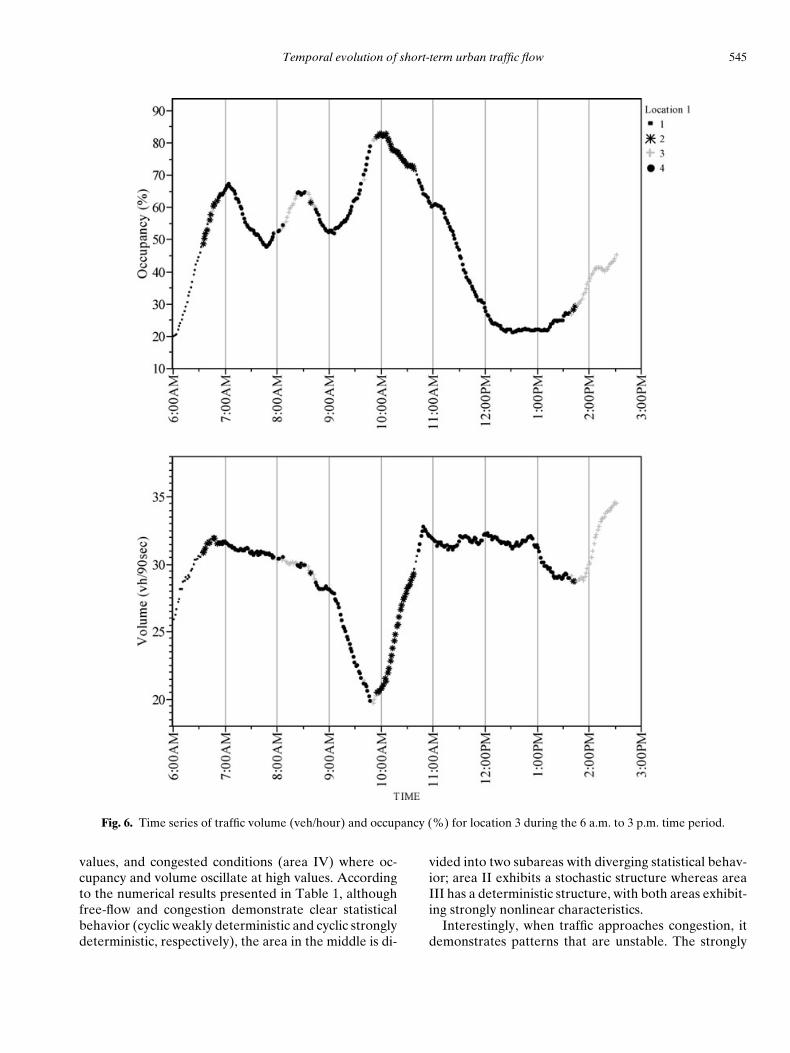
Fig. 6. Time series of traffic volume (veh/hour) and occupancy (%) for location 3 during the 6 a.m. to 3 p.m. time period.
values, and congested conditions (area IV) where oc-cupancy and volume oscillate at high values. Accordingto the numerical results presented in Table 1, althoughfree-flow and congestion demonstrate clear statisticalbehavior (cyclic weakly deterministic and cyclic stronglydeterministic, respectively), the area in the middle is di-
vided into two subareas with diverging statistical behav-ior; area II exhibits a stochastic structure whereas areaIII has a deterministic structure, with both areas exhibit-ing strongly nonlinear characteristics.
Interestingly, when traffic approaches congestion, itdemonstrates patterns that are unstable. The strongly

546 Vlahogianni, Karlaftis & Golias
Fig. 7. A graphical representation of the resulting traffic clustering in the volume–occupancy relationship for the three locationsunder study.
nonlinear characteristics are indicative of the oscillat-ing nature observed by the series of flow and occu-pancy; instability and chaotic-like behavior have alsobeen reported by previous studies based on stochasticmicroscopic traffic flow modeling through a sequenceof traffic lights with both fixed and irregular signal-ization characteristics (Nagatani, 2005, 2008). In thisarticle, although the reasons why such traffic behav-ior occurs cannot be readily identified, two structuresare reflected; first, there is the deterministic structurethat dominates the area of synchronized flow; second,a stochastic short-term evolution in synchronized flowcan be identified, probably encompassing nonrecurrentincidents. Further, the observed instability of traffic flownear capacity is indicative of the considerable transi-tional nature of traffic flow near congestion.
An important insight gained by clustering traffic pat-terns is that transitional conditions can be quantitativelycharacterized. Boundary traffic volume and occupancyvalues along with information on the %DET and Lmax
statistics can lead to recognizing patterns in traffic; forexample, in the specific study area, observing the result-ing clustering reveals that congestion is reached through
a nonlinear deterministic behavior (area III). On theother hand, traffic flow “leaves” free-flow conditionseither through a nonlinear deterministic manner (andmoves to area III) or a sudden stochastic shift (andmoves to area II). Moreover, the study of traffic’s prop-agation between areas can uncover the duration of vari-ous traffic phenomena. For example, congestion for theurban arterial under study is found to last, on average,about 45 minutes; transitive states near congestion lastmuch less, with mean duration in area III at approxi-mately 12 minutes. Moreover, transitions between areasIII and II are frequent, with a shift approximately every7.5 minutes and maximum time period between shifts 45minutes.
Finally, Figure 7 depicts the resulting traffic flow ar-eas in the volume–occupancy relationship in the threelocations of interest during the 4-hour morning peak pe-riod. As can be observed, traffic flow in each locationhas a distinct temporal behavior; traffic flow in location1 seems to exhibit intense shifts to extreme traffic flowconditions compared to the dynamics of downstream lo-cations. The dependence of each location on the nearupstream or downstream location is a critical issue for

Temporal evolution of short-term urban traffic flow 547
further study due to its immediate effects on the imple-mentation of short-term forecasting algorithms.
5 CONCLUSIONS
Short-term traffic forecasting practice has, for sometime, indicated the need to uncover and model pat-terns of traffic to improve on its predictions. However,previous efforts on the subject did not uncover trafficpatterns with respect to their statistical behavior or theconditions under which they occur. In this article weoffered a methodology for identifying different trafficflow patterns, the traffic conditions under which thesepatterns occur, and their temporal evolution character-istics. Results from the analysis of traffic’s temporal evo-lution indicate that traffic pattern propagation exhibitsintense variability with respect to its statistical charac-teristics such as deterministic structure and nonlinearevolution. Further, clustering of traffic patterns uncov-ers four distinct classes of traffic pattern evolution.
The proposed multilayer traffic pattern recognitionstrategy presents several interesting features:
1. Multivariate modeling (joint consideration of vol-ume and occupancy) of traffic variables;
2. Identification and statistical characterization ofthe temporal pattern-based evolution of trafficflow;
3. Generation of clusters of traffic patterns that ex-hibit similar statistical characteristics with respectto their temporal evolution;
4. Identification of transitional traffic conditionswhere a shift in pattern occurs.
The proposed approach can be considered as trans-ferable to the degree that its data-driven nature per-mits; given a new set of data that reflects new topo-logical/highway characteristics, the proposed approachcan reveal and numerically approximate traffic patternsand traffic conditions for the new area under study. Fi-nally, the proposed approach is purely dynamic both inits concept as in its operation; it can result in a recursiveprocedure for recognizing the dynamic dependence oftraffic (the traffic pattern) in any time interval. This is animportant feature that needs to be considered when de-ploying dynamic prediction structures operating in realtime.
REFERENCES
Abarbanel, H. D. I. (1996), Analysis of Observed ChaoticData, Institute for Nonlinear Science, Springer-Verlag,New York.
Abdulhai, B., Porwal, H. & Recker, W. (2002), Short-termtraffic flow prediction using neuro-genetic algorithms, Jour-nal of Intelligent Transportation Systems, 7(1), 3–41.
Chen, H., Grant-Muller, S., Mussone, L. & Montgomery, F.(2001), A study of hybrid neural network approaches andthe effects of missing data on traffic forecasting, NeuralComputing & Applications, 10, 277–86.
Chowdhury, D., Santen, L. & Schadschneider, A. (2000), Sta-tistical physics of vehicular traffic and some related systems,Physics Reports, 329, 199–329.
Clark, S. D., Dougherty, M. S. & Kirby, H. R. (1993), The useof neural networks and time series models for short-termtraffic forecasting: a comparative study, PTRC 21st SummerAnnual Meeting, September, Manchester, UK.
Danech-Pajouh, M. & Aron, M. (1991), ATHENA: a methodfor short-term inter-urban motorway traffic forecasting,Recherche Transport Securite, 6, 11–6.
Davies, D. L. & Bouldin, D. W. (1979), A cluster separationmeasure, IEEE Transactions on Pattern Recognition andMachine Intelligence, 1, 224–7.
Davis, G. A., Niham, N. L., Hamed, M. M. & Jacobson, L. N.(1991), Adaptive forecasting of freeway traffic congestion,Transportation Research Record, 1287, 29–33.
Eckmann, J. P., Kamphorst, O. S. & Ruelle, D. (1987), Re-currence plots of dynamical systems, Europhysics Letters,4, 973.
Fraser, A. M. & Swinney, H. L. (1986), Independent coordi-nates for strange attractors from mutual information, Phys-ical Review A, 33(2), 1134–40.
Gao, J. & Cai, H. (2000), On the structures and quantificationof recurrence plots, Physics Letters A, 270, 75–87.
Hamed, M. M., Al-Masaeid, H. R. & Bani Said, Z. M. (1995),Short-term prediction of traffic volume in urban arterials,ASCE Journal of Transportation Engineering, 121(3), 249–54.
Helbing, D. (2001), Traffic and related self-driven many-particle systems, Reviews of Modern Physics, 73(4), 1067–1141.
Hruschka, H. & Natter, M. (1999), Comparing performanceof feedforward neural nets and K-means for cluster-basedmarket segmentation, European Journal of Operational Re-search, 114(2), 346–53.
Husch, D. & Albeck, J. (2004), Synchro 6 user guide, Traf-ficware, CA.
Ishak, S. & Alecsandru, C. (2004), Optimizing traffic predic-tion performance of neural networks under various topo-logical, input and traffic condition settings, Journal ofTransportation Engineering, 130(4), 452–65.
Jiang, X. & Adeli, H. (2004), Wavelet packet-autocorrelationfunction method for traffic flow pattern analysis, Computer-Aided Civil and Infrastructure Engineering, 19, 324–37.
Jiang, X. & Adeli, H. (2005), Dynamic wavelet neural networkmodel for traffic flow forecasting, Journal of TransportationEngineering, 131(10), 771–9.
Kamarianakis, I. & Prastakos, P. (2003), Forecasting trafficflow conditions in an urban network: comparison of multi-variate and univariate approaches, Transportation ResearchRecord, 1857, 74–84.
Kantz, H. & Schreiber, T. (1997), Non-Linear Time SeriesAnalysis, Cambridge Non-linear Science: Series 7, Cam-bridge University Press, New York.
Kennel, M. B., Brown R. & Abarbanel, H. D. I. (1992),Determining embedding dimension for phase-space

548 Vlahogianni, Karlaftis & Golias
reconstruction using a geometrical construction, PhysicsReviews A, 45, 3403.
Kerner, B. S. (2004a), Three-phase traffic theory and highwaycapacity, Physica A, 333, 379–440.
Kerner, Boris S. (2004b), The Physics of Traffic: EmpiricalFreeway Pattern Features, Engineering Applications, andTheory. Springer, Berlin, ISBN 3-540-20716-3.
Kohonen, T. (1995, 2001), Self-Organizing Maps. Springer Se-ries in Information Sciences, Vol. 30, 3rd extended edn.,Springer, Berlin, Germany.
Kuoa, R. J., Ana, Y. L. Wanga, H. S. & Chung, W. J. (2006),Integration of self-organizing feature maps neural networkand genetic K-means algorithm for market segmentation,Expert Systems with Applications, 30, 313–24.
Kwon, E. & Stephanedes, Y. J. (1994), Comparative evalua-tion of adaptive and neural-network exit demand predic-tion for freeway control, Transportation Research Record,1446, 66–76.
Lampinen, J. & Oja, E. (1992), Clustering properties of hierar-chical self-organizing maps, Journal of Mathematical Imag-ing and Vision, 2, 261–72.
Marwan, N. & Kurths, J. (2002), Nonlinear analysis of bi-variate data with cross recurrence plots, Physics Letters A,302(5–6), 299–307.
Marwan, N., Romano, C. M., Theiler, M. & Kurths, J. (2007),Recurrence plots for the analysis of complex systems,Physics Reports, 438, 237–329.
Nagatani, T. (2002), The physics of traffic jams, Reports onProgress in Physics, 65, 1331–86.
Nagatani, T. (2005), Chaos and dynamical transition of a sin-gle vehicle induced by traffic light and speedup, Physica A:Statistical Mechanics and Its Applications, 348, 561–71.
Nagatani, T. (2008), Effect of irregularity on vehicular trafficthrough a sequence of traffic lights, Physica A: StatisticalMechanics and Its Applications, 387(7), 1637.
Park, D., Rilett, L. R. & Han, G. (1999), Spectral basis neuralnetworks for real-time travel time forecasting, Journal ofTransportation Engineering, 125(6), 515.
Persaud, B. N. & Hall, F. L. (1989), Catastrophe theory andpatterns in 30-second freeway traffic data–implications forincident detection. Transportation Research Part A, 23(2),103–13.
Shockley, K., Buttwill, M., Zbilut, J. P. & Webber, C. L. Jr.(2002), Cross recurrence quantification of coupled oscilla-tors, Physics Letters A, 305, 59–69.
Smith, B. L. & Demetsky, M. J. (1997), Traffic flow forecast-ing: comparison of modelling approaches, Journal of Trans-portation Engineering 123(4), 261–6.
Smith, B. L. & Oswald, R. K. (2003), Meeting real-timetraffic flow forecasting requirements with imprecise compu-tations, Computer Aided Civil and Infrastructure Engineer-ing, 18(3), 201–13.
Stathopoulos, A. & Karlaftis, M. G. (2003), A multivariatestate-space approach for urban traffic flow modelling andprediction, Transportation Research Part C, 11(2), 121–5.
Trulla, L. L., Giuliani, A., Zbilut, J. P. & Webber, C. L. Jr.(1996), Recurrence quantification analysis of the logisticequation with transients, Physics Letters A, 223, 255–60.
Van Der Voort, M., Dougherty, M. & Watson, S. (1996), Com-bining Kohonen maps with ARIMA time-series models toforecast traffic flow, Transportation Research, Part C, 4,307–18.
Vesanto, J. & Alhoniemi, E. (2000), Clustering of the self-organizing map, IEEE Transactions on Neural Networks,11(3), 586–600.
Vlahogianni, E. I., Geroliminis, N. & Skabardonis, A. (2007),On traffic flow regimes and transitions in signalized ur-ban arterials, in The Proceedings of the 86th Annual Trans-portation Research Board Meeting, January, WashingtonDC.
Vlahogianni, E. I., Karlaftis, M. G. & Golias, J. C. (2005), Op-timized and meta-optimized neural networks for short-termtraffic flow prediction: a genetic approach, TransportationResearch C, 13, 211–34.
Vlahogianni, E. I., Karlaftis, M. G. & Golias, J. C. (2006),Statistical methods for detecting nonlinearity and non-stationarity in univariate short-term time-series of trafficvolume, Transportation Research Part C: Emerging Tech-nologies, 14(5), 351–67.
Vlahogianni, E. I., Karlaftis, M. G. & Stathopoulos, A.(2005), An extreme value based neural clustering ap-proach for identifying traffic states, in The Proceed-ings of the 8th International IEEE Conference on Intelli-gent Transportation Systems, 13–16 September, Vienna,Austria.
Webb, A. (2002), Statistical Pattern Recognition. 2nd edn.,John Wiley, Hoboken, NJ.
Webber, C. L. Jr. & Zbilut, J. P. (2005), Recurrence quan-tification analysis of nonlinear dynamical systems. Chap-ter 2, in Tutorials in Contemporary Nonlinear Methods forthe Behavioral Sciences, The National Science Foundation,Arlington, VA.
Williams, B. M. (2001) Multivariate vehicular traffic flow pre-diction: an evaluation of ARIMAX modeling, Transporta-tion Research Record, 1776, 194–200.
Williams, B. M., Durvasula, P. K. & Brown, D. E. (1998),Urban traffic flow prediction: application of seasonal au-toregressive integrated moving average and exponentialsmoothing models, Transportation Research Record, 1644,132–44.
Xie, Y. & Zhang, Y. (2006), A wavelet network model forshort-term traffic volume forecasting, Journal of IntelligentTransportation Systems: Technology, Planning, and Opera-tions, 10(3), 141–50.
Xu, R. & Wunsch, D. C. II (2005), Survey of clustering algo-rithms, IEEE Transactions on Neural Networks, 16(3), 645–78.
Yin, H., Wong, S. C. & Xu, J. (2002), Urban traffic flow predic-tion using fuzzy-neural approach, Transportation ResearchPart C, 10, 85–98.
Zbilut, J. P. (2004), Unstable Singularities and Randomness.Elsevier, Amsterdam.
Zbilut, J. P. (2006), Use of recurrence quantification analy-sis in economic time-series, in M. Salzano and A. Kirman(eds.), Economics: Complex Windows, Springer, New York,pp. 91–104.
Zbilut, J. P., Dixon, D. D. & Zak, M. (2002), Detectingsingularities of piecewise deterministic (terminal) dynam-ics in experimental data, Physics Letters A, 304(3–4), 95–101.
Zbilut, J. P., Giuliani, A. & Webber, C. L. Jr. (1998), De-tecting deterministic signals in exceptionally noisy environ-ments using cross-recurrence quantification, Physics LettersA, 246(1–2), 122–8.
Zbilut, J. P. & Webber, C. L. Jr. (1992), Embeddings anddelays as derived from quantification of recurrence plots,Physics Letters A, 171, 199–203.
Zhang, H. M. (2000), Recursive prediction of traffic conditionswith neural networks, Journal of Transportation Engineer-ing, 126, 472–81.