PROPOSAL TO THE OFFICE OF PIPELINE SAFETY - ROSA P
142
- 1 - DTPH56 – 06 –T– 000023 - FINAL REPORT EFFECT OF SURFACE PREPARATION ON RESIDUAL STRESSES IN MULTI- LAYER COATINGS AND THE CONSEQUENCES FOR DISBONDMENT FOLLOWING CONSTRUCTION DAMAGE AND EXPOSURE TO IN-SERVICE STRESS SUBMITTED BY: NOVA Chemicals Research & Technology Centre 2928 –16 th Street NE, Calgary, Alberta, Canada, T2E 7K7 www.novachem.com POC/PI: Dr. Bill Santos and Mr. Matthew Botros Tel: (403) 250-0661, Fax: (403) 250-0633, Email: [email protected] COLLABORATORS: Mr. Robert Worthingham (TransCanada Pipelines Ltd.) & Dr. Peter Singh (ShawCor Ltd.)
-
Upload
khangminh22 -
Category
Documents
-
view
0 -
download
0
Transcript of PROPOSAL TO THE OFFICE OF PIPELINE SAFETY - ROSA P

- 1 -
DTPH56 – 06 –T– 000023 - FINAL REPORT
EFFECT OF SURFACE PREPARATION ON RESIDUAL STRESSES IN MULTI-
LAYER COATINGS AND THE CONSEQUENCES FOR DISBONDMENT FOLLOWING
CONSTRUCTION DAMAGE AND EXPOSURE TO IN-SERVICE STRESS
SUBMITTED BY:
NOVA Chemicals Research & Technology Centre
2928 –16th Street NE, Calgary, Alberta, Canada, T2E 7K7
www.novachem.com
POC/PI: Dr. Bill Santos and Mr. Matthew Botros
Tel: (403) 250-0661, Fax: (403) 250-0633, Email: [email protected]
COLLABORATORS: Mr. Robert Worthingham (TransCanada Pipelines Ltd.)
&
Dr. Peter Singh (ShawCor Ltd.)

NOVA Chemicals Research & Technology Centre #DTPH56-06-BAA-001
Effect of Surface Preparation on Residual Stresses in Multi-layer Coatings
- 2 -
PUBLIC ABSTRACT
Underground pipelines are protected by a combination of cathodic protection and a
protective coating. Multi-layer coatings offer protection against corrosion and from
mechanical damage during construction or during service. Multi-layer coatings are
widely used in Europe and other countries but have not been used as extensively in
North America despite offering advantages in terms of combined corrosion and impact
resistance.
The aim of this investigation is to improve the performance of multi-layer coatings
through an understanding of the factors that affect the level of residual stress in the
coating and ultimately, the consequences for coating disbondment. This report
describes research to understand the effect of surface preparation and coating aging on
the distribution of residual stress in plant applied HPCC and the consequences of in-
service performance. Although it is known that the current manufacturing processes
lead to the introduction of residual stress in multi-layer coatings, the magnitude of these
stresses and the consequences for coating performance are unknown.

NOVA Chemicals Research & Technology Centre #DTPH56-06-BAA-001
Effect of Surface Preparation on Residual Stresses in Multi-layer Coatings
- 3 -
1.0 EXECUTIVE SUMMARY
This final report addresses Program Area 1. Coating Integrity in the PHMSA Advanced
Coatings R&D Solicitation #DTPH56-06-BAA-0001.
Multi-layer coatings are widely used in Europe and other countries but have not been
used as extensively in North America despite offering advantages in terms of combined
corrosion and impact resistance. Part of this lack of market penetration is due to
uncertainty in how these coatings will perform in service, especially whether the outer
polyethylene (PE) layer will create shielding conditions if the coating disbonds.
Although some information exists on the environmental aspects of multi-layer coating
disbondment, from work on separate fusion bonded epoxy (FBE) and PE coatings and
from work on multi-layer coatings in Europe and Canada, there is no information about
the effect of residual and operating stresses on the coating and how this affects the
probability or consequences of disbondment.
This investigation involves the determination of the effect of surface preparation on the
distribution of residual stress in a plant applied three-layer coating and the
consequences related to in-service performance. In particular, the stress-strain
properties of the coatings will be compared with loads likely to occur during construction
and from soil stress during service. This comparison will allow the probability of coating
damage to be predicted, from which the potential for disbondment and the development
of aggressive trapped water solutions can also be estimated.

NOVA Chemicals Research & Technology Centre #DTPH56-06-BAA-001
Effect of Surface Preparation on Residual Stresses in Multi-layer Coatings
- 4 -
This work will support a better understanding of multi-layer coating behaviour in service
environments and provide direction for future development of coatings with improved
performance. Together, these improvements should result in a more widespread use of
these advanced pipeline coatings in North America, increasing pipeline integrity and
safety. These advances will provide the basis for developing better industry standards
for the manufacture of multi-layer coatings in order to provide reliable and predictable
quality and coating performance.
This work brings together a team comprising a pipeline applicator (ShawCor Ltd.), a
manufacturer of coating components (NOVA Chemicals Corp.), both of whom are active
in developing new coating standards, a pipeline operator (TransCanada Pipelines), and
a pipeline research organization (NOVA Chemicals Research & Technology Centre).

NOVA Chemicals Research & Technology Centre #DTPH56-06-BAA-001
Effect of Surface Preparation on Residual Stresses in Multi-layer Coatings
- 5 -
TABLE OF CONTENTS
PUBLIC ABSTRACT ....................................................................................................... 2
EXECUTIVE SUMMARY ................................................................................................ 3
LIST OF TABLES ........................................................................................................... 7
LIST OF FIGURES ......................................................................................................... 7
LIST OF APPENDICIES ……………………………………………………………………... 9
2.0 OBJECTIVE AND SCOPE ..................................................................................... 10
2.1 Impact on Public Safety …………………………………………………….. 11
2.2 Main Deliverable and Benefit to Industry …………………………………. 11
3.0 INTRODUCTION ................................................................................................... 12
4.0 MULTI-LAYER COATINGS .................................................................................... 16
4.1 Steel Pipe Surface …………………………………………………………… 17
4.2 Chemical Surface Treatment ………………………………………………. 17
4.3 Multi-Layer Components ……………………………………………………. 18
4.4 Multi-Layer Coating Standards …………………………………………….. 21
5.0 HIGH PERFORMANCE COMPOSITE COATING ................................................. 22
5.1 HPCC Composition ………………………………………………………….. 23
6.0 GENERAL COATING DISBONDMENT MECHANISM ………………………….. 25
7.0 PREPARATION OF HPCC SAMPLES ……………………………………………. 27
7.1 Test Matrix ……………………………………………………………………. 27
7.2 Application Process …………………………………………………………. 29
7.3 Characterization of Surface Profiles Prior to Coating ……………………. 29
7.4 Characterization of Coating Properties ……………………………………. 30

NOVA Chemicals Research & Technology Centre #DTPH56-06-BAA-001
Effect of Surface Preparation on Residual Stresses in Multi-layer Coatings
- 6 -
8.0 RESULTS AND DISCUSSION …........................................................................... 35
8.1 Discussion of Coating Physical Properties ………………...........……….. 35
8.2 Cathodic Disbondment Experimental Setup ……………………………… 40
8.2.1 Discussion of Cathodic Disbondment Tests ……………………… 42
8.3 Introduction to Residual Stress Measurements ………………………...... 50
8.3.1 Hole-Drilling Method ..................................................................... 51
8.3.2 Residual Stress Measurements on HPCC ................................... 54
8.4 Assessment of In-Service Coating Performance .................................... 59
8.4.1 In-Service Stresses – Laboratory Testing .................................... 59
8.4.2 In-Service Stresses – Field Experience ....................................... 63
8.5 Comparison of Various Coating Property Measurements ....................... 65
9.0 CONCLUSIONS ................................................................................................. 68
10.0 RECOMMENDATIONS ...................................................................................... 73 11.0 REFERENCES ................................................................................................. 75
12.0 TABLES ............................................................................................................. 80
13.0 FIGURES ........................................................................................................... 95
14.0 APPENDICIES ................................................................................................. 130

NOVA Chemicals Research & Technology Centre #DTPH56-06-BAA-001
Effect of Surface Preparation on Residual Stresses in Multi-layer Coatings
- 7 -
LIST OF TABLES
Table 1 – Test Matrix of Tested Coating Physical Properties ....................................... 80
Table 2 – Measured Profiles of Pipe Joints Subjected to Various Blast Profiles .......... 81
Table 3 – Physical Property Data for HPCC, PE and FBE ........................................... 82
Table 4 – Cathodic Disbondment Test Matrix ............................................................... 83
Table 5 – Cathodic Disbondment Measurements and Photographs ............................ 84
Table 6 – 28 Day HWS @ 75°C Test Results for HPCC Samples ............................... 93
Table 6a – CSA Z245.20-06 Adhesion Rating Criteria ................................................. 93
Table 7 – Average Uniform Residual Stress in Tested Coatings .................................. 94
Table 8 – Average Change in Micro-strain as a Function of Depth .............................. 94
Table 9 – Average Cumulative Micro-strain Measured in Tested Coatings .................. 94
LIST OF FIGURES
Figure 1 – ASTM Type VI Dog Bone Tensile Sample Specifications ........................... 95
Figure 2 – DSC Measurement for Standard HPCC Coating from 30" Pipe .................. 96
Figure 3 – DSC Measurement from 1 year old HPCC Coated 36" Pipe ....................... 97
Figure 4 – DSC Measurement for a Lab Made Glass Cooled HPCC ........................... 98
Figure 5 – DSC Measurement for PE Air Cooled with Pressure .................................. 99
Figure 6 – DSC Measurement for PE Cooled at 30°C/min ......................................... 100
Figure 7 – DSC Measurement for PE Standard Compression Molding ...................... 101
Figure 8 – DSC Measurement for Quench Cooled PE ............................................... 102
Figure 9 – DSC Measurement for Lab-Made FBE ...................................................... 103
Figure 10 – Large Diameter CD Cell for Long-Term Testing ...................................... 104
Figure 11 – Typical HPCC Coated Pipe Sample Section............................................ 104

NOVA Chemicals Research & Technology Centre #DTPH56-06-BAA-001
Effect of Surface Preparation on Residual Stresses in Multi-layer Coatings
- 8 -
Figure 12 – CD Experimental Configuration with Power Supply ................................ 105
Figure 13a – Picture of Cathodic Disbondment Experimental Configuration .............. 106
Figure 13b – Cathodic Disbondment Testing for All Project Samples ........................ 107
Figure 14a - Cathodic Disbondment Experimental Setup ........................................... 108
Figure 14b - Cathodic Disbondment Electrical Circuit Diagram .................................. 103
Figure 15a – Hot water Soaking Pre-treatment for CD Testing .................................. 109
Figure 15b – Hot Water Baths used for Hot Soaking Pre-treatment for CD Testing ... 109
Figure 16 – Current Response Recorded for Varying Surface Treatments during CD
Tests Using 1 Year Old HPCC ............................................................... 110
Figure 17 – Current Response Recorded for Varying Surface Treatments during CD
Tests Using New HPCC ......................................................................... 111
Figure 18 – Current Response Recorded for Varying Surface Treatments during CD
Tests Using Low Profile HPCC .............................................................. 112
Figure 19 – Current Response Recorded for Varying Surface Treatments during CD
Tests Using High Profile HPCC .............................................................. 113
Figure 20 – Comparison of Current Response of No Pre-Treatment on Various HPCC
Samples .................................................................................................. 114
Figure 21 – Comparison of Current Response of Hot Soaked Testing Treatment on
Various HPCC Samples .......................................................................... 115
Figure 22 – Comparison of Current Response of Impacted Surface Treatment on
Various HPCC Samples .......................................................................... 116
Figure 23 – Comparison of Current Response of Impacted and Hot Soaked Surface
Treatment on Various HPCC Samples .................................................... 117

NOVA Chemicals Research & Technology Centre #DTPH56-06-BAA-001
Effect of Surface Preparation on Residual Stresses in Multi-layer Coatings
- 9 -
Figure 24 – Comparison of CD Performance of 1 Year Old HPCC ............................ 118
Figure 25 – Comparison of CD Performance of New HPCC ...................................... 119
Figure 26 – Comparison of CD Performance of Low Profile HPCC ........................... 120
Figure 27 – Comparison of CD Performance of High Profile HPCC .......................... 121
Figure 28 – Comparison of CD Performance of No Pre-Treatment Testing on Various
HPCC Samples ....................................................................................... 122
Figure 29 – Comparison of Cathodic Disbondment Performance of Hot Soaked Testing
Treatment on Various HPCC Samples .................................................... 123
Figure 30 – Comparison of Cathodic Disbondment Performance of Impacted Surface
Treatment on Various HPCC Samples .................................................... 124
Figure 31 – Comparison of Cathodic Disbondment Performance of Impacted and Hot
Soaked Surface Treatment on Various HPCC Samples ......................... 125
Figure 32 – Orientation of a Three-element Strain Gauge Rosette ............................ 126
Figure 33 – Residual Stress Measured on Varying Coating Surface
Preparations (x-direction) ........................................................................ 127
Figure 34 – Average Residual Stress Measured on Varying Coating Surface
Preparations (y-direction) ........................................................................ 128
Figure 35 – Relationship between Coating Disbondment of No Pre-Treatment
Samples and Magnitude of Cumulative Micro-Strain .............................. 129
LIST OF APPENDICIES
APPENDIX 1 – Residual Stress Measurement Database on HPCC Samples ........... 130
APPENDIX 2 – Shaw FBE Product Data Sheet ......................................................... 139
APPENDIX 3 – Shaw HPCC Product Data Sheet ...................................................... 141

NOVA Chemicals Research & Technology Centre #DTPH56-06-BAA-001
Effect of Surface Preparation on Residual Stresses in Multi-layer Coatings
- 10 -
2.0 OBJECTIVE AND SCOPE
This report is a first step in developing a research program aimed at increasing
understanding of the development of coating stresses resulting from surface
preparation, coating application procedures and environmental exposure conditions of
the effects of these stresses on coating disbondment. Although it is known that the
current manufacturing processes lead to the introduction of residual stress in multi-layer
coatings, the magnitude of these stresses and the consequences for coating
performance are unknown. Established techniques for determining the level of residual
stress and stress-strain behavior (e.g., hole-drilling) were used to quantify the effect of
different surface manufacturing processes on the mechanical properties of the coatings.
This information can then be used to optimize coating manufacturing and predict the
effects of coating properties, residual stress on coating disbondment and performance
in the field.
NOVA Chemicals Research & Technology Centre #DTPH56-06-BAA-001
Effect of Surface Preparation on Residual Stresses in Multi-layer Coatings
- 11 -
2.1 Impact on Public Safety
Public safety will be enhanced as a result of this research through the greater use of
high-performance, multi-layer pipeline coatings and through improvements to the quality
and performance of multi-layer, high performance composite coating (HPCC) and
ultimately expanded to fusion bonded epoxy (FBE) coatings upon further research. A
better understanding of the performance of these advanced coatings is expected to
result in greater use of these coatings in North America and beyond.
2.2 Main Deliverable and Benefit to Industry
This research can be used to improve specifications for the manufacture and application
of multi-layer coatings specifically to HPCC and ultimately upon further research
expanded to include FBE. Together, these improvements should result in more
widespread use of these advanced pipeline coatings in North America, increasing
pipeline integrity and safety. Moreover, improvements to coating manufacturing and
application procedures could be captured in various coating and pipeline standards.

NOVA Chemicals Research & Technology Centre #DTPH56-06-BAA-001
Effect of Surface Preparation on Residual Stresses in Multi-layer Coatings
- 12 -
3.0 INTRODUCTION
Regardless of coating system, buried pipelines are protected from external corrosion
and stress corrosion cracking (SCC) by a combination of a protective coating and
cathodic protection (CP). However, since coating defects and damage due to handling
(wear and tear) are usually unavoidable, a full understanding of subsequent coating
disbondment and its effects on pipeline integrity are essential.
Various coating systems have been used over the past 45 years and they have evolved
with time and with innovation of new materials. Today, several coating systems are
commonly used for pipelines: two layer polyethylene (2LPE), three layer polyethylene
(3LPE), three layer polypropylene (3LPP), fusion bonded epoxy (FBE or Dual FBE),
coal tar enamel (CTE), asphalt enamel and polyurethane (PUR). The different systems
are specified by pipeline owners and consultants based on several factors, including
short term cost, long term cost, captive usage, regional availability of the coating
material, control on handling, transportation and installation of pipelines, and technical
rationale [1].
3LPE coating is dominant worldwide with approximately 50% of the market share for
onshore pipelines, with the exception of North America. The trend is increasing with a
greater number of projects coated with 3LPE in China, India and the Middle East.

NOVA Chemicals Research & Technology Centre #DTPH56-06-BAA-001
Effect of Surface Preparation on Residual Stresses in Multi-layer Coatings
- 13 -
The increased acceptance of 3LPE is due to its broad operating temperature range from
-45°C to +85°C and ability to withstand very rough handling and installation practices
without damage to the coating. 3LPE systems consist of an epoxy primer, a grafted co-
polymer medium density (MDPE) adhesive to bond the epoxy primer with a high density
polyethylene (HDPE) topcoat.
3LPP systems are recognized as excellent systems for offshore projects with elevated
operating temperatures (0°C to +140°C) and extreme pipeline mechanical stresses.
Recent projects in the North Sea, Africa, Gulf of Mexico and Arabian regions have set
new standards for 3LPP coatings, which provide access to deeper gas and oil fields.
3LPP systems consist of an epoxy primer, a grafted copolymer PP adhesive to bond the
epoxy primer with a PP topcoat. HDPE and PP based systems offer excellent
mechanical protection and long term aging performance.
FBE is dominant in North America and in the United Kingdom. FBE has excellent
adhesion to steel which provides long term corrosion resistance and protection of
pipelines operating at moderate temperatures (-40°C to +85°C). FBE also provides
resistance to cathodic disbondment which reduces the total cost of cathodic protection
during pipeline operation. FBE is also applied as a dual layer product which provides
tough physical properties that minimize damage during handling, transportation,
installation and operation similar to 3LPE systems. Some pipeline owners have
graduated from coal tar coating and urethane to Dual FBE due to environmental impact.

NOVA Chemicals Research & Technology Centre #DTPH56-06-BAA-001
Effect of Surface Preparation on Residual Stresses in Multi-layer Coatings
- 14 -
Coal tar and asphalt enamel are both still used in some countries. However, their use is
declining due to health and environmental concerns.
SCC recommended practices written by the Canadian Energy Pipeline Association
(CEPA), state of the art reviews (OPS/Baker report) and pipeline standards such as
CSA Z662-03 (Oil and Gas Pipeline Systems) identify and require the following coating
properties for pipeline applications:
1. A coating should electrically and physically isolate the environment from the pipe.
2. A coating should be compatible with CP (i.e., it should allow protection of the
pipe by CP at coating defects).
3. A coating should resist under-film migration of moisture and maintain sufficient
adhesion.
4. A coating should resist environmental degradation.
5. A coating should have sufficient strength to resist soil stress and mechanical
damage during handling.
6. A coating should be sufficiently ductile to resist cracking.
7. Surface preparation prior to coating should reduce the steel’s susceptibility to
SCC.
FBE as well as multi-layer and composite coatings meet the above requirements. FBE
external pipeline coatings are currently the most commonly used coatings for new
pipeline construction in North America.

NOVA Chemicals Research & Technology Centre #DTPH56-06-BAA-001
Effect of Surface Preparation on Residual Stresses in Multi-layer Coatings
- 15 -
Introduced in the 1950’s, FBE possesses a wide range of desirable attributes including
high electrical resistance, low oxygen permeability, excellent adhesion and resistance to
cathodic disbondment (CD), soil stress, penetration and abrasion.
However, limited high temperature performance, modest impact resistance and
flexibility concerns can constrain some applications. Occurrences of blistering have
been observed in the field. Environmental and physical damage (e.g. due to soil
movement, the presence of rocks, or the effects of horizontal directional drilling) to the
coating in service will increase the CP current requirements, but the pipe continues to
be protected by CP where a loss of adhesion occurs. These field observations have led
to the conclusion that the disbondment of FBE coatings does not present an integrity
threat to a pipeline as long as CP is present on the line. No SCC failures have been
reported for FBE coatings in over 40 years of experience.
Three-layer coatings provide excellent pipeline protection for small and large diameter
pipelines with moderate operating temperatures. Some of the benefits of multi-layer
coatings include the long term corrosion protection of FBE which, as mentioned
previously, provides excellent adhesion to steel and protection of pipelines operating at
moderate temperatures.

NOVA Chemicals Research & Technology Centre #DTPH56-06-BAA-001
Effect of Surface Preparation on Residual Stresses in Multi-layer Coatings
- 16 -
An added advantage of three-layer systems is the enhanced mechanical protection
provided by the tough outer layer of polyethylene which protects pipelines during
transportation and installation, thereby reducing costly repairs while also providing
added in-ground protection against shear forces, chemicals and abrasive soil conditions
that FBE-only systems can be susceptible [2-4]. By increasing the thickness of the
polyethylene outer layer, multi-layer systems can provide a high level of mechanical
protection across many diverse environments without requiring the use of costly select
backfill. Currently, less than 15% of all pipeline coatings in North America consist of
three-layer coatings. However, interest in multi-layer coatings is increasing as high
performance coatings increases pipeline integrity and safety.
A typical three-layer coating comprises an inner layer of FBE, an inner adhesive or tie
layer, and a low to high density polyethylene outer layer, thereby combining the
advantages of epoxies and extruded polyethylene. The FBE coating is recognized for
its excellent chemical resistance, good adhesion and interfacial properties. The
polyethylene outer layer provides enhanced mechanical protection.
4.0 MULTI-LAYER COATINGS - GENERAL
Multi-layer coatings offer a means of countering the weakness of single layer coatings
by combining materials in such a way to create a broader base of advantageous
characteristics.

NOVA Chemicals Research & Technology Centre #DTPH56-06-BAA-001
Effect of Surface Preparation on Residual Stresses in Multi-layer Coatings
- 17 -
It is based on two principles which are: (i) optimization by combining favourable
properties of different coating materials, and (ii) functional separation of performance
such as corrosion protection and protection against mechanical damage.
Three layer side extruded coatings were originally developed in 1980's in Europe. The
first coating of this kind did not use epoxy primer, they were designed usually as two
layer systems and were susceptible to a phenomenon known as cathodic disbondment,
causing runaway disbondment of the coating from the steel surface in the presence of
holiday under cathodic protection conditions. This problem was corrected with the
addition of an epoxy primer layer [5].
4.1 Steel Pipe Surface
The steel pipe surface must be prepared to near-white metal condition, or better, by
using steel shot and steel grit, or a mixture of shot and grit. The preferred anchor
pattern depth should not exceed 60 micrometers, but occasionally can be as deep as
100 micrometers, if it is compensated by higher FBE thickness.
4.2 Chemical Surface Treatment
Some pipeline owners specify use of chromate or phosphoric acid or combination of
both, phosphoric acid and chromate rinse, after the abrasive steel blasting.

NOVA Chemicals Research & Technology Centre #DTPH56-06-BAA-001
Effect of Surface Preparation on Residual Stresses in Multi-layer Coatings
- 18 -
It is generally recognized that chromate treatments only benefit short term coating
performance and do not improve long term coating performance. Phosphoric acid
treatment improves long term coating performance by removing salt contamination and
mildly etching the surface [6]. The benefits of using chemical surface treatment are well
known in improving final properties of the product, but they can be categorized in two
distinctive groups: (i) a physical benefit due to rinsing with liquid and therefore removing
steel dust from the surface and (ii) a chemical benefit due to formation of crystalline
network of phosphate or chromate on the surface, which activates the surface
chemically and improves adhesion. The chemical benefit is especially visible in the wet
testing, such as cathodic disbondment or hot water soak. The chemical surface
treatment for multi-layer systems such as HPCC are similar to those used for FBE
systems since the first layer applied to the pipe in HPCC is FBE.
4.3 Multi-Layer Components
Three layer pipeline coatings utilize a layer of FBE, a polyolefin outer layer and an
adhesive tie layer. An initial layer of FBE is selected because of its excellent adhesion
to steel and its cathodic disbondment resistance. This is achieved because of the
strong polar molecular structure, which is also responsible for its high moisture
absorption. FBE thickness selection and application temperature, including pipe pre-
heat temperature, is the most important part of the successful three layer polyethylene
final product.

NOVA Chemicals Research & Technology Centre #DTPH56-06-BAA-001
Effect of Surface Preparation on Residual Stresses in Multi-layer Coatings
- 19 -
Over last several years adhesive technology has developed and advanced from the
early days of hot melt adhesives, based on ethylene-vinyl acetate (EVA), ethylene-
acrylic acid (EAA) and ethylene-ethyl acrylate (EEA) through terpolymers to grafted
polyethylenes. In most countries grafted polyethylenes are the widest used adhesives
for the three layer coatings, as they provide the best overall properties for these
systems. Adhesives needed for three layer coating systems are usually co-polymers of
grafted polyethylene with active maleic anhydride or similar groups and are well known
in most countries. Adhesives fulfill a dual purpose.
Firstly, adhesives bond chemically to the uncured groups in the epoxy powder and,
providing that the FBE is not cured at the moment of contact with the adhesive, form a
strong bond, which cannot be separated under a normal peel test. Secondly, the
adhesive bonds physically to the outer polyethylene jacket by forming a chain
entanglement between adhesive layer and polyethylene layer. There is a strong
chemical affinity between the adhesive and polyethylene, i.e. over 95% of the adhesive
consists of polyethylene, therefore the two layers bond together physically very well,
especially in the molten state. Adhesive can be applied either by extrusion or by spray
(in the powder form). Both systems differ dramatically in the property called melt flow
index, which is a measure of viscosity of polyethylene, or, in other words, is a reflection
of the polyethylene chains molecular mass.
The polyethylene layer is applied by side extrusion for large diameter pipe and by
crosshead extrusion for smaller diameter pipes.

NOVA Chemicals Research & Technology Centre #DTPH56-06-BAA-001
Effect of Surface Preparation on Residual Stresses in Multi-layer Coatings
- 20 -
The polyethylene extruded on top of the adhesive can belong to several groups of
density, molecular weight distribution and linearity. In the past, low density polyethylene
was used extensively. Over the years, however, with new and improved polyethylene
manufacturing processes, polyethylene density increased from approximately 0.925 to
0.945, as per ASTM D792, commonly used now. The respective merits of these two
types of polyethylene are subject of many arguments. However, there is strong
evidence that higher density polyethylene with narrower molecular weight distributions
provide a much tougher coating with less mechanical damage, than its low density
counterpart. There is a notable trend in the industry to switch to higher density
polyethylene over last few years. Typically, however, there is a limit of density not
exceeding 0.95, as above this value, polyethylene is more prone to environmental
stress cracking.
The problem with extrusion on large diameter pipes with raised spiral or longitudinal
welds is poor coverage of the welds especially where the profile is pronounced. There
is a tendency to form voids at the weld neck area which produces pinholes and entraps
water during the cooling stage. Rollers have been used to compress the molten
polyethylene around the weld seam with some success in longitudinal welds. There is
also a reduction of coating thickness at the top of the weld, which results in increased
material usage to achieve the minimum required coating thickness. An advantage of
using powder coatings is that they avoid these problems.
NOVA Chemicals Research & Technology Centre #DTPH56-06-BAA-001
Effect of Surface Preparation on Residual Stresses in Multi-layer Coatings
- 21 -
4.4 Multi-Layer Coating Standards
The three layer coatings are described in several national standards. The oldest and still
most widely used is the German Standard DIN 30670. The French standard NFA 49-
710 is also used to a lesser extent. The Canadian Standard CSA Z245.21 is gaining
international acceptance over last few years, since it was first published in the early
1990’s. There are significant differences between these national standards, not only in
the properties, quality control, process or testing but also in the underlying philosophy of
the respective standards. The biggest weakness of the DIN Standard is that it does not
require the coating applicator to use an epoxy primer, it does not require cathodic
disbondment testing and the specified peel adhesion value is set very low. The French
NF Standard addresses many of the weaknesses of the DIN Standard and delves into a
much higher level of detail in specifying the material selection and performance
criteria [7].
The Canadian CSA Standard recommends that the polyethylene layer be two to three
times thinner than specified in the DIN Standard. The rationale behind it is related to
the fact that the Canadian Standard specifies HDPE, which is much more durable, than
low density polyethylene (LDPE), used typically in Germany. Despite the lower coating
thickness (1.5 mm CSA versus 3mm DIN), the resultant impact and damage resistances
of both coatings are similar. In addition to these standards, there are many new three
layer polyethylene standards being developed including the European EN standard,
international ISO and American ASTM.

NOVA Chemicals Research & Technology Centre #DTPH56-06-BAA-001
Effect of Surface Preparation on Residual Stresses in Multi-layer Coatings
- 22 -
5.0 HIGH PERFORMANCE COMPOSITE COATING
High Performance Composite Coating (HPCC) was the multi-layer coating used for the
majority of the research presented in this report. HPCC is considered an advanced
composite system that represents the latest development in anti-corrosion systems.
The product consists of fusion bonded epoxy, polyolefin adhesive and tough a
polyethylene layer for a total coating thickness of approximately 0.8 to 1 mm. HPCC is
designed to protect buried oil and gas pipelines in environments where mechanical
protection, moisture and corrosion resistance and high operating performance
characteristics are required.
Specifically, HPCC is a powder-coated, multi-component coating consisting of a FBE
layer, a medium density polyethylene outer layer and a tie layer containing a chemically
modified polyethylene adhesive. The tie layer is a blend of adhesive and FBE. This
blend produces a physical interlocking of the components with no defined interface and
single layer coating behaviour. The adhesive and polyethylene are similar to each other
and intermingle easily to disperse any interface [8].
The composite coating components are applied in powder form using electrostatic
powder coating techniques. The process provides versatility in customizing the
thickness of the components of the coating system, as well as produces the composite
system as described previously. A quenching process is used, minimizing the formation
of voids and internal stresses.
NOVA Chemicals Research & Technology Centre #DTPH56-06-BAA-001
Effect of Surface Preparation on Residual Stresses in Multi-layer Coatings
- 23 -
The external polyethylene component of the composite coating does not exhibit the
frozen-in-stresses that are typically seen in three layer systems. In three layer systems,
the polyethylene layer is extruded and then wrapped over the pipe. This extrusion and
stretching process can induce very high elongational stresses in the top layer that then
become frozen in when the material is quenched. During storage and in service, these
stresses can then act to produce shrinkage at the cutback area and can even result in
disbondment at the FBE-steel interface. The polyethylene powder application in the
Composite Coating does not involve any directional forces on the polyethylene material
that would result in built-in stresses. There is no evidence that the composite coating
suffers from the same disbondment failures as three layer systems that are becoming
more widely used.
5.1 HPCC Composition
The thickness of the FBE component in HPCC has ranged from 100 µm to 400 µm.
The FBE layer can be viewed partly as a corrosion coating and partly as an adhesion
layer for the coating to steel interface. As an adhesion layer, thicknesses in the range
of 50-72 µm have been used [3]. However, for a corrosion coating, the minimum
thickness of 125 µm is recommended [8]. Optimization studies [9] have shown that a
FBE primer thickness of 175 µm is a good base for corrosion resistance when used in
conjunction with the powder polyolefin adhesive and polyethylene topcoat. Greater
thicknesses of epoxy, above 250 µm, have been used in three layer coatings on some
critical areas especially offshore pipelines.
NOVA Chemicals Research & Technology Centre #DTPH56-06-BAA-001
Effect of Surface Preparation on Residual Stresses in Multi-layer Coatings
- 24 -
Higher epoxy thickness increases the corrosion performance but this has to be
balanced with increasing cost. The powdered adhesive component is used strictly as a
functional “tie-layer” between the epoxy and the topcoat, and only a small amount of
material is necessary to obtain good chemical bonding and melt blending of the
components to form a composite material. Typically about 125-150 µm is used for the
powder adhesive tailored for this technology.
The polyethylene layer thickness is selected to withstand environmental conditions,
especially impact during transportation and installation of pipe. Typical thicknesses can
range from 500 µm to several millimeters. The polyethylene top layer serves several
different functions: chemical and moisture barrier, mechanical protection and weather
resistance.
Polyethylene thickness plays a role in overall corrosion performance of the coating; with
slightly better cathodic disbondment performance with increasing thickness. However,
at thicknesses above 1 mm, there is an increase in cathodic disbondment performance
but it does not appear to be substantial as in the case of FBE [8]. The tendency has
been to use thicknesses of up to 3 mm of LDPE, based on the supposition of fairly
severe transportation and construction scenarios. However, recommendations are for
lower thickness especially with medium and high density polyethylene, which have
better impact resistance. Typical impact strength requirements for three-layer
polyethylene are in the range of 5-7 J/mm [10].

NOVA Chemicals Research & Technology Centre #DTPH56-06-BAA-001
Effect of Surface Preparation on Residual Stresses in Multi-layer Coatings
- 25 -
6.0 GENERAL COATING DISBONDMENT MECHANISM
In the presence of a coating defect in a three-layer system, the controlling factors in the
disbondment mechanism resemble those of FBE coatings, namely the generation and
transport of hydroxyl ions to the disbonding front in parallel with the transport of cations.
The main reason for differences in the disbondment mechanism of FBE and three-layer
coatings pertains to the shielding of CP by the outer polyethylene layer in the three-
layer coatings. Consequently, cathodic reactions that produce hydroxyl ions and
increase the disbondment pH are limited and mostly restricted to the holiday site.
Widely accepted theory based on the increase in pH at the site of the holiday as a result
of cathodic reactions is presented in the following mechanism [11]:
2 H+ + 2 e- H2 (1)
H2O + ½ O2 + 2 e- 2 OH- (2)
Fe2O3 + 3 H2O + 2 e- 2 Fe(OH)2 + 2 OH- (3)
H2O + e- ½ H2 + OH- (4)
Reduction of hydrogen ions (Equation 1) quickly increases the pH and as the pH rises,
the concentration of H+ declines and the reaction becomes unfavorable. Equation 2
increases the pH through the reduction of oxygen from the solution. Intermediate
species, such as peroxides, superoxides or hydroxyl radicals, have been suggested as
possible agents of coating disbondment as well [6].

NOVA Chemicals Research & Technology Centre #DTPH56-06-BAA-001
Effect of Surface Preparation on Residual Stresses in Multi-layer Coatings
- 26 -
These species may form due to the increase in solution pH. The reduction of ferric
oxide on the steel surface to form ferrous hydroxide according to Equation 3 can result
in a high pH environment in the crevice area surrounding the holiday. Finally, water
itself may be reduced and raise the local pH, as shown in Equation 4.
If FBE disbondment is predominantly controlled by the presence of hydroxyl ions in
conjunction with an applied potential, it would appear that the disbondment area of
three-layer coatings is most likely of limited size. A maximum disbondment radius of
approximately 25-35 mm has been suggested by laboratory data [12]. A small
disbondment would reduce the threat of SCC, since the crack length would not be able
to grow sufficiently to result in fracture.
The European experience on the other hand has indicated large areas of disbondment
for three-layer coatings [13]. Much of this disbondment was attributed to poor coating
application. Aging of the coating, influenced by temperature, water, and/or oxygen can
result in or enhance coating disbondment. However, in-service aging was found to
have minimal effects on water and oxygen permeation in coating permeation tests.

NOVA Chemicals Research & Technology Centre #DTPH56-06-BAA-001
Effect of Surface Preparation on Residual Stresses in Multi-layer Coatings
- 27 -
7.0 PREPARATION OF HPCC SAMPLES
7.1 Test Matrix
Various physical coating properties, listed in Table 1, were measured through
performing several standard and non-standard tests to help understand coating
performance and relate mechanical properties to measured residual stress and
disbondment data. Adhesion, impact, flexibility and cathodic disbondment (CD) tests
were performed to provide insight into the propensity of coating disbondment as a
function of pipe surface roughness and simulated service conditions. CD tests were
only completed as single experiments and not replicated, therefore resultant trends or
correlations are extrapolated from a small data set and future experimental replications
are recommended to confirm the results and conclusions reported herein.
For the purpose of this study several pipeline coating samples with a three-layer
composite coating, HPCC, provided by ShawCor Ltd. were used. Specifics on the
preparation of the pipe surface and pipe coating samples are provided below:
i. A three-layer coating produced by an electrostatic powder coating process for all
three layers. The manufacturing process results in diffuse interlayer boundaries,
minimal voids and, likely, no or low residual stresses with a total coating
thickness of 0.8-1.0 mm.

NOVA Chemicals Research & Technology Centre #DTPH56-06-BAA-001
Effect of Surface Preparation on Residual Stresses in Multi-layer Coatings
- 28 -
ii. Various surface preparation treatments are considered, with a focus of the
effects of these treatments on the surface profile and residual stresses on the
steel surface. Different blast media (1 low profile and 1 high profile) were used to
produce different surface profiles and to impart different levels of compressive
stresses to the steel. These stresses are desirable for preventing the initiation of
SCC should a supportive environment develop on the pipe at a coating defect.
Following preparation of the samples, the coated samples were subjected to simulated
service conditions in order to "age" or deteriorate the samples. This investigation
considered different service stresses and different exposure conditions:
i. Service stresses may consist of shear forces as a result of soil movement or
impact damage during installation or excavation. High shear stresses are also
experienced during horizontal directional drilling activities. Recent work on an
impacted three-layer coating showed that the impact damage may extend
beyond the actual impact site, thereby increasing the coating disbondment [14].
These service stresses are simulated by standard impact tests.
ii. Coating permeation is increased by high temperature exposure to wet
environments, and generally has a negative effect on coating disbondment [15].

NOVA Chemicals Research & Technology Centre #DTPH56-06-BAA-001
Effect of Surface Preparation on Residual Stresses in Multi-layer Coatings
- 29 -
7.2 Application Process
The application process for the composite coating consists of similar steps as required
for FBE coating. The steel pipe is prepared by pre-warming in a hot water rinse,
followed by abrasive blasting to achieve a near white metal finish and a specified
anchor pattern. The pipe is then inspected for defects such as slivers, which can be
removed by grinding. Phosphoric acid washing and deionized water rinsing is carried
out followed by induction heating to the recommended powder application temperature.
The three components are applied sequentially to the hot pipe in the same powder
booth. After fusing and curing is completed, the pipe is cooled using both internal and
external water quench. Finally, the coating is inspected, marked for identification, and
tested for quality conformances.
7.3 Characterization of Surface Profiles Prior to Coating
Four Grade 483 Cat II pipe samples were prepared for coating with HPCC. Two
samples were prepared with a standard blast profile using 100% GB25 grit. One was
aged for a period of 1-year to study the effect of aging on HPCC. A sample was made
with increased blast profile which was achieved by grit blasting with panabrasive GB18
grit. Finally, a low blast profile sample was prepared by subjecting the sample to half
the blasting time and with reduced amperage (which is a measure of the amount of grit
fed to the blasting units during profiling) as compared to the standard blasting procedure
used with GB25.

NOVA Chemicals Research & Technology Centre #DTPH56-06-BAA-001
Effect of Surface Preparation on Residual Stresses in Multi-layer Coatings
- 30 -
The preparation of the low profile blasted sample to create a smoother pipe surface
required several iterations before a surface roughness with a similar change in
magnitude from the standard blast surface (as completed on the increased blast profile
sample) could be achieved. The resultant surface roughness for each sample
measured by laser profilometry is presented in Table 2. The surface roughness is
reported in Rz and Peak Count. Rz refers to the average “peak to valley depth” or
profile depth of the measured sample while peak count refers to the number of peaks
per cm. The reported values represent an average of 4 measurements recorded in the
sample region of the joint. ShawCor Ltd. was able to successfully create a significant
difference in sample surface roughness when comparing the reduced profile to the
increased profile pipe samples.
7.4 Characterization of Coating Properties
The HPCC coated pipe samples consisted of four joints of pipe prepared by ShawCor
Ltd. Each joint was approximately 10 feet long. Each sample underwent a slightly
different manufacturing condition. One sample was made with the standard blast
profile, one with a low blast profile, and one with a high blast profile. The fourth sample
had the standard HPCC blast profile but was manufactured and stored outdoors in
Camrose, Alberta for approximately 1 year.

NOVA Chemicals Research & Technology Centre #DTPH56-06-BAA-001
Effect of Surface Preparation on Residual Stresses in Multi-layer Coatings
- 31 -
With these four different HPCC coating variations selected standard and non-standard
tests were chosen to understand coating performance. The data provided from these
tests were then used to understand if the magnitude of residual stress has an impact on
HPCC coating performance.
In addition, standard and 1 year aged polymer samples were collected to understand
the commercial polymer properties of plant applied HPCC. This data was compared to
lab made HPCC to understand if any key coating property differences existed. These
samples were also collected to analyze polymer property differences in commercial
HPCC as a result of aging. In addition, 4 PE only samples prepared at different cooling
rates were created in such a way to ensure that the cooling rate used for commercial
polymer samples would fall within the PE sample range. This data was used to
understand if the cooling rate of the coating was optimized to maximize the physical
properties of the coating. Lastly, a free film FBE sample, with the same thickness as
the commercial HPCC coating, was prepared to understand the performance
contribution of this layer.
All four HPCC samples were sub-sectioned into appropriately sized test samples. All
four pipe coated joints were cut into several 12” by 12” curved plate sub samples for
standard test methods including cathodic disbondment tests. The sample plates were
tested for holidays with a Tinker and Rasor Holiday detector set at 3400 V.

NOVA Chemicals Research & Technology Centre #DTPH56-06-BAA-001
Effect of Surface Preparation on Residual Stresses in Multi-layer Coatings
- 32 -
The specific samples tested were as follows:
1. Polymer sample from a standard HPCC coated on a 30" diameter pipe.
2. Polymer sample from a standard HPCC coated on a 36" diameter pipe. This
pipe was coated with the HPCC coating 1 year before testing.
3. Lab made glass molded free film HPCC plaque sample.
4. PE compression molded sample (cooled 15°C/min).
5. PE compression molded sample that was air cooled under pressure. This was
achieved by molding normally with heat and pressure on the heating cycle but
turning the heating off during the cooling cycle (no forced convection cooling,
~1°C/min). The sample was then removed once the system was cooled to room
temperature.
6. PE compression molded sample with a cooling rate of 30°C/min. This is
achieved by molding with heat and hydraulic pressure normally during the
heating cycle but using electrical controllers to control the cooling system to
deliver the set cooling rate. The sample is complete once the system cools to
room temperature.
7. PE compression molded sample was heated normally but cooled by submerging
the sample in cold water. This is achieved by molding with heat and hydraulic
pressure normally during the heating cycle then the sample is removed from the
compression molder and subsequently submerged in water. The sample is
complete once the system cools to room temperature.

NOVA Chemicals Research & Technology Centre #DTPH56-06-BAA-001
Effect of Surface Preparation on Residual Stresses in Multi-layer Coatings
- 33 -
8. Lab made glass molded FBE sample. FBE powder is poured into a mold with a
glass bottom. The glass-powder-mold assembly is heated to properly cure the
FBE. The system is allowed to cool to room temperature using natural
convection.
All PE samples were made with the same proprietary grade of PE pipe coating resin.
All of the above listed samples were tested for density, melt index (MI), tensile, and
differential scanning calorimetry (DSC). The descriptions of these tests are described
below:
a) Density of all polymer samples was measured using a density column.
Measurements are made by introducing a linear liquid density gradient inside a
graduated glass cylinder. The density gradient is obtained by using a set of
calibrated marker floats whose densities span the desired density range in equal
intervals. Samples are placed in the column and sink until they reach a liquid
level that matches their own density. The cylinder is graduated so the final
position of the sample can be determined. The air temperature around the
vessel must be maintained at 23°C to prevent the gradient from being affected by
thermal convection. The testing conduct for this report was completed according
to ASTM standard D1505-68.
b) Melt index is a rheometric test performed on some plastics in which a measured
amount of resin is melted and pushed through a defined orifice (0.0825”) with a
defined mass (2160g).

NOVA Chemicals Research & Technology Centre #DTPH56-06-BAA-001
Effect of Surface Preparation on Residual Stresses in Multi-layer Coatings
- 34 -
The amount of resin that is pushed through the orifice in a 10 minute period is
defined as the melt index. This test gives a general indication of a resins
molecular weight. A higher melt index means that a larger amount of material
has passed through the orifice. This usually indicates a polymer with lower
molecular weight. A lower melt index usually indicates higher molecular weight
polymer. MI results in this report for all resins used were tested to ASTM
standard D2839.
c) Tensile testing was conducted using ASTM standard D638 and a type IV dog
bone as depicted in Figure 1. The tensile tests involved mounting of a dog bone
sample into a hydraulic tensile testing machine that is able to fasten or grip both
ends of the dog bone. The machine then applied a tensile load by separating at
a constant velocity. Load cells in the tensile testing machine are then able to
output load versus displacement data, which are then converted to a stress
versus strain output.
d) DSC was used to measure the percent crystallinity and melting points of all
polymer samples. DSC is a thermoanalytical technique in which the difference in
the amount of heat required to increase the temperature of a sample and a
reference are measured as a function of temperature [16]. The main application
of DSC is in studying phase transitions, such as melting or exothermic
decompositions. These transitions involve energy changes or heat capacity
changes that can be detected by DSC with great sensitivity.

NOVA Chemicals Research & Technology Centre #DTPH56-06-BAA-001
Effect of Surface Preparation on Residual Stresses in Multi-layer Coatings
- 35 -
As the coating sample undergoes an exothermic process like crystallization less
heat is required to raise the sample temperature. By observing the difference in
heat flow between the coating samples, a difference in material crystallinity can
be determined.
MI, density and tensile data can be found in Table 3. The DSC data has been tabulated
and presented in Figures 2-9.
8.0 RESULTS AND DISCUSSION
8.1 Discussion of Coating Physical Properties
The direct measurement of HPCC mechanical properties was not a trivial task. The
difficulty with these measurements is that the thermoplastic and thermosetting
microstructures of the material, and therefore mechanical properties, are defined by
their molecular architectures (density, molecular weight, molecular weight distribution,
co-monomer incorporation, etc.) and their heat histories.
The heat history of thermoplastic or thermoset will be affected by the specific heat
transfer conditions present during the solidification of the thermoplastic or thermoset. In
the case of coating a metal pipe with HPCC, the molten layers of PE, PE tie layer, and
FBE on the outer surface of the pipe, cool under very specific conditions.

NOVA Chemicals Research & Technology Centre #DTPH56-06-BAA-001
Effect of Surface Preparation on Residual Stresses in Multi-layer Coatings
- 36 -
The molten layers release their heat to both the inside of the pipe (through the pipe wall)
and to the air surrounding the external surface of the pipe. In addition, the commercial
process of applying HPCC uses a water misting/deluging method to cool the coating
more rapidly. Once the molten layers are solidified the microstructure of the various
layers are set and define the coatings mechanical properties. Direct measurement of
the mechanical properties of these solidified layers is essentially impossible because
the coating is strongly bonded to the metal pipe surface and removal of the coating
cannot be achieved without causing mechanical damage.
An attempt to infer the mechanical properties of HPCC using specific mechanical testing
was completed. These tests were completed on various samples of HPCC, PE and
FBE polymer to better understand the physical properties of these components.
Through analysis of the data collected, the HPCC microstructure was inferred and
therefore the mechanical properties. Six samples were tested to understand the
mechanical properties of HPCC. Two samples were lab made FBE and HPCC. These
samples were made by melting either all three HPCC components or just FBE alone
into a thin film on a heated glass substrate. Due to the poor adhesion of glass with
plastic films, the coatings are easily removed and tested mechanically.
In addition to these samples, four PE samples using a compression molding machine
and different molding conditions were prepared. Specific molding conditions were
chosen to provide various cooling rates that span the range of commercial HPCC
coating cooling rates.

NOVA Chemicals Research & Technology Centre #DTPH56-06-BAA-001
Effect of Surface Preparation on Residual Stresses in Multi-layer Coatings
- 37 -
Compression molding is a process of applying heat and pressure to force polymer
material to conform to the geometry of a mold. The cooling cycle is adjusted manually
through a variety of methods. In the case of the samples tested, a rectangular 12” x
12” shaped mold of desired film thickness was used. Lab samples with an average
HPCC coating with FBE at a thickness of 0.23 mm, PE tie layer at 0.15 mm and 0.51
mm of PE were used. The PE, FBE and HPCC samples were 0.51 mm, 0.23 mm, and
0.89 mm thick, respectively.
The tensile testing results are summarized in Table 3. A correlation between density
and cooling rate is observed for the PE only samples. As the cooling rate of the
molding is increased the density of the polymer is decreased. An explanation for this
observation is that polymeric materials are comprised of long carbon chains that
crystallize and pack together through a chain folding mechanism during solidification.
During this solidification process, due to steric hindrance, the PE requires a longer time
for the molecules to re-order themselves compared to other materials such as metals.
The shorter the cooling period during solidification, in turn, results in less time that is
available for the molecules to tightly pack, therefore, resulting in lower density polymer
material.
Related to the cooling effect is the tensile yield strength of the PE samples. It is also
observed in Table 3. As the density of the PE sample increases so does the yield
strength of the material. Some interesting observations can be made by comparing
these results to the lab made HPCC and FBE samples.

NOVA Chemicals Research & Technology Centre #DTPH56-06-BAA-001
Effect of Surface Preparation on Residual Stresses in Multi-layer Coatings
- 38 -
First, the overall tensile yield strength of the HPCC matches very closely to that of the
air cooled PE sample. This is not surprising as the lab made HPCC was also air cooled
during the molding process. Hence, both of these samples would have had slow
cooling rates resulting in maximum yield strength. Secondly, both the air cooled PE and
the HPCC samples have very similar yield strengths implying that the majority of the
HPCC strength is derived from the PE layer and not the higher yield strength FBE
material.
The elongation at yield of the HPCC, FBE and PE samples show some interesting
differences. All of the PE samples have elongation at yield values in the 10-12% range
depending on the cooling rate experienced by the sample. In general, the higher the
cooling rate, the higher the elongation at yield. When referring to the lab made HPCC
and FBE samples, their elongation at yield are surprisingly similar to each other. This
would imply that the FBE component of the HPCC structure actually increases the
stiffness but decreases ductility in the HPCC coating. This implication is supported by
the measured ultimate elongation of all the samples. The PE samples are in the 936-
1003% range compared to the 2% values measured for both the HPCC and FBE. The
low values of ductility observed in the HPCC and FBE are likely a result of the FBE
being a thermoset material. This material uses heat to increase the number of covalent
bonds between molecules creating a ridged network of bonds that do not allow for a
great deal deformation. When the stress/strain of these materials exceeds their limits,
large amounts of the covalent bonds are torn apart causing a brittle catastrophic failure.

NOVA Chemicals Research & Technology Centre #DTPH56-06-BAA-001
Effect of Surface Preparation on Residual Stresses in Multi-layer Coatings
- 39 -
The chemical nature of the material does not allow for these bonds to be repaired
through a second heating cycle.
DSC data for the lab prepared HPCC and FBE, the 4 PE samples and the two
commercially prepared HPCC coatings can be found in Figures 2-9. The two
commercially prepared HPCC samples were extracted from the ShawCor Ltd. plant
applied HPCC coated pipes. The first sample was prepared from a recently coated 30”
diameter pipe, while the second sample was taken from a one year old coated 36”
diameter pipe. The DSC results for the PE samples in Figures 2-9, show that as the
cooling rate of the samples is increased the percent crystallinity and enthalpy both
decrease. This correlation is again, a result of the time needed for crystallization to
occur during solidification. The faster the cooling rate, the less time that is available for
large dense crystals to form. As a result, there is less energy stored in the material
which will result in a lower enthalpy release when the material is re-melted during DSC.
When comparing the DSC values of the commercial HPCC samples, taken from the 30”
and 36” diameter pipes, to the four PE samples, the crystallinity and enthalpy values of
the 30°C/min cooled PE sample aligns well with the commercial coatings. Meaning
that, the commercially applied PE coating in the HPCC material is cooled relatively
slowly. For this reason we can infer that these commercially applied HPCC coatings
would likely have good overall strength. We can also infer good mechanical properties
of the commercially applied HPCC based on the effect of cooling rate on tensile
properties previously discussed in Table 3.

NOVA Chemicals Research & Technology Centre #DTPH56-06-BAA-001
Effect of Surface Preparation on Residual Stresses in Multi-layer Coatings
- 40 -
The same correlation is not apparent for the lab made glass cooled HPCC sample. The
DSC numbers for this sample are difficult to decipher as the crystallinity numbers are
very low despite having good tensile strength. Further work with these lab made HPCC
samples must be conducted in order to ensure that they are truly a good representation
of the commercial product from a microstructure/mechanical property perspective.
Finally, the DSC results for the FBE material shows that re-heating the material does
not cause the FBE to melt but rather go through a softening phenomenon known as the
glass transition temperature. This data establishes the point that FBE is a thermoset
material which explains its lower ductility performance as compared to PE but
appropriate for the purpose as a pipeline coating.
The melt index results summarized in Table 3 reveals that the PE material used was of
a high melt index with a value close to 5. This is an appropriate value for a material to
flow and melt sufficiently during the application phase of the coating, which would
eliminate porosity and assist with adhesion to the tie layer.
8.2 Cathodic Disbondment Experimental Setup
Thirteen plates of each pipe coating variant, without holidays, were selected for various
cathodic disbondment tests. The schedule for 3, 6 and 12 month tests for each coating
sample is summarized in Table 4. Each plate was prepared with a 1/8” hole drilled for
the cathodic connection to the test circuit.

NOVA Chemicals Research & Technology Centre #DTPH56-06-BAA-001
Effect of Surface Preparation on Residual Stresses in Multi-layer Coatings
- 41 -
The surface of the plate was then cleaned and a cylindrical acrylic test cell was
centered on the holiday and adhered to the plate with silicon sealant. The cell diameter
used was 15 cm to ensure that the size of a resultant disbondment would not be limited;
hence the maximum disbondment radii possible for these tests were 7.5 cm. The
coating area exposed to the water saturated commercially available screened/washed
all purpose sand was ~170 cm2. Based on work completed by Payer on the effect of
sand on coating disbondment [15], approximately 300 cm3 of sterilized sand was added
to the cell and spread out evenly. Deionized water was then added to fully saturate the
sand and was periodically added throughout the duration of the tests to maintain
saturation. The cells were covered with a Plexiglas® lid and left exposed to the
atmosphere.
A graphite rod was used as the counter electrode as specified in Clause 10.8 of CSA
Z245.20-06 / Z245.21-06 [10]. Pictures of the cathodic disbondment cells during setup
are found in Figures 10-13b. The applied cathodic potential was controlled using a
variable resistor and a power supply. The testing involved the use of a Keithley data
acquisition (DAQ) unit connected to a variable resistor board, which set the potential for
each cell. Current measurements were performed by measuring the potential across
small 12-ohm resistors that were placed in the circuit between the counter electrode and
the sample. The applied potential was periodically checked with a reference electrode
and adjusted throughout the test. The potential for each cell was set to -3.0 V using a
standard calomel electrode (SCE).

NOVA Chemicals Research & Technology Centre #DTPH56-06-BAA-001
Effect of Surface Preparation on Residual Stresses in Multi-layer Coatings
- 42 -
The variable resistor boards are powered by a 15 V power supply. Figures 14a and 14b
show the experimental and electrical setup used for the cathodic disbondment tests.
Some of the coating samples were also subjected to a pretreatment process that was
designed to qualitatively simulate field service. The first stage of the pretreatment
process consisted of cooling the coated steel samples to -30o C for 24 hours and then
impacting the coating with a 15.8 mm diameter ball according to Clause 12.12 in CSA
Z245.20-06 / Z245.21-06 [10] at an energy of 3 Joules. This energy is sufficient to
simulate rock damage but not sufficient to cause a holiday. The samples were
examined for defects using a Tinker and Rasor Holiday Detector at a high setting of
3400 V. These samples were then placed in a hot water bath at a temperature of 60o C,
to simulate high operating temperature, for a period of 60 days, Figures 15a-b.
8.2.1 Discussion of Cathodic Disbondment Tests
Current measurements acquired during these experiments are summarized in Figures
16-23. The greatest average current was generally measured for the 1 year old HPCC
coating as observed in Figures 16 and 20-23 and generally the lowest average currents
were measured for the low profile coating sample, Figures 20-23.
Upon test completion, the saturated sand was removed from the cells and photographs
were taken and are provided in Table 5. The disbondment area was measured as per
Clause 12.13 in CSA Z245.20-06 [10].

NOVA Chemicals Research & Technology Centre #DTPH56-06-BAA-001
Effect of Surface Preparation on Residual Stresses in Multi-layer Coatings
- 43 -
Using a utility knife, radial cuts were made through the coating and the coating was
chipped off between the radial cuts. There was a clear difference between the
disbonded area in which the coating was removed easily and the edge of the
disbondment, where the resistance to chipping became extremely high. The disbonded
distance from the original holiday center along each cut was measured and these
values were averaged. The resultant cathodic disbondment data is presented in
Figures 24-31.
Each data point is reflective of only one experiment i.e. no repeat tests were carried out
and therefore the authors believe that further testing should be performed to confirm the
trends and correlations observed. In addition, the authors have observed wide ranges
of uncertainty in controlled experiments with replicate tests in previous testing (at least ±
20% for a given repeated CD disbondment result). Despite this, the project team
attempted to maximize the test matrix to cover as many combinations as possible in the
course of the present study and as a result subtle differences between sample
performances may be difficult to discern.
When comparing Figures 24-27, the samples that underwent no pre-treatment prior to
cathodic disbondment testing led to the lowest disbondment radius for each of the pipe
sample treatments tested, i.e. 1 year old HPCC, “new” HPCC, Low Profile and High
Profile, for 12 months which is echoed by the current measurements made in Figures
16-19.

NOVA Chemicals Research & Technology Centre #DTPH56-06-BAA-001
Effect of Surface Preparation on Residual Stresses in Multi-layer Coatings
- 44 -
The surface treatment which intuitively one would expect to be the most aggressive of
all the scenarios tested, hot soaked + impacted, on average resulted in large
disbondment radii, averaging approximately 50 mm, Figures 24-27, but only the “new”
HPCC sample, as shown in Figure 25, resulted in the greatest disbondment radius for
the impact + hot soak treatment. As for the hot soaked condition, two disbondments
appear to have reached the cell wall, i.e. > 70 mm, Figures 24 and 27. However, the
irregular trend observed in Figure 27 and the irregular disbondment shape, Table 5
(Page 91), could be due to non-uniform surface preparation and therefore should be
replicated.
Figures 28-31 collect each specific surface treatment (i.e. no pre-treatment, hot soak,
impacted and impacted + hot soak) and compare each of the surface sample
preparations tested. On average, the low profile and “new” HPCC prepared surfaces
performed the best, i.e. resulted in the lowest average disbondment radii. Also, the high
blast profile prepared surface samples generally resulted in the largest average
disbondment radius when compared to the standard and low blast samples with the
only exception being in the no pre-treatment case, Figure 28.
When comparing these results to those in literature several insights can be made. First,
it is known that surface cleanliness and roughness are the most important factors
affecting coating adhesion [17]. Previous research by Varacalle et al [18], compared
surface roughness produced by grit blasting steel using different blast abrasives.

NOVA Chemicals Research & Technology Centre #DTPH56-06-BAA-001
Effect of Surface Preparation on Residual Stresses in Multi-layer Coatings
- 45 -
The authors showed that sprayed liquid coatings on substrates roughened with steel grit
(resulting in a rougher surface) exhibited superior bond strength to those prepared with
conventional grit resulting in a smoother surface. The range in Rz measured by the
authors, were in the range of 1.85 to 3.98 mils compared to values of 2.4 to 3.3 mils in
this study, Table 2. In addition, Varacalle et al. [18] recorded peak counts, Pc, which is
an indication of profile peak density, that were in the range of 100-185 peak/cm
compared to a range of 20-22 peak/cm in this study. In both cases, the Rz and Pc
values that were measured in this investigation were lower suggesting that, however
opposite to findings by Varacalle et al, relatively minor changes in surface roughness in
this study may have (recall these tests are based on single sample experiments with no
replicates) influenced the bond strength between the FBE and steel substrate. This is
indicated by the results attained from the CD disbondment tests, Figures 28-31, where
the average disbondment radii are slightly different for the three surface roughness
scenarios tested.
A possible explanation for the effect of surface roughness in this study could be
attributed to the fact that HPCC coating layers are applied as powders which melt upon
contact with the heated pipe. The implication here is that the melted FBE may not
possess the same viscosity as other applied liquid coatings to flow into surface
asperities of the substrate as easily as a liquid coating would (as in the case of a
sprayed coating) which was investigated by Varacalle et al [18]. Since no liquid
coatings were tested in this investigation, future testing should be completed to test this
possibility.

NOVA Chemicals Research & Technology Centre #DTPH56-06-BAA-001
Effect of Surface Preparation on Residual Stresses in Multi-layer Coatings
- 46 -
Coating component viscosity may be responsible for the observation in this investigation
of a less roughened surface leading to reduced coating disbondment as witnessed in
the CD disbondment tests for what intuitively should be the most aggressive condition,
impact + hot soak, Figure 31. A similar result was found with the 28-day hot water soak
(HWS) adhesion test results performed at 75°C summarized in Tables 6 and 6a where
the low blast treated surface possessed a superior average adhesion rating (CSA
Rating: 2) than the high blast profile sample (CSA Ratings: 3). A broader spectrum of
surface roughness values could be completed to determine what the optimum surface
roughness is to achieve maximum FBE/substrate bond strength.
In relation to the issue of aging, the 1-year old HPCC coating generally resulted in the
largest disbondment radius and greatest average measured current regardless of
coating treatment or surface condition tested as seen in Figures 28-31 and Figures 20-
23, respectively. Even in the case of the hot soak condition, Figure 29, the
disbondment radius for the 1 year old HPCC appears to reach the cell limit, ~ 70 mm.
These CD disbondment test results are supported by the 28-day HWS adhesion test
results performed at 75°C summarized in Tables 6 and 6a. It is apparent that on
average the 1-year coating was more easily removed with a CSA rating of 2 (less than
50% of the coating can be removed) as compared to the “new” HPCC coating with
generally a CSA rating of 1 (coating cannot be removed cleanly). However, it is
important to note that a CSA rating of 2 is still considered excellent as far as a new
coating is concerned.

NOVA Chemicals Research & Technology Centre #DTPH56-06-BAA-001
Effect of Surface Preparation on Residual Stresses in Multi-layer Coatings
- 47 -
Overall, these limited results suggest that the age of the HPCC influences the amount of
disbondment. The authors believe further experimental testing into the disbondment
mechanism should be conducted to affirm these findings for HPCC and other multi-layer
coating systems.
Reviewing the current response, Figures 16-23 and disbondment data, Figures 24-31
and comparing these results to previous literature studies several mechanistic points on
the disbondment of HPCC can be claimed. Kamimura and Kishikawa [12] studied the
mechanism of cathodic disbondment of a three-layer coating comprising an inner epoxy
primer, a PE adhesive layer and an outer PE protective layer. The initial cause of
disbondment was believed to be through reduction and dissolution of an interfacial
oxide regardless of the fact that the steel surfaces were grit-blasted prior to coating.
Electrochemical reactions at the disbondment interface were supported by the transport
of O2 and H2O through the coating and Na+ ions and H2O along the substrate-coating
interface. Between the holiday and the perimeter of the disbonding coating, a potential
gradient would exist, i.e., the location at which the disbondment is occurring. The
potential at the holiday is controlled by the potentiostat or constant current device used
to perform the CD test, in the case of this investigation, nominally –3.0 VSCE. The
potential will be less negative further into the crevice formed by the disbonding coating
at the FBE-steel interface because of the iR drop caused by the geometrical restrictions
presented by the disbondment.

NOVA Chemicals Research & Technology Centre #DTPH56-06-BAA-001
Effect of Surface Preparation on Residual Stresses in Multi-layer Coatings
- 48 -
The nature and rate of the cathodic electrochemical processes within the disbonded
region will depend on the potential gradient within the disbondment and the rate of mass
transport into and out of the crevice formed between the FBE and steel surface.
The electrochemical reduction of H2O within the crevice will lead to an increase in pH,
with the increase in the anion concentration balanced by the electrical migration of Na+
ions into the crevice from the bulk solution. Dissolved O2 will not diffuse into the crevice
from the holiday because it is effectively consumed at the holiday itself. However, O2
could diffuse to the disbonded interface through the coating. Water could also be
transported into the disbondment crevice either via the holiday or through the coating
[19]. The reduction of water will occur at a rate that is exponentially dependent on the
potential (-3.0 VSCE in this case) [20]. The transport of water into the crevice could
become rate-limiting, especially if H2 bubbles are generated and trapped under the
disbonded coating.
In this investigation, for all the samples tested the disbondment of the HPCC occurred
at the FBE/steel interface and not between the individual layers themselves. Several
reasons have been previously proposed to account for the disbondment of FBE
coatings, including the reduction of surface oxides, alkaline hydrolysis of the organic
polymer, and the oxidative degradation of the polymer by superoxide and hydroxyl
radicals formed during the reduction of O2 [21, 22]. The epoxy-substrate bonding would
be weakened by the reduction of surface oxides. The polymer would degrade by both
the alkaline hydrolysis and oxidative degradation mechanisms, also seemingly
weakening the epoxy-substrate interfacial bond.
NOVA Chemicals Research & Technology Centre #DTPH56-06-BAA-001
Effect of Surface Preparation on Residual Stresses in Multi-layer Coatings
- 49 -
The alkalinity necessary for hydrolysis could be produced by the electrochemical
reduction of either O2 or H2O. The oxidative degradation mechanism specifically needs
the presence of O2, and would not occur in the field under anaerobic conditions.
A potential gradient will exist away from the holiday under the disbonded coating for
coatings that are shielding. The rate of OH- generation by the reduction of O2 and H2O
will be highest at the holiday and decrease further into the crevice. Therefore, the
region of highest pH will also be at the holiday, decreasing further into the crevice.
Hydroxide ions produced at the holiday will diffuse away though hindered by the
presence of soil or sand, as reported by Payer [23], into the bulk solution and into the
crevice to regions of lower pH. Transport of OH- ions into the crevice can occur by
diffusion and advection, the latter assisted by the enhancement of surface wetting with
increasing pH [22]. The rate of oxide reduction will also diminish with distance into the
crevice as the potential decreases.
O2 will be consumed electrochemically at the holiday and will not diffuse into the crevice
from the holiday, as discussed above. Nonetheless, O2 could diffuse through the
coating and could be electrochemically reduced in the crevice away from the holiday.
With the possible exception of the diffusion of O2 through the coating and reduction
inside the crevice, all of the processes that lead to coating disbondment will occur at
their highest rate at the holiday and diminish in rate further into the crevice.
The aforementioned studies provide mechanistic reasons for disbondment to occur, as
observed in varying levels for the samples tested in this investigation as presented in
Table 5 and Figures 24-31.
NOVA Chemicals Research & Technology Centre #DTPH56-06-BAA-001
Effect of Surface Preparation on Residual Stresses in Multi-layer Coatings
- 50 -
Considering that cathodic disbondment of FBE coatings can be attributed to the
reduction of surface oxides, alkaline hydrolysis of the organic polymer, and the oxidative
degradation of the polymer by superoxide and hydroxyl radicals, one could speculate
that these processes were most prominent for the 1-year old HPCC and those samples
subjected to hot soaking as observed in the disbondment data, Figures 24-31, due to
the degradation of an already reduced FBE/substrate bond as compared to a “new”
HPCC or a no pre-treatment subjected coating.
8.3 Introduction to Residual Stress Measurements
The major focus of the characterization work was on the ability to perform residual
stress measurements and to determine the stress-strain properties of the HPCC
coating. Residual stresses, which are internal and therefore locked-in are contained in
materials that are produced by nearly every mechanical, chemical, and thermal process,
either alone or in combination. As a result, most metallic or metallic oxide coatings are
in a state of internal stress. The stresses in these coatings can be either compressive
or tensile. It is generally recognized that compressive stresses in metallic or metallic
oxide coatings are more favorable than tensile stresses because they increase
resistance to fatigue failure. However, extremely high compressive stresses may cause
either coating separation from the base metal or intracoating spalling. If a tensile stress
leads to strain that exceeds the elastic limit of the coating, then it will cause cracking in
the coating perpendicular to the direction of the stress.
NOVA Chemicals Research & Technology Centre #DTPH56-06-BAA-001
Effect of Surface Preparation on Residual Stresses in Multi-layer Coatings
- 51 -
Conversely, most polymeric coatings shrink during and after solidification due to
chemical reaction, solvent evaporation, phase separation, or some combination thereof.
Coating adhesion, however, prevents shrinkage from occurring freely; this frustration of
in-plane shrinkage leads to a tensile stress in the plane of the coating [24]. At the same
time, stress accumulates, which may be relaxed by processes such as molecular
motion. The measured stress at any time is the result of the competition between stress
buildup from frustrated shrinkage and stress relief from relaxation. Accumulation of
stress is a problem because it can lead to defects such as cracks. Therefore,
understanding the formation of residual stress in the coating is important to prevent the
coating from peeling or cracking during service. Residual stresses have significant
influence on the mechanical and physical properties of the coatings, particularly
electrical resistivity, optical reflectance, fatigue and corrosion [25].
8.3.1 Hole-Drilling Method
The traditional hole-drilling method for measuring residual stresses involves drilling a
shallow hole in the test specimen to a depth approximately equal to the hole diameter.
Typical hole diameters range from 0.8 to 5.0 mm (0.030 – 0.200 in.). The removal of
material by creating of the hole re-distributes the stresses in the material surrounding
the hole. A specially designed three-element strain-gage, rosette, such as shown in
Figure 32a [26], measures the associated partial strain relief.

NOVA Chemicals Research & Technology Centre #DTPH56-06-BAA-001
Effect of Surface Preparation on Residual Stresses in Multi-layer Coatings
- 52 -
The in-plane residual stresses that originally existed at the hole location can then be
calculated from the measured strain reliefs using the method described in ASTM E 837-
08 [27]. The ASTM standard also provides details of practical drilling procedures.
The partial strain relief measured by one of the three strain gages in the rosette is
related to the principal in-plane residual stresses by:
𝑚𝑎𝑥 ,𝑚𝑖𝑛 =3−1
4A ±
3−1 2+ 3+1− 22 2
4B (5)
𝑃 = 3+1
2 , 𝑄 =
3−1
2 , 𝑇 =
3+1− 22
2 (6)
where A = −a (1+)
2E , B =
−b
2E
Where 𝑚𝑎𝑥 and 𝑚𝑖𝑛 are the maximum and minimum principal residual stresses.
A and B are calibration constants, the values of which depend on the specimen material
properties, the rosette geometry, the hole diameter and the hole depth. 1, 2 and 3 are
the measured combination strains while the computed combination stresses are defined
as P (isotropic (equi-biaxial) stress, Q (45° shear stress) and T (xy shear stress).
a and b are dimensionless calibration coefficients. ASTM E 837-08 tabulates the
calibration constants for the standard rosette pattern shown in Figure 32a-b [26].

NOVA Chemicals Research & Technology Centre #DTPH56-06-BAA-001
Effect of Surface Preparation on Residual Stresses in Multi-layer Coatings
- 53 -
The calibration coefficients A and B for hole drilling in a coated material differ from the
standard values given in ASTM E 837-08. The actual values depend on the elastic
properties of the coating and the substrate, the coating thickness, and the hole diameter
and depth. These coefficients can be determined by either experimental calibrations
[28] using known externally applied stresses or finite-element calculations [29].
Approximate values of A and B for thick coatings can be estimated from the values
given in ASTM E 837-08. For this purpose, a “thick” coating is one that is at least 0.25
times the mean radius of the strain-gage rosette. For the smallest commercially
available hole-drilling rosette, the mean radius is about 1.25 mm (0.050 in.). Therefore,
the minimum acceptable coating thickness is about 0.3 mm (0.012 in.).
An approximate estimation of A and B , for a coated material is based on the observation
that the hole-drilling method is most sensitive to the stresses closest to the specimen
surface. Almost all of the measured strain relief is due to the stresses in the material
within a depth of about 0.25 times the mean radius of the hole-drilling rosette.
Thus, a substrate coated to at least this depth is likely to behave similarly to a
homogeneous thick specimen consisting only of coating material. Thus, A and B
calibration constants for a “thick” coating are approximately equal to the ASTM
tabulated values for a homogenous material with the elastic properties of the coating.
For the purpose of this investigation the A and B constants were not changed
throughout the hole-drilling process of the HPCC coating as the coating properties were
generally related to the outer polyethylene layer.

NOVA Chemicals Research & Technology Centre #DTPH56-06-BAA-001
Effect of Surface Preparation on Residual Stresses in Multi-layer Coatings
- 54 -
8.3.2 Residual Stress Measurements on HPCC
As described in the previous section, conventional hole-drilling techniques were used to
measure the amount of residual stress at different locations through the thickness of the
composite coating.
The use of the hole-drilling technique to measure the residual stress in HPCC is an
approach that is extremely novel since measurements on such “soft” materials are very
difficult to capture. Initially, there was some concern that the residual stress fluctuations
may be too large for this method and the depth at which one could obtain meaningful data
was unknown. The fact that HPCC material was inherently a low modulus material
complicated the measurement. The Young’s modulus and Poisson’s ratio used for the
purpose of the calculations for the residual stress measurements on HPCC was equivalent
to that of the PE layer, where 400 MPa and 0.4 were used, respectively.
The possibility existed that the magnitude of stress relief would be below the detection limit
of the technique. This is not typically a concern with metals, metal coatings or metal oxide
coatings because the magnitude to the stress relief is much higher due to the high modulus
of the material.
An initial testing protocol was designed with the use of expertise supplied by an external
contractor, Proto Manufacturing, which specializes in performing residual stress
measurements on various materials.

NOVA Chemicals Research & Technology Centre #DTPH56-06-BAA-001
Effect of Surface Preparation on Residual Stresses in Multi-layer Coatings
- 55 -
Residual stress measurements were made on the four intact pipe ring sample conditions
plus a “zero” stress compression molded sample used to benchmark the coating
measurements on the rings.
Four intact pipe rings, each representing one of the surface preparations, (i.e. standard,
low profile, high profile and standard 1-year old) were drilled in five different
circumferential locations. The five test locations on the pipe ring were chosen so that
they did not coincide with the spiral weld on the ring. An additional complexity was the
fact that the HPCC coated pipe rings possessed a surface that was quite textured, i.e.
similar to that of an orange peel. The surface texture led to initial measurements that
were found to be quite variable and inconsistent when comparing measurements that
were taken in a surface region defined as a “valley” versus a coating surface region
defined as a “peak” (referring to the peaks and valleys of the textured coating). Valley
measurements were problematic since insufficient material thickness existed to
complete a full depth analysis of the coating.
Conversely, measurements made on “peak” coating regions resulted in complete and
consistent measurements. Considering this observation, subsequent residual stress
measurements were restricted to surface “peak” locations on the HPCC coating.
Through the use of an attached micrometer to the hole drilling apparatus, an EA62RE
drill bit was systematically stepped down at 0.005 inch (0.127 mm) increments to a total
depth of 0.030 inches (0.762 mm), approximately 75 - 85% of the total coating
thickness, in order to measure the coating strain as a function of depth.

NOVA Chemicals Research & Technology Centre #DTPH56-06-BAA-001
Effect of Surface Preparation on Residual Stresses in Multi-layer Coatings
- 56 -
With the ultimate depth measured being 0.030 in., the residual stress measurements
that were taken were generally related to the polyethylene layer. Some venturing into
the underlying tie-layer (which is essentially 95% or more polyethylene based) or even
penetration into the upper limits of the FBE layer was possible, given the fact that the
total HPCC coating thickness can range from 0.035 to 0.039 in. (0.89 to 1.0 mm).
The entire residual stress measurement data set attained can be found in Appendix 1,
including stresses measured in the x- and y- direction (Sx and Sy), shear stress (Txy),
maximum and minimum principal stress (Smax and Smin), maximum shear stress and
beta (angle from the gage axis to the maximum principal stress direction). A summary
of this data can be found in Table 7, as an average uniform residual stress. An
indication that the hole drilling technique is sensitive to changes in shear stress within
the coating is based on the observation that there is a change in the beta angle as a
function of depth, Appendix 1.
A plot of the data measured in the circumferential (hoop) x-direction (Sx) and tangential
(longitudinal) y-direction (Sy) are presented as a function of coating depth for each pipe
condition tested in Figures 33 and 34. The data used to plot these figures was
extracted from Appendix 1 where the average error on each measurement is ~ 5%.
According to the contractor, Proto Manufacturing, the difference between the stress
values attained for each coating condition type presented in Figures 33 and 34 are
considered significantly different as the measurements were highly reproducible and
reliable.

NOVA Chemicals Research & Technology Centre #DTPH56-06-BAA-001
Effect of Surface Preparation on Residual Stresses in Multi-layer Coatings
- 57 -
It is apparent from both plots that the “zero” compression plaque which was
manufactured to provide a “zero” residual stress benchmark for these measurements
possessed the lowest residual stress. This result further validates the use of this
technique to measure residual stress in non-metallic coatings.
The 1-year old HPCC standard surface coating sample generally resulted in the lowest
residual stress as compared to the other coating surface treatments. This is not an
entirely surprising observation as the polyethylene layer, which is approximately 0.8 mm
thick, is a viscoelastic material, that will stress relax over time. The 1-year old HPCC
pipe was stored outdoors where it would have experienced increased direct sunlight
hours and summer temperatures during storage resulting in further and faster relaxation
compared to the newly manufactured standard HPCC.
However, a second factor may have influenced the resultant residual stress
measurements. The fact that the pipe used for the 1-year old HPCC had a larger
diameter (36”) than the pipe material used to coat the other sample conditions (30”),
may have changed the coating physical properties (i.e. crystallinity), even though the
coating mill does attempt to control the pipe temperature by altering the pipe line speed.
This is considered an important factor since the cooling rate of the pipe material during
the coating application process is influenced by the geometry of the pipe, specifically
the surface area, AS, to volume, V, ratio by the following relation using the lumped
capacitance method [30]:
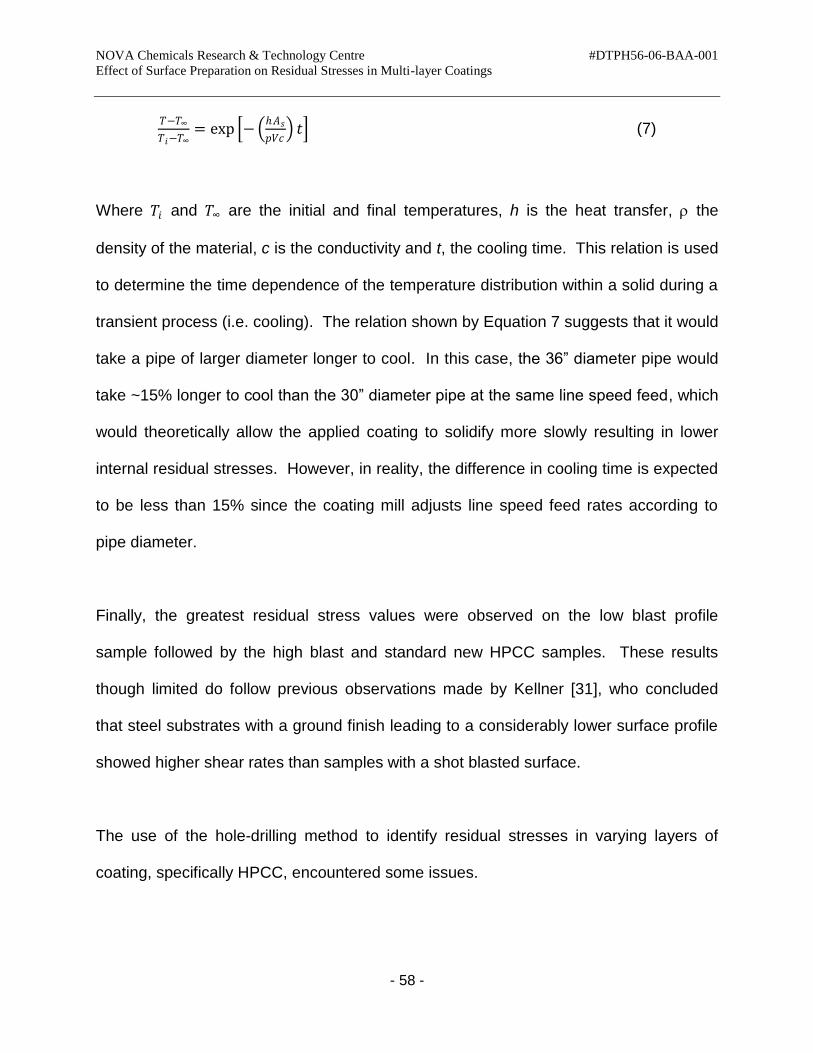
NOVA Chemicals Research & Technology Centre #DTPH56-06-BAA-001
Effect of Surface Preparation on Residual Stresses in Multi-layer Coatings
- 58 -
𝑇−𝑇∞
𝑇𝑖−𝑇∞= exp −
ℎ𝐴𝑠
𝑝𝑉𝑐 𝑡 (7)
Where 𝑇𝑖 and 𝑇∞ are the initial and final temperatures, h is the heat transfer, the
density of the material, c is the conductivity and t, the cooling time. This relation is used
to determine the time dependence of the temperature distribution within a solid during a
transient process (i.e. cooling). The relation shown by Equation 7 suggests that it would
take a pipe of larger diameter longer to cool. In this case, the 36” diameter pipe would
take ~15% longer to cool than the 30” diameter pipe at the same line speed feed, which
would theoretically allow the applied coating to solidify more slowly resulting in lower
internal residual stresses. However, in reality, the difference in cooling time is expected
to be less than 15% since the coating mill adjusts line speed feed rates according to
pipe diameter.
Finally, the greatest residual stress values were observed on the low blast profile
sample followed by the high blast and standard new HPCC samples. These results
though limited do follow previous observations made by Kellner [31], who concluded
that steel substrates with a ground finish leading to a considerably lower surface profile
showed higher shear rates than samples with a shot blasted surface.
The use of the hole-drilling method to identify residual stresses in varying layers of
coating, specifically HPCC, encountered some issues.
NOVA Chemicals Research & Technology Centre #DTPH56-06-BAA-001
Effect of Surface Preparation on Residual Stresses in Multi-layer Coatings
- 59 -
Specifically, there existed some non-uniformity in the thickness of the coating, therefore,
not all the hole-drill measurements ventured through all three coating layers when
considering the maximum drill depth was 0.0300 in (0.762 mm).
However, when reviewing the micro-strain data and calculating the change in delta
micro-strain as a function of stepwise ingress into the coating, Table 8, there is a
decrease in the magnitude of delta micro-strain, as you approach the hole-drill limit for
some of the coating samples tested. These limited results would suggest that the drill
has entered the region dominated by FBE since it is a much less ductile material than
PE (i.e. FBE is not expected to relax as easily as PE). Therefore, though this trend was
not observed with all the coating samples tested (for reasons mentioned), it is
appropriate to consider the hole-drilling technique as a possible tool to identify residual
stresses within varying layers of a coating.
8.4 Assessment of In-Service Coating Performance
8.4.1 In-Service Stresses – Laboratory Testing
The prediction of soil stress effects on coatings have been determined by burial of
coating samples in large soil boxes or by more convenient laboratory methods [32] and
apparatus [33]. Extensive testing has shown that the behaviour in the ground or in soil
boxes is directly related to the ability of the coating to resist shear forces exerted by soil
movement. This property can be directly measured by a determination of the amount or
rate of shear of a sample when subjected to a known shear stress.

NOVA Chemicals Research & Technology Centre #DTPH56-06-BAA-001
Effect of Surface Preparation on Residual Stresses in Multi-layer Coatings
- 60 -
A buried pipeline experiences various types of soil stress and magnitude depending on
burial depth, soil type, soil compaction, wet and dry, freeze and thaw cycles, seismic
activity, operating temperature, pipe size, etc. These stresses can be categorized into
four categories [34, 35]:
1. Axial stress due to pipeline expansion and contraction.
2. Static load due to soil and pipe weight.
3. Circumferential stress due to pipeline lateral movement at bends.
4. Stress applied in a random direction due to soil swelling and shrinkage
(particularly important in clay soils during wet and dry cycles).
The magnitude of the stress on the pipeline depends on the ability of the soil to adhere
to the coating and subsequently the stress transfer function between the soil and the
coating. The calculation of soil forces on buried pipelines was first reported by Marston
[36] in 1929 and modified by Spangler [37] in 1938. In 1986, Davis et al [38] calculated
the distribution of forces generated by soil on a pipeline and compared it to a finite
element analysis calculation. Essentially, when the coating strength is less than the
stresses introduced by the soil, the coating will fail.

NOVA Chemicals Research & Technology Centre #DTPH56-06-BAA-001
Effect of Surface Preparation on Residual Stresses in Multi-layer Coatings
- 61 -
A review of the technical literature was performed to quantify in-service stresses due to
soil stresses through laboratory testing of various coatings. Andrenacci et al [34] tested
several multi-layer coating systems including 2LPE, 3LPE and FBE to evaluate their
resistance to soil stress due to thermal changes in the pipeline with the use of a soil box
apparatus. The authors concluded that the most critical properties of a coating’s ability
to resist soil stress are the cohesive strength and adhesive strength. Specifically,
coatings with high cohesive and adhesive strengths like FBE and 3LPE showed
excellent resistance to disbondment, wrinkling, tearing, shifting and abrasion while
subjected to a longitudinal pipe movement test under a constant static load of 1400 kg
to mimic 6 foot burial at both 23°C and 60°C. Only minor scratches in these coatings
were observed after 500 cycles at 23°C and 250 cycles at 60°C. These results suggest
that a PE outer layer is sufficiently adequate to withstand soil stresses when properly
adhered to coating under-layers.
The viscoelastic behaviour of thick-walled MDPE pipe was also investigated by
Hamouda et al. [39], to characterize the nonlinear time-dependent response of semi-
crystalline thermoplastic material to creep deformation. Stress-strain behaviour was
found to be high nonlinear and dependent on both strain and strain rate with resultant
yield stress values slightly above 12 MPa. This value is slightly less than those
recounted in this report for PE subjected to various cooling methods, Table 3, where
yield strengths ranged from 18.6 MPa to 21.1 MPa.

NOVA Chemicals Research & Technology Centre #DTPH56-06-BAA-001
Effect of Surface Preparation on Residual Stresses in Multi-layer Coatings
- 62 -
In addition to laboratory experiments, various models have been developed to predict
and quantify these sources of loads on pipe. In recent times, finite element (FE)
modeling has been used to understand damage mechanisms of acrylic-steel (soft coat
on hard substrate) and polyurethane-polypropylene (hard coat on soft substrate) [40].
The modeled scratch mechanisms are shown to be correlated with the material
properties and the corresponding stress fields, which are related to the geometry of the
scratch tip and coating thickness. The authors were able to propose a quantitative
evaluation methodology by combining the ASTM scratch test method and FE modeling.
These scratch results were based on materials that possessed a yield stress ratio of
coating to substrate of 0.33 and 2.08, respectively [40].
In HPCC, the yield stress ratios are 0.29 (PE : FBE) and 0.24 (FBE : steel), considering
the PE layer is the outer layer and FBE is considered well adhered to the steel substrate
it is possible that the scratch mechanisms proposed for the acrylic-steel scenario could
be loosely applied to the PE:FBE layers in HPCC. Unfortunately, the magnitude of the
yield strength of acrylic and steel are ~5X the yield strength of MDPE and FBE. This is
important since it was found that nearly 40 MPa of damage strength was required to
cause delamination in the acrylic-steel example. It is apparent that the yield strength of
both the coating and substrate play a role in scratch formation mechanisms observed in
this research. A similar FE approach could be performed with multi-layer coatings like
HPCC to observe potential disbondment mechanisms.
NOVA Chemicals Research & Technology Centre #DTPH56-06-BAA-001
Effect of Surface Preparation on Residual Stresses in Multi-layer Coatings
- 63 -
8.4.2 In-Service Stresses – Field Experience
Information from field experience was obtained from TransCanada Pipeline (TCPL)
databases and construction records. In general, TCPL has not experienced any
disbondment related to HPCC coating which has been tested in this report. In addition,
as part of this investigation no report was discovered, as part of a literature review, that
discussed field observed overall disbondment failure of FBE coating. However,
information was provided by TCPL personnel that have identified disbondment failures
with PE-based coatings which were likely due to soil stress related issues.
In literature, several authors [41-43] have specified some factors that lead to in-field
disbondment of PE-based systems which include:
i. Incomplete surface preparation
ii. No or improper use of chromate pre-treatment to condition steel
substrate
iii. Use of inadequate type of FBE and/or PE
iv. Inappropriate application temperatures for FBE
v. Water absorption observed mainly in coating cutback areas
The CSA requirement for the peel strength value of coatings is 150N but according to
data provided by ShawCor Ltd., related to one of their PE coating products, Yellow
Jacket®, has shown peel strength values in the range of 400 - 500N.

NOVA Chemicals Research & Technology Centre #DTPH56-06-BAA-001
Effect of Surface Preparation on Residual Stresses in Multi-layer Coatings
- 64 -
Therefore, when referring to CSA Z245.20-06 / Z245.21-06 [10], Section 12.4 Peel
Adhesion, a minimum peeling load of 15.3 kg (Peel Strength = 150N) to 50.9 kg (Peel
Strength = 500N) is calculated. Therefore, HPCC has withstood in-service stresses
imposed by soil stresses up to a peeling load of at least 50.9 kg since no reports of
disbondment have been reported. It is important to note that historically peel tests on
HPCC are not completed because the PE layer does not undergo sustained peel [8]. In
addition, related shear tests also have shown no movement even at high temperatures.
Shear failure, when it occurs, only does so within the weaker PE outer layer and only at
temperatures above its softening point. Previous tensile testing performed on HPCC
has resulted in no failure at the FBE/steel interface where shear strengths in excess of
17 MPa were typically obtained [8].
Field effects of pulling pipe during horizontal directional drill (HDD) pipe emplacement
have been published by Polak et al [44]. The field test results of strain gage
instrumented PE pipes were investigated. The test program involved 200 mm (8 inch)
diameter pipe, standard dimension ratio (SDR) 17 and 150 mm (6 inch) diameter, SDR
11, high density and medium density PE pipes pulled along 90 m and 177 m bore paths.
The pipes were instrumented with strain gages to measure both flexural and axial
deformations with time and along the bore path. Pulling loads of 10-20 kN were used
while strains of 0.2% were measured for the MDPE pipe. The authors concluded that
extruded PE pipes are well suited for HDD construction since they allow reduction of the
pulling loads on the pipe due to their low flexural stiffness.

NOVA Chemicals Research & Technology Centre #DTPH56-06-BAA-001
Effect of Surface Preparation on Residual Stresses in Multi-layer Coatings
- 65 -
The large pulling loads experienced by the extruded PE pipe during their research,
would be expected to be too high for a multi-layer coated pipe system such as 3LPE
since expected peel strengths are of the order of up to 500 N as reported earlier.
8.5 Comparison of Various Coating Property Measurements
In this section, the mechanical properties and coating residual stress measured in
Sections 8.1 and 8.3.2 are compared with the results of the CD tests used to
characterize the coatings in Section 8.2.1 and the surface profiles measured in Section
7.3.
The magnitude of the residual stress in the circumferential (hoop) direction as shown in
Figure 33 and Table 7, can influence the adhesive strength of the coating by affecting
how tightly bound the coating is to the substrate in a manner that can be described as
an elastic band being stretched over the circumference of the pipe. Tensile stresses
which are indicated by positive stress values as seen in Table 7 would be expected in
such a scenario. The lowest value of Sx is found for the standard 1 year old HPCC as
compared to the other pipe surface treatments.
This is an intriguing result as the CD disbondment tests for the 1 year old HPCC with no
pre-treatment, Figure 28, resulted in the largest average disbondment radii. The limited
data suggests that there is an inverse correlation between the circumferential residual
stress, Sx, and the amount of coating disbondment.

NOVA Chemicals Research & Technology Centre #DTPH56-06-BAA-001
Effect of Surface Preparation on Residual Stresses in Multi-layer Coatings
- 66 -
This trend is also apparent for the balance of samples tested; Table 9, which
summarizes the average cumulative micro-strain (µ), measured. When analyzing, the
magnitude of total cumulative µ at a depth of 0.0300 in., there exists a steady increase
in magnitude from Standard 1-Year < Standard < High Blast Profile < Low Blast Profile.
This trend is inversely related to the CD disbondment data for the no pre-treatment
samples, Figure 28, where the average disbondment for a no pre-treatment surface
increases from Low Blast Profile < High Blast Profile < Standard < Standard 1-Year.
This relationship is presented in Figure 35.
By incorporating the effect of surface roughness to the combination of the residual
stress and CD disbondment data, one notices that the smoother surface (low profile)
sample results in the greatest coating bond strength. A similar trend is shown with the
28-day hot water soak (HWS) adhesion test results performed at 75°C summarized in
Tables 6 and 6a where the low blast treated surface possessed a superior average
adhesion rating (CSA Rating: 2) than the high blast sample (CSA Ratings: 3).
This trend is only applicable to the surface roughness extremes used in this
investigation as anomalies are identified in the disbondment results attained for the
standard profile (roughness) samples, Figures 28 and 29, which do not fall in between
the low and high blast profile samples. Completion of future sample replicates could
elucidate some of these observations and anomalies. In addition, only three surface
roughness profiles were tested and further replicates would be useful to determine
whether there is value in optimizing for surface roughness.

NOVA Chemicals Research & Technology Centre #DTPH56-06-BAA-001
Effect of Surface Preparation on Residual Stresses in Multi-layer Coatings
- 67 -
As mentioned earlier, the low profile surface disbondment result could be attributed to
the fact that HPCC coating is applied as a powder and may not possess the same flow
characteristics as a liquid coating when melted to fill surface asperities of the substrate
as easily, where a greater number of asperities would exist on a surface with enhanced
roughness. The implication of this scenario would be that more air gaps would form or
remain between the coating and substrate after application on a rougher surface as
compared to a smoother surface. A further investigation into the coating/substrate
interface is required to confirm this scenario.
Once confirmed one would expect that the rate at which ions Na+, OH- or molecules of
O2 and H2O, as previously discussed, could penetrate into the FBE / steel substrate
interface would be affected. The realization that “gaps” could exist between the FBE
and steel as the steel surface roughness increases is intriguing along with the
implication that lower residual stress may predict the extent of coating disbondment.
Although some work has been done on the environmental aspects of coating
disbondment, little is known about the effect of residual stresses remaining from the
manufacturing process. For example, there is little information on the impact of surface
preparation techniques, coating application, and environmental exposure conditions on
the time-dependent mechanical properties of the coating, the resulting stresses in the
coating and at the interlayer and coating/steel interfaces. The presence of residual
coating stresses, environmental exposure or impact damage during construction may
contribute greatly to disbondment of the coating.
NOVA Chemicals Research & Technology Centre #DTPH56-06-BAA-001
Effect of Surface Preparation on Residual Stresses in Multi-layer Coatings
- 68 -
This investigation has resulted in the realization that further research is required to
complete a greater understanding of the role of inherent and/or applied stresses on
coating disbondment, ultimately, leading to identifying improved methodologies for
surface preparation and coating application. This will only be achieved through the
completion of a much larger experimental research program with the same strict
controls that were applied in these experiments but with more attention to
understanding the normal variability that is expected with coated pipe supplied by a
coating mill. Only then will complete insights, when related to construction damage, into
evaluating the impact damage on the long-term integrity of a pipeline be plausible.
9.0 CONCLUSIONS
This investigation has served as an initial step into determining the effect of surface
preparation on the distribution of residual stress in a plant applied three-layer coating.
The three-layer system used was HPPC, produced by an electrostatic powder coating
process for all three layers. Various surface preparation treatments were considered,
with a focus of the effects of these treatments on the surface profile and residual
stresses on the steel surface. Different blast media (1 low profile, 1 standard profile,
and 1 high profile) were used to produce different surface profiles and to impart different
levels of compressive stresses to the steel though not quantified. Following preparation
of the samples, the coated samples were subjected to simulated service conditions in
order to "age" or deteriorate the samples through impacting and hot soaking the coating
samples.

NOVA Chemicals Research & Technology Centre #DTPH56-06-BAA-001
Effect of Surface Preparation on Residual Stresses in Multi-layer Coatings
- 69 -
Information from field experience obtained from TransCanada Pipeline (TCPL)
databases and construction records show that no disbondment related issues have
been experienced with HPCC applied coatings. An extensive literature survey also
resulted in no report of worldwide overall disbonding failure of FBE coatings. However,
the literature review identified several PE (2LPE and 3LPE) coating issues that have
been observed which were linked to either improper application, surface preparation
issues or disbondment failures likely due to soil stress related issues [41-43].
The major focus of the characterization work was on the ability to perform residual
stress measurements and to determine the stress-strain properties of the HPCC
coating. The use of the hole-drilling technique to measure the residual stress in HPCC
is an approach that is extremely novel and considered successful for this application.
Further measurements on other coating systems specifically, PE (2LPE, 3LPE) and
FBE are required to identify stresses that may be indigenous to a particular coating type
which could ultimately contribute to the overall stress measured in a three-layer system
like HPCC.
The following section highlights some of the findings related to specific HPCC properties
and measurements made during this investigation:

NOVA Chemicals Research & Technology Centre #DTPH56-06-BAA-001
Effect of Surface Preparation on Residual Stresses in Multi-layer Coatings
- 70 -
A. Physical Properties of HPCC
i. The direct measurement of mechanical properties was difficult since HPCC
contains thermoplastic and thermosetting microstructures, therefore
mechanical properties, are defined by their molecular architectures (density,
molecular weight, molecular weight distribution, co-monomer incorporation,
etc.) and their heat histories.
ii. HPCC mechanical strength is derived from the PE layer and not the higher
yield strength FBE material.
iii. The FBE component of the HPCC structure increases the stiffness but
decreases ductility in the HPCC coating with respect to the PE component.
iv. The crystallinity and enthalpy values attained from DSC analysis of HPCC
show that commercially applied HPCC coatings would likely have good
overall strength since they are similar to values attained for PE cooled at
30°C/min.
v. Commercially applied HPCC possesses good mechanical properties based
on the effect of cooling rate on tensile properties as presented in Table 3.
vi. The melt index results summarized in Table 3 shows that the PE material
used in HPCC is of a high melt index with a value close to 5.

NOVA Chemicals Research & Technology Centre #DTPH56-06-BAA-001
Effect of Surface Preparation on Residual Stresses in Multi-layer Coatings
- 71 -
As a result, this material would be expected to flow and melt well during the
application phase of the coating. This would eliminate porosity and help with
adhesion to the tie layer. However, further research into how the viscosity of
liquids affects the flow into surface asperities is required to compare powder
vs. liquid applied coatings.
B. Effect of Surface Preparation and Aging on Cathodic Disbondment
Results provided by the CD data suggest that the adhesion of the FBE layer to the
steel substrate is affected by both the surface roughness of the substrate and the
age of the coating:
i. The low profile surface tested in this investigation resulted in the least amount
of disbondment, Table 5 and Figures 28-31, and provided better adhesion
which was supported by the 28-day HWS adhesion tests, Table 6. A broader
range of surface roughness samples could be investigated to determine an
optimum surface roughness.
ii. The 1-year old HPCC consistently resulted in the largest average
disbondment radii regardless of surface treatment or profile. The speculation
provided for this observation include that the material may have relaxed over
the storage time exposed to various weather conditions and also that this
coating was applied to a 36” diameter coating versus a 30” diameter coating.

NOVA Chemicals Research & Technology Centre #DTPH56-06-BAA-001
Effect of Surface Preparation on Residual Stresses in Multi-layer Coatings
- 72 -
As discussed in Section 8.3.2, the size of the pipe could influence the cooling
rate and time for the coating to set (even though the coating mill attempts to
compensate for this by pipe line feed speed) thereby possibly affecting the
overall coating properties, though subsequent DSC measurements were not
able to detect any significant differences in coating crystallinity. Further
testing may be worthwhile to determine the impact of pipe diameter on
coating crystallinity and disbondment.
C. Residual Stress Technique and Measurements
The residual stress measurements taken were reproducible and significant. The
“zero” compression plaque provided an appropriate baseline for validating the
technique. The measurements performed on the pipe coating samples were mostly
related to the polyethylene layer with some venturing into the underlying tie-layer
and on occasion reaching the upper limits of the FBE layer as described in Section
8.3.2.
i. The 1-year aged standard surface coating sample resulted in the lowest
residual stress as compared to the other HPCC surface treatments.
ii. The greatest residual stress values were observed on the low blast profile
sample followed by the high blast and standard new HPCC samples.
NOVA Chemicals Research & Technology Centre #DTPH56-06-BAA-001
Effect of Surface Preparation on Residual Stresses in Multi-layer Coatings
- 73 -
iii. The hole-drilling method to identify residual stresses in the varying layers of
HPCC is considered a viable option. The sensitivity of this technique towards
identifying varying layers was demonstrated by the decrease in the magnitude
of delta micro-strain as the drill approached the hole-drill depth limit
suggesting a transition from a PE dominated tie-layer into a FBE dominated
region, Table 9.
10.0 RECOMMENDATIONS
Based upon the findings of this study, the following is recommended:
1. An investigation to determine what amount of residual stress would be
detrimental to coating adhesion (as a function of coating type for example
extruded or powder applied).
2. Similar comparisons using other coating types such as 2LPE, 3LPE, FBE and
PE tape to measure residual stress would be beneficial to determine the
implication of residual stress on coating disbondment. In addition, residual
stress measurements on other coatings i.e. PE only, FBE only should be
completed to determine if the magnitude of the stress in the coating adjacent to
the substrate is also a function of coating type and layer depth.
3. Determine the effect of surface roughness on residual stress in the PE layer and
at what point does it become detrimental to the long term coating performance.

NOVA Chemicals Research & Technology Centre #DTPH56-06-BAA-001
Effect of Surface Preparation on Residual Stresses in Multi-layer Coatings
- 74 -
4. Perform a similar investigation with an increased number of residual stress
measurements to ensure statistics are significant between varying surface
preparations as a function of depth into the coating.
5. Repeat residual stress measurements in HPCC to greater depths and with a
greater sample size to confirm/validate initial results where the change in delta
micro-strain occurs when approaching the FBE layer. This would address any
concerns related to the use of residual stress measurements in identifying
specific layers within multi-layer coatings.
6. Using residual stress measurements to compare coating surface “peak” versus
“valley” locations whereby determining the effect of varying layer thickness on
the residual stress and ultimately coating disbondment.
7. Supplementary CD test replicates are required to confirm the results in this
investigation and complement research in future studies related to
recommendations 1-3.
These recommendations if completed would result in a clearer understanding of the
performance of multi-layer coatings and lead to some modifications to coating
manufacturing and application procedures which could be captured in various
international coating and pipeline standards.

NOVA Chemicals Research & Technology Centre #DTPH56-06-BAA-001
Effect of Surface Preparation on Residual Stresses in Multi-layer Coatings
- 75 -
11.0 REFERENCES
1. Dasgupta C., Developments in Steel Pipelines Coating Systems, Pipelines
International Magazine, 2009.
2. Alexander, M., High Temperature Performance of Three-Layer Epoxy /
Polyethylene Coatings, Paper No. 0575, Corrosion 91, NACE International, 1991.
3. Connelly G., Gaillard G., et al, Three Layer Pipe Coatings for Elevated
Temperatures, Pipeline Industry, p. 53, 1990.
4. Gaillard G., Connelly G., three-layer Polyolefin Pipe Coatings, U.K. Corrosion,
1987.
5. Haimbl J.G., Geiser J., Polyethylene Coatings in Europe. A Look Back on 30
Years of Experience, Prevention of Pipeline Corrosion Conference, Pipeline and
Gas Industry, Houston, 1995.
6. Kehr J.A., Fusion Bonded Epoxy (FBE) – A Foundation for Pipeline Corrosion
Protection, NACE Press, Houston, TX., 2003.
7. Alexander, M., Three Layer Epoxy/Polyethylene Side Extruded Coatings for Pipe
for High Temperature, Garneau Inc., ASME 1998.
8. Singh P., R. Worthingham, et al, New Developments in High Performance
Coatings, Proc. 2005 16th International Conference on Pipeline, Paphos, Cyprus,
Paper No. 55-66, 2005.
9. Shaw Pipe Protection Limited, Internal Report, RD9217.

NOVA Chemicals Research & Technology Centre #DTPH56-06-BAA-001
Effect of Surface Preparation on Residual Stresses in Multi-layer Coatings
- 76 -
10. CSA Z245.20-06 / CSA Z245.21-06, “External Fusion bonded epoxy Coating for
Steel Pipe / External Polyethylene Coating for Pipe,” Canadian Standard
Association, Etobicoke, ON, 2006.
11. Been J., Given R., Ikeda-Cameron K., Factors Affecting the Rate and Extent of
Disbondment of FBE Coatings, Paper No. 05138, Corrosion 05, NACE
International, 2005.
12. Kamimura, T., H. Kishikawa, Mechanism of Cathodic Disbonding of Three-Layer
Polyethylene-Coated Steel Pipe, Corrosion, Vol. 54, No. 12, pp. 979-987, 1998.
13. Argent, C., D. Norman, Fitness for Purpose Issues Relating to FBE and Three
Layer PE Coatings, Paper No. 05034, Corrosion 05, NACE International, 2005.
14. Been J., R. Given, R. Worthingham, Performance Testing of a Multi-Component
Powder Coating System, Proc. 2006 International Pipeline Conference, Calgary,
AB, Paper No. IPC2006-10443, 2006.
15. Payer, J.H., I. Song, B. Trautman, J.J. Perdomo, R.E. Rodriguez, K.M. Fink,
Interrelationships Among Coatings, Cathodic Protection and Corrosion of
Pipelines, Research Topical Symposium, Corrosion 97, NACE International,
1997.
16. Wunderlich, B. (1990). Thermal Analysis. New York: Academic Press. pp. 137-
140.
17. Engineering and Design – Thermal Spraying: New Construction and
Maintenance, Engineer Manual EM 1110-2-3401, U.S. Army Corps of Engineers,
1999.

NOVA Chemicals Research & Technology Centre #DTPH56-06-BAA-001
Effect of Surface Preparation on Residual Stresses in Multi-layer Coatings
- 77 -
18. Varacalle D.J., Guillen D.P., Effect of Grit-Blasting on Substrate Roughness and
Coating Adhesion, J. Therm. Spray Tech., Vol. 15 (3), p.348, 2006.
19. Meyer, M., X. Campaignolle, F. Coeuille, and M.E.R. Shanahan, Impact of Aging
Processes on Anticorrosion Properties of Thick Polymer Coatings for Steel, “In”
Corrosion Modeling for Assessing the Conditions of Oil and Gas Pipelines, (F.
King and J.A. Beavers, Eds.), NACE International, Houston, TX, p. 93, 2004.
20. Cheng, Y. and F. King, Temperature Dependent Corrosion Rates in Salt Slough
Environments – Electrochemical Aspects. NOVA Research & Technology Centre
Report, NRTC-01532, 2001.
21. Gervasio, D., I. Song, and J.H. Payer, Determination of the Oxygen Reduction
Products on ASTM A516 Steel during Cathodic Protection. J. Appl. Electrochem.
28, 979-992, 1998.
22. Rodriguez, R.E., B.L. Trautman, and J.H. Payer, Influencing Factors in Cathodic
Disbondment of Fusion Bonded Epoxy Coatings. Corrosion 00, NACE
International, Paper No. 00166, 2000.
23. Payer, J.H., Cathodic Disbondment of Pipeline Coatings under Realistic Field
Conditions, PRCI Report, Contract PR-75-9609, 2001.
24. Francis, L.F., Development and Measurement of Stress in Polymer Coatings, J.
Mat. Sci., Vol. 37 (22), 2002.
25. Sue J.A., Schajer G.S., “Stress Determination in Coatings”, In: Totten G., Howes
M., Inoue T. (Eds.), Handbook of Residual Stress and Deformation of Steel, ASM
International, 2002, p. 118.

NOVA Chemicals Research & Technology Centre #DTPH56-06-BAA-001
Effect of Surface Preparation on Residual Stresses in Multi-layer Coatings
- 78 -
26. Jerry Lord, The NPL Materials Centre, BCA Structural Materials Workshop –
September 2000.
27. “Determining Residual Stresses by the Hole-Drilling Strain-Gage Method”, E 837-
08 Annual Book of ASTM Standards, ASTM.
28. “Measurements of Residual Stresses by Hole-Drilling Strain-Gage Method”,
TN503-4, Measurements Group, Wendell, NC, 1993.
29. Schajer G.S., J. Eng. Mater. Technol. (Trans. ASME), Vol. 103 (No. 2), 1981, p
157.
30. Incropera F.P. and DeWitt D.P., Introduction to Heat Transfer, 3rd Ed., 1996, p
212.
31. Kellner J.D., Shear Strength Testing of Pipeline Coatings and Soil Stress, Paper
No. 199, Corrosion 96, NACE International, 1996.
32. Kellner J.D., Laboratory Evaluation of the Effect of Soil Stress on Anti-Corrosion
Pipeline Coatings, Paper No. 282, Corrosion 85, NACE International, 1985.
33. Kellner, J.D., Soil Stress Apparatus, USA 4,483,197, 1984.
34. Andrenacci A. and Wong D.T., Simulation of Coating Behaviour in Buried Service
Environment, Paper No. 07020, Corrosion 07, NACE International, 2007.
35. B.C. Yen et al., Measurements of Soil Anchoring Effect on Protector Coatings for
Heated Pipelines”, Oil and Gas Journal, 1985, p 63.
36. Marston A., The Theory of External Loads on Closed Conduits in the Light of the
Latest Experiments, Proc. 9th Annual Meeting, Highway Research Board, 1929.

NOVA Chemicals Research & Technology Centre #DTPH56-06-BAA-001
Effect of Surface Preparation on Residual Stresses in Multi-layer Coatings
- 79 -
37. Spangler M.G., Horizontal Pressures on Retaining Walls Due to Concentrated
Surface Loads, Iowa Eng. Exp. Sta. Bull., 140, 1938, p. 79.
38. Davis J.A. et al, Interaction Between Soil and Coatings on Buried Pipelines, Proc.
26th Australasian Corrosion Association, Adelaide, Australia, 1986.
39. Hamouda H.B.H et al, Viscoplastic Behaviour of a Medium Density Polyethylene
(MDPE): Constitutive Equations Based on Double Nonlinear Deformation Model,
Int. J. Plasticity, 23, 1307-1327, 2007.
40. Jiang H., Browning R., et al, Mechanical Modeling of Scratch Behavior of
Polymeric Coatings on Hard and Soft Substrates, Tribol. Lett., Springer
Netherlands, 2009.
41. D. Norman, Are We Protecting Our Assets?, 15th International Pipeline Protection
Conference, Bedfordshire, U.K..: BHR, 2003.
42. Nazarbeygi A.E., Moeini A.R., Three-Layer Polyethylene Coating Performance in
Iran, Materials Performance, NACE International, p.32, 2009.
43. Argent C.J. and Norman D., Three Layer Polyolefin Coatings: Fulfilling Their
Potential, Corrosion 06, NACE International, Paper No. 56, 2006.
44. Polak, M.A., Duyvestyn, G., Knight, M., “Experimental Strain Analysis for
Polyethylene Pipes Installed by Horizontal Directional Drilling, Tunnelling and
Underground Space Technology 19, p. 205, 2004.

NOVA Chemicals Research & Technology Centre #DTPH56-06-BAA-001
Effect of Surface Preparation on Residual Stresses in Multi-layer Coatings
- 80 -
12.0 TABLES Table 1 – Test Matrix of Tested Coating Physical Properties
Sample
Standard and Non-Standard Tests
Impact
TestAdhesion Flexibility
Hole
Drilling
Residual
Stress
CD Disbondment 3.0V CP, Saturated Sandy Soil
- 3, 6, & 12months
No pre-
treatmentImpacted
Hot
soaked
Both
impacted
& Hot
soaked
Standard
HPCCX X X X X X X X
Low
Amperage
Blast Profile
HPCC
X X X X X X X X
High Blast
Profile
HPCC
X X X X X X X X
1 year
Outdoor
Aged HPCC
X X X X X X X X

NOVA Chemicals Research & Technology Centre #DTPH56-06-BAA-001
Effect of Surface Preparation on Residual Stresses in Multi-layer Coatings
- 81 -
Table 2 - Measured Profiles of Pipe Joints Subjected to Various Blast Profiles

NOVA Chemicals Research & Technology Centre #DTPH56-06-BAA-001
Effect of Surface Preparation on Residual Stresses in Multi-layer Coatings
- 82 -
Table 3 – Physical Property Data for HPCC, PE and FBE
Sam
ple
De
nsi
ty
(g/c
m3 )
Ten
sile
Yie
ld
Stre
ngt
h (
MP
a)
Std
De
v o
f
Ten
sile
Yie
ld
Stre
ngt
h (
MP
a)
Elo
nga
tio
n
at Y
ield
(%)
Std
De
v El
on
gati
on
at Y
ield
(M
Pa)
Me
lt In
de
x
(g/1
0 m
in)
Ult
imat
e
Ten
sile
Stre
ngt
h
(MP
a)
Std
De
v o
f
Ult
imat
e
Ten
sile
Stre
ngt
h
(MP
a)
Ult
imat
e
Elo
nga
tio
n
(%)
Std
De
v o
f
Ult
imat
e
Elo
nga
tio
n (
%)
Fusi
on
Bo
nd
Epo
xy>
164
.95
20
N/A
64.9
52
0
Gla
ss C
oo
led
HP
CC
1.06
9223
.75.
92
0N
/A23
.75.
92
0
PE
Air
Co
ole
d
wit
h P
ress
ure
(~1°
C/m
in)
0.95
4421
.10.
410
04.
9723
.20.
793
644
PE
30°C
/min
coo
lin
g w
ith
pre
ssu
re
0.95
0918
.60.
110
14.
5926
110
0372
PE
Stan
dar
d
Co
mp
ress
ion
Mo
ldin
g
(15°
C/m
in)
0.94
7817
.70.
112
14.
9126
297
066
PE
Qu
en
ch C
oo
l0.
9457
15.6
0.2
121
4.88
26.7
1.5
961
75
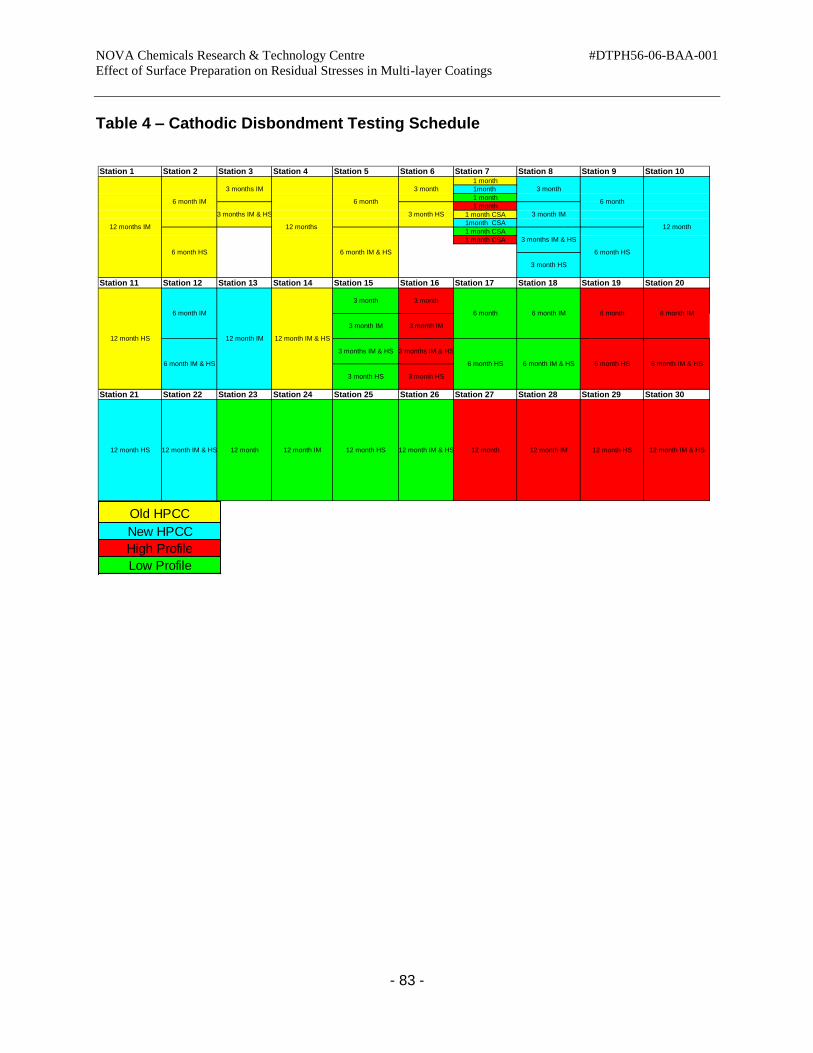
NOVA Chemicals Research & Technology Centre #DTPH56-06-BAA-001
Effect of Surface Preparation on Residual Stresses in Multi-layer Coatings
- 83 -
Table 4 – Cathodic Disbondment Testing Schedule
Station 1 Station 2 Station 3 Station 4 Station 5 Station 6 Station 7 Station 8 Station 9 Station 101 month
1month
1 month
1 month
1 month CSA
1month CSA
1 month CSA
1 month CSA
Station 11 Station 12 Station 13 Station 14 Station 15 Station 16 Station 17 Station 18 Station 19 Station 20
Station 21 Station 22 Station 23 Station 24 Station 25 Station 26 Station 27 Station 28 Station 29 Station 30
12 month IM & HS12 month HS12 month 12 month IM
12 month
3 month IM3 month HS
3 months IM & HS
3 month HS
6 month
6 month HS
6 month IM & HS
3 month
12 month IM12 month HS 12 month IM & HS
3 month
6 month IM
12 months IM
6 month IM
3 months IM
6 month
6 month HS 6 month IM & HS
3 months IM & HS
12 months
12 month IM 12 month HS 12 month IM & HS12 month HS 12 month IM & HS 12 month
6 month
6 month HS
6 month
6 month HS
6 month IM
6 month IM & HS
6 month IM
6 month IM & HS
3 month
3 month IM
3 months IM & HS
3 month HS
3 month
3 month IM
3 months IM & HS
3 month HS
Old HPCC
New HPCC
High Profile
Low Profile

NOVA Chemicals Research & Technology Centre #DTPH56-06-BAA-001
Effect of Surface Preparation on Residual Stresses in Multi-layer Coatings
- 84 -
Table 5 – Cathodic Disbondment Measurements and Photographs
Sample Name
Cathodic Disbondment Locations Images
A B C D E F G H
1 year old HPCC, 1 month
17 16 17.5 18 18.5 17 15 18
1 year old HPCC 3months
22 20 20 19 21.5 23 22 23
1 year old HPCC, Impacted 3 months
19 20 20 20 20 20 20 20
1 year old HPCC, 6 months
37 35 34 35 35 37 37 40
1 year old HPCC impacted, 6 months
31 32 32 31 32 32 30.5 30

NOVA Chemicals Research & Technology Centre #DTPH56-06-BAA-001
Effect of Surface Preparation on Residual Stresses in Multi-layer Coatings
- 85 -
New HPCC 1 month
6 6 5 6 7 5 5 5
New HPCC 3 months
19 16 21 22 22.5 21 19 19
New HPCC, 3 months impacted
22 24 20 21 23 23 24 22
New HPCC, 6 months
31 26 27 26 29 27 29 29
New HPCC Impacted 6 months
34 28 29 28 26 30 32 34
Sample Cathodic Disbondment Locations A B C D E F G H

NOVA Chemicals Research & Technology Centre #DTPH56-06-BAA-001
Effect of Surface Preparation on Residual Stresses in Multi-layer Coatings
- 86 -
#3, 3 months
22 23 23 21 21 23 21 22
#2, 3 month 12 15 20 18 14 15 15 11
1 yr old HPCC Hot soaked 3 months
70
82
75
67
64
55
54
54
1 yr old HPCC HS + Impacted 3 months
45
35
33
33
54
60
63
62
#3 Impacted 3 months
24
24
26
25
26
23
24
23
Sample Cathodic Disbondment Locations A B C D E F G H

NOVA Chemicals Research & Technology Centre #DTPH56-06-BAA-001
Effect of Surface Preparation on Residual Stresses in Multi-layer Coatings
- 87 -
#3 3 months
22
17
10
11
24
29
31
29
#2 6 months
24 28 30
25 21 22 20 19
#3 Impacted 6 months
21 24 24 25 25 23 23 21
#2 Impacted 6 months
17 19 17 15 15 20 19 18
#2 3 months (supposed to be 1 month)
16 19 20 20 19 19 22 21
Sample Cathodic Disbondment Locations A B C D E F G H

NOVA Chemicals Research & Technology Centre #DTPH56-06-BAA-001
Effect of Surface Preparation on Residual Stresses in Multi-layer Coatings
- 88 -
1 year old HPCC HS 6 months (turned into 3 months)
34 35 40 42 36 34 32 33
1 year old HPCC, HS and Impacted 6 months (turned into 3 months)
32 28 29 26 32 28 31 39
#3 1 month
12 11 11 10 8 8 10 11
#2 1 month
12 12 11 11 9 9 10 10
New HPCC HS and Impacted 3 month
20 23 21 19 20 20 19 21
Sample Cathodic Disbondment Locations A B C D E F G H

NOVA Chemicals Research & Technology Centre #DTPH56-06-BAA-001
Effect of Surface Preparation on Residual Stresses in Multi-layer Coatings
- 89 -
1 year old HPCC 12 month
44 41 51 54 51 38 37 38
1 year old HPCC Impacted 12 month
51 47 40 39 66 59 57 54
Low profile #2 Hot soaked 3 month
27 25 23 25 28 28 29 28
1 year old HPCC HS and Impacted 12 months
76 78 45 3 38 53 63 78
1 year old HPCC Hot soaked 12 months
63 74 74 70 64 66 68 71
Sample Cathodic Disbondment Locations A B C D E F G H

NOVA Chemicals Research & Technology Centre #DTPH56-06-BAA-001
Effect of Surface Preparation on Residual Stresses in Multi-layer Coatings
- 90 -
#3 HS and Impacted 3 months
19 19 19 17 20 23 67 61
New HPCC Impacted 12 months
25 27 29 35 40 43 37 29
New HPCC 12 months
32 30 23 24 28 30 27 30
Low profile #2 HS and Impacted 3 month
20 20 20 20 19 20 19 19
New HPCC HS and Impacted 6 month
47 45 37 34 46 44 45 38
Sample Cathodic Disbondment Locations A B C D E F G H

NOVA Chemicals Research & Technology Centre #DTPH56-06-BAA-001
Effect of Surface Preparation on Residual Stresses in Multi-layer Coatings
- 91 -
New HPCC Hot soaked 6 month
46 31 32 34 22 22 29 36
New HPCC Hot soaked 3 month
17 18 18 20 18 15 16 17
#3 Hot soaked 3 month
75 76 58 80 26 57 60 32
#3 12 Month
21 20 24 28 31 27 20 21
#2 Impacted 12 month
30 32 35 40 38 36 18 17
Sample Cathodic Disbondment Locations A B C D E F G H

NOVA Chemicals Research & Technology Centre #DTPH56-06-BAA-001
Effect of Surface Preparation on Residual Stresses in Multi-layer Coatings
- 92 -
#3 HS and Impacted 6 month
46 42 56 44 46 36 40 40
#2 12 month
22 25 26 24 22 19 20 19
#3 Impacted 12 month
40 36 35 36 45 50 43 40
#2 HS and Impacted 6 month
27 26 30 27 19 17 19 21
Sample Cathodic Disbondment Locations A B C D E F G H

NOVA Chemicals Research & Technology Centre #DTPH56-06-BAA-001
Effect of Surface Preparation on Residual Stresses in Multi-layer Coatings
- 93 -
Table 6 – 28 day HWS @ 75°C Test Results for HPCC Samples
Sample # CSA
Acceptance Criteria
Standard Surface (1 Year)
Standard Surface (New)
Low Blast High Blast
1
Rating of 1-3
Rating of 2 Rating of 1 Rating of 2 Rating of 2
2 Rating of 2 Rating of 2 Rating of 2 Rating of 3
3 Rating of 2 Rating of 1 Rating of 2 Rating of 3
4 Rating of 2
Table 6a – CSA Z245.20-06 Adhesion Rating Criteria
CSA Rating Description
1 Coating cannot be removed cleanly
2 Less than 50% of the coating can be removed
3 More than 50% of the coating can be removed, but the coating demonstrates a definite resistance to the levering action
4 The coating can be easily removed in strips or large chips
5 The coating can be completely removed as a single piece.

NOVA Chemicals Research & Technology Centre #DTPH56-06-BAA-001
Effect of Surface Preparation on Residual Stresses in Multi-layer Coatings
- 94 -
Table 7 – Average Uniform Residual Stress in Tested Coatings
Sample Sx (ksi) Sy (ksi) Txy (ksi) Smax (ksi)
Standard +0.218 ±0.063 +0.075 ±0.026 -0.248 ±0.010 +0.425 ±0.093
Low Blast +0.461 ±0.047 +0.334 ±0.081 -0.034 ±0.004 +0.502 ±0.032
High Blast +0.286 ±0.046 +0.266 ±0.064 -0.075 ±0.017 +0.413 ±0.033
Standard - 1 year +0.160 ±0.025 +0.163 ±0.092 +0.054 ±0.055 +0.225 ±0.034
"Zero" Compression +0.069 ±0.006 -0.020 ±0.063 -0.018 ±0.046 +0.111 ±0.038
Table 8 – Average Change in Micro-strain as a Function of Depth
Table 9 – Average Cumulative Micro-strain Measured in Tested Coatings
COATING REGIONSTANDARD
SURFACE
LOW BLAST
PROFILE
HIGH BLAST
PROFILE
STANDARD
SURFACE - 1 YR
"ZERO" COMPRESSION
PLAQUE
0.0000 - 0.0050 -103 -55 -102 -36 -9
0.0005 - 0.0100 -77 -194 -187 -49 -17
0.0100 - 0.0150 -170 -181 -165 -99 -2
0.0150 - 0.0200 -42 -177 -128 -75 -32
0.0200 - 0.0250 -30 -137 -91 -21 -12
0.0250 - 0.0300 -45 -108 -12 -51 -9
Depth (in.)STANDARD
SURFACE
LOW BLAST
PROFILE
HIGH BLAST
PROFILE
STANDARD
SURFACE - 1 YR
"ZERO" COMPRESSION
PLAQUE
0.0000 0 0 0 0 0
0.0050 -103 -55 -102 -36 -9
0.0100 -180 -249 -289 -85 -26
0.0150 -350 -430 -454 -184 -28
0.0200 -392 -607 -582 -259 -60
0.0250 -422 -744 -673 -280 -72
0.0300 -467 -852 -685 -331 -81

NOVA Chemicals Research & Technology Centre #DTPH56-06-BAA-001
Effect of Surface Preparation on Residual Stresses in Multi-layer Coatings
- 95 -
13.0 FIGURES
Figure 1 – ASTM Type VI Dog Bone Tensile Sample Specifications
Location Location Description
Dimensions (mm)
Dimensions (in)
W Width of narrow section
6 0.25
L Length of narrow section
33 1.30
WO Width overall min 19 0.75
LO Length overall min 115 4.5
D Distance between grips
64 2.5
R Radius of fillet 14 0.56
RO Outer radius 25 1.00

NOVA Chemicals Research & Technology Centre #DTPH56-06-BAA-001
Effect of Surface Preparation on Residual Stresses in Multi-layer Coatings
- 96 -
Figure 2 – DSC Measurement for Standard HPCC Coating from 30" Diameter Pipe
First Heat Peak 1 Onset Peak 120.5 MP Peak (°C) 125.8 Heat of Fusion dH (J/g) 158.0 Crystallinity (%) 54.5

NOVA Chemicals Research & Technology Centre #DTPH56-06-BAA-001
Effect of Surface Preparation on Residual Stresses in Multi-layer Coatings
- 97 -
Figure 3 – DSC Measurement from 1 year old HPCC Coated 36" Diameter Pipe
First Heat Peak 1 Onset Peak 118.6
MP Peak (°C) 125.9
Heat of Fusion dH (J/g) 158.0
Crystallinity (%) 54.5

NOVA Chemicals Research & Technology Centre #DTPH56-06-BAA-001
Effect of Surface Preparation on Residual Stresses in Multi-layer Coatings
- 98 -
Figure 4 – DSC Measurement for a Lab Made Glass Cooled HPCC
First Heat Peak 1 Onset Peak 120.2
MP Peak (°C) 125.5
Heat of Fusion dH (J/g) 100.5
Crystallinity (%) 34.7

NOVA Chemicals Research & Technology Centre #DTPH56-06-BAA-001
Effect of Surface Preparation on Residual Stresses in Multi-layer Coatings
- 99 -
Figure 5 – DSC Measurement for PE Air Cooled with Pressure
First Heat Peak 1 Onset Peak 123.4 MP Peak (°C) 130.4 Heat of Fusion dH (J/g) 170.4 Crystallinity (%) 58.8
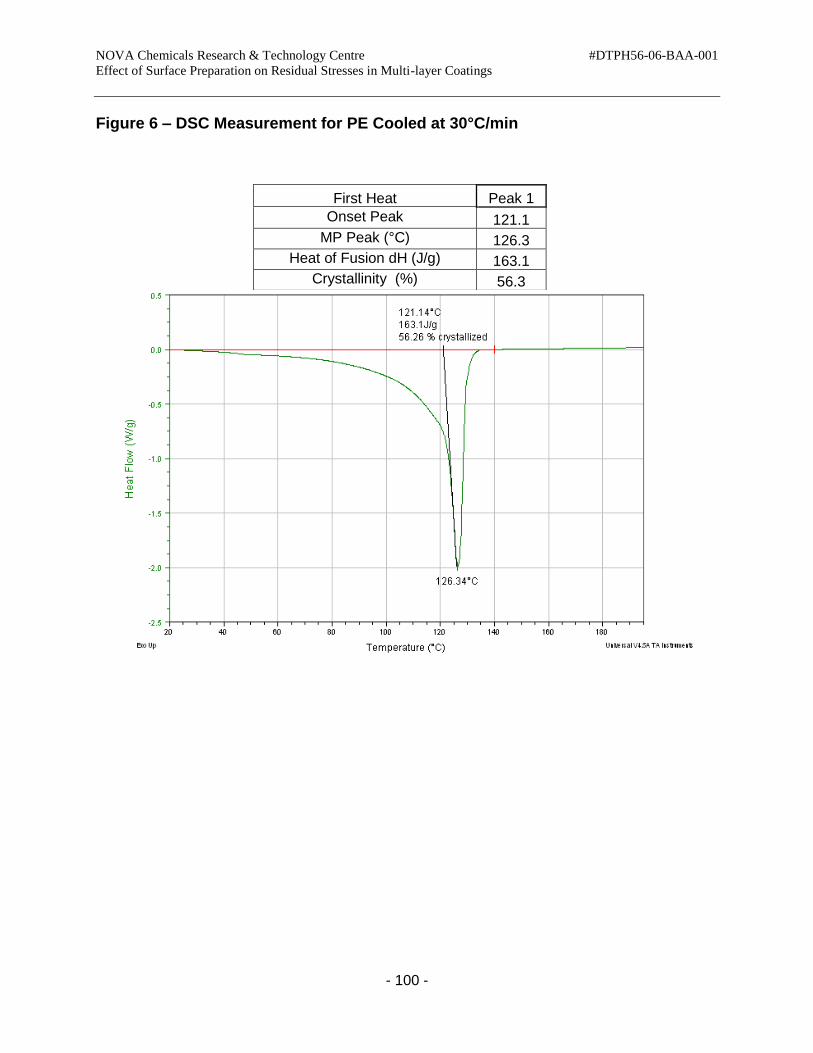
NOVA Chemicals Research & Technology Centre #DTPH56-06-BAA-001
Effect of Surface Preparation on Residual Stresses in Multi-layer Coatings
- 100 -
Figure 6 – DSC Measurement for PE Cooled at 30°C/min
First Heat Peak 1 Onset Peak 121.1 MP Peak (°C) 126.3 Heat of Fusion dH (J/g) 163.1 Crystallinity (%) 56.3

NOVA Chemicals Research & Technology Centre #DTPH56-06-BAA-001
Effect of Surface Preparation on Residual Stresses in Multi-layer Coatings
- 101 -
Figure 7 – DSC Measurement for PE Standard Compression Molding
First Heat Peak 1 Onset Peak 119.4 MP Peak (°C) 126.0 Heat of Fusion dH (J/g) 158.8 Crystallinity (%) 54.8
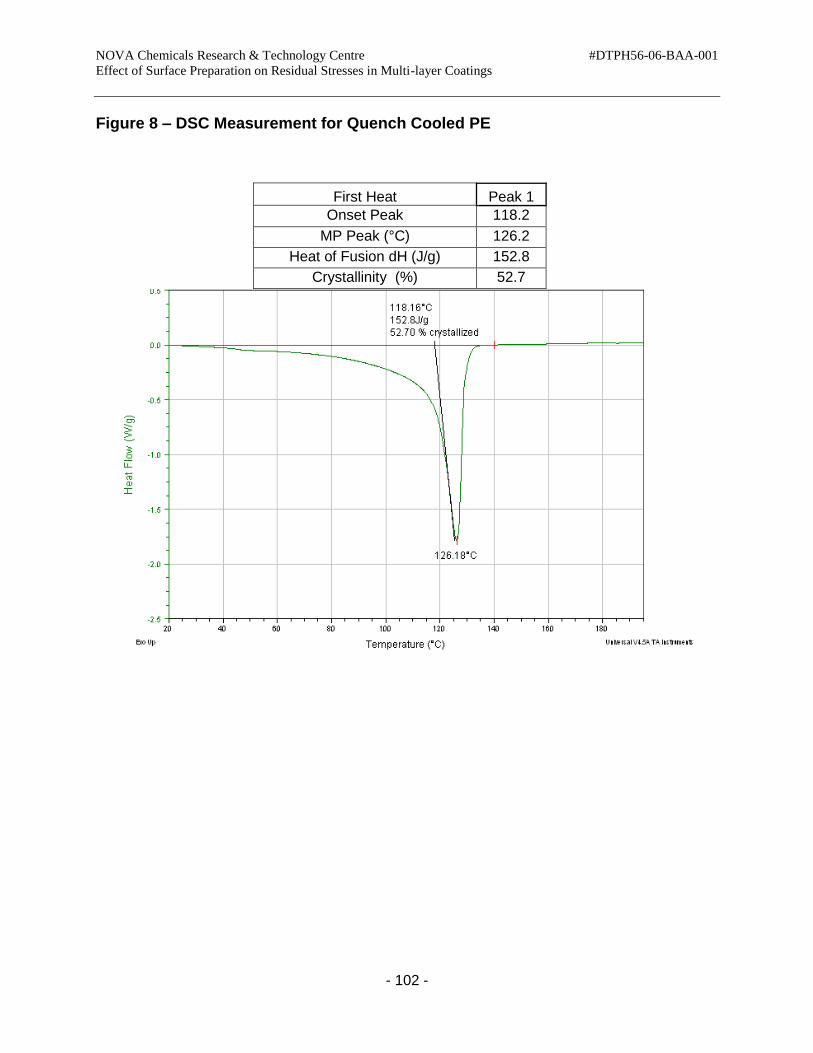
NOVA Chemicals Research & Technology Centre #DTPH56-06-BAA-001
Effect of Surface Preparation on Residual Stresses in Multi-layer Coatings
- 102 -
Figure 8 – DSC Measurement for Quench Cooled PE
First Heat Peak 1 Onset Peak 118.2
MP Peak (°C) 126.2
Heat of Fusion dH (J/g) 152.8
Crystallinity (%) 52.7

NOVA Chemicals Research & Technology Centre #DTPH56-06-BAA-001
Effect of Surface Preparation on Residual Stresses in Multi-layer Coatings
- 103 -
Figure 9 – DSC Measurement for Lab-Made FBE
First Heat Peak 1 Peak 2
Onset temperature (°C) 71.8 100.5
Inflection point (°C) 74.4 104.8
End Temperature (°C) 80.7 106.3
Crystallinity (%) N/A N/A
MP Peak (°C) N/A N/A
Delta Cp [J/(g·°C)] 0.084 0.15

NOVA Chemicals Research & Technology Centre #DTPH56-06-BAA-001
Effect of Surface Preparation on Residual Stresses in Multi-layer Coatings
- 104 -
Figure 10 – Large Diameter CD Cell for Long-Term Testing
Figure 11 – Typical HPCC Coated Pipe Sample Section

NOVA Chemicals Research & Technology Centre #DTPH56-06-BAA-001
Effect of Surface Preparation on Residual Stresses in Multi-layer Coatings
- 105 -
Figure 12 – CD Experimental Configuration with Power Supply
Cathode
Potential = 3.0V
Reference Electrode
Test Sample
Anode
Test cell will be filled with sandy soil and electrolyte.

NOVA Chemicals Research & Technology Centre #DTPH56-06-BAA-001
Effect of Surface Preparation on Residual Stresses in Multi-layer Coatings
- 106 -
Figure 13a – Picture of Cathodic Disbondment Experimental Configuration
Figure 13b – Cathodic Disbondment Testing for All Project Samples

NOVA Chemicals Research & Technology Centre #DTPH56-06-BAA-001
Effect of Surface Preparation on Residual Stresses in Multi-layer Coatings
- 107 -
Figure 14a - Cathodic Disbondment Experimental Setup
Shelf
Keithley DAQ
Laptop
Shelf
E3610A Power Source #2
E3610A Power Source #1
Shelf
15 channels variable
resistor box #2
15 channels variable
resistor box #1
15
channels
15
channels
Steel Sample Coated
Typical Acrylic
Electrochemical
Cell with lid
Graphite Electrode Example of 1 of 30 testing
stations.
Spill Sock

- 108 -
Figure 14b - Cathodic Disbondment Electrical Circuit Diagram
10ohm Resistance
Green Connector Red Connector
Steel Sample
Electrode in
Electrolyte
Black Connector
Potentiostat
Variable Resistor
Keithley DAQ – Less than
1mV across resistor
Will be 3.0V
across cell

WP #254 NOVA Chemicals Research & Technology Centre #DTPH56-06-BAA-001
Effect of Surface Preparation on Residual Stresses in Multi-layer Coatings
- 109 -
Figure 15a – Hot water Soaking Pre-treatment for CD Testing
Figure 15b – Hot Water Baths used for Hot Soaking Pre-treatment for CD Testing
Circulator Heater
Circulator Heater
Water Bath Water Bath
Samples
Circulator Heater

WP #254 NOVA Chemicals Research & Technology Centre #DTPH56-06-BAA-001
Effect of Surface Preparation on Residual Stresses in Multi-layer Coatings
- 110 -
Figure 16 – Current Response Recorded for Varying Surface Treatments during CD Tests Using 1 Year Old HPCC
-0.03
-0.025
-0.02
-0.015
-0.01
-0.005
0
0.005
0 50 100 150 200 250 300 350 400 450
Curr
ent (
A)
Time (Days)
Impacted
No Pre-treatment
Impacted + Hot Soaked
Hot Soaked

WP #254 NOVA Chemicals Research & Technology Centre #DTPH56-06-BAA-001
Effect of Surface Preparation on Residual Stresses in Multi-layer Coatings
- 111 -
Figure 17 – Current Response Recorded for Varying Surface Treatments during CD Tests Using New HPCC
-0.03
-0.025
-0.02
-0.015
-0.01
-0.005
0
0.005
0 50 100 150 200 250 300 350 400 450
Cu
rre
nt
( A)
Time (Days)
Impacted
No Pre-treatment
Impacted + Hot Soaked
Hot Soaked

WP #254 NOVA Chemicals Research & Technology Centre #DTPH56-06-BAA-001
Effect of Surface Preparation on Residual Stresses in Multi-layer Coatings
- 112 -
Figure 18 – Current Response Recorded for Varying Surface Treatments during CD Tests Using Low Profile HPCC
-0.03
-0.025
-0.02
-0.015
-0.01
-0.005
0
0.005
0 50 100 150 200 250 300 350 400 450
Curr
ent (
A)
Time (Days)
Impacted
No Pre-treatment
Impacted + Hot Soaked
Hot Soaked

WP #254 NOVA Chemicals Research & Technology Centre #DTPH56-06-BAA-001
Effect of Surface Preparation on Residual Stresses in Multi-layer Coatings
- 113 -
Figure 19 – Current Response Recorded for Varying Surface Treatments during CD Tests Using High Profile HPCC
-0.03
-0.025
-0.02
-0.015
-0.01
-0.005
0
0.005
0 50 100 150 200 250 300 350 400 450
Curr
ent (
A)
Time (Days)
Impacted
No Pre-treatment
Impacted + Hot Soaked
Hot Soaked

WP #254 NOVA Chemicals Research & Technology Centre #DTPH56-06-BAA-001
Effect of Surface Preparation on Residual Stresses in Multi-layer Coatings
- 114 -
Figure 20 – Comparison of Current Response of No Pre-Treatment on Various HPCC Samples
-0.03
-0.025
-0.02
-0.015
-0.01
-0.005
0
0.005
0 50 100 150 200 250 300 350 400 450
Cu
rre
nt
/ A
Time / days
High Profile
Low Profile
Old HPCC
New HPCC

WP #254 NOVA Chemicals Research & Technology Centre #DTPH56-06-BAA-001
Effect of Surface Preparation on Residual Stresses in Multi-layer Coatings
- 115 -
Figure 21 – Comparison of Current Response of Hot Soaked Testing Treatment on Various HPCC Samples
-0.03
-0.025
-0.02
-0.015
-0.01
-0.005
0
0.005
0 50 100 150 200 250 300 350 400 450
Cu
rre
nt
/ A
Time / days
High Profile
Old HPCC
New HPCC
Low Profile

WP #254 NOVA Chemicals Research & Technology Centre #DTPH56-06-BAA-001
Effect of Surface Preparation on Residual Stresses in Multi-layer Coatings
- 116 -
Figure 22 – Comparison of Current Response of Impacted Surface Treatment on Various HPCC Samples
-0.03
-0.025
-0.02
-0.015
-0.01
-0.005
0
0.005
0.01
0 50 100 150 200 250 300 350 400 450
Cu
rre
nt
( A)
Time (Days)
High Profile
Low Profile
Old HPCC
New HPCC

WP #254 NOVA Chemicals Research & Technology Centre #DTPH56-06-BAA-001
Effect of Surface Preparation on Residual Stresses in Multi-layer Coatings
- 117 -
Figure 23 – Comparison of Current Response of Impacted and Hot Soaked Surface Treatment on Various HPCC Samples
-0.03
-0.025
-0.02
-0.015
-0.01
-0.005
0
0.005
0 50 100 150 200 250 300 350 400 450
Cu
rre
nt
/ A
Time / days
High Profile
Low Profile
Old HPCC
New HPCC

WP #254 NOVA Chemicals Research & Technology Centre #DTPH56-06-BAA-001
Effect of Surface Preparation on Residual Stresses in Multi-layer Coatings
- 118 -
Figure 24 – Comparison of CD Performance of 1 Year Old HPCC
0.00
10.00
20.00
30.00
40.00
50.00
60.00
70.00
80.00
0 60 120 180 240 300 360 420
Ave
rage
Cat
ho
dic
Dis
bo
nd
me
nt
rad
ius
( m
m)
Time ( days)
No-Pretreatment
Impacted
Hot Soaked
Hot Soaked +Impacted

WP #254 NOVA Chemicals Research & Technology Centre #DTPH56-06-BAA-001
Effect of Surface Preparation on Residual Stresses in Multi-layer Coatings
- 119 -
Figure 25 – Comparison of CD Performance of New HPCC
0.00
5.00
10.00
15.00
20.00
25.00
30.00
35.00
40.00
45.00
50.00
0 60 120 180 240 300 360 420
Ave
rage
Cat
ho
dic
Dis
bo
nd
me
nt
rad
ius
( m
m)
Time ( days)
No Pre-treatment
Impacted
Hot Soaked
Hot Soaked +Impacted

WP #254 NOVA Chemicals Research & Technology Centre #DTPH56-06-BAA-001
Effect of Surface Preparation on Residual Stresses in Multi-layer Coatings
- 120 -
Figure 26 – Comparison of CD Performance of Low Profile HPCC
0
10
20
30
40
50
60
70
0 60 120 180 240 300 360 420
Ave
rage
Cat
ho
dic
Dis
bo
nd
me
nt
rad
ius
( m
m)
Time ( days)
No Pre-treatment
Impacted
Hot Soaked
Hot Soaked +Impacted
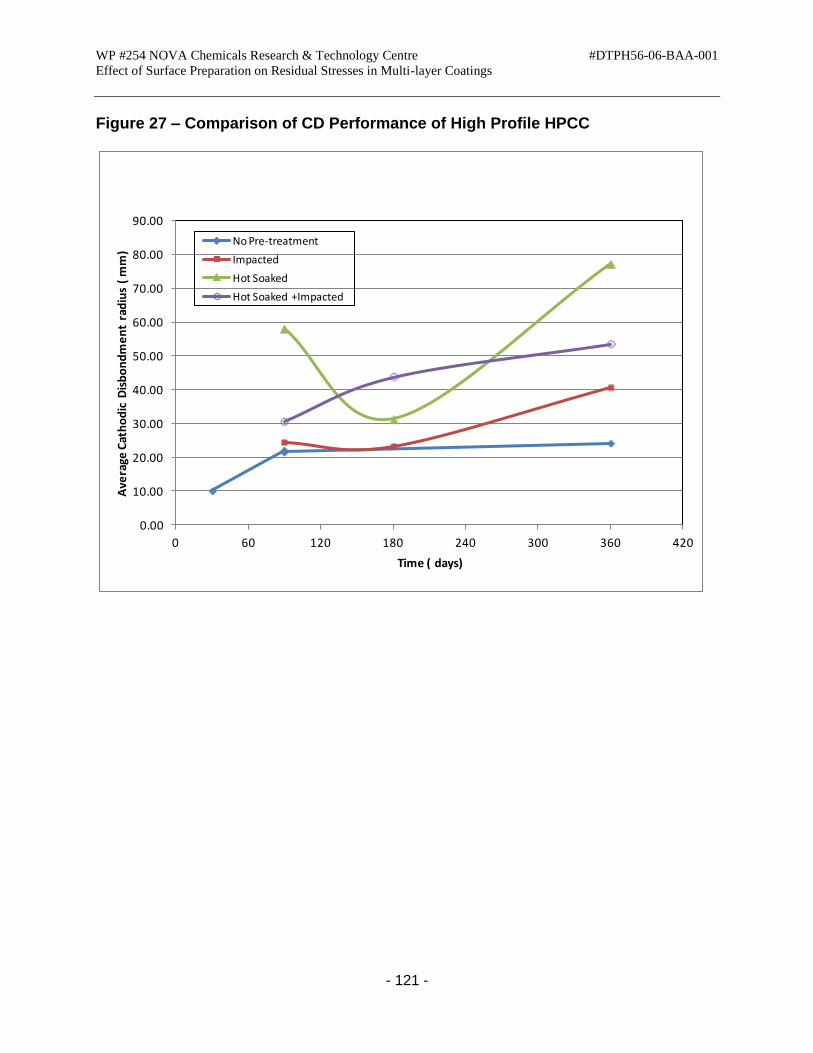
WP #254 NOVA Chemicals Research & Technology Centre #DTPH56-06-BAA-001
Effect of Surface Preparation on Residual Stresses in Multi-layer Coatings
- 121 -
Figure 27 – Comparison of CD Performance of High Profile HPCC
0.00
10.00
20.00
30.00
40.00
50.00
60.00
70.00
80.00
90.00
0 60 120 180 240 300 360 420
Ave
rage
Cat
ho
dic
Dis
bo
nd
me
nt
rad
ius
( m
m)
Time ( days)
No Pre-treatment
Impacted
Hot Soaked
Hot Soaked +Impacted
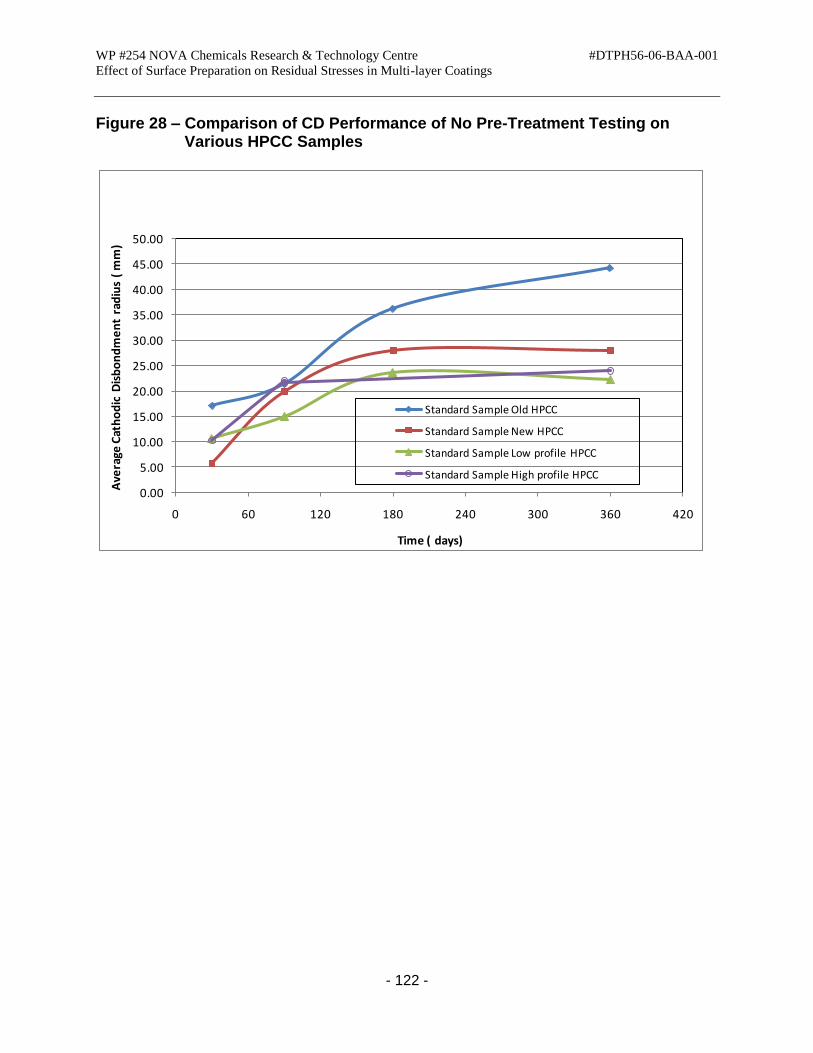
WP #254 NOVA Chemicals Research & Technology Centre #DTPH56-06-BAA-001
Effect of Surface Preparation on Residual Stresses in Multi-layer Coatings
- 122 -
Figure 28 – Comparison of CD Performance of No Pre-Treatment Testing on Various HPCC Samples
0.00
5.00
10.00
15.00
20.00
25.00
30.00
35.00
40.00
45.00
50.00
0 60 120 180 240 300 360 420
Ave
rage
Cat
ho
dic
Dis
bo
nd
me
nt
rad
ius
( m
m)
Time ( days)
Standard Sample Old HPCC
Standard Sample New HPCC
Standard Sample Low profile HPCC
Standard Sample High profile HPCC

WP #254 NOVA Chemicals Research & Technology Centre #DTPH56-06-BAA-001
Effect of Surface Preparation on Residual Stresses in Multi-layer Coatings
- 123 -
Figure 29 – Comparison of Cathodic Disbondment Performance of Hot Soaked Testing Treatment on Various HPCC Samples
0.00
10.00
20.00
30.00
40.00
50.00
60.00
70.00
80.00
90.00
0 60 120 180 240 300 360 420
Ave
rage
Cat
ho
dic
Dis
bo
nd
me
nt
rad
ius
( m
m)
Time ( days)
Hot soaked Old HPCC
Hot soaked New HPCC
Hot soaked Low profile
Hot soaked High profile

WP #254 NOVA Chemicals Research & Technology Centre #DTPH56-06-BAA-001
Effect of Surface Preparation on Residual Stresses in Multi-layer Coatings
- 124 -
Figure 30 – Comparison of Cathodic Disbondment Performance of Impacted Surface Treatment on Various HPCC Samples
0.00
10.00
20.00
30.00
40.00
50.00
60.00
0 60 120 180 240 300 360 420
Ave
rage
Cat
ho
dic
Dis
bo
nd
me
nt
rad
ius
( m
m)
Time ( days)
Impacted Old HPCC
Impacted New HPCC
Impacted Low profile
Impacted High profile
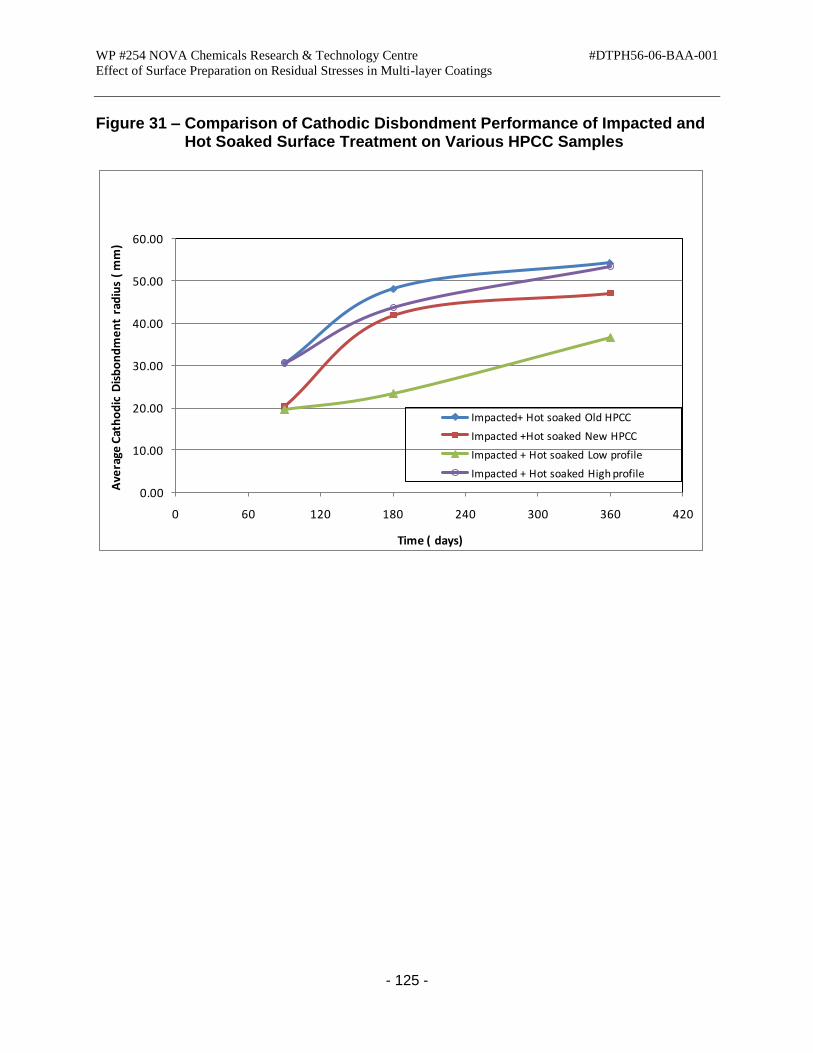
WP #254 NOVA Chemicals Research & Technology Centre #DTPH56-06-BAA-001
Effect of Surface Preparation on Residual Stresses in Multi-layer Coatings
- 125 -
Figure 31 – Comparison of Cathodic Disbondment Performance of Impacted and Hot Soaked Surface Treatment on Various HPCC Samples
0.00
10.00
20.00
30.00
40.00
50.00
60.00
0 60 120 180 240 300 360 420
Ave
rage
Cat
ho
dic
Dis
bo
nd
me
nt
rad
ius
( m
m)
Time ( days)
Impacted+ Hot soaked Old HPCC
Impacted +Hot soaked New HPCC
Impacted + Hot soaked Low profile
Impacted + Hot soaked High profile

WP #254 NOVA Chemicals Research & Technology Centre #DTPH56-06-BAA-001
Effect of Surface Preparation on Residual Stresses in Multi-layer Coatings
- 126 -
Figure 32 – Orientation of a Three-element Strain Gauge Rosette
a b

WP #254 NOVA Chemicals Research & Technology Centre #DTPH56-06-BAA-001
Effect of Surface Preparation on Residual Stresses in Multi-layer Coatings
- 127 -
Figure 33 – Average Residual Stress Measured on Varying Coating Surface Preparations in the Circumferential (Hoop) X-direction
-1.0
-0.5
0.0
0.5
1.0
0.000 0.005 0.010 0.015 0.020 0.025 0.030 0.035
Str
ess (
ksi)
Depth (in)
Standard Surface
Low Blast Profile
High Blast Profile
Standard Surface - 1 Year
"Zero" Compression Plaque

WP #254 NOVA Chemicals Research & Technology Centre #DTPH56-06-BAA-001
Effect of Surface Preparation on Residual Stresses in Multi-layer Coatings
- 128 -
Figure 34 – Average Residual Stress Measured on Varying Coating Surface Preparations in the Longitudinal (Tangential) Y-direction
-1.5
-1.0
-0.5
0.0
0.5
1.0
1.5
0.000 0.005 0.010 0.015 0.020 0.025 0.030 0.035
Str
ess (
ksi)
Depth (in)
Standard Surface
Low Blast Profile
High Blast Profile
Standard Surface - 1 Year
"Zero" Compression Plaque
Average

WP #254 NOVA Chemicals Research & Technology Centre #DTPH56-06-BAA-001
Effect of Surface Preparation on Residual Stresses in Multi-layer Coatings
- 129 -
Figure 35 – Relationship between Coating Disbondment of No Pre-Treatment Samples and Magnitude of Cumulative Micro-Strain
Standard 1-Year
Standard New
High Profile
Low Profile
15
20
25
30
35
40
45
250 350 450 550 650 750 850
Dis
bo
nd
me
nt
Rad
ius
/ m
m
Cumulative Micro-Strain / µ

WP #254 NOVA Chemicals Research & Technology Centre #DTPH56-06-BAA-001
Effect of Surface Preparation on Residual Stresses in Multi-layer Coatings
- 130 -
14.0 APPENDIX APPENDIX 1 – Residual Stress Measurement Database on HPCC Samples
STANDARD SURFACE Ring 1 Uniform Stresses
Location Sx (ksi) Sy (ksi) Txy (ksi) Smax (ksi) Tmax (ksi) beta (deg)
1 +0.232 ±0.008 +0.090 ±0.003 -0.026 ±0.001 +0.237 ±0.007 +0.076 ±0.002 +10 ±1
2 +0.034 ±0.001 +0.077 ±0.003 -0.077 ±0.003 +0.135 ±0.000 +0.080 ±0.003 +53 ±1
3 +0.378 ±0.012 -0.079 ±0.002 -0.262 ±0.008 +0.497 ±0.004 +0.347 ±0.003 +24 ±1
4 +0.380 ±0.012 +0.229 ±0.007 -0.208 ±0.007 +0.526 ±0.005 +0.221 ±0.006 +35 ±1
5 +0.067 ±0.002 +0.056 ±0.002 -0.666 ±0.021 +0.728 ±0.019 +0.666 ±0.021 +45 ±0
Average +0.218 ±0.163 +0.075 ±0.126 -0.248 ±0.110 +0.425 ±0.193 +0.278 ±0.130 +33 ±0
Ring 1 Location 1 Power Series
Depth (in) Sx (ksi) Sy (ksi) Txy (ksi) Smax (ksi) Tmax (ksi)
beta (deg)
0.000 +0.347 ±0.013 +0.016 ±0.005 +0.009 ±0.003 +0.347 ±0.014 +0.166 ±0.004 -2 ±1
0.005 +0.294 ±0.010 +0.049 ±0.003 -0.007 ±0.001 +0.294 ±0.010 +0.122 ±0.004 +2 ±1
0.010 +0.240 ±0.008 +0.082 ±0.003 -0.023 ±0.001 +0.243 ±0.007 +0.082 ±0.002 +8 ±1
0.015 +0.186 ±0.007 +0.116 ±0.005 -0.039 ±0.002 +0.203 ±0.006 +0.052 ±0.001 +24 ±1
0.020 +0.133 ±0.008 +0.149 ±0.007 -0.055 ±0.003 +0.196 ±0.005 +0.055 ±0.003 +49 ±0
0.025 +0.079 ±0.011 +0.182 ±0.009 -0.071 ±0.004 +0.218 ±0.006 +0.087 ±0.004 +63 ±1
0.030 +0.025 ±0.014 +0.215 ±0.012 -0.086 ±0.006 +0.249 ±0.008 +0.128 ±0.005 +69 ±1
Ring 1 Location 2 Power Series
Depth (in) Sx (ksi) Sy (ksi) Txy (ksi) Smax (ksi) Tmax (ksi)
beta (deg)
0.000 -0.125 ±0.005 +0.040 ±0.004 -0.449 ±0.014 +0.414 ±0.010 +0.457 ±0.015 +50 ±0
0.005 -0.048 ±0.003 +0.061 ±0.003 -0.278 ±0.009 +0.289 ±0.006 +0.283 ±0.008 +51 ±1
0.010 +0.029 ±0.002 +0.082 ±0.003 -0.106 ±0.004 +0.165 ±0.002 +0.110 ±0.004 +52 ±0
0.015 +0.106 ±0.004 +0.103 ±0.004 +0.065 ±0.005 +0.170 ±0.009 +0.065 ±0.005 -44 ±0
0.020 +0.183 ±0.008 +0.125 ±0.005 +0.237 ±0.010 +0.393 ±0.017 +0.238 ±0.011 -41 ±1
0.025 +0.260 ±0.011 +0.146 ±0.007 +0.408 ±0.016 +0.615 ±0.025 +0.412 ±0.016 -41 ±0
0.030 +0.338 ±0.013 +0.167 ±0.009 +0.579 ±0.022 +0.838 ±0.033 +0.586 ±0.022 -41 ±0
Ring 1 Location 3 Power Series
Depth (in) Sx (ksi) Sy (ksi) Txy (ksi) Smax (ksi) Tmax (ksi)
beta (deg)
0.000 +0.751 ±0.026 -0.603 ±0.019 -0.449 ±0.016 +0.887 ±0.016 +0.813 ±0.006 +17 ±1
0.005 +0.583 ±0.019 -0.359 ±0.011 -0.363 ±0.012 +0.706 ±0.011 +0.594 ±0.005 +19 ±1
0.010 +0.414 ±0.013 -0.114 ±0.005 -0.276 ±0.009 +0.532 ±0.006 +0.383 ±0.004 +23 ±1
0.015 +0.246 ±0.010 +0.130 ±0.007 -0.190 ±0.007 +0.387 ±0.003 +0.199 ±0.006 +37 ±1
0.020 +0.077 ±0.011 +0.374 ±0.016 -0.104 ±0.007 +0.407 ±0.011 +0.182 ±0.002 +72 ±2
0.025 -0.092 ±0.016 +0.619 ±0.023 -0.018 ±0.010 +0.619 ±0.023 +0.356 ±0.003 +89 ±1
0.030 -0.260 ±0.023 +0.863 ±0.032 +0.068 ±0.013 +0.867 ±0.034 +0.566 ±0.006 -87 ±1

WP #254 NOVA Chemicals Research & Technology Centre #DTPH56-06-BAA-001
Effect of Surface Preparation on Residual Stresses in Multi-layer Coatings
- 131 -
Ring 1 Location 4 Power Series
Depth (in) Sx (ksi) Sy (ksi) Txy (ksi) Smax (ksi) Tmax (ksi)
beta (deg)
0.000 +0.287 ±0.017 +0.479 ±0.017 -1.232 ±0.039 +1.618 ±0.022 +1.235 ±0.039 +47 ±0
0.005 +0.327 ±0.014 +0.361 ±0.012 -0.761 ±0.024 +1.105 ±0.011 +0.761 ±0.024 +46 ±0
0.010 +0.366 ±0.012 +0.243 ±0.008 -0.290 ±0.010 +0.601 ±0.001 +0.296 ±0.010 +39 ±0
0.015 +0.406 ±0.014 +0.124 ±0.006 +0.181 ±0.013 +0.494 ±0.023 +0.229 ±0.013 -26 ±1
0.020 +0.445 ±0.019 +0.006 ±0.008 +0.652 ±0.028 +0.913 ±0.042 +0.688 ±0.028 -36 ±0
0.025 +0.485 ±0.025 -0.112 ±0.012 +1.123 ±0.043 +1.348 ±0.062 +1.162 ±0.043 -38 ±1
0.030 +0.524 ±0.031 -0.230 ±0.017 +1.594 ±0.059 +1.785 ±0.083 +1.638 ±0.059 -38 ±0
Ring 1 Location 5 Power Series
Depth (in) Sx (ksi) Sy (ksi) Txy (ksi) Smax (ksi) Tmax (ksi)
beta (deg)
0.000 -0.227 ±0.012 -0.270 ±0.013 -1.048 ±0.042 +0.800 ±0.030 +1.049 ±0.042 +44 ±0
0.005 -0.059 ±0.004 -0.085 ±0.005 -0.846 ±0.029 +0.774 ±0.024 +0.846 ±0.029 +45 ±0
0.010 +0.109 ±0.005 +0.100 ±0.005 -0.644 ±0.020 +0.748 ±0.015 +0.644 ±0.020 +45 ±0
0.015 +0.276 ±0.013 +0.284 ±0.013 -0.441 ±0.019 +0.721 ±0.007 +0.441 ±0.019 +45 ±0
0.020 +0.444 ±0.020 +0.469 ±0.021 -0.239 ±0.029 +0.696 ±0.008 +0.239 ±0.029 +47 ±1
0.025 +0.611 ±0.028 +0.654 ±0.030 -0.036 ±0.042 +0.675 ±0.009 +0.042 ±0.039 +60 ±1
0.030
Ring 1 Average Power Series
Depth (in) Sx (ksi) Sy (ksi) Txy (ksi) Smax (ksi) Tmax (ksi)
beta (deg)
0.000 +0.207 ±0.015 -
+0.068 ±0.012 -0.634 ±0.023 +0.813 ±0.018 +0.744 ±0.021 +31 ±0
0.005 +0.219 ±0.010 +0.005 ±0.007 -0.451 ±0.015 +0.634 ±0.012 +0.521 ±0.014 +33 ±1
0.010 +0.232 ±0.008 +0.079 ±0.005 -0.268 ±0.009 +0.458 ±0.006 +0.303 ±0.008 +33 ±0
0.015 +0.244 ±0.010 +0.151 ±0.007 -0.085 ±0.009 +0.395 ±0.010 +0.197 ±0.009 +7 ±1
0.020 +0.256 ±0.013 +0.225 ±0.011 +0.098 ±0.015 +0.521 ±0.017 +0.280 ±0.015 +18 ±1
0.025 +0.269 ±0.018 +0.298 ±0.016 +0.281 ±0.023 +0.695 ±0.025 +0.412 ±0.021 +27 ±1
0.030 +0.157 ±0.020 +0.254 ±0.018 +0.539 ±0.025 +0.935 ±0.040 +0.730 ±0.023 -24 ±1
LOW BLAST PROFILE
Ring 2 Uniform Stresses
Location Sx (ksi) Sy (ksi) Txy (ksi) Smax (ksi) Tmax (ksi) beta (deg)
1 +0.362 ±0.011 +0.288 ±0.009 +0.105 ±0.003 +0.437 ±0.014 +0.111 ±0.004 -35 ±0
2 +0.293 ±0.010 +0.132 ±0.005 -0.129 ±0.004 +0.365 ±0.005 +0.152 ±0.002 +29 ±1
3 +0.373 ±0.012 +0.299 ±0.010 -0.047 ±0.002 +0.396 ±0.011 +0.060 ±0.001 +26 ±1
4 +0.627 ±0.020 +0.297 ±0.010 -0.101 ±0.004 +0.656 ±0.018 +0.193 ±0.003 +16 ±1
5 +0.649 ±0.021 +0.656 ±0.021 +0.004 ±0.000 +0.658 ±0.021 +0.005 ±0.001 -66 ±1
Average +0.461 ±0.147 +0.334 ±0.081 -0.034 ±0.104 +0.502 ±0.132 +0.104 ±0.057 -6 ±0
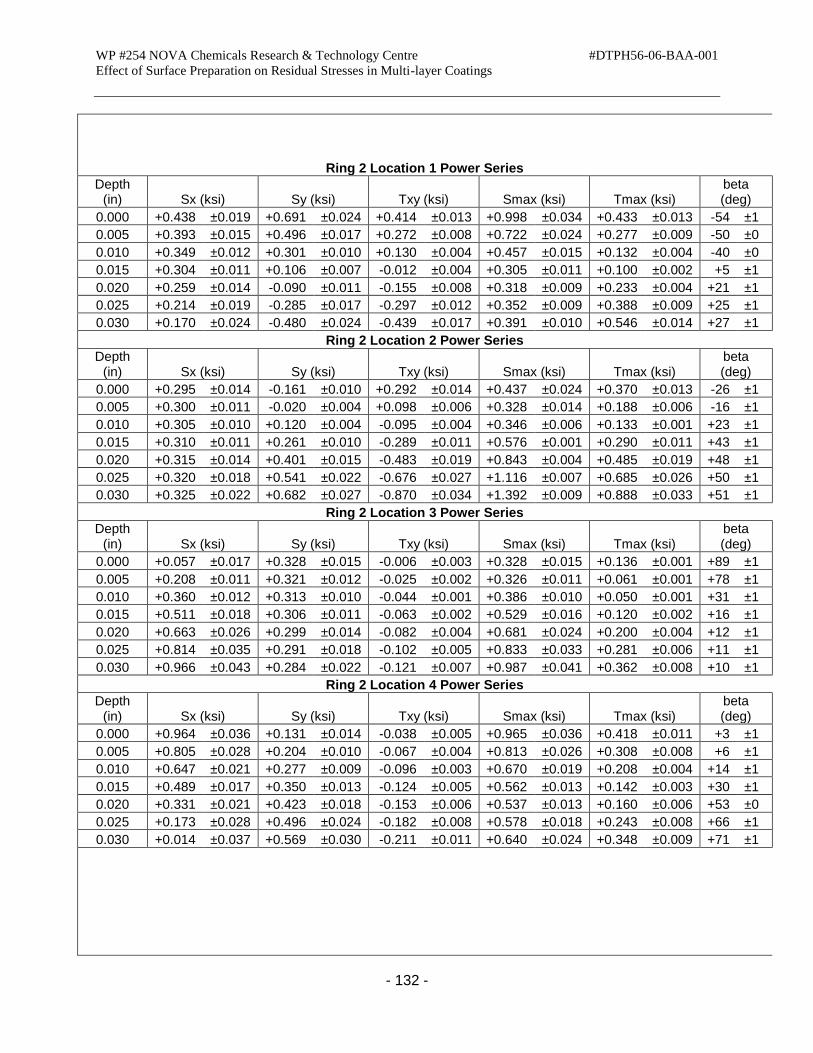
WP #254 NOVA Chemicals Research & Technology Centre #DTPH56-06-BAA-001
Effect of Surface Preparation on Residual Stresses in Multi-layer Coatings
- 132 -
Ring 2 Location 1 Power Series
Depth (in) Sx (ksi) Sy (ksi) Txy (ksi) Smax (ksi) Tmax (ksi)
beta (deg)
0.000 +0.438 ±0.019 +0.691 ±0.024 +0.414 ±0.013 +0.998 ±0.034 +0.433 ±0.013 -54 ±1
0.005 +0.393 ±0.015 +0.496 ±0.017 +0.272 ±0.008 +0.722 ±0.024 +0.277 ±0.009 -50 ±0
0.010 +0.349 ±0.012 +0.301 ±0.010 +0.130 ±0.004 +0.457 ±0.015 +0.132 ±0.004 -40 ±0
0.015 +0.304 ±0.011 +0.106 ±0.007 -0.012 ±0.004 +0.305 ±0.011 +0.100 ±0.002 +5 ±1
0.020 +0.259 ±0.014 -0.090 ±0.011 -0.155 ±0.008 +0.318 ±0.009 +0.233 ±0.004 +21 ±1
0.025 +0.214 ±0.019 -0.285 ±0.017 -0.297 ±0.012 +0.352 ±0.009 +0.388 ±0.009 +25 ±1
0.030 +0.170 ±0.024 -0.480 ±0.024 -0.439 ±0.017 +0.391 ±0.010 +0.546 ±0.014 +27 ±1
Ring 2 Location 2 Power Series
Depth (in) Sx (ksi) Sy (ksi) Txy (ksi) Smax (ksi) Tmax (ksi)
beta (deg)
0.000 +0.295 ±0.014 -0.161 ±0.010 +0.292 ±0.014 +0.437 ±0.024 +0.370 ±0.013 -26 ±1
0.005 +0.300 ±0.011 -0.020 ±0.004 +0.098 ±0.006 +0.328 ±0.014 +0.188 ±0.006 -16 ±1
0.010 +0.305 ±0.010 +0.120 ±0.004 -0.095 ±0.004 +0.346 ±0.006 +0.133 ±0.001 +23 ±1
0.015 +0.310 ±0.011 +0.261 ±0.010 -0.289 ±0.011 +0.576 ±0.001 +0.290 ±0.011 +43 ±1
0.020 +0.315 ±0.014 +0.401 ±0.015 -0.483 ±0.019 +0.843 ±0.004 +0.485 ±0.019 +48 ±1
0.025 +0.320 ±0.018 +0.541 ±0.022 -0.676 ±0.027 +1.116 ±0.007 +0.685 ±0.026 +50 ±1
0.030 +0.325 ±0.022 +0.682 ±0.027 -0.870 ±0.034 +1.392 ±0.009 +0.888 ±0.033 +51 ±1
Ring 2 Location 3 Power Series
Depth (in) Sx (ksi) Sy (ksi) Txy (ksi) Smax (ksi) Tmax (ksi)
beta (deg)
0.000 +0.057 ±0.017 +0.328 ±0.015 -0.006 ±0.003 +0.328 ±0.015 +0.136 ±0.001 +89 ±1
0.005 +0.208 ±0.011 +0.321 ±0.012 -0.025 ±0.002 +0.326 ±0.011 +0.061 ±0.001 +78 ±1
0.010 +0.360 ±0.012 +0.313 ±0.010 -0.044 ±0.001 +0.386 ±0.010 +0.050 ±0.001 +31 ±1
0.015 +0.511 ±0.018 +0.306 ±0.011 -0.063 ±0.002 +0.529 ±0.016 +0.120 ±0.002 +16 ±1
0.020 +0.663 ±0.026 +0.299 ±0.014 -0.082 ±0.004 +0.681 ±0.024 +0.200 ±0.004 +12 ±1
0.025 +0.814 ±0.035 +0.291 ±0.018 -0.102 ±0.005 +0.833 ±0.033 +0.281 ±0.006 +11 ±1
0.030 +0.966 ±0.043 +0.284 ±0.022 -0.121 ±0.007 +0.987 ±0.041 +0.362 ±0.008 +10 ±1
Ring 2 Location 4 Power Series
Depth (in) Sx (ksi) Sy (ksi) Txy (ksi) Smax (ksi) Tmax (ksi)
beta (deg)
0.000 +0.964 ±0.036 +0.131 ±0.014 -0.038 ±0.005 +0.965 ±0.036 +0.418 ±0.011 +3 ±1
0.005 +0.805 ±0.028 +0.204 ±0.010 -0.067 ±0.004 +0.813 ±0.026 +0.308 ±0.008 +6 ±1
0.010 +0.647 ±0.021 +0.277 ±0.009 -0.096 ±0.003 +0.670 ±0.019 +0.208 ±0.004 +14 ±1
0.015 +0.489 ±0.017 +0.350 ±0.013 -0.124 ±0.005 +0.562 ±0.013 +0.142 ±0.003 +30 ±1
0.020 +0.331 ±0.021 +0.423 ±0.018 -0.153 ±0.006 +0.537 ±0.013 +0.160 ±0.006 +53 ±0
0.025 +0.173 ±0.028 +0.496 ±0.024 -0.182 ±0.008 +0.578 ±0.018 +0.243 ±0.008 +66 ±1
0.030 +0.014 ±0.037 +0.569 ±0.030 -0.211 ±0.011 +0.640 ±0.024 +0.348 ±0.009 +71 ±1
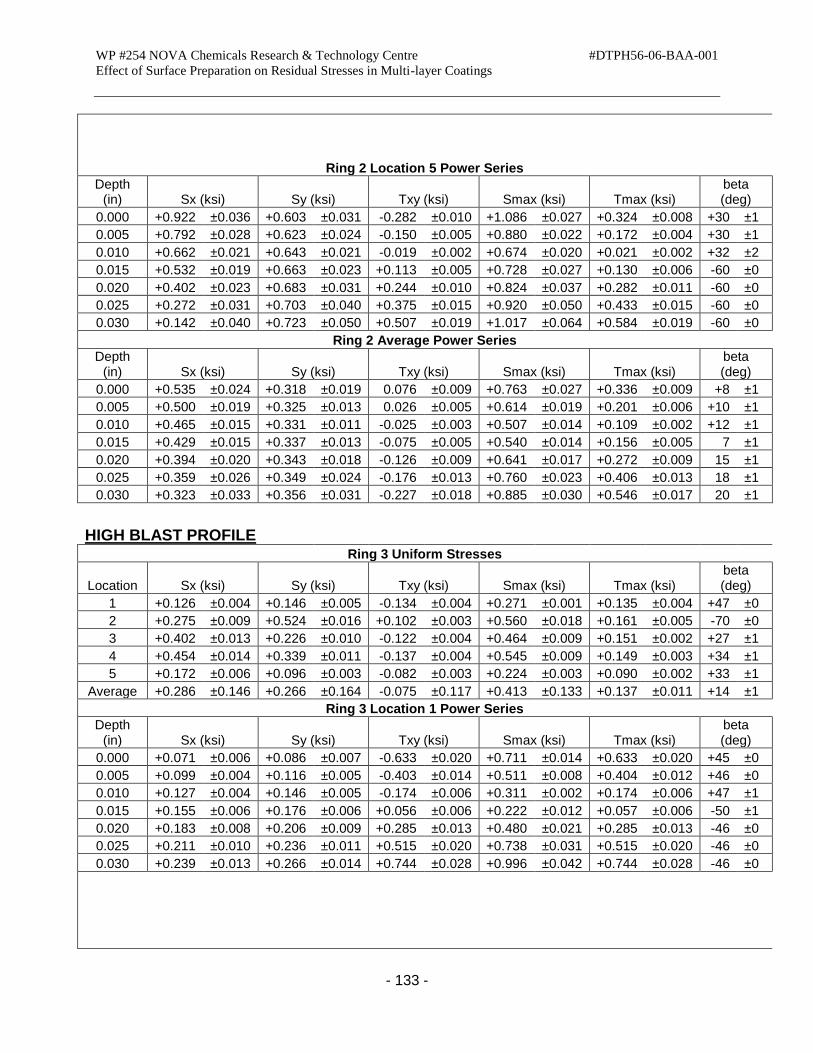
WP #254 NOVA Chemicals Research & Technology Centre #DTPH56-06-BAA-001
Effect of Surface Preparation on Residual Stresses in Multi-layer Coatings
- 133 -
Ring 2 Location 5 Power Series
Depth (in) Sx (ksi) Sy (ksi) Txy (ksi) Smax (ksi) Tmax (ksi)
beta (deg)
0.000 +0.922 ±0.036 +0.603 ±0.031 -0.282 ±0.010 +1.086 ±0.027 +0.324 ±0.008 +30 ±1
0.005 +0.792 ±0.028 +0.623 ±0.024 -0.150 ±0.005 +0.880 ±0.022 +0.172 ±0.004 +30 ±1
0.010 +0.662 ±0.021 +0.643 ±0.021 -0.019 ±0.002 +0.674 ±0.020 +0.021 ±0.002 +32 ±2
0.015 +0.532 ±0.019 +0.663 ±0.023 +0.113 ±0.005 +0.728 ±0.027 +0.130 ±0.006 -60 ±0
0.020 +0.402 ±0.023 +0.683 ±0.031 +0.244 ±0.010 +0.824 ±0.037 +0.282 ±0.011 -60 ±0
0.025 +0.272 ±0.031 +0.703 ±0.040 +0.375 ±0.015 +0.920 ±0.050 +0.433 ±0.015 -60 ±0
0.030 +0.142 ±0.040 +0.723 ±0.050 +0.507 ±0.019 +1.017 ±0.064 +0.584 ±0.019 -60 ±0
Ring 2 Average Power Series
Depth (in) Sx (ksi) Sy (ksi) Txy (ksi) Smax (ksi) Tmax (ksi)
beta (deg)
0.000 +0.535 ±0.024 +0.318 ±0.019 0.076 ±0.009 +0.763 ±0.027 +0.336 ±0.009 +8 ±1
0.005 +0.500 ±0.019 +0.325 ±0.013 0.026 ±0.005 +0.614 ±0.019 +0.201 ±0.006 +10 ±1
0.010 +0.465 ±0.015 +0.331 ±0.011 -0.025 ±0.003 +0.507 ±0.014 +0.109 ±0.002 +12 ±1
0.015 +0.429 ±0.015 +0.337 ±0.013 -0.075 ±0.005 +0.540 ±0.014 +0.156 ±0.005 7 ±1
0.020 +0.394 ±0.020 +0.343 ±0.018 -0.126 ±0.009 +0.641 ±0.017 +0.272 ±0.009 15 ±1
0.025 +0.359 ±0.026 +0.349 ±0.024 -0.176 ±0.013 +0.760 ±0.023 +0.406 ±0.013 18 ±1
0.030 +0.323 ±0.033 +0.356 ±0.031 -0.227 ±0.018 +0.885 ±0.030 +0.546 ±0.017 20 ±1
HIGH BLAST PROFILE
Ring 3 Uniform Stresses
Location Sx (ksi) Sy (ksi) Txy (ksi) Smax (ksi) Tmax (ksi) beta (deg)
1 +0.126 ±0.004 +0.146 ±0.005 -0.134 ±0.004 +0.271 ±0.001 +0.135 ±0.004 +47 ±0
2 +0.275 ±0.009 +0.524 ±0.016 +0.102 ±0.003 +0.560 ±0.018 +0.161 ±0.005 -70 ±0
3 +0.402 ±0.013 +0.226 ±0.010 -0.122 ±0.004 +0.464 ±0.009 +0.151 ±0.002 +27 ±1
4 +0.454 ±0.014 +0.339 ±0.011 -0.137 ±0.004 +0.545 ±0.009 +0.149 ±0.003 +34 ±1
5 +0.172 ±0.006 +0.096 ±0.003 -0.082 ±0.003 +0.224 ±0.003 +0.090 ±0.002 +33 ±1
Average +0.286 ±0.146 +0.266 ±0.164 -0.075 ±0.117 +0.413 ±0.133 +0.137 ±0.011 +14 ±1
Ring 3 Location 1 Power Series
Depth (in) Sx (ksi) Sy (ksi) Txy (ksi) Smax (ksi) Tmax (ksi)
beta (deg)
0.000 +0.071 ±0.006 +0.086 ±0.007 -0.633 ±0.020 +0.711 ±0.014 +0.633 ±0.020 +45 ±0
0.005 +0.099 ±0.004 +0.116 ±0.005 -0.403 ±0.014 +0.511 ±0.008 +0.404 ±0.012 +46 ±0
0.010 +0.127 ±0.004 +0.146 ±0.005 -0.174 ±0.006 +0.311 ±0.002 +0.174 ±0.006 +47 ±1
0.015 +0.155 ±0.006 +0.176 ±0.006 +0.056 ±0.006 +0.222 ±0.012 +0.057 ±0.006 -50 ±1
0.020 +0.183 ±0.008 +0.206 ±0.009 +0.285 ±0.013 +0.480 ±0.021 +0.285 ±0.013 -46 ±0
0.025 +0.211 ±0.010 +0.236 ±0.011 +0.515 ±0.020 +0.738 ±0.031 +0.515 ±0.020 -46 ±0
0.030 +0.239 ±0.013 +0.266 ±0.014 +0.744 ±0.028 +0.996 ±0.042 +0.744 ±0.028 -46 ±0

WP #254 NOVA Chemicals Research & Technology Centre #DTPH56-06-BAA-001
Effect of Surface Preparation on Residual Stresses in Multi-layer Coatings
- 134 -
Ring 3 Location 2 Power Series
Depth (in) Sx (ksi) Sy (ksi) Txy (ksi) Smax (ksi) Tmax (ksi)
beta (deg)
0.000 +0.613 ±0.022 +1.121 ±0.038 +0.361 ±0.012 +1.308 ±0.045 +0.441 ±0.015 -63 ±1
0.005 +0.439 ±0.015 +0.827 ±0.027 +0.242 ±0.007 +0.943 ±0.031 +0.310 ±0.010 -64 ±0
0.010 +0.264 ±0.009 +0.534 ±0.018 +0.123 ±0.004 +0.581 ±0.019 +0.182 ±0.006 -69 ±0
0.015 +0.089 ±0.007 +0.240 ±0.012 +0.003 ±0.003 +0.240 ±0.012 +0.076 ±0.003 -89 ±1
0.020 -0.086 ±0.010 -0.054 ±0.016 -0.116 ±0.006 +0.047 ±0.008 +0.117 ±0.006 +49 ±1
0.025 -0.261 ±0.016 -0.347 ±0.026 -0.235 ±0.010 -0.065 ±0.010 +0.239 ±0.011 +40 ±1
0.030 -0.436 ±0.023 -0.641 ±0.036 -0.354 ±0.015 -0.169 ±0.015 +0.369 ±0.015 +37 ±0
Ring 3 Location 3 Power Series
Depth (in) Sx (ksi) Sy (ksi) Txy (ksi) Smax (ksi) Tmax (ksi)
beta (deg)
0.000 +0.644 ±0.024 +0.286 ±0.013 -0.421 ±0.013 +0.922 ±0.009 +0.457 ±0.010 +33 ±1
0.005 +0.527 ±0.018 +0.251 ±0.009 -0.283 ±0.009 +0.704 ±0.008 +0.315 ±0.006 +32 ±1
0.010 +0.409 ±0.013 +0.216 ±0.007 -0.146 ±0.005 +0.488 ±0.008 +0.175 ±0.002 +28 ±1
0.015 +0.292 ±0.011 +0.181 ±0.007 -0.008 ±0.004 +0.292 ±0.011 +0.056 ±0.002 +4 ±2
0.020 +0.174 ±0.013 +0.146 ±0.009 +0.129 ±0.007 +0.290 ±0.018 +0.130 ±0.007 -42 ±0
0.025 +0.057 ±0.018 +0.111 ±0.012 +0.266 ±0.012 +0.352 ±0.026 +0.268 ±0.011 -48 ±1
0.030 -0.061 ±0.024 +0.076 ±0.016 +0.404 ±0.016 +0.417 ±0.035 +0.410 ±0.015 -50 ±1
Ring 3 Location 4 Power Series
Depth (in) Sx (ksi) Sy (ksi) Txy (ksi) Smax (ksi) Tmax (ksi)
beta (deg)
0.000 +0.370 ±0.021 +0.237 ±0.016 -0.423 ±0.014 +0.732 ±0.005 +0.428 ±0.013 +41 ±1
0.005 +0.413 ±0.015 +0.288 ±0.012 -0.291 ±0.009 +0.648 ±0.006 +0.298 ±0.008 +39 ±0
0.010 +0.455 ±0.014 +0.339 ±0.010 -0.160 ±0.005 +0.567 ±0.008 +0.170 ±0.004 +35 ±1
0.015 +0.497 ±0.017 +0.389 ±0.014 -0.028 ±0.004 +0.504 ±0.015 +0.061 ±0.000 +14 ±2
0.020 +0.539 ±0.023 +0.440 ±0.019 +0.103 ±0.006 +0.604 ±0.027 +0.114 ±0.007 -32 ±0
0.025 +0.581 ±0.030 +0.491 ±0.024 +0.235 ±0.011 +0.775 ±0.037 +0.239 ±0.011 -40 ±1
0.030 +0.623 ±0.037 +0.542 ±0.030 +0.366 ±0.015 +0.951 ±0.048 +0.368 ±0.016 -42 ±0
Ring 3 Location 5 Power Series
Depth (in) Sx (ksi) Sy (ksi) Txy (ksi) Smax (ksi) Tmax (ksi)
beta (deg)
0.000 -0.055 ±0.010 +0.010 ±0.005 -0.381 ±0.012 +0.360 ±0.006 +0.383 ±0.013 +47 ±1
0.005 +0.055 ±0.005 +0.056 ±0.003 -0.244 ±0.008 +0.299 ±0.004 +0.244 ±0.008 +45 ±0
0.010 +0.166 ±0.006 +0.102 ±0.003 -0.106 ±0.004 +0.245 ±0.001 +0.111 ±0.003 +37 ±1
0.015 +0.277 ±0.010 +0.148 ±0.005 +0.032 ±0.004 +0.285 ±0.011 +0.072 ±0.004 -13 ±1
0.020 +0.388 ±0.015 +0.194 ±0.008 +0.169 ±0.008 +0.486 ±0.020 +0.195 ±0.008 -30 ±0
0.025 +0.499 ±0.020 +0.240 ±0.011 +0.307 ±0.014 +0.703 ±0.028 +0.333 ±0.013 -34 ±0
0.030 +0.610 ±0.026 +0.287 ±0.013 +0.444 ±0.017 +0.921 ±0.037 +0.473 ±0.018 -35 ±0

WP #254 NOVA Chemicals Research & Technology Centre #DTPH56-06-BAA-001
Effect of Surface Preparation on Residual Stresses in Multi-layer Coatings
- 135 -
Ring 3 Average Power Series
Depth (in) Sx (ksi) Sy (ksi) Txy (ksi) Smax (ksi) Tmax (ksi)
beta (deg)
0.000 +0.329 ±0.017 +0.348 ±0.016 -0.299 ±0.014 +0.807 ±0.016 +0.468 ±0.014 +21 ±1
0.005 +0.307 ±0.011 +0.308 ±0.011 -0.196 ±0.009 +0.621 ±0.011 +0.314 ±0.009 +20 ±0
0.010 +0.284 ±0.009 +0.267 ±0.009 -0.093 ±0.005 +0.438 ±0.008 +0.162 ±0.004 +16 ±1
0.015 +0.262 ±0.010 +0.227 ±0.009 +0.011 ±0.004 +0.309 ±0.012 +0.064 ±0.003 -27 ±1
0.020 +0.240 ±0.014 +0.186 ±0.012 +0.114 ±0.008 +0.381 ±0.019 +0.168 ±0.008 -20 ±0
0.025 +0.217 ±0.019 +0.146 ±0.017 +0.218 ±0.013 +0.501 ±0.026 +0.319 ±0.013 -26 ±1
0.030 +0.195 ±0.025 +0.106 ±0.022 +0.321 ±0.018 +0.623 ±0.035 +0.473 ±0.018 -27 ±0
STANDARD SURFACE - 1 Year Old
Big Ring 4 Uniform Stresses
Depth (in) Sx (ksi) Sy (ksi) Txy (ksi) Smax (ksi) Tmax (ksi)
beta (deg)
1 +0.288 ±0.009 +0.238 ±0.008 +0.085 ±0.003 +0.352 ±0.011 +0.089 ±0.003 -37 ±0
2 +0.132 ±0.004 +0.119 ±0.004 -0.019 ±0.001 +0.146 ±0.003 +0.020 ±0.001 +36 ±1
3 +0.052 ±0.002 +0.128 ±0.004 +0.036 ±0.002 +0.142 ±0.005 +0.052 ±0.002 -68 ±0
4 +0.132 ±0.004 +0.155 ±0.005 +0.113 ±0.004 +0.257 ±0.008 +0.113 ±0.004 -48 ±0
5 +0.355 ±0.012 +0.337 ±0.011 +0.106 ±0.004 +0.453 ±0.014 +0.107 ±0.004 -43 ±0
Average +0.160 ±0.125 +0.163 ±0.092 +0.054 ±0.055 +0.225 ±0.134 +0.064 ±0.039 -32 ±0
Big Ring 4 Location 1 Power Series
Depth (in) Sx (ksi) Sy (ksi) Txy (ksi) Smax (ksi) Tmax (ksi)
beta (deg)
0.000 +0.587 ±0.021 +0.407 ±0.016 +0.253 ±0.009 +0.766 ±0.027 +0.269 ±0.009 -35 ±0
0.005 +0.440 ±0.015 +0.320 ±0.011 +0.176 ±0.006 +0.566 ±0.019 +0.186 ±0.006 -36 ±0
0.010 +0.293 ±0.010 +0.233 ±0.008 +0.098 ±0.004 +0.366 ±0.012 +0.103 ±0.003 -37 ±0
0.015 +0.146 ±0.007 +0.146 ±0.006 +0.021 ±0.002 +0.167 ±0.008 +0.021 ±0.002 -45 ±1
0.020 0.000 ±0.009 +0.059 ±0.008 -0.057 ±0.004 +0.093 ±0.005 +0.064 ±0.004 +59 ±1
0.025 -0.147 ±0.014 -0.028 ±0.012 -0.134 ±0.007 +0.059 ±0.007 +0.147 ±0.007 +57 ±0
0.030 -0.294 ±0.020 -0.114 ±0.016 -0.212 ±0.009 +0.026 ±0.009 +0.230 ±0.009 +57 ±1
Big Ring 4 Location 2 Power Series
Depth (in) Sx (ksi) Sy (ksi) Txy (ksi) Smax (ksi) Tmax (ksi)
beta (deg)
0.000 -0.056 ±0.008 -0.003 ±0.006 -0.048 ±0.003 +0.026 ±0.004 +0.055 ±0.003 +59 ±1
0.005 +0.037 ±0.004 +0.060 ±0.004 -0.035 ±0.002 +0.085 ±0.002 +0.037 ±0.002 +54 ±0
0.010 +0.130 ±0.004 +0.122 ±0.004 -0.021 ±0.001 +0.148 ±0.003 +0.022 ±0.001 +40 ±0
0.015 +0.223 ±0.008 +0.185 ±0.007 -0.008 ±0.001 +0.224 ±0.008 +0.021 ±0.001 +12 ±2
0.020 +0.315 ±0.012 +0.247 ±0.010 +0.005 ±0.002 +0.316 ±0.012 +0.035 ±0.002 -4 ±2
0.025 +0.408 ±0.016 +0.309 ±0.013 +0.019 ±0.003 +0.411 ±0.018 +0.053 ±0.003 -10 ±1
0.030 +0.501 ±0.021 +0.372 ±0.016 +0.032 ±0.004 +0.508 ±0.022 +0.072 ±0.004 -13 ±1

WP #254 NOVA Chemicals Research & Technology Centre #DTPH56-06-BAA-001
Effect of Surface Preparation on Residual Stresses in Multi-layer Coatings
- 136 -
Big Ring 4 Location 3 Power Series
Depth (in) Sx (ksi) Sy (ksi) Txy (ksi) Smax (ksi) Tmax (ksi)
beta (deg)
0.000 -0.008 ±0.004 +0.117 ±0.007 +0.119 ±0.004 +0.188 ±0.009 +0.134 ±0.005 -59 ±0
0.005 +0.021 ±0.002 +0.123 ±0.005 +0.080 ±0.003 +0.167 ±0.007 +0.095 ±0.003 -61 ±0
0.010 +0.050 ±0.002 +0.130 ±0.004 +0.042 ±0.002 +0.148 ±0.005 +0.058 ±0.002 -67 ±0
0.015 +0.079 ±0.003 +0.137 ±0.005 +0.004 ±0.001 +0.137 ±0.005 +0.029 ±0.001 -86 ±1
0.020 +0.109 ±0.005 +0.144 ±0.007 -0.034 ±0.003 +0.165 ±0.004 +0.038 ±0.002 +59 ±2
0.025 +0.138 ±0.006 +0.150 ±0.009 -0.072 ±0.004 +0.217 ±0.004 +0.073 ±0.004 +47 ±1
0.030 +0.167 ±0.008 +0.157 ±0.011 -0.111 ±0.006 +0.273 ±0.004 +0.111 -±0.006 +44 ±1
Big Ring 4 Location 4 Power Series
Depth (in) Sx (ksi) Sy (ksi) Txy (ksi) Smax (ksi) Tmax (ksi)
beta (deg)
0.000 +0.272 ±0.010 +0.162 ±0.008 +0.343 ±0.011 +0.564 ±0.020 +0.347 ±0.011 -40 ±1
0.005 +0.204 ±0.007 +0.156 ±0.006 +0.237 ±0.007 +0.418 ±0.014 +0.238 ±0.008 -42 ±0
0.010 +0.137 ±0.005 +0.149 ±0.005 +0.131 ±0.004 +0.275 ±0.009 +0.131 ±0.004 -46 ±0
0.015 +0.070 ±0.004 +0.143 ±0.006 +0.025 ±0.003 +0.151 ±0.007 +0.044 ±0.003 -73 ±2
0.020 +0.003 ±0.005 +0.136 ±0.007 -0.081 ±0.006 +0.174 ±0.003 +0.104 ±0.004 +65 ±1
0.025 -0.064 ±0.007 +0.130 ±0.009 -0.186 ±0.009 +0.243 ±0.001 +0.210 ±0.007 +59 ±1
0.030 -0.131 ±0.010 +0.123 ±0.011 -0.292 ±0.012 +0.314 ±0.001 +0.319 ±0.011 +57 ±1
Big Ring 4 Location 5 Power Series
Depth (in) Sx (ksi) Sy (ksi) Txy (ksi) Smax (ksi) Tmax (ksi)
beta (deg)
0.000 +0.464 ±0.020 +0.430 ±0.018 +0.036 ±0.005 +0.487 ±0.023 +0.040 ±0.005 -32 ±1
0.005 +0.410 ±0.015 +0.383 ±0.014 +0.068 ±0.004 +0.466 ±0.018 +0.070 ±0.004 -39 ±1
0.010 +0.356 ±0.011 +0.337 ±0.010 +0.101 ±0.003 +0.447 ±0.015 +0.101 ±0.003 -42 ±0
0.015 +0.302 ±0.011 +0.290 ±0.011 +0.133 ±0.005 +0.429 ±0.015 +0.133 ±0.005 -44 ±0
0.020 +0.247 ±0.014 +0.244 ±0.013 +0.165 ±0.007 +0.411 ±0.020 +0.165 ±0.007 -45 ±0
0.025 +0.193 ±0.018 +0.197 ±0.017 +0.198 ±0.009 +0.393 ±0.026 +0.198 ±0.009 -45 ±0
0.030 +0.139 ±0.023 +0.151 ±0.022 +0.230 ±0.012 +0.375 ±0.034 +0.230 ±0.012 -46 ±0
Big Ring 4 Average Power Series
Depth (in) Sx (ksi) Sy (ksi) Txy (ksi) Smax (ksi) Tmax (ksi)
beta (deg)
0.000 +0.252 ±0.013 +0.223 ±0.011 +0.141 ±0.006 +0.406 ±0.017 +0.169 ±0.007 -21 ±1
0.005 +0.222 ±0.009 +0.208 ±0.008 +0.105 ±0.004 +0.340 ±0.012 +0.125 ±0.005 -25 ±0
0.010 +0.193 ±0.006 +0.194 ±0.006 +0.070 ±0.003 +0.277 ±0.009 +0.083 ±0.003 -30 ±0
0.015 +0.164 ±0.007 +0.180 ±0.007 +0.035 ±0.002 +0.222 ±0.009 +0.050 ±0.002 -47 ±1
0.020 +0.135 ±0.009 +0.166 ±0.009 +0.000 ±0.004 +0.232 ±0.009 +0.081 ±0.004 +27 ±1
0.025 +0.106 ±0.012 +0.152 ±0.012 -0.035 ±0.006 +0.265 ±0.011 +0.136 ±0.006 +22 ±1
0.030 +0.076 ±0.016 +0.138 ±0.015 -0.071 ±0.009 +0.299 ±0.014 +0.192 ±0.006 +20 ±1

WP #254 NOVA Chemicals Research & Technology Centre #DTPH56-06-BAA-001
Effect of Surface Preparation on Residual Stresses in Multi-layer Coatings
- 137 -
"ZERO" COMPRESSION PLAQUE Plaque Uniform Stresses
Location Sx (ksi) Sy (ksi) Txy (ksi) Smax (ksi) Tmax (ksi) beta (deg)
1 +0.188 ±0.006 +0.115 ±0.004 +0.115 ±0.004 +0.272 ±0.009 +0.121 ±0.004 -36 ±0
2 +0.057 ±0.002 -0.200 ±0.006 -0.166 ±0.006 +0.139 ±0.002 +0.210 ±0.006 +26 ±0
3 -0.021 ±0.001 -0.116 ±0.004 +0.044 ±0.002 -0.004 ±0.002 +0.065 ±0.000 -21 ±1
4 +0.111 ±0.004 +0.043 ±0.002 -0.099 ±0.003 +0.181 ±0.001 +0.105 ±0.003 +35 ±1
5 +0.077 ±0.003 +0.041 ±0.002 +0.001 ±0.001 +0.077 ±0.003 +0.018 ±0.001 -2 ±1
Average +0.069 ±0.106 -0.020 ±0.163 -0.018 ±0.146 +0.111 ±0.138 +0.087 ±0.073 0 ±1
Plaque Location 1 Power Series
Depth (in) Sx (ksi) Sy (ksi) Txy (ksi) Smax (ksi) Tmax (ksi)
beta (deg)
0.000 +0.377 ±0.015 +0.331 ±0.013 +0.165 ±0.008 +0.521 ±0.021 +0.167 ±0.008 -41 ±0
0.005 +0.269 ±0.010 +0.209 ±0.007 +0.139 ±0.005 +0.381 ±0.014 +0.142 ±0.005 -39 ±0
0.010 +0.161 ±0.005 +0.086 ±0.004 +0.112 ±0.004 +0.241 ±0.008 +0.118 ±0.004 -36 ±0
0.015 +0.053 ±0.005 -0.036 ±0.005 +0.085 ±0.004 +0.104 ±0.009 +0.096 ±0.003 -31 ±1
0.020 -0.055 ±0.010 -0.159 ±0.010 +0.058 ±0.006 -0.029 ±0.015 +0.078 ±0.005 -24 ±2
0.025 -0.163 ±0.015 -0.282 ±0.015 +0.032 ±0.009 -0.155 ±0.019 +0.067 ±0.005 -14 ±3
0.030
Plaque Location 2 Power Series
Depth (in) Sx (ksi) Sy (ksi) Txy (ksi) Smax (ksi) Tmax (ksi)
beta (deg)
0.000 +0.001 ±0.005 -0.765 ±0.027 -0.515 ±0.018 +0.261 ±0.005 +0.642 ±0.021 +27 ±0
0.005 +0.043 ±0.002 -0.453 ±0.015 -0.331 ±0.011 +0.208 ±0.004 +0.413 ±0.013 +27 ±1
0.010 +0.084 ±0.003 -0.142 ±0.006 -0.146 ±0.005 +0.156 ±0.001 +0.184 ±0.005 +26 ±0
0.015 +0.126 ±0.005 +0.169 ±0.012 +0.039 ±0.007 +0.192 ±0.016 +0.045 ±0.007 -59 ±0
0.020 +0.167 ±0.009 +0.480 ±0.024 +0.224 ±0.013 +0.597 ±0.031 +0.273 ±0.015 -62 ±1
0.025 +0.209 ±0.011 +0.791 ±0.036 +0.409 ±0.020 +1.002 ±0.047 +0.502 ±0.023 -63 ±0
0.030
Plaque Location 3 Power Series
Depth (in) Sx (ksi) Sy (ksi) Txy (ksi) Smax (ksi) Tmax (ksi)
beta (deg)
0.000 -0.211 ±0.008 -0.495 ±0.016 +0.026 ±0.003 -0.209 ±0.009 +0.144 ±0.004 -5 ±1
0.005 -0.112 ±0.004 -0.309 ±0.010 +0.035 ±0.002 -0.106 ±0.005 +0.104 ±0.002 -10 ±1
0.010 -0.013 ±0.002 -0.123 ±0.005 +0.043 ±0.002 +0.001 ±0.003 +0.070 ±0.001 -19 ±1
0.015 +0.085 ±0.004 +0.062 ±0.005 +0.051 ±0.002 +0.126 ±0.006 +0.052 ±0.002 -39 ±1
0.020 +0.184 ±0.007 +0.248 ±0.011 +0.059 ±0.003 +0.283 ±0.012 +0.067 ±0.004 -59 ±0
0.025 +0.283 ±0.011 +0.434 ±0.017 +0.067 ±0.004 +0.459 ±0.019 +0.101 ±0.005 -69 ±0
0.030 +0.382 ±0.014 +0.619 ±0.023 +0.075 ±0.006 +0.641 ±0.025 +0.141 ±0.007 -74 ±1

WP #254 NOVA Chemicals Research & Technology Centre #DTPH56-06-BAA-001
Effect of Surface Preparation on Residual Stresses in Multi-layer Coatings
- 138 -
Plaque Location 4 Power Series
Depth (in) Sx (ksi) Sy (ksi) Txy (ksi) Smax (ksi) Tmax (ksi)
beta (deg)
0.000 +0.228 ±0.008 +0.001 ±0.003 -0.335 ±0.011 +0.468 ±0.004 +0.353 ±0.010 +36 ±1
0.005 +0.172 ±0.006 +0.019 ±0.002 -0.226 ±0.009 +0.334 ±0.003 +0.239 ±0.006 +36 ±1
0.010 +0.117 ±0.004 +0.036 ±0.002 -0.118 ±0.004 +0.201 ±0.001 +0.124 ±0.004 +35 ±1
0.015 +0.062 ±0.003 +0.054 ±0.003 -0.009 ±0.003 +0.068 ±0.000 +0.010 ±0.003 +33 ±5
0.020 +0.007 ±0.004 +0.071 ±0.004 +0.099 ±0.006 +0.143 ±0.009 +0.104 ±0.005 -54 ±0
0.025 -0.048 ±0.006 +0.088 ±0.005 +0.208 ±0.009 +0.239 ±0.014 +0.219 ±0.009 -54 ±1
0.030 -0.104 ±0.008 +0.106 ±0.006 +0.316 ±0.013 +0.334 ±0.019 +0.333 ±0.012 -54 ±1
Plaque Location 5 Power Series
Depth (in) Sx (ksi) Sy (ksi) Txy (ksi) Smax (ksi) Tmax (ksi)
beta (deg)
0.000 +0.132 ±0.005 +0.147 ±0.006 +0.086 ±0.004 +0.226 ±0.009 +0.086 ±0.004 -48 ±1
0.005 +0.103 ±0.004 +0.095 ±0.004 +0.047 ±0.002 +0.146 ±0.006 +0.047 ±0.002 -43 ±0
0.010 +0.075 ±0.003 +0.043 ±0.002 +0.008 ±0.001 +0.077 ±0.003 +0.018 ±0.001 -13 ±1
0.015 +0.046 ±0.002 -0.009 ±0.002 -0.031 ±0.002 +0.060 ±0.001 +0.041 ±0.001 +24 ±1
0.020 +0.017 ±0.003 -0.061 ±0.004 -0.070 ±0.003 +0.058 ±0.000 +0.080 ±0.003 +30 ±1
0.025 -0.011 ±0.005 -0.113 ±0.006 -0.109 ±0.005 +0.058 ±0.001 +0.120 ±0.005 +32 ±1
0.030 -0.040 ±0.006 -0.165 ±0.008 -0.147 ±0.007 +0.057 ±0.001 +0.160 ±0.006 +34 ±1
Plaque Average Power Series
Depth (in) Sx (ksi) Sy (ksi) Txy (ksi) Smax (ksi) Tmax (ksi)
beta (deg)
0.000 +0.105 ±0.008 -0.156 ±0.013 -0.115 ±0.009 +0.253 ±0.010 +0.278 ±0.009 -6 ±1
0.005 +0.095 ±0.005 -0.088 ±0.008 -0.067 ±0.006 +0.193 ±0.006 +0.189 ±0.006 -6 ±1
0.010 +0.085 ±0.003 -0.020 ±0.004 -0.020 ±0.003 +0.135 ±0.003 +0.103 ±0.003 -1 ±1
0.015 +0.074 ±0.004 +0.048 ±0.005 +0.027 ±0.004 +0.110 ±0.006 +0.049 ±0.003 -14 ±2
0.020 +0.064 ±0.007 +0.116 ±0.011 +0.074 ±0.006 +0.210 ±0.013 +0.120 ±0.006 -34 ±1
0.025 +0.054 ±0.010 +0.184 ±0.016 +0.121 ±0.009 +0.321 ±0.020 +0.202 ±0.009 -34 ±1
0.030 +0.079 ±0.009 +0.187 ±0.012 +0.081 ±0.009 +0.344 ±0.015 +0.211 ±0.008 -31 ±1

WP #254 NOVA Chemicals Research & Technology Centre #DTPH56-06-BAA-001
Effect of Surface Preparation on Residual Stresses in Multi-layer Coatings
- 139 -
APPENDIX 2 – Shaw FBE Product Data Sheet

WP #254 NOVA Chemicals Research & Technology Centre #DTPH56-06-BAA-001
Effect of Surface Preparation on Residual Stresses in Multi-layer Coatings
- 140 -

WP #254 NOVA Chemicals Research & Technology Centre #DTPH56-06-BAA-001
Effect of Surface Preparation on Residual Stresses in Multi-layer Coatings
- 141 -
APPENDIX 3 – Shaw HPCC Product Data Sheet

WP #254 NOVA Chemicals Research & Technology Centre #DTPH56-06-BAA-001
Effect of Surface Preparation on Residual Stresses in Multi-layer Coatings
- 142 -