The GPS Odograph User's Guide - ROSA P
28
WN 96W0000046 The GPS Odograph User’s Guide April 1996 Robert G. Nystrom John A. Harding sponsor: FHWA Dept. No.: J090 Contract No.: DTFH61-96-C00040 Project No.: 049518E20A
-
Upload
khangminh22 -
Category
Documents
-
view
1 -
download
0
Transcript of The GPS Odograph User's Guide - ROSA P
WN 96W0000046
The GPS Odograph User’s Guide
April 1996
Robert G. NystromJohn A. Harding
sponsor: FHWADept. No.: J090
Contract No.: DTFH61-96-C00040Project No.: 049518E20A

(c)1996 Mitretek Systems, Inc.This work also contains information that is the copyright work of The MITRE Corporation. All rightsreserved. The information was produced for the U.S. Government under Contracts numbered DTFH61-91-G00027 and DTFH61-95-C-00040. and is subject to Federal Acquisition Regulation Clause 52.227-14, Rights inData-General.
Abstract
The GPS-based Odograph Prototype (GOP or GPS Odograph) was developed in an effortsponsored by The Federal Highway Administration (FHWA). The purpose of this effort wasto develop a means of using inexpensive commercial off-the-self laptop (or notebook)computers and Global Positioning System (GPS) receivers to automate the collection ofroadway speed and travel time data. This document, The GPS Odograph Users Guide. waswritten to provide instructions on how to use the GPS Odograph.
KEYWORDS: GPS Odograph, Intelligent Transportation System
iii
Table of Contents
Section
1 Introduction
1.1 What the GPS Odograph Does2.1 System Components
2 Operating the GPS Odograph
3 Dynamic Display and Marking Delineator Locations
4 Data Display Menu Options
4.1 Static DisplaysAppendix A Abbreviated User Instructions
Appendix B Roadway Profile
Appendix C Input/Output Data File Format
Distribution List
Page
l-l
l-ll-3
2-1
3-l
4-l
4-lA-l
B-l
C-l
DI-1
V
List of Figures
Figure
l-l Dynamic Display Screen l-2
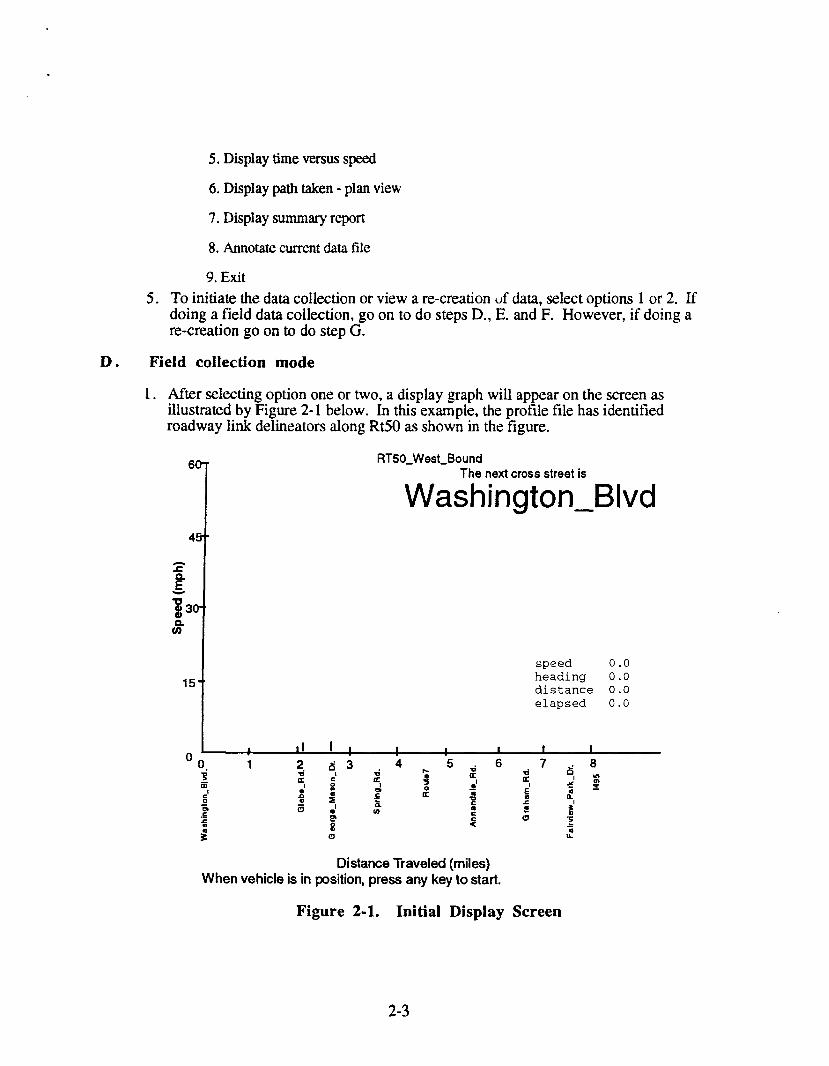
2-l Initial Display Screen 2-3
4-2 Dynamic Display Screen 2-4
4-3 Speed Profile and Travel Time Graph 4-2
4-2 Plan View 4-3
Page
vi
List of Tables
Table
4-l Sample Summary ReportB-l Roadway Profile ParametersB-2 Example Roadway ProfileC-l Sample Data File
vii
Page
4-3B-2
B-3C-l
Section 1
Introduction
The GPS-based Odograph Prototype (GOP or GPS Odograph) was developed in an effortsponsored by The Federal Highway Administration (FHWA). The purpose of this effort wasto develop a means of using inexpensive commercial off-the-self laptop (or notebook)computers and Global Positioning System (GPS) receivers to automate the collection ofroadway speed and travel time data This document, The GPS Odograph Users Guide, waswritten to provide instructions on how to use the GPS Odograph.
The GOP itself consists of a GPS receiver, a laptop PC, and GOP software. To complete thesystem there is a serial cable to connect the GPS receiver and the computer, an antenna for theGPS receiver that can be attached to the roof of a test vehicle (via a magnet), and a cable thatplugs into the cigarette lighter to provide power to the GPS receiver and to the computer. Thecomputer might also be operated under battery power.
For abbreviated instructions for operation of the GPS Odograph, please turnto Appendix A. Using those instructions which minimize advance preparation willminimize initial effort, but are not recommended for longer term use. More satisfactory resultswill be derived through use of roadway profiles for the routes to be run for data collection, seemore detail in later sections, i.e., Section 2, step A.
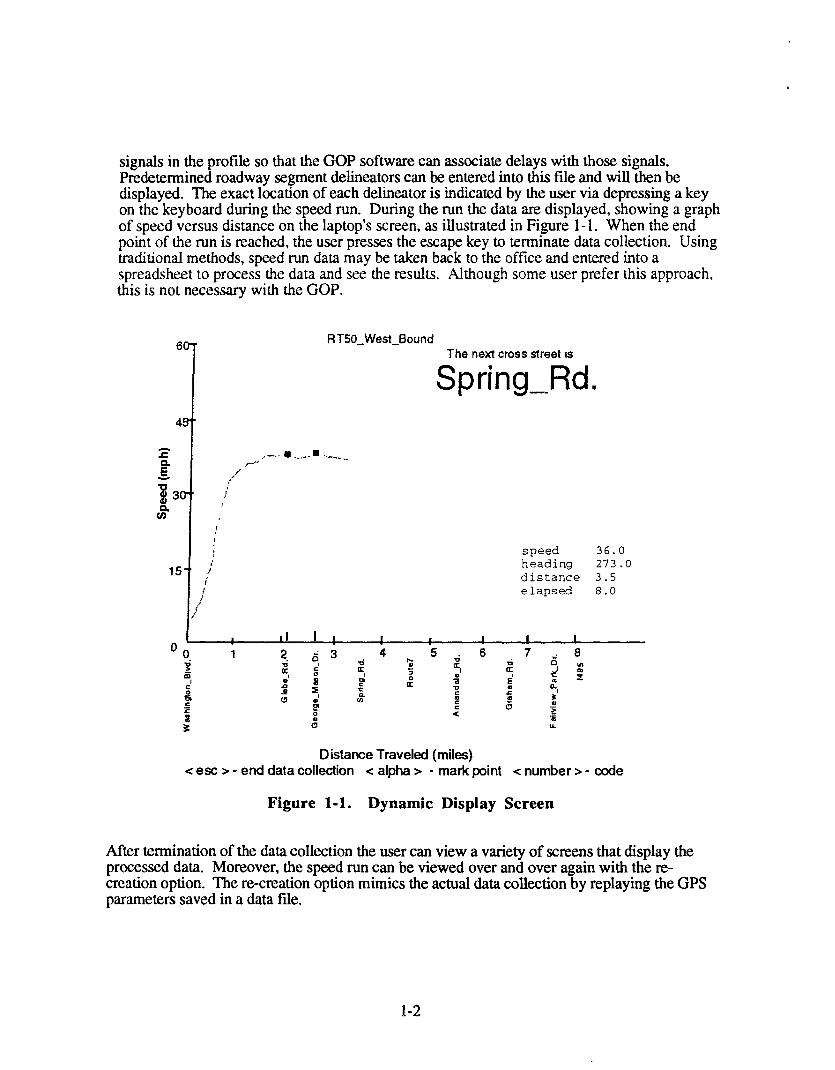
1.1 What the GPS Odograph Does
The GOP is a portable traffic speed and travel time data collection device. The GOP automatesthe collection and processing of speed and travel time data through the use of GPS data. UsingGPS to track a vehicle’s speed, heading, and position eliminates any need to connect to or useinformation from the vehicle, such as odometer readings, or to take time readings from astopwatch. All data, taken at one or two second intervals, is stored to an output file. Dataprocessing is done automatically and represented graphically or in tabular form. If data from aspecific speed run are saved, that run can be re-created and the displays can be reviewed toconduct further analysis.
The GOP operation mimics the manual process of taking a speed run. The GOP recordsspeed, time, heading, and calculates traveled distance. Having speed and distance data everysecond or two, supports a very detailed picture of roadway segment operational characteristics.Some users have used the GOP to collect field data and have continued using spread sheetsback in the office for processing the data. A manually conducted speed run only suppliesinformation averaged over each delineated roadway segment. Similarly, every speed run hasstart, interim and end points, and it is no different with the GOP. The GOP is started at thedesignated start of the run. Interim points can also be indicated by the user to separate thecollected data into segments. An input file, the roadway profile, can be included to customizethe displays by identifying delineator points, such as cross streets, and to enhance the datacollection and output displays. It may also be useful to identify intersections with traffic
l-l
1.2 System Components
The GOP is very simple in concept. It consists of three major components which are: 1) GPSreceiver, 2) laptop (or notebook) computer, and 3) GOP software. There are also three minorcomponents: the GPS antenna, a serial cable for connecting the GPS receiver and the laptopcomputer, and the cable that supplies power to the GPS receiver.
Through use of the GPS satellites, the GPS receiver supplies the parameters that enable thedetermination of vehicle location, speed, and direction of travel. The message from the GPSreceiver is sent to the laptop via the serial port The type of GPS receiver that is used in theprototype utilizes an external antenna that is magnetically mounted to the outside center of theroof of the vehicle used. Also, the GPS receiver is powered by 12 volt DC through thecigarette lighter.
Testing has shown the performance of the GOP to be directly linked to the accuracy of theGPS receiver being used. Through informal testing of various GPS units, the best performerfound to date has been the Trimble Navigation Place? GPS 400 receiver.
The laptop computer supports the GPS message input, input from the user, and is the platformby which the collected data is processed and output to the user. The laptop also houses thesoftware, the user input file, and facilitates the recording of the collected data output file todisk. The program should be run in the DOS environment on a 386 or higher computer. TheGOP program was written in C++. The GOP executable file is designated gopexe.exe.
1-3
Section 2
Operating the GPS Odograph
This section provides instructions for operating the GOP. The explanation of each step coversall the information the user must know to conduct a speed run with the GOP. Abbreviateddata collection user instructions are provided in Appendix A. More complete anddetailed preparation and operating instructions are explained in this section. File formats areexplained in the Appendices B and C.
Initial Use - When the GPS Odograph software is initially received, working copies of theoriginal disk should be made and the original should be safely put away. The working copy ofthe disk will have files written to it during operatim. The user will also want to prepareroadway profiles and place them on working copies of the disk.
A. Create a Roadway Profile (highly recommended, but optional)
1.
2.
3.
4.
B .
1.
2.
Initially the subject segments of the roadway on which the speed run is going to beconducted should be identified. Appropriate start, interim, and end delineator pointsshould be chosen.
If the user wishes to customize the system to the particular run, the roadway profileparameters need to be developed according to the roadway profile format (format ispresented in Appendix B). Parameter values for distances need not be exact,reasonably good estimates are sufficient and will not hamper data collection. Asdescribed in Appendix B, the distances may be determined using GPS data from theGOP.
Create an ASCII file and enter the roadway profile parameters.
Once the roadway profile is complete it should be saved as a DOS text file. The filedesignation uses not more than the first 6 characters to identify the route described inthe file, followed by a direction indication of two characters, EB, WB, NB, or SBindicating the east, west, north or south bound direction. The extension for theroadway profile file has been designated as .plf. For example, the roadway profilename might be Rt50wb.plf as illustrated in Appendix B. This file should be placed onthe disk with the GOP software.
Connecting the Hardware
First connect the serial cable to the serial port on the computer and serial port on theGPS receiver.
Connect the GPS receiver and the computer to the vehicle’s power source or thecomputer may be battery powered.
2-l
3. Connect the antenna to the GPS receiver and place the antenna on the roof of thevehicle.
4. Turn on the computer.
C. Starting the GPS Odograph software
1.. Insert the disk with the GOP software into the disk drive, usually the A: drive.2. Switch the computer to the A: drive3. Starting the executable can be done two ways, batch mode or command line.
. Batch mode: Type the name of the batch command that contains the commandline inputs and depress the return or enter key. The command with that batchcommand name would have been prepared in advance and placed on the diskcontaining the GOP software and the roadway profile file.
. Command line: at the A:> prompt type gopexe followed by the command fieldinputs. (If you just enter gopexe the program will prompt you for the othercommand field information.) For example:
A:>gopexe f Rt50 EWNote that the command fields are separated by spaces.The first command field is the name of the executable file that runs the GOP(gopexe).The second command field indicates the mode the GOP will operate, f - forfield data collection run and r - for recreating a field run from a data file.The third command field indicates the route or road identification, Rt50 (up to 6characters). This indicates to the software what input files to use. This is theidentification also used for the data files. If no indication is entered, theprogram will use a default profile. The operator will still be prompted tosupply an output data file name.The fourth and last command field input, EW, indicates the directions of theinput file that will be used, Rt50eb.plf and Rt50wb.plfThe command line entry is completed by depressing the return or enter key.
4. After the software is started the main menu will appear. Route 50 is used as theexample here. .
1. Collect data (road name and direction) Rt50_East_Bound
2. Collect data (road name and opposite direction) Rt50_West_bound
3. Obtain new profile
4. Display time and speed versus distance
2-2
E . Indication of a marked point or code data in field collection mode
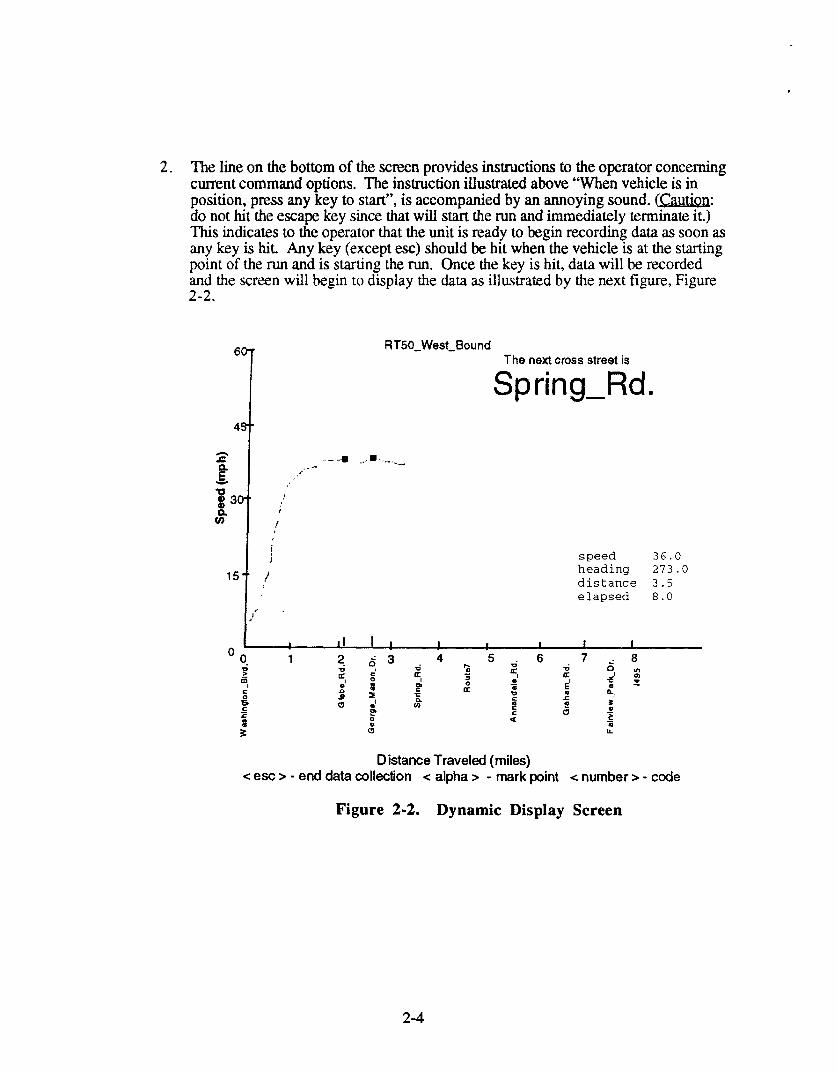
1. The association of points (roadway link delineators) such as cross streets with GPSdata points is accomplished by the operator pressing any letter key < alpha > whenthe vehicle reaches the point of interest. This is done during the collection of dataWhen an alpha key is pressed marking a delineator point, an indication of this isdisplayed on the screen by a highlighted box (n ) as shown in Figure 2-2. (The datafields are further explained in Appendix C.) , Note that the next reference pointidentified in the roadway profile as a delineator is indicated at the top of the display.
2. To otherwise code a data point as a point of interest, select and enter a number keyfrom 1 to 9, associated with the specific code. The number selected will be enteredwith the corresponding GPS data point into the output data file.
Note: a data point can not be both marked as a delineator and coded as a point of interest.
F. Termination of field data collection
1. To end the collection of data press the esc key. This is done at the end of the run.After the esc key is pressed, the instructions at the bottom of the screen will changeto, Press any key. Pressing any key, except the esc key, will invoke the mainmenu.
G . Re-creation Mode
1. After selecting option 1 or 2 the instructions on the bottom of the screen, “Pleaseenter input data file”, will prompt for a data file name. Enter a data file name, e.g.Rt5000.out, and press return.
2. After pressing return, the graphical screen display will appear. Next, the data pointsthat represent the speed vs. distance graph will be plotted. The points will be plottedfaster than the points are plotted during an actual collection run. The displayed graphis a re-creation of the graph displayed during the collection of the data.
3. Upon completion of the graph, the instructions at the bottom of the screen willchange to “Press any key”. Pressing any key, except esc, will invoke the mainmenu. Since the data file has been entered into the program, the operator may nowchoose any of the other display options (see Section 4) which will then use the samedata file.
H . Conducting other field runs or viewing other re-creations
To proceed with other field runs or recreations using a different profile file proceed as outlinedbelow. To continue use of the prior profile file for data collection runs or re-creations return tothe instructions at C-4.
1. Select the 3 option from the main menu and follow the instructions at the bottom ofthe screen.
2-5
2. First instruction: Enter the profile portion of the file nameExample: Rt50
and then press enter
3. Second instruction: Enter the first run directionType E, W, N, or S
4. Third instruction: Enter the second run directionType E, W, N, or S ( opposite of the first )
5. “Press any key to continue”, will appear at the bottom of the screen. Pressing anykey, except esc, will reconfigure the main menu to the new roadway, From herecontinue with the steps under C-4 to start a new run or continue with G-l to view are-creation.
I, Other menu options
1. Option 8 - Annotate current data file
This option enables the operator to input comments concerning the field run or re-creation directly into the data file. After the field run is completed or the t-e-creationis done, select option 8. Follow the instruction at the bottom of the screen. To exithit the return key twice.
2, Option 9 - Exit, exits program
3. Options 4,5,6, and 7 display collected data - These produce static displaysdiscussed in detail in Section 4.display.
Press the indicated key to invoke the desired
J. Data files
1. The data from a field run is saved automatically to a data file that is placed on thedisk in the A: drive. The data file is identified by the profile route name, e.g. Rt50,a number designation, 00, and ended with .out. The files are numbered insuccession from 00 to 99.of .out files. Examples:
After completing some runs the disk should have a series
Rt5000.outRt5001.outRt5002.ot.uRt5003.out
If no profile file is used the program will ask for an output file name.
2. The name of the profile used appears at the top of each data file. Furtherinformation on the data file format is contained in Appendix C.
2-6
Section 3
Dynamic Display and Marking Delineator Locations
The dynamic display is illustrated in Figures 2- 1 and 2-2. The dynamic display is a datacollection aide. This display is called dynamic because it displays speed verses distance data asit is collected. The cross streets (roadway link delineators} provided via the roadway profileare displayed across the bottom of the graph and the next cross street from the roadway profileis identified at the top of the display. The highlighted boxes indicate the location at which thecorresponding delineator was encountered as indicated by the user. The user does this bypressing any letter key <alpha key>. Having the user identify the exact location of thedelineator with respect to the data being collected helps to justify the data more preciselybetween delineated segments. At the end of the run the last delineator or end point is also to beidentified by the user.
After initializing a recreation of a speed run, a dynamic display is created that includes theidentified delineators. During a recreation, delineators do not need to be re-identified byoperator entry.
There are some nuances associated with identifying delineators.
. If a delineator is not marked by operator entry, the summary display will notcorrectly correlate with the delineated segments identified in the roadway profile.This can be remedied by editing the associated roadway profile and deleting thereferences concerning the missed delineator.
. In the opposite case when an extra delineator is identified by operator entry, tocorrectly correlate the roadway segment information displayed to the summaryreport, the new delineator must either be added to the roadway profile or thedelineator indication in the saved data must be removed. Removing a delineatorindication in the saved data is explained in the input/output data file formatinformation in Appendix C.
. Also, accidental double key hits (key hits within 2 seconds of each other) are treatedas one key hit by the program and the second hit is dropped.
3-l .
Section 4
Data Display Menu Options
After a run is completed a series of displays can be invoked. At the completion of a fieldrun pressing the escape key, or pressing any key after the dynamic screen is displayedduring a re-creation, invokes the main option menu. The four static display options arehighlighted in the illustration below.
1 Collect data (road name and direction) Rt50_East_Bound
2. Collect data (road name and opposite direction) Rt50_West_bound
3. Obtain new profile
4. Display time and speed versus distance
5. Display time versus speed
6. Display path taken - plan view
7. Display summary report
8. Annotate current data file
9. Exit
Just enter the designated number to view the corresponding screen. Currently the Displaytime versus speed option, number 5, has not been enabled so choosing option 5 doesnothing. At any time while viewing a static display, hitting any key will redisplay the staticdisplay option menu.
4.1 Stat ic Displays
The static graphical display choices include:
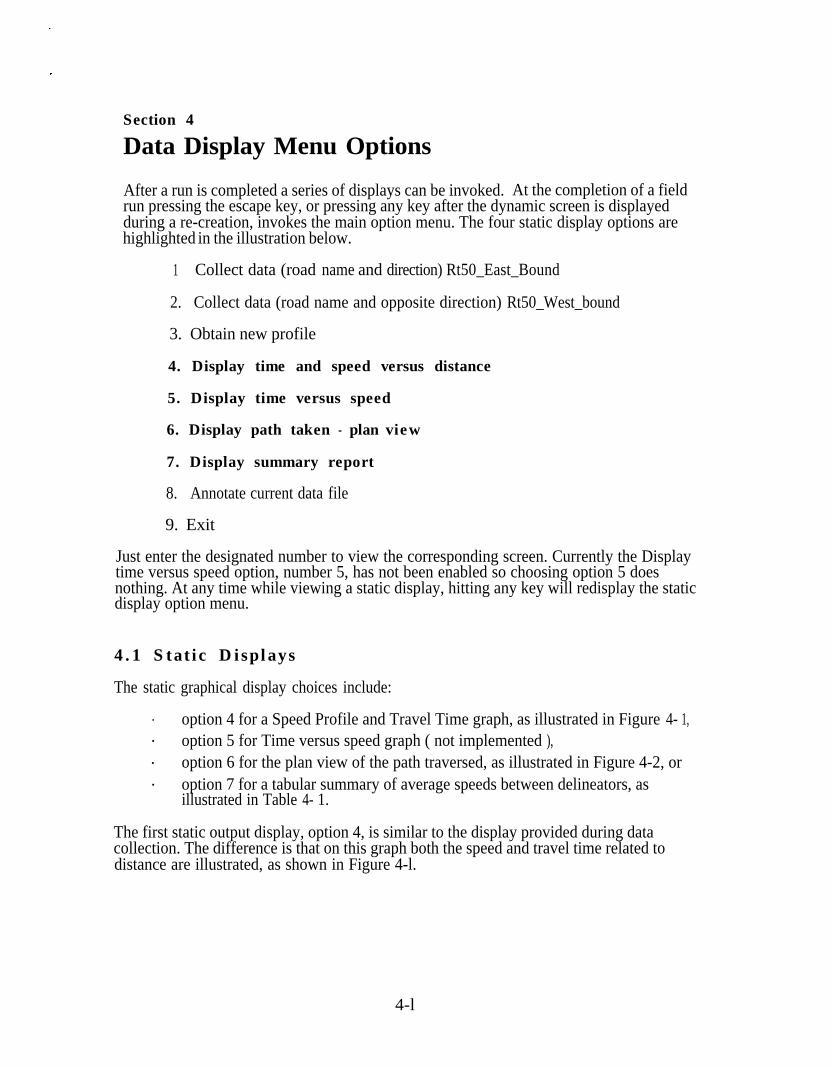
. option 4 for a Speed Profile and Travel Time graph, as illustrated in Figure 4- 1,
. option 5 for Time versus speed graph ( not implemented ),
. option 6 for the plan view of the path traversed, as illustrated in Figure 4-2, or
. option 7 for a tabular summary of average speeds between delineators, asillustrated in Table 4- 1.
The first static output display, option 4, is similar to the display provided during datacollection. The difference is that on this graph both the speed and travel time related todistance are illustrated, as shown in Figure 4-l.
4-l
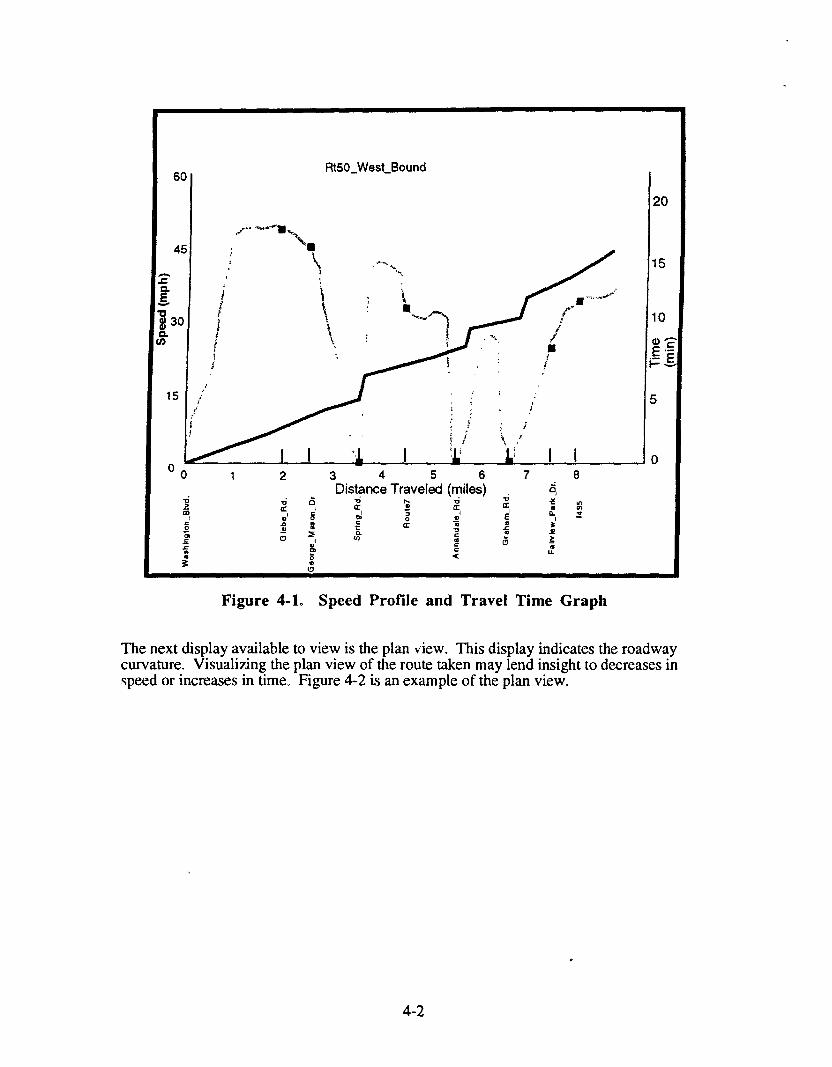
Plan viiRoute 50 - Washington Blvd to I-495
west
Distance is approximately 8 miles
Figure 4-2. Plan View
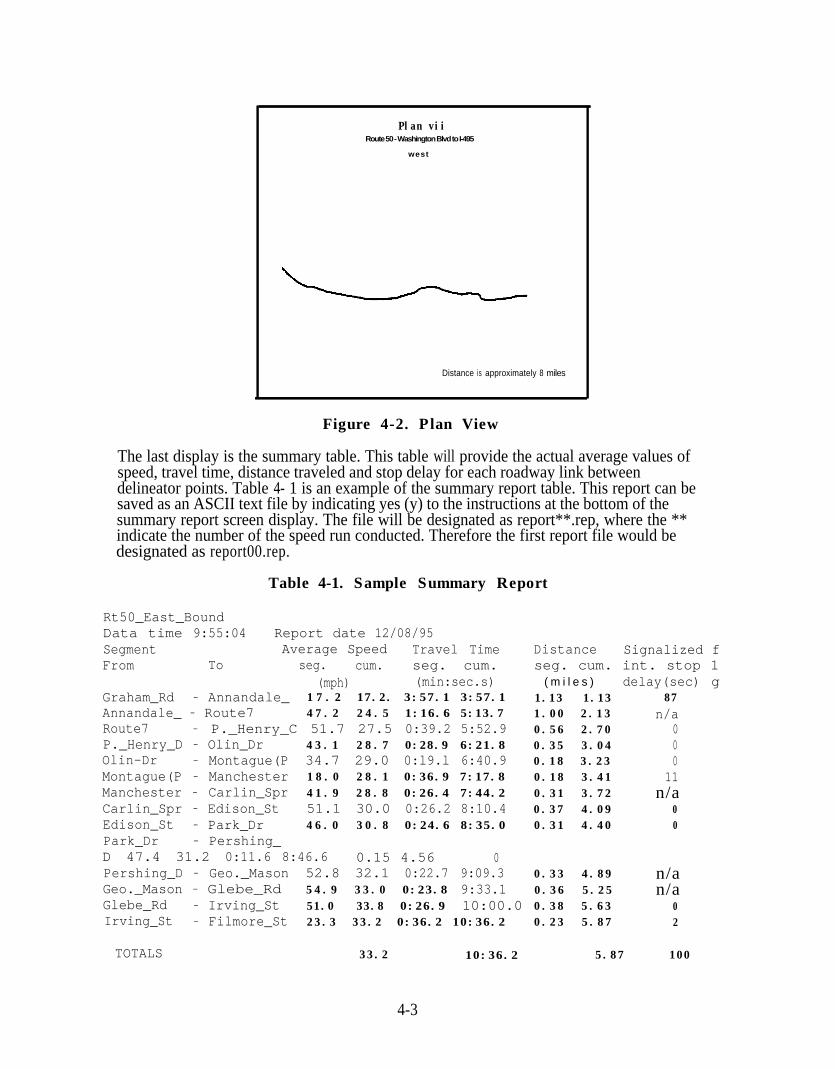
The last display is the summary table. This table will provide the actual average values ofspeed, travel time, distance traveled and stop delay for each roadway link betweendelineator points. Table 4- 1 is an example of the summary report table. This report can besaved as an ASCII text file by indicating yes (y) to the instructions at the bottom of thesummary report screen display. The file will be designated as report**.rep, where the **indicate the number of the speed run conducted. Therefore the first report file would bedesignated as report00.rep.
Table 4-1. Sample Summary Report
Rt50_East_BoundData time 9:55:04 Report date 12/08/95Segment Average Speed Travel TimeFrom To seg. cum. seg. cum.
(mph) (min:sec.s)Graham_Rd - Annandale_ 1 7 . 2 17.2. 3:57.1 3:57.1Annandale_ - Route7 47.2 24.5 1:16.6 5:13.7Route7 - P._Henry_C 51.7 27.5 0:39.2 5:52.9P._Henry_D - Olin_Dr 43.1 28.7 0:28.9 6:21.8Olin-Dr - Montague(P 34.7 29.0 0:l9.l 6:40.9Montague(P - Manchester 18.0 28.1 0:36.9 7:17.8Manchester - Carlin_Spr 41.9 28.8 0:26.4 7:44.2Carlin_Spr - Edison_St 51.1 30.0 0:26.2 8:10.4Edison_St - Park_Dr 46.0 30.8 0:24.6 8:35.0Park_Dr - Pershing_D 47.4 31.2 0:11.6 8:46.6 0.15 4.56 0Pershing_D - Geo._Mason 52.8 32.1 0:22.7 9:09.3Geo._Mason - Glebe_Rd 54.9 33.0 0:23.8 9:33.1Glebe_Rd - Irving_St 51.0 33.8 0:26.9 10:00.0Irving_St - Filmore_St 23.3 33.2 0:36.2 10:36.2
TOTALS 33.2 10:36.2
Distance Signalized fseg. cum. int. stop 1
( m i l e s ) delay(sec) g1.13 1.13 871.00 2.13 n/a0.56 2.70 00.35 3.04 00.18 3.23 00.18 3.41 110.31 3.72 n/a0.37 4.09 00.31 4.40 0
0.33 4.89 n/a0.36 5.25 n/a0.38 5.63 00.23 5.87 2
5.87 100
4-3
Appendix A
Abbreviated User Instructions
A.1
.
.
.
.
A . 2
A.2.1
A.2.1.1
.
Connect the Hardware
First connect the serial cable to the serial port on the computer and serial port on theGPS receiver.Connect the GPS receiver and the computer to the vehicle’s power source or thecomputer may be battery powered.Connect the antenna to the GPS receiver and place the antenna on the roof of thevehicle. Center the antenna on the car roof to give optimum satellite visibility.Turn on the computer.
Doing the Data Collection Run
Doing the Run With Minimum Preparation (Without the RoadwayProfile)
Starting the Software
To minimize preparation effort, it is assumed that the user has neither a profile fileor a batch command file, although preparation and use of the profile file is highlyrecommended.Insert the disk with the GOP software into the disk drive, usually the A: drive.Switch the computer to the A: driveType the command line inputs at the A:> prompt as follows:
A:>gopexe f
Note that the command fields are separated by spaces.
(When you just enter gopexe or gopexe f, the program prompts you for additionalinformation.)
The first command field is the name of the executable file that runs the GOP.(gopexe)The second command field indicates the mode the GOP will operate, f - for fieldrun and r - for re-creating a field run from a data file.The program will use a default profile. The operator will still be prompted tosupply an output data file name.
After the software is started the main menu will appear:
A-l
1. Collect data (road name and direction)2. Collect data (road name and opposite direction)3. Obtain new profile4. Display time and speed versus distance5. Display time versus speed6. Display path taken - plan view7. Display summary report8. Annotate current data file9. Exit
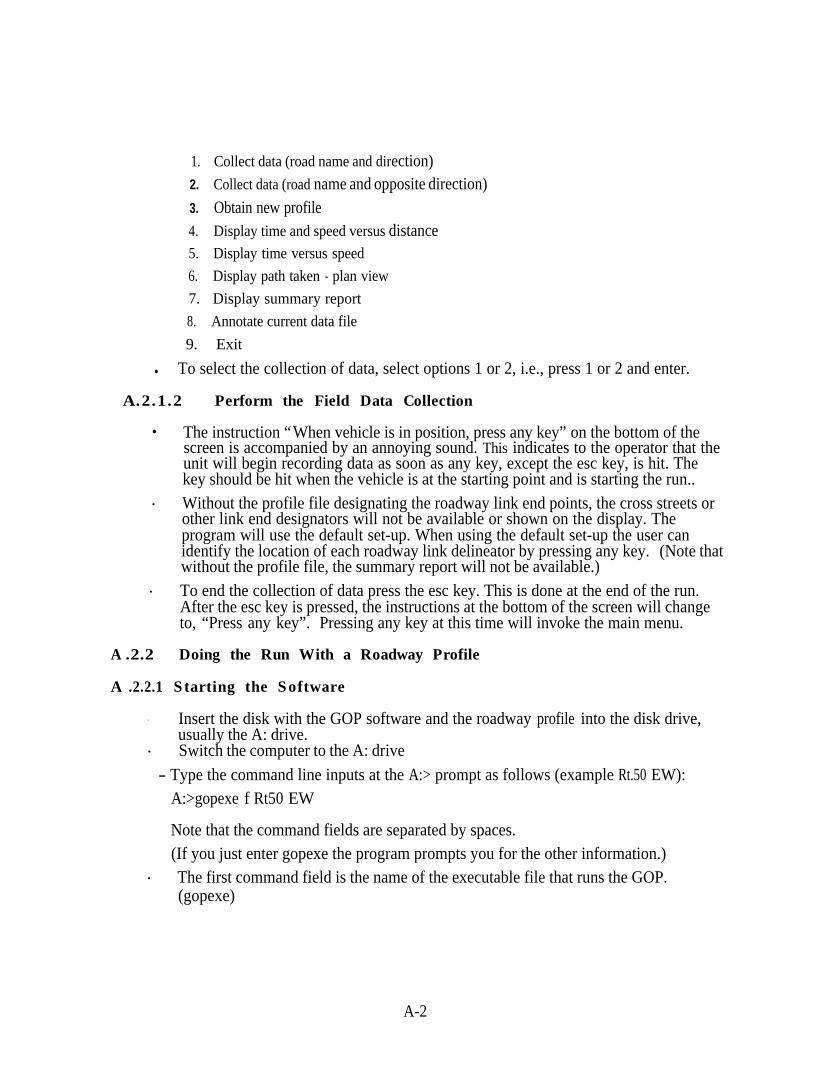
l To select the collection of data, select options 1 or 2, i.e., press 1 or 2 and enter.
A.2.1.2 Perform the Field Data Collection
l The instruction “When vehicle is in position, press any key” on the bottom of thescreen is accompanied by an annoying sound. This indicates to the operator that theunit will begin recording data as soon as any key, except the esc key, is hit. Thekey should be hit when the vehicle is at the starting point and is starting the run..
. Without the profile file designating the roadway link end points, the cross streets orother link end designators will not be available or shown on the display. Theprogram will use the default set-up. When using the default set-up the user canidentify the location of each roadway link delineator by pressing any key. (Note thatwithout the profile file, the summary report will not be available.)
. To end the collection of data press the esc key. This is done at the end of the run.After the esc key is pressed, the instructions at the bottom of the screen will changeto, “Press any key”. Pressing any key at this time will invoke the main menu.
A .2.2 Doing the Run With a Roadway Profile
A .2.2.1 Starting the Software
. Insert the disk with the GOP software and the roadway profile into the disk drive,usually the A: drive.
. Switch the computer to the A: drive- Type the command line inputs at the A:> prompt as follows (example Rt.50 EW):
A:>gopexe f Rt50 EW
Note that the command fields are separated by spaces.(If you just enter gopexe the program prompts you for the other information.)
. The first command field is the name of the executable file that runs the GOP.(gopexe)
A-2
.
A.2.2.2
.
.
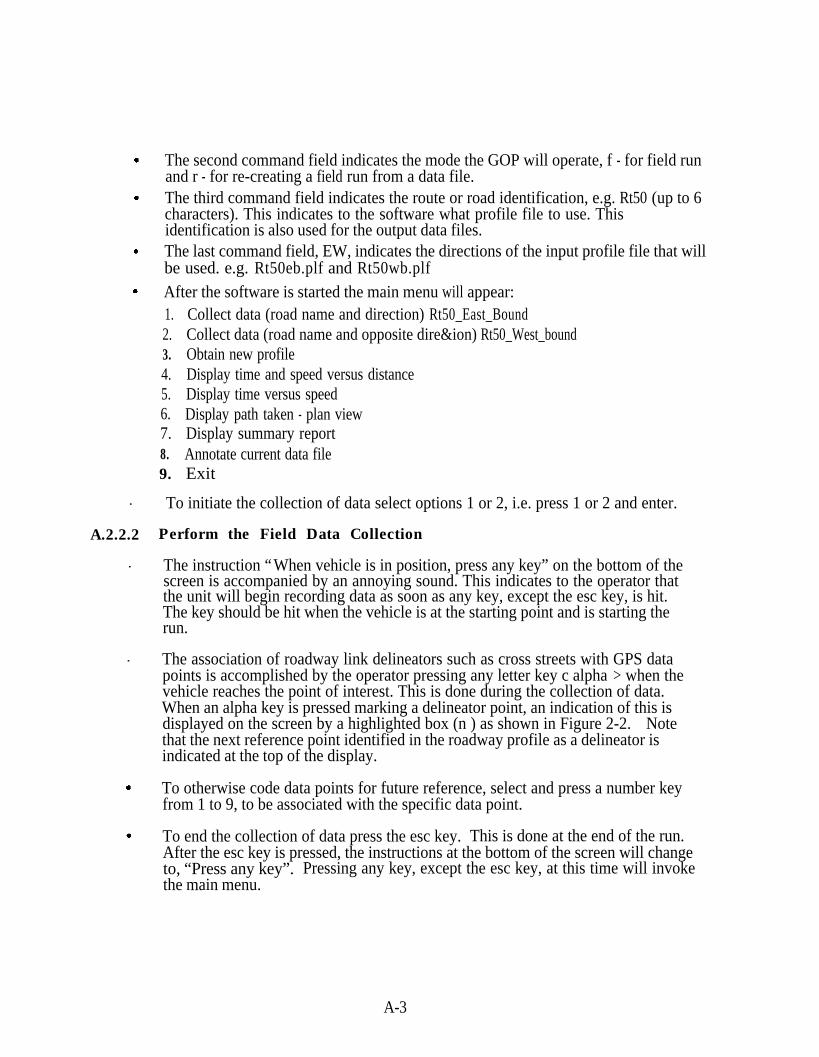
The second command field indicates the mode the GOP will operate, f - for field runand r - for re-creating a field run from a data file.The third command field indicates the route or road identification, e.g. Rt50 (up to 6characters). This indicates to the software what profile file to use. Thisidentification is also used for the output data files.The last command field, EW, indicates the directions of the input profile file that willbe used. e.g. Rt50eb.plf and Rt50wb.plfAfter the software is started the main menu will appear:1. Collect data (road name and direction) Rt50_East_Bound2. Collect data (road name and opposite dire&ion) Rt50_West_bound3. Obtain new profile4. Display time and speed versus distance5. Display time versus speed6. Display path taken - plan view7. Display summary report8. Annotate current data file9. Exit
To initiate the collection of data select options 1 or 2, i.e. press 1 or 2 and enter.
Perform the Field Data Collection
The instruction “When vehicle is in position, press any key” on the bottom of thescreen is accompanied by an annoying sound. This indicates to the operator thatthe unit will begin recording data as soon as any key, except the esc key, is hit.The key should be hit when the vehicle is at the starting point and is starting therun.
The association of roadway link delineators such as cross streets with GPS datapoints is accomplished by the operator pressing any letter key c alpha > when thevehicle reaches the point of interest. This is done during the collection of data.When an alpha key is pressed marking a delineator point, an indication of this isdisplayed on the screen by a highlighted box (n ) as shown in Figure 2-2. Notethat the next reference point identified in the roadway profile as a delineator isindicated at the top of the display.
To otherwise code data points for future reference, select and press a number keyfrom 1 to 9, to be associated with the specific data point.
To end the collection of data press the esc key. This is done at the end of the run.After the esc key is pressed, the instructions at the bottom of the screen will changeto, “Press any key”. Pressing any key, except the esc key, at this time will invokethe main menu.
A-3
Appendix B
Roadway Profile
There are many ways to obtain the information for the roadway profile. It can be completed bylooking at a map. If the map is detailed enough signal location, street names, and the estimateddistances between the streets can all be obtained. Another method is to drive the route and tovisually survey the route and obtain the distances between delineators by using the GPSOdograph. This can be done by not specifying a roadway profile during initialization of thesoftware. Not specifying a profile will cause the program to use the default set-up. Whenusing the default set-up the user can identify the location of each delineator by pressing anykey. This data can then be taken back to the office and the distances between delineators canbe calculated and entered into the roadway profile file. Another alternative is to use a profilefile with the delineator names and dummy distances for a field run and have the GOP determinethe distances needed for the profile file. The distances may be printed in the summary report,see Section 4.
One thing to remember is that the roadway profile data is an enhancement that customizes thedata files and displays. It does not alter any of the data collected but does make the data easierto use. It also enables the software to do the calculations needed to provide the summaryreport showing the measured characteristics of each roadway link identified in the roadwayprofile.
B. 1 The Roadway Profile Format
The Roadway Profile is an ASCII text tile that contains specific information concerning thecharacteristics of the route on which a speed/travel time survey is to be conducted. The intentof the file is to enhance the data collection effort by providing parameters that will customizethe screen displays to the route being surveyed, as shown in Figure 2- 1. The cross streetnames indicate the location of reference points as well as for calculations used to produce thesummary report. The number of signals and their locations invokes determination of delaydata related to each identified signal to be processed. Text designations such as direction andtitle are displayed on various output screens to identify the route the data is associated with.
The software can be used without a roadway profile; however, there are no screen indicationsfor when a segment delineator should be identified and the dynamic display screen utilizedwhile collecting data defaults to a length and speed that may not be appropriate for viewing thecollection of a particular survey. Note also that without the profile file, the summary reportwill not be available.
Table B-l is a listing of the parameters to be included in the roadway profile. Parameters thatdesignate distance and speed should be designated as floating point numbers. Parameters thatdesignate the number of segments, delineators, or signals should be designated as integers.Since spaces are used as field dividers, text designations must not contain any white spaces. Astreet name such a Steven Martin Dr. must be designated as Steven-Martin-Dr. The route andcross street names are limited to 20 characters. The roadway type, and direction parameters are
B-l
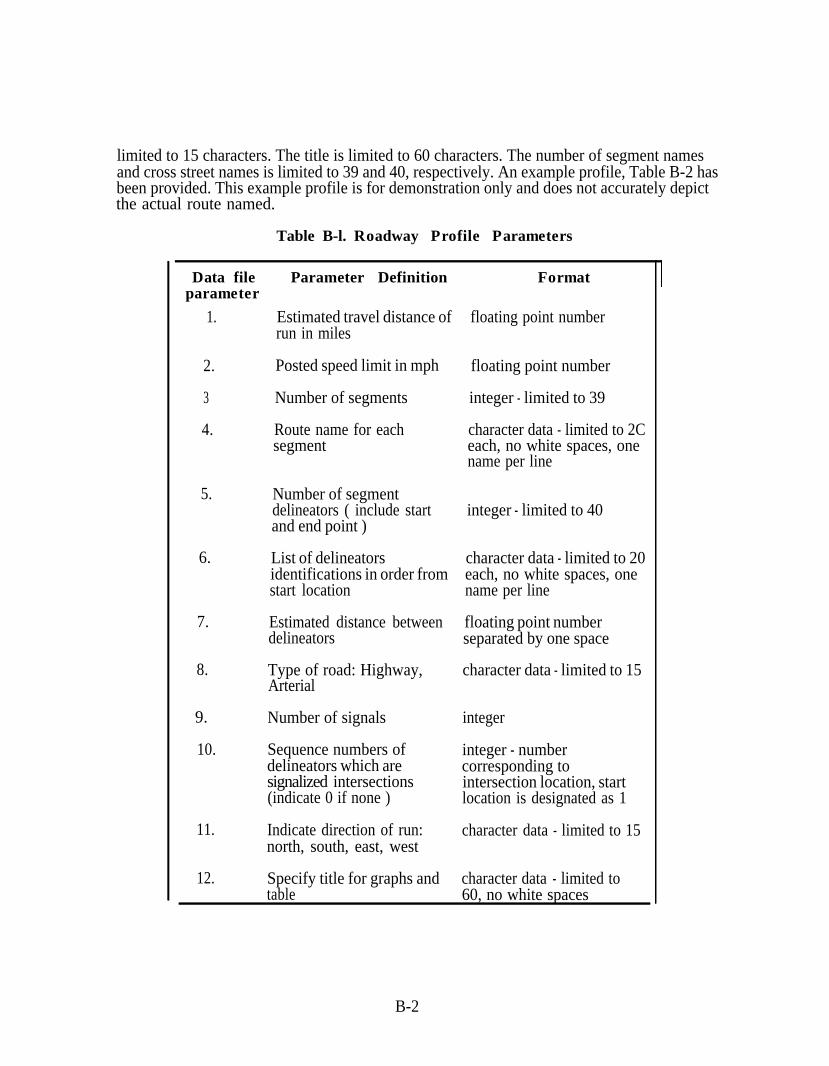
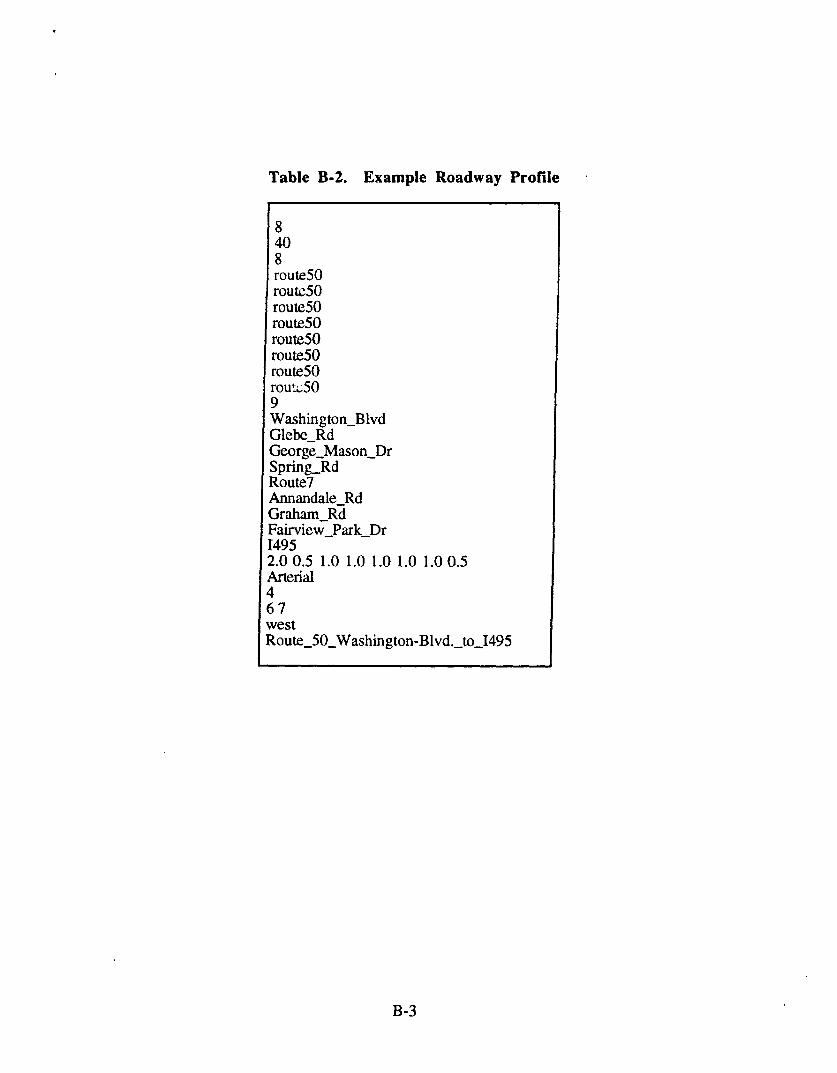
limited to 15 characters. The title is limited to 60 characters. The number of segment namesand cross street names is limited to 39 and 40, respectively. An example profile, Table B-2 hasbeen provided. This example profile is for demonstration only and does not accurately depictthe actual route named.
Table B-l. Roadway Profile Parameters
Data file Parameter Definition Formatparameter
1. Estimated travel distance of floating point numberrun in miles
2.
3
4.
Posted speed limit in mph
Number of segments
Route name for eachsegment
floating point number
integer - limited to 39
character data - limited to 2Ceach, no white spaces, onename per line
5. Number of segmentdelineators ( include startand end point )
integer - limited to 40
6.
7.
8.
List of delineators character data - limited to 20identifications in order from each, no white spaces, onestart location name per line
Estimated distance between floating point numberdelineators separated by one space
Type of road: Highway, character data - limited to 15Arterial
9.
10.
11.
Number of signals
Sequence numbers ofdelineators which aresignalized intersections(indicate 0 if none )
Indicate direction of run:north, south, east, west
integer
integer - numbercorresponding tointersection location, startlocation is designated as 1
character data - limited to 15
12. Specify title for graphs and character data - limited totable 60, no white spaces
B-2
Appendix C
Input/Output Data File Format
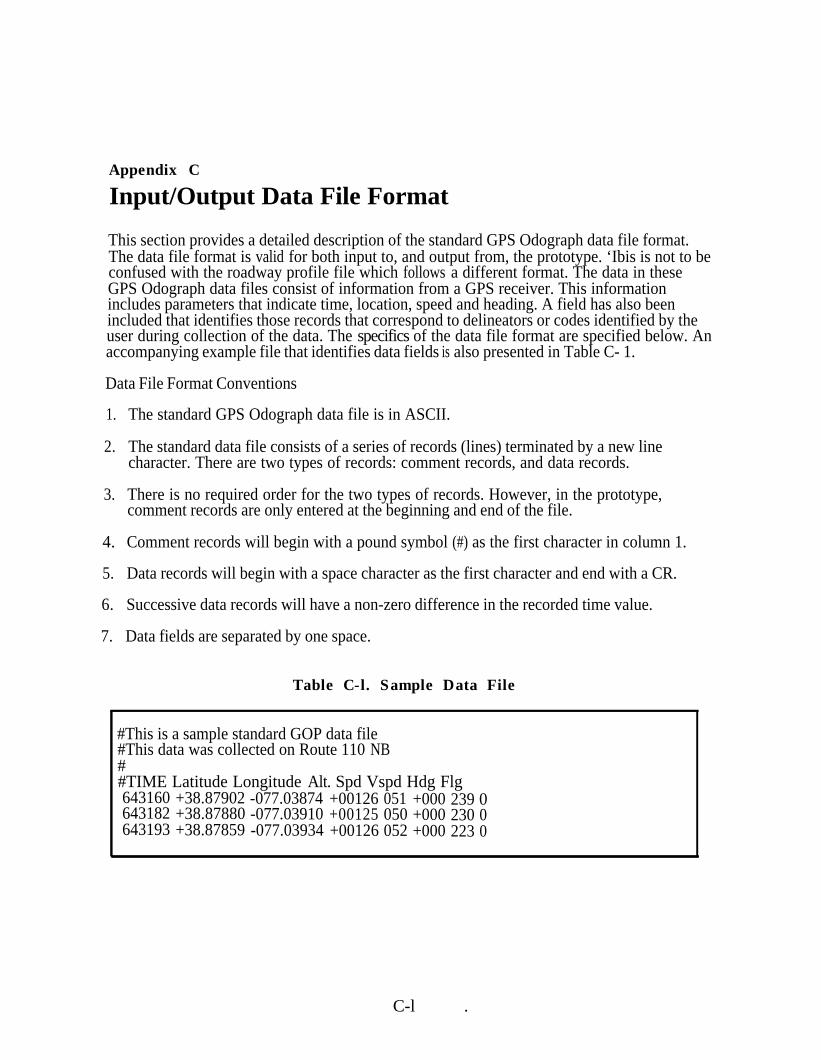
This section provides a detailed description of the standard GPS Odograph data file format.The data file format is valid for both input to, and output from, the prototype. ‘Ibis is not to beconfused with the roadway profile file which follows a different format. The data in theseGPS Odograph data files consist of information from a GPS receiver. This informationincludes parameters that indicate time, location, speed and heading. A field has also beenincluded that identifies those records that correspond to delineators or codes identified by theuser during collection of the data. The specifics of the data file format are specified below. Anaccompanying example file that identifies data fields is also presented in Table C- 1.
Data File Format Conventions
1. The standard GPS Odograph data file is in ASCII.
2. The standard data file consists of a series of records (lines) terminated by a new linecharacter. There are two types of records: comment records, and data records.
3. There is no required order for the two types of records. However, in the prototype,comment records are only entered at the beginning and end of the file.
4. Comment records will begin with a pound symbol (#) as the first character in column 1.
5.. Data records will begin with a space character as the first character and end with a CR.
6. Successive data records will have a non-zero difference in the recorded time value.
7. Data fields are separated by one space.
Table C-l. Sample Data File
#This is a sample standard GOP data file#This data was collected on Route 110 NB##TIME Latitude Longitude Alt. Spd Vspd Hdg Flg643160 +38.879022 -077.03874 +001266 051 +000 239 0643182 +38.878800 -077.03910 +001256 050 +000 230 0643193 +38.878599 -077.03934 +001266 052 +000 223 0
C-l .
The time is expressed in seconds past midnight based on Greenwich Mean Time. The latitudeand longitude are in degrees. The altitude is in meters above a theoretical ellipsoid. The(horizontal) speed and vertical velocity are in miles per hour, and the heading is expressed indegrees from true north and increases eastward (clockwise). The flag field is set to -1 whenthe user depresses an alpha key during a run, and is used to designate roadway segmentdelineators, such as intersections. The flag field can also contain a number from 1-9,corresponding to when the user depresses a number key from 1 to 9.
c-2
DISTRIBUTION LIST
INTERNAL
JO90
K. J. BieseckerR. BolczakJ. R. CervaM. D. CheslowD. L. DionK. P. DopartW. M. EvancoR. A. GlasscoS. G. HatcherC. W. KainR. K. LayM. F. McGurtinA. A. MertigJ. L. MilnerG. G. NelsonD. NussmanR. G. Nystrom (5)V. M. Pate1J. R. PetersonA. T. ProperD. L. RobertsA. E. SalwinA. M. SchokaD. E. ShankK. E. WunderlichITS File (5)JO90 File (2)
EXTERNAL
Dr. Joseph Peters, HVH-1Mr. Raj Ghaman, HTV-3Federal Highway Administration400 7th Street, S.W.Washington, DC 20590
Approved for Project Distribution:
M. F. McGurrinProgram Manager, 0495 18E20A
Transportation Data File (2)Records Resources (3)
DI- 1