Analysis for Drugs In Saliva and Breath - ROSA P
201
• ", T U5.0epar1menr TTl T ǵ mlnlsl September 1981 Final Report DOT HS·806·194 Analysis for Drugs In Saliva and Breath A. Robert Jeffcoat Research Triangle Institute P.O. Box 12194 Research Triangle Park, N.C. 27709 Contrac1 No. DOT HS·7·01737 Contract Amoun1 $224,167 Thi s document Is avai lable 10 the U.S. public through the National Technlcallnlorallon Service. Spri ngfield, Vi rginia 22161 \
-
Upload
khangminh22 -
Category
Documents
-
view
0 -
download
0
Transcript of Analysis for Drugs In Saliva and Breath - ROSA P
•
",
T
U5.0epar1menr of Trcnsp0r\oTlon Notlonol HIghway Traffic 501.ty Admlnlslrotlon
September 1981 Final Report
DOT HS·806·194
Analysis for Drugs In Saliva and Breath
A. Robert Jeffcoat
Research Triangle Institute P.O. Box 12194 Research Triangle Park, N.C. 27709
Contrac1 No. DOT HS·7·01737 Contract Amoun1 $224,167
This document Is available 10 the U.S. public through the National Technlcallnlorrnallon Service. Springfield, Virginia 22161
\
This document is disseminated under the sponsorship of the Department of Transportation in the interest of information exchanqe. The United States Government assumes no liabi�ity for its contents or use thereof.
•
"
'-
I: i I I
Technical �oport Documentation Page 1. R.port No. 2. Go .... rnm.n' Acc euion No. 3. Reclpien'·. Catalog No.
OOT-HS-806 194
4. Tltl. and Subtltl. S. R.po,t Dot.
September 25. 1981 Analysis for Drugs in Saliva and Breath 6. Por'otaling O,goniaotion <:Gde
h-��--:--:--------------------------f 8. �or'onniiig O'goniao'ion R.p.rt No.
7. Author")
-A. Robert Jeffcoat , Ph . D . 9. Po,'orrnlng O,ganlao.lon Norno and Add, ...
Research Triangle Institute P . O. Box 12194 Research Triangle 'Park, N . C. 27709
RTI/1528/00-11F 10. Wo,k Unit No. (TRAIS)
11. Contract 0' Grant No.
�T-HS-7-01737 13. Typ. a. Repo,t and Pe,iod Co .... r.d. ��----------------�----------------------------� 12. Spon.orlng Ag.ncy Nom. and Add,e"
National Highway Traffic Safety Administration Department of Transportation
Final Report Sept . 1977 - June 1981
General Services Division 14. Spon.oring Agency Cod.
Washington , D . C . 20590 15. Supplementary Not ..
Principle Contributing Authors : M. E. Wall , Ph . D. , M . Perez-Reyes , M. D .
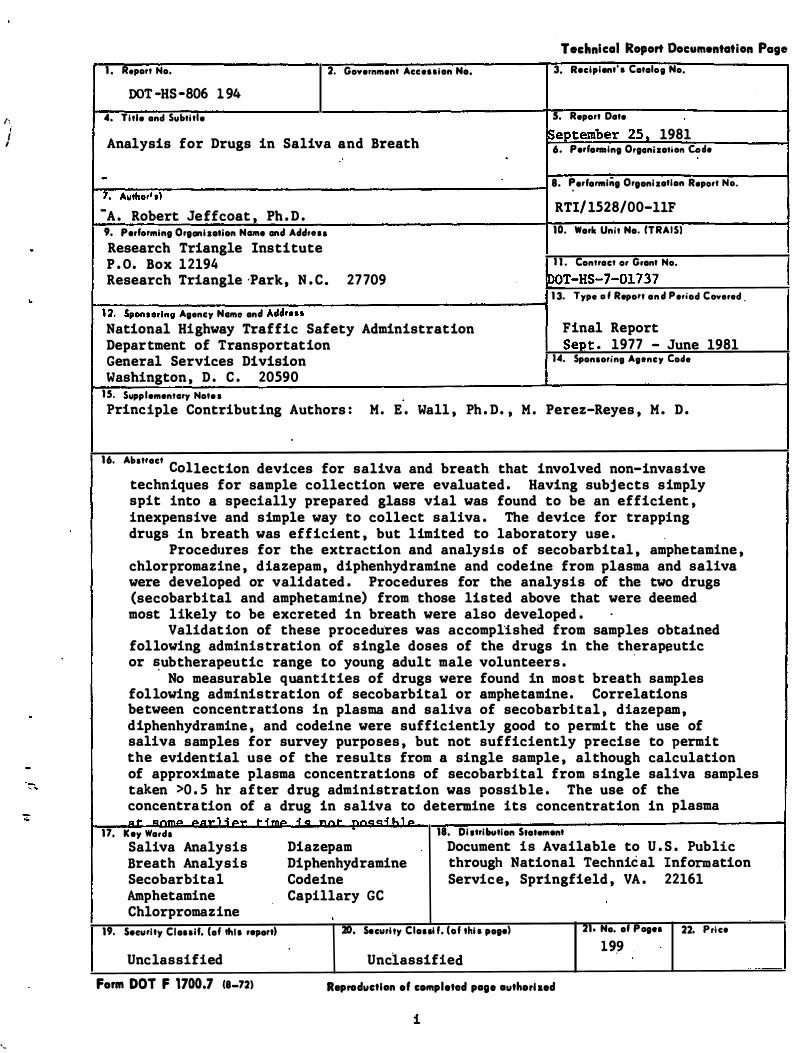
16. Ab."ac' C 1 o lection devices for saliva and breath that involved non-invasive techniques for sample collection were evaluated . Having subjects simply spit into a specially prepared glass vial was found to be an efficient , inexpensive and simple way to collect saliva . The device for trapping drugs in breath was efficient , but limited to laboratory use .
Procedures for the extraction and analysis of secobarbital , amphetamine , chlorpromazine , diazepam, diphenhydramine and codeine from plasma and saliva were developed or validated . Procedures for the analysis of the two drugs (secobarbital and amphetamine) from those listed above that were deemed most likely to be excreted in breath were also developed .
Validation of these procedures was accomplished from samples obtained following administration of single doses of the drugs in the therapeutic or �ubtherapeutic range to young adult male volunteers .
.
No measurable quantities of drugs were found in most breath samples following administration of secobarbital or amphetamine. Correlations between concentrations in plasma and saliva of secobarbital , diazepam, diphenhydramine , and codeine were sufficiently good to permit the use of saliva samples for survey purposes , but not sufficiently precise to permit the evidential use of the results from a single sample , although calculation of approximate plasma concentrations of secobarbital from single saliva samples taken >0 . 5 hr after drug administration was possible . The use of the concentration of a drug in saliva to determine its concentration in plasma .. � anma a .... 1-1&>,. .. ofm&> ofa nnf' nn!l:u::ihll>
17. Koy Warda
Saliva Analysis Breath Analysis Secobarbital Amphetamine Chlorpromazine
19. Security Clouil. (a. ,hi. ,epa,t)
Unclassified
Form DOT F 1700.7 (8-72)
Diazepam Diphenhydramine Codeine Capillary GC
18. Diltribution S.a •• rn ont Document is Available to U . S . Public through National Technical Information Service, Springfield , VA . 22161
20. Socurlty Clo .. iI. (of .hl. ,ago) 21. Na. o' Pag.. 22. Price
Unclassified 199
Reproductlen ef completed page authorized
i
" ..
I
i •
• .1.'.
filii
Hili II • .J
ip I .1
Hi!
I.
•• 1 lIt
-
i !::� � • a • » • �
•••
i 11 HilH
j i i _ lj"IH I". :a l!
t __ _ ... ...
! . .
,.
•
• •
s • I
• , "
• •
• • ,
t
� ljJjJ,:�,[d::luIIIJjJljluLIII[iJu�j:kl:d:�II\.l:�II�J:d:JJI��I :Jnn :JII ��I ' -� '1'1'1' 1'1'1'1' '1'1'1'1'1'1'1' 'ITlrTI' 'ITI'I'ITI' 'ITI'I'ITI' 'ITll'Tl' '1'I'll'TI' '1'1'1'1'1'1'1' '1'1'1'1'1'1'1' c ' ... " ' . 1 t _
t; :8
i •
•
•
i y
i
t •
J !
I
I
lid
. ... ., ,, = :01--• • - . -
... 1. ".
hu mil
•••
I I. - .: .. :: • •
•
lil�
..
i i
. j. i i I L."II i1 "jl1lJ
! i ; •
i I
L I!
! ts I!, .,"" -. � Q: 1II",, ;:. '" 'I .. � •••• 01.": !!: -I " � - S Ii Ii : :; J
� h . - I ' II ;�
I, f = I (I. H I mHli ;l ;1 H "
;1
r
•
..
iii
Table of Contents
List of Figures
List of Tables
'. .
1 . 0 Background Information
1 . 1 Binding of Drugs to Protein
1 . 2 Saliva .
1 . 3 Analysis of Drugs in Saliva
1 . 4 Analysis of Drugs in Breath
2 . 0 Goals , Objectives , Drugs and Challenges of the Program
2 . 1 Goals and Obj ectives . . .
2 . 2 Selection of Drugs for this Proj ect
2 . 3 Challenges . • • • •
3 . 0 General Methodology
3 . 1 Introduction - Approaches Used
3 . 2 Clinical Methodology
3 . 2 . 1 Subj ects
3 . 2 . 2 Dose Forms of the Drugs and Method of Administration • • • • . • • • • • •
3 . 2 . 3 Medical Support for Subj ects
3 . 2 . 4 Collection of Biological Samples
3 . 2 . 4 . 1 Plasma (Blood)
3 . 2 . 4 . 2 Saliva
3 . 2 . 4 . 3 Breath
3 . 3 Analysis of Samples
3 . 3 . 1 Selection of Internal Standards • ,
3 . 3 . 2 Extraction Methods
Page
vii
xi
1
1
2
3
6
8
8
9
12
14
14
16
16
17
17
17
17
20
20
21
21
26
iv
Table of Contents (continued)
3 . 3 . 3 Gas Chromatographic Analyses
3.3 . 4 Radioimmuoassay . • . . . . .
3 . 4 Methods Used for Studying Effects of Increased and Decreased Salivary Flow
. . . . . .
3 . 5 Methods for Analysis of Creatinine in Saliva .
3 . 6 Methods for Determination of Plasma Protein Binding of Drugs
4 . 0 Results
. . . . . . . .
4 . 1 Collection Devices for Saliva and Breath
4 . 2 Binding of D�ugs to Plasma Protein . . • •
4 . 3 Analysis and Correlation of Concentrations of Drugs in Plasma and Saliva . . . . . .
4 . 3.1 Secobarbital
4.3 . 2 Amphetamine . . 4 . 3 . 3 Chlorpromazine
4 . 3 . 4 Diazepam
4 . 3 . 5 Diphenhydramine .
4 . 3 . 6 Codeine . . . . .
4 . 4 Use of Creatinine Concentrations in Saliva as an Aid in Establishing Correlations of Concentrations
2 7
29
35
35
36
44
44
47
52
52
60
69
73
78
82
of Amphetamine in Plasma and Saliva . . • . 89
4 . 5 Analysis of Drugs in Breath
5 . 0 Discussion . . . . .
5 . 1 Assay Methodologies
5 . 2 Use of Saliva Concentrations of Drugs that are Mainly Non-Ionized to Predict Their Plasma Concentrations . • • . . . . . . .
89
102
102
107
•
..
v
Table of Contents (continued)
5 . 3 Use of Saliva Concentrations of Drugs that are Mainly Ionized to Predict Their Plasma Concentrations . . . .
6 . 0 Research Conclusions • . • • • . . . . . . . . .
7 . 0 Names , Qualifications and Participation
8 . 0
o f Researchers . . • • • • • • •
References . . . . . . . . . . . • . • .
Appendix A - Detailed Analytical Methodologies
A .I Secobarbital
A .2 Amphetamine .
A . 3 Chlorpromazine
A . 4 Diazepam
. . . . . .
A . 5 Dipbenhydramine
A . 6 Codeine . . . . .
'.
. . . . . .
. . . . .
110
113
116
117
A-I
A-I
A-12
A-25
A";34
A-46
A-55

•
..
Figure No .
vii
LIST OF FIGURES
1 Structures and Some Properties of Drugs Studied • • • • • • 10
2 Structures of the Drugs Studied and the Internal Standards Employed in Their Assays . • • • • • • • • • • • • 23
3
4
5
6
7
8
9
10
Chromatogram of Amphetamine Extracted from Saliva Using a Carbowax 20M Capillary Column • • • • • • '.
Chromatogram of Amphetamine Extracted from Saliva at a Concentration of 55 ng/mL on a SE-30 Capillary Column • . . • . • • • • • . • • • • • • • • •
Chromatogram of Plasma Extract Containing 1 pg Secobarbital (I) , 0 . 5 pg'Hexobarbital (III) per ML Plasma . Amounts of Barbiturates Inj ected onto the Column wer� 150 ng Secobarbital , 75 ng But Dbarbital and 75 ng Hexobarbital • • • • • • • • • • • ' . • •
. . . .
. . . .
Chromatogram of Plasma Extract Containing 1 pg Secobarbital (I) , 0 . 5 pg Barbital (III) per ML Plasma . Amounts o f Barbiturates Inj ected Onto the Column Were 150 ng Secobarbital , 75 ng Allylcyclopentyl Barbituric Acid and 75 ng Barbital . • • • • • • • • • . . .
GC of Diazepam, Desmethyldiazepam and Possible Internal Standards on an 8 meter Carbowax-20M Capillary Column •
HPLC Chromatogram of Creatinine Using· Conditions Reported by Pu and Chiou (1979) • • • • • •
HPLC Chromatogram of Creatine at pH 4 . 80 at Lower Ionic Strength than in Figure 1 • • • • • •
HPLC Chromatogram of Creatinine Under Conditions Developed for Saliva Creatine Assay • • • • • • •
. . . . .
. . . . .
11 Calibration Curve for the Determination of Saliva
12
13
14
Creatinine '. • • . . . . . . . . . . . . .
Ethanol BubIer for Trapping Drugs Exhaled in Breath
Breath Trap Employing Tenax Adsorbant . . . . .
Correlation between the Predicted and Observed Concentrations of Secobarbital in Plasma . Predicted values are those Calculated from Concentrations in Saliva . . . . . . . . . . . . . . . . . . . . . . . .
. .
30
31
32
33
34
37
38
39
40
45
46
59
Figure No .
15
viii
LIST OF FIGURES (Continued)
Correlation betwee� the Predicted and Observed Concentrations of Secobarbital at times one hour or Later After Administration of Drug . Predicted Values are those Calculated from Concentrations in Saliva . . . . . . . . . . . . . . . . . . . . . . . . . 61
16 Chromatogram of Amphetamine Extracted from Plasma at a Concentration of 20 ng/mL on a SE-30 Capillary·
17
18
19
20
21
22
23
ColU1Dll • • • • • • • • • • • • • • • • • • • • • • •
Correlation between Saliva and Plasma Concentrations of Amphetamine • • • • • • • • • • • • • • • • • • • • •
Correltion between Predicted and Observed Concentrations of Amphetamine in Plasma . · The Predicted Values are those Calculated from Concentrations in Saliva by the Henders�n-Hasselbalch-derived equation • • • • •
Chromatogram of Chlorpromazine Extracted from Saliva • •
Chromatogram of Diazepam Extracted from Plasma • • • • •
Chromatogram of Diphenhydramine Extracted from Saliva . •
Correlation between Saliva and Plasma Concentrations of Diphenhydramine • • • • • • • • • . • • • • •
Correlation between Predicted and Observed Concentrations of Diphenhydramine in Plasma. The predict 'ed Values are Those Calculated from Concentrations in Saliva by the Henderson-Hasselbalch-derived e quation
. .
24 Correlation between Saliva and Plasma Concentrations
25
26
27
of Codeine • • • • • • • • . . . . . . . . . . . . .
Correlation between Predicted and Observed Concentrations of Codeine in Plasma . The Predi�ted Values are Those Calculated from Concentrations in Saliva by the Henderson-Hasselbalch-derived equation • • • • • •
Plots of the Ratios of Predicted and Found Pla sma Amphetamine (P-F Ratios) and of Saliva Creatinine for Subj ect A2 Following Administration of 0 . 122 mg/kg of Amphetamine • • • • • • • • • • • • • • • • • •
Plots of. the Ratios of Predicted and Found Plasma Amphetamine (P-F Ratios) and of Saliva Creatinine for Subj ect A4 Following Administration of 0 . 061 mg/kg of Amphet8lline . . . . • . . . . . . . . . . . . . . .
63
70
71
72
17
79
83
84
90
91
92
93
Figure No .
28
ix
LIST OF FIGURES (Continued)
Plots of the Ratios of Predicted and Found Plasma Amphetamine (PF Ratios) and of Saliva Creatinine for Subj ect A6 Following Administration of 0.122 ms/ks of Amphetamine • • • • • • • • • • • • • • . . . .
29 Gas Chromatogram of Breath Samples After Administration of Secobarbital . Internal Standards are Hexobarbital
94
and Butabarbital • • • • • • • • • • • • • • • • • • • • 98

•
Table No .
1
2
3
xi
LIST OF TABLES
Ages and Weights of Subjects • • • • • . . • e. • • • . . . .
Forms and Amounts of Drugs Administered to Subj ects in the Human Validation Studies . • • • • • • • • • • · .
pKa Values for Drugs • • • • • • . . . . . . . . . .
18
19
43
4 Binding of Secobarbital to Plasma Protein • • • • • • • • • 48
5
6
7
8
Binding of Amphetamine to Plasma Protein • • • • • •
Plasma Binding Data for Diazepam • • • • • • • • • •
Binding of Diphenhydramine (DPHM) to Plasma Protein. • . . .
Relative Retention Times of Selected Barbiturates and Barbitu'rate Analogs on a Packed Carbowax 20M Column, Isothermal at 2 05°C • • • • • • • • • • . . . .
9 Concentration of Secobarbital in Plasma and Saliva
49
50
51
53
Following a Single Oral Dose • • • • • • • • • • • 55
10 Effect of Stimulation and Suppression of Salivary Flow on the Correlation of Concentrations of Secobarbital in Plasma and Saliva • • • • • • • • • • • • • • • • • • • • 62
11 Concentration of Amphetamine in Plasma and Saliva , Following a Single Oral Dose • • . • • • � • • • • • • • • • 65
12 Concentrations of Diazepam in the Plasma of Subjects Dl-D6 Following 0 . 143 and 0 . 0714 mglkg Oral Doses of
13
14
15
16
17
Diazepam . . . . . . . . • • . . . . . . . . • . . . • . . . .
Concentrations of Diazepam in the Saliva of Subject D2 Following an Oral Dose of 0 . 143 mglkg Diazepam and Comparison of These Values with Corresponding Diazepam Concentrations in Plasma • • • • •
Concentrations of Diphenhydramine (DPHM) in Plasma and Saliva Following a Single Oral Dose . • • • • •
Concentrations of Codeine in Plasma and Saliva Following a Single Oral Dose • • • • • • • • • . .
· . . · .
• • . . .
· . . . .
Concentrations of Secobarbital in Breath Following a Single Oral Dose of 100 mg of Sodium Sevobarbital .
Maximum Concentration of Amphetamine in Breath Following a Single Oral Dose of 0 . 061 ms/kg of
75
76
80
86
96
d , t-Amphetamine • � • • • • • • • • • • • • • . . . . . . • • 100

•
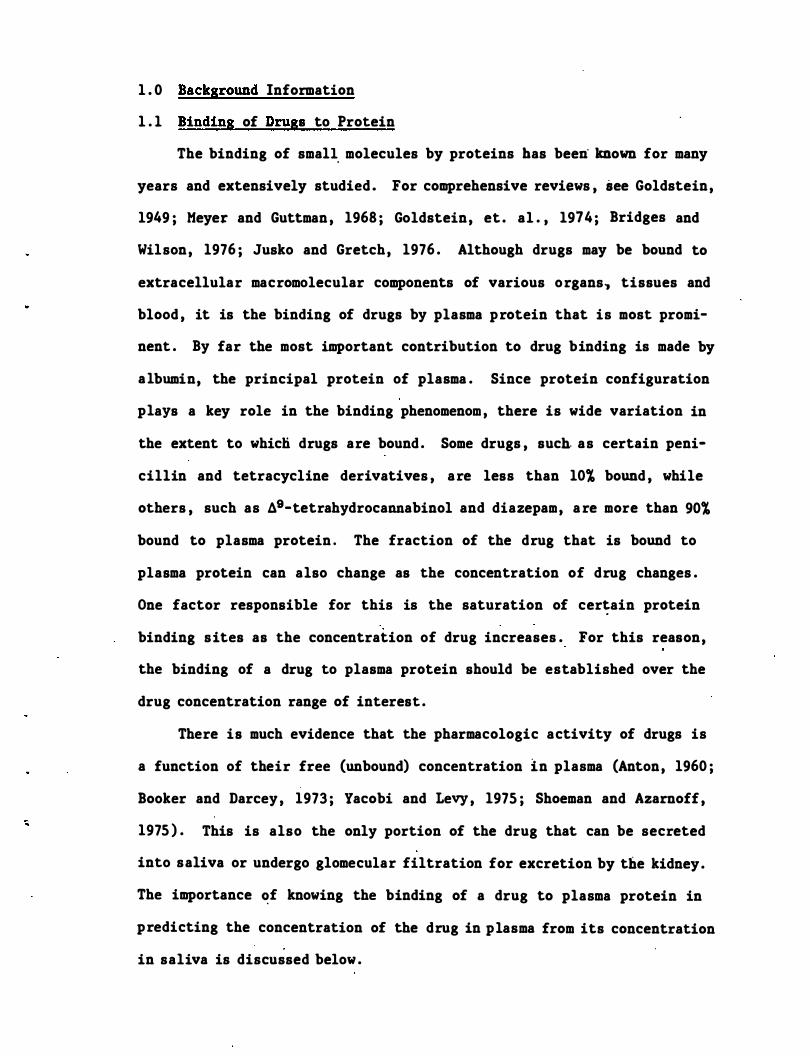
1 . 0 Background Information
1 . 1 Binding of Drugs to Protein
The binding of sma1� molecules by proteins has been known for many
years and extensively studied . For comprehensive reviews , see Goldstein,
1949 ; Meyer and Guttman , 1968 ; Goldstein, et . al . , 1974 ; Bridges and
Wilson, 1976 ; Jusko and Gretch, 1976 . Although drugs may be bound to
extracellular macromolecular components of various organs, tisBues and
blood , it is the binding of drugs by plasma protein that is most promi
nent . By far the most important contribution to drug binding is made by
albumin, the principal protein of plasma . Since protein configuration
plaYB a key role in the binding phenomenom , there is wide variation in
the extent to whicn drugs are bound . Some drugs , Buch as certain peni
cillin and tetracycline derivatives , are leBs than 10% bound , while
otherB , such as A9-tetrahydrocannabinol and diazepam, a re more than 90%
bound to plasma protein . The fraction of the drug that is bound to
plaBma protein can alBo change aB the concentration of drug changes .
One factor responBible for this is the saturation of cer�ain protein
binding siteB aB the concentration of drug increases . For this reaBon,
the binding of a drug to plaBma protein Bhould be established over the
drug concentration range of intereBt .
There iB much evidence that the pharmacologic activity of drugs is
a function of their free (unbound) concentration in plasma (Anton, 1960 ;
Booker and Darcey , 1973 ; Yacobi and Levy , 1975 ; Shoeman and Azarnoff ,
1975 ) . This is also the only portion of the drug that can be secreted
into saliva or undergo glomecular filtration for excretion by the kidney .
The importance �f knowing the binding of a drug to plasma protein in
predicting the concentration of the drug in plasma from its concentration
in saliva is discussed below .
2
1 . 2 Saliva
Saliva is formed from the secretions of glands in the oral cavity.
These glands are the par�tid, one on each side of the face below the
ear, submaxillary (submandibular), principally in the floor of the
mouth; sublingual, principally in the floor of the mouth; and buccal,
scattered beneath the mucuous membranes of lips and cheeks . Salivary
secretion is under nervous control, being reflexly initiated by mechani
cal, chemical, or radiant stimuli acting on taste buds in the mouth,
olfactory receptors, visual receptors, or other sense organs . Secretion
may also occur as a result of conditioned reflexes, as when one thinks
about food .
Saliva is a complex variable mixture containing more than 99 percent
water, together with polysaccharides, proteins, salivary amylase, inor
ganic ions, sloughed epithelial cel1s, disintegrating leukocytes and
small organic molecules, including drugs, that are circulating in plasma .
The composition of parotid saliva has been shown to vary with flow rate
(Beal, 1979 ) . Circadian rythms have also been demonstrated in parotid,
submandibular and whole saliva flow rates and composition (Fergu�on and
Botchway, 1980 ; Dawes, 1972, 1975 ; Dawes and Ong, 1973 ; Ferguson et al . ,
1973 ; Ferguson and Fort, 1974) . The thin, watery type o f saliva is
produced by serious cells in the salivary glands and the thick, viscid
type by mucous cells in the same glands .
The parotid gland and the submaxillary gland are the two primary
potential glandular sources for the transport of drugs into saliva
cavity and thereby the oral cavity. Approximately 30-60% of the volume
of saliva originates from the serous cells in these glands (this primarily
represents parotid secretion) .
"
;;
3
The parotid gland (and presumably the serous cells of the submaxil
lary gland, cf . Atta et a l . , 1975) respond to three different types of
physiological stimulation� Alpha-adrenergic stimulation results primarily
in the secretion of potassium and water ; beta-adrenergic stimulation
results in secretion of a protein-rich solution containing calcium and
sodium, while cholinergic stimulation results in a secretion similar in
composition to that produced after alpha-adrenergic stimulation.
In a study of the secretion of ascorbic acid in human saliva,
Mikili and Kirveskari (1969) found that the rate of secretion of ascorbic
acid averaged 0 . 14 �g/minute for the submaxillary and sublingual glands
and 0 . 59 �g/minute for the parotid gland . Assuming that the secretion
of the drugs studied in this proj ect is similar to that for ascorbic
acid, the parotid gland is the most significant source of drug entry
into the oral cavity.
In addition to diffusive transport of compounds into the oral
cavity, certain compounds such as the alkali earth metals undergo specific
transport phenomena . There is no evidence to suggest that any of the
compounds studied in this program would be subj ect to active transport .
However, some of the compounds may have a direct pharmacologic action on
the salivary gland effecting secretion. This may be particularly true
with amphetamine, which is an alpha-andrenergic agonist .
1 . 3. Analysis of Drugs in Saliva
Saliva samples from race horses have been analyzed for many years
to' determine the possible presence of illicit drugs . Only recently,
however, has much attention been given to the use of this fluid for drug
level determinations in man; As analytical methodology such as radio
immunoassay and electron capture-gas chromatography (Ge), which provides
4
assay capabilities at the nanogram level and below , has become available ,
the use of saliva for the determination of "biologically active" drug
levels has grown increasingly popular .
If diffusion into saliva is essentially a pass�ve process (Keen
1960) , then the concentration of a drug in saliva should be principally
a function of relative protein binding in plasma and saliva , the pH of
the two fluids , and the pKa of the drug (Rasmussen , 1964) . Since the
mean protein content of saliva is only about 260 mg per 100 mL, a rough
estimate of the amount of an unionized drug present in saliva is the
amount of free drug present in plasma . The theoretical relationship
between the concentration of an ionizable drug in plasma and its concen-
tration in saliva ' can be expressed mathematically �n the following
derivations of the Henderson-Hasselbach equation (Dvorchik and Vesell ,
1976 ; Martin , et . al . , 1976) :
For acidic drugs
Cp x fp = 1 + 10 (pHp-pka) x Cs x fs 1 + 10 (pHs-pka)
For basic drugs
Cp x fp = 1 + 10 (pka-pHp) x Cs x fs 1 + 10 (pka-pHs)
Where Cs = concentration of drug in saliva
Cp = concentration of drug in plasma
pka = pka of the drug
pHs = saliva pH
pHp = plasma pH , usually assumed �o be 7 . 4
fp = fraction of drug not bound to protein in plasma
fs = fraction of drug not bound to protein in saliva , usually
assumed to be 1 . 0 .
•
..
5
The relation between saliva and plasma levels of diphenylhydantoin
has been determined by a number of workers (Cook et al . , 1975; Bochner
et al . , 1974; Troupin and Friel , 1974; Conrad, et al . , 1974; Zion et al . ,
1976) . Cook found that a simple linear relationship existed between
plasma and sa 1i va levels with [ saliva] = 0 . 1 [plasma ] '. This ratio is
close to that reported for the ratio of free to bound drug in plasma at
37°C (Lunde et a 1 . , 1971) .
Similar studies have been done with phenobarbital (Cook et al . ,
1975; Zion et al . , 1976) . For this drug , the relationship was not quite
linear , but over the range of most clinical interest (10-60 �g/ml plasma)
the saliva concentration could b� approximated by [ saliva ] = 0 . 29 [plasma} .
The concentration in saliva is less than predicted on the basis of the
free fraction in plasma (Waddell and Butler, 1957 ) , but is readily
explained by the effect of the pH of saliva and plasma (ca . 6 . 5 and 7 . 4 ,
respectively) and the pKa of phenobarbital . Piraino and D i Gregorio
(1977) report the correlation of saliva and plasma levels of diazepam
where [ saliva} = 0 . 03 [plasma] . This indicates that diazepam is highly , ,
bound in the plasma and compa'res favorably with ratios of free/bound
(0 . 05 ) from plasma protein binding studies . Mucklow, et a1 . , (1978)
present data on the correlation of a number of drugs . These authors
conclude that good correlations exist between plasma and saliva concentra-
tions of drugs that are largely nonionized at normal plasma pH (e . g . ,
phenytoin , phenobarbital and antipyrine) while correlations are usually
poor unless salivary flow rate and pH can be standardized for drugs that
are largely ionized at normal plasma pH (e . g . , propranolol , chlorpropamide ,
meperidine and tolbutamide) .
6
1 . 4 Analysis of Drugs in Breath
Qualitative determinations of volatiles in breath go back many
years with the "analyst ' �" nose being the d�tecting device (.! .& . , the
acetone smell of a diabetic's breath, alcohol in an i�toxicated person's
breath) . Examples of quantitative measurements of drugs from breath
samples on the other hand are quite scarce . A notable exception to this
is the well-known "breathalyzer" usecl routinely by law enforcement
officials to determine alcohol levels in the body . Due to the high
volatility and therefore relatively high levels of alcohol present in
the breath of drinking drivers , the technology associated with these
measurements is somewhat less 'demanding than that required for the
measurement of breath levels of therapeutic drugs .
It was recognized early that in order to measure drug levels in
breath a concentration of the volatile organics was necessary. Initial
attempts to collect and concentrate the volatile organics present in
namogram levels were mostly based on the work of Ter.nishi et al e (1972) ,
who developed a coiled tubular cold trap collection device . The cold
finger trap described in a report of the University of Missouri School
of Pharmacy (DOT-HS-80l-660) evolved from this device . Detection instru
mentation for these studies were gas chromatographs coupled with flame
ionization or mass spectral detectors .
Work at the University of Missouri (DOT-HS-820-253) produced a
polyethylene foam wafer device which was used in the analysis of ethchlor
vynol and chloral hydrate in breath, as well as in the detection of what
were thought to be marihuana constituents . On the other 'hand , RTI
experience has been that extremely "clean" collection devices are required
when working at low nanogram levels . In particular , plastics frequently
cause problems .
"
"
"
..
..
RTI has also developed techniques for the analysis of the first
exhalation from human subj ects after puffing a marihuana cigarette .
These samples were co11e�ted on a Cambridge filter, ext'racted from the
filter, and analyzed by gas liquid chromatography (Wall" 1976) .
7
2 . 0 Goals, Objectives , Drugs and Challenges of the Program
2 . 1 Goals and Objectives
8
As stated in the RFP for this project , �e primary objective of the
study was to develop methods for using breath and saliva as biological
samples to detect and quantify drug concentrations in drivers , and to be
able , if possible , to infer previous levels of drug concentrations . For
purposes of the study , these methods need not be developed . for roadside
application . The product of this proj ect would be drug detection methods
that are ready for operational use in future drug incidence research
studies .
Specifically , it was the purpose of this study to develop practical
operational methods , procedures , and equipment for . the collection ,
extraction , identification , and quantification of selected drugs which
are considered possible highway safety hazards in breath and/or saliva
and to assess the feasibility of estimating the drug concentration at
the time of an accident based on samples collected some time later . It
was further stated that ultimately at least the collection of these
samples and possibly the analysiS would be· performed by operational
personnel and that the products of the proj ect should reflect this goal .
The project was divided into four maj or tasks , each with a particular
objective . The first was the preparation of a detailed study plan.
This plan would include proposed methods of breath/saliva sample collec
tion, sample extraction , and analysis; proposed procedures for validation
of the developed drug analysis methods in human Bubj ects , and possibili
ties of false negatives and false positives and how these will be detected
and dealt with.
II
..
9
The second objective was the development of methods and procedures
for sample collection and analysis . The third objective was the valida
tion of the methods and procedures in human subjects . This would involve
establishing a quantitative relationship between the concentration of
the drug or the suitable breakdown product in breath and/or saliva to
its concentration in blood, covering a range up to the normal clinical
dosage .
2 . 2 Selection of Drugs For This Project
Six drugs were studied as part of this contract . Criteria used for
the selection of these drugs included the following :
(a) The drug must be widely used and/or abused ;
(b) The drug must represent a class of drugs which are known
or suspected to affect driving performance ;
(c) The drugs selected must collectively possess a broad range of
physical/chemical characteristics such as melting point; vapor
pressure at 37°C , molecular weight, lipophyilicity/hydrophilicity ,
protein binding, etc .
(d) Preliminary methodology should be available in the literature
for the analysis of the drug at therapeutic levels .
The six drugs for study were selected by DOT with consultation by
personnel from RTI and the National Institute on Drug Abuse and were :
Secobarbital (Seconal)
Amphetamine (Benzedrine)
Chlorpromazine (Thorazine)
Diazepam (Valium)
Diphe�ydramine (Benadryl)
Codeine
The structures and so�e properties of thes� drugs are shown in Figure 1 .
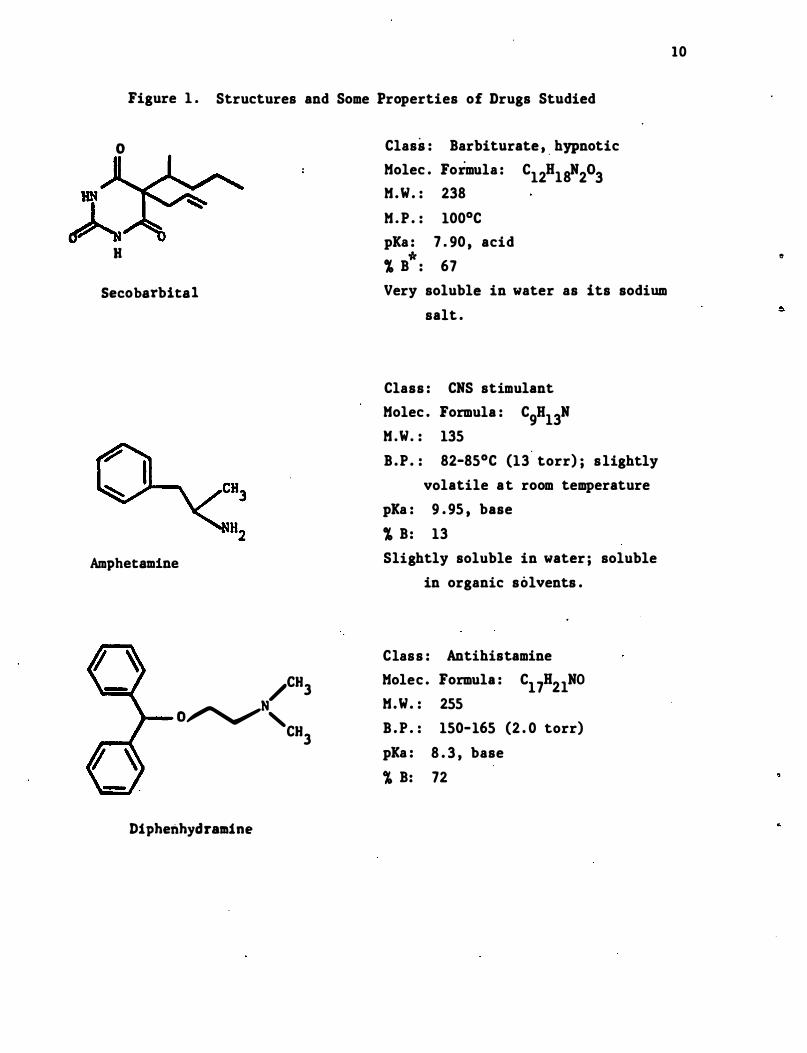
Figure 1 . Structures and Some Properties of Drugs Studied
o Class : Barbiturate •. hypnotic
H
Secobarbital
Amphetamine
/CH3
N O�' CH3
Diphenhydramine
Molec . Formula : C12H18N203 M .W . : 238
M . P . : 100°C pKa : 7 . 90 , acid � B
*: 67
Very soluble in water as its sodium salt .
Class : CNS stimulant Molec . Formula : C9H13N M . W. : 135 B .P . : 82-85°C (13
' torr); slightly
volatile at room temperature pKa : 9 . 95 , base � B: 13 Slightly soluble in water; soluble
in organic solvents .
Class : Antihistamine Molec . Formula : C17H2lNO M.W. : 255 B . P . : 150-165 (2 . 0 torr) pKa : 8 . 3 , base � B: 72
10
"
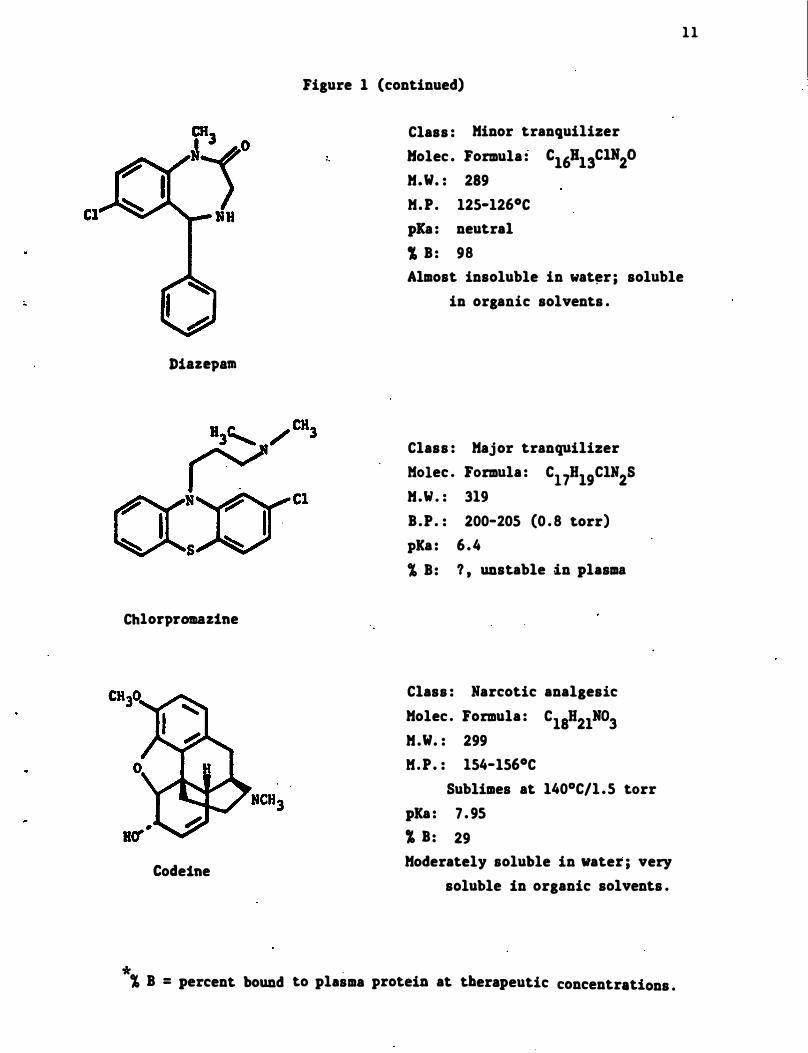
1 1
Figure 1 (continued)
Diazepam
Chlorpromazine
Codeine
Class: Minor tranquilizer
Holec. Formula: Cl6Bl3C1ll20
M. W. : 289
M.P. l25-l26°C
pICa: neutral
I B: 98
Almost insoluble in wat�r; soluble
in organic solvents .
Class: Major tranquilizer
Holec . Formula: Cl7Hl9ClN2S
M.W.: 319
B .P . : 200-205 (0 . 8 torr)
pKa: 6.4
1 B: 1, unstable in plasma
Class: Narcotic analgesic
Molec . Formula: C18H2lN03 M.W.: 299
H . P.: 154-l56°C
Sublimes at l40oC/l.5 torr
pKa: 7.95
1 B: 29
Moderately soluble in water; very
soluble in organic solvents .
* . 1 B = percent bound to plasma proteiD at therapeutic concentrations .
12
2 . 3 Challenges
The maj or challenge of this program was to develop analytical
systems for measurement of the drugs in various biological fluids that
were both sensitive and specific . The analytical systems used by most
previous investigators were designed either to measure the concentrations
of drugs in overdoses subj ects or as a part of.a clinical study where
future interferences from other drugs was not encountered . . The criteria
used in development of our analytical systems were :
(1) The analysis had to be very sensitive so as to permit measure
ment of subtherapeutic concentrations of drug in both the
plasma and saliva .
(2) The peaks from the chromatographic system had to be sharp so
that maximum separation from other drugs that may be present
in field samples could be achieved.
(3) Internal standards used in the analytical systems had to be
appropriate for their purpose, . but not be- compounds in wide
spread use, as had been used in most previous stu�ies .
(4) The procedures had to be adaptable for use for other closely
related drugs .
(5) Where possible, the procedures were to utilize gas chromatog�
raphy with a nitrogen-specific detector (This was requested by
National Institute on Drug Abuse consultants to the DOT Scientific
Proj ect Officer) .
(6) The procedures had to be usable by other investigators with
current commercial equipment .
A second cballenge was the development of a protocol for the human
validation studies . This protocol had to be workable for the physician
and subjects involved, yet had to provide for proper controls in order
to limit the number of variables in the study.
13
A final challenge w�s to try to develop methods to correlate the
results of the human validation study with each drug in order to establish
if a correlation existed between the concentrations of the drug in
plasma, saliva and breath . Each fluid presented its own problems. One
of the maj or problems with breath was obtaining" a clean sample, uncontami
nated with saliva droplets . One maj or problem with saliva was its
variability from time to time and subj ect to subj ect .
3 . 0 General Methodology
3 . 1 Introduction - Approaches Used
14
Experimental work i� this project was �ivided into three maj or
areas : development of collection devices for breath a�d saliva, develop
ment of analytical methodology to measure selected drugs in these flUids ,
and validation of these methods by establishing a quantitative relation
ship between the concentration of the drugs in ,breath and/pr saliva and
their concentration in blood . Our approaches to each of these experi
mental areas are summarized below.
Since it was envisioned that sample collection would ultimately be
performed by operational personnel , we endeavored to keep the collection
of samples as simple as possible , but in manners whi�h would not com
promise the integrity of the samples . Due to the known adsorption of
many drugs to plastics such as polyethylene , polystyrene , etc . , the use
of plastics , with the exception of teflon , was avoided . Likewise , the
use of invasive techniques to collect samples of breath and saliva , such
as would have been required for the collection of parotid saliva , were
also avoided . For breath collection , procedures that are in common use
for collecting trace organics from environmental air samples were inves
tigated . A simple container into which subj ects could spit was evalu
ated for the collection of saliva .
Analytical procedures should be sufficient to not only provide
quantitative information concerning the concentration of drugs in saliva
and breath, but also must be devised so that the investigator is pro
vided with some measure of qualitative information , that is, am I mea
suring the drug that I think I am measuring? For this reason , we turned
to state-of-the-art chromatographic procedures which could be reasonably
15
reproduced in a well-equipped laboratory. Because of the expense of
mass spectrometers as detectors , we did not use them in our analyti�al
systems . However , when �sed as detectors fo� gas chromatographs , mass
spectrometers are superior to any other kind of detec�or for providing
qualitative information on the materials present in the samples being
analyzed . The use of deactivated glass and fused silica capillary gas
chromatographic columns , which provide superior resolutipn to other
types of chromatography, was pursued . This area has rapidly expanded
over the past five-ten years with excellent columns now becoming commer
cially available . These columns were coupled to a highly sensitive
nitrogen-phosphorus selective detector which a large degree of specific
ity as to the nature of the compounds being detected .
Validation of our methodology was accomplished with a highly selec
tive group of subjects . These subj ects were selected so as to provide a
minimum of variation in the results due to sex , age , weight , presence or
interaction with other drugs , or diseased states . Without information
on such a restricted population , the contribution of any or all of these
variables to the correlation cif concentrations of drugs in saliva or
breath to the concentrations in plasma (or lack of correlation) would be
very difficult to determine . Likewise , it would be impossible for us to
know whether our other results were being influenced by any of these
factors .
3 . 2 Clinical Methodology
3 . 2 . 1 Subjects
16
At least six volunteer subjects were used for each' drug . Most of
these subj ects were tested at two dose levels of the d·rug . The restric
tions as to the selection of subj ects were as follows :
A . All subjects were healthy.
B . Sex - male
Female subj ects would introduce cyclical hormonal changes
which are undesirable at this time .
C . Age - 18-35 years . No minors were used .
D . Weight - All subjects weighed 140-190 lbs .
E . Height - The heights of all subj ects were within the range
prescribed by age-weight-height tables for healthy individuals .
Other restrictions were placed on the subjects prior to and during the
study. These are as follows :
F . No drugs , tobacco , marihuana or alcohol for one week prior to
and for the duration of the experiment .
G. No caffeine (from coffee , tea , cola , cocoa , etc . ) for three
days prior to and for the dUration of the experiment.
H . No food from 12:01 a .m . of the day of the experiment until
3 hr after administration of the drug .
I . Intake of water and other approved liquids were restricted
from two hours prior to the start until 3 hr after adminis
tration of the drug .
Subj ects were informed as to the purpose of the experiment , the
drug to be administered and its possible side effects . They were also
informed of the general protocol of the experiment and the restrictions
17
to be placed on them as outlined above . They were free to withdraw from
the study at any time . All subjects s igned the informed consent state-
ment that had been approved by both the RTI and the University of North
Carolina Committees on Protection of the Rights of Human Subjects . The
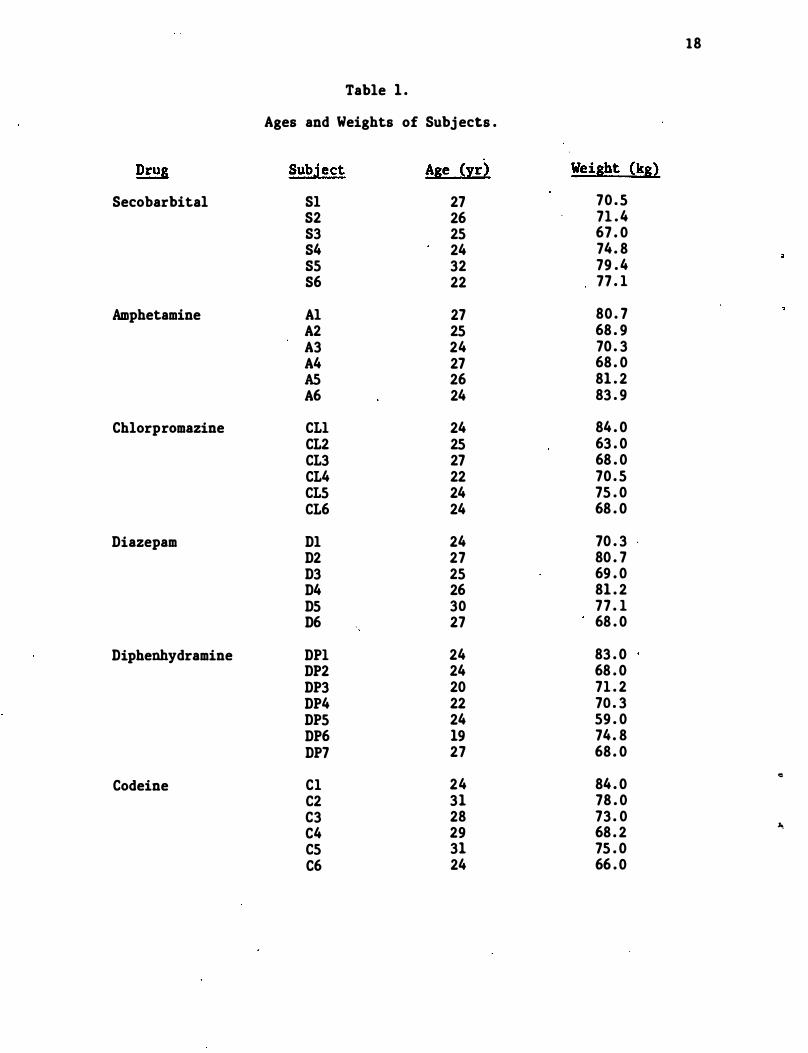
weights and ages of the subjects are listed in Table l .
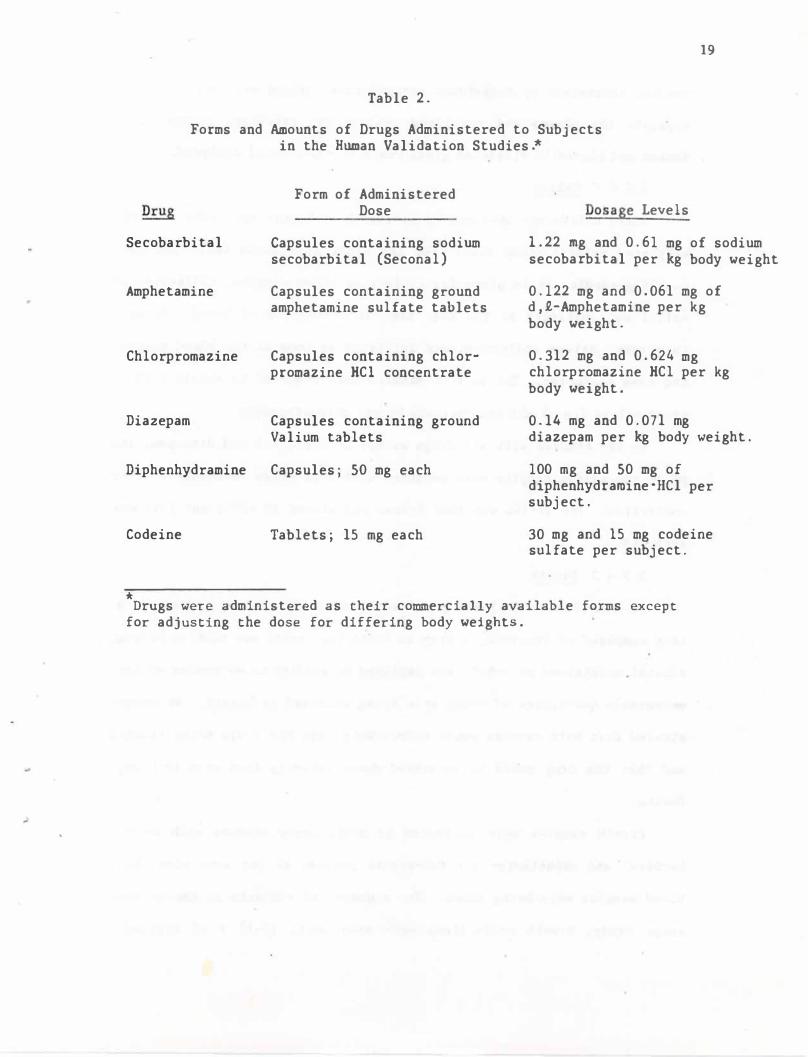
3 . 2 . 2 Dose Forms of the Drugs and Method of Administration
Drugs were administered orally in a commercially ava"ilable form.
Two dose levels were used for each drug with the higher level being
twice the lower level . Doses of secobarbital , amphetamine , chlorpromazine
and diazepam were adjusted for d�ffering body weights . The exact forms
and dosages of the drugs are shown in Table 2 .
3 . 2 . 3 Medical Support for Subjects
Subjects were under constant supervision of Dr. Perez-Reyes for at
least the first 4 hours of the experiment. Since the doses given were
within the therapeutic range , pharmacodynamic effects were noticeable
for some drugs . This was especially true for chlorpromazine . Particu-
lar attention was given to the subj ects until these effects disappeared "" "
and in no case were subjects released from constant supervision of the
physician while pharmacodynamic effects were observable . Each subj ect
was also seen by Dr . Perez-Reyes 6 , 8 , 11 and 24 hr after administration
of the drug .
3 . 2 . 4 Collection of Biological Samples
3 . 2 . 4 . 1 Plasma (Blood)
Blood , ca . 30 mL per sample , was collected at 0 , 0 . 5 , 1 . 0 , 1 . 5 ,
2 . 0 , 3 , 4, 6 , 8, 11 and 24 hr after administration of the drug. For the
first four houts these samples were collected through an indwelling
18
Table 1 .
Ages and Weights of Subj ects .
Drug Subject Age (yr) Weight (kg) Secobarbital Sl 27 70 . 5
S2 26 71 . 4 83 25 67 . 0 84 24 74 . 8 85 32 79 . 4 86 22 77 . 1
Amphetamine Al 27 80 . 7 A2 25 68 . 9 A3 24 70 . 3 A4 27 68 . 0 AS 26 81 . 2 A6 24 83 . 9
Chlorpromazine CLI 24 84 . 0 CL2 25 63 . 0 CL3 27 68 . 0 CL4 22 70 . 5 CL5 24 75 . 0 CL6 24 68 . 0
Diazepam Dl 24 70 . 3 . D2 27 80 . 7 D3 25 69 . 0 D4 26 81 . 2 D5 30 77 . 1 D6 27 68 . 0
Diphenhydramine DPI 24 83 . 0 DP2 24 68 . 0 DP3 20 71 . 2 DP4 22 70 . 3 DP5 24 59 . 0 DP6 19 74. 8 DP7 27 68 . 0
.. Codeine Cl 24 84 . 0
C2 31 78 . 0 C3 28 73 . 0 C4 29 68 . 2 �
C5 31 75 . 0 C6 24 66 . 0
19
Table 2.
Forms and Amounts of Drugs Administered to Subjects in the Human Validation Studies.*
Secobarbital
Amphetamine
Chlorpromazine
Diazepam
Diphenhydramine
Codeine
*
Form of Administered Dose
Capsules containing sodium secobarbital (Seconal)
Capsules containing ground amphetamine sulfate tablets
Capsules containing cblor· promazine HCI concentrate
Capsules containing ground Valium tablets
Capsules; 50 mg each
Tabletsj 15 mg each
Dosage Levels
1.22 mg and 0.61 mg of sodium secobarbital per kg body weight
0.122 mg and 0.061 mg of d,£-Amphetamine per kg body weight.
0.312 mg and 0.624 mg chlorpromazine HCl per kg body weight.
0.14 mg and 0.071 mg diazepam per kg body weight.
100 mg and 50 mg of diphenhydramine"Hel per subject.
30 mg and 15 mg codeine sulfate per subject.
Drugs were administered as their commercially available forms except for adjusting the dose for differing body weights.
20
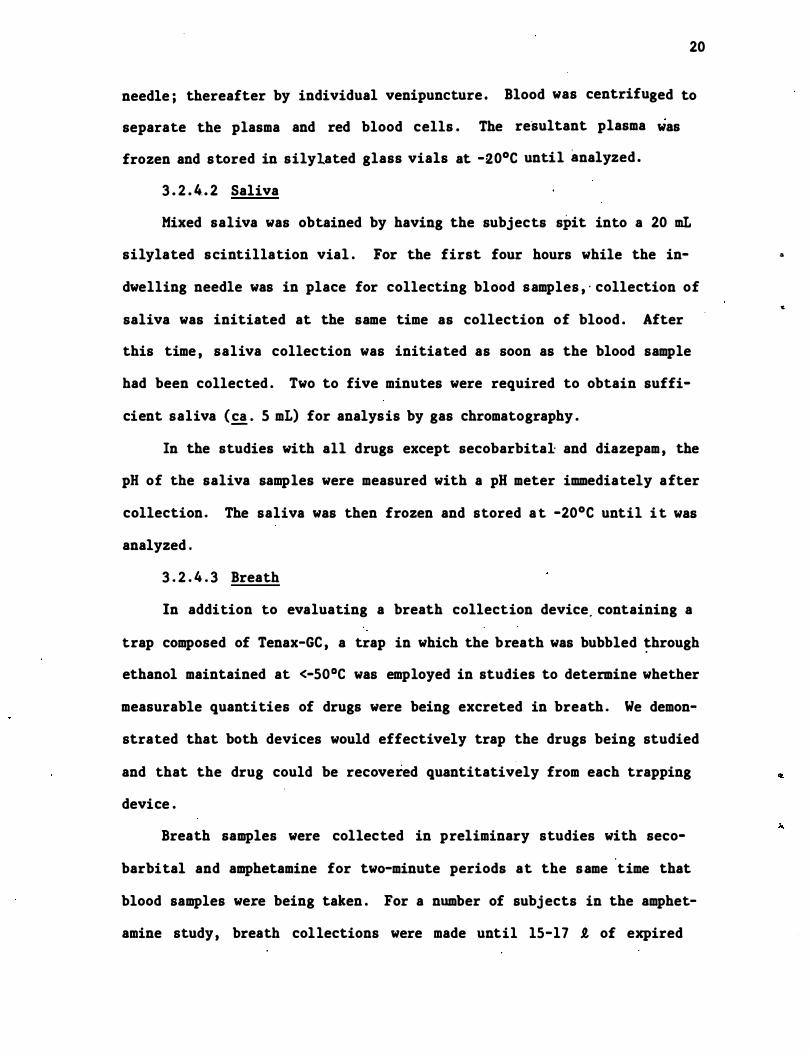
needle; thereafter by individual venipuncture . Blood was centrifuged to
separate the plasma and red blood cells . The re'sultant plasma was
frozen and stored in silylated glass vials at -20°C until analyzed .
3 . 2 . 4 . • 2 Saliva
Mixed saliva was obtained by having the subjects spit into a 20 mL
silylated scintillation vial . For the first four hours while the in
dwelling needle was in place for collecting blood samples , · collection of
saliva was initiated at the same time as collection of blood . After
this time , saliva collection was initiated as soon as the blood sample
had been collected . Two to five minutes were required to obtain suffi
cient saliva C£!. 5 mL) for analysis by gas chromatography .
In the studies with all drugs except secobarbital and diazepam , the
pH of the saliva samples were measured with a pH meter immediately after
collection. The saliva was then frozen and stored at -20°C until it was
analyzed .
3 . 2 . 4 . 3 Breath
In addition to evaluating a breath collection device. containing a
trap composed of Tenax-GC , a trap in which the breath was bubbled �hrough
ethanol maintained at <-SOoC was employed in studies to determine whether
measurable quantities of drugs were being excreted in breath . We demon
strated that both devices would effectively trap the drugs being studied
and that the drug could be recovered quantitatively from each trapping
device .
Breath samples were collected in preliminary studies with seco
barbital and amphetamine for two-minute periods at the same time that
blood samples were being taken . For a number of subj ects in the amphet
amine study, breath collections were made until lS-17 R. of expired
..
..
21
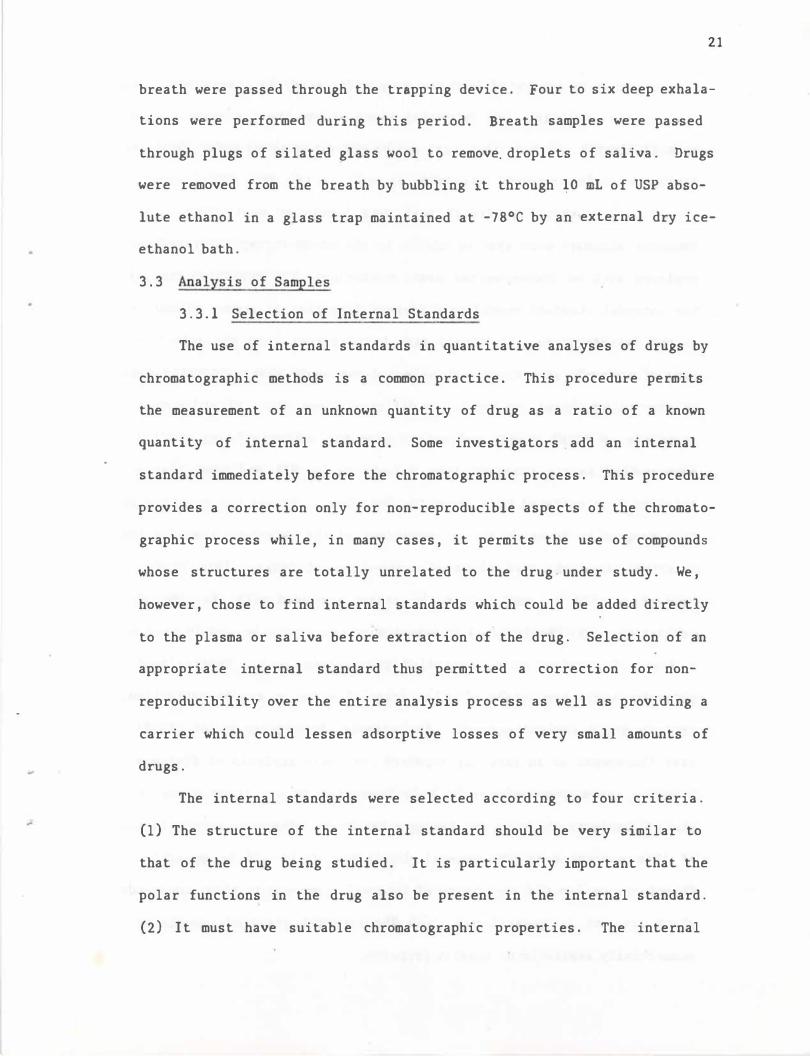
breath were passed through the trapping device. Four to six deep exhala
tions were performed during this period. Breath samples .... ere pas·sed
through plugs of silated glass wool to remove, droplets of saliva. Drugs
were removed from the breath by bubbling it through �O roL of USP abso
lute ethanol in a glass trap maintained at -78°C by an external dry ice
ethanol bath.
3.3 Analysis of Samples
3.3.1 Selection of Internal Standards
The use of internal standards in quantitative analyses of drugs by
chromatographic methods is a common practice. This procedure permits
the measurement of an unknown quantity of drug as a ratio of a known
quantity of internal standard. Some investigators add an internal
standard immediately before the chromatographic process. This procedure
provides a correction only for non-reproducible aspects of the chromato
graphic process while, in many cases, it permits the use of compounds
whose structures are totally unrelated to the drug under study. We,
however, chose to find internal standards which could be added directly
to the plasma or saliva before extraction of the drug. Selection of an
appropriate internal standard thus permitted a correction for non
reproducibility over the entire analysis process as well as providing a
carrier which could lessen adsorptive losses of very small amounts of
drugs.
The internal standards were selected according to four criteria.
(1) The structure of the internal standard should be very similar to
that of the drug being studied. It is particularly important that the
polar functions in the drug also be present in the internal standard.
(2) It must have suitable chromatographic properties. The internal
22
standard must be separated from the drug under study by the column being
used in the analysis . The retention times of the two compounds should
be sufficiently close so that they can be chro�tographed under identical
conditions . The internal standard , as well as the d,rug under study ,
should give a sharp symetrical peak with little or no tailing . The
internal standard must also be stable to the chromatographic procedures
employed with no decomposition peaks occurring . The ret�ntion time of
the internal standard should be different from that of common plasma or
saliva interferences . It should also be different from the retention
time of commonly used drugs . We selected compounds whose retention time
on the column being employed was different from those of endogenous
compounds in blank plasma and saliva from the subjec,ts being studied
from pooled saliva obtained from volunteers at RTI and from plasma
obtained from outdated blood from the Red Cross . It was not possible in
this program to do an extensive comparison of the retention times of the
internal standards with those of commonly used drugs . This study ,
however , should be done before the assays are used with the general
population. (3) The internal 'standard must not i'tself be widely used as
a drug . In studies with controlled populations , e . g . t hospitalized
patients , where the intake of other drugs is known or can be controlled ,
this is not a . serious concern. For example , DiGregorio et al (1978)
used flurazepam as an internal standard for their analysis of diazepam.
Likewise , such compounds could have been used in our study since we
studied subj ects who were not taking other drugs . However , extrapolation
of this procedure to the general population would not be ·possible .
Therefore , we limited our choice of internal standards to those compounds
which are not in general use . (4) The internal standards should be
commercially available or readily prepared .
o
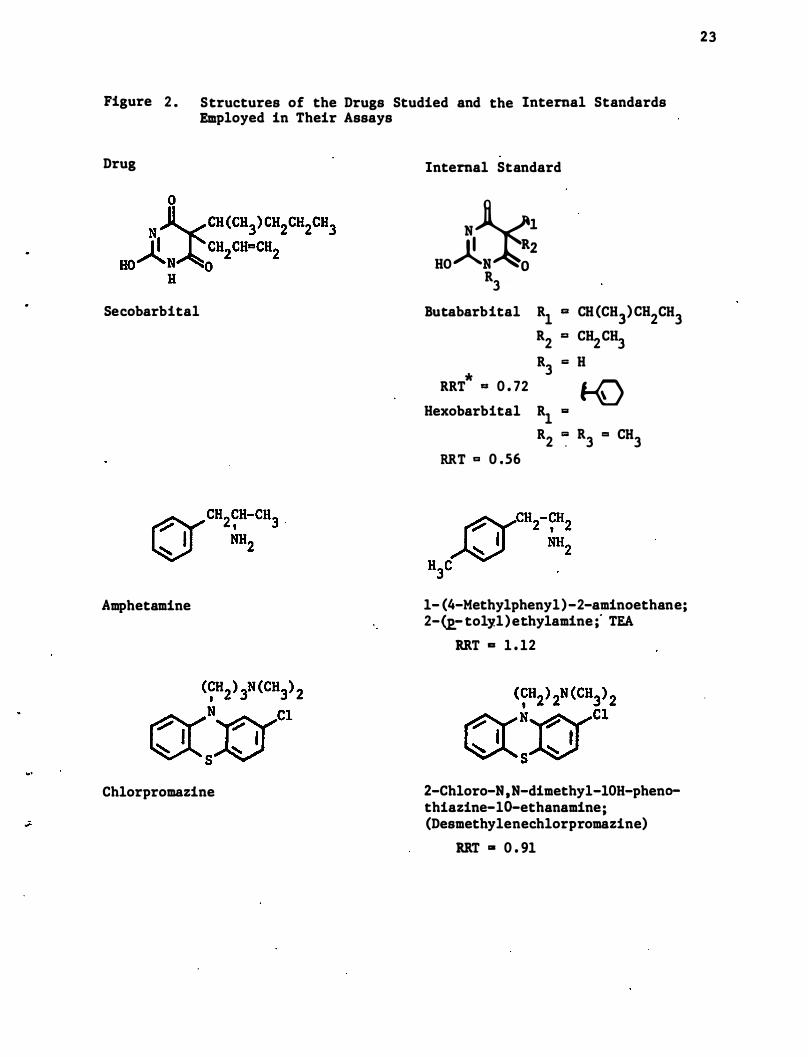
Figure 2. Structures of the Drugs Studied and the Internal Standards Employed in Their Assays
Drug Internal Standard
Secobarbital
Amphetamine
Chlorpromazine
HOJl�� R3
Butabarbital Rl a CH (CH3) CH2CH3 R2 a CH2CH3 R .,. H
* 3 RRT .,. 0 . 72 1-0
Hexobarbital Rl '"
R2 � R3 .,. CH3 RRT .,. 0.56
1- (4-Methylphenyl)-2-aminoethane; 2-�tolyl)ethylamine ;' TEA
RRT a 1 . 12
2-Chloro- N, N-dimethyl-10H-phenothiazine-lo-ethanamine; (Desmethylenechlorpromazine)
RRT g 0 . 91
23
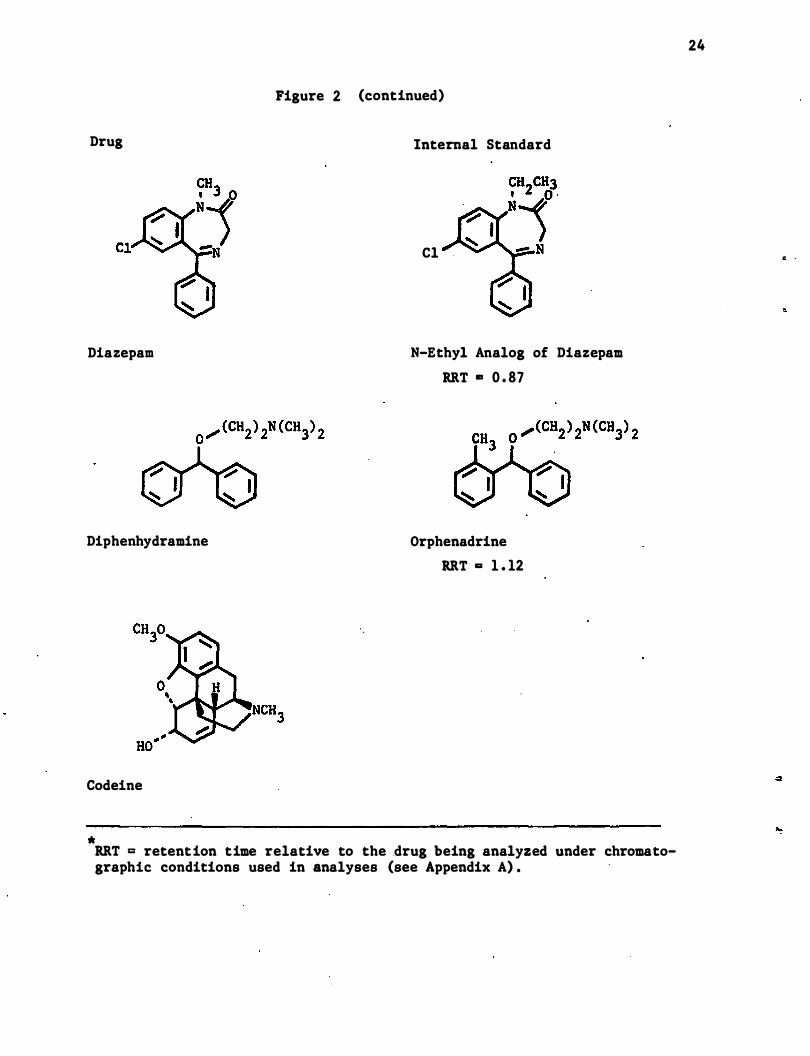
Figure 2 (continued)
Drug Internal Standard
Diazepam
Diphenhydramine
Codeine
*
Cl
N-Ethyl Analog of Diazepam
RRT .. 0 . 87
Orphenadrine
RRT a 1 . 12
RRT = retention time relative to the drug being analyzed under chromato-graphic conditions used in analyses (see Appendix A) .
24
� .
"
25
The structures of the compounds used for internal standards and the
drugs for which they were used are shown in Figure 2 . All of these
internal standards meet �e criteria as specif�ed above , with the possible
exception of the internal standard for secobartital . For this reason ,
we chose two internal standards to be used for this drug . Both are also
barbiturates listed in the Merck Index . From a chromatographic stand
point , the best internal standard is butabarbital . Howe�er, this com
pound is also listed in the current Physicians Desk Reference , and thus
may be used by a small number of people . The second internal standard ,
hexobarbital , is slightly inferior from a chromatographic standpoint ,
but is not included in the current Physicians Desk Reference as an
available drug .
The internal standard chosen for amphetamines , 2- (p-tolyl)ethyl
amine , is available from commercial sources . Another possible internal
standard for amphetamines is shown in Appendix A . 2 . The internal stan
dards selected for chlorpromazine and diazepam, desm�thylene chlorproma
zine and the N-ethyl analog of diazepam, respectively , are not commer
cially available . They were prepared by alkylation of the appropriate
phenothiazine or benzodiazepine respectively . An alternate internal
standard for diazepam is shown in Appendix A . 4 . The internal standard
selected for diphenhydramine is orphenadrine . While several trade names
exist for this compound in the Merck Index , it ·is not listed as being
available in the current Physicians Desk Reference . No internal standard
was necessary for the assay of codeine which was done by radioimmunoassay
(RIA) .
26
3 . 3 . 2 Extraction Method
At the initiation of this proj ect, it was hoped that a maximum of
three extraction methods would suffice for a�l compounds studied: one
for basic drugs , one for neutral drugs , and one for , acidic drugs . It .
would , thus , be feasible to design an analytical scheme so that a number
of drugs could be analyzed simultaneously . Unfortunately , due to the
wide diversity of the compounds studied in this project " this was not
completely possible . Codeine was analyzed without being first extracted
from plasma or saliva . The extraction procedures used for the other
drugs are shown in Appendix A . In general , basic drugs and diazepam
were extracted with toluene or with a solution of 1-2% isoamyl alcohol
in hexane from plasma and saliva that had been made �asic and to which
the internal standard had been added . Procedures for analysis of ampheta-
mine and diphenhydramine call for these drugs to then be extracted into
aqueous acid . The resulting amphetamine hydrochloride was concentrated
and converted to its trifluoroacetamide before chromatographic analysis .
In the extraction procedure for diphenhydramine , the aqueous acid was
made basic and the diphenhydramine reextracted into methylene chloride .
It was then ready for chromatographic analysis . Chlorpromazine and
diazepam were analyzed directly from the concentrated organic extracts .
The slightly acidic secobarbital was extracted from acidified saliva or
plasma , after the addition of the internal standards , with chloroform.
Secobarbital was then reextracted into a sodium hydroxide solution.
This solution was made acidic and the secobarbital extracted once again
into chloroform . The chloroform extract was concentrated and the seco-
barbital analyzed by gas chromatography . Silylated glassware was used
throughout all extraction and analytical procedures . All solvents were
"distilled in glass" quality.
!
27
For the analysis of breath , the ethanol contained in the breath
traps from the subjects in the secobarbital study was made slightly
basic with sodium hydroxide . It was then concentrated at 30°C . The
residue was made acidic and extracted with chloroform. After evapora
tion of the chloroform , the residue was chromatographed'. Methanolic BCL
was added to the ethanol in the breath traps from the subj ects in the
amphetamine study in order to convert the amphetamine to the non
volatile amphetamine hydrochloride . The ethanol was then evaporated and
the residue dissolved in toluene and treated with trifluoroacetic anhy
dride as described for the plasma and saliva .
3 . 3 . 3 Gas Chromatographic Analyses
Analyses for all drugs , except for codeine , (this analysis was done
by radioimmunoassay, cf section 3 . 3 . 4) were performed on a gas liquid
chromatograph equipped with capillary columns and a nitrogen-phosphorus
specific (thermionic) detector. The capillary columns were employed to
increase resolution and reproducibility . The columns chosen for this
proj ect had highly deactivated surfaces which allowed us to achieve
quantitation at very low concentrations of the drugs . At the initiation
of the proj ect , commercial capillary columns which provided these highly
deactivated surfaces were not available . The initial columns were thus
prepared at RTI . The column surfaces were prepared by cleaning them
with BCl gas followed by the deposition of a thin layer of barium car
bonate . Next , a thin film of pyrolyzed Carbowax was formed on the
surface of the barium carbonate . Finally , the desired stationary phase
was introduced in the column . The inside diameter of these columns was
0 . 25 mm . The l�ngth of column required for the analyses ranged from 8-
30 meters . Toward the end of the proj ect , commercial columns with
satisfactory performance were available . The columns used for the
analysis of diphenhydramine were purchased from Chrompack U . S .A .
28
The nitrogen-phosph�rus specific the�ionic detection further
increased the specificity of the assay while providing more sensitivity
than is available with flame ionization detection . This detector was
also used in those cases where there was a choice between electron
capture and nitrogen-phosphorus specific detectors . Since only a small
portion of drugs are inherently sensitive to electron capture detection
while most drugs contain nitrogen, the use of a nitrogen-phosphorus
detector provides a generalized detection system for them while being
insensitive to most endogenous compounds .
Samples were introduced onto the columns with a splitless inj ection
system . Such an inj ection system permitted routine inj ection of 1 �L of
the sample onto the column. (The other commonly used injection system
with capillary columns is a split injection in which approximately 0 . 01
�L of sample actually is applied to the column. ) An automatic sampler
was employed . Samples to be chromatographed were dissolv�d in 10-20 �L
of an appropriate solvent and placed in 100 �L conical vials . Two
stationary phases were used in the analyses in this proj ect : polymethyl
silicone (SE-30 , OV-lOl) and polyethylene glycol (Carbowax 20-M ; CP Wax
51) . Columns containing some other valuable stationary phases were not
available either because techniques have not been perfected to permit
the reproducible preparation of good columns (OV-17) or because the
column phases contain nitrogenous substituents which slowly bleed into
the nitrogen sensitive detector (e . g . , OV-225) .
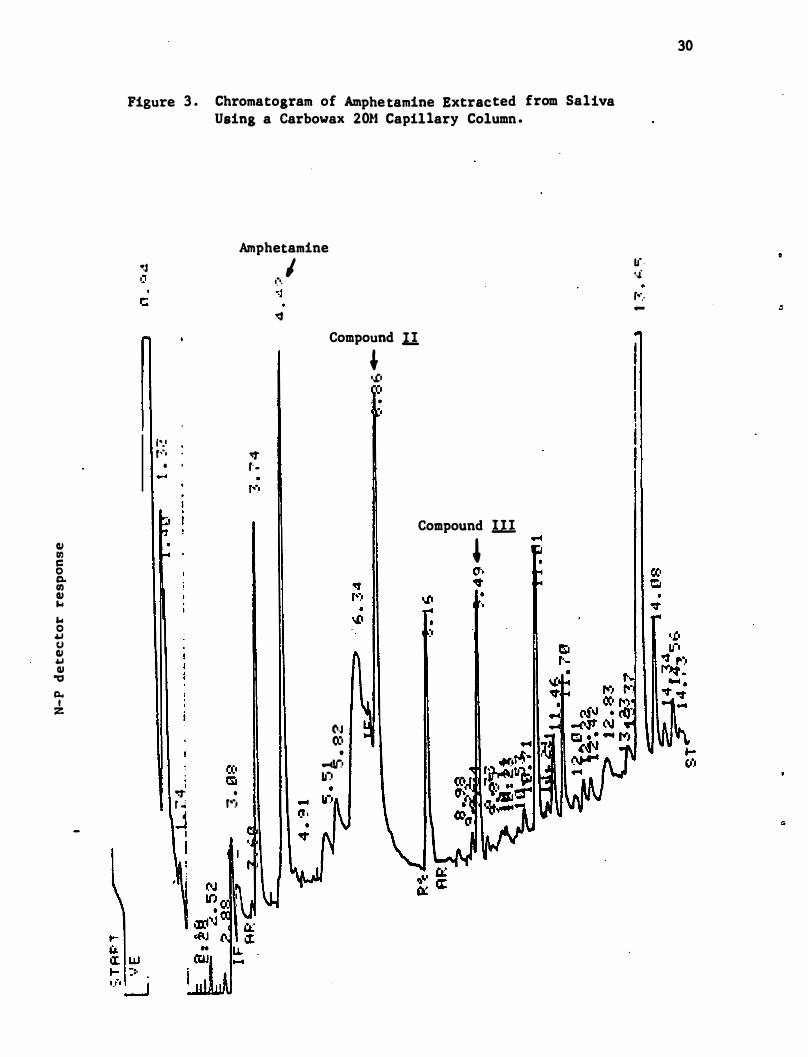
The Carbowax stationary phase proved superior for all compounds
except amphetamine . Amphetamine trifluoroacetamide and its internal
"
4
29
standards were not well resolved from endogenous compounds on the
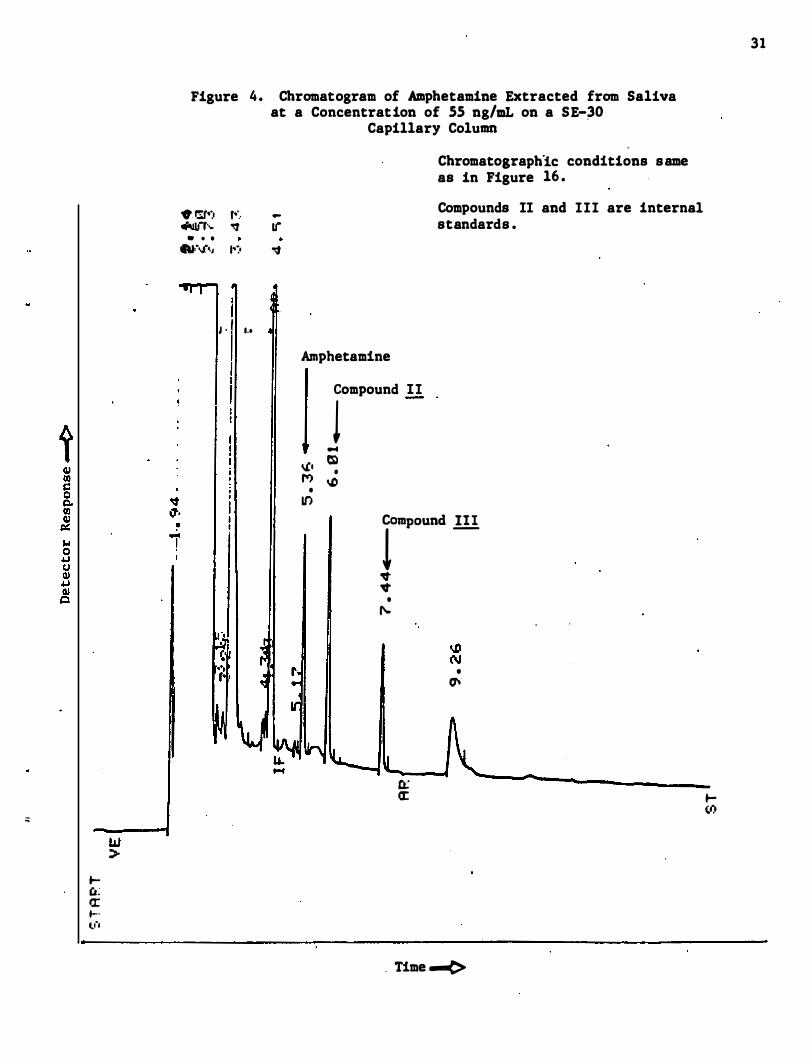
Carbowax column (cf . Figure 3) . Much better resolution and sharper
peaks were obtained using a SE-30 capillary column as is seen in Figure
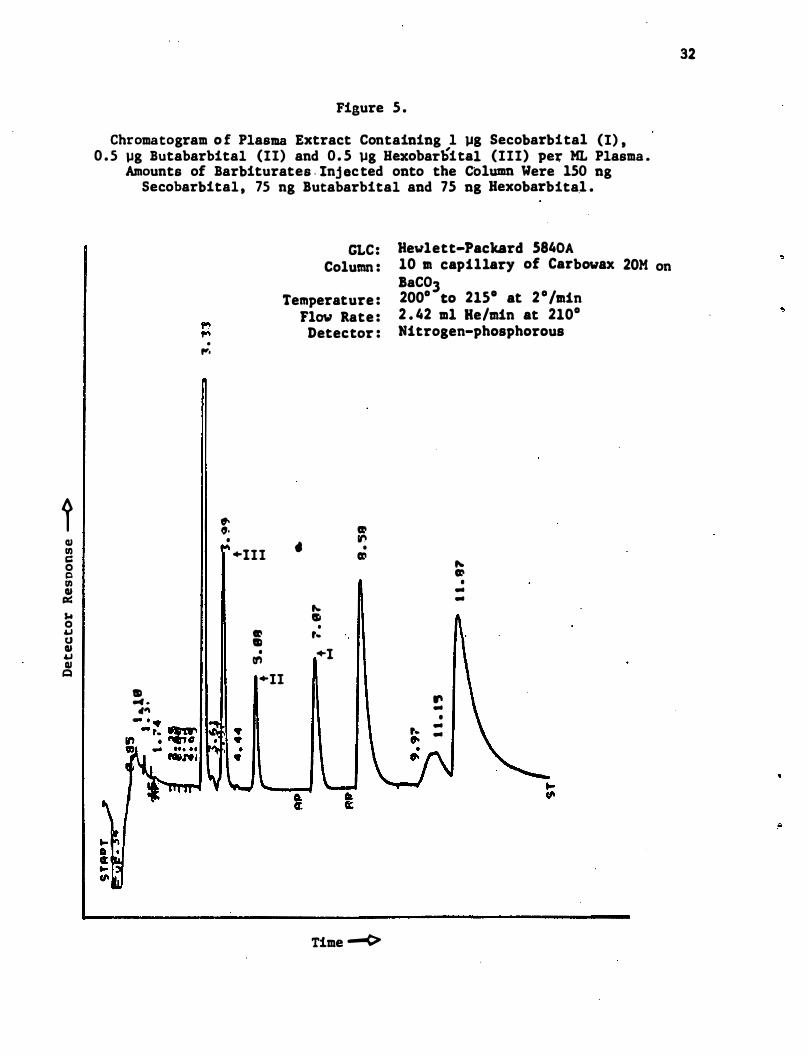
4 . On the other hand , excellent separation and peak ,hape are observed
for secobarbital on a Carbowax column (Figure 5 ) , whereas these param
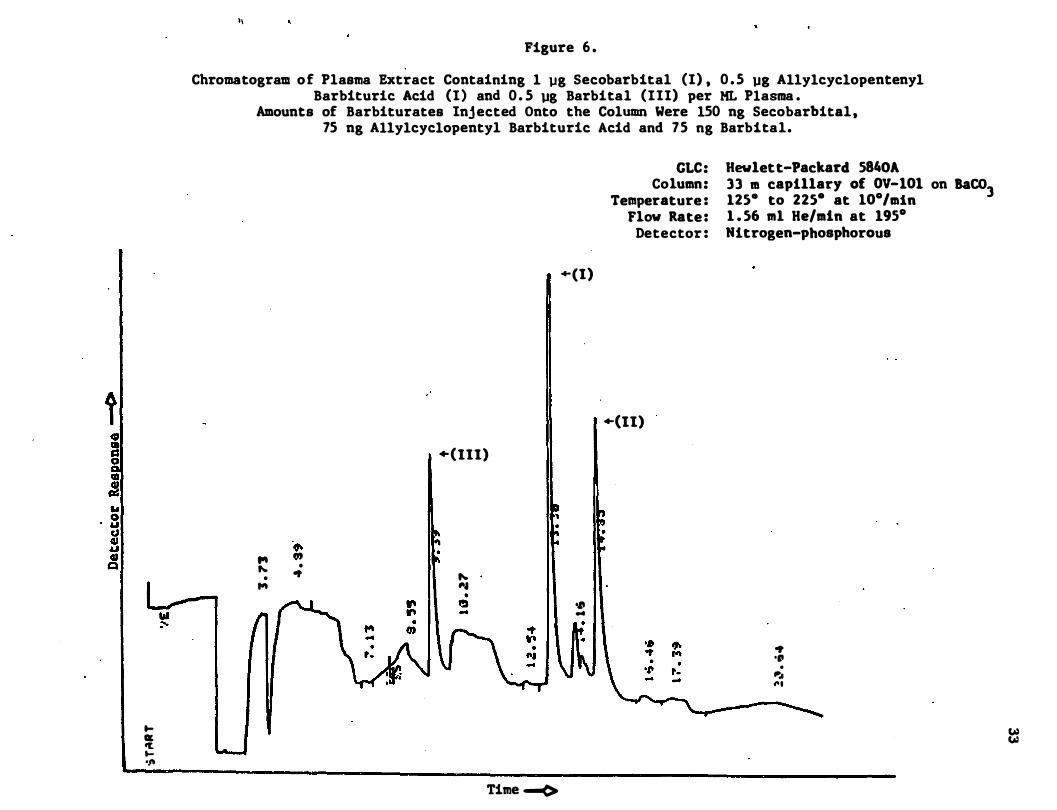
eters are not nearly so good when secobarbital is chromatographed on a
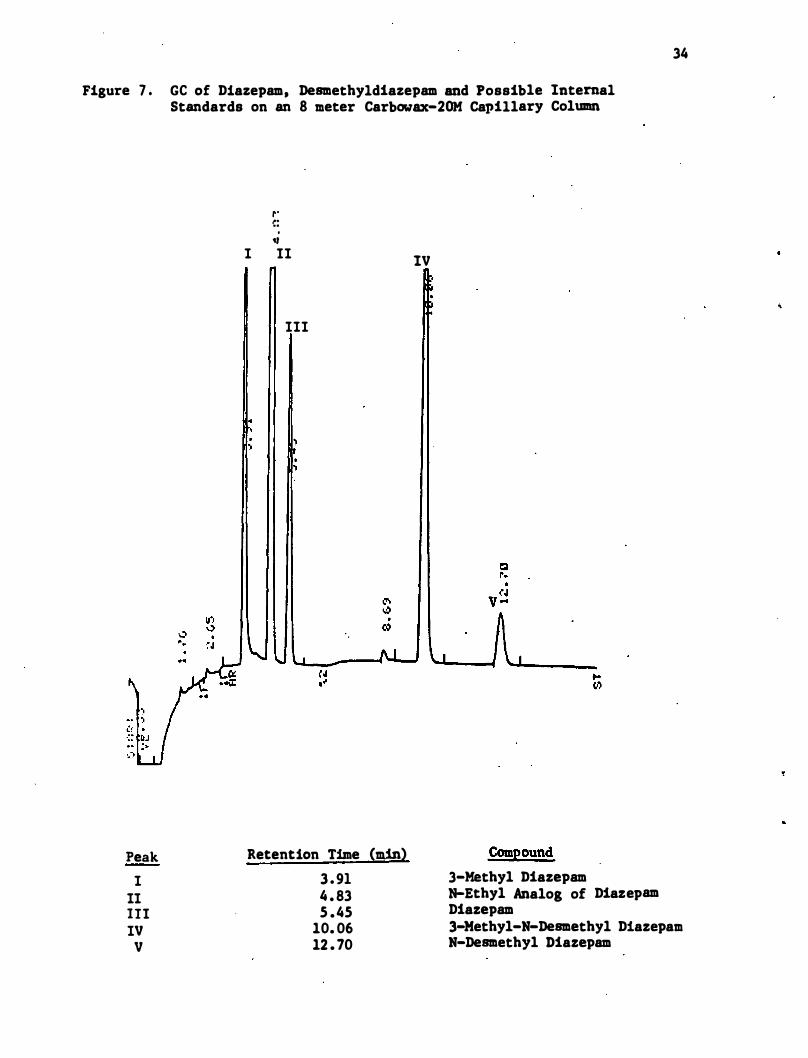
methyl silicone (OV-lOl) column (cf. Figure 6) . Diazep,am could be
chromatographed well on either column ; however , the methyl silicone
columns were unable to separate diazepam from any of the internal stan
dards . This separation was readily obtained using the Carbowax column
(cf. Figure 7 ) . This column did equally well for chlorpromazine and
diphenhydramine . Typical chromatograms from saliva ,and plasma , exact
chromatographic conditions , and standard curves for assays of all com
pounds are given in Appendix A . All assays were run at least in dupli
cate . Further replicate assays were run in cases where the duplicate
assays were not in close agreement .
3 . 3 . 4 Radioimmunoassay
The antiserum to codeine was obtained from Dr . John Findlay ,
Wellcome Research Laboratories . The procedure used for the radioimmuno
assay was essentially that published by Findlay et a 1 . (1976) . This'
antiserum has extremely low cross reactivity with codeine-6-glucuronide
and morphine , known metabolites of codeine . The assay was designed for
use with 0 . 1 mL of plasma . The assay was adapted for use with saliva in
which 10-50 �L of saliva were used per assay . Thus , the radioimmuno
assay required less than 1/10 of the plasma and saliva necessary for a
gas chromatographic assay . The details of the assay procedure are
included in Appendix A .
G.I en C o C). en G.I ... ... o .. U G.I .. QJ
"tI
a. I z
Figure 3 . Chromatogram of Amphetamine Extracted from Saliva Using a Carbowax 20l-t Capillary Column .
0:2 "
Amphetamine
,.', r" ', ". • . t-
, -:t r � j I
I
• r'�'
I�·. o:J ":f
I
Compound n
N 0:0
• .-4lr' ."')
, • .£ • . .
"
Compound ill
,
30
Li · • .£ r··.· -
;;
W ::;-
� u: a: .... ('-1
Figure 4 . Chromatogram of Amphetamine Extracted from Saliva at a Concentration of SS ng/mL on a SE-�O
Capillary Column
. �.) r··.· �'''' "!f • • •
"'."�J .':0
I � · I I.'
-If '1
Amphetamine
Compound II
J ... � 'il • M t.D
• U')
Chromatographlc conditions same as in Figure 16 .
Compounds II and III are internal standards .
• rpOund lli j'
I
'It 'It
• ,...
• 0'
Q;: a:
. Time .-(>
31
� (."
t IV II) c 0 p II) IV � ,.. 0 4J 0 IV 4J IV
Q
Figure 5 .
Chromatogram of Plasma Extract Containing 1 �s Secobarbital (I) , 0 . 5 �g Butabarbital (II) and 0 . 5 �g Bexobar�ital (III) per ML Plasma .
Amounts of Barbiturates . lnj ected onto the Column Were 150 ng Secobarbital , 75 ng Butabarbital and 75 ns Hexobarbita.l .
• .,f • "'"
. ....
.. o· •
GLC: Column :
Temperature : Flow Rate : Detector :
CI:' • '"
+111 • CI:'
t-SI
• CI:' .. ,.
• +1 en
+11
Time --<>
Hewlett-Packard 5840A 10 m capillary of Carbowax 20M on BaCOl 200° to 215° at 2°/min 2 . 42 m1 He/min at 210° Nitrogen-phosphorous
t-CI:' • --
" -•
,. -.. -
32
, • :I & Ie :I ... 8 cJ il
� tit � � ."
1\
Figure 6 .
Chromatogram o f Plasma Extract Containing 1 �g Secobarbital (I) , 0 . 5 �g A11y1cyc1openteny1 Barbituric Acid (I) and 0 . 5 �g Barbital (III) per HL Plasma .
Amounts of Barbiturates Injected Onto the Column Were 150 ng Secobarbital , 75 ng Al1y1cyc1opentyl Barbituric Acid and 7 5 ng Barbital.
� (I) '" • .... oJ • M
+(111)
t..,
Time -<:>
+(1)
." ..
GLC: Column:
Temperature : Flow Rate :
Detector :
+(II)
Hewlett-Packard 5840A 33 m capillary of OV-IOI on BaC03 1250 to 2250 at lOo/min 1 . 56 m1 He/min at 1950 Nitrogen-phosphorous
oJ ." .
.... .. ,
w �
34
Figure 7 . GC of Diazepam, Desmethyldiazepam and Possible Internal Standards on an 8 meter Carbowax-2OM Capillary Column
Peak I
II III IV
V
r' -:: . . ,
I II
III
. ')
Retention Tfme (min) 3 . 91 4 . 83 5 .45
10. 06 12 . 70
IV
Compound 3-Methyl Diazepam N-Ethyl Analog of Diazepam Diazepam 3-Hethyl-N-Desmethyl Diazepam N-Desmethyl Diazepam
..
3 . 4 Methods Used for Studying Effects of Increased and Decreased
Salivary Flow
35
In these experiments , two subjects were each given " a single 100 mg
capsule of sodium secobarbital at time O. Subjects S·l and S-6 from the
previous secobarbital studies were used in the experiments . After
administration of the secobarbital , blood , breath , and saliva samples
were collected at 1 . 5 , 2 . 0 , and 3 . 0 hours . Blood (10 mL) 'and saliva (3
mL) were collected as in the prior study. Breath samples consisted of
the entire exhaled air over a 2 minute period .
After completion of the three hour sample collections , each subj ect
was administered one drop of lemon juice to stimulate saliva production.
Blood (10 mL) and saliva (3 mL) samples were then ·taken . The time
required for saliva collection was measured . This procedure was repeated
after a 15 minute interval . Immediately after the second saliva collec
tion , atropine was administered intravenously. Fifteen minutes ' later,
blood and saliva samples were taken as before and the time required for
saliva collection was measured . After an additional 15 �inutes , this
collection procedure was repeated . The saliva and plasma sampl�s col
lected in the study were analyzed as described in section 3 . 3 . Breath
samples were analyzed as described in section 4 . 5 .
3 . 5 Methods for Analysis of Creatinine in Saliva
The possibility of using the concentration of creatinine in saliva
as an "internal standard" in order to arrive at better predictions of
the concentration of amphetamines in plasma from its concentration in
saliva was investigated . A method for the determination of " creatinine
concentrations in saliva has been reported by Pu and Chiou (1979) . This
method involves the chromatography of deproteinized saliva by high
36
performance liquid chromatography (HPLC) on a strong cation-exchange
column using a pH 4 . 8 buffer as the mobile phase with detection of ·the
eluting creatinine achieved by measuring its . UV absorption at 254 nm .
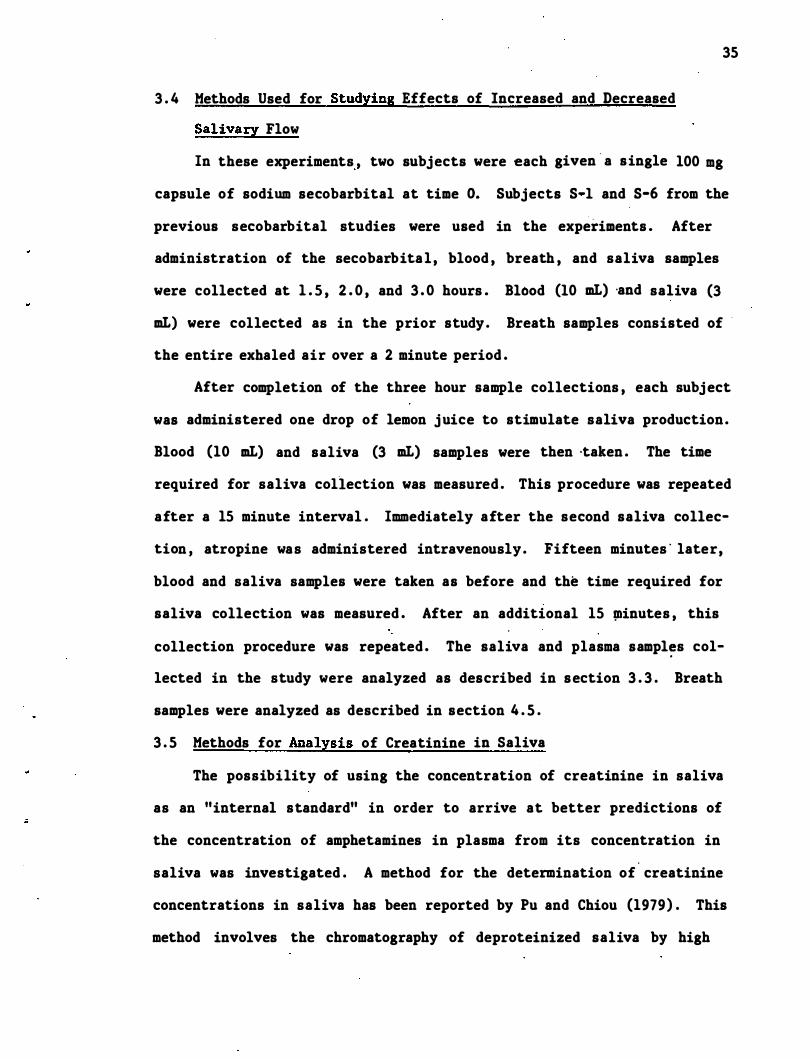
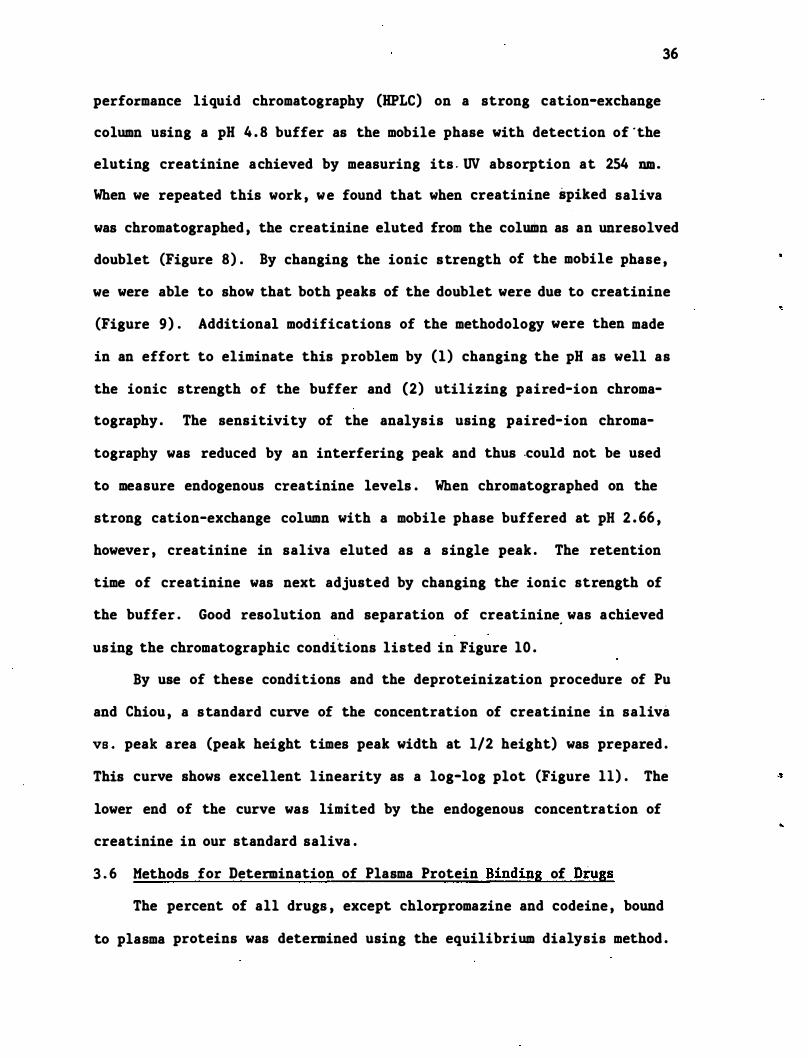
When we repeated this work , we found that when creatinine spiked saliva
was chromatographed , the creatinine eluted from the column as an unresolved
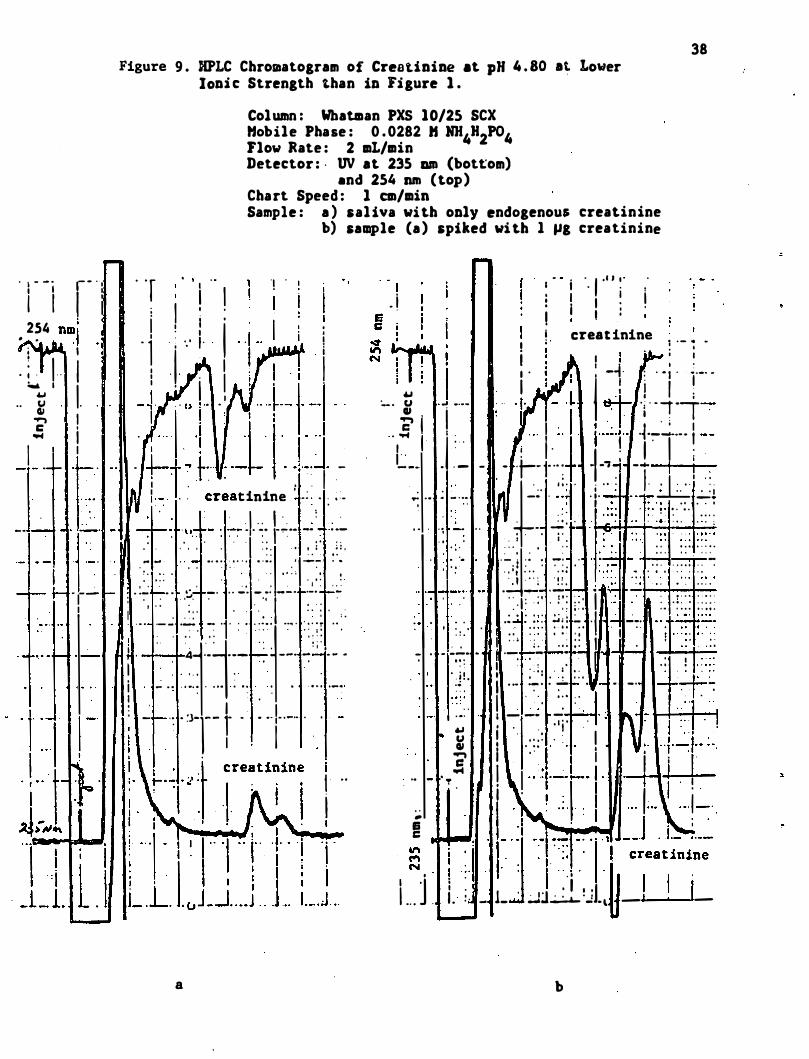
doublet (Figure 8) . By changing the ionic strength of the mobile phase ,
we were able to show that both peaks of the doublet were due to creatinine
(Figure 9) . Additional modifications of the methodology were then made
in an effort to eliminate this problem by (1) changing the pH as well as
the ionic strength of the buffer and (2) utilizing paired-ion chroma
tography . The sensi ti vi ty of the analysis using paired-ion chroma
tography was reduced by an interfering peak and thus -could not be used
to measure endogenous creatinine levels . When chromatographed on the
strong cation-exchange column with a mobile phase buffered at pH 2 . 66 ,
however , creatinine in saliva eluted as a single peak . The retention
time of creatinine was next adjusted by changing the ionic strength of
the buffer . Good resolution and separation of creatinine. was achieved
using the chromatographic conditions listed in Figure 10 .
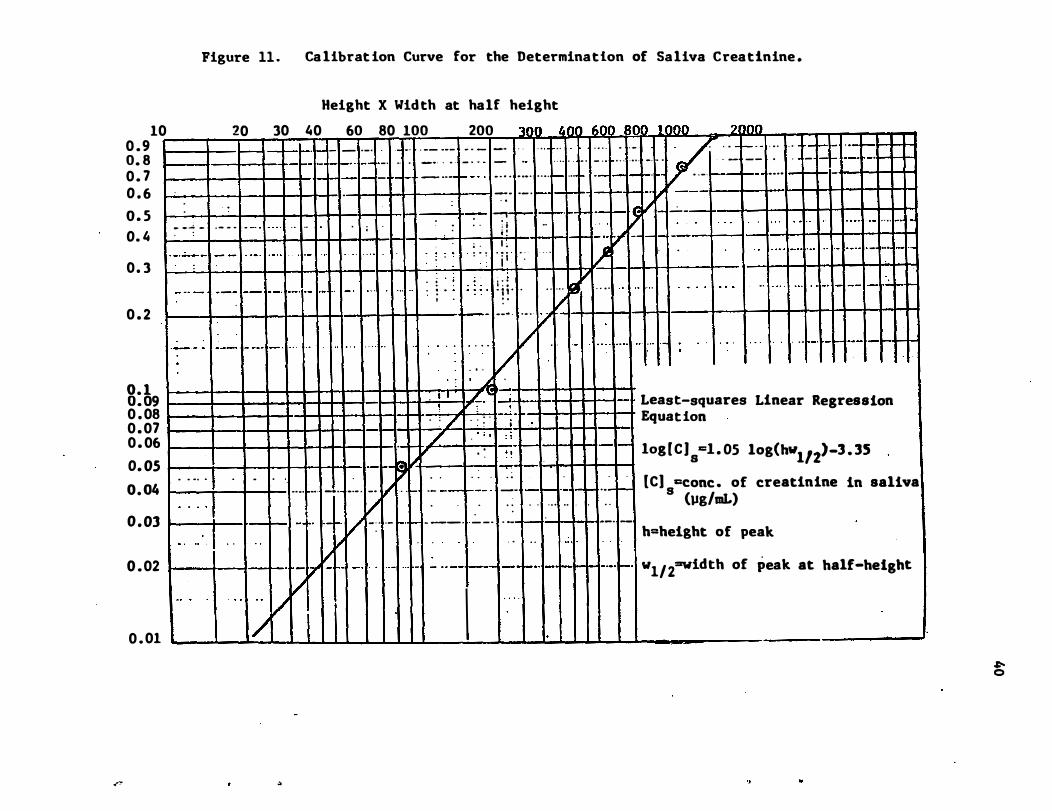
By use of these conditions and the deproteinization procedure of Pu
and Chiou , a standard curve of the concentration of creatinine in saliva
VB . peak area (peak height times peak width at 1/2 height) was prepared .
This curve shows excellent linearity as a log-log plot (Figure 11) . The
lower end of the curve was limited by the endogenous concentration of
creatinine in our standard saliva .
3 . 6 Methods for Determination of Plasma Protein Binding of Drugs
The percent of all drugs , except chlorpromazine and codeine , bound
to plasma proteins was determined using the equilibrium dialysis method .
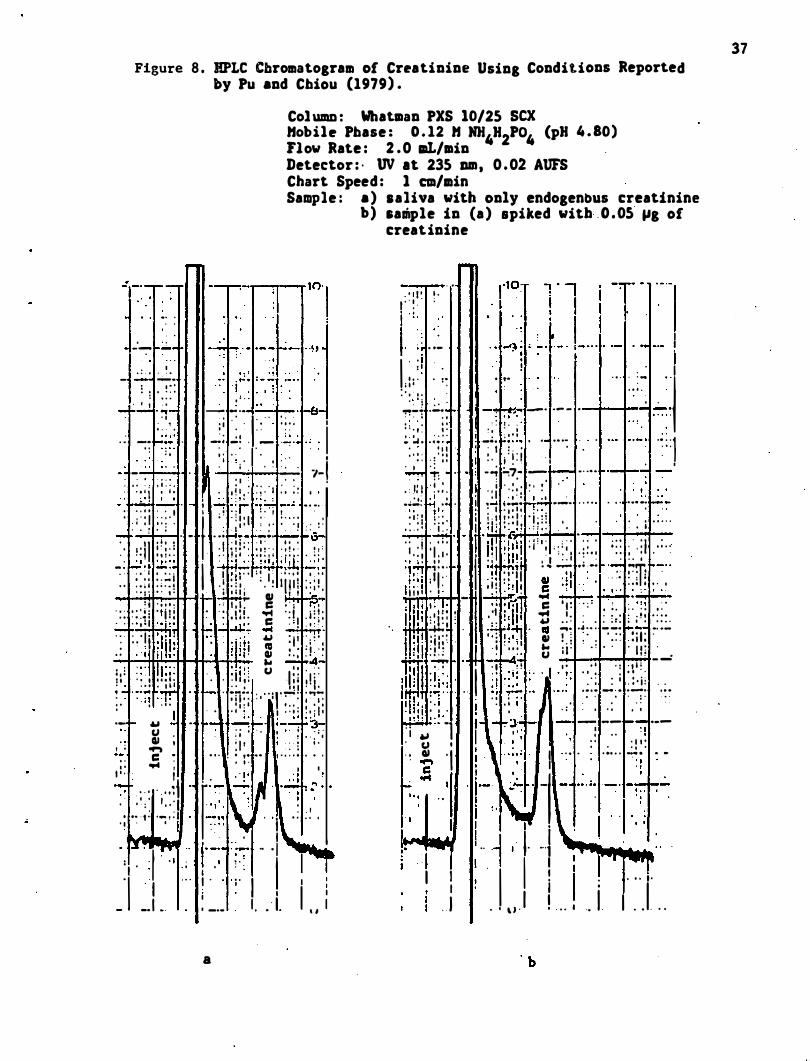
Figure 8 . HPLC Cbromatogram of Crratinine Using Conditions Reported by Pu and Chiou (1979) .
Col UDI.D : Whatlllan PXS 10/25 sex Hobilr Phase : 0 . 12 H NH.H2PO. (pH 4 . 80) Flow Rate : 2 .0 aL/min Detector : · UV at 235 am , 0 .02 AUFS Chart Speed : 1 em/min Sample : a ) .aliva with only endogenous creatinine
· " -: : - -'-:- ro: ' --
, : , . � . - - .... -: ! ' 0 : : : . ' t · , --.....;. ."'-· . ,
t . ' .
. � -:: ���: . , : .
...
, ' " --- _ ". . -B-
: ; . : ' j : : ' " : ; : . '1 .-7; ..;; ' .- . .:.: . : . : :
: i " ; ' I '. � . : . . '1
a :. -. - 7-• . • . • - I • I •
: ' : . ; j ' : . ; : . ' ; ' . : : ; . ' . : , : : " 1 � · r� ..!....! · t "':";' ;� r! · · �; � "'·! • . ..
I . . . . . . , � . ! . � . . , t ' · l " : I ; : ; ' . I " . ; � : , ; , . : " : ; . , : :
. • • • • · 1 . . , . . . ' - I • _ • • ; Ht- -." _ _ \5_ · ' 1 ' 4 ' . , ' I t " d ' • • •
• I ' ! I � I ' : . • � ' " • n ' : . t ! . . ! t : • • • I , � • • • • f . . . . . . , I I I • • • " . - : ...:.! �l �:;. I' �L.:J";'; 1!���� �: . · ' . • I • • • . I [; l� . I t � I : . • . • • . ' •
I " • • _ 1 I • I . , 1 \ 1 1 ' . ' I I I • • i l • • • • ! ' 0 0 : 1 . • • i ' : 1 ' , " 1 ' e . l ' I I ' I � .. t t "�
: t ' , , 1 . . : 1 . 1 . C I ' , r;". . : : : : '.! : " 1' ! ,i • . • , " .. , , ' .- : 1 . • . • • • • • • C " 1 ' ' , ' . . " , , 1 " i " � � .J.l!; .. " . . " :
. : : : I j : ' : '1 ; " : i " ' � : I i ' ; : ' , . : � ' I i i l l , : . ill l ! � : . ; : ! . : ... -.04-: , l : : : ! I! I : ; : I t • • , ' I ' , . " . , ' . I " � '7 ' 7�� �;: : " I • • ,
,- f- � 1 U , II , , ; ....,
. . c : . . .... I " . . I .� . . . · . . �t
· , . 1 I · " : , . . :
• ,. ' t · -- t · . ' I ' •
. : ! j ! : U I : : ' : : . . . 1 , , ; . , ; . 1 ,' . , I ' 1 1 ' , � . ;0:: : " ' ; l ��: ; '"T�
. • • : I � , I : : : : � . ; I : . "'-:- --=.; ..:.. .-� .:=:,; i , ' , " . ; . . : : ;
: I ' : ! . ' . , . . ' , . .. , , . , . . . . . - . ,
I " r' :,:�+r ' ,+� " :��:� I " " 1 . : : � ,
...... . . I I · 1.:J'!"1� ., j--'. ::':- � . I : '1 ' 1 " : I . " .. ; : I I I I - _I .. : _.. 1 • • ' 1. "
a
b) sample in (a ) spiked with . O . OS JIg of creatinine
...
-
-
_
..
· " 1 ' • . I ' . � . :
1, ' : , . . - I I i
I' ; ' ' . 1
. : : : . . :: ' .. ' . . : . �� . . " j • I . _
" , ' � �_ • • � _"!I. L..... , '-. - ' -- - • . ' . : . , I.�":--
' 0 . ' " : : I , " : ' : t . . . ! : : : : • . : • � . 0 4 '" --. t-.. .. . . . . . - " , ·· · ·1
• ' I I . ; I : ' . ' ' . . . . I t : : . : ' : : . ' f ! . I I · I . : . --f---l ' � 1: ' --; :....7.- --: r--:-:- . . ... �, • ; ,: t . � , : . I ' • , ' I t '
. I . � I : ; � : 'I : I ' .�.:.!: l.:.! .! . -" "...p.... . " • ••••• 1-.'-. , , 11 1 . � • ��!i� ! . . .-• • , . "
: ' � i : : : . l i ! ! : � I : ' i ; : ! . ' , . . . . I . . . !.!L '6' � . : : . . ' .
. : . i . . . . . . . i ' . : . 1 "1 1 ; ('�i : 1 " ; ; . : ; ' ; : ' ; : : . ' . : \ . : . . I . : , ' I . . , • , i : 1 1 " ' t : : . ; . � . ' � ' : � . : ' ++1 � ! . . I IOt .."H : .. -- , • .•• � .- "m e._"
' : ; j . 1 1 " : ! ! : : ' 1 1 . p : . . . :. ! ' ; l . , ! . : . ' . o I ! ' : ' 1 , "C 'd " . . , , . . I 1 1 1 1 ' " _ . : . � . .. � � � : ; ' � iF , ; , ! · �Iir"fl� C ' I : . . ; . , .- :7:' . .
I' �:d : " 1 : : ! :1 : : 1 1' / .. , . . : : : . : ' . ; ; . : : • , " . , • • .., . , ' • • • " 0 I . ' • • • •
" t ...... ' . ���J� . " ... � .� .. . --, i+':""!- •. • -�.I! :q ; : . " : � : ' d ., ! . i " : . . : : : i l : . i l l . , : · 1 ' " ... i I ' . . . . ' J l i . • 1 , .� • • U I . _ ...: ' 1 ' 1 . . . , , ! , . . , . : · , 1 : ii�' ! ! :D : � : . . I �l 'lf: : '/1 . :. : : : � : : � : ��! ' . :
.
I ! ' , : . i . � , ; " .. . . : '
. = ' .
· h i • , . • ' . . - . , . . , 1 . I . ' · . � __ �I- . ; -1 -�J' . r- --; -- r--:-; .--I � " , ' . , . . " . , t! ' j \ .: . " , , : , : ' , : . . , J: : , -�":? . 'I ' -" �
-: ;-I" \�' I����
!' I"i " II ' - j n · ,: 1 I I I I ; . . . , .
.I . ' \ J . 1 ! . . . 1 . 1 I . . I . . .
37
· 1 - - ' r - " , i I I i
• 2�4 �i i I
· ; . I ··
I .. �� ' I
. � I oS i I I
T ·
t _ .
. · 1 � · -' r-
I I
38 Figure 9 . HPLC Chromatogram of Creatinine at pH 4 . 80 at Lower
JODi c Strength than iD Figure 1 .
Column : Whatman PXS 10/25 SCX Hobile Phase : 0 . 0282 " HH4H2P04 Flow Rate : 2 mL/min Detector : · UV at 235 am (bot�om)
.nd 254 nm (top) Chart Speed : I em/min Sample : a ) sal iva with oDly endogenous creatinine
b) sample (a ) spiked wi th I �g creatinine
'! . . T " , " , I ! i I: :
. j ; '"' I I i i i I . j . -+ " , .
.
' ' .+- 1" +
.. �1- , :t : .JJ". .!j -,. . . , , ti i ' . .
f. : u �re� .I.�. r- �.,. : .� . . . . . . , . . . , : : . , , ; ' : : , . " - " . , , . . : . ' . . . , . :: . '
I�:- : ',
� . . . . . . . . . . . . . • ' 0 . • . • I ' " I " • ' 0 . · I . ' " : . . � . : ' : :�: . � . . : _
. �:�' I--' ;�' : . � :
1 ;
.
" :- � '�1' ':-1' l : '.::'�
. .. , . >� " . t • 4 . • . __
. . _ _ _ _ . I -. .. .
! - . . . : : .. : . , . . , .
.
. . : . _ .
� . 1 I , - .: - :3-1-- r ' , " , " _00 ' ,
a
I I i ! .. I I
I , i
" , . I '" " . I I · . I I I I 1 : I I : ' I , " I erea t inine
! " � .- � .. ! ' ! -+ : . . ; . l._o o
... I I � j I � �: I* I, 1 -·· "'"- . I -: . I 'I.�J. L.'l�7,: �� 1_" _- II : . .
! , . I ! I I : , .- - - ·t-- 1"· : - -'7 1 -... I i .
. " ' t
' . :
.. . .
. : 1
·£" : '
� .. , - . :� -�' . ' :: . , . , :: " 1:.. ; . '. : :: . �+ . . , , ' ' F ' " . . . . . . - � . , . . . . • ' ' . . " . � . _ . . � - o .
I . , , . ; . , j ' . . : ' ." '�j": ';. ' . _; ' .
: : . : : ' . : :� , ' .' i : ' . .
'. . ' 0 • . • • • • . • •
. " t . 0 0 • • • • . , . " • • 0 ' , 1 ' ' ' ; ' ! : " , . , . . . . . , . ' . . 1:--: I '7,. " , ·1 . . . . . . . . . . . . ' . . " " : " . . , . . . . . . . " , . , . . . . . . . . . . . , . " , . . : , : . . .: . . : , " : �:: �. · 1 , �,. "r:f:::
- , - .:...:.. . ' .� ;� . ,; ; : I . I . : ' . . : :
· ;j L i ' ::' . ! . : : . : . ! r : : : . . . I '" '-:- ' . :- ' , _. . . -: . . I " , ' ' ' : ' . .
, .,. I - -- -
... I . . , I i ' . ' u I ' . . . : . I � I ' , : ' r '" i 1 i I
.� - . • I ! ·
· T�lt I I i s ..... -
'I J' I � . . I ' . : ' i ! :J ! ' i .. . . I . . ' _ 1_ _j� ..: . , _ 0 _
b
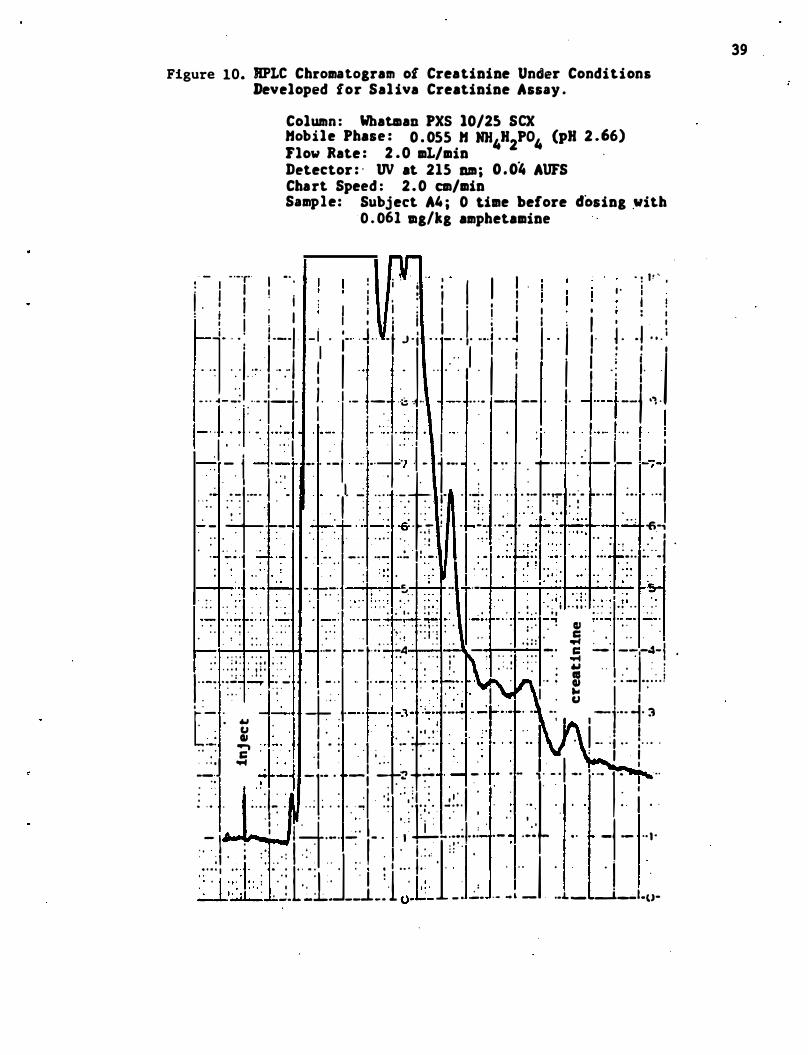
Figure 10. RPLC Chromatogram of Creatinine Under Conditions Developed for Sal iva Creatinine Assay .
Column : Whatman PXS 10/2S SCX Hobile Phase : 0 . 055 H NH4H2P04 (pH 2 . 66) Flow Rate : 2 .0 mL/min . Detector : ' UV at 215 Dm ; O . O� AUFS Chart Speed : 2 . 0 em/min Sample: Subject A4 ; 0 time before dosing �ith
0 . 061 mglkg amphetamine
, - , · ··r I -' , ! i ' , " " I . : . , ' , ,: I I ! . ' : ,' I I I ' , . ! . ' I I ! ' : . I I : I . . I I I ! : I I I ! , I : I ! I ! , I I I I I i i I : I ' ! 1', . . ; )! ._-, - I
I . i-' . � . . ·t J 'ji . . -" ',' ... j . . � I" . / , . i · · I " · :
I I " I I . 1 ; , I . .
. . . .. ' ·· .. 1 I . .
. . . . I . ! I . : ,.
. . . , I ' , , � I " 1 ' . I J . 1 , , , • . . -4- _; . . . . ·I'-i· .
1 ._ - .;;: .. .. --� .. . - - -_ . J. �··--t' --1 ., . . I , ' " I , I ' ' , . . , I , � . . , I I ' I ,
. : - l' ' �
J
' _ . . �-I
_
.. ..
-" ,1 - 1' _e. '.
- �. '. t . . · · · � - - L,j
. I . , '
1
. I <' +.::I: .. .
.
� : " . . ,1. � .: . '�, . ' .- r . -+ .
. . � . , �� _ _ .;;- :_; _ _ . _ : . . . "' , . . . . . . . . . . . .
. ' - ' . . ' ,- , , ' , : :: �: .fr . . :7 ! . -' . . .. . . T": ' _ :::: . . : -6
.,
. .·
"' 1 ..
.� . . . . . -: . �� .:� I ! � ·� , . : : : : : i l "· · · : . :;. : ',:. :. : ·1 . I · : . : :J ': " ';: , -.' ' �': . , , �\ .: :; ' ,�: . /. � .� ' : , : : : '>� .�;: :: , - � , ;�: :::
' • • • • ' . , 0 " • • • " , " : " . • I ' , t • • , . ' • • • . • • • • • ' " • • • . . • • I . • • • • I • • • • ' . , . . . . . ,
. . : . : ' . : : ' � : . : : : : . : : . : , : . : > ; . : : j : � : : . . : , � ; ; . . ' � : '.
' : , , ' , .. - . ' - r- " -4 - -
. r: - --,-4-1 : : , : � � : :) : : : : : , l ' ' : ' : ' : " : i : ' : : , : : : : ' : i , . , . " 1 : , i '
1 "-: , :� , � -; ,-.
, �. ' .
. r '� ' . . : . : . � I . "� : . ' i ' I " ! � i . _-,.: . . . . '[:- : -
� J�' +-, -" r-' I-'l+� : , �.� � --�t-:... . . .� U , -1'.' i' 3 " u " I " , _ . 't' · � : . , . , I I i : ' :�:J E : '(' - j , I · :
. ' I ;4: ' ' :- : : : ;. : : -f_ :q" : . .
- I ' : -· l· ( . . �: ,ft--1 -1'- ' -I , ? : � ' .-1 � -t- . - ' : - . _. " ·' 1 ' , - . .
. ' ' 1 " . I " " 1 ' 1 ' 1 ' � . ; ' . ' . . . . _ . ..: : . . . - � :: ']t'
.: . � . . . " ' . , . " . , . -, I : i' " ' I
' , ; : j ' : ,' , : , , : ' , . ' I - I ' 1 . _ . -.,; - _ . . , - .•• : . • ; - - . • • • . - - ··1 "
: " ; 1 ' ; : : . . · : I ' �· . . : , 1 , 1 ' i ' : ' i: � " ' " "
. . . , I . . , ' , . , [' • . J " .
I . . . , . . " ' . . I ' . I '
> . I . . . . . . : : ' 1: ' . I : 1 . I . � . �,� . �. ',:. . -
. __ ..1._. ' o-t� _ . �- , - _ l - ,
_
.l _ ---i_I-u-
39
.-"
Figure 11 . Ca librat ion Curve for the Determination of Saliva Creatinine .
Height X Wid th at half height
10 20 30 40 60 80 100 200 3(] R j 01) 60l 80(1 .1 rum 2llm 0 . 9 t--- '1-- - - . • . . . •. . 0_ • • • • • _ - • • ' " ' " . . . . . . 0 � • • • r-- 'O • • • • • �_I- _ " .L -L .1 J 0. 8 r-0 'O -t-- . _ • . o • •• • _ •• • • . _ ' " _ " . . .. . . . . " . . . . . . . 0 . . . . _ __ . . _ -r- __ _ .
0. 7 I-r- -r- - �.r- _ ... r- 0 " . . . . . ... . . .. r-- ... r- • . , . 0. o. •... - t-- t--1 0 . 6 . . �. '- '
-. � 1 1 1 I
o 5 : .
-, . t-.� .- -f <:� - �o
0:4
, --; - . . . -- " � " '" ' ; ' ' , : : , ; ! ' �':V�'-r- '�':"--+-f I I I I I I � � I� 0. 3
. . • . • . _ I .. . . I_·i -
; : : . ! i . : . . . I J! . . I · · I · · I . . . . .. ........... .. . - _. - .: . . • . I �
.. . . . . . .. . . " '0" 1-1 --1-1'+ 0 . 2
. . . . . .... .. . : l · :t· � � · ! i i · · . . . . . . . . . . I ' . . I I I I I I I I I I 1 1 1 1 1 . . �- . . . V I I I l-Hi I 1 I I I I I I I I I I I
. . . . V . ... . .. . . . . . . . . ..... ....... .... ,
. . . / . . . .. -' ''-1""1'--1-1"-1-
. , , � . 8:b9 . : I ' .If.,,, 3fi= I I I I I � Least-squares Linear Resression 0 . 08 . : / . . : . i . Equation 0 . 07
/ : ; ,
. : 0 . 06 . � ' . : :;. r- log [ C ]s =1 . 05 log(hwl/2>-3 . 35 0. 05 t--� � -._
O 04 . .
..
. . . " . I�I' . . . . . .
; . . . [C] =conc . of creatinine in saliva • . .
.. .. . - . _ .• . •• i" . r-' .• -- 1--- ' -- - r--r'-I-t-
.. -t-- s I I . . . . . . . . . . .. . . . . (llS/mL)
0 . 03 1 i L_...1-I _1. I.+. V -: . . - r· ... - --.. .:.... -. . . � . __ . _
V . " . . • - . I . . • I ·.·.· h=height of peak
0 _ 02 I 1--l--l-tt'�"1 -l ' I " l t'l - ----r-1--I-'-I-tttf" -t-'1 w1/2"'Width of peak at half-he1sht
0 _ 01 I I " iX, 1 111 I I I I I I I \ \. J. LI\ J I ,
"
� o
The binding of codeine to plasma protein has been well established
(Judis , 1977) ; chlorpromazine is unstable in plasma .
In the equilibrium dialysis determinations , a small amount of a
41
radiolabeled preparati�n of the drug to be studied wa� added to aliquots
of plasma from subj ects in the human validation study. The amount of
radio labeled drug added was less than 10% of the amount of unlabeled
drug that was already present in the plasma (determined by gc analysis) .
The plasma was then placed on one side of a dialysis membrane , Sorensen ' s
phosphate buffer on the other . Sorensen' s buffer i s a buffer whose pH,
K+ and Na+ concentrations are approximately equal to those in plasma
(Sorensen, 1909) . The drug was allowed to equilibrate between the two
sides of the membrane (ca 18 hr) . Since free drug can pass through the
membrane but protein-bound drug cannot , the difference between the
concentrations of drug on the two sides is equal to the concentration of
bound drug (CB) . Since the concentration of unbound drug (Cf) ' is the
same on both sides of the membrane and is equal to the concentration of
total drug in the buffer , the fraction of drug free , i . e . , not bound to
protein (Ff) can be calculated 'as follows :
F f = Cf = Concentration of drug on buffer side
CB + CF Concentration of drug on plasma s ide
The equilibrium dialysis procedure was car�ied out on plasma sam
ples which contained a high concentration of drug and a low concentra-
tion of drug from each subj ect in the study . Radiolabelled drug whose
purity had been established by TLC or HPLC was added to a ca 2 .5 mL
aliquot of plasma . The concentrations of radio labelled drug in the
, 42
plasma and buffer compartments were measured after equilibrium had been
reached by scintillation spectrometry. The total amount of radiolabelled
drug in the two compartm�nts was also measured to determine the degree
of absorption of the drug to the dialysis equipment • . Recovery of drug
was usually >90% but in all cases was >70%.
pKa Values for the drugs being studied were also determined where
these values were not available from the literature (cf . Table 3) .
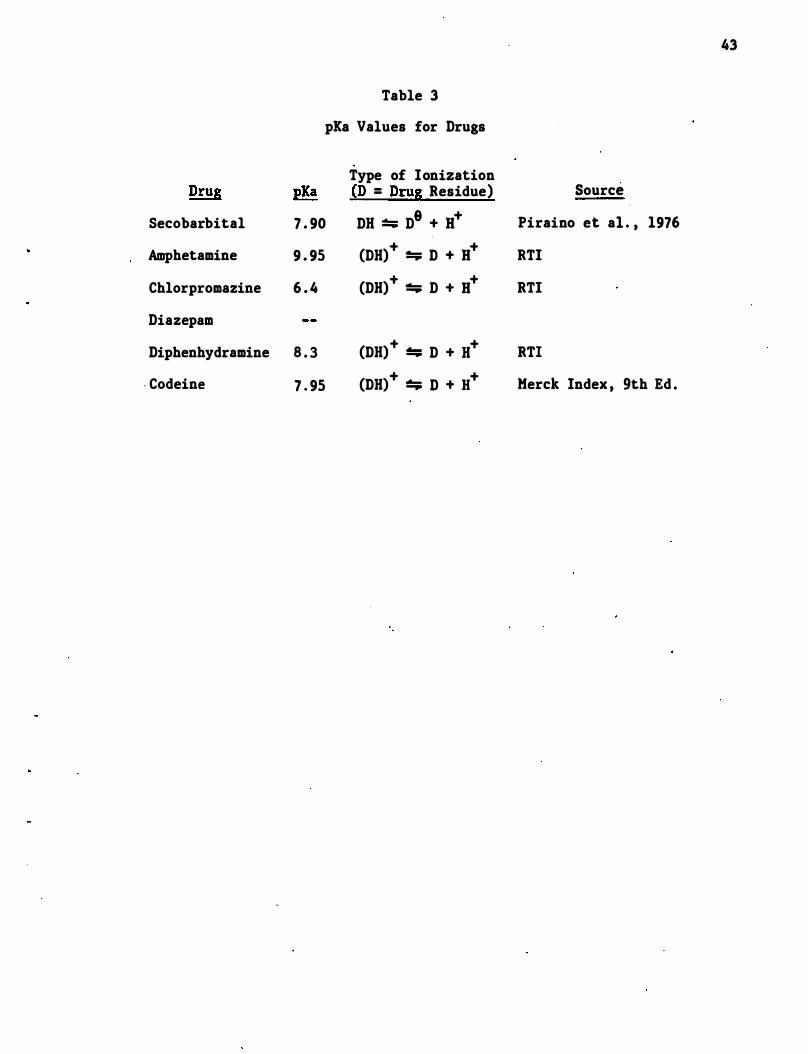
Table 3
pEa Values for Drugs
Type of Ionization pKa {D = DruS Residue)
Secobarbital 7 . 90 DB � D8 + B+
Amphetamine 9 . 95
Chlorpromazine 6 . 4
Diazepam
Diphenhydramine 8 . 3
. Codeine 7 . 95
(DB)+ � D + B+
(DB) + :!:;; D + B+
(DB) + :!:;; D + B+
(DB)+ � D + H+
43
Source
Piraino et aI . , 1976
RTI
RTI
RTI
Merck Index , 9th Ed .
44
4 . 0 Results
4 . 1 Collection Devices for Saliva and Breath
The collection device used for saliva consisted of a specially treated
vial into which the subj ect could spit. We used 2Q mL borosilicate
glass scintillation vials which had been s ilylated by treatment at 225°C
with hexamethyldisilazane . A teflon liner was inserted into the caps of
these vials . The cost of the untreated vials , but with t�flon l ined
caps , is estimated to be $250 per thousand . Equipment to s ilate the
vials cost approximately $3 , 000 . With this equipment , approximately 500
vials per day could be silylated with a labor commitment of 0 . 5 man-days
per thousand vials .
The development of a collection device for breath that could be used at
the roadside was not completed s ince we were unable to find measureable
concentrations of the drugs being studied in breath . In order to collect
drugs exhaled in breath , we used an ethanol bubbler trap similar ·to that
shown in Figure 12 . This device was shown to effectively trap secobar-
bital and amphetamine from simulated breath and is suita�le for other . .
research proj ects . A preliminary device which contained a cartridge of
Tenax (Figure 13) was also evaluated . This device effectively trapped
secobarbital and amphetamine from simulated breath . Howevet:, the Tenax·
usually employed for trapping trace organics in environmental samples
provides two great a resistence for normal exhalations . Other groups at
RTI have devised equipment to collect more volatile compounds from
breath, in which the exhaled air is trapped in a large Tedlar bag and
then pumped through the Tenax cartridge .
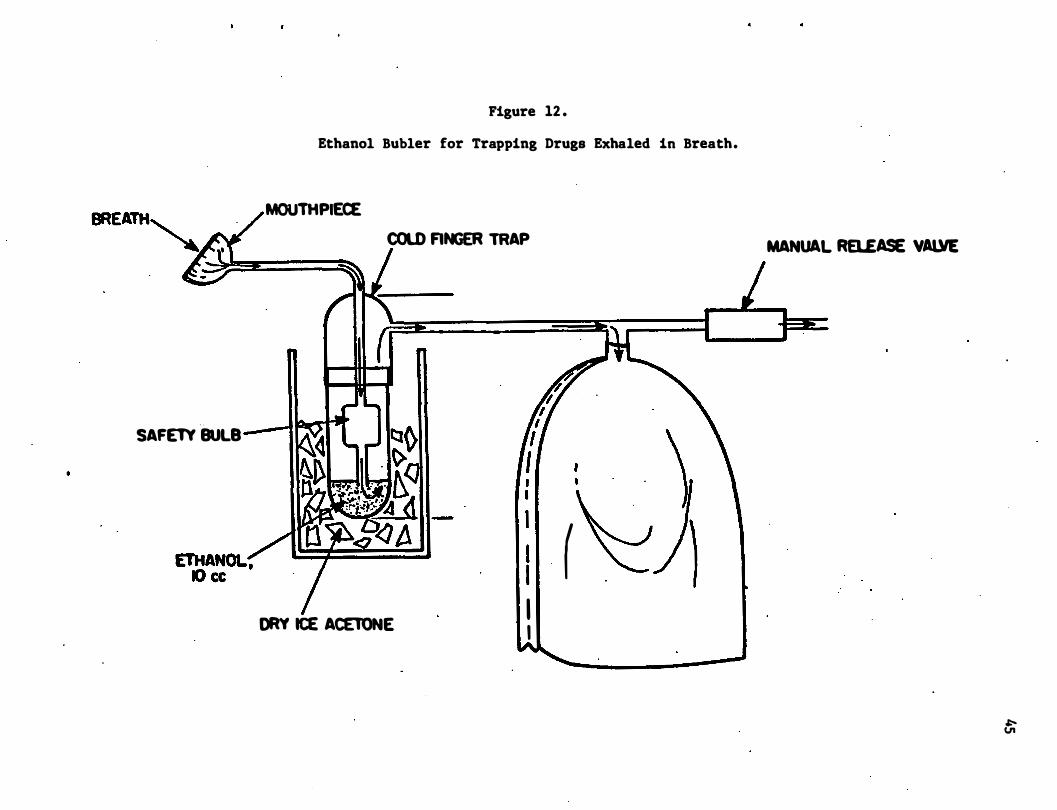
SAFETY BULB
Figure 12 .
Ethanol Bubler for Trapping Drugs Exhaled in Breath.
MOUTHPIECE COLD FINGER TRAP
DRY ICE ACElONE
I . ( I I I I
MANUAL RaEASE VAllIE
f;
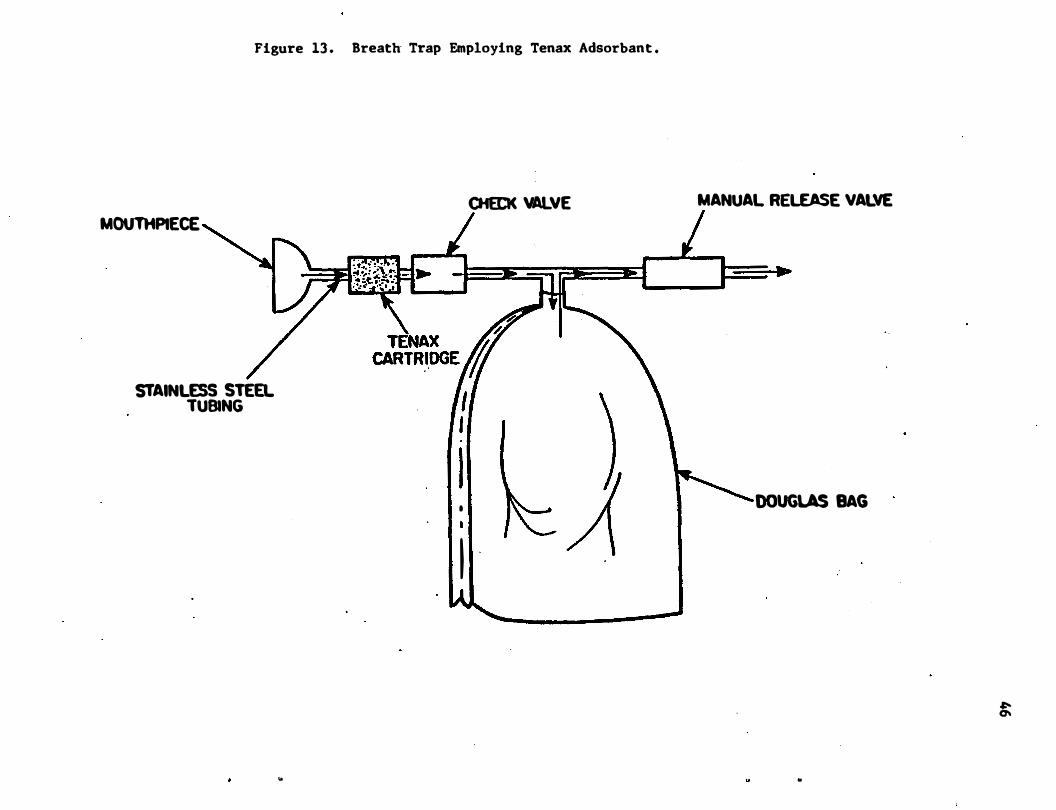
Figure 13 . Breath Trap Employing Tenax Adsorbant .
MOUTHPIECE
STAINLESS STEEL TUBING
..
CHECK VALVE
I •
I
MANUAL RELEASE VALVE
-
DOUGLAS BAG
�
..
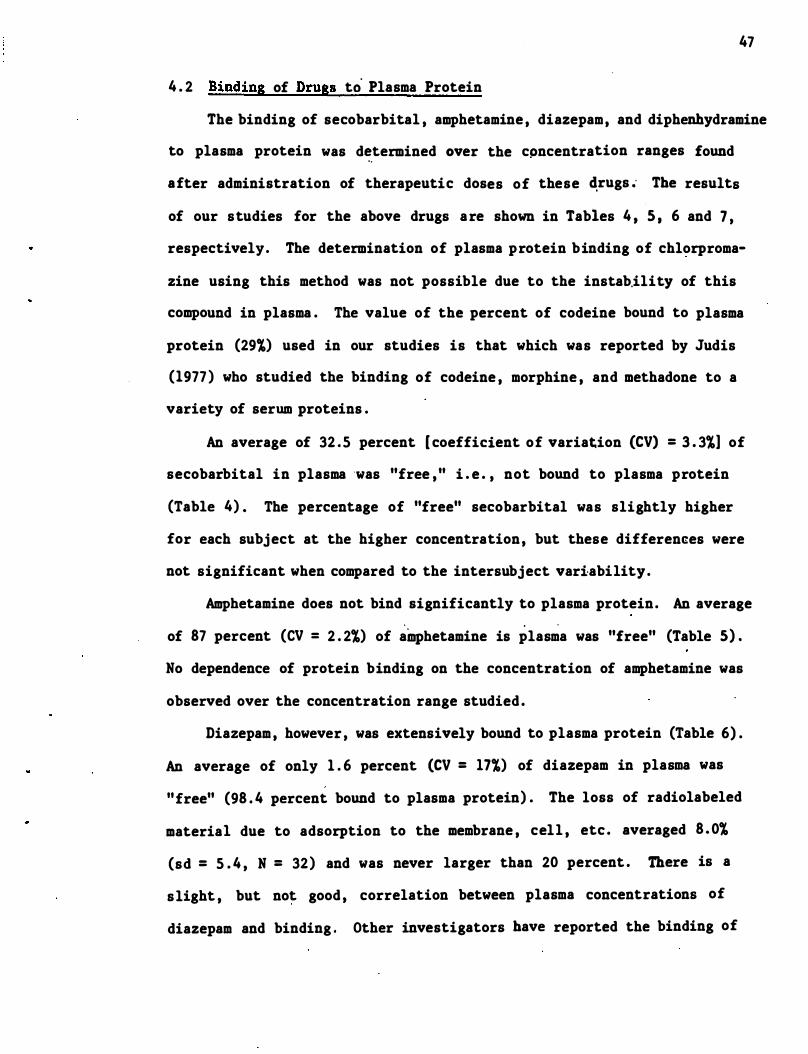
47
4 . 2 Binding of Drugs to Plasma Protein
The binding of secobarbital , amphetamine , diazepam, and diphenhydramine
to plasma protein was d�.termined over the cpncentration ranges found
after administration of therapeutic doses of these �rugs ; The results
of our studies for the above drugs are shown in Tables 4 , S , 6 and 7 ,
respectively. The determination of plasma protein binding of chlorproma
zine using this method was not possible due to the instab.ility of this
compound in plasma . The value of the percent of codeine bound to plasma
protein (29%) used in our studies is that which was reported by Judis
(1977 ) who studied the binding of codeine , morphine , and methadone to a
variety of serum proteins .
An average of 32 . 5 percent [ coeffiCient of variation (CV) = 3 . 3%] of
secobarbital in plasma was "free ," i . e . , not bound to plasma protein
(Table 4) . The percentage of "free" secobarbital was slightly higher
for each subject at the higher concentration, but these differen�es were
not significant when compared to the intersubject variability.
Amphetamine does not bind significantly to plasma protein. An average . . .
of 87 percent (CV = 2 . 2%) of amphetamine is plasma was "free" (Table S) . No dependence of protein binding on the concentration of amphetamine was
observed over the concentration range studied .
Diazepam , however , was extensively bound to plasma protein (Table 6) .
An average of only 1 . 6 percent (CV = 17%) of diazepam in plasma was
"free" (98 . 4 percent bound to plasma protein) . The loss of radiolabeled
material due to adsorption to the membrane , cell , etc . averaged 8 . 0%
(sd = 5 . 4 , N = 32) and was never larger than 20 percent . There is a
slight , but not good , correlation between plasma concentrations of
diazepam and binding . Other investigators have reported the binding of
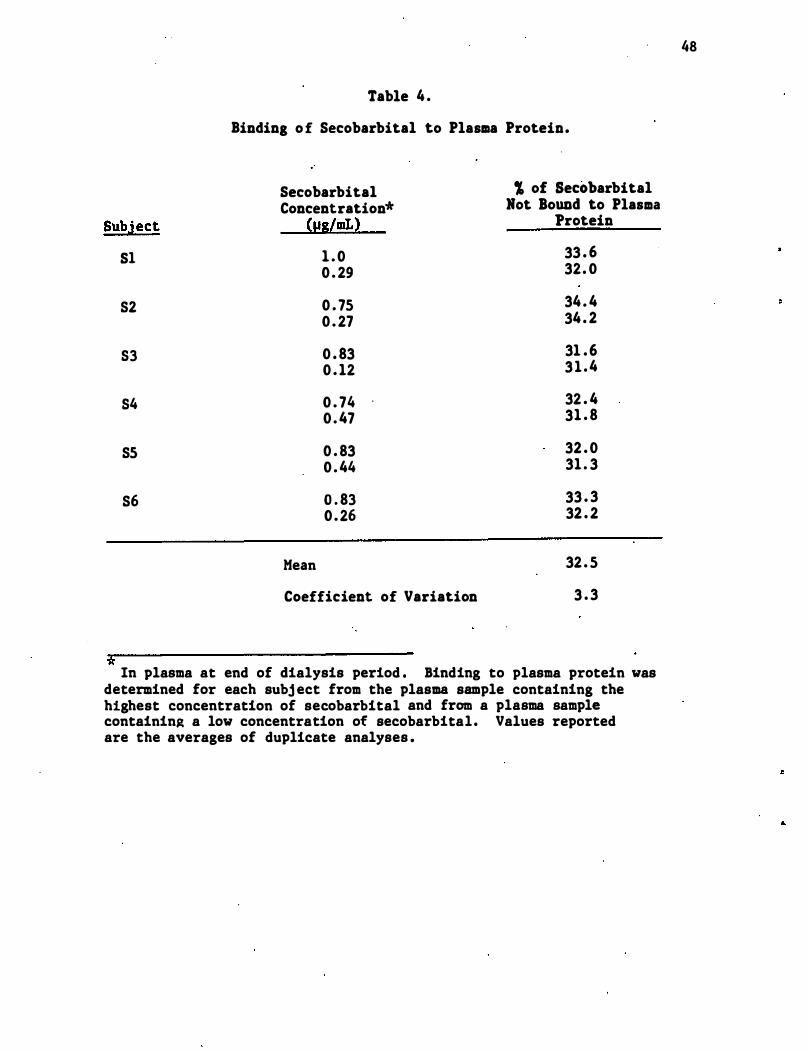
Table 4 .
Binding o f Secobarbital to Plasma Protein.
Secobarbital , of Secobarbital Concentration* Hot .Bound to Plasma
Subject <IIS/mL) Protein
Sl 1 . 0 33 . 6
0 . 29 32. 0
82 0 . 75 34 . 4
0 . 27 34 . 2
S3 0 . 83 31 . 6 0 . 12 3 1 . 4
S4 0 . 74 32 . 4 0 . 47 31 . 8
85 0 . 83 32 . 0 0 . 44 31 . 3
86 0 . 83 33 . 3 0 . 26 32 . 2
Mean 32 . 5
Coefficient of Variation 3 . 3
* In plasma at end of dialysis period . Binding to plasma protein was
determined for each subj ect from the plasma sample containing the highest concentration of secobarbital and from a plasma sample containin� a low concentration of secobarbital. Values reported are the averages of duplicate analyses .
48

Table 5 .
Binding of Amphetamine to Plasma Protein.
Amphetamine % of Amphetamine Concentration* Not Bound to Plasma
Subject (ns/mL) Protein
A1 1 . 6 90. 0 8 . 9 87 .4
A2 2 . 6 86 . 0 14 . 4 87 . 2
A3 <1 89. 2 13 . 4 86 . 6
A4 0 . 6 86 . 4 14 . 1 89 . 1
AS 4 . 2 88. 6 13 . 4 85 . 5
A6 <1 86 . 6 4 . 7 87 . 4 7 . 6 82 . 4
Mean "87 . 1
Coefficient of Variation 2 . 2
* In plasma at end of dialysis period . Binding to plasma protein was
determined for each subject from the plasma sample containing th� highest concentration of amphetamine and from a plasma sample containing a low concentration of amphetamine . Values reported are the averages of dup�icate analyses .
49
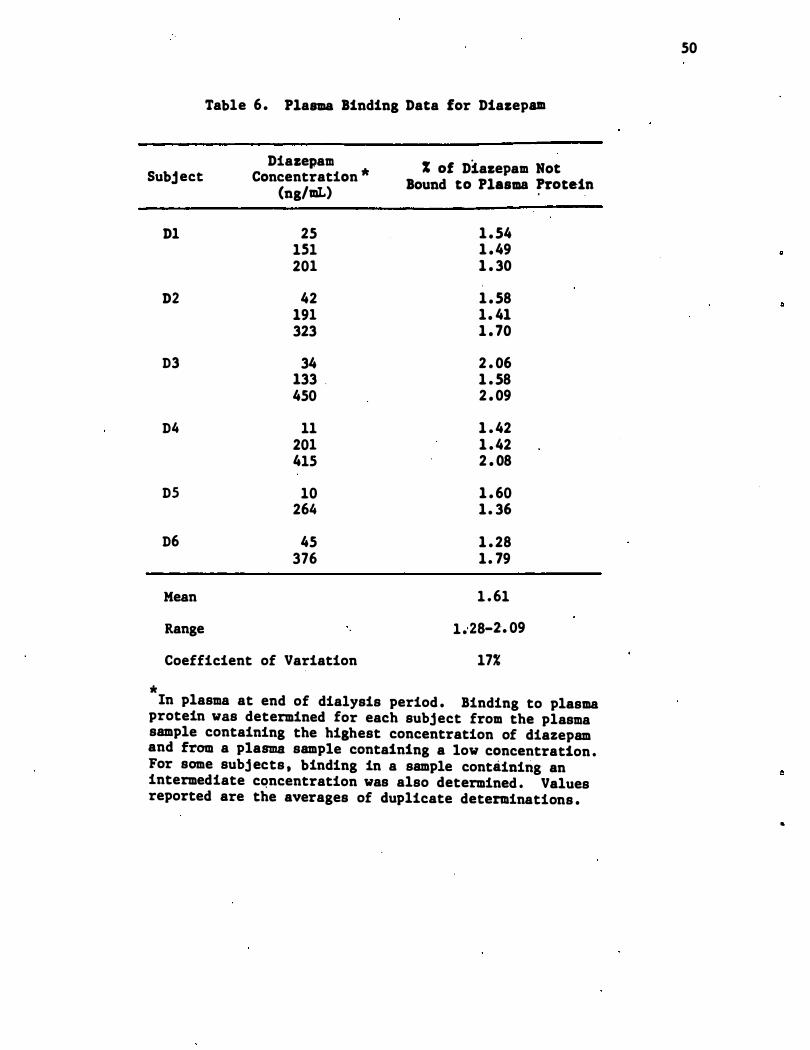
Table 6. Plasma Binding Data for Diazepam
Subj ect Diazepam
Concentration '* (ng/mI.)
% of Diazepam Not Bound to Plasma �rotein
'*
D1
D2
D3
D4
D5
D6
Mean
Range
25 lSI 201
42 191 323
34 133 . 450
11 201 41S
10 264
45 376
Coefficient of Variation
1 . 54 1 . 49 1 . 30
1 . 58 1. 41 1 . 70
2 . 06 1 . 58 2 . 09
1 . 42 1 . 42 2 . 08
1 . 60 1. 36
1 . 28 1. 79
1 . 61
1 .. 28-2'. 09
17%
In plasma at end of dialysis period . Binding to plasma protein was determined for each subject from the plasma sample containing the highest concentration of diazepam and from a plasma sample containing a low concentration . For some subj ects , binding in a sample containing an intermediate cQncentration was also determined . Values reported are the averages of duplicate determinations .
50
..
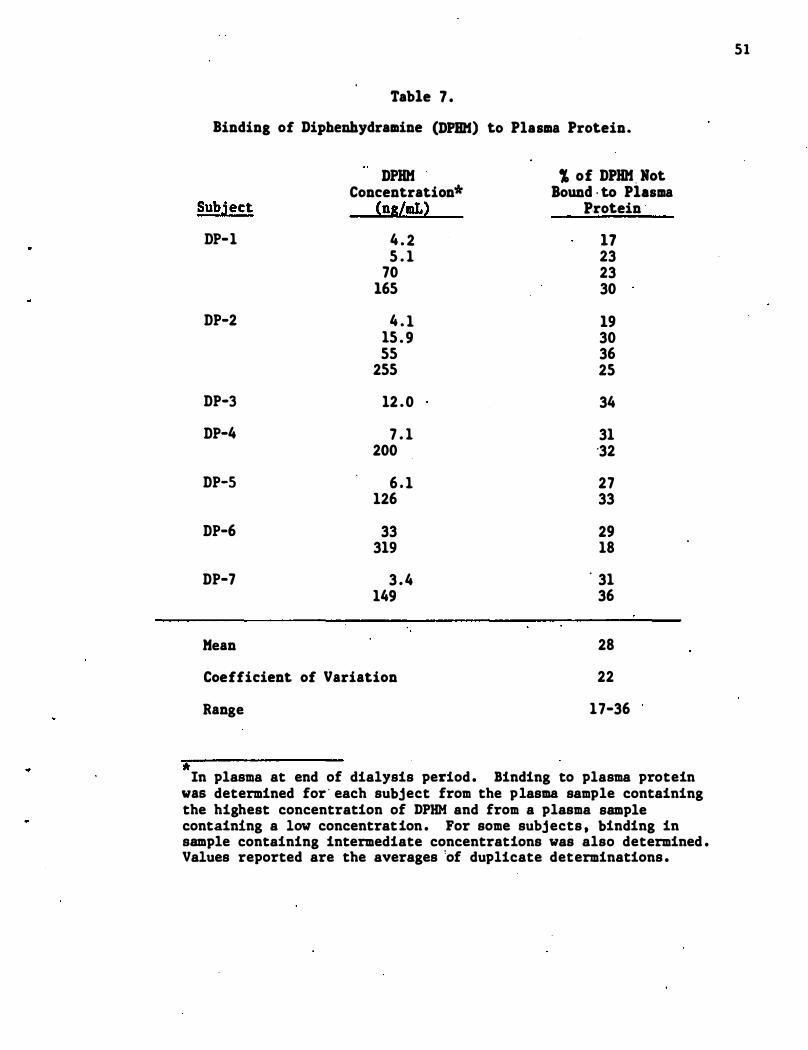
Table 7 .
Binding of Diphenhydramine (DPIIH) to Plasma Protein.
DPHH , of DPHH, Hot Concentration* Bound , to Plasma
Subject (ns/mL) Protein '
DP-1 4 . 2 17 5 . 1 23
70 23 165 30
DP-2 4 . 1 19 15 . 9 30 55 36
255 25
DP-3 12 . 0 34
DP-4 7 . 1 31 200 '32
DP-5 6 . 1 27 126 33
DP-6 33 29 319 18
DP-7 3 . 4 . 31 149 36
Mean 28
Coefficient of Variation 22
Range 17-36
" In plasma at end of dialysis period . Binding to plasma protein
was determined for ' each subject from the plasma sample containing the highest concentration of DPHM and from a plasma sample containing a low concentration . For some subjects , binding in sample containing intermediate concentrations was also determined . Values reported are the averages 'of duplicate determinations .
51
52
diazepam to plasma protein to be 95% (Sturdee , 1976) , 96 . 8% (Klotz
et al . , 1�76) , 98% (Kanto et al . , 1975) and 96 . 5-98% (DiGregorio et al . ,
1978) . We took special c�re to purify our radiolabeled diazepam by HPLC
before use , since small quantities of non-protein bound impurities would
result in a significant increase in the amount of "free diazepam" calcu
lated to be present in plasma .
The binding of diphenhydramine to plasma protein was found to be the
most variable (Table 7 ) of any drug studied . The percent of "free"
diphenhydramine in plasma ranged from 17 to 36 percent , with an average
of 28 percent .
4 . 3 Analysis and Correlation of Concentrations of Drugs in Plasma and
Saliva
4 . 3 . 1 Secobarbital
Detailed information on the extraction and analysis of secobarbital
from plasma and saliva is given in Appendix A . l . Extracts from plasma
and saliva could be chromatographed on either a methyl silicone (SE-30)
or a polyethylene glycol (Car�owax) coated c�pil�ary GC column. Sample
chromatograms obtained from an extract of plasma that had been ·spiked
with secobarbital and internal standards are shown in Figures 6 and 5 ,
respectively, for the two different columns . Different internal stan
dards were used for the two analyses 0. Since the chromatogram from the
Carbowax column is much "cleaner" in the region where secobarbital and
its internal standards elute , all subsequent evaluations utilized this
column. Linear calibrations (log-log scale) were established for seco
barbital in plasma from 0 . 02 to 4 . 0 �g/mL and in saliva from 0 . 05 to 2 . 0
�g/mL . The relative retention times of other barbituates and their
analogs on Carbowax have been reported (Berry, 1973) and a re shown in
Table 8 .
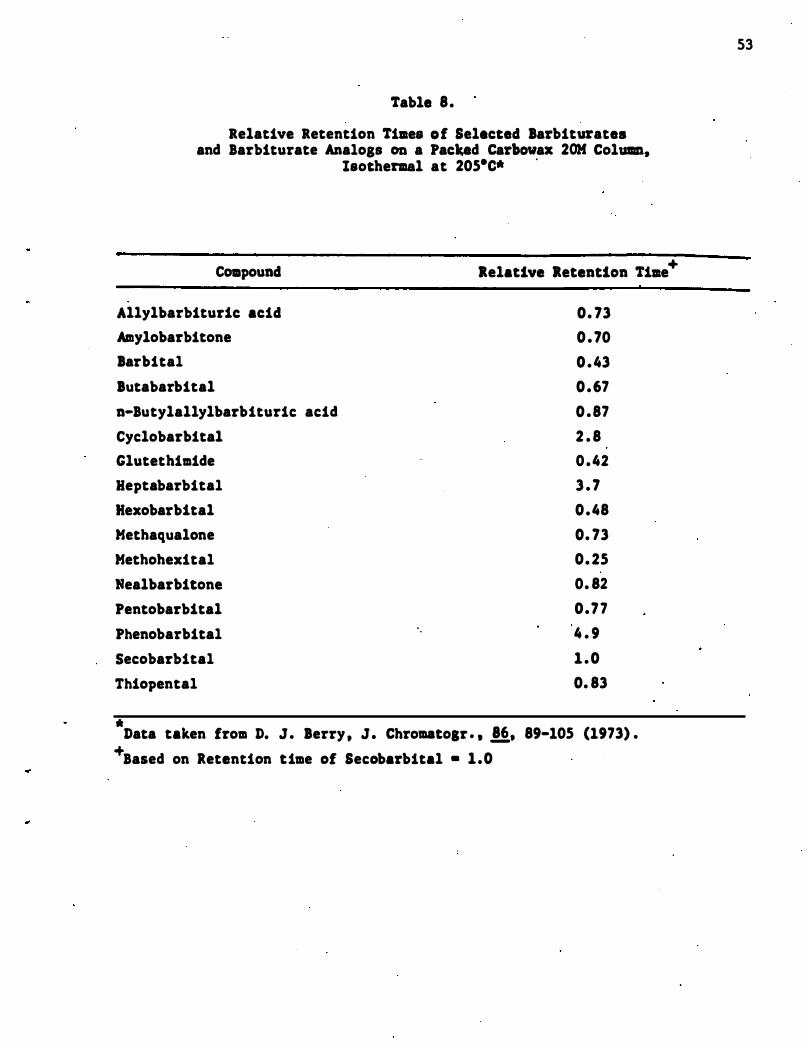
Table 8.
Relative Retention Times of Selected Barbiturates and Barbiturate Analogs on a Packed Carbowax 20K Column,
C01Dpound
Allylbarbituric acid
Amylobarbitone
Barbital
Butabarbital
n-Butylallylbarbituric acid
Cyclobarbital
Glutethimide
Reptabarbital
Hexobarbital
Methaqualone
Metbobexital
Nealbarbitone
Pentobarbital
Phenobarbital
Secobarbital
Thiopental
Isothermal at 205·C* .
+ Relative Retention Time
' .
0. 73 0 .70 0 .43 0 .67 0 .87 2 . 8 0 .42 3 . 7 0.48 0. 73 0. 25 0. 82 0.77 4 . 9 1 .0 0. 83
* Data taken from D. J. Berry , J. Chromatogr. , !i, 89-105 (1973) .
+Based on Retention time of Secobarbital • 1.0
53
54
The results of the analyses of plasma and saliva from six subj ects ,
each dosed at two differnt levels (0 . 61 and 1 . 22 mg/kg) with sodium
secobarbital , are listed " in Table 9 . Predicted values for the concen-
tration
tration
of secobarbital in plasma [8 ] were calculated from the concen-c .
in saliva [8 ] by the equation [8 ] = [8 ] Ifp where fp is the s . c s fraction of secobarbital not bound to plasma protein. In this case,
additional corrections for the differences in the pH of ' plasma and
saliva were not made . For saliva pH ' s of 6 . 5 and 7 . 0 , [8 ] c would be
increased by factors of 1 . 3 and 1 . 2 , respectively . These corrections ,
however, do not result in better agreements between plasma and saliva
concentrations of secobarbital .
The average ratio of the predicted to observed concentrations of
secobarbital in plasma for all determinations is 1 . 08 (CV = 42%, n =
107) . The average ratio for the 0 . 5 hr samples is 2 . 5 (CV = 40%, n =
6) . Omitting these samples the average ratio of the remaining samples
is 0 . 99 (CV = 2l� , n = 101) . While the theoretical reasons for omitting
these samples are uncertain, empirically , their �mission results in a
much better correlation of drug concentrations in plasma and saliva .
Perhaps , minute drug particles still remain in the oral cavity at this
time or are somehow returned to the oral cavity from the upper digestive
tract . The average ratio for the 1 . 0 hr samples , 1 . 17 (CV = 28%, n =
10) is slightly higher (P <0 . 01) than the average ratio of 0 . 97 (CV =
18%, n = 91%) for the samples taken after this time .
A plot of the predicted [8] versus observed [8 ] concentrations of c p secobarbital in plasma on a log-log scale is shown in Figure 14 . The
least squares linear regression of this data , expressed in ng/DIL, produces
a best-fit line represented by the equation:
"
"
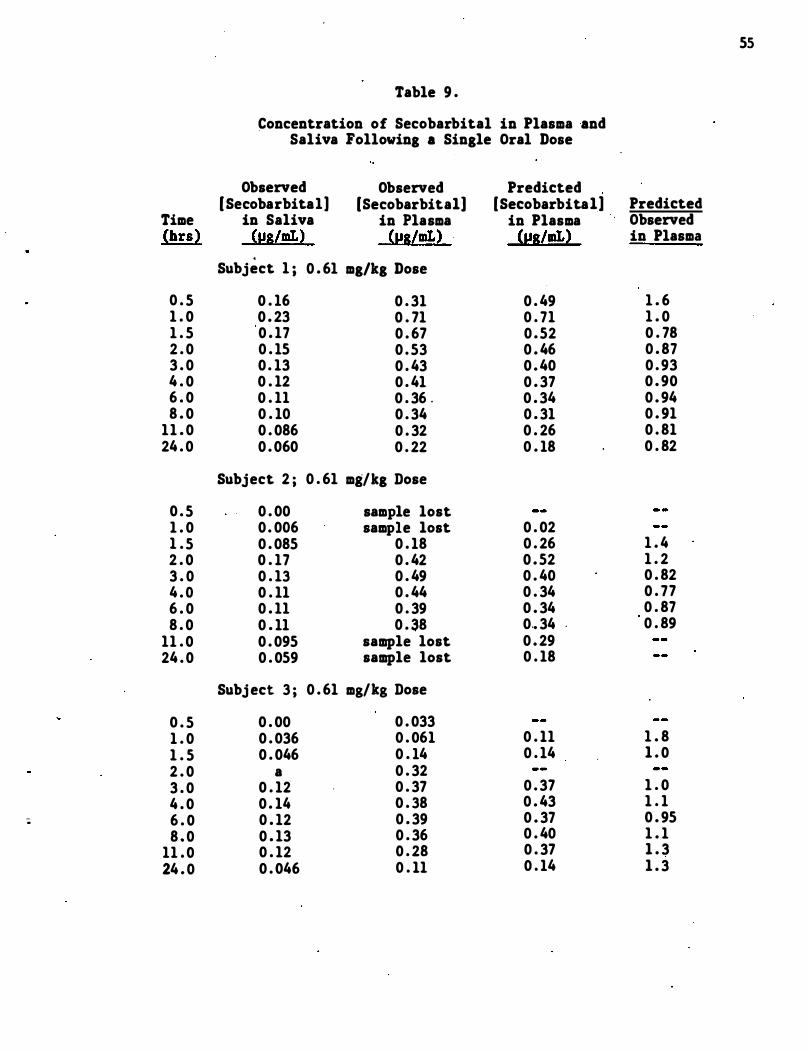
55
Table 9 .
Concentration of Secobarbital in Plasma and Saliva Following a Single Oral Dose
Observed Observed Predicted [Secobarbital] [Secobarbital] [Secobarbital] Predicted
Time in Saliva in Plasma in Plasma Observed (brs) (1:!8/mLl {1:!8lmLl {1:!8lmLl in Plasma
.
Subject 1 ; 0 . 61 mg/kg Dose
0 . 5 0 . 16 0 . 31 0 . 49 1 . 6 1 . 0 0 . 23 0 . 71 0 . 71 1 . 0 1 . 5 0 . 17 0 . 67 0 . 52 0 . 78 2 . 0 0 . 15 0 . 53 0 . 46 0 . 87 3 . 0 0 . 13 0 . 43 0 . 40 0 . 93 4 . 0 0 . 12 0 . 41 0 . 37 0 . 90 6 . 0 0 . 11 0 . 36 . 0 . 34 0 . 94 8 . 0 0 . 10 0 . 34 0 . 31 0 . 91
11 . 0 0 . 086 0 . 32 0 . 26 0 . 81 24 . 0 0 . 060 0 . 22 0 . 18 0 . 82
Subject 2 ; 0 . 61 mg/kg Dose
0 . 5 0 . 00 sample lost 1 . 0 0 . 006 sample lost 0 . 02 1 . 5 0 . 085 0 . 18 0 . 26 1 . 4 2 . 0 0 . 17 0 . 42 0 . 52 1 . 2 3 . 0 0 . 13 0 . 49 0 . 40 0 . 82 4 . 0 0 . 11 0 . 44 0 . 34 0 . 77 6 . 0 0 . 11 0 . 39 0 . 34 0 . 87 8 . 0 0 . 11 0 . 38 0 .• 34 0 . 89
11 . 0 0 . 095 sample lost 0 . 29 24 . 0 0 . 059 sample lost 0 . 18
Subj ect 3 ; 0 . 61 mg/kg Dose
0 . 5 0 . 00 0 . 033 1 . 0 0 . 036 0 . 061 0 . 11 1 . 8 1 . 5 0 . 046 0 . 14 0 . 14 1 . 0 2 . 0 a 0 . 32 3 . 0 0 . 12 0 . 37 0 . 37 1 . 0 4 . 0 0 . 14 0 . 38 0 . 43 1 . 1
; 6 . 0 0 . 12 0 . 39 0 . 37 0 . 95 8 . 0 0 . 13 0 . 36 0 . 40 1 . 1
11 . 0 0 . 12 0 . 28 0 . 37 1 . 3 24 . 0 0 . 046 0 . 11 0 . 14 1 . 3
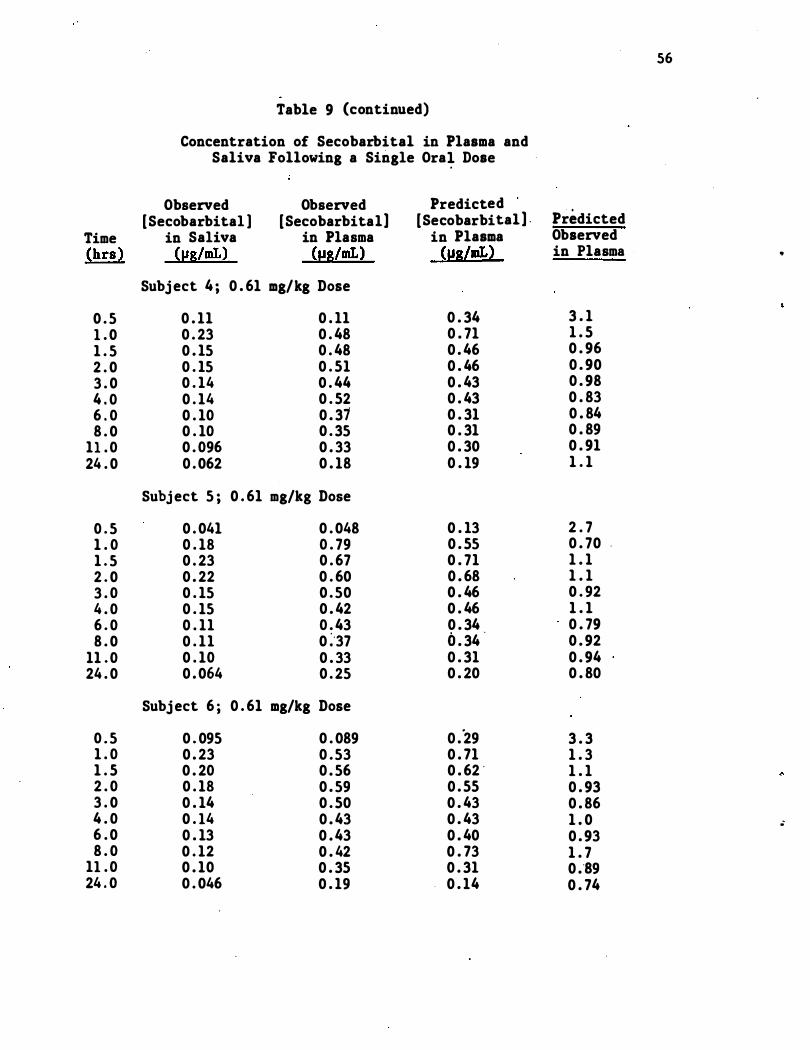
56
Table 9 (continued)
Concentration of Secobarbital in Plasma and Saliva Following a Single Ora� Dose
Observed Observed Predicted (Secobarbital ] (Secobarbital] (Secobarbital] . Predicted
Time in Saliva in Plasma in Plasma Observed (hrs ) (J,lS/mL) (J,lS/mL) (IJS/mL) in Plasma ..
Subj ect 4 ; 0 . 61 mg/kg Dose
0 . 5 0 . 11 0 . 11 0 . 34 3 . 1 1 . 0 0 . 23 0 . 48 0 . 71 1 . 5 1 . 5 0 . 15 0 . 48 0 . 46 0 . 96 2 . 0 0 . 15 0 . 51 0 . 46 0 . 90 3 . 0 0 . 14 0 . 44 0 . 43 0 . 98 4 . 0 0 . 14 0 . 52 0 . 43 0 . 83 6 . 0 0 . 10 0 . 31 0 . 31 0 . 84 8 . 0 0 . 10 0 . 35 0 . 31 0 . 89
11 . 0 0 . 096 0 . 33 0 . 30 0 . 91 24 . 0 0 . 062 0 . 18 0 . 19 1 . 1
Subj ect 5 ; 0 . 61 mg/kg Dose
0 . 5 0 . 041 0 . 048 0 . 13 2 . 7 1 . 0 0 . 18 0 . 79 0 . 55 0 . 70 . 1 . 5 0 . 23 0 . 67 0 . 71 1 . 1 2 . 0 0 . 22 0 . 60 0 . 68 1 . 1 3 . 0 0 . 15 0 . 50 0 . 46 0 . 92 4 . 0 0 . 15 0 . 42 0 . 46 1 . 1 6 . 0 0 . 11 0 . 43 0 . 34 0 . 79 8 . 0 0 . 11 0 :'37 0 . 34 0 . 92
11 . 0 0 . 10 0 . 33 0 . 31 0 . 94 24 . 0 0 . 064 0 . 25 0 . 20 0 . 80
Subj ect 6 ; 0 . 61 mg/kg Dose
0 . 5 0 . 095 0 . 089 0 ."29 3 . 3 1 . 0 0 . 23 0 . 53 0 . 71 1 . 3 1 . 5 0 . 20 0 . 56 0 . 62 ' 1 . 1 2 . 0 0 . 18 0 . 59 0 . 55 0 . 93 3 . 0 0 . 14 0 . 50 0 . 43 0 . 86 4 . 0 0 . 14 0 . 43 0 . 43 1 . 0 • 6 . 0 0 . 13 0 . 43 0 . 40 0 . 93 8 . 0 0 . 12 0 . 42 0 . 73 1 . 7
11 . 0 0 . 10 0 . 35 0 . 31 0 .'89 24 . 0 0 . 046 0 . 19 0 . 14 0 . 74
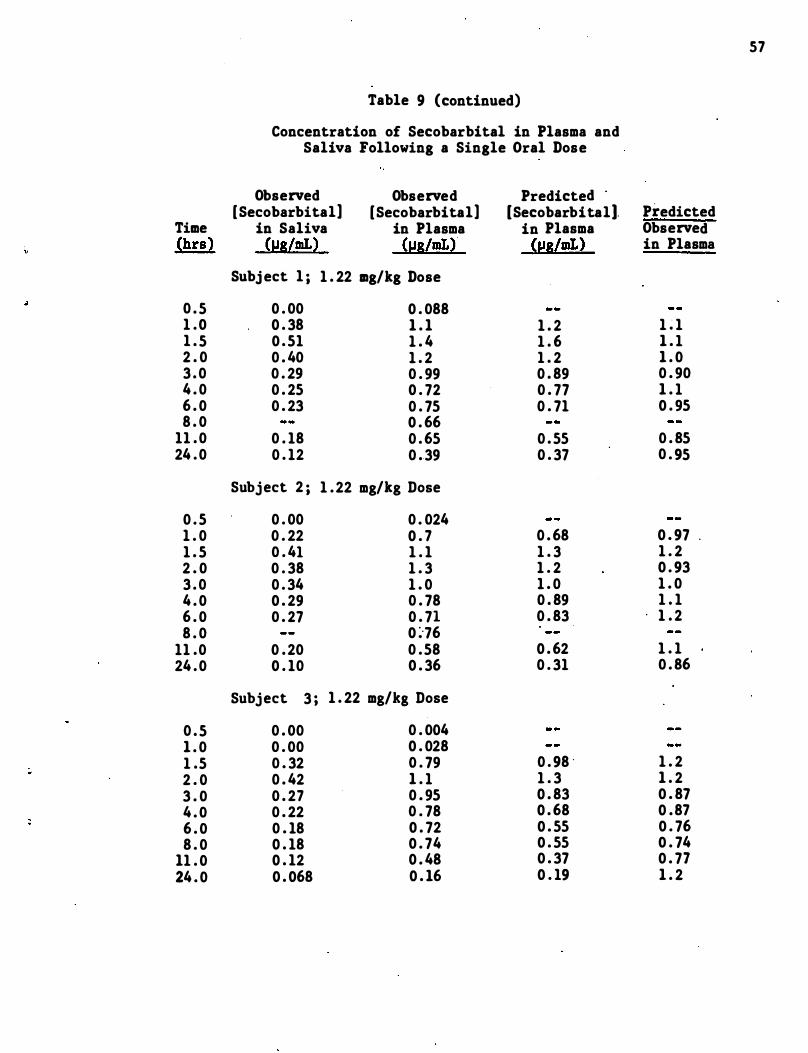
57
Table 9 (continued)
Concentration of Secobarbital in Plasma and Saliva Following a Single Oral Dose
Observed Observed Predicted [Secobarbital] [Secobarbital] [Secobarbital). Predicted
Time in Saliva in Plasma in Plasma Observed (hrs) (lJs/mL) (lJs/mL) (IJS/mL) in Plasma
Subj ect 1 ; 1 . 22 mg/kg Dose
0 . 5 0 . 00 0 . 088 1 . 0 0 . 38 1 . 1 1 . 2 1 . 1 1 . 5 0 . 51 1 . 4 1 . 6 1 . 1 2 . 0 0 . 40 1 . 2 1 . 2 1 . 0 3 . 0 0 . 29 0 . 99 0 . 89 0 . 90 4 . 0 0 . 25 0 . 72 0 . 77 1 . 1 6 . 0 0 . 23 0 . 75 0 . 71 0 . 95 8 . 0 0 . 66
11 . 0 0 . 18 0 . 65 0 . 55 0 . 85 24 . 0 0 . 12 0 . 39 0 . 37 0 . 95
Subject 2 ; 1 . 22 mg/kg Dose
0 . 5 0 . 00 0 . 024 1 . 0 0 . 22 0 . 7 0 . 68 0 . 97 . 1 . 5 0 . 41 1 . 1 1 . 3 1 . 2 2 . 0 0 . 38 1 . 3 1 . 2 0 . 93 3 . 0 0 . 34 1 . 0 1 . 0 1 . 0 4 . 0 0 . 29 0 . 78 0 . 89 1 . 1 6 . 0 0 . 27 0 . 71 0 . 83 1 . 2 8 . 0 0 :·76
11 .0 0 . 20 0 . 58 0 . 62 1 . 1 24 . 0 0 . 10 0 . 36 0 . 31 0 . 86
Subject 3 ; 1 . 22 mg/ks Dose
0 . 5 0 . 00 0 . 004 1 . 0 0 . 00 0 . 028 1 .5 0 . 32 0 . 79 0 . 98 · 1 . 2 2 . 0 0 . 42 1 . 1 1 . 3 1 . 2 3 . 0 0 . 27 0 . 95 0 . 83 0 . 87 4 . 0 0 . 22 0 . 78 0 . 68 0 . 87 6 . 0 0 . 18 0 . 72 0 . 55 0 . 76 8 . 0 0 . 18 0 . 74 0 . 55 0 . 74
11 . 0 0 . 12 0 . 48 0 . 37 0 . 77 24 . 0 0 . 068 0 . 16 0 . 19 1 . 2
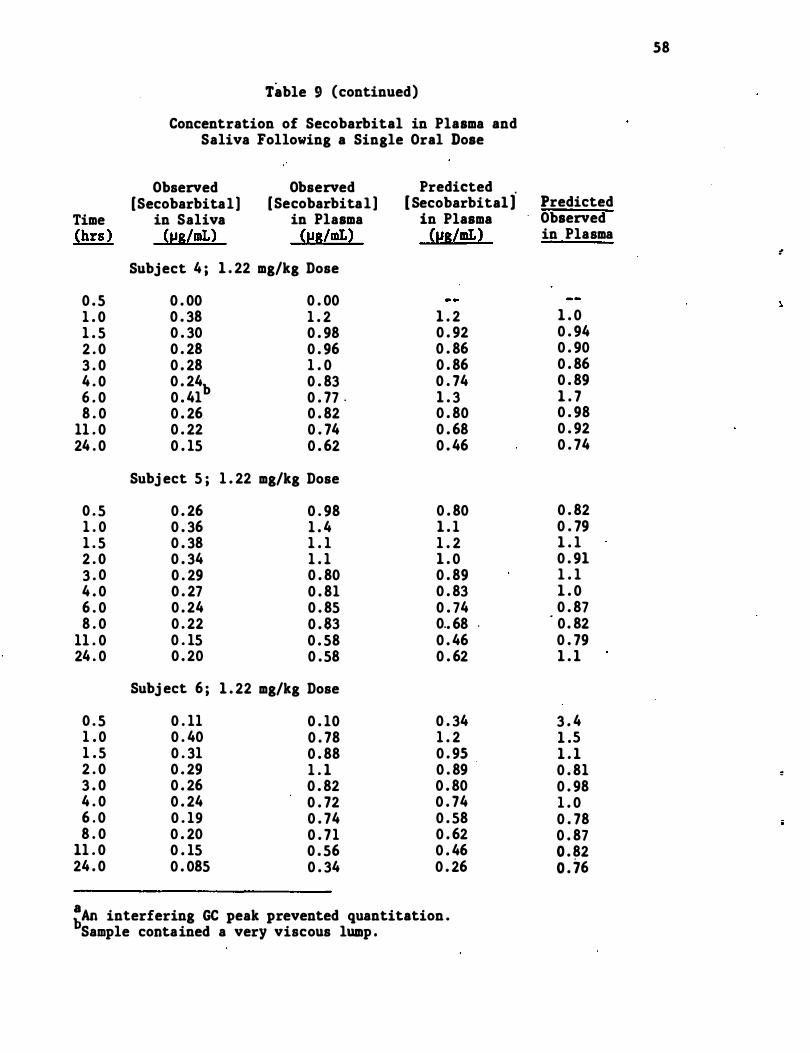
58
Table 9 (continued)
Concentration of Secobarbital in Plasma and Saliva Following a Single Oral Dose
Observed Observed Predicted [Secobarbital] [Secobarbital ] [ Secobarbital] Predicted
Time in Saliva in Plasma in Plasma Observed �hrs ) (i!SlmL) (i!S/mL) (i!8/mL� in Plasma
�
Subject 4 ; 1 . 22 mg/kg Dose
0 . 5 0 . 00 0 . 00 1 . 0 0 . 38 1 . 2 1 . 2 1 . 0 1 . 5 0 . 30 0 . 98 0 . 92 0 . 94 2 . 0 0 . 28 0 . 96 0 . 86 0 . 90 3 . 0 0 . 28 1 . 0 0 . 86 0 . 86 4 . 0 0 . 24b 0 . 83 0 . 74 0 . 89 6 . 0 0 . 41 0 . 77 . 1 . 3 1 . 7 8 . 0 0 . 26 0 . 82 0 . 80 0 . 98
11 . 0 0 . 22 0 . 74 0 . 68 0 . 92 24 . 0 0 . 15 0 . 62 0 . 46 0 . 74
Subj ect 5 ; 1 . 22 mg/kg Dose
0 . 5 0 . 26 0 . 98 0 . 80 0 . 82 1 . 0 0 . 36 1 . 4 1 . 1 0 . 79 1 . 5 0 . 38 1 . 1 1 . 2 1 . 1 2 . 0 0 . 34 1 . 1 1 . 0 0 . 91 3 . 0 0 . 29 0 . 80 0 . 89 1 . 1 4 . 0 0 . 27 0 . 81 0 . 83 1 . 0 6 . 0 0 . 24 0 . 85 0 . 74 0 . 87 8 . 0 0 . 22 0 . 83 0 .. 68 . · 0 . 82
11 . 0 0 . 15 0 . 58 0 . 46 0 . 79 24 . 0 0 . 20 0 . 58 0 . 62 1 . 1
Subj ect 6 ; 1 . 22 mg/kg Dose
0 . 5 0 . 11 0 . 10 0 . 34 3 . 4 1 . 0 0 . 40 0 . 78 1 . 2 1 .5 1 . 5 0 . 31 0 . 88 0 . 95 1 . 1 2 . 0 0 . 29 1 . 1 0 . 89 0 . 81 � 3 . 0 0 . 26 0 . 82 0 . 80 0 . 98 4 . 0 0 . 24 0 . 72 0 . 74 1 . 0 6 . 0 0 . 19 0 . 74 0 . 58 0 . 78 8 . 0 0 . 20 0 . 71 0 . 62 0 . 87
11 . 0 0 . 15 0 . 56 0 . 46 0 . 82 24 . 0 0 . 085 0 . 34 0 . 26 0 . 76
:An interfering GC peak prevented quantitation . Sample contained a very viscous lump .
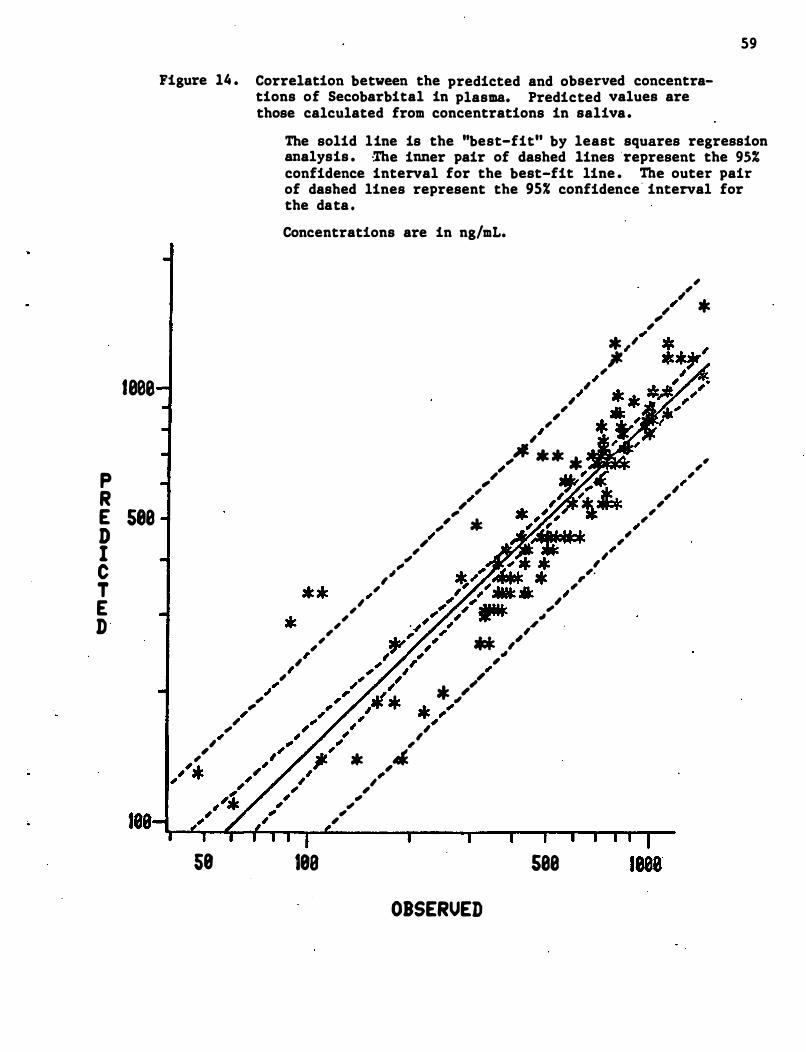
P R
le0e
E see D I C T E D
59
Figure 14 . Correlation between the predicted and observed concentrations of Secobarbital in plasma. Predicted values are those calculated from concentrations in saliva.
" , , *
58
" ,
, , "
The solid line is the ''best-fit'' by least squares regression analysis . ·The inner pair of dashed lines represent the 95% confidence interval for the best-fit line . The outer pair of dashed lines represent the 95% confidence " interval for the data . Concentrations are in ng/mL.
, "
, " ,
" , * " �'
,
, , " , * ,
,JI. • * • AJir;i� , , ,
"
" , ,,'
,
, ,
" ,
" , , , .
",
, " , ,
, , , , , ** ,,'
"
,
18a
, * ,J.
., , .,
" ,
" * ,,'
. " " ,
OBSERVED
, ,
see
" , , , "
, ,
, " ,. , ,
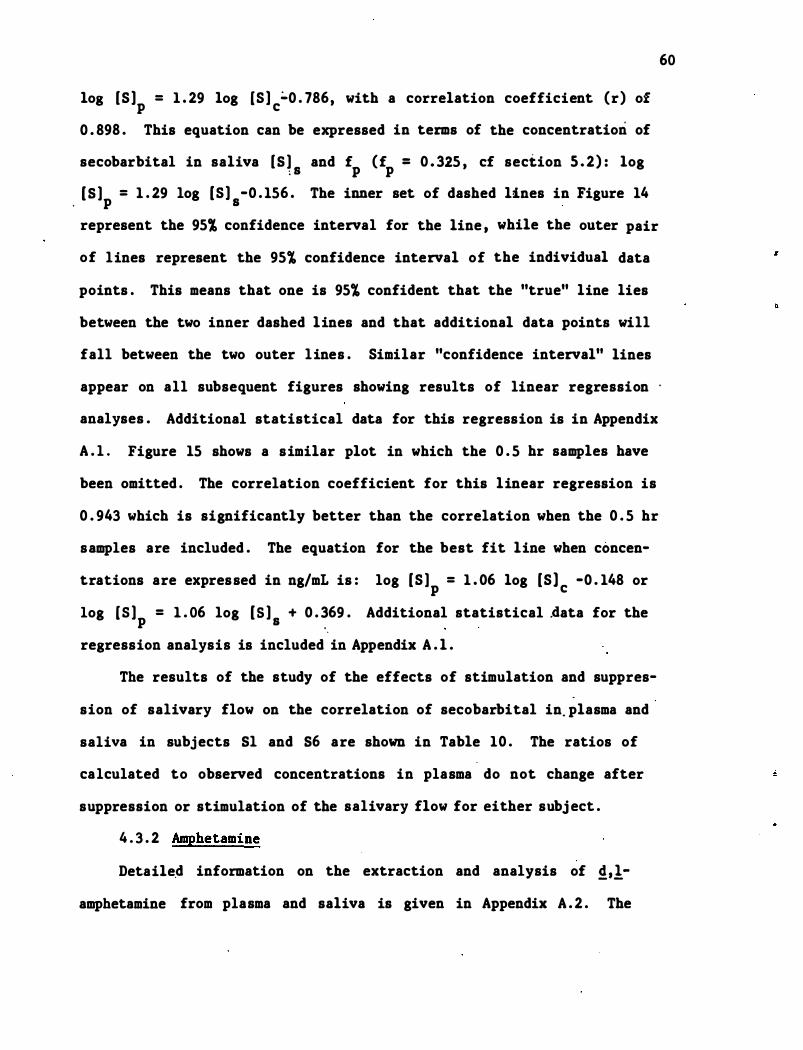
log (S ) = 1 . 29 log IS] �0 . 786, with a correlation coefficient (r) of p c 0 . 898 . This equation can be expressed in te�s of the concentration of
secobarbital in saliva (5 ] and f (f = 0 . 325 , cf section 5 . 2) : log : s p p [ 5 ] = 1 . 29 log [S) -0 . 156 . The inner set of dashed lines in Figure 14 . p s represent the 951 confidence interval for the line , while the outer pair
of lines represent the 95% confidence interval of the individual data
points . This means that one is 95% confident that the "true" line lies
between the two inner dashed lines and that additional data points will
fall between the two outer lines . Similar "confidence interval" lines
60
appear on all subsequent figures showing results of linear regression .
analyses . Additional statistical data for this regression is in Appendix
A . l . Figure 15 shows a similar plot in which the 0 . 5 hr samples have
been omitted . The correlation coefficient for this linear regression is
0 . 943 which is significantly better than the correlation when the 0 . 5 hr
samples are included . The equation for the best fit line when concen-
trations are expressed in ng/mL is : log [S ]p = 1 . 06 log [Sl c -0 . 148 or
log IS ] = 1 . 06 log [ 5 ] + 0 . 369 . Additional statistical Aata for the p s . regression analysis is included in Appendix A . l .
The results of the study of the effects of stimulation and suppres-
sion of salivary flow on the correlation of secobarbital in. plasma and
saliva in subjects 51 and 56 are shown in Table 10 . The ratios of
calculated to observed concentrations in plasma do not change after
suppression or stimulation of the salivary flow for either subj ect .
4 . 3 . 2 Amphetamine
Detaile.d information on the extraction and analysis of �,!amphetamine from plasma and saliva is given in Appendix A . 2 . The
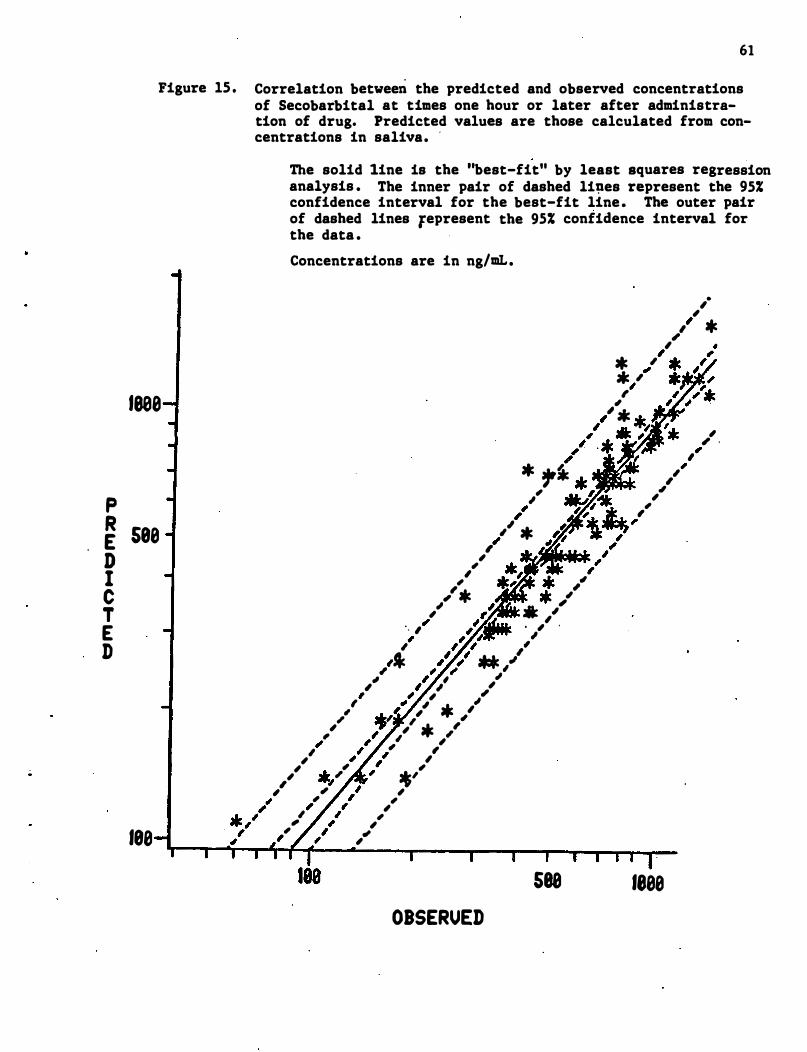
61
Figure IS . Correlation between the predicted and observed concentrations of Secobarbital at times one hour or later after administration of drug. Predicted values are those calculated from concentrations in saliva. .
The solid line is the "best-fit" by least squares regression analysis . The inner pair of dashed li�es represent the 95% confidence interval for the best-fit line . The outer pair of dashed lines fepresent the 95% confidence interval for the data . Concentrations are in ng/mL.
* " . "
,
• , , " * ,
lee8 " ,
.I .
p � S88
D I C T E D
188
" , , , , " , , , ... , , �J' , , , ,
" ,
" "
" * �fk , * �, "
" *
, . . "
, , , ,'* ,
" ,
i' , * .I' , . , .
, , "
" . .I'
.ee,./ , ,
, , , ,
.I . ' , , , ' . ' , , , , , , , , , , , ,
*' ,
, ,
" , , , ,
, ., ,
OBSERUED
S88 1888
" , , .
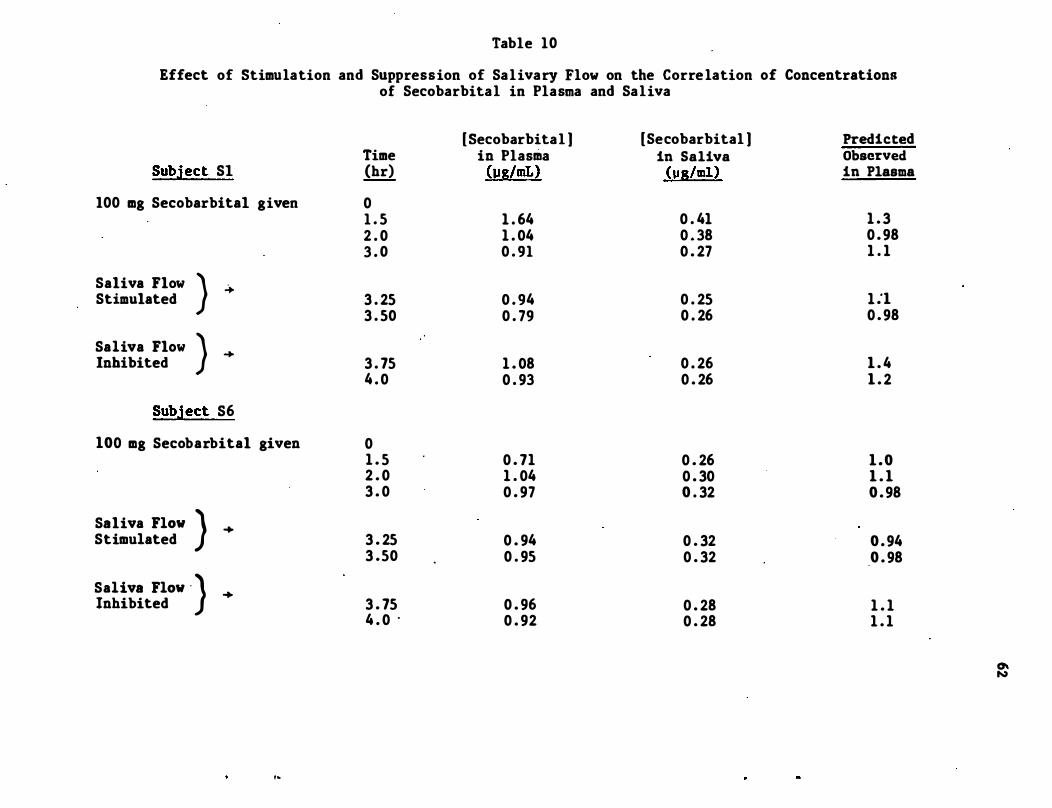
Table 10
Effect of Stimulation and Suppression of Salivary Flow on the Corre lation of Concentrations of Secobarbital in Plasma and Saliva
Subject Sl
100 mg Secobarbital given
Saliva Flow Stimulated
Saliva Flow Inhibited
} �
} �
Subject S6
100 mg Secobarbital given
Saliva FlOW ) + Stimulated
Saliva FlOW "} + Inhibited
,�
Time (hr)
0 1 . 5 2 . 0 3 . 0
3 . 25 3 . 50
3 . 75 4 . 0
0 1 . 5 2 . 0 3 . 0
3 . 25 3 .50
3 . 75 4 . 0 .
[ Secobarbital ) in Plasma (pg/mL)
1 . 64 1 . 04 0 . 91
0 . 94 0 . 79
1 . 08 0 . 93
0 . 71 1 . 04 0 . 97
0 . 94 0 . 95
0 . 96 0 . 92
[Secobarbital ) Predicted in Saliva Observed
(pg/ml) in Plasma
0 . 41 1 . 3 0 . 38 0 . 98 0 . 27 1 . 1
0 . 25 1 .'1 0 . 26 0 . 98
0 . 26 1 . 4 0 . 26 1 . 2
0 . 26 1 . 0 0 . 30 1 . 1 0 . 32 0 . 98
0 . 32 0 . 94 0 . 32 0 . 98
0 . 28 1 . 1 0 . 28 1 . 1
0\ N
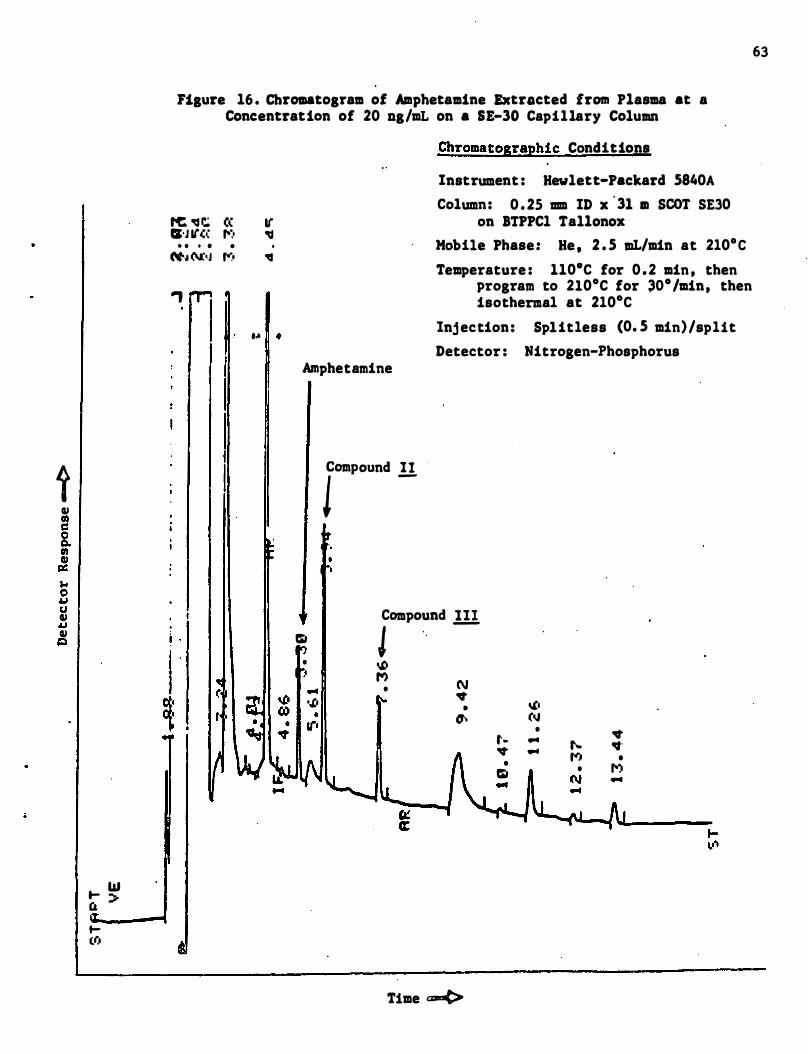
i IU co c i 10 ell c: ... 0 IJ U IU
IJ IU Q
t- W C& > t(r,
63
Fisure 16 . Chromatosram of Amphetamine Extracted from Plasma at a Concentration of 20 ns/mL on a 8E-30 Capillary Column
tC " r..; C( I( CI'J If(( 1':' �
• • • • • N'., (\J: •. J ,.-:, "
-,
... •
. ,
i .
I "
Chromatographic Conditions
Instrument : Hewlett-Packard 5840A Column: 0 . 25 mm ID x
'3l m SCOT SE30 on BTPPCl Tallonox
Mobile Phase: He , 2 . 5 mL/min at 2l0·C Temperature : 110·C for 0 . 2 min , then
program to 2l0·C for �O·/min. then isothermal at 2l0·C
Injection: Splitless (0. 5 min)/split Detector : Nitrogen-Phosphorus
Amphetamine
ICl1llPound !!
Compound ill Q J • �
M N ... • .,t. .. o,t • •
• � (oJ 11"' • .. t- ... t ... � . .. ... ,.-, • • 1'') Q • (\I ...
Time c--t>
64
chromatographic analysis of the small amounts of amphetamine present in
plasma and saliva presents severe problems due to the adsorption of this
drug to the column mater�als . Therefore the 'amphetamine was converted
in the analytical procedure to its trifluoroacetamide .derivative . This
derivative has low adsorption and good chromatographic properties .
Other investigators have similarly found it necessary to form derivatives
of amphetamine in order to measure its concentration in · biological
fluids (Wan, et . al , 1978 ; Matin , et. al . , 1977 ; O ' Brien , et. al , 1972) .
Both methyl silicone (SE-30) and polyethylene glycol (Carbowax-20M)
coated capillary GC columns were evaluated for the analysis of amphetamine
in samples of plasma and saliva . Because of the much sharper peaks and
the cleaner baseline in the region of chromatogram i:orresponding to
amphetamine and its internal standards , the SE-30 column was chosen for
the analysis of this drug . Figure 16 shows a typical chromatogram of
amphetamine (trifluoroacetamide) extracted from plasma . . CompoUI1ds I I
and III in the chromatogram are internal standards . Linear calibrations
(log-log scale) were established for amphetamine in plasma . from 1 . 0-100
ng/mL and in saliva from 1 . 0-500 ng/mL.
The results of the analyses of plasma and saliva from six subj ects ,
each dosed at two different levels (0 . 061 and 0 . 122 mg/kg) with �,!- .
amphetamine , are shown in Table 11 . Matin et a1 . (1977 ) reported that
concentrations of amphetamine in saliva were approximately 2 1/2 times
higher than the corresponding concentrations in plasma . For some of the
subj ects in our study and at some time periods , similar results were
found . However , there appeared to be a large subj ect to subject vari
ation in the concentrations of amphetamine in saliva following admin
istration of the same amount of drug . Subj ect A2 is particularly "abnormal , "
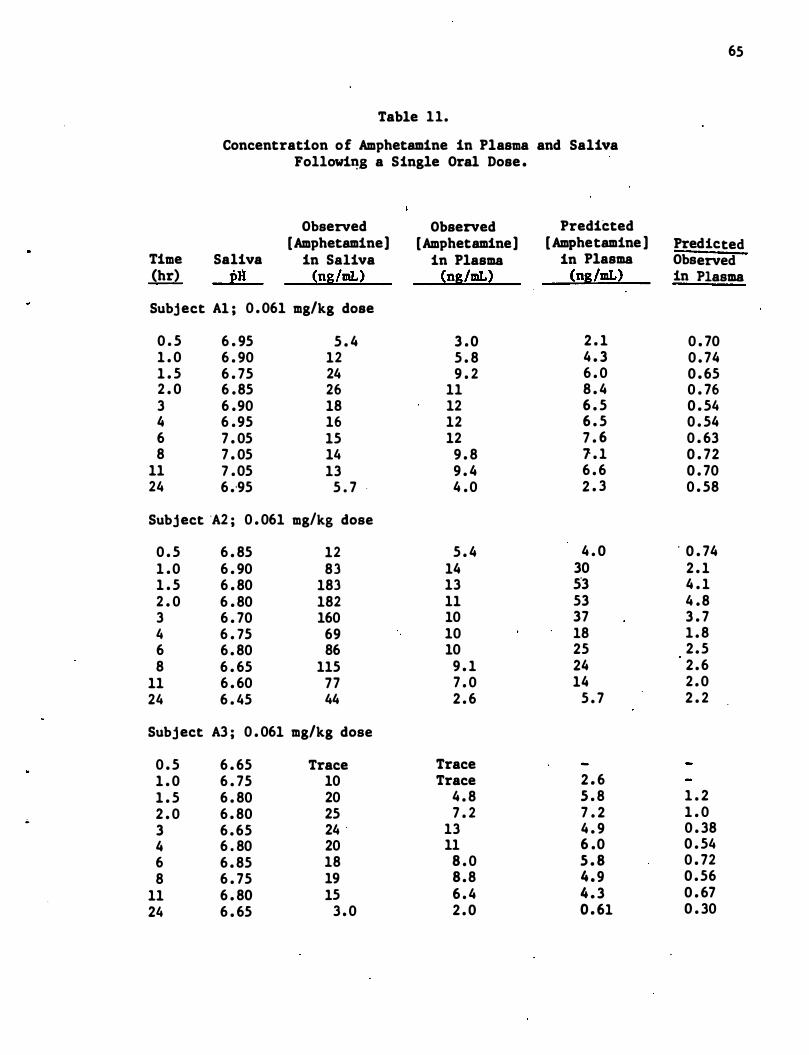
..
Table 11.
Concentration of Amphetamine in Plasma and Saliva Fo11owi�g a Single Oral Dose .
Observed Observed Predicted [Amphetamine] [Amphetamine] [ Amphetamine ]
Time Saliva in Saliva in Plasma in Plasma (hr) pH (ng/mL) (ng/mL) (ng/mL)
Subject Al ; 0 . 061 mg/kg dose
0 . 5 6 . 95 5 . 4 3 . 0 2 . 1 1 . 0 6 . 90 12 5 . 8 4 . 3 1 . 5 6 . 75 24 9 . 2 6 . 0 2 . 0 6 . 85 26 11 8 . 4 3 6 .90 18 12 6 . 5 4 6 . 95 16 12 6 . 5 6 7 . 05 15 12 7 . 6 8 7 . 05 14 9 . 8 1 . 1
11 7 . 05 13 9 . 4 6 . 6 24 6 .. 95 5 . 7 . 4 . 0 2 . 3
Subject 'A2 i 0 . 061 mg/kg dose
0 . 5 6 . 85 12 5 . 4 4 . 0 1 . 0 6 . 90 83 14 30 1 . 5 6 . 80 183 13 53 2 . 0 6 . 80 182 11 53 3 6 . 70 160 10 37 4 6 . 75 69 10 18 6 6 . 80 86 10 25 8 6 . 65 115 9 . 1 24
11 6 . 60 77 7 . 0 14 24 6 . 45 44 2 . 6 5 . 7
Subject A3 i 0 . 061 mg/kg dose
0 . 5 6 . 65 Trace Trace 1 . 0 6 . 75 10 Trace 2 . 6 1 . 5 6 . 80 20 4 . 8 5 . 8 2 . 0 6 . 80 25 7 . 2 7 . 2 3 6 . 65 24 13 4 . 9 4 6 . 80 20 11 6 .0 6 6 . 85 18 8 . 0 5 . 8 8 6 . 75 19 8 . 8 4 . 9
11 6 . 80 15 6 . 4 4 . 3 24 6 . 65 3 . 0 2 . 0 0 . 61
65
Predicted Observed in Plasma
0 . 70 0 . 74 0 . 65 0 . 76 0 . 54 0 . 54 0 . 63 0 . 72 0 . 70 0 . 58
. 0 . 74 2 . 1 4 . 1 4 . 8 3 . 7 1 . 8 2 . 5 2 . 6 2 . 0 2 . 2
1 . 2 1 . 0 0 . 38 0 . 54 0 . 72 0 . 56 0 . 67 0 . 30
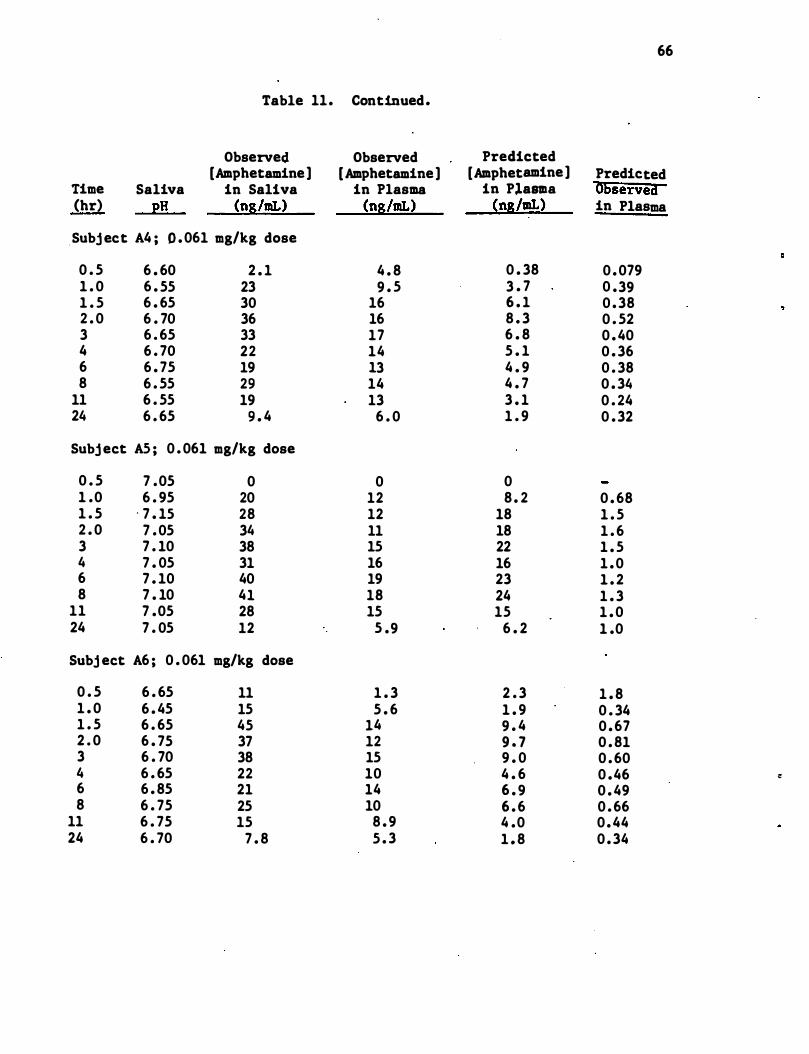
66
Table 11. Continued.
Observed Observed Predicted [Amphetamine) [Amphetamine) [Amphetamine) Predicted
Time Saliva in Saliva in Plasma in Plana "Observed (hr) pH (ng/mI.) (ng/mI.) (ng/mI.) in Plasma
Subj ect A4 ; 0 . 061 mg/kg dose
0 . 5 6 . 60 2 . 1 4 . 8 0 . 38 0 . 079 1 . 0 6 . 55 23 9 . 5 3 . 7 0 .39 1 . 5 6 . 65 30 16 6 . 1 0 . 38 2 . 0 6 . 70 36 16 8 . 3 0 . 52 3 6 . 65 33 17 6 . 8 0 . 40 4 6 . 70 22 14 5 . 1 0 . 36 6 6 . 75 19 13 4 . 9 0 . 38 8 6 . 55 29 14 4 . 7 0 . 34
11 6 . 55 19 13 3 . 1 0 . 24 24 6 . 65 9 . 4 6 . 0 1 . 9 0 . 32
Subj ect AS ; 0 . 061 mg/kg dose
0 . 5 7 .05 0 0 0 1 .0 6 . 95 20 12 8 . 2 0 . 68 1 . 5 - 7 . 15 28 12 18 1 . 5 2 . 0 7 . 05 34 11 18 1 . 6 3 7 . 10 38 15 22 1 . 5 4 7 . 05 31 16 16 1 . 0 6 7 . 10 40 19 23 1 . 2 8 7 . 10 41 18 24 1 . 3
11 7 .05 28 15 15 1 . 0 24 7 . 05 12 5 .9 6 . 2 1 .0
Subj ect A6 ; 0 . 061 mg/kg dose
0 . 5 6 . 65 11 1 . 3 2 . 3 1 . 8 1 . 0 6 . 45 15 5 . 6 1 . 9 0 . 34 1 . 5 6 . 65 45 14 9 . 4 0 . 67 2 . 0 6 . 75 37 12 9 . 7 0 . 81 3 6 . 70 38 15 9 . 0 0 . 60 4 6 . 65 22 10 4 . 6 0 .46 :: 6 6 . 85 21 14 6 . 9 0 . 49 8 6 . 75 25 10 6 . 6 0 . 66
11 6 . 75 15 8 . 9 4 .0 0 . 44 24 6 . 70 7 . 8 5 . 3 1 . 8 0 . 34
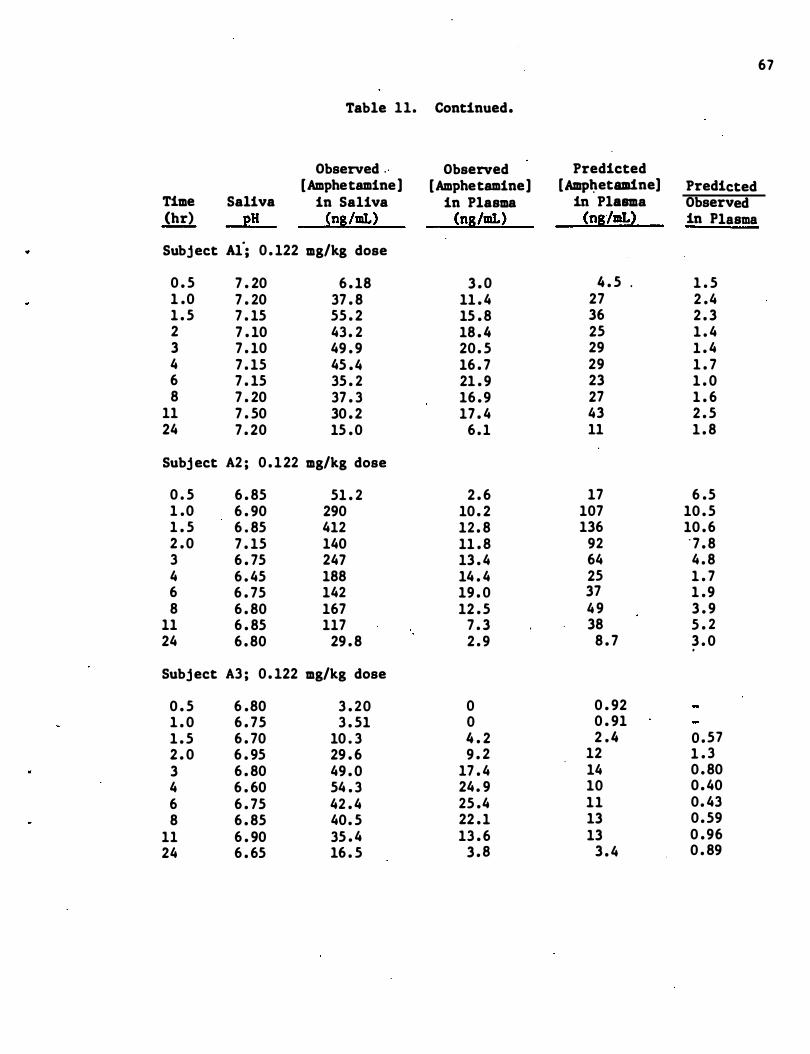
67
Table 11. Continued.
Observed " Observed Predicted [Amphetamine] [Amphetamine] [Amp�etam1ne] Predicted
Time Saliva in Saliva in Plasma in Plasma Observed (hr) 2H (ns/mL) (ns/mL) (nslmL� in Plasma
Subject Al'; 0 . 122 mg/kg dose
0 . 5 7 . 20 6 . 18 3 . 0 4 . 5 . 1 . 5 1 .0 7 . 20 37 . 8 11 . 4 27 2 .4 1 . 5 7 . 15 55 . 2 15 . 8 36 2 . 3 2 7 . 10 43 . 2 18 . 4 25 1 . 4 3 7 . 10 49 . 9 20 . 5 29 1 . 4 4 7 . 15 45 . 4 16 . 7 29 1 . 7 6 7 . 15 35 . 2 21 . 9 23 1 . 0 8 7 . 20 37 . 3 16 . 9 27 1 . 6
11 7 . 50 30 . 2 17 . 4 43 2 . 5 24 7 . 20 15 . 0 6 . 1 11 1 . 8
Subj ect A2 ; 0 . 122 mg/kg dose
0 . 5 6 . 85 51 . 2 2 . 6 17 6 .5 1 .0 6 . 90 290 10 . 2 107 10 . 5 1 . 5 6 . 85 412 12 . 8 136 10 . 6 2 . 0 7 . 15 140 11 . 8 92 ' 7 . 8 3 6 . 75 247 13 . 4 64 4 . 8 4 6 . 45 188 14 . 4 25 1 . 7 6 6 . 75 142 19 . 0 37 1 . 9 8 6 . 80 167 12 . 5 4 9 3 . 9
11 6 . 85 117 7 . 3 38 5 . 2 24 6 . 80 29 . 8 2 . 9 8 . 7 3 . 0
.
Subject A3 ; 0 . 122 mg/kg dose
0 . 5 6 .80 3 . 20 0 0 . 92 1 . 0 6 . 75 3 . 51 0 0 . 91 1 . 5 6 . 70 10 . 3 4 . 2 2 . 4 0 . 57 2 . 0 6 . 95 29 . 6 9 . 2 12 1 . 3 3 6 . 80 49 . 0 17 . 4 14 0 . 80 4 6 . 60 54 . 3 24 . 9 10 0 . 40 6 6 . 75 42 . 4 25 .4 11 0 . 43 8 6 . 85 40. 5 22 . 1 13 0 . 59
11 6 . 90 35 . 4 13 . 6 13 0 . 96 24 6 . 65 16 . 5 3 . 8 3 . 4 0 . 89
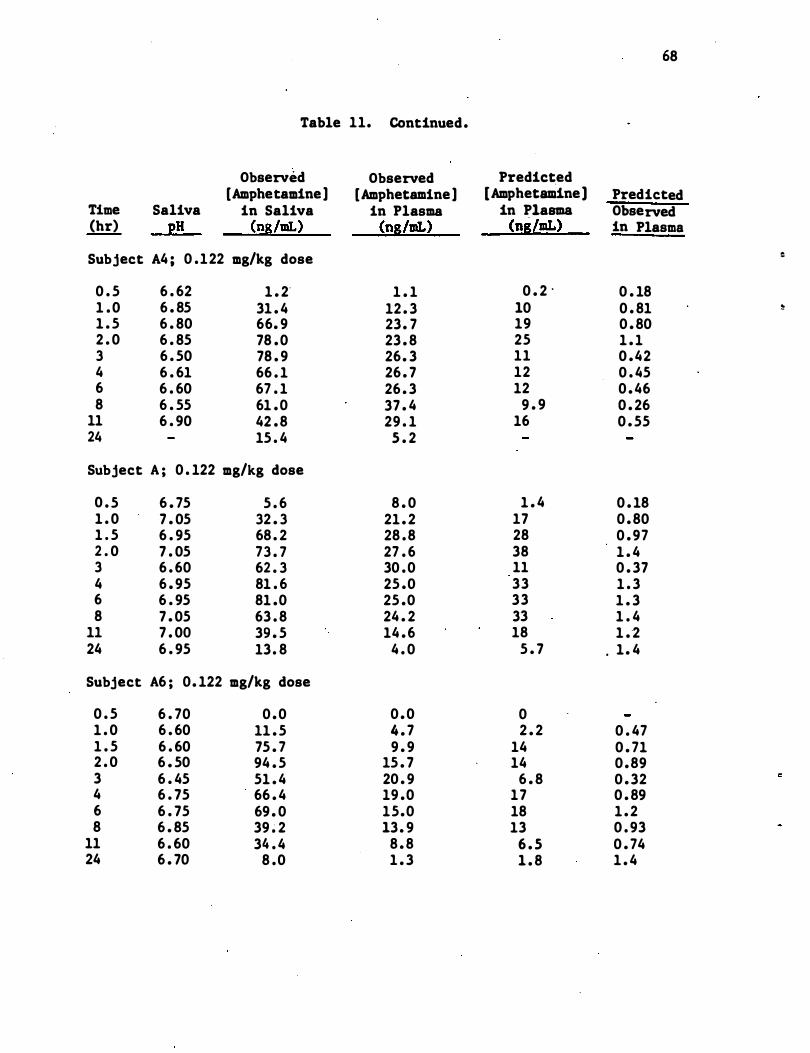
68
Table 11. Continued.
Observed Observed Predicted [Amphetamine] [Amphetamine] [Amphetaudne] Predicted
Time Saliva in Saliva in Plasma in Plasma Observed (hr) pH (ng/mI.) (ng/mL) (ng/mL) in Plasma
Subject A4 ; 0 .122 mg/kg dose �
0 . 5 6 . 62 1 . 2' 1 . 1 0 . 2 " 0 . 18 1 . 0 6 . 85 31 . 4 12 . 3 10 0 . 81 �
1 . 5 6 . 80 66. 9 23. 7 19 0 . 80 2 . 0 6 . 85 78 . 0 23 . 8 25 1 . 1 3 6 . 50 78 . 9 26. 3 11 0 .42 4 6 . 61 66 . 1 26 . 7 12 0 . 45 6 6 . 60 67 . 1 26 . 3 12 0 . 46 8 6 . 55 61 . 0 37 . 4 9 . 9 0 . 26
11 6 . 90 42 . 8 29 . 1 16 0 . 55 24 15 . 4 5 . 2
Subject A ; 0 . 122 mg/kg dose
0 . 5 6 . 75 5 . 6 8 . 0 1 . 4 0 . 18 1 . 0 7 . 05 32 . 3 21 . 2 17 0 . 80 1 . 5 6 . 95 68 . 2 28 . 8 28 0 . 97 2 . 0 7 . 05 73 . 7 27 . 6 38 1 . 4 3 6 . 60 62 . 3 30 . 0 11 0 . 37 4 6 . 95 81 . 6 25 .0 33 1 . 3 6 6 . 95 81 .0 25 .0 33 1 . 3 8 7 . 05 63 . 8 24 . 2 33 1 . 4
11 7 . 00 39 . 5 14 . 6 18 1 . 2 24 6 . 95 13. 8 4 . 0 5 . 7 . 1 . 4
Subject A6 ; 0. 122 mg/kg dose
0 . 5 6 . 70 0 . 0 0 . 0 0 1 . 0 6 . 60 11 . 5 4 . 7 2 . 2 0 . 47 1 . 5 6 . 60 75 . 7 9 . 9 14 0 . 71 2 . 0 6 . 50 94 . 5 15 . 7 14 0 .89 3 6 . 45 51 . 4 20 . 9 6 . 8 0 . 32 4 6 . 75 66 . 4 19 .0 17 0 . 89 6 6 . 75 69 . 0 15.0 18 1 . 2 8 6 . 85 39 � 2 13. 9 13 0 . 93
11 6 . 60 34 . 4 8 . 8 6 . 5 0 . 74 24 6 . 70 8 .0 1 . 3 1 . 8 1 . 4
..
;;
with concentrations of amphetamine in saliva 5-10 times as high as any
of the other subjects .
69
Predicted concentrat�ons of amphetamine in plasma were calculated from
concentrations in saliva by the Henderson-Hasselbalch-derived equation
discussed in section 2 . 2 . The ratio of predicted to observed concen
trations in plasma average 1 . 43 (CV = l24�, n = 113) and range from 0 . 18
to 10 . 6 . The ratios for subj ect A2 averaged 2 . 6 for the lower dose of
amphetamine and 5 . 6 for the higher dose while the corresponding ratios
for subj ect A4 were 0 . 34 and 0 . 56 , respectively. There is no significant
difference in the ratios for the 0 . 5 hr samples and those for the later
times as was observed for secobarbital .
Plots of the concentrations of amphetamine in saliva versus concentra
tions in plasma and of the predicted versus observed concentrations in
plasma .are shown in Figures 17 and 18 , respectively. Correlation coef
ficients of the least squares linear regression (log-log scale) · were
0 . 61 and 0 . 62 . Thus , there is poor correlation between concentrations
of amphetamine in saliva and plasma . Attempts to use a� "internal
standard" in saliva in order t� obtain better correlations are described
in section 4 . 4 of this report .
4 . 3 . 3 ChlOrpromaZine
Detailed information on the extraction and analysis of chlorpromazine
from plasma and saliva , including preparation of the internal standard ,
is given in Appendix A . 3 . Extracts from plasma and saliva were chroma-
to graphed on a polyethylene glycol (Carbowax 20M) coated capillary GC
column . A chromatogram obtained from an extract of saliva that had been
spiked with chlo�romazine and its internal standard is shown in Figure
19 . Linear calibrations (log-log scale) were established for chlorpromazine
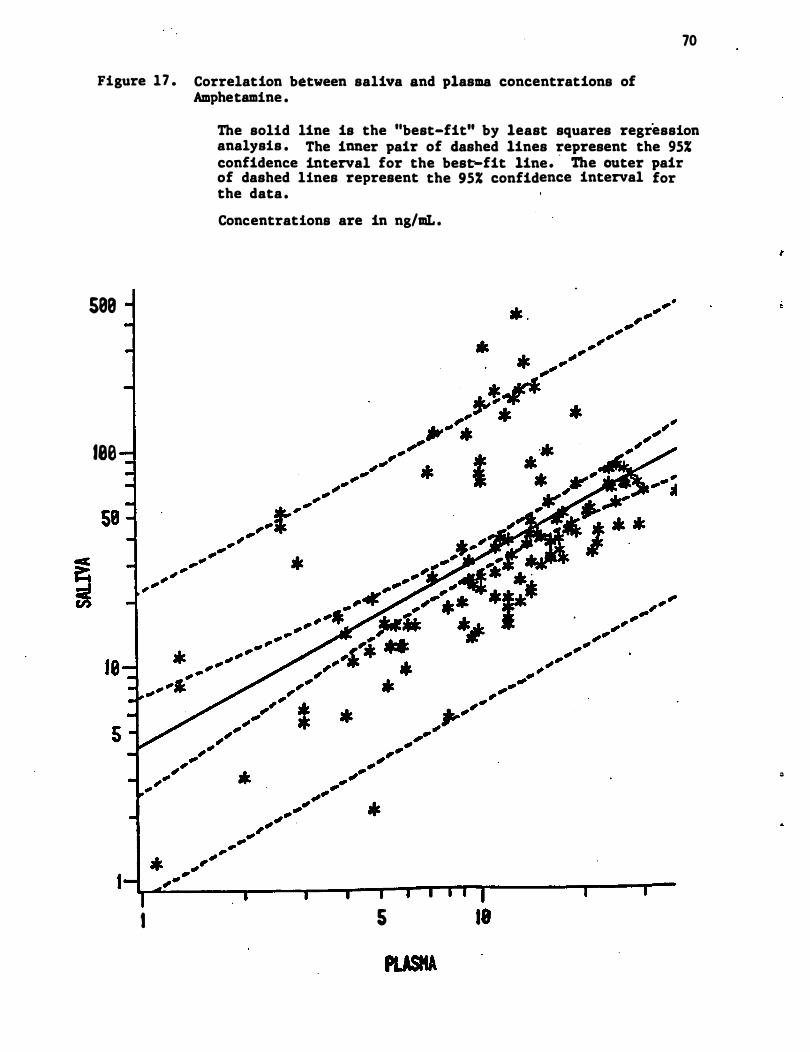
70
Figure 17 . Correlation between saliva and plasma concentrations of Amphetamine .
588
180
I
The solid line is the "best-fit" by least squares regression analysis . The inner pair of dashed lines represent the 95% confidence interval for the best-fit line. ' The outer pair of dashed lines represent the 95% confidence interval for the data .
Concentrations are in ng/aL .
5 18
"
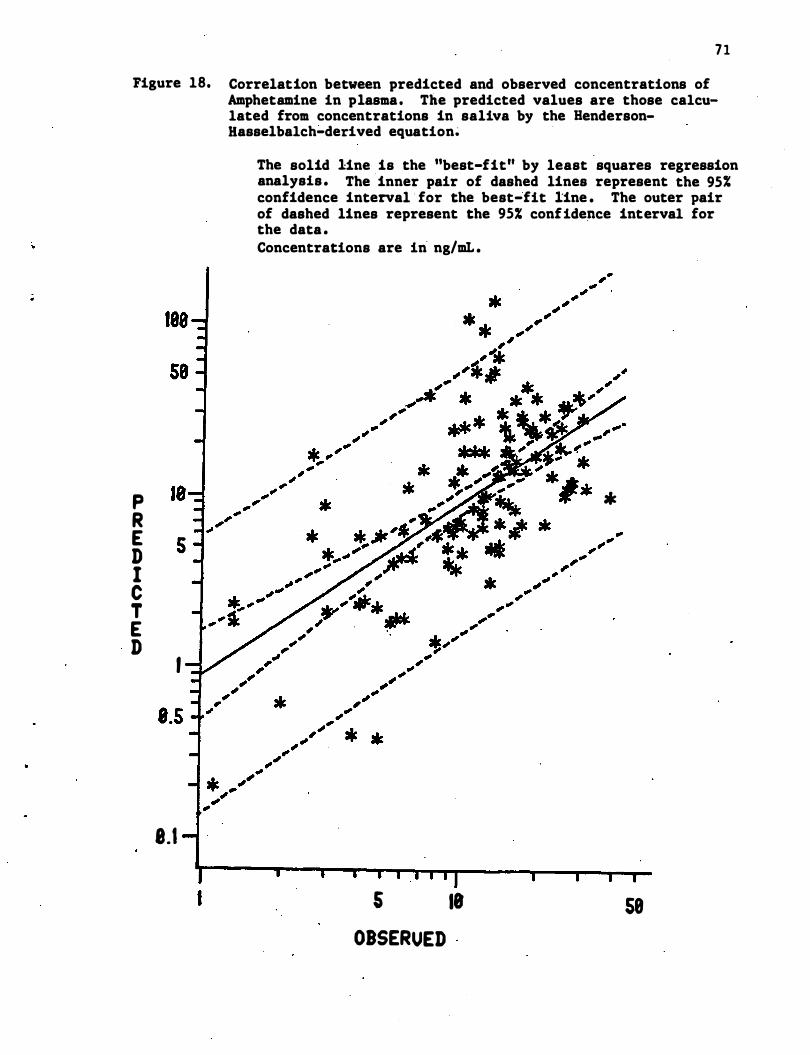
71
Figure 18. Correlation between predicted and observed concentrations of Amphetamine in plasma. The predicted values are those calculated from concentrations in saliva by the HendersonHasselbalch�derived equation�
P R E D I C T E D
I
8.1
I
The solid line is the ''best-fit'' by least squares regression analysis . The inner pair of dashed lines represent the 95% confidence interval · for the best-fit line . The outer pair of dashed lines represent the 95% confide�ce interval for the data . Concentrations are in ng/mL .
*
s 18 58 OBSERUED
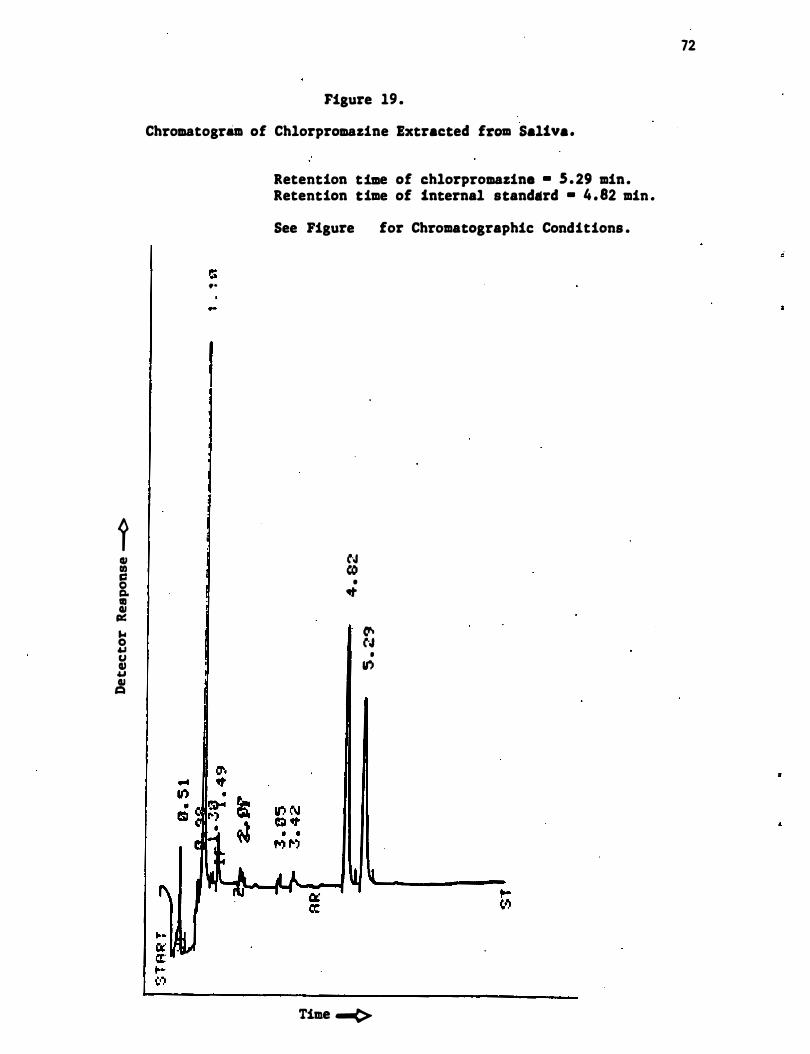
1 III III C 0 g. 111 III Ill! ... 0 .., U III .., III �
Figure 19 .
Chromatogram of Chlorpromazine Extracted from Saliva.
..
Retention time of chlorpromazine • 5 . 29 min. Retention time of internal standard • 4 . 82 min .
See Figure for Chromatographic Conditions •
N ((I
• �
V't CoJ •
If,I
Time -(>
72
in saliva from 20-400 ng/mL and in plasma from 5-200 ng/mL, although at
concentrations of less than 20 ng/mL in plasma appreciable scatter was
observed in the analytical results .
Chlorpromazine was measured in plasma from six subjects who had
each been given two different levels of chlorpromazine . These samples
had been stored at -20°C in the dark for several weeks before analysis .
After two more weeks some of the samples were reanalyzed . The concen-
tration of chlorpromazine in these reanalyzed samples was substantially
less than was determined two weeks previously . We are therefore not
confident that the values obtained for concentrations of chlorpromazine
in plasma are the concentrations ' that were present when the blood sam-
pIes were taken . Hence , comparison of concentrations of chlorpromazine
in saliva and in these plasma samples is not possible .
4 . ;3 . 4 Diazepam
Detailed information on the extraction and analysis of dia.zepam
from plasma and saliva in given in Appendix A . 4 . Extracts from plasma
and saliva could be chromatographed on either a methyl silicone (SE-30)
or a polyethylene glycol (Carbowax 20M) coated capillary GC column •
.I Diazepam elutes from the SE-30 column with a reasonable retention time
and good peak shape . However , the SE-30 column was unable to separate
diazepam from either of the internal standards that we have devised and
73
therefore is not useful for the analysis of this drug unless other
internal standards are found . A typical chromatogram of diazepam extracted
from plasma on the Carbowax column is shown in Figure 20 . Diazepam , its
internal standard (the I-ethyl analog of diazepam) , and 3-methyl
diazepam (reten�ion time 8 . 51 min) , another possible internal standard ,
elute in sharp peaks free from interferences on this column . Linear
calibration curves (log:'log scale) were established for diazepam in
plasma from 10-500 ng/mL and in saliva from 1-20 ng/mL . An additional
standard curve for diazep�m in saliva was established between 0 . 1 and 5
ng/mL .
74
Analysis of multiple samples containing more than 25 ng/mL of
diazepam was accomplished with ease on this column. Concentrations of
diazepam in the plasma of six subj ects who were each administered diaze
pam at two dose levels are shown in Table 12 . However , analysis of
samples containing less than 10 ng/mL of diazepam , which entailed inj ec
tion of larger quantities of plasma or saliva extract , caused rapid
degeneration of the chromatography column , which was being operated very
close to its maximum temperature . Analysis of the -diazepam in one
subj ect , however , was completed before all of the columns which we had
were destroyed . The results of these analyses are shown in Table 13 .
Since diazepam is a neutral molecule , the concentration of diazepam
in saliva should correspond to the concentration of "free" diazepam
(i . e . that which is not bound to plasma protein) in plasma! The saliva
concentrations of diazepam for subject D2 ranged from 2 . 1-5 . 6% �f the
concentrations in plasma with the exception of the 0 . 5 hr sample , which
was much higher (13% of the concentration in plasma ) . DiGregorio et al e
(1978) , who reported only averaged values for nine ' subj ects following
analysis of plasma and saliva on a packed column with electron capture
detection, found that mixed saliva contained an average of 2 . 9% as much
diazepam as plasma . Using our very limited data (Table 13) and elimi
nating the 0 . 5 hr sample , we found the average predicted plasma concen
tration of diazepam was 2 . 0 times that actually observed . The concen
tration of diazepam in plasma predicted from the 0 . 5 hr sample is more
than eight times that actually observed .
:
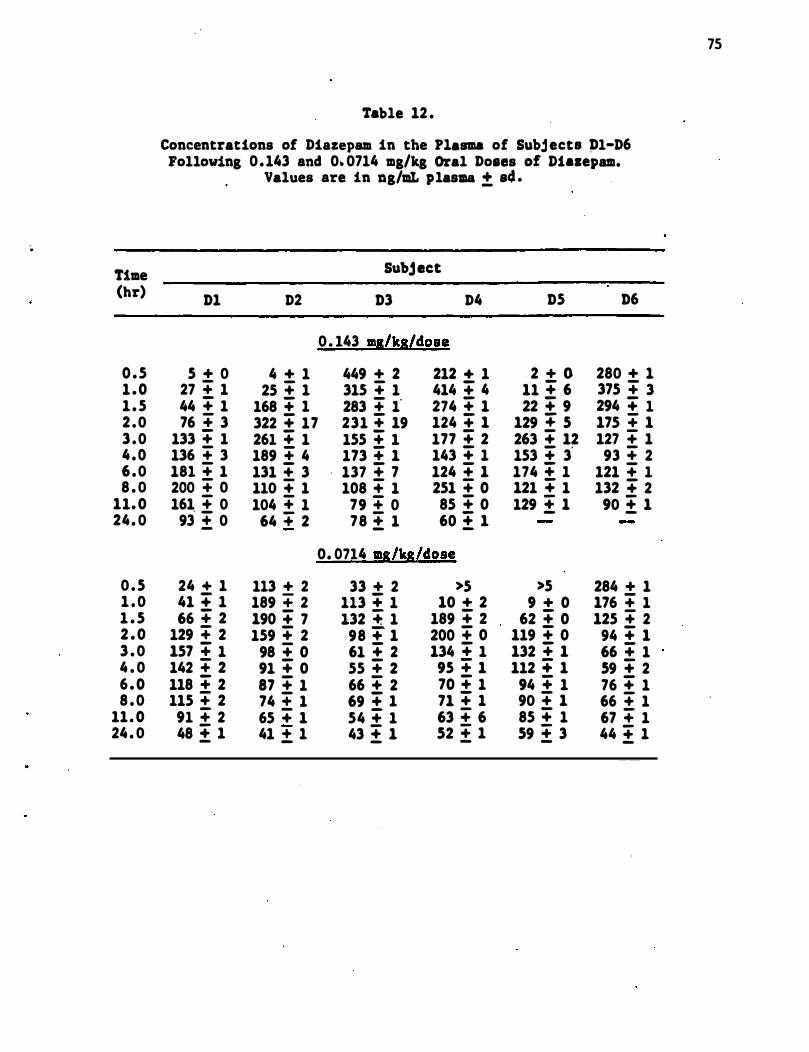
�
Time (hr)
0 .5 1 .0 1 .5 2 .0 3 .0 4 .0 6 .0 8 . 0
11. 0 24. 0
0 .5 1 . 0 1 . 5 2 . 0 3 . 0 4 . 0 6 .0 8 . 0
11. 0 24 . 0
Table 12 .
Concentrations of Diazepam in the Plasma of Subjects Pl-D6 Following 0 .143 and 0. 0714 mg/kg Oral Doaes of Dialepam.
Values are in ng/mt plasma ± s4 .
Subject
D1 D2 D3 D4 D5 D6
0 . 143 ms/ks/dose
5 + 0 4 + 1 449 + 2 212 + 1 2 + 0 280 + 1 27 + 1 25 + 1 315 + 1 414 + 4 11 + 6 375 + 3 44 + 1 168 + 1 283 + 1" 274 + 1 22 + 9 294 + 1 76 + 3 322 + 17 231 + 19 124 + 1 129 + 5 175 .. 1
133 + 1 261 + 1 155 + 1 177 + 2 263 + 12 127 .. 1 136 .. 3 189 + 4 173 + 1 143 + 1 153 + 3' 93 " 2 181 + 1 131 " 3 137 + 7 124 .. 1 174 + 1 121 .. 1 200 + 0 110 + 1 108 " 1 251 + 0 121 + 1 132 + 2 161 + 0 104 + 1 79 + 0 85 + 0 129 ± 1 90 ± 1 93 ± 0 64 + 2 78 ± 1 60 ± 1
0. 0714 ms/ks/dose
24 + 1 113 + 2 33 + 2 >5 >5 284 + 1 41 + 1 189 .. 2 113 + 1 10 + 2 9 + 0 176 .. 1 66 + 2 190 + 7 132 +. 1 189 + 2 62 + 0 125 + 2
129 + 2 159 + 2 98 + 1 200 + 0 119 + 0 94 + 1 157 + 1 98 + 0 61 + 2 134 + 1 132 + 1 66 + 1 142 + 2 91 + 0 55 + 2 95 + 1 112 + 1 59 + 2 118 + 2 87 + 1 66 + 2 70 + 1 94 + 1 76 + 1 115 + 2 74 ± 1 69 + 1 71 + 1 90 + 1 66 + 1 91 " 2 65 + 1 54 " 1 63 " 6 85 + 1 67 " 1 48 ± 1 41 ± 1 43 ± 1 52 ± 1 59 ± 3 44 ± 1
75
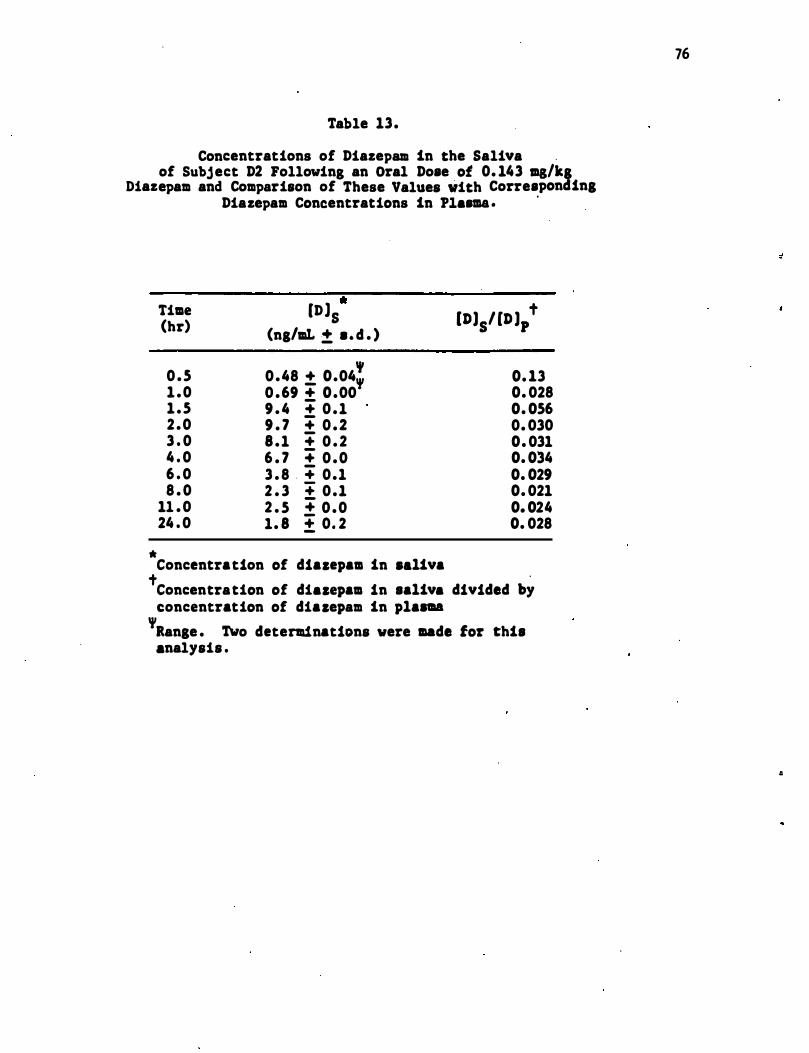
Table 13.
Concentrations of Diazepam in the Saliva . of Subject D2 Following an Oral Dose of 0. 143 ma/kg
Diazepam and Comparison of These Values with Corresponding
*
Time (hr)
0 .5 1 .0 1 .5 2 .0 3 . 0 4 . 0 6 . 0 8 . 0
11 .0 24 . 0
Diazepam Concentrations in Pl.... . .
" t [D)S (ng/llL ± • . d . )
[D)S/ [D)p , 0. 13 0.48 ± 0.04" 0 .69 + 0.00 0. 028
9 . 4 :;: 0 .1 0. 056 9 . 7 :;: 0 .2 0. 030 8 .1 :;: 0 . 2 0. 031 6 . 7 :;: 0 .0 0. 034 3 . 8 . :;: 0.1 0. 029 2 . 3 :;: 0.1 0. 021 2 . 5 :;: 0 .0 0. 024 1. 8 ± 0. 2 0. 028
Concentration of diazepam in •• 1iva t . Concentration of di.zepam in sa1iv. divided by concentration of diazepam in p1a.aa
'aange . TWo determinations were made for this analysis .
76
II
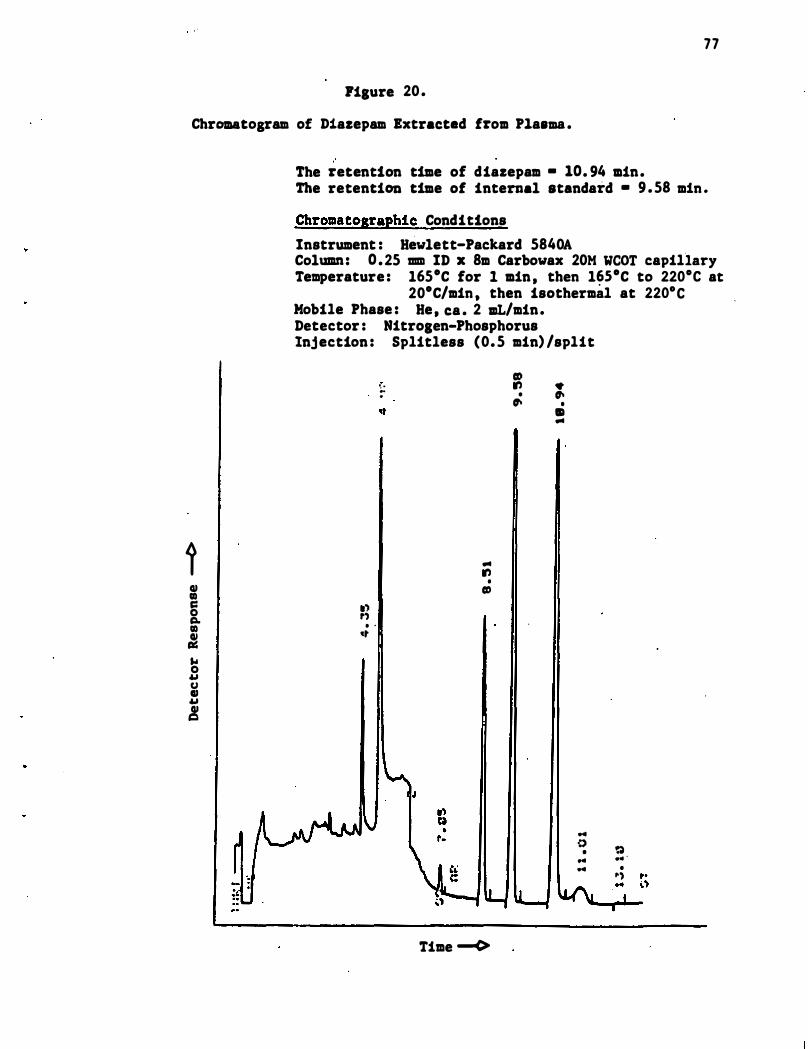
77
rilure 20 .
Chromatoaram of Diazepam Extracted from Plasma .
i QI CIl c:: 0 c:I. CIl � ... 0 u U QI u !
" The retention time of diazepam • 10. 94 min. The retention time of internal standard • 9 . 58 min .
Chromatographic Conditions
Instrument : Hewlett-Packard 5840A Column: 0 . 25 mm ID x 8m Carbowax 20M weOT capillary Temperature : l65·C for 1 min , then l�5·C to 220·C at
20·C/min , then isothermal at 220·C Mobile Phase : He , ca . 2 IlL/min. Detector : Nitrolen-Phosphorus Injection : Splitless (0. 5 min) /split
.') ,') . '
...
, . � .
... .,
• CD
Time --c>
CD ., •
� • �
• • ...
" o
• ... "
� . .. . •
�')
78
4 . 3 . 5 Diphenhydramine
Detailed information on the extraction and analysis of diphenhydra-
mine from plasma and sal�va is given in Appendix A .5 . Plasma and saliva
extracts were chromatographed on a commercial polyethylene glycol (CP
Wax 51 ; Chrompack) glass capillary column. A sample chromatogram
obtained from extracted saliva containing diphenhydramine and the inter-
nal standard, Orphenadrine , is shown in Figure 21 . Linear calibration
curves (log-log scale) were established for diphenhydramine in plasma
and saliva over ranges of 1-200 and 15-1000 ng/mL respectively.
The results of the analysis of plasma and saliva samples from seven
subj ects , each of which received a 100 mg dose of diphenhydramine and
two of which also received a 50 mg dose , are shown in Table 14 . Pre-
dicted concentrations of diphenhydramine in plasma were calculated from
concent-rations in saliva by the Henderson-Hasselbalch-derived equation
described in Section 2 . 2 .
The ratios o f predicted to observed concentrations o f diphenhydramine
in plasma average 2 . 3 (CV = 67%, n = 42) . They range from D . 28 to 5 . 9 ,
with a median value of 1 . 7 . These ratios vary as a function of �ime .
The maximum values of these ratios for each subj ect at 1 . 5-3 hours and
in all but one case correspond to the maximum concentration of diphen-
hydramine in saliva . Significant variations in binding of diphenydramine
to different samples of plasma from the same subj ect were also observed
(cf Table 7) .
Plots of the concentrations of diphenhydramine in saliva (DP] s versus concentrations in plasma (DP] and of the predicted (DP] versus p c
..
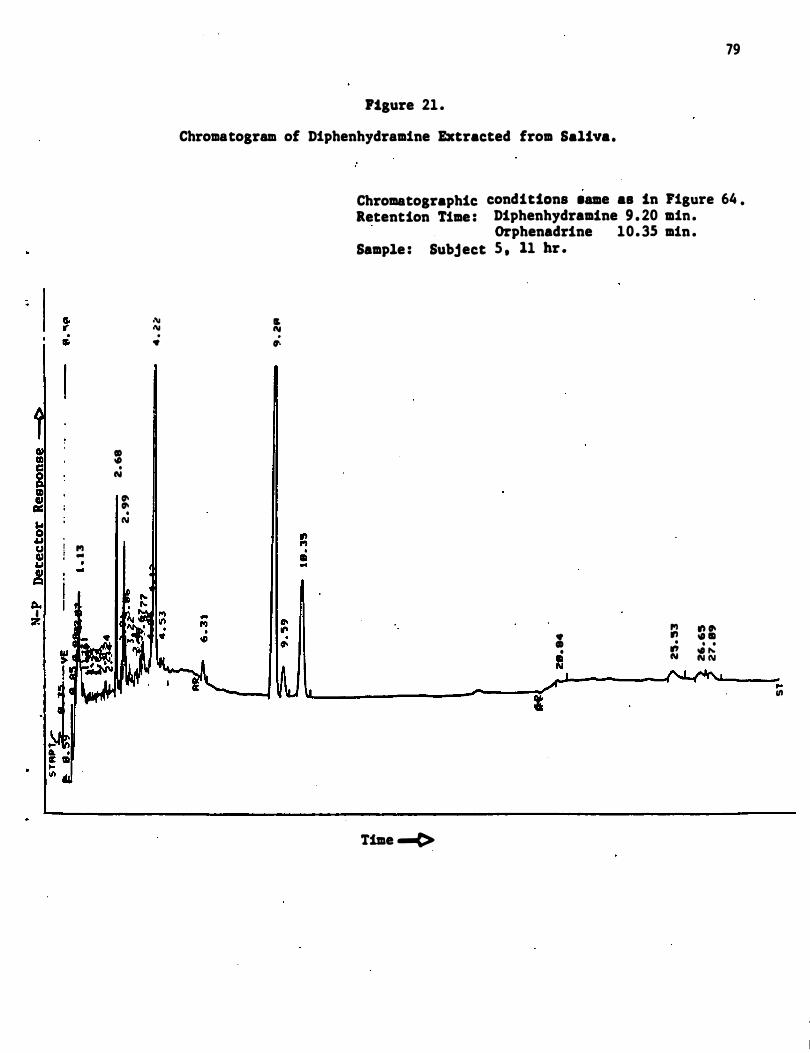
II) III ..: ... 0 U U III u ,! ea.. I :7.
CD • . Clot
". ". • N
f'I -
.'\1 1\1 . •
79
Ftgure 21 .
Chromatogram of Diphenhydramine Extracted from Saliva.
" AI . ".
Chromatographic Retention Time :
Sample : Subject
Time ......e>
conditions .ame aa in Figure 64 . Diphenhydramine 9 . 20 min. Orphenadrine 10. 35 min . 5 . 11 hr .
f'I • ." CD .
• � II Clot
I
." ". . 11 . . . � N N
.. '"
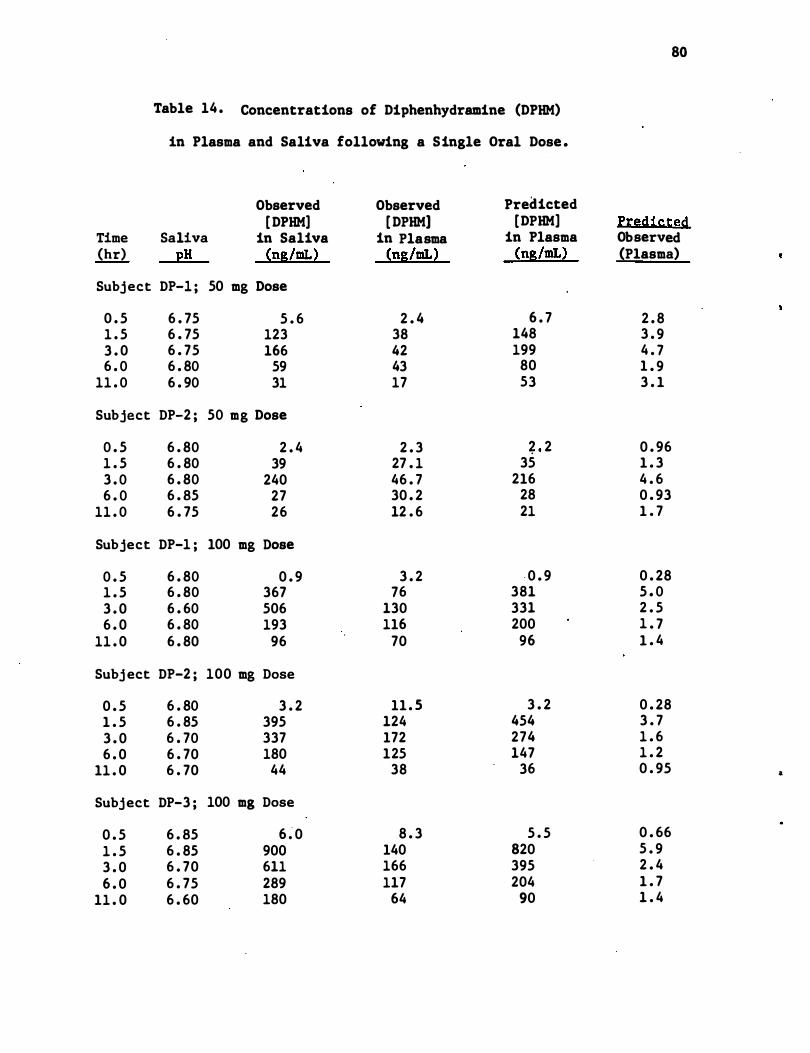
Table 14 . Concentrations of Diphenhydramine (DPHM)
in Plasma and Saliva following a Single Oral Dose .
Observed Observed Predicted [ DPHM] [ DPHM] [DPHM]
Time Saliva in Saliva in Plasma in Plasma (hr) pH (ng/mL) (ng/mL) (ng/mL)
Subj ect DP-l ; 50 mg Dose
0 . 5 6 . 75 5 . 6 2 . 4 6 . 7 1 . 5 6 . 75 123 38 148 3 . 0 6 . 75 166 42 199 6 . 0 6 . 80 59 43 80
11 . 0 6 . 90 31 17 53
Subject DP-2 ; 50 mg Dose
0 . 5 6 . 80 2 . 4 2 . 3 ? 2 1 . 5 6 . 80 39 27 . 1 35 3 . 0 6 . 80 240 46 . 7 216 6 . 0 6 . 85 27 30 . 2 28
11 . 0 6 . 75 26 12 . 6 21
Subject DP-1 ; 100 mg Dose
0 . 5 6 . 80 0 . 9 3 . 2 · 0 . 9 1 . 5 6 . 80 367 76 381 3 . 0 6 . 60 506 130 331 6 . 0 6 . 80 193 116 200
11 . 0 6 . 80 96 70 96
Subj ect DP-2 ; 100 mg Dose
0 . 5 6 . 80 3 . 2 11 . 5 3 . 2 1 . 5 6 . 85 395 124 454 3 . 0 6 . 70 337 172 274 6 . 0 6 . 70 180 125 147
11 . 0 6 . 70 44 38 36
Subj ect DP-3 ; 100 mg Dose
0 . 5 6 . 85 6 � 0 8 . 3 5 . 5 1 . 5 6 . 85 900 140 820 3 . 0 6 . 70 611 166 395 6 . 0 6 . 75 289 117 204
11 . 0 6 . 60 180 64 90
80
f:t:�dis:ted Observed (Plasma)
2 . 8 3 . 9 4 . 7 1 . 9 3 . 1
0 . 96 1 . 3 4 . 6 0 . 93 1 . 7
0 . 28 5 . 0 2 . 5 1 . 7 1 . 4
0 . 28 3 . 7 1 . 6 1 . 2 0 . 95 &
0 . 66 5 . 9 2 . 4 1 . 7 1 . 4
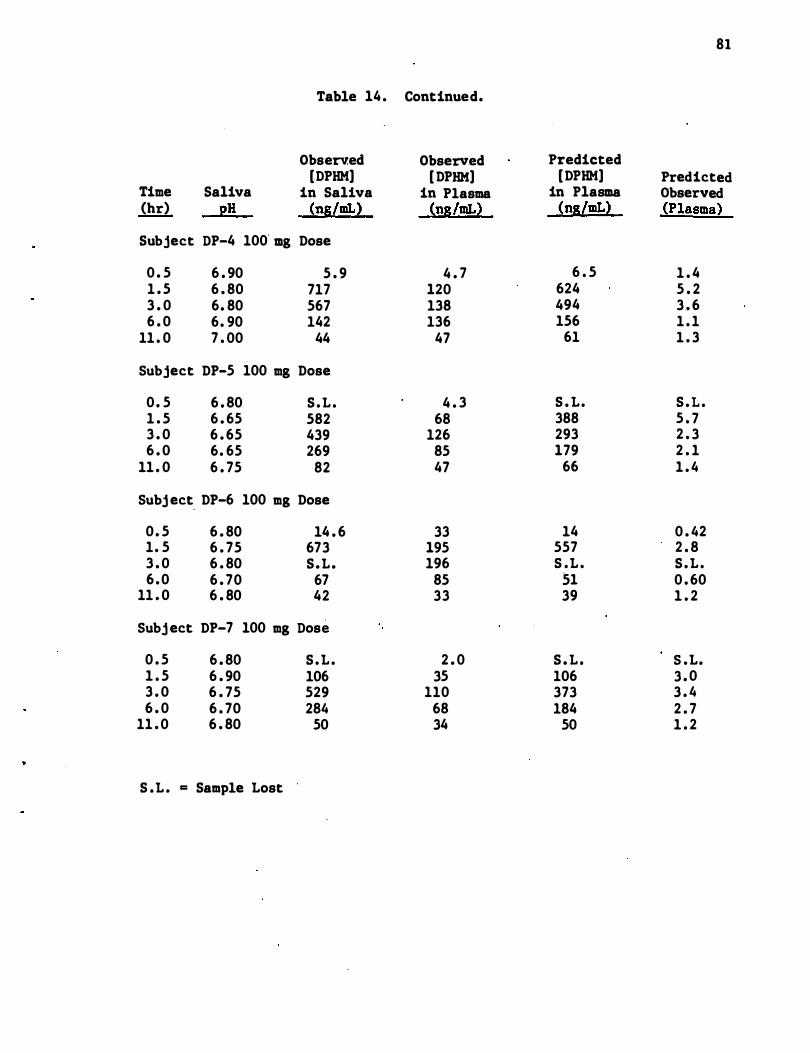
81
Table 14 . Continued.
Observ.ed Observed Predicted [DPHM) [ DPHK) [DPHM) Predicted
Time Saliva in Saliva in Plasma in Plasma Observed (hr) pH (ng/mL) (ng/mL) (ng/mL) (Plasma)
Subject DP-4 100 mg Dose
0 . 5 6 . 90 5 . 9 4 . 7 6 . 5 1 . 4 1 . 5 6 . 80 717 120 624 5 . 2 3 . 0 6. 80 567 138 494 3 . 6 6 . 0 6. 90 142 136 156 1 . 1
11 . 0 7 . 00 44 47 61 1 . 3
Subject DP-5 100 mg Dose
0 . 5 6 . 80 S . L . 4 . 3 S . L . S . L . 1 . 5 6 . 65 582 68 388 5 . 7 3 . 0 6 . 65 439 126 293 2 . 3 6 . 0 6. 65 269 85 179 2 . 1
11 . 0 6 . 75 82 47 66 1 . 4
Subj ect. DP-6 100 mg Dose
0 . 5 6 . 80 14 . 6 33 14 0 . 42 1. 5 6 . 75 673 195 557 2 . 8 3 . 0 6 . 80 S .L . 196 S .L . S . L . 6 . 0 6 . 70 67 85 51 0 . 60
11 . 0 6 . 80 42 33 39 1 . 2
Subj ect DP-7 100 mg Dose
0 . 5 6 . 80 S . L . 2 . 0 S . L . S .L. 1 . 5 6 . 90 106 35 106 3 . 0 3 . 0 6 . 75 529 110 373 3 . 4 6 . 0 6 . 70 284 68 184 2 . 7
11 . 0 6 . 80 50 34 50 1 . 2
S .L . = Sample Lost .
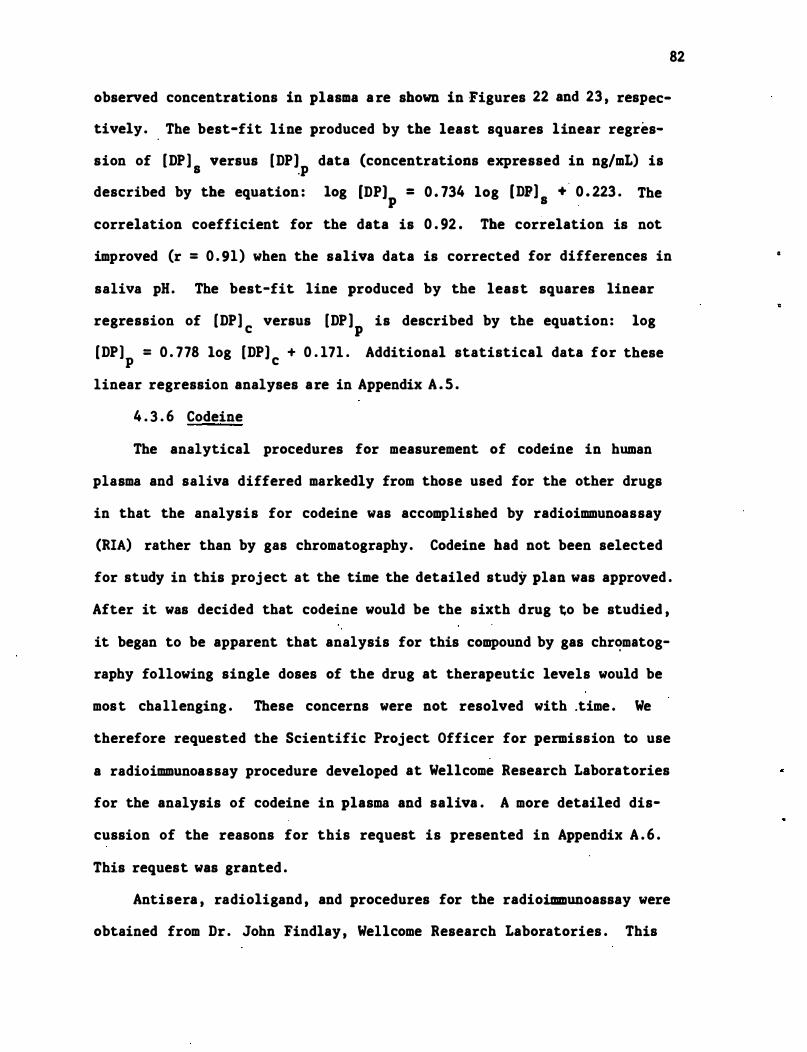
82
observed concentrations in plasma a re shown in Figures 22 and 23 , respec
tively. The best-fit line produced by the least squares linear regres
sion of [DP] versus [DP) data (concentrations expressed in ng/mL) is s .p described by the equation : log [DP) = 0 . 734 log [DP] + ' 0 . 223 . The p s , correlation coefficient for the data is 0 . 92 . The correlation is not
improved (r = 0 . 91) when the saliva data is corrected for differences in
saliva pH. The best-fit line produced by the least squares linear
regression of (DP] versus [DP] is described by the equation: log c p (DP] = 0 . 778 log [DP) + 0 . 171 . Additional statistical data for these p c linear regression analyses are in Appendix A . S .
4 . 3 . 6 Codeine
The analytical procedures for measurement of codeine in human
plasma and saliva differed markedly from those used for the other drugs
in that the analysis for codeine was accomplished by radioimmunoassay
(RIA) rather than by gas chromatography. Codeine had not been selected
for study in this proj ect at the time the detailed study plan was approved .
After it was decided that codeine would be the sixth drug to be studied ,
it began to be apparent that analysis for this compound by gas chr�m8tog
raphy following single doses of the drug at therapeutic levels would be
most challenging . These concerns were not resolved with .time . We
therefore requested the Scientific Project Officer for permission to use
a radioimmunoassay procedure developed at Well come Research Laboratories
for the analysis of codeine in plasma and saliva . A more detailed dis-
cussion of the reasons for this request is presented in Appendix A . 6 .
This request was granted .
Antisera , radioligand , and procedures for the radioimmunoassay were
obtained from Dr . John Findlay , Wellcome Research Laboratories . This
•
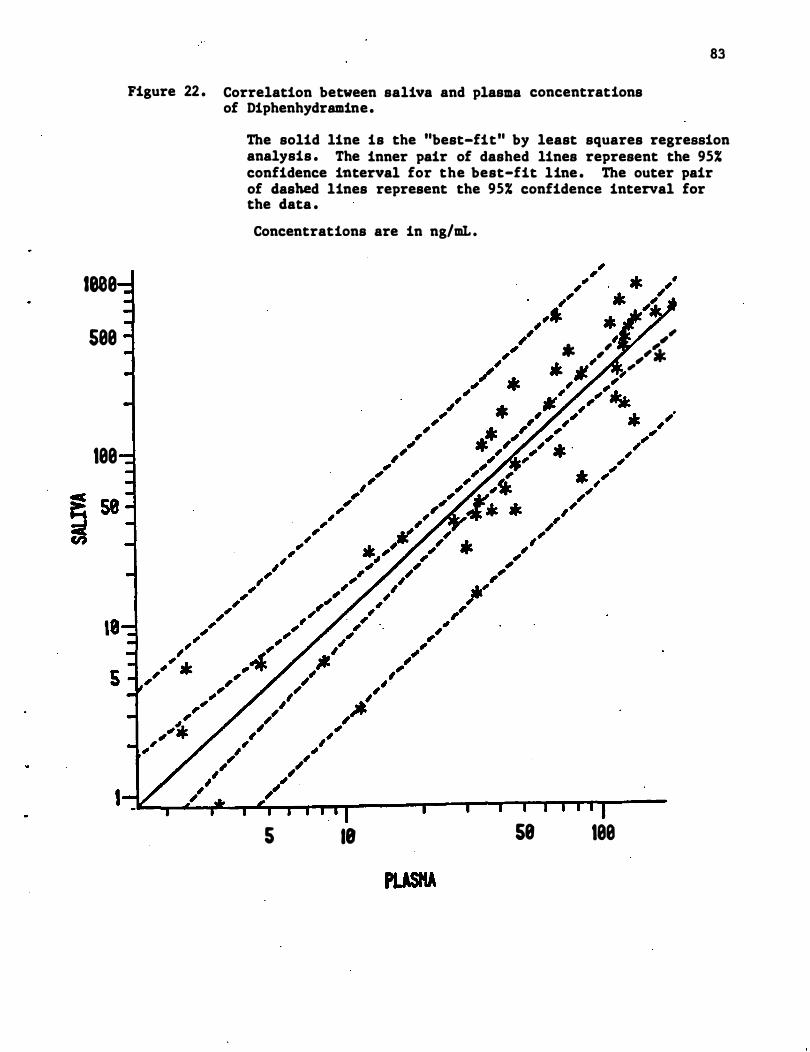
1808
588
188
Figure 22 . Correlation between saliva and plasma concentrations of Diphenhydramine.
83
The solid line is the "best-fit" by least squares regression analysis . The inner pair of dashed lines represent the 95% confidence interval for the best-fit line . The outer pair of dashed lines represent the 95% confidence interval for the data .
Concentrations are in ng/mL .
5 18 58
, ,," * ' ', ,,". . .11' , II- ,,�
188
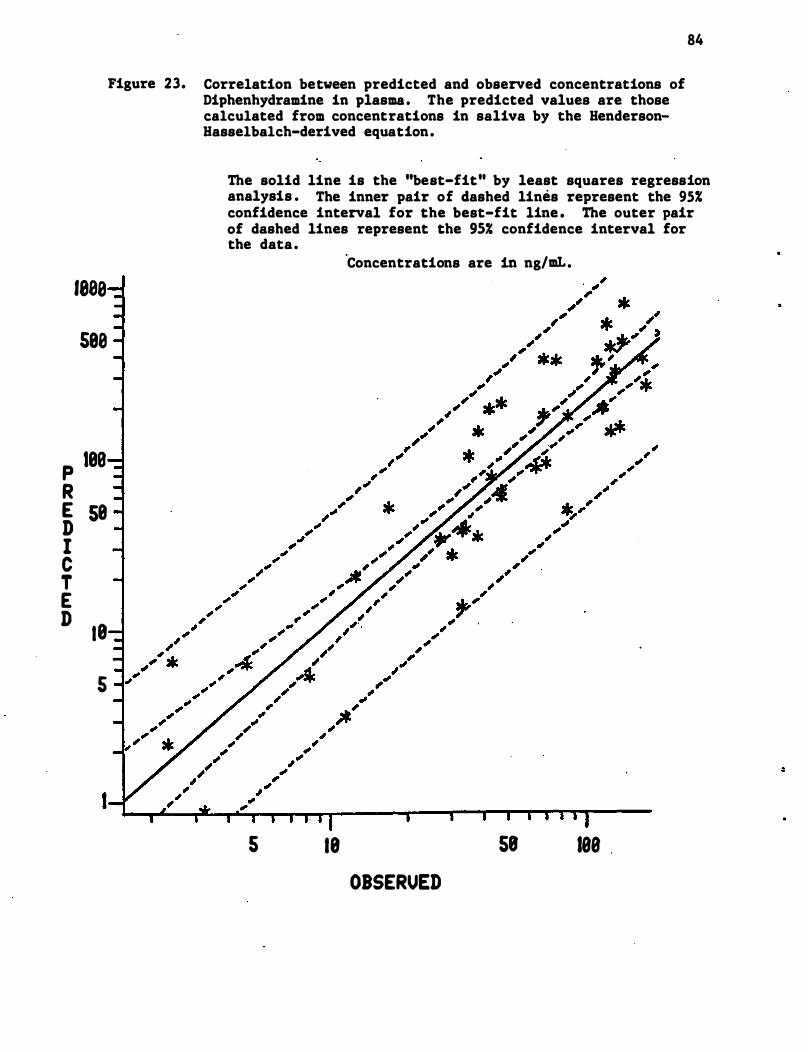
1888
5e8
p lee R E 5e D I C T E D
18
5
I
Figure 23. Correlation between predicted and observed concentrations of Diphenhydramine in plasma. The predicted values are those calculated from concentrations in saliva by the BendersonBasselbalch-derived equation.
84
The solid line is the "best-fit" by least squares regression analysis . The inner pair of dashed lines represent the 95% confidence interval for the best-fit line . The outer pair of dashed lines represent the 95% confidence interval for the data .
'Concentrations are in ng/mI..
5 18 58 188 OBSERUED
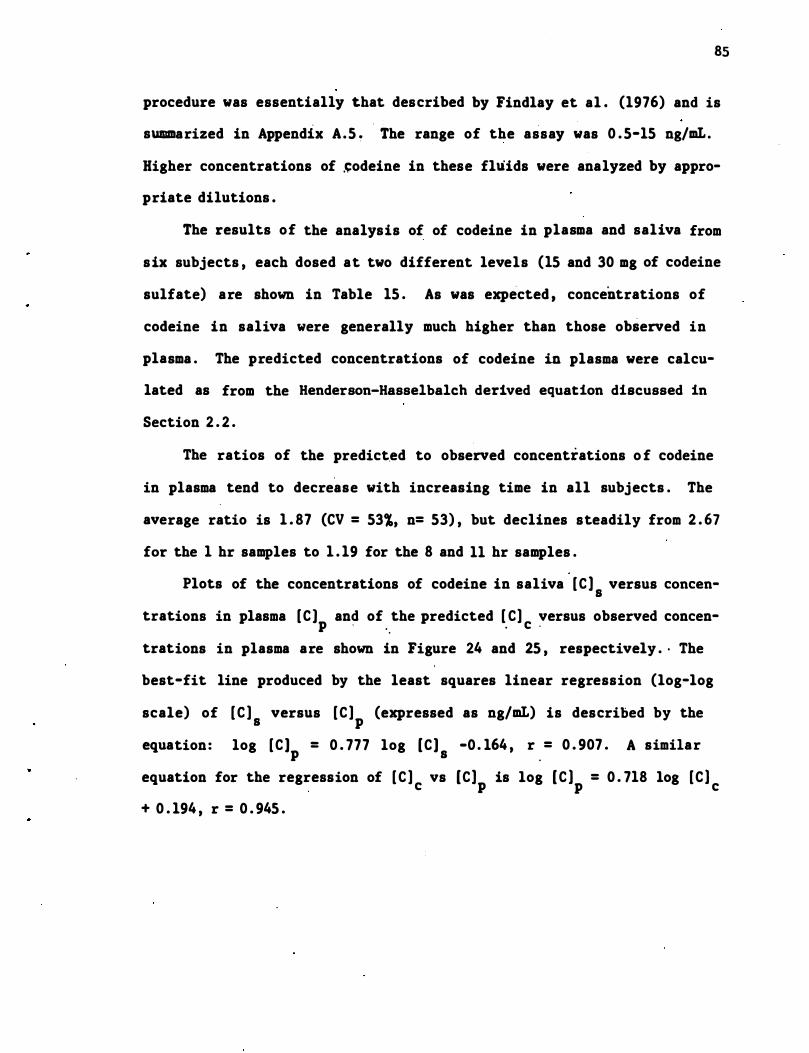
85
procedure was essentially that described by Findlay et al e (1976) and is
summarized in Appendix A.5 ! The range of the assay was 0 . 5-15 ng/mL.
Higher concentrations of �odeine in these fluids were analyzed by appro
priate dilutions .
The results of the analysis of of codeine in plasma and saliva from
six subjects , each dosed at two different levels (15 and 30 mg of codeine
sulfate) are shown in Table 15 . As was expected , concentrations of
codeine in saliva were generally much higher than those observed in
plasma . The predicted concentrations of codeine in plasma were calcu-
lated as from the Henderson-Hasse1ba1ch derived equation discussed in
Section 2 . 2 .
The ratios of the predicted to observed concentrations o f codeine
in plasma tend to decrease with increasing time in all subjects . The
average ratio is 1 . 87 (CV = 53�, n= 53) , but declines steadily from 2 . 67
for the 1 hr samples to 1 . 19 for the 8 and 11 hr samples .
Plots of the concentrations of codeine in saliva [C l s versus concen
trations in plasma [C ) and of the predicted [ C] versus observed concen-p . ' . . c · trations in plasma are shown in Figure 24 and 25 , respectively . · The
best-fit line produced by the least squares linear regression (log-log
scale) of [ C ] s versus [C ]p (expressed as ng/mL) is described by the
equation: log [C ) = 0 . 777 log [C) -0 . 164 , r = 0 . 907 . A similar p s . equation for the regression of [ C ] vs [Cl is log [C ) = 0 . 718 log [C ) c p p c + 0 . 194 , r = 0 . 945 .
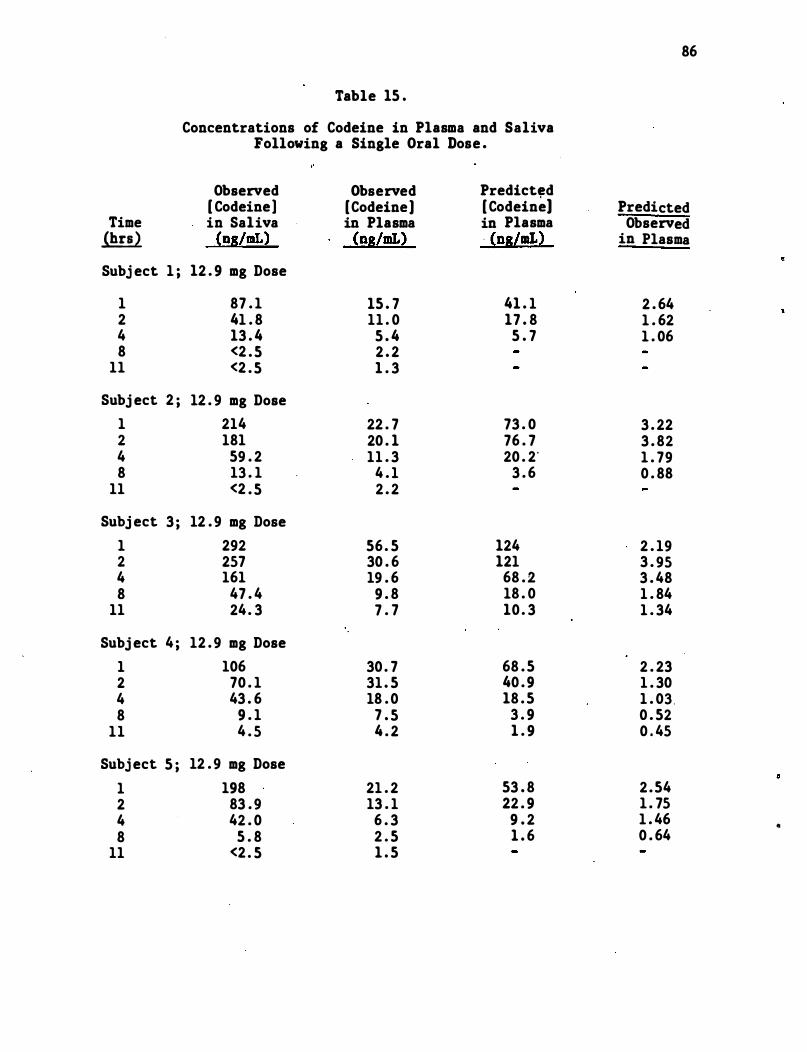
86
Table 15 .
Concentrations of Codeine in Plasma and Saliva Following a Single Oral Dose .
Observed Observed Predict,d [ Codeine] [Codeine) [ Codeine] Predicted
Time in Saliva in Plasma in Plasma Observed ili:!l (ng/DIL) (ng/DIL) . (ns/DIL) in Plasma
Subj ect 1 ; 12 . 9 mg Dose
1 87 . 1 15 . 7 41 . 1 2 . 64 2 41 . 8 11 . 0 17 . 8 1 . 62 4 13 . 4 5 . 4 5 . 7 1 . 06 8 <2 . 5 2 . 2
11 <2 . 5 1 . 3
Subj ect 2 ; 12 . 9 mg Dose 1 214 22 . 7 73 . 0 3 . 22 2 181 20 . 1 76 . 7 3 . 82 4 59 . 2 11 . 3 20 . 2' 1 . 79 8 13 . 1 4 . 1 3 . 6 0 . 88
11 <2 . 5 2 . 2
Subj ect 3 ; 12 . 9 mg Dose 1 292 56 . 5 124 2 . 19 2 257 30 . 6 121 3 . 95 4 161 19 . 6 68 . 2 3 . 48 8 47 . 4 9 . 8 18 . 0 1 . 84
11 24. 3 7 . 7 10 . 3 1 . 34
Subj ect 4 ; 12 . 9 mg Dose 1 106 30 . 7 68 . 5 2 . 23 2 70 . 1 31 . 5 40 . 9 1 . 30 4 43 . 6 18 . 0 18 . 5 1 . 03 . 8 9 . 1 7 . 5 3 . 9 0 . 52
11 4 . 5 4 . 2 1 . 9 0 . 45
Subj ect 5 ; 12 . 9 mg Dose 1 198 21 . 2 53 . 8 2 .54 2 83 . 9 13 . 1 22 . 9 1 . 75 4 42 . 0 6 . 3 9 . 2 1 . 46 e 8 5 . 8 2 . 5 1 . 6 0 . 64
11 <2 . 5 1 . 5
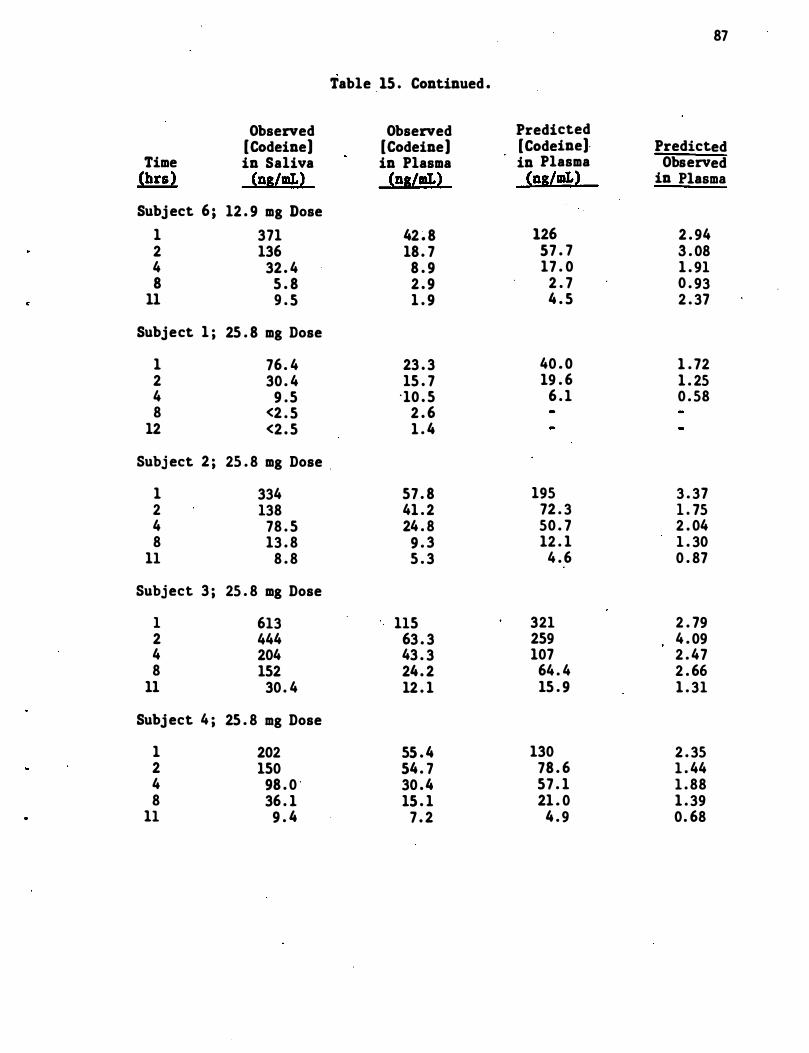
87
Table 15 . Continued .
Observed Observed Predicted [Codeine] [Codeine] [Codeine]. Predicted
Time in Saliva in Plasma in Plasma Observed (brs) (ns/IIL) (ns/IIL) (ns/IIL) in Plasma
Subj ect 6 ; 12 . 9 mg Dose 1 371 42 � 8 126 2 . 94 2 136 18 . 7 57 . 7 3 . 08 4 32 . 4 8 . 9 17 . 0 1 . 91 8 5 . 8 2 . 9 2 . 7 0 . 93
11 9 . 5 1 . 9 4 . 5 2 . 37
Subject 1 ; 25 . 8 mg Dose
1 76 . 4 23 . 3 40 . 0 1 . 72 2 30 . 4 15 . 7 19 . 6 1 . 25 4 9 . 5 "10 . 5 6 . 1 0 . 58 8 <2 . 5 2 . 6
12 <2 . 5 1 . 4
Subj ect 2 ; 25 . 8 mg Dose .
1 334 57 . 8 195 3 . 37 2 138 41 . 2 72 . 3 1 . 75 4 78 . 5 24 . 8 50 . 7 2 . 04 8 13 . 8 9 . 3 12 . 1 1 . 30
11 8 . 8 5 . 3 4 . 6 0 . 87
Subject 3 ; 25 . 8 mg Dose
1 613 115 321 2 . 79 2 444 63 . 3 259 4 . 09 4 204 43 . 3 107 2 . 47 8 152 24 . 2 64 . 4 2 . 66
11 30 . 4 12 . 1 15 . 9 1 . 31
Subj ect 4 ; 25 . 8 mg Dose
1 202 55 . 4 130 2 . 35 2 150 54 . 7 78 . 6 1 . 44 4 98 . 0 ' 30 .4 57 . 1 1 . 88 8 36 . 1 15 . 1 21 . 0 1 . 39
11 9 . 4 7 . 2 4 . 9 0. 68
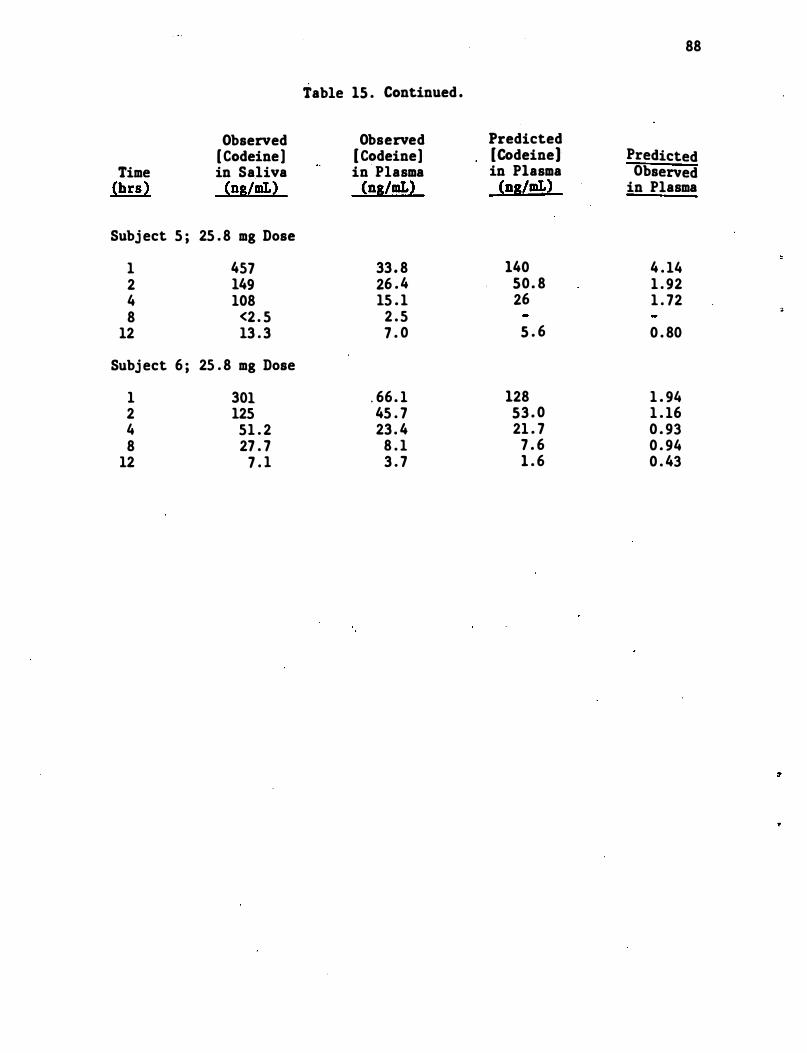
88
Table 15 . Continued .
Observed Observed Predicted [ Codeine] [ Codeine] [Codeine] Predicted
Time in Saliva in Plasma in Plasma Observed (bra) (ns/mL) (ns/mL) (ns/mL) in Plasma
Subj ect 5 ; 25 . 8 mg Dose
1 457 33 . 8 140 4 . 14 2 149 26 . 4 50 . 8 1 . 92 4 108 15 . 1 26 1 . 72 8 <2 . 5 2 . 5 �
12 13 . 3 7 . 0 5 . 6 0 . 80
Subj ect 6 ; 25 . 8 mg Dose
1 301 . 66 . 1 128 1 . 94 2 125 45 . 7 53 . 0 1 . 16 4 51 . 2 23 . 4 21 . 7 0 . 93 8 27 . 7 8 . 1 7 . 6 0 . 94
12 7 . 1 3 . 7 1 . 6 0 . 43
4 . 4 Use of Creatinine Concentrations in Saliva as an Aid in
Establishing Correlations of Concentrations of Amphetamine
in Plasma and Saliva
Creatinine levels in the saliva samples from su�jects A2 and A6
following administration of 0 . 122 mg/kg of amphetamine and from subject
A4 following the administration of 0 . 061 mg/kg of amphetamine were
determined using the methods described in section 4 . 5 . These samples
were chosen because they have amphetamine concentrations from which
calculations of plasma amphetamine levels were higher than (subject A2) ,
lower than (subject A4) , and approximately the same (subject A6) as that
actually found .
Plots of the predicted/found amphetamine plasma levels (P-F ratio)
and creatinine saliva levels for these subjects are contained in Figures
26 , 27 .and 28 . It can be seen from the plots that subj ect A4 , who has
low P-F ratios , also has relatively low creatinine levels . Subject A2 ,
who has high P-F ratios , also has relatively high creatinine levels .
Subj ect A6 has intermediate values of both P-F ratios and creatine
levels . Quantitative corrections of the P-F ratios using the plasma
creatinine levels were , however , not possible . For instance , the saliva
creatinine levels for subject A2 were lowest when the P-F �atios were ·
the highest . At other times , the two curves were almost parallel .
Thus , while some correction of the P-F ratios can be made using saliva
creatinine levels , these corrections are not sufficiently good to pro
vide quantitative relationships .
4 . 5 Analysis of Drugs in Breath
It was agre.ed by personnel at DOT , RTI , and NIDA that the drugs
most likely to be excreted in breath were secobarbital and amphetamine .
89
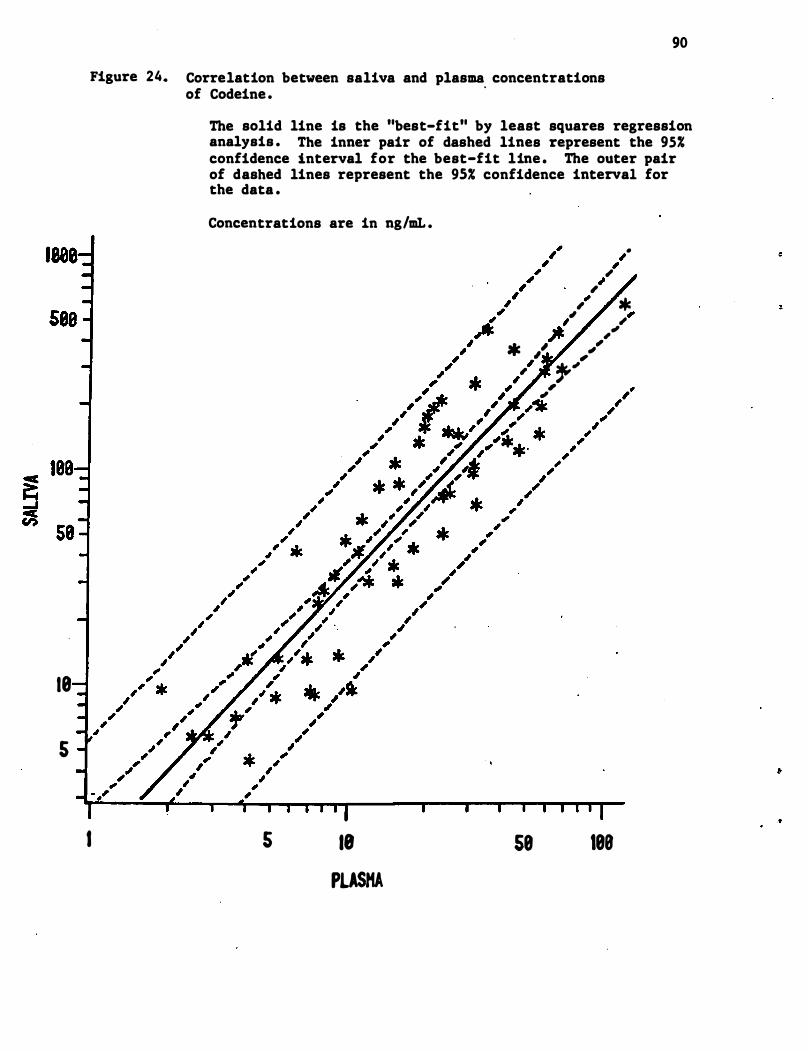
18
s
90
Figure 24. Correlation between saliva and plasma concentrations
I
of Codeine . .
The solid line is the "best-fit" by least squares regression analysis . The inner pair of dashed lines represent the 95% confidence interval for the best-fit line . The outer pair of dashed lines represent the 95% confidence interval for the data .
Concentrations are in ng/mL .
s 18
PLASMA
• ,
""
" * , " .' ,
� , * ,' ,,,, " �" , ,
58 188
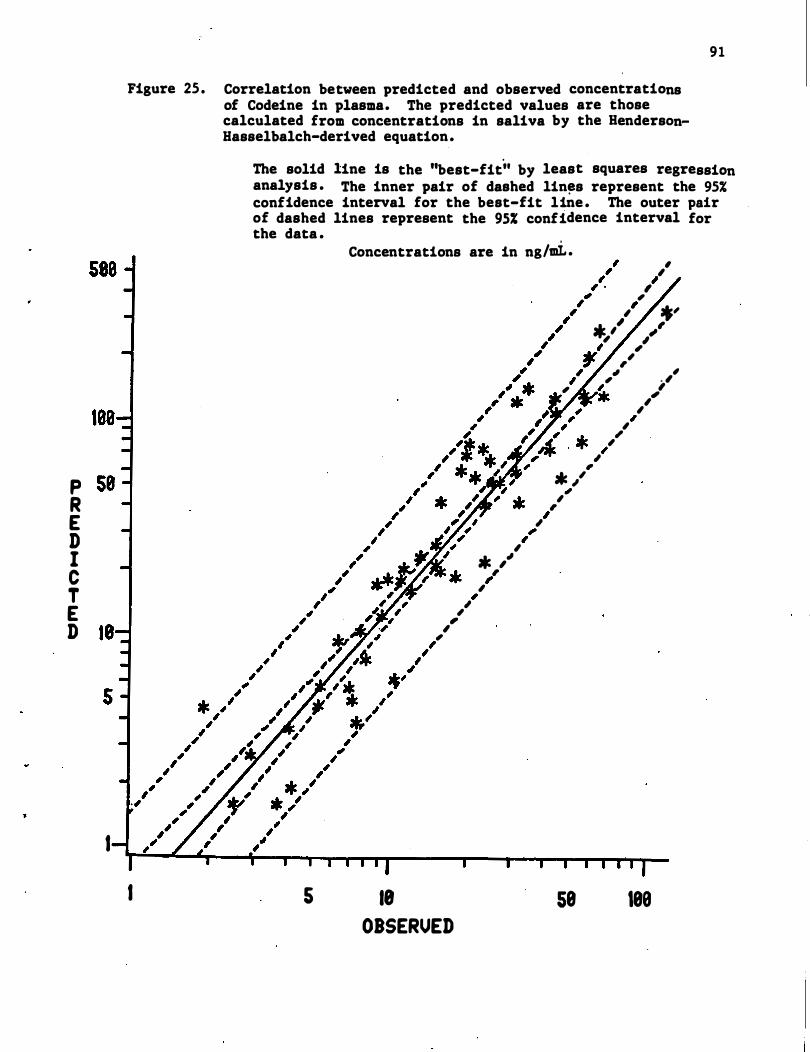
P R E D I C T E D
I
91
Figure 25 . Correlation between predicted and observed concentrations of Codeine in plasma. The predicted values are those calculated from concentrations in saliva by the HendersonBasselbalch-derived equation.
I
The solid line is the ''best-fit'' by least squares regression analysis . The inner pair of dashed lin�s represent the 95% confidence interval for the best-fit line . The outer pair of dashed lines represent the 95% confidence interval for the data .
5
Concentrations are in ng/mi . ,
",
, , , * " ,
,,' , , ,
,
*, �, , ,
, ;'
,� ,
, , , ,
18
OBSERVED
"
" , ;Jr. ," "
,
" ,
;Jr. " "
",
58
,
* " �
",
189
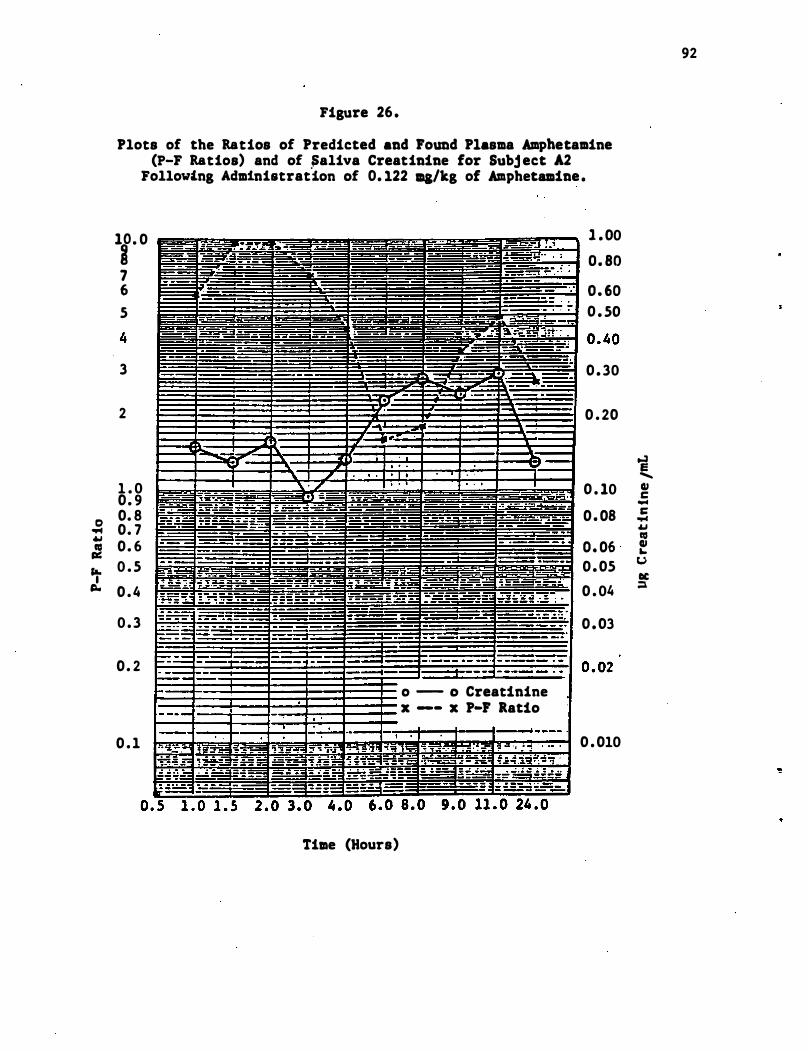
Figure 26 .
Plots of the Ratios of Predicted and Found Plasma Amphetamine (P-F Ratios) and of �aliva Creatinine for Subj ect A2
Following Adm1nistrat"1on of 0. 122 ma/kg of Amphetamine .
11 . 0 1 . 00
� 1IIIIililllilll_iilllll� :::: 5 0 . 50
3 0 . 30
2 0 . 20
i .......
1 . 0 0 . 9
o 0. 8 .. 0. 7 oW : 0. 6 ra. 0 . 5 ,L
1IIIIIIIIIIIIIIIIIIIIIIIIiillllllillili 0 . 10 �
:::: i 0 . 05 u
tIC 0 . 4
0 . 3
0 . 2
0 . 1
Tille (Hours)
o --- 0 Creatinine x --- x P-F Ratio
0 . 04
0 . 03
0 . 010
::1
92
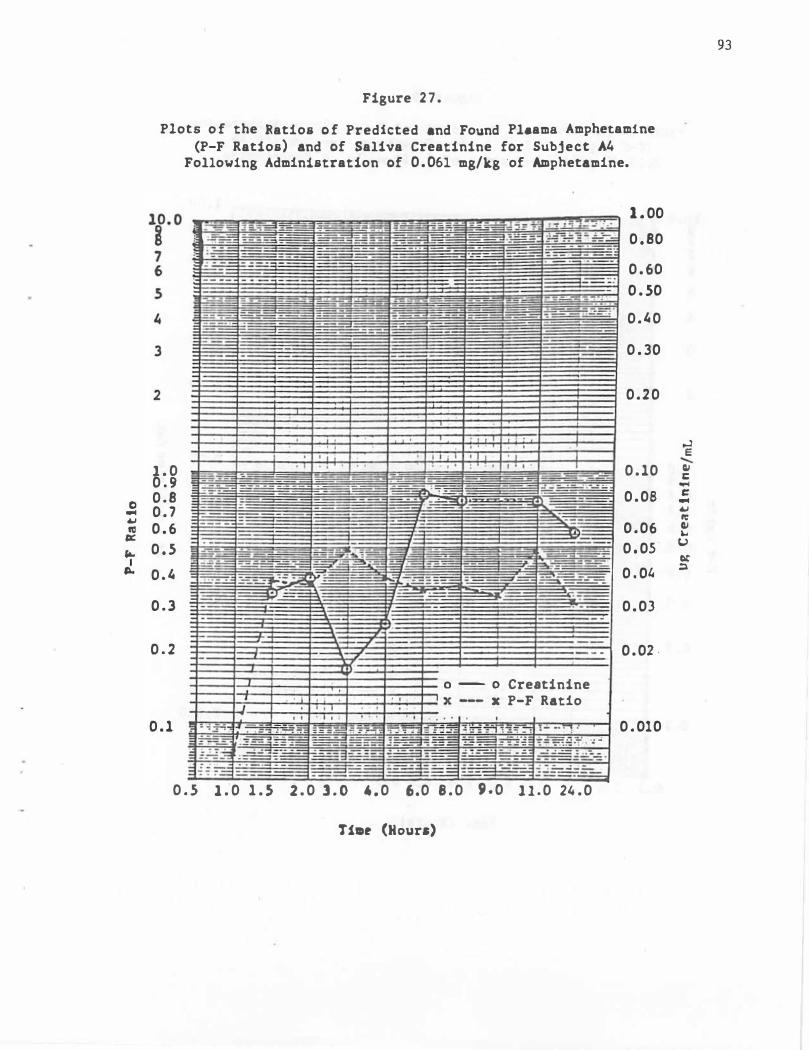
0 -� •
" ...
I ..
Figure 2 7 .
Plots o f the Ratios o f Predicted and Found PI.ama Amphetamine (P-F Ratios) and of Saliva Creatinine for Subject A4
Following Administration of 0 . 061 mg/kg 'of Amphetamine.
1 . 00
0 . 80
0 . 60
0 . 50
0 . ' 0
0 . 30
0 . 2 0
"
1 . 0 0 . 10 0 . 9 0 . 8 0 . 08 0 . 7
0 . 6 0 . 06
0 . 5 0 . 05
0 . ' 0 . 0'
0 . 3 0 . 03
0 . 2 0 . 02 ·
0 - 0 Creatinine x P-F Ratio
0 . 1 0 . 010
0 . 5 1 . 0 1 . 5 2 . 0 l . O 4 . 0 6.0 8 . 0 9 . 0 1 1 . 0 2' . 0
TilDe (Hours)
93
.., e �
• c -c -� • • "
u " "
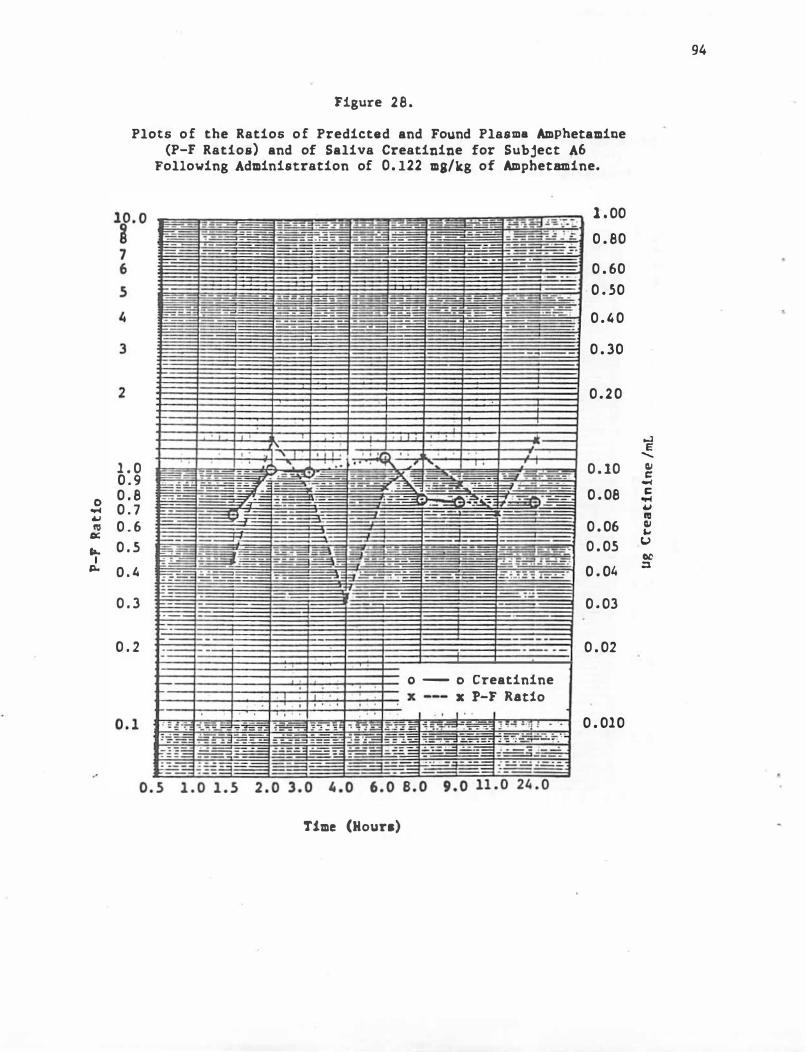
0 � � �
'"
.. I
"-
Figure 28.
Plots of the Ratios of Predicted and Found Plasma Amphetamine (P-F Ratios) and of Saliva Creatinine for Subject A6
Following Administration of 0. 122 ma/kg of Amphetamine.
1 . 00
0 . 80
0 . 60
· 0 . 50
0 . ' 0
0 . 30
0.20
1 . 0 0 . 9
0 . 10
0 . 8 0 . 08 0 . 7 0 . 6 0 . 06
0 . 5 0 . 05
D . ' 0 . 0'
0 . 3 0 . 03
0 . 2 0 . 02
a - 0 Creatinine x P-F R.a.t1o
0 . 010
Time (Hour.)
94
-' E
-• •
-• � � � • �
u " "
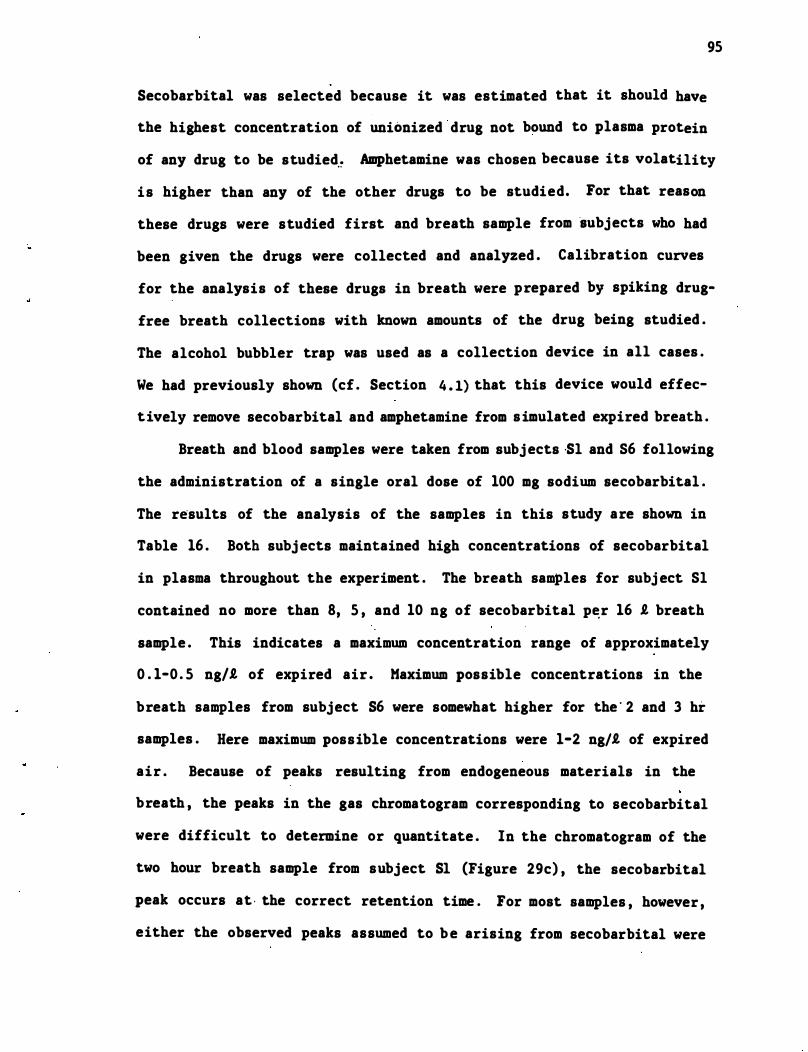
95
Secobarbital was selected because it was estimated that it should have
the highest concentration of unionized drug not bound to plasma protein
of any drug to be studied"� Amphetamine was chosen because its volatility
is higher than any of the other drugs to be studied. For that reason
these drugs were studied first and breath sample from subjects who had
been given the drugs were collected and analyzed . Calibration curves
for the analysis of these drugs in breath were prepared by spiking drug
free breath collections with known amounts of the drug being studied .
The alcohol bubbler trap was used as a collection device in all cases .
We had previously shown (cf . Section 4 . 1) that this device would effec
tively remove secobarbital and amphetamine from s imulated expired breath .
Breath and blood samples were taken from subj ects "Sl and S6 following
the administration of a single oral dose of 100 mg sodium secobarbital .
The results of the analysis of the samples in this study are shown in
Table 16 . Both subj ects maintained high concentrations of secobarbital
in plasma throughout the experiment . The breath samples for subj ect Sl
contained no more than 8, 5 , and 10 ng of secobarbital p�r 16 t breath
sample . This indicates a maximum concentration range of approximately
0 . 1-0 . 5 ng/t of expired air . Maximum possible concentrations in the
breath samples from subject S6 were somewhat higher for the " 2 and 3 hr
samples . Here maximum possible concentrations were 1-2 ng/t of expired
air . Because of peaks resulting from endogeneous materials in the
breath , the peaks in the gas chromatogram corresponding to secobarbital
were difficult to determine or quantitate . In the chromatogram of the
two hour breath sample from subject Sl (Figure 29c) , the secobarbital
peak occurs at · the correct retention time . For most samples , however ,
either the observed peaks assumed to b e arising from secobarbital were
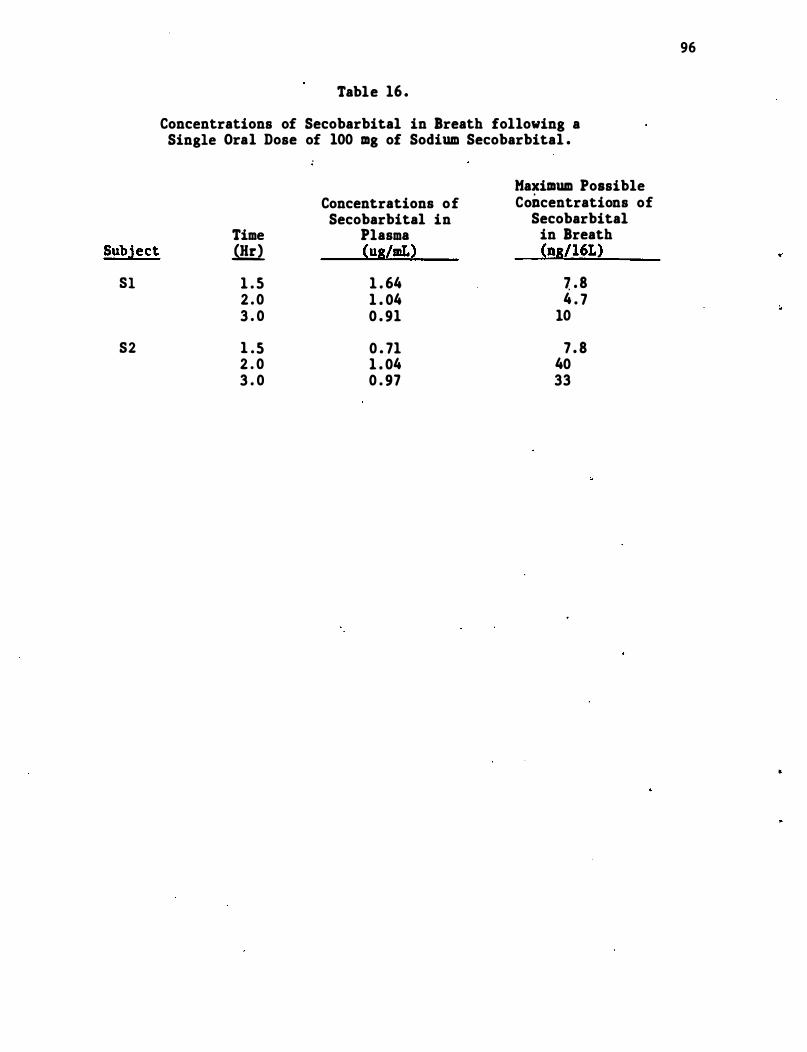
Subject
Sl
S2
Table 16 .
Concentrations of Secobarbital in Breath following a Single Oral Dose of 100 mg of Sodium Secobarbital .
Maximum Possible Concentrations of Concentrations of
Secobarbital in Secobarbital Time Plasma in Breath .QW. (U8/mL) (n8/l6L)
1 . 5 1 . 64 � . 8 2 . 0 1 . 04 4 . 7 3 . 0 0 . 91 10
1 . 5 0 . 71 7 . 8 2 . 0 1 . 04 40 3 . 0 0 . 97 33
96
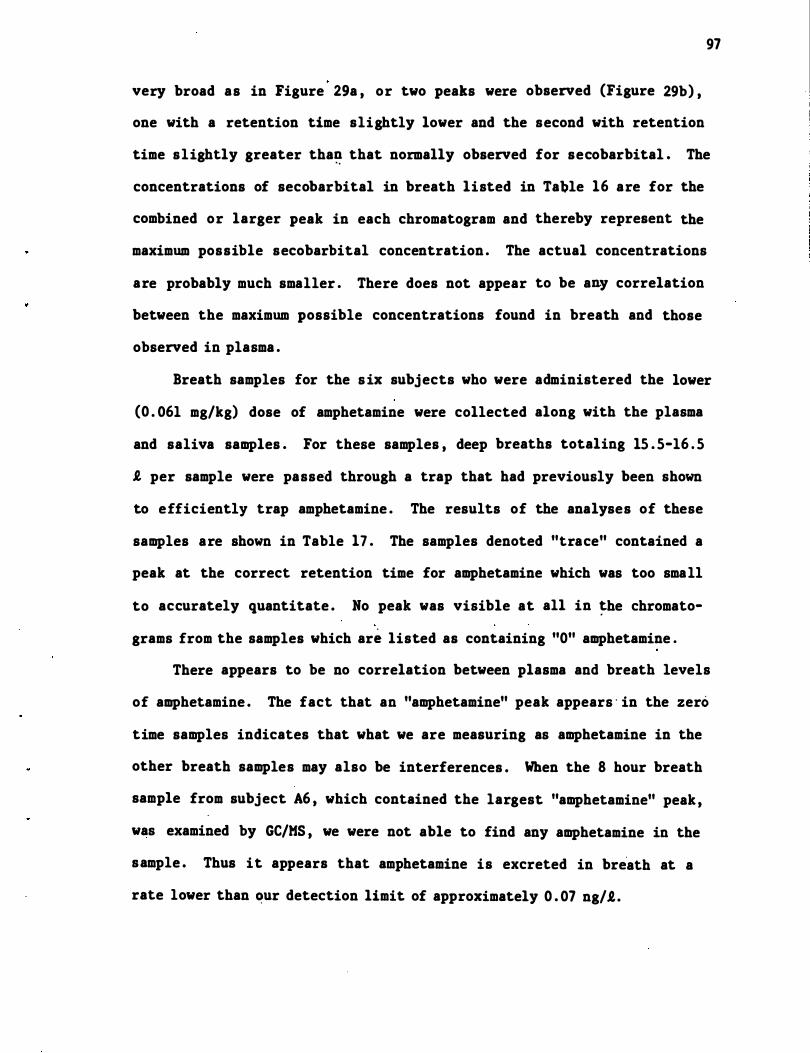
97
very broad as in Figure 29a , or two peaks were observed (Figure 29b) ,
one with a retention time slightly lower and the second with retention
time slightly greater tha� that normally observed for secobarbital . The
concentrations of secobarbital in breath listed in Ta�le 16 are for the
combined or larger peak in each chromatogram and thereby represent the
maximum possible secobarbital concentration . The actual concentrations
are probably much smaller . There does not appear to be any correlation
between the maximum possible concentrations found in breath and those
observed in plasma .
Breath samples for the s ix subjects who were administered the lower
(0 . 061 mg/kg) dose of amphetamine were collected along with the plasma
and saliva samples . For these samples , deep breaths totaling 15 . 5-16 . 5
I, per sample were passed through a trap that had previously been shown
to efficiently trap amphetamine . The results of the analyses of these
samples are shown in Table 17 . The samples denoted "trace" contained a
peak at the correct retention time for amphetamine which was too small
to accurately quantitate . No peak was visible at all in �he chromato
grams from the samples which are listed as containing "0" amphetamine .
There appears to be no correlation between plasma and breath levels
of amphetamine . The fact that an "amphetamine" peak appears · in the zero
time samples indicates that what we are measuring as amphetamine in the
other breath samples may also be interferences . When the 8 hour breath
sample from subject A6 , which contained the largest "amphetamine" peak ,
was examined by GC/MS , we were not able to find any amphetamine in the
sample . Thus it appears that amphetamine is excreted in bre"ath at a
rate lower than �ur detection limit of approximately 0 . 07 ng/R.. .
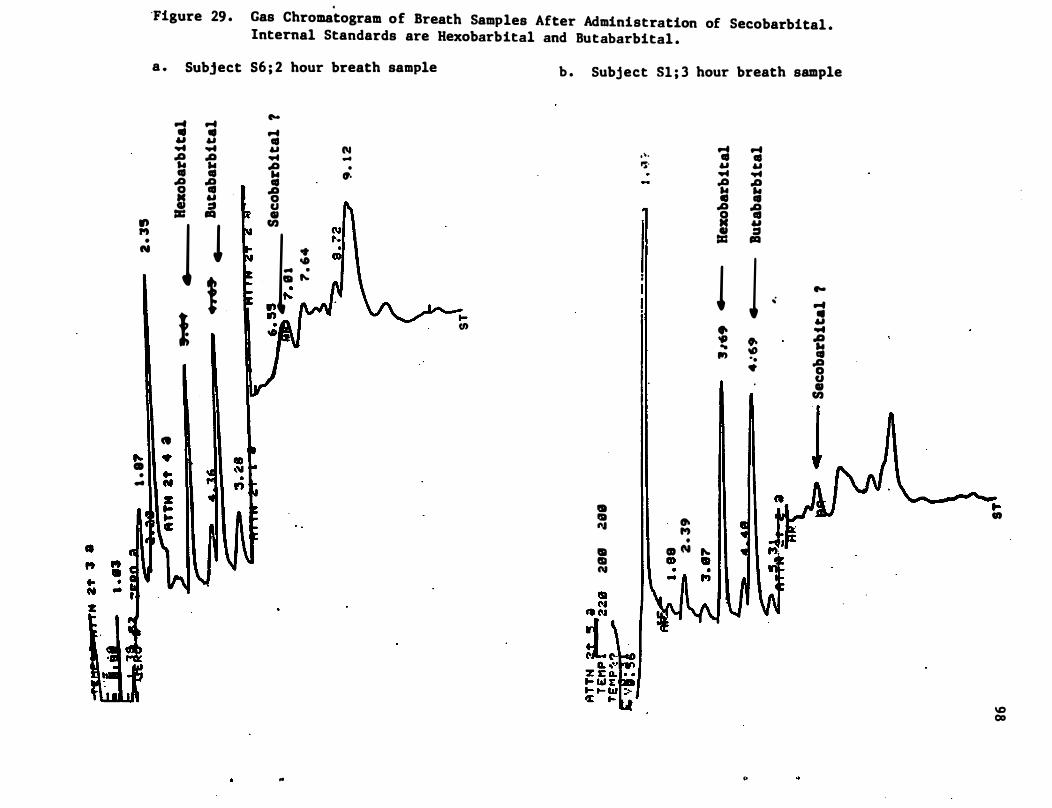
. "Figure 29 . Gas Chromatogram of Breath Samples After Administration of Secobarbital .
Internal Standards are Hexobarbital and Butabarbital .
a .
., ,., • N
• � 1I . CD • .. 1 1
Subject S6 ; 2 hour breath sample
... ... It It 61 61 .... .... A A ... .. co co .a � 0 &1 ...
i :a
1 l ! f
11 4 1 •• .It
I'oe
... co 61 .... .a ... co A 0 Col CI en
I ·
-0 ... . . ....
�� , -
..
N ... . ".
- '-""'" t-(/)
b . Subject 51 ; 3 hour breath sample
.'. 'S"
I I .. I» ....
.. I I CIa N
� ,., •
CD N "-a» ..
... co 61 .... -e ., .a ! 1 .. ." .. ."
II
... co 61 ....
� � 61 :::t III
1 I'oe .; ... ..
61 .... .. -e ID co -. .g •
CI CI en
I I UJJ
..
� .,
\C 00
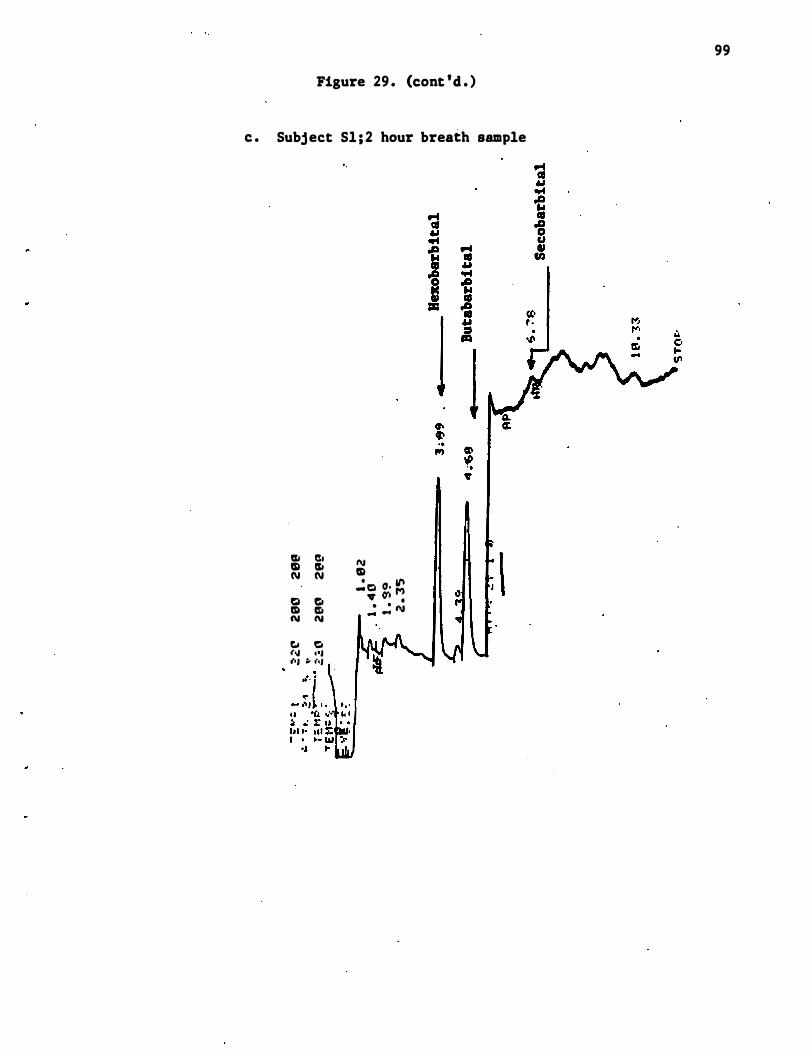
Figure 29 . (cont 'd . )
c . Subject Sl ; 2 hour breath sample
lSI C!I m lSI N N
� CI m It! N N
t.I 1:1 (oJ " 1 (oj � (.,
N m
• &I' - 1:1 0, ,., ., 0"1 . "= ': 1\1
" , \
99
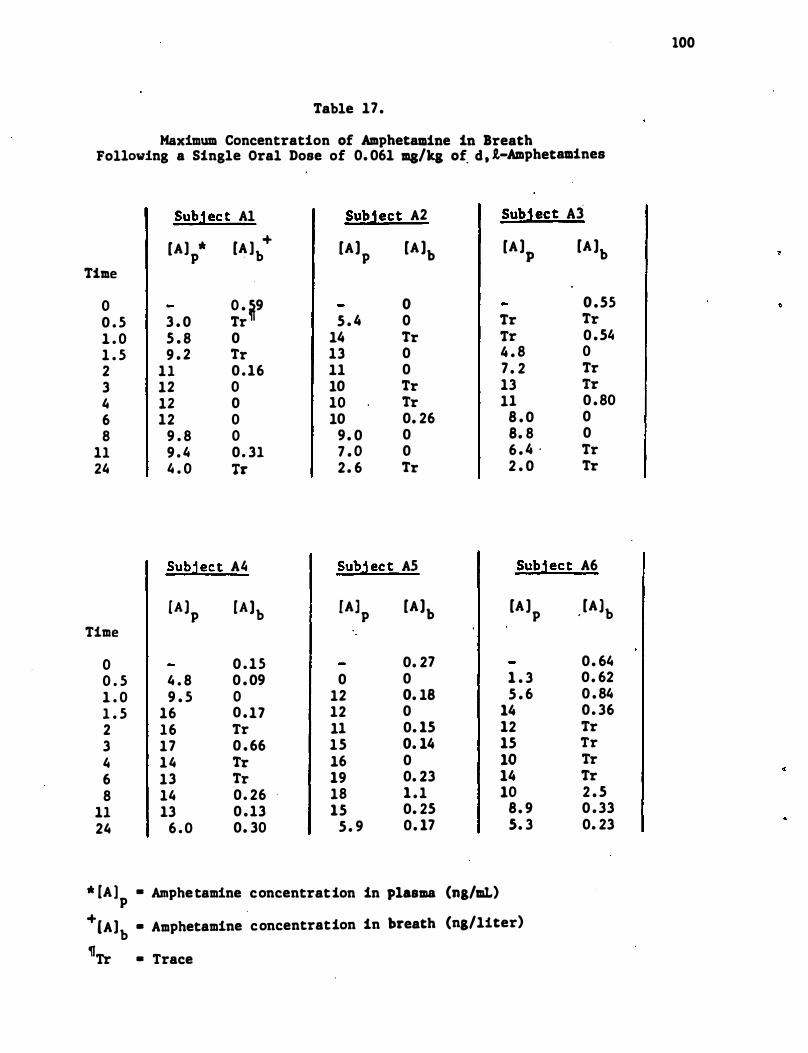
Table 17.
Maximum Concentration of Amphetamine in Breath Following a Single Oral Dose of 0. 061 malta of d , l-Amphetamines
Subj ect Al Subject A2
[A] * p [A ] + · b [Al
p [A lb
Time
0 0 . �9 0 0 . 5 3 . 0 Tr 5 . 4 0 1 . 0 5 . 8 0 14 Tr 1 . 5 9 . 2 Tr 13 0 2 11 0 . 16 11 0 3 12 0 10 Tr 4 12 0 10 Tr 6 12 0 10 0. 26 8 9 . 8 0 9 . 0 0
11 9 . 4 0 . 31 7 . 0 0 24 4 . 0 Tr 2 . 6 Tr
Subj ect A� Subj ec t AS
CAl p [Alb fA] p [Al
b Time
0 0 . 15 0. 27 0 . 5 4 . 8 0 . 09 0 0 1 . 0 9 . 5 0 12 0. 18 1 . 5 16 0 . 17 12 0 2 16 Tr 11 0. 15 3 17 0 . 66 15 0. 14 4 14 Tr 16 0 6 13 Tr 19 0. 23 8 14 0 . 26 18 1 . 1
11 13 0 . 13 15 0. 25 24 6 . 0 0. 30 5 . 9 0. 17
* [A ) • Amphetamine concentration in plasma (ng/aL) p
Subject A3
[A lp [A lb
0 . 55 Tr Tr Tr 0 . 5� 4 . 8 0 7 . 2 Tr 13 Tr 11 0 . 80
8 . 0 0 8. 8 0 6 . 4 . Tr 2 . 0 Tr
Subject A6
[A J p , [Alb
0. 64 1 . 3 0. 62 5 . 6 0 . 84
14 0. 36 12 Tr 15 Tr 10 Tr 14 Tr 10 2 . 5
8. 9 0 . 33 S. 3 0. 23
+ .
[A]b • Amphetamine concentration in breath (ng/1iter) �
Tr • Trace
100
101
Since the presence of the drUgs studied in breath was very question
able and no correlation could be established between concentrationi of
these drugs in plasma and .. the maximum possible concentraiions in breath ,
it was decided by the Scientific Project Officer, DOT, that efforts
directed toward analysis of drugs in breath in this proj ect would be
discontinued .
102
5 . 0 Discussion
5 . 1 Assay Methodologies
In this program , pro�edures which can �e used for routine. assays of
saliva samples containing secobarbital , amphetamine , chlorpromazine , and
diphenhydramine were developed . The same general chroma tographic methods
were used for secobarbital , chlorpromazine , diazepam , and diphenhydramine .
Thus , one gas chromatograph could be set up to analyze sa�les for these
drugs interchangeably. Since the drugs studied in this proj ect are each
members of larger classes of similar drugs the assays which. were devel
oped should easily be expanded to include many other similar compounds .
This may be particularly true of the analysis of secobarbital , since
several other barbiturates are also widely used .
Codeine was measured in saliva samples by an assay that is quite
specific for this compound . Radioimmunoassays , while much cheaper , more
specific , easier to run , and requiring much less sample , are u�ually
developed to measure only a single compound . A radioimmunoassay , simi
lar to the one for codeine , has been developed for measurement of mor
phine in plasma [Findlay et al . , (1978) ] and should easily be adapted
for the measurement of morphine in saliva .
Measurement of diazepam in saliva is feas ible by the methodology
that we developed . However , routine measurements of therapeutic and
subtherapeutic levels of this compound in saliva will be quite time
consuming and expensive using these methods . We suggest that if large
numbers of samples are to be assayed that a radioimmunoassay for this
compound be considered . It is anticipated that in several years addi
tional stationary phases will be available in capillary GC columns .
Modifications of our procedures for use on these columns may considerably
enhance the usefulness of the methods that were developed for diazepam.
e
..
103
The methodologies developed in our program provide for collection
of samples at the roadside , but with analyses being conducted in a
laboratory. The �ollecti.on device developed . for saliva (treated vial)
is relatively inexpensive and simple to use . No sp�cial · precautions
need to be taken by the operational personnel for its use . It is neces
sary, however , in order to obtain adequate correlations between con
centrations in saliva and in plasma of some of . the drugs , for the pH of
the saliva to be accurately determined . This can only be accomplished
immediately after the saliva is collected , since the pH of saliva can
change with storage . It was not determined in our study whether the use
of pH paper would suffice for this measurement . Our general laboratory
practice , which was used in this program, is to stor,e all biological
samples at -20oe . The ·stability of the drugs in saliva at higher tem
peratu�es was not investigated .
The laboratory procedures involve equipment that is not portable
except in mobile laboratory trailers . The extractions or analyses of
these samples by field personnel who are not highly trained in the
procedures does not appear to be feasible .
Several problems have appeared during the collection and analysis
of saliva from the subj ects in this study which are likely to be more ·
severe in less controlled populations . The first of these problems
occurred during the study of the effect of stimulation and suppression
of saliva flow upon the concentrations of drugs and saliva and plasma .
Simply stated , when saliva flow is suppressed , it is difficult to obtain
sufficient sample to analyze . Since salivary secretion is under nervous
control , many potential subj ects may experience a "dry mouth" when
approached by highway department personnel . Although suppression of
104
salivary flow did not alter the relative concentrations of secobarbital
in saliva and plasma , consideration should be given to methods by which
the salivary flow is leas,t suppressed . The gas chromatographic analyses
for basic drugs such as diphenhydramine , amphetamine , . and chlorpromazine
can be performed on 1 mL of saliva . However , analyses of drugs that are
not basic , and especially those that are highly bound in plasma to
protein (e . g . , diazepam) require several times this volume . Radio
immunoassay procedures , such as the one used for the analysis of codeine ,
can be performed on as little as 10-20 �L of sample .
The second problem experienced was the non-homogeneity of some
saliva samples . In less controlled populations , extraneous materials
from food , tobacco , cigarette smoke , lipstick and other makeup , and
other drugs should be expected to be encountered . We found that centri
fuging. the saliva samples at 1500-2000 x g satisfactorially removed most
contaminants . Studies on a much wider variety of solid contaminants
should be conducted. Contamination of saliva with extraneous materials
that are soluble in this fluid may present a much more se�ious problem .
The extraction procedures employed in our analysis effectively �emove
those materials which would otherwise have interferred with the chroma
tographic determinations . These procedures should also remove most
extraneous compounds .
The third problem encountered was the presence of the drug being
analyzed in saliva arising from material remaining in the oral cavity
from the drug tablet/capsule . This is not an actual problem in per
forming the analytical procedures , but rather in interpreting the results
of the analysis �nd is an example of a false positive .
105
False positives are usual ly considered as measurements of amounts
of a compound in the . fluid which is not actually there . For saliva ,
another method of arriving at a false positive is for the compound being . .
analyzed to be present in the saliva in the oral cavity but not having
been secreted by the salivary gland . This is possible in saliva due to
residues of drugs being taken orally or being inhaled remaining in the
oral cavity or being refluxed from the upper gastrointes.tinal tract .
This type of false positive can be partially dealt with by using a mouth
rinse prior to the collection of saliva or by collecting two samples of
saliva with a sufficiently long time interval (ca . 30-60 min) in between .
False positives due to interferences in the analytical process , e . g . ,
compounds contained in saliva which give rise to peak� in gas chromato
grams at the same position as the peak corresponding to the drug under
study, in somewhat the same manner as those co-eluting with the internal
standard give rise to false negatives , are much more difficult to deal
with . For survey purposes , analysis of saliva samples taken from a
number of people which are known not to contain the drug under study
should be sufficient to determine whether such interferences will be
frequent . In instances where the results of a single sample are to be
used , it may be necessary to analyze the sample by at least two dif- .
ferent methods , preferably with two different modes of detection. For
example , diazepam could be assayed on a Carbowax GC column with a nitro-
gen specific detector and on a methyl silicone capillary column with an
electron capture detector . Even better would be the replacement of one
of these assay procedures with a radioimmunoassay .
False positives can also occur from chance events , e . g . , electronic
noise peaks , dirty GC injectors , contaminated counting vials . These
false positives can be dealt with by performing each analysis at least
in duplicate .
106
When an established extraction-analysis . procedure ' was used , false
negatives arose most easily from (1) failure to obtain a true sample of
the body fluid , (2) losses occurring in sample storage and (3) inter
fering peaks in the chromatogram. We did not encounter false negatives
(as far as can be determined) due to failure to obtain a true sample of
body fluid , due to the nature of our studies . Liquids other than saliva
in the oral cavity at the time of saliva collection would dilute the
saliva and lead to erroneously low values for concentrations of the drug
in saliva . This problem can be overcome by taking two samples of saliva
in close succession from the same subj ect . The dilutant present in the
mouth should be contained primarily in the first sample , and the second
sample, should contain a higher concentration of saliva . Both samples
could then be analyzed in order to ascertain if the saliva in ,first
sample had been diluted . If a sufficient volume of saliva had been
collected in the first sample to rid the mouth of all of the dilutant ,
then the concentration of drug in the second sample could be considered
valid . Alternatively , the saliva in the first sample could be routinely
discarded and analysis performed only on the second sample of saliva .
False negatives due to losses occurring in sample storage will vary
markedly with the drug being analyzed and the storage conditions .
Chlorpromazine , for instance , is unstable in plasma but quite stable in
saliva at -20°C . We experienced no losses of drugs under these storage
conditions in the collection vials described in section 4 . l � We have
observed consid�rable losses of samples of some drugs stored in unsily
lated or plastic containers . Possible decomposition of each drug must
107
be evaluated under the anticipated storage conditions . Both short-term
(transporting the sample from the collection site to the analysis �ite)
and long-term (storage �f the sample at the analysis site prior to
analysis) stability must be considered . We recomme�d that the storage
conditions used in this study be employed until less stringent condi-
tions have been evaluated.
Compounds which co-extract with the drug being analyzed and which
have a retention time in the chromatographic analysis identical to that
of the internal standard will make the concentration of the internal
standard appear higher than it actually is and thereby produce a false
negative . Before any of the chromatographic assays developed in this
program are used for the general population , a study should be conducted
to determine , in samples from a large number of subj ects , whether such
interf�ring peaks are to be expected . Other ways that this possibility
of false negatives can be dealt with are to use multiple internal stan-
dards such as we developed for secobarbital , amphetamine , and diazepam
or to chromatograph each sample on two different stationary phases . At . .
least one manufacturer now sells an instrument that automatically inj ects
a sample on two different columns and compares the results under micro-
processor control .
5 . 2 Use of Saliva Concentrations of Drugs that are Mainly Non-Ionized
to Predict Their Plasma Concentrations
Secretion of non-ionized drugs by the salivary glands should be
independent of the relative pH' s of saliva and plasma . The concentra-
tion of these drugs in saliva should then be equivalent to the concen-
tration of ttfreett drug in plasma . We found that at one hour or later
after administration the average concentration of secobarbital in saliva
108
was 0 . 99 times the concentration of "free" secobarbital in plasma (CV =
21%) ; i . e . , [ saliva] = 0 . 32 [plasma ] . At 0 . 5 hr after administration of
secobarbital (in a capsule) , its concentration in saliva was 2 . 5 times
the concentration of "free" secobarbital in plasma .. Prediction of
concentration of secobarbital in plasma from its concentration in saliva
is thus much improved if the time following adminstration of the drug
that the sample is taken is known . From the equation of. the best-fit
line for the linear regression analysis of our data (excluding the 0 . 5
h r samples) , predicted secobarbital concentrations in plasma from con
centrations of 10 , 100 , and 1000 ng/mL in saliva are 27 , 308 , and 3540
ng/mL respectively . Inclusion of the 0 . 5 hr samples in this analysis
changes the predicted concentration in plasma to 14 , 265 , and 5180 ng/mL
respectively .
The samples from 3 of the subj ects in our study were also analyzed
by Cook et al e (1979) who used stereoselective RIA' s for secobarbital .
He found relationships of [ saliva ] = 0 . 31 [plasma] and [ saliva ] = 0 . 29
[plasma] for R- and S- secobarbital , respectively. Cook �t al e (1975)
had previously demonstrated a similar relationship between saliva and
plasma concentration of phenobarbital , where [ saliva ] = 0 . 29 [plasma] .
With limited data , we found that the concentration of diazepam in
saliva averaged 3 . 1% of that in plasma for samples taken one hr or later
after administration of the drug . Almost identical results were reported
by Di Gregorio et al e (1978) on samples taken from 9 subj ects .
In studies with other drugs that are not appreciably , ionized at
plasma pH , Cook et al e (1975) found a linear relationship existed between
concentrations �f diphenylhydantoin in plasma and saliva where [ saliva ] =
0 . 1 [plasma ] . A similar relationship , [ saliva ] = 0 . 13 [plasma] , was
s
109
found by Mucklow, et al . (1978) , who analyzed a single sample from each
of eleven patients who were receiving regular doses of the drug .
Mucklow also reporte� that between 3 an4 32 hr after a s ingle dose
of antipyrine to 10 subjects the relationship betwee� concentrations of •
the drug in saliva and plasma was [ saliva ] = 0 . 92 [plasma ] .
For many drugs which are not ionized at nonoal plasma pH, including
secobarbital and diazepam, direct relationships exist be�ween the con-
centrations of the drugs in saliva and their concentrations in plasma .
In surveys , where there are large number of subjects , the relationships
are precise enough to penoit accurate estimations of the distribution of
concentrations of these drugs in "plasma from analysis of saliva samples .
A calculation of the approximate concentration "of secobarbital in
plasma from a single sample of saliva is possible using the equation
[plasma ] = 0 . 32 ; 95% confidence interval = 0 . 19 to 0 . 45
[ saliva ]
provided the sample is obtained at least 1 hr after adminstration of the
drug . If the time interval between adminstration of the drug and the
sample being taken is not knoim , then the 95% con"fidence interval becomes
much larger.
Although the ratios of concentrations of diazepam in saliva to"
those in plasma varied only several percent (2 . 1-5 . 6%) in the samples
from the one subj ect that we were able to analyze , this represents
almost a 3 fold difference in the predicted concentrations of diazepam
in plasma . Thus unless further data show that the results for this
subject are abnormal , then a large error factor will accompany the
detenoination of a concentration in plasma from a single sample of
saliva .
110
The dete�ination of the plasma concentration of either secobarbi
tal or dia�epam from the concentration of the drug in saliva at SQme
later time is not possible . Before a drug i� taken , its concentration
in plasma is �ero , assuming no residual drug is pres�nt from a prior
administration . After the drug is taken , its concentration in plasma
rises to a maximum value and then returns to �ero . Thus , for every
concentration of the drug in plasma (and sali�a) , except .possibly for
the maximum concentration , there are at least two time points where this
concentration occurs , one before the maximum concentration is reached ,
the other after the maximum concentration is reached . Thus , if a cer
tain plasma concentration were calculated (in this study based on a
concentration of the drug in saliva) , it would not b� known if that
concentration were for a time point before the maximum concentration was
reached or after the maximum were reached . At some time , for instance
one hour , prior to one of these time points , there could have been no
drug in the plasma , while for the same time interval prior to the other ,
the concentration of drug could have been at its maximum value .
5 . 3 Use of Saliva Concentrations of Drugs that are Mainly Ioni�ed
to Predict Their Plasma Concentrations
Our results indicate that for some drugs that are mainly ioni�ed at
normal plasma pH there is a reasonable correlation between concentra
tions of the drug in saliva and its concentrations in plasma , while
other drugs exhibit only poor correlation . Improved correlation is
observed in some cases when corrections are made for the differences in
the pH of saliva and plasma .
An example of a drug whose concentrations in saliva and plasma do
not correlate well is amphetamine (cf . Figures 17 and 18) . Attempts to
I I I
improve this correlation with an "internal indicator" (creatinine) of
salivary secretion were not successful . Since amphetamine is an alpha
adrenergic agonist , it i� possible that this compound interferes with
its own secretion .
Much better correlations were obtained between concentrations in
saliva and plasma for diphenhydramine and codeine . Correlation coeffi
cients for the linear regression analyses of the logs of the concen
trations of these drugs in plasma and saliva were greater than 0 . 9 for
each . The correlations between concentrations in saliva and plasma were
improved for codeine , but not for diphenhydramine , when corrections were
made for the differences in pH of individual samples of saliva and
plasma . The relation between saliva and plasma concentrations of both
drugs as calculated by linear regression analysis is very concentration
dependent . For example , assuming the pH of saliva is 7 . 0 and fp = 0 . 28
for diphenhydramine , an observed concentration of ' lO ng/mL of this drug
in saliva would lead to a predicted concentration of 9 . 1 or 12 . 3 ng/mL
in plasma . The latter value includes a correction for th� differing pH
of plasma and saliva . Similar calculations for an observed concentra-
tion in saliva of 1000 ng/mL leads to a prediction of 266 or 443 ng/mL.
Approximately equal concentrations in plasma and saliva are predicted at
the lower observed concentration in saliva , but less than half the
saliva concentration is predicted to be in plasma at the higher concen
tration . In order to more fully establish whether these relationhsips
really are concentration dependent , studies should be conducted where
the dose of each of these drugs is varied over a wider range than was
done in this pro) ect.
112
Mucklow et al . (1978) has reported poor correlation (linear regres
sion analysis) between the saliva and plasma concentrations of pro
pranolol (r = 0 . 43) and chlorpropamide (r = 0 .54) . Cook et al . ( 1981)
found a somewhat better correlation between the observed plasma concen
trations and those predicted from saliva concentrations of phencyclidine
(r = 0 . 76) . In this study the pH values of individual saliva samples
were used in the calculations .
It does not seem likely that, at the present itme , saliva could be
used for quantitative estimation of the cC!ncentrations in plasma of
amphetamine or of drugs described above studied by other investigators .
Saliva could possibly be used to estimate the concentrations in plasma
of diphenhydramine and codeine for survey purposes .. Use of single
saliva samples to determine concentrations of any of these drugs in
plasma' does not appear feasible .
113
6 . 0 Research Conclusions
The following conclusions can be drawn from the results of t�is
proj ect :
(1) It is not possible at the present time to co�relate the excre-
tion of relatively non-volatile drugs in breath with their
concentrations in plasma . None of the drugs examined in this
study were highly volatile . If care is not taken, breath
samples will be contaminated with droplets of saliva . These
droplets can contain large concentrations of drug which will
interfere with the accurate determination of the concentration
of drug in breath .
(2) Mixed saliva can be collected noninvasively by a simple
. procedure .
(3) Analysis of saliva for all the drugs studied except codeine
can be accomplished on capillary gas chormatographic columns
with nitrogen-phosphorus specific detection .
(4) The radioimmunoassay for codeine which was deve�oped for use . .
with plasma can be adapted for use with saliva .
(5) Qualitative determinations of the presence of drugs in plasma
from their concentrations in saliva are possible for all drugs'
studied . Roadside techniques for these determinations are not
now available . Such roadside testing could possibly be developed
from currently emerging techniques , but its development would
be costly .
(6) . Correlations between concentrations in plasma and saliva of
the two drugs in this study that are mainly non-ionized at
normal plasma pH (secobarbital and diazepam) are reasonably
114
good . Use of these correlations for survey purpose appears
feasible . The correlations would permit semi-quantita"tive
determinations ,of the concentrations of these drugs in plasma
from their concentrations in a single sample of saliva one
hour or more after administration of the drug . The correlations
are not sufficiently good , however , to permit evidential use
of the result of a single sample .
(7) Correlations between concentrations in plasma and saliva of
the drugs in this study that are mainly ionized at normal
plasma pH (amphetamine , diphenhydramine and codeine) are more
tenuous and vary considerably from drug to drug . Calculations
based on the pH of each saliva sample inprove the correlation
for diphenhydramine . The correlations between plasma and
saliva concentrations of diphenhydramine and codeine are
sufficiently good (correlation coefficients >0 . 92) to ' permit
the utilization of saliva for survey purposes .
(8) The use of the concentration of a drug in saliva to determine
its concentration in plasma at some earlier time is qot now
possible . Knowledge of the pharmacokinetics of the metabolites
of a drug and development of methods to measure these metabo
lites in saliva may at some future time permit the use of the
concentrations of both the drug and its metabolites in saliva
to make such predictions .
(9) The major problem associated with the correlation of saliva
and plasma concentrations of drugs that otherwise showed good
correlations is the abnormal (false positive? ) values observed
"
1 15
for samples taken less than one hour after the drug was admin
istered . The problem arose even though the mouth was flushed
with water immeqiately after administration of 'the drug .
".
7 . 0 Names , Qualifications and Participation of Researchers
Name
Dr. K . E . Wall
Dr . A . R. Jeffcoat
Dr. K . Perez-Reyes
Participation
Directed overall program
Directed research in program ,
Conducted clinical experiments .
116
8 . 0 References
Anton, A . H . , J . Pharmacol . Exp . Ther. , 129 , 282 (1960) .
Atta , A . G . , Maringoni , � . L . , Netto , J . B . B . and Filho , B . S . , Rev .
Bras . Perqui , Med . BioI . , !, 37 (1975) .
Beal , A. M . , Quarterly J . Exp . Physiol . , 64 , 89 ( 1979 ) .
Berry , D . J . , J . Chromatogr . , 86 , 89 (1973) .
117
Bochner , F . , Hooper , W. D . , Sutherland , J. M . ; Eadie , M . J . and Tyrer ,
J . H . , Arch . Neurol . , 31 , 57 ( 1974) .
Booker, H . E . and Darcy , B . , Epi1epsia , 14 , 177 ( 1973) .
Bridges , J . W. , and Wilson, A . B . E . , in "Progress in Drug Metabolism , "
J . W. Bridges and L . F . Chasseaud , ed . , John Wiley and Sons , London,
1976 , Vol 1 pp 193-247 .
Brunson, M . K . and Nash, · J . F . , Clin. Chem. , 21 , 1956 (1975) .
Conrad , G . J . , Jeffay, H . , Boshes , L . and Steinberg, A . D . , J . Dent .
Res . , 53 , 1323 (1974) .
Cook, C . E . , Amerson , E . W. , Poole , W. E . , Lesser , P . and O ' Tuama , L . ,
Clin. Pharmacol . Ther . , 18 , 742 (1975) .
Cook, C . E . , Jeffcoat , A. R. , Brine , D . R. and Wall , M . E . , Qua�terly
Report No . 4 for proj ect entitled "Metabolism and Pharmacokinetics
of Drugs (Contract No . 271-80-3705 ) ; National Institute on Drug
Abuse , February , 1981 .
Cook, C . E . , Myers , M. A . , Tallent , C . R. , Seltzman , T . an� Jeffcoat ,
A . R . , Fed . Proc . , 38 , 742 (1979) .
Dahlstrom, B . , Paalzow, L . and Edlund , P . O . , Acta Pharmacol . et Toxicol . ,
41 , 273 (1977) .
Dawes , C . , J . Physio1 . (Lond . ) , 220 , 529 (1972) .
Dawes , C . , J . Physio1 . (Lond . ) , 224 , 535 (1975) .
118
Dawe s , C . and Ong, B . Y . , Arch. oral Biol . . 1 8 . 1233 ( 19 7 3 ) .
DiGregorio, G . J . • Piraino, A . J . and Rueh, E . , C l i n . Pharma ca l . The r . J
24 , 720 ( 1 9 7 8 ) .
Dvorech i k , B . H . and Ve se l l , E . 5 . , Chlin. Chern . , 22 86� (1976 ) .
Ferguson, D . B . and Botchwa y . C . A . • Archs . oral BioI . , 24 , 8 7 7 ( 1 9 80 ) .
Ferguson, D . B . , alld Fort, A . , Archs. oral Biol . , .!.2. . 47 ( 1 9 7 4 ) .
Ferguson, D . B . , Fort, A . , E l l i o t t , A . L . and Potts , A . J " . Archs .
oral Biol . , !,! , 1155 ( 1 9 7 3 ) .
Findlay, J . W . A " Butz, R . F . and Welch, R . H . , Life Sc i . , 1 9 , 389
( 1 9 7 6 ) .
Findlay , J . W . A ' I Butz, R . F . and Welch, R . H . , Clin . Pharmacal . Ther . ,
2 2 , 439 ( 1 9 7 7 ) .
Findlay , J . W . A . , Jones , E . C . , Butz, R . F . and Welch, R . H . , C l i n .
Pharmaca l . The r . , 2 4 , 6 0 ( 1 9 78 ) .
Goldstein, A . • Pharmacol . Rev . • ! . 102 ( 1 9 49 ) .
Goldstein, A . • Aronow, 1 . , and Kalman, S . M . , "Principles o f Drug Action , "
2nd ed . , John Wj ley and Sons , New York, 1 9 7 4 .
Jud i !> , J . , J . Pharm. Sci . , 66 , 802 ( 1 9 7 7 ) .
Jusko, w . J . , and Cretch , 11 . , Drug l1etab. Rev . , :! 43 ( 1 9 7 6 ) .
Kanto , J . and Kanga s , L . , Acta Pharmacol . Toxico l . , 3 6 , 328 ( 1 9 7 5 ) .
Keen, P . in "Concepts in Biochemical Pharma cology, Part l , lt B . B . Brodie ,
J . R . G i l lette and H . S . Ackeiman, Ed s . , Springe r , Berlin, 1960 , pp
213-233 .
Klotz , U " Anton i n , K . -H . and B i e c k , P . R . , J . Pha rmaca l . Exp. Ther . ,
199 , 67 ( 1 9 7 6 ) .
Lunde , P . K . H . , Rane, A . , Yaffe, S . J . , Lucd , L . and Sjogvi s i t , F . ,
C l i n . Pharl':lacol . The r . , g , 846 ( 1 9 7 1 ) .
119
Makila , E . and Kirveskari , P . , Arch. oral Bioi . , !!, 1285 (1969) .
Matin , S . B . , Wan, S . H . and Knight , J . B . , Biomed . Mass Spectrom. ,· !,
118 (1977 ) .
Matin, S . B . , Wan, S . H . and Knight, J . B . , Biomed . Mass -. Spectron. , !, 2
(1977) •
Matin, S . B . , Wan, S . H. , and Kar8m, J . B . , C1in . Pharmacol . Ther . , 16 ,
1052 (1976) .
Meyer , M. C . and Buttman, D . E . , J . Pharm. ScL , 57 , 895 (1968) .
Mucklow , J . C . , Bending, M . R . , Kahn, G . C . and Dollery, C . T . , C1in.
Pharmacol . Ther . , 24 , 563 (1978) .
Obrien, J . E . , Zazulak, W. , Abbey , V . • and Hinsvark, 0 . , J . Chromatogr .
Sci . , 10 , 336 (1972) .
Piraino , A . J . , DiGregorio , G . J. and Nagle , B . T. , J . Dent. Res . , 55 ,
43 (1976) .
Pu , F . S . and Chiou, W. L . , J . Pharm. ScL , 68 , 534 (1979 ) .
Rasmussen , F . , Acta Pharmacol . Toxico1 . , 21 , 11 (1964) .
Shoeman, D . W. and Azarnoff , D . L . , J . Pharmacol . Exp . Ther • . , 195 , 84
(1975) .
Sorenson, S . P . L . , Biochem. Z . , 22 , 352 (1909) .
Sturdee , P . W . , Brit . J . Anesth . , 48 , 1091 (1976) .
Teranishi , R . , Mon , T . R . , Robinson, A. B . , Cary , P . and Pauling, L . ,
Anal . Chem. , 44 , 18 (1972) .
Troupin , A. S . and Friel , P . , Epi1epsia . , 16 , 198 (1975 ) .
Waddell , W. J . and Butler , T . C . , J. Clin . Invest . , 36 , 1217 (1957) .
Wall , M. E . and Davis , K . B. , Annual Report for Contract No . NOi-KR-l-
0092 with the National Institute on Drug Abuse entitled "Analysis of
Marihuana Samples and Development of Cannabinoid Materials and
Dosage Forms , 1973 - 1976 . "
Wan , S . H . , Matin, S . B . & Azarnoff , D . L . , Clin. Pharmacol . Ther . , 23 ,
585 · (1978) .
Yacobi , A . and Levy , G . , Res . Commun. Chem. Pathol . Pharmacol . , 12 , " -
405 (1975) .
120
Zweidinger, R . A . , Weinberg , F . M . and Handy, R . W . , J ; " Pharm. Sci . , 65 ,
427 (1976) .
Appendix A - Detailed Analytical Methodologies
A . I Secobarbital
..
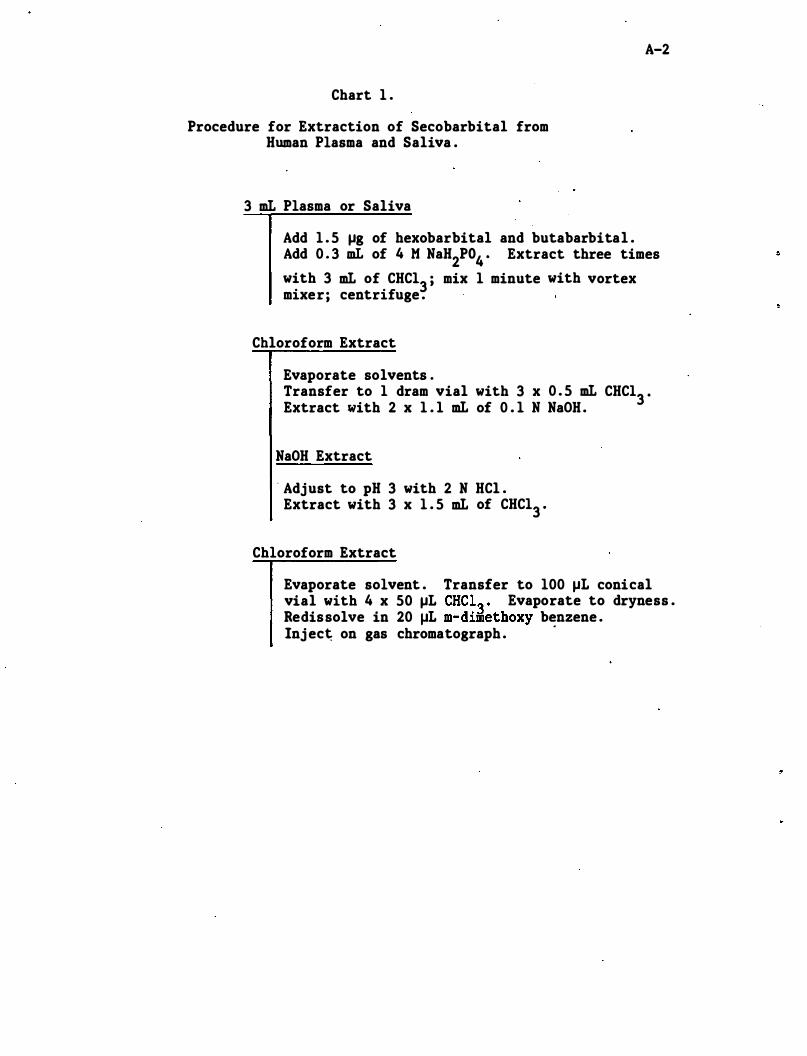
Chart 1 .
Procedure for Extraction of Secobarbital from Human Plasma and Saliva .
3 mL Plasma or Saliva
A-2
Add 1 . 5 �g of hexobarbital and butabarbital . Add 0 . 3 mL of 4 M NaH2P04 • Extract three times with 3 mL of CHC13 ; mix 1 minute with vortex mixer; centrifuge .
Chloroform Extract
Evaporate solvents . Transfer to 1 dram vial with 3 x 0 . 5 mL CHC13 • Extract with 2 x 1 . 1 mL of 0 . 1 N NaOH .
NaOH Extract
. Adjust to pH 3 with 2 N HCl . Extract with 3 x 1 . 5 mL of CHC13 "
Chloroform Extract
Evaporate solvent . Transfer to 100 �L conical vial with 4 x 50 �L CHC1� " Evaporate to dryness . Redissolve in 20 �L m-dimethoxy benzene . Inj ec� on gas chromatograph .
.
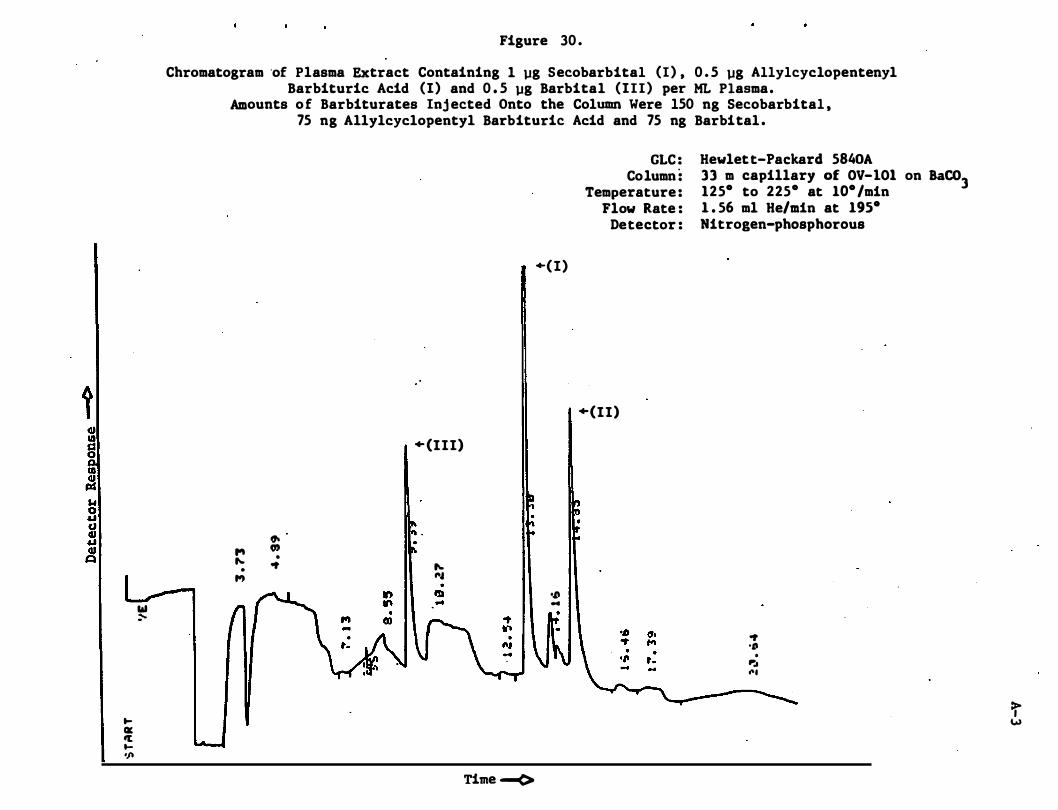
t GJ ID s:s g CD :! w 0 '" cJ jl
� QC � t'f'
"
Figure 30 .
Chromatogram 'of Plasma Extract Containing 1 �g Secobarbital (I) , 0 . 5 �g Allylcyclopentenyl Barbituric Acid (I) and 0 . 5 �g Barbital (III) per ML Plasma.
Amounts o f Barbiturates Inj ected Onto the Column Were 150 ng Secobarbital , 75 ng Allylcyclopentyl Barbituric Acid and 75 ng Barbital .
� 0) '" . � ot •
,.,
+ (III)
� ,. ..
+(I)
GLC : Column :
Temperature : Flow Rate :
Detector :
+(II)
Hewlett-Packard 5840A 33 m capillary of OV-IOI on BaC03 125· to 225· at 10· /min 1 . 56 ml He/min at 195· Nitrogen-phosphorous
� ." ... III :--
Time -<>
ot ." . P:. ...
>, w
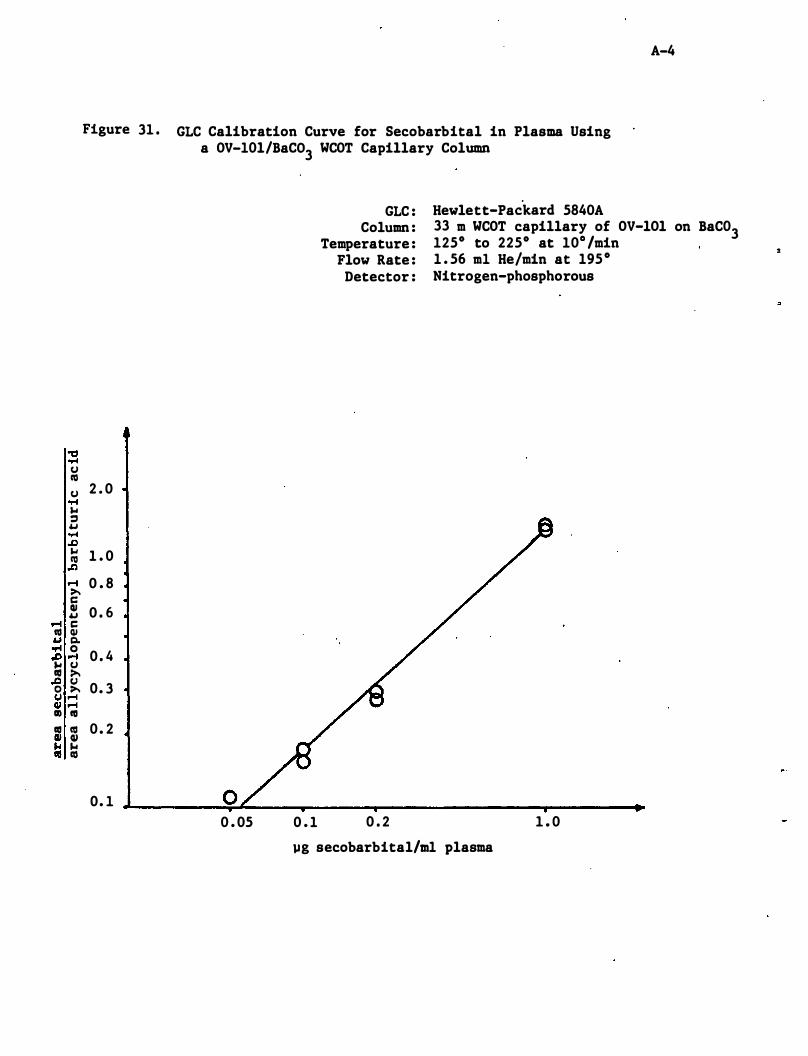
"0 ...c U II) U
...c '" :I 4..t ...c .D '" II) .C) .-i >-c: QI 4..t .-4 c: II) QI 4..t Q. or4 0 .D .... '" U aI >-.tl u o >-u ....
QI .... II) 1\1 aI 1\1 Q/ QI '" '" to II)
Figure 31 . GtC Calibration Curve for Secobarbital in Plasma Using a OV-10l/BaC03 WCOT Capillary Column
GtC : Hewlett-Packard 5840A
A-4
Column : Temperature :
33 m WCOT capillary of OV-lOl on BaC03 1250 to 2250 at 10o /min
2 . 0
1 . 0
0 . 8
0 . 6
0 . 4
0. 3
0 . 2
0. 1 o 0 . 05
Flow Rate : Detector :
0 . 1 0 . 2
1 . 56 ml He/min at 1950 Nitrogen-phosphorous
1 . 0
�g secobarbital/m1 plasma
:
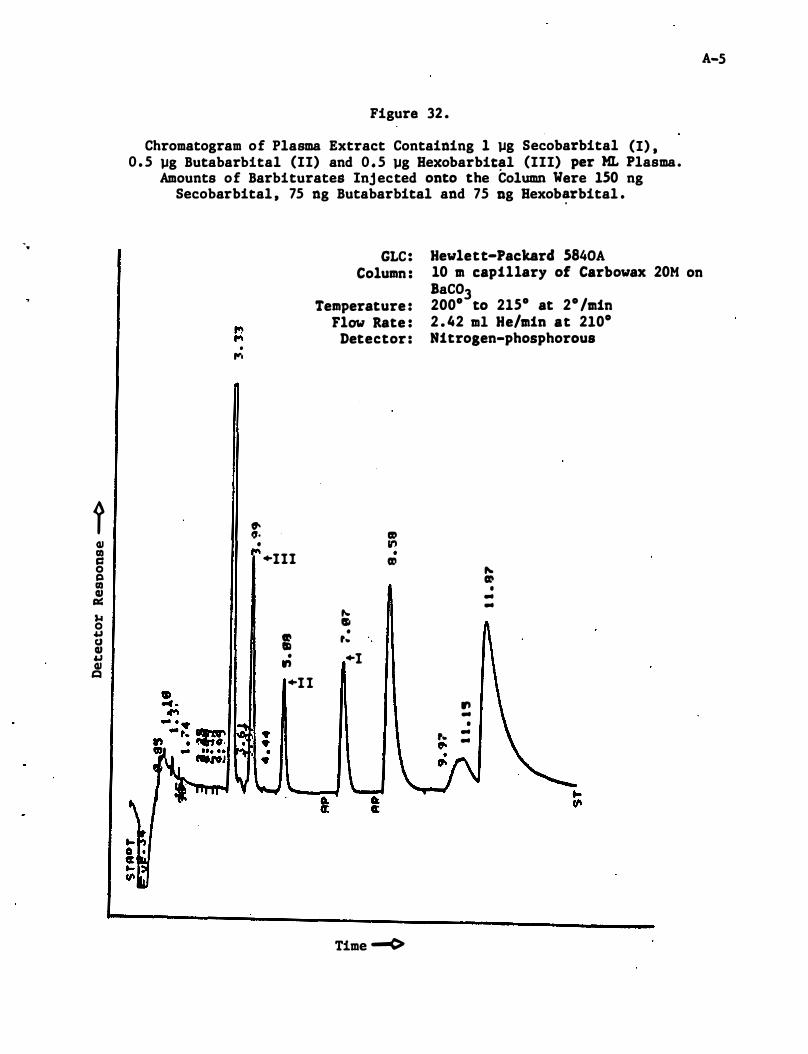
'.
t ClI G) c:: 0 Cl G) ClI ell:: ,.. 0 o&J tI ClI o&J ClI t:I
Figure 32 .
Chromatogram of Plasma Extract Containing 1 �g Secobarbital (I) , 0 . 5 �g Butabarbital (II) and 0 . 5 �g Bexobarbit�l (III) per ML Plasma.
Amounts of Barbiturates Inj ected onto the Column Were 150 ng Secobarbital , 75 ng Butabarbital and 75 Dg Bexob�rbital .
GLC: Hewlett-Packard 5840A
A-5
Column : 10 m capillary of Carbowax 20M on
Temperature : Flow Rate :
Detector : . ....
� ". II) • II')
• +111 II)
... SI • II) II ,-
• +1 ., +1 1
Time ......(>
BaC03 200° to 215° at 2° /min 2 . 42 ml He/min at 210° Nitrogen-phosphorous
� II) • .. ..
., .. •
,- .. 0- ..
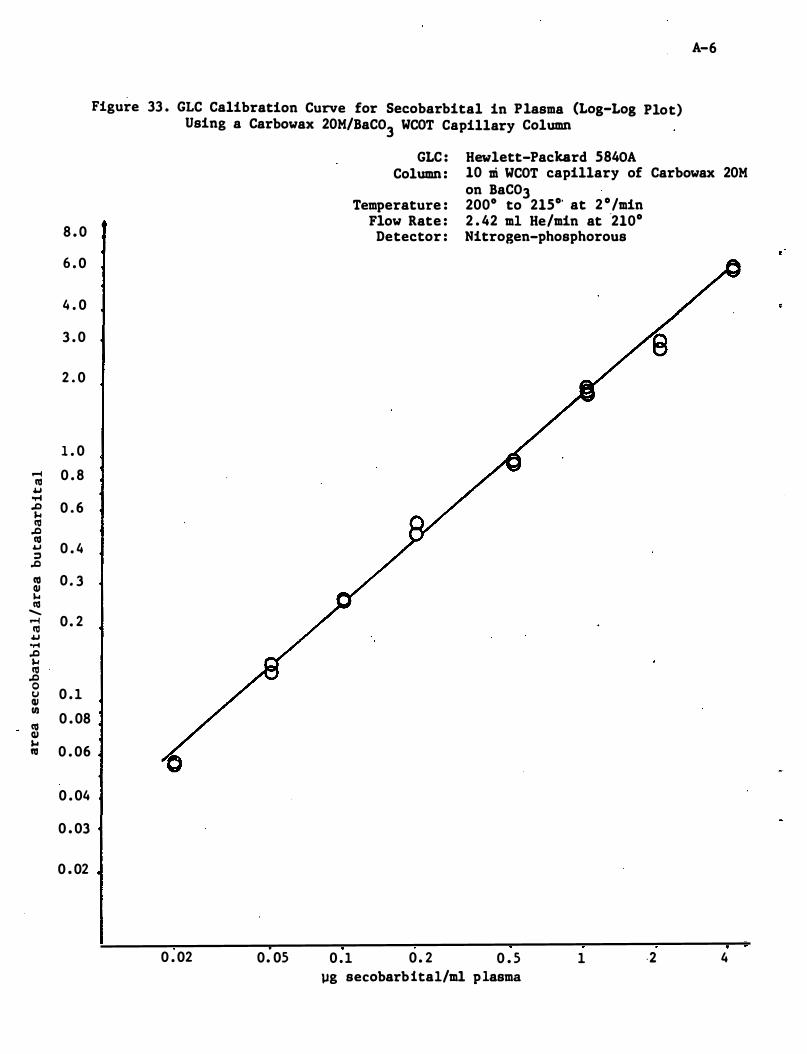
.-4 III 4.J ..-I .D ... III .0 III 4.J ;:) .0 III (1J � III
-.-4 III 4.J ..-4 .0 ... III .0 0 tJ (1J I/) co (1J ... co
Figure 33 . GLC Calibration Curve for Secobarbital in Plasma (Log-Log Plot) Using a Carbowax 20M/BaC03 WCOT Capillary Column
GLC : Hewlett-Packard 5840A
A-6
Column : 10 Di WCOT capillary of Carbowax 20M on BaC03
Temperature : 2000 to 215°' at 2 °/min Flow Rate : 2 . 42 m1 He/min at '210°
8 . 0 Detector : Nitrogen-phosphorous
6 . 0
4 . 0
3 . 0
2 . 0
1 . 0
0 . 8
0 . 6
0 . 4
0 . 3
0 . 2
0 . 1
0 . 08
0 . 06
0 . 04
0 . 03
0 . 02
0 . 02 0. 05 0 . 1 0 . 2 0 . 5 1 ,2 4 �g secobarbita1/ml plasma
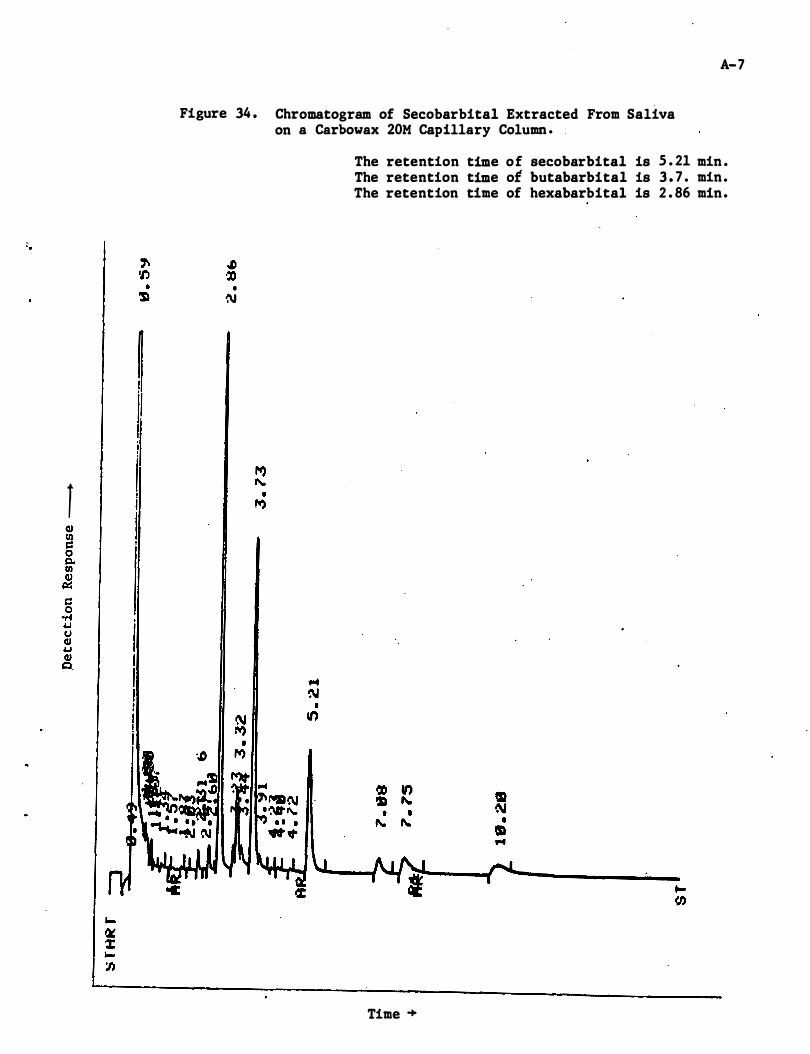
1
A-7
Figure 34 . Chromatogram of Secobarbital Extracted From Saliva on a Carbowax 20M Capillary Column .
• N
The retention time of secobarbital is 5 . 21 min . The retention time of butabarbital is 3 . 7 . min. The retention time of hexabarbital is 2 . 86 min •
Time �
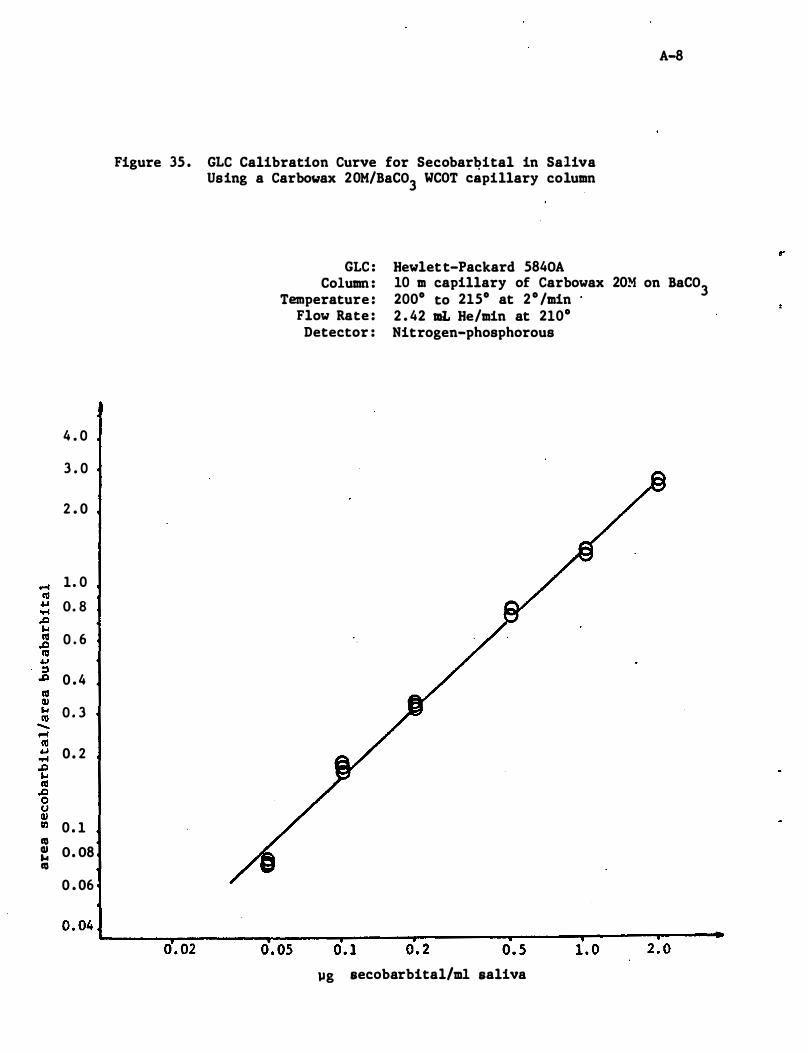
4 . 0
3 . 0
2 . 0
1. 0
O. S
0 . 6
0 . 4
0 . 3
0 . 2
0 . 1 to � O. OS to
0 . 06
A-S
Figure 35 . GLC Calibration Curve for Secobarbital in Saliva Using a Carbo�ax 20M/BaC03 WCOT capillary column
GLC : Column :
Temperature : Flow Rate :
Detector :
Hewlett-Packard 5S40A 10 m capillary of Carbowax 20M on BaC03 200° to 215° at 2 ° /min 2 . 42 mL He/min at 210° Nitrogen-phosphorous
0 . 04 L-____ ,-______ -r ____ � __ ----�------��--��--��---. 0 . 02 0 . 05 0 . 1 0 . 2 0 . 5 1 . 0 2 . 0
�g secobarbital/m1 saliva
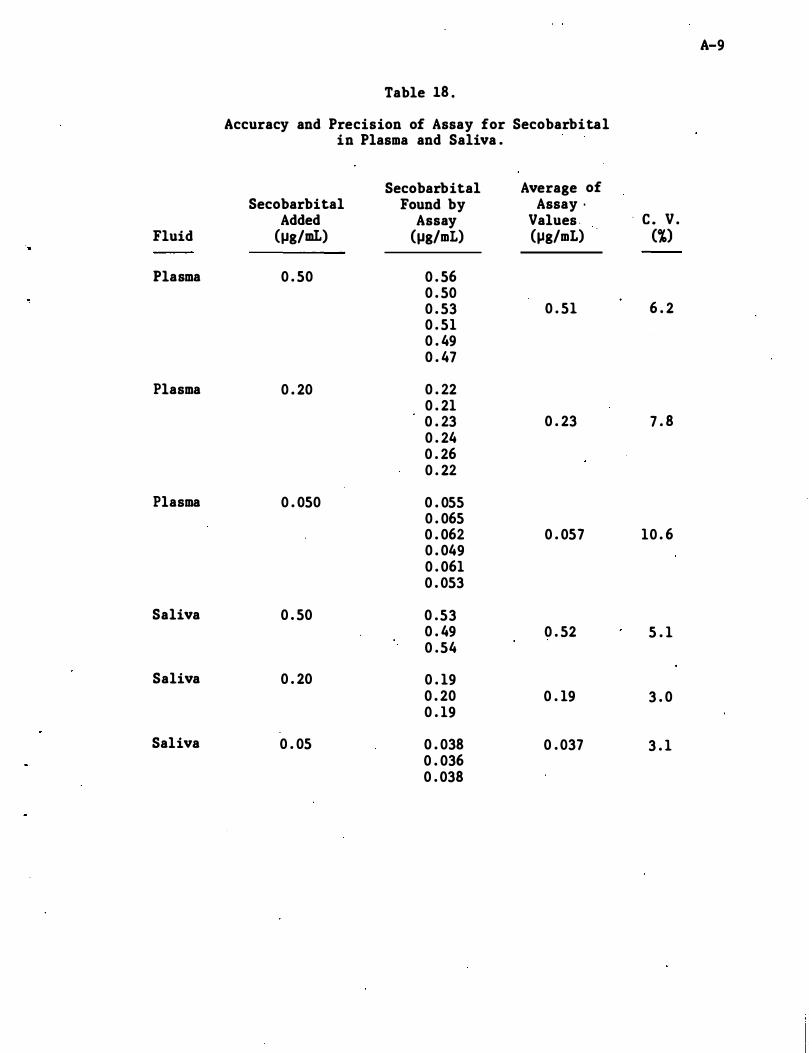
A-9
Table 18 .
Accuracy and Precision of Assay for Secobarbital in Plasma and Saliva .
Secobarbital Average of Secobarbital Found by Assay ·
Added Assay Values . . c . V . Fluid (J,lg/mL) (J,lg/mL) (J,lg/mL) ('X)
Plasma 0 . 50 0 . 56 0 . 50 0 . 53 0 . 51 6 . 2 0 . 51 0 . 49 0 . 47
Plasma 0 . 20 0 . 22 0 . 21 0 . 23 0 . 23 7 . 8 0 . 24 0 . 26 0 . 22
Plasma 0 . 050 0 . 055 0 . 065 0 . 062 0 . 057 10 . 6 0 . 049 0 . 061 0 . 053
Saliva 0 . 50 0 . 53 0 . 49 0 . 52 5 . 1 0 . 54
Saliva 0 . 20 0 . 19 0 . 20 0 . 19 3 . 0 0 . 19
Saliva 0 . 05 0 . 038 0 . 037 3 . 1 0 . 036 0 . 038
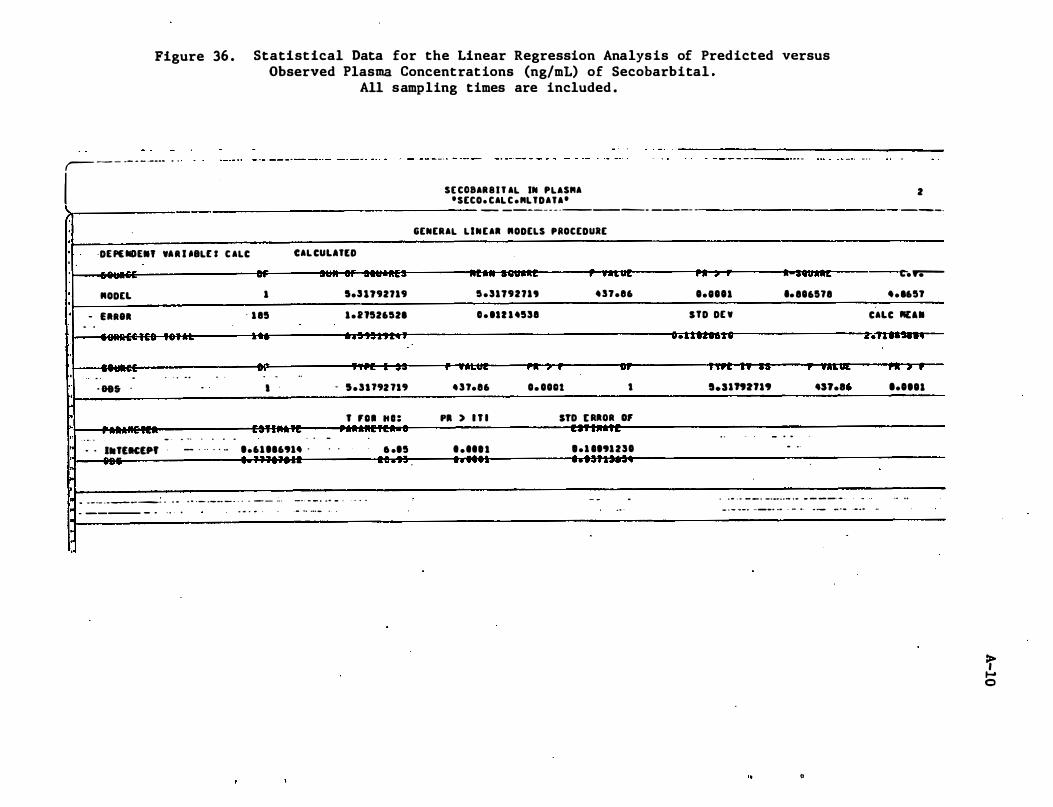
Figure 36 . Statist ical Data for the Linear Regression Analys is of Predicted versus Observed Plasma Concentrat ions (ng/mL) of Secobarbital .
All sampling times are included .
,- - - -- - - ---- - "
I I ·
·
·
·
·
·
·
·
·
, , ·
DE P£IIDE.' VU USLU C ALC CAL CUUTU -.-
RODEL
- UReA - .
. .. .
. . ' &85 '
........
.
....
. . •• T£K£Pf
, .. ...
. . . -. - .
-
.
.. , . . . . .. - . . . . . ...
. "
1
' 1 85
. ..
.. - -•
..
.-. ,
1.61 116914 .
.... n .. ...... ·ft� ..
5.U192719
1 . 2 1526521
. . . .. . . .
c .. . ....
- ' . ' U'2 1.'
-, ,
T 'D. "0= ... ' ..
6 .15
... ' .... . V . ' '' ,
.. - - -_ . _ - - -_ . . . ... . .. . _ ._ ..... - . . . - - - _. -_ . .. _ . . . - . . , , .
S[ C08AR8I T AL IN PLAS"A 'SECO. CAL C."LTDATA'
-
---_ ._ - _ .
_-
----
- --
-- -
GENERAL LINEA. RODELS PROCEDURE
n .. wn " .. .. W ft .. .w ......
5 . 31792719 4 n .e6
0 . IU 1 4538
. ..... � oft , • "0'
4 ' f.e6 O. OODt •
p. ) n l STD [ RAOR Of _ .. ' . ' -
. . ... . 0 . 1 0191230
. ' .... .. . .. .. . ....... �
- - .
, 0.11101
STD DE V
...&&.�tD
'T� . .. ...
S.Slft2fl9
. .
... •• 816118
- . . - ..
.... -"f."
. . .. . .. _ _ . _ ...... .. _ . ... - - - ---
2
._--,
-
t.y.---4 . 165f
CALC REal
2.U .....
r .. , r
1.011 •
- -. ..
- ---- _ . . . . . .. . ... . ... .. ... - . .. . - - - .. _ . .. __ . .. . - .. -.-- .. -- .- . . ..
..
a
>, ,... o
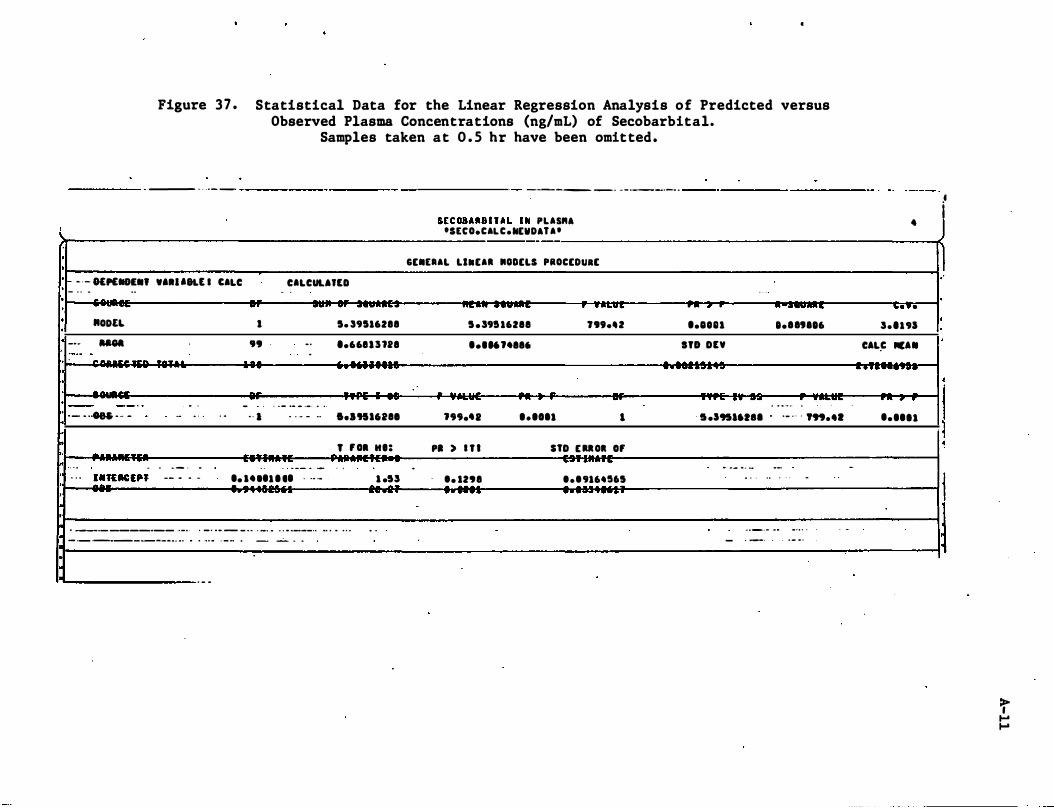
Figure 37 . Statistical Data for the Linear Regression Analysis of Predicted versus Observed Plasma Concentrations (ng/mL) of Secobarbital.
Samples taken at O . S hr have been omitted.
---
- - . _-
--------- ----------- -_ . - _ . __ ._ . . _------- ------
!
·
·
· - - - 1£"""'.' .'.U8U I CALC
·
·
• ,
- - - ..
"ODEL
--
-
�
"""
..
'. - - ----- -- ---. , " -- _ ..
· --.. . - . .. � . - -· ·
· h • . . . _----
-· -- . . . . - - -- -
. . -.
, . I
'9
-. . I
- -
CALCUU'tD - -- . - ..
. . . - -- - .- . .. , . .. . - - .-
.• . - -- - -
1. 39116288
'.668 1 1 728 --a •• 'II1"8I
, ' 01 H':
- -. . . ��,uc:,p, -- - .. - .. .. .. 1 1 .. . ... . - 1 .5�
,-·
,- .... , .. • __ • _ _______ ' . _ 0 ' • _ • • _ _ _ • • ' _0_" • • • ____ .. ... . .. . 0 .
_ ._ ._. __ _ ______ . . .. .. .. ' . 0 • • _ ... ..
. _ .
_ _ . 0
-- .. . -
5lCUBARBI TAL IN PLA5ftA -SteO.CALC.NEVDA'A-- --
GE.tAAL LINEAl MODELS PROCEDuaE
. � .. . . - �
1 . �9I 16288 "" •• 2
..... ., .... . - .• A .. ...... , ••• 011 I
P. ) I T I no E UOI 0' . . . ' . . t • • 298 t . t 9164"5 ..-.... .. , .
�-y
•• lOn
IlO on ...... ...
.....
- -
.... "16
...... ...... _-• • • , • • > •
- 5 .195"'" . . _ . . - ," ... .. -- .... ..
. . - .-'0 • •
-._._ . -- - -- -.. . . .
. - . .
- -
•
... ..
�.'191
CAL� fICA • .. . ...........
n. , r
.. .. 11 -
.-I J 1 ·
·
· I
I j ·
·
I J
1
t I-' I-'

A-12
Appendix A - Detailed Analytical Methodologies
A . 2 Amphetamine
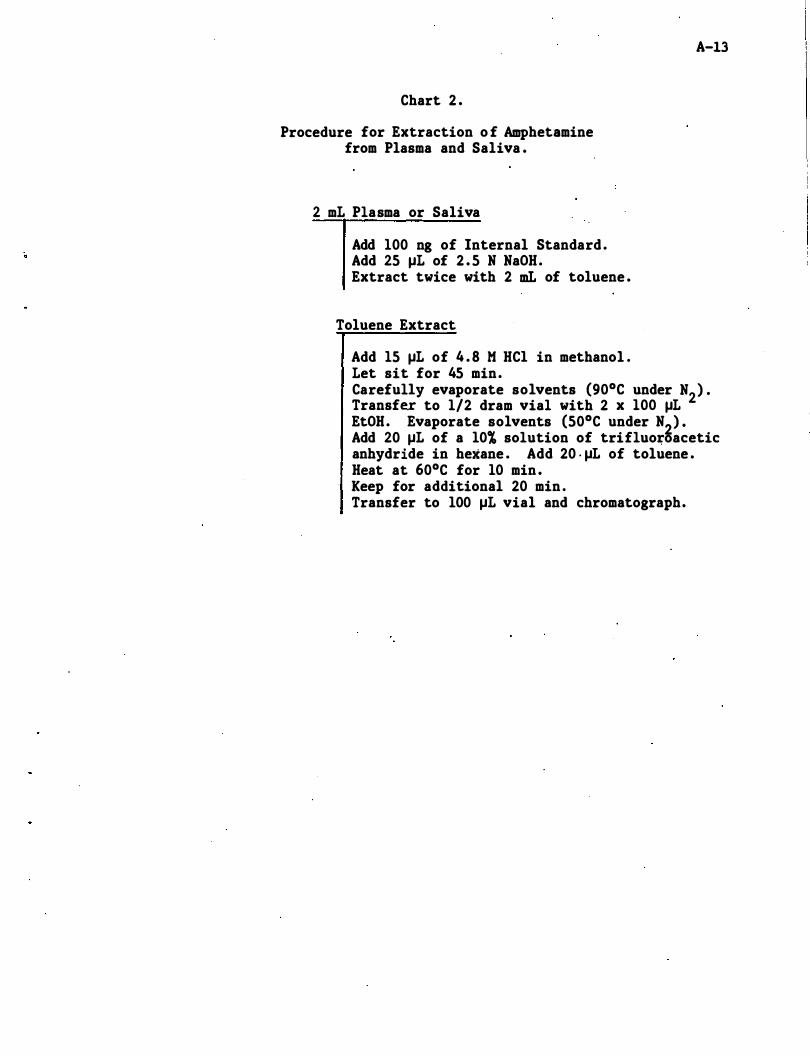
Chart 2 .
Procedure for Extraction o f Amphetamine from Plasma and Saliva .
2 mL Plasma or Saliva
Add 100 ng of Internal Standard . Add 25 �L of 2 . 5 N NaOH. Extract twice with 2 mL of toluene .
Toluene Extract
Add 15 �L of 4 . 8 M HCI in methanol . Let sit for 45 min.
A-13
Carefully evaporate solvents (90°C under N2) . Transfer to 1/2 dram vial with 2 x 100 �L EtOH. Evaporate solvents (50°C under N2) . Add 20 �L of a 10% solution of trifluo�oacetic anhydride in hexane . Add 20 . �L of toluene . Heat at 60°C for 10 min . Keep for additional 20 min . Transfer to 100 �L vial and chromatograph.
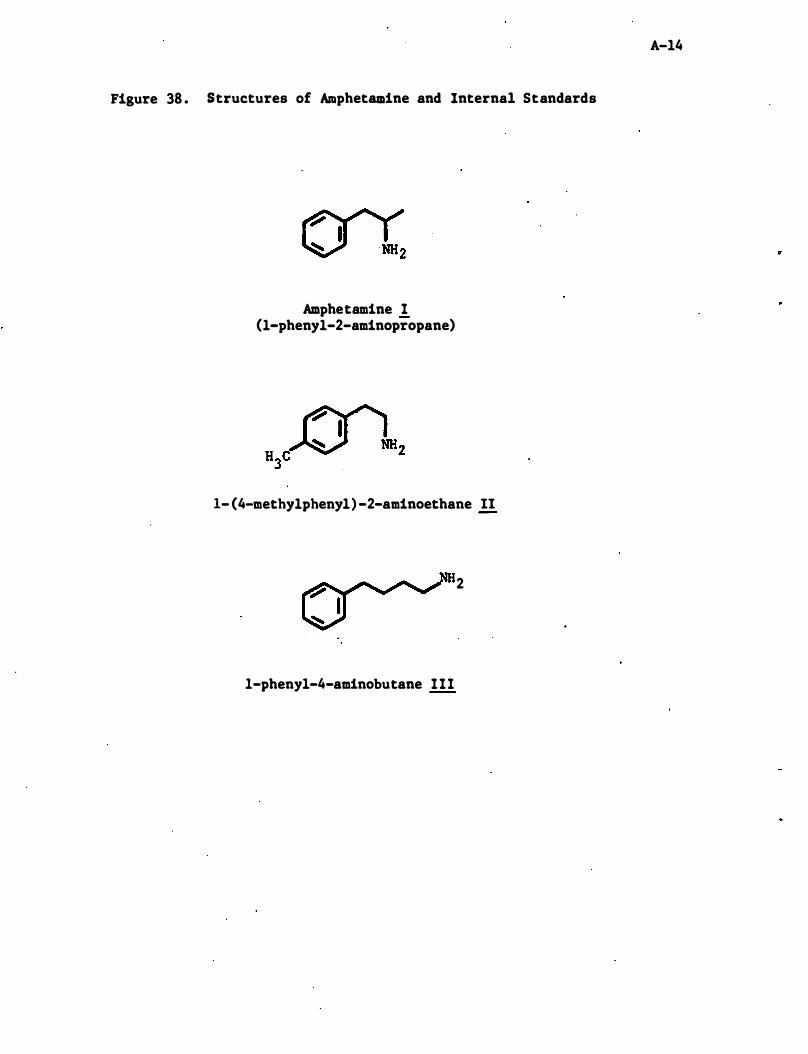
Figure 38 . Structures of Amphetamine and Internal Standards
Amphetamine 1 (l-phenyl-2-aminopropane)
1- (4-methylphenyl) -2-aminoethane II
2
I-phenyl-4-aminobutane 111
A-14
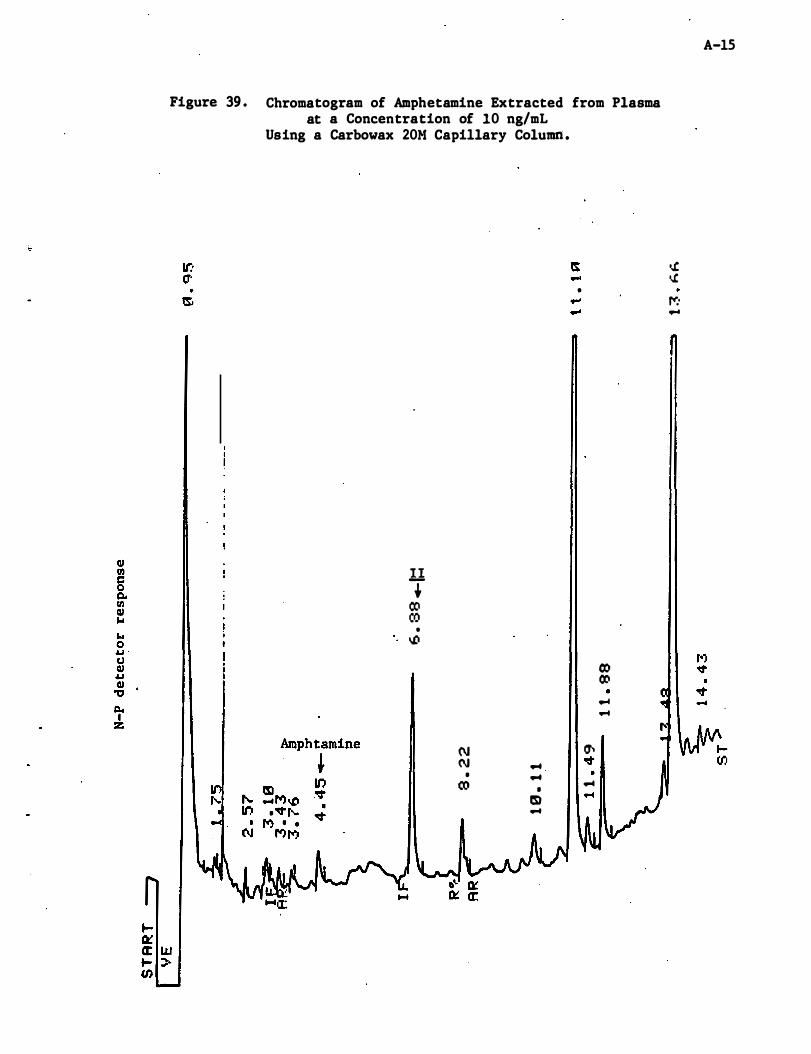
Figure 39 . Chromatogram of Amphetamine Extracted from Plasma at a Concentration of 10 ng/mL
Using a Carbowax 20M Capillary Column .
II t CO CO
• to/)
(\J (\J ...
• ... CO •
m ...
•
O'j CO ... ...
.,.. o:t ... ...
../.
. ./. f": • ...
A-lS
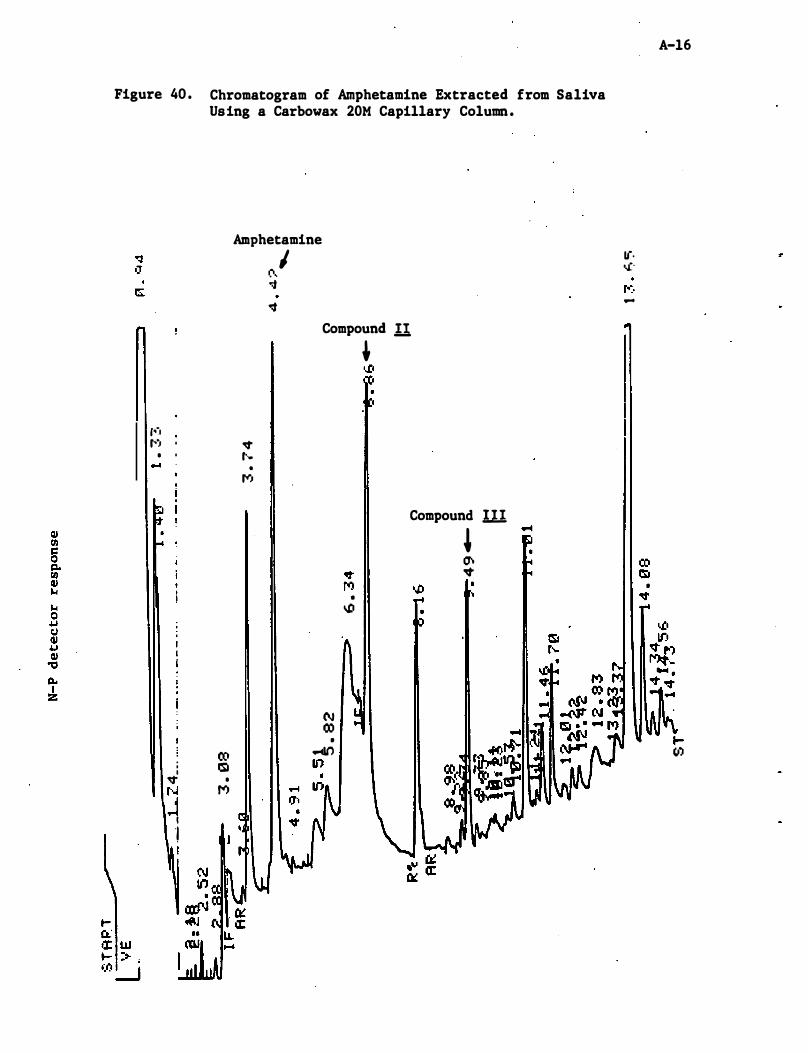
Figure 40 . Chromatogram of Amphetamine Extracted from Saliva Using a Carbowax 20M Capillary Column .
r'�1 �') .
• . ...
ro i lSI I 'It • N M J I '1
Amphetamine
(\ I o:j o:t
Compound II
� t ..
•
r--,
(\J 00
• ..., If)
, o,!,I
• o.D
Compound ill
� O"t �
1('. o,i'
-
• �
A-l6
.... (lJ
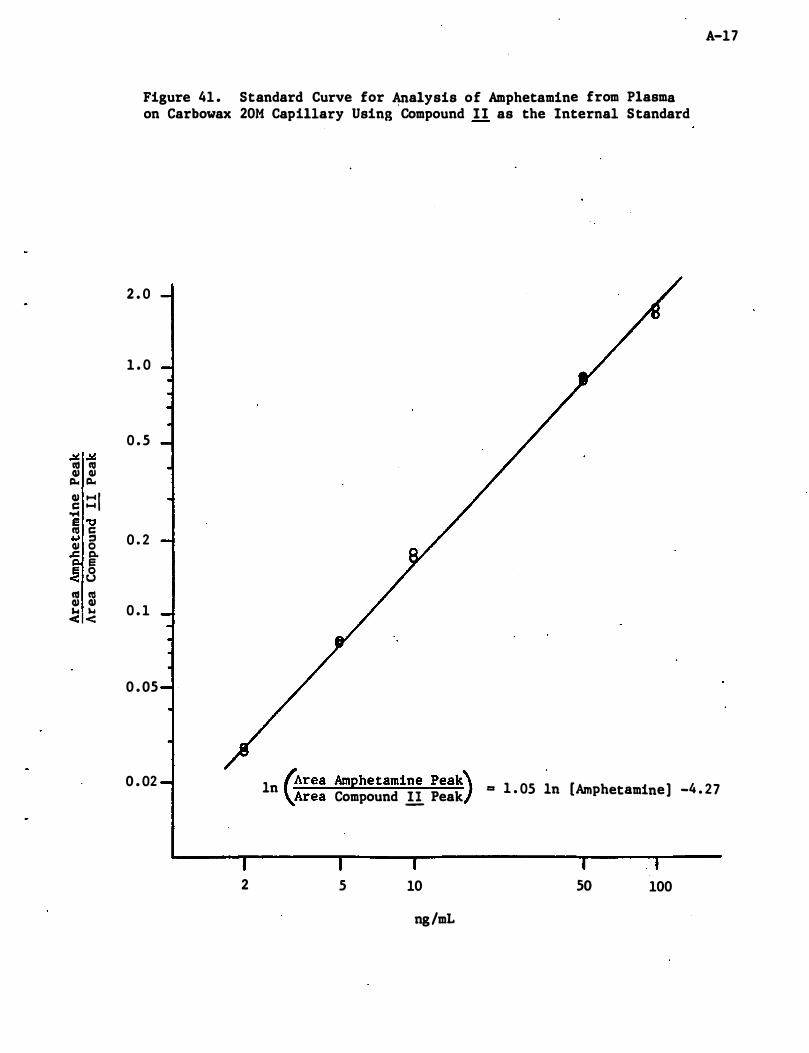
.¥ .¥ III III QJ QJ
� �
QJ ::: 1 c: 'r4 E 't:I III c: � =' QJ 0
.c: j:I.
� 8 III III QJ QJ ... w < <
A-17
Figure 41 . Standard Curve for �alysis of Amphetamine from Plasma on Carbowax 20M Capillary Using Compound 1 1 as the Internal Standard
2 . 0
1 . 0
0 . 5
0 . 2
0 . 1
0 . 05
0 . 02
2
In "Area Amphetamine peak) = 1 . 05 In [Amphetamine] -4 . 27 \Area Compound 11 Peak
5 10 so 100
ng/mL
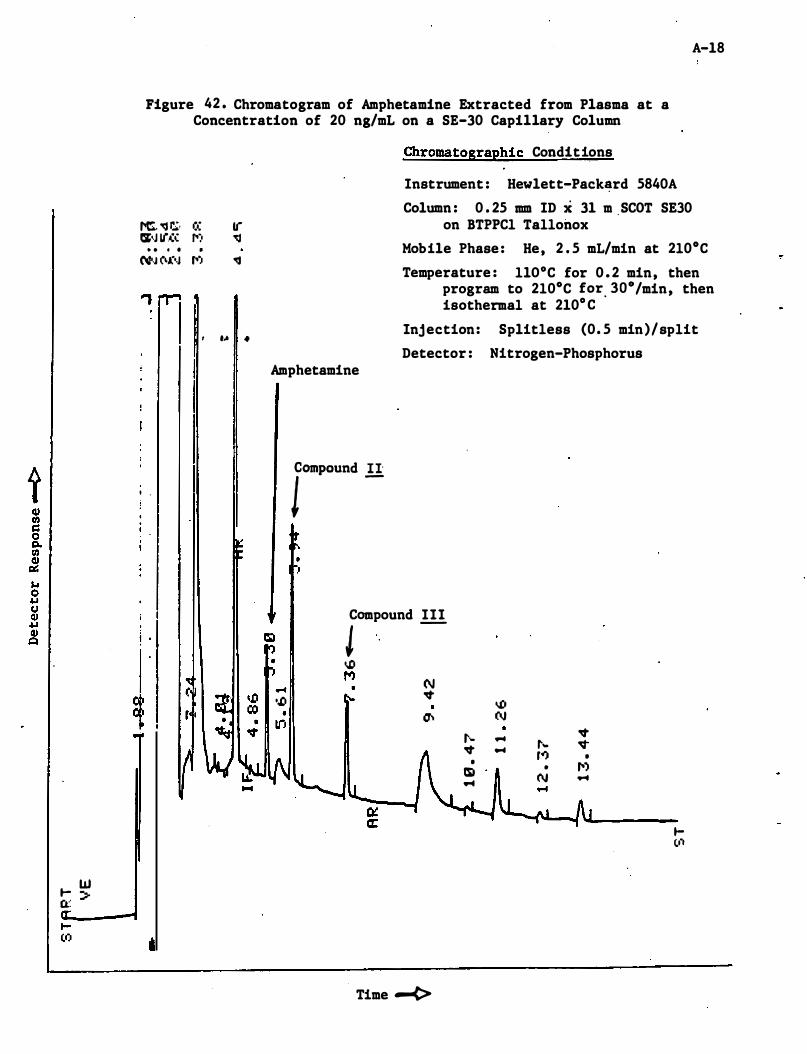
... W Q:: :=-
A-18
Figure 42 . Chromatogram of Amphetamine Extracted from Plasma at a Concentration of 20 ng/mL on a SE-30 Capillary Column
f'C. 'CJ r.;, IS-,J If(': . . 0 • (,�N (\(-,J
..,
, ,
i I
! .
� ,
cr. tr ro:, 'CJ
• ro:. �
, ... .
Chromatographic Conditions
Instrument : Hewlett-Pack�rd 5840A
Column : 0 . 25 mm ID x 31 m ,SCOT SE30 on BTPPCl Tallonox
Mobile Phase : He, 2 . 5 mL/min at 2l0oC
Temperature : llO°C for 0 . 2 min, then program to 2l0oC for. laO/min, then isothermal at 210° C
Injection: Splitless (0 . 5 min)/split
Detector : Nitrogen-Phosphorus Amphetamine
10lDPOUDd !!
Compound 111 J -o.!J M N ... � './J
• a-. In t-�
• m ...
Time -<>
o.D N ... ... r-...
ro:. •
N
� �
• f'') ...
... (.I�
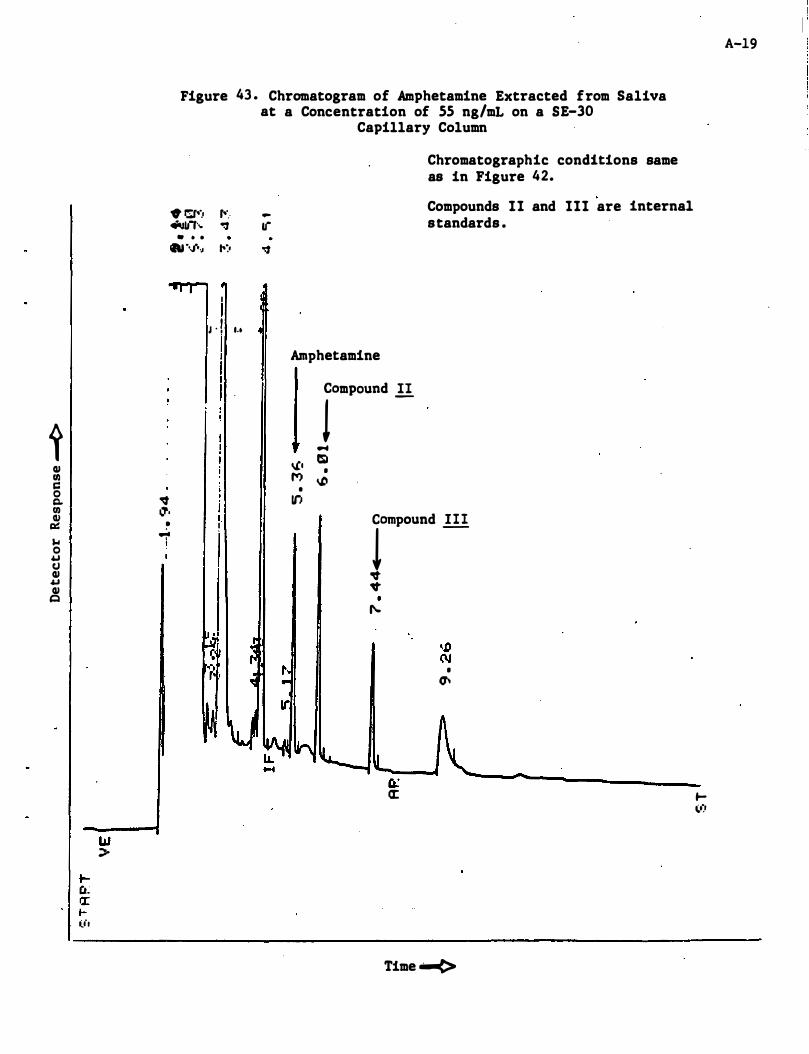
t QI Ul C 0 Q. Ul QI e:.:: $./ 0 � CJ QI .u QI
C
W :> f-a); a: ... ll'l
Figure 43 . Chromatogram of Amphetamine Extracted from Saliva at a Concentration of 55 ng/mL on a 5E-30
Capillary Column
• r:r-... r-'. 4tJI.I, ... "!J
• • •
.... ./ •• J ,-:.
I I J , I I I .•
I I I I
� j �. I . • I .;. t
� ar o:f
Amphetamine
Chromatographic conditions same as in Figure 42.
Compounds 11 and 111 are internal standards .
rmpOUDd !!
.... eo. 'il • M o.D
• If) rpoUnd .!!!
"It "It ,....
• �
CL: �
Time -....(>
A-19
f-III
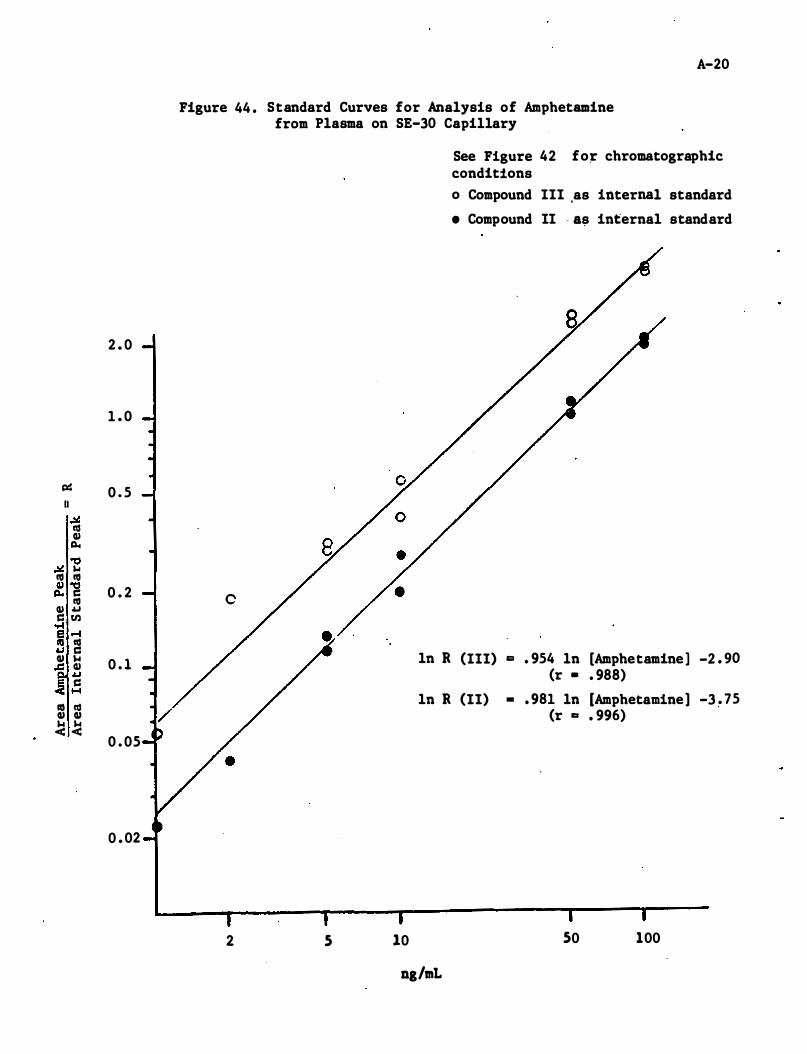
2 . 0
1 . 0
p:: 0 . 5 II
� t1S CII Q,.
� "C ... t1S t1S CII "O
0 . 2 Q,. C t1S CII .u C tIl oro! fa .-I .u � CII ... 0 . 1 ..c CII
.u C ....
co t1S CII CII � �
0 . 05
0 . 02
A-20
Figure 44 . Standard Curves for Analysis of Amphetamine from Plasma on SE-30 Capillary
0
ln R
ln R
2 5 10
ng/mL
See Figure 42 fo� chromatographic conditions o Compound III ,as internal standard
• Compound II · as internal standard
(III) co . 954 ln [Amphetamine ] -2 . 90 (r • . 988)
(II) • . 981 ln [Amphetamine] -3 . 75 (r co . 996)
50 100
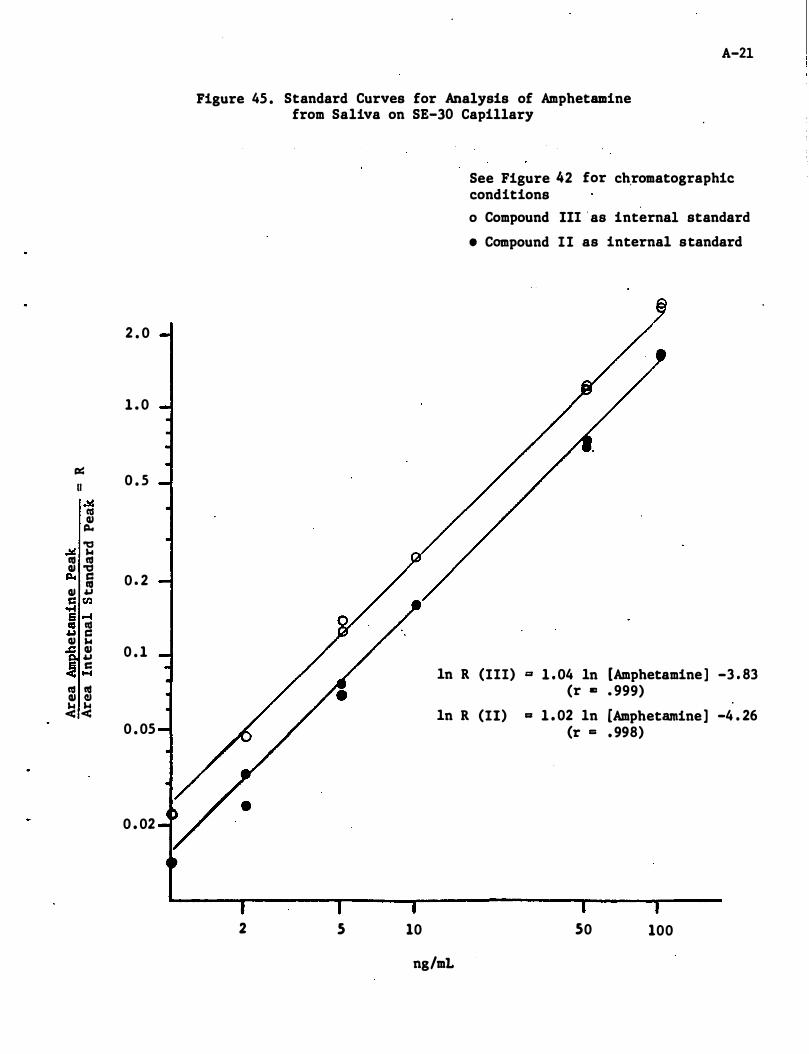
2 . 0
1 . 0
� (I 0 . 5
.!.is III Q) �
.!.is 'tJ ... III III Q) 'tJ � s:: 0 . 2 III Q) .u S:: tIl .... ; .-4 .u � Q) ... .c Q) 0 . 1 .u � s::
�
III III Q) CI � � 0 . 05
0 . 02
A-2l
Figure 45 . Standard Curves for Analysis of Amphetamine from Saliva on SE-30 Capillary
In R
In R
2 5 10
ng/mL
See Figure 42 for ch,romatographic conditions
o Compound III ' as internal standard
• Compound II as internal standard
(III) '" 1 . 04 In [Amphetamine ] -3 . 83 (r lIZ . 999)
(II) = 1 . 02 In [Amphetamine] -4 . 26 (r = . 998)
50 100
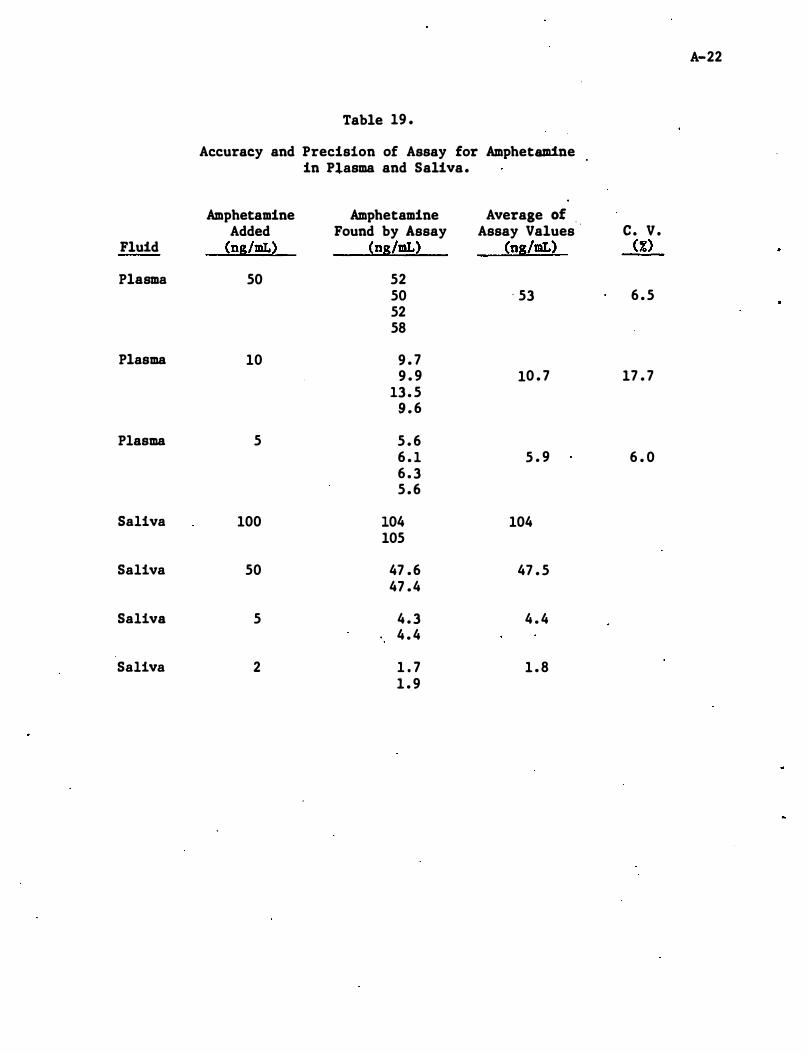
A-22
Table 19 .
Accuracy and Precision of Assay for Amphetamine in Plasma and Saliva.
Amphetamine Amphetamine Average of . Added Found by Assay Assay Values c . V .
Fluid (ns/mL) (ns/mL) (ns/mL) (%)
Plasma 50 52 50 ' 53 6 . 5 52 58
Plasma 10 9 . 7 9 . 9 10 . 7 17 . 7
13 . 5 9 . 6
Plasma 5 5 . 6 6 . 1 5 . 9 6 . 0 6 . 3 5 . 6
Saliva 100 104 104 105
Saliva 50 47 . 6 47 . 5 47 .4
Saliva 5 4 . 3 4 . 4 4 . 4
Saliva 2 1 . 7 1 . 8 1 . 9
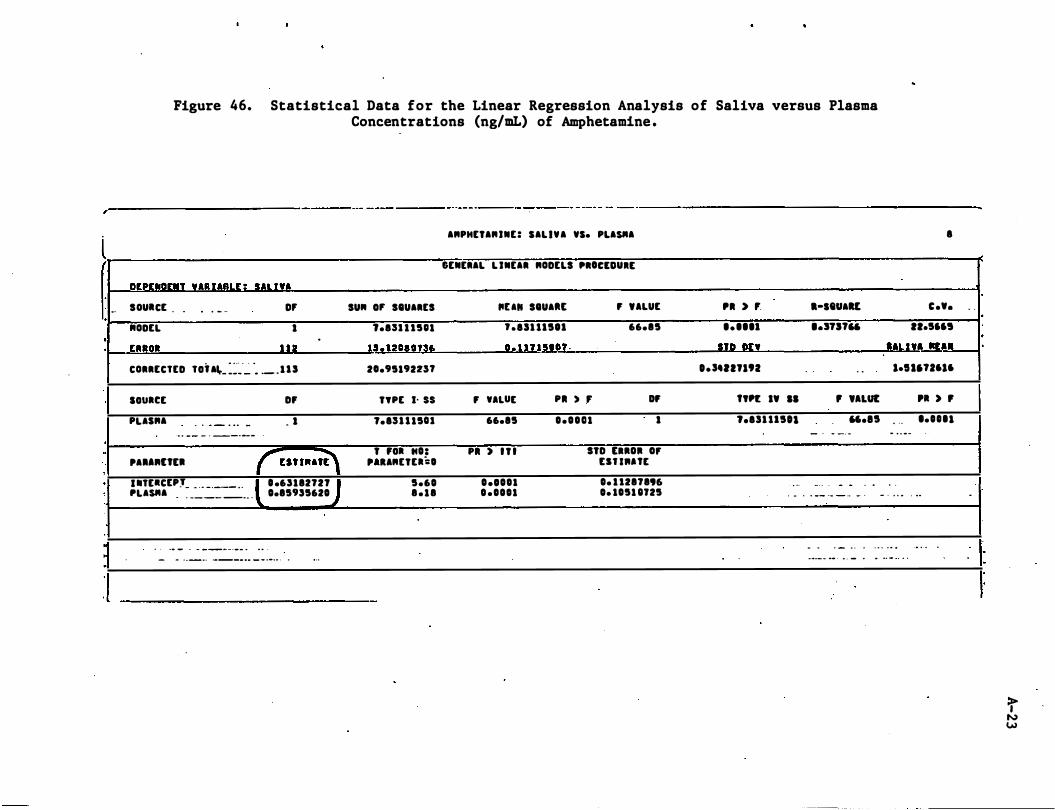
,
l -.
·
· ·
, ·
,
·
-
Figure 46. Statistical Data for the Linear Regression Analysis of Saliva versus Plasma Concentrations (ng/mL) of Amphetamine .
--------- - -- - - _.-- - --- - -- -- -----------------------
DEPtNDtNT UUAaLE � SALI" SOUICt
"ODtL
tRRoI
. - .. . - .. 0' I
1 1 1
CORRtCTED Toi AI,._ :��''':' ' • . _ _ 1 I S
souact
PUSRA . 0 .. _ . 0 . _
" . . _- _ . _-._-
DF
_ I
.
,. .... Utll r un""E" "TElCEPJ _ _ _ _ . __ . . PUSftA -
- -- -- -_ . .
. . -. - - - ------- - . . .
. .63112721 0.15955620
- - - . _ . 0 . ___ . _ .. _ _ .•.. . . , ..
ARPHETARINt: SALIVA VS. PLASftA
GtNERAL L INEAR RODtLS PROClDUlt
SU" 0' SIUARES "UII SIUAIlE F ULUt
t.ISl U511 ' .ISUI511 66.15
u. nOUnl! !!!UU5IOT ·
2O.95192U'
TYPt J. ss F "UE PI ) , OF
1.ISU 15U 66.15 0 . 0 0 1 1 I
T Foa "0: PI ) I T I STD tlROI 0, " URETta:O ut l .. nt
5.60 0 •• 001 0. U2171 .. 1 . 1 1 0 .0001 o. 1051 OJ25
'I ) , .-seVAU
..... 1 '.3TI1" IIR III:!
0.,.,.n'2 ..
. .
I
e •••
11.566'
IALI!' IlU. leU.1J6l6
"n •• II , "LUI: 'I ) , t.ISU1501
. ..
".15
_ . - _ . .
_ . . . . .
. . . - . 0 . -
. .
......
- . . _- -- - - _ . - • • 0 .. . ...
- . . _ .
.
.
.
..
. .
.
..
__ . ... 0 ' _ " ... .. . . . <, 0 - , •
. .
-
.
=r N W
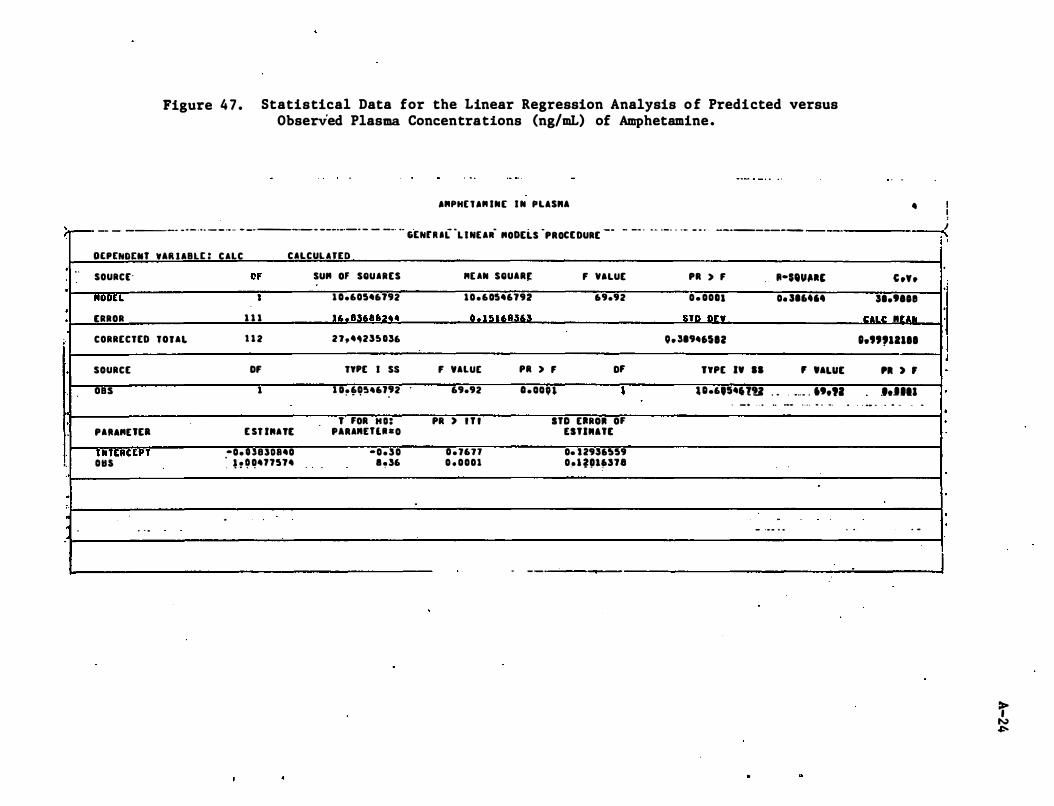
Figure 4 7 . Statistical Data for the Linear Regression Analysis o f Predicted versus Observed Plasma Concentrations (ng/mL) of Amphetamine.
I"PH[ ' I" IN[ I N PLIS .. I
)-- -- - ----- - - - . • • -- .- .. - -. ---.- - ---.-.-- - - -- •• GtNu aCL I NElR- "ODtLS -PROCE DURE -- - -- . • • . _- - -- - - . ----------
· . .
·
· ·
.
·
'.
·
:
DEP[NDENT VIR llalE : CllC CILCUllfEO
SOURCE-
-"OOU [AROR
CORRECTED TOUI.
SOURCE
oas
PA""Utl
I tlT ERtEPT 0115
. - .
Of 1
1 1 1
1 1 2
OF 1
E ST IMATE
-0. UUOS40 � h � �4n514
-
SU" Of SQUIRES
. . -
1 0.60546192
11. e�"8f1�.4
2l,4,23U36
TYPE I S5
1 O. 6054,J92 . . .. . .
T FOR H O : '.RAMUU - O
-0.30 e,36
MUN SQUAR� F VALUE
1 0 .60546192 69.92
II . 1 ! U"S363
F 'ALUE PR > F OF 69.92 o . oon ,
PR ) I T I ITO ERROl OF ESTIMatE
0 . J671 0. U9U559 0 . 0001 0 � 1 '!llf»n8
. - _ .
PR > F II-$'''�I' 0 . 0011 0. 316".
�Tft ft-:: V
0. 3194"12
TYPE I' II , '.LUE
U.6,S46'lU . . . _ .. _ . • t.n . _ . . . • .0 ___ . . . . . . ..
-- .... . . . .
.
4 ! I �
C .Y. 31.tlOe
II:ILII: .. r ..... 1.",12111
'I ) ,
J.UII . _. � . .. � .
. -
I · I ' I ·
I
:r N �
A-25
Appendix A - Detailed Analytical Methodologies . . , . ' ,'
A . 3 Chlorpromazine
r .
•
• . 1 • • • �
, . �
r
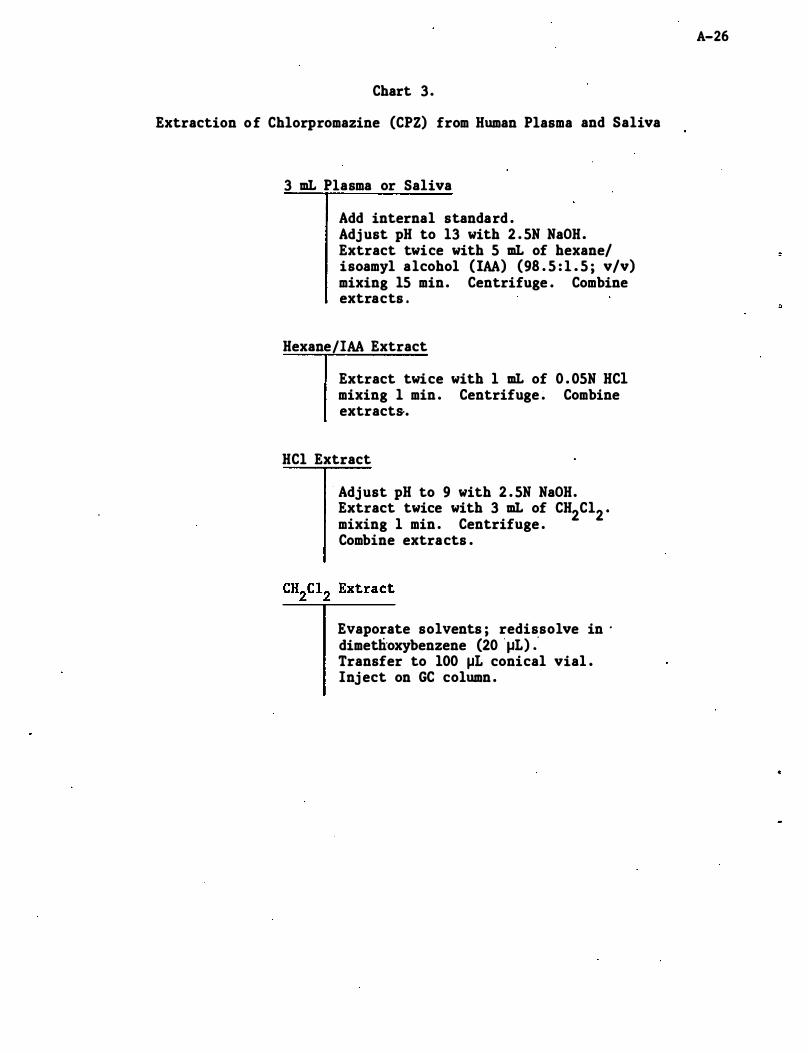
Chart 3 .
Extraction of Chlorpromazine (CPZ) from Human Plasma and Saliva
3 mL Plasma or Saliva
Add internal standard . Adj ust pH to 13 with 2 . 5N NaOH. Extract twice with 5 mL of hexane/ isoamyl alcohol (IAA) (98 . 5 : 1 . 5 ; v/v) mixing 15 min. Centrifuge . Combine extracts .
Hexane/IAA Extract
Extract twice with 1 mL of 0 . 05N HCI mixing 1 min . Centrifuge . Combine extract&.
HCl Extract
Adjust pH to 9 with 2 . 5N NaOH. Extract twice with 3 mL of CH2C12 • mixing 1 min . Centrifuge . Combine extracts .
Evaporate solvents ; redissolve in . dimetlioxybenzene (20 ' J-IL) : Transfer to 100 J-IL conical vial . Inj ect on GC column .
A-26
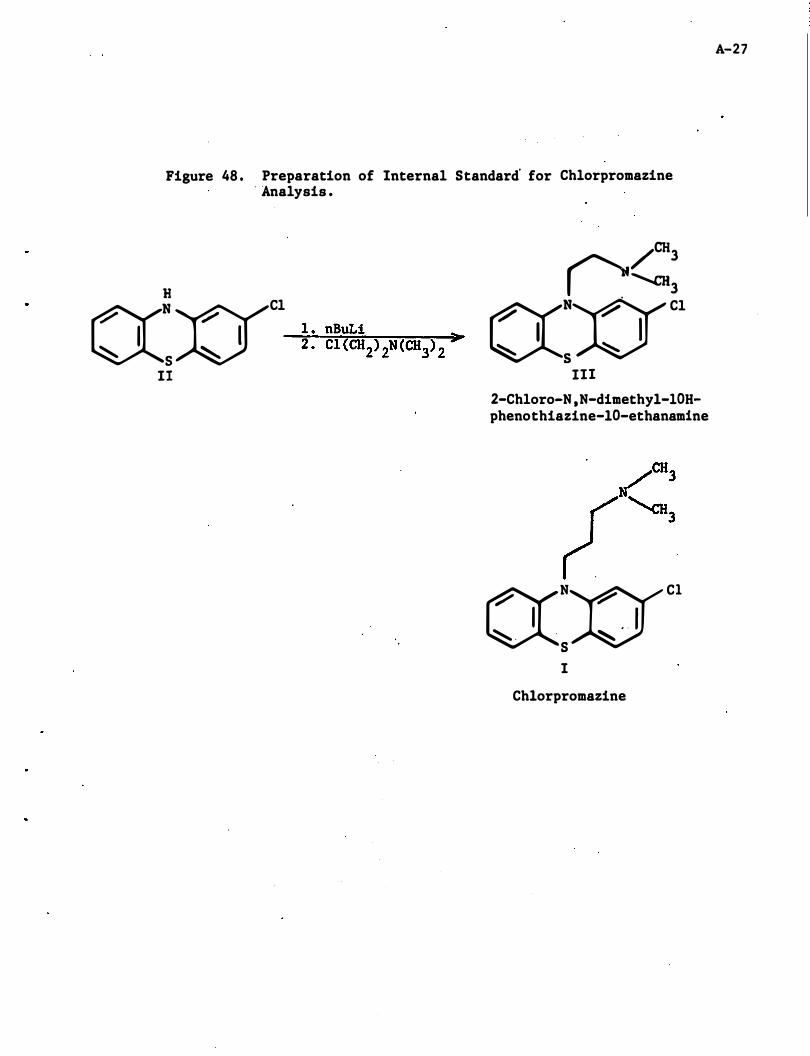
Figure 48 . Preparation of Internal Standard' for Chlorpromazine . Analysis .
((=:(YI Cl
� I � S
II
/CH3 0'-a13
((:xrC1
III
2-Chloro-N ,N-dimethyl-lOHphenothiazine-lO-ethanamine
((NX)'9' Cl
I . ' I � . . �
S I
Chlorpromazine
A-27
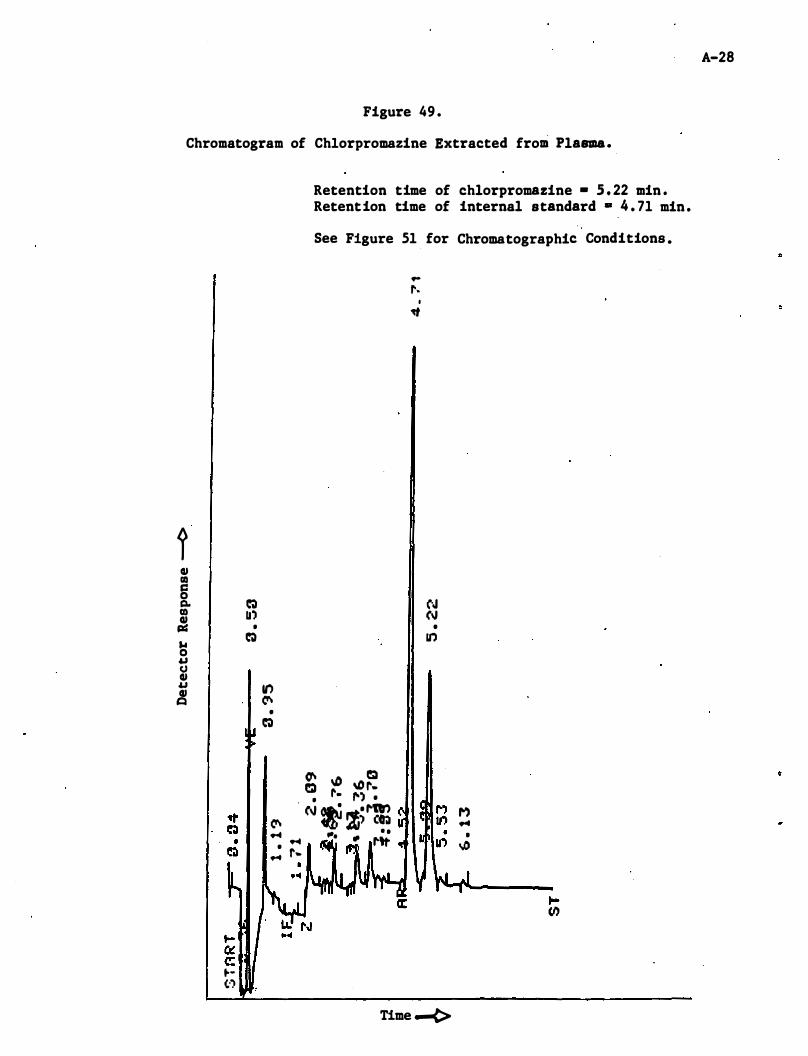
Figure 49 .
Chromatogram of Chlorpromazine Extracted from Plasma.
t QI III c:: 0 � Co III II') QI j:I=I •
� ... 0 u U QI U It) QI c:a � •
�
� � � � •
� • ...
to-" c: to-(:')
Retention time of chlorpromazine - S . 22 min . Retention time of internal standard • 4 . 71 min .
See Figure 51 for Chromatographic Conditions •
� ltD C!:I e:. ", r. 1'. 1"') • • . I n1r') (\J � �; (� I . � "" � ,.tt
t-
.. r.
I �
N (\J • go)
Time -¢>
M �
I tJJ
t-tl)
A-28
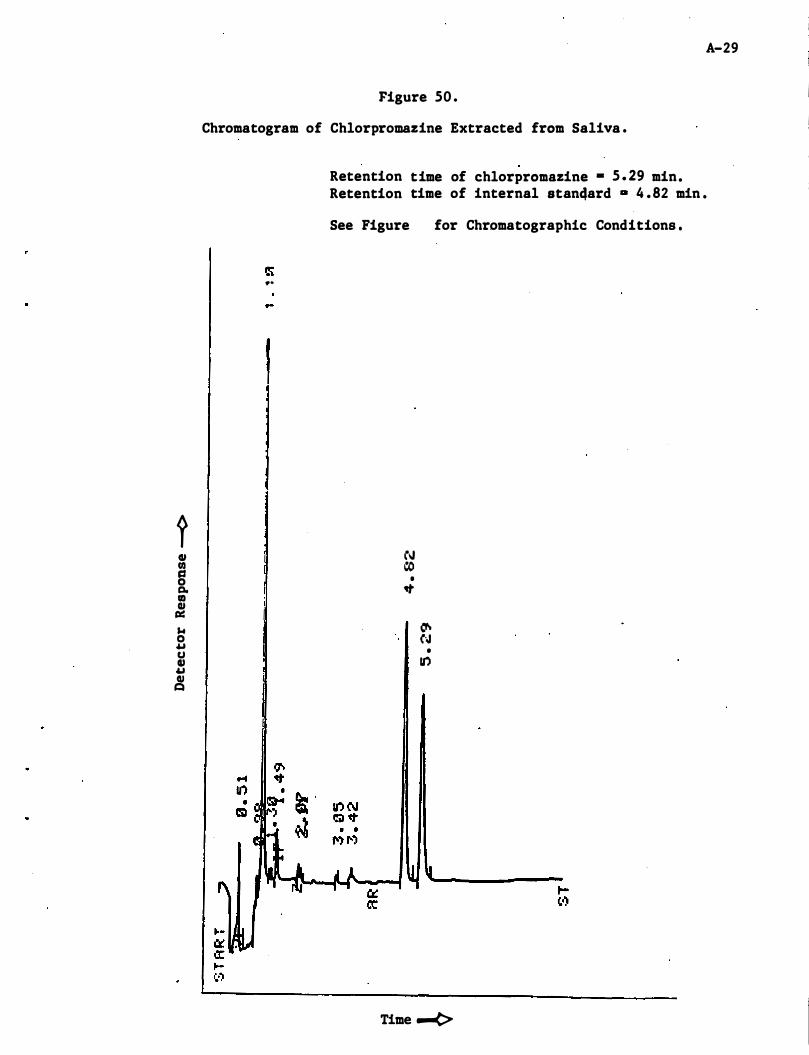
? GI fIl c:s 0 a. aI GI CI:: $.I 0 .u U GI .u GI t:I
A-29
Figure 50 .
Chromatogram of Chlorpromazine Extracted from Saliva .
...
I
Retention time of chlorpromazine • 5 . 29 min. Retention time of internal stan4ard D 4 . 82 min .
See Figure for Chromatographic Conditions •
(oJ CO
• �
� N •
U")
Time ....e>
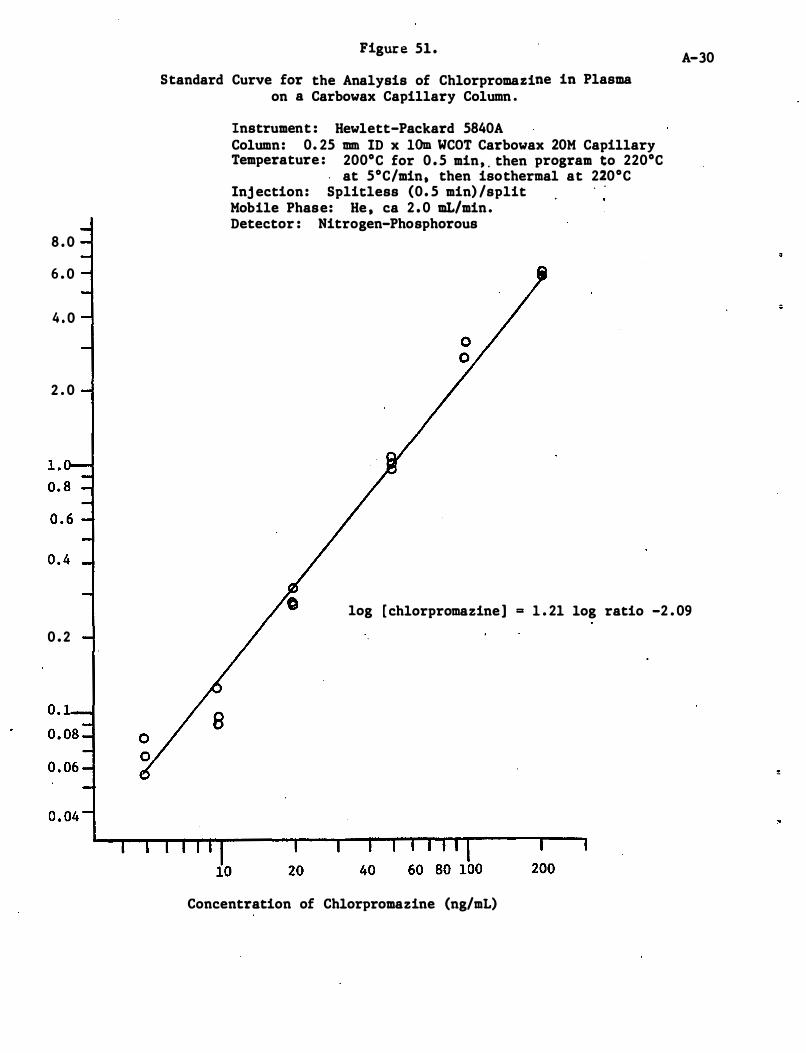
8 . 0
6 . 0
4 . 0
2 . 0
0 . 2
Figure 51 .
Standard Curve for the Analysis of Chlorpromazine in Plasma on a Carbowax Capillary Column .
Instrument : Hewlett-Packard 5840A Column: 0. 25 mm ID x 10m WCOT Carbowax 20M Capillary Temperature : 200°C for 0 . 5 min, . then program to 220°C
. at 5°C/min, then isothermal at 220°C Inj ection: Splicless (0 . 5 min) /split Mobile Phase: He , ca 2 . 0 mL/min. Detector : Nitrogen-Phosphorous
A-30
log [ chlorpromazine] = 1 . 21 log ratio -2 . 09
B
Concentration of Chlorpromazine (ng/mL)
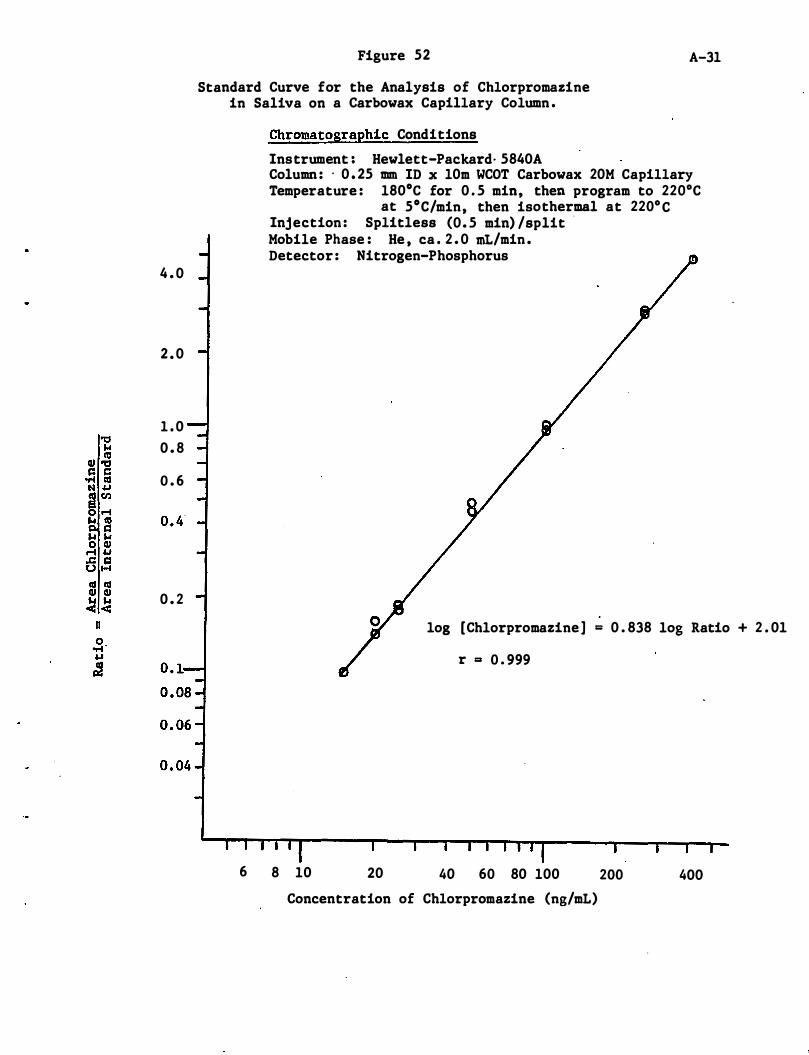
4 . 0
2 . 0
1 . 0 0 . 8
0 . 6
0 . 2
Figure 52
Standard Curve for the Analysis of Chlorpromazine in Saliva on a Carbowax Capillary Column .
A-31
Chromatographic Conditions
Instrument : Hewlett-Packard· 5840A Column : . 0 . 25 mm ID x 10m WCOT Carbowax 20M Capillary Temperature : 180°C for 0 . 5 min, then program to 220°C
at 5°C/min, then isothermal at 220° C Injection : Splitless (0. 5 min) /split . Mobile Phase : He , ca . 2 . 0 mL/min . Detector : Nitrogen-Phosphorus
log [Chlorpromazine ] = 0 . 838 log Ratio + 2 . 01
r = 0 . 999
6 8 10 20 40 60 80 100
Concentration of Chlorpromazine (ng/mL)
200 400
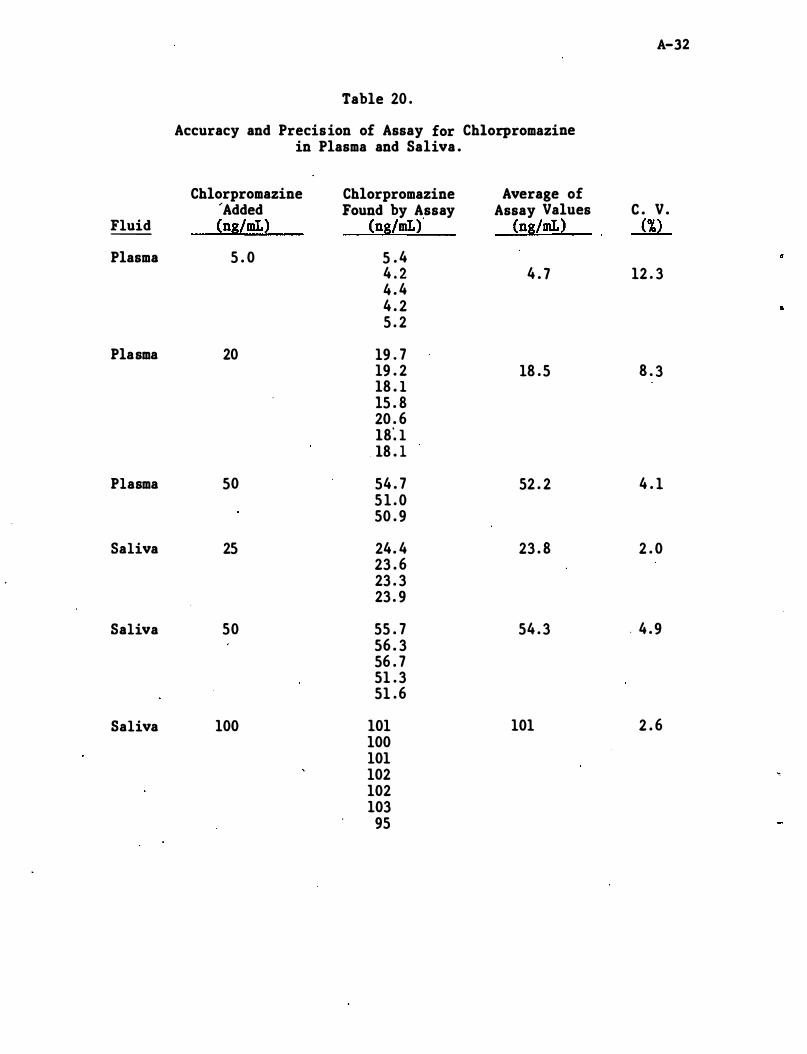
A-32
Table 20 . Accuracy and Precision of Assay for Chlorpromazine
in Plasma and Saliva .
Chlorpromazine Chlorpromazine Average of 'Added Found by Assay Assay Values C . V .
Fluid (ng/mL) (ng/mL) (ng/mL) (%) --
Plasma 5 . 0 5 . 4 4 . 2 4 . 7 12 . 3 4 . 4 4 . 2 5 . 2
Plasma 20 19 . 7 19 . 2 18 . 5 8 . 3 lB . l l5 . B 20 . 6 lB� l lB . 1
Plasma 50 54 . 7 52 . 2 4 . 1 5 1 . 0 50 . 9
Saliva 25 24 . 4 23 . B 2 . 0 23 . 6 23 . 3 23 . 9
Saliva 50 55 . 7 54 . 3 . 4 . 9 56 . 3 56 . 7 51 . 3 51 . 6
Saliva 100 101 101 2 . 6 100 101 102 �
102 103
95
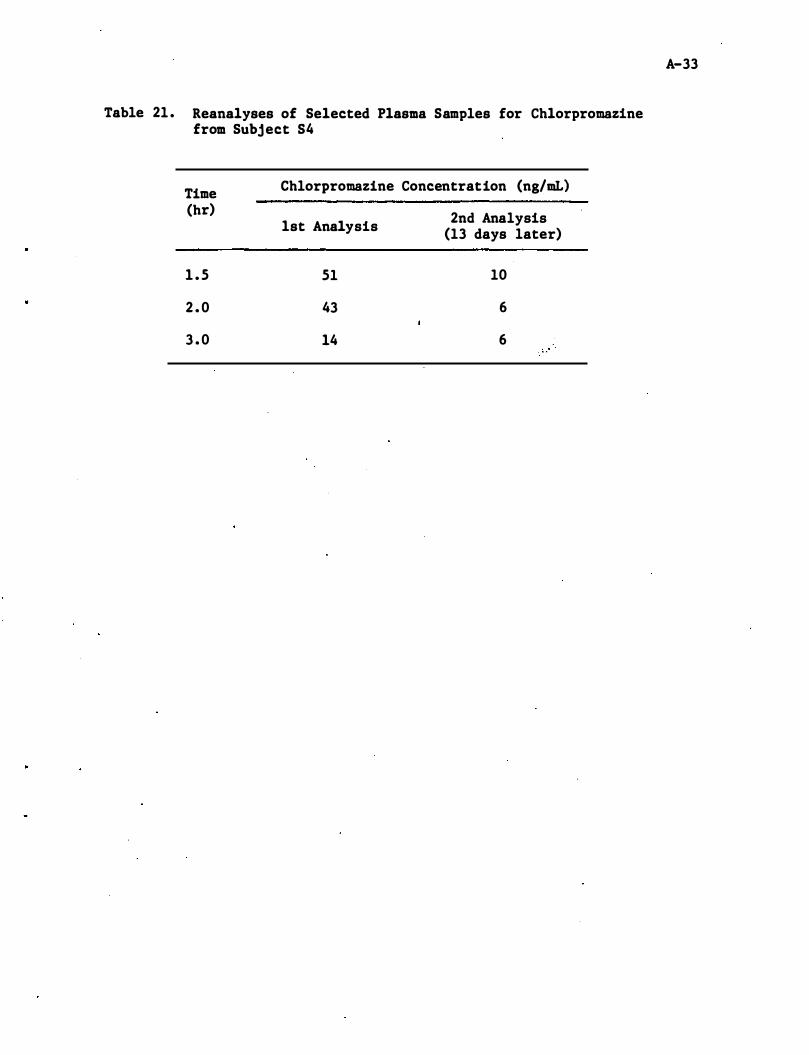
Table 21 . Reanalyses of Selected Plasma Samples for Chlorpromazine from Subject S4
Time Chlorpromazine Concentration (ng/mL)
(hr) 2nd Analysis 1st Analysis (13 days later)
1 . 5 51 10
2 . 0 43 6
3 . 0 14 6 , "
A-33

Appendix A - Detaile� Analytical Methodologies
A . 4 Diazepam
A-34
=
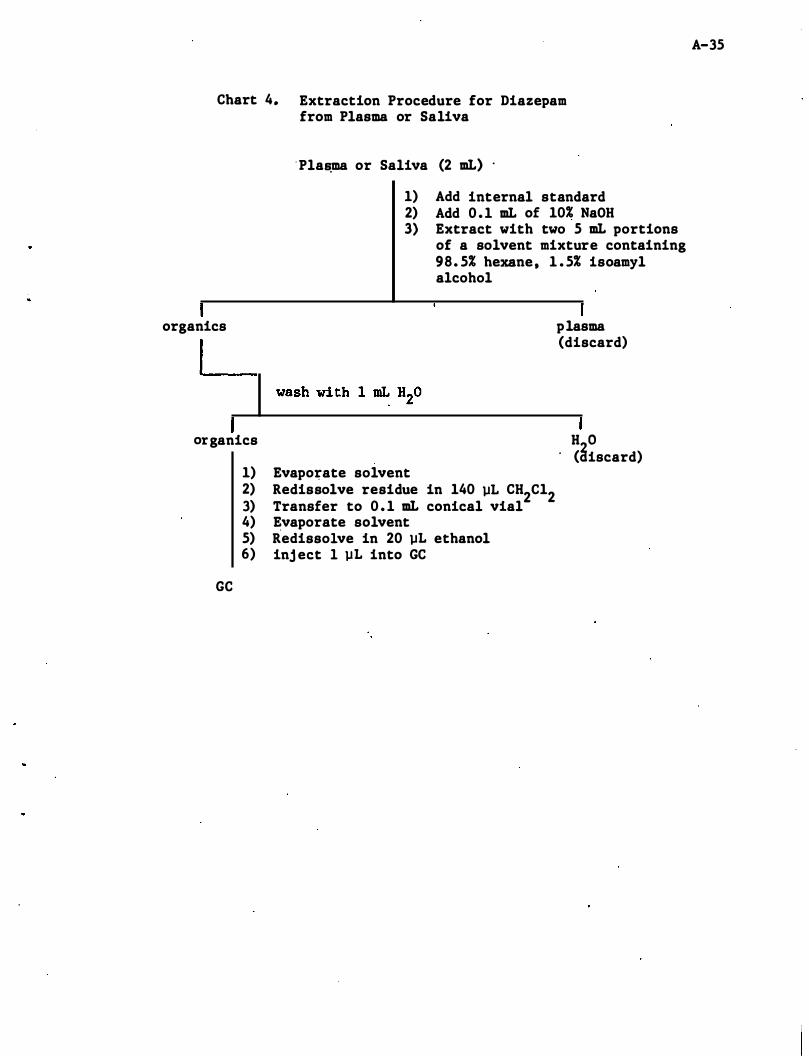
Chart 4. Extraction Procedure for Diazepam from Plasma or Saliva
' Pla�ma or Saliva (2 mL) .
1) Add internal standard 2) Add 0 . 1 mL of 10% NaOH 3) Extract with two 5 mL portions
of a solvent mixture containing 98. 5% hexane, 1 . 5% isoamyl alcohol
organics plasma
organics
GC
1) Evapo�ate solvent 2) Redissolve residue in 140 �L CH2C12 3) Transfer to 0 . 1 mL conical vial 4) Evaporate solvent 5) Redissolve in 20 �L ethanol 6) inj ect 1 �L into GC
(discard)
H 0 . (3iscard)
A-35
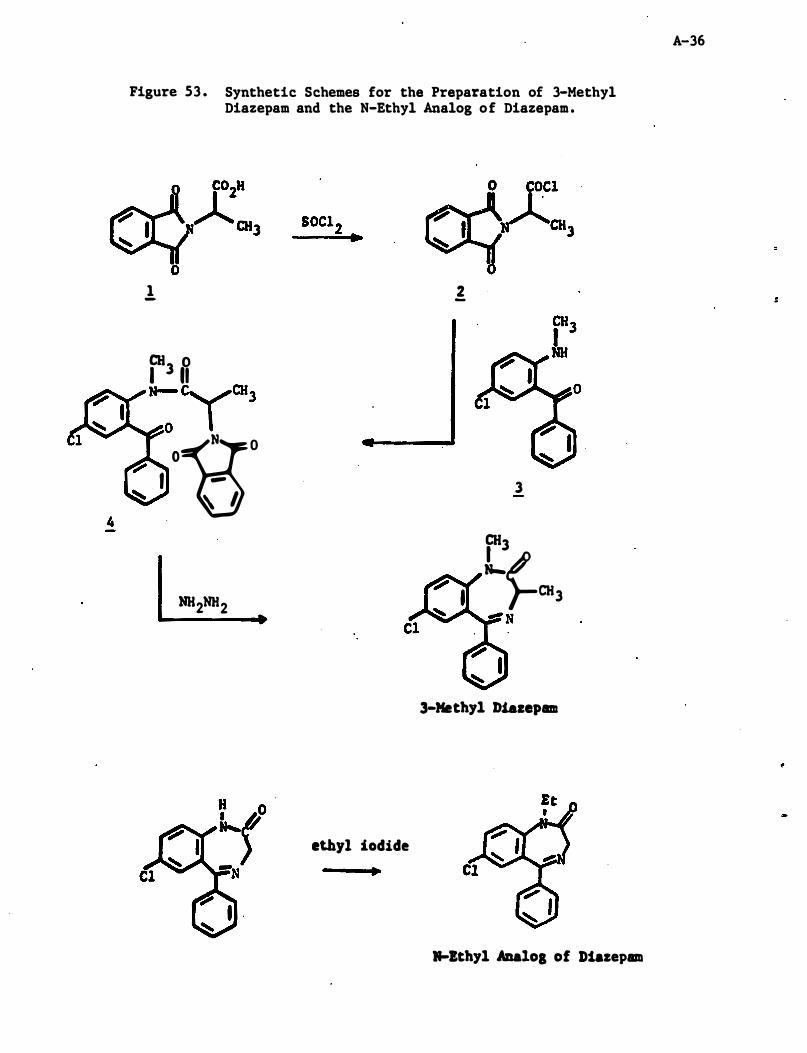
4
Figure 53 . Synthetic Schemes for the Preparation of 3-Methyl Diazepam and the N-Ethyl Analog of Diazepam .
1 -
r3 B --;YCHl 0 � -go
I -� � l
NH2NH2
2 -
3 CH3 L�CHl �N
3-Methyl Diazepam
ethyl iodide •
�Ithyl ABaloS of Diazepam
A-36
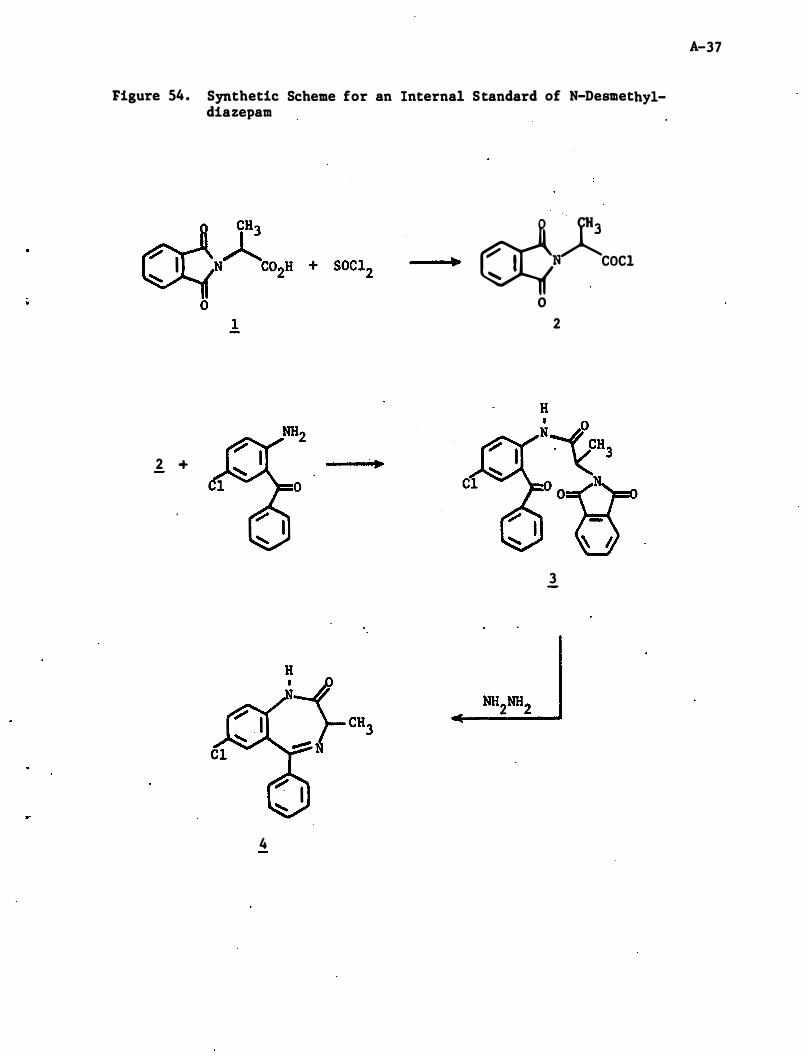
Figure 54. Synthetic Scheme for an Internal Standard of N-Desmethyldiazepam
��COCI
o 1 2
2 + III
3
4
A-37
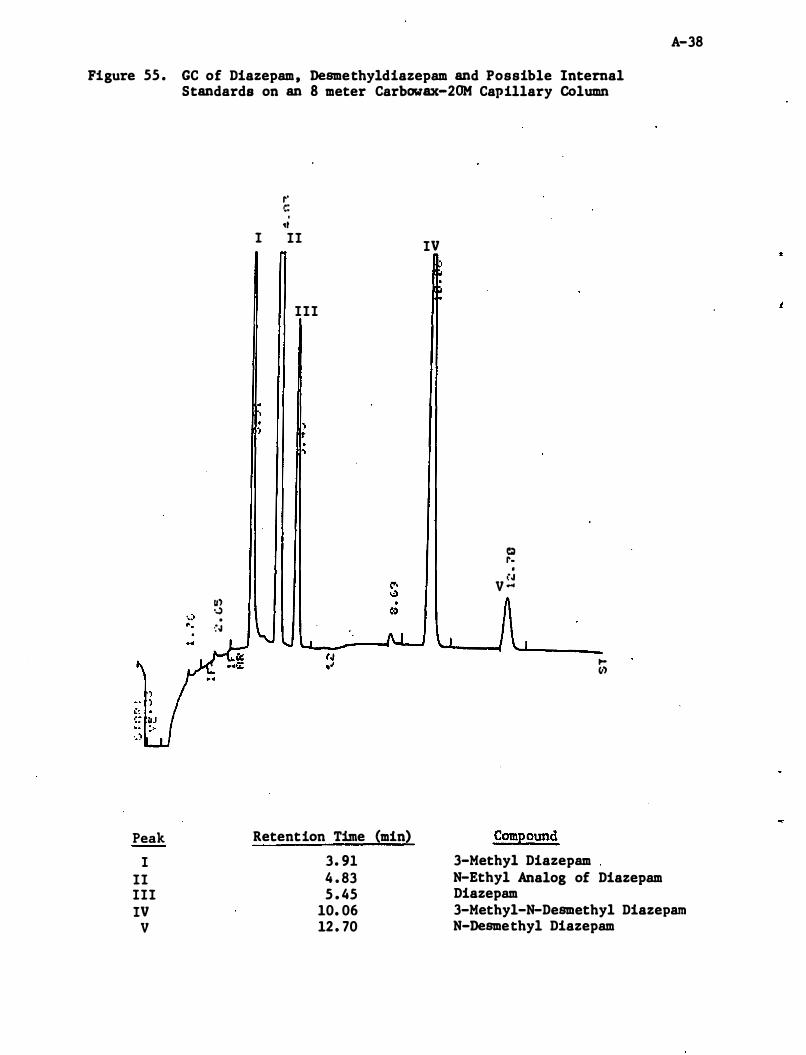
A-38
Figure 55 . GC of Diazepam, Desmethyldiazepam and Possible Internal Standards on an 8 meter Carbowax-2OM Capillary Column
Peak
I II III IV
V
Ul ,..) . . �.J
r' c: . ,I
I II
III
, ) , 'I
Retention Time (min)
3. 91 4 . 83 5 . 45
10. 06 12 . 70
IV
Q 1'. , i.J
V '"
Compound
3-Methyl Diazepam
toIII
N-Ethyl Analog of Diazepam Diazepam 3-Methyl-N-Desmethyl Diazepam N-Desmethyl Diazepam
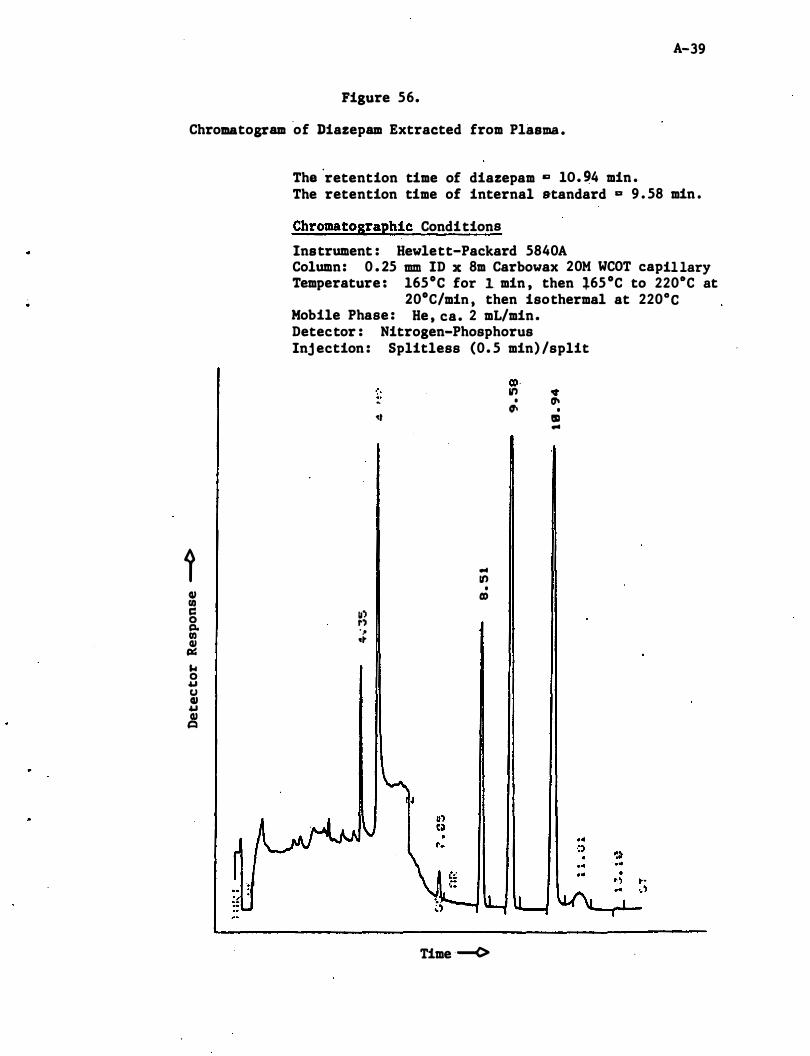
A-39
Figure 56.
Chromatogram ·of Diazepam Extracted from Plasma .
i QI I/) c: 0 c:t. I/) QI c:.: ... 0 "" CJ QI "" QI �
The 'retention time of diazepam c lO. �4 min . The retention time of internal standard D 9 . 58 min .
Chromatographic Conditions
Instrument : Hewlett-Packard 5840A Column: 0 . 25 mm ID x 8m Carbowax 20M WeOT capillary Temperature : l65°e for I. min , then �65 °C to 2200e at
20°C/min , then isothermal at 220°C Mobile Phase : He , ca. 2 mL/min. Detector : Nitrogen-Phosphorus Inj ection : Splitless (0. 5 min) /split
co '. ' U') • � • (1\ (1\ • �t III ...
... It)
• co
�:. 1'') .� .t"
Time --<>
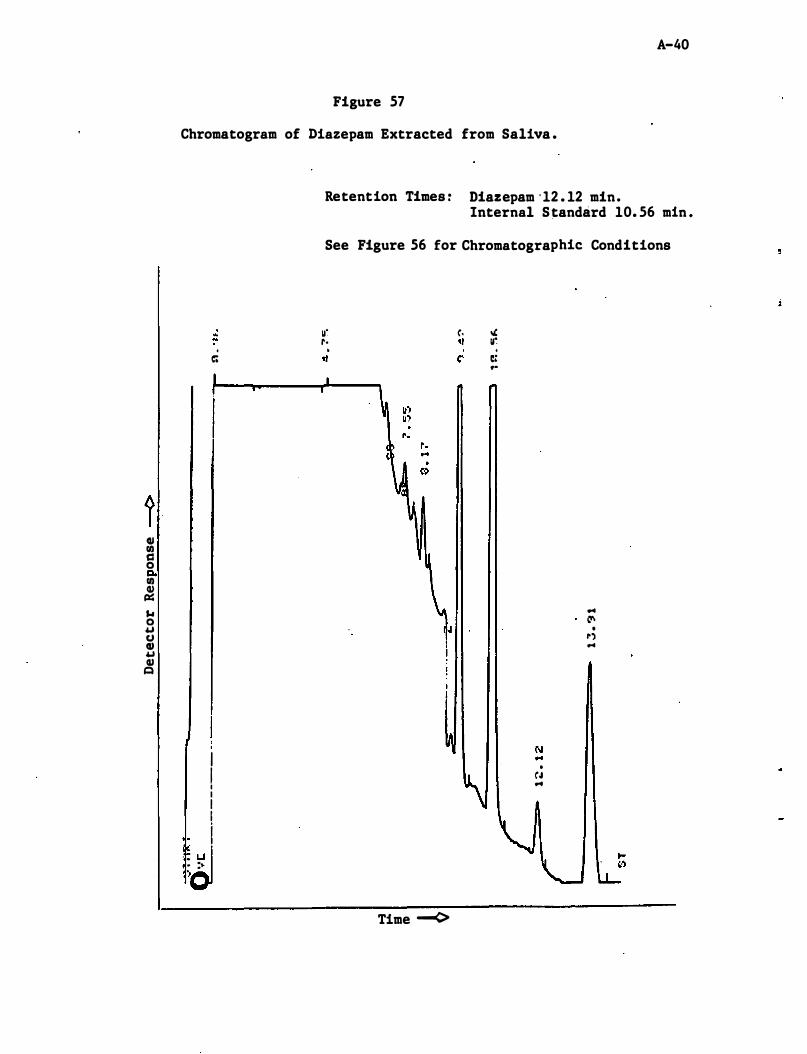
1 QI fI) c:: 0 c. fI) Q) Ill:: ... 0 � CJ Q) � Q)
Q
A-40
Figure 57
Chromatogram of Diazepam Extracted from Saliva .
� .
c;
I I I I I I i . . � . . : .. . }
Retention Times : Diazepam ' 12 . 12 min. Internal S tandard 10. 56 min .
See Figure 56 for Chromatographic Conditions
u' c. " r· " . " C'
Time --<>
Ir. . �: ..
. C"' M
... 0'
• 1'') ...
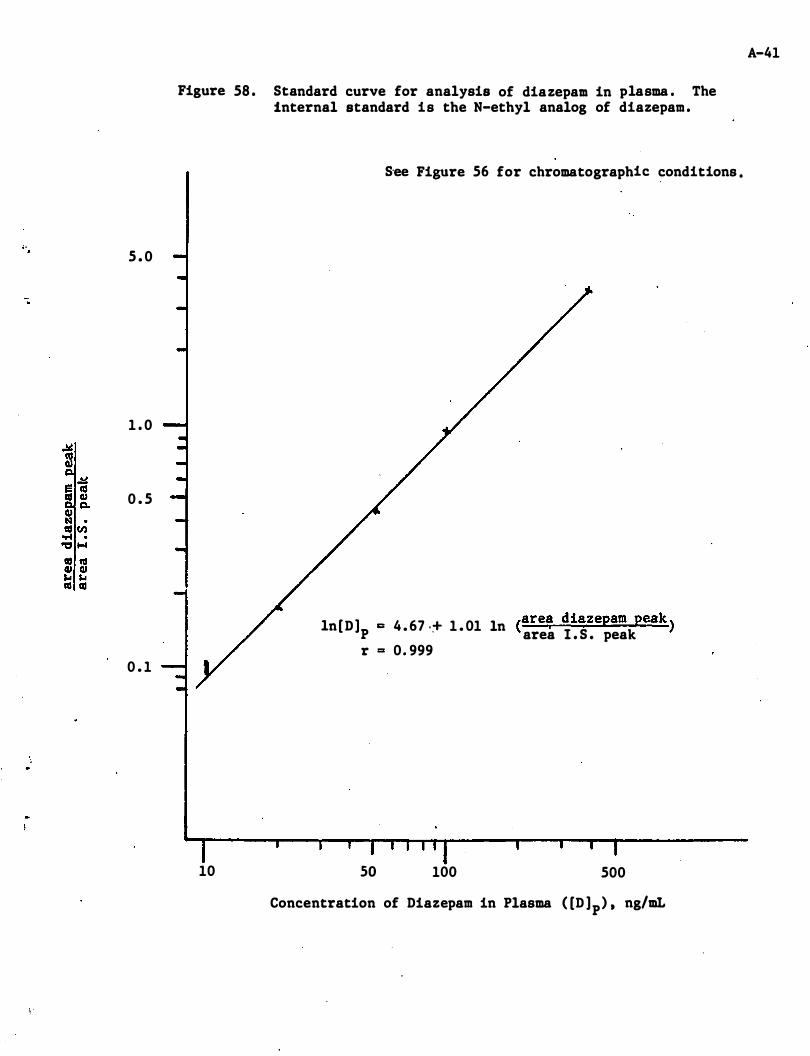
5 . 0
1 . 0
0 . 5
0 . 1
\ '
Figure 58 . Standard curve for analysis of diazepam in plasma . The internal standard is the N-ethyl analog of diazepam .
10
S'ee Figure 56 for chromatographic conditions .
In[ D ]p c 4 . 67 .� 1 . 01 ln (are, diazepam peak ) area I . S . peak r = 0. 999
so 100 500
Concentration of Diazepam in Plasma ( [D ]p) ' ng/mL
A-41
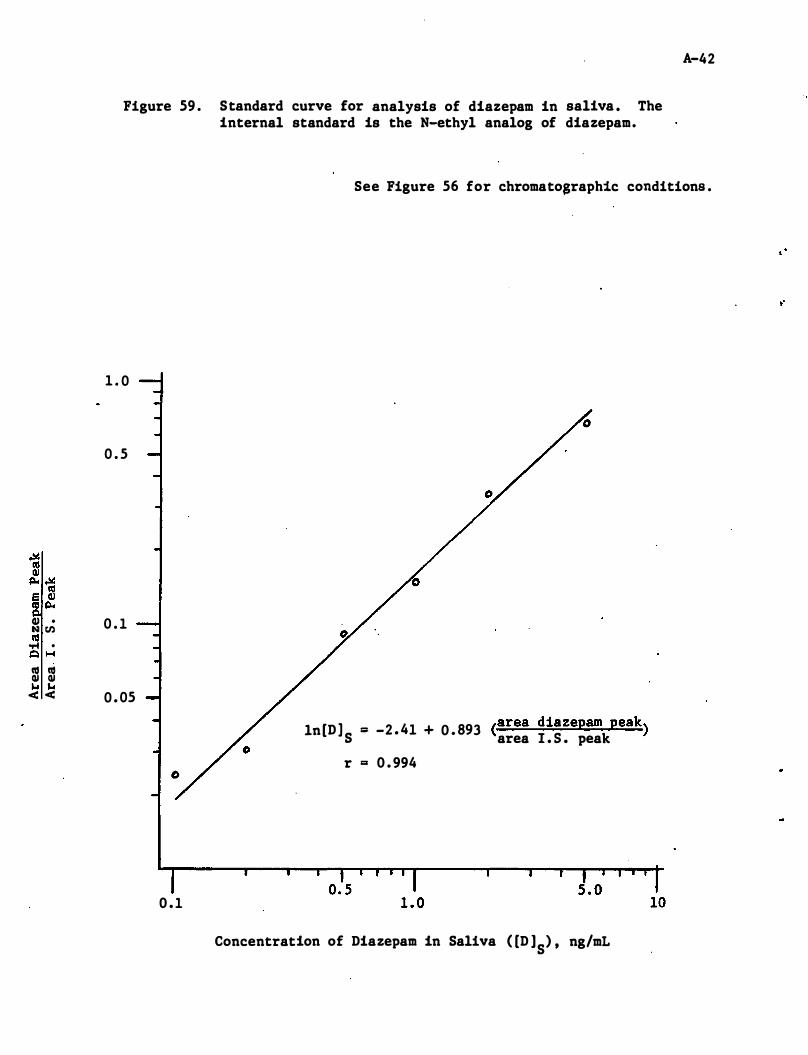
Pigure 59 . Standard curve for analysis of diazepam in saliva . The internal standard is the N-ethyl analog of diazepam.
A-42
See Pigure 56 for chromato$raphic conditions .
1 . 0
0 . 5
� rn 0 . 1 lIS .... .
/!::I H
m m ... ... < < 0 . 05
In[D ] S = -2 . 41 + 0 . 893 (area diazepam peak) area 1 . 5 . peak
r = 0 . 994
0 . 1
Concentration of Diazepam in Saliva ( [D ]S) ' ng/mL
"
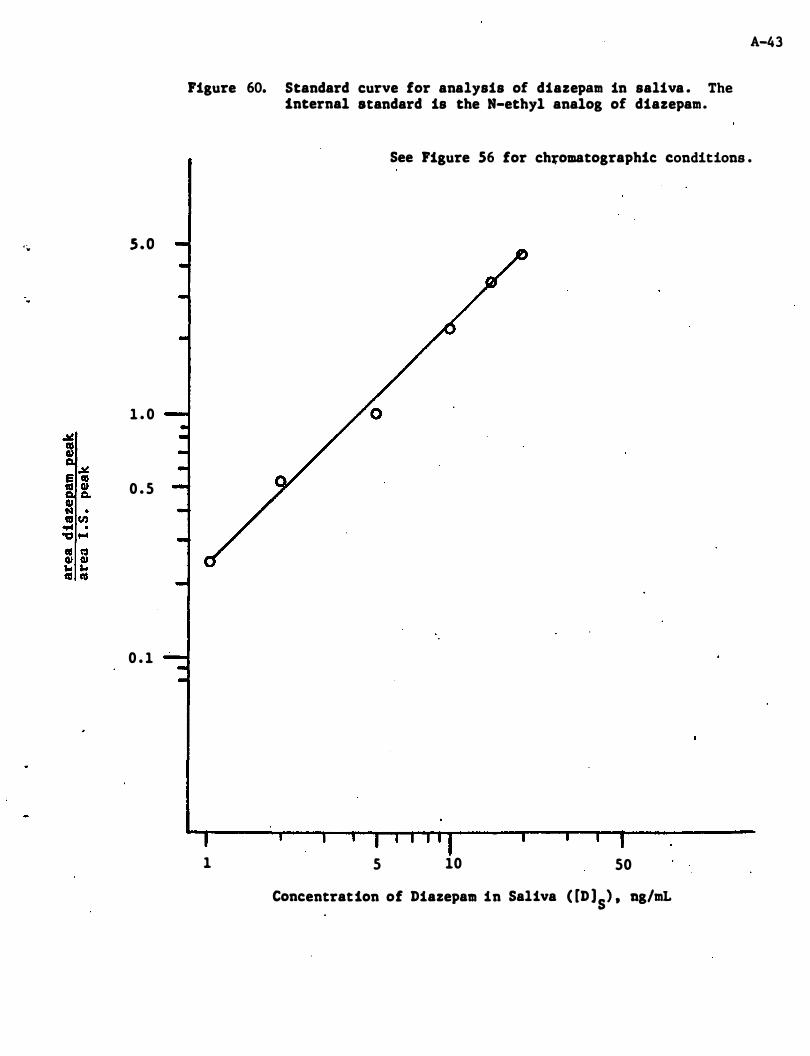
' ;' s . o
1 . 0
0 . 5
0 . 1
Figure 60. Standard curve for analysis of diazepam in saliva . The internal standard is the N-ethyl analog of diazepam.
A-43
See Figure S6 for chfomatographic conditions .
1 5 10 50
Concentration of DiazepaM in Saliva ( [D ]S) ' ng/mL
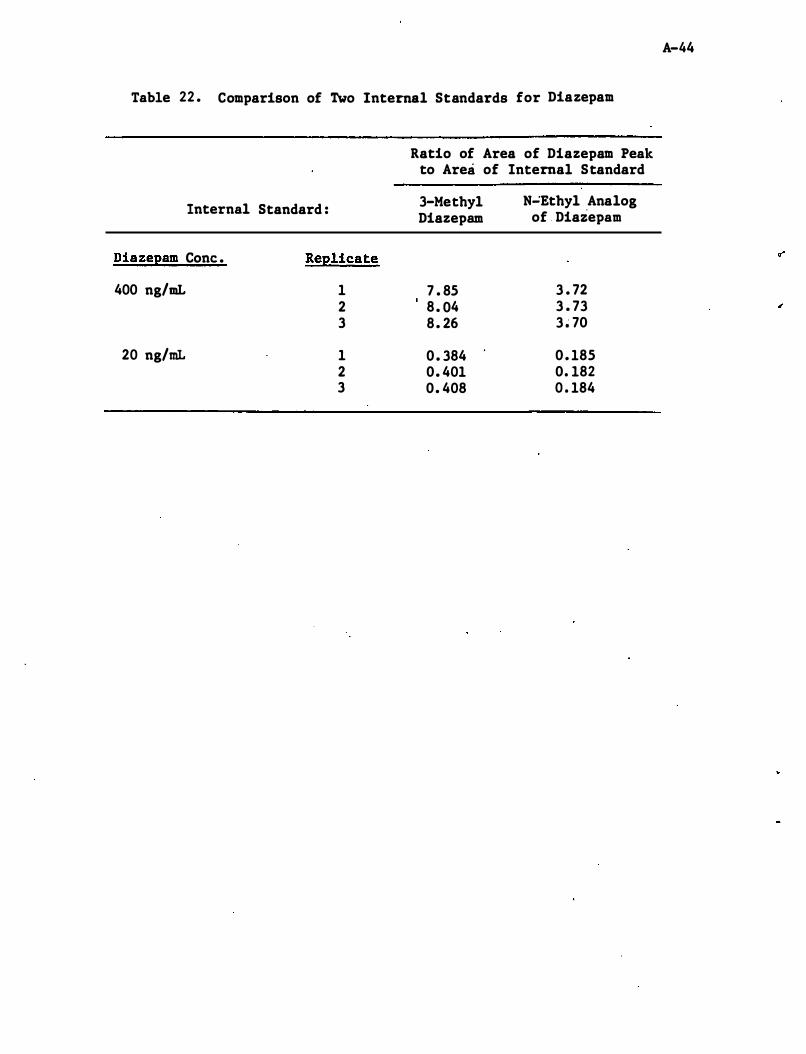
Table 22 . Comparison of Two Internal Standards for Diazepam
Internal
Diazepam Cone .
400 ng/mL
20 ng/mL
Standard :
Replicate
1 2 3
1 2 3
Ratio of Area of Diazepam Peak to Area of Internal Standard
3-Metbyl N":Etbyl Analog Diazepam of Diazepam
7 . 85 3 . 72 8 . 04 3 . 73 8 . 26 3 � 70
0 . 384 0 . 185 0. 401 0. 182 0. 408 0 . 184
A-44
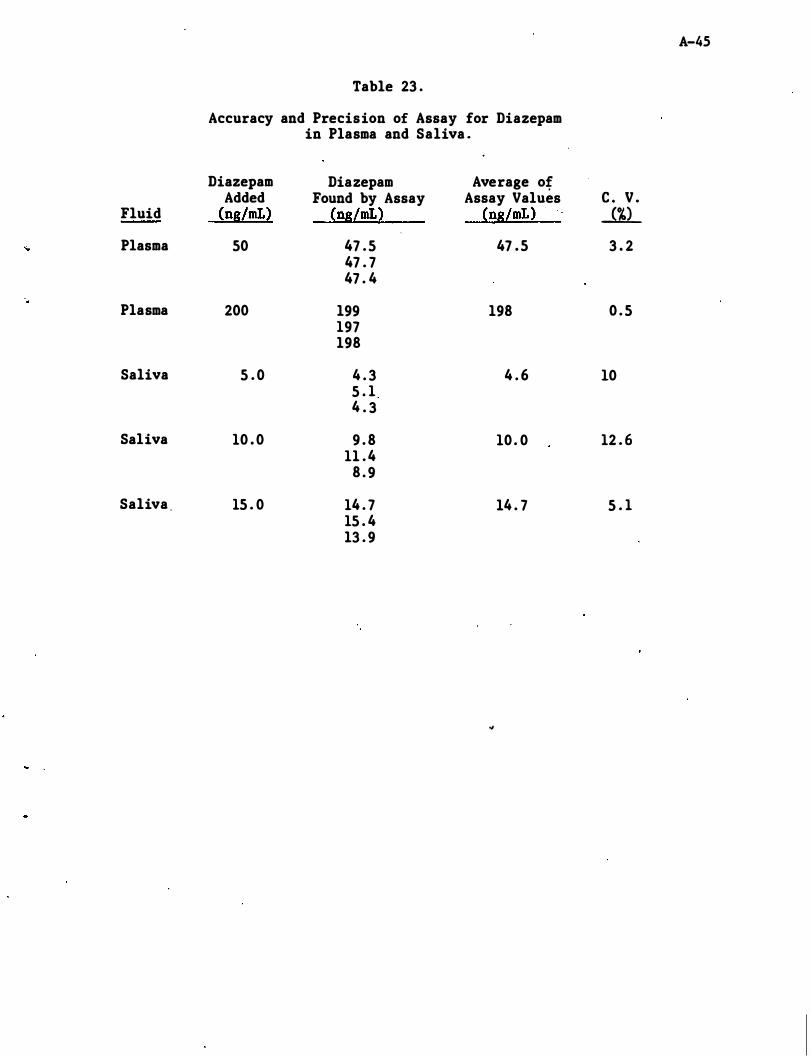
A-45
Table 23 .
Accuracy and Precision of Assay for Diazepam in Plasma and Saliva .
Diazepam Diazepam Average of Added Found by Assay Assay Values c . V .
Fluid (ng/mL) (ng/mL) (ng/mL) ...m... Plasma 50 47 . 5 47 . 5 3 . 2
47 . 7 47 . 4
. Plasma 200 199 198 0 . 5
197 198
Saliva 5 . 0 4 . 3 4 . 6 10 5 . 1 4 . 3
Saliva 10 . 0 9 . 8 10 . 0 12 . 6 11 . 4
8 . 9
Saliva . 15 . 0 14 . 7 14 . 7 5 . 1 15 . 4 13 . 9
..

Appendix A - Detailed Analytical Methodologies
A . 5 Diphenhydramine
A-4�
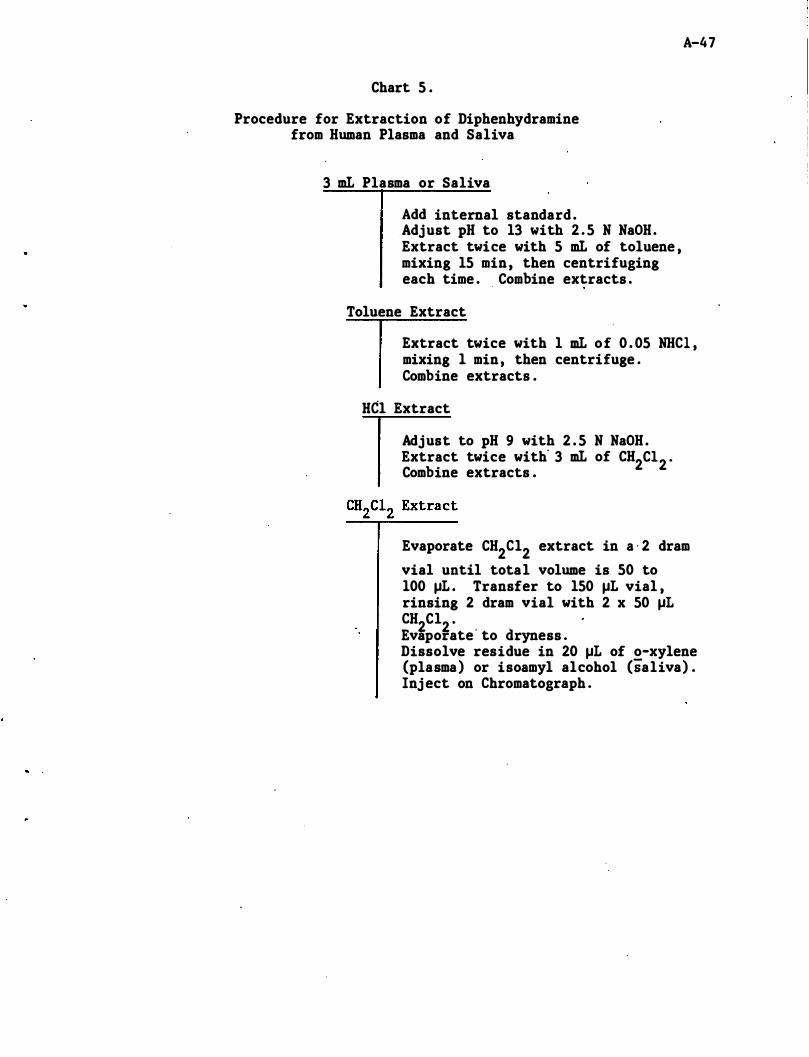
Chart 5 .
Procedure for Extraction of Diphenhydramine from Human Plasma and Saliva
3 mL Plasma or Saliva
Add internal standard . Adjust pH to 13 with 2 . 5 N NaOH. Extract twice with 5 mL of toluene , mixing 15 min , then centrifuging each time . Combine extracts .
Toluene Extract
A-47
Extract twice with 1 mL of 0 . 05 NBCl , mixing 1 min , then centrifuge . Combine extracts .
Hel Extract
Adjust to pH 9 with 2 . 5 N NaOH . Extract twice with' 3 mL of CH2Cl2 . Combine extracts .
Evaporate CH2Cl2 extract in a ' 2 dram vial until total volume is 50 to 100 �L . Transfer to 150 �L vial , rinsing 2 dram vial with 2 x 50 �L CH2Cl2 · Evaporate ' to dryness . Dissolve residue in 20 �L of o-xylene (plasma) or isoamyl alcohol (saliva) . Inj ect on Chromatograph .
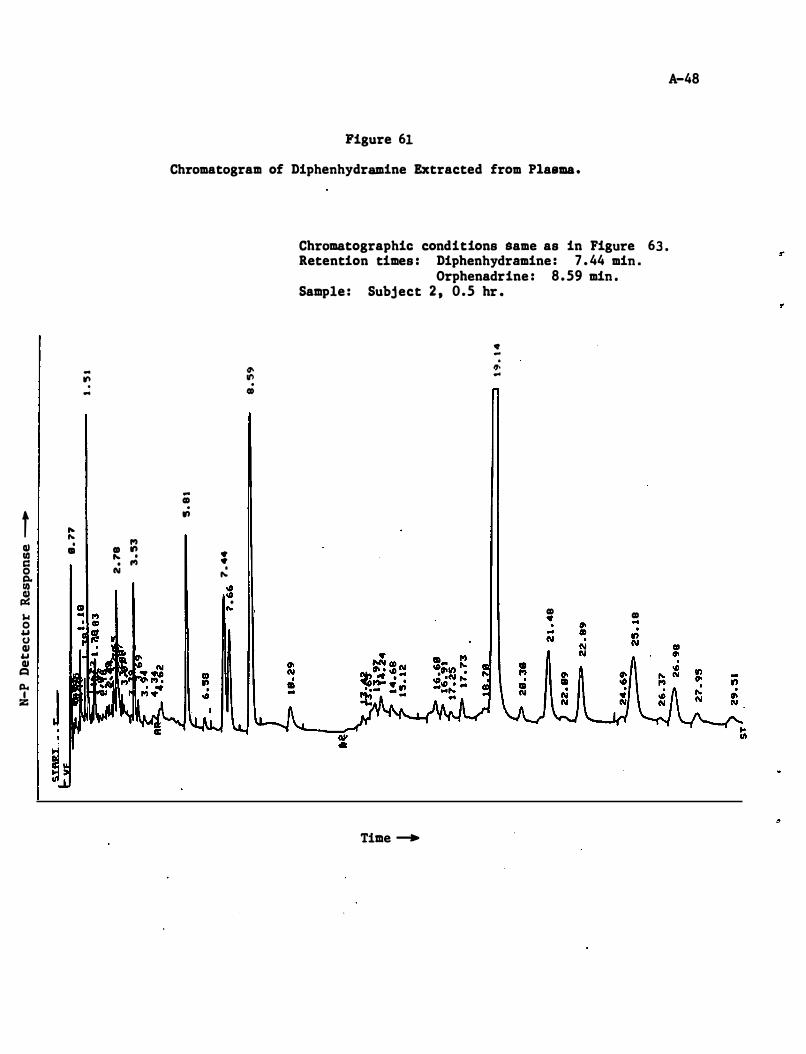
.. ... . ...
t ... ... Q) . 1'1
CD CD ., III ... . c:: . 1'1 0 N tl. III � $.I 0 .. (J QI .. QI t=I
Po. I Z
Figure 61
Chromatogram of Diphenhydramine Extracted from Plasma .
tt> It') . CD
.. CD . .,
• • . ... III III
• ...
Chromatographic conditions Same as in Figure 63 . Retention times : Diphenhydramine : 7 . 44 min .
Orphenadrine : 8 . 59 min . Sample : Subj ect 2 , 0.5 hr •
• -. ". ..
Time -+
CD • CD ..
A-48
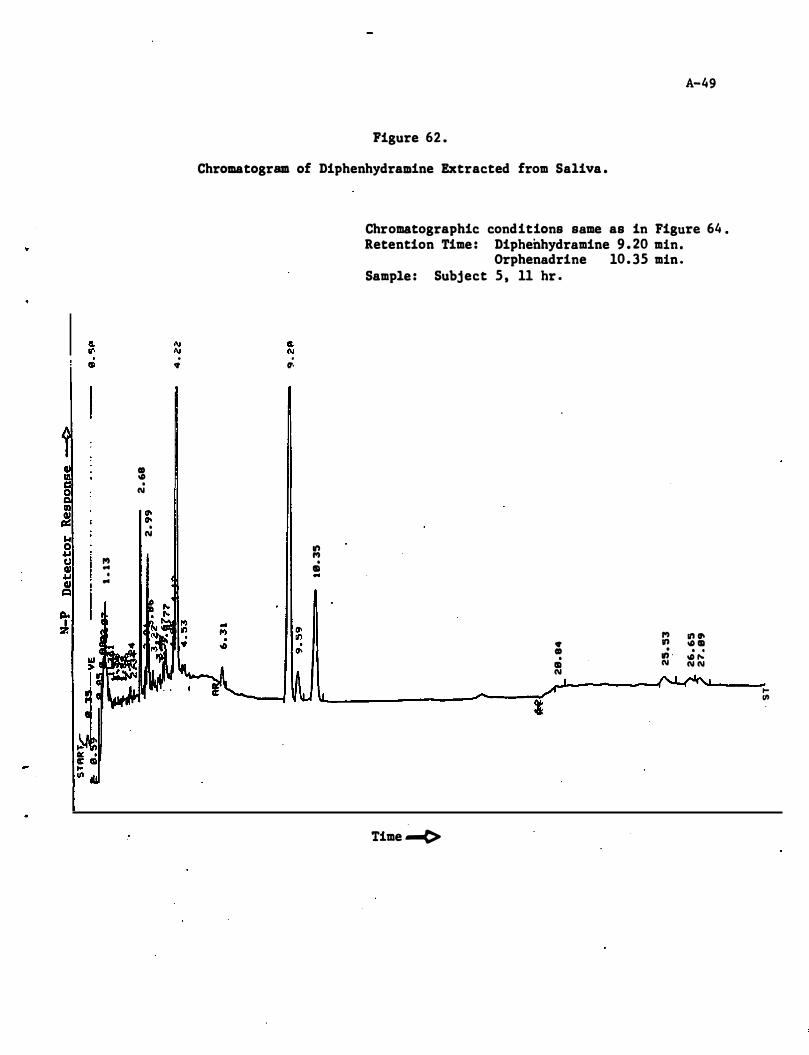
. <t
CD � . N II) cr-:! cr-. � N 0 4.J U ,., II .. 4.J •
II .. 1:1 � I l7.
A-49
Figure 62 .
Chromatogram of Diphenhydramine Extracted from Saliva .
. It·
." ,., . ID ..
Chromatographic cond itions same as in Figure 64 . Retention Time : Diphenhydramine 9 . 20 min .
Orphenadrine 10. 35 min . Sample : Subj ect 5 , 11 hr •
<t CD . ID N
I
Time .....(>
,., ." . .,, -N
." cr-� ID . . � ,.. N N
'" en
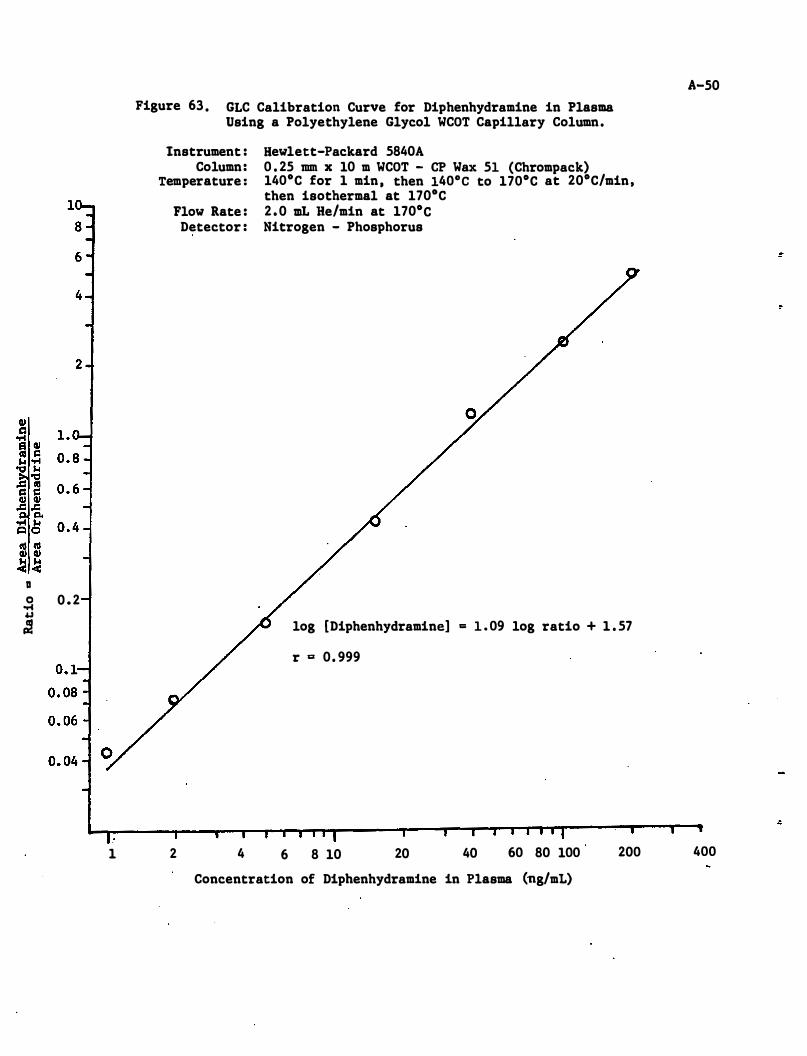
D o 0 . 2 ...c 4.1 .=
1
Figure 63 . GLC Calibration Curve for Diphenhydramine in Plasma Using a Polyethylene Glycol WCOT Capillary Column .
Instrument : Hewlett-Packard 5840A Column : 0 . 25 mm x 10 m WCOT - CP Wax 51 (Chrompack)
Temperature : 140°C for 1 min , then 140° C to 170°C at 20°C/min , then isothermal at 170°C
2
Flow Rate : 2 . 0 mL He/min at 170°C Detector : Nitrogen - Phosphorus
log [Diphenhydramine] = 1 . 09 log ratio + 1 . 57
4
r g 0 . 999
6 8 10 20 40 60 80 100
Concentration of Diphenhydramine in Plasma (ng/mL)
200
A-50
400
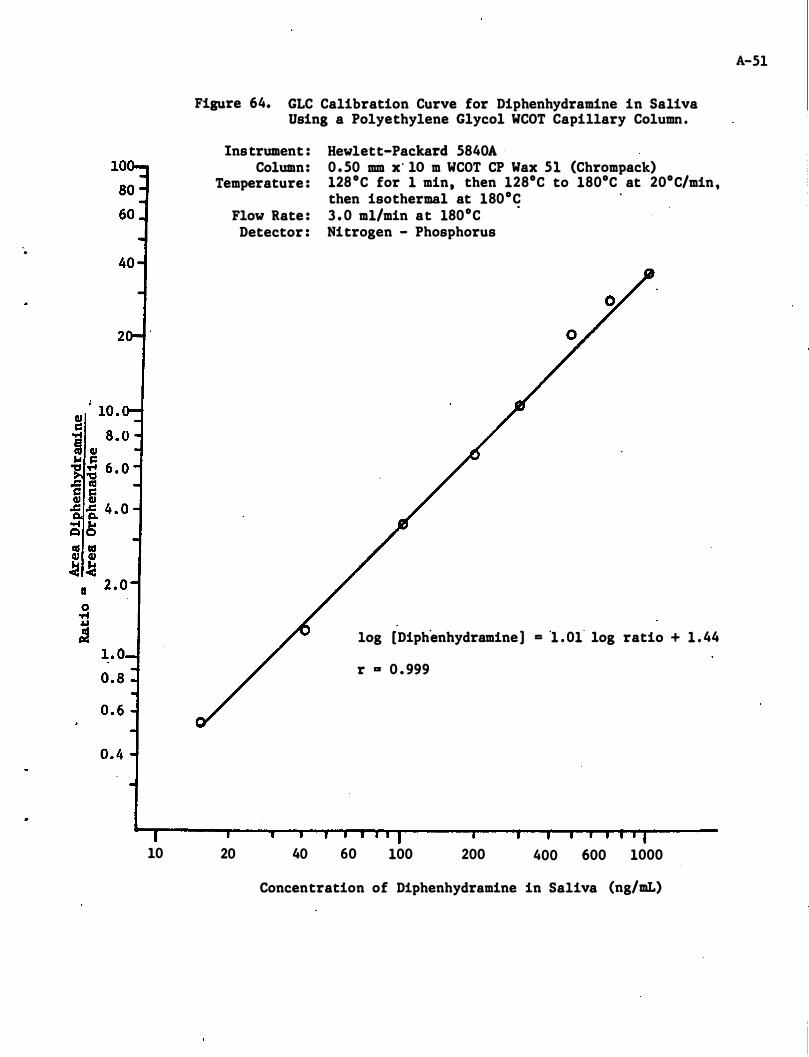
-.
10
Figure 64. GLC Calibration Curve for Diphenhydramine in Saliva Using a Polyethylene Glycol WCOT Capillary Column .
Instrument : Column:
Temperature :
Flow Rate : Detector :
20 40
Hewlett-Packard 5840A 0 . 50 mm x' lO m WCOT CP Wax 51 (Chrompack) 128°C for 1 min, then 128°C to 180°C at 20°C/min, then isothermal at 180°C 3 . 0 m1/min at 180°C
.
Nitrogen - Phosphorus
log [Diphenhydramine] = '1 . 01- log ratio + 1 . 44
r OR 0 . 999
60 100 200 400 600 1000
Concentration of Diphenhydramine in Saliva (ng/mL)
A-51
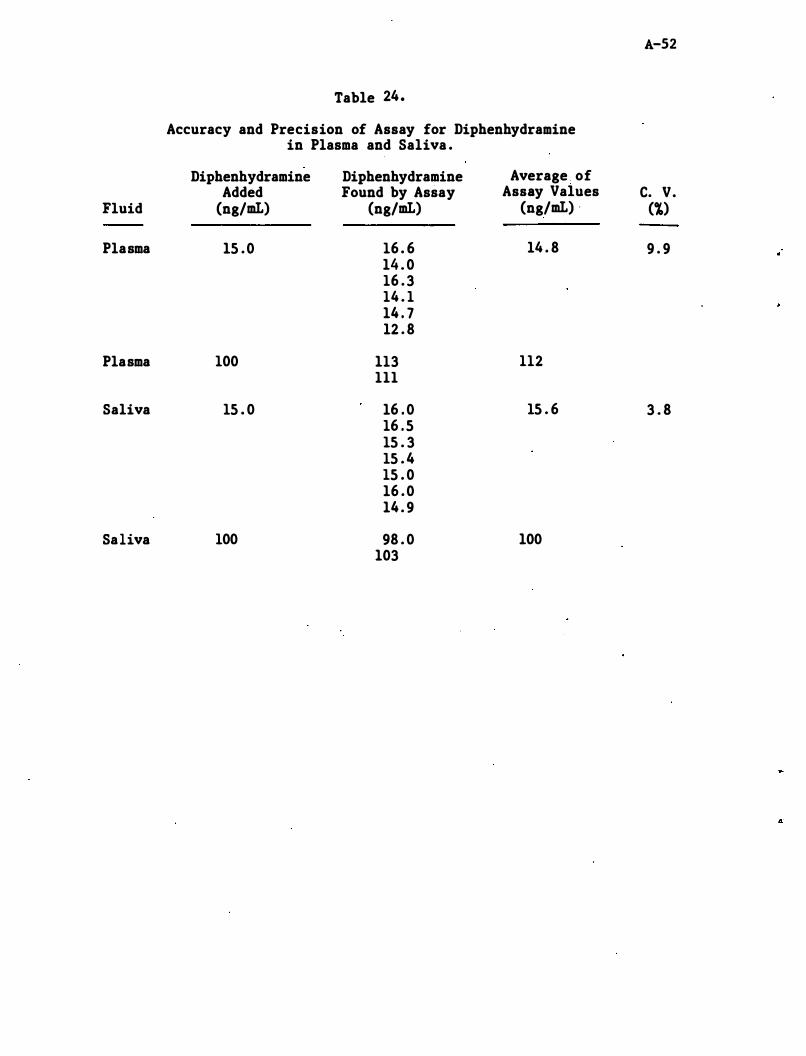
A-52 Table 24.
Accuracy and Precision of Assay for Diphenhydramine in Plasma and Saliva .
Diphenhydramine Diphenhydramine Average . of Added Found by Assay Assay Values C. V.
Fluid (ng/mL) (ng/mL) (ng/mL) . (%)
Plasma 15 . 0 16 . 6 14 . 8 9 . 9 14 . 0 16 . 3 14 . 1 14 . 7 12 . 8
Plasma 100 113 112 III
Saliva 15 . 0 16 . 0 15 . 6 3 . 8 16 . 5 15 . 3 15 . 4 15 . 0 16 . 0 14 . 9
Saliva 100 98 . 0 100 103
4
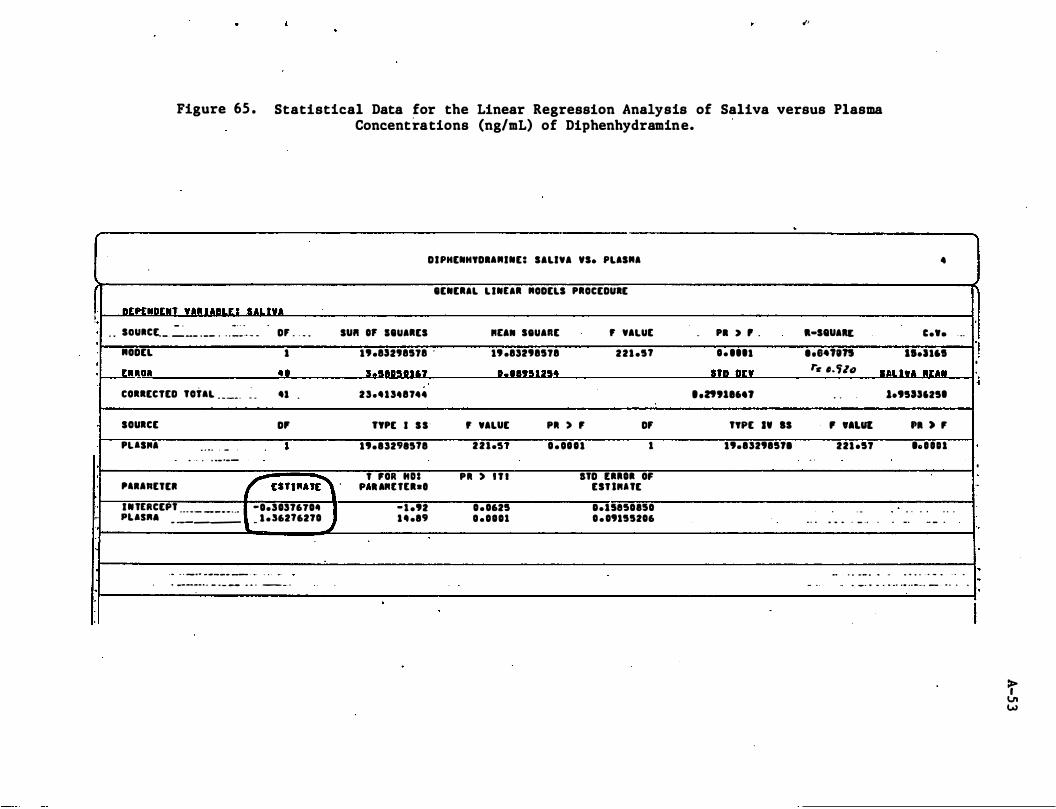
I !, , .
�,
Figure 65 . Statistical Data for the Linear Regression Analysis of Saliva versus Plasma Concentrations (ng/mL) of Diphenhydramine.
-
DIPHENHYDI."INE: SALIVA 'S. PLIS"I
IENE.IL L INEI. "ODELS P.OCEDURE
OrprNDI:.' VA. UIILI: ! SAL'I"A
. . SOU.CL. � __ . __ . . . :::�'. _ _ 0' . , _ . SU" 0' IIUI.ES IttA.. StUARE , VALUE - PI > , . a-S8UAU
"ODEL 1 .'.8sn8518 .
.' .85198518 221 .5' 1 . ... 1 •• e411n
•
c ••• , ..
11.1161
' _..ll.'OI 41 1.5II"lIt 1,,,"U5. StD on t"e ,,'Uti SIILI"A IIU.
,
.. ,.
,
.
COllECTED TOilL _ _ __ . � _
SOURCE
PUS"I . . .. , -
.. , . . . ... _ ._-
'1 .
D'
•
'1""ttEII r un""'� ' I N tERCEpt -0.5157610' ... - - - - - - . � .. pus". - ----- _ 1 . '62'6270
oJ
... . . _ ... .. _--- -- .- . . " .-
. _--_ .. . _ . - - .. .. . - _ .
25,'15.87 ••
TYPE I S S ' , VALUE
19.1529"'8 2 2 1 ."
' fOR "oa PII ) ' 7 1 " . . IIUta-.
- 1 .'2 0 . 0625 1 4 .19 0 .0101
.
PII ) , 0' 0 . 0111 1
stD [11101 OF UT lIIUE
O.lse,o"o
0 . 09155206
• • Zttl ... l
TYPE ., IS
.'.152915" . ,
. . .
- .
. . 1.95as625.
, 'ALUI 221 .51
. . .. ... .. . - .. .
.. . .. - _ . .. ..
'1 ) , 'o • • n
. . . . . . . . _. - - .
.. . .. .. - 0 _ .. . . ..
- .. _ . . . .. .. .. .. .. -... - - . . . ..
I "
·
' .
.j
·
..
'.
�
·
·
I
t VI W
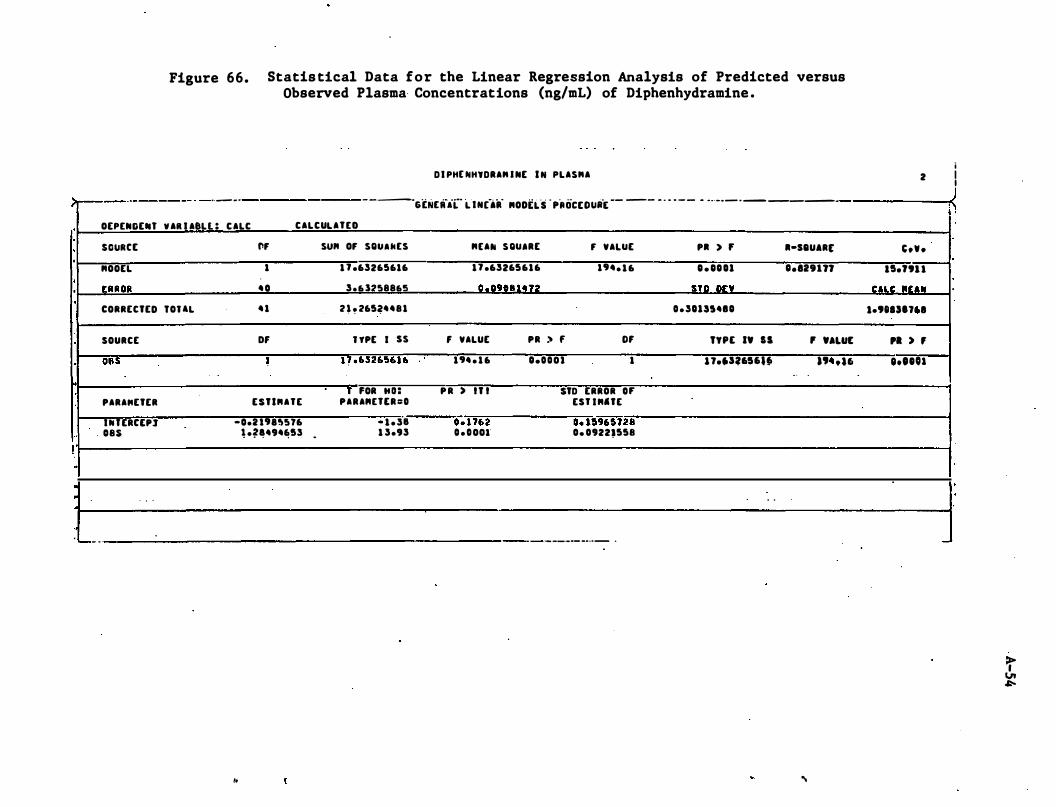
Figure 66. Statis tical Data for the Linear Regression Analysis of Predicted versus Observed Plasma· Concentrations (ng/mL) of Diphenhydramine .
DI PHE NHYDRAM I NE I N PLASMA
;._._._-----_ . _ .. _ _ .
-----
6[NElf'(- L IN(aii "ODEL'S ·PROCEOU.iE -- -- - ' - - - - - -.. --- .--------
·
· ·
·
•
! ..
·
·
· ...... _ .
OEPENOEN' V AIl I AeLl : CALC CALCULATED
SGURCE "OOEL
[RROR
CORRECTED fOUL
SOURCE
08S
PARA"ETER
IUERCEP} 085
. .
fir
1
40
41
Of •
ESTI"ATE
-0.U'.!;S76 � .��494,,!13
,.
SUM or SQuakES
1 7 .63265616
3.63:l'S8865
2 h 265�4481
l TPE I SS
H ·63265616
, FOR HD: PARA"ETER:D
- 1 . 3'8 1 3.93 -
"[AN SQUIRE r VALUE
17 .63265616 1'4. 1 6
0 .. 0'11111472
f VALUE PR > f OF 1'4 . 1 6
P R ) IT I
D� 1762 D . DOOI
D.DDOl 1
STD ERROR 0' EST I"'tE
0. 15965728 0. 0922,558
- ----- -_ .. -
.
P. > , .-saUAR,
D . DDU 0.129177 STO on
D.3Un4ID
"PE IV IS , VALUE
n.J3.'56I,. a" .16 . .
. .
...
2
'.V.
15.ftH
CUC IIrall 1.'eest" 1
PI ) ,
"'DOl
i I I
� !
-
t VI �

•
Appendix ,A - Detailed Analytical Methodologies
A . 6 Codeine
A-55
R E S E A R C H T R I A N G L E I N S T I T U T E . O S T O .. .. I C • • O X • • • • • II • S • A II C H T II I A N . � . • A II K . N O li T H C A II 0 � I N A . " • •
CHIEMISTRY AND �I"IE SCI.NC •• • ROUP
Dr. James Frank DOT
January 30 , '1981
National Highway Traffic Safety Administration Problem Behavior Research Division (NRD42) Massiff Building 400 7th Street SW Washington , DC 20590
Dear Dr . Frank:
A-56
This letter is in regard to several topics that have arisen in our work on "The Analysis for Drugs in Saliva and Breath" and which we have previously discussed by phone .
The first topic concerns the analysis of codeine in plasma and saliva . As you may remember , this compound had not been selected at the time the detailed study plan was approved . After it was decided that codeine would be the sixth drug to be studied in our contract , we began looking "for suitable analytical techniques for its analysis . Dr . Ruth Zweidinger of our institute had previously analyzed codeine in plasma in a project sponsored by Burroughs-Wellcome Company . At the time (1975) that she did her work , there were no good analytical procedures for analyzing codeine in plasma after single therapeutic or sub-therapeutic doses . Since that time , several procedures have been reported . I have tried to summarize these procedures below . They are divided into two classifications : gas chromatographic- and radioimmUno-assays .
(1) Gas Chromatographic Procedures
Three GC procedures have been described . All a re modifications of earlier procedures but offer improvements , usually in sensitivity , to the earlier procedures .
Brunson and Nash (1975) analyzed codeine in plasma using an OV-225 stationary phase in a packed column, flame ionization detection, and papaverine as an internal standard . The published standard curve which has data points from 25 to 150 ng of codeine per ml of plasma is linear. The authors claim that uas little as 5 ",g of codeine • • • per liter (5 ng/mL) could be measured in plasma" although no data was presented for codeine concentrations below 25 ng/aL. We have found previously that all such claims must be taken with a lot of salt . Figures showing the concentration of codeine in plasma vs . time for two subjects who were
, . . • • • • I " • • • • ., II O M A A � . I . N . D U II H A M A N D H I � �
Dr. JalDes Frau Pale 2 January 30 , 1981
A-57
each liven a single oral does of 60 IIIg code'ine sulfate (equivalent to 52 IIIg of codeine) were also presented . The peak conce!'trat'ions of codeine in plasma (C ) were £! 110 nl/mL. At 6 hr , the conce�trations had decreased to �-40 ng/mL. The 20 ng/mL value was lower than the lowest point on the standard curve".
A second procedure was reported by Dahlstrom, et. al (1977) . These authors employed an OV-17 stationary phase in a packed co�umn , derivitization of the codeine witb pentafluoropropionic aohydride , and electron capture detection. The internal standard was N-ethyl morphine . The authors claim tbat "the method allowed determinations of codeine • • • witb acceptable precision down to 7 . 5 ng per sample (0 . 05-1 . 0 mL) . Data was presented for concentrations of codeine down to 20 nl per sample .
Zweidinler et al (1976) published her procedure which made use of an XE-60 stationary pbase in a packed column and flame ionization detection . The limit of detection using this procedure was 5 ng/mL although below 50 ng/mL determinations were difficult .
(2) RIA Procedures
Two procedures bave been developed by Findley et a l e The .first of these (Findley et aI , 1977) required ext'raction of codeine from plasma and preliminary purification of the extract because of the cross-reactivity of the RIA with codeine-6-glucuronide and lDorphine . Large amounts of codeine-6-glucuronide are present in plasma relative to the concentration of codeine . Morphine is al�o present . Us�ng �his RIA procedure , the concentrations of codeine in the plasma of six subjects who had each been given a s ingle dose of 65 mg of codeine phosphate (49 mg codeine) were followed over 22 bours . The values of C were about 100 ng/IDL . Concentrations of codeine at 12 hr were 5-12 ngr�.
The second RIA procedure (Findlay, et aI , 1976) is based on a much more selective antisera . The cross-reactivities to codeine-6-glucuronide and morphine were <0 . 05 and 0 . 1 percent , respectively. Cross-reactivity with norcodeine was 16�. While norcodeine is found in the urine after administration of �odeine , only a trace quantity was found in the plasma « 10� of the concentration of codeine) by gc-mass spectrometry (Brunson and Nash, 1975 ) , and none when flame-ionization was used in place of the mass spectrometer. Using this more selective antisera , no extraction or prepurification step is required. A standard curve for the analysis of codeine in plasma over tbe range of 0 . 24-31 nl/IIL was published . The authors state tbat "the practical limit of sensitivity is less than 1 nl/IDL. " Sampl�s containinl more than 31 nl/IIL of codeine can be diluted .
Dr . James Frank Page 3 January 30 , 1981
A-58
In our studies we have plasma and saliva"
samples from : subjects who were aiven IS and 30 mg of codeine ora lly. Based on �he results of the assays of Findlay et al and Brunson and Nash , we mnticipate . peak concentrations of codeine of about 35 and 65 ng/mL , respectively, for the two dose levels . Twelve hours after dosing concentrations of codeine are expected to be 5-10 percent of the peak concentrations . Concentrations of codeine in saliva will probably be hiaher than those in plasma .
Severe problems have been encountered in trying to adapt any of the reported GC procedures for our use . As they have been reported , all have documented lower l imits much too high for our needs . The OV-225 stationary phase contains nitrile groups . The phase also "bleeds" off . Thus it is not suitable for use with nitrogen sensitive detectors and can rapidly contaminate electron capture detectors . The OV-17 stationary phase appears to be the phase of choice . Unfortunately, this phase cannot be coated evenly . At low ng/at concentrations of most basic drugs , adsorption of the drug to uncoated or fractured support in packed columns is a major problem. The development of good OV-17 coated capillary columns has been an elusive goal , again because of the poor coating properties of this phase . Our analytical group at RTI has been unsuccessful in this regard . Several reputable cOlDIDerical companies list such columns in their advertisements , but we have been unable to obtain delivery. We had one OV-17 capillary column , which was never delivered , on order for a year . Codeine fails to elute from the Carbowax coated capillary column which we are using for our other analyses at its maximum temperature (2200C) . Our initial efforts using packed columns were also unsuccessful with low amounts of codeine .
We therefore propose to al;lalyze codeine in plasma and" saliva by the RIA method of Findlay , et aI , (1978) using their more selective antisera . We feel that this method is the only one presently available that has the requisite selectivity and sensitivity to accurately quantitate codeine in plasma following a single sub-therapeutic dose . In using this RIA , standard curves will be prepared using plasma spiked with ' known amounts of codeine . Control samples will be run with each assay. If the concentration of codeine in plasma is sufficiently high, then we will attempt to analyze the codeine in a few samples both by RIA and GC . The GC will be accompl ished using a packed column and OV-17 as the stationary phase .
We have already made inquiries of Drs . Findlay and Welch at BurroughsWellcome concerning the availability of their antisera . The Wellcome Research laboratories are less than one mile from ours and . there is ongoing cooperation between the two laboratories in other areas . There were no problems anticipated in our obtaining the antisera. . Dr . Findlay indicated that I . should let him know when I needed it and he would make it available with no further red tape . Analysis of codeine by RIA would also be much faster and cheaper than. even with a GC procedure that was already developed .
•
..
A-59
Procedure for the Radioimmunoassay for Codeine
Antisera , radioligand and procedures for the assay were obtained
from Dr . John Findlay, Wellcome Research Labo�atories , Research Triangle
Park, NC . Purity of the radioligand �3H-codeine) w�s established by
TLC . The titer for the antiserum was dete.rmined by incubating 0 . 2 mL of
various dilutions of the neat antiserum with 0 . 1 mL of drug-free plasma
or diluted drug-free saliva , 0 . 2 mL of the radioligand (24P pg/0 . 2 mL) ,
and 0 . 5 mL of buffer (0 . 05H Na2HP04 eNaH2P04 ' 0 . 15H NaCl , O . OlH EDTA ,
0 . 1% gelatin , pH 7 . 0) . The mixture was incubated for a minimum of
2 hours at 4°C . Separation of the antibody-bound from the free radio
ligand was accomplished using 0 . 5 mL of a 5 mg/mL suspension of dextran
coated charcoal in buffer (0 . 25% dextran) . After 30 m,inutes , the char
coal suspension was centrifuged at lOOOxg for 15 minutes . The tempera-
ture for charcoal adsorption and centrifugation was 4°C . The resulting
supernatant was decanted into 20 mL glass counting vials , and 10 � of a
toluene : Triton-X, 2 : 1 (v/v) counting cocktail containing 6 . 0 g of Omni
fluor (New England Nuclear) per liter , was added . Samples were placed
into a Packard Hodel 460 liquid scintillation coUnter and counted for
2 minutes .
The above procedure was used for the radioimmunoassays except that '
0 . 2 mL of the antiserum at the titer found (1 : 6000 for plasma and 1 : 10
saliva/buffer ; 1 : 5000 for 1 : 5 saliva/buffer) was' used , and 0 . 1 mL of
plasma (0 . 01 mL saliva) containing known (standards and controls) and
unknown amounts (samples ) of codeine was used instead of drug-free
plasma (saliva ) . Since 0 . 1 mL of' neat saliva interfered with the
binding of the radiolabel , 0 . 1 mL of 1 : 10 saliva/buffer dilution (or 1 : 5
saliva/buffer dilution) was used in the saliva assays . For the standard
A-60
curve , 0 . 01 or 0 . 02 mL of drug-free saliva was spiked with 0 . 09 or
0 . 08 mL, respectively , of codeine phosphate standard in buffer; for the
samples , 0 . 01 or 0 . 02 mL . of subj ects ' saliva was diluted with 0 . 09 or
0 . 08 mL , respectively, of buffer .
Concentrations of codeine free base were calculated from a standard
curve plot of % radioligand bound vs . codeine free base concentration on
a logit-log scale . The range of the assay was 0 . 5-15 ng/mL . Since it
was necessary to dilute saliva 1 :5 with buffer before the assay , this
range corresponds to initial codeine concentrations in saliva of 2 . 5-75
ng/mL . Plasma and saliva samples containing higher concentrations of
codeine were diluted with drug-free plasma and buffer , respectively,
before they were analyzed .
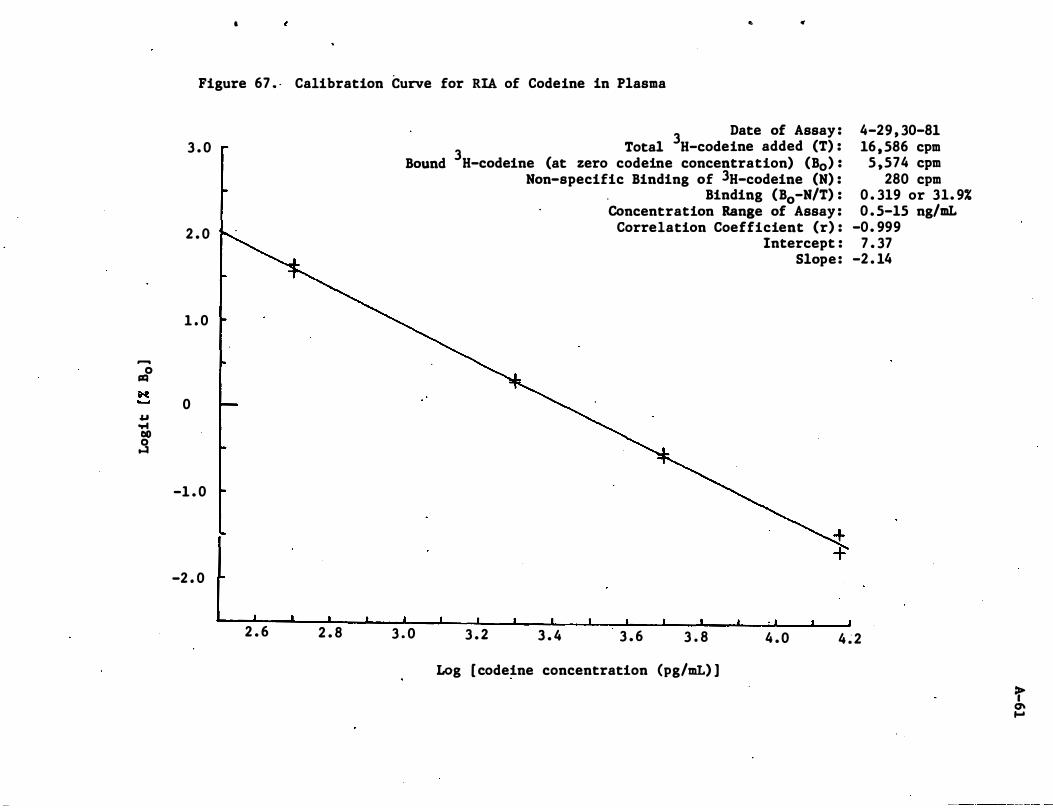
-0 r:IQ
M u .... 00 0 ...:I
.. ., ,
Figure 67 . - Calibration Curve for RIA of Codeine in Plasma
3 . 0
2 . 0
1 . 0
0
-1 . 0
-2 . 0
2 . 6 2 . 8
Bound
3 Date of Assay :
3 Total H-codeine added (T) : H-codeine (at zero codeine concentration) (Bo) :
Non-specific Binding of 3H-codeine (N) : Binding (Bo-N/T) :
Concentration Range of Assay : Correlation Coefficient (r) :
Intercept : Slope :
4-29 , 30-81 16 , 586 cpm
5 ,574 cpm 280 cpm
0 . 319 or 31. 9% 0 . 5-15 ng/mL
-0. 999 7 . 37
-2 . 14
3 . 0 3 . 2 3 . 4 3 . 6 3 . 8 4 . 0 4 � 2
Log [ codeine concentration (pg/mL) ]
t Q\ ....
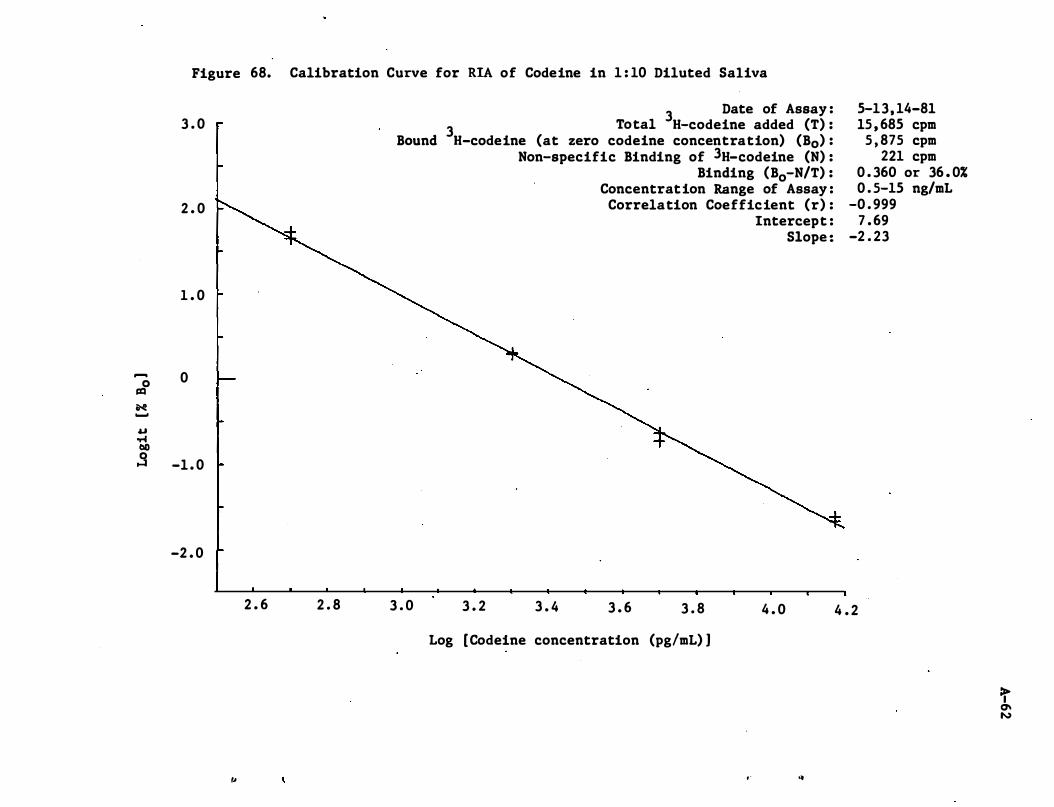
-0 =
N -
u '" tID 0 ...:I
Figure 68. Calibration Curve for RIA of Codeine in 1 : 10 Diluted Saliva
3 . 0
2 . 0
1 . 0
0
-1 . 0
-2 . 0
2 . 6 2 . 8
,.
Bound
3 . 0
3 Date of Assay :
3 Total H-codeine added (T) : H-codeine (at zero codeine concentration) (Bo) :
Non-specific Binding of 3H-codeine (N) : Binding (Bo-N/T) :
Concentration Range of Assay : Correlation Coefficient (r) :
Intercept : Slope :
3 . 2 3 . 4 3 . 6 3 . 8 4 . 0
Log [Codeine concentration (pg!mL) ]
, " of
5-13, 14-81 15 , 685 cpm
5 , 875 cpm 221 cpm
0 . 360 or 36 . 0% 0 . 5-15 ng/mL
-0 . 999 7 . 69
-2 . 23
4 . 2
=r 0\ N
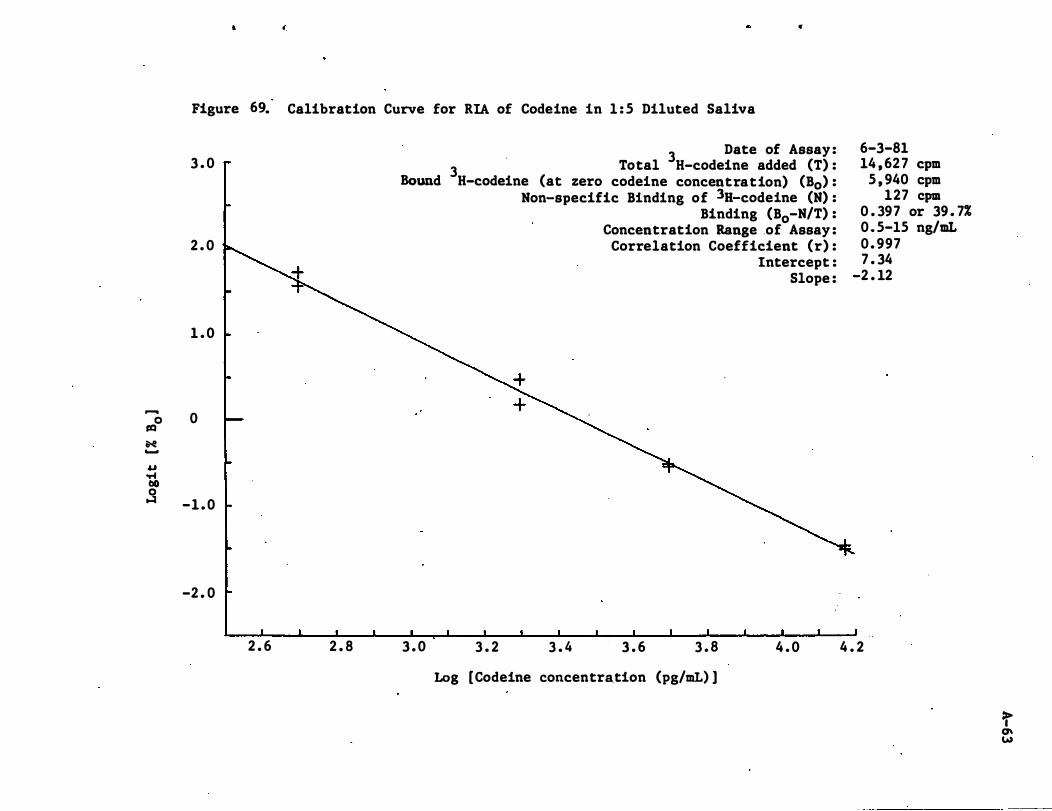
..... 0 rQ
N ...... u '" bO 0 �
, .
Figure 6� Calibration Curve for RIA of Codeine in 1 : 5 Diluted Saliva
3 . 0
2 . 0
1 . 0
0
-1 . 0
-2 . 0
2 . 6 2 . 8
Bound
3 . 0
3 Date of Assay :
3 Total H-codeine added (T) : H-codeine (at zero codeine concentration) (Bo) :
Non-specific Binding of 3H-codeine (N) : Binding (Bo-N/T) :
Concentration Range .of Assay : Correlation Coefficient (r) :
Intercept : Slope :
3 . 2 3 . 4 3 . 6 3 . 8 4 . 0
Log [Codeine concentration (pg/mL) ]
6-3-81 14 , 62 7 cpm
5 , 940 cpm 127 cpm
0 . 397 or 39 . 7% 0 . 5-15 ng/mL 0 . 997 7 . 34
-2 . 12
4 . 2
t CJ\ W
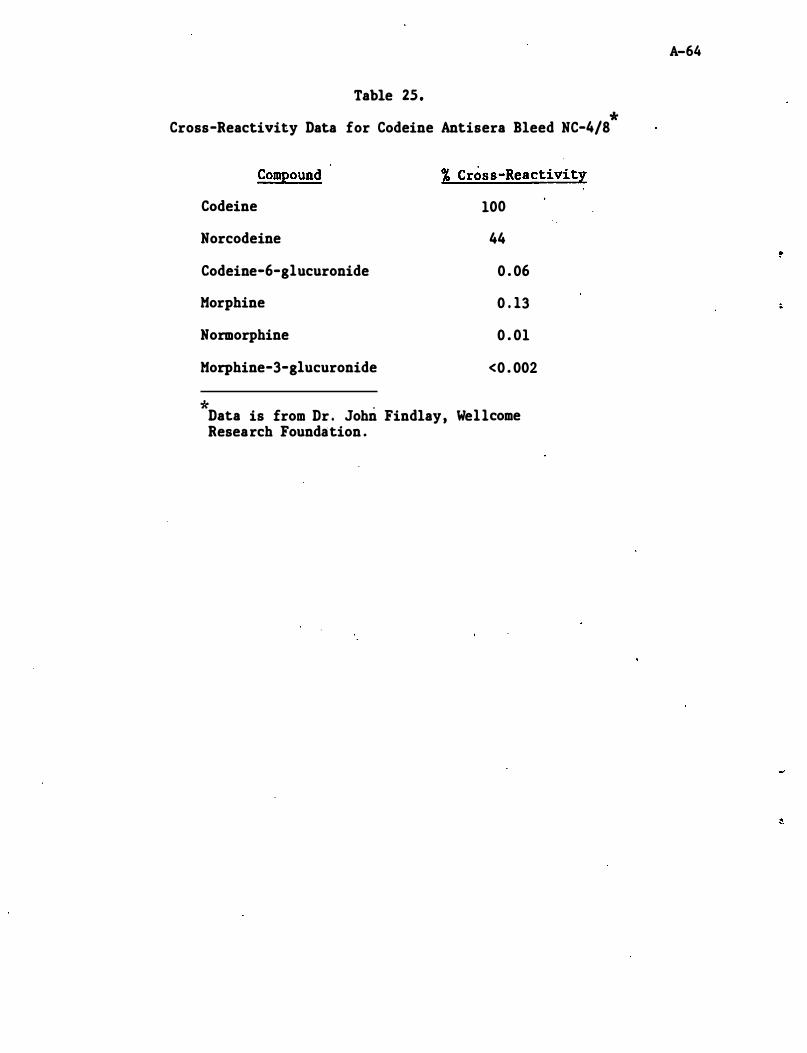
Table 25. *
Cross-Reactivity Data for Codeine Antisera Bleed NC-4/8
Compound
Codeine
Norcodeine
Codeine-6-g1ucuronide
Morphine
Normorphine
Morphine-3-g1ucuronide
* .
% Cross-Reactivity
100
44
0 . 06
0 . 13
0 . 01
<0 . 002
Data is from Dr . John Findlay, We11come Research Foundation .
A-64
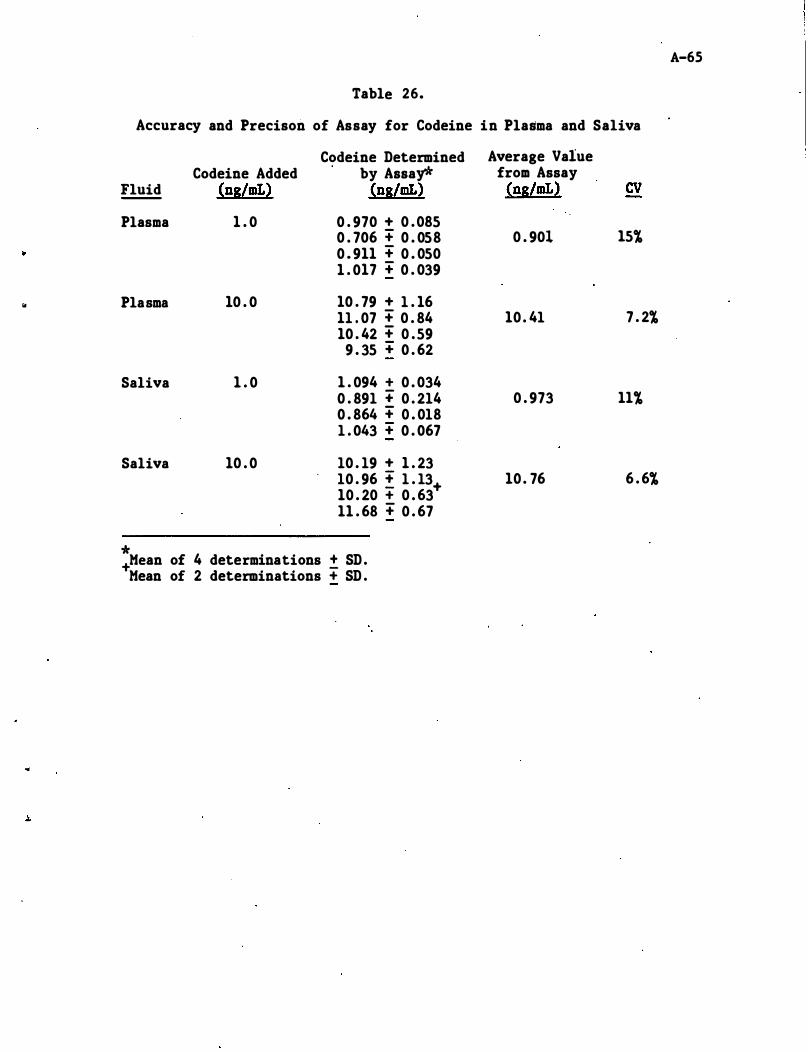
A-65
Table 26.
Accuracy and Precison of Assay for Codeine in Plasma and Saliva
Codeine Determined Average Value Codeine Added by Assay* from Assay
Fluid -- (ns/mL) (ns/mL) (ns/mL) CV Plasma 1 . 0 0 . 970 + 0 . 085
0 . 706 + 0 . 058 0 . 901 15% 0 . 911 + 0 . 050 1 . 017 + 0 . 039
" Plasma 10 . 0 10 . 79 + 1 . 16 11 . 07 + 0 . 84 10 . 41 7 . 2% 10 . 42 + 0 . 59
9 . 35 + 0 . 62
Saliva 1 . 0 1 . 094 + 0 . 034 0 . 891 + 0 . 214 0 . 973 11% 0 . 864 + 0 . 018 1 . 043 + 0 . 067
Saliva 10 . 0 10 . 19 + 1 . 23 10 . 96 ! 1 . 13+ 10 . 76 6 . 6% 10 . 20 + 0 . 63 11 . 68 + 0 . 67
* +Mean of 4 determinations ± SD .
Mean of 2 determinations + SD .
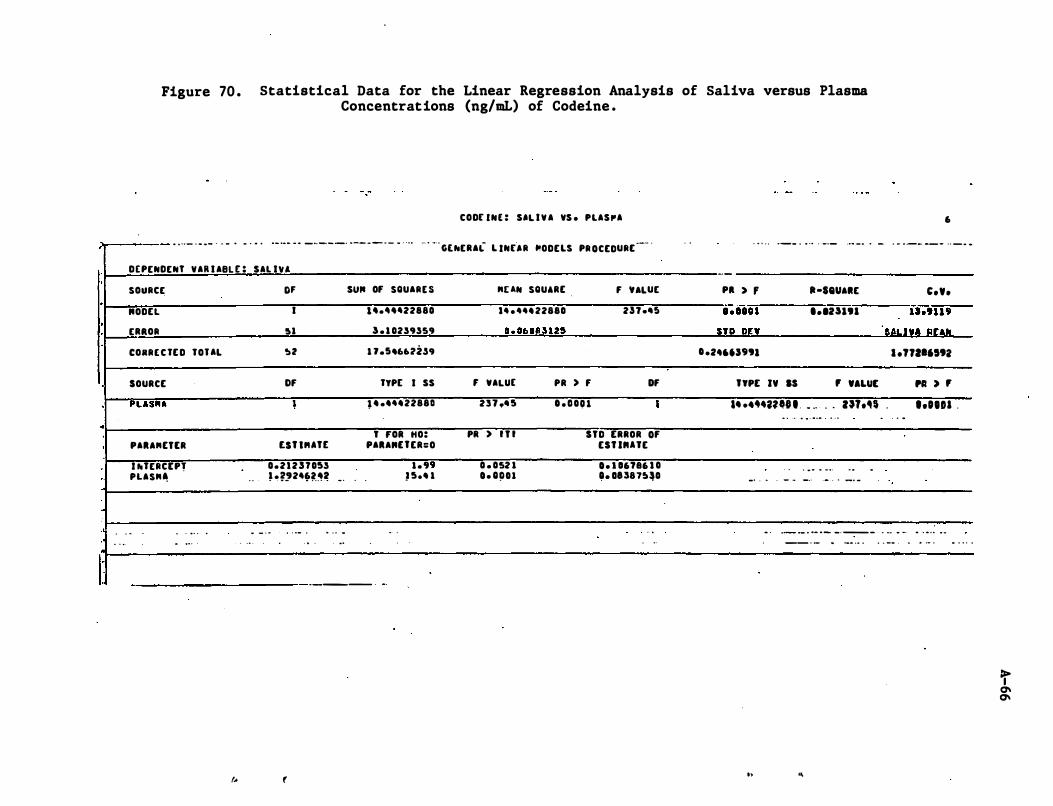
Figure 70 . Statistical Data for the Linear Regression Analysis of Saliva versus Plasma Concentrations (ng/mL) of Codeine .
CODE INE : S'l I Y A YS . PLASPA 6 ;r---- . . .. - . . . - . . . . . . . .. ... . . _ .. -. _ _ . . _ . _ . - . . . . ·· · · ·Ur-ERA"- L INEAR "ODELS PR OCEDURE
--· · . . . . . . . .. _ _ . . .. . -_.- ..• - . . - ' " .. . _- -- -- . . - . ..
·
0
·
·
.
·
I:-
DEPENDENT YAR I ABL E : SAL IVA
SOURCE
"ODEl
ERAOR
CORRE C TE D TOUL
SOURCE
"lAS"A
PAU"ETtR
I hTERC[pr PLAS"�
. . - . . . . . ..
. . .
-
... .. .
("
Of SUIt Of SQUARt s
I 1'.''''22880
!ll 3 . 1 0239359
'!at 1 7.!!46UZ,59
Of TYP[ I SS
l . . .... 22880
T fOR HO: £SHUTt PAU"UER=O
0.21257053 1." . . ' .�'2'���� • . . .
.. - ' .
0 ' • • . . 0- .
. . .
.. - . -..
------ .
(
- .
) 5.4 1
"UN SQUARE f VALUE
1 . .... 22880 2n •• !! 0. 060U125
F VAlUE PR ) f Of
231 •• 5 D . DOU •
PR ) I T I STD ERROR Of
0 . 052 1 D. Q!lOl
ESUIIUE
D. I 06786 1 O O. OU815�0
. .
. ..
--
PI > f lI-seUAIlE C.Y. .-;ioi"i I.IU',. is.'"9
STR on IALI!A IllAPI
D .24U'''' l .nal"'2
"PE IY IS , 'ALUE PI ) ,
.. .• �.,n'.' . . .. . . zn.�$ . I.OlDa . .. . -. .. . . . .. .. . .
. . . . . .. .. . . - .
-' . . . - - _ . .- . . _. -
.
.. . . ..
. ._ ._ . . _ . _ _ . _- - . -.. . -. .. . . . .. . -
-_ . - .
h ..
.. - .. . . . _- .. .. .. . . . . . .
It 0\ 0\
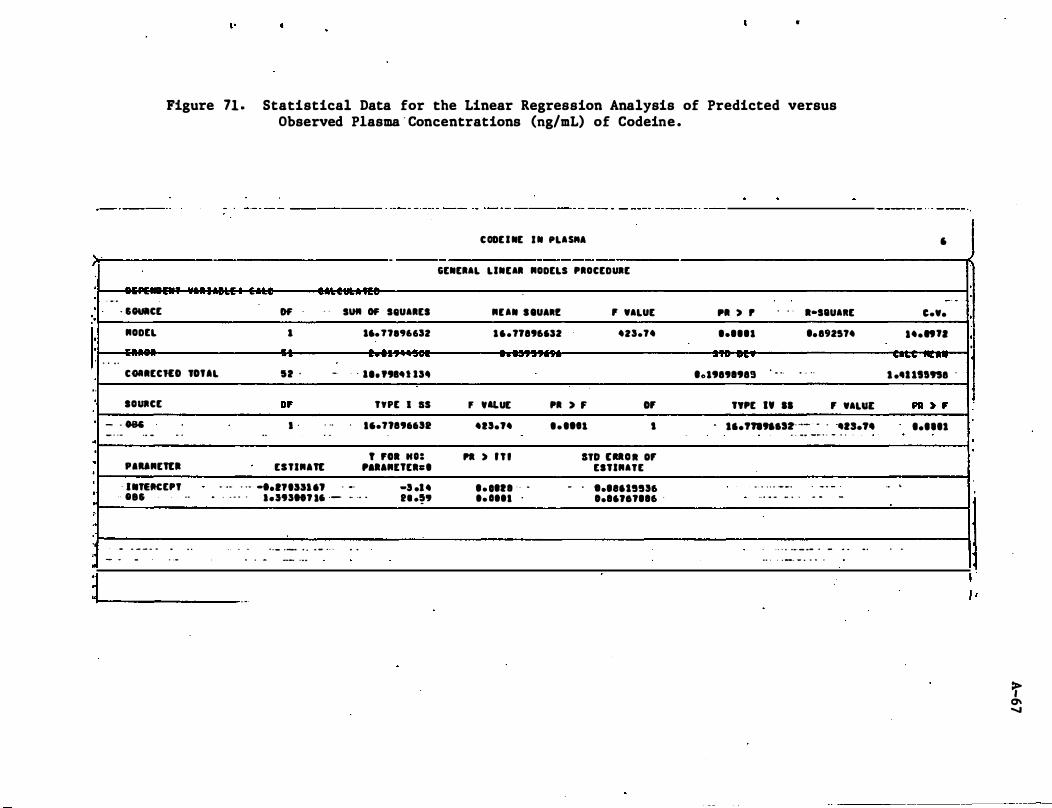
}t. ·
·
'.
· ·
,. ·
·
.. ·
·
· , I I
: ..
·
, ,
" •
Figure 71 . Statistical Data for the Linear Regression Analysis of Predicted versus Observed Plasma ' Concentrations (ng/mL) of Codeine .
. ..
- . . .
· SOUICE
NODEL
-
-
- -
-
--
Of' . . s'"' OF seUARES
1 16. n8'J"SZ
.. . . . ..
COIIECKO TOtaL 12 . •. . . ••• "IU IS.
SOURCE
- - ON _
. . -
.. - . .
"UNEn:1
· •• TEttCEP'
·· .. 5
- . - - - ... - . -
.
. ..
..
. .
0' • • . .. .. . .
EllIN,n:
. .. - -. ... ,nssu, . _.
TYPE I IS
.,.1l896652
f rol "0: , .. ,NUEh.
-5 •• 4 . , ' . " . lenSH., .' ·- - .. . 11 .59
. -. . -
-'
. . - . _ . . . . - . . . -- ' . .
. .
.
C ODE I NE . N PLAS"A
-GENERAL LINEAR NODELS PROCEDURE
NUN S tUARE , WALUE
16.17896'52 4ZS.14
. . . . . .. ..
F "LUE PR ) F OF
415.'4 .. .. " ,
PI ) I f l STD UU II OF
'. '''1 ' ' .
.. .... .
- . ESTINATE
'.""5556 0.16.,..,.16 .
PI , ,
..... 1
...... .... '019891989
. . .
. ..
l-seUAIlE
•• 892514
. . . .
TYPE IV II F WALut
. 1I.,.,.,"Slt· __ · ' .13.74 . . -- -_ . . - . . .
0 • • • • • _ _ •
. . . .. .. _ . .
. - ,, -
. - -
. . . . ... _ .- . - .. . •• _ . , _, _ , ' 0 •
. .
,
- . C.W •
.4.n"
.. ...... ........ 1 •• """8 .
. . .
. .
PI :. , ..... 1
·
· ·
·
1
"
>, 0\ "