Comparisons of the NGA Ground-Motion Relations
22
Comparisons of the NGA Ground-Motion Relations Norman Abrahamson, a) M.EERI, Gail Atkinson, b) M.EERI, David Boore, c) Yousef Bozorgnia, d) M.EERI, Kenneth Campbell, e) M.EERI, Brian Chiou, f) I. M. Idriss, g) M.EERI, Walter Silva, h) M.EERI, and Robert Youngs, i) M.EERI The data sets, model parameterizations, and results from the five NGA models for shallow crustal earthquakes in active tectonic regions are compared. A key difference in the data sets is the inclusion or exclusion of aftershocks. A comparison of the median spectral values for strike-slip earthquakes shows that they are within a factor of 1.5 for magnitudes between 6.0 and 7.0 for distances less than 100 km. The differences increase to a factor of 2 for M5 and M8 earthquakes, for buried ruptures, and for distances greater than 100 km. For soil sites, the differences in the modeling of soil/sediment depth effects increase the range in the median long-period spectral values for M7 strike-slip earthquakes to a factor of 3. The five models have similar standard deviations for M6.5-M7.5 earthquakes for rock sites and for soil sites at distances greater than 50 km. Differences in the standard deviations of up to 0.2 natural log units for moderate magnitudes at all distances and for large magnitudes at short distances result from the treatment of the magnitude dependence and the effects of non-linear site response on the standard deviation. INTRODUCTION As part of the NGA project, five groups developed new ground-motion models for application to the shallow crustal earthquakes in the Western United States (WUS). The models are described in five accompanying papers: Abrahamson and Silva, 2008 (AS08); a) Pacific Gas & Electric Company, 245 Market Street, San Francisco, CA 94105 b) Department of Earth Sciences, University of Western Ontario, London, Ont. Canada N6A 5B7 c) U.S. Geological Survey, MS977, 345 Middlefield Rd., Menlo Park, CA 94025 d) Pacific earthquake Engineering Center, University of California, Berkeley, CA, 94720 e) ABS Consulting/EQECAT, 1130 NW 161 st Pl., Beaverton, OR 97006-6337 f) Division of Research and Innovation, California Department of Transportation, Sacramento, CA g) Professor Emeritus, University of California, Davis h) Pacific Engineering and Analysis, El Cerrito, CA 94546 i) Geomatrix Consultants Inc., 2101 Webster St., 12 th Floor, Oakland CA 94612
Transcript of Comparisons of the NGA Ground-Motion Relations
Comparisons of the NGA Ground-MotionRelations
Norman Abrahamson,a)M.EERI, Gail Atkinson,b)
M.EERI, David Boore,c)
Yousef Bozorgnia,d)M.EERI, Kenneth Campbell,e)
M.EERI, Brian Chiou,f) I. M.Idriss,g) M.EERI, Walter Silva,h) M.EERI, and Robert Youngs,i) M.EERI
The data sets, model parameterizations, and results from the five NGA models
for shallow crustal earthquakes in active tectonic regions are compared. A key
difference in the data sets is the inclusion or exclusion of aftershocks. A
comparison of the median spectral values for strike-slip earthquakes shows that
they are within a factor of 1.5 for magnitudes between 6.0 and 7.0 for distances
less than 100 km. The differences increase to a factor of 2 for M5 and M8
earthquakes, for buried ruptures, and for distances greater than 100 km. For soil
sites, the differences in the modeling of soil/sediment depth effects increase the
range in the median long-period spectral values for M7 strike-slip earthquakes to
a factor of 3. The five models have similar standard deviations for M6.5-M7.5
earthquakes for rock sites and for soil sites at distances greater than 50 km.
Differences in the standard deviations of up to 0.2 natural log units for moderate
magnitudes at all distances and for large magnitudes at short distances result from
the treatment of the magnitude dependence and the effects of non-linear site
response on the standard deviation.
INTRODUCTION
As part of the NGA project, five groups developed new ground-motion models for
application to the shallow crustal earthquakes in the Western United States (WUS). The
models are described in five accompanying papers: Abrahamson and Silva, 2008 (AS08);
a) Pacific Gas & Electric Company, 245 Market Street, San Francisco, CA 94105b) Department of Earth Sciences, University of Western Ontario, London, Ont. Canada N6A 5B7c) U.S. Geological Survey, MS977, 345 Middlefield Rd., Menlo Park, CA 94025d) Pacific earthquake Engineering Center, University of California, Berkeley, CA, 94720e) ABS Consulting/EQECAT, 1130 NW 161st Pl., Beaverton, OR 97006-6337f) Division of Research and Innovation, California Department of Transportation, Sacramento, CAg) Professor Emeritus, University of California, Davish) Pacific Engineering and Analysis, El Cerrito, CA 94546i) Geomatrix Consultants Inc., 2101 Webster St., 12th Floor, Oakland CA 94612

Boore and Atkinson, 2008 (BA08); Campbell and Bozorgnia, 2008 (CB08); Chiou and
Youngs, 2008 (CY08); and Idriss, 2008 (I08). In this paper, we compare the data sets, model
parameterizations, use of analytical model constrains, and the resulting ground motions
(median and aleatory variability) from the five NGA models. The objective of this paper is
to compare the five NGA models and provide some explanations for the causes of the
differences, but not to evaluate the strengths and weaknesses of the different models.
DATA SET SELECTION
Although the NGA developers all started with the same data base of 3551 recordings
from 173 earthquakes, the selected data sets used to develop the models have significant
differences. The number of selected earthquakes and recordings are summarized in Table 1.
A key difference in the data sets is the treatment of aftershocks. The AS08 and CY08 data
sets include aftershocks, resulting in a much larger number of earthquakes than the BA08 and
CB08 sets. The I08 data set includes aftershocks, but is has the smallest number of
recordings because it only includes rock sites (450 m/s<VS30<900 m/s). The earthquakes
selected by each developer team and the number of recordings for each earthquake is listed in
Table 2.
An important issue in the selection of the earthquakes was the applicability of the well-
recorded large-magnitude earthquakes from outside of the WUS (1999 Chi-Chi and 1999
Kocaeli) to the prediction of ground motions in the WUS. All of the developers considered
both the Chi-Chi and Kocaeli data to be applicable to the WUS. Furthermore, comparisons
of the NGA models with Eurpoean data have shown that the NGA models are applicable to
Europe (Campbell and Bozorgnia, 2006 and Stafford et al. 2007), suggesting that the NGA
models are globally applicable to shallow crustal earthquakes in active tectonic regions.
Table 1. Summary of Data Sets Used by the Developers
AS08 BA08 CB08 CY08 I08
Number ofEarthquakes
135 58 64 125 72
Number ofRecordings
2754 1574 1561 1950 942

Table 2. Selected Earthquakes and Number of Stations Used by the Developers.
EQID YEAR Earthquake Name Mag AS08 BA08 CB08 CY08 I0812 1952 Kern County 7.36 1 120 1957 San Francisco 5.28 1 1 125 1966 Parkfield 6.19 4 4 4 4 128 1968 Borrego Mtn 6.63 1 229 1970 Lytle Creek 5.33 10 10 7 530 1971 San Fernando 6.61 35 31 33 22 1031 1972 Managua, Nicaragua-01 6.24 1 1 132 1972 Managua, Nicaragua-02 5.20 1 133 1973 Point Mugu 5.65 1 134 1974 Hollister-03 5.14 2 2 235 1975 Northern Calif-07 5.20 536 1975 Oroville-01 5.89 1 1 137 1975 Oroville-02 4.79 2 238 1975 Orovile-04 4.37 3 339 1975 Oroville-03 4.70 9 9 240 1976 Friuli, Italy-01 6.50 4 5 5 3 141 1976 Gazli, USSR 6.80 1 1 1 142 1976 Fruili, Italy-03 5.50 3 3 143 1976 Friuli, Italy-02 5.91 4 4 144 1977 Izmir, Turkey 5.30 145 1978 Santa Barbara 5.92 1 146 1978 Tabas, Iran 7.35 4 7 7 3 247 1979 Dursunbey, Turkey 5.34 1 1 148 1979 Coyote Lake 5.74 10 7 10 10 149 1979 Norcia, Italy 5.90 2 3 3 3 150 1979 Imperial Valley-06 6.53 33 33 33 33 151 1979 Imperial Valley-07 5.01 16 1652 1979 Imperial Valley-08 5.62 1 153 1980 Livermore-01 5.80 6 5 5 6 154 1980 Livermore-02 5.42 7 7 255 1980 Anza (Horse Canyon)-01 5.19 5 5 5 5 256 1980 Mammoth Lakes-01 6.06 3 2 3 357 1980 Mammoth Lakes-02 5.69 3 358 1980 Mammoth Lakes-03 5.91 4 459 1980 Mammoth Lakes-04 5.70 3 460 1980 Mammoth Lakes-05 5.70 2 261 1980 Mammoth Lakes-06 5.94 5 562 1980 Mammoth Lakes-07 4.73 6 663 1980 Mammoth Lakes-08 4.80 7 764 1980 Victoria, Mexico 6.33 4 4 4 4 165 1980 Mammoth Lakes-09 4.85 9 968 1980 Irpinia, Italy-01 6.90 12 12 12 12 569 1980 Irpinia, Italy-02 6.20 10 10 470 1981 Irpinia, Italy-03 4.70 1 171 1981 Taiwan SMART1(5) 5.90 772 1981 Corinth, Greece 6.60 1 1 173 1981 Westmorland 5.90 6 6 6 674 1983 Mammoth Lakes-10 5.34 1 175 1983 Mammoth Lakes-11 5.31 1 176 1983 Coalinga-01 6.36 45 44 45 45 177 1983 Coalinga-02 5.09 20 20 178 1983 Coalinga-03 5.38 3 3 1

Table 2. Selected Earthquakes. (cont)EQID YEAR Earthquake Name Mag AS08 BA08 CB08 CY08 I08
79 1983 Coalinga-04 5.18 11 11 180 1983 Coalinga-05 5.77 9 11 181 1983 Coalinga-06 4.89 2 2 182 1983 Coalinga-07 5.21 2 2 183 1983 Ierissos, Greece 6.70 1 184 1983 Trinidad offshore 5.70 285 1983 Coalinga-08 5.23 2 2 186 1983 Taiwan SMART1(25) 6.50 987 1983 Borah Peak, ID-01 6.88 2 2 288 1983 Borah Peak, ID-02 5.10 3 3 289 1984 New Zealand -01 5.50 190 1984 Morgan Hill 6.19 27 24 27 26 591 1984 Lazio-Abruzzo, Italy 5.80 5 5 5 5 194 1984 Bishop (Rnd Val) 5.82 1 195 1985 Taiwan SMART1(33) 5.80 796 1985 Drama, Greece 5.20 1 197 1985 Nahanni, Canada 6.76 3 3 3 398 1986 Hollister-04 5.45 3 3 3 3 199 1986 Mt. Lewis 5.60 1 1
100 1986 Taiwan SMART1(40) 6.32 8101 1986 N. Palm Springs 6.06 32 30 31 30 6102 1986 Chalfant Valley-01 5.77 5 5 5 5103 1986 Chalfant Valley-02 6.19 11 10 11 11104 1986 Chalfant Valley-03 5.65 3 3105 1986 Chalfant Valley-04 5.44 2 2108 1986 San Salvador 5.80 2 2 2 1110 1987 Baja California 5.50 1 1111 1987 New Zealand-02 6.60 2 2 2112 1987 New Zealand-03 5.80 1113 1987 Whittier Narrows-01 5.99 108 106 109 105 10114 1987 Whittier Narrows-02 5.27 9 10 11 2115 1987 Superstition Hills-01 6.22 1 1 1116 1987 Superstition Hills-02 6.54 11 11 11 11117 1988 Spitak, Armenia 6.77 1 1118 1989 Loma Prieta 6.93 77 73 77 58 22119 1990 Griva, Greece 6.10 1 1 1120 1991 Georgia, USSR 6.20 5 5121 1992 Erzican, Turkey 6.69 1 1 1122 1992 Roermond, Netherlands 5.30 2 3 1 3123 1992 Cape Mendocino 7.01 6 6 6 6124 1992 New Zealand-04 5.70 1125 1992 Landers 7.28 68 68 67 16 3126 1992 Big Bear-01 6.46 38 39 38 18 5127 1994 Northridge-01 6.69 155 154 149 134 28128 1994 Double Springs 5.90 1 1129 1995 Kobe, Japan 6.90 20 12 22 17 5130 1995 Kozani, Greece-01 6.40 3 3 3 1 2131 1995 Kozani, Greece-02 5.10 2 1

Table 2. Selected Earthquakes. (cont)EQID YEAR Earthquake Name Mag AS08 BA08 CB08 CY08 I08132 1995 Kozani, Greece-03 5.30 2 1133 1995 Kozani, Greece-04 5.10 2 1134 1995 Dinar, Turkey 6.40 2 4 2 2136 1999 Kocaeli, Turkey 7.51 17 26 22 17 6137 1999 Chi-Chi, Taiwan 7.62 318 380 381 208 152138 1999 Duzce, Turkey 7.14 13 22 14 12 7139 1972 Stone Canyon 4.81 3 3 1140 1972 Sitka, Alaska 7.68 1 1 1 1141 1976 Caldiran, Turkey 7.21 1 1 1142 1979 St. Elias, Alaska 7.54 2 2143 1990 Upland 5.63 3 3 3 2 1144 1990 Manjil, Iran 7.37 5 7 7 3 1145 1991 Sierra Madre 5.61 9 8 8 9 1147 1994 Northridge-02 6.05 15 18 4148 1994 Northridge-03 5.20 7 7 3149 1994 Northridge-04 5.93 7 7 1150 1994 Northridge-05 5.13 8 8 3151 1994 Northridge-06 5.28 48 46 12152 1992 Little Skull Mtn,NV 5.65 8 8 8 5 3153 1997 Northwest China-01 5.90 2 2154 1997 Northwest China-02 5.93 2 2155 1997 Northwest China-03 6.10 1156 1997 Northwest China-04 5.80 2 2157 1998 San Juan Bautista 5.17 1 1158 1999 Hector Mine 7.13 79 82 78 15 12160 2000 Yountville 5.00 24 24 24 18 3161 2001 Big Bear 4.53 42 41 43 39 2162 2001 Mohawk Val, Portola 5.17 6 6 6 3163 2001 Anza-02 4.92 72 72 72 34 11164 2001 Gulf of California 5.70 11 11 11165 2002 CA/Baja Border Area 5.31 9 9 9 6166 2002 Gilroy 4.90 34 34 34 18 10167 2002 Yorba Linda 4.27 12 12 12 12
168 2002Nenana Mountain,
Alaska 6.70 5 33 51
169 2002 Denali, Alaska 7.90 9 23 9 4170 2003 Big Bear City 4.92 35 33 36 25 6171 1999 Chi-Chi, Taiwan-02 5.90 195 127 122172 1999 Chi-Chi, Taiwan-03 6.20 189 120 104173 1999 Chi-Chi, Taiwan-04 6.20 202 123 93174 1999 Chi-Chi, Taiwan-05 6.20 166 100 117175 1999 Chi-Chi, Taiwan-06 6.30 188 135 112
MODEL FUNCTIONAL FORMS
The main features of the functional forms of the five NGA models are summarized in
Table 3. Saturation at short distances is a feature of ground motion models that leads to
weaker magnitude scaling at short distances than compared to the magnitude scaling at larger
distances. Saturation causes a pinching of the ground motion for different magnitudes at

short distance. This is not the same as including a quadratic magnitude scaling that applies at
all distances. In ground motion studies, a model is said to have "full saturation" if there is no
magnitude scaling of the median ground motion at zero distance . A model is said to have
over-saturation if the median ground motion decreases with increasing magnitude at zero
distance. All of the NGA models include some form of saturation of the short-period ground
motion at short distances through either a magnitude-dependent distance slope (AS08, BA08,
CB08, I08) or a magnitude-dependent fictitious depth (CY08). In several cases, the selected
data sets would have lead to over-saturation of the short-period ground motion at short
distances if the regression was unconstrained, but none of the developers allowed over-
saturation in their models.
The five models all include a style-of-faulting factor, but the grouping of the
normal/oblique slip events with either normal or strike-slip events is different (Table 4).
Three models (AS08, CB08, and CY08) include rupture-depth and hanging-wall (HW)
factors. The BA08 model implicitly includes these effects through the use of RJB as the
primary distance measure. The I08 model does not include either of these effects.
There is a correlation between the style-of-faulting effect and the rupture-depth effect
because, in the NGA data base, a greater fraction of reverse earthquakes are buried ruptures
as compared to strike-slip earthquakes. For the three models that include the rupture-depth
parameter, much of the style-of-faulting effect given in previous models is accommodated by
the rupture-depth effect.
Four of the five models are applicable to soil sites as well as rock sites; the I08 model is
only applicable for rock sites. All four models applicable to soil sites include non-linear site
amplification factors. Three models (AS08, BA08, and CB08) constrained the non-linear
part of the amplification using either analytical model results or other published non-linear
amplification factors. In contrast, the CY08 model derived the non-linear amplification
directly from the NGA data as part of the regression.
The soil/sediment depth information is missing for most of the recording sites in the NGA
data set, causing difficulties in developing models for this effect. Three models (AS08,
CB08, and CY08) included the soil/sediment depth effects and one model (BA08) did not
include soil/sediment depth effects. The AS08 model constrained the shallow soil/sediment
depth scaling using analytical results from 1-D site amplification and constrained the deep
soil/sediment depth scaling using analytical results from 3-D basin amplification. The CY08

models estimated the soil/sediment depth scaling from the NGA data with available
soil/sediment depths. The CB08 model constrained the soil/sediment depth scaling using the
results from the 3-D simulations with additional empirical adjustments at short periods and
shallow soil/sediment depths.
There are two main differences in the forms of the standard deviation models: magnitude
dependence and non-linear site response effects. Three of the models (AS08, CY08, and I08)
have magnitude-dependent standard deviations and two models (BA08, and CB08) have
magnitude-independent standard deviations. Of the four models applicable to soil sites, three
models (AS08, CB08, and CY08) include some or all of the effects of non-linear site
amplification effects on the standard deviation. The fourth model, BA08, does not consider
the effects of non-linear amplification on the standard deviation. The I08 model does not
address this issue since it is only for rock sites.
Table 3. Functional Forms of NGA models
AS08 BA08 CB08 CY08 I08Saturation at
short distancesX X X X X
Style-of-FaultingFactor
X X X X X
Rupture DepthFactor
X Implicitthrough RJB
X(RV only)
X
HW Factor X Implicitthrough RJB
X X
Nonlinear siteamplification
Constrained(Walling et al,
2008)
Constrained(Choi &Stewart,2005)
Constrained(Walling et al,
2008)
X N/A
Soil/SedimentDepth factor
Constrained(Shallow: Silva,
2005;Deep: Day et al,
2005)
ConstrainedDeep: Day et
al. (2005)
X N/A
MagnitudeDependent σ
X X X
Non-linearEffects on σ
Intra-event andintra-event terms
Intra-eventterm only
Intra-eventand intra-
eventterms
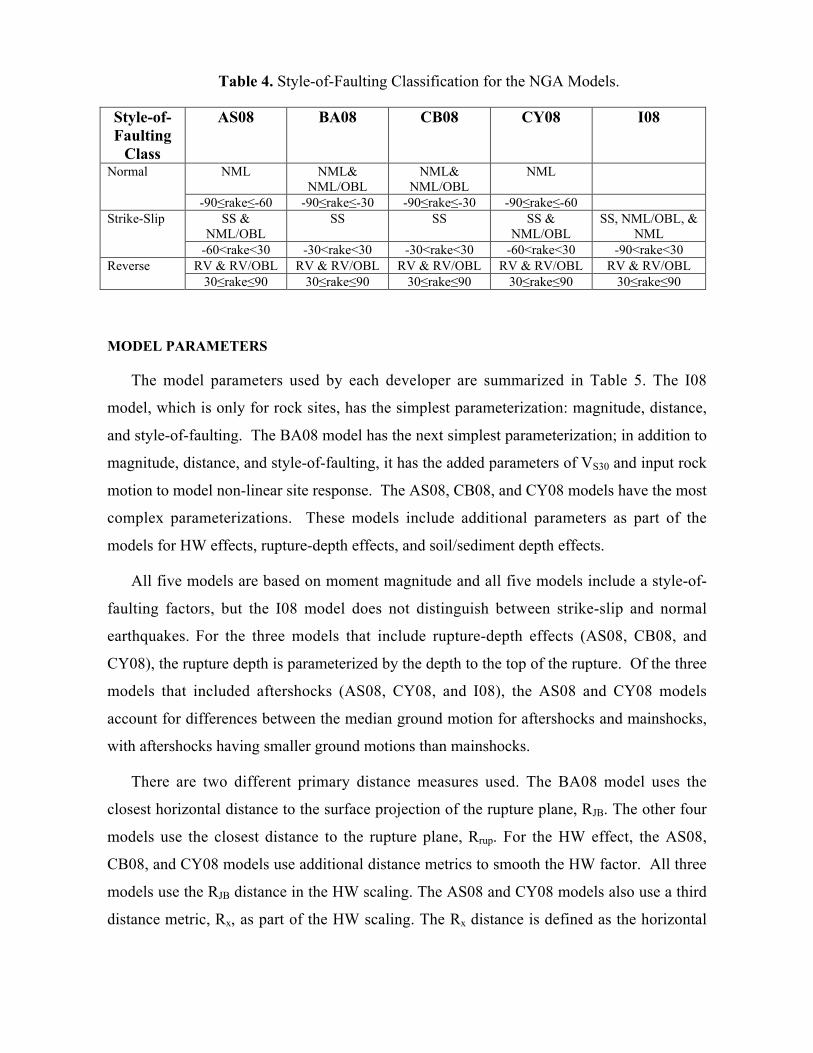
Table 4. Style-of-Faulting Classification for the NGA Models.
Style-of-Faulting
Class
AS08 BA08 CB08 CY08 I08
NML NML&NML/OBL
NML&NML/OBL
NMLNormal
-90≤rake≤-60 -90≤rake≤-30 -90≤rake≤-30 -90≤rake≤-60SS &
NML/OBLSS SS SS &
NML/OBLSS, NML/OBL, &
NMLStrike-Slip
-60<rake<30 -30<rake<30 -30<rake<30 -60<rake<30 -90<rake<30RV & RV/OBL RV & RV/OBL RV & RV/OBL RV & RV/OBL RV & RV/OBLReverse
30≤rake≤90 30≤rake≤90 30≤rake≤90 30≤rake≤90 30≤rake≤90
MODEL PARAMETERS
The model parameters used by each developer are summarized in Table 5. The I08
model, which is only for rock sites, has the simplest parameterization: magnitude, distance,
and style-of-faulting. The BA08 model has the next simplest parameterization; in addition to
magnitude, distance, and style-of-faulting, it has the added parameters of VS30 and input rock
motion to model non-linear site response. The AS08, CB08, and CY08 models have the most
complex parameterizations. These models include additional parameters as part of the
models for HW effects, rupture-depth effects, and soil/sediment depth effects.
All five models are based on moment magnitude and all five models include a style-of-
faulting factors, but the I08 model does not distinguish between strike-slip and normal
earthquakes. For the three models that include rupture-depth effects (AS08, CB08, and
CY08), the rupture depth is parameterized by the depth to the top of the rupture. Of the three
models that included aftershocks (AS08, CY08, and I08), the AS08 and CY08 models
account for differences between the median ground motion for aftershocks and mainshocks,
with aftershocks having smaller ground motions than mainshocks.
There are two different primary distance measures used. The BA08 model uses the
closest horizontal distance to the surface projection of the rupture plane, RJB. The other four
models use the closest distance to the rupture plane, Rrup. For the HW effect, the AS08,
CB08, and CY08 models use additional distance metrics to smooth the HW factor. All three
models use the RJB distance in the HW scaling. The AS08 and CY08 models also use a third
distance metric, Rx, as part of the HW scaling. The Rx distance is defined as the horizontal

distance from the top edge of the rupture, measured perpendicular to the fault strike (Rx is
positive over the hanging wall and negative over the footwall).
All of the models except for I08 use the average shear-wave velocity in the top 30 m,
VS30, as the primary site parameter. All four models that include site effects incorporate non-
linear site response. Two different measures for the strength of the shaking are used for the
non-linear site response effects: AS08, BA08, and CB08 use the median peak acceleration on
a rock outcrop; CY08 use the median spectral acceleration on a rock outcrop at the period of
interest. The BA08 model defines the input rock motion based on VS30=760 m/s whereas the
other three models use a VS30 of about 1100 m/s. Three models include the soil depth as an
additional site parameter: AS08 and CY08 use the depth to VS=1.0 km/s and CB08 use the
depth the VS=2.5 km/s.
Table 5. Parameters used in the NGA models
Parameter AS08 BA08 CB08 CY08 IMoment magnitude M M M M MDepth-to-top-of-rupture (km) ZTOR ZTOR ZTOR
Reverse style-of-faulting flag FRV RS FRV FRV FNormal style-of-faulting flag FNM NS FNM FNM
Strike-slip style-of-faulting flag SSUnspecified style-of-faulting flag USAftershock flag FAS ASDip (degrees) δ * δ * δ *Down-dip rupture width (km) W *Closest distance to the rupture plane(km)
Rrup Rrup Rrup Rrup
Horizontal distance to the surfaceprojection of the rupture (km)
Rjb * Rjb Rjb * Rjb *
Horizontal distance to the top edge ofthe rupture measured perpendicular tostrike (km)
Rx * Rx *
Hanging Wall Flag FHW FHW
Average shear-wave velocity in the top30 m (m/s)
VS30 VS30 VS30 VS30
Depth to VS=1.0 km/s (km) Z1.0 Z1.0
Depth to VS=2.5 km/s (km) Z2.5
Rock motion PGA for non-linear siteresponse
€
P ˆ G A1100 pga4nl A1100
Rock motion Sa for non-linear siteresponse
yref(T)
VS30 of rock motion used for non-linearsite response (m/s)
1100 760 1100 1130
* Used for HW scaling only

COMPARISON OF THE MEDIAN VALUES
The NGA models use different source parameters and distance measures. Some of the
models include the depth to top of rupture as a source parameter. To compare with the NGA
models that do not include this parameter, the median depth-to-top-of-rupture from the NGA
data base was used: 6 km for M=5.0, 3 km for M=6, 1 km for M=7, and 0 km for M=8.0. To
address the different distance measures used by the NGA models, the ground motions were
computed for specified source-site geometries.
There is also an issue of the soil/sediment depth to be used for the comparisons. The
AS08 and CY08 models both give recommended values of Z1.0 to be used if the soil/sediment
depth is not known. The relations for the median Z1.0 for a given VS30 are not consistent
between these two models. For the general comparisons, the recommended median Z1.0
values are used for each model. For the CB08 model, which uses Z2.5 as the soil/sediment
depth parameter, the recommendation is to estimate Z2.5 from the Z1.0. For the comparisons,
the Z2.5 are estimated using the AS08 estimates of Z1.0.
DISTANCE SCALING
The distance scaling for the median ground motion for vertical strike-slip faults and a
rock site condition (VS30=760 m/s, Z1.0=0.034 km, Z2.5=0.64 km) is compared in Figures 1a
and 1b for peak acceleration and T=1 sec spectral acceleration, respectively. For M6 and M7
earthquakes, the five NGA models lead to similar ground motions (within a range of a factor
of 1.5). At M5 and M8, the differences between the NGA models become larger (up to a
factor of 2) due to the sparse amount strong motion data from M5 and M8 earthquakes.
At 200 km for M8, the AS08 model has PGA values a factor of 2 larger than the other
four models. One cause of the large difference is that the AS08 data set excluded recordings
at distances greater than 100 km from earthquakes outside of the WUS because AS08
considered regional differences to be stronger at larger distances. As a result, AS08 excluded
large magnitude large distance data from Kocaeli (EQID 136), Chi-Chi (EQID 137), and
Manjil (EQID 144) which all showed greater attenuation (lower ground motions) at distances
greater than 100 km. At large distances (> 100 km), the AS08 model is only applicable to the
WUS.
The large range of the M5 models is due to the selection of the sparse strong motion data
from M5 earthquakes. A large set of M5 data is available from broadband network stations,

but the compilation of data from moderate magnitude (M5) earthquakes was not emphasized
in the NGA project because these earthquakes are generally not of engineering interest in
California. The range of the ground motion models for M5 could be greatly reduced with the
compilation of the available M5 ground motion recordings.
The distance scaling for soil sites is shown in Figures 2a and 2b for PGA and T=1 sec
spectral acceleration, respectively. The range of the soil-site ground motions for the four
NGA models applicable to soil sites are similar to the range of ground motions seen for rock
sites.
MAGNITUDE SCALING
The magnitude scaling of the median ground motion is compared in Figure 3 for an RJB
distance of 30 km and a rock site condition. Overall, the magnitude scaling for the five NGA
models are very similar. For short spectral periods, the median ground motions are within a
factor of 1.5. At long periods, the range increases to a factor of 2 at M5 and M8.
DEPTH OF RUPTURE SCALING
The depth-to-top-of-rupture scaling of the median ground motions is compared in Figure
4 for M6 earthquakes at a RJB distance of 10 km for both strike-slip and reverse earthquakes.
For the BA08 model, there is no dependence on depth since the model uses RJB as the
distance measure. For the I08 model, there is a systematic decrease in the median ground
motion with increasing depth because this model does not include a depth factor and uses
Rrup as the distance measure. The AS08 and CY08 models include a rupture depth
dependence for both strike-slip and reverse earthquakes with the buried ruptures leading to
stronger shaking than surface ruptures at the same distance. As a result of this depth scaling,
these two models show an increase in the median ground motion as the rupture depth
increases: the CY08 model has a smooth increase from 0 to 7 km depth and then becomes
almost constant, similar to the RJB scaling; the AS08 model has a strong scaling with depth
with a limit on the depth scaling of 10 km. This causes the AS08 model to have a peak in the
scaling at a depth of 10 km. The CB08 model includes a rupture depth effect for reverse
earthquakes only for depth greater than 1 km. As a result, the CB08 model shows a
systematic decrease in the PGA with increasing depth for strike-slip earthquakes, but there is
an increase from surface rupture (depth 0) to 1 km depth (buried rupture) for reverse
earthquakes, followed by a smooth decrease.

The range of median ground motions due to the rupture depth scaling is up to a factor of
2. The rupture depth scaling is a new feature of the NGA models. The range can be reduced
with the inclusion of additional moderate magnitude (M5-M6) earthquakes to better constrain
the rupture-depth scaling.
VS30 SCALING
The VS30 scaling of the median ground motion is shown in Figures 5a and 5b for M7
strike-slip earthquakes at rupture distances of 100 and 10 km, respectively. For the 100 km
distance case, the site response is nearly linear and the four models all show similar ln(VS30)
slopes. There are two limits to the VS30 scaling. First, there is a limit beyond which the
amplification is constant. For the AS08 model this limit is period dependent limit whereas
the limit is period independent (1100 m/s) for the CB08 and CY08 models. For the BA08
model, this limit is not included as part of the model. The second limit is the maximum VS30
for which the models are applicable. The largest VS30 values recommended by the developers
are 1300 m/s for BA08, 1500 m/s for CB08 and CY08, and 2000 m/s for AS08.
For the 10 km case, there are strong non-linear effects on the amplification. There is little
scaling with VS30 for the short periods due to the non-linear effects. For T=3 sec, the site
response is approximately linear and the scaling with VS30 is similar to the scaling for the 100
km case.
HANGING-WALL SCALING
The hanging-wall scaling is compared in Figure 6 for reverse and normal M6.7
earthquakes with surface rupture and with buried rupture. For this example, the top of
rupture for the buried case is at a depth of 6 km, consistent with the 1994 Northridge
earthquake. The AS08, CB08, and CY08 models include explicit HW effects. The BA08
model implicitly includes HW effects through the use of the RJB distance metric which leads
to a constant ground motion for sites located over the rupture plane (RJB=0). The I08 model
does not include HW effects so this model attenuates smoothly as a function of the rupture
distance. The buried rupture case leads to the largest differences in the models with a range
of a factor of 2.5 in the median ground motions for sites over the HW. The CY08 model has
the strongest HW scaling for surface rupture and the AS08 model has the strongest HW
scaling for buried ruptures.

RESPONSE SPECTRA
The median response spectra for M=5, 6, 7, and 8 for strike-slip earthquakes for rock site
conditions are compared in Figure 7. For M6-M7, the spectral for the five models are similar
(within a factor of 1.5). At M5 and M8, the range increases to a factor of 2.
The soil/sediment depth scaling for M7 strike-slip earthquakes at a distance of 10 km is
compared in Figure 8. For an average soil/sediment depth (Z1.0=0.50 km, Z2.5=2.3 km), the
four models have very similar spectra (within a factor of 1.3). Three of the models include
the effects of soil/sediment depth (the BA08 model does not include soil/sediment depth
effects). For shallow soil/sediment depths (Z1.0=0.1 km, Z2.5=0.9 km), the AS08 model has a
large reduction in the long-period ground motion, but the other two models do not have an
effect on the long-period ground motion for shallow soil/sediment sites. The AS08 shallow
soil/sediment scaling is stronger due to the use of 1-D analytical site response results to
constrain the model. For the deep soil/sediment sites (Z1.0=1.2 km, Z2.5=4.8 km), the three
models (AS08, CB08, and CY08) all show a large increase in the long-period motion as
compared to the BA08 model that does not include soil/sediment depth scaling. At T=10 sec
period, the AS08 and CB08 models show the strongest scaling due to the use of the 3-D
analytical basin response results to constrain their models. At short periods, the CB08 and
CY08 models show an increase for deep soil/sediment sites based on fitting the scaling seen
in the NGA data that have soil/sediment depth estimates.
COMPARISON OF THE STANDARD DEVIATIONS
The period dependence of the standard deviation for M=5 and M=7 earthquakes is
compared in Figure 9. For M=7, the five models have similar standard deviations. For M=5,
there is a large difference with the three magnitude-dependent models showing much larger
standard deviations. The magnitude dependence of the standard deviation is compared in
Figure 10 for PGA and T=1 sec. The three models that included a magnitude-dependent
standard deviation all included aftershocks, whereas the two models that used a magnitude-
independent standard deviation excluded aftershocks. Including aftershocks greatly increases
the number of small magnitude earthquakes and the aftershocks show larger variability than
the large-magnitude mainshocks.
All four models applicable to soil sites included non-linear effects on the median site
amplification, but they address the impacts on the standard deviation differently. The AS08

and CY08 models include the impacts on both the intra-event and inter-event standard
deviations. The CB08 model includes the impact on the intra-event standard deviation, but
excludes the impact on the inter-event standard deviation. The BA08 models does not
include the effect on either the intra-event or inter-event standard deviations. When the non-
linear effects are included, the standard deviations for the short-period ground motions are
reduced. The distance dependence of the standard deviation is shown in Figure 11 for M7
strike-slip earthquakes for PGA and spectral acceleration at T=1 sec. At short distances, the
non-linear effects lead to a reduction of 0.10 to 0.15 natural log units.
CONCLUSIONS
Overall, the NGA models show similar median values (within a factor of 1.5) for vertical
strike-slip faults with magnitudes between 5.5 and 7.5. The largest differences are for small
magnitudes (M5), very large magnitudes (M8), and sites over the hanging wall. The standard
deviations are similar for M>6.5. The largest differences in the standard deviations are for
small magnitudes (due to inclusion or exclusion of aftershocks) and for soil sites at short
distances (due to inclusion or exclusion of non-linear effects on the standard deviation).
REFERENCES
Abrahamson, N. A. and W. J. Silva (2008). Summary of the Abrahamson and Silva NGA ground-
motion relations, Earthquake Spectra, this issue
Boore, D. M. and G. M. Atkinson (2008). Ground-motion prediction equations for the average
horizontal component of PGA, PGV, and 5%-damped PSA at spectral periods between 0.01s and
10.0s, Earthquake Spectra, this issue
Campbell, K. W. and Y. Bozorgnia (2006). Next generation attenuation (NGA) empirical ground
motion models: can they be used in Europe?, First European Conference on Earthquake
Engineering and Seismology Geneva, Switzerland, 3-8 September 2006, Paper Number: 458
Campbell, K. W. and Y. Bozorgnia (2008). NGA ground motion model for the geometric mean
horizontal component of PGA, PGV, PGD and 5% damped linear elastic response spectra for
periods ranging from 0.01 to 10 s, Earthquake Spectra, this issue
Chiou, B. S. J and R. R. Youngs (2008). Chiou-Youngs NGA ground motion relations for the
geometric mean horizontal component of peak and spectral ground motion parameters,
Earthquake Spectra, this issue

Choi, Y and J. P. Stewart (2005). Nonlinear site amplification as function of 30 m shear-wave
velocity, Earthquake Spectra, 21, 1-30.
Day, S. M., J. Bielak, D. Dreger, R. Graves, S. Larsen, K. Olsen, A. Pitarka (2005). 3D ground
motion simulations in basins, Final report prepared for the Pacific Earthquake Engineering
Research Center, Project 1A03.
Idriss, I. M. (2008). An NGA empirical model for estimating the horizontal spectral values generated
by shallow crustal earthquakes, Earthquake Spectra, this issue
Silva, W. J. (2005) Site response simulations for the NGA project. Report prepared for the Pacific
Earthquake Engineering Research Center.
Stafford, P. J., F. O. Strasser, and J. J. Bommer (2008). An Evaluation of the Applicability of the
NGA Models to Ground-Motion Prediction in the Euro-Mediterranean Region, accepted for
publication in Bulletin of Earthquake Engineering, vol. 6, 2008
Walling, M, W. J. Silva, and N. A. Abrahamson (2008). Non-linear Site Amplification Factors for
Constraining the NGA models, Earthquake Spectra, this issue.
ACKNOWLEDGMENTS
This study was sponsored by the Pacific Earthquake Engineering Research Center's
Program of Applied Earthquake Engineering Research of Lifelines Systems supported by the
California Department of Transportation, the California Energy Commission, and the Pacific
Gas & Electric Company. This work was partly funded by the PG&E/DOE cooperative
agreement: “Development and Verification of an Improved Model for Extreme Ground
Motions Produced by Earthquakes” (DOE Award Number DE-FC28-05RW12358).
This work made use of the Earthquake Engineering Research Centers Shared Facilities
supported by the National Science Foundation under award number EEC-9701568 through
the Pacific Earthquake Engineering Research Center (PEER). Any opinions, findings, and
conclusion or recommendations expressed in this material are those of the authors and do not
necessarily reflect those of the National Science Foundation.

Figure 1a. Comparison of distance scaling of PGA for strike-slip earthquakes for VS30=760 m/s.
Figure 1b. Comparison of distance scaling of T=1 sec for strike-slip earthquakes for VS30=760 m/s.

Figure 2a. Comparison of distance scaling of PGA for strike-slip earthquakes for VS30=270 m/s.
Figure 2b. Comparison of distance scaling of T=1 sec for strike-slip earthquakes for VS30=270 m/s
.

Figure 3. Comparison of magnitude scaling of the median ground motion for strike-slip earthquakesand rock site conditions (VS30=760 m/s) at a distance of 30 km.
Figure 4. Comparison of scaling of PGA with depth for M6 earthquakes and rock site conditions(VS30=760 m/s) at RJB=10km: left frame is for strike-slip earthquakes; right frame is for reverse slip
earthquakes.
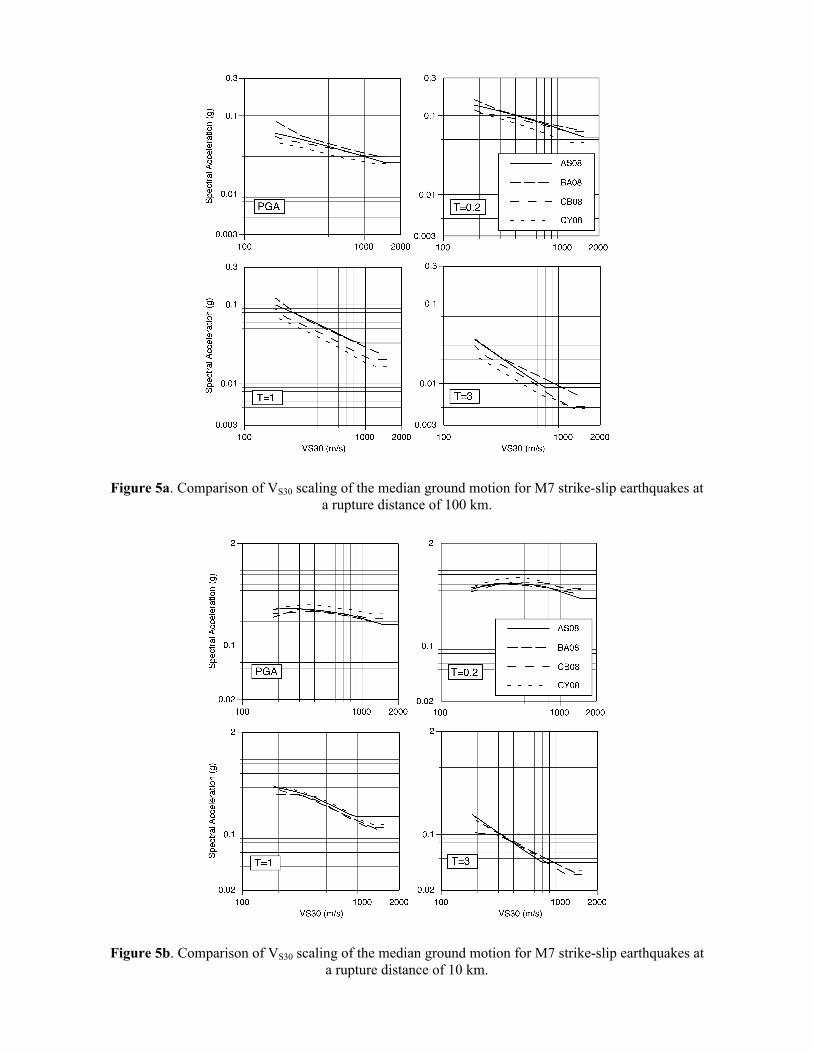
Figure 5a. Comparison of VS30 scaling of the median ground motion for M7 strike-slip earthquakes ata rupture distance of 100 km.
Figure 5b. Comparison of VS30 scaling of the median ground motion for M7 strike-slip earthquakes ata rupture distance of 10 km.

Figure 6. Comparison of FW and HW effects on of PGA for a 45 degree, M6.7 earthquakes forVS30=760 m/s. Left frame: surface rupture. Right Frame: buried rupture (top=6 km).

Figure 7. Comparison of median 5% damped spectra for strike-slip earthquakes and rock siteconditions (VS30=760 m/s) at an RJB distance of 10 km.
Figure 8. Comparison of median spectra for M7 strike-slip earthquakes at an RJB distance of 10 kmfor different site conditions: soil sites (VS30=270 m/s) with average soil depth (Z1.0=0.5 km, Z2.5=2.3km), shallow soil depth (Z1.0=0.1 km, Z2.5=0.9 km), and deep soil depth (Z1.0=1.2 km, Z2.5=4.8 km)depths and rock sites (VS30=760 m/s)

Figure 9. Comparison of the standard deviation for M5 (left) and M7 (right) strike-slip earthquakes ata distance of 30 km for rock site conditions (VS30=760 m/s).
Figure 10. Comparison of magnitude dependence of the standard deviation for PGA (left) and T=1sec (right) for strike-slip earthquakes at a distance of 30 km for rock site conditions (VS30=760 m/s).
Figure 11. Comparison of distance dependence of the standard deviation for PGA (left) and spectralacceleration at T=1 sec (right) for M7 strike-slip earthquakes and soil site conditions (VS30=270 m/s).