Comparisons of normal saline and lactated Ringer's ...
12
ORIGINAL RESEARCH Open Access Comparisons of normal saline and lactated Ringer’ s resuscitation on hemodynamics, metabolic responses, and coagulation in pigs after severe hemorrhagic shock Wenjun Z Martini * , Douglas S Cortez and Michael A Dubick Abstract Background: Ongoing improvements in trauma care now recommend earlier use of blood products as part of damage control resuscitation, but generally these products are not available at far forward battlefield locations. For the military, questions continue to arise regarding efficacy of normal saline (NS) vs. lactated Ringer’s (LR). Thus, this study compared the effects of LR and NS after severe hemorrhage in pigs. Methods: 20 anesthetized pigs were randomized into control (n = 6), LR (n = 7), and NS (n = 7) groups. Hemorrhage of 60% estimated total blood volume was induced in LR and NS groups by removing blood from the left femoral artery using a computer-controlled pump. Afterwards, the pigs were resuscitated with either LR at 3 times the bled volume or the volume of NS to reach the same mean arterial pressure (MAP) as in LR group. Hemodynamics were measured hourly and blood samples were taken at baseline (BL), 15 min, 3 h and 6 h after resuscitation to measure changes in coagulation using thrombelastograph®. Results: MAP was decreased by hemorrhage but returned to BL within 1 h after resuscitation with LR (119 ± 7 ml/kg) or NS (183 ± 9 ml/kg, p < 0.05). Base excess (BE) was decreased by hemorrhage; resuscitation with LR recovered BE but not with NS. Total peripheral resistance was decreased with NS and LR, with a larger drop shown in NS. Serum potassium was increased with NS, but not affected with LR. Coagulation changes were similar between LR and NS. Conclusions: NS may be inferior to LR in resuscitation due to its vasodilator effects and the risks of metabolic acidosis and hyperkalemia. Keywords: Hemorrhagic shock, Oxygen metabolism, Coagulation, Pre-hospital resuscitation and Thromboelastrograph® Background Normal saline (NS) and lactated Ringer’ s (LR) solution have been used as crystalloid fluids for decades [1,2], but controversies continue as to which crystalloid is best. Although damage control resuscitation was introduced recently to initiate early use of blood products for se- verely injured hypotensive trauma patients [3-6], blood products are not generally available at pre-hospital and far forward military settings. Crystalloids remain to be used as resuscitation fluids under these conditions with survival benefit [7]. NS contains 154 mM Na + and Cl - , with an average pH of 5.0 and osmolarity of 308 mOsm/L. LR solution has an average pH of 6.5, is hypo-osmolar (272 mOsm/L), and has similar electrolytes (130 mM Na + , 109 mM Cl - , 28 mM lactate, etc.) to plasma; thus, it was considered a more physiologically compatible fluid than NS. Since its initial use in 1831 for treating cholera [8,9], NS has been recommended as therapeutic intravenous (IV) fluid in various clinical situations, such as kidney transplantation, blood storage, and blood transfusion [10,11], although development of hyperchloremic acidosis is commonly observed [12-14]. LR’ s acid base balance is superior to that of NS’ s [15,16], but it has not been * Correspondence: [email protected] US Army Institute of Surgical Research, JBSA Ft, 3698 Chambers Pass, Sam Houston, TX 78234, USA © 2013 Martini et al.; licensee BioMed Central Ltd. This is an open access article distributed under the terms of the Creative Commons Attribution License (http://creativecommons.org/licenses/by/2.0), which permits unrestricted use, distribution, and reproduction in any medium, provided the original work is properly cited. Martini et al. Scandinavian Journal of Trauma, Resuscitation and Emergency Medicine 2013, 21:86 http://www.sjtrem.com/content/21/1/86
-
Upload
khangminh22 -
Category
Documents
-
view
0 -
download
0
Transcript of Comparisons of normal saline and lactated Ringer's ...

Martini et al. Scandinavian Journal of Trauma, Resuscitation and Emergency Medicine 2013, 21:86http://www.sjtrem.com/content/21/1/86
ORIGINAL RESEARCH Open Access
Comparisons of normal saline and lactatedRinger’s resuscitation on hemodynamics,metabolic responses, and coagulation in pigsafter severe hemorrhagic shockWenjun Z Martini*, Douglas S Cortez and Michael A Dubick
Abstract
Background: Ongoing improvements in trauma care now recommend earlier use of blood products as part ofdamage control resuscitation, but generally these products are not available at far forward battlefield locations. Forthe military, questions continue to arise regarding efficacy of normal saline (NS) vs. lactated Ringer’s (LR). Thus, thisstudy compared the effects of LR and NS after severe hemorrhage in pigs.
Methods: 20 anesthetized pigs were randomized into control (n = 6), LR (n = 7), and NS (n = 7) groups. Hemorrhageof 60% estimated total blood volume was induced in LR and NS groups by removing blood from the left femoralartery using a computer-controlled pump. Afterwards, the pigs were resuscitated with either LR at 3 times the bledvolume or the volume of NS to reach the same mean arterial pressure (MAP) as in LR group. Hemodynamics weremeasured hourly and blood samples were taken at baseline (BL), 15 min, 3 h and 6 h after resuscitation to measurechanges in coagulation using thrombelastograph®.
Results: MAP was decreased by hemorrhage but returned to BL within 1 h after resuscitation with LR (119 ± 7 ml/kg)or NS (183 ± 9 ml/kg, p < 0.05). Base excess (BE) was decreased by hemorrhage; resuscitation with LR recovered BE butnot with NS. Total peripheral resistance was decreased with NS and LR, with a larger drop shown in NS. Serumpotassium was increased with NS, but not affected with LR. Coagulation changes were similar between LR and NS.
Conclusions: NS may be inferior to LR in resuscitation due to its vasodilator effects and the risks of metabolic acidosisand hyperkalemia.
Keywords: Hemorrhagic shock, Oxygen metabolism, Coagulation, Pre-hospital resuscitation and Thromboelastrograph®
BackgroundNormal saline (NS) and lactated Ringer’s (LR) solutionhave been used as crystalloid fluids for decades [1,2], butcontroversies continue as to which crystalloid is best.Although damage control resuscitation was introducedrecently to initiate early use of blood products for se-verely injured hypotensive trauma patients [3-6], bloodproducts are not generally available at pre-hospital andfar forward military settings. Crystalloids remain to beused as resuscitation fluids under these conditions with
* Correspondence: [email protected] Army Institute of Surgical Research, JBSA Ft, 3698 Chambers Pass, SamHouston, TX 78234, USA
© 2013 Martini et al.; licensee BioMed CentralCommons Attribution License (http://creativecreproduction in any medium, provided the or
survival benefit [7]. NS contains 154 mM Na+ and Cl-,with an average pH of 5.0 and osmolarity of 308 mOsm/L.LR solution has an average pH of 6.5, is hypo-osmolar(272 mOsm/L), and has similar electrolytes (130 mM Na+,109 mM Cl-, 28 mM lactate, etc.) to plasma; thus, it wasconsidered a more physiologically compatible fluid thanNS. Since its initial use in 1831 for treating cholera [8,9],NS has been recommended as therapeutic intravenous(IV) fluid in various clinical situations, such as kidneytransplantation, blood storage, and blood transfusion[10,11], although development of hyperchloremic acidosisis commonly observed [12-14]. LR’s acid base balance issuperior to that of NS’s [15,16], but it has not been
Ltd. This is an open access article distributed under the terms of the Creativeommons.org/licenses/by/2.0), which permits unrestricted use, distribution, andiginal work is properly cited.

Martini et al. Scandinavian Journal of Trauma, Resuscitation and Emergency Medicine 2013, 21:86 Page 2 of 12http://www.sjtrem.com/content/21/1/86
approved by the Association of American Blood Bank foruse with blood products in the same iv-line [11]. Thus, itis necessary and clinically relevant to comprehensively andsystemically examine the resuscitative effects of these twocrystalloids.Limited experimental evidence has contributed to the
difficulty over the selection of resuscitation fluids. LR’sbetter acid base balance and survival has been shown ina rat model with massive hemorrhage [17] and an un-anesthetized swine model with rapid hemorrhage [18],suggesting the superiority of LR under severe traumasetting. In pigs with uncontrolled hemorrhage, Kiralyet al. showed that LR resuscitation was associated withhypercoagulability and less blood loss over a 2-hourpost-injury period [19]. It is unclear whether the hyper-coagulability is transient or is likely to be a concern. Onthe other hand, a recent multicenter survey of prehospi-tal intervention at a combat zone showed that IV fluidsadministered in the field favored the use of NS by 73%to 17% LR [20], even though Hextend® (manufactured byBioTime, California, USA, with 6% hetastarch, a meanmolecular weight of 670 kD and a degree of hydro-xyethyl group substitution of 0.75 (HES 670/0.75)) is thefluid recommended by the Committee on Tactical Com-bat Casualty Care [21]. In addition, the Israeli DefenseForce has recently recommended LR as initial resuscita-tion of their combat casualties [22]. Thus, the greateruse of NS by medics than the recommendation forHextend® [20,21], recommendation for pre-hospital LR bythe Israeli Defense Force [22], and the inquiry from theUS Army’s Combat Developer’s office regarding NS vs. LRfor pre-hospital resuscitation, all together prompted thiscurrent study. In order to assess more comprehensivelythe physiological and biochemical effects of LR and NS,we compared the resuscitative effects of LR and NS onhemodynamics, oxygen metabolism, and coagulation in aswine model with severe hemorrhagic shock over a 6 hpost resuscitation period; the time period in which mosttrauma patients die from hemorrhage [23].
MethodsExperimental designThis animal study was approved by the Institutional Ani-mal Care and Use Committee of the US Army Institute ofSurgical Research and was conducted in compliance withthe Animal Welfare Act and the implementing AnimalWelfare Regulations and in accordance with the principlesof the Guide for the Care and Use of Laboratory Animals.A total of 20 pigs (34.6 ± 1.2 kg) were randomly allocatedinto three experimental groups: sham control (n = 6),hemorrhage with LR resuscitation group (LR, n = 7), andhemorrhage with NS resuscitation group (NS, n = 7). Afteran overnight fast, the animals were pre-anesthetized withGlycopyrrolate (Glycopyrronium bromide, 0.1 mg/kg,
America Regent, Shirley, NY, USA) and Telazol® (Tileta-mine HCl and Zolazepam HCl, 6 mg/kg, Pfizer, NY, NY,USA). Anesthesia was induced via a facemask withapproximately 5% Isoflurane (Forane, Baxer, Deerfield,IL, USA) in 100% Oxygen. The pigs were then intubatedwith a cuffed endotracheal tube (7.5 mm, Rusch, Tele-flex Medical, Research Triangle Park, NC). During sur-gical instrumentation, anesthesia was maintained with1% to 3% isoflurane in 30% oxygen in air using a ventila-tor and monitor (Fabius gas anesthesia system andInfinity Explorer monitoring system, Draeger Medical,Telford, PA). Tidal volume was set at 7 ml/kg with arate of 25 breaths/minute. Ventilation was adjusted toreach an end tidal pCO2 of approximately 40 mmHgat baseline. Afterwards, no adjustments in ventilationsetting were made throughout the experiment. Polyvinylchloride catheters were inserted into the thoracic aortavia the carotid artery to measure mean arterial pressure(MAP), systolic and diastolic blood pressure, and heartrate. A Swan-Ganz thermodilution catheter was insertedin the pulmonary artery via the left jugular vein to meas-ure cardiac output and temperature. The right femoralartery was cannulated for arterial blood sampling and in-duction of bleeding. The right jugular vein was cannulatedfor venous blood sampling. The left femoral vein wascannulated for resuscitation. The right femoral vein wascannulated for IV anesthesia during the study. No splenec-tomy was performed in this study.Upon completion of surgical procedures, anesthesia
was switched to a combination of isoflurane (0.5%) andcontinuous IV drip of Ketacine® (Ketamine HCl, 0.25 mg/(kg*min), Putney, Boise, ID, USA) in all pigs throughoutthe entire study period. After a 10-min stabilizationperiod, blood samples were taken from the femoral arteryand the right jugular vein for baseline measurements. Theurine bag was emptied before urine output measurementstarted at baseline. Hemorrhage was then induced bybleeding from the femoral artery into sterile empty bloodbags containing standard anticoagulant citrate phosphatedextrose solution. The pigs were hemorrhaged 60% oftheir estimated total blood volume exponentially over60 min using a computer-controlled pump as described inour laboratory [24]. Upon the completion of hemorrhage,pigs were randomly assigned to LR or NS group. In theLR group, pigs were resuscitated with LR at 3 times thebled volume given over a 45-min period. In the NS group,resuscitation with NS was given to reach the same MAPas achieved after resuscitation in the LR group. Therefore,an NS resuscitated pig was done after a LR resuscitatedpig. The LR of 3 times the bled volume was used since thisratio was conventionally recommended as initial fluid re-suscitation of hemorrhagic shock for prehospital traumalife support [25]. Pigs in the sham control group were nothemorrhaged or resuscitated. Pigs in all three groups were
Martini et al. Scandinavian Journal of Trauma, Resuscitation and Emergency Medicine 2013, 21:86 Page 3 of 12http://www.sjtrem.com/content/21/1/86
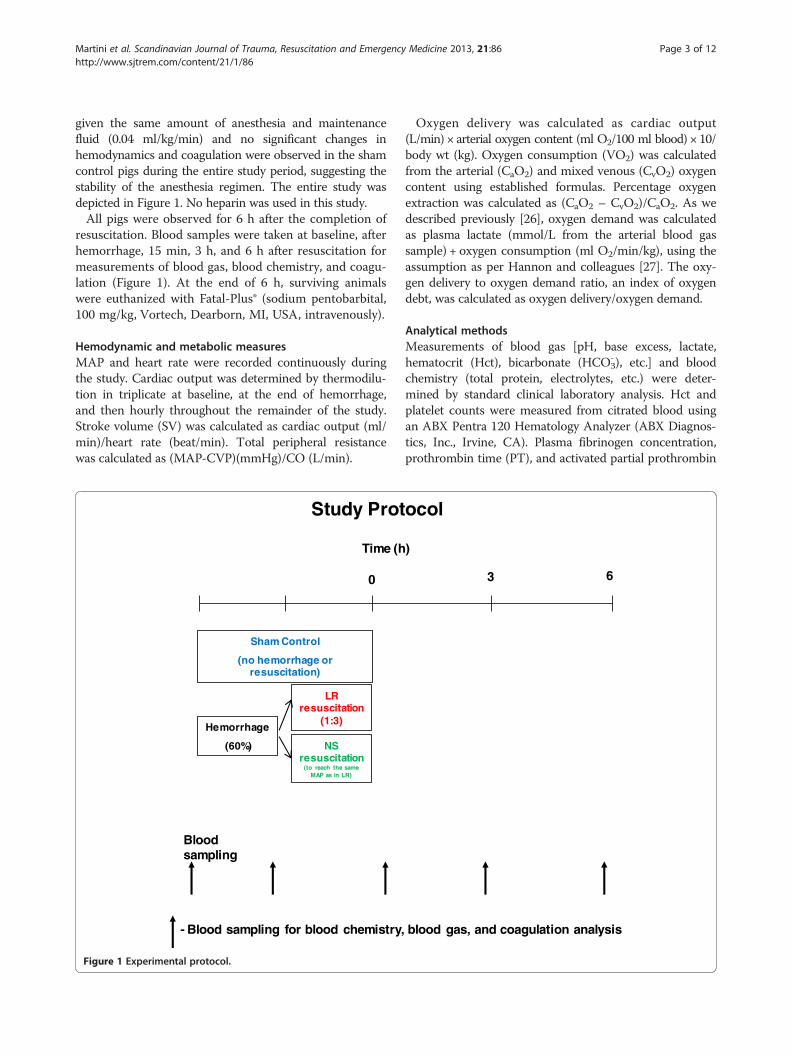
given the same amount of anesthesia and maintenancefluid (0.04 ml/kg/min) and no significant changes inhemodynamics and coagulation were observed in the shamcontrol pigs during the entire study period, suggesting thestability of the anesthesia regimen. The entire study wasdepicted in Figure 1. No heparin was used in this study.All pigs were observed for 6 h after the completion of
resuscitation. Blood samples were taken at baseline, afterhemorrhage, 15 min, 3 h, and 6 h after resuscitation formeasurements of blood gas, blood chemistry, and coagu-lation (Figure 1). At the end of 6 h, surviving animalswere euthanized with Fatal-Plus® (sodium pentobarbital,100 mg/kg, Vortech, Dearborn, MI, USA, intravenously).
Hemodynamic and metabolic measuresMAP and heart rate were recorded continuously duringthe study. Cardiac output was determined by thermodilu-tion in triplicate at baseline, at the end of hemorrhage,and then hourly throughout the remainder of the study.Stroke volume (SV) was calculated as cardiac output (ml/min)/heart rate (beat/min). Total peripheral resistancewas calculated as (MAP-CVP)(mmHg)/CO (L/min).
0
Time (h
Blood sampling
Study Prot
Hemorrhage
(60%)
LR resuscitation
(1:3)
NS resuscitation
(to reach the same MAP as in LR)
Sham Control
(no hemorrhage or resuscitation)
- Blood sampling for blood chemistry,
Figure 1 Experimental protocol.
Oxygen delivery was calculated as cardiac output(L/min) × arterial oxygen content (ml O2/100 ml blood) × 10/body wt (kg). Oxygen consumption (VO2) was calculatedfrom the arterial (CaO2) and mixed venous (CvO2) oxygencontent using established formulas. Percentage oxygenextraction was calculated as (CaO2 – CvO2)/CaO2. As wedescribed previously [26], oxygen demand was calculatedas plasma lactate (mmol/L from the arterial blood gassample) + oxygen consumption (ml O2/min/kg), using theassumption as per Hannon and colleagues [27]. The oxy-gen delivery to oxygen demand ratio, an index of oxygendebt, was calculated as oxygen delivery/oxygen demand.
Analytical methodsMeasurements of blood gas [pH, base excess, lactate,hematocrit (Hct), bicarbonate (HCO3
-), etc.] and bloodchemistry (total protein, electrolytes, etc.) were deter-mined by standard clinical laboratory analysis. Hct andplatelet counts were measured from citrated blood usingan ABX Pentra 120 Hematology Analyzer (ABX Diagnos-tics, Inc., Irvine, CA). Plasma fibrinogen concentration,prothrombin time (PT), and activated partial prothrombin
)
3
ocol
6
blood gas, and coagulation analysis

Martini et al. Scandinavian Journal of Trauma, Resuscitation and Emergency Medicine 2013, 21:86 Page 4 of 12http://www.sjtrem.com/content/21/1/86
time (aPTT) were measured using the BCS CoagulationSystem (Dade Behring, Deerfield, IL).The coagulation profile was assessed in fresh whole
blood with pig thromboplastin by thrombelastograph®(TEG) using a TEG 5000 Hemostasis Analyzer (Haemo-scope, Niles, IL) In TEG measurements, reaction time(R time) is the latency time for initial clot formation,K time reflects the speed to reach a certain level of clotstrength, angle α reflects the rapidity of clot build-upand cross-linking, MA represents the maximum strengthor stiffness of the clot, and LY60 indicates the percentageof clot lysis at 60 min after maximum clotting is achieved.
Statistical analysisData were expressed as means ± standard error of themean (SEM) and analyzed using SAS statistical software(Cary, NC). A two-way analysis of variance (ANOVA)with repeated measures using a Tukey adjustment wasused to compare the changes over time between thegroups. A one-way ANOVA with repeated measuresusing a Dunnett adjustment was used to compare thechanges to baseline within the group. The statisticallysignificant level was set at p < 0.05.
ResultsHemodynamics, cardiac-pulmonary function, and oxygenmetabolic responsesAll animals survived to the end of the 6 h study. No sig-nificant changes in the hemodynamics were observed inthe control group over the experimental period. A 60%hemorrhage dropped MAP from the baseline value of79 ± 6 mm Hg to 31 ± 3 mm Hg (p < 0.05). In the LRgroup, resuscitation with LR at 3 times bled volume(119 ± 7 ml/kg) led to a MAP that peaked briefly nearpre-hemorrhage levels, but then fell and remained athypotensive levels around 60 mmHg (Figure 2). In theNS group, 183 ± 9 ml/kg of NS was infused to achieveMAP similar to that in the LR group (Figure 2). Heartrate was increased by hemorrhage, followed by a partialdecline after resuscitation in both groups. Heart ratereturned to near baseline levels in the NS group, butremained higher over baseline in the LR group (Figure 2).Urine output rose with resuscitation in both groups witha larger increase in the NS group, followed by a decline tobaseline values at 2 h after resuscitation in the LR group(Figure 2). From the start of resuscitation to 15 min afterthe completion of resuscitation, urine output in the NSgroup (23 ± 5 ml/kg) doubled that in the LR group (10 ±3 ml/kg, with 1 ± 0 ml/kg in the control group). The totalurine output over the 6 h resuscitation period in the NSgroup (45 ± 5 ml/kg) also doubled that in the LR group(21 ± 4 ml/kg, with 10 ± 1 ml/kg in the control group, allp < 0.05 LR versus NS, and LR or NS versus control).
No significant changes in cardiac output, stroke volume,total peripheral resistance, oxygen content, or oxygen ex-traction were observed in controls during the experiment(Table 1). No significant changes in temperature were ob-served in any groups during the study. Cardiac outputreturned to pre-hemorrhage levels at the end of LR resus-citation (15 min). In contrast, cardiac output was increased50% over BL by NS resuscitation and remained elevated inthis group for the 6 h experimental period. Stroke volumereturned to pre-hemorrhage levels with NS resuscitation(15 min), but remained below pre-hemorrhage levels forthe 6 h experimental period after LR resuscitation (Table 1).Total peripheral resistance was decreased after resuscita-tion with LR or NS, with a lower resistance shown in theNS group vs. the LR group (Table 1).Oxygen metabolic responses to hemorrhage and resus-
citation with LR or NS were described in Table 2 andFigure 3. Arterial PO2 and PCO2 were similar amongthe 3 groups during the study (Table 2). Venous PO2
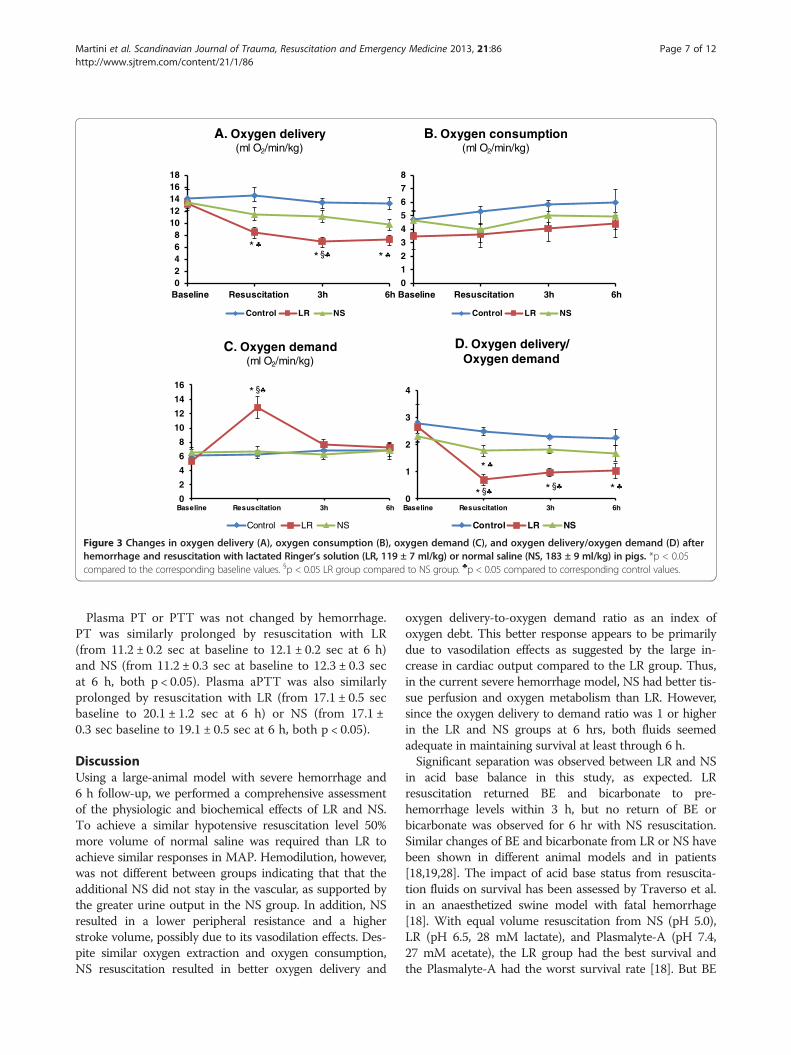
returned to pre-hemorrhage levels 15 min after LR orNS resuscitation, but declined during the remaining 6 hwith a larger decrease observed in LR group (Table 2).There were no differences in venous PCO2 among the 3groups during the study (Table 2). Arterial oxygen con-tent was decreased for 6 h after hemorrhage and resusci-tation with LR or NS (Table 2). Venous oxygen contentwas also decreased for 6 h after hemorrhage and resusci-tation with LR or NS (Table 2). Oxygen extraction wasincreased for 6 h after resuscitation with LR solution orNS. Oxygen delivery was reduced after resuscitation withLR, with no significant changes observed in the NSgroup (Figure 3A). Oxygen consumption remained un-changed in all three groups during the study (Figure 3B).Oxygen demand did not change after NS resuscitation,but doubled immediately after LR resuscitation, butreturned to baseline values by 3 h (Figure 3C). Oxygendelivery to oxygen demand ratio, an index of oxygendebt, was decreased after NS resuscitation but returnedto baseline value within 3 h, whereas a larger drop wasobserved after LR resuscitation and remained low overthe course of the study (Figure 3D).
Hemodilution, acid base balance, and electrolytesNo significant changes in Hct, base excess, or lactateconcentrations were observed in the control group overthe entire experimental period. Significant hemodilutionwas observed after hemorrhage and resuscitation withLR or NS (Table 1). Total protein dropped from baselinevalue of 5.6 ± 0.2 g/dL to 2.7 ± 0.1 g/dL at 15 min and3.3 ± 0.1 g/dL at 6 h after LR resuscitation and frombaseline value of 5.7 ± 0.2 g/dL to 3.0 ± 0.2 g/dL at15 min and 3.5 ± 0.2 g/dL at 6 h after NS resuscitation(all p < 0.05 vs. baseline). There were no significant

mm
Hg
BP
M
0
50
100
150
200
250
Baseline Hemo Resus 1h 2h 3h 4h 5h 6h
Control LR NS
0
20
40
60
80
100
Baseline Hemo Resus 1h 2h 3h 4h 5h 6hControl LR NS
mL
Mean Arterial Pressure
Heart Rate
Urine Output
0
200
400
600
800
1000
Baseline Hemo Resus 1h 2h 3h 4h 5h 6h
Control LR NS
*
*
** ** * * *
*****
*
*
* * * ** ***
*
*
**
*
Figure 2 Changes in mean arterial pressure (MAP), heart rate (HR), and urine output after hemorrhage and resuscitation with lactatedRinger’s solution (LR, 119 ± 7 ml/kg) or normal saline (NS, 183 ± 9 ml/kg) in pigs. *p < 0.05 compared to the corresponding baselinevalues. ♣p < 0.05 compared to corresponding control values.
Martini et al. Scandinavian Journal of Trauma, Resuscitation and Emergency Medicine 2013, 21:86 Page 5 of 12http://www.sjtrem.com/content/21/1/86
differences in Hct (Table 1) or total protein between LRand NS groups during the 6 h after resuscitation.Base excess fell below zero after hemorrhage and
returned to pre-hemorrhage levels with LR resuscitationby 3 h but remained below pre-hemorrhage levels for 6 hwith NS resuscitation (Figure 4). Plasma lactate levels roseabout 4.5-fold above baseline values by hemorrhage andreturned to pre-hemorrhage value within 15 min after NSresuscitation and at 6 h after LR resuscitation (Figure 4).
Bicarbonate HCO3- levels were decreased by hemorrhage
but returned to pre-hemorrhage values by 3 h after LRresuscitation, whereas no return was observed with NSresuscitation (Figure 4). Arterial pH was decreased froma pre-hemorrhage value of 7.41 ± 0.02 to 7.35 ± 0.01 afterNS resuscitation (p < 0.05) but returned to pre-hemorrhagevalue at the 3 h time point. No significant changes in arter-ial pH occurred in the control or LR group during thestudy.

Table 2 Changes in oxygen content and extraction afterhemorrhage and resuscitation with lactated Ringer’s (LR)solution or normal saline (NS) in pigs
Baseline Resuscitation 3 h 6 h
Arterial O2 (mmHg)
Control 475 ± 18 460 ± 15 497 ± 16 470 ± 15
LR 493 ± 15 513 ± 10 515 ± 15 499 ± 11
NS 478 ± 25 474 ± 21 490 ± 17 470 ± 16
Arterial CO2 (mmHg)
Control 47 ± 4 48 ± 4 45 ± 3 45 ± 4
LR 44 ± 3 43 ± 3 45 ± 3 43 ± 2
NS 47 ± 2 43 ± 2 44 ± 2 44 ± 1
Venous O2 (mmHg)
Control 55 ± 5 60 ± 4 58 ± 5 50 ± 5
LR 56 ± 2 53 ± 3 36 ± 1*♣ 36 ± 1*♣
NS 54 ± 2 53 ± 2 46 ± 2*♣ 43 ± 1*♣§
Venous CO2 (mmHg)
Control 60 ± 5 57 ± 4 50 ± 3 51 ± 5
LR 53 ± 2 50 ± 2 56 ± 2 56 ± 1
NS 59 ± 5 50 ± 2 55 ± 1 55 ± 1
Arterial oxygen content (ml O2/dL blood)
Control 13.8 ± 0.6 13.8 ± 0.5 13.6 ± 0.3 13.3 ± 0.7
LR 14.7 ± 0.3 7.6 ± 0.3*♣ 8.5 ± 0.6*♣ 7.8 ± 0.4*♣
NS 13.2 ± 0.9 6.4 ± 0.4*♣ 7.9 ± 0.4*♣ 7.3 ± 0.4*♣
Venous oxygen content (ml O2/dL blood)
Control 9.9 ± 0.5 9.9 ± 0.7 9.3 ± 0.6 7.7 ± 0.9
LR 10.8 ± 0.2 4.3 ± 0.2*♣ 3.5 ± 0.2*♣ 3.1 ± 0.2*♣
NS 8.6 ± 0.6 4.1 ± 0.3*♣ 4.2 ± 0.3*♣ 3.8 ± 0.3*♣
Oxygen extraction (%)
Control 28 ± 4 29 ± 3 32 ± 3 32 ± 3
LR 28 ± 2 43 ± 2* 57 ± 3* 60 ± 3*
NS 35 ± 5 36 ± 3 47 ± 3* 49 ± 3*
Animal groups include control (C, n = 6), hemorrhage with LR resuscitation(LR, n = 6), and hemorrhage with normal saline resuscitation (NS, n = 6). Dataare expressed as means ± SE.*p < 0.05 compared to corresponding baseline values within the group; §p < 0.05LR vs NS groups; and ♣p < 0.05 compared to corresponding control values.
Table 1 Changes of cardiac-pulmonary functions andhemodilution after hemorrhage and resuscitation withlactated Ringer’s (LR) solution or normal saline (NS) in pigs
Baseline Resuscitation 3 h 6 h
Cardiac output (L/min)
Control 3.9 ± 0.3 4.3 ± 0.3 4.4 ± 0.4 3.6 ± 0.2
LR 3.7 ± 0.2 3.9 ± 0.3 3.5 ± 0.2 3.3 ± 0.2
NS 3.8 ± 0.3 5.9 ± 0.5*§♣ 4.7 ± 0.3§ 4.5 ± 0.2§♣
Stroke volume (ml/beat)
Control 36.5 ± 3.5 36.8 ± 2.2 36.8 ± 3.7 35.5 ± 3.9
LR 41.4 ± 3.3 24.9 ± 1.6*§♣ 21.4 ± 2.3*§ 24.7 ± 2.1*§
NS 38.2 ± 4.9 45.7 ± 4.7 38.1 ± 3.3 40.1 ± 3.3
Total Peripheral resistance (mm Hg/(L/min))
Control 20.4 ± 1.4 18.6 ± 2.0 17.3 ± 2.6 17.7 ± 1.3
LR 22.9 ± 1.0 17.7 ± 0.9* 17.9 ± 1.3* 17.4 ± 0.7*
NS 23.1 ± 1.8 12.5 ± 1.4*§ 12.5 ± 0.7*§ 12.0 ± 0.4*§
Hct (%)
Control 29.0 ± 0.8% 28.9 ± 0.9% 28.0 ± 0.9% 27.6 ± 1.0%
LR 30.2 ± 1.0% 13.1 ± 0.9%*♣ 14.0 ± 0.7%*♣ 14.7 ± 0.6%*♣
NS 29.0 ± 1.0% 11.6 ± 0.8 %*♣ 12.5 ± 0.6%*♣ 12.2 ± 0.7%*♣
Animal groups include control (C, n = 6), hemorrhage with LR resuscitation(LR, n = 6), and hemorrhage with normal saline resuscitation (NS, n = 6). Dataare expressed as means ± SE.*p < 0.05 compared to corresponding baseline values within the group;§p < 0.05 LR vs NS groups; and ♣p < 0.05 compared to correspondingcontrol values.
Martini et al. Scandinavian Journal of Trauma, Resuscitation and Emergency Medicine 2013, 21:86 Page 6 of 12http://www.sjtrem.com/content/21/1/86
There were no significant changes in Na+, K+, Ca++, or Cl-
in the control group during the entire study period (Table 3).Na+ was increased after NS resuscitation but returned topre-hemorrahge level within 6 h. K+ did not change initiallyafter NS resuscitation but was elevated at 6 h afterwards(Table 3). No changes in Na+ or K+ were observed in pigswith LR resuscitation (Table 3). Ca++ was similarly decreasedat 15 min after resuscitation with LR or NS but returned topre-hemorrhage levels by 6 h in both groups (Table 3).Cl- was elevated for 6 h after NS resuscitation, with nochanges shown after LR resuscitation (Table 3).
CoagulationPlasma fibrinogen concentration in control pigs remainedunchanged during the study. Plasma fibrinogen concen-tration was decreased from a baseline value of 193 ±12 mg/dL to 95 ± 5 mg/dL after LR resuscitation (p < 0.05)and from a baseline value of 189 ± 9 mg/dL to 101 ±5 mg/dL after NS resuscitation (p < 0.05). Platelet countwas decreased from the baseline value of 359 ± 54 103/μLto 172 ± 28 103/μL after LR resuscitation and from a base-line value of 427 ± 58 103/μL to 207 ± 29 103/μL after NSresuscitation (both p < 0.05). There were no significantdifferences between LR and NS groups in fibrinogenconcentrations or platelet count during the 6 h afterresuscitation.
There were no changes in TEG measurements inthe control group during the study (Figure 5). R timeand K times were shortened by hemorrhage butreturned to near pre-hemorrhage values after resuscita-tion with LR or NS (Figure 5). Clotting speed (α-angle)was increased by hemorrhage and returned to pre-hemorrhage values after LR or NS resuscitation (Figure 5).Clot strength (MA) was not changed by hemorrhage butwas similarly reduced by resuscitation with LR or NS,followed by return to baseline values within 3 h afterresuscitation (Figure 5). No significant changes in fibrin-olysis (LY60) were observed in any group during the study(data not shown).
02468
1012141618
Baseline Resuscitation 3h 6h
Control LR NS
0
1
2
3
4
5
6
7
8
Baseline Resuscitation 3h 6h
Control LR NS
0
2
4
6
8
10
12
14
16
Baseline Resuscitation 3h 6h
Control LR NS
0
1
2
3
4
Baseline Resuscitation 3h 6h
Control LR NS
A. Oxygen delivery(ml O2/min/kg)
B. Oxygen consumption(ml O2/min/kg)
C. Oxygen demand(ml O2/min/kg)
D. Oxygen delivery/ Oxygen demand
* § **
* §
* § * §
*
*
Figure 3 Changes in oxygen delivery (A), oxygen consumption (B), oxygen demand (C), and oxygen delivery/oxygen demand (D) afterhemorrhage and resuscitation with lactated Ringer’s solution (LR, 119 ± 7 ml/kg) or normal saline (NS, 183 ± 9 ml/kg) in pigs. *p < 0.05compared to the corresponding baseline values. §p < 0.05 LR group compared to NS group. ♣p < 0.05 compared to corresponding control values.
Martini et al. Scandinavian Journal of Trauma, Resuscitation and Emergency Medicine 2013, 21:86 Page 7 of 12http://www.sjtrem.com/content/21/1/86
Plasma PT or PTT was not changed by hemorrhage.PT was similarly prolonged by resuscitation with LR(from 11.2 ± 0.2 sec at baseline to 12.1 ± 0.2 sec at 6 h)and NS (from 11.2 ± 0.3 sec at baseline to 12.3 ± 0.3 secat 6 h, both p < 0.05). Plasma aPTT was also similarlyprolonged by resuscitation with LR (from 17.1 ± 0.5 secbaseline to 20.1 ± 1.2 sec at 6 h) or NS (from 17.1 ±0.3 sec baseline to 19.1 ± 0.5 sec at 6 h, both p < 0.05).
DiscussionUsing a large-animal model with severe hemorrhage and6 h follow-up, we performed a comprehensive assessmentof the physiologic and biochemical effects of LR and NS.To achieve a similar hypotensive resuscitation level 50%more volume of normal saline was required than LR toachieve similar responses in MAP. Hemodilution, however,was not different between groups indicating that that theadditional NS did not stay in the vascular, as supported bythe greater urine output in the NS group. In addition, NSresulted in a lower peripheral resistance and a higherstroke volume, possibly due to its vasodilation effects. Des-pite similar oxygen extraction and oxygen consumption,NS resuscitation resulted in better oxygen delivery and
oxygen delivery-to-oxygen demand ratio as an index ofoxygen debt. This better response appears to be primarilydue to vasodilation effects as suggested by the large in-crease in cardiac output compared to the LR group. Thus,in the current severe hemorrhage model, NS had better tis-sue perfusion and oxygen metabolism than LR. However,since the oxygen delivery to demand ratio was 1 or higherin the LR and NS groups at 6 hrs, both fluids seemedadequate in maintaining survival at least through 6 h.Significant separation was observed between LR and NS
in acid base balance in this study, as expected. LRresuscitation returned BE and bicarbonate to pre-hemorrhage levels within 3 h, but no return of BE orbicarbonate was observed for 6 hr with NS resuscitation.Similar changes of BE and bicarbonate from LR or NS havebeen shown in different animal models and in patients[18,19,28]. The impact of acid base status from resuscita-tion fluids on survival has been assessed by Traverso et al.in an anaesthetized swine model with fatal hemorrhage[18]. With equal volume resuscitation from NS (pH 5.0),LR (pH 6.5, 28 mM lactate), and Plasmalyte-A (pH 7.4,27 mM acetate), the LR group had the best survival andthe Plasmalyte-A had the worst survival rate [18]. But BE

BE
0
2
4
6
8
10
12
14
Baseline Hemorrhage Resuscitation 3h 6h
Control LR NS
0
5
10
15
20
25
30
35
40
Baseline Hemorrhage Resuscitation 3h 6h
Control LR NS
Lactate
HCO3-
mM
mM
mM
-6
-4
-2
0
2
4
6
8
10
12
Baseline Hemorrahge Resuscitation 3h 6h
Control LR NS
*
* §
*
* §* §
**
**
*
*
*
** § * §
Figure 4 Changes in acid-base status after hemorrhage and resuscitation with lactated Ringer’s solution (LR, 119 ± 7 ml/kg) or normalsaline (NS, 183 ± 9 ml/kg) in pigs. *p < 0.05 compared to the corresponding baseline values. §p < 0.05 LR group compared to NS group.♣p < 0.05 compared to corresponding control values.
Martini et al. Scandinavian Journal of Trauma, Resuscitation and Emergency Medicine 2013, 21:86 Page 8 of 12http://www.sjtrem.com/content/21/1/86
and pH from LR and Plasmalyte-A resuscitation were simi-lar and higher than those from NS [18], suggesting a betteracid base status was not necessarily attributable to a bettersurvival. Nevertheless, as an index of shock, improved BEshould be a goal to improve outcome and acidosis is asso-ciated with well-known detrimental effects on the cardio-vascular system and coagulation [29,30].
Clinical trials have failed to show significant differences inoutcomes of LR and NS resuscitation. In comparative trialsof LR and NS performed in patients who underwent ab-dominal aortic aneurysm repair or renal transplant, Waterset al. [15] and Khajavi et al. [28] reported that there wereno differences in clinical outcomes, such as duration of ven-tilation, ICU stay, or incidence of complication between

Table 3 Changes of electrolytes after hemorrhage andresuscitation with lactated Ringer’s (LR) solution ornormal saline (NS) in pigs
Baseline After Hemorrhage and Resuscitation 6 h
Na+ (mM)
Control 138 ± 3 139 ± 6 141 ± 2
LR 140 ± 3 138 ± 3 132 ± 3
NS 141 ± 2 150 ± 3*§♣ 144 ± 6
K+ (mM)
Control 4.5 ± 0.2 4.7 ± 0.4 4.6 ± 0.2
LR 4.3 ± 0.2 4.3 ± 0.2 5.2 ± 0.4
NS 4.5 ± 0.2 4.5 ± 0.3 5.7 ± 0.3*
Ca++ (mM)
Control 9.2 ± 0.2 9.4 ± 0.3 8.9 ± 0.1
LR 9.5 ±0.4 7.7 ± 0.3*♣ 8.3 ± 0.8
NS 9.4 ± 0.3 7.9 ± 0.2*♣ 9.0 ± 0.3
Cl - (mM)
Control 97 ± 2 109 ± 8 100 ± 1
LR 101 ± 2 102 ± 2 97 ± 3
NS 102 ± 3 121 ± 6* 123 ± 6*
Animal groups include control (C, n = 6), hemorrhage with LR resuscitation (LR,n = 6), and hemorrhage with normal saline resuscitation (NS, n = 6). Data areexpressed as means ± SE.*p < 0.05 compared to corresponding baseline values within the group; §p <0.05 LR vs NS groups; and ♣p < 0.05 compared to correspondingcontrol values.
Martini et al. Scandinavian Journal of Trauma, Resuscitation and Emergency Medicine 2013, 21:86 Page 9 of 12http://www.sjtrem.com/content/21/1/86
patients resuscitated with LR or NS, although the patientgroup with NS resuscitation was more acidotic. Using a ratmodel with hemorrhage and simultaneous resuscitation,Healey et al. found that NS and LR had equivalent survivalrates under moderate hemorrhage (36% of estimated bloodvolume). But with a massive hemorrhage (218% of esti-mated blood volume), LR resuscitation resulted in bettersurvival [17]. Thus, it appears that the separation of out-comes from LR and NS becomes apparent only under ex-treme circumstance, such as when greater than 1 bloodvolume of fluid is given.Lactate rose about 5 fold after 60% hemorrhage in this
study and returned to pre-hemorrhage levels after resus-citation with LR or NS. The recovery rates, however,were different: NS returned lactate to pre-hemorrhagelevel within 15 min, but lactate did not return to nearpre-hemorrhage level for at least 3 h after resuscitation.At 15 min after resuscitation, lactate levels were 8.7 ±1.2 mM in the LR group and 2.6 ± 0.8 mM in the NSgroup. This difference could result from lactate loadfrom LR resuscitation or from a larger-volume dilutionfrom NS resuscitation. Calculation of fluid inflow andoutflow suggested that the latter is unlikely. From thestart of resuscitation to 15 min after the completion ofresuscitation, a total of 4.6 ± 0.3 L of LR was infused andurine output was 0.46 ± 0.15 L in the LR group, with a
net fluid inflow of 4.1 L. During the same period a totalof 6.1 ± 0.1 L of NS was infused for resuscitation whileurine output was 0.81 ± 0.18 L, with a net fluid inflow of4.9 L. This 20% volume difference (4.1 L of LR vs. 4.9 Lof NS) would not be able to fully explain the observed3.5fold difference of lactate between the LR (8.7 mM)and NS (2.6 mM) group. Thus, the difference of lactatelevels at 15 min after resuscitation may relate to thelactate load from LR resuscitation, at least in part. How-ever, this difference gradually disappeared within 6 hwith a simultaneous increase of HCO3
- in the LR group,suggesting that an ongoing lactate metabolism in pigsand the production of bicarbonate may contribute to thebetter acid-base status from lactate resuscitation. Sincethe metabolism of lactate in humans takes a few hoursand involves producing H+ and HCO3
- [31], a similartime frame observed in the present study indicates simi-lar lactate metabolism in humans and pigs. In addition,current blood bank guidelines state that LR should notbe mixed with blood to prevent the risk of clot forma-tion from calcium included in LR, which can diminishthe anti-coagulation effect in stored blood. Thus, LRresuscitation should not be given with blood through thesame iv-line and crystalloids should be avoided inpatients with blood transfusion.Hemorrhage and resuscitation caused disturbances in
the coagulation process. PT and aPTT were prolongedfor 6 h after hemorrhage and resuscitation, suggestinga hypocoagulable states. In contrast, the TEG datasuggested a hypercoagulable states. These differencesbetween TEG and standard plasma assays were alsoobserved in burn and trauma patients [32,33]. Clottinginitiation was shortened, and clotting speed was ac-celerated by hemorrhage; but both returned to pre-hemorrhage values after resuscitation. Clot strength wascompromised after resuscitation but returned within 3 h.Despite these dynamic changes in the coagulation pro-file, there were no differences between LR and NS resus-citation during the study, suggesting the equivalenteffects of the two fluids on coagulation. In contrast, afaster clotting speed and better clot strength from LRresuscitation were reported by Kiraly et al. [19]. This dis-crepancy is likely due to the differences in study design.The present study used a swine model with controlledhemorrhage with 50% more volume of NS, whereasKiraly et al. used a swine model of liver injury and anuncontrolled hemorrhage with 150% more volume of NSused. The additional hemodilution from the 150% NSmight contribute to the different findings. In addition, asham control group was included in the present studyand our data showed that coagulation profiles from LRand NS resuscitation returned to pre-hemorrhage valuesand became similar to those of the control values. Thus,potential thrombotic risk from LR resuscitation is unlikely.

0
1
2
3
4
5
6
7
Control LR NS
0
1
1
2
2
3
3
4
Control LR NS
50
60
70
80
Control LR NS
50
60
70
80
Control LR NS
TEG-K timeTEG-R time
TEG-MATEG-Angle (α)
min min
mm
Deg
ree
*
* *
*
*
*
*
*
Figure 5 Changes in Thrombelastograph® (TEG) measurements after hemorrhage and resuscitation with lactated Ringer’s solution(LR, 119 ± 7 ml/kg) or normal saline (NS, 183 ± 9 ml/kg) in pigs. R time: latency time for initial fibrin formation. K time: a measure of speedto reach a certain level of clot strength. Angle a: the rapidity of fibrin build up and cross-linking. MA: maximum strength of the developed clot.*p < 0.05 compared to the corresponding baseline values.
Martini et al. Scandinavian Journal of Trauma, Resuscitation and Emergency Medicine 2013, 21:86 Page 10 of 12http://www.sjtrem.com/content/21/1/86
In order to make a valid comparison, a commonphysiological endpoint after resuscitation is needed toassess the effects of resuscitation. In this study, we usedpost-resuscitation MAP as the physiological endpoint tocompare the effects of LR and NS on hemodynamics,coagulation and metabolism. We found that NS required50% more volume to reach the same physiological end-point. If the same volume of resuscitation was used inLR and NS groups, we suspected that the blood pressureafter NS resuscitation would be lower than that of LRdue to its vasodilator effects.A fixed volume controlled hemorrhage model was used
in this study to investigate metabolic, hemodynamic andcoagulation effects of hypovolemia and fluid resuscitation.This model mimics situations where trauma patientsbleed an amount of blood before hemorrhage is con-trolled [34]. However, it is limited in reflecting coagula-tion changes under a clinical scenario of continuedbleeding (or rebleeding). It is likely the on-going bleed-ing from uncontrolled hemorrhage will exaggerate theimpact of vasodilation effects from NS, with higher
volumes infused and more hemodilution and coagula-tion impairment. Considering that restriction on resus-citation fluid has been shown improving survival inuncontrolled bleeding patients [35] and animals [36], alarger volume of NS, as compared to LR, would increasebleeding with resultant higher morbidities and mortalityin trauma patients.In this study, to reach the same resuscitative physio-
logical endpoint, NS required 50% more volume and wasassociated with a higher cardiac output and lower periph-eral resistance, as compared to LR resuscitation. These dif-ferences are possibly due to the vasodilator effects fromNS. It is worth emphasizing that these effects are likely tobe exaggerated under uncontrolled hemorrhage, resultingin more fluid volume, a larger hemodilution, and more se-vere impairment in coagulation. Further, an elevation of K+
was observed at 6 h post NS resuscitation, while no changeof K+ was observed after LR resuscitation. The mechanismfor the increase of K+ from NS is not fully known, but maybe due to an extracellular shift of potassium caused bychanges in blood hydrogen ion concentration, as the result

Martini et al. Scandinavian Journal of Trauma, Resuscitation and Emergency Medicine 2013, 21:86 Page 11 of 12http://www.sjtrem.com/content/21/1/86
of hyperchloremic acidosis from NS resuscitation [37].Consistent with our current results, clinically significanthyperkalemia from NS administration has been reportedin patients during renal transplantation [16,28]. Thus, NSis associated with vasodilator effects and the risks of meta-bolic acidosis and hyperkalemia. Currently, military firstresponders have NS, LR and Hextend available [20]. How-ever, the results from the current study and our recentstudy [38] suggest that all of these fluids have limitationsin managing hemodynamics, metabolic responses, and co-agulation. The optimum resuscitation fluid awaits furtherdevelopment.
ConclusionsWe compared resuscitative effects of NS and LR in aswine model with 60% controlled hemorrhage. AlthoughLR and NS had equivalent effects on hemodynamics andoxygen metabolism, NS required a larger resuscitationvolume and was associated with poor acid base status andelevated serum potassium in this model. Thus, NS may beinferior to LR in resuscitation due to its vasodilator effectsand the risks of metabolic acidosis and hyperkalemia.
AbbreviationsBE, Base excess; BL, Baseline; IV, Intravenous; LR, Lactated Ringer’s; MAP, Meanarterial pressure; NS, Normal saline; PT, Prothrombin time; aPTT, Activatedpartial prothrombin time; TEG, Thrombelastography®; TEG measurements, ; Rtime, Latency time for initial fibrin formation; K time, a measure of speed toreach a certain level of clot strength; Angle α, the rapidity of fibrin build upand cross-linking; MA, Maximum strength of the clot; LY60, Percentage ofclot lysis at 60 min after MA is achieved.
Competing interestsThe authors declare that they have no competing interests.
Authors’ contributionsWM designed and performed the study, analyzed the data with assistancefrom statistician Mr John Jones, and wrote the manuscript. DC performedthe study. MD designed study and edited the manuscript. All authors readand approved the final manuscript.
AcknowledgmentsThe authors appreciate the support received from the Veterinary ServiceSupport Branch and Laboratory Support Branch at the U.S. Army Institute ofSurgical Research.This study was supported by the U.S. Army Medical Research and MaterielCommand. The opinions or assertions contained herein are the private viewsof the author and are not to be construed as official or as reflecting theviews of the Department of the Army or the Department of Defense.
Received: 22 August 2013 Accepted: 5 December 2013Published: 11 December 2013
References1. Mullins RJ: Management of Shock. Philadelphia, Stamford, CT: Appleton &
Lange; 1996.2. Maier RV: Shock. In Surgery:Scientific Principles and Practice. 2nd edition.
Edited by Greenfield LJ, Mulholland MW, Oldham KT, Zelenock GB, LillemoeKD. Philadelphia, PA: Lippincott-Raven; 1997:182–215.
3. Tapia NM, Suliburk J, Mattox KL: The initial trauma center fluidmanagement of penetrating injury: a systematic review. Clin Orthop RelatRes 2013, 471(12):3961–3973.
4. Duchesne JC, Heaney J, Guidry C, McSwain N Jr, Meade P, Cohen M,Schreiber M, Inaba K, Skiada D, Demetriades D, et al: Diluting the benefits
of hemostatic resuscitation: a multi-institutional analysis. J Trauma AcuteCare Surg 2013, 75(1):76–82.
5. Carlino W: Damage control resuscitation from major haemorrhage inpolytrauma. Eur J Orthop Surg Traumatol 2013 [Epub ahead of print]
6. Dutton RP: Haemostatic resuscitation. Br J Anaesth 2012, 109(Suppl 1):i39–i46.7. Spoerke N, Michalek J, Schreiber M, Brasel KJ, Vercruysse G, MacLeod J,
Dutton RP, Duchesne JC, McSwain NE, Muskat P, et al: Crystalloidresuscitation improves survival in trauma patients receiving low ratios offresh frozen plasma to packed red blood cells. J Trauma 2011,71(2 Suppl 3):S380–S383.
8. Foex BA: How the cholera epidemic of 1831 resulted in a new techniquefor fluid resuscitation. Emerg Med J 2003, 20(4):316–318.
9. Awad S, Allison SP, Lobo DN: The history of 0.9% saline. Clin Nutr 2008,27(2):179–188.
10. Belani KG, Palahniuk RJ: Kidney transplantation. Int Anesthesiol Clin 1991,29(3):17–39.
11. Banks AAoB: Accreditation Requirements Manual. 5th edition. Arlington:American Association of Blood Banks; 1994.
12. Wilkes NJ, Woolf R, Mutch M, Mallett SV, Peachey T, Stephens R, MythenMG: The effects of balanced versus saline-based hetastarch and crystalloidsolutions on acid-base and electrolyte status and gastric mucosal perfusionin elderly surgical patients. Anesth Analg 2001, 93(4):811–816.
13. Williams EL, Hildebrand KL, McCormick SA, Bedel MJ: The effect ofintravenous lactated Ringer’s solution versus 0.9% sodium chloridesolution on serum osmolality in human volunteers. Anesth Analg 1999,88(5):999–1003.
14. Scheingraber S, Rehm M, Sehmisch C, Finsterer U: Rapid saline infusionproduces hyperchloremic acidosis in patients undergoing gynecologicsurgery. Anesthesiology 1999, 90(5):1265–1270.
15. Waters JH, Gottlieb A, Schoenwald P, Popovich MJ, Sprung J, Nelson DR:Normal saline versus lactated Ringer’s solution for intraoperative fluidmanagement in patients undergoing abdominal aortic aneurysm repair:an outcome study. Anesth Analg 2001, 93(4):817–822.
16. O’Malley CM, Frumento RJ, Hardy MA, Benvenisty AI, Brentjens TE, Mercer JS,Bennett-Guerrero E: A randomized, double-blind comparison of lactatedRinger’s solution and 0.9% NaCl during renal transplantation. AnesthAnalg 2005, 100(5):1518–1524. table of contents.
17. Healey MA, Davis RE, Liu FC, Loomis WH, Hoyt DB: Lactated ringer’s issuperior to normal saline in a model of massive hemorrhage andresuscitation. J Trauma 1998, 45(5):894–899.
18. Traverso LW, Hollenbach SJ, Bolin RB, Langford MJ, DeGuzman LR: Fluidresuscitation after an otherwise fatal hemorrhage: II. Colloid solutions.J Trauma 1986, 26(2):176–182.
19. Kiraly LN, Differding JA, Enomoto TM, Sawai RS, Muller PJ, Diggs B, Tieu BH,Englehart MS, Underwood S, Wiesberg TT, et al: Resuscitation with normalsaline (NS) vs. lactated ringers (LR) modulates hypercoagulability andleads to increased blood loss in an uncontrolled hemorrhagic shockswine model. J Trauma 2006, 61(1):57–64.
20. Lairet JR, Bebarta VS, Burns CJ, Lairet KF, Rasmussen TE, Renz EM, King BT,Fernandez W, Gerhardt R, Butler F, et al: Prehospital interventionsperformed in a combat zone: a prospective multicenter study of 1,003combat wounded. J Trauma Acute Care Surg 2012, 73(2 Suppl 1):S38–S42.
21. Butler FK: Tactical combat casualty care: update 2009. J Trauma 2010,69(Suppl 1):S10–S13.
22. Lipsky AM, Ganor O, Abramovich A, Katzenell U, Glassberg E: Walkingbetween the drops: Israeli defense forces’ fluid resuscitation protocol.J Emerg Med 2013, 44(4):790–795.
23. Holcomb JBSP: Optimal use of blood in trauma patients. Biologicals 2010,38(1):6.
24. Burns JW, Baer LA, Darlington DN, Dubick MA, Wade CE: Screening ofpotential small volume resuscitation products using a severehemorrhage sedated swine model. Int J Burns Trauma 2012,2(1):59–67.
25. Salomone JP PP: Prehospital Trauma Life Support: Military Version. 6th edition.St. Louis, Missouri: MOSBY Elsevier; 2007.
26. Sondeen JL, Prince MD, Kheirabadi BS, Wade CE, Polykratis IA, de Guzman R,Dubick MA: Initial resuscitation with plasma and other blood componentsreduced bleeding compared to hetastarch in anesthetized swine withuncontrolled splenic hemorrhage. Transfusion 2011, 51(4):779–792.
27. Hannon JP, Wade CE, Bossone CA, Hunt MM, Loveday JA: Oxygen deliveryand demand in conscious pigs subjected to fixed-volume hemorrhage

Martini et al. Scandinavian Journal of Trauma, Resuscitation and Emergency Medicine 2013, 21:86 Page 12 of 12http://www.sjtrem.com/content/21/1/86
and resuscitated with 7.5% NaCl in 6% Dextran. Circ Shock 1989,29(3):205–217.
28. Khajavi MR, Etezadi F, Moharari RS, Imani F, Meysamie AP, Khashayar P,Najafi A: Effects of normal saline vs. lactated ringer’s during renaltransplantation. Ren Fail 2008, 30(5):535–539.
29. Martini WZ, Pusateri AE, Uscilowicz JM, Delgado AV, Holcomb JB:Independent contributions of hypothermia and acidosis to coagulopathyin swine. J Trauma 2005, 58(5):1002–1009. discussion 1009–1010.
30. Martini WZ, Dubick MA, Pusateri AE, Park MS, Ryan KL, Holcomb JB: Doesbicarbonate correct coagulation function impaired by acidosis in swine?J Trauma 2006, 61(1):99–106.
31. Hartmann AF, Senn MJ: Studies in the metabolism of sodium r-lactate. III.Resuponse of human subjects with liver damage, disturbed warter andmineral balance, and renal insufficiency to the intravenous injection ofsodium r-lactate. J Clin Invest 1932, 11(2):345–355.
32. Park MS, Martini WZ, Dubick MA, Salinas J, Butenas S, Kheirabadi BS, PusateriAE, Vos JA, Guymon CH, Wolf SE, et al: Thromboelastography as a betterindicator of hypercoagulable state after injury than prothrombin time oractivated partial thromboplastin time. J Trauma 2009, 67(2):266–275.discussion 275–266.
33. Martini WZ, Cortez DS, Dubick MA, Park MS, Holcomb JB:Thrombelastography is better than PT, aPTT, and activated clotting timein detecting clinically relevant clotting abnormalities after hypothermia,hemorrhagic shock and resuscitation in pigs. J Trauma 2008, 65(3):535–543.
34. Bellamy RF, Maningas PA, Wenger BA: Current shock models and clinicalcorrelations. Ann Emerg Med 1986, 15(12):1392–1395.
35. Bickell WH, Wall MJ Jr, Pepe PE, Martin RR, Ginger VF, Allen MK, Mattox KL:Immediate versus delayed fluid resuscitation for hypotensive patientswith penetrating torso injuries. N Engl J Med 1994, 331(17):1105–1109.
36. Hahn RG: Fluid therapy in uncontrolled hemorrhage–what experimentalmodels have taught us. Acta Anaesthesiol Scand 2013, 57(1):16–28.
37. Halperin ML, Kamel KS: Potassium. Lancet 1998, 352(9122):135–140.38. Martini WZ, Dubick MA, Blackbourne LH: Comparisons of lactated Ringer’s
and Hextend resuscitation on hemodynamics and coagulation followingfemur injury and severe hemorrhage in pigs. J Trauma Acute Care Surg2013, 74(3):732–740.
doi:10.1186/1757-7241-21-86Cite this article as: Martini et al.: Comparisons of normal saline andlactated Ringer’s resuscitation on hemodynamics, metabolic responses,and coagulation in pigs after severe hemorrhagic shock. ScandinavianJournal of Trauma, Resuscitation and Emergency Medicine 2013 21:86.
Submit your next manuscript to BioMed Centraland take full advantage of:
• Convenient online submission
• Thorough peer review
• No space constraints or color figure charges
• Immediate publication on acceptance
• Inclusion in PubMed, CAS, Scopus and Google Scholar
• Research which is freely available for redistribution
Submit your manuscript at www.biomedcentral.com/submit