Are Normal Controls Still Normal?
43
Property of University of Edinburgh Property of University of Edinburgh Are Normal Controls Still Normal? B048430 9940 MSc Cognition in Science and Society The University of Edinburgh 2014
Transcript of Are Normal Controls Still Normal?

Property of University of EdinburghProperty of University of Edinburgh
Are Normal Controls Still Normal?
B048430
9940
MSc Cognition in Science and Society
The University of Edinburgh
2014
Property of University of EdinburghProperty of University of Edinburgh
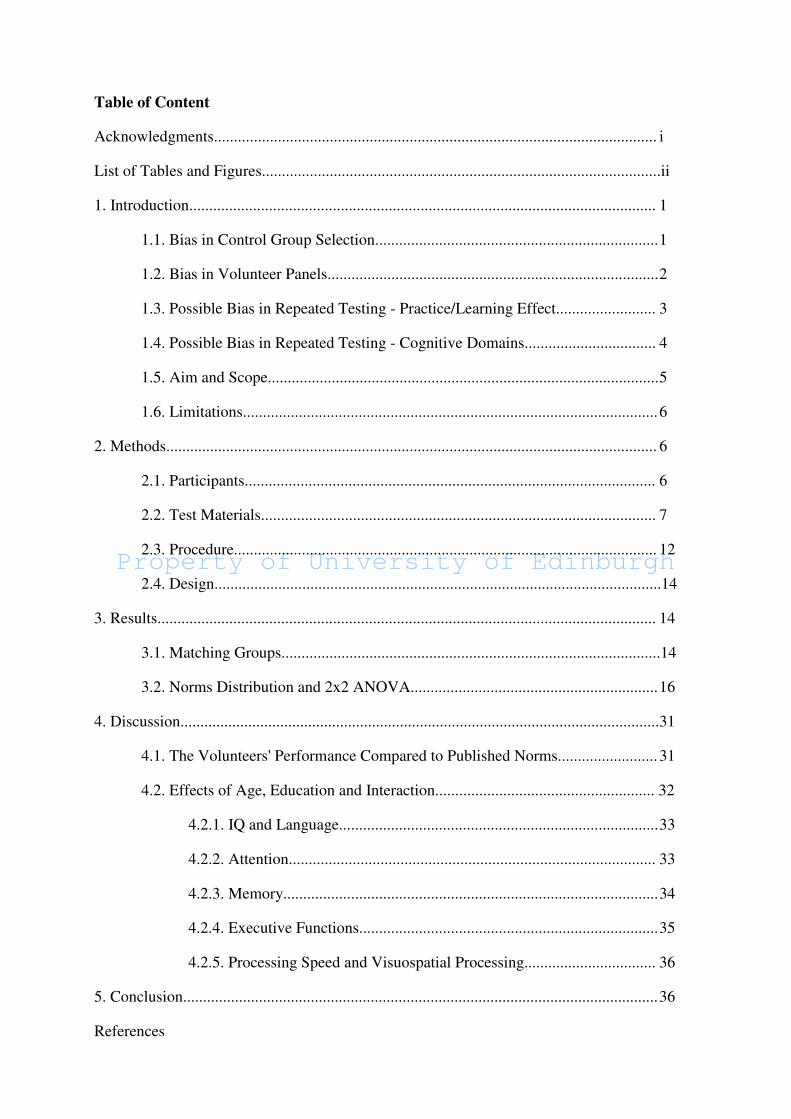
Table of Content
Acknowledgments............................................................................................................... i
List of Tables and Figures....................................................................................................ii
1. Introduction..................................................................................................................... 1
1.1. Bias in Control Group Selection....................................................................... 1
1.2. Bias in Volunteer Panels................................................................................... 2
1.3. Possible Bias in Repeated Testing - Practice/Learning Effect......................... 3
1.4. Possible Bias in Repeated Testing - Cognitive Domains................................. 4
1.5. Aim and Scope.................................................................................................. 5
1.6. Limitations........................................................................................................ 6
2. Methods........................................................................................................................... 6
2.1. Participants....................................................................................................... 6
2.2. Test Materials................................................................................................... 7
2.3. Procedure.......................................................................................................... 12
2.4. Design................................................................................................................14
3. Results............................................................................................................................. 14
3.1. Matching Groups...............................................................................................14
3.2. Norms Distribution and 2x2 ANOVA.............................................................. 16
4. Discussion........................................................................................................................ 31
4.1. The Volunteers' Performance Compared to Published Norms......................... 31
4.2. Effects of Age, Education and Interaction....................................................... 32
4.2.1. IQ and Language................................................................................ 33
4.2.2. Attention............................................................................................ 33
4.2.3. Memory.............................................................................................. 34
4.2.4. Executive Functions........................................................................... 35
4.2.5. Processing Speed and Visuospatial Processing................................. 36
5. Conclusion....................................................................................................................... 36
References

Property of University of EdinburghProperty of University of Edinburgh
i
Acknowledgments:
I would like to thank my supervisors Dr Thomas Bak and Dr Mario A. Parra Rodriguez for
their support, guidance and enthusiasm for this project. I would also like to thank Rini Kaplan
with whom I share the dissertation topic and the experience of many hours in the lab assessing
volunteers. Further acknowledgment to Lisa Reuter for testing 10 participants and Natalie
Rangolam for testing 6 participants.
Special thanks go to all the volunteers who participated in this study. Thank you for
answering our email, letters and calls.
Finally, I wish to thank my flatmates for their unwavering support!

Property of University of EdinburghProperty of University of Edinburgh
ii
List of Tables and Figures
Table 1 Seven main categories for cognitive domains............................................. 4
Table 2 Total number of participants who participated in this study....................... 7
Table 3 List of nine tests with subcategories and their corresponding
cognitive domains........................................................................................ 11
Table 4 Total number of inexperienced participants and experienced participants.. 14
Table 5 Scores of outlier N18 compared to cut-off scores provided by norms.........15
Table 6 Total number of inexperienced/experienced participants divided
by age groups...............................................................................................16
Table 7 Means with standard deviations and norms for ROCFT Copy.................... 17
Table 8 Means with standard deviations and norms for ROCFT
Immediate Recall..........................................................................................17
Table 9 Means with standard deviations and norms for ROCFT
Delayed Recall............................................................................................. 18
Table 10 Means with standard deviations and norms for ADASCog
and subcategories......................................................................................... 19
Table 11 Means with standard deviations and norms for GNT.................................. 22
Table 12 Means with standard deviations and norms for NART............................... 23
Table 13 Means with standard deviations and norms for ACE-III
and subcategories......................................................................................... 23
Table 14 Means with standard deviations and norms for TEA 3 and 5...................... 26
Table 15 Means with standard deviations and norms for DSCT................................ 28
Table 16 Means with standard deviations and norms for TMT A.............................. 29
Table 17 Means with standard deviations and norms for TMT B...............................30
Fig. 1 Procedure of Test Administration................................................................ 13
Fig. 2 2x2 ANOVA results for ROCFT Immediate Recall.................................... 18
Fig. 3 2x2 ANOVA results for ROCFT Delayed Recall........................................18
Fig. 4 2x2 ANOVA results for ADAS Total.......................................................... 21
Fig. 5 2x2 ANOVA results for ADAS Memory.................................................... 21
Fig. 6 2x2 ANOVA results for GNT...................................................................... 22
Fig. 7 2x2 ANOVA results for ACE Fluency........................................................ 25
Fig. 8 2x2 ANOVA results for ACE Total.............................................................26
Fig. 9 2x2 ANOVA results for ACE Attention...................................................... 26
Fig. 10 2x2 ANOVA results for TEA 3................................................................... 27
Fig. 11 2x2 ANOVA results for DSCT.................................................................... 28
Fig. 12 2x2 ANOVA results for TMT Part B.......................................................... 30

Property of University of EdinburghProperty of University of Edinburgh
1
1. Introduction
In many research fields and especially in cognitive neuropsychology, control groups are
indispensible. They form the backbone of any empirical study and statistical model, since
norms and cut-off lines are based on how cognitively impaired cases fare compared to the
healthy population. How else can one determine whether there is a pathological development
or deterioration in someone's cognitive abilities, without knowing first how a healthy brain
develops, works and ages? To know what is abnormal, one first has to know what constitutes
as normal. Selecting participants for such a healthy "normal" group, however, can be
problematic. There are many factors that could influence our cognition, such as age, education,
social background or even leisure activities. Where do we live? At what university did we
study? How many languages do we speak? How active are we, mentally and physically,
especially when we are older?
While many research articles go into great detail as to how, where and why exactly they have
recruited their patient groups, the same can often not be said regarding the information given
about the control groups. In many cases, only the bare numbers are provided to show that the
samples were matched on basic demographics, such as age, education and gender. Control
groups are just mentioned as an afterthought, even though they are as crucial to the study as
patient groups. Matching the participants on a few selected variables, however, does not mean
that the sample chosen for the study truly represents the normal population or, for that matter,
even truly matches the patient group. The question arises; are these so called normal control
groups really good representatives of the average population? Ignoring this question could
lead to bias and, consequently, might contort the results of a study. The following sections
will elaborate on a few possible causes of bias that have to be considered when using healthy
"normal" controls in experimental designs.
1.1. Bias in Control Group Selection
Criticizing controls and questioning whether they are truly representative samples of the
"normal" public seems to be a taboo in the science community. Although there are many
possible sources for bias, the literature so far has paid little attention to this problem
(Schechter, Strasser, Santangelo, Kim, & Endicott, 1994). One of the main issues with control
groups is how and where they are recruited. Getting volunteers from the general public is
often an arduous job and it is all too tempting for researchers to recruit friends, colleagues or
students (Patel, Doku, & Tennakoon, 2003). Especially studies carried out at universities like
to take advantage of having an abundance of students at their hands. They are easy to recruit,

Property of University of EdinburghProperty of University of Edinburgh
2
already matched in age and education, happy with little to no payment and are often even
obligated to participate in experimental studies to receive credit points. However, university-
educated volunteers are by far not representative of the general public. Even if matched on
years of education, are Oxbridge or Ivy League graduates really comparable to their
counterparts from lower ranked universities or vocational education? Choosing elite groups,
which might even have insider knowledge on experiments and procedures, can distort the
results of studies and set the norm of what constitutes "normal performance" at a much higher
level than it actually is.
Recruiting volunteers from the general public might mitigate these biases, however, the
selection process can bring its own set of problems. A volunteer's motivation, for example, is
rarely questioned. While some are simply interested in the topic, others might choose to take
part in neuropsychological studies, because they are concerned about their own mental status.
Instead of going to a doctor, which could have a negative stigma to it, they get a free
evaluation by taking part in an experiment (Schechter, et al., 1994). Since research studies
often lack in-depth evaluation due to limited funding or time, especially when dealing with
large subject pools, the so called "normal" and healthy participants might not be truly free of
any mental disorders, known or unknown to them (Schechter, et al., 1994). A study on
recruitment and screening of normal controls by Shtasel (1991) showed that out of 1284
volunteers responding to a newspaper advert for a biomedical research, 50.9% were excluded
after a preliminary telephone screening, due to having a history of psychiatric, neurologic, or
medical problems. Of the remaining volunteers another 49.7% were excluded after an in-
person evaluation. In the end, only 157 volunteers were admitted to the study (Shtasel, et al.,
1991). Without these screening processes, however, even a handful of participants could
influence the results of the study and the healthy controls score lower than they actually
should. To avoid these issues that arise from recruiting from the general public, research
institutions now frequently use volunteer panels. They make the recruitment process easier,
the control groups are less elite than through in-house selection and it is possible to monitor
the panelists' mental health over a longer period of time.
1.2. Bias in Volunteer Panels
Schechter et al. proposed a model for such a panel, called the Central Recruitment Program,
in 1994 (Schechter, et al., 1994). The idea behind it was to get individuals who do not sign up
to participate in one specific study, but are rather part of a subject pool used for a variety of
experiments. They should be screened in-depth before they are accepted into the panel. Only

Property of University of EdinburghProperty of University of Edinburgh
3
volunteers who meet a project's specific criteria are selected as control subjects and they
should not participate in the same type of study too often (Schechter, et al., 1994).
Furthermore, the participants on those volunteer panels should be regularly assessed, since a
mental illness could develop at any future point in time (Schechter, Singer, Kuperman, &
Endicott, 1998). This is a somewhat idealistic view of a panel and does not quite work in
reality. The suggested thorough screening process might be somewhat extreme. It is highly
time consuming and time is, more often than not, money. Furthermore, although no evaluation,
as discussed above, is certainly problematic, meticulously screening volunteers for any sort of
psychological or medical affliction might lead to an overly healthy panel, also not truly
representing the general public.
While these forms of biases have been discussed in some literature, albeit not in many
experimental studies, practically no literature exists on another form of bias that could be
found in volunteer panels; the fact that volunteers stay on these panels for years, sometimes
decades. They are repeatedly tested with assessment tools specifically designed to screen for
cognitive abilities. There is a strong possibility of practice/learning effect bias.
1.3. Possible Bias in Repeated Testing - Practice/Learning Effect
It is quite common in neuropsychological evaluations to repeatedly use the same battery of
well established cognitive screening tests. While serial testing can be essential for monitoring
disease progression or possible recovery in patients, especially with healthy controls, it can
also lead to the so called 'practice effect' (Bartels, Wegrzyn, Wiedl, Ackermann, & Ehrenreich,
2010). This effect can be either specific to certain tests - participants might develop better
test-taking strategies or recall certain items and answers (Benedict & Zgaljardic, 1998) - or it
can be a more general effect, because participants get familiar with the testing environment
which could reduce anxiety (Bartels, et al., 2010). In both cases the participants score better
on a test they know than in a novel experimental situation with a never before seen test. A
study by Krenk et al. (2012) showed that a sample of around 150 healthy elderly controls
improved significantly on a series of cognitive tests from the first two sessions to the third
session (Krenk, Rasmussen, Siersma, & Kehlet, 2012). Bartels et al. (2010) investigated
practice effects in tests that are used to screen for impairment in specific cognitive domains
and they found significant improvement, especially during the first three months, in almost all
tests across various domains (Bartels, et al., 2010). One possible way to prevent or at least
reduce the magnitude of practice effect is to introduce alternative test forms. However, a few
studies have shown that not all cognitive domains react equally well to variations of tests and

Property of University of EdinburghProperty of University of Edinburgh
4
especially procedural and nonverbal memory tests seem to improve more persistently
(Benedict & Zgaljardic, 1998; Beglinger, et al., 2005). This could mean that independently of
how familiar one is with one specific test, learning still occurs, simply by taking part in
cognitively demanding experiments. Not many studies have investigated whether there is an
improvement in cognitive domains due to repeated exposure to testing.
1.4. Possible Bias in Repeated Testing - Cognitive Domains
Each neuropsychological disorder can affect and disrupt our cognition differently. There
are various causes of cognitive problems, such as traumatic brain injuries, strokes, cancer or
neurodegenerative diseases, such as Alzheimer's or Parkinson's, to name a few. Although
certain diseases might show a similar pathology, each type might show different symptoms,
afflicting specific cognitive domains, depending on location. A patient with vascular dementia,
for example, might have more difficulties in sustaining attention than someone with
Alzheimer's disease, which in turn might manifests itself more in episodic memory problems
than attentional problems (Graham, Emery, & Hodges, 2004). It is therefore important that
neuropsychological assessments do not just deal with our overall cognition, but also look at
separate cognitive domains to determine what kind of impairment one is dealing with. The
degree of subtlety into which the domains are divided can vary across studies (e.g. memory,
semantic and episodic memory, anterograde and retrograde episodic memory etc.). However,
seven main domains can be derived from the literature dealing with the cognitive assessment
tests used in this study (Caselli, et al., 2007; Kipps & Hodges, 2005) and are listed in table 1.
Even normal ageing causes a slowing of our cognitive abilities, and yet, not all cognitive
domains are equally affected by age. While language, IQ or general knowledge and, to a
degree, numerical abilities do not seem to significantly decline over time, others, such
processing speed, executive functions and certain aspects of memory, are strongly associated
with age-related decline (Deary, et al., 2009). However, the degree of decline varies from
individual to individual and some people seem to age better than others. One possible
explanation for this is that by keeping yourself mentally, intellectually and physically active,
Table 1 Seven main categories for cognitive domains.
Cognitive Domains
Memory Language Visuospatial
Processing Attention
Executive
Functions
Processing
Speed IQ
The neuropsychological tests used in this study screen for impairment in one or more of these seven domains. A
detailed list of which test assesses which domain is provided in table 3.

Property of University of EdinburghProperty of University of Edinburgh
5
cognitive decline can be reduced or slowed down (Deary, et al., 2009). This could mean that
volunteers, who choose to be on a panel and who are repeatedly tested and constantly learning,
show less of a decline in their cognitive domains than the average "normal" person from the
general public.
1.5. Aim and Scope
The University of Edinburgh uses a research volunteer panel since the early 1990s,
consisting at the moment of 833 volunteers. It is not quite clear when exactly it started, since
correspondence before 2001 has not been recorded, but some participants of this study stated
they have signed up as early as 1990. Although the panel is quite versatile and combines a
wide range of years of education, social background and age, it could be improved by keeping
more detailed records. While the in-depth evaluation process suggested by Schechter et al.
(1994) might be a bit extreme, the University of Edinburgh does not assess their recruits
thoroughly. The volunteers fill out a questionnaire when they sign up, in which they only have
to state whether they have normal hearing and sight. If participants meet any exclusion criteria,
such as mental illnesses or mild cognitive impairment (MCI) it is found out during a study
and then, hopefully, noted down. Yet more often than not, it is neither detected nor passed on
to the panel's administration and as a result, such participants might contaminate the study's
outcome. Furthermore, there are no records of how many and what kind of tests a volunteer
has done. Participants taking part in this study have done experiments ranging from 0 to over
100. This could lead to practice effect bias and bias due to improved cognitive abilities. Since
it is not possible to determine how often a participant has done one specific test,
investigations into practice effects are limited for this study. It will therefore concentrate on
the following research questions:
RQ1: Do volunteers, age 55-75, on average perform better on eight cognitive test compared to
the published norms?
RQ2: Do experienced volunteers (two or more experiments per year) score differently on the
eight tests than volunteers who have little to none experience and if so, is there an interaction
between age and experience?
RQ3: Is the effect more pronounced in certain cognitive domains than others?

Property of University of EdinburghProperty of University of Edinburgh
6
1.6. Limitations
The original idea of this research project was to compare the volunteers from the panel to
the general public, in addition to comparing the experienced panelists to the inexperienced
ones. If our hypotheses were true, the volunteers and especially the experienced ones, should
be significantly better than the general public due to the fact that they are on a panel (selection
bias) as well as being repeatedly exposed to cognitive tests (practice/learning effect bias).
However, it was remarkably difficult to recruit people from the general public. Several
attempts were made to recruit people in person as well as with flyers, yet the response rate
was little to none. This could be due to the fact that no payment was offered or because the
testing sessions were 1.5 hours to 2 hours long which is quite a time investment. Perhaps there
is simply a reluctance in the general public to take part in psychological experiments,
conducted by postgraduate students. It is also interesting to note that it was a much longer and
more difficult process to recruit the volunteers who had been on the panel for a while,
compared to the newly joined volunteers. While the latter were still eager to participate in
experiments, the "veteran" volunteers seemed to have developed a certain fatigue towards
participation.
This study, therefore, is not able to draw comparisons between volunteers and the general
public and focuses on the experienced vs. inexperienced volunteers within the panel instead.
To make the sample size more robust, the people recruited from the general public were
added to the inexperienced groups. However, if provided with more time there would be great
possibilities for future studies which could provide to the lack of experimental literature on
control group bias.
2. Methods
2.1. Participants
The participants for this study were selected from the University of Edinburgh's research
volunteer panel as well as from the general public. To maximize the chances of finding
potentially high differences in experience among the volunteers, only the contact information
of volunteers who had been on the panel for more than five years or less than nine months
were used. During the early stages of this study, the University of Edinburgh had just finished
their latest recruitment phase and in order to reach more inexperienced volunteers, their
information was subsequently added to the contact list. Preliminary excluding criteria were
abnormal hearing and vision or medical conditions, as stated on the contact information sheet

Property of University of EdinburghProperty of University of Edinburgh
7
provided by the university. Volunteers younger than 55 or older than 75 were excluded to
facilitate finding a concise sample of a healthy, senior control group. Due to the fact that no
payment was offered, except for a maximum reimbursement of £4 for parking, bus and train
fares, only volunteers who lived in Edinburgh were contacted. This criterion was changed to
volunteers who lived no further than one hour by away from Edinburgh by car, in hopes of
finding more participants.
From the volunteers who had joined the panel in the last nine months, 48 volunteers were
contacted, 32 were scheduled, 3 withdrew and 29 were tested. From the volunteers who have
been on the panel for more than five years, 90 volunteers were contacted, 29 were scheduled,
5 withdrew and 24 were tested.
To find participants from the general public, flyers were created, stating the nature and
duration of the study, asking for healthy, English native speaking participants over 55 and
providing them with the researchers' and supervisors' contact details. The flyers were hung up
in various community centers, supermarkets, parks and medical centers. After getting little to
no responses, flyers were handed out in person to people in the city and in front of churches.
As mentioned above, the recruitment was not very fruitful and only 8 participants were
scheduled and tested. Table 2 shows an overview of the total number of participants recruited.
Table 2 Total number of participants who participated in this study.
Participants (n=61)
Male Female Age Mean Age
(SD)
Years of
Education
Mean YoE
(SD)
Left-
Hnd.
Right
-Hnd.
Total 21 40 55-75 64.93
(5.31) 8-26.5
16.60
(3.40) 7 54
> 5 Years
(n=24) 9 15 58-75
66.50
(5.25) 10-21
16.31
(3.16) 4 20
< 9 Mth.
(n=29) 7 22 55-72
63.48
(4.61) 10-26.5
17.45
(3.23) 3 26
General
Pub.(n=8) 5 3 55-73
65.50
(7.01) 8-19
14.38
(3.96) 0 8
2.2. Test Materials
It was important for this study to select well established cognitive screening tests which are
commonly used for assessing cognitive abilities and impairment, not only because they cover
a broad spectrum of cognitive domains, but also due to their popularity in neuropsychological
Demographics (gender, age, mean age with standard deviation (SD), years of education, mean years of education
(YoE) with SD, left-handedness and right-handedness) are given for the total number of participants, volunteers
who have been on the panel for more than 5 years (> 5), volunteers who have joined in the last 9 months (<9 mth.)
and the people recruited from the general public.
Property of University of EdinburghProperty of University of Edinburgh
8
research. It is highly probable that some of the volunteers, especially the experienced ones,
would have come across one or two of the tests during their time on the panel. Nine tests were
selected to fit into a two hour testing session per participant.
The Rey-Osterrieth Complex Figure Test (ROCFT) was first developed by Swiss
psychologist André Rey in 1941 and later standardized into a 36-point scale, based on 18
elements within the figure, by Osterrieth in 1944 (Rey, 1941; Osterrieth, 1944). Copying the
ROCFT measures visuospatial perception, construction and organizational strategies, whereas
the recall is used to measure visual memory and how much of the original information could
be retained over time (Benett-Levy, 1984; Troyer & Wishart, 1997; Fastenau, Denburgh &
Hufford, 1999). The administration procedures can vary, depending on how one sets the time
intervals between copy and delayed recall and whether one allows for an immediate or short-
term recall after the copy trial. The procedure used in this study follows Meyers and Meyers
(1995) proposition of Copy, Immediate Recall and 30-min Delayed Recall. Looking at
different ways of administration they have shown that an immediate or short-term recall has a
significant effect on the 30-min Delayed Recall which has to be considered when looking at
norms that only had a copy and delayed trial (Meyers & Meyers, 1995). Norms were taken
from a study conducted by Fastenau et al. (1999) who present age-appropriate norms for Copy,
Immediate Recall and Delayed Recall, based on a sample of 211 healthy adults with an age
range from 30 - 85 years and an education range of 12 - 25 years (Fastenau, et al., 1999) The
test was administered on paper, allowing pencil and rubber.
The Alzheimer's Disease Assessment Scale - Cognitive Behavior Section (ADASCog) was
first published in 1984, specifically designed to assess patients with Alzheimer's disease (AD)
type dementia (Rosen, Mohs, & Davis, 1984). Similar to the ACE it covers cognitive domains,
such as memory, language, constructional abilities and executive functions. Although the test
is very popular in research and clinical trials, there are not many studies that reference
normative data for the ADASCog (Graham, Cully, Snow, Massman, & Doody, 2004). Unlike
the ACE, the ADASCog is not used to detect cognitive impairment, but rather to evaluate the
severity of it and the degree of decline. Graham et al. (2004) are one of the few who provide
norms for each subtest, as well as norms for total scores according to age and education,
based on a sample of 124 participants aged 55 - 89 (Graham, et al., 2004). Scores in this study,
therefore, were compared to this set of norms. The test was administered on paper. Word lists
and pictures of objects were presented on flashcards.

Property of University of EdinburghProperty of University of Edinburgh
9
The Graded Naming Test (GNT) was designed by McKenna and Warrington in 1980 as an
instrument to detect mild word retrieval difficulties and improvement or deterioration of
naming abilities (Warrington, 1997). Noting that, if less frequent words are more vulnerable
to word-finding difficulties, an individual with an extensive vocabulary would not score
abnormally on common vocabulary tests, McKenna and Warrington (1980) presented a
naming test of graded difficulty to better assess an individual's naming abilities (McKenna &
Warrington, 1980). In 1997 Warrington looked at the performance of normal control subjects
on the NART and the GNT and suggested a restandardization due to the impression that the
test has become less difficult and the overall level of performance has shifted (Warrington,
1997). Norms were taken from this restandardization. The test was administered with the
pictures printed on 30 sheets of A4 paper.
The National Adult Reading Test (NART) was created by Nelson and McKenna in 1982 as
a way to determine pre-morbid IQ (Nelson & Willison, 1991). In dealing with cognitive
impairment and deteriorating diseases, such as dementia, it is important to know what pre-
morbid IQ the patient had to estimate the severity of decline. Due to the fact that reading
abilities seem to be quite resistant to the progression of dementia, the NART offers a better
prediction of pre-morbid IQ than current vocabulary levels (Nelson & Willison, 1991).The
test is comprised of 50 irregular words which do not follow the common rules of grapheme-
phoneme representation and pronunciation. Without knowing the word, patients would
generally not be able to guess the correct pronunciation of it. NART error scores are usually
converted into WAIS IQs . After introducing WAIS-R, calculated IQs were on average 7.5
points lower than in the original WAIS and the NART was restandardized in 1991 (Nelson &
Willison, 1991). This study used the norms presented for NART errors in the manual. The
words were printed on an A4 sheet and read out loud by the participants.
The Addenbrooke's Cognitive Examination (ACE) was introduced by Mathuranath et al. in
2000 as a quick and straight forward test that could detect early dementia and differentiate
between AD and frontotemporal dementia (FTD) (Mathuranath, Nestor, Berrios, Rakowicz, &
Hodges, 2000). It underwent several revisions since then, namely changing the design to
make the test easier to administrate, as well as making the content more cross-cultural
applicable and to increase sensitivity (Mioshi, Dawson, Mitchell, Arnold & Hodges, 2006;
Hsieh, Schubert, Hoon, Mioshi, & Hodges, 2013). It is a very popular screening test for
dementia, since it usually takes less than fifteen minutes to complete and has proven to be
highly accurate (Mathuranath, et al., 2000). This study used the current version ACE-III

Property of University of EdinburghProperty of University of Edinburgh
10
which includes subcategories measuring orientation and attention, memory, verbal fluency,
language and visuospatial abilities. A comparison between ACE-III to ACE-R showed that
dementia patients generally scored 1-2 points lower on the ACE-III, but sensitivity and
specificity values for cut-offs at 88/100 and 82/100 still remained high (Hsieh, et al., 2013).
Norms suggested by Hsieh et al. (2013) and Mioshi et al. (2006) for overall scores, as well as
scores for the separate cognitive domains, were used in this study. The test was administered
on paper with a pen or pencil.
The Test of Everyday Attention (TEA) was developed by Robertson et al. (1994) as a
measurement of different forms of attention and how they are affected depending on the
location of the lesion (Robertson, Ward, Ridgeway, & Nimmo-Smith, 1996). This study uses
three auditory subtests of the TEA; Elevator Counting (subtest 2) requires sustained attention.
It has been shown that especially lesions to the prefrontal cortex can result in problems
sustaining attention and concentration (MacPherson, Turner, Bozzali, Cipolotti, & Shallice,
2010). Elevator Counting with Distraction (subtest 3) and Reversal (subtest 5), on the other
hand, rely heavily on attention switching and auditory-verbal working memory (Robertson, et
al., 1996; Chan, 2000). Norms were taken from Robertson et al. (1996) who presented norms
for the age range 50 to 64 and 65 to 80 (Robertson, et al.,1996) and the TEA manual
(Robertson, et al., 1994). The test was administered on either a laptop or an iPad.
The Digit Symbol-Coding Test (DSCT), also known as the Digit Symbol (DS) or Digit
Symbol Substitution Test (DSST) is one of the fourteen subtests of the Wechsler Adult
Intelligence Scale III (WAIS-III) which is used as a measurement of general adult intelligence
(Wechsler, 1997). The DSCT has proven to be one of the more sensitive subtests used in the
WAIS when screening for brain damage. It not only measures processing speed, but studies
further suggest that performance also relies on visual scanning, perceptual organization,
visual-motor coordination and, to a lesser degree, memory and the abilities to form new
verbal associations (Crowe et al., 1999; Joy, Fein & Kaplan, 2003). The performance on the
DSCT is known to drop with age, although not necessarily due to reduced motor control, as a
study by Salthouse (1992) investigated, but rather a slowing of overall cognitive processing
(Salthouse, 1992). Norms were taken from the WAIS-III manual.
The Trail Making Task (TMT) was originally part of the Army Individual Test of General
Ability in 1944 and was subsequently incorporated into the Halstead-Reitan
Neuropsychological Test Battery (Corrigan & Hinkeldey, 1987; Reitan, 1958). The test
requires visual-conceptual and visual-motor tracking skills, using cognitive abilities, such as

Property of University of EdinburghProperty of University of Edinburgh
11
scanning, processing speed, mental flexibility and executive functions (Tombaugh, 2004).
While Part A mostly relies on visuospatial processing, Part B depends more heavily on
executive functions and attention switching, due to its more complex task of connecting
numbers and letters in ascending order (Kipps & Hodges, 2005). Even though the TMT is
widely used, there are no clear sets of norms. Some studies calculate the difference (B-A, or
sometimes A-B) and ratio (B/A) of the two parts (Corrigan & Hinkeldey, 1987; Giovagnoli, et
al., 1996). Other studies try to define norms on mean number of seconds the parts require,
stratifying it by age and education (Tombaugh, 2004). Norms for this study were taken from
Tombaugh (2004) who used a sample of 911 participants, aged 18-89 years and two education
levels (Tombaugh, 2004). The test was administrated on paper with pen or pencil.
The Boston Cookie Theft (BCT) description task is a component of the Boston Diagnostic
Aphasia Examination (Goodglass & Kaplan, 1983). It is used to assess spontaneous speech
and looks at linguistic features, such as syntax, lexicon, phonology or prosody (Giles,
Patterson, & Hodges, 1996). The picture was presented on an A4 paper and the written
sample was collected on paper as well. Due to limited time, the results of the test were not
further assessed in this study. The participants did not seem to present with any language
impairment and generally had no difficulties describing the picture. However, in a future
study it would still be very interesting to see how healthy "normal" controls differ from each
other in spontaneous speech and writing.
Table 3 shows an overview of the cognitive domains utilize by each test.
Table 3 List of 9 tests with subcategories and their corresponding cognitive domains.
Cognitive Domains
Tests Memory Language Visuospatial
Processing Attention
Executive
Functions
Processing
Speed IQ
ROCFT
Copy Imm. Recall Delayed Recall ADASCog Word Recall Word Delayed Word Recogn. Instructions Commands Naming Comprehension Word Finding Language Construction

Property of University of EdinburghProperty of University of Edinburgh
12
Nr cancelling Orientation Ideational Pr. Maze GNT NART ACE Memory Language Visuospatial Attention Verbal Fluency TEA 2,3,5 DSCT () () TMT A TMT B
2.3. Procedure
After receiving the approval of the ethics committee, the recruitment process started in
April and ended in early July. The contact information for the volunteers was randomly
divided between the two main researchers to ensure each had an equal amount of experienced
and inexperienced participants, as well as participants from younger and older age groups.
Volunteers were contacted via e-mail, in which the pre-questionnaire was attached as a PDF
file, as well as inline. If there was no e-mail address available or turned out invalid, volunteers
were contacted via letters, which included the pre-questionnaire and a stamped return
envelope. Volunteers were subsequently contacted by phone to schedule the testing session.
Participants from the general public were scheduled via phone or email. Each participant was
given a number to secure anonymity of their data. Testing started at the end of May and lasted
until end of July. Each session started with a short conversation, not just to welcome the
participants, but also to observe their language abilities as part of the ADASCog. After
signing the consent form, the testing would begin. Upon completing the last test, the
participants were asked to fill out a questionnaire, asking them about leisure activities, as well
as whether they felt like their memory, concentration, and language abilities have changed in
the last years and if so whether they felt like it impaired their everyday life. The participants
were further given a language questionnaire if they stated that they spoke any other languages
next to English. When necessary, participants were reimbursed with £4. During the session
they were provided with water and snacks. Figure 1 gives an overview of the test procedure.
Main cognitive domains assessed by each test and subtest are signaled with ticks. The DSCT mainly relies on
visuospatial processing and processing speed, however, it might also tap into memory and executive functions. This
is signaled with ticks in brackets.

Property of University of EdinburghProperty of University of Edinburgh
13
Fig. 1 Procedure of test administration. Sessions would usually take 1.5 to 2 hours.
ROCFT
Copy
ROCFT
Immediate
Recall
ADASCog
GNT
NART
ACE-III
TEA 2, 3, 5
BCT Oral
DSCT
TMT A, B
BCT
Written
5 Min
Break
All ROCFT tests are timed. Participants are told not to hurry, and
are allowed to use the rubber, if they feel it is necessary. After
the Immediate Recall the time is noted; 30 minutes until the
ROCFT Delayed Recall start.
Five questions from the ACE-III are added to the ADASCog
subsection Orientation (No./Floor, Street/Hospital, Town,
County, Country), so the participants would not have to be
repeatedly tested on these. The scores are subsequently added
to the ACE. For the words and objects, it is ensured the
participants can properly see the flashcards. The maze is timed
in full seconds and 45 seconds are given for the nr. cancelling.
Participants are allowed to go through the GNT and NART at
their own speed. If they make a mistake on the GNT they are
asked whether they know another name for the object,
otherwise they could continue.
Depending on how quickly the tests
proceeded, participants are either asked to
draw the ROCFT Delayed Recall, or, if there is
enough time, continue on to the ACE-III.
Otherwise a quick break is taken to get to the
30 minute mark for the Delayed Recall.
they could continue.
It is ensured that tones are clearly audible. Examples are
played for all the tasks, if needed repeatedly. Task 5 proved to
be rather complicated to understand and sometimes drawings
are used to illustrate how it works. A few participants could
not perform the task 5 and are given 0 points for it.
Both TMT A and B are timed. Short samples are given for all
three tests to ensure participants know what to do
Participants are given 120 seconds to transcribe as many
symbols as possible.
Questions on the ACE-III that were already
asked in the ADASCog Orientation subsection
(Day, Date, Month, Year, Season) and the
copying of the cube are not asked again and
the scores were taken from the ADASCog.
ROCFT
Delayed
Recall

Property of University of EdinburghProperty of University of Edinburgh
14
2.4. Design
The two groups, experienced and inexperienced, were further divided into age categories of
{55-65} years and {66-75} years, to compare how the age groups performed in relation to
their level of experience. The cut-off 65 was chosen, since it is often the age of retirement.
Furthermore, geriatric health care centers start offering assistance to those who are 65 or older,
while early-onset Alzheimer's is usually diagnosed in people below 65 (Alzheimer's Society).
SPSS was used to run the analysis. To see how the experienced group fares compared to the
inexperienced one, and whether there is a main effect of age or experience, a 2x2 ANOVA
was conducted for each test and subtest. Kolmogorov-Smirnov (K-S) or Shapiro-Wild (S-W)
were used to test for normal distribution. Since this study is dealing with healthy participants,
tests which evaluate cognitive impairment, such as the ADASCog or ACE, often show ceiling
effects. If the distribution was not normal, attempts were made to log transform the data,
however, this usually did not normalize the distribution. As it is, the 2x2 ANOVA might
therefore not be robust enough for groups in which the assumption of a normal distribution is
violated. This has to be considered when looking at the results.
3. Results
3.1. Matching Groups
To determine whether experience has an effect on scores, the 61 volunteers are split into
two groups according to their frequency of participation on the panel. Participating in two or
more experiments per year counts as experienced, less than two times per year as
inexperienced. Cut-off line is determined by total number of experiments (range: 0-125
experiments, mean=12.32 (SD=21.39)) divided by total years since starting participation on
the panel (range: 0-23 years, mean=3.80 (SD=5.397)). Table 4 shows gender, age and
education range, as well as experience on the panel for the two groups.
Table 4 Total number of inexperienced participants and experienced participants.
Participants
Inexperienced (n=27) Experienced (n=34)
Female 18 22
Male 9 12
Age 55 - 75 55 - 74
Mean Age (SD) 64.56 (6.25) 65.24 (4.52)
Years of Education 8 - 20 10 - 26.5
Mean YoE (SD) 16.06 (3.00) 17.03 (3.67)
No. of Years on Panel 0-23 0-14

Property of University of EdinburghProperty of University of Edinburgh
15
Mean NoY (SD) 4.26 (6.34) 3.44 (4.58)
No. of Experiments 0-25 1-125
Mean NoE (SD) 5.24 (7.99) 17.94 (26.60)
Experience(SD) 0.62 (0.80) 4.86 (3.13)
An independent sample t-test is conducted to see whether the groups match. The Levene's
Test for Equality of Variances for age is significant with F(59)=6.981, p=0.011. In all
probability, equality of variance can therefore not be assumed. Even though the two groups
might not be homogenous in age, they are matched on all three variables. Age difference for
inexperienced (M=64.56, SE=1.20) and experienced (M=65.24, SE=0.78) is not significant
t(45.86)= -0.475, p= 0.637. Difference in education for inexperienced (M=16.06, SE=0.58)
and experienced (M=17.03, SE=0.63) is not significant t(59)= -1.113, p= 0.270. Gender for
inexperienced and experienced is also not significant t(59)= -0.157, p= 0.875.
In a next step, the inexperienced and experienced groups are further divided into age {55-
65} and {66-75}. Controlling for outliers shows that one participant in particular scored
below average on all tests, with exception of the NART. The fact that most scores are also
below what published norms consider as "normal", even when applying double or triple
standard deviation (SD), gives reason to suspect presence of MCI. Table 5 lists the
participant's scores and cut-off norms:
Table 5 Scores of outlier N18 compared to cut-off scores provided by norms
N18
Age:57 ROCFT ACE ADAS GNT NART TEA DSCT TMT
Scores 28/6/9.5 80 20 20 2 4/1/0 34 116/172
Cut-off 28.5/9.5/10 82/88 5.24 16 30 7/6/2 46 41.86/89.76
Since this study is trying to detect very subtle changes in cognitive domains between the two
older and younger groups, scores like these could influence the outcome. Due to the
participant's 80 on ACE, the scores are excluded from the inexperienced group. Another
participant scored 80 on ACE and is not included in the experienced group. To match for age
between the experienced and inexperienced {66-75} year-olds, one 73 year-old participant,
Scores are provided for participant N18, 57 years old (18 years of education). Cut-off scores are calculated
according to published norms. Highlighted in red shows all the scores that are below the norms and are considered
abnormal.
Demographics (gender, age, mean age with standard deviation (SD), years of education, mean years of education
(YoE) with standard deviation, number of years participants have been on the panel, mean number of years on the
panel (NoY) with standard deviation, number of experiments they have participated in, mean number of
experiments (NoE) with standard deviation) for both groups.
Experience: Number of total experiments divided by number of years on the panel. Mean and standard deviation
are given for both groups. 2.0 experiments or more per year counts as experienced.

Property of University of EdinburghProperty of University of Edinburgh
16
who scored abnormally on TMT B (180.5 seconds), is excluded from the inexperienced group.
The final groups are presented in table 6.
Table 6 Total number of inexperienced/experienced participants divided by age groups.
Participants
Inexperienced Experienced
55-65 (n=14) 66-75 (n=11) 55-65 (n=15) 66-75 (n=18)
Female 10 6 11 11
Male 4 5 4 7
Mean Age (SD) 59.79 (2.81) 70.55 (2.66) 61.07 (2.66) 68.78 (2.26)
Years of Educ. 13 - 20 8 - 20 10 - 21 10 - 26.5
Mean YoE (SD) 17.21 (2.01) 14.50 (3.63) 17.33 (2.69) 16.61 (4.41)
Years on Panel 0 - 15 0 - 23 0 - 8 0 - 14
Mean YoP (SD) 4.21 (5.48) 4.55 (8.02) 1.53 (2.62) 5.22 (5.28)
No.Experiments 0 - 25 0 - 25 1 - 70 1 - 125
Mean NoE (SD) 2.28 (8.53) 4.82 (8.39) 9.20 (17.78) 26.06 (31.03)
Experience(SD) 0.55 (0.69) 0.44 (0.65) 4.44 (3.79) 5.16 (2.62)
Equality of variances can be assumed for all variables in both groups. Group {55-65}: Age
difference between inexperienced (M=59.79, SE=.75) and experienced (M=61.07, SE=0.69)
is not significant t(27)= -1.262, p= 0.218. Difference in education between inexperienced
(M=17.21, SE=0.54) and experienced (M=17.33, SE=0.69) is not significant t(27)= -0.134, p=
0.894. Gender between inexperienced and experienced is also not significant t(27)= 0.111, p=
0.913. Group {66-75}: Age difference between inexperienced (M=70.55, SE=.80) and
experienced (M=68.78, SE=0.53) is not significant t(27)= 1.919, p= 0.067. Difference in
education between inexperienced (M=14.50, SE=1.09) and experienced (M=16.61, SE=1.04)
is not significant t(27)= -1.333, p= 0.194. Gender between inexperienced and experienced is
also not significant t(27)= 0.337, p= 0.739. It can be concluded that the groups are matched.
3.2. Norms, Distribution and 2x2 ANOVA
ROCFT
On the Copy task, all groups score similarly, varying between 32/33 and 36 points out of a
maximum of 36. Both the inexperienced and experienced groups score around 1 point better
on the ROCFT Copy than the norms given by Fastenau et al. (1999) suggest.
Demographics (gender, age, mean age with standard deviation (SD), years of education, mean years of education
(YoE) with standard deviation, number of years participants have been on the panel, mean number of years on the
panel (NoY) with standard deviation, number of experiments they have participated in, mean number of
experiments (NoE) with standard deviation) for age groups 55 - 65 and 66 - 75 for both inexperienced and
experienced participants.
Experience: Number of total experiments divided by number of years on the panel. Mean and standard deviation are
given for all four groups. 2.0 experiments or more per year counts as experienced.

Property of University of EdinburghProperty of University of Edinburgh
17
Table 7 Means with standard deviations and norms for ROCFT Copy
ROCFT Copy
Inexperienced Experienced
55-65 (n=14) 66-75 (n=11) 55-65 (n=15) 66-75 (n=18)
Min 33 33.5 33 32
Max 36 36 36 36
Mean (SD) 35.43 (0.94) 35.14 (1.05) 35.33 (1.11) 35.17 (1.34)
TOTAL 35.30 (0.98) 35.24 (1.23)
Norm (Fastenau, et al., 1999)
Mean Age 63 Mean Age 68
31.94 (3.37) 31.76 (3.63)
Due to ceiling effects in the scores of all four groups, no further inferential analyses are
conducted.
On the Immediate Recall, scores differ more distinctly from each other. Although the
experienced group scores only marginally better than the inexperienced group, experienced
{66-75} and inexperienced {66-75} are at opposite ends, with the older experienced
volunteers scoring the highest and the older inexperienced volunteers scoring the lowest out
of the four groups. Compared to the norms and including SD, all groups score 4 to 7 points
better.
Table 8 Means with standard deviations and norms for ROCFT Immediate Recall
ROCFT Immediate Recall
Inexperienced Experienced
55-65 (n=14) 66-75 (n=11) 55-65 (n=15) 66-75 (n=18)
Min 8 3 6.5 14
Max 29.5 28 27 34
Mean (SD) 21.43 (5.26) 16.41 (9.34) 19.00 (6.09) 22.67 (5.80)
TOTAL 19.22 (7.60) 21.00 (6.13)
Norms (Fastenau, et al., 1999)
Mean Age 63 Mean Age 68
15.52 (5.82) 15.18 (5.58)
For the Immediate Recall, the scores in all groups are normally distributed: Inexperienced
{55-65}, D(14)=0.152, p=0.200 and inexperienced {66-75}, D(11)=0.140, p=0.200.
Descriptive statistic and norms are provided of the test for all four groups. Total lists the mean scores and standard
deviation for inexperienced and experienced participants, irrespective of their age.
Published norms are provided for comparison.
Descriptive statistic and norms are provided of the test for all four groups. Total lists the mean scores and standard
deviation for inexperienced and experienced participants, irrespective of their age.
Published norms are provided for comparison.

Property of University of EdinburghProperty of University of Edinburgh
18
Experienced {55-65}, D(15)=0.165, p=0.200 and experienced {66-75}, D(18)=0.113,
p=0.200.
The Delayed Recall shows a similar result to the Immediate Recall. Experienced volunteers
are only marginally better than inexperienced, but the older age groups differ more
prominently from each other than the younger groups. All score 4 to 7 points better than the
norms suggest.
Table 9 Means with standard deviations and norms for ROCFT Delayed Recall
ROCFT Delayed Recall
Inexperienced Experienced
55-65 (n=14) 66-75 (n=11) 55-65 (n=15) 66-75 (n=18)
Min 7 3 8 13.5
Max 30 30 28 33
Mean (SD) 19.93 (5.60) 16.50 (8.26) 18.23 (5.56) 22.69 (5.75)
TOTAL 18.42 (6.96) 20.67 (6.01)
Norms (Fastenau, et al., 1999)
Mean Age 63 Mean Age 68
15.91 (5.91) 15.29 (5.57)
The scores for Delayed Recall are also normally distributed: Inexperienced {55-65},
D(14)=0.189, p=0.186 and inexperienced {66-75}, D(11)=0.109, p=0.200. Experienced {55-
65}, D(15)=0.151, p=0.200 and experienced {66-75}, D(18)=0.101, p=0.200.
Scores for both recalls are further analyzed to see whether there are significant effects:
Descriptive statistic and norms are provided of the test for all four groups. Total lists the mean scores and standard
deviation for inexperienced and experienced participants, irrespective of their age.
Published norms are provided for comparison.
Fig. 2 2x2 ANOVA results for ROCFT Immediate Recall Fig. 3 2x2 ANOVA results for ROCFT Delayed Recall

Property of University of EdinburghProperty of University of Edinburgh
19
For both ROCFT Immediate Recall (Fig.2) and Delayed Recall (Fig.3), more experience
significantly improves the performance of the older groups. On the Immediate Recall, no
significant main effect of experience F(1,54)=1.192, p=0.280 or age F(1,54)=0.147, p=0.702
can be seen. However, the amount of experience significantly interacts with age between the
groups, F(1,54)=6.150, p=0.016. Results for the Delayed Recall are almost identical. There is
no significant main effect of experience F(1,54)=1.842, p=0.180 or age F(1,54)=0.097,
p=0.757, but experience significantly interacts with age between the two age groups,
F(1,54)=5.666, p=0.021.
ADASCog:
The norms provided for ADAS Total do not include scores for maze time or number
cancelling. Furthermore, while Graham et al. (2004) provide norms for the components of
memory and language domains, they do not offer the same for visuospatial, processing speed
or executive functions, mainly because they do not look at maze and number cancelling scores.
Only the total scores are therefore compared to the norms. Due to miscommunication in test
instruction, maze time is not considered in this study, only maze errors.
The ADASCog measures number of errors, lower scores are therefore better than higher
scores. Both inexperienced and experienced groups seem to score marginally worse than what
the norms suggest. Especially when looking at the maximum scores of the older groups there
is a discrepancy between the published norms and the data here. Even with double or triple
SD, some participants would have to be excluded due to abnormal scores. However, since
there are only few published papers on ADASCog norms for healthy adults, and the
participants with high scores did not perform significantly worse than others on any of the
other tests, they are not excluded from the data set. Executive functions show strong ceiling
effects with everyone scoring between 0 and 1 point and are not further analyzed. Processing
speed, language and visuospatial domain are analyzed, but do not show any significant results.
Table 10 Means with standard deviations and norms for ADASCog and subcategories
ADASCog
Inexperienced Experienced
55-65 (n=14) 66-75 (n=11) 55-65 (n=15) 66-75 (n=18)
Total Score
Min 0.33 1.67 0.67 0.33
Max 6.70 14.67 9.50 13.33
Mean (SD) 3.08 (2.14) 7.79 (3.40) 4.92 (2.30) 5.57 (3.09)
TOTAL 5.15 (3.85) 5.28 (3.02)
Memory

Property of University of EdinburghProperty of University of Edinburgh
20
Min 0.33 0.67 0.67 0.33
Max 6.70 12.67 9.50 12.33
Mean (SD) 2.80 (2.04) 6.33 (3.40) 4.32 (2.77) 5.07 (2.86)
TOTAL 4.35 (3.20) 4.73 (2.80)
Language
Min 0.00 0.00 0.0 0.00
Max 2.00 3.00 2.0 2.00
Mean (SD) 0.43 (0.65) 1.09 (1.22) 0.53 (0.74) 0.56 (0.70)
TOTAL 0.72 (0.98) 0.55 (0.71)
Visuospatial
Min 1.00 0.00 0.00 1.00
Max 29.00 26.00 27.00 22.00
Mean (SD) 11.36(7.59) 11.45(8.63) 10.20(7.20) 10.56(5.83)
TOTAL 11.40 (7.89) 10.39 (6.39)
Attention
Min 0.00 0.00 0.00 1.00
Max 400 2.00 1.00 1.00
Mean (SD) 0.36 (1.08) 0.64 (0.67) 0.33 (0.49) 0.33 (0.49)
TOTAL 0.48 (0.92) 0.33 (0.48)
Exec.Function
Min 0.00 0.00 0.00 0.00
Max 1.00 1.00 1.00 1.00
Mean (SD) 0.14 (0.36) 0.18(0.40) 0.13 (0.35) 0.17 (0.38)
TOTAL 0.16 (0.37) 0.15 (0.36)
Processing Speed
Min 1.00 0.00 0.00 1.00
Max 29.00 26.00 27.00 21.00
Mean (SD) 11.29(7.63) 11.36(8.55) 10.13(7.22) 10.50(5.72)
TOTAL 11.32 (7.87) 10.33 (6.34)
Norms (Graham, et al., 2004)
Age 55 - 64 Age 65 - 69 Age 70 - 74
3.60 (1.64) 4.51 (2.18) 5.13 (2.06)
The ADASCog Total scores follow normal distribution; Inexperienced {55-65}, D(14)=0.220,
p=0.065 and inexperienced {66-75}, D(11)=0.171, p=0.200. Experienced {55-65},
D(15)=0.116, p=0.200 and experienced {66-75}, D(18)=0.163, p=0.200.
Descriptive statistic and norms are provided of the test and all the subcategories for all four groups. Total lists the
mean scores and standard deviation for inexperienced and experienced participants, irrespective of their age.
ADASCog subtests word recall, delayed recall, word recognition and instructions are combined into Memory
subcategory.
ADASCog subtests commands, naming, comprehension, word finding difficulties and language are combined into
Language subcategory.
ADASCog subtests construction and number cancelling with errors are combined into Visuospatial subtests.
ADASCog subtests number cancelling errors and orientation are combined into Attention subcategory.
ADASCog subtests ideational praxis and maze errors are combined into Executive Functions subcategory.
ADASCog subtests number cancelling and errors and maze errors are combined into Processing Speed
subcategory.
Published norms are provided for comparison.
Property of University of EdinburghProperty of University of Edinburgh
21
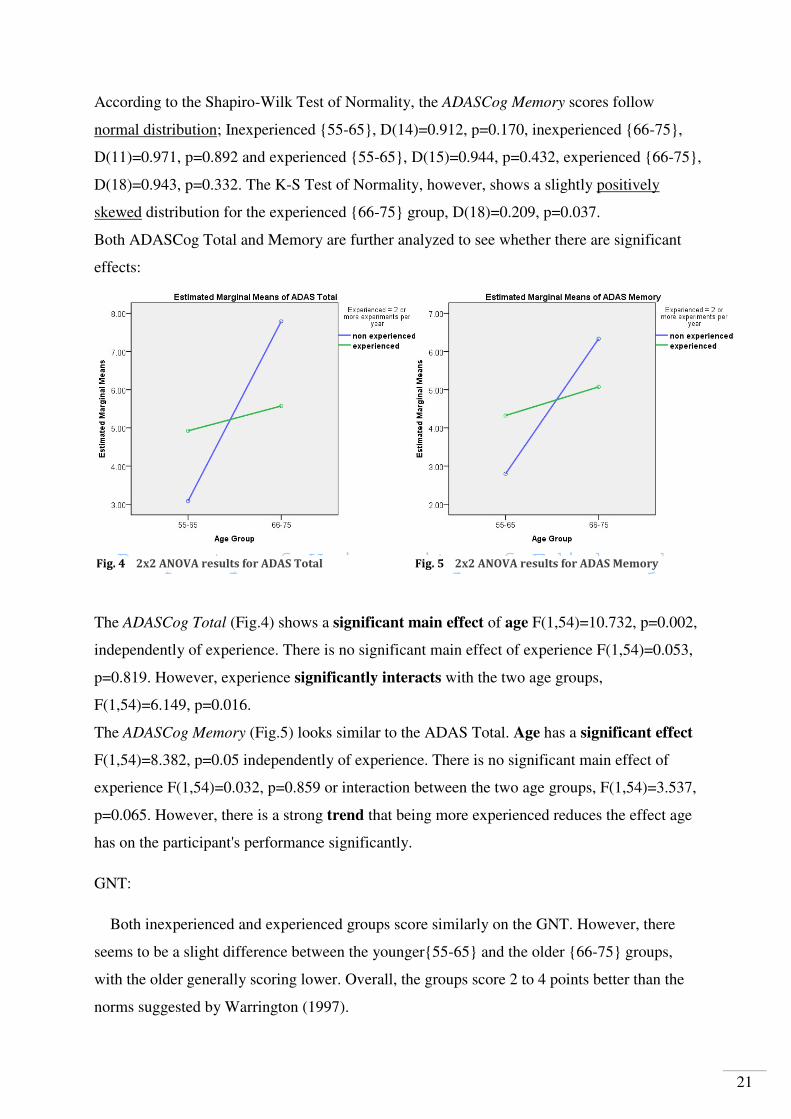
According to the Shapiro-Wilk Test of Normality, the ADASCog Memory scores follow
normal distribution; Inexperienced {55-65}, D(14)=0.912, p=0.170, inexperienced {66-75},
D(11)=0.971, p=0.892 and experienced {55-65}, D(15)=0.944, p=0.432, experienced {66-75},
D(18)=0.943, p=0.332. The K-S Test of Normality, however, shows a slightly positively
skewed distribution for the experienced {66-75} group, D(18)=0.209, p=0.037.
Both ADASCog Total and Memory are further analyzed to see whether there are significant
effects:
The ADASCog Total (Fig.4) shows a significant main effect of age F(1,54)=10.732, p=0.002,
independently of experience. There is no significant main effect of experience F(1,54)=0.053,
p=0.819. However, experience significantly interacts with the two age groups,
F(1,54)=6.149, p=0.016.
The ADASCog Memory (Fig.5) looks similar to the ADAS Total. Age has a significant effect
F(1,54)=8.382, p=0.05 independently of experience. There is no significant main effect of
experience F(1,54)=0.032, p=0.859 or interaction between the two age groups, F(1,54)=3.537,
p=0.065. However, there is a strong trend that being more experienced reduces the effect age
has on the participant's performance significantly.
GNT:
Both inexperienced and experienced groups score similarly on the GNT. However, there
seems to be a slight difference between the younger{55-65} and the older {66-75} groups,
with the older generally scoring lower. Overall, the groups score 2 to 4 points better than the
norms suggested by Warrington (1997).
Fig. 4 2x2 ANOVA results for ADAS Total Fig. 5 2x2 ANOVA results for ADAS Memory

Property of University of EdinburghProperty of University of Edinburgh
22
Table 11 Means with standard deviations and norms for GNT
GNT
Inexperienced Experienced
55-65 (n=14) 66-75 (n=11) 55-65 (n=15) 66-75 (n=18)
Min 24 22 24 21
Max 30 29 30 30
Mean (SD) 27.57 (3.34) 25.73 (2.33) 27.13 (1.64) 26.61 (2.40)
TOTAL 26.76 (2.22) 26.85 (2.08)
Norms (Warrington, 1997)
20.4 (4.1)
The scores for the GNT are normally distributed for the inexperienced {55-65}group,
D(14)=0.211, p=0.090, and the experienced {66-75}group, D(18)=0.175, p=0.148. The
distributions for the inexperienced {66-75}group, D(11)=0.259, p=0.038 and the experienced
{55-65} group, D(15)=0.266, p=0.005 can be seen as slightly bi- or multimodal. However, the
S-W test shows normal distribution for both groups with D(11)=0.866, p=0.068 and
D(15)=0.912, p=0.146. The data is further analyzed to see whether there are significant
effects:
The GNT (Fig.6) shows a significant main effect of age F(1,54)=4.549, p=0.038. There is no
significant main effect of experience F(1,54)=0.161, p=0.689 and experience does not
significantly interact with age between the two age groups, F(1,54)=1.419, p=0.239.
Descriptive statistic and norms are provided of the test for all four groups. Total lists the mean scores and standard
deviation for inexperienced and experienced participants, irrespective of their age.
Published norms are provided for comparison.
Fig. 6 2x2 ANOVA results for GNT

Property of University of EdinburghProperty of University of Edinburgh
23
NART:
The NART is scored in errors. All the groups score better than the what the norms by
Nelson and Willison (1991) suggest. The lowest score is 0 and highest score is 17, whereas
the norms, including SD, are between 7.1 and 30.5. There is one outlier in the inexperienced
{66-75} group who scored 17 errors. Although this is not abnormal according to published
norms, in this sample, it skews the distribution D(11)=0.255, p=0.045. The descriptive data is
shown with the outlier included, since the scores are "normal". For any further analysis of the
NART, however, the participant's data is excluded. Results do not reach significance with or
without the outlier.
Table 12 Means with standard deviations and norms for NART
NART
Inexperienced Experienced
55-65 (n=14) 66-75 (n=11) 55-65 (n=15) 66-75 (n=18)
Min 2 1 0 0
Max 11 17 13 11
Mean (SD) 4.79 (2.78) 7.27 (4.54) 4.73 (3.49) 5.11 (3.05)
TOTAL 5.88 (3.79) 4.94 (3.21)
Norms (Nelson & Willison, 1991)
18.8 (11.7)
ACE-III:
The two age and experience groups do not to differ much from each other, except for the
subcategory fluency, in which the experienced seeme to be at an advantage. The volunteers
are only marginally better on the total ACE score than the norms, mainly due to small
variances in the fluency subcategory. Attention, memory, language and visuospatial
subcategories are almost identical to the norms provided by Hsieh (2013) and Mioshi (2006).
Most of the scores show ceiling effects. Language, visuospatial and memory subcategories
show no significant results and are not further analyzed.
Table 13 Means with standard deviations and norms for ACE-III and subcategories
ACE-III
Inexperienced Experienced
55-65 (n=14) 66-75 (n=11) 55-65 (n=15) 66-75 (n=18)
Descriptive statistic and norms are provided of the test for all four groups. Total lists the mean scores and standard
deviation for inexperienced and experienced participants, irrespective of their age.
Published norms are provided for comparison.

Property of University of EdinburghProperty of University of Edinburgh
24
Total Score
Min 90 86 93 85
Max 100 100 100 100
Mean (SD) 97.14 (2.96) 95.91 (4.66) 98.40 (2.06) 96.28 (4.11)
TOTAL 96.60 (3.76) 97.24 (3.46)
Memory
Min 23 19 22 19
Max 26 26 26 26
Mean (SD) 25.21 (1.25) 24.82 (2.44) 25.20 (1.27) 24.83 (2.04)
TOTAL 25.04 (1.84) 25.00 (1.71)
Language
Min 25 24 25 23
Max 26 26 26 26
Mean (SD) 25.64 (0.50) 25.18 (0.67) 25.93 (0.26) 25.33 (0.91)
TOTAL 25.64 (0.57) 25.61 (0.75)
Visuospatial
Min 14 13 12 13
Max 16 16 16 16
Mean (SD) 15.64 (0.63) 15.36 (1.03) 15.67 (1.05) 15.56 (0.86)
TOTAL 15.52 (0.82) 15.61 (0.93)
Attention
Min 17 16 17 14
Max 18 18 18 18
Mean (SD) 17.79 (0.43) 17.45 (0.69) 17.80 (0.41) 17.17 (1.51)
TOTAL 17.64 (0.57) 17.45 (1.18)
Fluency (Executive Functions)
Min 9 9 13 12
Max 14 14 14 14
Mean (SD) 12.86 (1.56) 12.64 (1.57) 13.80 (0.41) 13.39 (0.85)
TOTAL 12.76 (1.54) 13.58 (0.71)
ACE-III Norms (Hsieh, et al., 2013)
ACE Total 95.4 (3.3)
Language 25.6 (0.6)
Visuospatial 15.6 (0.6)
Attention 17.4 (1.2)
ACE-R Norms (Mioshi, et al., 2006)
Memory 23.4 (2.7)
Fluency 11.9 (1.7)
The ACE Total scores are not normally distributed for the inexperienced {55-65}group,
D(14)=0.328, p=0.000, the experienced {55-65} group, D(15)=0.281, p=0.002.The
distributions following normal distribution for the inexperienced {66-75}group, D(11)=0.219,
Descriptive statistic and norms are provided of the test and subcategories for all four groups. Total lists the mean
scores and standard deviation for inexperienced and experienced participants, irrespective of their age.
Published norms are provided for comparison.

Property of University of EdinburghProperty of University of Edinburgh
25
p=0.147 and the experienced {66-75}group, D(18)=0.195, p=0.068.
ACE Fluency scores show a normal distribution for the inexperienced {66-75} group
D(11)=0.228, p=0.114. All the other groups show a negatively skewed distribution towards
the maximum score of 14: Inexperienced {55-65}, D(14)=0.268, p=0.007, experienced {55-
65}, D(15)=0.485, p=0.000 and experienced {66-75}, D(18)=0.375, p=0.000.
ACE Attention scores are all negatively skewed; Inexperienced {55-65} group D(14)=0.478,
p=0.000 and experienced {55-65}, D(15)=0.485, p=0.000. Inexperienced {66-75},
D(11)=0.332, p=0.001, and experienced {66-75}, D(18)=0.377, p=0.000.
ACE Total, Fluency and Attention are further analyzed to see whether there are significant
effects:
The ACE Fluency (Fig.7) is the only test that shows a main effect of experience
F(1,54)=7.689, p=0.008. No effect can be seen for age F(1,54)=1.068, p=0.306 or interaction
F(1,54)=0.097, p=0.757. It has to be noted that the Levene's Test of Equality of Error
Variances is significant F(3, 54)=5.681, p=002 and the distribution is not normal for all
groups. However, this result suggest that experience significantly improves performance for
both age groups.
ACE Total (Fig.8) shows no main effect of experience F(1,54)=0.740, p=0.393 or age
F(1,54)=3.153, p=0.081 on the participants' scores, however, age seems to show a trend
towards significance. The amount of experience did not significantly interact with age
between the two age groups, F(1,54)=0.221, p=0.640.
Similarly, the ACE Attention (Fig.9) shows no main effect of experience F(1,54)=0.296,
p=0.589 or age F(1,54)=3.679, p=0.060 on the participants' scores, however, age seems to
Fig. 7 2x2 ANOVA results for ACE Fluency

Property of University of EdinburghProperty of University of Edinburgh
26
show a trend towards significance. The amount of experience did not significantly interact
with age between the two age groups, F(1,54)=0.361, p=0.550. However, the Levene's Test is
significant with F(3,54)=6.551, p=0.001.
TEA:
On the TEA 2, all participants scored 7 points out of a maximum of 7. The test is therefore
not included in any further analysis. The overall scores for the TEA 3 lie well within the
suggested range of norms. No norms are provided by Robertson et al. (1996) for the TEA 5
scores for the older groups. According to the TEA manual, scoring 0 points is acceptable
(Robertson, et al., 1994). The {55-65} groups score slightly better compared to the norms
provided for a mean age of 61 (Robertson et al, 1996).
Table 14 Means with standard deviations and norms for TEA 3 and 5
TEA
Inexperienced Experienced
55-65 (n=14) 66-75 (n=11) 55-65 (n=15) 66-75 (n=18)
TEA 3
Min 1 1 5 3
Max 10 10 10 10
Mean (SD) 8.50 (2.62) 6.27 (3.35) 9.07 (1.53) 7.83 (2.41)
TOTAL 7.52 (3.11) 8.39 (2.12)
TEA 5
Min 0 0 0 0
Max 10 10 10 10
Mean (SD) 6.21 (3.89) 4.91 (3.56) 5.67 (3.31) 5.44 (3.07)
TOTAL 5.64 (3.73) 5.55 (3.13)
Fig. 8 2x2 ANOVA results for ACE Total Fig. 9 2x2 ANOVA results for ACE Attention

Property of University of EdinburghProperty of University of Edinburgh
27
Norms for TEA 3 (Robertson, et al., 1996)
Age 50-64 Age 65-80
TEA 3 8.18 (2.8) 7.75 (2.9)
TEA 5 4.7 (3.1) -
Norms from the TEA manual (Robertson, et al., 1994)
TEA 3 6 or more 5 or more
TEA 5 2 or more 0 or more
The TEA 3 scores are not normally distributed for the inexperienced {55-65}group,
D(14)=0.290, p=0.002, the experienced {55-65} group, D(15)=0.349, p=0.000 and the
experienced {66-75}group, D(18)=0.297, p=0.000. The scores are following normal
distribution for the inexperienced {66-75}group, D(11)=0.231, p=0.105..
TEA 5 scores are normally distributed for the inexperienced {66-75}group, D(11)=0.171,
p=0.002, the experienced {55-65} group, D(15)=0.190, p=0.151 and the experienced {66-
75}group, D(18)=0.186, p=0.100. The scores show a bi- or multimodal distribution for the
inexperienced {55-65}group, D(11)=0.248, p=0.019. Further analysis on TEA 5 does not
show any significant results. TEA 3 has the following significant effect:
It has to be noted that the Levene's Test of Equality of Error Variances for the TEA 3 is
significant with F(3,54)=3.662, p=0.018. However, with the data at hand, the results (Fig.10)
suggest that age has a significant main effect F(1,54)=6.822, p=0.012.There is no significant
Descriptive statistic and norms are provided of TEA 3 and 5 for all four groups. TEA 2 is not given, because every
participant scored 7 out of 7 points. Total lists the mean scores and standard deviation for inexperienced and
experienced participants, irrespective of their age.
Published norms are provided for comparison. Cut-off for TEA 2 is 6 or less. Norms taken from the manual provide
cut-offs for TEA 3: below 6, respectively 5 and for TEA 5: below 2 for the 50-64 year olds. A score of 0 is acceptable
for 65+.
Fig. 10 2x2 ANOVA results for TEA 3

Property of University of EdinburghProperty of University of Edinburgh
28
main effect of experience F(1,54)=2,578, p=0.114 and experience does not significantly
interact with age between the two age groups, with F(1,54)=0.563, p=0.456.
DSCT:
The DSCT scores are transferred into a scaled score as part of the WAIS-III. The manual
offers a conversion table. The volunteers are overall score better than the norms. Within the
experienced and inexperienced groups, the younger volunteers also seem to perform better
than the older.
Table 15 Means with standard deviations and norms for DSCT
DSCT
Inexperienced Experienced
55-65 (n=14) 66-75 (n=11) 55-65 (n=14) 66-75 (n=18)
Min 52 49 57 51
Max 97 96 100 93
Mean (SD) 75.29 (12.23) 67.73 (12.81) 75.86 (13.75) 69.89 (12.87)
TOTAL 71.96 (12.80) 72.50 (13.39)
Norms (Wechsler, 1997)
Age 55 - 64 Age 65 - 69 Age 70 - 74
46 - 71 39 - 64 36 - 61
Scaled score of 9.88 (2.87)
On the DSCT all scores follow normal distribution; Inexperienced {55-65}, D(14)=0.137,
p=0.200 and inexperienced {66-75}, D(11)=0.190, p=0.200. Experienced {55-65},
D(14)=0.165, p=0.075 and experienced {66-75}, D(18)=0.099, p=0.200. One participant's
score from experienced {55-65} group was excluded due to errors during administration of
the test. The data is further analyzed to see whether there are significant effects:
Descriptive statistic and norms are provided of the test for all four groups. Total lists the mean scores and standard
deviation for inexperienced and experienced participants, irrespective of their age.
Published norms are provided for comparison.
Fig. 11 2x2 ANOVA results for DSCT

Property of University of EdinburghProperty of University of Edinburgh
29
DSCT (Fig.10) shows no main effect of experience F(1,53)=0.154, p=0.696 or age
F(1,53)=3.784, p=0.057 and experience does not significantly interact with age between the
two age groups, F(1,53)=0.052, p=0.820. Even though there are no significant main effects,
results suggest a strong trend that age effects the scores independently of experience.
TMT A and B:
In both Part A and B, all groups perform similar to the norms suggested by Tombaugh
(2003). He provides norms for both lower education (0-12 years) and higher education (+12
years). Comparison is made to +12 years. The inexperienced and experienced groups are
almost identical, with the experienced {55-65} performing slightly better.
Table 16 Means with standard deviations and norms for TMT A
TMT A
Inexperienced Experienced
55-65 (n=14) 66-75 (n=11) 55-65 (n=15) 66-75 (n=18)
Min 27.0 21.1 19.7 16.0
Max 55.7 56.0 62.0 68.2
Mean (SD) 37.94 (10.44) 37.59 (9.83) 34.29 (10.66) 37.50 (13.11)
TOTAL 37.78 (9.97) 36.04 (11.99)
Norms TMT A (Tombaugh, 2003)
Age 55-59 Age 60-64 Age 65-69 Age70-74
31.72 (10.14) 31.32 (6.96) 33.84 (6.69) 40.13 (14.48)
All scores for Part A follow normal distribution; Inexperienced {55-65}, D(14)=0.182,
p=0.200 and inexperienced {66-75}, D(11)=0.139, p=0.200. Experienced {55-65},
D(15)=0.201, p=0.105 and experienced {66-75}, D(18)=0.171, p=0.172. Further analysis
shows no significant effects.
Part B has outliers, both in the experienced {55-65} and {66-75} group, scoring 150,
respectively 181.5 seconds. Even when considering triple SD from the norms given for each
age category, the scores are abnormal. Descriptive data is given without the of the two
participants. An analysis with and without the outliers show no significant results. In a next
step, three more participants, who scored above 110, are excluded to see whether there is a
significant main effect of age or experience on the performance.
Descriptive statistic and norms are provided of the Part A of the TMT for all four groups. Total lists the mean scores
and standard deviation for inexperienced and experienced participants, irrespective of their age.
Published norms are provided for comparison.
Fig. 10 2x2 ANOVA results for DSCT

Property of University of EdinburghProperty of University of Edinburgh
30
Table 17 Means with standard deviations and norms for TMT B
TMT B
Inexperienced Experienced
55-65 (n=14) 66-75 (n=11) 55-65 (n=14) 66-75 (n=17)
Min 43.1 35.2 30.3 40
Max 114.2 113.0 111.0 93.0
Mean (SD) 66.66 (19.72) 65.91 (20.31) 56.68 (21.84) 66.67 (13.68)
TOTAL 66.32 (19.55) 62.16 (18.22)
Norms TMT B (Tombaugh, 2003)
Age 50-59 Age 60-64 Age 65-69 Age 70-74
68.74 (21.02) 64.59 (18.59) 67.12 (9.31) 86.27 (24.07)
Without the outliers, all groups are normally distributed: Inexperienced {55-65}, D(13)=0.163,
p=0.200 and inexperienced {66-75}, D(10)=0.137, p=0.200. Experienced {55-65},
D(12)=0.150, p=0.200 and experienced {66-75}, D(17)=0.163, p=0.200. Further analysis
shows the following effects:
Part B of the TMT (Fig.11) shows a significant interaction, but in this case, it is the younger
volunteers who benefit from the level of experience. There is no significant main effect of
experience F(1,49)=0.958, p=0.333 or age F(1,49)=0.963, p=0.331. However, the amount of
experience significantly interacts with age between the two age groups, F(1,49)=6.150,
p=0.032.
Descriptive statistic and norms are provided of the Part B of the TMT for all four groups. Total lists the mean
scores and standard deviation for inexperienced and experienced participants, irrespective of their age.
Published norms are provided for comparison.
Fig. 12 2x2 ANOVA results for TMT Part B
Property of University of EdinburghProperty of University of Edinburgh
31
4. Discussion
4.1. The Volunteers' Performance Compared to Published Norms
When Nelson and Willison (1991) restandardized their NART norms, they used a sample
of 182 participants from various social classes. Their mean score of errors was 18.8 (11.7)
which set the norm at 7-30 incorrectly read words. Converting the NART error score to
WAIS-R IQs predicts a Full Scale IQ of 107.4 (17.1) (Nelson & Willison, 1991). The
inexperienced and experienced volunteers of this study scored 5.88 (3.79), respectively 4.94
(3.21). This converts into Full Scale IQs ranging between 118 and 129, with the experienced
groups starting at a slightly higher IQ of 121. One of the shortcomings of NART is that it has
difficulties predicting higher IQs than 131, which is the maximum IQ that can be calculated
from a 0 error score (Nelson & Willison, 1991). Three of the participants in this study had
perfect scores and could very well have higher IQs than 131. Two conclusions can be drawn
from these results:
One is that the NART might be in need of another restandardization. IQ test scores, while
relatively stable within one generation, have been rising over time. This is often attributed to
the "Flynn effect". In the late 1980s, James R. Flynn collected various IQ tests from all over
the world to see how IQ scores changed during the 20th century. He published his study in
1987 and although it is still not quite clear what exactly causes IQs to change, the article led
to restandardizations of many tests, such as the NART in 1991 (Flynn, 1987; Deary & Batty,
2007). However, this has been almost 25 years ago and while WAIS is currently in its IV
edition, no new norms are provided for NART.
The second conclusion is that the volunteers from the University of Edinburgh's research
panel indeed have higher IQs than the average general public. Deviations from the norms on
the following tests further support this conclusion.
The norm for the GNT is 20.41 (4.1), ranging between 16.41 and 24.51 (Warrington, 1997).
The minimum scores of the volunteers, however, already start on 22 and reach maximum
scores of 30. Almost the same can be said about the DSCT scores. Throughout the groups
there is a tendency to start in the mid to higher ranges of the norms and go beyond them,
transcribing up to 30 more symbols within 120 seconds than norm and SD provided by
Wechsler (1997) suggest.
The ROCFT Immediate and Delayed Recall depict an even clearer picture. While the norms
for both parts are set around 15 (5), averaging between 10 and 20 points, the experienced
group has a mean of approximately 21 (6) and the inexperienced of 19 (7), scoring up to 7

Property of University of EdinburghProperty of University of Edinburgh
32
points more than what the normative data predicts (Fastenau et al., 1999).
Although the volunteers seem to perform better than the published norms, indicating that
they are not truly representing the "normal" population, not all the tests reflect this as clearly.
Little difference can be seen between the volunteers' scores and the norms for ACE (Hsieh et
al., 2013, Mioshi et al., 2006), TMT Part A and B (Tombaugh, 2003) or TEA (Robertson et al.,
1996). On the ADASCog, the inexperienced and experienced volunteers scored similar to the
norms, but individuals, especially in the {66-75}groups made almost twice as many errors
than what constitutes as normal according to Graham et al. (2004).
One possible explanation for the discrepancy could be that the published norms of these
studies are also based on volunteer panels and might be biased for similar reasons investigated
in this study. Graham et al. (2004) recruited their participants from a registry of normal senior
volunteers (Graham et al., 2004). Hsieh et al. (2013) do not clarify how they recruited their
controls. Mioshi et al. (2006) recruited theirs from the volunteer panel at the Medical
Research Council where the study was conducted and they were all family members of the
patient group (Misohi et al., 2006). For his normative study on the TMT, Tombaugh (2003)
reused individuals who participated in a series of experiments investigating age effects on
visual and verbal memory, as well as processing speed (Tombaugh, 2003). These volunteers
were repeatedly tested on exactly what the TMT A and B assesses. Robertson et al. (1996)
state that it was difficult to find volunteers whose IQ was below 100. Furthermore, practice
effect was discovered when the participants were repeatedly presented with the same version
of TEA and they suggest one should use alternative forms of the test (Robertson, et al., 1996).
In these four tests, all the normative data is based on control groups that were highly
experienced, either due to repeated testing or familiarity with the procedures. If the hypothesis
that experience has a positive effect on cognitive abilities holds true, there could have been
bias in all of these studies. The results of the analyses conducted on the eight tests shed light
onto what affects performance within the panel and how experience can improve cognitive
abilities.
4.2. Effects of Age, Experience and Interaction
Age is one of the key factors of cognitive decline across an adult's lifespan. For some
domains, decline already starts in the mid to late twenties. This especially holds true for
processing speed, executive functions and memory, namely the ability to encode information
into episodic memory, (Heden & Gabrieli, 2004; Deary, et al., 2009, Schaie, 1996). Other
domains, such as language and verbal abilities, remain relatively stable and only start to

Property of University of EdinburghProperty of University of Edinburgh
33
decline at later stages in life, (Schaie, 1996; Heden & Gabrieli, 2004). One would therefore
expect significant age effects on tests assessing the domains processing speed, executive
functions, attention, memory and possibly visuospatial processing, whereas IQ and language
domains should not show much of a difference between the two age groups. While the results
support this to a degree, not all domains react to age the way it is expected and the impact of
experience on performance should not be underestimated.
4.2.1. IQ and Language
The NART, which is used to determine pre-morbid IQ and is supposed to be resistant to
age-associated decline and impairment, proves to be reliable and shows no significant
difference between the four groups. Neither do the language subcategories of the ADASCog
and ACE-III. There are no significant main effects for age or experience, supporting the idea
that language abilities remain relatively stable at an older age. However, ADASCog and ACE
are designed to assess cognitive impairment and the tasks normally do not pose much of a
challenge for healthy adults. Therefore, results often show ceiling effects.
When investigating language, the GNT is the most meaningful test in this study, since it is
used to detect word finding difficulties and includes objects that are not quite as commonly
known as the ones in ACE. Somewhat surprisingly, the results show a main effect for age
F(1,54)=4.549, p=0.038. It only accounts for about 7.8% of the differences in scores, but a
clear decline with age can be seen in both inexperienced and experienced older groups. While
the level of experience does not influence performance, age has an impact on naming abilities
and increases word finding difficulties.
4.2.2. Attention
Further expected decline due to age can be seen in attention. Sustaining attention, tested
with the TEA 2, is no problem for the healthy volunteers used in this study and they all scored
maximum points on this task. TEA 3 is used to assess the ability to switch attention, focusing
on one tone and ignoring another. Here, age has a significant main effect on the two groups
with F(1,54)=6.822, p=0.012. The performance of the {66-75} groups declines by
approximately 2 points. Although both the experienced {55-65} and {66-75} groups score
slightly better than the inexperienced ones, this does not reach significance. The results of
TEA 5, which is also testing attention, are not significant. A reason for this could be that the
task is more complex than TEA 3, and the level of performance also depends on a number of
other factors, such as knowing more than one language or mathematical skills.
Property of University of EdinburghProperty of University of Edinburgh
34
An age-associated regression can also be noticed in the ACE subcategory Attention. It does
not quite reach significance, with F(1,54)=3.679, p=0.060, but this could be due to the fact
that the subcategories of ACE-III, similar to ADASCog, primarily assess simple tasks, such as
counting 7 away from 100 or stating dates and weekdays. The variance in scores of healthy
adults is therefore only minimal. This is also reflected in the ACE Total score which shows
that age has some effect, both inexperienced and experienced {66-75} groups scoring slightly
lower than the {55-65} groups, but it is not significant, with F(1,54)=3.153, p=0.081. There is
no main effect of experience or interaction in any of the tests assessing attention. Repeatedly
taking part in neuropsychological experiments does not seem to improve attention abilities.
4.2.2. Memory
Memory is a domain which should show clear age-associated decline. While most of the
tests indeed have significant effects of age, the level of experience plays a crucial role in the
{66-75} groups. On the ADASCog Total score, age has a significant main effect of
F(1,54)=10.732, p=0.002. Both inexperienced and experienced volunteers make more errors
in the {66-75} group than in the {55-65} group. However, the increase of errors is more
substantial in the inexperienced group, rising from 3.08 (2.14) to 7.79 (3.40), than in the
experienced group, which starts with a slightly higher error score of 4.92 (2.30), but only rises
up to 5.57 (3.09). Although experience by itself has no meaningful main effect, the interaction
between experience and age is significant with F(1,54)=6.149, p=0.016. The age-associated
decline is greater in the inexperienced group which score increases by 6 points on average.
The experienced group, on the other hand, almost remains the same, increasing by about 1
error. It is therefore possible to say that even though there is little difference between the two
younger groups, a higher level of experience can cause the age decline to stagnate.
The results of the ADASCog Total are mostly due to the ADASCog Memory subcategory,
since language, attention and executive function subcategories all show ceiling effects, with
only little variances. The ADAS Memory category, on the other hand, comprising of word
recall, delayed recall, recognition and instructions, shows an almost identical pattern to the
ADAS Total score. Although interaction does not quite reach significance, with
F(1,54)=3.537, p=0.065, a clear trend can be seen that the level of experience decreases the
magnitude of impact age has on memory.
A similar result can be seen on the ROCFT Immediate and Delayed Recall. Both tests are
used to assess visual memory and the analysis shows that experience significantly interacts
with age on the immediate recall task, with F(1,54)=6.150, p=0.016 and the delayed recall

Property of University of EdinburghProperty of University of Edinburgh
35
task, with F(1,54)=5.666, p=0.021. Although neither age nor experience by itself has a
significant effect, together, they show a most interesting picture. On both tests, the
inexperienced {55-65} group scores on average only 2 points better than the experienced {55-
65} group. The groups do not differ much at this stage. However, the inexperienced group
declines with age and the {66-75} year-olds' mean score is down from approximately 20.68
(5.43) to 16.45 (8.8). Contrary to this, the experienced {66-75} group increases their scores
from an average of 18.61 (5.83) to 22.68 (5.78). Instead of declining with age, like the
inexperienced group does, the experienced group is actually getting better. A higher level of
experience, therefore, significantly increases the visual memory abilities of the {66-75} group.
It can be concluded that frequently taking part in neuropsychological studies and experiments
has a positive effect on memory abilities.
4.2.4. Executive Functions
Experience does have a main effect, independently of age, on the cognitive domain of
executive functions which is utilized in problem solving, planning and task flexibility (Kipps
& Hodges, 2005). The ACE Fluency subcategory is the only one of the ACE-III subtests that
reaches a significant result for experience, with F(1,54)=7.689, p=0.008. It tests verbal
fluency and participants have to list words starting with one particular letter, and name as
many animals as possible, while being under time pressure. Both younger and older
experienced groups perform significantly better on this task than the inexperienced groups.
Furthermore, the test uses a cut-off and gives maximum scores to subjects listing more than
18 words and 22 animals. Many participants, however, were able to go beyond these limits
and it is possible that the difference between the experienced and inexperienced groups would
be even more significant.
Part B of the TMT is also used to assess executive functions. Participants have to switch
between letters and numbers, trying to connect them in an ascending order as quickly as
possible. Results show that there is a significant interaction between experience and age, with
F(1,49)=6.150, p=0.032. The scores are almost identical between the inexperienced and
experienced {66-75} groups. The {55-65} groups, however, differ by more than 10 seconds
from each other, with the experienced being faster than the inexperienced. It can be concluded
that a high level of experience has a positive effect on the performance of the {55-65} group,
but the advantage disappears in the {66-75} group.
Executive functions are known to decline with age, yet there is no main effect for age on
TMT Part B. The inexperienced groups remain on approximately 66 seconds with a SD of ca.

Property of University of EdinburghProperty of University of Edinburgh
36
20. It is only the experienced groups that decline slightly with age. It is possible that
frequently participating in experiments only has a positive impact on executive functions up
to a certain age, after which the age-associated decline sets in more prominently.
4.2.5. Processing Speed and Visuospatial Processing
Processing speed should also be affected by age. The tests used to assess this domain, such
as the TMT A and B or the DSCT, however, show no significant results in this study. The
DSCT does indicate a strong trend that age has an impact on performance, with age
F(1,53)=3.784, p=0.057, but one would have suspected a more prominent result. Reasons for
this could be that both tests also rely on visuospatial abilities and neither the ROCFT nor any
of the ADAS and ACE subcategories showed significant results for this domain. This could
mean that visuospatial abilities are not as much affected by age. Another possibility is that the
sample sizes are not extensive enough to reach significance.
5. Conclusion
Overall, volunteers from the University of Edinburgh's research panel seem to perform
better than what normative data suggest, indicating that panels are not always good
representatives of the general public. Within the panel, the experienced volunteers performed
better than the inexperienced. Not all the results reached significance, however, further
research with larger samples could rectify this. The level of experience does have a
meaningful impact on memory and executive functions. Frequently taking part in
neuropsychological experiments improves memory abilities, especially at the later age of 66
to 75. Executive functions are clearly better at a younger age, and in case of verbal fluency,
remain significantly improved even at an older age. This leads to the conclusion that the
experienced volunteers are better, not only due to practice effect and familiarity with the tests,
but also because the repeated exposure to neuropsychological assessments improves their
cognitive abilities. The fact that experienced volunteers perform significantly better on a
number of cognitive assessments has to be considered when using volunteer panels in future.

Property of University of EdinburghProperty of University of Edinburgh
References:
Bartels, C., Wegrzyn, M., Wiedl, A., Ackermann, V., & Ehrenreich, H. (2010). Practice
effects in healthy adults: A longitudinal study on frequent repetitive cognitive testing. BMC
Neuroscience, 11:118.
Beglinger, L. J., Gaydos, B., Tangphao-Daniels, O., Duff, K., Kareken, D. A., Crawford, J., et
al. (2005). Practice effects and the use of alternate forms in serial neuropsychological testing.
Archives of Clinical Neuropsychology, 20, 517-529.
Benedict, R. H., & Zgaljardic, D. J. (1998). Practice Effects During Repeated Administration
of Memory Tests With and Without Alternate Forms. Journal of Clinical and Experimental
Neuropsychology, Vol.20(3), 339-352.
Benett-Levy, J. (1984). Determinants of performance on the Rey-Osterrieth Complex Figure
Test: An analysis, and a new technique for single-case assessment. British Journal of Clinical
Psychology, 23, 109-119.
Caselli, R. J., Reiman, E. M., Locke, D. E., Hutton, M. L., & Hentz, J. G. (2007). Cognitive
Domain Decline in Healthy Apolipoprotein E4 Homozygotes Before the Diagnosis of Mild
Cognitive Impairment. Arch Neurol., 64 (9), 1306-1311.
Chan, R. C. (2000). Attentional deficits in patients with closed head injury: a further study to
the discriminative validity of the test of everyday attention. Brain Injury, Vol.14(3), 227-236.
Corrigan, J. D., & Hinkeldey, N. S. (1987). Relationships Between Parts A and B of the Trail
Making Test. Journal of Clinical Psychology, Vol.43(4), 402-409.
Crowe, S. F., Benedict, T., Enrico, J., Mancuso, N., Matthews, C., & Wallace, J. (1999).
Cognitive Determinants of Performance on the Digit Symbol-coding Test, and the Symbol
Search Test of the WAIS-III, and the Symbol Digit Modalities Test: An Analysis in the
Healthy Sample. Australian Psychologist (34), 204-210.
Deary, I. J., & Batty, G. D. (2007). Cognitive epidemiology. Journal of Epidemiology &
Community Health, 61(5), 378-384.
Deary, I. J., Corley, J., Gow, A. J., Harris, S. E., Houlihan, L. M., Marioni, R. E., et al. (2009).
Age-associated cognitive decline. British Medical Bulletin, 92(1), 135-152.
Fastenau, P. S., Denburg, N. L., & Hufford, B. J. (1999). Adult Norms for the Rey-Osterrieth
Complex Figure Test and for Supplemental Recognition and Matching Trials: from the
Extended Complex Figure Test. The Clinical Neuropsychologist, 13:1, 30-47.
Flynn, J. R. (1987). Massive IQ Gains in 14 Nations: What IQ Tests Really Measure.
Psychological Bulleting , Vol.101(2), 171-191.
Giles, E., Patterson, K., & Hodges, J. R. (1996). Performance on the Boston Cookie theft
picture description task in patients with early dementia of the Alzheimer's type: Missing
information. Aphasiology, 10:4, 395-408.
Giovagnoli, A., Del Pesce, M., Mascheroni, S., Simoncelli, M., Laiacona, M., & Capitani, E.
(1996). Trail Making Test: normative values from 287 normal adult controls. The Italian
Journal of Neurological Sciences, 17, 305-309.

Property of University of EdinburghProperty of University of Edinburgh
Goodglass, H., & Kaplan, E. (1983). The Assessment of Aphasia and Related Disorders (2nd
ed.). Philadelphia, PA: Lea & Febiger.
Graham, D. P., Cully, J. A., Snow, A. L., Massman, P., & Doody, R. (2004). The Alzheimer's
Disease Assessment Scale - Cognitive Subscale: Normative Data for Older Adult Controls.
Alzheimer Disease and Associated Disordorders, Vol.18(4), 236-240.
Graham, N. L., Emery, T., & Hodges, J. R. (2004). Distinctive cognitive profiles in
Alzheimer’s disease and subcortical vascular dementia. Journal of Neurology, Neurosurgery
& Psychiatry , 75, 61-71.
Hsieh, S., Schubert, S., Hoon, C., Mioshi, E., & Hodges, J. R. (2013). Validation of the
Addenbrooke's Cognitive Examination III in Frontotemporal Dementia and Alzheimer's
Disease. Dementia and Geriatric Cognitive Disorders, 36(3-4), 242-250.
Joy, S., Fein, D., & Kaplan, E. (2003). Decoding Digit Symbol: Speed, Memory, and Visual
Scanning. Assessment, Vol.10(1), 56-65.
Kipps, C. M., & Hodges, J. R. (2005). Cognitive Assessment For Clinicians. J Neurol
Neurosurg Psychiatry, 76 (Suppl I), i22-i30.
Krenk, L., Rasmussen, L. S., Siersma, V. D., & Kehlet, H. (2012). Short-term practice effects
and variability in cognitive testing in a healthy elderly population. Experimental Gerontology,
47, 432-436.
MacPherson, S. E., Turner, M. S., Bozzali, M., Cipolotti, L., & Shallice, T. (2010). Frontal
subregions mediating Elevator Counting task performance. Neuropsychologia, 48, 3679-3682.
Mathuranath, P. S., Nestor, P. J., Berrios, G. E., Rakowicz, W., & Hodges, J. R. (2000). A
brief cognitive test battery to differentiate Alzheimer's disease and frontotemporal dementia.
Neurology, 55, 1613-1620.
McKenna, P., & Warrington, E. K. (1980). Testing for nominal dyshpasia. Journal of
Neurology, Neurosurgery, and Psychiatry, 43, 781-788.
Meyers, J. E., & Meyers, K. R. (1995). Rey complex figure test under four different
administration procedures. The Clinical Neuropsychologist, Vol.9 (1), 63-67.
Mioshi, E., Dawson, K., Mitchell, J., Arnold, R., & Hodges, J. R. (2006). The Addenbrooke's
Cognitive Examination Revised (ACE-R): a brief cognitive test battery for dementia
screening. International Journal of Geriatric Psychiatry, 21, 1078-1085.
Nelson, H. E., & Willison, J. (1991). The Revised National Adult Reading Test (2nd ed.).
Windsor, UK: The NFER-Nelson Publishing Company Ltd.
Osterrieth, P. A. (1944). Le test de copie d'une figure complexe: contribution à l'étude de la
perception et la mémoire. Archives de Psychologie, 30, 286-356.
Patel, M. X., Doku, V., & Tennakoon, L. (2003). Challenges in recruitment of research
participants. Advances in Psychiatric Treatment, 9, 229-238.
Reitan, R. M. (1958). Validity of the Trail Making Test as an indicator of organic brain
damage. Perceptual and Motor Skills, 8, 271-276.
Rey, A. (1941). L'examen psychologique dans les cas d'encéphalopathie traumatique.
Archives de Psychologie, 28, 286-340.

Property of University of EdinburghProperty of University of Edinburgh
Robertson, I.H., Ward, T., Ridgeway, V., & Nimmo-Smith, I. (1994). The test of everyday
attention: TEA. Bury St. Edmunds,, UK: Thames Valley Test Company.
Robertson, I. H., Ward, T., Ridgeway, V., & Nimmo-Smith, I. (1996). The structure of normal
human attention: The Test of Everyday Attention. Journal of the International
Neuropsychological Society, 2, 525-534.
Rosen, W., Mohs, R., & Davis, K. (1984). A new rating scale for Alzheimer's disease. Am J
Psychiatry, 141, 1356-1364.
Salthouse, T. A. (1992). What Do Adult Age Differences in the Digit Symbol Substitution
Test Reflect? Journal of Gerontology: PSYCHOLGOCIAL SCIENCES, Vol.47(3), 121-128.
Schaie, K. (1996). Intellectual development in adulthood. Handbook of the psychology of
aging, 4, 266--286.
Schechter, D., Singer, T. M., Kuperman, J., & Endicott, J. (1998). Selection of ‘normal’ control subjects for psychiatric research: update on a model for centralized recruitemnt.
Psychiatry Research, 79, 175-185.
Schechter, D., Strasser, T. J., Santangelo, C., Kim, E., & Endicott, J. (1994). "Normal"
Control Subjects Are Hard to Find: A Model for Centralized Recruitment. Psychiatry
Research, 53, 301-311.
Shtasel, D. L., Gur, R. E., Mozley, P. D., Richards, J., Taleff, M. M., Heimberg, C., et al.
(1991). Volunteers for Biomedical Research: Recruitment and Screening of Normal Controls.
Archives of General Psychiatry, 48, 1022-1025.
Tombaugh, T. N. (2004). Trail Making Test A and B: Normative data stratified by age and
education. Archives of Clinical Neuropsychology, 19, 203-214.
Troyer, A. K., & Wishart, H. A. (1997). A Comparison of Qualitative Scoring Systems for the
Rey-Osterrieth Complex Figure Test. The Clinical Neuropsychologist, Vol.11(4), 381-390.
Warrington, E. K. (1997). The Graded Naming Test: A Restandardisation.
Neuropsychological Rehabiltation: An International Journal, 7:2, 143-146.
Wechsler, D. (1997). WAIS-III: Administration and scoring manual. San Antonio: The
Psychological Corporation.
URL:
Alzheimer's Society. (2014). Younger people with dementia. Retrieved from
http://www.alzheimers.org.uk/site/scripts/documents_info.php?documentID=164.