Water–saving ground cover rice production system reduces net greenhouse gas fluxes in an annual...
16
Biogeosciences, 11, 1–16, 2014 www.biogeosciences.net/11/1/2014/ doi:10.5194/bg-11-1-2014 © Author(s) 2014. CC Attribution 3.0 License. Water-saving ground cover rice production system reduces net greenhouse gas fluxes in an annual rice-based cropping system Z. Yao 1 , Y. Du 1 , Y. Tao 2 , X. Zheng 1 , C. Liu 1 , S. Lin 2 , and K. Butterbach-Bahl 3 1 State Key Laboratory of Atmospheric Boundary Layer Physics and Atmospheric Chemistry, Institute of Atmospheric Physics, Chinese Academy of Sciences, Beijing 100029, China 2 College of Resource and Environmental Science, China Agricultural University, Beijing 100193, China 3 Institute for Meteorology and Climate Research, Atmospheric Environmental Research, Karlsruhe Institute of Technology, 82467 Garmisch-Partenkirchen, Germany Correspondence to: C. Liu ([email protected]) Received: 1 April 2014 – Published in Biogeosciences Discuss.: 13 June 2014 Revised: 3 October 2014 – Accepted: 9 October 2014 – Published: Abstract. To safeguard food security and preserve pre- cious water resources, the technology of water-saving ground cover rice production system (GCRPS) is being increasingly adopted for rice cultivation. However, changes in soil water status and temperature under GCRPS may affect soil biogeo- chemical processes that control the biosphere–atmosphere exchanges of methane (CH 4 ), nitrous oxide (N 2 O) and car- bon dioxide (CO 2 ). The overall goal of this study is to bet- ter understand how net ecosystem greenhouse gas exchanges (NEGE) and grain yields are affected by GCRPS in an an- nual rice-based cropping system. Our evaluation was based on measurements of the CH 4 and N 2 O fluxes and soil het- erotrophic respiration (CO 2 emissions) over a complete year, and the estimated soil carbon sequestration intensity for six different fertilizer treatments for conventional paddy and GCRPS. The fertilizer treatments included urea application and no N fertilization for both conventional paddy (CUN and CNN) and GCRPS (GUN and GNN), and solely chicken manure (GCM) and combined urea and chicken manure ap- plications (GUM) for GCRPS. Averaging across all the fer- tilizer treatments, GCRPS increased annual N 2 O emission and grain yield by 40 and 9%, respectively, and decreased annual CH 4 emission by 69 %, while GCRPS did not af- fect soil CO 2 emissions relative to the conventional paddy. The annual direct emission factors of N 2 O were 4.01, 0.09 and 0.50% for GUN, GCM and GUM, respectively, and 1.52 % for the conventional paddy (CUN). The annual soil carbon sequestration intensity under GCRPS was estimated to be an average of -1.33 Mg C ha -1 yr -1 , which is approxi- mately 44% higher than the conventional paddy. The annual NEGE were 10.80–11.02 Mg CO 2 -eq ha -1 yr -1 for the con- ventional paddy and 3.05–9.37 Mg CO 2 -eq ha -1 yr -1 for the GCRPS, suggesting the potential feasibility of GCRPS in re- ducing net greenhouse effects from rice cultivation. Using organic fertilizers for GCRPS considerably reduced annual emissions of CH 4 and N 2 O and increased soil carbon seques- tration, resulting in the lowest NEGE (3.05–5.00 Mg CO 2 - eq ha -1 yr -1 ). Accordingly, water-saving GCRPS with or- ganic fertilizer amendments was considered the most promis- ing management regime for simultaneously achieving rela- tively high grain yield and reduced net greenhouse gas emis- sion. 1 Introduction Atmospheric methane (CH 4 ), nitrous oxide (N 2 O) and car- bon dioxide (CO 2 ) are key compounds in biogeochemi- cal carbon and nitrogen cycling, thereby playing important roles for atmospheric chemistry and climate change (IPCC, 2007). Agriculture, without considering land use change, has been estimated to contribute approximately 10–12 % of the total global anthropogenic emissions of greenhouse gases (GHGs), which accounts for about 50 and 60 % of global CH 4 and N 2 O emissions, respectively (Smith et al., 2007). In agricultural soils, these GHGs are all produced or consumed as a result of soil microbial processes, but the magnitude of the fluxes depends heavily on agricultural systems (Linquist Published by Copernicus Publications on behalf of the European Geosciences Union.
-
Upload
independent -
Category
Documents
-
view
1 -
download
0
Transcript of Water–saving ground cover rice production system reduces net greenhouse gas fluxes in an annual...

Biogeosciences, 11, 1–16, 2014
www.biogeosciences.net/11/1/2014/
doi:10.5194/bg-11-1-2014
© Author(s) 2014. CC Attribution 3.0 License.
Water-saving ground cover rice production system reduces net
greenhouse gas fluxes in an annual rice-based cropping system
Z. Yao1, Y. Du1, Y. Tao2, X. Zheng1, C. Liu1, S. Lin2, and K. Butterbach-Bahl3
1State Key Laboratory of Atmospheric Boundary Layer Physics and Atmospheric Chemistry,
Institute of Atmospheric Physics, Chinese Academy of Sciences, Beijing 100029, China2College of Resource and Environmental Science, China Agricultural University, Beijing 100193, China3Institute for Meteorology and Climate Research, Atmospheric Environmental Research, Karlsruhe
Institute of Technology, 82467 Garmisch-Partenkirchen, Germany
Correspondence to: C. Liu ([email protected])
Received: 1 April 2014 – Published in Biogeosciences Discuss.: 13 June 2014
Revised: 3 October 2014 – Accepted: 9 October 2014 – Published:
Abstract. To safeguard food security and preserve pre-
cious water resources, the technology of water-saving ground
cover rice production system (GCRPS) is being increasingly
adopted for rice cultivation. However, changes in soil water
status and temperature under GCRPS may affect soil biogeo-
chemical processes that control the biosphere–atmosphere
exchanges of methane (CH4), nitrous oxide (N2O) and car-
bon dioxide (CO2). The overall goal of this study is to bet-
ter understand how net ecosystem greenhouse gas exchanges
(NEGE) and grain yields are affected by GCRPS in an an-
nual rice-based cropping system. Our evaluation was based
on measurements of the CH4 and N2O fluxes and soil het-
erotrophic respiration (CO2 emissions) over a complete year,
and the estimated soil carbon sequestration intensity for six
different fertilizer treatments for conventional paddy and
GCRPS. The fertilizer treatments included urea application
and no N fertilization for both conventional paddy (CUN
and CNN) and GCRPS (GUN and GNN), and solely chicken
manure (GCM) and combined urea and chicken manure ap-
plications (GUM) for GCRPS. Averaging across all the fer-
tilizer treatments, GCRPS increased annual N2O emission
and grain yield by 40 and 9 %, respectively, and decreased
annual CH4 emission by 69 %, while GCRPS did not af-
fect soil CO2 emissions relative to the conventional paddy.
The annual direct emission factors of N2O were 4.01, 0.09
and 0.50 % for GUN, GCM and GUM, respectively, and
1.52 % for the conventional paddy (CUN). The annual soil
carbon sequestration intensity under GCRPS was estimated
to be an average of−1.33 Mg C ha−1 yr−1, which is approxi-
mately 44 % higher than the conventional paddy. The annual
NEGE were 10.80–11.02 Mg CO2-eq ha−1 yr−1 for the con-
ventional paddy and 3.05–9.37 Mg CO2-eq ha−1 yr−1 for the
GCRPS, suggesting the potential feasibility of GCRPS in re-
ducing net greenhouse effects from rice cultivation. Using
organic fertilizers for GCRPS considerably reduced annual
emissions of CH4 and N2O and increased soil carbon seques-
tration, resulting in the lowest NEGE (3.05–5.00 Mg CO2-
eq ha−1 yr−1). Accordingly, water-saving GCRPS with or-
ganic fertilizer amendments was considered the most promis-
ing management regime for simultaneously achieving rela-
tively high grain yield and reduced net greenhouse gas emis-
sion.
1 Introduction
Atmospheric methane (CH4), nitrous oxide (N2O) and car-
bon dioxide (CO2) are key compounds in biogeochemi-
cal carbon and nitrogen cycling, thereby playing important
roles for atmospheric chemistry and climate change (IPCC,
2007). Agriculture, without considering land use change, has
been estimated to contribute approximately 10–12 % of the
total global anthropogenic emissions of greenhouse gases
(GHGs), which accounts for about 50 and 60 % of global
CH4 and N2O emissions, respectively (Smith et al., 2007). In
agricultural soils, these GHGs are all produced or consumed
as a result of soil microbial processes, but the magnitude of
the fluxes depends heavily on agricultural systems (Linquist
Published by Copernicus Publications on behalf of the European Geosciences Union.

2 Z. Yao et al.: Water-saving ground cover rice production system
et al., 2012). Aerobic upland agricultural systems primarily
release N2O and contribute little to the global atmospheric
CH4 budget (e.g., Adviento-Borbe et al., 2007; Wang et al.,
2011), while paddy field and irrigated lowland rice cultiva-
tion systems are known to be significant sources of atmo-
spheric CH4, and also N2O (e.g., Cai et al., 1997; Shang et
al., 2011; Yao et al., 2012). Across 62 study sites and 328
observations worldwide, Linquist et al. (2012) estimated that
the aggregate emission of CH4 and N2O in rice production
systems was approximately 4 times higher than that of either
upland wheat or maize systems, suggesting greater mitiga-
tion opportunities for rice systems. Therefore, measurements
of GHG fluxes from different rice-based cropping systems
are of regional and global significance.
Rice is the major staple food of more than 3 billion peo-
ple worldwide, accounting for approximately 20 % of their
overall energy intake (FAO, 2011). To meet the food demand
of a growing population, an annual increase in rice produc-
tion in the range of 8–10 million tons is needed over the
next 20 years (Liu et al., 2013). Meanwhile, because of in-
tensified competition for freshwater resources between agri-
cultural and industrial development and as a result of rapid
urbanization, it is anticipated that by 2025 approximately
15–20 million hectares of irrigated rice will suffer from wa-
ter scarcity (Bouman, 2007). Overall, food security in the
world is challenged by increasing food demand and threat-
ened by declining water availability, and thus, a number of
studies on water-saving irrigation management for rice pro-
duction systems have been carried out (e.g., Bouman and
Tuong, 2001; Belder et al., 2004; Qu et al., 2012; Hou et
al., 2012). However, the majority of these experiments were
only focused on water use efficiency and rice productivity,
and little is known about the influences of management prac-
tices on GHG emissions from rice-based cropping systems.
Accordingly, it is still unresolved if increased rice yields can
be obtained at lower environmental costs, i.e., decreased ir-
rigation water demand and at the same time decreased GHG
emissions (Bouman et al., 2006).
China is the world’s largest rice producer, contributing
approximately 35 % of the total global rice production (Qu
et al., 2012). Moreover, with regard the amount of irriga-
tion water, China is the second biggest consumer in the
world, with water use in the agricultural sector accounting
for 62 % of total freshwater use (Wang et al., 2012). Further-
more, agriculture in China is thought to be a major source
of national GHG emissions, which is responsible for approx-
imately 17–20 % of annual anthropogenic GHG emissions
(Wang et al., 2012). It is generally recognized that water
management is one of the most important practices that im-
pact CH4 and N2O emissions as well as grain yields in rice
paddy fields (e.g., Minamikawa and Sakai, 2005; Kreye et
al., 2007; Qin et al., 2010; Yang et al., 2012). Keeping rice
paddies continuous waterlogged requires the consumption of
large amounts of water (approximately 3000–5000 L kg−1 of
grain, Bouman et al., 2002), and results in huge CH4 emis-
sions (approximately 24 g CH4 kg−1 of grain, Linquist et al.,
2012). In contrast, the management of mid-season drainage,
which causes anaerobic and aerobic alternation in paddy
fields, is considered to be an effective option for reducing
CH4 emissions and exerting a positive impact on rice yields
(e.g., Cai et al., 1997; Yan et al., 2003; Zou et al., 2005a).
Meanwhile, intermittent irrigation with mid-season drainage
is the standard procedure of Chinese farmers, and the in-
troduction of this technology at the end of the last century
onwards has helped to significantly reduce CH4 emissions
from paddy fields (e.g., Yan et al., 2009). However, irriga-
tion water demand for paddy rice cultivation still remains
high, and it is estimated that at current levels of water usage
in China, the annual total water shortage is approximately
30–40 billion m3, and by 2050 the total water deficit could
reach 400 billion m3, representing about 80 % of the current
annual capacity (Liu et al., 2013).
Considering the decreasing water availability for agri-
culture and the increasing demand for rice production,
water-saving management practices have become part of the
China’s most important policies (Hou et al., 2012), and vari-
ous water-saving technologies have been proposed and prac-
ticed in the paddy fields (e.g., Xu et al., 2004; Kreye et al.,
2007, Yang et al., 2012). One of the most promising tech-
nologies to overcome water scarcity and temperature limita-
tions in rice cultivation, the latter being specifically a prob-
lem in mountainous and rice-producing regions in the north
of China, is named the ground cover rice production system
(GCRPS). For the GCRPS practice, the soil surface is cov-
ered with a thin plastic film to reduce evaporation and in-
crease soil temperature. The technology allows growing tra-
ditional lowland rice cultivars at nearly saturated soil condi-
tions with no standing water. This practice has been proven
to reduce irrigation water demand by 40–60 % and increas-
ing rice yields at long-term experimental sites by on average
10 % (Qu et al., 2012) and at the regional scale by approxi-
mately 18 % (Liu et al., 2013).
GCRPS technology was first tested approximately 2
decades ago; it is now widely disseminated and practiced in
more than 4 million hectares in several provinces of China
such as Hubei, Sichuan, Ningxia and Heilongjiang. How-
ever, changing soil conditions from permanently flooded to
saturated, and covering the soil with a thin plastic film has
consequences for soil temperature and redox potential (Eh).
Both environmental factors are expected to lead to changes
in soil biogeochemical cycling of C and N. For example,
the increase in soil Eh under GCRPS (Liu et al., 2013) is
anticipated to reduce CH4 emissions. However, the practice
that enhances soil temperature and aeration status may result
in increased N2O emissions (Wang et al., 2011) and min-
eralization rates of soil organic carbon (Qu et al., 2012),
which may offset or overshadow the positive effects which
can be achieved with regard to reductions in CH4 emissions.
Consequently, a comprehensive assessment of the impact of
GCRPS on GHG fluxes needs to take into account CH4 and
Biogeosciences, 11, 1–16, 2014 www.biogeosciences.net/11/1/2014/
Tao Yueyue
高亮

Z. Yao et al.: Water-saving ground cover rice production system 3
Table 1. Field management practices for different fertilizer treatments in the conventional paddy and ground cover rice production systems
over the rice-growing season of 2011.
N application rate (kg N ha−1)
Treatmenta Urea Chicken Total Water managementb Transplanting
manure and harvest date
Conventional paddy
CNN 0 0 0 F-D-F 29 Apr and 22 Sep 2011
CUN 150 0 150 F-D-F 29 Apr and 22 Sep 2011
Ground cover rice production system (GCRPS)
GNN 0 0 0 Moist but no standing water 29 Apr and 22 Sep 2011
GUN 150 0 150 Moist but no standing water 29 Apr and 22 Sep 2011
GCM 0 150 150 Moist but no standing water 29 Apr and 22 Sep 2011
GUM 75 75 150 Moist but no standing water 29 Apr and 22 Sep 2011
a CNN, the control that received no N fertilizer under conventional paddy; CUN, urea application at a common rate of 150 kg N ha−1
under conventional paddy; GNN, the control that received no N fertilizer under GCRPS; GUN, urea application at a common rate of
150 kg N ha−1 under GCRPS; GCM, solely chicken manure application at a common rate of 150 kg N ha−1 under GCRPS; GUM, urea
and chicken manure (1 : 1 nitrogen basis) (75 kg N ha−1 and 75 kg N ha−1) under GCRPS. b F, flooding; D, mid-season drainage.
N2O emissions simultaneously and, in some cases, soil car-
bon sequestration changes. Failure to include one or more of
these aspects may lead to biased views and misleading evalu-
ations of this practice. To our knowledge, a few studies have
conducted short-term (only during the rice-growing season)
measurements of CH4 and N2O fluxes under GCRPS (Dittert
et al., 2002; Xu et al., 2004; Kreye et al., 2007), but so far no
study available has quantified the effects of GCRPS on the
net greenhouse effects at the annual scale.
In response to these research needs, we launched a case
study in which CH4 and N2O fluxes, soil respiration (CO2)
emissions and rice yields were measured simultaneously in
an annual rice-based cropping system under conventional
paddy and GCRPS practices. The main objectives of this
study were to (a) characterize and quantify the CH4, N2O
and CO2 fluxes and the direct emission factors of fertilizer N
across the annual rice–fallow systems, (b) better understand
the key regulating factors on CH4, N2O and CO2 fluxes from
two contrasting practices, and (c) assess the efficacy of water-
saving GCRPS technique to minimize the net greenhouse ef-
fects while sustaining crop yield.
2 Materials and methods
2.1 Site description and field experiment
Our field measurements were performed in paddy fields
(32◦38′ N, 110◦37′ E, approx. 234 m above sea level) in
the city of Shiyan, Hubei province, central China, where
GCRPS was introduced in the 1990s and is now widely
applied by local farmers because of water and tempera-
ture limitations for rice cultivation (Zhou et al., 2008). The
field site is on the bottom of a small valley, which is lo-
cated in a typical hilly agricultural area, where cropping
regime is primarily dominated by annual rice paddy-fallow
system. The region is exposed to the northern subtropi-
cal monsoon climate, with an annual mean air temperature
of 15.3 ◦C, an annual average rainfall of 834 mm, an an-
nual total sunshine of 1835 h and a frost-free period of 234
days. The topsoil (0–15 cm) of the experimental farm is of
a sandy loam texture with 5.2± 0.7 % clay (< 0.002 mm),
33.7± 2.5 % silt (0.002–0.02 mm) and 61.1± 3.2 % sand
(0.02–2 mm); it has a pH value of 6.2, an organic car-
bon content of 10.3± 1.3 g kg−1, total nitrogen content of
1.18± 0.07 g kg−1 and a bulk density of 1.30± 0.04 g cm−3.
As a result of long-term conventional tillage practices, soils
at the field site have developed a compact plough pan layer at
approximately 20 cm depth, which may substantially inhibit
water infiltration while favoring lateral flow.
In the present study, we investigated six fertilizer treat-
ments under the two rice production systems (Table 1): two
fertilizer treatments for the conventional paddy (i.e., CNN:
no nitrogen fertilization as a control and CUN: urea applied
at a common rate) and four fertilizer treatments in GCRPS
(i.e., GNN: no nitrogen fertilization as a control, GUN: urea
applied at a common rate, GCM: chicken manure applied at
a common N rate, and GUM: urea plus chicken manure at
1 : 1 nitrogen basis). Since our previous studies in the Jiangsu
province showed that the use of organic matter in conven-
tional paddy rice production systems leads to increased net
GHG emissions (Yao et al., 2013a), only the treatments with
urea application and the control were established for the con-
ventional paddy (i.e., CNN and CUN). The treatments were
arranged in a completely randomized block design with three
replications (each plot with a size of 5 m× 8 m), giving a to-
tal of 18 plots. All plots were completely isolated by levees
www.biogeosciences.net/11/1/2014/ Biogeosciences, 11, 1–16, 2014
4 Z. Yao et al.: Water-saving ground cover rice production system
with plastic coverings. The total N content and C : N ratio of
the applied chicken manure were 1 % and 13.6, respectively.
Fertilizer, organic, inorganic or a mix of both, was applied
once as basal fertilization at a rate of 150 kg N ha−1 just be-
fore rice transplanting. In addition, all treatments received
45 kg P2O5 ha−1 and 45 kg K2O ha−1 as basal fertilizers in
the forms of Ca(H2PO4)2 and KCl, respectively. In agree-
ment with the local water regime, the experimental plots
of conventional paddy were under a cycle of flooding/mid-
season drainage/frequent waterlogging with intermittent irri-
gation (F-D-F). In the present study, the mid-season drainage
started on 25 June and ended on 30 June, and the period of fi-
nal drainage was from 11 August to the end of rice-growing
season (Fig. 1). For GCRPS, to realize the goal of saving
water and simultaneously satisfying rice growth, each plot
was further separated into three raised beds (width 1.4 and
length 7.6 m) surrounded by 0.2 wide and 0.15 m deep fur-
rows that were filled with water to maintain soil water content
near saturation. Each raised bed in GCRPS was covered with
a 0.005 mm thick and 1.7 m wide transparent polyethylene
plastic film, and then holes were punched in plastic film us-
ing a special puncher for the transplantation of rice seedlings.
In the GCRPS plots, irrigation was applied in the furrows
only to keep soil moist with no standing water on the raised
beds. It should be noted that when the mid-season and final
drainage were practiced in the conventional paddy, irrigation
was also not applied in the GCRPS during these periods. Af-
ter rice harvest, the rice straw was completely harvested and
removed and all field plots were kept fallow over the winter
period. During the fallow period, the local farmers usually
collected the plastic film from the GCRPS plots, and then
plowed all of the experimental fields to control weeds and
insects.
2.2 Measurements of GHGs fluxes
The CH4 and N2O fluxes along with soil CO2 emissions
were measured in situ using static opaque manual gas sam-
pling chambers (Yao et al., 2009) over the entire rice–fallow
rotation under conventional paddy and GCRPS practices
from May 2011 to April 2012. During the rice-growing
season, to better evaluate the CH4 and N2O fluxes under
GCRPS, two sizes of rectangular stainless-steel frames of
0.65 m width× 0.90 m length× 0.15 m height and 0.20 m
width× 0.30 m length× 0.20 m height were inserted into the
soils of the raised bed and furrow, respectively, before rice
transplanting in each plot. In order to keep conditions inside
the frame as similar to the actual field status of the raised
bed in GCRPS, the soil inside the frame was also covered by
plastic film with two rows of transplanting holes with a diam-
eter of 3 cm every 16 cm along the raised bed. The top edge
of the frame had a water groove, which fit exactly to the rim
of the top chamber, and the gas-tight seal was ensured by fill-
ing the groove with water. For the conventional paddy, only
one frame of 0.65 m width× 0.90 m length× 0.15 m height
38
0
15
30
45
60
40
60
80
100
-200
0
200
400
600
800d
Conventional paddy
GCRPS
So
il E
h (
mv)
0
2
4
6 c Conventional paddy
GCRPS
Fallow season
Apr.30Feb.30Dec.30Oct.30Aug.30Jun.30Apr.30
Flo
od
wa
ter
(cm
)
Rice season
0
10
20
30
40b Conventional paddy
GUN
GCM
So
il te
mp
era
ture
(C
)
0
10
20
30
40
Precipitation
Air temperature
Air
te
mp
era
ture
(C
)
a
Pre
cip
ita
tio
n (
mm
d-1)
WF
PS
(%
)
Fig. 1.
Figure 1. The dynamics of (a) daily precipitation and mean air
temperature, (b) daily mean soil temperature for the conventional
paddy and ground cover rice production system (GCRPS) with urea
(GUN) and chicken manure (GCM) applications, (c) floodwater
depth during the rice-growing season for the conventional paddy
and water-filled pore space (WFPS) at 0–6 cm soil depth and (d) soil
redox potential (Eh, mean ± standard error) at a depth of 10 cm for
the conventional paddy and GCRPS during the rice–fallow rotation
cycle of 2011–2012.
was put into the soil for each plot. To assess CO2 emis-
sions from the bare soils of conventional paddy and GCRPS
plots, a square stainless-steel frame with an area of 0.25 m2
was driven into the soil to a depth of 0.40 m so as to in-
hibit outside root access, and maintained the bare soil in-
side throughout the rice-growing season. Based on the types
of frames, three different sizes of insulated chambers (i.e.,
with a bottom area of 0.65 m× 0.90 m and a height of 0.50
or 1.0 m depending on crop growth, a 0.20 m width× 0.30 m
length× 0.30 m height, and a bottom area of 0.50 m× 0.50 m
and a height of 0.50 m) were used for gas samplings. These
chambers were covered with reflective material to (i.e., foil)
reduce absorption of sunlight and had a hole of 2 cm diame-
ter in the top panel for equilibrating the pressure during the
placement of them on the water groove of frames. This hole
was kept closed during the air sampling by using a pressure
balance tube which was determined in terms of the descrip-
tion of Hutchinson and Mosier (1981). During the fallow pe-
riod, the frames both in the furrows and in the bare soils were
removed because all field plots were drained and kept bare.
That is, only one size of frame with width 0.65 m× length
0.90 m× height 0.15 m was maintained in place throughout
the fallow season, except when it was removed for tillage on
4 January 2012, and thus, the fluxes of CH4, N2O and CO2
were measured from the same chambers during the fallow
period.
Biogeosciences, 11, 1–16, 2014 www.biogeosciences.net/11/1/2014/

Z. Yao et al.: Water-saving ground cover rice production system 5
On each sampling day, chambers were temporarily
mounted onto the frames, and gas samples for CH4, N2O
and CO2 detection were taken with a 60 mL polypropylene
syringe at 0, 10, 20, 30 and 40 min after covering. During the
gas collection, the air temperature inside the chamber was
monitored using a digital thermometer (JM624, Tianjin Jin-
ming Instrument Co. Ltd., China). Within 6 hr after gas sam-
pling, gas samples were simultaneously analyzed for CO2,
CH4 and N2O using a gas chromatograph (Agilent 7890A,
Agilent Technologies, CA, USA) equipped with an electron
capture detector for N2O detection and a flame ionization de-
tector for CH4 and CO2 detection (a nickel catalyst applied
for converting CO2 to CH4). A detailed description of the
gas chromatograph configurations adopted in our instrument
can be found in Zheng et al. (2008) and Wang et al. (2010).
The fluxes of CH4, N2O and CO2 were calculated from the
linear or nonlinear changes in the gas concentrations in the
enclosed chamber with time (Wang et al., 2013), and cor-
rected for the height of chamber, chamber air temperature
and ambient air pressure effects.
Generally, gas fluxes were measured between 8:00 and
11:00 LT in the morning, assuming that the fluxes at that time
represent the approximate daily mean of GHGs fluxes since
the soil temperature during that period was close to the aver-
age daily soil temperature (Yao et al., 2009). Over the rice-
growing season, flux measurements were usually done three
to four times per week at intervals of 1 to 2 days, whereas
during the fallow period flux measurements were done five
times per week.
2.3 Auxiliary measurements
At times of GHGs flux measurements, soil Eh at a depth
of 10 cm were monitored using platinum-tipped electrodes
with a calomel reference electrode connected to a portable
millivolt meter (FJA-5, Nanjing Chuan-Di Instrument Co.
Ltd., China). Each of the 18 plots had two replicated elec-
trodes that were permanently installed in the experimental
fields during the rice-growing period. Over the rice-growing
season, soil water contents in the GCRPS plots were au-
tomatically measured in 30 min intervals using a frequency
domain reflectometry (FDR) sensor (RDS Technology Co.,
Ltd Jiangsu, Nanjing, China). The FDR probes were embed-
ded in the soil layer (0–6 cm) before rice transplanting. For
the conventional paddy plots, the field floodwater depth was
monitored daily using an embedded vertical ruler. For the
fallow period, soil (0–6 cm) moisture in all field plots was
measured daily adjacent to the frames by using a portable
FDR probe. Over the entire rice–fallow system, the air tem-
perature and daily precipitation were recorded by an auto-
matic meteorological station (HOBO, Onset, USA) at the
experimental farm. Soil (5 cm) temperature in the conven-
tional paddy and GCRPS plots was automatically recorded
in 15 min intervals using a HOBO temperature sensor (On-
set, USA). To determine soil mineral N (NH+4 and NO−3 )
and dissolved organic C (DOC) contents, soil samples at a
depth of 0–10 cm were randomly collected at two points in
each plot using a 3 cm diameter gauge auger at weekly in-
tervals. Following the collection, soil samples were bulked
for each treatment, and extracted using 1 M KCl solution for
NH+4 and NO−3 determination and using 0.05 M K2SO4 so-
lution for DOC measurement. The soil extracts were frozen
at−18 ◦C and later analyzed with a continuous flow analyzer
instrument (San++, Skalar Analytical B.V., the Netherlands)
for simultaneous measurements of NH+4 , NO−3 and DOC.
The rice plants at physiological maturity were harvested
manually from one subplot with a size of 1.4 m× 7.6 m in
each experimental plot, and then separated into grain and
straw. The yields of grain and straw were determined after
oven drying at 70 ◦C to a constant weight, and then each part
was further processed and analyzed for C and N content (Qu
et al., 2012). In order to determine the weight of root at matu-
rity, all rice plants (including aboveground biomass and root
until 40 cm soil depth) at eight randomly selected hills (ap-
proximately 0.3 m2) were harvested in each plot, washed and
separated for aboveground and belowground biomass and
dried to a constant weight.
2.4 Data processing and statistical analysis
The fluxes of CH4, N2O and CO2 for each treatment of a
given sampling date were obtained by averaging fluxes of the
three spatial replicates. The total cumulative fluxes of an indi-
vidual gas over the rice season, fallow period and annual rota-
tion cycle were directly calculated from the observed fluxes,
using linear interpolation between sampling dates. The N2O
emission factor of fertilizer N applied to the soil was com-
puted by subtracting the total cumulative emission of N2O
in the control from the corresponding total emissions in each
fertilized treatment and dividing the result by the applied to-
tal amount of N fertilization. To assess the combined climatic
impact from CH4 and N2O under the agronomic treatments,
the aggregate emissions of CH4 and N2O (expressed in CO2
equivalents) were calculated using the global warming po-
tential indices of 25 and 298 for CH4 and N2O, respectively,
over a 100-year time horizon (IPCC, 2007).
As the net ecosystem exchanges (NEEs) of CO2 dur-
ing the rice-growing season could not be measured with
the opaque chamber method, they were estimated from
the difference between net primary production (NPP) and
heterotrophic respiration (Rh) as suggested by Liu and
Greaver (2009), i.e., NEE = Rh−NPP, in which the NPP
was determined by summing up the weights of harvested
aboveground biomass (including straw and grain) and root,
and the Rh was estimated as the soil respiration from the
bare soil (Raich and Tufekcioglu, 2000). The carbon se-
questration capacity of the soil was calculated by inte-
grating NEE estimates, the amount of carbon incorporated
through fertilization and the carbon amount harvested in
the straw and grain, i.e., soil carbon sequestration capac-
www.biogeosciences.net/11/1/2014/ Biogeosciences, 11, 1–16, 2014

6 Z. Yao et al.: Water-saving ground cover rice production system
Table 2. Straw (S) and grain (G) yields as well as total (T ) yields (straw and grain, in Mg ha−1), and plant uptake of C (in Mg ha−1)
and N (in kg ha−1) at physiological maturity for different fertilizer treatments in the conventional paddy and ground cover rice production
systems (GCRPS).
Conventional paddy GCRPS
CNN CUN GNN GUN GCM GUM
Straw yield 5.50± 0.21a 8.35± 0.36bc 5.75± 0.46a 8.69± 0.45c 6.17± 0.52ad 7.32± 0.47bd
S uptake of C 2.19± 0.07a 3.33± 0.11bc 2.24± 0.17a 3.52± 0.19c 2.44± 0.19a 2.95± 0.18b
S uptake of N 24.6± 2.9a 64.4± 3.6b 29.9± 2.2a 66.5± 7.8b 50.2± 4.1c 48.1± 2.7c
Grain yield 5.49± 0.17a 7.92± 0.21b 6.05± 0.06c 7.70± 0.19b 7.43± 0.15b 7.97± 0.16b
G uptake of C 2.34± 0.07a 3.41± 0.09b 2.58± 0.02c 3.33± 0.08b 3.22± 0.05b 3.46± 0.08b
G uptake of N 48.2± 4.0a 81.5± 4.0b 61.8± 1.9c 87.7± 3.6b 94.2± 4.1b 93.9± 5.7b
Total yield 10.99± 0.34a 16.27± 0.56b 11.80± 0.40a 16.39± 0.43b 13.60± 0.60c 15.29± 0.63b
T uptake of C 4.52± 0.13a 6.74± 0.20b 4.82± 0.15a 6.84± 0.17b 5.67± 0.24c 6.40± 0.26b
T uptake of N 72.8± 6.9a 145.9± 3.3b 91.6± 4.0a 154.2± 8.9b 144.4± 7.9b 141.9± 5.2b
Data shown are means ± standard errors of three spatial replicated plots. Definitions of abbreviations for the different fertilizer treatments are shown in the
footnotes of Table 1 and in the text. Different letters within the same row indicate statistically significant differences among treatments at the P < 0.05 level.
39
0
6
12
18
24
30 CNN
CUN
a
NO
3
- (m
g N
kg
-1S
DW
)
NO
3
- (m
g N
kg
-1S
DW
) NH
4
+ (
mg
N k
g-1S
DW
)
NH
4
+ (
mg
N k
g-1S
DW
)
0
6
12
18
24
30 GNN
GUN
GCM
GUM
b
048
12164080
120160
c
04812164080120160
d
Fallow season
Rice season Fallow seasonRice season
0
30
60
90
120
150e
DO
C (
mg
C k
g-1S
DW
)
DO
C (
mg
C k
g-1S
DW
)
Apr.30Feb.30Dec.30Oct.30Aug.30Jun.30Apr.30 Apr.30Feb.30Dec.30Oct.30Aug.30Jun.30Apr.30
0
30
60
90
120
150f
Fig. 2.
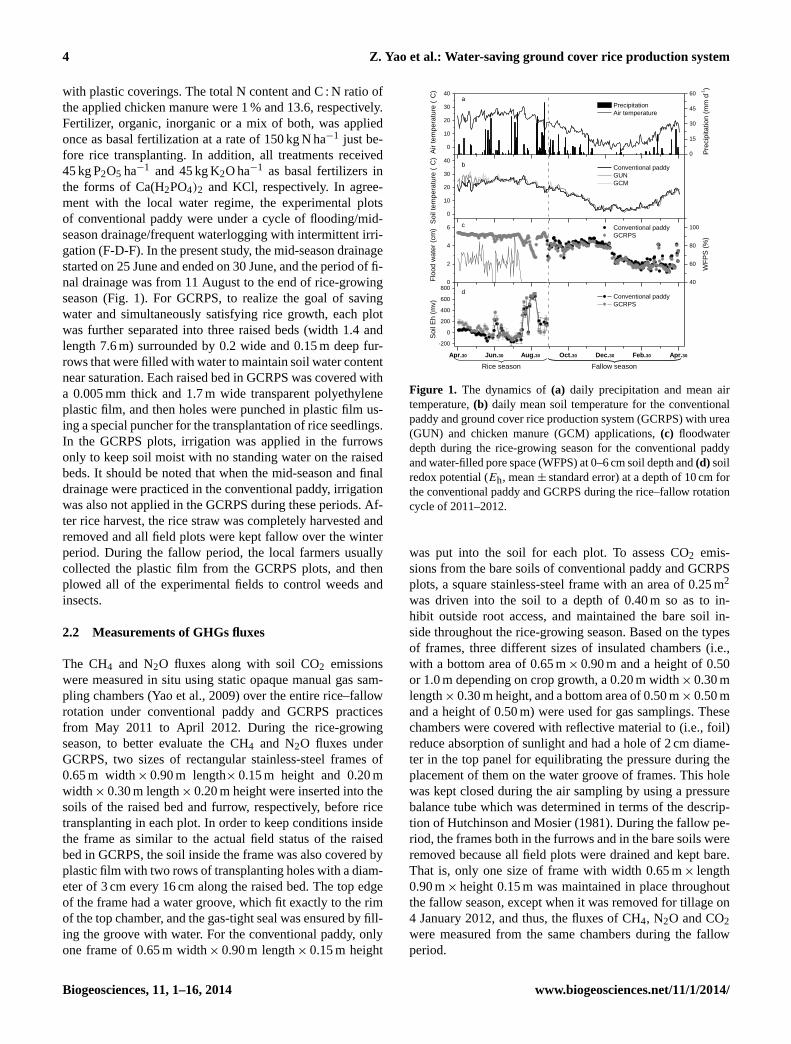
Figure 2. Seasonal dynamics in (a–b) soil ammonium
(NH+4
), (c–d) nitrate (NO−3
) and (e–f) dissolved organic car-
bon (DOC) contents (mean ± standard error) for different fertilizer
treatments in the conventional paddy and ground cover rice produc-
tion systems during the rice–fallow rotation cycle of 2011–2012.
SDW stands for soil dry weight. Definitions of abbreviations for the
different fertilizer treatments are shown in the footnotes of Table 1
and in the text.
ity (Mg C ha−1) =−NEE+ Incorporated C−Harvested C.
Here the negative NEE fluxes indicate net CO2 uptake, and
the negative values of carbon sequestration capacity indicate
the net carbon losses from soil. It should be noted that our
present estimates of soil carbon sequestration capacity were
quite preliminary and exhibited a certain degree of underes-
timation due to not including root exudates. To calculate the
complete GHG balance for conventional paddy and GCRPS
treatments, the net ecosystem greenhouse gas exchange
(NEGE) was estimated by integrating the CH4 and N2O
fluxes and soil carbon sequestration capacity, i.e., NEGE
(Mg CO2-eq ha−1) = 25×CH4 flux (kg C ha−1)× 16 / 12 /
1000+ 298×N2O flux (kg N ha−1)× 44 / 28 / 1000− soil C
sequestration (Mg C ha−1)× 44 / 12. In this study, the neg-
ative value of NEGE indicates the net sink of atmospheric
GHGs.
All statistical analyses were performed using SPSS 12.0
(SPSS Inc., Chicago, USA) and Origin 7.0 (Origin Lab Cor-
poration, USA). Differences in cumulative emissions from
the rice–fallow system as affected by different agronomic
treatments were examined by using a one-way ANOVA with
Tukey’s multiple range test. To estimate the relationships be-
tween soil environmental variables and GHGs emissions in
the rice-growing season, multiple linear regression analyses
were carried out with the stepwise procedure.
3 Results
3.1 Environmental drivers and rice production
The total amounts of rainfall were 597.8 and 281.2 mm for
the rice and fallow seasons, respectively (Fig. 1a). Within the
first two months after soil was covered by plastic film, soil
temperature was 25.7 ◦C on average in GCRPS but 22.8 ◦C
on average in the conventional paddy (Fig. 1b). Within the
GCRPS plots, the chicken manure application generally in-
creased soil temperature, with mean values of 24.3 and
25.2 ◦C for GUN and GCM, respectively. During the fallow
period, both conventional paddy and GCRPS showed com-
parable results of soil temperature (mean: 10.2 vs. 9.9 ◦C).
For the conventional paddy, a floodwater layer of on av-
erage 2.6± 0.5 cm was maintained during the rice-growing
season, except for the periods of mid-season aeration and fi-
nal drainage. For GCRPS, soil water content was generally
kept at more than 90 % WFPS (water-filled pore space) until
the final drainage before rice harvest (Fig. 1c). During the fal-
low period, there were no significant differences in soil wa-
Biogeosciences, 11, 1–16, 2014 www.biogeosciences.net/11/1/2014/

Z. Yao et al.: Water-saving ground cover rice production system 7
40
0
3
6
9a. CNN
0
3
6
9b. CUN
0.0
0.7
1.4
3
6c. GNN
CH
4 flu
x (
mg
C m
-2 h
-1)
0.0
0.7
1.4
3
6d. GUN
CH
4 flu
x (
mg
C m
-2 h
-1)
0
3
6
e. GCM
0
3
6
Fallow seasonRice seasonFallow seasonRice season
f. GUM
Apr.30Feb.30Dec.30Oct.30Aug.30Jun.30Apr.30 Apr.30Feb.30Dec.30Oct.30Aug.30Jun.30Apr.30
Fig. 3.
Figure 3. Seasonal dynamics in (a–f) methane (CH4) fluxes (mean
± standard error) for different fertilizer treatments in the conven-
tional paddy and ground cover rice production systems during the
rice–fallow rotation cycle of 2011–2012. The CH4 fluxes during the
rice season as shown in panels (c–f) were measured from the raised
beds of ground cover rice production systems. Definitions of ab-
breviations for the different fertilizer treatments are shown in the
footnotes of Table 1 and in the text.
ter contents between GCRPS and conventional paddy. Both
conventional paddy and GCRPS showed a comparable sea-
sonality in soil Eh (Fig. 1d). However, soil Eh under GCRPS
was on average 73 % higher than that of conventional paddy.
Across the rice-growing season, the mean NH+4 content
in the CNN (5.3 mg N kg−1 SDW (soil dry weight)) and
CUN (7.6 mg N kg−1 SDW) treatments were 39 and 15 %
higher than that of the GNN and GUN, respectively (Fig. 2).
In contrast, the seasonal mean NO−3 contents under CNN
(0.35 mg N kg−1 SDW) and CUN (0.50 mg N kg−1 SDW)
were lower than their corresponding GNN and GUN treat-
ments. Compared to the GUN, GCM reduced the NH+4and NO−3 contents by 20 and 28 %, respectively. Applica-
tion of GUM increased soil NH+4 and NO−3 contents com-
pared to GCM, but to a smaller extent than GUN. In addi-
tion, the mean DOC contents under conventional paddy (i.e.,
57.9 mg C kg−1 SDW for CNN and 52.7 mg C kg−1 SDW for
CUN) were higher than those of the GNN (43.1 mg C kg−1
SDW) and GUN (36.6 mg C kg−1 SDW), but they were com-
parable to those of GUM and GCM. During the fallow pe-
riod, all the fertilized treatments (CUN, GUN, GCM and
GUM) had higher soil mineral N (NH+4 and NO−3 ) con-
tents (11.8–14.1 mg N kg−1 SDW) as compared to the con-
trols (6.7–9.8 mg N kg−1 SDW).
The total yields of straw and grain and the uptake of C
and N by the plants in the fertilized plots were significantly
higher compared to the unfertilized controls regardless of
rice production system (P < 0.05, Table 2). Compared to the
CNN, the GNN treatment significantly improved grain yields
by 10 % (P < 0.05), though there was no significant differ-
ence in straw yields. In contrast, the grain yields did not dif-
Figure 4. Relationships of (a) methane (CH4) emissions to soil tem-
perature and redox potential (Eh) in the control of conventional
paddy rice production system (i.e., CNN) and (b) nitrous oxide
(N2O) emissions to soil temperature and ammonium (NH+4
) con-
tents in the urea application treatment of ground cover rice produc-
tion system (i.e., GUN) during the rice-growing season. The mesh
plots are the result of multiple linear regression analysis according
to the equations presented in Table 4.
fer between CUN and GUN. The chicken manure amend-
ments under GCRPS (GCM and GUM) did not influence
grain yields, compared to CUN and GUN (Table 2).
3.2 Methane fluxes
During the rice-growing season, the CH4 emissions in-
creased steadily after rice transplanting, and peak emissions
were observed at the beginning of August for plots fertil-
ized with urea (CUN and GUN) or left unfertilized (CNN
and GNN). For plots fertilized with chicken manure (GCM
and GUM), two periods with elevated CH4 emissions were
observed: the first one appeared immediately following fer-
tilization, while the second occurred at the beginning of Au-
gust (Fig. 3). Seasonal cumulative CH4 emissions signifi-
cantly varied by rice production system and fertilizer treat-
ment (Table 3). Compared to the CNN, CUN significantly
inhibited seasonal CH4 emissions by 33 % (P < 0.05). Un-
der GCRPS, there were similar temporal trends but varying
amplitudes of CH4 emissions between the furrow and raised
bed of each treatment (Fig. 3 and Fig. S1 in the Supplement).
Seasonal CH4 emissions for the furrows ranged from 2.07 to
3.67 kg C ha−1, which was on average 72 % lower than those
of the raised beds (P < 0.05). The seasonal mean CH4 emis-
sions under GCRPS, weighted by the areal extent of the fur-
row and raised bed, were 5.36, 6.65, 33.4 and 11.8 kg C ha−1
for the GNN, GUN, GCM and GUM, respectively (Table 3).
Averaging across GNN and GUN under GCRPS, the sea-
sonal CH4 emission was 6.00± 0.68 kg C ha−1, which is
86 % lower than that of the conventional paddy (P < 0.05),
indicating that the conversion from conventional paddy to
GCRPS inhibited CH4 emissions substantially. Also, the
CH4 emissions from GCM and GUM under GCRPS were
lower as compared to the conventional paddy.
Across sampling dates during the rice-growing season,
CH4 emissions were negatively correlated with soil Eh and
www.biogeosciences.net/11/1/2014/ Biogeosciences, 11, 1–16, 2014

8 Z. Yao et al.: Water-saving ground cover rice production system
Table 3. Seasonal and annual cumulative fluxes of methane (CH4, in kg C ha−1) and nitrous oxide (N2O, in kg N ha−1) and direct emission
factors of applied nitrogen (in %) for different fertilizer treatments in the conventional paddy and ground cover rice production systems
(GCRPS).
Conventional paddy GCRPS
CNN CUN GNN GUN GCM GUM
Rice season
Raised bed CH4 – – 6.19± 0.64 7.51± 1.04 41.1± 0.98 13.8± 0.26
Furrow CH4 – – 2.07± 0.29 3.26± 0.14 3.09± 0.38 3.67± 0.37
Area weighted CHa4
52.3± 3.8a 35.2± 4.6b 5.36± 0.51c 6.65± 0.86c 33.4± 0.85b 11.8± 0.13c
Raised bed N2O – – 0.13± 0.01 5.12± 1.2 0.17± 0.01 0.40± 0.07
Furrow N2O – – 0.070± 0.01 1.08± 0.17 0.089± 0.01 0.065± 0.01
Area weighted N2Oa 0.089± 0.01a 0.21± 0.05b 0.12± 0.01ab 4.30± 0.96c 0.15± 0.01ab 0.33± 0.06d
Emission factor – 0.082 – 2.79 0.023 0.14
Fallow season
CH4 −0.54± 0.25a −0.51± 0.08a −0.92± 0.13a −0.81± 0.06a −0.84± 0.06a −0.50± 0.10a
N2O 0.45± 0.02a 2.60± 0.75b 0.51± 0.14a 2.34± 0.64bc 0.60± 0.04a 1.05± 0.32ac
Annual rotation
CH4 51.7± 3.6a 34.6± 4.5b 4.43± 0.61c 5.84± 0.89c 32.6± 0.89b 11.3± 0.14c
N2O 0.54± 0.02a 2.81± 0.80b 0.62± 0.13a 6.64± 1.5c 0.76± 0.05a 1.38± 0.27b
Emission factor – 1.52 – 4.01 0.087 0.50
a The area weighted emissions of CH4 and N2O for the GCRPS treatments in the rice season were calculated on the basis of the areal extent of furrow and raised bed. Data
shown are means ± standard errors of three spatial replicates. Definitions of abbreviations for the different fertilizer treatments are shown in the footnotes of Table 1 and in
the text. Different letters within the same row indicate statistically significant differences among treatments.
42
0
50
100
150900
180027003600
a. CNN
0
50
100
150900180027003600
b. CUN
0
50
100
150900
18002700 c. GNN
N2O
flu
x (
g N
m-2 h
-1)
0
50
100
15090018002700d. GUN
N2O
flu
x (
g N
m-2 h
-1)
0
50
100
150900
18002700
Fallow seasonRice season
e. GCM
Apr.30Feb.30Dec.30Oct.30Aug.30Jun.30Apr.30 Apr.30Feb.30Dec.30Oct.30Aug.30Jun.30Apr.30
Fallow seasonRice season
0
50
100
15090018002700f. GUM
Fig. 5.
Figure 5. Seasonal dynamics in (a–f) nitrous oxide (N2O) fluxes
(mean± standard error) for different fertilizer treatments in the con-
ventional paddy and ground cover rice production systems during
the rice–fallow rotation cycle of 2011–2012. The N2O fluxes dur-
ing the rice season as shown in panels (c–f) were measured from the
raised beds of ground cover rice production systems. Definitions of
abbreviations for the different fertilizer treatments are shown in the
footnotes of Table 1 and in the text.
positively with soil temperature (Table 4). For instance, soil
temperature and Eh together explained approximately 46 %
of the observed temporal variation in CH4 emission for CNN
(Fig. 4).
In the following fallow season, there were no significant
production system impacts or seasonal patterns (Fig. S2 in
the Supplement). Over the fallow period, soils of all treat-
ments acted as weak sinks for atmospheric CH4, which
ranged from −0.92 to −0.50 kg C ha−1 (Table 3). Annual
CH4 emissions over the rice–fallow system ranged from
4.43 kg C ha−1 yr−1 for the GNN to 51.7 kg C ha−1 yr−1 for
the CNN plots. Across the plots with urea application
and the control, annual CH4 emission averaged 5.14 and
43.2 kg C ha−1 yr−1 for the GCRPS and conventional paddy,
respectively; the former value was significantly lower than
the latter one (P < 0.05, Table 3).
3.3 Nitrous oxide emissions
During the rice-growing season, the N2O emissions from the
unfertilized plots (CNN and GNN) were consistently low
(mean: < 8 µg N m−2 h−1, Fig. 5). The N2O emissions from
the fertilized plots (CUN, GUN, GCM and GUM) were rel-
atively low and steady across the rice-growing season, apart
from a pronounced peak following fertilization and a small
spike following mid-season drainage at the end of June.
Among all the fertilizer treatments, the highest peak emission
of N2O appeared in the GUN plots, and N2O emissions re-
mained much higher compared to the other treatments for al-
most 6 weeks following fertilization, although the emissions
did fluctuate (Fig. 5). Similar to CH4 emission, seasonal N2O
emissions were also affected by rice production system and
Biogeosciences, 11, 1–16, 2014 www.biogeosciences.net/11/1/2014/

Z. Yao et al.: Water-saving ground cover rice production system 9
Table 4. Stepwise multiple linear regression analysis between soil environmental variables and the emissions of methane (CH4), nitrous
oxide (N2O) and heterotrophic respiration (CO2) for different fertilizer treatments during the rice-growing season.
Regression functiona R2bP c Number
of cases
Methane (CH4)
CNN FCH4= −8.59− 0.003Eh+ 0.44ST 0.46 < 0.01 60
CUN FCH4= −4.18− 0.003Eh+ 0.23ST 0.35 < 0.01 60
GNN NS NS NS
GUN NS NS NS
GCM FCH4= 1.38− 0.003Eh 0.29 < 0.05 60
GUM FCH4= 0.39− 0.001Eh 0.26 < 0.05 60
Nitrous oxide (N2O)
CNN NS NS NS
CUN FN2O = 1.33+ 0.96NH+4
0.22 < 0.05 20
GNN NS NS NS
GUN FN2O = −569.3+ 41.6NH+4+ 17.6ST 0.77 < 0.01 20
GCM FN2O = −9.80+ 0.58ST 0.10 < 0.05 60
GUM FN2O = −25.3+ 0.84NH+4+ 1.01ST 0.59 < 0.01 20
Heterotrophic respiration (CO2)
CNN FCO2= 26.0+ 0.088Eh 0.46 < 0.01 20
CUN FCO2= 22.7+ 0.11Eh 0.51 < 0.01 20
GNN FCO2= 320.6− 3.27WFPS 0.74 < 0.01 60
GUN FCO2= 328.1− 3.39WFPS 0.91 < 0.01 60
GCM FCO2= 293.3− 2.94WFPS 0.72 < 0.01 60
GUM FCO2= 251.2− 2.52WFPS 0.75 < 0.01 60
a F, the trace gas fluxes; Eh, soil redox potential; ST, soil temperature; WFPS, water-filled pore space;
NS, not significant.b Coefficient of determination. c Values indicate significance level. Definitions of abbreviations for the
different fertilizer treatments are shown in the footnotes of Table 1 and in the text.
fertilizer treatment. Under conventional paddy, CUN signif-
icantly increased N2O emissions by 138 % relative to the
CNN (P < 0.05), and the direct emission factor of N2O was
estimated to be 0.082 %. For the GCRPS plots, the magnitude
of N2O emissions from the furrows was significantly lower
than from the raised beds (P < 0.05, Table 3), although they
showed similar seasonal patterns (Figs. 5 and S1). The area-
weighted seasonal N2O emissions were 0.12, 4.30, 0.15 and
0.33 kg N ha−1 for the GNN, GUN, GCM and GUM, respec-
tively. The direct emission factors of N2O were estimated to
be 2.79, 0.023 and 0.14 % for the GUN, GCM and GUM,
respectively. Across GNN and GUN under GCRPS, the sea-
sonal N2O emission averaged 2.21 kg N ha−1, which is re-
markably higher than that of conventional paddy, indicating
that the conversion from conventional paddy to GCRPS sig-
nificantly stimulated N2O emissions. In contrast, GCM and
GUM only slightly increased N2O emissions in comparison
to the conventional paddy.
Across the rice-growing season, a positive linear correla-
tion was found between N2O emissions and soil NH+4 con-
tents or soil temperature, or both for all the fertilized treat-
ments (Table 4). For example, Fig. 4b illustrates the relation-
ship between soil temperature, NH+4 content and N2O emis-
sions for the GUN.
During the fallow period, marked N2O emissions were
recorded mainly in late March and April after substantial
rainfall events (Figs. 1a and 5). Although no fertilizer was
applied in the fallow season, the cumulative N2O emissions
over this period were observed to be higher than those dur-
ing the rice-growing season, except for the GUN treatment.
Total N2O emissions in the fallow season (ranging from 0.45
to 2.60 kg N ha−1) did not differ between the conventional
paddy and GCRPS, but varied significantly among fertilizer
treatments in each production system (Table 3).
Over the rice–fallow cropping cycle, annual N2O emis-
sions ranged from 0.54 kg N ha−1 yr−1 for the CNN to
6.64 kg N ha−1 yr−1 for the GUN plots (Table 3). Although
there was no significant difference in annual N2O emissions
between CNN and GNN, GUN remarkably increased annual
N2O emission by 136 % relative to CUN (P < 0.05). In con-
trast, GUM did not significantly affect annual N2O emission,
and GCM even reduced annual N2O emission by 73 %, com-
pared to the CUN. The annual direct emission factor of N2O
www.biogeosciences.net/11/1/2014/ Biogeosciences, 11, 1–16, 2014

10 Z. Yao et al.: Water-saving ground cover rice production system
43
0
50
100
150
200
a. CNN
0
50
100
150
200
b. CUN
0
50
100
150c. GNN
So
il R
h e
mis
sio
n (
mg
C m
-2 h
-1)
0
50
100
150d. GUN
So
il R
h e
mis
sio
n (
mg
C m
-2 h
-1)
0
50
100
150
Fallow seasonRice seasonFallow season
e. GCM
Rice season
0
50
100
150f. GUM
Apr.30Feb.30Dec.30Oct.30Aug.30Jun.30
Apr.30 Apr.30Feb.30Dec.30Oct.30Aug.30Jun.30Apr.30
Fig. 6.
Figure 6. Seasonal dynamics in (a–f) soil heterotrophic respiration
(Rh) emissions (mean ± standard error) from bare soils of differ-
ent fertilizer treatments in the conventional paddy and ground cover
rice production systems during the rice–fallow rotation cycle of
2011–2012. Definitions of abbreviations for the different fertilizer
treatments are shown in the footnotes of Table 1 and in the text.
was estimated to be 1.52, 4.01, 0.087 and 0.50 % for the
CUN, GUN, GCM and GUM, respectively.
3.4 Soil Rh emissions and estimates of NEE and soil
carbon sequestration
Soil Rh emissions showed a slight peak in late August for
the plots with urea application and the control (CNN, GNN,
CUN and GUN). Similar results were observed in the GCM
and GUM treatments, apart from a short flush following
fertilization (Fig. 6). Over the rice-growing season, there
were no significant differences in seasonal Rh emissions
(ranging from 0.91 to 1.17 Mg C ha−1) between the con-
ventional paddy and GCRPS (Table 5). The soil Rh emis-
sion was significantly correlated with Eh under conventional
paddy, while it was negatively correlated with WFPS un-
der GCRPS (Table 4). For the rice growth period, the NEE
fluxes ranged between −6.51 and −3.97 Mg C ha−1 for con-
ventional paddy and from −6.68 to −4.35 Mg C ha−1 for
GCRPS, with no significant difference between them (Ta-
ble 5).
Soil CO2 emissions from the conventional paddy and
GCRPS showed similar seasonal patterns during the fal-
low period (Fig. 6). The total CO2 emissions over this pe-
riod ranged from 1.49 to 2.04 Mg C ha−1, with no signifi-
cant effects of rice production system (Table 5). Over the
entire rice–fallow system, the annual soil CO2 emissions
and NEE fluxes ranged from 2.47 to 3.16 Mg C ha−1 yr−1
and −5.19 to −2.06 Mg C ha−1 yr−1, respectively, among
the treatments. There was no significant effects of rice pro-
duction system on both annual soil CO2 emissions and
NEE fluxes. The estimated annual soil carbon sequestra-
tion capacity ranged from−2.47 Mg C ha−1 yr−1 for CNN to
−0.44 Mg C ha−1 yr−1 for GCM (Table 5). Across all treat-
ments under GCRPS, the annual soil carbon sequestration ca-
pacity averaged−1.33 Mg C ha−1 yr−1, which is 44 % higher
compared to the conventional paddy, indicating that the con-
version from conventional paddy to GCRPS had the potential
to reduce carbon loss from soil.
3.5 Estimates of net ecosystem greenhouse
gas exchange (NEGE)
During the rice-growing season, total emissions of CH4 and
N2O from GNN and GUN averaged 1235 kg CO2-eq ha−1,
which is approximately 19 % lower than the conventional
paddy (Table 5). The chicken manure applications under
GCRPS, especially GCM, significantly reduced aggregate
emissions of CH4 and N2O (P < 0.05) compared to the CUN
and GUN. During the fallow period, the aggregate emissions
of CH4 and N2O did not significantly differ between the con-
ventional paddy and GCRPS. Over the entire annual cycle,
the mean total emissions of CH4 and N2O across GNN and
GUN tended to be lower as compared to the conventional
paddy. Relative to the CUN and GUN, GCM and GUM sig-
nificantly reduced annual aggregate emissions of CH4 and
N2O (P < 0.05).
On the annual basis, the NEGE ranged from 3.05 for
the GCM to 11.02 Mg CO2-eq ha−1 for the CNN plots (Ta-
ble 5). There were no significant differences in annual NEGE
between the urea application and the control, irrespective
of rice production systems. Compared to the conventional
paddy, the annual NEGE were reduced by 19 % on average
under GCRPS across GNN and GUN. The GCM and GUM
treatments reduced annual NEGE by 67 and 47 % in compar-
ison with GUN, respectively, and by 72 and 54 % relative to
the CUN, respectively. Accordingly, the lowest NEGE was
achieved under the GCM and GUM plots for the fertilized
treatment (Table 5).
4 Discussion
4.1 Key regulating factors of temporal variations
of CH4 and N2 O fluxes
In the conventional paddy, a relatively low CH4 emission
occurred before mid-season drainage and pronounced CH4
emissions were observed when the field was flooded again
after the mid-season drainage (Fig. 3a–b). Our findings are
inconsistent with the common pattern of CH4 emissions as
reported by previous studies: steadily increasing CH4 emis-
sion until mid-season drainage, followed by a rapid decrease
and no recovery of CH4 emission levels as compared to the
pre-mid-season period until harvest (e.g., Cai et al., 1997;
Nishimura et al., 2004; Zou et al., 2005a; Dong et al., 2011).
This indicated that the CH4 emissions from hilly paddy fields
could also be affected by the site-specific environmental fac-
tors such as soil temperature (Shang et al., 2011), apart from
soil Eh which is used as an index for the oxidation–reduction
Biogeosciences, 11, 1–16, 2014 www.biogeosciences.net/11/1/2014/

Z. Yao et al.: Water-saving ground cover rice production system 11
Table 5. Net primary production (NPP) and soil heterotrophic respiration (Rh) and their estimated net ecosystem exchanges (NEEs) of CO2,
and the estimated C sequestration capacity in soil and aggregate emissions of CH4 and N2O and their estimated net ecosystem greenhouse
gas exchanges (NEGE) for the conventional paddy and ground cover rice production systems under different fertilizer treatments over the
annual rice–fallow cropping rotation.
NPP Rh NEE Incorporated C Harvested C C sequestration Aggregate emission of CH4 NEGE
(Mg C ha−1) (Mg C ha−1) (Mg C ha−1) (Mg C ha−1) (Mg C ha−1) (Mg C ha−1) and N2O (kg CO2-eq ha−1) (Mg CO2-eq ha−1)
Rice season
CNN 4.98± 0.14a 1.00± 0.01ab −3.97± 0.14a 0 4.52± 0.13a −0.55± 0.01a 1785± 125ab 3.81± 0.07a
CUN 7.42± 0.22b 0.91± 0.05a −6.51± 0.23b 0 6.74± 0.20b −0.23± 0.05b 1271± 137b 2.13± 0.13bc
GNN 5.40± 0.17a 1.05± 0.02ab −4.35± 0.18a 0 4.82± 0.15a −0.47± 0.03a 234± 19c 1.97± 0.13c
GUN 7.67± 0.19b 0.98± 0.08a −6.68± 0.25b 0 6.84± 0.17b −0.16± 0.09b 2236± 475a 2.83± 0.52b
GCM 6.35± 0.27b 1.17± 0.05b −5.18± 0.24c 2.04 5.67± 0.24b 1.55± 0.03c 1186± 29b −4.51± 0.14d
GUM 7.17± 0.29b 0.96± 0.07a −6.21± 0.32b 1.02 6.40± 0.26b 0.83± 0.09d 546± 30c −2.51± 0.31d
Fallow season
CNN 0 1.91± 0.03a 1.91± 0.03a 0 0 −1.91± 0.03a 193± 16a 7.21± 0.10a
CUN 0 2.04± 0.11a 2.04± 0.11a 0 0 −2.04± 0.11a 1202± 355b 8.67± 0.44b
GNN 0 1.67± 0.05ab 1.67± 0.05ab 0 0 −1.67± 0.05ab 207± 62a 6.33± 0.13a
GUN 0 1.49± 0.14b 1.49± 0.14b 0 0 −1.49± 0.14b 1069± 302bc 6.53± 0.49a
GCM 0 1.99± 0.14a 1.99± 0.14a 0 0 −1.99± 0.14a 254± 19a 7.56± 0.53ab
GUM 0 1.92± 0.17a 1.92± 0.17a 0 0 −1.92± 0.17a 475± 150ac 7.51± 0.50ab
Annual rotation
CNN 4.98± 0.14a 2.92± 0.03ab −2.06± 0.16a 0 4.52± 0.13a −2.47± 0.04a 1978± 111ad 11.02± 0.07a
CUN 7.42± 0.22b 2.94± 0.15ab −4.47± 0.25bc 0 6.74± 0.20b −2.27± 0.15a 2473± 239ac 10.80± 0.53a
GNN 5.40± 0.17a 2.72± 0.05ab −2.67± 0.13ad 0 4.82± 0.15a −2.14± 0.03ab 440± 67b 8.30± 0.11b
GUN 7.67± 0.19b 2.47± 0.20a −5.19± 0.28c 0 6.84± 0.17b −1.65± 0.22b 3305± 713c 9.37± 1.01ab
GCM 6.35± 0.27b 3.16± 0.19b −3.19± 0.22d 2.04 5.67± 0.24b −0.44± 0.17c 1440± 45d 3.05± 0.67c
GUM 7.17± 0.29b 2.87± 0.23ab −4.30± 0.34b 1.02 6.40± 0.26b −1.09± 0.22d 1022± 123d 5.00± 0.72c
Data shown are means ± standard errors of three spatial replicates. Definitions of abbreviations for the different fertilizer treatments are shown in the footnotes of Table 1 and in
the text. Different letters within the same column indicate statistically significant differences among treatments during the periods of rice and fallow seasons as well as
annual rotation.
conditions regulated by water management (Minamikawa
and Sakai, 2005). It has been reported that low tempera-
tures suppress CH4 fluxes (Castro et al., 1995), and thus,
the low CH4 emission during the continuous flooding pe-
riod before mid-season drainage indeed might be attributed
to low soil temperatures at the start of the rice-growing period
(on average 3 ◦C lower as compared to the paddy fields in
Jiangsu province). This interpretation is further supported by
the demonstrated correlations between CH4 emissions and
soil Eh as well as soil temperature for the conventional paddy
(Table 4 and Fig. 4a). The CH4 emissions in GCM and GUM
under GCRPS were negatively correlated with soil Eh but not
affected by soil temperature, highlighting the warming effect
under GCRPS alleviating the hypothesized temperature lim-
itation of methanogenesis. In contrast, we did not observe
that the seasonality of CH4 emissions in GNN and GUN was
affected by soil Eh or soil temperature, which is presum-
ably due to the constantly low magnitude of CH4 emissions
(< 1.0 mg C m−2 h−1) from these two treatments.
Under conventional paddy, periods of high N2O emis-
sions were observed following N fertilization and mid-season
drainage events, respectively (Fig. 5b). This is in agreement
with previous studies (Cai et al., 1997; Zou et al., 2005a; Yao
et al., 2010) and shows that availability of N substrates and
changes in soil water regimes are the major drivers of high
N2O emissions, which override the effect of soil temperature
on nitrification and/or denitrification processes. However, the
major regulating factors of N2O emissions in the fertilized
treatments under GCRPS were soil NH+4 content and tem-
perature (Table 4). These two regulating factors interacted
positively (e.g., Fig. 4b) such that pronounced N2O emis-
sions mostly occurred following fertilization coupled with
the obvious warming effect of GCRPS, agreeing with the
findings of previous research for comparable environments
(e.g., Wang et al., 2011; Hu et al., 2013). In addition, during
the fallow period, the N2O emissions in all the treatments re-
mained low, and elevated emissions were only recorded in
late March and April (Fig. 5) when heavy rainfall (> 27 mm)
increased the soil water content to approximately ≥ 80 %
WFPS (Fig. 1c). Similar rainfall driven peak emissions of
N2O during the non-flooded period of rice-based cropping
systems have been observed also in previous studies else-
where (Zheng et al., 2000; Yao et al., 2010, 2013b) and fur-
ther confirm that at soil water contents of 70–90 % WFPS
pronounced N2O emissions are likely to occur (Dobbie et
al., 1999; Wang et al., 2011).
4.2 GCRPS and fertilizer practices affecting
CH4 and Rh fluxes
Numerous studies report on CH4 emissions from rice pad-
dies (e.g., Yagi et al., 1996; Sass et al., 1999; Yan et al.,
www.biogeosciences.net/11/1/2014/ Biogeosciences, 11, 1–16, 2014

12 Z. Yao et al.: Water-saving ground cover rice production system
2009), but only a few studies measured CH4 and N2O fluxes
simultaneously (e.g., Cai et al., 1997; Zou et al., 2005a;
Linquist et al., 2012). To our knowledge, no study is avail-
able reporting annual fluxes of N2O, CH4 and CO2 for
GCRPS, even though the first measurements were done a
decade ago (Dittert et al., 2002; Xu et al., 2004; Kreye et al.,
2007). In this study, annual CH4 emissions under conven-
tional paddy varied between 34.6 and 51.7 kg C ha−1 yr−1,
which was within the lower ranges (18–320 kg C ha−1) re-
ported by Xie et al. (2010) for conventional Chinese paddy
fields. In comparison to the CNN, the urea application (CUN)
significantly reduced annual CH4 emissions (Table 3). It
is well accepted that synthetic N fertilizers increase crop
growth as well as alter CH4 generating and oxidizing mi-
crobes, and thereby result in complex impacts on CH4 emis-
sions (Bodelier and Laanbroek, 2004; Cai et al., 2007; Liu
and Greaver, 2009). Banger et al. (2012) conducted a com-
prehensive meta-analysis on the net effects of N fertilizers on
CH4 emission and found that in the majority of studies (98 of
155 data sets), N fertilization increased CH4 emissions from
rice paddies. The effects of N fertilization will be modified
by water management of rice paddies: under the conditions
of intermittent irrigation with mid-season drainage, N fer-
tilizers seem to stimulate methanotrophs leading to higher
CH4 oxidation in the paddy fields (Banger et al., 2012). Also
in this study, mid-season drainage which generally promotes
aerobic soil conditions together with urea application obvi-
ously stimulated the CH4 oxidation activity in our soils and
decreased CH4 emissions.
In comparison to the conventional paddy, on average,
GCRPS across GNN and GUN decreased annual CH4 emis-
sions substantially (Table 3). It is generally recognized that
water management has a close relationship with the redox
status of soil (e.g., Minamikawa and Sakai, 2005). Aver-
age soil Eh under GCRPS were significantly higher than
that of the conventional paddy (Fig. 1d), indicating that un-
der GCRPS more oxidized soil conditions prevailed during
the rice-growing season. Accordingly, the GCRPS treatments
with their more aerated soil conditions were likely to inhibit
CH4 production by methanogens and favor CH4 consump-
tion by methanotrophs, which integrally led to decreased
CH4 emissions. Although the CH4 emissions under GCRPS
were not affected by the urea application due to the negli-
gible emissions from the GUN and GNN treatments, GCM
significantly increased CH4 emissions (Table 3). It has long
been shown that organic matter incorporation increases CH4
emissions from paddy fields due to the increased supply of
C substrates and energy for methanogens (Bhattacharyya et
al., 2012), which is further corroborated by the evidence that
soil DOC contents were significantly higher in GCM.
In this study, the annual Rh emissions from all the treat-
ments ranged from 2.47 to 3.16 Mg C ha−1 yr−1 (Table 5).
These values were within the range of soil Rh emissions ob-
tained in the global zone (0.35 to 2190 g C m−2 yr−1), as re-
ported by Bond-Lamberty and Thomson (2010). It is worth
noting that soil Rh emissions during the rice-growing sea-
son did not differ between conventional paddy and GCRPS,
although GCRPS increased soil temperature. These results
indicated that the nearly saturated soil water conditions un-
der GCRPS might efficiently reduce the impact of soil tem-
perature on CO2 emissions since the response of soil CO2
emission to increased temperature was likely constrained
and masked by soil water content (Maestre and Cortina,
2003). Actually, our statistical analysis revealed that soil CO2
emissions under GCRPS were significantly correlated with
WFPS, but were not affected by soil temperature (Table 4),
which supports the above mentioned speculations. In addi-
tion, nutrients supplied via fertilization would be expected
to influence soil CO2 emission by increasing rhizosphere C
input due to enhanced plant productivity and root residue
production (Iqbal et al., 2009). In this study, GCM gener-
ally increased annual soil CO2 emissions compared to GNN,
which is consistent with other studies that organic amend-
ments could enhance the bioavailability of soil C and mi-
crobial respiration (Lee et al., 2007; Bhattacharyya et al.,
2012). In contrast, urea application did not affect soil mi-
crobial respiration (Table 5). In a review of more than 60
studies, Fog (1988) suggested that N fertilization showed no
influence or a negative impact on decomposition of organic
matter. Thus, one can reasonably speculate that soil Rh emis-
sions did not differ between urea fertilization and control,
since they are the net results of organic matter decomposi-
tion by soil microorganisms. Similarly, a number of previous
studies also reported no difference in soil CO2 emission be-
tween control and synthetic N fertilizers (Rochette and Gre-
gorich, 1998; Hu et al., 2004; Lee et al., 2007).
4.3 GCRPS and fertilizer practices affecting N2O
fluxes and direct emission factors
For the conventional paddy, total N2O emissions during the
rice-growing season were 0.089–0.21 kg N ha−1, which is
within the range of previously reported emissions (Akiyama
et al., 2005). For the 53 studies considered in Akiyama
et al. (2005) for paddy fields with mid-season drainage,
N2O emissions ranging from 0.026 to 4.42 kg N ha−1. Under
GCRPS, total N2O emissions across the rice-growing period
were 0.12–4.30 kg N ha−1, which is comparable to previous
estimates in water-saving paddy fields (Dittert et al., 2002;
Kreye et al., 2007; Yang et al., 2012). It should be noted that
although no fertilizer was applied in the following fallow sea-
son, cumulative N2O emissions over this period were up to
2.60 kg N ha−1 (Table 3). This is likely a result of aerobic soil
organic nitrogen mineralization during the upland fallow pe-
riod, with associated productions of N2O from nitrification
and denitrification (Liu et al., 2010; Shang et al., 2011). In
addition, the N2O emissions during the fallow period tended
to be higher in the fertilized than in the unfertilized plots (Ta-
ble 3), showing that the effects of fertilization on N2O emis-
sions is carried over into the following fallow period. This
Biogeosciences, 11, 1–16, 2014 www.biogeosciences.net/11/1/2014/

Z. Yao et al.: Water-saving ground cover rice production system 13
is also supported by the evidence that higher soil mineral N
(NH+4 and NO−3 ) contents were observed for the fertilized
treatments during the fallow period (Fig. 2).
Annual N2O emissions and the urea-induced direct emis-
sion factor in the CUN plots were 58 and 62 % lower than
those of the GUN plots, respectively, which is largely due to
increases in N2O emissions during the rice-growing season
after conversion from conventional paddy to GCRPS (Ta-
ble 3). Generally, the production of N2O in soils is greatly
affected by soil water status and temperature (Williams et
al., 1992; Smith et al., 2003; Schindlbacher et al., 2004).
Under conventional paddy fields, nitrification of NH+4 was
suppressed by a lack of oxidized soil conditions, and den-
itrification, which could be potentially produced in prevail-
ing anaerobic conditions, was probably restricted by the high
shortage of NO−3 or reacted completely (i.e., the reduction of
N2O to N2), and thus, resulted in decreased N2O emissions.
This explanation was supported by the higher NH+4 contents
and at the same time, lower NO−3 contents for the CUN plots
relative to the GUN plots (Fig. 2). In addition, the GUN
treatment not only kept soil moisture at approximately 90 %
WFPS, but also increased soil temperature (Fig. 1), both fa-
vored the production and emission of N2O.
Although GUN significantly increased N2O emissions,
both GCM and GUM under GCRPS reduced annual N2O
emissions substantially (Table 3). Similar inhibitory effects
of organic fertilizer amendments on N2O emissions have
been observed in other laboratory and field studies (Pathak
et al., 2002; Yao et al., 2010; Qin et al., 2010). In contrast,
some other studies observed that the incorporation of organic
fertilizer stimulated N2O emissions or that N2O emissions
were not affected at all (e.g., Gentile et al., 2008; Wang et al.,
2011). In general, as was also observed in our study, the N2O
emissions were highly dependent on soil mineral N (NH+4and NO−3 ) availability in paddy fields (Liu et al., 2010; Yao et
al., 2010). Consistent with expectations, soil mineral N con-
tent was lower in the GCM and GUM since mineral N was
slowly released from organic manure mineralization, as com-
pared to the rapid release of mineral N with urea application
in GUN, and consequently decreasing N2O emissions. In ad-
dition, the significantly increased CH4 emissions from GCM
indicated the apparently prevailing anaerobic conditions in
soils. At the same time, the higher soil temperature and DOC
contents in GCM would further stimulate soil denitrifier ac-
tivity and efficiency during the denitrification process, which
benefits nitrate finally transformed into N2 rather than the
middle product of N2O (Millar and Baggs, 2005; Qin et al.,
2010). Also, Kramer et al. (2006) conducted lab and field
studies and found that soils with organic fertilization exhib-
ited higher potential denitrification rates, greater denitrifica-
tion efficiency and higher N2 emissions than the soils farmed
with synthetic N fertilizers.
Over the entire rice–fallow system, the direct emission fac-
tors of N2O were 1.52 and 4.01 % due to urea applications
under conventional paddy and GCRPS, respectively, which
is obviously higher than the IPCC default value of 0.30 % for
rice paddy fields and 1 % for upland croplands (IPCC, 2006).
Compared with the reported annual direct emission factors
of 0.34–2.50 % for N2O in Chinese upland-rice rotation sys-
tems (Zheng et al., 2000, 2004; Zou et al., 2005b; Liu et al.,
2010; Yao et al., 2010, 2013b), the direct emission factor is
comparable for the CUN but relatively high for the GUN.
However, N2O emissions from GUN were substantially re-
duced by manure application, giving annual direct emission
factors of 0.087 and 0.50 % under GCM and GUM, respec-
tively. This further confirms that the application of organic
fertilizers indeed decreases annual direct emission factors of
N2O as was also reported in previous studies (e.g., Pathak et
al., 2002; Yao et al., 2010).
4.4 Grain yield, NEGE and implications for
assessing GCRPS
In the present study, the grain yields under conventional
paddy and GCRPS ranged from 5.49 to 7.92 Mg ha−1 and
6.05 to 7.97 Mg ha−1, respectively, which is within the range
of rice grain yields for the conventional paddy (3.63 to
8.77 Mg ha−1) and GCRPS (4.27 to 9.97 Mg ha−1) estimated
at a large regional scale in central China (Liu et al., 2013).
Across the GNN and GUN treatments under GCRPS, the
grain yield was estimated to be an average of 6.87 Mg ha−1,
which is approximately 3 % higher than that of the conven-
tional paddy. This result is comparable to previous estimates
on the stimulating effects of GCRPS on grain yields (Qu et
al., 2012; Liu et al., 2013).
Although GCRPS reduced the greenhouse effects of CH4
emission by 83 % when practiced together with urea appli-
cation (i.e., GUN), this reduction was fully compensated by
increases (approximately 136 %) in annual emissions of the
even more potent GHG N2O (Table 5). Similar results have
been observed in other studies where increased N2O emis-
sions substantially offset the decreases in CH4 emissions re-
sulting from changes in water management (Xu et al., 2004;
Kreye et al., 2007; Hou et al., 2012; Yang et al., 2012). For
the GCM and GUM treatments, however, the increased N2O
emissions did not compensate for the climate benefits from
decreased CH4 emissions, resulting in the lower annual ag-
gregate emissions of CH4 and N2O compared to the GUN
and CUN. In addition, as estimated in this study, GCRPS
tended to reduce the C loss in soils (Table 5). Averaging
across GNN and GUN under GCRPS, the annual NEGE
was 8.83 Mg CO2-eq ha−1 yr−1, which is 19 % lower com-
pared to the conventional paddy, indicating that water-saving
GCRPS management tended to reduce net greenhouse effects
from rice-based cropping systems. Within the GCRPS, GUM
and GCM further decreased the annual NEGE compared to
the GNN and GUN. Based on the results of grain yield and
NEGE, therefore, water-saving GCRPS management, partic-
ularly when practiced together with organic fertilizer amend-
www.biogeosciences.net/11/1/2014/ Biogeosciences, 11, 1–16, 2014

14 Z. Yao et al.: Water-saving ground cover rice production system
ments, is beneficial for increasing grain yields while simulta-
neously reducing total GHG emissions during crop produc-
tion.
5 Conclusions
The introduction of water-saving GCRPS technology has a
high potential to increase rice grain yields and to significantly
reduce irrigation water demand for rice cultivation. How-
ever, it remains unknown if this new rice production tech-
nique will in the end not lead to pollution swapping of GHG
emissions, i.e., from CH4 emissions for conventional paddy
fields to increased soil N2O and CO2 emissions for ground
cover rice production systems. This study provides for the
first time an assessment of the net effect of GCRPS on the
annual GHG balance. Averaging across all the fertilizer treat-
ments, GCRPS greatly increased annual N2O emissions and
significantly decreased annual CH4 emissions, while GCRPS
had no effect on annual soil CO2 emissions compared to the
conventional paddy. By integrating CH4 and N2O emissions
and soil carbon sequestration capacities, the estimated annual
net greenhouse gas exchanges in all the GCRPS treatments
tended to be lower as compared to the conventional paddy,
highlighting the potential feasibility of GCRPS in reducing
net greenhouse effects. Overall, from the environmental sus-
tainability point of view for the hilly rice-based cropping sys-
tem, the implementation of water-saving GCRPS technology,
particularly practiced together with organic fertilizer supple-
ment, seems to be a very promising approach to increase
grain yields, reduce aggregate emissions of CH4 and N2O
and to stimulate soil carbon sequestration.
The Supplement related to this article is available online
at doi:10.5194/bg-11-1-2014-supplement.
Acknowledgements. This project was funded by the Ministry of
Science and Technology of China (2012CB417106), the National
Nature Science Foundation of China (51139006, 41075109,
41305129, 41321064). We wish to thank the Shiyan Municipal
Bureau of Agriculture for routine maintenance during the field trial.
We are also grateful to Haibo Dong, Rui Wang and Yongfeng Fu
for their assistance in field and laboratory measurements.
Edited by: Y. Kuzyakov
References
Adviento-Borbe, M. A. A., Haddix, M. L., Binder, D. L., Walters,
D. T., and Dobermann, A.: Soil greenhouse gas fluxes and global
warming potential in four high-yielding maize systems, Glob.
Change Biol., 13, 1972–1988, 2007.
Akiyama, H., Yagi, K., and Yan, X. Y.: Direct N2O emissions
from rice paddy fields: summary of available data, Global Bio-
geochem. Cy., l9, GB1005, doi:10.1029/2004GB002378, 2005.
Banger, K., Tian, H., and Lu, C.: Do nitrogen fertilizers stimulate or
inhibit methane emissions from rice fields? Glob. Change Biol.,
18, 3259–3267, 2012.
Belder, P., Bouman, B. A. M., Cabangon, R., Guoan, L., Quilang, E.
J. P., Li, Y. H., Spiertz, J. H. J., and Tuong, T. P.: Effect of water-
saving irrigation on rice yield and water use in typical lowland
conditions in Asia, Agric. Water Manage., 65, 193–210, 2004.
Bhattacharyya, P., Roy, K., Neogi, S., Chakravorti, S., Behera, K.,
Das, K., Bardhan, S., and Rao, K.: Effect of long-term appli-
cation of organic amendment on C storage in relation to global
warming potential and biological activities in tropical flooded
soil planted to rice, Nutr. Cycl. Agroecosyst., 94, 273–285, 2012.
Bodelier, P. L. E. and Laanbroek, H. J.: Nitrogen as a regulatory
factor of methane oxidation in soils and sediments, FEMS Mi-
crobiol. Ecol., 47, 265–277, 2004.
Bond-Lamberty, B. and Thomson, A.: A global database of soil res-
piration data, Biogeosciences, 7, 1915–1926, doi:10.5194/bg-7-
1915-2010, 2010.
Bouman, B. A. M.: A conceptual framework for the improvement
of crop water productivity at different spatial scales, Agric. Syst.,
93, 43–60, 2007.
Bouman, B. A. M. and Tuong, T. P.: Field water management to
save water and increase its productivity in irrigated lowland rice,
Agric. Water Manage., 49, 11–30, 2001.
Bouman, B. A. M., Hengsdijk, H., Hardy, B., Bindraban, P. S.,
Tuong, T. P., and Ladha, J. K. (Eds.): Water-wise rice produc-
tion, Proceedings of the International Workshop on Water-wise
Rice Production 8–11 April 2002, pp. 356, Los Baños, Philip-
pines, International Rice Research Institute, 2002.
Bouman, B. A. M., Humphreys, E., Tuong, T. P., and Barker, R.:
Rice and water, Adv. Agron., 92, 187–237, 2006.
Cai, Z., Yan, X., Yan, G., Xu, H., Tsuruta, H., Yagi, K., and Minami,
K.: Methane and nitrous oxide emissions from rice paddy fields
as affected by nitrogen fertilisers and water management, Plant
Soil, 196, 7–14, 1997.
Cai, Z., Shan, Y., and Xu, H.: Effects of nitrogen fertilization
on CH4 emissions from rice fields, Soil Sci. Plant Nutr., 53,
353–361, 2007.
Castro, M. S., Steudler, P. A., Melillo, J. M., Aber, J. D., and Bow-
den, R. D.: Factors controlling atmospheric methane consump-
tion by temperate forest soils, Global Biogeochem. Cy., 9, 1–10,
1995.
Dittert, K., Lin, S., Kreye, C., Zheng, X., Xu, Y., Lu, X., Shen,
Q., Fan, X., and Sattelmacher, B.: Saving water with Ground
Cover Rice Production Systems (GCRPS) at the price of in-
creased greenhouse gas emissions?, in: Water-Wise Rice Produc-
tion, edited by: Bouman, B. A. M., Hengsdijk, H., Hardy, B.,
Bindraban, P. S., Tuong, T. P., and Ladha, J. K., 197–206, Inter-
national Rice Research Institute, Los Baños, Philippines, 2002.
Dobbie, K. E., McTaggart, I. P., and Smith, K. A.: Nitrous ox-
ide emissions from intensive agricultural systems: variations be-
tween crops and seasons, key driving variables, and mean emis-
sion factors, J. Geophys. Res., 104, 26891–26899, 1999.
Dong, H., Yao, Z., Zheng, X., Mei, B., Xie, B., Wang, R., Deng,
J., Cui, F., and Zhu J.: Effect of ammonium-based, non-sulfate
fertilizers on CH4 emissions from a paddy field with a typi-
Biogeosciences, 11, 1–16, 2014 www.biogeosciences.net/11/1/2014/

Z. Yao et al.: Water-saving ground cover rice production system 15
cal Chinese water management regime, Atmos. Environ., 45,
1095–1101, 2011.
FAO (Food and Agriculture Organization): FAOSTAT online elec-
tronic data base, http://faostat.fao.org/, 2011.
Fog, K.: The effect of added nitrogen on the rate of decomposition
of organic matter, Biol. Rev. Camb. Philos. Soc., 63, 433–462,
1988.
Gentile, R., Vanlauwe, B., Chivenge, P., and Six, J.: Interactive ef-
fects from combining fertilizer and organic residue inputs on
nitrogen transformations, Soil Biol. Biochem., 40, 2375–2384,
2008.
Hou, H., Peng, S., Xu, J., Yang, S., and Mao, Z.: Seasonal variations
of CH4 and N2O emissions in response to water management
of paddy fields located in Southeast China, Chemosphere, 89,
884–892, 2012.
Hu, R., Hatano, R., Kusa, K., and Sawamoto, T.: Soil respiration and
net ecosystem production in an onion field in central Hokkaido,
Japan, Soil Sci. Plant Nutr., 50, 27–33, 2004.
Hu, X., Su, F., Ju, X., Gao, B., Oenema, O., Christie, P., Huang,
B., Jiang, R., and Zhang, F.: Greenhouse gas emissions from a
wheat-maize double cropping system with different nitrogen fer-
tilization regimes, Environ. Pollut., 176, 198–207, 2013.
Hutchinson, G. L. and Mosier, A. R.: Improved soil cover method
for field measurement of nitrous oxide fluxes, Soil Sci. Soc. Am.
J., 45, 311–316, 1981.
IPCC (Intergovernmental Panel on Climate Change), IPCC Guide-
lines for National Greenhouse Gas Inventories [M], 4, Agricul-
ture, Forestry and Other Land Use, IPCC / IGES, Hayama, Japan,
2006.
IPCC (Intergovernmental Panel on Climate Change), Climate
Change 2007: The Physical Science Basis, Contribution of
Working Group I to the Fourth Assessment Report of the Inter-
governmental Panel on Climate Change, edited by: Solomon, S.,
Qin, D., Manning, M., Chen, Z., Marquis, M., Averyt, K. B., Tig-
nor, M., and Miller, H. L., 498–540, Cambridge University Press,
Cambridge, United Kingdom and New York, NY, USA, 2007.
Iqbal, J., Hu, R., Lin, S., Hatano, R., Feng, M., Lu, L., Ahamadou,
B., and Du, L.: CO2 emission in a subtropical red paddy soil (Ul-
tisol) as affected by straw and N-fertilizer applications: A case
study in Southern China, Agr. Ecosyst. Environ., 131, 292–302,
2009.
Kramer, S. B., Reganold, J. P., Glover, J. D., Bohannan, B. J. M., and
Mooney, H. A.: Reduced nitrate leaching and enhanced denitri-
fier activity and efficiency in organically fertilized soils, PNAS,
103, 4522–4527, 2006.
Kreye, C., Dittert, K., Zheng, X., Zhang, X., Lin, S., Tao, H., and
Sattelmacher, B.: Fluxes of methane and nitrous oxide in water-
saving rice production in north China, Nutr. Cycl. Agroecosyst.,
77, 293–304, 2007.
Lee, D. K., Doolittle, J. J., and Owens, V. N.: Soil carbon dioxide
fluxes in established switchgrass land managed for biomass pro-
duction, Soil Biol. Biochem., 39, 178–186, 2007.
Linquist, B., Van Groenigen, K., Adviento-Borbe, M., Pittelkow,
C., and Van Kessel, C.: An agronomic assessment of greenhouse
gas emissions from major cereal crops, Glob. Change Biol., 18,
194–209, 2012.
Liu, L. and Greaver, T. L.: A review of nitrogen enrichment effects
on three biogenic GHGs: the CO2 sink may be largely offset by
stimulated N2O and CH4 emission, Ecol. Lett., 12, 1103–1117,
2009.
Liu, M., Lin, S., Dannenmann, M., Tao, Y., Saiz, G., Zuo, Q.,
Sippel, S., Wei, J., Cao, J., Cai, X., and Butterbach-Bahl, K.:
Do water-saving ground cover rice production systems increase
grain yields at regional scales?, Field Crop. Res., 150, 19–28,
2013.
Liu, S., Qin, Y., Zou, J., and Liu, Q.: Effects of water regime during
rice-growing season on annual direct N2O emission in a paddy
rice-winter wheat rotation system in southeast China, Sci. Total
Environ., 408, 906–913, 2010.
Maestre, F. T. and Cortina, J.: Small-scale spatial variation in soil
CO2 efflux in a Mediterranean semiarid steppe, Appl. Soil Ecol.,
23, 199–209, 2003.
Millar, N. and Baggs, E. M.: Relationships between N2O emissions
and water-soluble C and N contents of agroforestry residues after
their addition to soil, Soil Biol. Biochem., 37, 605–608, 2005.
Minamikawa, K. and Sakai, N.: The effect of water manage-
ment based on soil redox potential on methane emission from
two kinds of paddy soil in Japan, Agr. Ecosyst. Environ., 107,
397–407, 2005.
Nishimura, S., Sawamoto, T., Akiyama, H., Sudo, S., and Yagi, K.:
Methane and nitrous oxide from a paddy field with Japanese con-
ventional water management and fertilizer application, Global
Biogeochem. Cy., 18, GB2017, doi:10.1029/2003GB002207,
2004.
Pathak, H., Bhatia, A., Prasad, S., Singh, S., Kumar, S., Jain, M. C.,
and Kumar, U.: Emissions of nitrous oxide from rice-wheat sys-
tems of Indo-Gangetic plains of India, Environ. Monit. Assess.,
77, 163–178, 2002.
Qin, Y., Liu, S., Guo, Y., Liu, Q., and Zou, J.: Methane and ni-
trous oxide emissions from organic and conventional rice crop-
ping systems in Southeast China, Biol. Fertil. Soils, 46, 825–834,
2010.
Qu, H., Tao, H., Tao, Y., Liu, M., Shen, K., and Lin, S.: Ground
cover rice production system increases yield and nitrogen recov-
ery efficiency, Agron. J., 104, 1399–1407, 2012.
Raich, J. W. and Tufekcioglu, A.: Vegetation and soil respiration:
Correlations and controls, Biogeochemistry, 48, 71–90, 2000.
Rochette, P. and Gregorich, E. G.: Dynamics of soil microbial
biomass C, soluble organic C and CO2 evolution after three years
of manure application, Can. J. Soil Sci., 78, 283–290, 1998.
Sass, R. L., Fisher, F. M., Ding, A., and Huang, Y.: Exchange of
methane from rice fields: national, regional, and global budgets,
J. Geophys. Res., 104, 26943–26951, 1999.
Schindlbacher, A., Zechmeister-Boltenstern, S., and Butterbach-
Bahl, K.: Effects of soil moisture and temperature on NO, NO2
and N2O emissions from European forest soils, J. Geophys. Res.,
109, D1702, doi:10.1029/2004JD004590, 2004.
Shang, Q., Yang, X., Gao, C., Wu, P., Liu, J., Xu, Y., Shen, Q., Zou,
J., and Guo, S.: Net annual global warming potential and green-
house gas intensity in Chinese double rice-cropping systems: a 3-
year field measurement in long-term fertilizer experiments, Glob.
Change Biol., 17, 2196–2210, 2011.
Smith, K. A., Ball, T., Conen, F., Dobbie, K. E., Massheder, J., and
Rey, A.: Exchange of greenhouse gases between soil and atmo-
sphere: interactions of soil physical factors and biological pro-
cesses, Eur. J. Soil Sci., 54, 779–791, 2003.
www.biogeosciences.net/11/1/2014/ Biogeosciences, 11, 1–16, 2014

16 Z. Yao et al.: Water-saving ground cover rice production system
Smith, P., Martino, D., Cai, Z., Gwary, D., Janzen, H., Kumar, P.,
McCarl, B., Ogle, S., O’Mara, F., Rice, C., Scholes, B., and
Sirotenko, O.: Agriculture, in: Climate Change 2007: Mitigation,
Contribution of work group III to the fourth assessment report
of the Intergovernmental Panel on Climate Change, edited by:
Metz, B., Davidson, O. R., Bosch, P. R., Dave, R., and Meyer, L.
A., 497–540, Cambridge University Press, Cambridge, UK and
New York, NY, USA, 2007.
Wang, J., Rothausen, S., Conway, D., Zhang, L., Xiong, W., Hol-
man, I., and Li, Y.: China’s water-energy nexus: greenhouse-gas
emissions from groundwater use for agriculture, Environ. Res.
Lett., 7, 014035, doi:10.1088/1748-9326/7/1/014035, 2012.
Wang, K., Zheng, X., Pihlatie, M., Vesala, T., Liu, C., Haapanala,
S., Mammarella, I., Rannik, Ü., and Liu, H.,: Comparison be-
tween static chamber and tunable diode laser-based eddy covari-
ance techniques for measuring nitrous oxide fluxes from a cotton
field, Agr. Forest Meteorol., 171–172, 9–19, 2013.
Wang, W., Dalal, R., Reeves, S., Butterbach-Bahl, K., and Kiese, R.:
Greenhouse gas fluxes from an Australian subtropical cropland
under long-term contrasting management regimes, Glob. Change
Biol., 17, 3089–3101, 2011.
Wang, Y. H., Wang, Y. S., and Ling, H.: A new carrier gas type for
accurate measurement of N2O by GC-ECD, Adv. Atmos. Sci.,
27, 1322–1330, 2010.
Williams, E. J., Hutchinson, G. L., and Fehsenfeld, F. C.: NOx and
N2O emissions from soil, Global Biogeochem. Cy., 6, 351–388,
1992.
Xie, B., Zheng, X., Zhou, Z., Zhu, B., Chen, X., Shi, Y., Wang,
Y., Zhao, Z., Liu, C., Yao, Z., and Zhu J.: Effects of nitrogen
fertilizer on CH4 emission from rice fields: multi-site field ob-
servations, Plant Soil, 326, 393–401, 2010.
Xu, Y., Shen, Q., Li, M., Dittert, K., and Sattelmacher, B.: Effect of
soil water status and mulching on N2O and CH4 emission from
lowland rice field in China, Biol. Fertil. Soils, 39, 215–217, 2004.
Yagi, K., Tsuruta, H., Kanda, K., and Minami, K.: Effect of water
management on methane emission from a Japanese rice paddy
field: automated methane monitoring, Global Biogeochem. Cy.,
10, 255–267, 1996.
Yan, X., Cai, Z., Ohara, T., and Akimoto, H.: Methane emis-
sion from rice fields in mainland China: Amount and sea-
sonal and spatial distribution, J. Geophys. Res., 108, 4505,
doi:10.1029/2002JD003182, 2003.
Yan, X., Akiyama, H., Yagi, K., and Akimoto, H.: Global esti-
mations of the inventory and mitigation potential of methane
emissions from rice cultivation conducted using the 2006 Inter-
governmental Panel on Climate Change Guidelines, Global Bio-
geochem. Cy., 23, GB2002, doi:10.1029/2008GB003299, 2009.
Yang, S., Peng, S., Xu, J., Luo, Y., and Li, D.: Methane and nitrous
oxide emissions from paddy field as affected by water-saving ir-
rigation, Phy. Chem. Earth, 53–54, 30–37, 2012.
Yao, Z., Zheng, X., Xie, B., Liu, C., Mei, B., Dong, H., Butterbach-
Bahl, K., and Zhu, J.: Comparison of manual and automated
chambers for field measurements of N2O, CH4, CO2 fluxes from
cultivated land, Atmos. Environ., 43, 1888–1896, 2009.
Yao, Z., Zhou, Z., Zheng, X., Xie, B., Mei, B., Wang, R.,
Butterbach-Bahl, K., and Zhu, J.: Effects of organic matter in-
corporation on nitrous oxide emissions from rice-wheat rotation
ecosystems in China, Plant Soil, 327, 315–330, 2010.
Yao, Z., Zheng, X., Dong, H., Wang, R., Mei, B., and Zhu, J.: A 3-
year record of N2O and CH4 emissions from a sandy loam paddy
during rice seasons as affected by different nitrogen application
rates, Agr. Ecosyst. Environ., 152, 1–9, 2012.
Yao, Z., Zheng, X., Wang, R., Xie, B., Butterbach-Bahl, K., and
Zhu, J.: Nitrous oxide and methane fluxes from a rice-wheat crop
rotation under wheat residue incorporation and no-tillage prac-
tices, Atmos. Environ., 79, 641–649, 2013a.
Yao, Z., Zheng, X., Wang, R., Dong, H., Xie, B., Mei, B., Zhou,
Z., and Zhu, J.: Greenhouse gas fluxes and NO release from
a Chinese subtropical rice-winter wheat rotation system under
nitrogen fertilizer management, J. Geophys. Res.-Biogeo., 118,
623–638, 2013b.
Zheng, X., Wang, M., Wang, Y., Shen, R., Gou, J., Li, J., Jin, J.,
and Li, L. T.: Impacts of soil moisture on nitrous oxide emission
from croplands: a case study on the rice-based agro-ecosystem in
Southeast China, Chemosphere-Global Change Sci., 2, 207–224,
2000.
Zheng, X., Han, S., Huang, Y., Wang, Y., and Wang, M.:
Re-quantifying the emission factors based on field mea-
surements and estimating the direct N2O emission from
Chinese croplands, Global Biogeochem. Cy., 18, GB2018,
doi:10.1029/2003GB002167, 2004.
Zheng, X., Mei, B., Wang, Y. H., Xie, B., Wang, Y. S., Dong, H., Xu,
H., Chen, G., Cai, Z., Yue, J., Gu, J., Su, F., Zou, J., and Zhu, J.:
Quantification of N2O fluxes from soil-plant systems may be bi-
ased by the applied gas chromatograph methodology, Plant Soil,
311, 211–234, 2008.
Zhou, S. D., Herzfeld, T., Glauben, T., Zhang, Y. H., and Hu, B. C.:
Factors affecting Chinese farmers’ decisions to adopt a water-
saving technology, Can. J. Agric. Econ., 56, 51–61, 2008.
Zou, J., Huang, Y., Jiang, J., Zheng, X., and Sass, R. L.: A 3-year
field measurement of methane and nitrous oxide emissions from
rice paddies in China: Effects of water regime, crop residue,
and fertilizer application, Global Biogeochem. Cy., 19, GB2021,
doi:10.1029/2004GB002401, 2005a.
Zou, J., Huang, Y., Lu, Y., Zheng, X., and Wang, Y.: Direct emis-
sion factor for N2O from rice-winter wheat rotation systems in
southeast China, Atmos. Environ., 39, 4755–4765, 2005b.
Biogeosciences, 11, 1–16, 2014 www.biogeosciences.net/11/1/2014/