Quantifying N response and N use efficiency in rice–wheat (RW) cropping systems under different...
10
Quantifying N response and N use efficiency in rice–wheat (RW) cropping systems under different water management Q. JING 1,2,3 *, H. VAN KEULEN 2,3 , H.HENGSDIJK 2 , W. CAO 1 , P.S. BINDRABAN 2 , T. DAI 1 AND D.JIANG 1 1 Key Laboratory of Crop Growth Regulation, Ministry of Agriculture, Nanjing Agricultural University, Nanjing 210095, China 2 Plant Research International, Wageningen University and Research Centre, P.O. Box 16, 6700 AA, Wageningen, The Netherlands 3 Group Plant Production Systems, Wageningen University, P.O. Box 430, 6700 AK, Wageningen, The Netherlands (Revised MS received 7 December 2008; First published online 26 February 2009) SUMMARY About 0 . 10 of the food supply in China is produced in rice–wheat (RW) cropping systems. In recent decades, nitrogen (N) input associated with intensification has increased much more rapidly than N use in these systems. The resulting nitrogen surplus increases the risk of environmental pollution as well as production costs. Limited information on N dynamics in RW systems in relation to water management hampers development of management practices leading to more efficient use of nitrogen and water. The present work studied the effects of N and water management on yields of rice and wheat, and nitrogen use efficiencies (NUEs) in RW systems. A RW field experiment with nitrogen rates from 0 to 300 kg N/ha with continuously flooded and intermittently irrigated rice crops was carried out at the Jiangpu experimental station of Nanjing Agricultural University of China from 2002 to 2004 to identify improved nitrogen management practices in terms of land productivity and NUE. Nitrogen uptake by rice and wheat increased with increasing N rates, while agronomic NUE (kg grain/kg N applied) declined at rates exceeding 150 kg N/ha. The highest combined grain yields of rice and wheat were obtained at 150 and 300 kg N/ha per season in rice and wheat, respectively. Carry-over of residual N from rice to the subsequent wheat crop was limited, consistent with low soil nitrate after rice harvest. Total soil N hardly changed during the experiment, while soil nitrate was much lower after wheat than after rice harvest. Water management did not affect yield and N uptake by rice, but apparent N recovery was higher under intermittent irrigation (II). In one season, II management in rice resulted in higher yield and N uptake in the subsequent wheat season. Uptake of indigenous soil N was much higher in rice than in wheat, while in rice it was much higher than values reported in the literature, which may have consequences for nitrogen fertilizer recommendations based on indigenous N supply. INTRODUCTION In China, as in many other parts of Asia, rice and wheat are grown frequently in rotation. Rice–wheat (RW) systems occupy 0 . 10 of the arable area in China, mainly along the Yangtze River (Huke & Huke 1992). These systems are of major importance for ensuring China’s food security. The population of China is expected to increase by nearly half a billion people by 2030 (FAO 2003), requiring large ad- ditional quantities of rice and wheat. Since suitable agricultural land is scarce in China, RW systems are managed very intensively, i.e. with high inputs to * To whom all correspondence should be addressed. Email: [email protected] and [email protected] Journal of Agricultural Science (2009), 147, 303–312. f 2009 Cambridge University Press 303 doi:10.1017/S0021859609008466 Printed in the United Kingdom
Transcript of Quantifying N response and N use efficiency in rice–wheat (RW) cropping systems under different...
Quantifying N response and N use efficiency
in rice–wheat (RW) cropping systems under different
water management
Q. JING 1,2,3*, H. VAN KEULEN 2,3, H. HENGSDIJK 2, W. CAO 1, P. S . BINDRABAN 2,T. DAI 1 AND D. JIANG1
1Key Laboratory of Crop Growth Regulation, Ministry of Agriculture, Nanjing Agricultural University,Nanjing 210095, China
2Plant Research International, Wageningen University and Research Centre, P.O. Box 16, 6700 AA,Wageningen, The Netherlands
3Group Plant Production Systems, Wageningen University, P.O. Box 430, 6700 AK, Wageningen,The Netherlands
(Revised MS received 7 December 2008; First published online 26 February 2009)
SUMMARY
About 0.10 of the food supply in China is produced in rice–wheat (RW) cropping systems. In recentdecades, nitrogen (N) input associated with intensification has increased much more rapidly thanN use in these systems. The resulting nitrogen surplus increases the risk of environmental pollution aswell as production costs. Limited information on N dynamics in RW systems in relation to watermanagement hampers development of management practices leading to more efficient use of nitrogenand water. The present work studied the effects of N and water management on yields of rice andwheat, and nitrogen use efficiencies (NUEs) in RW systems. A RW field experiment with nitrogenrates from 0 to 300 kg N/ha with continuously flooded and intermittently irrigated rice crops wascarried out at the Jiangpu experimental station of Nanjing Agricultural University of China from2002 to 2004 to identify improved nitrogen management practices in terms of land productivity andNUE.Nitrogen uptake by rice and wheat increased with increasing N rates, while agronomic NUE
(kg grain/kg N applied) declined at rates exceeding 150 kg N/ha. The highest combined grain yieldsof rice and wheat were obtained at 150 and 300 kg N/ha per season in rice and wheat, respectively.Carry-over of residual N from rice to the subsequent wheat crop was limited, consistent with low soilnitrate after rice harvest. Total soil N hardly changed during the experiment, while soil nitrate wasmuch lower after wheat than after rice harvest. Water management did not affect yield and N uptakeby rice, but apparent N recovery was higher under intermittent irrigation (II). In one season, IImanagement in rice resulted in higher yield and N uptake in the subsequent wheat season. Uptake ofindigenous soil N was much higher in rice than in wheat, while in rice it was much higher than valuesreported in the literature, which may have consequences for nitrogen fertilizer recommendationsbased on indigenous N supply.
INTRODUCTION
In China, as in many other parts of Asia, rice andwheat are grown frequently in rotation. Rice–wheat(RW) systems occupy 0.10 of the arable area in
China, mainly along the Yangtze River (Huke &Huke 1992). These systems are of major importancefor ensuring China’s food security. The population ofChina is expected to increase by nearly half a billionpeople by 2030 (FAO 2003), requiring large ad-ditional quantities of rice and wheat. Since suitableagricultural land is scarce in China, RW systemsare managed very intensively, i.e. with high inputs to
* To whom all correspondence should be addressed.Email : [email protected] and [email protected]
Journal of Agricultural Science (2009), 147, 303–312. f 2009 Cambridge University Press 303doi:10.1017/S0021859609008466 Printed in the United Kingdom

maximize yields per unit of land. Extremely highannual doses of 500–650 kg N/ha are common in RWsystems (Zhu et al. 2000), with low nitrogen use ef-ficiency (NUE) (Xu &Wu 1999; Cui et al. 2000; Penget al. 2002), particularly in southern Jiangsu Province.Applying N beyond crop needs results in undesirableemissions to the environment, such as gaseous andleaching losses and runoff to surface water, and inunnecessary production costs for farmers (Li & Zhang1999; Xing & Zhu 2000).Commonly, the rice crop in RW systems is grown
by keeping a permanent layer of water on the field,resulting in higher seepage and percolation lossesthan in the wheat crop. Competing claims for freshwater sources call for more efficient use of irrigationwater in rice production (Bouman & Tuong 2001;Bouman et al. 2006). To reduce water use in irrigatedrice, water-saving techniques are being developed.These include the introduction of periods with satu-rated, but non-flooded, soil conditions during partof the growing period, also known as intermittentirrigation (II) (Mao 1993), direct seeding of rice undernon-flooded conditions (Xie et al. 1995) and theintroduction of ground cover, reducing evaporationlosses (Lin et al. 2002). II can reduce water inputwithout affecting yields (Belder et al. 2004, 2005).Water-saving techniques in rice may also improve soilphysical and biological properties for the associatedwheat crop (Timsina & Connor 2001), resulting inincreased NUEs in the wheat (Zheng 2000).There has been considerable research on N dy-
namics in rice and wheat separately, but few studieshave described those dynamics in RW systems(Timsina et al. 2001). Information on N dynamicsin RW systems in relation to II is especially scarce,which constrains the development of RW systemswith improved water and NUEs. The present studyexamines N response and NUE in a RW system basedon a 2-year field experiment with two seasons of riceand wheat, different nitrogen regimes and differentwater management in the rice crop, including con-ventional flooding and II.
MATERIALS AND METHODS
Experimental design
The experiments were carried out at the Jiangpuexperimental station of Nanjing Agricultural Uni-versity at Nanjing (32x04kN, 118x48kE) from 2002to 2004, covering two sequences of rice and wheatcrops. The soil is a clayey loam (Anthrosol ; FAO2006) with pH 7.1, soil organic matter content16.3 g/kg, total N content 1.6 g/kg, available phos-phorus 23.9 mg/kg and available potassium 95.7 mg/kg in the 0–400 mm soil layer. The japonica rice cul-tivar Wuxiangjing9 and wheat cultivar Yangmai10were grown.
Management and treatments in the rice season
The experiment was a two-factor split plot designwith three replicates. The main factor, water man-agement, consisted of two treatments, i.e. conven-tional irrigation (CI) and II. The sub-factor nitrogenmanagement consisted of five application rates, i.e.0, 75, 150, 225 and 300 kg N/ha. Plot size was 10r3 m2. Plots were separated by plastic film to 300 mmbelow soil surface to reduce water and nitrogen flowsbetween adjacent plots. In 2002, rice was sown on11 May and transplanted as six-leaf seedlings on15 June at one seedling per hill, spaced at 250 and150 mm between and within the rows, respectively.Because of differences in maturity, the 0 kg N/haplots were harvested on 5 October, the remainingII-plots on 15 October and the remaining CI-plots on21 October. After transplanting, the CI treatmentwas flooded with a water layer of 20–50 mm, exceptduring mid-season drainage for 2 days, starting on31 July, and for 5 days, starting on 25 August.Relative soil water content (defined as soil watercontent divided by field capacity) in II was main-tained throughout the growth period between c. 0.85(when the soil started to form cracks) and saturation,through drainage or irrigation. Before transplant-ing, 0.60 of the total nitrogen was applied as basalfertilizer, another 0.20 at 15 days after jointing,and the remaining 0.20 at 25 days after jointing (5–10days before heading). In addition to nitrogen, 135 kgP2O5 and 210 kg K2O/ha were applied as basal ferti-lizer.In 2003, rice was sown on 15 May and transplanted
on 15 June in a 300r150 mm pattern. All plots wereharvested on 23 October. Crop management wasidentical to that in 2002.
Management and treatments in the wheat season
In 2002, after the rice harvest, the land was ploughedand seed was drilled on 9 November at 180 grains/m2.Each rice plot was sub-divided into three to applythree N rates to wheat, i.e. 0, 150 and 300 kg N/ha.Before sowing, 0.60 of the N was applied, and theremainder was top-dressed at the jointing stage. Inaddition, 135 kg P2O5 and 210 kg K2O/ha wereapplied as basal fertilizer. Wheat was harvested on3 June.In 2003, an alternative layout was selected, based
on the results of the previous year: the rice plots ofeach N treatment were split into two, with half re-ceiving the same N-doses as in the rice season, whilethe other half did not receive any N. Before sowingof the wheat crop, the soil was prepared with a rotat-ing plough and 0.60 of the fertilizer was applied, theremainder being applied in equal splits at jointingand booting. All plots received 135 kg P2O5 and210 kg K2O/ha as basal fertilizer. Wheat was sown
304 Q. J ING ET AL.
on 6 November at a density of 150 grains/m2 and washarvested on 26 May.
Measurements
Dry weight and nitrogen content
During the entire experiment, dates of key growthstages of crops were recorded. Rice and wheat plantswere harvested from 1 m2 subplots to determine pan-icle and spike number, grain number/panicle, grainnumber/spike and grain weight. The proportion offilled grains was determined from the number of filledgrains/panicle. Filled grains were selected in a NaClsolution with a specific gravity of 1.03. Plant samples,separated in grain and straw, were oven-dried at80 xC for 2 days. The yields were measured fromthe samples and expressed on the basis of 0.86 g drymatter (DM)/g fresh weight moisture content forboth crops. Concentrations of N in grain and strawwere determined by micro-Kjeldahl (AOAC 1984),following digestion in a H2SO4–H2O2 solution.
Soil nitrogen
Total and nitrate nitrogen in the 0–400 and400–800 mm soil layers were periodically monitored,both before and after crop growth in the plots of0, 150 and 300 kg N/ha and under both water man-agement treatments. Nitrate (NO3-N) was extractedfrom fresh soil samples using an equilibrium extrac-tion with 2.0 N KCl solution and analysed using aflow analyser. Total soil N was determined after air-drying of soil samples, using micro-Kjeldahl, follow-ing digestion in a H2SO4–H2O2 solution. Nitrate andtotal N were expressed in kg/ha using the bulk densityof each soil layer.
NUE indicators and analysis
Apparent nitrogen recovery (ANR) is the ratio of thedifference in N uptake between the treated and thezero-fertilizer plot to the application rate. Physio-logical NUE (kg grain DM/kg N) is defined as grainproduction per unit N uptake by the crop, whileagronomic efficiency (AE, in kg grain DM/kg N) isdefined as grain production per unit N applied. Thesecharacteristics are presented in three-quadrant graphs(De Wit 1953; Van Keulen 1982): one quadrant pres-ents grain yield against N application (fertilizer re-sponse curve, AE), the second, yield against N uptake(yield–uptake curve, NUE), and the third relates Napplication to N uptake (application–uptake curve,ANR). Only two out of these three relations aremutually independent, the third relation always fol-lows from the other two.
Weather data
Daily radiation, precipitation, maximum and mini-mum temperature data were collected from a
meteorological station located 1 km from the exper-iments.
Data analysis
GenStat for Windows, 8th edition (http://www.vsn-intl.com/genstat/) was used for the data analysis, i.e.establishing effects of management and N rates, andtheir interactions on yield, yield components and soilN. Statistical differences were determined using Waldstatistics.
RESULTS
Weather
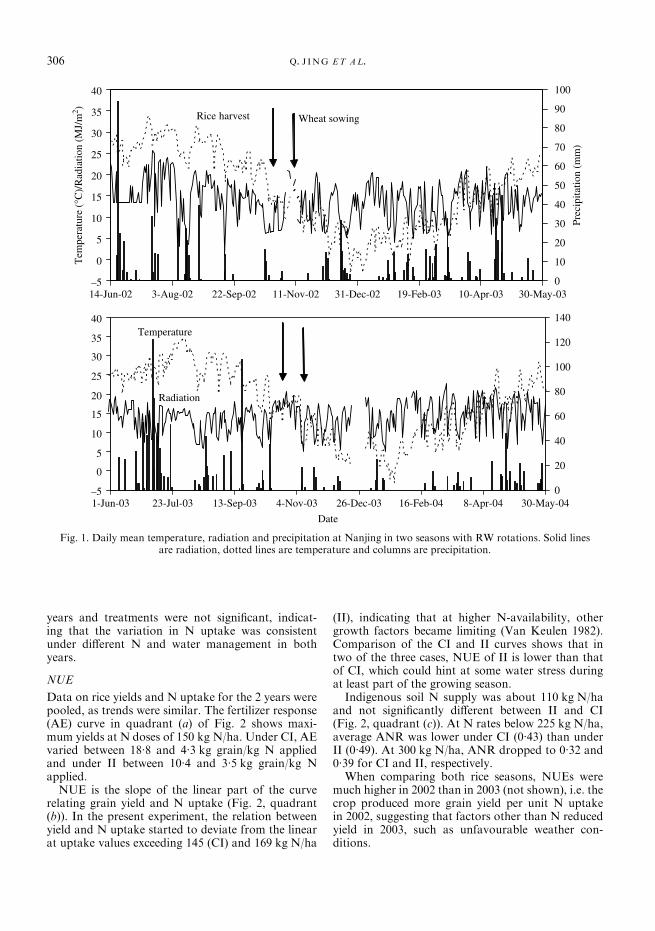
Average daily solar radiation during the first rice-growing season was 14.9 MJ/m2 compared to13.2 MJ/m2 during the second season (Fig. 1). Rain-fall in the second rice season was more frequentand much higher than in the first rice season (1054v. 421 mm). Average temperature was 25.7 xC in thefirst v. 25.1 xC in the second season. Frequency ofrainfall in the first wheat season was higher than inthe second, although total rainfall was similar (511v. 435 mm). However, the higher rainfall frequencyand the associated cloudiness resulted in lower aver-age daily solar radiation during the first wheatseason: 13.0 MJ/m2 compared to 14.4 MJ/m2 duringthe second season. Consistent with the radiationlevels, average temperature during the first wheatseason was 10.1 v. 11.4 xC in the second season.
Rice
Grain yield
In both seasons, yields increased with N rates exceptfor the highest N rate (Table 1). Neither water man-agement nor the interaction of water and nitrogenhad an effect on yields. The lower yield at the highestN rate was associated with the lowest proportion offilled grains. The number of spikelets was 26% higherin the first year than in the second year, and associ-ated with a 20% higher grain yield. There was nointeraction between years and treatments, indicatingconsistent yield responses across years.
Aboveground N uptake
N uptake was similar for both water managementtreatments (Table 1), but uptake increased with in-creasing N rates. Below 150 kg N/ha, total crop Nuptake exceeded N fertilizer input, while at the higherrates it was reversed. There was no interactionbetween N and water management on N uptake.Consistent with the yield difference between bothyears, crop N uptake in 2002 was clearly higher thanin 2003 (194 v. 149 kg N/ha), associated with N up-take in the control (0 kg N/ha) plots, i.e. 130 kg N/hain 2002 and 91 kg N/ha in 2003. Interactions between
Nitrogen use efficiency in rice–wheat rotations 305
years and treatments were not significant, indicat-ing that the variation in N uptake was consistentunder different N and water management in bothyears.
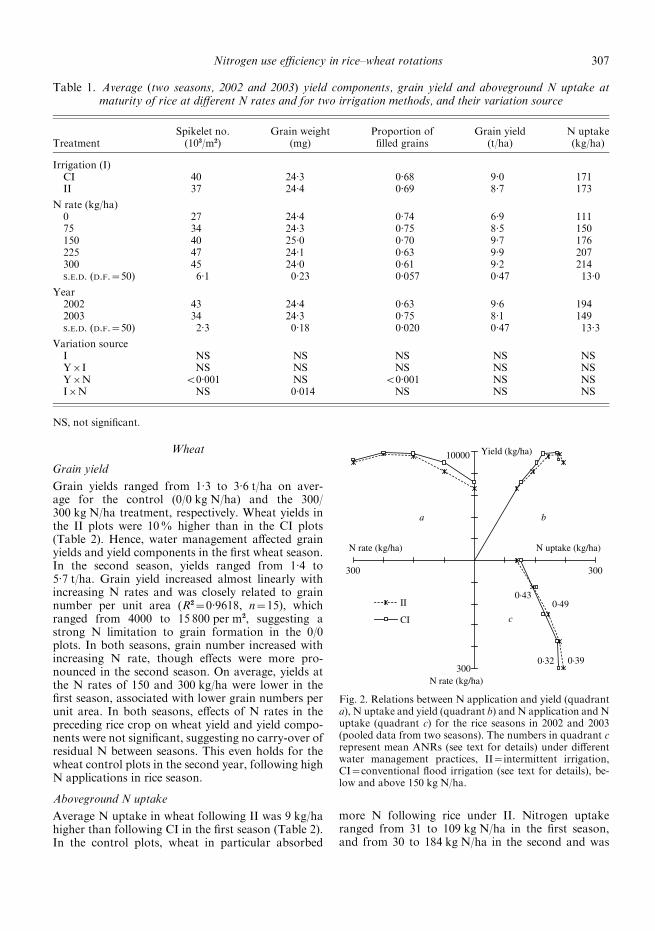
NUE
Data on rice yields and N uptake for the 2 years werepooled, as trends were similar. The fertilizer response(AE) curve in quadrant (a) of Fig. 2 shows maxi-mum yields at N doses of 150 kg N/ha. Under CI, AEvaried between 18.8 and 4.3 kg grain/kg N appliedand under II between 10.4 and 3.5 kg grain/kg Napplied.NUE is the slope of the linear part of the curve
relating grain yield and N uptake (Fig. 2, quadrant(b)). In the present experiment, the relation betweenyield and N uptake started to deviate from the linearat uptake values exceeding 145 (CI) and 169 kg N/ha
(II), indicating that at higher N-availability, othergrowth factors became limiting (Van Keulen 1982).Comparison of the CI and II curves shows that intwo of the three cases, NUE of II is lower than thatof CI, which could hint at some water stress duringat least part of the growing season.Indigenous soil N supply was about 110 kg N/ha
and not significantly different between II and CI(Fig. 2, quadrant (c)). At N rates below 225 kg N/ha,average ANR was lower under CI (0.43) than underII (0.49). At 300 kg N/ha, ANR dropped to 0.32 and0.39 for CI and II, respectively.When comparing both rice seasons, NUEs were
much higher in 2002 than in 2003 (not shown), i.e. thecrop produced more grain yield per unit N uptakein 2002, suggesting that factors other than N reducedyield in 2003, such as unfavourable weather con-ditions.
Temperature
–5
0
5
10
15
20
25
30
35
40
1-Jun-03 23-Jul-03 13-Sep-03 4-Nov-03 26-Dec-03 16-Feb-04 8-Apr-04 30-May-04
Radiation
0
20
40
60
80
100
120
140
Date
Rice harvest
–5
0
5
10
15
20
25
30
35
40
14-Jun-02 3-Aug-02 22-Sep-02 11-Nov-02 31-Dec-02 19-Feb-03 10-Apr-03 30-May-03
Wheat sowing
Tem
pera
ture
(°C
)/R
adia
tion
(MJ/
m2 )
0
10
20
30
40
50
60
70
80
90
100
Prec
ipita
tion
(mm
)
Fig. 1. Daily mean temperature, radiation and precipitation at Nanjing in two seasons with RW rotations. Solid linesare radiation, dotted lines are temperature and columns are precipitation.
306 Q. J ING ET AL.
Wheat
Grain yield
Grain yields ranged from 1.3 to 3.6 t/ha on aver-age for the control (0/0 kg N/ha) and the 300/300 kg N/ha treatment, respectively. Wheat yields inthe II plots were 10% higher than in the CI plots(Table 2). Hence, water management affected grainyields and yield components in the first wheat season.In the second season, yields ranged from 1.4 to5.7 t/ha. Grain yield increased almost linearly withincreasing N rates and was closely related to grainnumber per unit area (R2=0.9618, n=15), whichranged from 4000 to 15 800 per m2, suggesting astrong N limitation to grain formation in the 0/0plots. In both seasons, grain number increased withincreasing N rate, though effects were more pro-nounced in the second season. On average, yields atthe N rates of 150 and 300 kg/ha were lower in thefirst season, associated with lower grain numbers perunit area. In both seasons, effects of N rates in thepreceding rice crop on wheat yield and yield compo-nents were not significant, suggesting no carry-over ofresidual N between seasons. This even holds for thewheat control plots in the second year, following highN applications in rice season.
Aboveground N uptake
Average N uptake in wheat following II was 9 kg/hahigher than following CI in the first season (Table 2).In the control plots, wheat in particular absorbed
more N following rice under II. Nitrogen uptakeranged from 31 to 109 kg N/ha in the first season,and from 30 to 184 kg N/ha in the second and was
Table 1. Average (two seasons, 2002 and 2003) yield components, grain yield and aboveground N uptake atmaturity of rice at different N rates and for two irrigation methods, and their variation source
TreatmentSpikelet no.(103/m2)
Grain weight(mg)
Proportion offilled grains
Grain yield(t/ha)
N uptake(kg/ha)
Irrigation (I)CI 40 24.3 0.68 9.0 171II 37 24.4 0.69 8.7 173
N rate (kg/ha)0 27 24.4 0.74 6.9 11175 34 24.3 0.75 8.5 150150 40 25.0 0.70 9.7 176225 47 24.1 0.63 9.9 207300 45 24.0 0.61 9.2 214S.E.D. (D.F.=50) 6.1 0.23 0.057 0.47 13.0
Year2002 43 24.4 0.63 9.6 1942003 34 24.3 0.75 8.1 149S.E.D. (D.F.=50) 2.3 0.18 0.020 0.47 13.3
Variation sourceI NS NS NS NS NSYrI NS NS NS NS NSYrN <0.001 NS <0.001 NS NSIrN NS 0.014 NS NS NS
NS, not significant.
a b
0·430·49
0·39
c
0·32
II
CI
N uptake (kg/ha)N rate (kg/ha)
Yield (kg/ha)
N rate (kg/ha)
300 300
10000
300
Fig. 2. Relations between N application and yield (quadranta), N uptake and yield (quadrant b) and N application andNuptake (quadrant c) for the rice seasons in 2002 and 2003(pooled data from two seasons). The numbers in quadrant crepresent mean ANRs (see text for details) under differentwater management practices, II=intermittent irrigation,CI=conventional flood irrigation (see text for details), be-low and above 150 kg N/ha.
Nitrogen use efficiency in rice–wheat rotations 307
significantly affected by N rates, but not by the Nrates on the preceding rice crop, indicating no carry-over of residual N in either year.
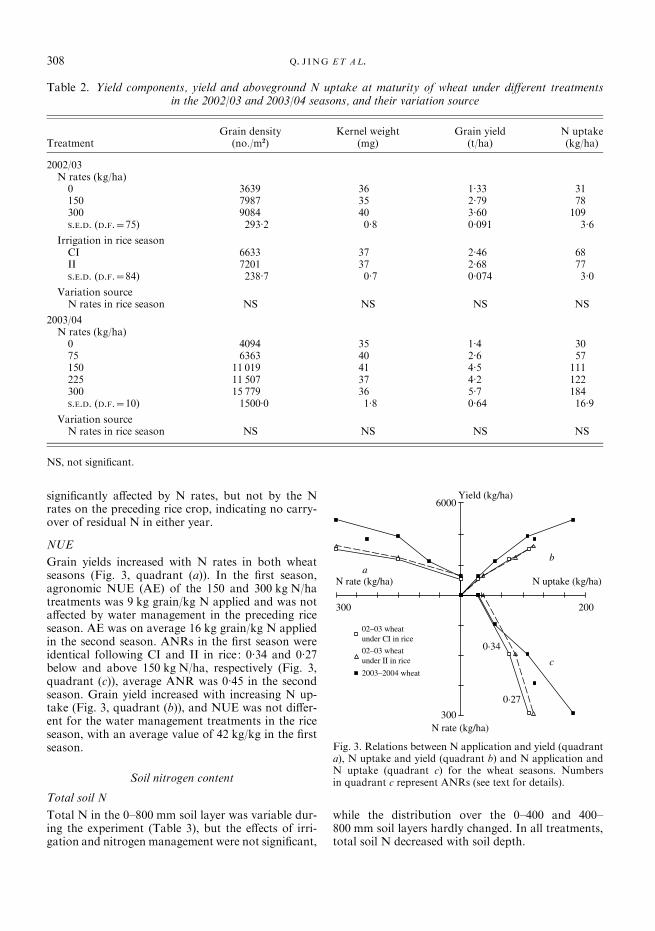
NUE
Grain yields increased with N rates in both wheatseasons (Fig. 3, quadrant (a)). In the first season,agronomic NUE (AE) of the 150 and 300 kg N/hatreatments was 9 kg grain/kg N applied and was notaffected by water management in the preceding riceseason. AE was on average 16 kg grain/kg N appliedin the second season. ANRs in the first season wereidentical following CI and II in rice: 0.34 and 0.27below and above 150 kg N/ha, respectively (Fig. 3,quadrant (c)), average ANR was 0.45 in the secondseason. Grain yield increased with increasing N up-take (Fig. 3, quadrant (b)), and NUE was not differ-ent for the water management treatments in the riceseason, with an average value of 42 kg/kg in the firstseason.
Soil nitrogen content
Total soil N
Total N in the 0–800 mm soil layer was variable dur-ing the experiment (Table 3), but the effects of irri-gation and nitrogen management were not significant,
while the distribution over the 0–400 and 400–800 mm soil layers hardly changed. In all treatments,total soil N decreased with soil depth.
Table 2. Yield components, yield and aboveground N uptake at maturity of wheat under different treatmentsin the 2002/03 and 2003/04 seasons, and their variation source
TreatmentGrain density
(no./m2)Kernel weight
(mg)Grain yield
(t/ha)N uptake(kg/ha)
2002/03N rates (kg/ha)0 3639 36 1.33 31150 7987 35 2.79 78300 9084 40 3.60 109S.E.D. (D.F.=75) 293.2 0.8 0.091 3.6
Irrigation in rice seasonCI 6633 37 2.46 68II 7201 37 2.68 77S.E.D. (D.F.=84) 238.7 0.7 0.074 3.0
Variation sourceN rates in rice season NS NS NS NS
2003/04N rates (kg/ha)0 4094 35 1.4 3075 6363 40 2.6 57150 11 019 41 4.5 111225 11 507 37 4.2 122300 15 779 36 5.7 184S.E.D. (D.F.=10) 1500.0 1.8 0.64 16.9
Variation sourceN rates in rice season NS NS NS NS
NS, not significant.
6000
300
0·34
0·27
ab
c
02–03 wheat under CI in rice
02–03 wheat under II in rice
2003–2004 wheat
N uptake (kg/ha)N rate (kg/ha)
Yield (kg/ha)
N rate (kg/ha)
300 200
Fig. 3. Relations between N application and yield (quadranta), N uptake and yield (quadrant b) and N application andN uptake (quadrant c) for the wheat seasons. Numbersin quadrant c represent ANRs (see text for details).
308 Q. J ING ET AL.
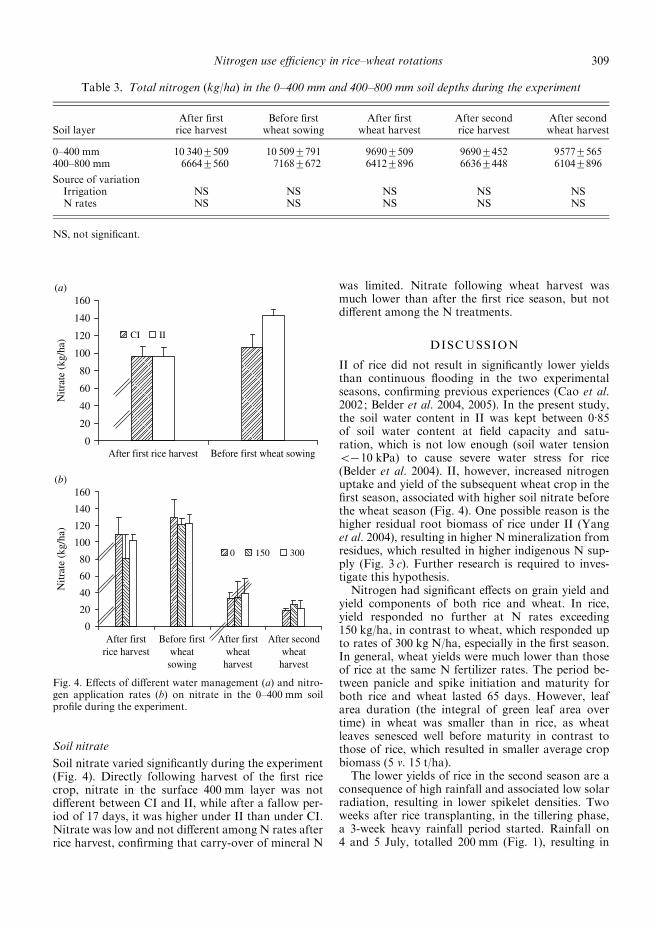
Soil nitrate
Soil nitrate varied significantly during the experiment(Fig. 4). Directly following harvest of the first ricecrop, nitrate in the surface 400 mm layer was notdifferent between CI and II, while after a fallow per-iod of 17 days, it was higher under II than under CI.Nitrate was low and not different among N rates afterrice harvest, confirming that carry-over of mineral N
was limited. Nitrate following wheat harvest wasmuch lower than after the first rice season, but notdifferent among the N treatments.
DISCUSSION
II of rice did not result in significantly lower yieldsthan continuous flooding in the two experimentalseasons, confirming previous experiences (Cao et al.2002; Belder et al. 2004, 2005). In the present study,the soil water content in II was kept between 0.85of soil water content at field capacity and satu-ration, which is not low enough (soil water tension<x10 kPa) to cause severe water stress for rice(Belder et al. 2004). II, however, increased nitrogenuptake and yield of the subsequent wheat crop in thefirst season, associated with higher soil nitrate beforethe wheat season (Fig. 4). One possible reason is thehigher residual root biomass of rice under II (Yanget al. 2004), resulting in higher N mineralization fromresidues, which resulted in higher indigenous N sup-ply (Fig. 3 c). Further research is required to inves-tigate this hypothesis.Nitrogen had significant effects on grain yield and
yield components of both rice and wheat. In rice,yield responded no further at N rates exceeding150 kg/ha, in contrast to wheat, which responded upto rates of 300 kg N/ha, especially in the first season.In general, wheat yields were much lower than thoseof rice at the same N fertilizer rates. The period be-tween panicle and spike initiation and maturity forboth rice and wheat lasted 65 days. However, leafarea duration (the integral of green leaf area overtime) in wheat was smaller than in rice, as wheatleaves senesced well before maturity in contrast tothose of rice, which resulted in smaller average cropbiomass (5 v. 15 t/ha).The lower yields of rice in the second season are a
consequence of high rainfall and associated low solarradiation, resulting in lower spikelet densities. Twoweeks after rice transplanting, in the tillering phase,a 3-week heavy rainfall period started. Rainfall on4 and 5 July, totalled 200 mm (Fig. 1), resulting in
0
20
40
60
80
100
120
140
160
After firstrice harvest
Before firstwheat
sowing
After firstwheatharvest
After secondwheatharvest
Nitr
ate
(kg/
ha)
0 150 300
0
20
40
60
80
100
120
140
160
After first rice harvest Before first wheat sowing
Nitr
ate
(kg/
ha) CI II
(a)
(b)
Fig. 4. Effects of different water management (a) and nitro-gen application rates (b) on nitrate in the 0–400 mm soilprofile during the experiment.
Table 3. Total nitrogen (kg/ha) in the 0–400 mm and 400–800 mm soil depths during the experiment
Soil layerAfter firstrice harvest
Before firstwheat sowing
After firstwheat harvest
After secondrice harvest
After secondwheat harvest
0–400 mm 10 340¡509 10 509¡791 9690¡509 9690¡452 9577¡565400–800 mm 6664¡560 7168¡672 6412¡896 6636¡448 6104¡896
Source of variationIrrigation NS NS NS NS NSN rates NS NS NS NS NS
NS, not significant.
Nitrogen use efficiency in rice–wheat rotations 309
complete submergence of the crop for 2 days.Radiation before anthesis was lower in 2003 than in2002 (Table 4), resulting in lower growth rates andthus lower spikelet densities (Kropff et al. 1994). Thedifference in yield between the 2 years was also con-sistent with the difference in photothermal quotient(PTQ), defined by Nix (1976) as the ratio of meandaily radiation for an interval to mean temperatureminus a base temperature. PTQ prior to anthesisshowed a positive linear relationship to grain yield(Nix 1976; Islam & Morison 1992; Ortiz-Monasterioet al. 1994).N rates in the preceding rice season did not affect
wheat yields, suggesting that there was little N carry-over from the rice season to wheat, which is sup-ported by low total soil nitrogen and nitrate after riceharvest. This is consistent with results from Ladhaet al. (2000), showing no residual effect on rice grainyield and N uptake after 8 years of urea–N appli-cation. Fan et al. (2005) also observed no differencesin soil mineral N after rice harvest following differentN rates in rice. In contrast to the present results,however, Fan et al. (2005) observed differences inresidual mineral N following differential N rates onwheat. These divergent results may reflect differencesin experimental conditions (soil and climate).In the 2002/03 season, wheat yields were lower than
in 2003/04 and the yields (4.5–6.0 t/ha) commonlyrealized at application rates of 135–315 kg N/ha afterrice in South Jiangsu (Xu & Wu 1999; Wang et al.
2003). The lower radiation and PTQ during the20 days prior to anthesis in the first wheat season(Table 4) resulted in much lower grain numbers (Nix1976; Fischer 1985; Bindraban et al. 1998), whichmay have created sink limitations during grain filling.The pooled rice data showed higher ANRs under II
than under CI, in line with other reports (Belder et al.2005). Low ANRs may have been caused by higher Nlosses under CI due to de-nitrification and ammoniavolatilization (Cai et al. 1986; Zhu et al. 1989). Watermanagement treatments in the previous rice seasonhad no effect on ANR of wheat.Dobermann et al. (2003) reported strong variations
in indigenous N supply in different areas of Asia, witha maximum value of 80 kg/ha in irrigated rice inJinhua, Zhejiang Province in Southeast China. In thepresent experiment, indigenous soil N supply was130 kg/ha in the first rice season and 91 kg/ha in thesecond, which was fully reflected in differences inrice yields of the control plots between the two years,i.e. 7.2 t/ha in 2002 and 6.7 t/ha in 2003. Potentialindigenous N supply in rice in Southeast China maythus be substantially higher than the widely acceptedrate of 80 kg N/ha, which should have conse-quences for nitrogen recommendations in rice (Witt& Dobermann 2004). Indigenous N supply wasmuch lower in the wheat season, i.e. about 30 kg/ha(Table 2). This difference in indigenous soil N supplyshould be accounted for in nutrient management ofRW systems.
REFERENCES
AOAC (1984). Official Methods of Analysis, 14th edn. Ar-lington, VA: Association of Official Analytical Chemists.
BELDER, P., BOUMAN, B. A. M., CABANGON, R., LU, G.,QUILANG, E. J. P., LI, Y., SPIERTZ, J. H. J. & TUONG, T. P.(2004). Effect of water-saving irrigation on rice yield andwater use in typical lowland conditions in Asia. Agri-cultural Water Management 65, 193–210.
BELDER, P., SPIERTZ, J. H. J., BOUMAN, B. A. M., LU, G.& TUONG, T. P. (2005). Nitrogen economy and waterproductivity of lowland rice under water-saving irri-gation. Field Crops Research 93, 169–185.
BINDRABAN, P. S., SAYRE, K. D. & SOLIS-MOYA, E. (1998).Identifying factors that determine kernel number inwheat. Field Crops Research 58, 223–234.
Table 4. The PTQ and radiation (R) from 20 days prior to panicle initiation (PI-20) to PI and from PI toanthesis (A) in rice and from 20 days prior to anthesis (A-20) to A in wheat in two seasons
Season
Rice Wheat
PTQMJ/(m2rdrxC)
RMJ/(m2rd)
PTQMJ/(m2rdrxC)
RMJ/(m2rd)
PI-20 to PI PI to A PI-20 to PI PI to A A-20 to A A-20 to A
First season 0.89 0.74 19.5 14.6 1.27 13.8Second season 0.58 0.53 11.6 12.4 1.42 16.9
PTQ is defined as the ratio of the mean daily total incident solar radiation for an interval to the mean temperature less thebase temperature (Nix 1976). The base temperature for japonica rice is 8 xC and for wheat 4.5 xC.
310 Q. J ING ET AL.
BOUMAN, B. A. M. & TUONG, T. P. (2001). Field watermanagement to save water and increase its productivityin irrigated lowland rice. Agricultural Water Management49, 11–30.
BOUMAN, B. A. M., HUMPHREYS, E., TUONG, T. P. & BARKER,R. (2006). Rice and water. Advances in Agronomy 92,187–237.
CAI, G., ZHU, Z., TREVITT, A. C. F., FRENEY, J. R. &SIMPSON, J. R. (1986). Nitrogen loss from ammonium bi-carbonate and urea fertilizers applied to flooded rice.Fertilizer Research 10, 203–215.
CAO, W., JIANG, D., WANG, S. & TIAN, Y. (2002). Physio-logical characterization of rice grown under differentwater management systems. In Water-wise Rice Pro-duction. Proceedings of the International Workshop onWater-wise Rice Production (Eds B. A. M. Bouman,H. Hengsdijk, B. Hardy, P. S. Bindraban, T. P. Tuong& J. K. Ladha), pp. 249–257, Los Banos, Philippines:International Rice Research Institute (IRRI).
CUI, Y. T., CHENG, X., HAN, C. R. & LI, R. G. (2000). Theeconomic and ecological satisfactory amount of nitrogenfertilizer using on rice in Tai Lake Watershed. ActaEcologica Sinica 20, 659–662.
DE WIT, C. T. (1953). A Physical Theory on Placementof Fertilizers. Verslagen Landbouwkundig Onderzoek(Agricultural Research Reports) 59.4, s’Gravenhage, TheNetherlands: Staatsdrukkerij.
DOBERMANN, A., WITT, C., ABDULRACHMAN, S., GINES,H. C., NAGARAJAN, R., SON, T. T., TAN, P. S., WANG,G. H., CHIEN, N. V., THOA, V. T. K., PHUNG, C. V.,STALIN, P., MUTHUKRISHNAN, P., RAVI, V., BABU, M.,SIMBAHAN, G. C. & ADVIENTO, M. A. A. (2003). Soil fer-tility and indigenous nutrient supply in irrigated ricedomains of Asia. Agronomy Journal 95, 913–923.
FAN, M. S., JIANG, R. F., LIU, X. J., ZHANG, F. S., LU, S. H.,ZENG, X. Z. & CHRISTIE, P. (2005). Interactions betweennon-flooded mulching cultivation and varying nitrogeninputs in rice-wheat rotations. Field Crops Research 91,307–318.
FAO (2003). Water Management: Towards 2030. Rome:FAO.
FAO (2006). Guidelines for Soil Description. Rome: FAO.FISCHER, R. A. (1985). Number of kernels in wheat crops
and the influence of solar radiation and temperature.Journal of Agricultural Science, Cambridge 105, 447–461.
HUKE, R. & HUKE, E. (1992). Rice/Wheat Atlas of SouthAsia. Los Banos, Philippines: IRRI.
ISLAM, M. S. & MORISON, J. I. L. (1992). Influence of solar-radiation and temperature on irrigated rice grain-yield inBangladesh. Field Crops Research 30, 13–28.
KROPFF, M. J., CASSMAN, K. G., PENG, S., MATTHEWS, R. B.& SETTER, T. L. (1994). Quantitative understanding ofyield potential. In Breaking the Yield Barrier (Ed. K. G.Cassman), pp. 21–38. Los Banos, Philippines: IRRI.
LADHA, J. K., DAWE, D., VENTURA, T. S., SINGH, U.,VENTURA, W. & WATANABE, I. (2000). Long-term effectsof urea and green manure on rice yields and nitrogenbalance. Soil Science Society of America Journal 64,1993–2001.
LI, Y. & ZHANG, J. (1999). Agricultural diffuse pollutionfrom fertilisers and pesticides in China.Water Science andTechnology 39, 25–32.
LIN, S., DITTERT, K., TAO, H., KREYE, C., XU, Y., SHEN, Q.,FAN, X. & SATTELMACHER, B. (2002). The ground-cover
rice production system (GCRPS): a successful new ap-proach to save water and increase nitrogen fertilizerefficiency? In Water-wise Rice Production. Proceedings ofthe International Workshop onWater-wise Rice Production(Eds B. A. M. Bouman, H. Hengsdijk, B. Hardy, P. S.Bindraban, T. P. Tuong & J. K. Ladha), pp. 187–195. LosBanos, Philippines: IRRI.
MAO, Z. (1993). Study on evaluation of irrigation perform-ance in China. In Proceedings of Asian Regional Symp-osium on Maintenance and Operation of Irrigation/Drainage Scheme and Improved Performance, pp. 6–35.Beijing.
NIX, H. A. (1976). Climate and crop productivity inAustralia. In Climate and Rice (Ed. S. Yoshida), pp. 495–507. Los Banos, Philippines: IRRI.
ORTIZ-MONASTERIO, J. I., DHILLON, S. S. & FISCHER, R. A.(1994). Date of sowing effects on grain yield and yieldcomponents of irrigated spring wheat genotypes and re-lationships with radiation and temperature in Ludhiana,India. Field Crops Research 37, 169–184.
PENG, S., HUANG, J., ZHONG, X., YANG, J., WANG, G. & ZOU,Y. (2002). Research strategy in improving fertilizer-nitrogen use efficiency of irrigated rice in China. ScientiaAgricultura Sinica 35, 1095–1103.
TIMSINA, J. & CONNOR, D. (2001). Productivity and man-agement of rice-wheat cropping systems: issues andchallenges. Field Crops Research 69, 93–132.
TIMSINA, J., SINGH, U., BADARUDDIN, M., MEISNER, C. &AMIN, M. R. (2001). Cultivar, nitrogen, and water effectson productivity, and nitrogen-use efficiency and balancefor rice-wheat sequences of Bangladesh. Field CropsResearch 72, 143–161.
VAN KEULEN, H. (1982). Graphical analysis of annual cropresponse to fertilizer application. Agricultural Systems 9,113–126.
WANG, D. J., LIN, J. H., SUN, R. J., XIA, L. Z. & LIAN, G.(2003). Optimum nitrogen rate for a high productiverice-wheat system and its impact on the groundwater inthe Taihu Lake area. Acta Pedologica Sinica 40, 426–432.
WITT, C. & DOBERMANN, A. (2004). Towards a decisionsupport system for site-specific nutrient management. InIncreasing Productivity of Intensive Rice Systems ThroughSite-specific Nutrient Management (Eds A. Dobermann,C. Witt & D. Dawe), pp. 359–396. Enfield, NH, USA/LosBanos, Philippines: Science Publishers Inc./IRRI.
XIE, C., CHENG, G. & FENG, Z. (1995). Managing tech-niques for high-yield cultivation in mechanical directseeding rice fields and line seeding wheat fields undermechanised minimum tillage. Acta Agriculturae Shanghai11, 57–62.
XING, G. X. & ZHU, Z. L. (2000). An assessment of N lossfrom agricultural fields to the environment in China.Nutrient Cycling in Agroecosystems 57, 67–73.
XU, X. & WU, J. (1999). Effective utilization of N fertilizersby wheat and the effects of N fertilizer application onpollution of water body environment. Chinese Journal ofSoil Science 30, 268–270.
YANG, C. M., YANG, L. Z., YANG, Y. X. & ZHU, O. Y.(2004). Rice root growth and nutrient uptake as influ-enced by organic manure in continuously and alternatelyflooded paddy soils. Agricultural Water Management 70,67–81.
ZHENG, J. (2000). Rice–wheat cropping system in China.In Soil and Crop Management Practices for Enhanced
Nitrogen use efficiency in rice–wheat rotations 311

Productivity of the Rice–Wheat Cropping System in theSichuan Province of China (Eds P. R. Hobbs &R. K. Gupta), pp. 1–10. Rice–Wheat Consortium PaperSeries 9. New Delhi, India: Rice–Wheat Consortium forthe Indo-Gangetic Plains.
ZHU, J. G., HAN, Y., LIU, G., ZHANG, Y. L. & SHAO, X. H.(2000). Nitrogen in percolation water in paddy fields with
a rice/wheat rotation. Nutrient Cycling in Agroecosystems57, 75–82.
ZHU, Z. L., CAI, G. X., SIMPSON, J. R., ZHANG, S. L., CHEN,D. L., JACKSON, A. V. & FRENEY, J. R. (1989). Processesof nitrogen loss from fertilizers applied to flooded ricefields on a calcareous soil in North-central China.Fertilizer Research 18, 101–115.
312 Q. J ING ET AL.