Oracle Primavera P6 Delay Analysis Techniques - Eastwood ...
This article was downloaded by: [Indian Institute of Remote Sensing], [Kamal Pandey]On: 06 October 2011, At: 21:53Publisher: Taylor & FrancisInforma Ltd Registered in England and Wales Registered Number: 1072954 Registeredoffice: Mortimer House, 37-41 Mortimer Street, London W1T 3JH, UK
International Journal of RemoteSensingPublication details, including instructions for authors andsubscription information:http://www.tandfonline.com/loi/tres20
Cropping pattern of Uttar Pradesh usingIRS-P6 (AWiFS) dataN. J. Singh a b , M. Kudrat a , K. Jain b & K. Pandey aa Regional Remote Sensing Service Centre, Department of Space,ISRO, Dehradun, Indiab Indian Institute of Technology Roorkee, India
Available online: 22 Aug 2011
To cite this article: N. J. Singh, M. Kudrat, K. Jain & K. Pandey (2011): Cropping pattern of UttarPradesh using IRS-P6 (AWiFS) data, International Journal of Remote Sensing, 32:16, 4511-4526
To link to this article: http://dx.doi.org/10.1080/01431161.2010.489061
PLEASE SCROLL DOWN FOR ARTICLE
Full terms and conditions of use: http://www.tandfonline.com/page/terms-and-conditions
This article may be used for research, teaching, and private study purposes. Anysubstantial or systematic reproduction, redistribution, reselling, loan, sub-licensing,systematic supply, or distribution in any form to anyone is expressly forbidden.
The publisher does not give any warranty express or implied or make any representationthat the contents will be complete or accurate or up to date. The accuracy of anyinstructions, formulae, and drug doses should be independently verified with primarysources. The publisher shall not be liable for any loss, actions, claims, proceedings,demand, or costs or damages whatsoever or howsoever caused arising directly orindirectly in connection with or arising out of the use of this material.

International Journal of Remote SensingVol. 32, No. 16, 20 August 2011, 4511–4526
Cropping pattern of Uttar Pradesh using IRS-P6 (AWiFS) data
N. J. SINGH*†‡, M. KUDRAT†, K. JAIN‡ and K. PANDEY††Regional Remote Sensing Service Centre, Department of Space, ISRO, Dehradun, India
‡Indian Institute of Technology Roorkee, India
(Received 13 March 2009; in final form 10 March 2010)
The cropping pattern (rotation) of a region depends on the soil, water availability,economic conditions and climatic factors. Remote sensing is one of the effectivetools that can provide precise and up-to-date information on the performance ofagricultural systems. Four seasons data from the Indian Remote Sensing Satellite(IRS)-P6 Advanced Wide Field Sensor (AWiFS) were used for the generation of thecropping pattern of Uttar Pradesh by geographic information system (GIS)-aidedintegration of digitally classified crop and land use inventories of the kharif, rabiand zaid crop seasons. Twelve different cropping patterns were delineated andmapped in the Indo-Gangetic plain of Uttar Pradesh. The forests covered about6.32% of the total geographical area. The net cropped area was 20 282 159.46 ha(84.18% of the total geographical area) and the non-agricultural area observedwas 3 437 376.00 ha (14.26% of the total geographical area). Rice was the singlemost dominant crop of the state, occupying about 32.94% of the total geographi-cal area during the kharif season. Maize/jowar was the second major cereal crop,accounting for 13.77% of the total geographical area of the state. The major cropsgrown during the rabi season were wheat and pulses/oilseed, covering areas of 7979 267.71 ha (33.12%) and 5 974 742.58 ha (24.80%), respectively. Rice-wheat,sugarcane and rice-pulses were the major cropping patterns, occupying about 3958 739.85 ha (16.43%), 3 609 939.74 ha (14.98%) and 2 511 298.24 ha (10.42%),respectively. The areas under pulses/oilseed were significantly higher in the rabiseason. Sugarcane-wheat and pulses shared an almost equal area (6.49%). Themaize/jowar-wheat cropping pattern occupied 6.14% of the total geographical areaof the state. Single cropping patterns (i.e. rice-fallow, fallow-pulses, fallow-wheat,maize-fallow and sugarcane-fallow) were minor, occupying 6.08, 2.94, 4.06, 2.69and 2.51%, respectively. Waste land, including gulley, salt-affected, waterloggedand rock land, accounted for 3.80% of the total geographical area. The results ofthis study indicate that temporal IRS-P6 (AWiFS) data are very useful for studyingspatial cropping patterns. The values of the Multiple Cropping Index (MCI) andthe Cultivated Land Utilization Index (CLUI) show that the study area has a highcropping intensity.
1. Introduction
Pressure on the limited natural resources of India is ever increasing because of the bur-geoning population. Consequently, the need to cultivate more and more of our rapidlyshrinking per capita land resources has become important. However, this resource is
*Corresponding author. Email: [email protected]
International Journal of Remote SensingISSN 0143-1161 print/ISSN 1366-5901 online © 2011 Taylor & Francis
http://www.tandf.co.uk/journalsDOI: 10.1080/01431161.2010.489061
Dow
nloa
ded
by [
Indi
an I
nstit
ute
of R
emot
e Se
nsin
g], [
Kam
al P
ande
y] a
t 21:
53 0
6 O
ctob
er 2
011

4512 N. J. Singh et al.
becoming degraded at an increasing rate due to soil erosion, soil salinity/alkalinity,waterlogging and soil pollution, chemicals and toxic industrial wastes. The shrink-ing of agricultural land and the demand for more food production call for multiplecropping in a single piece of land. Hence there is a need to pay more attention to bet-ter management of agricultural systems, especially cropping patterns. The croppingpattern, a phenomenon of spatial nature (FAO 1996, Bontkes and Van Keulen 2003,Martinez-Casasnovas et al. 2005), refers to the yearly sequence, spatial arrangementand association of crops or crops and fallow on a given area. It plays a key role inagricultural production, socio-economy and the environment. Cropping pattern varia-tion can have significant environmental consequences, namely soil fertility and erosion(Groten 1993, Quarmby et al. 1993) and the global carbon balance (Houghton 1994,Houghton et al. 2000, Searchinger et al. 2008). To accomplish the above objectiveand to formulate the optimum cropping pattern within an agro-ecological region, anup-to-date knowledge and understanding of the existing cropping pattern is essential.
Remote sensing provides precise and up-to-date information on the performanceof agricultural systems. The main advantage of remote sensing from satellites is thesynoptic and repeated collection of data, which allows retrieval of time-series and reli-able information on the spatial distribution of the cropping pattern (rotation) overlarge areas (Panigrahy and Chakraborty 1998, Bastiaanssen et al. 2000, Panigrahyet al. 2005a). The usefulness of remote sensing technique for the generation of agricul-tural statistics is well documented in many parts of the world (DeFries et al. 1998,Pinter et al. 2003, Xiao et al. 2003, Liu et al. 2005) through the combination ofarea sampling and supervised classification. Crop classification has been carried outwith Landsat Multi-Spectral Scanner (MSS) or Thematic Mapper (TM) images (Loet al. 1986, Badhwar et al. 1987, Tennakoon et al. 1992). A large-area crop exper-iment covering the USA, the former USSR, Brazil, Argentina and India is one ofthe important examples of crop inventory using remote sensing (McDonald and Hall1980). In India, Navalgund et al. (1991) demonstrated the usage of Indian RemoteSensing (IRS) satellite images for crop inventory, crop acreage and production estima-tion (CAPE) for the major agro-climatic zones of India. They generated crop acreagestatistics across the year but their study was lacking data on the spatial distribution ofcrops. Choudhury and Saha (2003) used temporal IRS-ID LISS III and Landsat TMdata to discriminate crops in the kharif (15 October 1997 and 21 September 2001) andrabi (2 February 1998 and 28 February 2003) seasons. They also analysed changes incrop area over a period from 1997 to 2003 for the Barwala C.D. block of Panchkculadistrict of Haryana, but cropping pattern/crop rotation analysis is lacking in theirstudy. More recently, the National Agriculture Statistics Service (NASS 2004) of theUnited States Department of Agriculture (USDA) generated a major crop types mapprimarily with Advanced Wide Field Sensor (AWiFS) imagery. Martinez-Casasnovaset al. (2005) proposed a method to map cropping patterns using a time-series cropmap obtained from classification of remote sensing images. Guo et al. (2004) detectedcrop rotation in two regions of China using satellite remote sensing data. Murakamiet al. (2001) used multitemporal images to characterize six cropping patterns: rice,rice-winter cereal, soybean, soybean-winter cereal, lotus and rush. Rajak et al. (2002)demonstrated the use of multitemporal WiFS images for monitoring the changes incropping pattern in part of Rajasthan, India. Panigrahi et al. (1997) and Qiu et al.(2003) showed the usefulness of remote sensing images for analysis and mapping crop-ping patterns (crop rotation). However, spatial information on the annual croppingpattern is scarce (Craig 2001, Wardlow and Egbert 2008).
Dow
nloa
ded
by [
Indi
an I
nstit
ute
of R
emot
e Se
nsin
g], [
Kam
al P
ande
y] a
t 21:
53 0
6 O
ctob
er 2
011

Cropping pattern of Uttar Pradesh using IRS-P6 (AWiFS) data 4513
In the present study an attempt was made to extract the cropping pattern (rotation)of the Indo-Gangetic plain of Uttar Pradesh using temporal AWiFS images as part ofthe Indian Space Research Organization Geosphere Biosphere Programme (IGBP).
2. Materials and methods
2.1 Study area
The Indo-Gangetic plain of Uttar Pradesh in India has a geographical area of 2 409300.21 ha, which is about 7.3% of the country’s geographical area (figure 1). It liesbetween latitude 23◦ 52′ and 30◦ 24′ N and longitude 77◦ 05′ and 84◦ 38′ E. Thestate can be divided into three physiographical regions: the northern mountains ofSiwaliks, the southern hills and plateau, and the vast alluvial Gangetic plains betweenthe two. The state is fed by five major rivers, the Ganga, the Yamuna, the Ramganga,the Gomati and the Ghaghra, which drain into the Bay of Bengal. Uttar Pradeshhas a tropical climate: the annual rainfall and temperature range from 1000 to 1200mm and from 5◦C to 45◦C, respectively. The major landuse/land cover in the studyregion is characterized by agriculture, forests and horticultural plantations, barrenrocks and scrubs, settlements, wastelands and water bodies. There are two main crop-ping seasons: kharif, from June/July to October, and rabi, from November to April.The proportion of net irrigated area to net cropped area has increased from 36.12%in 1966–1967 to 54.89% in 1980–1981 and 76.30% in 2001–2002 (Kumar 2005). Themain crops grown in the area are wheat, paddy, sugarcane, maize, sunflower, mustard,pulses and various oilseeds and several different vegetables. The major kharif crops ofthe study area are paddy, maize and sugarcane, while jowar, bajra, groundnut, sesame,arhr and fodder are grown occasionally. For these crops the field is prepared in Apriland May and the seeds are sown at the start of rains in June. The crops are ready forharvesting by the beginning of November. The major rabi crops are wheat, sunflower,mustard, gram, linseed and rapeseed. The farmers prepare the ground at the end ofOctober or the beginning of November and harvesting starts in early March. Theprincipal soils at order level are Alfisols, Entisols, Inceptisols, Mollisols and Vertisols.
2.2 Satellite image acquisition
IRS-P6 (AWiFS) has a spatial resolution of 56 m, four spectral channels (green(0.52–0.59 µm), red (0.62–0.68 µm), near infrared (NIR: 0.77–0.86 µm) and short-wave IR (SWIR: 1.55–1.70 µm)) and a temporal resolution of 5 days with a740 km swath width. Four IRS-P6 (AWiFS) images acquired in 2005 during February(rabi season), May (zaid/summer season), September (kharif season) and November(pre-rabi season) were used for identifying different crops, cropping patterns andother landuse/landcover classes. Images of November 2005 were used to discriminatesugarcane from other kharif crops. Images of May 2005 were used to discriminateforest and plantation from agricultural area. Survey of India (SOI) topographicalmaps (1:250 000) were used for selection of ground control points (GCPs) requiredfor georeferencing, and also during field verification. The study area falls under path–row 95–49, 95–54 and 100–54 according to the IRS-P6 AWiFS image acquisitionreferencing scheme.
2.3 Methodology
ERDAS (Earth Resource Data Analysis System), a commercial image processingsoftware package (ERDAS, Inc., Norcross, GA, USA), was used for radiometric
Dow
nloa
ded
by [
Indi
an I
nstit
ute
of R
emot
e Se
nsin
g], [
Kam
al P
ande
y] a
t 21:
53 0
6 O
ctob
er 2
011

4514 N. J. Singh et al.
km0 100 200 300 400
N
Figure 1. The Uttar Pradesh study area in India.
Dow
nloa
ded
by [
Indi
an I
nstit
ute
of R
emot
e Se
nsin
g], [
Kam
al P
ande
y] a
t 21:
53 0
6 O
ctob
er 2
011

Cropping pattern of Uttar Pradesh using IRS-P6 (AWiFS) data 4515
corrections, georeferencing, classification and spatial modelling of the cropping pat-terns in Utter Pradesh. The first-order effects of atmospheric scattering or haze werecorrected based on a subtractive bias, that is the minimum digital number (DN)established for each band (Jensen 1986). The IRS-P6 (AWiFS) images of February2005 were georeferenced with the toposheet following a second-order polynomial.The nearest-neighbour resampling technique was adopted to maintain the originalradiometry (Jensen 1986). The rectified February images were considered as the refer-ence. Other images were registered by following image-to-image registration using therectified February 2005 images. The projection and datum used for the study area werethe Lambert Conformal Conic (LCC) projection and Modified Everest (Chen and Lee1992), respectively. Any GCP that showed a residual error greater than two pixels wasignored in the model. The overall root mean square (RMSE) was observed at less thantwo pixels. The output pixel size of the rectified image was kept at 50 m.
Considering the spectral variability, crop calendar and accessibility, the numberof sampling points and their distribution were determined across the study area.Accordingly, fieldwork was undertaken covering all cropping seasons. A total of 325ground truth points were collected. The coordinates of the ground truth points wererecorded with the help of a handheld mobile global positioning system (GPS) andfield characteristics were noted on the field sheet. We used 225 ground truth points forassigning spectral class into information class (mapping unit) and the remaining 100points were used for validation.
The unsupervised classification was adapted to minimize the effect of subjectiv-ity (Soares et al. 2008). All four geometrically and radiometrically corrected bandsof each AWiFS image date were used as input to the iterative ISODATA clusteringalgorithm, and a convergence threshold of 0.95 and a maximum of 20 iterations werechosen. The total number of spectral clusters was set to 40. An unsupervised classifi-cation approach has been followed in similar studies (Panigrahy et al. 2005a, Soareset al. 2008, Wardlow and Egbert 2008). Forest and orchard were extracted from theMay images since most of the areas were under fallow in this month. After the kharifcrop had been harvested, sugarcane was the dominant crop in November. Therefore,only sugarcane was extracted from the November images.
The similar DN values were regrouped and reduced to distinguished classes fromthe output ISODATA classification. Assignment of thematic class and contextualrefinement were carried out for the mixed classes using field information (groundtruth observations) and local knowledge. The mixed classes were permanent non-agricultural land (waterlogging is spectrally similar to water body, gullied land isspectrally similar to fallow land). Forest land showed spectral similarity to orchardand crop land. This was overcome by using the area of interest (AOI) option. TheAOIs of forest, orchard, river, canals, waterlogged areas, sand, gully, rocks and set-tlements were determined from the AWiFS images of different seasons. These AOIswere used at the time of regrouping of spectral classes into non-agricultural thematicclasses. The crop rotation map was prepared by a logical combination of the croppixels of the four-season classified outputs using the spatial modelling tools availablein ERDAS Imagine. The sequential flow of the methodology is given in figure 2. Theclassification accuracy was evaluated by the methods suggested by Skirvin et al. (2004)and Jensen (1986). The Kappa test was carried out for overall classification accuracyassessment.
Several indices are available to evaluate and compare the efficiencies of differentcropping system (Palaniappan 1985). The Multiple Cropping Index (MCI) and the
Dow
nloa
ded
by [
Indi
an I
nstit
ute
of R
emot
e Se
nsin
g], [
Kam
al P
ande
y] a
t 21:
53 0
6 O
ctob
er 2
011

4516 N. J. Singh et al.
Multidate IRS-P6 AWiFS data
(Feb, May, Sep, Nov)
MayLand use map
Field observations,GPS, etc.
Digital classification
Cropping pattern map
Contextual refinement
FebLand use map
SepLand use map
Decision rule
Expertknowledge
NovLand use map
Figure 2. Sequential flow of the methodology.
Cultivated Land Utilization Index (CLUI) are commonly used to access land use effi-ciencies (Panigrahy et al. 2005b). The MCI is defined as the sum of the area (�ai)under different crops (i = 1, 2, 3, . . .) in a single year divided by the total cultivatedarea (A) multiplied by 100 [MCI = 100(�ai/A)]. The CLUI is defined as the sum ofthe product of the land area under each crop (i = 1, 2, 3, . . .) and the actual durationof that crop (d i) divided by the sum of the product of the total cultivated land area and365 days [(CLUI) = �aidi/365A]. In the present study, both the MCI and the CLUIwere computed to evaluate the efficiencies of the different cropping patterns. The MCIis an indicator of the intensification in time domain and quantifies the vertical expan-sion of an agricultural area. The MCI is the most popular index for quantifying theintensity of a single crop, double-cropping or triple-cropping whereas the CLUI indi-cates land utilization efficiency and the time and place for the land that is not utilized.
3. Results and discussion
3.1 Kharif season
Analysis of the kharif season (September 2005) images showed that rice was the sin-gle most dominant crop of the study area, occupying an area of about 7 935 335.77ha, which accounted for 32.94% of the total geographical area of the state (table 1).Other major cereal crops are maize, jowar or bajra, covering an area of 3 317 153.36ha and accounting for 13.77% of the total geographical area of the state. Sugarcane,the main cash crop, is mostly confined to the western part of the study area. Thiscrop occupies an area of 5 778 323.51 ha, which is 23.98% of the total geograph-ical area (table 1 and figures 3 and 4). In Uttar Pradesh, rice is grown on 32.94%
Dow
nloa
ded
by [
Indi
an I
nstit
ute
of R
emot
e Se
nsin
g], [
Kam
al P
ande
y] a
t 21:
53 0
6 O
ctob
er 2
011

Cropping pattern of Uttar Pradesh using IRS-P6 (AWiFS) data 4517
Table 1. Kharif (September 2005) crops of Uttar Pradesh derived from IRS-P6(AWiFS) images.
Class name Area, ha (%)
Rice 7 935 335.77 (32.94)Maize/Jowar 3 317 153.36 (13.77)Pulses/Oilseed 1 653 108.04 (6.86)Sugarcane 5 778 323.51 (23.98)Fallow 1 919 315.90 (7.97)Orchard 44 907.25 (0.19)Forest 1 523 157.35 (6.32)Gully 283 403.37 (1.18)Salt-affected area 487 353.97 (2.02)Waterlogged 131 266.92 (0.54)Rock 15 323.22 (0.06)Sand 305 340.33 (1.27)Water 390 188.07 (1.62)Cloud 7498.24 (0.03)Settlement 301 324.73 (1.25)Total 24 093 000.21 (100.00)
0 100
Rice
Legend
Orchard Gully Waterlogged
Water
Cloud
Rock
Sand
Settlement
Forest
Fallow
Salt-affected area
Sugarcane
Maize/Jowar
Pulses
N
200 300
km
Figure 3. Crops growing in the kharif season (September 2005).
Dow
nloa
ded
by [
Indi
an I
nstit
ute
of R
emot
e Se
nsin
g], [
Kam
al P
ande
y] a
t 21:
53 0
6 O
ctob
er 2
011

4518 N. J. Singh et al.
0
5
10
15
20
25
30
35
Ric
e
Suga
rcan
e
Mai
ze/J
owar
Fallo
w
Puls
es/O
ilsee
d
Fore
st
Salt-
affe
cted
are
a
Wat
er
Sand
Settl
emen
t
Gul
ly
Wat
erlo
gged
Orc
hard
Roc
k
Clo
ud
Are
a (%
)
Figure 4. Areal extent of various crops in the kharif season (September 2005) and otherclasses.
(7 935 335.77 ha) of the state geographical area and represents about 12.4% of theall-India area under this crop. Rice is concentrated in the eastern and northeasternparts of Uttar Pradesh where the alternative crops are pulses/oil seeds, sugarcane,bajra and jowar in decreasing order of importance (Krishiworld 2009a). Maize, jowarand bajra are the second most popular kharif cereals and these were confined to thesouthwestern and western parts of Uttar Pradesh. Maize is a crop grown commonlyin moderate to low rainfall areas, or on soils with a heavy texture (better moistureretaining capacity) but with good drainage. Jowar is grown in medium rainfall regionswhereas bajra has been the main crop in areas with less rainfall and on light tex-tured soils. In the maize-growing areas of Uttar Pradesh, rice in kharif and wheat inrabi are the main crops. Bajra, groundnut, sugarcane, ragi and pulses are also usedas alternative crops (Krishiworld 2009b). Pulses covered an area of 1 653 108.04 ha(6.86%). Among the non-agricultural land, the forested area occupied the major share1 523 157.35 ha (6.32%), followed by salt-affected land (mainly saline-sodic) and thengullied land, which accounted for 283 403.37 ha (1.18%). Barren rocky and water-logged areas were 15 323.22 ha (0.06%) and 131 266.92 ha (0.54%), respectively (table1 and figures 3 and 4). These results are in agreement with the area statistics of theMinistry of Agriculture (2000). There was a significant reduction of the fallow land,estimated at 7.97% in the kharif season in 2005 as compared to 22.33% of the totalgeographical area of the state (Ministry of Agriculture 2000). The overall accuracyobserved was 92.67%. Guo et al. (2004) reported an overall accuracy of 85%. Themaximum accuracy was observed for rice (94.28%) and the minimum accuracy wasfor pulses (84.61%). The possible reason for lower accuracy of pulses (arhar) may bedue to the spectral similarity to fallow land, as the field is partially covered with pulsesduring the kharif season (September).
Dow
nloa
ded
by [
Indi
an I
nstit
ute
of R
emot
e Se
nsin
g], [
Kam
al P
ande
y] a
t 21:
53 0
6 O
ctob
er 2
011

Cropping pattern of Uttar Pradesh using IRS-P6 (AWiFS) data 4519
Table 2. Rabi (February 2005) crops of Uttar Pradesh derived from IRS-P6(AWiFS) images.
Class name Area, ha (%)
Wheat 7 979 267.71 (33.12)Sugarcane 3 609 939.74 (14.98)Pulses 5 974 742.58 (24.80)Orchard 44 907.25 (0.19)Fallow 3 095 743.49 (12.85)Forest 1 523 157.35 (6.32)Gully 283 403.37 (1.18)Salt-affected area 487 353.97 (2.02)Waterlogged 130 987.43 (0.54)Rock 15 323.22 (0.06)Sand 305 358.37 (1.27)Water 341 490.99 (1.42)Settlement 301 324.73 (1.25)Total 24 093 000.21 (100.00)
3.2 Rabi season
Rabi season AWiFS images acquired in February 2005 were chosen because this isthe peak growing period for rabi crops in the study area. The major crops grown inthe study area were wheat, pulses and oilseed and sugarcane, occupying an area of7 979 267.71 ha (33.12%), 5 974 742.58 ha (24.80%) and 3 609 939.74 ha (14.94%),respectively (table 2 and figures 5 and 6). The pulses/oilseeds were generally grownas relay crops with rice, as they thrive on the residual soil moisture. As the spec-tral signatures of the different pulses and oilseeds were not very distinct, they wereassigned as pulses/oilseeds. Pulses/oilseeds were unique because they were grown inFebruary on the moisture conserved areas that remain fallow in May, Septemberand November. The acreage of the wheat was less than that of the Indian harvest,estimated at 9 880 000 ha instead of the present estimate of 7 979 267.71 ha. Thepossible reason for this discrepancy might be that the changes in cropping patternsbetween 1960 and 2001 indicate shifts from food grains to non-food grains, espe-cially from coarse cereals to pulses and oilseeds, sugarcane, and other non-foodcrops (Kumar et al. 2001). Coarse cereals and pulses are being replaced by rice-wheat in this region. Sugarcane is also gaining importance in this region (Mythili2008). Wheat production accounts for about 40% of total cereal production in India(DARE/ICAR 2008). The area under rabi food grains decreased. Hence the presentstudy produced higher estimates for pulses/oilseed area of 5 974 742.58 ha whereasthe Indian harvest estimation reported was 3 340 000 ha (Centre for MonitoringIndian Economy 2008). The class pulses/oilseed included arhar, gram, urd, rape-seed, mustard, linseed and sesame. The fallow land was higher in the rabi seasoncompared to the kharif season and accounted for about 12.92%. Some pixels of thewheat crop showed mixing with sugarcane and pulses. Orchards showed mixing withforest and plantation. Based on the Kappa test, the overall classification accuracyfound was 89.68%. The maximum accuracy was observed for wheat crop, followed bysalt-affected land.
Dow
nloa
ded
by [
Indi
an I
nstit
ute
of R
emot
e Se
nsin
g], [
Kam
al P
ande
y] a
t 21:
53 0
6 O
ctob
er 2
011

4520 N. J. Singh et al.
0 100
Wheat
Legend
Orchard
Gully
Waterlogged
Water
Rock
Sand
Settlement
Forest
Fallow
Salt-affected area
Sugarcane
Pulses
N
200 300
km
Figure 5. Crops growing in the rabi season (February 2005).
3.3 Cropping patterns of Uttar Pradesh
The areal extent and spatial distributions of the various cropping patterns in the Indo-Gangetic plain of Uttar Pradesh are presented in table 3 and figures 7 and 8. Theresults reveal that the net cropped area was 20 282 159.46 ha, which is 84.18% of thetotal geographical area, and the net non-cropped area was 3 437 376.00 ha, account-ing for 14.27% of the total geographical area. The non-cropped areas included wereforest, gully, salt-affected areas, exposed hilly rocks, dry river sand, waterlogged areaand water body (river), and settlement (table 3). The gullied land, salt-affected land,barren rocks and waterlogged area are included as wasteland. All these lands togetheraccounted for an area of 917 347.48 ha (3.80%), whereas the area under forest coverwas 1 523 157.35 ha (6.32%), which was in accordance with the estimates of theMinistry of Environment and Forests (2005). The most important finding is that thesalt-affected land (saline sodic) is confined to the interfluvial plain between the riversGanga and Yammuna and is controlled by the micro-topography (Pal et al. 2003). Theoverall broad land use categories are in agreement with those of Jabir (2009).
The order of the cropping pattern in Uttar Pradesh in terms of area in hectareswas rice-wheat (3 958 379.85) > sugarcane (3 609 939.74) > rice-pulses (2 511 298.24)> sugarcane-wheat (1 564 480.73) > maize/jowar-wheat (1 478 353.12) > rice-fallow (1 465 297.68) > maize-pulses (1 189 791.53) > fallow-wheat (977 694.01) >
Dow
nloa
ded
by [
Indi
an I
nstit
ute
of R
emot
e Se
nsin
g], [
Kam
al P
ande
y] a
t 21:
53 0
6 O
ctob
er 2
011
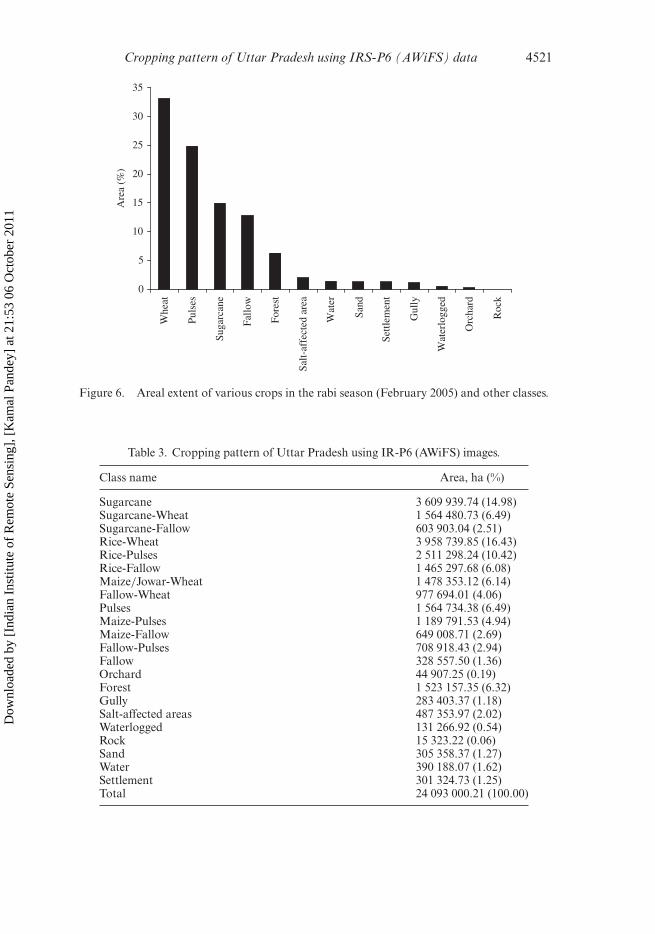
Cropping pattern of Uttar Pradesh using IRS-P6 (AWiFS) data 4521
0
5
10
15
20
25
30
35
Whe
at
Puls
es
Suga
rcan
e
Fallo
w
Fore
st
Salt-
affe
cted
are
a
Wat
er
Sand
Settl
emen
t
Gul
ly
Wat
erlo
gged
Orc
hard
Roc
k
Are
a (%
)
Figure 6. Areal extent of various crops in the rabi season (February 2005) and other classes.
Table 3. Cropping pattern of Uttar Pradesh using IR-P6 (AWiFS) images.
Class name Area, ha (%)
Sugarcane 3 609 939.74 (14.98)Sugarcane-Wheat 1 564 480.73 (6.49)Sugarcane-Fallow 603 903.04 (2.51)Rice-Wheat 3 958 739.85 (16.43)Rice-Pulses 2 511 298.24 (10.42)Rice-Fallow 1 465 297.68 (6.08)Maize/Jowar-Wheat 1 478 353.12 (6.14)Fallow-Wheat 977 694.01 (4.06)Pulses 1 564 734.38 (6.49)Maize-Pulses 1 189 791.53 (4.94)Maize-Fallow 649 008.71 (2.69)Fallow-Pulses 708 918.43 (2.94)Fallow 328 557.50 (1.36)Orchard 44 907.25 (0.19)Forest 1 523 157.35 (6.32)Gully 283 403.37 (1.18)Salt-affected areas 487 353.97 (2.02)Waterlogged 131 266.92 (0.54)Rock 15 323.22 (0.06)Sand 305 358.37 (1.27)Water 390 188.07 (1.62)Settlement 301 324.73 (1.25)Total 24 093 000.21 (100.00)
Dow
nloa
ded
by [
Indi
an I
nstit
ute
of R
emot
e Se
nsin
g], [
Kam
al P
ande
y] a
t 21:
53 0
6 O
ctob
er 2
011

4522 N. J. Singh et al.
0 100
Rice-Wheat Rice-Fallow
Rice-Pulses
Legend
Orchard
Gully
Waterlogged
Water
Rock
Sand
Settlement
Forest
Fallow-Wheat
Salt-affected area
Sugarcane
Sugarcane-Wheat
Sugarcane-Fallow
Maize-Pulses
Maize/Jowar-Wheat
Maize-Fallow
Fallow-Pulses
Fallow
Pulses
200 300
km
N
Figure 7. Cropping patterns of Uttar Pradesh and other classes.
fallow-pulses (708 918.43) > maize-fallow (649 008.71) > current fallow (328 557.50).From these results it was clear that rice-wheat is the major cropping sequence fol-lowed by sugarcane. Similar results have been reported using National Oceanic andAtmospheric Administration (NOAA) Advanced Very High Resolution Radiometer(AVHRR) images (Panigrahy et al. 1992, Rajak et al. 2002). The distribution of thecropping patterns shows that most of the areas were covered by double-cropping.The results of the present study are in agreement with the findings of Panigrahyet al. (1992). Rice-wheat, sugarcane-wheat and rice-pulses were the major croppingpatterns of the state of Uttar Pradesh. The state of Uttar Pradesh is the largest sugar-producing state in India, contributing about 44% to the country’s total sugarcaneproduction. Murakami et al. (2001) carried out a similar study in Japan with tempo-ral SPOT/HRV images to discriminate cropping systems. The present study concludedthat there was a transformation of the cropping pattern in Uttar Pradesh from rice-wheat to rice-pulses/oilseeds and maize/jowar-wheat to maize/jowar-pulses/oilseedsdepending on the pre-winter rainfall and water availability. The areas of pulses andoilseed combination were significantly increased because of higher return to thefarmers. Single-cropping was observed in some areas. Single crops (i.e. maize-fallow,sugarcane-fallow) occupied a much smaller area within the study areas. Rice-fallowand fallow-pulses occupied 4.12% and 3.79%, respectively.
Dow
nloa
ded
by [
Indi
an I
nstit
ute
of R
emot
e Se
nsin
g], [
Kam
al P
ande
y] a
t 21:
53 0
6 O
ctob
er 2
011

Cropping pattern of Uttar Pradesh using IRS-P6 (AWiFS) data 4523
0
2
4
6
8
10
12
14
16
18
Ric
e-W
heat
Suga
rcan
e
Ric
e-Pu
lses
Suga
rcan
e-W
heat
Puls
es
Fore
st
Mai
ze/J
owar
-Whe
at
Ric
e-Fa
llow
Mai
ze-P
ulse
s
Fallo
w-W
heat
Fallo
w-P
ulse
s
Mai
ze-F
allo
w
Suga
rcan
e-Fa
llow
Salt-
affe
cted
are
as
Wat
er
Fallo
w
Sand
Settl
emen
t
Gul
ly
Wat
erlo
gged
Orc
hard
Roc
k
Are
a (%
)
Figure 8. Areal extent of the cropping patterns (rotation) of Uttar Pradesh.
3.4 Cropping system indices
The calculated values of the indices MCI and CLUI for the study area were 175.93and 0.63, respectively. According to Panigrahy et al. (2005b), these values represent ahigh rating, which indicates that the study area is intensively cultivated with multiplecropping practices. The study area is under crop for more than 200 days in a year,which is in agreement with the above calculated values of MCI and CLUI.
4. Summary and conclusions
A total of 12 cropping patterns were observed in the whole of the study area. Thecropping pattern classes were sugarcane, sugarcane-wheat, sugarcane-fallow, rice-wheat, rice-pulses, rice-fallow, maize/jowar-wheat, fallow-wheat, pulses, maize-pulses,fallow-pulses and maize-fallow. Among the various cropping patterns, rice-wheat,sugarcane and rice-pulses were the major cropping patterns, occupying about 16.43%(3 958 739.85 ha), 14.98% (3 609 939.74 ha) and 10.42% (2 511 298.24 ha) of the totalgeographical area of the state, respectively.
The cropping pattern of Uttar Pradesh is dependent on the monsoon rainfall andwater availability. Rice-wheat and sugarcane are common where irrigation facilitiesare available. Hence rice-wheat and sugarcane are the dominant cropping patterns inthe northeastern part and also the eastern part of the study area. The area underthe pulses/oilseed cropping pattern is very common in the southwestern part of thestudy area, where irrigation facilities are limited. Sugarcane-wheat and pulses sharedan almost equal area (6.49%). Single cropping patterns for maize-fallow, rice-fallow,fallow-pulses plus fallow-wheat were minor cropping patterns confined to the centraland southwestern parts of the study area, accounting for 6.08, 4.64 and 4.06%,respectively. Overall, fallow land occupied an area of 328 557.50 ha (1.36% of totalgeographical area). The salt-affected areas were estimated as 487 353.97 ha (2.02% ofthe total geographical area).
The results of the present study lead to the conclusion that IRS-P6 (AWiFS)imagery, with moderate spatial and temporal resolution and a large swath width, is
Dow
nloa
ded
by [
Indi
an I
nstit
ute
of R
emot
e Se
nsin
g], [
Kam
al P
ande
y] a
t 21:
53 0
6 O
ctob
er 2
011

4524 N. J. Singh et al.
suitable for characterizing the cropping patterns of the Indo-Gangetic plain. Variouscrop classes were discriminated at different cropping seasons and this demonstratedthe utility of the multidate data sets for cropping pattern mapping. Similar conclu-sions were drawn by earlier researchers (Panigrahy and Chakraborty 1998, Wardlowand Egbert 2002). The MCI and CLUI showed values of 175.93 and 0.63, respec-tively, indicating that a high intensity of agriculture was prevalent in the Indo-Gangeticplain. The limitation of the study is the non-availability of multispectral remote sens-ing images during the kharif season because of cloud cover. Further scope lies in theincorporation of microwave remote sensing data as an additional band or bands torefine future studies.
AcknowledgementsWe are grateful to the Program Director and Deputy Program Director of ISRO-GBPfor funding, and the Director of NNMRS, RRSSC, ISRO and Dr K. P. Sharma, Head,RRSSC and Dr V. K. Dhadhwal, Dean IIRS and Project Director, NCP for encour-agement and facilities. We thank Shri Promod Kumar, John Mathew, Dr HitendraPadalia, of RRSSC, Dehra Dun and other colleagues for their help. Special thanksare due to Dr S. K. Saha, Head, Agriculture and Soil Division and Dr J. Prashad,Head, Technical Section, IIRS Dehradun, for critically going through the manuscript.We thank two anonymous referees for their constructive comments and suggestions.
ReferencesBADHWAR, G.D., GARGANTINI, C.E. and REDONDO, F.V., 1987, Landsat classification of
Argentina summer crops. Remote Sensing of Environment, 21, pp. 111–117.BASTIAANSSEN, W.G.M., MOLDEN, D.J. and MAKIN, I.W., 2000, Remote sensing for irri-
gated agriculture: examples from research and possible applications. Agricultural WaterManagement, 46, pp. 137–155.
BONTKES, T.S. and VAN KEULEN, H., 2003, Modelling the dynamics of agricultural develop-ment at farm and regional level. Agricultural Systems, 76, pp. 379–396.
CENTRE FOR MONITORING INDIAN ECONOMY, 2008, Indian Harvest Version 1.1. Availableonline at: www.cmie.com (accessed 24 May 2009).
CHEN, L. and LEE, L., 1992, Progressive generation of control frameworks for image registra-tion. Photogrammetric Engineering and Remote Sensing, 58, pp. 1321–1328.
CHOUDHURY, S. and SAHA, S.K., 2003, Cropping pattern change analysis and optimal landuseplanning by integrated use of satellite remote sensing and GIS – a case study of BarwalaC.D. Block, Panchkula District, Haryana. Indian Cartographer, 23, pp. 111–123.
CRAIG, M.E., 2001, The NASS cropland data layer program. In Third Annual InternationalConference on Geospatial Information in Agriculture, Denver, CO, 5–7 November 2001.
DARE/ICAR, 2008, Agricultural Economics, Marketing and Statistics. Annual Report2007–2008, pp. 103–107 (Pusa, New Delhi: Indian Council of Agricultural Research).
DEFRIES, R., HANSEN, M., TOWNSEND, J.G.R. and SOHLBERG, R., 1998, Global land coverclassifications at 8 km resolution: the use of training data derived from Landsat imageryin decision tree classifiers. International Journal of Remote Sensing, 19, pp. 3141–3168.
FAO, 1996, Forest Resources Assessment 1990 – Survey of Tropical Forest Cover and Studyof Change Processes. FAO Forestry Paper 130 (Rome, Italy: Food and AgriculturalOrganisation of the United Nations).
GROTEN, S.M.E., 1993, NDVI – crop monitoring and early yield assessment of Burkina Faso.International Journal of Remote Sensing, 14, pp. 1495–1515.
GUO, J.K., LIU, J.Y., HUANG, G.M., ZHUANG, D.F., YAN, H.M. and ZHANG, G.P., 2004,Detecting crop rotations in China using AVHRR imagery and ancillary data. Availableonline at: www.isprs.org/congresses/istanbul2004/comm7/papers/45.pdf (accessed12 August 2009).
Dow
nloa
ded
by [
Indi
an I
nstit
ute
of R
emot
e Se
nsin
g], [
Kam
al P
ande
y] a
t 21:
53 0
6 O
ctob
er 2
011

Cropping pattern of Uttar Pradesh using IRS-P6 (AWiFS) data 4525
HOUGHTON, R.A., 1994. Emissions of carbon from land use change. In The Carbon Cycle,T.M.L Wigley and D. Schimel (Eds), pp. 63–76 (New York: Cambridge UniversityPress).
HOUGHTON, R.A., HACKLER, J.L. and LAWRENCE, K.T., 2000, Changes in terrestrial carbonstorage in the United States. 2. The role of fire and fire management. Global Ecologyand Biogeography, 9, pp. 145–170.
JABIR, A., 2009, Agricultural Land Lease Pattern in Uttar Pradesh: Implications forLandless, Marginal and Small Households (Lucknow: Agriculture Management Centre,Indian Institute of Management). Available online at: http://planning.up.nic.in/
landuseboard/landuse-Jabir.ppt (accessed 15 May 2009).JENSEN, J.R., 1986, Introductory Digital Image Processing: A Remote Sensing Perspective,
2nd edn (Upper Saddle River, NJ: Prentice Hall).KRISHIWORLD, 2009a, Cropping Patterns. Krishiworld: The Pulse of Indian Agriculture.
Available online at: www.krishiworld.com/html/crop_pattern1.html (accessed 4th April2009).
KRISHIWORLD, 2009b, Soils. Krishiworld: The Pulse of Indian Agriculture. Available online at:www.krishiworld.com/html/soils1.html (accessed 24 May 2009).
KUMAR, S., 2005, Note on Farm Sector in Uttar Pradesh (Lucknow: Department of Planning,Government of Uttar Pradesh).
KUMAR, S., SRIVASTAVA, R.K., SINGH, A.K., KALRA, A., TOMAR, V.K.S. and BANSAL, R.P.,2001, Higher yields and profits from new crop rotations permitting integration ofmediculture with agriculture in the Indo-Gangetic plains. Current Science, 80, pp.563–566.
LIU, J., LIU, M., TIAN, H., ZHUANG, D., ZHANG, Z., ZHANG, W., TANG, X. and DENG, X.,2005, Spatial and temporal patterns of China’s cropland during 1990–2000: an analysisbased on Landsat TM data. Remote Sensing of Environment, 98, pp. 442–456.
LO, T.M.C., SCARPACE, F.L. and LILLESAND, T.M., 1986, Use of multitemporal spectral pro-files in agricultural land-cover classification. Photogrammetric Engineering and RemoteSensing, 52, pp. 535–544.
MARTINEZ-CASASNOVAS, J.A., MARTIN-MONETERO, A. and CASTERAD, M.A., 2005, Mappingmulti-year cropping patterns in small irrigation districts from time series analysis ofLandsat TM images. European Journal of Agronomy, 23, pp. 159–169.
MCDONALD, R.B. and HALL, F.G., 1980, Global crop forecasting. Science, 280, p. 670.MINISTRY OF AGRICULTURE, 2000, Landuse Statistics at a Glance 1996–97 (New Delhi:
Ministry of Agriculture, Government of India).MINISTRY OF ENVIRONMENT AND FORESTS, 2005, State of Forest Report 2005 (Dehradun:
Ministry of Environment and Forests), pp. 136–139.MURAKAMI, T., OGAWA, S., ISHITSUKA, N., KUMAGAI, K. and SAITO, G., 2001, Crop discrim-
ination with multitemporal SPOT/HRV data in the Saga plains, Japan. InternationalJournal of Remote Sensing, 22, pp. 1335–1348.
MYTHILI, G., 2008, Acreage and Yield Response for Major Crops in the Pre- and Post-ReformPeriods in India: A Dynamic Panel Data Approach (Mumbai: Indira Gandhi Institute ofDevelopment Research).
NASS, 2004, 2002 Census of Agriculture: Vol. 1. Geographic Area (Washington, DC: UnitedStates Government Printing Office), p. 561. National Agriculture Statistical Service(NASS). Available online at: www.nass.usda/gov/research/Cropland/SARS1a.htm(accessed 15 April 2009).
NAVALGUND, R.R., PARIHAR, J.S., AJAI and RAO, P.P.N., 1991, Crop inventory using remotesensing data. Current Science, 61, pp. 162–171.
PAL, D.K., SRIVASTAV, P., DURGE, S.L. and BHATTACHARYA, T., 2003, Role of micro-topographyin the formation of sodic soils in the semi-arid part of Indo-Gangetic plain. Catena, 51,pp. 3–31.
PALANIAPPAN, S.P., 1985, Cropping System in the Tropics: Principles and Management (NewDelhi: Wiley Eastern).
Dow
nloa
ded
by [
Indi
an I
nstit
ute
of R
emot
e Se
nsin
g], [
Kam
al P
ande
y] a
t 21:
53 0
6 O
ctob
er 2
011

4526 N. J. Singh et al.
PANIGRAHY, R.K., PANIGRAHY, S., RAY, S.S. and PARIHAR, J.S., 2005a, Analysis of the crop-ping pattern and crop rotation of a subsistence agricultural region using high temporalremote sensing data. Available online at: www.Mapindia.org/2005/papersagriculture(accessed 15 May 2009).
PANIGRAHY, S. and CHAKRABORTY, M., 1998, An integrated approach for potato crop inten-sification using temporal remote sensing data. ISPRS Journal of Photogrammetry andRemote Sensing, 53, pp. 54–60.
PANIGRAHY, S., CHAKRABORTY, M., SHARMA, S. A., KUNDU, N., GHOSH, S.C. and PAL, M.,1997, Early estimation of rice acre using temporal ERS-1 synthetic aperture radardata – a case study for Horwah and Hooghly districts of West Bengal, India.International Journal of Remote Sensing, 18, pp. 1827–1833.
PANIGRAHY, S., MANJUNATH, K.R. and RAY, S.S., 2005b, Deriving cropping system perfor-mance indices using remote sensing data. International Journal of Remote Sensing, 26,pp. 2595–2606.
PANIGRAHY, S., PARIHAR, J.S. and PATEL, N.K., 1992, Rice acreage estimation using NOAAAVHRR data. Journal of the Indian Society of Remote Sensing, 20, pp. 35–42.
PINTER, P.J., HATFIELD, J.L., SCHEPERS, J.S., BARNES, E.M., MORAN, M.S., DAUGHTRY, C.S.and UPCHURCH, D.R., 2003, Remote sensing for crop management. PhotogrammetricEngineering and Remote Sensing, 69, pp. 647–664.
QIU, J., TANG, M., FROLKING, S., BOLES, S., LI, C., XIAO, X., LIU, J., ZHUANG, Y. and QIN, X.,2003, Mapping single-, double-, and triple- crop agriculture in China at 0.5◦ × 0.5◦ bycombining country-scale census data with a remote sensing-derived Land cover map.Geocarto International, 18, pp. 3–13.
QUARMBY, N.A., MILNES, M., HINDLE, T.L. and SILLEOS, N., 1993, The use of multi-temporalNDVI measurements from AVHRR data for crop yield estimation and prediction.International Journal of Remote Sensing, 14, pp. 199–210.
RAJAK, D.R., OZA, M.P., BHAGIA, N. and DADHWAL, V.K., 2002, Monitoring cropping changesusing multitemporal WiFS data. Geocarto International, 17, pp. 53–58.
SEARCHINGER, T., HEIMLICH, R., HOUGHTON, R.A., DONG, F., ELOBEID, A., FABIOSA, J.,TOKGOZ, S., HAYES, D. and YU, T., 2008, Use of U.S. croplands for biofuels increasesgreenhouse gases through emissions from land-use change. Science, 319, pp. 1238–1240.
SKIRVIN, M., WILLIAM, G.K., STUART, E.M., SAMUEL, E.D., JOHN, K.M., EDMONDS, M.,CHRISTOPHER, J.W. and DAVID, R.W., 2004, Assessing the accuracy of satellite-derivedland-cover classification using historical aerial photography, digital orthophoto quad-rangles, and airborne video data. In Remote Sensing and GIS Accuracy Assessment, R.S.Lunetta and J.G. Lyon (Eds), pp. 116–129 (New York: CRC Press).
SOARES, D.M., GALVAO, L.S. and FORMAGGIO, A.R., 2008, Crop area estimation from orig-inal simulated spatial resolution data and landscape metrics. Scientia Agricola, 65,pp. 459–467.
WARDLOW, B.D. and EGBERT, S.L., 2002, Discrimination cropping patterns for the U.S. CentralGreat Plains region using time-series MODIS 250 meter NDVI data – preliminaryresults. In Proceedings of the ISPRS Commission I: Integrated Remote Sensing at theGlobal, Regional and Local Scale, vol. 39, part I, 10–15 November, Denver, CO, USA.
WARDLOW, B.D. and EGBERT, S.L., 2008, Large-area crop mapping using time-series MODIS250 m NDVI data: an assessment for the U.S. Central Great Plains. Remote Sensing ofEnvironment, 112, pp. 1096–1116.
XIAO, X., LIU, J., ZHUANG, D., FROLKING, S., BOLES, S., XU, B., LIU, M., SALAS, W., MOORE,B. and LI, C., 2003, Uncertainties in estimates of cropland area in China: a comparisonbetween an AVHRR-derived dataset and a Landsat TM-derived dataset. Global andPlanetary Change, 37, pp. 297–306.
Dow
nloa
ded
by [
Indi
an I
nstit
ute
of R
emot
e Se
nsin
g], [
Kam
al P
ande
y] a
t 21:
53 0
6 O
ctob
er 2
011
Copyright © 2022 FDOKUMEN