PMUJ – P6 – Detalhamento de Propostas - Prefeitura de Jundiaí
Upload
khangminh22Category
view
0download
0
PP66 HHeellpp FFoorr PPrriinntt
RReelleeaassee 88..00

2
Copyright © 1999, 2010, Oracle and/or its affiliates. All rights reserved.
The Programs (which include both the software and documentation) contain proprietary
information; they are provided under a license agreement containing restrictions on use
and disclosure and are also protected by copyright, patent, and other intellectual and
industrial property laws. Reverse engineering, disassembly, or decompilation of the
Programs, except to the extent required to obtain interoperability with other
independently created software or as specified by law, is prohibited.
The information contained in this document is subject to change without notice. If you
find any problems in the documentation, please report them to us in writing. This
document is not warranted to be error-free. Except as may be expressly permitted in your
license agreement for these Programs, no part of these Programs may be reproduced or
transmitted in any form or by any means, electronic or mechanical, for any purpose.
The platform-specific hardware and software requirements included in this document
were current when this document was published. However, because new platforms and
operating system software versions might be certified after this document is published,
review the certification matrix on the My Oracle Support (formerly OracleMetaLink) Web
site for the most up-to-date list of certified hardware platforms and operating system
versions. The My Oracle Support (formerly OracleMetaLink) Web site is available at the
following URL:
http://metalink.oracle.com/
or
http://support.oracle.com/
If the Programs are delivered to the United States Government or anyone licensing or
using the Programs on behalf of the United States Government, the following notice is
applicable: U.S. GOVERNMENT RIGHTS Programs, software, databases, and related
documentation and technical data delivered to U.S. Government customers are
"commercial computer software" or "commercial technical data" pursuant to the
applicable Federal Acquisition Regulation and agency-specific supplemental
regulations. As such, use, duplication, disclosure, modification, and adaptation of the
Programs, including documentation and technical data, shall be subject to the licensing
restrictions set forth in the applicable Oracle license agreement, and, to the extent
applicable, the additional rights set forth in FAR 52.227-19, Commercial Computer
Software -- Restricted Rights (June 1987). Oracle USA, Inc., 500 Oracle Parkway,
Redwood City, CA 94065.
Copyright

Copyright
3
The Programs are not intended for use in any nuclear, aviation, mass transit, medical, or
other inherently dangerous applications. It shall be the licensee's responsibility to take all
appropriate fail-safe, backup, redundancy and other measures to ensure the safe use of
such applications if the Programs are used for such purposes, and we disclaim liability for
any damages caused by such use of the Programs.
Oracle and Primavera are registered trademarks of Oracle Corporation and/or its
affiliates. Other names may be trademarks of their respective owners. The Programs may
provide links to Web sites and access to content, products, and services from third
parties. Oracle is not responsible for the availability of, or any content provided on,
third-party Web sites. You bear all risks associated with the use of such content. If you
choose to purchase any products or services from a third party, the relationship is directly
between you and the third party. Oracle is not responsible for: (a) the quality of
third-party products or services; or (b) fulfilling any of the terms of the agreement with the
third party, including delivery of products or services and warranty obligations related to
purchased products or services. Oracle is not responsible for any loss or damage of any
sort that you may incur from dealing with any third party.
To view the P6 Commercial Notices and Disclosures for Documentation, go to the
\Documentation\<language>\Notices and Disclosures folder of the P6 physical media
or download.


5
Contents
Copyright ........................................................................................................................................... 2
Preface ............................................................................................................................................ 39
About Oracle Primavera P6 Enterprise Project Portfolio Management ....................................... 39
Working with Oracle Primavera P6 Enterprise Project Portfolio Management Suite .................. 41
About P6 ..................................................................................................................................... 43 About P6 Professional................................................................................................................ 44 About P6 Progress Reporter ...................................................................................................... 45 About Contract Management .................................................................................................... 45 About the Oracle Business Process Management Suite ......................................................... 45 About Oracle BI Publisher and the OBIEE Platform ................................................................. 46 About P6 Reporting Database ................................................................................................... 46 About P6 Analytics ..................................................................................................................... 46 About the P6 Integration API ..................................................................................................... 48 About P6 Web Services .............................................................................................................. 48 About Oracle Universal Content Management ......................................................................... 48 About Oracle Primavera Risk Analysis ...................................................................................... 49
P6 EPPM Release 8 New Feature Summary ................................................................................. 51
Web Administration and Configuration ..................................................................................... 53 Easy Web Setup, Configuration, and Administration........................................................ 53 Web-Based User Administration ........................................................................................ 53 One Source for All Enterprise Data .................................................................................... 54
Project and Portfolio Management ........................................................................................... 57 Web-Based EPS and Project Views ................................................................................... 57 Enhanced Portfolio Filtering .............................................................................................. 57 Schedule Preview ............................................................................................................... 57 Recalculate Assignment Costs .......................................................................................... 58 Project Baselines ................................................................................................................ 58
Project Templates ...................................................................................................................... 59 Reusable Project Templates .............................................................................................. 59
Resource Management ............................................................................................................. 61 Completely Redesigned Resource and Role UI ................................................................ 61 Improved Resource Planning and Analysis ....................................................................... 61 Optimized Resource and Role Team Handling ................................................................. 61
Risk Management ...................................................................................................................... 63 Qualitative Risk Management ........................................................................................... 63 Risk Scoring Matrix, Categories, and Thresholds ............................................................. 63
Enterprise Reporting .................................................................................................................. 65 Integrated On-Demand or Scheduled Reports ................................................................. 65
Workflow ..................................................................................................................................... 67 Oracle BPM Integration ...................................................................................................... 67
Technological Advances ............................................................................................................ 69 Integrated LDAP Provisioning ............................................................................................ 69 Enhanced and Expanded Job Services ............................................................................. 69 Expanded Event Support ................................................................................................... 69 Integration Ready ............................................................................................................... 70

P6 Help
6
P6 Web Services Security Enhancements ........................................................................ 70 Platforms............................................................................................................................. 70
User Productivity ........................................................................................................................ 71 Auto-Complete Field Values ............................................................................................... 71 Customizable Toolbars ....................................................................................................... 71 Enhanced Activity, Assignment, and EPS Filters .............................................................. 71 E-mail Activity Views ........................................................................................................... 71 Keyboard Shortcuts ............................................................................................................ 72 Menus and Icons ................................................................................................................ 72 Redesigned Detail Windows .............................................................................................. 72
Learning Assistance ................................................................................................................... 73 Completely Redesigned Online Help ................................................................................. 73 UPK Multimedia Tutorials .................................................................................................. 73
P6 Professional .......................................................................................................................... 75 Timescaled Logic Diagrams ............................................................................................... 75 Tabbed Views ...................................................................................................................... 75 Customizable Menus .......................................................................................................... 75 Customizable Toolbars ....................................................................................................... 75 Page Breaks by Group Band .............................................................................................. 75 Apply Actuals and Summarize Project Now Run as Services ........................................... 76 Auto-Refresh Grouped Data by Window ............................................................................ 76 Client-Web Delineation and Integration ............................................................................ 76 Streamlined Installer .......................................................................................................... 76 Improved HTML Editor ....................................................................................................... 76 Command Line Support ..................................................................................................... 76
P6 EPPM Documentation ............................................................................................................... 77
Where to Get Support ..................................................................................................................... 79
P6 Overview .................................................................................................................................... 81
Working with P6............................................................................................................................... 81
Customizing the P6 User Experience ............................................................................................. 83
About the User Interface ................................................................................................................. 84
Working with the P6 User Interface .......................................................................................... 84 About Screen Controls ....................................................................................................... 87 Working with the Main Menus ........................................................................................... 87 About the Most Recently Used List.................................................................................... 89
Working with Tables ........................................................................................................... 90 About Columns (Fields) ...................................................................................................... 91
Showing or Hiding Columns in a Table .............................................................................. 91 Configuring Columns or Values ......................................................................................... 91 Working with Toolbars ........................................................................................................ 93 Customizing Toolbars ......................................................................................................... 94
Working with "Select a Value" Dialog Boxes ..................................................................... 95 Selecting Values from "Select a Value" Dialog Boxes ...................................................... 97
Working with Data in P6..................................................................................................... 98 Working with Detail Windows ............................................................................................ 99 About Portlets ................................................................................................................... 101 About Data Entry Controls ................................................................................................ 101
Printing Pages Using P6 Printing Tools ........................................................................................ 101
Printing Pages Using Your Web Browser ...................................................................................... 102

Contents
7
About E-Mail Notifications ............................................................................................................ 103
Working with E-Mail Notifications............................................................................................ 103 Sending E-Mail to Resource Teams................................................................................. 104 Sending E-Mail Notifications about Resource Assignments .......................................... 105
About Grouping and Sorting ......................................................................................................... 105
Working with Group and Sort Features ................................................................................... 105 Grouping and Sorting Information .......................................................................................... 107
About Find, Search, and Filter Features ...................................................................................... 108
Working with Find, Search, and Filter Features ..................................................................... 108 Finding Entries .................................................................................................................. 109 Searching for Entries ........................................................................................................ 109 About Filters ...................................................................................................................... 110 Working with Filters .......................................................................................................... 110
Filtering Data .................................................................................................................... 113
Pages Supporting Filters .................................................................................................. 113
Creating, Modifying, and Deleting Data ....................................................................................... 114
Cutting, Copying, and Pasting Data ......................................................................................... 115 About Removal vs. Deletion..................................................................................................... 116
Deleting Entries ................................................................................................................ 116 Undoing Mistakes .................................................................................................................... 116
About Metrics and Calculations.................................................................................................... 117
Using Visual Indicators ............................................................................................................. 118
About Importing and Exporting Data ............................................................................................ 118
About Importing and Exporting Projects ................................................................................. 119 Configuring Browser Settings .................................................................................................. 119
About P6 Help ................................................................................................................................ 120
Viewing Help Content ............................................................................................................... 120 Working with P6 Help Topics ................................................................................................... 121
About Integration with Other Applications ................................................................................... 123
About Timesheets .................................................................................................................... 124 Working with Timesheets ................................................................................................. 124
Dashboards and Workspaces ....................................................................................................... 127
About Dashboards, Workspaces, and Workgroups ..................................................................... 127
About Dashboards.................................................................................................................... 127 Working with Dashboards ................................................................................................ 128 Creating Dashboards ....................................................................................................... 131 Customizing Dashboards ................................................................................................. 131 Configuring Dashboard Content ...................................................................................... 132
Configuring Dashboard Access ........................................................................................ 132
Configuring Dashboard Filters ......................................................................................... 133
Configuring Dashboard Layout ........................................................................................ 133
Showing and Hiding Dashboards .................................................................................... 134
Working with Workflows ................................................................................................... 134 About Project Workspaces ....................................................................................................... 137
Working with Project Workspaces ................................................................................... 138

P6 Help
8
Customizing Project Workspace ...................................................................................... 138 Configuring Workspace Content ...................................................................................... 139
Configuring Workspace Layout ........................................................................................ 139
Sending E-Mail to Project Resources .............................................................................. 140 About Project Performance Metrics ................................................................................ 141 Assessing Project Performance ....................................................................................... 141
Assessing Project Health ................................................................................................. 142
Customizing Project Statistics ......................................................................................... 143
Identifying Critical Activities Behind Schedule ................................................................ 143
About Performance Thresholds ....................................................................................... 144
Working with Performance Thresholds ........................................................................... 145 About Milestones .............................................................................................................. 145
Sending E-Mail about Milestones .................................................................................... 145 About Cost Performance Index (CPI) ............................................................................... 146
About Schedule Performance Index (SPI) ....................................................................... 146
About To-Complete Performance Index (TCPI) ................................................................ 146
About Contract Management .......................................................................................... 147 Working with Contract Management ............................................................................... 147
Opening the Contract Management Control Center ....................................................... 148
Linking P6 and Contract Management Projects ............................................................. 148
Linking P6/P6 Professional and Contract Management Applications .......................... 149
About Project Workgroups ....................................................................................................... 149 Working with Workgroups ................................................................................................ 150 Assigning Documents to Projects .................................................................................... 150
Creating Workgroups ........................................................................................................ 151
Customizing Workgroups ................................................................................................. 151
Assigning Workgroup Activities ........................................................................................ 152
Creating Workgroup Issues .............................................................................................. 153
Sending E-Mail to Activity Resources .............................................................................. 154
About Portlets ........................................................................................................................... 155 List of Portlets ................................................................................................................... 155 Customizing Portlets ........................................................................................................ 159 Customizing the My Risks Portlet .................................................................................... 159
Customizing the Resource Analysis Chart Portlet .......................................................... 159
Customizing the Open Requests for Resources Portlet ................................................. 160
Customizing Portfolio View Portlets ................................................................................. 160
Customizing Scorecard Portfolio View Portlets ............................................................... 161 Analyzing Resource Team Usage in the Resource Team Summary Portlet .................. 161
Creating Portfolio View Portlets ....................................................................................... 162 Document Review and Workflow Portlets ....................................................................... 163 Participating in Document Reviews ................................................................................. 163
Terminating Document Reviews ...................................................................................... 163

Contents
9
About Workflows ............................................................................................................... 164
Working with Workflows ................................................................................................... 165 Participating in Workflows ............................................................................................... 168 Linking the Cost Worksheet to Contract Management .................................................. 169 Opening Projects from Dashboard Portlets .................................................................... 170 Sending E-Mail to Resource Teams................................................................................. 170 Sending E-Mail Notifications about Resource Assignments .......................................... 171 Creating Custom Portlets ................................................................................................. 171
Portfolios ....................................................................................................................................... 173
About Portfolios ............................................................................................................................. 173
Working with Portfolios ................................................................................................................. 173
Creating Portfolios .................................................................................................................... 174 Creating Projects While Working with Portfolios .................................................................... 174 Creating Projects in a Portfolio View Scorecard Portlet ......................................................... 175 Creating Projects on the Portfolio Analysis Page ................................................................... 175 Assigning Projects to a Portfolio .............................................................................................. 176 Defining Performance Thresholds........................................................................................... 177
Portfolio Views ............................................................................................................................... 179
About Portfolio Views ............................................................................................................... 179 Working with Portfolio Views ................................................................................................... 179
Creating Portfolio Views ................................................................................................... 180 Working with Portfolio View Scorecards ................................................................................. 181 Working with Portfolio View Bubble Charts ............................................................................ 184 Working with Portfolio View Pie Charts ................................................................................... 186 Working with Portfolio View Histograms ................................................................................. 187
Portfolio Scenarios ........................................................................................................................ 191
About Portfolio Scenarios ........................................................................................................ 191 About What-if Analysis ............................................................................................................. 191 Working with Portfolio Scenarios ............................................................................................ 191
Creating Portfolio Scenarios ............................................................................................ 191 Sending E-Mail About Scenarios ..................................................................................... 192
Capacity Planning .......................................................................................................................... 195
About Capacity Planning .......................................................................................................... 195 Working with the Capacity Planning Page .............................................................................. 195
Analyzing Role Allocation (Capacity Planning) ................................................................ 198
Projects ......................................................................................................................................... 201
About Projects ............................................................................................................................... 201
Working with Projects .............................................................................................................. 201 Opening Projects, Portfolios, or Templates ............................................................................ 202
Opening Projects from Dashboard Portlets .................................................................... 202 Opening Recently Used Projects, Templates, or Portfolios ............................................ 202 Opening Selected Projects or Templates ........................................................................ 203 Opening the Last Project or Projects ............................................................................... 203 Opening Dependent Projects ........................................................................................... 203
The EPS .......................................................................................................................................... 205
About the Enterprise Project Structure (EPS) ......................................................................... 205 Working with the EPS ....................................................................................................... 205

P6 Help
10
Creating EPS Elements .................................................................................................... 207 Configuring the EPS.......................................................................................................... 208
About Projects .......................................................................................................................... 208 Creating Projects .............................................................................................................. 208 Creating Projects from Existing Projects or Templates .................................................. 209 Deleting Projects or EPSs ................................................................................................ 210 Opening Projects or Templates in the EPS ..................................................................... 210 Customizing Detail Windows ........................................................................................... 211 Configuring Project Preferences ...................................................................................... 212 Configuring Project Calculations...................................................................................... 213
Linking P6 and Contract Management Projects ............................................................. 213
Configuring Project Defaults ............................................................................................ 214
Configuring General Project Preferences ........................................................................ 214
Configuring P6 Progress Reporter ................................................................................... 215
Configuring Project Summarization ................................................................................. 215
About Gantt Charts ................................................................................................................... 215 Working with the Activity Gantt Chart .............................................................................. 216 Configuring Gantt Charts ................................................................................................. 216
About the Activity Table ........................................................................................................... 217 About Baselines ....................................................................................................................... 218
Working with Baselines .................................................................................................... 219 Creating Baselines ........................................................................................................... 220
About the Summarizer Service ................................................................................................ 221 Working with the Summarizer Service ............................................................................ 222 Summarizing Projects ...................................................................................................... 222
About Importing and Exporting Projects ................................................................................. 223 Working with Primavera XML Project Import/Export ...................................................... 223 Exporting Projects using Microsoft Project XML ............................................................. 224 Configuring Microsoft Project Templates ........................................................................ 224
Exporting Projects using Primavera XML Format ........................................................... 225 Importing Projects using Microsoft Project XML ............................................................. 226 Importing Projects using Primavera XML Format ........................................................... 226 Exporting Projects to Excel ............................................................................................... 227
About Budget Change Logs ..................................................................................................... 228 Creating Budget Change Requests ................................................................................. 228 Approving/Denying Budget Change Requests ............................................................. 229
About Project Views.................................................................................................................. 229 Configuring Project Views ................................................................................................ 229 Configuring Project View Columns ................................................................................... 230
Configuring Project View Grouping .................................................................................. 231
Configuring Project View Filters ....................................................................................... 232
Applying Filters ................................................................................................................. 232 Creating Filters ................................................................................................................. 233 Configuring Filters ............................................................................................................ 234 Configuring Project View Bars .......................................................................................... 234
Configuring Project View Gantt Chart .............................................................................. 235
Configuring Project View Access ...................................................................................... 235
About Bars ................................................................................................................................ 236

Contents
11
About Columns (Fields) ............................................................................................................ 236 About Grouping and Sorting .................................................................................................... 236 About Gantt Charts ................................................................................................................... 237 About Filters.............................................................................................................................. 237 About Funding Sources ............................................................................................................ 237
Assigning Project Funding Sources ................................................................................. 237 About Notebooks ...................................................................................................................... 237
Working with Notebooks .................................................................................................. 238 About Notebook Topics ............................................................................................................ 238
Assigning Notebook Topics .............................................................................................. 238 About Project Codes ................................................................................................................. 239
Assigning Project Codes ................................................................................................... 239 About P6 Progress Reporter .................................................................................................... 239 About Contract Management .................................................................................................. 240
Linking P6/P6 Professional and Contract Management Applications .......................... 240
About Project Templates ............................................................................................................... 240
Working with Project Templates .............................................................................................. 241 Creating Project Templates ..................................................................................................... 241
Activities ......................................................................................................................................... 243
About Activities ......................................................................................................................... 243 Working with Activities ..................................................................................................... 243 Creating Activities ............................................................................................................. 244 Configuring General Activity Information ........................................................................ 245 Recalculating Assignment Costs ..................................................................................... 246 Sending Project Data to ERP ........................................................................................... 246 Customizing Detail Windows ........................................................................................... 247
About Activity Types ................................................................................................................. 248 About Suspending and Resuming Activities ........................................................................... 248 About WBS Summary Activities ............................................................................................... 249 About Gantt Charts ................................................................................................................... 249
Working with the Activity Gantt Chart .............................................................................. 249 Configuring Gantt Charts ................................................................................................. 250
About the Activity Table ........................................................................................................... 251 About Activity Networks ........................................................................................................... 251
Working with Activities in the Activity Network ............................................................... 252 About Calendar View ................................................................................................................ 253
Working with Activities in Calendar View ........................................................................ 254 About Siblings and Children .................................................................................................... 255 About Work Breakdown Structures (WBS) .............................................................................. 255
Working with WBS Elements ............................................................................................ 255 Creating a WBS ................................................................................................................. 256 Adding a WBS from Template .......................................................................................... 257 Configuring General WBS Information ............................................................................ 258
About Baselines ....................................................................................................................... 258 Working with Baselines .................................................................................................... 259 Creating Baselines ........................................................................................................... 261
About Scheduling ..................................................................................................................... 262 Scheduling Projects .......................................................................................................... 262 Configuring General Scheduling Options ........................................................................ 263
Configuring Advanced Scheduling Options ..................................................................... 264

P6 Help
12
About Float ............................................................................................................................... 265 About Critical Path Activities .................................................................................................... 265
Working with Critical Path Activities ................................................................................ 265 About Schedule Preview .......................................................................................................... 267
Enabling Schedule Preview .............................................................................................. 267 About Resource Leveling ......................................................................................................... 268
Leveling Resources .......................................................................................................... 268 Configuring Resource Leveling Options and Priorities ................................................... 269
About The Apply Actuals Feature ............................................................................................ 271 Working with the Apply Actuals Feature .......................................................................... 271 Applying Actuals to a Project............................................................................................ 273
About Updating Progress ......................................................................................................... 274 Working with Updating Progress...................................................................................... 274
About the Auto Compute Actuals Feature .............................................................................. 275 Working with the Auto-Compute Actuals Feature ........................................................... 275 Applying Auto Compute Actuals to Activities ................................................................... 276
About Store Period Performance............................................................................................. 277 Storing Period Performance............................................................................................. 277
About Importing and Exporting Data ....................................................................................... 278 Importing Activities from Excel ........................................................................................ 278 Exporting Activities to Excel ............................................................................................. 279 Creating Import Templates .............................................................................................. 279
About Progress Spotlight ......................................................................................................... 280 About Relationship Lines ......................................................................................................... 280 About Progress Lines ............................................................................................................... 281 About Activity Views ................................................................................................................. 281
Working with Activity Views .............................................................................................. 281 Creating Views .................................................................................................................. 282 Configuring Activity Views ................................................................................................ 283 Configuring Activity View Columns ................................................................................... 284
Configuring Activity View Grouping .................................................................................. 284
Configuring Activity View Filters ....................................................................................... 285
Applying Filters ................................................................................................................. 286 Creating Filters ................................................................................................................. 287 Configuring Filters ............................................................................................................ 287 Configuring Activity View Bars .......................................................................................... 288
Configuring Activity View Gantt Chart .............................................................................. 289
Configuring Activity Network ............................................................................................ 290
Configuring Activity View Access ...................................................................................... 290
Sending E-Mail of an Activity View ................................................................................... 291 About Bars ................................................................................................................................ 291 About Columns (Fields) ............................................................................................................ 292 About Filters.............................................................................................................................. 292 About Grouping and Sorting .................................................................................................... 292 About Resource Assignments .................................................................................................. 293
Assigning Activity Resources............................................................................................ 293 Configuring Activity Resources ........................................................................................ 294 Requesting Resources for Activities ................................................................................ 294 Specifying Resource Assignment Rates .......................................................................... 295

Contents
13
Adding Activity Resource Estimates ................................................................................ 296 About the Recalculate Assignment Costs Feature ......................................................... 296
About Resources ...................................................................................................................... 297 About Roles .............................................................................................................................. 297
Assigning Activity Roles .................................................................................................... 297 Configuring Activity Roles ................................................................................................. 298 Assigning Resource Curves to Resource or Role Assignments from the Activities Page299
About Activity Codes ................................................................................................................. 300 Creating Activity Code Values for Activities ..................................................................... 300 Assigning Activity Code Values to Activities .................................................................... 301
About Documents ..................................................................................................................... 302 Assigning Documents to Activities ................................................................................... 302
About Expenses ........................................................................................................................ 303 Creating Expenses ............................................................................................................ 303 Configuring Expenses ....................................................................................................... 303 Configuring Auto Compute Actuals for Expenses ........................................................... 304
About Feedback ....................................................................................................................... 304 Adding Feedback .............................................................................................................. 304 Adding the New Feedback Column ................................................................................. 305 Acknowledging Feedback ................................................................................................ 306
About Status ............................................................................................................................. 306 Configuring Status ............................................................................................................ 306 Configuring Status Units and Costs ................................................................................. 307
About Duration Types ............................................................................................................... 308 Working with Duration Types ........................................................................................... 308 Configuring Status Durations........................................................................................... 309
About Constraints ..................................................................................................................... 309 Working with Activity Constraints .................................................................................... 310 Configuring Status Constraints ........................................................................................ 310
About Issues ............................................................................................................................. 311 Creating Activity Issues .................................................................................................... 312 Configuring Activity Issues ............................................................................................... 312
About Notebooks ...................................................................................................................... 313 Working with Notebooks .................................................................................................. 313
About Notebook Topics ............................................................................................................ 313 Assigning Notebook Topics .............................................................................................. 313
About Relationships ................................................................................................................. 314 Creating Activity Relationships ........................................................................................ 314 Configuring Activity Relationships ................................................................................... 315 Assigning Predecessor Relationships ............................................................................. 316 Configuring Predecessor Relationships .......................................................................... 317 Assigning Successor Relationships ................................................................................. 318 Configuring Successor Relationships .............................................................................. 318
About Risks ............................................................................................................................... 319 Working with Project Risks .............................................................................................. 319 Assigning a Risk to an Activity ......................................................................................... 321
About Steps .............................................................................................................................. 322 Working with Activity Steps .............................................................................................. 322 Creating Activity Steps ..................................................................................................... 323 Configuring Activity Steps ................................................................................................ 324
About Step Templates .............................................................................................................. 324 Adding Activity Steps from a Step Template ................................................................... 324
About Trace Logic ..................................................................................................................... 325

P6 Help
14
Viewing Relationships with Trace Logic .......................................................................... 325 About Budget Change Logs ..................................................................................................... 326
Creating Budget Change Requests ................................................................................. 327 Approving/Denying Budget Change Requests ............................................................. 327
About Earned Value ................................................................................................................. 328 Configuring WBS Earned Value ....................................................................................... 329
About Milestones ..................................................................................................................... 329 Creating WBS Milestones ................................................................................................ 329
Team Usage ................................................................................................................................... 331
About Team Usage ................................................................................................................... 331 Customizing Team Usage ................................................................................................. 331 Assigning Resources to Unstaffed Activities ................................................................... 331 Exporting Team Usage Spreadsheets ............................................................................. 332 Searching Resources ....................................................................................................... 333 Sending E-Mail to a Project Manager .............................................................................. 334
Issues ............................................................................................................................................. 337
About Issues ............................................................................................................................. 337 Working with Issues ......................................................................................................... 337 Creating Project Issues .................................................................................................... 338 Configuring Project Issues ............................................................................................... 339 Customizing Project Issues .............................................................................................. 339 Assigning Related Items to Issues................................................................................... 340 Sending E-Mail about Issues ........................................................................................... 341
About Issue Codes ................................................................................................................... 342 Assigning Issue Codes...................................................................................................... 342
About Issue Forms ................................................................................................................... 342 Creating Issue Forms ....................................................................................................... 343 Assigning Projects to Issue Forms ................................................................................... 344
Risks ............................................................................................................................................... 345
About Risks ............................................................................................................................... 345 Risk Enterprise Data ................................................................................................................ 347
Working with Risks Enterprise Data ................................................................................ 347 Configuring Risk Enterprise Data .................................................................................... 347 Risk Thresholds ................................................................................................................ 349 About Risk Thresholds ..................................................................................................... 349
Working with Risk Thresholds .......................................................................................... 349 Creating Risk Thresholds ................................................................................................. 350 Modifying Risk Thresholds ............................................................................................... 351 Risk Scoring Matrices ...................................................................................................... 353 About Risk Scoring Matrices ............................................................................................ 353
Working with Risk Scoring Matrices ................................................................................ 354 Creating Risk Scoring Matrices ....................................................................................... 357 Assigning a Risk Scoring Matrix to a Project ................................................................... 358 Assigning a Risk Scoring Matrix to a Project from the Enterprise Data Pane ............... 358 Assigning a Risk Scoring Matrix to a Project from the EPS Page .................................. 359 Assigning a Risk Scoring Matrix to a Project from the Portfolios Section ..................... 359 Risk Categories ................................................................................................................. 361 About Risk Categories ...................................................................................................... 361
Creating Risk Categories .................................................................................................. 361 Risk UDFs .......................................................................................................................... 363 About Risk User Defined Fields ....................................................................................... 363

Contents
15
Creating Risk UDFs ........................................................................................................... 363 Project Risks ............................................................................................................................. 365
Working with Project Risks .............................................................................................. 365 Managing Project Risks ................................................................................................... 367 Creating Project Risks ...................................................................................................... 367
Adding Detailed Project-Level Risks ................................................................................ 367 Adding Project Risks to Activities .................................................................................... 368 Adding High-Level Project Risks ...................................................................................... 369 Assigning a Risk to an Activity ......................................................................................... 370
Risk Response Plans ........................................................................................................ 371
About Risk Response Plans ............................................................................................. 371 Working with Risk Response Plans ................................................................................. 371 Developing a Risk Response Plan ................................................................................... 372 Adding Risk Response Plans ........................................................................................... 372 Adding Risk Response Plan Action Items ....................................................................... 373 Assigning Activities to Risk Response Plan Action Items ............................................... 374 Exporting Risk Data .......................................................................................................... 374
Documents .................................................................................................................................... 377
About Documents ..................................................................................................................... 377 Working with Documents ................................................................................................. 377 Adding Documents to a Project without the Content Repository................................... 378 Assigning Documents to Workgroups ............................................................................. 379 Creating Document Folders ............................................................................................. 379
Creating Document Templates ........................................................................................ 380 Copying Documents from Existing Templates ................................................................ 381 Sending E-Mail about Documents ................................................................................... 382
About the Content Repository ................................................................................................. 383 Working with the Content Repository .............................................................................. 383 Adding Documents to a Project and Storing Them in the Content Repository ............. 384 Adding Documents to a Project from the Content Repository ....................................... 385 Checking Out Documents ................................................................................................ 386 Checking In Documents ................................................................................................... 387 Configuring Document Details ......................................................................................... 387 Assigning Related Items to Documents .......................................................................... 388
About Document Reviews ................................................................................................ 389 Reviewing Documents ...................................................................................................... 390
Creating Document Reviews ............................................................................................ 390
Searching for Documents ................................................................................................ 391 Searching for Documents (Advanced Search) ................................................................ 392
Searching for Documents (Quick Search) ....................................................................... 392
Viewing Documents .......................................................................................................... 393 Downloading Documents ................................................................................................. 394
About Scheduled Services ............................................................................................................ 395
Creating Scheduled Services ................................................................................................... 395 Configuring Scheduled Services.............................................................................................. 395
Resources ..................................................................................................................................... 397
Roles .............................................................................................................................................. 397

P6 Help
16
About Roles .............................................................................................................................. 397 Creating Roles .......................................................................................................................... 397 Assigning a Resource to a Role ............................................................................................... 398 Assigning a Role Team to a Role ............................................................................................. 399 Assigning Rates to Roles ......................................................................................................... 400 Assigning Work Limits to Roles ............................................................................................... 400
Role Teams .................................................................................................................................... 401
About Role Teams .................................................................................................................... 401 Creating Role Teams ................................................................................................................ 401 Assigning a Role to a Role Team ............................................................................................. 401
Resources ...................................................................................................................................... 403
About Resources ...................................................................................................................... 403 Adding Resources .................................................................................................................... 403 Assigning a Role to a Resource ............................................................................................... 404 Assigning a Resource Team to a Resource ............................................................................ 404 Configuring Resource Settings ................................................................................................ 405 Assigning Calendars to Resources .......................................................................................... 406 Configuring Timesheet Reporting for Resources ................................................................... 407
Configuring Resource Settings for Timesheet Reporting ............................................... 407 Assigning Resource Codes ...................................................................................................... 408 Assigning Resource Rates ....................................................................................................... 409 Creating Import Templates ...................................................................................................... 410 Importing Resource Data ......................................................................................................... 411
Resource Teams ............................................................................................................................ 413
About Resource Teams ............................................................................................................ 413 Creating Resource Teams ....................................................................................................... 413 Assigning a Resource to a Resource Team ............................................................................ 414
Resource Assignments ................................................................................................................. 415
About Resource Assignments .................................................................................................. 415 Working with Resource Assignments in the Gantt Chart ....................................................... 415
Viewing Resource Assignments in a Gantt Chart ........................................................... 415 Customizing the Resources Assignments Gantt Chart Bars .......................................... 416 Setting the Resources Detailed Assignments Gantt Chart Timescale .......................... 417 Modifying Resource Assignment Dates in the Gantt Chart ............................................ 417
Viewing Assignment Unit and Cost Spreads ........................................................................... 418 Exporting Resource Assignment Data .................................................................................... 419 Assigning Resource Curves to Resource or Role Assignments from the Resources Assignments
Page .......................................................................................................................................... 419 Applying the Progress Spotlight to the Resources Assignments View .................................. 420
Resource Planning ........................................................................................................................ 421
About Resource Planning ........................................................................................................ 421 Customizing the Resource Planning Spreadsheet ................................................................. 421 Assigning Projects or WBS Elements to Resources or Roles ................................................ 423 Assigning Resources or Roles to Projects or WBS Elements ................................................ 424 Modifying Resource or Role Assignment Dates ..................................................................... 425 Allocating Units or the Percentage of Available Units to Resources or Roles ...................... 426 Synchronizing Resource Planning Dates ................................................................................ 427 Splitting a Resource or Role Assignment ............................................................................... 428

Contents
17
Categorizing Resource or Role Assignments using Status Codes ........................................ 429 Exporting the Resource Planning Spreadsheet ...................................................................... 430
Resource Analysis ......................................................................................................................... 431
About Resource Analysis ......................................................................................................... 431 Analyzing Resource Allocations ............................................................................................... 431 Assigning Resources to Unstaffed Activities .......................................................................... 433 Viewing Role Usage .................................................................................................................. 434 Viewing Resource Usage.......................................................................................................... 435 Exporting Resource or Role Usage Data ................................................................................. 437
Exporting Resource Data .............................................................................................................. 438
Exporting Resource Administration Data ................................................................................ 438 Exporting Resource Assignment Data .................................................................................... 438 Exporting the Resource Planning Spreadsheet ...................................................................... 439 Exporting Resource or Role Usage Data ................................................................................. 439
Reports ......................................................................................................................................... 440
About Reports ................................................................................................................................ 440
Working with Reports ............................................................................................................... 442 Scheduling Reports .................................................................................................................. 443 Running Reports On-Demand.................................................................................................. 444 Exporting a List of Reports....................................................................................................... 445 Viewing the Report Run History ............................................................................................... 445
Administration............................................................................................................................... 447
About Administration ..................................................................................................................... 447
About My Preferences ................................................................................................................... 447
Working with My Preferences .................................................................................................. 448 Customizing My Preferences Global Preferences .................................................................. 449
Customizing Global Currency Preferences ...................................................................... 449 Customizing Global Date Format Preferences ................................................................ 449 Customizing Global General Preferences ....................................................................... 450 Customizing Global Issues Preferences .......................................................................... 450 Customizing Global Performance Threshold Preferences ............................................. 450 Customizing Global Project Score Preferences .............................................................. 451 Customizing Global Resources Preferences ................................................................... 451 Customizing Global Row Number Preferences ............................................................... 452 Customizing Global Time Units Format Preferences ...................................................... 452 Sending E-Mail Notifications about Resource Assignments .......................................... 453
Customizing My Preferences View Preferences ..................................................................... 454 Changing Your Own Password ................................................................................................. 455
About My Calendar ........................................................................................................................ 455
Configuring My Calendar ......................................................................................................... 456 Setting Work Hours Per Time Period for My Calendar ................................................... 456 Configuring the Standard Work Week for My Calendar ................................................. 456 Modifying Calendar Days on My Calendar ...................................................................... 456 Importing Events to My Calendar .................................................................................... 457
About Application Settings ............................................................................................................ 458
Working with Application Settings ........................................................................................... 458 Configuring Data Limits Settings ............................................................................................. 459

P6 Help
18
Configuring Earned Value Settings ......................................................................................... 459 Configuring General Settings................................................................................................... 460 Configuring ID Lengths Settings .............................................................................................. 461 Configuring Timesheets Settings ............................................................................................ 461 Configuring Time Periods Settings .......................................................................................... 462
About Enterprise Data ................................................................................................................... 462
Working with Enterprise Data .................................................................................................. 463 About Baseline Types ............................................................................................................... 464
Creating Baseline Types ................................................................................................... 464 About Funding Sources ............................................................................................................ 465
Creating Funding Sources ................................................................................................ 465 About Notebook Topics ............................................................................................................ 465
Creating Notebook Topics ................................................................................................ 465 About Calendars ....................................................................................................................... 466
Working with Calendars ................................................................................................... 466 Creating Global Calendars ............................................................................................... 467 Configuring Global Calendars .......................................................................................... 467 Setting Work Hours Per Time Period for Global Calendars ............................................ 468
Configuring the Standard Work Week for Global Calendars .......................................... 468
Modifying Calendar Days on Global Calendars............................................................... 468
Setting the Default Global Calendar................................................................................ 469
Creating Project Calendars .............................................................................................. 469 Configuring Project Calendars ......................................................................................... 470 Assigning a Base Calendar to a Project Calendar .......................................................... 470
Setting Work Hours Per Period for a Project Calendar ................................................... 470
Configuring the Standard Work Week for Project Calendars ......................................... 471
Modifying Calendar Days on Project Calendars .............................................................. 471
Changing a Project Calendar to a Global Calendar ........................................................ 472
Creating Resource Calendars .......................................................................................... 472 Configuring Resource Calendars ..................................................................................... 473 Assigning a Base Calendar to a Resource Calendar ...................................................... 473
Assigning a Resource to a Resource Calendar ............................................................... 474
Setting Work Hours Per Time Period for a Resource Calendar...................................... 474
Configuring the Standard Work Week for Resource Calendars ..................................... 475
Modifying Calendar Days ................................................................................................. 475
Changing the Calendar Type ............................................................................................ 476
About Project Codes ................................................................................................................. 476 Creating Project Codes ..................................................................................................... 476 Creating Project Code Values .......................................................................................... 477 Configuring Project Codes ................................................................................................ 478 Configuring Project Code Values ..................................................................................... 478
About User Defined Fields ....................................................................................................... 479 Creating Project UDFs ...................................................................................................... 479 Defining Formulas for User Defined Fields ..................................................................... 480 Defining Indicators for User Defined Fields .................................................................... 480 Defining Statements for User Defined Fields ................................................................. 481

Contents
19
Creating WBS UDFs .......................................................................................................... 482 Creating Activity UDFs ...................................................................................................... 483 Creating Expense UDFs .................................................................................................... 483 Creating Step UDFs .......................................................................................................... 483 Creating Risk UDFs ........................................................................................................... 484 Creating Issue UDFs ......................................................................................................... 484 Creating Document UDFs................................................................................................. 485 Creating Assignment UDFs .............................................................................................. 485 Creating Resource UDFs .................................................................................................. 485
About Work Breakdown Structures (WBS) .............................................................................. 486 Creating WBS Categories ................................................................................................. 486
About Activity Codes ................................................................................................................. 486 Creating Activity Codes ..................................................................................................... 487 Creating Activity Code Values .......................................................................................... 488 Configuring Activity Code Values ..................................................................................... 489 Configuring EPS-Level Activity Codes .............................................................................. 490
About Cost Accounts ................................................................................................................ 490 Creating Cost Accounts .................................................................................................... 490
About Expenses ........................................................................................................................ 491 Creating Expense Categories ........................................................................................... 491
About Step Templates .............................................................................................................. 492 Creating Step Templates ................................................................................................. 492 Configuring Step Templates ............................................................................................ 492
About Risks ............................................................................................................................... 493 Working with Risks Enterprise Data ................................................................................ 493 Configuring Risk Enterprise Data .................................................................................... 494 About Risk Scoring Matrices ............................................................................................ 494 Working with Risk Scoring Matrices ................................................................................ 495
Creating Risk Scoring Matrices........................................................................................ 498
Assigning a Risk Scoring Matrix to a Project ................................................................... 499
Assigning a Risk Scoring Matrix to a Project from the Enterprise Data Pane ............... 499
Assigning a Risk Scoring Matrix to a Project from the EPS Page................................... 500
Assigning a Risk Scoring Matrix to a Project from the Portfolios Section ..................... 500
About Risk Thresholds ..................................................................................................... 501 Working with Risk Thresholds .......................................................................................... 501
Creating Risk Thresholds ................................................................................................. 503
Modifying Risk Thresholds ............................................................................................... 504
About Risk Categories ...................................................................................................... 505 Creating Risk Categories .................................................................................................. 505
About Issues ............................................................................................................................. 506 Creating Issue Codes ....................................................................................................... 506 Creating Issue Code Values ............................................................................................. 507
About Document Categories and Statuses ............................................................................ 507 Creating Document Categories........................................................................................ 507 Creating Document Statuses ........................................................................................... 508
About Currencies ...................................................................................................................... 508 Adding a Currency ............................................................................................................ 509 Defining a Base Currency ................................................................................................ 509
About Financial Periods ........................................................................................................... 509

P6 Help
20
Creating Financial Periods ............................................................................................... 510 Creating a Financial Period Batch ................................................................................... 511
About Overhead Codes ............................................................................................................ 512 Creating Overhead Codes ................................................................................................ 512
About Timesheet Periods ......................................................................................................... 512 Creating Timesheet Periods ............................................................................................. 512
About Resource and Role Rate Types ..................................................................................... 513 Configuring Resource and Role Rate Types .................................................................... 513
About Resource Codes ............................................................................................................. 513 Creating Resource Codes ................................................................................................ 513 Creating Resource Code Values ...................................................................................... 514
About Resource Curves............................................................................................................ 515 Defining Resource Curves................................................................................................ 515
About Units of Measure ........................................................................................................... 516 Creating Units of Measure ............................................................................................... 516
About User Access ......................................................................................................................... 516
About Users .............................................................................................................................. 517 The Default Admin Superuser.......................................................................................... 517 Creating User Accounts for P6 EPPM .............................................................................. 517 Configuring User Access .................................................................................................. 519 Assigning Associated Resources ..................................................................................... 519
Assigning Global Security Profiles ................................................................................... 520
Assigning Module Access ................................................................................................. 520
Assigning OBS Elements to Users ................................................................................... 521
Assigning Resource Access.............................................................................................. 521
Assigning User Interface Views ........................................................................................ 522
Changing Passwords ........................................................................................................ 522 Changing User Passwords ............................................................................................... 523
Counting Users ................................................................................................................. 523 About the OBS .......................................................................................................................... 524
Creating an OBS ............................................................................................................... 524 Assigning Users to an OBS ............................................................................................... 525
About Security Profiles ............................................................................................................. 526 Working with Security Profiles ......................................................................................... 527 Creating Global Security Profiles ..................................................................................... 528 Creating Project Security Profiles .................................................................................... 529
About User Interface Views ........................................................................................................... 530
Working with User Interface Views .......................................................................................... 530 Creating User Interface Views ................................................................................................. 531 Configuring User Interface Views ............................................................................................ 533
Context-Sensitive Help Topics ...................................................................................................... 535
Access Tab of the Create Filter Dialog Box of the Assignments Page ....................................... 535
Access Tab of the Create or Modify Filter Dialog Box ................................................................. 535
Access Tab of the Customize Activity View Dialog Box ............................................................... 536
Access Tab of the Customize Dashboard Page ........................................................................... 536
Access Tab of the Customize Project View Dialog Box................................................................ 537

Contents
21
Access Tab of the Customize Resources Assignments View Dialog Box of the Assignments Page
........................................................................................................................................................ 537
Access Tab of the Issue Forms Page ........................................................................................... 538
Action Required Tab of the Document Reviews Portlet .............................................................. 539
Action Required Tab of the Workflows Portlet ............................................................................. 540
Activities Detail Window of the Project Security Profiles Page ................................................... 543
Activities Detail Window of the Risks Page .................................................................................. 544
Activities Page ............................................................................................................................... 547
Activities Portlet of the Workgroup Workspace Page .................................................................. 550
Activities Work Area of the Timesheet Approval Page ................................................................ 551
Activity Codes Details Page of the Activity Form Page ................................................................ 554
Activity Codes Page ....................................................................................................................... 555
Activity Details Dialog Box of the Resource Staffing Dialog Box ................................................ 555
Activity Details of the Resources Dialog Box ............................................................................... 556
Activity Editing Tab of the User Interface View Details Page ...................................................... 557
Activity Form Page ......................................................................................................................... 558
Activity List for WBS Dialog Box .................................................................................................... 559
Activity Network Format of the Activities Page ............................................................................ 560
Activity Network Tab of the Customize Activity View Dialog Box ................................................ 561
Activity Tab of the Modify Template Dialog Box of the Import/Export Project Dialog Box ........ 562
Activity UDFs Page ......................................................................................................................... 563
Add Activity Expenses Page of the Activity Form Page ................................................................ 564
Add Document Page (without Content Repository) ..................................................................... 565
Add Folder Dialog Box ................................................................................................................... 567
Add Issue Page .............................................................................................................................. 568
Add Steps Page of the Activity Form Page ................................................................................... 569
Add User Dialog Box ...................................................................................................................... 570
Add Users from LDAP Dialog Box of the Users Page ................................................................... 571
Administration Detail Window of the Global Security Profiles Page .......................................... 572
Administration Page ...................................................................................................................... 573
Advanced Tab of the Add Project Dialog Box ............................................................................... 574
Advanced Tab of the Add Project Template Dialog Box .............................................................. 576
Advanced Tab of the Scheduling Options Dialog Box ................................................................. 577
Analysis Page ................................................................................................................................. 579
Application Settings Pane ............................................................................................................. 579
Apply Actuals Dialog Box of the Activities Page ........................................................................... 580
Approve Document Review Dialog Box ........................................................................................ 581
Assign by Search Dialog Box of the Planning Page ..................................................................... 582
Assign Project Manager Delegate Dialog Box of the Timesheet Approval Page ....................... 584
Assign Resource Manager Delegate Dialog Box of the Timesheet Approval Page ................... 584
Assignment UDFs Page ................................................................................................................. 585
Assignments Detail Window of the Activities Page ..................................................................... 586
Assignments Page ......................................................................................................................... 590

P6 Help
22
Bars Tab of the Customize Activity View Dialog Box ................................................................... 591
Bars Tab of the Customize Gantt Chart Options Dialog Box of the Activities Page ................... 593
Bars Tab of the Customize Gantt Chart Options Dialog Box of the Assignments Page ............ 595
Bars Tab of the Customize Gantt Chart Options Dialog Box of the EPS Page ........................... 597
Bars Tab of the Customize Project View Dialog Box ................................................................... 598
Bars Tab of the Customize Resource Assignments View Dialog Box of the Assignments Page599
Baseline Types Page ..................................................................................................................... 600
Baselines Dialog Box ..................................................................................................................... 601
BEI - Activities with No Project Baseline Finish Date Section of the Schedule Check Report Dialog
Box.................................................................................................................................................. 602
Budget Log Detail Window of the EPS Page ................................................................................ 603
Calculations Page of the Project Preferences Dialog Box .......................................................... 604
Calendar Tab of the Global Calendars Page ................................................................................ 605
Calendar Tab of the Project Calendars Page ............................................................................... 606
Calendar Tab of the Resource Calendars Page .......................................................................... 607
Calendar Tab of the View Calendar Dialog Box ........................................................................... 609
Calendar Tab of the View Calendar Dialog Box ........................................................................... 611
Calendar View Format of the Activities Page ............................................................................... 612
Cause Detail Window of the Risks Page ...................................................................................... 613
Change Password Dialog Box of the Users Page ........................................................................ 613
Chart Tab of the Customize Project Issues Dialog Box ............................................................... 614
Check Schedule Dialog Box .......................................................................................................... 616
Check Summary Section of the Schedule Check Report Dialog Box ......................................... 619
Codes Detail Window of the Activities Page ................................................................................ 620
Codes Detail Window of the EPS Page ........................................................................................ 620
Codes Detail Window of the Global Security Profiles Page ........................................................ 621
Codes Detail Window of the Project Security Profiles Page ....................................................... 624
Codes Detail Window of the Resources Tab of the Administration Page .................................. 625
Codes Section of the Activity Form Page ..................................................................................... 626
Columns Tab of the Customize Activity View Dialog Box ............................................................ 627
Columns Tab of the Customize Cost Worksheet Dialog Box ...................................................... 628
Columns Tab of the Customize Project Issues Dialog Box ......................................................... 628
Columns Tab of the Customize Project Statistics Dialog Box ..................................................... 629
Columns Tab of the Customize Project View Dialog Box ............................................................ 630
Columns Tab of the Customize Resource Assignments View Dialog Box of the Assignments Page
........................................................................................................................................................ 631
Columns Tab of the Customize Risks Portlet Dialog Box ............................................................ 632
Columns Tab of the Customize Scorecards Dialog Box of the Portfolio Views Section of the
Customize Dashboard Page ......................................................................................................... 633
Columns Tab of the Customize Spreadsheet Dialog Box of the Planning Page ........................ 634
Common Screen Elements for Customizing Columns or Values ................................................ 634
Communication Center Portlet of the Dashboards Page ............................................................ 635
Communication Center Portlet of the Workspace Page ............................................................. 636

Contents
23
Content Tab of the Customize Dashboard Page ......................................................................... 637
Content Tab of the Customize Workgroup Workspace Page ...................................................... 638
Content Tab of the User Interface View Details Page ................................................................. 639
Content Tab of the Workspace Details Page ............................................................................... 643
Contract Documents Portlet of the Workspace Page ................................................................. 644
Contract Issues Portlet of the Workspace Page .......................................................................... 644
Contract Management Page of the Project Preferences Dialog Box ......................................... 645
Contract Management Section of the Content Tab of the Customize Dashboard Page .......... 645
Contract Management Section of the Content Tab of the Customize Workspace Page .......... 646
Contract Reports Portlet of the Workspace Page ........................................................................ 648
Copy Project Options Dialog Box .................................................................................................. 648
Cost Accounts Page ....................................................................................................................... 650
Cost Worksheet Portlet ................................................................................................................. 651
Count Dialog Box of the Users Page............................................................................................. 652
Create Filter Dialog Box of the Assignments Page ...................................................................... 652
Create or Modify Filter Dialog Box of the Activities Page ............................................................ 653
Create Portfolio Page .................................................................................................................... 654
Critical Activities Behind Schedule Portlet of the Workspace Page ........................................... 655
Currencies Page ............................................................................................................................ 656
Currency Section of Global Tab of the My Preferences Page ..................................................... 658
Curve Definition Detail Window of the Resource Curves Page .................................................. 659
Custom Field Mapping Tab of the Modify Template Dialog Box of the Import/Export Project Dialog
Box.................................................................................................................................................. 659
Custom Portlet ............................................................................................................................... 660
Custom Portlet Section of the Content Tab of the Workspace Page ......................................... 661
Custom Portlets Section of the Content Tab of the Customize Dashboard Page ..................... 661
Customize Activity List for WBS Dialog Box ................................................................................. 662
Customize Activity Network Dialog Box of the Activities Page .................................................... 662
Customize Activity View Dialog Box .............................................................................................. 664
Customize Capacity Planning Chart Tab ...................................................................................... 665
Customize Capacity Planning Columns Tab ................................................................................ 666
Customize Capacity Planning Dialog Box ..................................................................................... 667
Customize Capacity Planning Grouping Tab ................................................................................ 668
Customize Capacity Planning Waterline Tab ............................................................................... 669
Customize Chart Dialog Box of the Resource Analysis Chart Portlet ......................................... 670
Customize Chart Dialog Box of the Resource Analysis Tab of the Analysis Page ..................... 671
Customize Columns Dialog Box of the Activities Page ................................................................ 672
Customize Columns Dialog Box of the EPS Page ........................................................................ 673
Customize Cost Worksheet Dialog Box ........................................................................................ 674
Customize Dashboard Page ......................................................................................................... 674
Customize Detail Windows Dialog Box of the Activities Page ..................................................... 675
Customize Detail Windows Dialog Box of the EPS Page ............................................................. 676
Customize Dialog Box of the Portfolio View Portlet ..................................................................... 676

P6 Help
24
Customize Dialog Box of the Team Usage Page .......................................................................... 678
Customize Filters Dialog Box of the Activities Page .................................................................... 680
Customize Filters Dialog Box of the Assignments Page .............................................................. 681
Customize Filters Dialog Box of the EPS Page ............................................................................ 682
Customize Gantt Chart Options Dialog Box of the Activities Page ............................................. 682
Customize Gantt Chart Options Dialog Box of the Assignments Page ....................................... 683
Customize Gantt Chart Options Dialog Box of the EPS Page ..................................................... 683
Customize Groupings Dialog Box of the Activities Page ............................................................. 684
Customize Groupings Dialog Box of the EPS Page ...................................................................... 685
Customize Project Issues Dialog Box ........................................................................................... 686
Customize Project Score Dialog Box of the Project Score Section of the Global Tab of the My
Preferences Page .......................................................................................................................... 687
Customize Project Statistics Dialog Box ...................................................................................... 688
Customize Project View Dialog Box .............................................................................................. 688
Customize Resource Assignments View Dialog Box of the Assignments Page ......................... 689
Customize Risks Dialog Box ......................................................................................................... 690
Customize Scorecard Columns Tab ............................................................................................. 691
Customize Scorecard Dialog Box ................................................................................................. 692
Customize Scorecard Dialog Box of the Portfolio Views Section of the Customize Dashboard Page
........................................................................................................................................................ 693
Customize Scorecard Group Tab .................................................................................................. 693
Customize Scorecard Waterline Tab ............................................................................................ 695
Customize Spreadsheet Dialog Box of the Planning Page ......................................................... 697
Customize Spreadsheet or Histogram Dialog Box of the Analysis Page .................................... 697
Customize Toolbar Items Dialog Box............................................................................................ 698
Customize Toolbar Items Dialog Box of the Assignments Page ................................................. 699
Customize Usage Options Dialog Box of the Assignments Page ................................................ 700
Dashboards Page .......................................................................................................................... 700
Data Limits Page ........................................................................................................................... 702
Date Format Section of the Global Tab of the My Preferences Page ........................................ 702
Day View Detail Window of the Calendar View of the Activities Page ........................................ 703
Defaults Page of the Project Preferences Dialog Box ................................................................. 704
Definition Tab of the Create Filter Dialog Box of the Assignments Page ................................... 706
Definition Tab of the Create or Modify Filter Dialog Box ............................................................. 707
Description Detail Window of the Cost Accounts Page ............................................................... 709
Description Detail Window of the EPS Page ................................................................................ 710
Description Detail Window of the Funding Sources Page .......................................................... 710
Description Detail Window of the OBS Page ............................................................................... 711
Description Detail Window of the Reports Page ......................................................................... 711
Description Detail Window of the Risk Scoring Matrices Page .................................................. 712
Description Detail Window of the Risks Page ............................................................................. 712
Description Detail Window of the Roles Tab of the Administration Page .................................. 713
Description Section of the Documents Details Page (without content repository) ................... 713

Contents
25
Description Tab of the Document Details Section (with content repository) ............................ 714
Document Categories Page .......................................................................................................... 715
Document Details Dialog Box ....................................................................................................... 715
Document Details Page of the Documents Page (without content repository) ......................... 716
Document Details Section of the Documents Page (with content repository) .......................... 717
Document Review Details Dialog Box of the Project Tab ........................................................... 718
Document Reviews Portlet ........................................................................................................... 720
Document Statuses Page ............................................................................................................. 720
Document UDFs Page ................................................................................................................... 721
Documents Detail Window of the Activities Page ....................................................................... 721
Documents Details Page of the Activity Form Page .................................................................... 722
Documents Page (with content repository) ................................................................................. 723
Documents Page (without content repository) ............................................................................ 724
Documents Portlet of the Workgroup Workspace Page ............................................................. 725
Documents Section of the Activity Form Page ............................................................................ 726
Earned Value Page ........................................................................................................................ 727
Earned Value Performance Portlet of the Dashboards Page ..................................................... 728
Earned Value Performance Portlet of the Workspace Page ....................................................... 729
Edit Dates and Constraints Page of the Activity Form Page ....................................................... 731
Edit Day Dialog Box of Calendars ................................................................................................. 734
Edit Duration and Units Page of the Activity Form Page ............................................................. 736
Edit Relationship Dialog Box of the Activities Page ..................................................................... 737
Edit Resource Assignment Dialog Box ......................................................................................... 738
Edit Resource Assignment Section of Activity Details of the Resources Dialog Box................. 739
Edit Resource or Role Details Page of the Open Requests for Resources Portlet .................... 741
Add or Edit Service Dialog Box of the Scheduled Services Page ............................................... 742
Edit Spending and Benefit Plans of Project Page ....................................................................... 743
Effect Detail Window of the Risks Page ....................................................................................... 744
Enterprise Data Page .................................................................................................................... 745
Enterprise Project Data Dialog Box .............................................................................................. 747
Enterprise Resource Data Dialog Box .......................................................................................... 749
EPS and Projects Detail Window of the Project Security Profiles Page ..................................... 750
EPS Budget Log Detail Window of the EPS Page ........................................................................ 752
EPS Funding Detail Window of the EPS Page .............................................................................. 753
EPS General Detail Window of the EPS Page .............................................................................. 754
EPS Notebooks Detail Window of the EPS Page ......................................................................... 755
EPS Page ........................................................................................................................................ 755
EPS Tab of the Activity Codes Page .............................................................................................. 757
Exceptions Section of the Leveling Report Log ........................................................................... 758
Exceptions Section of the Scheduling Report Dialog Box of the Activities Page ....................... 759
Expense Categories Page ............................................................................................................. 760
Expense Details Page of the Activity Form Page ......................................................................... 760
Expense UDFs Page ...................................................................................................................... 762

P6 Help
26
Expenses Detail Window of the Activities Page ........................................................................... 763
Expenses Section of the Activity Form Page ................................................................................ 765
Export Tab of the Import/Export Project Dialog Box ................................................................... 767
Feedback Detail Window of the Activities Page .......................................................................... 767
Filter Tab of the Customize Project Issues Dialog Box ................................................................ 768
Filter Tab of the Customize Risks Dialog Box .............................................................................. 770
Filters Tab of the Customize Activity View Dialog Box ................................................................. 771
Filters Tab of the Customize Project View Dialog Box ................................................................. 771
Filters Tab of the Customize Resource Assignments View Dialog Box of the Assignments Page772
Financial Periods Page .................................................................................................................. 773
Formula Detail Window of the Project UDFs Page ...................................................................... 774
Funding Detail Window of the EPS Page ..................................................................................... 775
Funding Sources Page .................................................................................................................. 776
Gantt Chart Format of the Activities Page ................................................................................... 776
Gantt Chart Format of the EPS Page ............................................................................................ 778
Gantt Chart Tab of the Customize Activity View Dialog Box ........................................................ 779
Gantt Chart Tab of the Customize Gantt Chart Options Dialog Box of the Activities Page ....... 780
Gantt Chart Tab of the Customize Gantt Chart Options Dialog Box of the Assignments Page 782
Gantt Chart Tab of the Customize Gantt Chart Options Dialog Box of the EPS Page ............... 782
Gantt Chart Tab of the Customize Project View Dialog Box ........................................................ 783
Gantt Chart Tab of the Customize Resource Assignments View Dialog Box of the Assignments Page
........................................................................................................................................................ 784
General Detail Window of the Activities Page ............................................................................. 785
General Detail Window of the EPS Page ...................................................................................... 789
General Detail Window of the Resources Tab of the Administration Page ............................... 791
General Page ................................................................................................................................. 793
General Page of the Project Preferences Dialog Box .................................................................. 794
General Section of the Activity Form Page .................................................................................. 795
General Section of the Content Tab of the Customize Dashboard Page ................................... 798
General Section of the Documents Details Page (without content repository) ......................... 799
General Section of the Global Tab of the My Preferences Page ................................................ 800
General Tab of the Add Project Dialog Box .................................................................................. 802
General Tab of the Add Project Template Dialog Box ................................................................. 803
General Tab of the Customize Spreadsheet Dialog Box of the Planning Page ......................... 804
General Tab of the Document Details Section ............................................................................ 805
General Tab of the Modify Template Dialog Box of the Import/Export Project Dialog Box ...... 808
General Tab of the Scheduling Options Dialog Box .................................................................... 809
Generate Financial Periods Dialog Box of the Financial Periods Page ...................................... 811
Generate Timesheet Periods Dialog Box of the Timesheet Periods Page ................................. 812
Global Calendars Page .................................................................................................................. 813
Global Data Detail Window of the Global Security Profiles Page ............................................... 814
Global Data Section of the Import Tab of the Import/Export Project Dialog Box ...................... 815
Global Security Profiles Page ........................................................................................................ 816

Contents
27
Global Tab of the Activity Codes Page.......................................................................................... 817
Global Tab of the My Preferences Page ....................................................................................... 818
Group Tab of the Customize Cost Worksheet Dialog Box ........................................................... 819
Group Tab of the Customize Project Issues Dialog Box .............................................................. 820
Group Tab of the Customize Project Statistics Dialog Box ......................................................... 822
Group Tab of the Customize Scorecard Dialog Box of the Portfolio Views Section of the Customize
Dashboard Page ............................................................................................................................ 823
Grouping Tab of the Customize Activity View Dialog Box ............................................................ 824
Grouping Tab of the Customize Project View Dialog Box ............................................................ 826
Grouping Tab of the Customize Resource Assignments View Dialog Box of the Assignments Page
........................................................................................................................................................ 828
Hard Constraints - Constraints That Prevent Activities Being Moved Section of the Schedule Check
Report Dialog Box .......................................................................................................................... 829
History Dialog Box ......................................................................................................................... 830
History of Workflow Instance Dialog Box ..................................................................................... 831
History Tab of the Document Details Section (with content repository) .................................... 832
ID Lengths Page ............................................................................................................................ 833
Impacts Detail Window of the Risk Scoring Matrices Page ........................................................ 834
Import Calendar Events Dialog Box .............................................................................................. 835
Import Tab of the Import/Export Project Dialog Box ................................................................... 835
Import/Export Project Dialog Box ................................................................................................. 837
Index Performance Portlet of the Dashboards Page ................................................................... 838
Index Performance Portlet of the Workspace Page .................................................................... 839
Indicators Detail Window of the Project UDFs Page ................................................................... 841
Invalid Progress Dates - Activities with Actual Dates After the Data Date Section of the Schedule
Check Report Dialog Box .............................................................................................................. 842
Invalid Progress Dates - Incomplete Activities Before the Data Date Section of the Schedule Check
Report Dialog Box .......................................................................................................................... 844
Issue Codes Page .......................................................................................................................... 845
Issue Codes Section of the Issue Forms Page ............................................................................ 846
Issue Details Page ......................................................................................................................... 846
Issue Form Tab of the Issue Forms Page .................................................................................... 849
Issue Forms Page .......................................................................................................................... 850
Issue UDFs Page............................................................................................................................ 851
Issues Detail Window of the Activities Page ................................................................................ 852
Issues Detail Window of the EPS Page ........................................................................................ 853
Issues Page .................................................................................................................................... 854
Issues Portlet of the Workgroup Workspace Page ...................................................................... 857
Issues Section of the Global Tab of the My Preferences Page ................................................... 859
Lags - Relationships with a Positive Lag Duration Section of the Schedule Check Report Dialog Box
........................................................................................................................................................ 860
Large Durations - Activities That Have a Remaining Duration Greater Than 352 Hours Section of the
Schedule Check Report Dialog Box .............................................................................................. 861

P6 Help
28
Large Float - Activities with a Total Float Greater Than 352 Hours Section of the Schedule Check
Report Dialog Box .......................................................................................................................... 862
Late Activities - Activities Scheduled to Finish Later Than the Project Baseline Section of the
Schedule Check Report Dialog Box .............................................................................................. 863
Layout Tab of the Customize Dashboard Page ........................................................................... 864
Layout Tab of the Customize Workgroup Workspace Page ........................................................ 865
Layout Tab of the Workspace Details Page ................................................................................. 866
Level Resources Dialog Box of the Activities Page...................................................................... 867
Leveling Report Log ....................................................................................................................... 867
Leveling Results Section of the Leveling Report Log .................................................................. 868
Leveling Settings Section of the Leveling Report Log ................................................................. 869
Leveling Warnings Section of the Leveling Report Log ............................................................... 870
Levels Detail Window of the Risk Thresholds Page .................................................................... 871
Limits Detail Window of the Roles Tab of the Administration Page ........................................... 872
Links to Closed Projects - Activities with Links to Closed Projects Section of the Schedule Check
Report Dialog Box .......................................................................................................................... 872
Logic - Activities Missing Predecessors or Successors Section of the Schedule Check Report Dialog
Box.................................................................................................................................................. 874
Long Lags - Relationships with a Lag Duration Greater Than 352 Hours Section of the Schedule
Check Report Dialog Box .............................................................................................................. 875
Manage Dashboards Page ........................................................................................................... 876
Manage Portfolio Views Page ....................................................................................................... 877
Manage Portfolios Page ................................................................................................................ 878
Manage Scenarios Page ............................................................................................................... 879
Milestone Status Portlet of the Workspace Page ........................................................................ 880
Modify Template Dialog Box of the Import/Export Project Dialog Box ....................................... 881
Module Access Detail Window of the Users Page ....................................................................... 882
My Activities Portlet ....................................................................................................................... 884
My Calendar Dialog Box ................................................................................................................ 886
My Calendar Portlet ....................................................................................................................... 887
My Documents Portlet ................................................................................................................... 887
My Issues Portlet ........................................................................................................................... 888
My Preferences Page .................................................................................................................... 890
My Projects Portlet ........................................................................................................................ 890
My Reviews Tab of the Document Reviews Portlet ..................................................................... 892
My Risks Portlet ............................................................................................................................. 893
My Workflows Tab of the Workflows Portlet ................................................................................ 894
My Workgroups Portlet of the Dashboards Page ........................................................................ 896
Negative Float - Activities with a Total Float Less Than 0 Section of the Schedule Check Report
Dialog Box ...................................................................................................................................... 897
Negative Lags - Relationships with a Lag Duration of Less Than 0 Section of the Schedule Check
Report Dialog Box .......................................................................................................................... 898
Notebook Details Page of the Activity Form Page ....................................................................... 899
Notebook Section of Activity Details of the Resources Dialog Box ............................................ 900

Contents
29
Notebook Section of the Activity Details Dialog Box ................................................................... 901
Notebook Section of the Activity Form Page ............................................................................... 902
Notebook Topics Page .................................................................................................................. 903
Notebook Topics Portlet of the Workspace Page ........................................................................ 904
Notebooks Detail Window of the Activities Page ......................................................................... 904
Notebooks Detail Window of the EPS Page ................................................................................. 905
Notebooks Tab of the Modify Project Template Dialog Box of the Import/Export Project Dialog Box
........................................................................................................................................................ 906
Notes Detail Window of the Resources Tab of the Administration Page ................................... 907
Notes Detail Window of the Risks Page ....................................................................................... 907
OBS Page ....................................................................................................................................... 908
Open a Request for a Resource Dialog Box................................................................................. 908
Open a Request for a Resource Dialog Box of the Assignments Detail Window of the Activities Page
........................................................................................................................................................ 909
Open Portfolio Dialog Box ............................................................................................................. 910
Open Projects Dialog Box .............................................................................................................. 911
Open Requests for Resources Portlet .......................................................................................... 912
Options Tab of the Level Resources Dialog Box of the Activities Page ...................................... 912
Options Tab of the Report Settings Dialog Box ........................................................................... 914
Overallocated Resources Portlet of the Workspace Page .......................................................... 916
Overhead Codes Page ................................................................................................................... 916
Password Tab of the My Preferences Page ................................................................................. 917
Performance Threshold Section of the Content Tab of the Workspace Page ........................... 918
Performance Threshold Section of the Global Tab of the My Preferences Page ...................... 920
Planning Page ................................................................................................................................ 922
Portfolio Analysis Page .................................................................................................................. 925
Portfolio Capacity Planning Page ................................................................................................. 926
Portfolio Details Page .................................................................................................................... 928
Portfolio Gantt Chart Page ............................................................................................................ 930
Portfolio Performance Status Page .............................................................................................. 931
Portfolio ROI Page ......................................................................................................................... 933
Portfolio Scenario Details Page .................................................................................................... 935
Portfolio Scenario Notes Dialog Box ............................................................................................ 936
Portfolio Scenario Save As Dialog Box ......................................................................................... 937
Portfolio View Details Page ........................................................................................................... 937
Portfolio View Portlet ..................................................................................................................... 940
Portfolio View Save As Dialog Box ................................................................................................ 943
Portfolios Page .............................................................................................................................. 943
Predecessors Detail Window of the Activities Page .................................................................... 944
Predecessors Section of the Relationships Section of the Activity Form Page ......................... 945
Prices Detail Window of the Roles Tab of the Administration Page ........................................... 946
Private Documents Tab of the My Documents Portlet (with content repository) ...................... 947
Probability and Impact Diagram Detail Window of the Risk Scoring Matrices Page ................ 948

P6 Help
30
Probability and Impact Diagram Detail Window of the Risks Page ............................................ 948
Probability Detail Window of the Risk Scoring Matrices Page .................................................... 949
Progress Reporter Page of the Project Preferences Dialog Box ................................................. 950
Project Access Detail Window of the Users Page ........................................................................ 950
Project Calendar Portlet of the Workspace Page ........................................................................ 951
Project Calendars Page ................................................................................................................. 952
Project Codes Page ....................................................................................................................... 952
Project Collaboration Section of the Content Tab of the Workspace Details Page ................... 954
Project Data Detail Window of the Project Security Profiles Page ............................................. 954
Project Data Section of the Import Tab of the Import/Export Project Dialog Box ..................... 956
Project Documents Portlet of the Workspace Page (with content repository) .......................... 957
Project Documents Portlet of the Workspace Page (without content repository) ..................... 957
Project Gantt Chart Portlet ............................................................................................................ 958
Project Health Portlet of the Dashboards Page ........................................................................... 960
Project Health Portlet of the Workspace Page ............................................................................ 960
Project Issues Portlet of the Workspace Page ............................................................................ 961
Project Notebooks Portlet of the Dashboards Page ................................................................... 963
Project Preferences Dialog Box .................................................................................................... 964
Project Risks Portlet ...................................................................................................................... 965
Project Score Section of Global Tab of the My Preferences Page.............................................. 966
Project Section of the Content Tab of the Customize Workspace Page .................................... 967
Project Security Profiles Page ....................................................................................................... 968
Project Statistics Page .................................................................................................................. 970
Project Statistics Portlet................................................................................................................ 971
Project Tab of the Activity Codes Page ......................................................................................... 973
Project Tab of the Documents Page (with content repository) ................................................... 974
Project Tab of the Documents Portlet of the Workgroup Workspace Page ............................... 974
Project Tab of the Project Documents Portlet of the Workspace Page (with content repository)975
Project UDFs Page ......................................................................................................................... 976
Projects Checked Have Links to the Following Closed Projects Section of the Schedule Check Report
Dialog Box ...................................................................................................................................... 977
Projects Checked Section of the Schedule Check Report Dialog Box ....................................... 978
Projects Detail Window of the Risk Scoring Matrices Page ........................................................ 979
Projects Page ................................................................................................................................. 980
Rate Types Page ............................................................................................................................ 981
Recent Documents Tab of the My Documents Portlet ................................................................ 982
Reject Document Review Dialog Box ........................................................................................... 982
Related Applications Detail Window of the Project Security Profiles Page................................ 983
Related Items Section of the Document Details Page (without content repository) ................ 984
Related Items Tab of the Document Details Section (with content repository) ........................ 985
Relationship Types - The Majority of Relationships Should be Finish to Start Section of the Schedule
Check Report Dialog Box .............................................................................................................. 986
Relationships Details Page of the Activity Form Page ................................................................ 988

Contents
31
Relationships Section of the Activity Form Page ......................................................................... 989
Report Settings Dialog Box ........................................................................................................... 990
Report Settings Dialog Box (Add Report Schedule) .................................................................... 991
Reports Page ................................................................................................................................. 992
Reports View of the Reports Page ................................................................................................ 993
Request for Information (RFI) Portlet of the Workspace Page ................................................... 994
Resource Analysis Chart Portlet ................................................................................................... 995
Resource Analysis Tab of the Analysis Page ............................................................................... 997
Resource Assignments Detail Window of the Project Security Profiles Page ............................ 998
Resource Calendars Page.......................................................................................................... 1000
Resource Codes Page ................................................................................................................ 1000
Resource Curves Page ............................................................................................................... 1001
Resource Details Page of the Activity Form Page .................................................................... 1002
Resource Search Criteria Dialog Box ........................................................................................ 1005
Resource Search Results Dialog Box ........................................................................................ 1008
Resource Staffing Dialog Box .................................................................................................... 1010
Resource Staffing Dialog Box of the Team Usage Page .......................................................... 1012
Resource Tab of the Modify Template Dialog Box of the Import/Export Project Dialog Box . 1013
Resource Team Summary Portlet ............................................................................................. 1014
Resource Teams Detail Window of the Resources Tab of the Administration Page .............. 1016
Resource Teams Tab of the Administration Page .................................................................... 1016
Resource UDFs Page .................................................................................................................. 1017
Resource Usage Tab of the Analysis Page ................................................................................ 1018
Resource/Cost - Activities That Do Not Have an Expense or a Resource Assigned Section of the
Schedule Check Report Dialog Box ........................................................................................... 1019
Resources Detail Window of the Global Security Profiles Page .............................................. 1020
Resources Detail Window of the Resource Teams Tab of the Administration Page .............. 1022
Resources Detail Window of the Roles Tab of the Administration Page ................................ 1023
Resources Page .......................................................................................................................... 1024
Resources Section of Activity Details of the Resources Dialog Box ........................................ 1024
Resources Section of the Activity Details Dialog Box ............................................................... 1026
Resources Section of the Activity Form Page ........................................................................... 1028
Resources Section of the Content Tab of the Customize Dashboard Page ........................... 1029
Resources Section of the Global Tab of the My Preferences Page ......................................... 1031
Resources Tab of the Administration Page .............................................................................. 1033
Resources Tab of the Level Resources Dialog Box of the Activities Page .............................. 1037
Response Plans Detail Window of the Risks Page ................................................................... 1037
Responsibility Detail Window of the OBS Page ........................................................................ 1041
Return on Investment of Project Page ...................................................................................... 1041
RFI Turnaround Portlet of the Workspace Page ....................................................................... 1043
Risk Categories Page ................................................................................................................. 1044
Risk Scoring Matrices Page ....................................................................................................... 1044
Risk Thresholds Page ................................................................................................................. 1046

P6 Help
32
Risk UDFs Page .......................................................................................................................... 1047
Risks Detail Window ................................................................................................................... 1047
Risks Detail Window of the Activities Page ............................................................................... 1049
Risks Page .................................................................................................................................. 1050
Role Teams Detail Window of the Roles Tab of the Administration Page .............................. 1053
Role Teams Tab of the Administration Page ............................................................................ 1054
Role Usage Tab of the Analysis Page ........................................................................................ 1054
Roles Detail Window of the Resources Tab of the Administration Page ................................ 1056
Roles Detail Window of the Role Teams Tab of the Administration Page .............................. 1057
Roles Tab of the Administration Page ....................................................................................... 1057
Safety Portlet .............................................................................................................................. 1058
Schedule Check Report Dialog Box ........................................................................................... 1059
Schedule Detail Window of the Reports Page .......................................................................... 1061
Schedule Performance Portlet of the Dashboards Page ......................................................... 1063
Schedule Performance Portlet of the Workspace Page ........................................................... 1064
Schedule Project Dialog Box of the Activities Page .................................................................. 1065
Schedule Tab of the Report Settings Dialog Box...................................................................... 1066
Scheduled Services Page .......................................................................................................... 1067
Schedules View of the Reports Page ........................................................................................ 1068
Scheduling Options Dialog Box.................................................................................................. 1070
Scheduling Report Dialog Box of the Activities Page ............................................................... 1071
Scheduling Results Section of the Leveling Report Log .......................................................... 1072
Scheduling Results Section of the Scheduling Report Dialog Box of the Activities Page ...... 1072
Scheduling Settings Section of the Leveling Report Log ......................................................... 1073
Scheduling Settings Section of the Scheduling Report Dialog Box of the Activities Page ..... 1075
Select Projects Dialog Box of the Project Calendars Page ...................................................... 1077
Select Projects Dialog Box of the Project Tab of the Activity Codes Page .............................. 1078
Send Projects to ERP Dialog Box of the Activities Page ........................................................... 1079
Service Status Dialog Box .......................................................................................................... 1080
Service Summary Detail Window .............................................................................................. 1081
Set Time Periods Dialog Box of Calendars ............................................................................... 1081
Settings Detail Window of the Resources Tab of the Administration Page ............................ 1083
Soft Constraints - Constraints That Do Not Prevent Activities Being Moved Section of the Schedule
Check Report Dialog Box ........................................................................................................... 1084
Standard Work Week Tab of the Global Calendars Page ........................................................ 1085
Standard Work Week Tab of the Project Calendars Page ....................................................... 1086
Standard Work Week Tab of the Resource Calendars Page ................................................... 1087
Standard Work Week Tab of the View Calendar Dialog Box .................................................... 1088
Standard Work Week Tab of the View Calendar Dialog Box .................................................... 1089
Start Review Dialog Box ............................................................................................................. 1090
Statistics Section of the Leveling Report Log ........................................................................... 1092
Statistics Section of the Scheduling Report Dialog Box of the Activities Page ...................... 1093
Status Section of the Activity Form Page .................................................................................. 1094

Contents
33
Status Tab of the Import/Export Project Dialog Box ................................................................ 1097
Step Templates Page ................................................................................................................. 1098
Step UDFs Page .......................................................................................................................... 1098
Steps Detail Window of the Activities Page .............................................................................. 1099
Steps Detail Window of the Step Templates Page ................................................................... 1101
Steps Details Dialog Box ............................................................................................................ 1101
Steps Details of Activity Details of the Resources Dialog Box ................................................. 1102
Steps Details Page of the Activity Form Page ........................................................................... 1103
Steps Section of Activity Details of the Resources Dialog Box ................................................ 1104
Steps Section of the Activity Details Dialog Box ....................................................................... 1106
Steps Section of the Activity Form Page ................................................................................... 1107
Store Period Performance Dialog Box of the Activities Page ................................................... 1108
Submittals Portlet ....................................................................................................................... 1109
Successors Detail Window of the Activities Page..................................................................... 1110
Successors Section of the Relationships Section of the Activity Form Page ......................... 1111
Summarization Page of the Project Preferences Dialog Box ................................................... 1112
Summary Indicators Detail Window of the Project UDFs Page ............................................... 1113
Table Format of the Activities Page ........................................................................................... 1115
Table Format of the EPS Page ................................................................................................... 1115
Team Usage Page ....................................................................................................................... 1116
Templates Detail Window of the Global Security Profiles Page .............................................. 1118
Time Periods Page ...................................................................................................................... 1119
Time Units Format Section of the Global Tab of the My Preferences Page ............................ 1120
Timesheet Approval Page .......................................................................................................... 1121
Timesheet Periods Page ............................................................................................................ 1123
Timesheet Table of the Timesheet Approval Page ................................................................... 1123
Timesheets Detail Window of the Project Security Profiles Page............................................ 1125
Timesheets Page ........................................................................................................................ 1125
Tolerance Detail Window of the Risk Scoring Matrices Page .................................................. 1127
Tools Detail Window of the Global Security Profiles Page ....................................................... 1128
Tools Detail Window of the Project Security Profiles Page ...................................................... 1129
Trace Logic Detail Window of the Activities Page ..................................................................... 1130
Units and Prices Detail Window of the Resources Tab of the Administration Page .............. 1131
Units of Measure Page ............................................................................................................... 1132
Usage Page of the Resource Team Summary Portlet .............................................................. 1133
Usage Tab of the Customize Resource Assignments View Dialog Box of the Assignments Page
..................................................................................................................................................... 1134
Used By Tab of the Global Calendars Page .............................................................................. 1135
Used By Tab of the Project Calendars Page ............................................................................. 1135
Used By Tab of the Resource Calendars Page ......................................................................... 1136
User Access Page ....................................................................................................................... 1136
User Defined Fields Section of the Issue Forms Page ............................................................. 1136
User Defined Section of the Activity Form Page ....................................................................... 1137

P6 Help
34
User Interface View Details Page .............................................................................................. 1138
User Interface Views Page ......................................................................................................... 1139
Users Detail Window of the OBS Page ...................................................................................... 1140
Users Page .................................................................................................................................. 1141
Users Tab of the User Interface View Details Page .................................................................. 1144
Version Tab of the Document Details Section (with content repository) ................................ 1145
View Calendar Dialog Box .......................................................................................................... 1147
View Calendar Dialog Box .......................................................................................................... 1147
View Tab of the My Preferences Page ....................................................................................... 1148
Views and Reports Detail Window of the Global Security Profiles Page ................................. 1152
Views and Reports Detail Window of the Project Security Profiles Page ................................ 1153
Warnings Section of the Leveling Report Log ........................................................................... 1154
Warnings Section of the Scheduling Report Dialog Box of the Activities Page ...................... 1155
WBS Budget Log Detail Window of the Activities Page ............................................................ 1156
WBS Category Page .................................................................................................................... 1157
WBS Documents Detail Window of the Activities Page ............................................................ 1157
WBS Earned Value Detail Window of the Activities Page ........................................................ 1158
WBS General Detail Window of the Activities Page .................................................................. 1160
WBS Issues Detail Window of the Activities Page .................................................................... 1162
WBS Milestones Detail Window of the Activities Page ............................................................ 1164
WBS Notebooks Detail Window of the Activities Page ............................................................. 1164
WBS UDFs Page.......................................................................................................................... 1165
Workflow Section of the Content Tab of the Customize Dashboard Page ............................. 1166
Workflows Portlet ....................................................................................................................... 1166
Workgroup Tab of the Documents Portlet of the Workgroup Workspace Page ..................... 1167
Workgroups Details Page ........................................................................................................... 1168
Workgroups Portlet of the Workspace Page ............................................................................. 1169
Working with the Activity Gantt Chart........................................................................................ 1169
Workspace Details Page ............................................................................................................ 1170
Workspace of Workgroup Page ................................................................................................. 1171
Workspace Page ......................................................................................................................... 1172
WP & Docs Tab of the Documents Page (with content repository) ......................................... 1173
WP & Docs Tab of the Project Documents Portlet of the Workspace Page (with content repository)
..................................................................................................................................................... 1174
Reference Topics ........................................................................................................................ 1175
Action Required for Document Reviews Toolbar ...................................................................... 1175
Action Required for Workflows Toolbar ..................................................................................... 1175
Actions Menu of the Assignments Page ................................................................................... 1177
Actions Menu on Activities Page ............................................................................................... 1178
Actions Menu on EPS Page ........................................................................................................ 1180
Activities Toolbar ........................................................................................................................ 1182
Activity View Toolbar ................................................................................................................... 1182

Contents
35
Applying Actuals Based on the Auto Compute Actuals Method (Reference) .......................... 1184
Applying Actuals Based on the Timesheets Method (Reference) ........................................... 1184
Assignments Toolbar .................................................................................................................. 1185
Assignments Toolbar of the Activities Page .............................................................................. 1187
Assignments View Toolbar ......................................................................................................... 1188
Available Columns of the Activities Page .................................................................................. 1189
Available Columns of the Assignments Page ........................................................................... 1213
Available Columns of the EPS Page .......................................................................................... 1223
Baselines Dialog Box Toolbar .................................................................................................... 1243
Bubble Chart Settings Area ....................................................................................................... 1244
Budget Log Toolbar .................................................................................................................... 1245
Capacity Planning Chart Toolbar ............................................................................................... 1245
Capacity Planning Toolbar ......................................................................................................... 1247
Codes Toolbar of the Activities Page ......................................................................................... 1248
Codes Toolbar of the EPS Page ................................................................................................. 1249
Command Line Support ............................................................................................................. 1249
Customizable Menus.................................................................................................................. 1249
Customizable Toolbars ............................................................................................................... 1250
Document Search Criteria ......................................................................................................... 1250
Document Security (Reference) ................................................................................................ 1251
Documents Toolbar of the Activities Page ................................................................................ 1251
Edit Menu of the Assignments Page ......................................................................................... 1252
Edit Menu on Activities Page ..................................................................................................... 1253
Edit Menu on EPS Page ............................................................................................................. 1254
Enterprise Data Activity Codes Toolbar ..................................................................................... 1255
Enterprise Data Baseline Types Toolbar ................................................................................... 1257
Enterprise Data Categories Toolbar .......................................................................................... 1258
Enterprise Data Cost Accounts Toolbar .................................................................................... 1260
Enterprise Data Currencies Toolbar .......................................................................................... 1261
Enterprise Data Document Statuses Toolbar ........................................................................... 1263
Enterprise Data Financial Periods Toolbar ............................................................................... 1264
Enterprise Data Funding Sources Toolbar ................................................................................ 1265
Enterprise Data Global Calendar Toolbar ................................................................................. 1267
Enterprise Data Issue Codes Toolbar........................................................................................ 1268
Enterprise Data Notebook Topics Toolbar ................................................................................ 1270
Enterprise Data Overhead Codes Toolbar ................................................................................ 1271
Enterprise Data Project Calendar Toolbar ................................................................................ 1272
Enterprise Data Project Codes Toolbar ..................................................................................... 1274
Enterprise Data Rate Types Toolbar ......................................................................................... 1276
Enterprise Data Resource Calendar Toolbar ............................................................................ 1276
Enterprise Data Resource Codes Toolbar ................................................................................. 1278
Enterprise Data Resource Curves Toolbar ................................................................................ 1280
Enterprise Data Risk Categories Toolbar .................................................................................. 1281

P6 Help
36
Enterprise Data Risk Scoring Matrices Toolbar ........................................................................ 1282
Enterprise Data Timesheet Periods Toolbar ............................................................................. 1284
Enterprise Data Units of Measure Toolbar ............................................................................... 1285
EPS Toolbar ................................................................................................................................ 1286
EPS View Toolbar ........................................................................................................................ 1286
Expenses Toolbar of the Activities Page ................................................................................... 1287
Filters Dialog Box Toolbar .......................................................................................................... 1288
Filters Tab Toolbar ...................................................................................................................... 1289
Funding Toolbar .......................................................................................................................... 1290
Histogram Chart Settings Area .................................................................................................. 1290
Import Templates (Reference) ................................................................................................... 1291
Issues Toolbar ............................................................................................................................ 1292
Level Resources Dialog Box (Reference) .................................................................................. 1292
My Calendar Dialog Box Toolbar ............................................................................................... 1293
My Reviews Toolbar ................................................................................................................... 1294
My Workflows Toolbar ................................................................................................................ 1294
Notebooks Toolbar ..................................................................................................................... 1295
Open Projects Dialog Box Toolbar ............................................................................................. 1296
Pages Supporting Filters ............................................................................................................ 1296
Performance Status Calculations .............................................................................................. 1297
Personal Information Section of the Content Tab of the Customize Dashboard Page .......... 1299
Pie Chart Settings Area .............................................................................................................. 1301
Planning Toolbar......................................................................................................................... 1302
Portfolio Analysis Settings Area ................................................................................................. 1303
Portfolio Analysis Toolbar ........................................................................................................... 1304
Portfolios Navigation Bar ........................................................................................................... 1305
Pre-defined BI Publisher Reports .............................................................................................. 1306
Predecessors Toolbar of the Activities Page ............................................................................ 1311
Preferences Columns of the EPS Table .................................................................................... 1312
Print Preview Toolbar ................................................................................................................. 1315
Private Documents Toolbar ....................................................................................................... 1316
Project Gantt Chart Portlet Toolbar ........................................................................................... 1318
Project Tab Toolbar of the Documents Page ............................................................................ 1319
Project Tab Toolbar of the Documents Portlet of the Workgroup Workspace Page .............. 1322
Project Tab Toolbar of the Project Documents Portlet ............................................................. 1323
Recent Documents Toolbar ....................................................................................................... 1325
Related Items Toolbar of the Project Tab ................................................................................. 1327
Reports Schedules View Toolbar ............................................................................................... 1327
Reports View Toolbar ................................................................................................................. 1328
Resources Navigation Bar ......................................................................................................... 1329
Resources Tab Toolbar .............................................................................................................. 1330
Response Plans Toolbar ............................................................................................................ 1333
Risk Activities Toolbar ................................................................................................................ 1333

Contents
37
Risk Scoring Method Description .............................................................................................. 1334
Risk Thresholds Toolbar ............................................................................................................ 1336
Risks Toolbar .............................................................................................................................. 1338
Risks Toolbar of the Activities and EPS Pages ......................................................................... 1339
Roles Tab Toolbar ....................................................................................................................... 1340
Schedule Detail Window Toolbar .............................................................................................. 1342
Scheduled Services Toolbar ...................................................................................................... 1343
Scorecard Settings Area ............................................................................................................ 1345
Select Projects Toolbar .............................................................................................................. 1345
Service Status Toolbar ............................................................................................................... 1346
Status Toolbar of Import/Export Project Dialog Box ................................................................ 1347
Step Templates Toolbar ............................................................................................................. 1347
Steps Detail Window Toolbar ..................................................................................................... 1348
Steps Toolbar of the Activities Page .......................................................................................... 1349
Successors Toolbar of the Activities Page ................................................................................ 1350
Tabbed Views.............................................................................................................................. 1351
Teams Tabs Toolbar ................................................................................................................... 1351
Text Editor Toolbar ..................................................................................................................... 1352
Timesheet Approval Toolbar ...................................................................................................... 1353
Toolbars Sub-Menu of the View Menu ...................................................................................... 1355
Trace Logic Toolbar of the Activities Page ................................................................................ 1355
User Access OBS Toolbar ........................................................................................................... 1356
User Access Security Profiles Toolbar ....................................................................................... 1358
User Access Users Toolbar ........................................................................................................ 1359
User Defined Fields Toolbar ...................................................................................................... 1361
View Menu of the Assignments Page ........................................................................................ 1362
View Menu on Activities Page .................................................................................................... 1365
View Menu on EPS Page ............................................................................................................ 1368
WBS Documents Toolbar of the Activities Page ....................................................................... 1369
WBS Earned Value Toolbar ........................................................................................................ 1370
WBS General Toolbar of the Activities Page ............................................................................. 1371
WBS Milestones Toolbar of the Activities Page ........................................................................ 1371
Workgroup Tab Toolbar of the Documents Portlet of the Workgroup Workspace Page ........ 1372
Working with Activity Progress ................................................................................................... 1374
WP & Docs Tab Toolbar ............................................................................................................. 1375

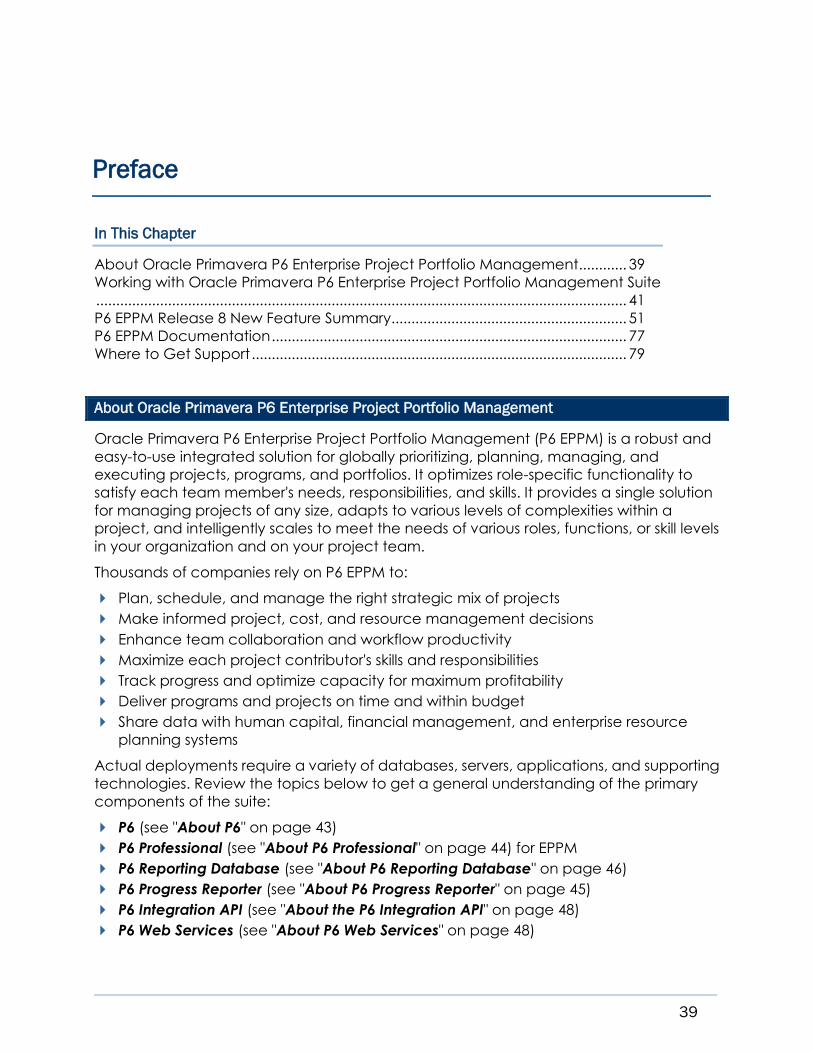
39
In This Chapter
About Oracle Primavera P6 Enterprise Project Portfolio Management ............ 39
Working with Oracle Primavera P6 Enterprise Project Portfolio Management Suite
..................................................................................................................................... 41
P6 EPPM Release 8 New Feature Summary ........................................................... 51
P6 EPPM Documentation ......................................................................................... 77
Where to Get Support .............................................................................................. 79
About Oracle Primavera P6 Enterprise Project Portfolio Management
Oracle Primavera P6 Enterprise Project Portfolio Management (P6 EPPM) is a robust and
easy-to-use integrated solution for globally prioritizing, planning, managing, and
executing projects, programs, and portfolios. It optimizes role-specific functionality to
satisfy each team member's needs, responsibilities, and skills. It provides a single solution
for managing projects of any size, adapts to various levels of complexities within a
project, and intelligently scales to meet the needs of various roles, functions, or skill levels
in your organization and on your project team.
Thousands of companies rely on P6 EPPM to:
Plan, schedule, and manage the right strategic mix of projects
Make informed project, cost, and resource management decisions
Enhance team collaboration and workflow productivity
Maximize each project contributor's skills and responsibilities
Track progress and optimize capacity for maximum profitability
Deliver programs and projects on time and within budget
Share data with human capital, financial management, and enterprise resource
planning systems
Actual deployments require a variety of databases, servers, applications, and supporting
technologies. Review the topics below to get a general understanding of the primary
components of the suite:
P6 (see "About P6" on page 43)
P6 Professional (see "About P6 Professional" on page 44) for EPPM
P6 Reporting Database (see "About P6 Reporting Database" on page 46)
P6 Progress Reporter (see "About P6 Progress Reporter" on page 45)
P6 Integration API (see "About the P6 Integration API" on page 48)
P6 Web Services (see "About P6 Web Services" on page 48)
Preface

40
BI Publisher (see "About Oracle BI Publisher and the OBIEE Platform" on page 46)
P6 Analytics (see "About P6 Analytics" on page 46)
Oracle Business Process Management Suite (see "About the Oracle Business Process
Management Suite" on page 45)
Oracle Universal Content Management (see "About Oracle Universal Content
Management" on page 48)
P6 EPPM also integrates with many other optional Oracle solutions such as Contract
Management (see "About Contract Management" on page 45), Oracle Risk Analysis,
Oracle PPM, and Cost Manager.

Preface
41
Working with Oracle Primavera P6 Enterprise Project Portfolio Management Suite
Depending on your organization's specific deployment, P6 EPPM generally consists of the
applications, functions, and databases depicted below.
Applications:
P6: Most users will rely almost exclusively on the P6 web application running in a standard
web browser. Simply termed P6, it is the primary interface for administering and
managing projects.

42
P6 Professional for EPPM: The P6 web application is the main interface for all project
management functionality; however, you can also use the optional P6 Professional
software to take advantage of its core project planning and scheduling functionality.
The P6 Professional application and its features, including the built-in TSLD viewer, run on
the Microsoft Windows operating system.
P6 Progress Reporter: P6 EPPM includes the P6 Progress Reporter integrated timesheet
entry software. Resources use P6 Progress Reporter to record their time spent working on
assignments via electronic timesheets, and approving managers use P6 to review and
approve them.
P6 Integration API: A Java-based application programming interface (API) enabling your
P6 EPPM deployment to interface with other components and systems.
P6 Web Services : P6 Web Services is an integration technology that extends P6
functionality and business objects. Based on open standards including SOAP, XML and
WSDL, P6 Web Services enables developers to leverage standard interfaces to create
integrated software solutions that interoperate with a wide variety of enterprise software
applications running on a diversity of hardware and operating system platforms.
P6 Analytics: An optional integrated dynamic reporting tool with advanced visual
features, including dashboards.
Functionality (included with P6 EPPM):
Core Enterprise Functionality: Use P6 for all of the following core enterprise functionality:
Administration and Enterprise Data: Administer user accounts, preferences, views,
application settings, and enterprise data.
Project, Portfolio, and Resource Management: P6 provides an extensive array of
features designed to optimize all phases of Project Management, Resource
Management, and Portfolio Management. It includes full support for activities,
work breakdown structures, costs, resource administration and assignment, roles,
teams, portfolio analysis, capacity planning, and convenient dashboards for
measuring status at any level at every moment.
Document Management: P6 includes document management support with or
without the optional document repository option. Use the optional document
collaboration features to conduct document reviews with key stakeholders to
keep projects moving or meet regulatory compliance.
Workflows: The workflow engine bundled with P6 EPPM provides Business Process
Modeling Notation (BPMN) compliant graphical notation that depicts the steps in
your project initiation workflows. Use the integrated Workflows portlet to
coordinate the sequence of tasks that flow between different process participants
in a series of stages.
Reports: Generate and view reports using your standard web browser running P6.
Reports can be generated electronically and routed via e-mail, saved to a shared
or local file, or printed to a traditional printer.

Preface
43
Planning and Scheduling: The optional P6 Professional component of the suite provides a
robust set of features primarily for planners and schedulers, including reflections,
schedule comparison (Claim Digger), and a report designer. Use the new built-in
Timescaled Logic Diagram (TSLD) viewer to create and customize condensed visual
depictions of complex project schedule information.
Time Reporting: P6 EPPM includes P6 Progress Reporter, an optional integrated timesheet
entry application.
Integrated Solutions: Build or deploy other systems and use the P6 Integration API or P6
Web Services to integrate them with P6 EPPM.
P6 Analytics: Extend your solution by adding P6 Analytics with the Oracle Business
Intelligence (OBI) metadata layer to facilitate the creation of ad-hoc reports and
interactive custom dashboards reflecting trends and metrics for activities, portfolios,
resource assignments, utilization, and project history. Also receive proactive alerts based
on integrated report data mined from the ODS and star databases.
Technology:
The P6 EPPM Database: The main database for all your P6 EPPM data.
BPM Workflow: The separate workflow engine bundled with P6 EPPM.
Oracle BI Publisher: The database server hosting the reporting library, templates, and
views required to build complex reports with ease.
The Reporting Database: The P6 Reporting Database portion of the suite consists of the
Star database and the Operational Data Store (ODS) database used to extract,
transform, and load data from the P6 EPPM database. This data is specifically designed
to be used to create reports.
Oracle Universal Content Management: This server hosts documents in a shared
repository enabling collaborative functionality such as document check-out/check-in
and versioning.
About P6
P6 is the main web application of the P6 EPPM solution. P6 provides enterprise-wide web
access to features arranged into the following sections:
Dashboards
Portfolios
Projects
Resources
Reports
Administration

44
P6 is a complete Enterprise Project Portfolio Management application with a powerful
but easy-to-use interface. It completely tracks projects, portfolios, and resources across
their full project lifecycles capturing all related costs, issues, risks, and performance
metrics along the way. It also supports project templates, allowing you to reuse projects
in full or in part. It is designed for organizations that need to simultaneously manage
multiple projects and support multi-user access across job sites and throughout the entire
organization.
The user interface provides structured menus where you can access a wide range of
data views and features that enable you to manage your projects from initial concept
review and approval through to completion. You can customize your own web pages,
called dashboards, to create a custom view of the specific projects and categories of
project data that are most relevant to your role in managing projects and resources.
Project workspaces and workgroups extend the model of customizable, focused data
views by enabling designated project members to create a uniform view of data that
relates to one specific project or to a subset of activities within a project.
P6 provides centralized resource administration, planning, and management, which
even includes resource timesheet approval and the ability to communicate with project
resources who use P6 Progress Reporter, the Web-based timesheet management
application of P6 EPPM. Use P6 to match people with roles and proficiency levels, and
then use that information to assign tasks effectively.
P6 includes robust reporting, workflow, e-mail notifications, events, and document
collaboration and review features.
Finally, P6 is the single source for administrative functions, including centralized enterprise
data, user accounts, application settings, and security for all users in P6 EPPM.
About P6 Professional
P6 Professional is a separate optional module that integrates traditional project
management with streamlined resource and cost management. It is ideal for planners
and schedulers.
Note: If you decide to use P6 Professional, you must still use P6 to
administer user accounts, enterprise data, and other settings.
The P6 Professional software includes a subset of the P6 features, as well as several of its
own specialized features. As a primary example, P6 Professional includes the new
Timescaled Logic Diagrams viewer for the creation, viewing, and modification of
timescaled logic diagrams (TSLDs). TSLDs condense the project plan displayed in the
Gantt chart into a more concise visual snapshot illustrating the chain of activities that
drive the project schedule. When you create a TSLD, it appears in the TSLD viewer.
Note: The TSLD viewer is designed for use with only the P6
Professional application.

Preface
45
About P6 Progress Reporter
The P6 Progress Reporter module is a Web-based project communication and
timekeeping system. As a team-level tool for project participants, it helps project
participants focus on the work at hand with a simple cross-project to-do list of their
upcoming assignments. Project team members can record time worked and enter
information about their project assignments. Regardless of location, team members can
communicate timesheet and activity status directly to their managers.
Because all project participants can use P6 Progress Reporter to enter up-to-the-minute
information about their assignments and to record the time they spent working on each
one, project managers can make crucial project decisions with the confidence that only
comes from having the most current information possible. Timesheet review and
approval takes place directly from within P6.
About Contract Management
Oracle Primavera Contract Management is a multi-user, multi-project database that
manages all aspects of contract control including changes and submittals. It can be
used in conjunction with P6 EPPM.
Essential features include:
Provides information to keep contracts on-time and within budget
Enables you to cross-reference and link documents for quick, easy retrieval
Maintains historical data that can be used for the life of the project and referenced in
future projects
Aids in resolving disputes or claims
About the Oracle Business Process Management Suite
The Oracle Business Process Management (BPM) Suite provides an integrated
environment for developing, administering, and using business applications centered
around business processes. BPM supports BPMN and BPEL standards from modeling and
implementation to run time and monitoring.
P6 directly integrates with BPM allowing you to initiate and manage workflows. Take
advantage of the ready-to-run project initiation workflow sample included with P6 EPPM
or design your own workflows.
You can also expand your use of BPM to include all stages of your application, program,
project, or product development life cycle from design-time and implementation to
run-time and application management.
The Oracle BPM Suite enables you to:
Create and customize business processes, models, and standards using pre-defined
components for web-based applications.
Collaborate between process developers and process analysts.

46
Expand business process management to include flexible, unstructured processes.
Add dynamic tasks and support approval routing using declarative patterns and
rules-driven flow determination.
Unify different stages of your development life cycle by addressing end-to-end
requirements for developing process-based applications. Oracle BPM unifies the
design, implementation, run time, and monitoring stages based on an SCA
infrastructure. This allows different personas to participate through all stages of the
workflow life-cycle.
About Oracle BI Publisher and the OBIEE Platform
BI Publisher and the Operational Data Store (ODS) are integrated with the P6 EPPM suite.
These components deliver on-demand web-based reporting through P6.
You have the option of expanding the capabilities of P6 EPPM using these components.
Oracle Business Intelligence Publisher: Oracle Business Intelligence Publisher (formerly
XML Publisher) is an enterprise reporting solution allowing you to design, manage, and
deliver highly formatted documents. Because it is built on open standards, your IT
developers can create data models against practically any data source and use BI
Publisher APIs to build custom applications leveraging existing data sources and
infrastructure. BI Publisher users can design report layouts using familiar desktop tools,
reducing the time and cost needed to develop and maintain reports. Extremely efficient
and highly scalable, BI Publisher can generate documents with minimal impact to
transactional systems. Using the convenient P6 web interface, reports can be viewed
online or scheduled for delivery to a wide range of destinations.
Oracle Business Intelligence Enterprise Edition (OBIEE): Expand your business intelligence
capabilities with this optional foundation platform. OBIEE enables your organization to
buy and plug in ready-to-run analytics packages or to build your own applications on
one common BI architecture.
About P6 Reporting Database
The P6 Reporting Database works with the P6 EPPM database to provide a robust and
powerful reporting solution. Project data from the P6 EPPM database is periodically
extracted, transformed, and loaded into an Operational Data Store (ODS) database.
Use P6 Reporting Database with BI Publisher to create and administer reports.
About P6 Analytics
P6 Analytics provides an in-depth and comprehensive method for gathering, analyzing,
sharing, and storing project performance, project history, resource assignment, and
utilization data. Use the P6 Analytics add-on application with P6 EPPM to create powerful
custom dashboards and reports to help your organization make better business
decisions. P6 Analytics requires Oracle Business Intelligence Enterprise Edition (OBIEE) or
Oracle Business Intelligence Standard Edition.

Preface
47
Built upon the Oracle Business Intelligence (OBI) suite, P6 Analytics delivers a catalog of
requests called Dashboards and Answers that provide an interactive way of viewing,
analyzing, and evaluating P6 EPPM data. In addition, it provides a Repository (RPD) file
which contains the data mappings between the physical data and the presentation
layer of OBI.
The dashboards provide detailed insight into your P6 EPPM data, through the use of
analytical charts, tables, and graphics. Dashboards have the ability to navigate to other
requests, to provide precise root cause analysis. In addition, you can configure individual
requests with the P6 EPPM Action Link, which enables you to navigate directly to your P6
site for true "Insight to Action" capabilities. Reports created with Oracle BI Answers can be
saved in the Oracle BI Presentation Catalog, and can be integrated into any Oracle BI
home page or dashboard. Results can be enhanced through options such as charting,
result layout, calculation, and drill-down features.
In summary, use P6 Analytics to:
Perform root-cause analysis and employ management-by-exception.
Gather critical insights into current and historical performance of all projects,
programs, and portfolios.
Make better decisions to eliminate project failure.
Quickly visualize critical project performance in early stages from dashboards.
Predict and identify cost trends early in project lifecycle to rescue troubled projects.
Gain visibility into resource performance through s-curves in dashboards with
interactive dashboards you can drill down to examine the root-cause problem.
Show staffing needs by portfolio with early warning indicators for upcoming
under-staffed project work.
Performance Data
P6 Analytics provides an RPD file to be used with the Oracle Business Intelligence suite.
The RPD file contains:
A physical representation of the Star schema.
A business layer where customized calculations are performed.
A presentation layer that groups all of the Star database fields into logical subject
areas.
The RPD delivers an extensive amount of earned value, cost, unit, percent complete,
and other key performance indicators. It enables data to be sliced by items such as time,
project, eps, portfolios, activities, and resources.
P6 Analytics delivers a sample dataset (P6 EPPM, Stage, ODS, and Star) from which the
Dashboards and Answers requests in the catalog are built. This sample data can be used
to view the power of Dashboards and Answers requests delivered in the catalog, which
will give the user an idea of how the catalog can be integrated with their data. For
information on configuring the sample dataset, see the SampleData.pdf document that
is included in the P6Analytics\Sample folder on your release media pack or download.

48
The Star Database
The Star database enables your organization to perform advanced business analysis on
project and portfolio data. It supplies a dimensional schema that organizes P6 EPPM
hierarchical relationships, enables the highest level of query efficiency and flexibility in
data analysis, and accumulates project data over time. This provides organizations with
baselines for tracking trends and for advanced business intelligence.
About the P6 Integration API
The P6 Integration API is a Java-based Application Programming Interface (API) and
server that enables developers to create application code aligned with P6 EPPM
business rules in order to seamlessly access P6 EPPM data.
About P6 Web Services
P6 Web Services enables your organization to seamlessly integrate P6 EPPM functionality
into other applications using open standards, languages, and protocols, including XML,
SOAP, SOA, and WSDL. P6 Web Services enables your organization to share P6 EPPM
data between applications independent of operating system or programming
language. Use P6 Web Services when you need to extend or customize integrated
functionality, for example, with BPM workflows, events, or forms-based applications.
About Oracle Universal Content Management
Integrated with P6, Oracle Universal Content Management (UCM) turns cluttered, often
unstructured content into organized assets by making it easier to catalog, access,
search, and reuse. All popular document formats such as HTML, XML, DOC, XLS, GIF, and
PDF are supported.
Using P6 with UCM, project participants can better manage their documents. Specific
functions include:
Upload new documents for storage in the unified UCM database
Categorize documents within folders for better organization
Link projects, WBS elements, activities, and issues to documents
Check in and check out documents (version control)
Review documents
You can also extend UCM to deliver content via Web sites, desktops, RSS feeds, mobile
devices, and Web Services.

Preface
49
About Oracle Primavera Risk Analysis
The optional Oracle Primavera Risk Analysis component extends the risk management
capabilities built into the P6 web application with its own full-lifecycle cost and schedule
risk analytics solution. Deploy Oracle Primavera Risk Analysis to integrate directly with
your project schedules and cost estimates to model risks and uncertainty.


51
P6 EPPM Release 8 New Feature Summary
Building on a tradition that includes worldwide sales and recognition spanning the last
quarter century, this release of P6 EPPM offers significant new or improved functionality
described in the following topics.
Note: This New Feature Summary is intended solely to remind
readers of various P6 EPPM documentation deliverables of the
major new or changed features since the last release. Refer to the
separate online help systems and individual documents for the
various components that comprise the P6 EPPM suite to learn more
about the features.
In This Chapter
Web Administration and Configuration ................................................................ 53
Project and Portfolio Management ....................................................................... 57
Project Templates ..................................................................................................... 59
Resource Management .......................................................................................... 61
Risk Management ..................................................................................................... 63
Enterprise Reporting ................................................................................................. 65
Workflow .................................................................................................................... 67
Technological Advances ........................................................................................ 69
User Productivity ....................................................................................................... 71
Learning Assistance .................................................................................................. 73
P6 Professional ........................................................................................................... 75


53
Web Administration and Configuration
Easy Web Setup, Configuration, and Administration
Routine setup, configuration, and administration tasks can be achieved using only the P6
application from a single centralized new menu with the following options:
My Calendar: Customize your personal work schedule.
My Preferences: Customize P6 for the way you prefer to work. Personalize the units,
formats, views, and other settings unique to each user.
Application Settings: Configure global application settings for data limits, earned
value calculations, timesheets, IDs, and time periods.
Enterprise Data: Define the data entities, types, categories, and user-defined fields
recognized by your industry or organization.
User Access: Configure who will use the various components of the P6 EPPM suite and
the P6 application, and what permissions to assign to them.
User Interface Views: In a single convenient location, configure the main menus and
pages of the application users of each view are permitted to access. This improved
feature helps you enforce a consistent enterprise-wide user experience.
Web-Based User Administration
Create and administer user accounts for all P6 EPPM users via the P6 web application. Set
each user's contact and login information, and configure their security privileges, profiles,
access, and user interface views. Configure the management hierarchy at your
organization (the organizational breakdown structure, or OBS) and manage project
assignments to reflect the areas of responsibility within your entire enterprise.
Also new in this release, you can use the P6 web application to define privileges for a set
of global and project security profiles and then assign them to users to restrict access in
accordance with your organization's information assurance and security policies.
In addition, the P6 web application now includes integrated Lightweight Directory
Access Protocol (LDAP) support for user provisioning. In the previous release, a Windows
PC was required to perform these tasks. You can now configure, search for, and add
users directly from your company's central LDAP directory using P6 in your web browser.
Enterprise deployments can also batch import multiple user accounts from an LDIF file.
The P6 Web Services module now supports single sign-on via Security Assertion Markup
Language (SAML).
In summary, improvements have been made in this release to the native, single-sign on
(SSO), LDAP, API, and Oracle Access Manager (OAM) features supporting more secure
user authentication for P6.

54
One Source for All Enterprise Data
Use P6 as a one-stop shop for administering all the enterprise data used by P6 and P6
Professional users. Centrally manage all enterprise data grouped by category, including:
Global category
Currencies
Financial Periods
Global Calendars
Overhead Codes
Timesheet Periods
Projects category
Baseline Types
Funding Sources
Notebook Topics
Project Calendars
Project Codes
Project User-Defined Fields
WBS Categories
WBS User-Defined Fields
Activities category
Activity Codes
Activity User-Defined Fields
Cost Accounts
Expense Categories
Expense User-Defined Fields
Step Templates
Step User-Defined Fields
Resources category
Assignment User-Defined Fields
Rate Types
Resource Calendars
Resource Codes
Resource Curves
Resource User-Defined Fields
Units of Measure
Risks category
Risk Thresholds

Preface
55
Risk Scoring Matrix
Risk Categories
Risk User-Defined Fields
Issues category
Issue Codes
Issue User-Defined Fields
Documents category
Document Categories
Document Statuses
Document User-Defined Fields


57
Project and Portfolio Management
Web-Based EPS and Project Views
Configure the project hierarchy at your organization (the enterprise project structure, or
EPS) and use it to structure projects and control user access to project and portfolio data.
Project managers will also use the new web-based EPS features to create and edit
projects, templates, preferences, baselines, and summaries. Other useful new features
include configuring multi-user EPS views that target key data, importing and exporting
Primavera XML, Microsoft Excel, and Microsoft Project 2007 data, and creating new
projects and templates directly within the EPS hierarchy.
Similar to the traditional activity views users have relied on for multiple releases, this
release now offers project managers more robust project views at the EPS level. Now, you
will be able to configure the entire EPS and monitor the status of multiple projects, all from
this single page.
The new EPS Gantt chart view on the web is also included. It shows a flat list or grouped
list of projects on a timeline. You can choose to display multiple bars, such as current
dates versus baseline dates for a comparison view. The timescale can be shown in
increments of years (for a long-range view), quarters, months, all the way down to days
(for a more granular view.)
Enhanced Portfolio Filtering
Automatic filter refreshing helps keep your portfolios in sync with the latest project data,
without the need for user intervention. This release also supports an expanded number of
filter parameters offering greater precision when configuring and comparing filtered
portfolios.
Schedule Preview
When hundreds or thousands of activities appear in a Gantt chart, P6 allows you to add,
modify, or delete them; however, historically, it wouldn't immediately update the results
in order to maximize performance. You could reschedule the project in order to view the
impacts of your changes and share them with other users, but what if you wanted to
preview the results before applying them?
New in P6 for this release is the optional Schedule Preview feature which will instantly
generate a preview of any schedule changes locally on your PC. This allows you to
preview the impact of adding, deleting, or modifying activities on the overall project
schedule before deciding to save the schedule changes or discard them.

58
Recalculate Assignment Costs
The web application now provides an optional command for updating resource and
role assignment cost data in your project to reflect recent changes to one or more rates.
Use this command during or after scheduling a project in case changes to dates cause
assignments to span periods with more than one rate in effect. This command can also
be run during leveling.
Project Baselines
In addition to supporting the administration of baseline types, this release of the P6 web
application also enables you to convert projects into baselines and then restore
baselines back into projects.

59
Project Templates
Reusable Project Templates
The new templates feature in P6 represents a significant feature improvement for this
release, replacing the Methodology Management functionality from the previous
release.
A template is a stored copy of, or blueprint for, a project. It includes all the details, best
practices, and de facto standards your organization associates with projects of a
particular type. For example, use project templates to create a library of predefined
project structures that can later be used as starting points for new projects. In addition,
specific WBS branches and their activities can be copied from projects or templates and
inserted wherever you need them.
Organize your template projects within the EPS, assign them project codes, and provide
them with descriptions to aid in reuse. Because templates and projects now share a
common database and user interface, it is easy to create templates from projects or to
create projects from templates. You can also create projects based on other projects,
and templates based on other templates.
Note: Methodologies from the previous release can be converted
into P6.


61
Resource Management
Completely Redesigned Resource and Role UI
The entire Resources section has been redesigned with a new, more intuitive interface
that offers robust and responsive enterprise-wide resource management features. A
single centralized resource page now provides point-and-click access to administration,
detailed and high-level planning, and resource and role usage and analysis. Editable
tables and supplemental windows empower you to manage enterprise resource
information quickly and efficiently. You'll see all resources at a glance and be able to
edit details and make resource team and primary role assignments with ease.
Access important enterprise data directly within the Resources section without
navigating away from your current resource management tasks.
Improved Resource Planning and Analysis
Navigate to a central location to view and evaluate resources by project, role, resource,
allocation, or your own custom filter. Toggle between resource analysis and resource
planning modes.
Optimized Resource and Role Team Handling
Select the resources that make up a team faster with fewer steps using the redesigned
resource team components. Rather than creating and configuring new resource teams,
save time by first duplicating the closest matching team and then simply editing its
configuration. When you use this "copy and paste" technique for creating a resource
team, all its resources are included in the new copy. You can also use copy and paste to
create and manage role teams.


63
Risk Management
This release of P6 includes significantly expanded Risk Management functionality based
on industry best practices and standards for project risk management.
Qualitative Risk Management
Using the new Risk Register, project managers can now assess potential risks on a project
plan, associate risks with activities, assign risk probabilities, calculate impacts to schedule
and cost, and develop risk response and contingency plans to mitigate risks.
The application's built-in qualitative risk management features are complemented by
the quantitative risk analysis features available with the full Oracle Primavera Risk Analysis
solution, an optional integrated component.
Risk Scoring Matrix, Categories, and Thresholds
Define risk probability, tolerance, and impact thresholds using the new risk scoring matrix.
When assigned to a project, users can assess risks in order to calculate relative project risk
scores. This feature includes a new color-coded probability and impact diagram (PID),
probability threshold scale, tolerance scale, and impact severity table.
Enhanced support for risk categories enables you to manage, track, and analyze your
own particular conventions for grouping and managing risk. A new risk threshold page
provides ways to configure color-coded assessment levels to measure the probability,
cost, and schedule impacts of each risk.


65
Enterprise Reporting
Integrated On-Demand or Scheduled Reports
This release of P6 includes the P6 Reporting Database integrated with Oracle Business
Intelligence Publisher. BI Publisher is an enterprise reporting solution allowing you to
design, manage, and deliver highly formatted documents. Report formats include
Microsoft Word, Excel, OpenOffice, PDF, and support an array of familiar columnar and
graphical styles. P6 provides more than 30 new reports dynamically generated when BI
Publisher accesses P6 data in the Operational Data Store (ODS).
Other key features include:
Ready-to-Run Reports: Run pre-defined reports to quickly get started
Room to Grow: Create reports via data models or templates (also includes custom
layout designer)
E-mail or save a report to a file: E-mail reports to your predefined distribution lists and
even save reports to a shared content repository.
Deliver the same report in multiple formats to satisfy different users: BI Publisher
supports several file formats including HTML, PDF, Excel, PPT, MHTML, RTF, XML, and
CSV. Each report can be published to all these formats or configured to only specific
formats and will have a default format defined.
Schedule reports or generate ad hoc reports on-demand: Schedule reports to be
generated on a defined interval. Reports can be scheduled to execute once, daily,
weekly or monthly. A report can have multiple schedule runs defined, each with its
own interval, delivery recipients, template and parameters. Of course, any report can
also be instantly generated on-demand.
Store archives and access report histories: Previous runs of a report can be saved,
providing a report archiving solution to allow for access to historical reports.
Organizations can configure BI Publisher to save reports for a defined time period,
and individuals can access the historical reports through BI Publisher.
Adjustable Parameters: To further reduce the effort and cost of creating and
maintaining reports, parameters can be defined within a report, and passed in during
runtime. Parameters can be used to filter and organize the information on a report. By
using parameters, a single report can meet the need of several project managers,
planners and stakeholders.
Secure Access: The new reporting capabilities provide three layers of security to
ensure data is protected and individuals only have access to the reports they are
permitted to run.
The entire reporting section can be hidden through the new Enterprise Reporting
module access setting. Provisioning this new module will expose the reporting
section and create database views in the ODS for each user.
The hierarchical folder structure used for organizing the reports can also define
which reports each user has access to run.

66
Reports pulling project information from the ODS will only return data for projects a
user has access to, as determined by P6 application security settings.
Also provided with this release are the ODS and its associated Extract, Transform and
Load (ETL) process. The ODS is part of the P6 Reporting Database and provides secure
access to information in an easy to use data schema.
Users seeking even greater leverage and analysis of their report data should consider
deploying P6 Analytics, available separately from Oracle.
Note: Users of the previous version of P6 may notice the removal of
the Project Reports and My Reports portlets. The new Reports
section replaces those old features. Users still interested in viewing
P6 Professional reports in a P6 portlet can select the Store report in
Work Products and Documents option in P6 Professional when
creating report batches or printing reports. See the P6 Professional
Help for more information.

67
Workflow
Oracle BPM Integration
Teams can collaborate with greater efficiency using the built-in project initiation
workflow included with P6. Additional workflows can be managed and customized using
the separate and optional Oracle Business Process Management (BPM) Suite. Oracle
BPM supports BPMN and BPEL at all stages from modeling and implementation to run
time and monitoring.
In prior versions of P6, there were embedded workflow engines (jBPM or Interwoven) to
automate only three P6 EPPM processes: project initiation, project processes, and
document review. While easy to configure, these lacked the depth of functionality to
truly model real-world processes. The prospect of using that legacy workflow integration
to automate additional processes was limiting. Beginning with Release 8, P6 leverages
Oracle’s Unified Business Process Management (OBPM) solution to serve as the engine to
automate any process related to the management of projects, programs, and portfolios.
All users participating in workflows are not required to use any other application besides
P6. Users can initiate, participate, approve, reject, delegate, escalate, and continuously
monitor any project workflow process flow by launching it from within a P6 dashboard.
Note: BPM is not the only solution for deploying custom workflows in
P6. This release also supports creation of an unlimited number of
custom workflows using P6 Web Services and P6 Events.


69
Technological Advances
Integrated LDAP Provisioning
The web application now directly includes Lightweight Directory Access Protocol (LDAP)
provisioning support for seamless LDAP or SSO user authentication. In the previous
release, a Windows PC was required to configure and add users from an LDAP repository.
You can now configure, search for, and add users from your company's central LDAP
directory using the P6 web application.
Note: Improvements have also been made in this release to the
native, LDAP, single-sign on (SSO), API, and Oracle Access
Manager (OAM) features supporting more secure user
authentication for P6.
Enhanced and Expanded Job Services
The historic client/server job services architecture has been completely redesigned. Now,
all jobs can be invoked and run in real-time from the web. Examples of on-demand jobs
include Recalculate Assignment Costs and Store Period Performance.
In addition, job scheduling also takes place in a web-based environment. The following
key jobs can be scheduled, for example, you might run these every Tuesday at a
particular time:
Summarize Project
Schedule Project
Level Project Resources
Apply Actuals
Expanded Event Support
In alignment with all its new features, this release also supports an expanded number of
events, triggered by interactions with various classes of objects that comprise the
solution. For example, specific types of interactions with activities, projects, EPS elements,
risks, documents, jobs such as Apply Actuals, and other special operations such as
copying a project will now trigger events. Compared with the previous release, nearly
three times as many events are available to developers at organizations where they are
used for a variety of purposes such as workflows, notifications, data warehousing, or
integrations with other enterprise software.
For more information, refer to the Using Events with P6 manual.

70
Integration Ready
P6 is now designed and tested to support major integrated enterprise management
solutions, including Oracle Primavera Portfolio Management 8.0 (formerly ProSight),
Oracle Enterprise Business Suite (EBS), JD Edwards, and other ERP products. Other popular
integrations include P6 Progress Reporter for timesheets, Contract Management for
contract management, and new in this release, BPM for workflows and BI Publisher or P6
Analytics for reporting.
P6 Web Services Security Enhancements
The P6 Web Services module now supports:
Single sign-on via Security Assertion Markup Language (SAML)
XML encryption
Digital signatures
Improvements have also been made in this release to the native, single sign-on (SSO),
LDAP, API, and Oracle Access Manager (OAM) features supporting more secure user
authentication.
Platforms
With each release of P6 EPPM, the supported platforms are updated to reflect new
technologies and the discontinuation of support for older technologies.
New Supported Platforms:
Apple Mac OS X with Safari browser for P6
Oracle Business Intelligence Publisher 10g for reporting
Oracle BPM 10g & 11g for workflows
HP Itanium application servers
Oracle Enterprise Manager 11g for enterprise administration
Components or Versions No Longer Supported:
JackRabbit previously used for document management
jBPM previously used for workflows
JBoss application server
WebLogic 10g application servers
Oracle HTTP 2.0 (10.1.3.2.0), IIS 6.0, and Apache 2.0 web servers
SiteMinder previously used for Single Sign-On

71
User Productivity
Auto-Complete Field Values
Available on select pages and dialog boxes, the new Auto-Complete feature offers
helpful functionality during data entry. As you key in an entry in a field that only accepts
values from a predefined list of existing values, the closest single matching value is
automatically selected for you. If multiple values match your input, they are displayed in
a list for you to make a selection.
Customizable Toolbars
On most pages of the application, fixed toolbars appear by default wherever they are
needed based on your current selection. This functionality existed in the last release and
was continued where needed for new pages in this release. However, on three of the
most commonly used pages of the application, the Activities, EPS, and Resource
Assignments pages, you can now customize the toolbars. Optimize your productivity by
hiding the commands you rarely use to make room for the ones you use most often. In
addition, you can rearrange and dock toolbars on these pages by clicking and
dragging.
Enhanced Activity, Assignment, and EPS Filters
Apply filters to the Activities, Assignments, and EPS pages to constrain the number of
activities, resource assignments, and projects, respectively, based on precise criteria you
specify. Filter enhancements in this release include:
Create, configure, and apply your own custom filters independent of the current
activity view. Even apply multiple combinations of custom or shared filters at the
same time. The filters you want to apply can also be saved with a customizable view,
so they are automatically reapplied along with all the other settings stored in the
view.
Share filters globally with all users, designate them only for certain users, or keep them
private for your own exclusive use.
Cut, copy, and paste filters.
Specify a greatly expanded number of filter criteria rules, a significant improvement
over the previous release's 10-rule limit.
Define nested logical filter rules for pinpoint accuracy when scanning rows of data.
For example, define inclusive (any of the following) and exclusive (all of the following)
rules.
E-mail Activity Views
Instantly capture one or more projects in your current multi-user view as a hyperlink you
can e-mail to others so they can also view the same project, WBS, activity, and step data
with all your customized settings applied.

72
Keyboard Shortcuts
The menus on the EPS, Activities, and Resource Assignments pages include new
time-saving keyboard equivalents for important commands. The Enterprise Data pages in
the administration section of the application also include keyboard equivalents for many
of its popular commands (for example, press the Insert key to add a new item). Most
pages and dialog boxes generally support Tab key traversal for easy access and
navigation between fields.
Menus and Icons
New in this release, the Activities, EPS, and Resource Assignments pages now organize
their feature-rich offering of commands within a series of standard menus titled Actions,
Edit, and View. Throughout the entire suite, nearly 100 icons representing various
commands have been redesigned and optimized for recognition and ease-of-use.
Redesigned Detail Windows
When a table of entries includes specific related information in a detail window, all detail
window tabs appear at the same time as a series so users are more aware of their
presence. Users no longer need to open and close each detail window separately. For
added convenience, tabbed detail windows are minimized and restored collectively as
a group.
Overall, for user efficiency, the application makes greater use of the consistent detail
window design. For example, detail windows now appear when administering resources
or user accounts and security profiles. The new EPS page includes eight detail windows
with specific supporting information related to EPS elements and projects. And finally, the
Activities page adds three new detail windows for issues, risks, and general data. The
detail windows on the Activities and EPS pages, two of the most widely used pages in the
application, can individually be shown or hidden from view.

73
Learning Assistance
Completely Redesigned Online Help
A new context-sensitive Online Help system is both re-authored and re-architected to
provide instant support to users in a time-saving structured interface. Topics include
descriptions for all screen elements, icons, and fields. Key concepts, related links,
step-by-step tasks, and valuable reference information are provided. Also includes new
hierarchical table of contents and search features.
UPK Multimedia Tutorials
Take advantage of the built-in integration with Oracle's User Productivity Kit (UPK)
allowing you to launch context-sensitive tutorials. In addition to opening the online help,
the expanded Help menus and buttons also present options for viewing UPK multimedia
simulations from within the P6 interface.
As your organization grows, expand your UPK investment to include custom tutorials
developed exclusively for your particular environment, training needs, or business
requirements. Oracle UPK must be purchased separately to create new simulations or
modify existing ones.


75
P6 Professional
An overview of the new features available only in P6 Professional, the client edition of P6
for Microsoft Windows PCs designed for planners and schedulers, follows.
To learn more about the features included in or removed from this release of P6
Professional, see the P6 Professional online help topic What's New in P6 Professional?
Timescaled Logic Diagrams
A much-anticipated new feature, Timescaled Logic Diagrams allows users to condense
the project schedule into smaller snapshots. A convenient timescale logic viewer,
seamlessly launched from within the P6 Professional application, facilitates the creation,
customizing, saving, and printing of timescaled logic diagrams and Gantt charts.
Tabbed Views
By popular demand, users can now switch between open layouts, screens, or views by
clicking their identifying tab. Tabs can also be grouped, splitting the window, and then
merged back into a single group of tabs within a window. This means that all main
windows in the entire application, including Projects, Activities, and Resources, can be
displayed simultaneously as tabs and can be tiled horizontally, vertically, or some
combination of both.
Customizable Menus
Users can now change the display order of menus, rearrange menu commands, delete
menus and commands, and create custom menus.
Customizable Toolbars
An improved default arrangement of toolbars and command buttons reduces visual
clutter. In addition, users can fully create and customize any toolbars in the client
interface with the commands of most importance to their goals and assignments.
Page Breaks by Group Band
P6 Professional now supports page breaks within layouts. Similar to reports, layouts can be
printed and page breaks determine if output will split your charts or other data onto
separate pages. Page breaks can be set manually, on customary Page Setup dialog
boxes, or automatically based on group band values.

76
Apply Actuals and Summarize Project Now Run as Services
Apply Actuals and Summarize Project jobs now run as java services. These jobs are no
longer processed locally within P6 Professional. You can view the status of these services
in the Job Status dialog box accessible from the Tools menu in P6 Professional and will be
notified when a service completes or fails.
Auto-Refresh Grouped Data by Window
Enable and disable automatic refresh of grouped data per window. This setting applies
to the active window only, and can be different for each open window.
Client-Web Delineation and Integration
his release offers greater web support and ease of use without sacrificing the raw power
our P6 Professional users have found indispensable. The P6 Professional client
application's legacy administrative functionality has been shifted to a redesigned web
interface to allow the client interface to focus entirely on planner/scheduler
functionality. P6 Professional users can decide to continue to rely on the optional client
application, with its strong core scheduling features, while most enterprise users will
migrate to and benefit from the greatly-expanded capabilities and convenience now
found in the P6 web application.
Streamlined Installer
P6 Professional now installs all of its files into a single directory with fewer required registry
settings. (Note: Only certain secondary applications using the API and the optional SDK
use registry settings.) The two main benefits of the new installer are that its footprint is
simple and that it is generally easier for IT administrators to deploy (e.g., installations can
be pushed over the network down to users' desktops).
Improved HTML Editor
A new HTML editor provides an expanded set of formatting options for use with notebook
and description fields.
Command Line Support
This release supports running batch report jobs and exporting projects from a command
line.
Note: To view P6 Professional reports in P6, select the Store report in
Work Products and Documents option when creating report
batches or printing reports. See the P6 Professional Help for more
information.

Preface
77
P6 EPPM Documentation
You can access reference manuals and administrator’s guides from the P6 EPPM
Documentation Center, located in the \Documentation\<language> folder of the P6
EPPM physical media or download. Most documentation assumes a standard setup of
the product, with full access rights to all features and functions.
Media packs include all files necessary to install P6 EPPM applications, all manuals and
technical documents related to the installation, administration, and use of P6 EPPM
components, and the Quick Install Guide. For information on the contents of the P6 EPPM
Media Pack, see the P6 EPPM Quick Install Guide.
The following table describes documentation publications and lists the recommended
readers by role. P6 EPPM roles are described in Installation Process Overview in the P6
EPPM Administrator's Guide.
Title Description
P6 EPPM
Administrator’s Guide
Explains how to set up the P6 EPPM database, servers,
and components; it also provides an overview of all the
components in the P6 EPPM solution. The guide
describes the procedures required to administer P6
EPPM, including setting up security and configuring
global preferences. The P6 EPPM network
administrator/database administrator and P6
administrator should read this guide.
P6 EPPM User's Guide This guide explains how to plan, set up, and manage
projects in a multiuser environment. If you are new to P6
EPPM, start with this guide to learn how to use the
software effectively to plan and manage projects.
When you need more detail, refer to the P6 Help. The
program manager, project manager, resource/cost
manager, and team leader should read this guide.
P6 Professional Help Explains how to use P6 Professional to plan, set up, and
manage projects in a multiuser environment. If you are
new to P6 Professional, use this Help to learn how to use
the software effectively to plan and manage projects.
The P6 Professional administrator, program manager,
project manager, resource/cost manager, and team
leader should read this Help.
P6 Help Describes how to create, manage, plan, and schedule
projects, group projects into portfolios, administer all
enterprise data, application settings, user accounts,
and security profiles, maintain both the organizational
breakdown structure (OBS) and enterprise project
structure (EPS), manage resources and roles, track risks,

78
issues, and notebooks, create and reuse templates,
evaluate budgets, analyze performance and ROI for
project portfolios, participate in workflows and
document reviews, approve timesheets, and generate
reports. The operations executive, P6 EPPM and P6
administrator, program manager, project manager,
resource/cost manager, and team leader should read
this Help.
P6 Progress Reporter
Administrator Help
Describes how to enter database connection
information for the P6 Progress Reporter server and
modify P6 Progress Reporter server and application
settings. The P6 EPPM network administrator/database
administrator should read this Help.
P6 Progress Reporter
Help
Describes how to use P6 Progress Reporter to enter and
update time spent on assignments. Team members
should read this Help.
Primavera Timescaled
Logic Diagram Help
Describes how to create, modify, and manage
Timescaled Logic Diagrams. Timescaled Logic Diagrams
condense the project schedule displayed in the Gantt
Chart into a more readable, easier to understand
format that provides a snapshot of the entire project
plan and the chains of activities that drive the project
schedule.
P6 Integration API
Administrator’s Guide
Explains how to install and configure the P6 Integration
API, which allows direct access to P6 EPPM via Java.
Those creating client code in Java and needing direct
access to the P6 EPPM database should read this guide.
P6 Web Services
Administrator’s Guide,
P6 Web Services
Programmer’s Guide,
and P6 Web Services
Reference Manual
Explains how to install and configure P6 Web Services,
which enables organizations to seamlessly integrate P6
EPPM functionality into other applications using web
services standards. The P6 Web Services Programmer’s
Guide, available as an HTML help system, describes
how to invoke, use, and troubleshoot the available
services/operations within supported environments. The
P6 Web Services Reference Manual, also available as
an HTML help system, describes all services and
operations available in P6 Web Services in a
comprehensive manner.

Preface
79
P6 SDK Web-based
documentation
Describes how to use the P6 SDK to connect to the P6
EPPM database. The tables, fields, and stored
procedures that you can access through the P6 SDK are
described. Examples are also provided to show how
you can use the P6 SDK to perform several basic tasks,
such as creating a new project or assigning a resource
to a project activity. The P6 EPPM network
administrator/database administrator and P6
administrator should read this documentation, which is
available in local drive\Program
Files\Oracle\Primavera P6 Professional\PMSDK\Doc\
by default. Double-click the INDEX.HTML file to open the
Table of Contents.
P3 to P6 EPPM
Migration Guide
This guide provides best practices for migrating your P3
data to P6 EPPM, and details how P3 functionality maps
to P6 EPPM functionality.
P6 Reporting Database
Administrator’s Guide
This document explains how to install and configure the
P6 Reporting Database application, and generate the
ODS database. It describes how to install and configure
the Oracle Gateway if the P6 Reporting Database is
installed on a Microsoft SQL Server. It also provides
information about how to run the Configuration Utility
P6 Reporting Database
User’s Guide
Provides information about using ODS and Star (if you
purchased P6 Analytics) with the P6 EPPM database to
extract data that you can use to create reports.
Distributing Information to the Team
You can copy the online documentation to a network drive for access by project
participants. Each team member can then view or print those portions that specifically
relate to his or her role in the organization.
Where to Get Support
If you have a question about using Oracle Primavera products that you or your network
administrator cannot resolve with information in the documentation or help, go to:
http://www.oracle.com/us/support/index.html
This page provides the latest information on contacting Oracle Global Customer Support
and the support renewals process.
Go to http://download.oracle.com/docs/cd/E17266_01/index.htm for the latest updates
to the P6 EPPM 8.0 Documentation library.


81
Working with P6
After logging into P6 with a secure user name and password, navigate to one of the
following main sections enumerated below to begin your work. Because your
capabilities within the application are limited based on security profiles, access settings,
optional user interface views, personal preferences, and other assignments, you may not
be able to view all the sections or use all the features within a section.
The P6 web user interface is composed of the following main sections:
Dashboards
This section presents highlights of major areas in resizable windows called portlets
arranged in customizable workspaces called dashboards.
Who Uses Dashboards?
Temporary subcontractors checking their next assignment, activity, or calendar entry.
Employees reporting or resolving issues preventing them from moving forward.
Financial executives checking costs, earned value performance, or resource analysis
charts to prepare forecasts.
Portfolios
This section presents data, metrics, and comparisons of related projects bundled into
portfolios. This section includes portfolio details, views, scenarios, portfolio Gantt with
spreadsheet or histogram, portfolio or single project ROI, portfolio analysis, resource
demand/capacity planning, and overall performance status.
Who Uses Portfolios?
Executives and critical thinkers interested in planning and analysis, ROI, and other
metrics spanning multiple projects.
Projects
The working core of the application. This section includes WBS, activities, risks, issues,
project workspaces, Gantt charts, calendars, expenses, and resource assignments.
Who Uses Projects?
Project Managers planning new projects.
Project leads and activity owners coordinating the completion of tasks.
Risk Managers implementing risk assessments or mitigation policies.
P6 Overview

82
Executives who want hands-on access to the EPS to view a portfolios's issues and
other status details
Resources providing input about the status of their activities including progress
updates, notebook entries, and issues.
Resources
This section helps you plan and manage resources, roles, and teams.
Who Uses Resources?
Human resource specialists, buyers, and purchasing officers assessing labor,
non-labor, and material resources.
Project Directors coordinating teams and managing the planned roles across the
entire company.
Project Managers planning resources for a particular project or time period.
Administer
This section provides administrative settings for configuring the framework for the
application. This includes user accounts, security profiles, views, application settings, and
enterprise data such as codes, user-defined fields, categories, templates, forms,
calendars, roles, units of measure, and other items used throughout the application.
Who Uses Administer?
Application and System Administrators and other users authorized to define the
essential framework for all other sections of the application, ultimately influencing
how work is performed and measured at the organization.
Users accessing their own personal preferences and calendars.
Note: Resource managers and project managers can take
advantage of a shortcut to an abbreviated set of enterprise data
to self-administer applicable information related to resources and
projects.
Reports
This section provides users with reports they can run on-demand or schedule for recurring
output.
Who Uses Reports?
A cross-functional array of users from all departments at your organization will likely be
generating, receiving, and analyzing reports.

83
Customizing the P6 User Experience
P6 includes sophisticated layers of security, view, and customization features designed to
control access and structure the collaborative experience of your entire team while also
allowing users to individually customize views and format their data. Periodically perform
the sequence of steps below for each user to optimize their experience.
When customizing your user experience, consider the following questions. These checks
may be performed in whole or in part, and in any sequence. The order shown here is not
mandatory. These items simply provide a basic checklist when examining your
interaction with the application.
Do I have the right module access settings? This determines which main components
of the solution you can access, such as Portfolios, Reports, P6 Professional, and P6
Web Services.
Do I have the right user interface view? This determines which main pages in the
application you can access. Your administrator may assign you to an optional
role-specific user interface view that corresponds to your assignments and work
processes. A group of users with similar roles will often be assigned the same user
interface view. You can edit your own personal view settings on the My Preferences
page.
Do I have the right security profiles? This determines what functions you can perform.
Your administrator will likely assign you to a role-specific global security profile and
project security profile that corresponds to your assignments and work processes. A
group of users with similar roles will often be assigned the same security profile.
Do I have the right OBS (project) access settings? This determines which projects are
available to you based on your assigned responsible manager.
Do I have the right global preferences? This determines the general formatting and
preferred settings of data across the application. For example, you can specify the
currency and date format you want to use. Even though you can customize these
preferences, it is recommended that teams make choices aligned with team goals.
Do I have the right application settings? This determines how P6 information is handled
and appears for all users. For example, the default hours per time period, ID string
lengths, integration links, and other default settings.
Do I have the current page customized to fit my needs? There are two main ways to
customize a page, detailed below.
Customizable Page-Specific Views: Certain pages of the application provide a
standard mechanism for configuring shared views and customizing individual
views. These include Activity, EPS, Resource Assignment, and portfolio views in
portlets or on the Portfolio Analysis page. They provide common ways to view and
work with data on their respective pages of application. Instead of manually
adjusting the current page, you can simply switch the applied view.

84
On-Screen Controls: Manually invoke the customization features provided on
each page. Throughout the application, these features are available through
Customize links or other context-specific toolbars and options displayed on the
page. Examples of screen customization follow:
Generally speaking, within all pages, you can hide, show, expand and
collapse elements as needed.
The Activities page and Portfolio Capacity Planning page, for example,
offer extensive options that enable you to retrieve, organize, and chart data
according to your specific requirements.
In the Issues portlet, you can filter, group, and chart issues as well as choose
the data details to display.
You can customize dashboards to display the portlets you want and to
specify how you want to organize them within the workspace. The
dashboard filtering feature lets you focus on information related to a single
project or all projects associated with a specific portfolio or project code. If
you have the required privileges, you can customize the workspace and
workgroups associated with a project.
About the User Interface
The application's user interface consists of familiar screen controls such as pages, tabs,
and dialog boxes, data entry controls, buttons, and links appearing in a standard web
browser.
Note: Your access to data and ability to interact with the user
interface are controlled by various security features. See About
Security.
Working with the P6 User Interface
The user interface presents familiar screen elements you manipulate in your web browser.
They include all of the following common types of user interface objects and several
more special objects not listed:
pages
tabs
dialog boxes
detail windows
portlets
fields
lists
buttons
links

P6 Overview
85
tables
charts
calendars
Refer to the sample images below to orient yourself with the P6 graphical user interface
inside your web browser.
Table of Common User Interface Elements
Item Description
P6 navigation bar: This bar is always visible and shows buttons
representing your access to dashboards and any of the main modules of
the application. Use it to navigate to the pages and menus in the
dashboards, portfolios, projects, resources, or reports sections of the
application.
Administer menu: This menu offers access to My Preferences for all users
and can include access to My Calendar for users with an associated
resource. Application administrators will also have access to one or more
of the following menu items: application settings, enterprise data, user
access, or user interface views.
86
Item Description
Personal Workspace dashboard: This default dashboard displays the
portlets you have selected that are important to your work goals. In this
example, notice the familiar hyperlinks including Customize which you
can click to configure the dashboard for use by you or multiple users.
Notice too that Personal Workspace is also the name for the tab you
would click to open this dashboard if more than one dashboard
appeared on this page.
Toolbars: From top to bottom, the Private Documents toolbar, the
Activities toolbar, and the Issues toolbar. There are hundreds of toolbars
throughout the application made up of over 400 icons. The Activities, EPS,
and Resource Assignments toolbars in the application also feature their
own Actions, Edit, and View menus.
Scorecard portfolio view portlet: In this example, the user has customized
this dashboard by adding a portfolio view of type scorecard within its
own portlet. The portlet also shows color-coded indicators in the Strategic
Alignment column of the scorecard and can be further customized to
suit work goals. The colors of a bar chart or histogram are also visible in
the Original Budget portfolio view portlet.
Projects navigation bar: This bar shows buttons representing pages
determined by your assigned user interface view and any custom
preferences you made. Similar bars can be found under the Portfolios,
Projects, and Resources sections.
Activity Table: One of the central work areas of the entire application,
this table allows you to customize its columns (fields), color-coded
grouping bands, and sort options, and of course apply filters.
Activity Gantt chart: Shown adjacent to the Activity Table, the Activity
Gantt chart represents your schedule and offers robust customizable
project management features including drag and drop editing,
timescale, progress lines, relationship lines, spotlights, bar necking, and
helpful mouseover tips.
Issues detail window: To gather the related details associated with a
particular item in certain tables, the application often provides one or
more detail windows in a series along the bottom. On pages supporting
applied views, you can determine which detail windows are shown or
hidden with your view.

P6 Overview
87
About Screen Controls
Screens - As is typical with enterprise software, the application's main pages present
more detail the further the user navigates within them. The following types of screen
controls will appear:
Pages
Tabbed Pages or simply, Tabs
Detail Windows
Dialog Boxes
Portlets
Working with the Main Menus
The seven main menus of P6 are located in the title bar and navigation bar. The menus
are:
Dashboards
Portfolios
Projects
Resources
Reports
Administer
Help
You can click each main menu directly on its icon or text to execute its default
command; however, you must click only on the triangle portion ( ) of the menu for the
additional Dashboard, Portfolio, Project, or Resource menu items to appear. If no triangle
appears next to the menu, this indicates your user interface view settings do not include
access to its menu items.
In all of the main menus except Help and Reports, your assigned user interface view and
your view settings on the My Preferences page determine which menu items appear, if
any. The portfolios and projects menus also display a list of your most recently used
portfolios and projects.
Each menu item will take you to another page or dialog box. If the first page for projects
or portfolios is already open, and you select one of the most recently used items in the
menu, it will open the selected projects or portfolios and refresh the page.

88
The sample image below demonstrates what you might see in your main menus. For the
most accurate details regarding your menus, see the help topic for the Content Tab of
the User Interface View Details Page and check your actual settings in the application.
Table of P6 Main Menus
Item Description
P6 title bar: Located in the P6 title bar, the Administer menu provides links
to related pages based on your view settings and personal preferences.
The Help menu items are standard and cannot be changed.
P6 navigation bar: Located in the P6 navigation bar, each menu opens
up additional pages within the section it represents. The Dashboards,
Portfolios, Projects, and Resources menus provide links to related pages
based on your view settings and personal preferences. The menus for
portfolios and projects also display links to your most recently used items.
Dashboards menu: Provides links to manage dashboards and timesheets.
Portfolios menu: Provides links to open and manage portfolios, views, and
scenarios. This example also shows three recently used portfolios, opened
by project code, manually-defined portfolio, and EPS element.
Projects menu: Provides links to open one or more projects, adjust specific
enterprise data for projects, and schedule services. This example also
shows five recently used projects or project groups, including two
individual projects, and all projects within the Energy Services EPS
element, Projects over $100K global filtered portfolio, and Mobile Product
project code group.

P6 Overview
89
Item Description
Resources menu: Contains a single link to adjust resource-specific
enterprise data without navigating away from the current page.
Administer menu: Assuming all its menu items are configured, this menu
provides links to adjust your own calendar and personal preferences. In
addition, it can also display links to the Application Settings, Enterprise
Data, User Access, and User Interface Views pages.
Help menu: A fixed menu providing links to the Online Help, P6 Library of
documents available online, and the Oracle Primavera Customer
Support website. If so configured, the Help menu can also provide links to
multimedia tutorials powered by Oracle UPK technology.
About the Most Recently Used List
As you work, when you click the Portfolios or Projects menu, by default P6
displays the five most recently used items, with the item you most recently opened listed
first.
Note: Your administrator can increase the list of most recently used
items to a maximum of ten.
The most recently used projects include individual projects or project groups (EPS nodes,
portfolios, or project code values). The most recently used portfolios include project
groups.
Projects are not added to the most recently used projects list when you create a project,
initiate a project request, or open a random set of projects (for example, projects from
multiple portfolios, but not the full portfolio itself). Projects you access from portlets are
added to the list, unless you access only activity detail information (such as activity
notebooks or documents) directly from a portlet.

90
Working with Tables
Tables appear throughout the application to not only display information, but also to
allow you to modify it, as permitted. The following general features are common to most
tables.
Table of Common Table Features
Item Description
Sort Order Indicators: Indicates the column you have selected to sort the
rows. Each time you click a column header, the sort order toggles from
ascending order, to descending order, and, for some tables, it cycles
back to unsorted order (the original order in which the entries were
created).
Grouping Levels: Many tables group related rows into hierarchical levels
you can click through to expand or collapse. Some tables use colored
bands to help you view these levels.
Selection Highlighting: The currently selected row is highlighted for you.
You can directly click and drag to select one or more entries. Hold down
the Ctrl key as you mouse click rows to select more than one. Hold down
Shift as you click two entries to select all contiguous rows.
Changed Data Icons: When rows change in a table, three color-coded
icons are used to signal the type of change that has occurred. A gold
icon indicates a pending change, a green icon indicates a new
entry, and a red icon indicates an error.
Data Entry Features: Tables allow you to directly edit data with
convenient controls to assist you in entering the right type of data. For
example, a date field will display a calendar.

P6 Overview
91
Column Resizing: You can directly drag to resize column widths.
Column Configuration: On most pages, a convenient Select Columns
icon allows you to select which columns are shown or hidden in the table.
Column Order: You can directly drag and drop column headings to
customize your tables.
About Columns (Fields)
Fields hold data. They generally either allow you to enter values or just display the field's
current value (called a read-only field).
Pages with tables often permit you to configure the fields that make up the columns of
the table. See Showing or Hiding Columns in a Table (on page 91).
Showing or Hiding Columns in a Table
When the list of available fields or columns for a table is relatively short, indicated by the
presence of the Select Columns icon and field list in the toolbar, use it to show and hide
the columns that appear.
To show and hide columns:
1) On the toolbar, click Select Columns.
2) From the resulting list of fields or columns:
a. Select an available column (not checked) to immediately display it in the table.
b. Select a currently visible column (checked) to immediately hide it in the table.
Note: You might have to scroll to the right end of a table to see all
the columns.
Configuring Columns or Values
When the list of available fields, columns, or values for a list, table, view, scorecard, or
other entity is relatively long, follow these common steps to configure the fields or values
you want. Essentially, you move the items you want from the available side to the
selected side.
For example, these steps apply when selecting projects or templates in the Open
Projects dialog box, when configuring the fields to display as columns in a table, and
when assigning individual users to a user interview view.
To configure fields, columns, or values:

92
1) In the Available Items list, select one or more items. If arranged in a hierarchy, click
to expand a group and view its items. Hold down the Ctrl key as you click to select
individual items or press the Shift key to extend your selection to an entire block of
items including the first and last items you clicked.
2) Click or double-click each item to add them to the Selected Items list. This is the
list of selected fields or values you want to appear in your customized list, table, view,
scorecard, or other entity.
3) To remove items, select them in the Selected Items list and click or double-click
them. If you need them again, the items are available in the list of available items.
4) In the Selected Items list, if applicable, adjust the order of appearance of your items:
a. Click to advance the item up or to the left in a table.
b. Click to advance the item down or to the right in a table.
Note: You can also directly click and drag columns in tables to
configure their order of appearance.

P6 Overview
93
Working with Toolbars
Throughout the application, pages, tabs, portlets, detail windows, and dialog boxes
provide access to essential commands in toolbars. Most toolbars are static, however, the
ones on the Activities, EPS, and Resource Assignment pages can be moved and
customized.
Table of Toolbar Elements
Item Description
Toolbar shortcut menu: Right-click within blank space on this panel to
select the toolbars you want in your customized view. You can also select
Rearrangeable or Customize Toolbars, both described below.
Rearrangeable toolbar: Click and hold the mouse button down on the
toolbar's edge until you see the move cursor. Then, drag to position the
toolbar wherever it is needed.

94
Item Description
Docked toolbar: In this example, the user has dragged the Edit toolbar
from its typical location on top to the page's left edge until it snaps into a
vertically-oriented position.
Customize Toolbar Items dialog box: In this example, the user has
selected Customize Toolbars from the Toolbars submenu of the View
menu. On this dialog box, the user has elected to hide the Fill Down
command icon from their Edit toolbar.
Activity View toolbar: This toolbar represents an example where a subset
of the commands found under the View menu are presented here in a
static or fixed toolbar for convenient access.
Toolbar in a detail window: The Steps detail window, like many other
detail windows, has its own fixed toolbar.
Customizing Toolbars
Toolbars are made up of icons that represent the commands you can invoke. You can
customize the appearance of icons on toolbars and move the toolbars on the following
pages only:
EPS page
Activities page
Resource Assignments page
P6 saves any custom settings you make with toolbars. When you return to one of these
pages with customizable toolbars, the settings you specified last will be reapplied to the
toolbars.
To customize a toolbar:
1) Navigate to one of the pages that support toolbar customization.
2) From the View menu, select Toolbars and then select Customize Toolbars...
3) On the Customize Toolbar Items dialog box:
a. In the Toolbar pane, select a toolbar.
b. In the Toolbar Item check box list, select the check box for the icons you want to
include. Clear the check box for the items you want to hide.
c. Click Save.
4) To reposition a toolbar:
a. On the page you selected for step 1, right-click in the blank space between
toolbars and select Rearrangeable.

P6 Overview
95
b. Click the grab handle for the toolbar you want to move and drag it to a new
position. Supported positions include the left, right, top, or bottom margins of the
main work area of the page.
Working with "Select a Value" Dialog Boxes
Throughout the application, certain types of fields require specific types of values. To
assist you in selecting from only a constrained list of available choices, the interface will
display Select a Value dialog boxes for you to search for and select a specific value
appropriate for the current field.
Note: Field lists of values are used when the available choices are
manageable (usually, less than 10 values). However, when the
number of available choices is large (for example, there might be
hundreds of projects), the application will offer Select a Value
dialog boxes.
Table 1 of 2: Select a Value Dialog Boxes
Item Description
Select a Value Button: Throughout the application, click Select a
Value to open a selection dialog box.

96
Item Description
Search Area: The top part of the dialog box contains search controls to
help you constrain the values based on your criteria.
Results area: The middle part of the dialog box displays the available
values based on your search criteria, if any. Make your selection here.
Command buttons: The bottom part of the dialog box contains
command buttons. Standard buttons include OK or Assign to accept the
value you selected, and Close to cancel the operation, close the dialog
box, and return to the previous screen.
Similar selection buttons: The Select a Date and Select a URL dialog boxes
function in a similar manner to the selection dialog boxes. Click these
buttons, when present in the interface, to select a constrained value for
the specific field.
Table 2 of 2: Select a Value Dialog Boxes
Item Description
Selection Buttons: Similar to the button, in these examples, click or
to choose a particular item.

P6 Overview
97
Item Description
Search Area: The top part of the dialog box contains custom search
controls to help you constrain the values based on your criteria. In one
example, option buttons are used to constrain Global, EPS, or Project
code values.
Results Area: The middle part of the dialog box displays the available
values based on your search criteria, if any. Make your selection here.
Command Buttons: The bottom part of the dialog box contains
command buttons. Standard buttons include Assign or OK to accept the
value you selected, and Close to cancel the operation, close the dialog
box, and return to the previous screen. Other buttons can also appear in
this area.
Selecting Values from "Select a Value" Dialog Boxes
To assist you in selecting from a constrained list of available values, the application will
often display Select a Value dialog boxes. Use these special dialog boxes to search for
potential matching values and select one or more specific values appropriate for the
current field.
Note: Although commonly used throughout the application, each
dialog box can contain unique options.
To select a value from a Select a Value dialog box:
1) Enter any search criteria to reduce the number of values shown.
2) Select a value in the list. If grouped in a hierarchy, expand a group to view the values.
3) Click OK or Assign.
4) Repeat these steps to select additional values if necessary.
5) When finished, click Close.

98
Working with Data in P6
The application's data entry controls are convenient and easy to use.
Table of Common Data Entry Controls
Item Description
Expandable sections: Often times a screen will reduce visual clutter by
hiding its fields and other controls. Expand these regions to show its fields.
In the sample image, we say that the Custom Portlets section is
expanded or opened, and the Performance Threshold section is
collapsed or closed. Also of note, you can directly modify the Title field
but the Last modified by field information is read-only.
Note: Data you enter can later become read-only for you or other users.

P6 Overview
99
Item Description
Auto-Complete: Also known as type-ahead. As you type in a field that
must be assigned a value from a pre-defined list of acceptable values,
the closest single matching value is automatically selected for you. If
multiple values match your typed input, they appear in a list. To select a
value, click one or press the up or down arrow keys on your keyboard
and then press Enter.
Select a Value from an Extended List: Click to select a field value from
a Select a Value dialog box listing only valid values. You cannot type in
your own entry in fields where the Select from Value List icon appears. This
convention is used whenever a field's value must be logically constrained
and validated against a pre-defined set of values. To illustrate this point,
consider the following example. You can type whatever you want in a
Name field for a new item you are creating; however, in a User field, you
must enter a valid user.
Select a Value from a Short List: In this example, the Activity Type field is
shown at rest. Below that, after the user has selected the field's list, its
values appear. For these kinds of fields, you will see references in the
documentation to selecting a value from the Activity Type list.
Options: For simplicity's sake, both radio buttons and check boxes are
referred to as options.
Dates: You can type a date in a valid format directly into a date field. Or,
you can select a date, including the time, from a small pop-up calendar.
Indicators: To help you readily identify the meaning of a given metric,
these color-coded graphics appear. You can also define your own
custom user-defined indicators.
Working with Detail Windows
When additional details about an item are necessary, rather than clutter the main work
area, the application will often use subordinate tabbed panels called detail windows.
Detail windows supplement their parent pages with related data and often include their
own toolbars. These special windows allow you to:
minimize them to a series of tabs
float, drag and drop, and freely resize them
tile them, or align them as overlapping tabs
dock or pin them (when docked, allowable placement includes bottom, left, and
right of the current work area)

100
When you customize the detail windows on the EPS, Activities, or Assignments pages, P6
prompts you to save the settings with the current view.
Note: Visual clues guide you when docking floating panels. As you
click the titlebar and drag it within the work area, a gray
rectangular outline indicates the panel will "snap to" this available
location.
Table of Key Detail Window Elements
Item Description
A series of detail windows: In this example, the three detail windows for
Steps, Documents, and Issues appear in a series aligned at the bottom of
the page with their titles shown in tabs.
Floating detail window: The user has dragged and dropped the Expenses
detail window to a position where it appears to be floating above the
rest. Click the Restore button in the titlebar to make the window go back
with its siblings.
Docked detail windows:The Assignments and Trace Logic detail windows
have been docked or pinned by the user to the space immediately to
the right of the main work area.
Minimized detail window: The Codes detail window has been minimized.
In this particular example, it also happens to be minimized to a position
along the right edge of the page. Typically, detail windows are minimized
along the bottom.

P6 Overview
101
Item Description
Detail window titlebar icons: Click these icons to Float, Restore, and
Minimize detail windows individually or collectively as a series.
About Portlets
Portlets are small expandable windows representing a specific theme or particular
subject matter. They are only available on dashboards, project workspaces, or
workgroup pages. Portlets provide a concise way to organize, present, and assess
project data within a single page and also offer tools for adding, modifying, and
personalizing portfolio, project, and resource data. Portlets on shared dashboards or
workspaces provide a centralized place for collaborating with other users.
The same portlet might display information differently depending on the page on which
it appears. On a dashboard, portlets display data based on association, ownership, or
applied filters. On a project workspace, portlets reflect data for the open project. On a
workgroup workspace, portlets show information belonging to that workgroup.
About Data Entry Controls
Data Entry Controls: P6 provides easy-to-use controls for entering data. To assist you in
choosing the right types of values, fields will sometimes present dialog boxes or calendars
for selecting from a pre-defined list of values or dates. Familiar value lists help narrow
choices and enforce consistency. You'll also recognize standard options (a term used for
both check boxes and option buttons or radio buttons), tables, spreadsheets, Gantt
charts, calendars, and other on-screen controls.
Printing Pages Using P6 Printing Tools
Available on most pages within the application, the printing tools and options provided
with the user interface offer the best options and output. It is recommended that you use
the Print Preview feature before generating actual output.
To print application pages:
1) Navigate to the specific page or tab and customize the view to meet your data
requirements.
2) In the toolbar, if available, click Print Preview to preview the printed output.
3) (Optional) In the Print Preview toolbar, adjust the preview using the commands
provided. For example, click Portrait to orient output to a standard tall page, or
click Landscape to orient output to a wide page.
4) In the toolbar, click Print to send the output to your default printer.

102
5) (Optional) In the Print dialog box, adjust the printer, page range, number of copies,
PDF settings, and other printing options. Click OK to print the output.
Tips
If the application printing tools are not available for the specific page or view you want
to print, you might be able to print the page using your web browser; however, this
method can never be guaranteed and might produce substandard results. See Printing
Pages Using Your Web Browser (on page 102).
Printing Pages Using Your Web Browser
Because P6 runs inside your web browser, you can print any data from any page at any
time using your browser's Print command. For example, in Microsoft Internet Explorer,
choose Print from the File menu. P6 application pages also feature a Print link you can
click. In addition, many pages also include separate Print toolbuttons in a toolbar.
Note: Whenever they are available, the printing commands
provided by the application offer the best options and output. It is
also recommended that you always use the Print Preview feature
before generating actual output.
To print data:
1) On any page that supports printing, click the Print link in the top right corner.
2) In the resulting Print dialog box for your operating system, choose a printer and click
OK to print.
Note: You have completed this task. Continue with the following
steps only if necessary to improve or customize the output.
3) In the Print dialog box, if available, click Print Preview. Refer to Print Preview
Toolbar to learn more about the Print Preview toolbar. If not available, use your
browser's Print Preview command. For example, in Internet Explorer choose Print
Preview from the File menu.
4) In the Print Preview dialog box, to customize the output, click Page Setup or click
your browser's Page Setup button.
5) In the Page Setup dialog box, apply the following optional settings on separate tabs if
available:
a. Click the Page or Page Layout tab to set the paper size and margins.
b. Click the Header/Footer tab, or separate tabs if available, to select pre-defined
headers or footers, or define your own.
c. Click the Sheet tab, if available, to set the range and tiled page order.
6) Click OK to close the Page Setup dialog box.

P6 Overview
103
7) In the Print Preview dialog box, click Print or Print (Alt+P) to make any final
adjustments in the Print dialog box. For example, click the Pages option and enter a 1
in both the from and to fields if you only want to print the first page of a lengthy report.
8) Click OK or Print.
Tips
When printing a spreadsheet or histogram on the Team Usage page, right-click in the
work area and choose Print.
The Print Preview dialog box for the Portfolio Analysis page includes special options.
About E-Mail Notifications
Notifications is a feature that enables users to be contacted by e-mail when changes
occur relating to project data such as issues, timesheets, or workflows. For example, you
can be notified when a project workflow is awaiting your approval.
When new user accounts are created, the user's e-mail address can be stored. This
allows them to receive e-mail notifications when certain events occur such as when a
user also mapped to a resource is assigned to an activity. Using issues as another
example, users can be notified about issues when the issue's priority level is set to "high",
when a specific issue code is assigned, or when any change to an issue occurs.
E-mail notifications can be sent manually or configured to be sent automatically by the
application.
Working with E-Mail Notifications
If available on the current page, portlet, or dialog box, you can click to manually
send an e-mail message.
P6 provides the following e-mail notifications. Follow the summary steps below (or, if
needed, see more detailed task topics) to configure automatic e-mail notifications for a
particular item.
Requirements:
In general, you should have an e-mail address stored in your user account to send e-mail
and recipient users should have an e-mail address stored in their user accounts to
receive e-mail. The e-mail accounts are required in order to send e-mail to users by
selecting them from a list. They are then automatically applied to the e-mail message.
However, it is also possible to manually enter a recipient's e-mail address in the E-Mail
dialog box just before sending the message.
To use the Notifications feature, your administrator will enable settings in P6 Administrator
application and configure it for use with a mail server.
After notifications are enabled, each individual can specify their personal notification
preferences enumerated below:

104
To configure automatic e-mail to a resource when that resource is added or removed
from an assignment, select the Send e-mail to resources upon adding or removing
assignments option in the General section of the Global tab of the My Preferences
page.
To receive e-mail notifications about issues, configure the Issues section of the Global
tab of the My Preferences page. You can be notified about issues based on an issue's
priority level. For example, you can be notified only when an issue's priority is listed as
"high." You can also be notified when issues are modified, or when issues are assigned
a specific issue code. You can be notified about issues for projects and workgroups
based on whether you have project access rights, issue access rights, if you are the
Project Owner or Issue Owner, or if you are assigned as a resource to that activity.
To automatically send e-mail to a designated temporary project manager delegate
assigned to approve timesheets, select the check box on the Assign Project Manager
Delegate dialog box. This will notify the delegate of their temporary assignment to
review timesheets and will list the designated projects.
To automatically send e-mail to a designated temporary resource manager
delegate assigned to approve timesheets, select the check box on the Assign
Resource Manager Delegate dialog box. This will notify the delegate of their
temporary assignment to review timesheets and will list the designated projects and
individual resources.
To automatically send e-mail to a resource about a rejected timesheet, reject the
timesheet on the TimeSheet Approval page from within P6. You will be prompted to
send a notice.
Administrators can configure BPM to notify a user when a project workflow is awaiting
that user's approval.
Sending E-Mail to Resource Teams
You can send e-mail to an entire resource team of your choosing.
To send e-mail to a resource team:
1) Click Dashboards.
2) On the Dashboards page, select a dashboard tab.
3) On the dashboard tab, expand the Resource Team Summary portlet:
4) In the Resource Team Summary portlet:
a. Click Filter by and select the team to which you want to send an e-mail.
b. Click E-mail resource team.
5) In the E-mail dialog box:
a. Edit the recipient list, message, and subject as needed.
b. Click Send E-mail.
Tips
You must have an e-mail address listed in you user profile to send an e-mail.

P6 Overview
105
Sending E-Mail Notifications about Resource Assignments
An automatic notification feature can be configured to send e-mail to the affected
resources when you add, change, or remove a resource assignment.
To configure P6 to automatically send e-mail about resource assignments:
1) Click the Administer menu and select My Preferences.
2) On the My Preferences page, click the Global tab.
3) On the Global tab, expand the General section.
4) In the General section:
a. Select the Send e-mail to resources upon adding or removing assignments option.
b. The system automatically selects the Prompt before sending e-mail option. Clear
the option if you do not want prompts.
5) On the Global tab, click Save and Close.
Tips
The address and subject line for the e-mail are generated based on the specific
assignment circumstances. For example, when you first assign a resource to an
activity, the e-mail subject line tells the resource they have been assigned and
provides the activity name. In all cases, the message text includes the project name,
resource start and finish dates, planned units, and planned units/time.
When the automatic e-mail option is on, confirmation messages are sent to you,
indicating the names of the recipients.
If a resource does not have an e-mail address specified on the Resources tab of the
Administration page, no e-mail can be sent.
When a resource is replaced on an activity, an e-mail is sent to the removed resource
and to the replacement resource.
About Grouping and Sorting
To simplify the display of complex tables of data, you can group rows of similar data and
sort the grouped bands as well as the data under them. Grouping helps you block
distracting data and focus only on the information you need. It also permits you to
collapse and expand hierarchical arrangements of your data rather than navigate large
flat lists.
Working with Group and Sort Features
This set of controls appears throughout the application (most notably on the Activities,
EPS, and Assignments pages) and offers similar functionality for grouping and sorting the
fields (or columns) in a list, table, or scorecard. Options for text color, band background
color, and showing data in bands are also provided.

106
To answer questions you need answered involving two or more fields, consider grouping
by those fields. For example, if you need to know Do we have any code yellow activities
that started this month or last and that are assigned to vendor ABC? then group and sort
by your code, start date (to the month level), and vendor fields.
Table of Common Grouping and Sorting Screen Elements
Item Description
Common Group and Sort Example: In this example, the Activities page is
grouped by the Project, WBS, and Start Date fields.
Custom Group and Sort Example: In this example, the Activities page is
grouped by the Crew project code, then by Action, Primary Resource,
and finally the Status activity code. This helps the user pinpoint the exact
data they were looking for.
P6 Overview
107
Item Description
Custom Group and Sort Settings: These are the corresponding Customize
Groupings dialog box settings applied to achieve the example in item 2
above. Even though the hierarchical fields are capable of displaying
data in more nested levels, the user is only concerned with the top two
levels indicated by a 2 in the To Level field.
Notes:
Most groupings support up to ten (10) levels with some pages
such as the Activities, EPS, and Resource Assignments pages
supporting up to twenty (20) levels of grouping by one or more
fields.
Because projects can be in two different portfolios, the same
project can appear in two different group bands when you are
grouped by portfolio. If you edit one of these bands, the other
bands will automatically be updated.
Grouping and Sorting Information
Grouping and sorting data helps reduce its visual complexity.
To group and sort data:
1) Navigate to a page supporting grouping and sorting.
2) If available in a toolbar, click Grouping and select a grouping option. The entries
are grouped hierarchically and sorted alphabetically.
3) If available in a toolbar, click Group... to open the Customize Groupings dialog
box.
4) On the Customize Groupings dialog box:
a. In the Level 1 Field list, select the first field you want to use to group all other data.
The available fields are arranged into categories that apply to your specific
context within the application.
b. In the remaining levels, select additional fields you want to use to further group
data empirically.
c. For each field, in the To Level list, select how deep the hiearchical groupings of
each field should appear. For example, if your project contained ten levels of
hierarchical WBS elements, enter 2 here if you only want to group all activities by
their top two WBS values. This is useful if you only want to see tasks grouped into
high-level arrangements, making them easier to scan. Instead of having to click
through each nested level, you might only be interested in seeing activities for
Phase II that fall under the Planning stage. To see activities grouped by all ten
levels, choose 10 or All.

108
d. For each field, in the Sort Order list, select how you want the grouped data bands
to be sorted when your grouping options are applied.
Note: You can click a column header in the actual table you just
customized later to change the column used to sort the data rows
under each band, but the sort order for the grouping bands
themselves is only determined by your selections in the Sort Order
list on the Customize Groupings dialog box.
e. Click OK to close the dialog box and apply your grouping options to the page you
selected in step 1.
About Find, Search, and Filter Features
The application provides three main ways to find the data you need: Find, Search, and
Filter.
The Find feature is available in tables to help you find the next matching row in a column.
Use the Find feature in table columns to locate matching rows of data one at a time up
or down the table.
Note: For pages with static data, use the Find feature in your web
browser to locate fixed elements of the user interface. See the help
documentation for your web browser.
The Search feature is available on certain pages or dialog boxes to help you reduce the
number of available values, showing only those values that meet your search criteria. Use
the Search feature wherever it is available to locate only matching values.
The Filter feature is available on certain pages to help you reduce the amount of data in
tables, showing only those values that meet your filter criteria. Use the Filter feature
wherever it is available to view only matching values. For example, you might configure
a view with pre-defined filter, group, and sort parameters.
Working with Find, Search, and Filter Features
The application supports three general ways to find only the data you need. The options
available vary from page to page.
Find: Use the basic Find feature to search for matching entries, one at a time, in
tables.
Search: Use Search to view all matching entries in certain dialog boxes and special
pages.
Filter: An advanced type of search, filters show all matching entries while hiding the
data you don't want to view on the Activities, EPS, and Resource Assignments pages.
You can also apply filters to include only certain kinds of projects in a portfolio, or to
include only specific project codes on a dashboard.

P6 Overview
109
Finding Entries
Another common feature of P6 tables is the Find command. Unlike the Search feature
which shows you all matching results at once, the Find feature searches up or down in a
column to find the next single matching entry.
To find entries in a table:
1) Navigate to any page with a table of entries.
2) Right-click in a specific column of the table and choose Find.
3) In the Find dialog box:
a. In the Find what field, enter your search criteria
b. Mark the Match whole words only option to constrain the results to only values that
match the exact words as typed.
c. Mark the Match case option to constrain the results to only values that match the
upper or lowercase spelling of the words as typed.
d. In the Direction section, select either Up or Down to indicate the direction of the
search.
e. Click Find or press Enter to search up or down through the rows of values in the
selected column. Your matching search results are highlighted in the current table.
4) To find the next matching entry, right-click and select Find Next.
To find matching data on a page, however, use your web browser's Find command.
To find entries on a page:
1) Navigate to any page displaying field data.
2) In your web browser, select Find from the Edit menu. For Internet Explorer 8.x, select
Find on this Page from the Edit menu.
3) In the Find field, enter your search criteria and click OK or press Enter.
4) Your matching search results are highlighted on the current page.
Searching for Entries
The application provides similar search tools wherever they are required to help you
search for matching entries. For example, if you create a new issue while viewing a
project on the Activities page, one of the required fields you'll need to complete is called
Responsible Manager. To complete the field, you can either type a value if known, or
click to open the Select Responsible Manager dialog box. If you open the dialog box,
you can use the search field provided to search for a particular name in the OBS rather
than manually click through all the OBS entries. As another example, when you open
projects, templates, or portfolios, you can use the search tools to find matches by name
or ID.
To search for matching entries:

110
1) If a search button such as Search is available, click it to show the Search field. If
not, proceed to the next step.
2) If a Search field is available, enter your search criteria and . If no search options are
available, the current page or dialog box does not support searching.
3) Click Search or press Enter to perform the search.
Note: Common dialog boxes in which you are asked to select a
value (accessible by clicking Select a Value throughout the
application) often include search features. See Working with
'Select a Value' Dialog Boxes (see "Working with "Select a Value"
Dialog Boxes" on page 95).
About Filters
As you work with increasing amounts of data over time, you will recognize a need to limit
your focus to only the data most relevant to your particular task or need. A filter is a
predefined constraint you place on data so that data that does not meet your filter
criteria is hidden and only the data you need are shown.
Working with Filters
Apply filters to large tables or complex pages in the application so their complexity and
time to display are reduced. For example, rather than displaying all activities for all
resources from all projects, likely to result in an unmanageable volume of data, you
might filter the Activities page to display only the activities assigned to you from a single
project. In this example, your filter criteria include an identifier for the single project and
an identifier for you.
Some pages feature basic filter options while others handle the most advanced logical
parameters. Applied alone or in combination, filters represent a powerful tool for
managing vast amounts of data.

P6 Overview
111
Basic Filters
The application presents simple filters you can apply to refine the data displayed. Basic
filters do not require you to define very detailed parameters.
Table of Basic Filter Elements
Item Description
A dashboard filter: In this example, the user has decided to apply a filter
to their personal dashboard. The applied filter will determine the data
that appears in all the portlets of the dashboard.

112
Item Description
The dashboard filtered by portfolio: The user's filter parameters are basic.
Essentially, the user selects a portfolio. Notice here that the user could
have elected to filter the dashboard by a special type of portfolio called
a filtered portfolio that is itself defined by more advanced filter criteria.
These examples illustrate how you can use filters to refine the precision of
the data you need while eliminating the noise or data you don't need.
Advanced Filters
You can create advanced filters to control with pinpoint accuracy the data displayed.
Advanced filters enable you to define what some users might perceive as complicated
logical parameters.
Example: A project manager for Product Release Y is tasked with assigning resources to
all non-Red Priority activities. She wants to examine all of John Brunner's assignments to
see if he is available to assign to other activities that have not yet started and do not yet
have resources assigned to them. Her filter criteria is demonstrated below:
Product Release equals Product Release Y (a custom project code) any of the following rules Priority is not equal to Red Primary Resource equals johnb - John Brunner Primary Resource is empty
The PM applies both her own user filter and the standard Not started activities only filter to
view activities matching either set of criteria in order to cast a wider net and review the
results.

P6 Overview
113
Table of Advanced Filter Elements
Item Description
Creation of a new filter: In this example, the user wants to reduce the
number of activities on the Activities page. After naming the new filter,
the user defines custom parameters to constrain the data.
Filters applied to the current activity view: After creating the new single
user filter, the user marks it and also marks one of the standard filters. The
user has also elected to show matches for any applied filters.
Filtering Data
Filters use logical rules you define to hide the data that you don't want to display. This
allows you to work with only the "good" data you want. Filters help reduce visual clutter
and improve performance.
To use filters:
1) Navigate to a page that supports filtering.
2) Define and save your filter criteria.
3) Enable or apply the filter.
Note: Defining filter criteria varies within the application from
making a few simple selections to applying advanced logic.
Pages Supporting Filters
The following areas of P6 support filtering:
Page Description
Activities page Apply filters based on project and activity parameters to
target specific activities.
EPS page Apply filters based on EPS and project parameters to
target specific projects.
Resource Assignments page Apply filters based on resource and role parameters to
target specific assignments.
Dashboards page Apply filters based on portfolios, projects, or codes to
target specific project and portfolio data displayed in
portlets on the dashboard.
Timesheet Approval page Apply filters based on timesheet status to target specific
timesheets.

114
Page Description
Portfolio Analysis
page
Apply filters based on EPS, portfolio, and project code to
target specific portfolio data.
Issues page and
Issues portlets
Apply filters based on issue parameters to target specific
issues.
Risks page Apply filters based on risk parameters to target specific
risks.
Create Portfolio and
Portfolio Details
pages
Apply filters based on project data, codes, and UDFs to
target specific projects that make up a portfolio.
Workflow portlet Apply basic filters to view workflow tasks on the Action
Required tab and filter by role or status on the My
Workflows tab.
Creating, Modifying, and Deleting Data
In general, you can create items and then directly modify the data in any field at any
time; however, the application will often guide you by making certain fields read-only or
hiding them when appropriate. To create items, follow the steps in the task topics
included in this online help or user guide. To modify data, follow the Getting Here steps to
navigate to a page or dialog box where you can directly view and edit the data. For
example, to modify activity data, navigate to the Activities page.
Once on a page, click in a field on a page or double-click in a table cell to edit or
remove a value. Changes made will cascade through P6 automatically.
If you cannot modify the data item, consider the following reasons:
The item is read-only. In other words, the data on the page is only being displayed for
you to view; however, it cannot be modified.
Your current view settings do not allow you to access the data. For example, you
might be able to access the data by adjusting your group and sort or filter settings.
Or, you might need to customize your user interface view settings or ask your
administrator to configure or reassign your user interface view.
Your current security settings do not allow you to access the data. You do not have
security, OBS, module access, or other access permissions to modify the item.
Specific business logic prohibits making certain modifications. For example, the item
can only be modified by its creator and cannot be modified by other users, or it
cannot be changed after a certain date.

P6 Overview
115
Cutting, Copying, and Pasting Data
Use the standard Cut, Copy, and Paste features to save time while working with a variety
of items in the application. For example, you can copy an entire resource or role
assignment table row from one project to another in the resource planning spreadsheet
on the Resource Planning page. Instead of creating a new user from scratch,
administrators might add a new user by simply copying and pasting an existing entry on
the Users page for a similar user.
The steps for copying and pasting the following types of data in the application are
essentially the same:
individual field and cell values
activities, including their steps and other associated data items
projects, including their WBS, activities, steps and other associated data items
EPS nodes, including their project & WBS data and activity data
resource and role assignments
user accounts and their associated data items
global and project security profiles, including their privileges
currencies, funding sources, calendar data, project codes, activity codes, and other
enterprise data supporting copy and paste functionality
scheduled reports
Note: The list above is not meant to represent all areas of the
application supporting this feature. Cut, Copy, and Paste
functionality is supported when these commands appear in a
toolbar or shortcut (right-click) menu.
To copy and paste a value:
1) Right-click on a row in a table and choose Copy (Ctrl+C) to copy the data item.
To remove the original item instead of creating a copy, choose Cut (Ctrl+X). In
fields, select the entire cell value or just a portion and then right-click and select Cut or
Copy.
2) Navigate to the supported destination for the new copied item, right-click, and
choose Paste (Ctrl+V). The supported destination should be compatible in order
for the copied data to paste successfully. For example, a row in a table pasted as a
row in another table, or a date-time field value pasted into another date-time field.
Note: Hold down the Ctrl key while clicking to select multiple rows
in a table. Hold down the Shift key to select contiguous rows.

116
About Removal vs. Deletion
In general, when you have the required security privileges, the application supports
direct modification, removal, and deletion of data. For example, you can directly input a
value over an existing field value or select an entry in almost any list or table and click
Delete to remove an assignment or delete an item. In some cases, certain additional
security settings might be required. You should also be aware of subtle differences
between removing an item and permanently deleting an item. Be aware that there may
be undesired consequences of your decision to remove or delete an item.
Deleting Entries
The steps for deleting any entry in the entire application, such as activities, steps, or users,
are generally the same.
To delete an entry:
1) Navigate to any table or list of entries in the application.
2) Select an entry. To select multiple entries, press and hold the Ctrl key down as you
click additional entries. Press and hold the Shift key down to select all contiguous
entries.
3) Delete the entry using one of the following generally available methods:
a. In tables, right-click and select Delete.
b. If a toolbar is available, click Delete (Delete).
c. On other pages or dialog boxes, click the available Delete button or link.
4) If prompted to confirm, click OK.
To learn more about the options, details, and consequences associated with deleting
various types of entries, refer to Removal vs. Deletion (see "About Removal vs. Deletion"
on page 116).
Undoing Mistakes
Mistakes happen from time to time and P6 includes some standard methods for reversing
unwanted changes. Follow the steps below and stop at the step that fixes your data
entry error. If a step does not undo your accidental entry, proceed to the next step.
To undo mistakes:
1) In a table with unsaved changes, click Cancel to discard any pending changes
and revert back to the last saved state.
2) If the page you are viewing shows a Cancel button or link, click it to discard any
pending changes and revert back to the last saved state.
3) If the page you are viewing shows a Restore to Defaults button or link, click it to restore
the page.

P6 Overview
117
Caution: This command will discard all changes that have ever
been made and will revert back to the original default values.
4) In a limited number of fields on only a few pages and dialog boxes, press Ctrl+Z to
undo only the most recent unsaved changes to only that field.
5) If you made an assignment and want to remove or change it, navigate back to the
page where you made the assignment and remove or change it. For example, you
can easily remove or change the users assigned to a user interface view, OBS
element, or portfolio. Begin by following the procedures in this help system for
assigning an entity and simply remove the assignment instead of making it.
6) If you created an item by mistake, and want to permanently delete it, begin by
following the procedures in this help system for creating the entity and simply delete it:
a. Navigate to the page showing the items.
b. Select the item you want to delete and click Delete.
c. Click Save to save your changes.
About Metrics and Calculations
P6 automatically calculates and displays various performance metrics designed to
enhance your company's competitive edge within your industry. Color-coded indicators,
such as Critical, Warning, Acceptable, and Exceptional, appear on
dashboards, workspaces, and portfolio pages to provide instant visual feedback.
The following categories of performance metrics are applied to portfolios, projects, or
even a single WBS to help you assess status relative to your goals.
Schedule - Metrics based on the current schedule, baseline duration, performance
percent complete, and schedule percent complete. This category also calculates
metrics at completion based on the current schedule. Examples include Schedule to
Date, Cost to Date, Schedule at Completion, and Cost at Completion.
Earned Value - Metrics based on Earned Value calculations. This category includes the
same metrics as the Schedule category, but uses different methods based on Earned
Value concepts such as SV and CV.
Index - Metrics based on cost or labor unit indices. This category includes:
SPI - A measure of the work accomplished as a percentage of the work
scheduled. The Schedule Performance Index helps determine if your schedule is
meeting earned and planned values.
CPI - A measure of the value of work accomplished as a percentage of the actual
costs. The Cost Performance Index helps assess spending vs. budget.
TCPI - A measure of the value of the remaining project work. The To Complete
Performance Index helps determine the level of performance required to achieve
your objectives within budget and on time.

118
Additional summaries, forecasts, variances, and other calculations are also provided
automatically. For example, portfolios provide built-in ROI calculations and projects will
automatically help you determine critical float paths.
Using Visual Indicators
Indicators are a special type of user-defined field (UDF) that enable you or other users to
select color-coded icons (such as ) to display as values in columns to highlight
specific activities, activity steps, activity resource assignments, documents, projects,
resources, risks, WBS elements, expenses, and issues.
To configure and apply user-defined indicators:
1) Click the Administer menu and choose Enterprise Data.
2) On the Enterprise Data pane, expand a group and select a UDF entry. For example,
expand Activities and click Activity UDFs.
3) On the UDFs page:
a. Click Add (Insert).
b. Enter a name for the UDF and then select Indicator from the Data Type list.
c. Click Save (Ctrl+S).
4) Navigate to the page where you want to display the color-coded indicator field,
such as Activities, EPS, or Risks, and add the indicator field to the table. Depending on
the page, click Customize, Columns, or Select Columns. See Showing and
Hiding Columns in a Table (see "Showing or Hiding Columns in a Table" on page 91) or
Configuring Columns or Values (on page 91).
5) In the indicator field, select a color-coded visual indicator (such as ) from the
list.
6) Click Save or Save.
About Importing and Exporting Data
Import/Export features allow you to bring data into P6 as well as export data to other
tools when needed.
Available Import Options:
Import Projects from other Oracle Primavera users or Microsoft Project
Import Activities
Import Resources
Import Appointments as personal non-work exception time from Microsoft Outlook
and other applications that support the iCalendar format
Available Export Options:
Export Projects
Export Activities

P6 Overview
119
Export Resources
Export Resource Allocation and Cost
Export Project Data to an ERP System
About Importing and Exporting Projects
You can import and export information to and from P6 using external files and then share
this information with other P6 EPPM users, Oracle Primavera Contractor users, other
project management tools (such as Microsoft Project and Microsoft Excel), and your
organization's human resource and accounting systems. You can also use external files
to archive your projects or create a backup of your database.
You can import and export project data between P6 and other applications using the
following file formats:
Oracle Primavera's XML format which enables you to share project information stored
in the P6 EPPM database.
Microsoft Project XML format which enables you to share information with Microsoft
Project 2007.
Note: All project data is stored in a central database. You can also
import projects using the Primavera XER format in P6 Professional.
Configuring Browser Settings
Before importing resource or Outlook data into P6, you must first give the browser
permission to invoke scripting commands on the ActiveX control that is part of the data
you want to import, such as Microsoft® Outlook or Excel. Since these applications are not
generally used for Web scripting, they are not marked as "safe for scripting", and
therefore web pages on sites that are part of your normal Internet zone do not have
permission to run script commands on it.
To allow P6 import features to invoke script commands on external applications, you
need to make the P6 web application site a member of a zone that has the privilege
"Initialize and script ActiveX controls not marked as safe". The "Trusted Sites" zone by
default has this privilege set to Prompt, which is recommended for this zone.
To set up P6 as a Trusted Site zone for importing data:
1) In your Web browser, choose Tools, Options.
2) Click the Security tab.
3) Click the Trusted Sites zone icon, then click the Sites button.
4) Enter the P6 hostname or IP address into the Add this web site to the zone field. Click
Add. If the message, "Sites added to this zone must use the https prefix" displays and
you do not want to use server verification, click OK and then clear the "Require Server
verification (https:) for all sites in this zone" option.
5) Click OK.

120
6) Once these settings are enabled, you will be prompted by P6 with the following
message "An ActiveX control on this page might be unsafe to interact with other parts
of the page. Do you want to allow this interaction?" Choose "Yes" to continue with the
import feature that you selected from P6.
About P6 Help
Use this online help system to learn more about the P6 application. Context-sensitive help
is available from almost every screen by clicking its Help link or Help button.
Use the Table of Contents, Search, and Related Topics features to find the topics of most
interest to you and your team.
Note: The help files include information about all features; however,
each user might not be authorized by their administrators to access
every feature. The help files are written as if you have the access
settings required to perform the task or view all the screen
elements. If you cannot perform a step or view an element, try
adjusting your security settings. Your access to data and ability to
interact with the user interface are controlled by various security
features. See About Security.
Viewing Help Content
As you work in the application, there will be times when you need assistance, on varying
levels. You might need just a reminder or a complete series of tasks to follow step by step.
Refer to the information below if you need help as you work in the application.
1) Consult your internal procedures. Your organization might enforce certain rules and
policies that override any instructions provided by Oracle Primavera.
2) If you want to access the P6 Online Help system, consult the table below to determine
how to open it from your current location in the application.
Current Location: How to Open the Online Help:
a page or tab Click the Help link at the top right of the page.
a dialog box Click the Help button, if available. If no help button is
available, try searching for the name of the dialog box as
stated in the titlebar or use the related topic links
provided for similar topics in the Online Help.
a dashboard portlet Click the Help button in the portlet's titlebar.

P6 Overview
121
Current Location: How to Open the Online Help:
a detail window
(panel)
Click the Help link at the top right of the detail window's
parent page and then click the link for the detail window
in the Online Help.
a work area in
full-screen view
Exit the full-screen view and click the Help link at the top
right of the page.
Working with P6 Help Topics
The online help appears in your default web browser whenever you need help using P6.
Table of Key Concepts: P6 Help
Item Description
The online help appears in your default web browser whenever you click
the Help command available from the following user interface screen
elements...
...the Help link on most main pages and tabbed pages;
...the Help button or menu on a few dialog boxes;
...the Help button or menu in the titlebar of all portlets.
Note: Help is context-sensitive. This means if the current page has a help
link or button, then the online help will open the closest matching help
topic. The help documentation includes a topic for almost every major
page and dialog box. If the dialog box you need help with does not
feature a help link, click Cancel and open the help topic for the
preceeding page which should include the help links you need.

122
Item Description
Key Help Window Elements: The Contents tab presents the table of
contents for the help system showing topics arranged by subject. Use the
Search tab to find help content by entering your own choice of
characters, keywords, or phrases.
The search feature will help you find partial word matches. For example,
searching for site will return pages that include site, website, or sitemap.
The search uses combination AND logic when you type multiple words or
fragments. Only help topics that include all of the words or fragments
appear in the results (e.g., word 1 AND word 2).
If the topic is in the table of contents, click Up/Previous to view the
previous help topic in the order shown in the table of contents. Click
Down/Next to view the next help topic in the order shown in the table of
contents. After a search, click Contents, if available, to view the topic
within the table of contents.
Key Help Page Elements: Context-sensitive help topics include an
overview, details for all screen elements on the actual P6 page, a Getting
Here section listing the steps required to navigate to the page, and
related topic links. Other types of topics include conceptual topics that
tell you about main ideas, conceptual topics that summarize how a
feature works often with sample screen images, task topics that take you
step-by-step through a procedure, and reference topics that describe
icons, fields, and other information. All topics may also include
applicable notes, tips, examples, and other information. Notes with
security considerations are indicated by .

P6 Overview
123
Common P6 Commands
To reduce repetition, the following screen elements are considered common and are
documented once in the table below rather than on every help topic. They may appear
in P6 as links or buttons, as illustrated in the samples above:
Save: Validates the data you entered or changed and then stores it. If it cannot
validate and save your data, the application will alert you so you can make
corrections; for example, when a required field value is missing or if a logical
constraint is not met.
Close: Closes the current page or dialog box. If you modified but did not yet save
data, you will be prompted to save or discard your changes.
Save and Close: Attempts to save the data and then close the current page or dialog
box, returning you to the previous page.
Cancel: Closes the page without saving any changes.
Restore to Defaults: Restores all options on the current page to their original default
settings.
Apply: Applies your modified settings to the object you are editing but does not save
them. This allows you to preview the impacts of your changes and decide if you want
to save them or make additional changes.
Customize: Opens the available options for customizing the current item. The custom
settings you make may be available to only you or to other users depending on the
item being customized.
OK: On a message box or alert dialog box, acknowledges that you have read the
message and want to continue rather than close or cancel the operation. On a
typical application dialog box, accepts your input and attempts to continue the
current task.
Assign: Applies your selection and continues the current task.
About Integration with Other Applications
Users at your organization are likely using other software and may be wondering about
compatability or ways P6 can work with other solutions.
P6 is part of a suite and works with or is compatability with the following add-ons and
applications:
Contract Management
P6 Progress Reporter
P6 Analytics
P6 Professional
Document Repository (UCM)
Microsoft SharePoint
Microsoft Project
Workflow features (BPM)

124
Microsoft Office, OpenOffice, and other third party productivity software; for
example, copy and paste notebooks into a word processor or export spreadsheet
data to .xls or .csv files.
iCalendar (.ics) format for importing personal calendar exception time
Oracle Primavera Risk Analysis
ERP systems
Consult your administrator to determine your precise deployment environment, access
settings, import/export options, and other features. More robust integration is achieved
using P6 Web Services, the P6 Integration API, or events.
About Timesheets
With the optional P6 Progress Reporter module installed, users can submit timesheets
reflecting their work assignments on projects. Timesheet approval managers can then
approve or reject those timesheets.
Timesheets allow the user to record hours for assigned activities. Timesheets are assigned
a period and an approval level. The period defines the amount of time the timesheet
covers, lasting from one week to a month, and what day of the week will conclude the
timesheet. The approval level specifies how many levels of approval are necessary to
submit a timesheet. Approval levels range anywhere from no approval required to two
approval levels.
Working with Timesheets
Resources required to submit their time using the optional timesheets provided by P6
Progress Reporter will navigate to an online timesheet they can fill in and submit for
approval by their manager.
Resources submitting a timesheet must meet the following requirements:
a) The resource must be assigned to activities in the project.
b) The resource must be assigned to a user account with Team Member or Progress
Reporter module access by their administrators.
c) The resource must be designated to use timesheets.
Approval managers must meet the following requirements:
a) Approval managers must be assigned as the P6 Progress Reporter Approval Manager
for the resource submitting the timesheet.
b) Approval managers must be granted P6 Progress Reporter access by their
administrators to utilize the full set of timesheet features; however, a manager strictly
reviewing timesheets just needs access to the Timesheet Approval page from
dashboards.
After a resource completes an online timesheet, the assigned approval manager for the
resource, or a designated delegate, then performs any of the following tasks:

P6 Overview
125
approves or rejects the timesheet
notifies the resource about the status of the timesheet
views/determines if a resource has started or submitted a particular timesheet
adds timesheet notes
runs a timesheet report in the Reports section of P6
Note: If you are a timesheet approval delegate for a project
manager, you can review timesheets for resources who are
assigned to activities within the projects for which you have been
granted approval rights. A project manager can transfer timesheet
approval rights to different delegates for each project.


127
About Dashboards, Workspaces, and Workgroups
P6 provides three types of user-customizable pages you can use to monitor and share
concise snapshots of data in a single place without having to navigate to other sections
of the application. They are:
Dashboards
Project Workspaces
Workgroups (a workspace within the project workspace)
You can customize the content and layout of each dashboard, workspace, and
workgroup to display related data inside smaller windows called portlets. Portlets provide
the means for adding, editing, and viewing up-to-date information about portfolio,
project, resource, workflow, document, and personal data. They provide a single
location for collaborating with other users.
You can have multiple dashboards and workgroups; however, each project has just one
project workspace.
About Dashboards
A dashboard is a customizable page consisting of the data you need to perform your
role. Dashboard data appears in one or more smaller regions called portlets. Custom
workspaces are available in the Dashboards section, where each workspace appears in
its own tab. The Projects section also presents a single dashboard for the current projects
you are viewing, called a workspace.
There are three types of dashboards:
User dashboards are private workspaces you create or customize that are not
available to other users. Use them to organize information meaningful to you. For
example, a dashboard that only contains My Activities, My Projects, My Documents,
and My Calendar.
Multi-user dashboards are accessible to a specific group of users you select. If
another user configures a dashboard for your use, you can view it on the Dashboards
Home page. Only the dashboard's creator can modify its content, layout, or access.
Dashboards created by other users and made available to you should contain
project or resource information relevant to you.
Global dashboards contain information relevant to all users. All users can view them.
You must have the appropriate security privileges to create, edit, and delete global
dashboards.
Dashboards and Workspaces

128
Working with Dashboards
P6 provides three types of customizable dashboards: dashboards (representing multiple
projects), the project workspace (representing a single project), and workgroups
(representing the data important to sub-groups or teams within a project). You can
customize the content and layout of each dashboard or workspace to display the
portlets you want to view. Portlets provide a means for adding, customizing, editing, and
viewing portfolio, project, resource, and personal data, as well as for collaborating with
other users.
The Dashboards page displays the global and multi-user dashboards available to you as
defined in your user interface view settings, along with your private user dashboards.
Each dashboard displays one or more portlets.
Note: An administrative setting limits the number of portlets that
can display in a dashboard to 12; however, administrators can
specify a different maximum.
Use the Manage Dashboards page to modify the list of available dashboards that display
on the Dashboards page or to create your own private or multi-user dashboards. Refer to
Showing and Hiding Dashboards (on page 134). The Personal Workspace dashboard is a
common default title used for the default dashboard assigned to a user. You can
customize dashboards. See Customizing Dashboards (on page 131).
The Project Workspace page is the default dashboard for a project and provides many
categories of project information, also shown in portlets. Each team member views the
same project-related portlets, including Project Milestone Status, Activities Behind
Schedule, Project Documents, and so on.
The two primary types of dashboards appearing on the Dashboards page or Project
Workspace page, enable you to view and manage project data based on your module
access, security privileges, and role relative to a project.
Note: When multiple projects are open on the Project Workspace
page in the Projects section , the Select Project list displays each
one. You must select the project you want to work with from the
Select Project list. If a single project is open, the Select Project list
does not appear. Any action you perform and all data that
appear on the page apply to the selected project only.
The Workgroups page is a collaborative space for people working on a project. It is a
subset of the workspace for an individual project. Project members can use the
Workgroups page to view activities, issues, and documents (requires optional document
repository) relevant to their area of the project.

Dashboards and Workspaces
129
Global Dashboards
As an administrator, you can create one or more global dashboards, customized for your
company's business needs, that apply to all P6 users. If your administrator creates global
dashboards and assigns one or more to your view:
they are automatically displayed as tabs on the Dashboards page when you login to
P6
the title of the global dashboard is determined by the administrator, for example,
Personal Workspace or Special Projects
only users with the required security privilege can modify the global dashboard's
content, layout, or access
If the administrator who created the global dashboard did not select the Restrict users
from changing the dashboard filter option on the Content tab of the Dashboard Details
page, you can specify your own dashboard filter in the Filter by field on the dashboard.
To hide a global dashboard, choose Manage Dashboards from the Dashboards menu in
the global navigation bar, then clear the dashboard's corresponding check box in the
Displayed Dashboards section.
Multi-user Dashboards
As an administrator, you can configure one or more multi-user dashboards, customized
for your needs. If you assign a multi-user dashboard to a user interface view, only users
who have access to the dashboard as specified in the Access tab of Dashboard
Preferences can view the dashboard.
Using Dashboards
As an administrator, you can configure and assign a user interface view for all users, even
new users. As users, you can access global and multi-user dashboards as defined in your
view when you log into P6. If you have the rights to access the Manage Dashboards
page, you can create and display the dashboards you want to view. On the Manage
Dashboards page, dashboards currently displayed are listed in the Displayed
Dashboards section; dashboards you have access to, but that are currently not
displayed, are listed in the Available Dashboards section. If you do not have the rights to
access the Manage Dashboards page, you can view only the dashboards included in
your view.
You can customize the Project Workspace page only if you have the appropriate
module access and security privilege.

130
Caution: Exercise caution whenever you delete a multi-user
dashboard. Other users might be using it and should be notified
before you make such a change.
Table of Screen Highlights
Item Description
Customize link: On the Dashboards page, select a dashboard and click
Customize to open a page with three tabs where you can configure the
dashboard's settings such as its portlet content, size and positioning in the
dashboard layout, and user access.
Content tab: In this example, the General and Personal Information
sections are expanded (the other sections are collapsed). This shows the
available fields and options you can configure. Select a portlet's check
box to show it on the dashboard.
Custom Portlets: Click the Add link to create your own portlets on the
dashboard.
Layout Tab: Use the arrow icons or drag and drop to change the position
of portlets within the dashboard. You can also choose from Narrow or
Wide size.
Access Tab: Use the common controls to select the user accounts
permitted to view this dashboard. You can also enable all users to view
the dashboard or restrict access to only you, the current user.

Dashboards and Workspaces
131
Creating Dashboards
Create dashboards to display portlets and data that pertain to your role. Multi-user
dashboards are also available, including global dashboards for all users to share data.
To create a dashboard:
1) Click the Dashboards menu and select Manage Dashboards.
2) On the Manage Dashboards page, click Create Dashboard.
3) On the Copy from Existing Dashboard dialog box:
a. Select Default Dashboard or an existing dashboard to use as the basis for your new
dashboard.
b. Click OK.
4) On the New Dashboard page, click the Content tab.
5) On the Content tab:
a. Expand the General section.
b. In the Dashboard Title field, enter a name.
6) On the New Dashboard page, click Save and Close.
Tips
The New Dashboard page is identical to the more commonly referenced Customize
Dashboard Page.
After creating a new dashboard, you will likely need to customize it, which consists of
configuring its content, layout, and user access settings. For help customizing
dashboards, see Customizing Dashboards (on page 131).
Customizing Dashboards
You can customize dashboards to display and organize the content you want to view.
For each user-defined or multi-user dashboard you create, you can customize the
dashboard's content, layout, and access.
To customize dashboards:
1) Click Dashboards.
2) On the Dashboards page, select a dashboard.
3) On the dashboard, click Customize.
4) On the Customize page:
a. Click the Content tab and configure what portlets display on the dashboard
page. For help, see Configuring Dashboard Content (on page 132).
b. Click the Layout tab and customize the display of the dashboard portlets. For help,
see Configuring Dashboard Layout (on page 133).
c. Click the Access tab and select an option to determine which users can use the
dashboard. For help, see Configuring Dashboard Access (on page 132).
d. Click Save and Close.

132
Tips
You can also select a dashboard on the Manage Dashboards page to customize it.
You can always customize your private dashboards, as well as multi-user dashboards
you create. You cannot customize multi-user dashboards created by another user.
You must have the required security privilege to customize a global dashboard. For
global and multi-user dashboards you have access to view, but not edit, you might
be able to specify a user filter that overrides the dashboard filter specified by the
dashboard's owner. Be aware this may lead to unexpected results.
Configuring Dashboard Content
You can determine which portlets appear on a dashboard and how they display their
information. Your changes apply to all users of the current dashboard.
To customize dashboard content (select the portlets you want to appear):
1) Click Dashboards.
2) On the Dashboards page, select a dashboard tab and click Customize.
3) On the Dashboard Details page, click the Content tab.
4) On the Content tab:
a. Expand the General section to modify the dashboard title and its filters, or to
specify the maximum number of rows displayed in portlets.
b. Expand the other sections representing the data of interest to users of this
dashboard. For example, Resources.
c. Select the portlets you want to display by checking the box adjacent to the name
of the portlet.
d. For portfolio view and custom portlets, click Add.
e. Expand a portlet name to configure its options, fields, and lists that determine what
will display on the dashboard. Click Customize if available for the selected portlet.
5) On the Customize page, click Save and Close.
Tips
The default maximum number of portlets you can display in a dashboard is twelve;
however, your administrator can specify a different maximum.
Configuring Dashboard Access
You can make a dashboard available only to you (user dashboard), to all users (global
dashboard), or to a list of users you specify (multi-user dashboard).
To configure dashboard access:
1) Click Dashboards.
2) On the Dashboards page, select a dashboard tab and click Customize.
3) On the Customize page, click the Access tab.

Dashboards and Workspaces
133
4) On the Access tab, select an option to determine which users can use the
dashboard. If you select List of Users, use the common set of controls to specify which
user accounts can use the dashboard.
Tips
You must have the appropriate security privilege to specify access. You cannot
change the access setting for a multi-user dashboard created by another user.
Configuring Dashboard Filters
For multi-user and global dashboards, the dashboard owner can elect to restrict users
from changing the dashboard filter. If the dashboard owner selects this option, the
dashboard displays data according to the specified dashboard filter. If the dashboard
owner does not select to restrict users from changing the dashboard filter, users can
select their own filter for the dashboard.
To configure dashboard filters:
1) Click Dashboards.
2) On the Dashboards page, select a dashboard tab.
3) On the dashboard tab, click Filter by at the top of the tab and select a filter from
the dialog box.
Tips
You can also change the filter from the General section on the Content tab of the
Customize page.
Configuring Dashboard Layout
You can arrange the portlets on the dashboard to accommodate your viewing
preferences.
To configure the layout of the portlets on a dashboard:
1) Click Dashboards.
2) On the Dashboards page, select a dashboard.
3) On the dashboard, click Customize.
4) On the Dashboard Details page, click the Layout tab.
5) On the Layout tab:
a. Select the Narrow or Wide option for each portlet to make it one or two columns
wide.
b. Select a portlet and click the up, down, left, or right arrows; or, drag and drop the
portlet to change its position.
c. Click Save and Close.

134
Showing and Hiding Dashboards
Determine which of the dashboards available to you should appear on your Dashboards
page as its own separate tab.
To show or hide dashboards:
1) Click the Dashboards menu and select Manage Dashboards.
2) On the Manage Dashboards page, expand both the Displayed Dashboards and the
Available Dashboards sections.
3) In the Available Dashboards section, select the dashboards you want to show on the
Dashboards page. When you check a dashboard, it immediately moves to the
Displayed Dashboards section.
4) In the Displayed Dashboards section:
a. Select the dashboards you want to hide from the Dashboards page. When you
check a dashboard, it immediately moves back to the Available Dashboards
section.
b. If more than one dashboard appears, click the up and down arrows to customize
their order of appearance.
5) Click Dashboards to view the results of your selections on the Dashboards page.
Tips
There is no need to save your changes on this page; they are automatically applied.
Click Delete to permanently delete the dashboards you created or have permissions
to delete.
If there is not enough room to display all the dashboard tabs on the Dashboards
page, a black triangular arrow appears after the last tab. Click it to view a list of
dashboards from which you can make a selection.
Caution: Exercise caution whenever you delete dashboards. Other
users might be using them and should be notified before you make
such a change.
Working with Workflows
Use workflows to route business processes such as project initiation requests through your
organization to gather information and visibility before a go/no go decision is made.
Template data, routing designators, and approval rules can be set for each stage of a
workflow. To illustrate these options, pretend we have a workflow involving five key
approval managers. You can define the workflow such that all five must approve and in
what sequence, if any. A much more relaxed approval rule would require only one out of
the five to approve.

Dashboards and Workspaces
135
Workflows begin in BPM where your administrator defines the human tasks involved and
assigns them to specific users, a role, or a group. An actual business need kicks off a
separate instance of the workflow and its human tasks are automatically routed to their
users, roles, or groups.
When a specific user or any user assigned to a role or group logs into P6, the Workflow
portlet on their dashboard will display their relevant tasks at this stage of the workflow, as
authenticated by BPM. As a workflow participant, you can select a task in the workflow
instance and claim ownership for it. This means you will be responsible for performing the
task. The application refreshes itself to show only the actions permitted for this particular
stage of the workflow for you (the currently logged in user).

136
Table 1 of 2: Key Workflow Screen Elements
Item Description
Setup and Configuration: After your administrator sets up BPM, configure
a dashboard to display the Workflows portlet.
Action Required Tab: This tab shows the tasks important to you (the
currently logged in user).
My Workflows Tab: This tab enables you to view all workflows according
to role and status filters you can set.
Initiate a Workflow: Click Initiate a Workflow to start a new instance of
a workflow based on a predesigned template.

Dashboards and Workspaces
137
Table 2 of 2: Key Workflow Screen Elements
Item Description
Workflow Form: Most workflows include forms which enable you to
update the progress of each task. In general, possible actions you can
perform on a human task during the routing of a workflow include:
Escalate, Suspend, Purge, Delete, Withdraw, Submit, Reassign, Claim,
Approve, and Reject.
Note: For tasks with no associated form, this icon is disabled. To perform
an action on a workflow task with no associated form, log into BPM and
use its Actions menu. It is also possible to design a solution using the P6
Integration API.
Workflow Status: The Workflow Status image is accessible from either tab
in the Workflows portlet. It shows the sequence of events in the workflow.
Items shown with a green border indicate the furthest level of progress
within the workflow. The current status of the workflow corresponds with
the last item to "go green".
Sample Workflow: A basic workflow image with tasks for an engineer, a
second task for an assigned role, and a third task for a manager to
complete the workflow. The current workflow task is Third User Task
because it is the last item in the sequence that has a green outline.
Workflow History: View a chronological sequence of all the previous
activities, users, and stages in the current workflow.
About Project Workspaces
A project workspace is a type of dashboard exclusively designed for your entire team to
share access to only the data needed for a single project. Configure workspaces to
display one or more smaller windows, called portlets, each with its own particular subject
matter or theme. Project workspaces can also include one or more child workgroups,
also displayed in a portlet.
Notes:
Although the user interface for the P6 web application
distinguishes between dashboards, project workspaces,
personal workspaces, and workgroups, they are all essentially
the same type of object: a customizable page made up of the
portlets you want to view. One major differentiating factor is the
source of information to appear within the portlets in each type
of dashboard.

138
Project workspaces and workgroups portlets are not available
for project templates.
Working with Project Workspaces
The Workspace page is the home page for the project and provides many categories of
project information. Each team member views the same project-related information,
including project milestone status, activities behind schedule, project documents, and so
on. You can access a project's workspace by opening a project or group of projects,
and then clicking Workspace on the project navigation toolbar.
Note: Project Workspace portlets display data for the selected
project only. When multiple projects are open, you must choose
the project you want to work with in the Select Project list at the top
right of the Project Workspace page. When a single project is
open, the Select Project list does not appear.
Customizing Project Workspace
Customize each project's workspace to determine which portlets are visible on its
Workspace page and how they display.
To customize a project's workspace:
1) Open one or more projects in the Projects section using one of the following methods:
Click Projects to open the last project or group of projects you were working
with.
Click the Projects menu and choose one of the most-recently used projects
or group of projects.
Click the Projects menu and choose Open Projects to select a project or
group of projects by portfolio type, EPS node, or project code.
2) On the Projects navigation bar, click Workspace.
3) On the Workspace page:
a. If more than one project is open, select a project from the Select Projects list.
b. Click Customize.
4) On the Customize page:
a. Click the Content tab and select the portlets you want to appear on the
Workspace page. See Configuring Workspace Content (on page 139).
b. Click the Layout tab and customize the size and position of the portlets. See
Configuring Workspace Layout (on page 139).
c. Click Save and Close when finished.

Dashboards and Workspaces
139
Configuring Workspace Content
You can determine what portlets display on the Workspace page and how they display
their information.
To customize workspace content:
1) Open one or more projects in the Projects section using one of the following methods:
Click Projects to open the last project or group of projects you were working
with.
Click the Projects menu and choose one of the most-recently used projects
or group of projects.
Click the Projects menu and choose Open Projects to select a project or
group of projects by portfolio type, EPS node, or project code.
2) On the Projects navigation bar, click Workspace.
3) On the Workspace page:
a. If more than one project is open, select a project from the Select Projects list.
b. Click Customize.
4) On the Customize page, click the Content tab.
5) On the Content tab:
a. Expand the sections you want to configure.
b. Select the portlets you want to appear on the Workspace page.
c. If you select a portlet with additional options, click to expand it and configure
the options or fields.
d. (Optional) Add a custom portlet. See Creating Custom Portlets (on page 171).
6) On the Customize page, click Save and Close.
Tips
Some portlets offer additional customization options. See Customizing Project Statistics
(on page 143), Customizing My Risks (see "Customizing the My Risks Portlet" on page
159), and Customizing Project Issues (on page 339).
In the Performance Threshold section, if the value calculated for the project is:
Greater than the critical value, the status will be critical .
Greater than the warning value and less than the critical value, the status will be
warning .
Less than the exceptional value and less than the warning value, the status will be
acceptable .
Greater than the exceptional value, the status will be exceptional .
Configuring Workspace Layout
You can arrange the portlets on your workspace to accommodate your viewing
preferences.

140
To configure workspace layout:
1) Open one or more projects in the Projects section using one of the following methods:
Click Projects to open the last project or group of projects you were working
with.
Click the Projects menu and choose one of the most-recently used projects
or group of projects.
Click the Projects menu and choose Open Projects to select a project or
group of projects by portfolio type, EPS node, or project code.
2) On the Projects navigation bar, click Workspace.
3) On the Workspace page, select a project from the Select Project list if more than one
project is open and click Customize.
4) On the Customize page, click the Layout tab.
5) On the Layout tab:
a. Select the Narrow or Wide option for each portlet to make it one or two columns
wide.
b. Select a portlet and click the movement arrows to determine where it will sit on the
Workspace page.
c. Click Save and Close.
Sending E-Mail to Project Resources
You can send e-mail to the resources listed for a project.
To send e-mail to project resources:
1) Open one or more projects in the Projects section using one of the following methods:
Click Projects to open the last project or group of projects you were working
with.
Click the Projects menu and choose one of the most-recently used projects
or group of projects.
Click the Projects menu and choose Open Projects to select a project or
group of projects by portfolio type, EPS node, or project code.
2) On the Projects navigation bar, click Workspace.
3) On the Workspace page:
a. If more than one project is open, select a project from the Select Projects list.
b. Expand the Communication Center portlet.
4) In the Communication Center portlet:
a. Click to expand a project and view its assigned resources.
b. Select the check box for each resource you want to add to the mailing list. Each
name you select will appear in the e-mail message's distribution list (the To: field).
c. On the E-mail tab, click the Send an e-mail link.

Dashboards and Workspaces
141
5) In the E-mail dialog box:
a. Edit the recipients, subject, and message text if needed.
b. Click Send E-mail.
Tips
You can also send e-mail to project resources from the Communication Center portlet
on the Dashboards page.
Select the check box next to the project name to automatically select all resources
listed. Clear the same check box to automatically clear all resources.
You must have an e-mail address listed in your user account to send e-mail.
About Project Performance Metrics
An array of performance metrics can be employed to measure project success against
time, cost, and other standards. Baselines are also often used to measure how a project
is progressing.
Project performance ratings are determined based on thresholds set for each of three
metrics: schedule, earned value, and index. Project health is calculated based on these
schedule performance thresholds.
Assessing Project Performance
You can use the workspace to quickly measure project performance. You can measure
project earned value, schedule, index, or statistics performance according to both
project cost and schedule.
To assess project performance:
1) Open one or more projects in the Projects section using one of the following methods:
Click Projects to open the last project or group of projects you were working
with.
Click the Projects menu and choose one of the most-recently used projects
or group of projects.
Click the Projects menu and choose Open Projects to select a project or
group of projects by portfolio type, EPS node, or project code.
2) On the Projects navigation bar, click Workspace.
3) On the Workspace page:
a. If more than one project is open, select a project from the Select Projects list.
b. Expand the Earned Value Performance, Schedule Performance, Index
Performance, or Project Statistics portlet and select a project to see its individual
performance.
Tips
If applicable, you can continue to follow the WBS down its line of children to view
individual WBS performance.

142
If the portlet is not available, add it to the workspace. See Configuring Workspace
Content (on page 139).
You can also assess project performance from the Performance or Statistics portlets
on the Dashboards page.
Assessing Project Health
You can use the workspace to quickly determine the health of a project and identify
areas where you might need to focus attention.
To assess project health:
1) Open one or more projects in the Projects section using one of the following methods:
Click Projects to open the last project or group of projects you were working
with.
Click the Projects menu and choose one of the most-recently used projects
or group of projects.
Click the Projects menu and choose Open Projects to select a project or
group of projects by portfolio type, EPS node, or project code.
2) On the Projects navigation bar, click Workspace.
3) On the Workspace page:
a. If more than one project is open, select a project from the Select Projects list.
b. Expand the Project Health portlet to see a quick summarization of the project.
Tips
If the portlet is not available, add it to the workspace. See Configuring Workspace
Content (on page 139).
You can also assess project health from the Project Health portlet on the Dashboards
page.

143
Customizing Project Statistics
Customize project statistics to define how columns and groups are displayed in the
workspace.
To customize project statistics:
1) Open one or more projects in the Projects section using one of the following methods:
Click Projects to open the last project or group of projects you were working
with.
Click the Projects menu and choose one of the most-recently used projects
or group of projects.
Click the Projects menu and choose Open Projects to select a project or
group of projects by portfolio type, EPS node, or project code.
2) On the Projects navigation bar, click Workspace.
3) On the Workspace page:
a. If more than one project is open, select a project from the Select Projects list.
b. Click Customize.
4) On the Customize page, click the Content tab.
5) On the Content tab, expand the Project Performance section and expand Project
Statistics.
6) In the Project Statistics section, click Customize Columns.
7) In the Customize Project Statistics dialog box, click the Columns tab.
8) On the Columns tab:
a. Configure the columns in the Selected Columns list. See Customizing Selected Lists
(see "Configuring Columns or Values" on page 91).
b. Select options from each list.
9) In the Customize Project Statistics dialog box, click the Group tab.
10) On the Group tab, repeat the following for each level you want to customize:
a. Select options from the lists for each Level.
b. Select or clear the options.
11) In the Customize Project Statistics dialog box, click Save.
12) On the Content tab, click Save and Close.
Tips
1) You can also customize project statistics columns from the Project Statistics portlet of
the Workspace page or the Project Statistics portlet of the Dashboards page.
Identifying Critical Activities Behind Schedule
You can use the workspace to identify activities that have zero or negative float and a
negative finish date variance.
To identify critical activities behind schedule:

144
1) Open one or more projects in the Projects section using one of the following methods:
Click Projects to open the last project or group of projects you were working
with.
Click the Projects menu and choose one of the most-recently used projects
or group of projects.
Click the Projects menu and choose Open Projects to select a project or
group of projects by portfolio type, EPS node, or project code.
2) On the Projects navigation bar, click Workspace.
3) On the Workspace page:
a. If more than one project is open, select a project from the Select Projects list.
b. Expand the Critical Activities Behind Schedule portlet and select an activity to see
its details.
Tips
If the Critical Activities Behind Schedule portlet is not available, add it to the workspace.
See Configuring Workspace Content (on page 139).
About Performance Thresholds
To help you assess the relative performance, earned value, index, and other calculations
for a WBS, project, or portfolio, P6 includes performance thresholds with visual indicators.
These thresholds capture the current calculation, variance, or metric and re-routes it into
one of four ranges or "buckets" as follows:
Exceptional: Indicates that the metric falls into a range your organization
considers better than normal or exceeding expectations.
Acceptable: Indicates that the metric falls into a range your organization
considers aligned with normal or within expectations.
Warning: Indicates that the metric falls into a range your organization considers
below normal. The project may need attention.
Critical: Indicates that the metric falls into a range your organization considers
far below normal. The project likely requires significant corrective action.
Instead of each project member assessing a variance of, say 2.9%, and wondering if that
is good or bad, thresholds will assign an easily recognized visual indicator based on
standards and business goals at your organization. With thresholds, everyone can agree
what 2.9% under means.
As an example, if you consider falling 50 days behind schedule to be critical, set the
critical thresholds setting to 50 days. For each performance metric, you can specify the
values used to determine if the result is exceptional, acceptable, warning, or critical.
Project health is calculated based on performance schedule thresholds described in this
topic.

Dashboards and Workspaces
145
Note: The same metric result may be Acceptable for one
project and a Warning for another.
Working with Performance Thresholds
Project performance ratings are determined based on thresholds set for each of three
metrics: schedule, earned value, and index. Project health is calculated based on the
performance schedule thresholds. Use the Workspace page to set threshold values to
aid in evaluating progress against plans for each specific project.
For each performance metric, you can specify the values used to determine if the status
of a project is exceptional, acceptable, warning, or critical. For example, if you want to
raise a warning flag when the project Cost Performance Index (CPI) falls 5% below 1, set
the CPI warning threshold to 5 for the index metric. If the project CPI falls between 5%
below 1 and the value set for the critical threshold, the project status will be displayed as
Warning in the Index Performance portlet on the Workspace page.
In the Performance Threshold section on the Content tab of the Project Workspace
Details page, if the value calculated for the project is:
Greater than the critical value, the status will be critical .
Greater than the warning value and less than the critical value, the status will be
warning .
Less than the exceptional value and less than the warning value, the status will be
acceptable .
Greater than the exceptional value, the status will be exceptional .
About Milestones
A milestone represents any significant event, goal, or gate in a project. Although P6
considers them a type of activity, milestones have zero duration; at any given moment
they are either achieved or not. Some examples of milestones in an office building
addition project might include the following:
project definition complete
structure complete
end bidding process.
Milestones can also be assigned at the WBS-level, and each one given a weight which
indicates its importance to the project schedule. When you mark a milestone as
complete, the weight is used to calculate the performance percent complete of all
activities included in the WBS level.
During project planning, you will want to identify the major milestones as they will help
you monitor the project's progress.
Sending E-Mail about Milestones
You can send an e-mail about the major goals in a project. This includes activities of type
milestone but not WBS milestones.

146
To send e-mail about milestones:
1) Open one or more projects in the Projects section using one of the following methods:
Click Projects to open the last project or group of projects you were working
with.
Click the Projects menu and choose one of the most-recently used projects
or group of projects.
Click the Projects menu and choose Open Projects to select a project or
group of projects by portfolio type, EPS node, or project code.
2) On the Projects navigation bar, click Workspace.
3) On the Workspace page:
a. If more than one project is open, select a project from the Select Projects list.
b. Expand the Milestone Status portlet and click E-Mail for one of the milestones.
4) In the E-mail dialog box:
a. Edit the recipients, subject, and message text if needed.
b. Click Send E-mail.
About Cost Performance Index (CPI)
Cost Performance Index (CPI) is a measure of the value of work accomplished as a
percentage of the actual costs. In this way, CPI helps you assess spending versus budget.
The CPI is computed as CPI equals Earned Value Cost divided by Actual Cost. A CPI
threshold value is expressed as a ratio. A value less than one indicates that actual costs
have exceeded the value of work performed. If the lower threshold value is one, an issue
is generated whenever the actual costs exceed the value of the work performed.
About Schedule Performance Index (SPI)
Schedule Performance Index (SPI) is a measure of the work accomplished as a
percentage of the work scheduled, SPI indicates whether you are meeting earned and
planned values within your schedule.
SPI threshold values are expressed as ratios, where SPI is equal to Earned Value Cost
divided by Planned Value Cost. A value less than one indicates that less work was
actually performed than was scheduled. If the threshold value is one, the work
performed is aligned with the expected cost of performing that work according to the
schedule.
About To-Complete Performance Index (TCPI)
The To-Complete Performance Index (TCPI) is a calculated projection of the cost
performance that must be achieved on the remaining work to meet recognized business
goals, such as the Budget at Completion (BAC) or the Estimate at Completion (EAC).
TCPI is essentially a ratio of the remaining work to the remaining funds. It enables a
project manager to determine the level of performance needed to achieve the cost or
time objectives.

Dashboards and Workspaces
147
Based on the BAC, TCPI is calculated as (Budget at Completion minus Earned Value)
divided by (Budget at Completion minus Actual Cost). Based on the EAC, TCPI is
calculated as (Budget at Completion minus Earned Value) divided by (Estimate at
Completion minus Actual Cost).
Example: During the course of a project, the project manager (PM)
determines that the sum of all the budgets for the work to-date, the
total planned value, exceeds the business goals of the
organization. The Budget at Completion (BAC) is no longer a
realistic goal. The PM develops a projected Estimate at
Completion (EAC) that replaces the BAC as the new cost
performance goal. The PM uses the forecasted EAC minus AC for
the funds remaining denominator in the TCPI equation.
About Contract Management
Oracle Primavera Contract Management is a multi-user, multi-project database that
manages all aspects of contract control including changes and submittals. It can be
used in conjunction with P6 EPPM.
Essential features include:
Provides information to keep contracts on-time and within budget
Enables you to cross-reference and link documents for quick, easy retrieval
Maintains historical data that can be used for the life of the project and referenced in
future projects
Aids in resolving disputes or claims
Working with Contract Management
If your P6 deployment is integrated with Contract Management, you can launch the
Contract Management Control Center from the Workspace page. In addition, when
your project is linked to a Contract Management project, you can view up-to-date
Contract Management information for the project, such as submittals or requests for
information, directly within portlets on the Workspace page.
You can select up to eight Contract Management portlets to display on the Workspace
page:
Contract Documents
Contract Issues
Contract Reports
Cost Worksheet
Request for Information (RFI)
RFI Turnaround Time
Safety
Submittals

148
Click on items or sections in the portlets to launch Contract Management and view
detailed information. For example, in the Request for Information (RFI) portlet, you can
click a section of the chart, such as OPN, to launch Contract Management and view a
list of all requests with an Open status.
Notes:
The Cost Worksheet portlet is also available in the Dashboards
section and shows data for multiple projects useful to users with
interests that extend beyond the project-specific context.
If your user name and password for Contract Management and
P6 are the same, you can immediately access information in
Contract Management. If you do not have the same user
name and password, the Login page appears, where you must
type a valid Contract Management user name and password.
Opening the Contract Management Control Center
If your organization is set up to access the Contract Management application, you can
launch the application from the Project Workspace. Additionally, if your project is linked
to a Contract Management project, you can also view up-to-date information such as
submittals or requests for information for the project within portlets on the Project
Workspace page.
To open the Contract Management Control Center:
1) Open one or more projects in the Projects section using one of the following methods:
Click Projects to open the last project or group of projects you were working
with.
Click the Projects menu and choose one of the most-recently used projects
or group of projects.
Click the Projects menu and choose Open Projects to select a project or
group of projects by portfolio type, EPS node, or project code.
2) On the Projects navigation bar, click Workspace.
3) On the Workspace page, click Launch Contract Management.
4) On the Contract Management Logon page, log on using your Contract Management
user name.
Linking P6 and Contract Management Projects
When the P6 and Contract Management applications are linked, you can then link a
specific project in P6 to a Contract Management project. This will enable you to view
up-to-date contractual information for the project within portlets.
To link a P6project to a Contract Management project:
1) Click Projects.

Dashboards and Workspaces
149
2) On the Projects navigation bar, click EPS.
3) On the EPS page:
a. Select a project.
b. Click the Actions menu and select Set Project Preferences....
4) In the Project Preferences dialog box, click the Contract Management tab.
5) On the Contract Management tab, click Group Name: Project Name .
6) In the Primavera P6 dialog box, log on to Contract Management.
7) In the Select Project and Group dialog box, expand a project, select a group, and
click OK.
8) In the Project Preferences dialog box, click Save to continue working or click Save
and Close if you are finished.
Tips
To link the project to a Contract Management project, you must have a valid user name
and password. If you have a Contract Management user name and password that is the
same as the user name and password with which you are currently logged in to P6, you
are not prompted to login again. If you do not have the same user name and password
for both applications, you must enter a valid Contract Management user name and
password in the Primavera P6 dialog box.
Linking P6/P6 Professional and Contract Management Applications
Perform the steps below to link P6 and P6 Professional to Contract Management. This link
at the application level allows you to establish links at the project level. When the
applications and projects are linked, P6/P6 Professional users can directly navigate to, or
directly show data from, the Contract Management application.
To link P6/P6 Professional to Contract Management:
1) Click the Administer menu and select Application Settings.
2) On the Application Settings pane, click the General tab.
3) On the General tab:
a. Enter a URL in the Contract Management URL field of the Contract Management
section.
b. Click Save and Close.
About Project Workgroups
The Project Workgroup Workspace page (or Workgroup Workspace) is a collaborative
space for people working on a project. It is a subset of the workspace for an individual
project. Project members can use the Workgroup Workspace to view documents, issues,
and other information relevant to their area of the project.

150
Working with Workgroups
Workgroups provide a way for a team to focus on specific project activity, issue, and
document information visible inside these three portlets found on the Workgroup
Workspace page:
Activities Portlet of the Workgroup Workspace Page
Issues Portlet of the Workgroup Workspace Page
Documents Portlet of the Workgroup Workspace Page
The data in each portlet inside a workgroup portlet is specific to the project workgroup or
to activities assigned to the workgroup. The portlets appear on a special Workspace of
Workgroup page showing the name of the workgroup. For example, if your workgroup is
called Team A, you would click the Team A link in the Workgroups portlet to open the
Workspace of Team A page.
Note: The Documents portlet is only available when the optional
Content Repository feature is enabled.
Assigning Documents to Projects
You can move documents from a workgroup to a project.
To assign documents to a project:
1) Open one or more projects in the Projects section using one of the following methods:
Click Projects to open the last project or group of projects you were working
with.
Click the Projects menu and choose one of the most-recently used projects
or group of projects.
Click the Projects menu and choose Open Projects to select a project or
group of projects by portfolio type, EPS node, or project code.
2) On the Projects navigation bar, click Workspace.
3) On the Workspace page:
a. If more than one project is open, select a project from the Select Projects list.
b. Expand the Workgroups portlet and select a workgroup.
4) On the Workgroup Workspace page, expand the Documents portlet and click the
Workgroup tab.
5) On the Workgroup tab, select a document and click Assign to Project.
6) In the Select Project dialog box, select a project and click OK.
Tips
The Assign to Project option is disabled if the document is already assigned to a
project.
You can only assign documents to the project to which the workgroup was
associated.

Dashboards and Workspaces
151
If the Workgroups portlet is not available, add it to the workspace. See Configuring
Workspace Content (on page 139).
If the Documents portlet is not available, add it to the workspace. See Customizing
Workgroups (on page 151).
You can also access workgroups from the My Workgroups portlet of the Dashboards
page.
Creating Workgroups
Create workgroups as a focus area for issues, activities, and documents of a specific
project segment.
To create workgroups:
1) Open one or more projects in the Projects section using one of the following methods:
Click Projects to open the last project or group of projects you were working
with.
Click the Projects menu and choose one of the most-recently used projects
or group of projects.
Click the Projects menu and choose Open Projects to select a project or
group of projects by portfolio type, EPS node, or project code.
2) On the Projects navigation bar, click Workspace.
3) On the Workspace page:
a. If more than one project is open, select a project from the Select Projects list.
b. Expand the Workgroups portlet and click Add.
4) In the Add a Workgroup dialog box, enter a name in the Workgroup name field and
click Save.
Tips
If the Workgroups portlet is not available, add it to the workspace. See Configuring
Workspace Content (on page 139).
You can also access workgroups from the My Workgroups portlet of the Dashboards
page.
Customizing Workgroups
Customize workgroups to determine which portlets are visible on the Workgroup
Workspace page.
To customize workgroups:
1) Open one or more projects in the Projects section using one of the following methods:
Click Projects to open the last project or group of projects you were working
with.
Click the Projects menu and choose one of the most-recently used projects
or group of projects.

152
Click the Projects menu and choose Open Projects to select a project or
group of projects by portfolio type, EPS node, or project code.
2) On the Projects navigation bar, click Workspace.
3) On the Workspace page:
a. If more than one project is open, select a project from the Select Projects list.
b. Expand the Workgroups portlet and select a workgroup.
4) On the Workgroup Workspace page, click Customize.
5) On the Customize page, click the Content tab.
6) On the Content tab:
a. Select or clear the options to add or delete workgroup portlets.
b. Enter a value in the Maximum number of rows displayed in Workgroup lists field.
7) On the Customize page, click the Layout tab.
8) On the Layout tab:
a. Select the Narrow or Wide option for each portlet to make it one or two columns
wide.
b. Select a portlet and click the movement arrows to determine where it will sit on the
Workspace page.
9) On the Customize page, click Save and Close.
Tips
If you select the Issues portlet, you can click Customize to customize issue columns,
filters, groups, or charts.
If you select the Documents portlet, you can opt to show activity documents.
If the portlet is not available, add it to the workspace. See Configuring Workspace
Content (on page 139).
You can also access workgroups from the My Workgroups portlet of the Dashboards
page.
Assigning Workgroup Activities
Assign activities to a workgroup to relate them to a specific segment of a project.
To assign activities to a workgroup:
1) Open one or more projects in the Projects section using one of the following methods:
Click Projects to open the last project or group of projects you were working
with.
Click the Projects menu and choose one of the most-recently used projects
or group of projects.
Click the Projects menu and choose Open Projects to select a project or
group of projects by portfolio type, EPS node, or project code.
2) On the Projects navigation bar, click Workspace.

Dashboards and Workspaces
153
3) On the Workspace page:
a. If more than one project is open, select a project from the Select Projects list.
b. Expand the Workgroups portlet and select a workgroup.
4) On the Workgroup Workspace page, expand the Activities portlet.
5) In the Activities portlet, click Assign.
6) In the Select an Activity dialog box, assign activities and click Close.
Tips
Any issues and documents associated with the assigned activity are automatically
assigned to their respective portlets in the workgroup.
If the Workgroups portlet is not available, add it to the workspace. See Configuring
Workspace Content (on page 139).
If the Activities portlet is not available, add it to the workspace. See Customizing
Workgroups (on page 151).
You can also access workgroups from the My Workgroups portlet of the Dashboards
page.
Creating Workgroup Issues
Create workgroup issues to identify problems that must be addressed before a project
can be completed.
To create workgroup issues:
1) Open one or more projects in the Projects section using one of the following methods:
Click Projects to open the last project or group of projects you were working
with.
Click the Projects menu and choose one of the most-recently used projects
or group of projects.
Click the Projects menu and choose Open Projects to select a project or
group of projects by portfolio type, EPS node, or project code.
2) On the Projects navigation bar, click Workspace.
3) On the Workspace page:
a. If more than one project is open, select a project from the Select Projects list.
b. Expand the Workgroups portlet and select a workgroup.
4) On the Workgroup Workspace page, expand the Issues portlet.
5) In the Issues portlet, click Add and select a form from the dialog box.
6) On the Add Issue page, enter or select a value for each of the required fields and
click Save.
Tips
The Default Form, displays all issue fields. If no issue forms are assigned to the project,
the Default Form is the only form you can select.

154
If the Workgroups portlet is not available, add it to the workspace. See Configuring
Workspace Content (on page 139).
If the Issues portlet is not available, add it to the workspace. See Customizing
Workgroups (on page 151).
You can also access workgroups from the My Workgroups portlet of the Dashboards
page.
Sending E-Mail to Activity Resources
You can send e-mail to the resources listed for an activity.
To send e-mail to activity resources:
1) Open one or more projects in the Projects section using one of the following methods:
Click Projects to open the last project or group of projects you were working
with.
Click the Projects menu and choose one of the most-recently used projects
or group of projects.
Click the Projects menu and choose Open Projects to select a project or
group of projects by portfolio type, EPS node, or project code.
2) On the Projects navigation bar, click Workspace.
3) On the Workspace page:
a. If more than one project is open, select a project from the Select Projects list.
b. Expand the Workgroups portlet and select a workgroup.
4) On the Workgroup Workspace page, expand the Activities portlet and select an
activity.
5) On the Activity Form page, expand the Resources section and click E-mail these
resources.
6) In the E-mail dialog box:
a. Edit the recipient list, message, and subject as needed.
b. Click Send E-mail.
Tips
You must have an e-mail address listed in you user profile to send an e-mail.
If the Workgroups portlet is not available, add it to the workspace. See Configuring
Workspace Content (on page 139).
If the Activities portlet is not available, add it to the workspace. See Customizing
Workgroups (on page 151).
You can also e-mail resources from the Activity Details page of the Open Requests for
Resources portlet of the Dashboards page.

Dashboards and Workspaces
155
About Portlets
Portlets are small expandable windows representing a specific theme or particular
subject matter. They are only available on dashboards, project workspaces, or
workgroup pages. Portlets provide a concise way to organize, present, and assess
project data within a single page and also offer tools for adding, modifying, and
personalizing portfolio, project, and resource data. Portlets on shared dashboards or
workspaces provide a centralized place for collaborating with other users.
The same portlet might display information differently depending on the page on which
it appears. On a dashboard, portlets display data based on association, ownership, or
applied filters. On a project workspace, portlets reflect data for the open project. On a
workgroup workspace, portlets show information belonging to that workgroup.
List of Portlets
Listed below, grouped by theme, are all possible portlets available on the Dashboards
page and Project Workspace page. The portlets available in your configuration may
vary. Click the portlet name to view a description of the portlet, the steps required to
navigate to it, and any related tasks you can perform using the portlet.
Dashboard Portlets:
Personal Data for the Currently Logged-In User
Communication Center Portlet of the Dashboards Page
My Activities Portlet
My Issues Portlet
My Projects Portlet
My Workgroups Portlet of the Dashboards Page
My Calendar Portlet
My Documents Portlet
My Risks Portlet
Portfolio Views
Portfolio View Portlet
Project Performance
Earned Value Performance Portlet of the Dashboards Page
Schedule Performance Portlet of the Dashboards Page
Index Performance Portlet of the Dashboards Page
Project Statistics Portlet
Project Health Portlet of the Dashboards Page
Project Notebooks Portlet of the Dashboards Page
Project Gantt Chart Portlet

156
Workflow
Workflows Portlet
Document Reviews Portlet
Resources
Open Requests for Resources Portlet
Resource Analysis Chart Portlet
Resource Team Summary Portlet
Custom Portlets
Custom Portlet
Contract Management
Cost Worksheet Portlet
Project Workspace Portlets:
Project Data for the Currently Selected Project
Project Documents Portlet of the Workspace Page (with Content Repository)
Project Documents Portlet of the Workspace Page (without Content Repository)
Project Risks Portlet
Project Issues Portlet of the Workspace Page
Notebook Topics Portlet of the Workspace Page
Overallocated Resources Portlet of the Workspace Page
Critical Activities Behind Schedule Portlet of the Workspace Page
Milestone Status Portlet of the Workspace Page
Custom Portlets
Custom Portlet
Contract Management
Contract Documents Portlet of the Workspace Page
Contract Issues Portlet of the Workspace Page
Contract Reports Portlet of the Workspace Page
Cost Worksheet Portlet
Request for Information (RFI) Portlet of the Workspace Page
RFI Turnaround Portlet of the Workspace Page
Safety Portlet
Submittals Portlet
Project Collaboration
Communication Center Portlet of the Workspace Page
Project Calendar Portlet of the Workspace Page

Dashboards and Workspaces
157
Workgroups Portlet of the Workspace Page
Activities Portlet of the Workgroup Workspace Page
Documents Portlet of the Workgroup Workspace Page
Issues Portlet of the Workgroup Workspace Page
Project Performance
Schedule Performance Portlet of the Workspace Page
Earned Value Performance Portlet of the Workspace Page
Index Performance Portlet of the Workspace Page
Project Statistics Portlet
Project Health Portlet of the Workspace Page


159
Customizing Portlets
In general, click Customize within a portlet to set options for it. The following tasks help
guide you through the steps to customize the specific portlets listed.
Customizing the My Risks Portlet
Customize the My Risks portlet to determine which columns and filters to apply to the
portlet.
To customize My Risks:
1) Click Dashboards.
2) On the Dashboards page, select a dashboard.
3) On the dashboard, expand the My Risks portlet and click Customize.
4) In the Customize Risks dialog box, click the Columns tab.
5) On the Columns tab, configure the columns in the Selected Columns list. See
Configuring Columns or Values (on page 91).
6) In the Customize Risks dialog box, click the Filter tab.
7) On the Filter tab:
a. Select an option from the Display list.
b. If applicable, select or clear the options.
8) In the Customize Risks dialog box, click Save.
Tips
You can also customize the risks that appear in the Project Risks portlet of the project's
Workspace page.
Customizing the Resource Analysis Chart Portlet
Customize the Resource Analysis Chart portlet to determine how information will display
in the portlet.
To customize the portlet:
1) Click Dashboards.
2) On the Dashboards page, select a dashboard.
3) On the dashboard, expand the Resource Analysis Chart portlet.
4) In the Resource Analysis Chart portlet:
a. In the Resource field, click Select a Resource and select a resource from the
dialog box.
b. In the Group by field, click Select Grouping and select a project code from the
dialog box.
c. Click Customize.
5) In the Customize chart dialog box:

160
a. Select a value in the Chart Type field.
b. Configure the other settings as needed.
c. Click Save.
Tips
You can also customize portlets from the Content tab of the Customize Dashboard page.
Customizing the Open Requests for Resources Portlet
Customize the Open Requests for Resources portlet to determine what information will
display in the portlet.
To customize the portlet:
1) Click Dashboards.
2) On the Dashboards page, select a dashboard tab and click Customize.
3) On the Customize page, click the Content tab.
4) On the Content tab, expand the Resources section and expand the Open Requests
for Resources section.
5) In the Open Requests for Resources section, configure the options, lists, and fields to
determine what will display in the portlet.
6) On the Customize page, click Save and Close.
Tips
You can also click Customize in the Open Requests for Resources portlet to access the
Customize page.
Customizing Portfolio View Portlets
Customize portfolio view portlets to determine what and how information will display in
the portlet.
To customize portfolio view portlets:
1) Click Dashboards.
2) On the Dashboards page, select a dashboard.
3) On the dashboard, expand the portfolio view portlet you want to customize and click
Customize.
4) In the Customize dialog box:
a. Configure the settings to determine the information that appears in the portfolio
view portlet. The settings vary based on your choice of chart, scorecard, or
histogram in the Type field.
b. Click Save.

Dashboards and Workspaces
161
Tips
For help customizing scorecards, see Customizing Scorecard Portfolio Views Portlets
(see "Customizing Scorecard Portfolio View Portlets" on page 161).
You can also customize Portfolio View portlets from the Content tab of the Customize
Dashboard page.
Customizing Scorecard Portfolio View Portlets
You can customize scorecard portfolio view portlets to reflect the data you need.
To customize a scorecard portfolio view portlet:
1) Click Dashboards.
2) On the Dashboards page, select a dashboard.
3) On the dashboard, expand a scorecard portfolio view portlet and click its Customize
link.
4) In the Customize dialog box, click the Columns tab.
5) On the Columns tab:
a. Select the columns you want to show in the scorecard using the common controls.
b. Specify values for the two sort fields.
c. Select the Show Project Requests check box to include potential project data.
6) In the Customize dialog box, click the Group tab.
7) On the Group tab, configure how you want to group the data in the scorecard using
common controls.
8) In the Customize dialog box, click Save.
Tips
You can also customize the portlet from the Content tab of the Dashboard Details page.
Analyzing Resource Team Usage in the Resource Team Summary Portlet
You can use the Resource Team Summary portlet to analyze resource team usage in a
spreadsheet or histogram.
To analyze resource team usage:
1) Click Dashboards.
2) On the Dashboards page, select a dashboard.
3) On the dashboard, expand the Resource Team Summary portlet.
4) In the Resource Team Summary portlet:
a. Click Filter by to select a resource team.
b. In the Resource column, click the link for a resource team.
5) On the Resource Usage page:
a. Select a Spreadsheet or Histogram display option.
b. Click Customize.

162
6) In the Customize dialog box:
a. Configure the Display, Timescale, and other options
b. Click Save.
7) Click Return one or more times to go back to the Resource Team Summary portlet
on a dashboard.
Tip
The same resource team usage data can also be viewed by selecting a resource team
on the Resource Usage tab of the Analysis page in the Resources section.
Creating Portfolio View Portlets
Create portfolio view portlets to display project portfolio data in a bubble chart, pie
chart, scorecard, histogram, side-by-side histogram, or stacked histogram portfolio view.
To create a portfolio view portlet:
1) Click Dashboards.
2) On the Dashboards page, select a dashboard.
3) On the dashboard, click Customize.
4) On the Customize page, click the Content tab.
5) On the Content tab, expand the Portfolio Views section and click the Add link.
6) In the Create View dialog box, select a new or existing portfolio view and click OK.
7) In the Portfolio Views section, expand the new view:
a. Enter a name in the Title field.
b. Select a portfolio view format from the Type list.
c. Configure the settings that vary based on your choice in the Type field. If you
selected Scorecard, click the Customize link to configure it.
8) On the Content tab, click Save and Close.
Tips
To show the portlet on the dashboard, select the check box near its name before you
click Save and Close. To remove the portlet from the dashboard, clear its check box.
To remove the portlet from appearing as a potential portfolio view, click the Remove
link.
Your security access settings determine if you can create new portlets based on new
or existing portfolio views.

163
Document Review and Workflow Portlets
The following topics apply to document reviews and workflows in portlets.
Participating in Document Reviews
If you have configured the optional Content Repository with P6, and you are assigned as
a reviewer for a specific document, you can review documents from the Document
Reviews portlet on a dashboard. As a reviewer, you can access review details, add
comments or attachments, and approve or reject the document.
To respond to a document review:
1) Click Dashboards.
2) On the Dashboards page, select a dashboard.
3) On the dashboard, expand the Document Reviews portlet and click the Action
Required tab.
4) On the Action Required tab:
a. Select a document to review.
b. Click View to view the document.
c. Click Details to view attachments and comments from previous reviewers.
d. Click Approve Document or Reject Document.
5) In the Approve Document Review or Reject Document Review dialog box:
a. Enter any supporting comments.
b. Attach any supporting documents.
c. Click Approve or Reject.
Tips
If the review type is set to Everyone Must Review in Sequence, the review will not
appear in subsequent reviewers' Action Required portlets until the document has
been approved by the previous reviewer.
If the Document Reviews portlet is not available, add it to the dashboard. For help,
see Configuring Dashboard Content (on page 132).
Terminating Document Reviews
You can terminate document reviews that you initiated.
To terminate a document review:
1) Click Dashboards.
2) On the Dashboards page, select a dashboard.
3) On the dashboard, expand the Document Reviews portlet.
4) In the Document Reviews portlet, click the My Reviews tab.
5) On the My Reviews tab:
a. Select the name of the document review you want to terminate.

164
b. Click Terminate.
Tips
If the portlet is not available, add it to the dashboard. For help, see Configuring
Dashboard Content (on page 132).
About Workflows
A workflow is an automated business process that routes information and tasks between
participants according to a defined set of procedures or rules designed to coordinate a
specific business goal. Workflows are primarily characterized by their level of procedural
automation involving one or more dynamic related series of processes, and their
combination of human and machine-based tasks involving interaction with software and
systems.
The following industry segments, marked by relatively high office labor costs and
transaction volume, have demonstrated successful workflow implementations:
insurance
banking
legal
general & administrative
design
engineering
manufacturing
Business process modeling and workflow automation allow transactions to be
conducted electronically without the need for manual intervention such as conducting
certain validations or re-keying data. When workflow IT systems are processing repetitive,
mundane, and often error-prone work, talented staff resources become available to
handle activities that add real value to the enterprise.
P6 includes a sample project initiation and review workflow used to evaluate proposed
work. It automates the process of reviewing and approving new project requests. You
can also create your own workflows implemented through the use of templates typically
created by your P6 administrator using BPM. Each workflow template defines the data,
business processes, review phases, and approval requirements for the varying types of
workflows specific to your organization. The necessary security privileges must be in place
for you to create, initiate, or participate in workflows.

Dashboards and Workspaces
165
Working with Workflows
Use workflows to route business processes such as project initiation requests through your
organization to gather information and visibility before a go/no go decision is made.
Template data, routing designators, and approval rules can be set for each stage of a
workflow. To illustrate these options, pretend we have a workflow involving five key
approval managers. You can define the workflow such that all five must approve and in
what sequence, if any. A much more relaxed approval rule would require only one out of
the five to approve.
Workflows begin in BPM where your administrator defines the human tasks involved and
assigns them to specific users, a role, or a group. An actual business need kicks off a
separate instance of the workflow and its human tasks are automatically routed to their
users, roles, or groups.

166
When a specific user or any user assigned to a role or group logs into P6, the Workflow
portlet on their dashboard will display their relevant tasks at this stage of the workflow, as
authenticated by BPM. As a workflow participant, you can select a task in the workflow
instance and claim ownership for it. This means you will be responsible for performing the
task. The application refreshes itself to show only the actions permitted for this particular
stage of the workflow for you (the currently logged in user).

Dashboards and Workspaces
167
Table 1 of 2: Key Workflow Screen Elements
Item Description
Setup and Configuration: After your administrator sets up BPM, configure
a dashboard to display the Workflows portlet.
Action Required Tab: This tab shows the tasks important to you (the
currently logged in user).
My Workflows Tab: This tab enables you to view all workflows according
to role and status filters you can set.
Initiate a Workflow: Click Initiate a Workflow to start a new instance of
a workflow based on a predesigned template.

168
Table 2 of 2: Key Workflow Screen Elements
Item Description
Workflow Form: Most workflows include forms which enable you to
update the progress of each task. In general, possible actions you can
perform on a human task during the routing of a workflow include:
Escalate, Suspend, Purge, Delete, Withdraw, Submit, Reassign, Claim,
Approve, and Reject.
Note: For tasks with no associated form, this icon is disabled. To perform
an action on a workflow task with no associated form, log into BPM and
use its Actions menu. It is also possible to design a solution using the P6
Integration API.
Workflow Status: The Workflow Status image is accessible from either tab
in the Workflows portlet. It shows the sequence of events in the workflow.
Items shown with a green border indicate the furthest level of progress
within the workflow. The current status of the workflow corresponds with
the last item to "go green".
Sample Workflow: A basic workflow image with tasks for an engineer, a
second task for an assigned role, and a third task for a manager to
complete the workflow. The current workflow task is Third User Task
because it is the last item in the sequence that has a green outline.
Workflow History: View a chronological sequence of all the previous
activities, users, and stages in the current workflow.
Participating in Workflows
All workflow tasks requiring your participation are listed in the Action Required tab of the
Workflows portlet on a dashboard. For example, you might be asked to evaluate new
project initiatives as part of a new project evaluation workflow.
The process form that accompanies each workflow task is based on the workflow type
and stage, so the information displayed might vary each time you perform this task.
Note: The Workflows portlet requires installation of BPM. See your
administrator.
To review a workflow task:
1) Click Dashboards.
2) On the Dashboards page, select a dashboard.
3) On the dashboard, expand the Workflows portlet.
4) In the Workflows portlet, click the Action Required tab.
5) On the Action Required tab, select a task and click View Form.

Dashboards and Workspaces
169
6) On the BPM Workflow Form dialog box, select an action to perform. The title and
available screen elements of this form vary depending on the selected workflow task
and stage.
7) Click Submit.
Linking the Cost Worksheet to Contract Management
You can link the Cost Worksheet portlet to Oracle Primavera to view cost data for
projects in a single Contract Management module database. Before you can link the
portlet to Contract Management, you must first enter a Contract Management URL in
the application and link a project to the Contract Management application. For help,
see Linking the Project Management Application to Contract Management (see "Linking
P6/P6 Professional and Contract Management Applications" on page 149) and Linking
Contract Management Data.
To link the portlet to Contract Management:
1) Click Dashboards.
2) On the Dashboards page, select a dashboard tab.
3) On the dashboard tab, click Customize.
4) On the Customize page, click the Content tab and expand the Contract
Management section.
5) In the Contract Management section:
a. Select Cost Worksheet and click to expand the additional options.
b. To enter a value in the Database Group Filter field, click Select Database Group
and select a group from the dialog box.
6) On the Content tab, click Save and Close.
7) On the dashboard tab, click Filter by.
8) In the Filter by dialog box, select a known project, portfolio, or group of projects by
code that includes one or more known projects linked to at least one Contract
Management project. Click OK.
9) On the dashboard tab, expand the Cost Worksheet portlet and log in to Contract
Management if prompted.
Tips
In order to access this portlet, you must have a valid Contract Management user name
and password. If you have a Contract Management user name and password that is the
same as the user name and password with which you are currently logged in to P6, you
are not prompted to login to Contract Management when you expand the Cost
Worksheet portlet.

170
Opening Projects from Dashboard Portlets
You can open projects from within certain project-related portlets such as My Projects or
Project Health. You must have OBS access, be the owner, or assigned as a resource or
activity owner in the project. In these portlets, wherever the project name appears as a
link, you can click it to open the project in the Projects section.
Note: Not all portlets allow you to open projects in this fashion. For
example, the Project Statistics and Schedule Performance portlets
will not open the project when its project link is clicked. Instead,
these portlets offer more detailed views into the data they
represent.
To open a project from within a portlet:
1) Click Dashboards.
2) On the Dashboards page, select a dashboard tab.
3) On the dashboard tab, expand the portlet and select a project.
Tips
In scorecard Portfolio View portlets, click next to the project you want to open.
In the Project Gantt Chart portlet, hold down the Ctrl key to select multiple projects
and click Open Projects in the portlet toolbar to open them.
Sending E-Mail to Resource Teams
You can send e-mail to an entire resource team of your choosing.
To send e-mail to a resource team:
1) Click Dashboards.
2) On the Dashboards page, select a dashboard tab.
3) On the dashboard tab, expand the Resource Team Summary portlet:
4) In the Resource Team Summary portlet:
a. Click Filter by and select the team to which you want to send an e-mail.
b. Click E-mail resource team.
5) In the E-mail dialog box:
a. Edit the recipient list, message, and subject as needed.
b. Click Send E-mail.
Tips
You must have an e-mail address listed in you user profile to send an e-mail.

Dashboards and Workspaces
171
Sending E-Mail Notifications about Resource Assignments
An automatic notification feature can be configured to send e-mail to the affected
resources when you add, change, or remove a resource assignment.
To configure P6 to automatically send e-mail about resource assignments:
1) Click the Administer menu and select My Preferences.
2) On the My Preferences page, click the Global tab.
3) On the Global tab, expand the General section.
4) In the General section:
a. Select the Send e-mail to resources upon adding or removing assignments option.
b. The system automatically selects the Prompt before sending e-mail option. Clear
the option if you do not want prompts.
5) On the Global tab, click Save and Close.
Tips
The address and subject line for the e-mail are generated based on the specific
assignment circumstances. For example, when you first assign a resource to an
activity, the e-mail subject line tells the resource they have been assigned and
provides the activity name. In all cases, the message text includes the project name,
resource start and finish dates, planned units, and planned units/time.
When the automatic e-mail option is on, confirmation messages are sent to you,
indicating the names of the recipients.
If a resource does not have an e-mail address specified on the Resources tab of the
Administration page, no e-mail can be sent.
When a resource is replaced on an activity, an e-mail is sent to the removed resource
and to the replacement resource.
Creating Custom Portlets
Create custom portlets if the existing portlets do not fulfill your needs.
To create custom portlets:
1) Open one or more projects in the Projects section using one of the following methods:
Click Projects to open the last project or group of projects you were working
with.
Click the Projects menu and choose one of the most-recently used projects
or group of projects.
Click the Projects menu and choose Open Projects to select a project or
group of projects by portfolio type, EPS node, or project code.
2) On the Projects navigation bar, click Workspace.
3) On the Workspace page, click Customize.
4) On the Customize page, click the Content tab.

172
5) On the Content tab, expand the Custom Portlets section.
6) In the Custom Portlets section:
To create a custom portlet:
1. Click Add on the Custom Portlets heading line.
2. Expand the new custom portlet and enter a value in each field.
To add the custom portlet to the Workspace page, select the option next to the
portlet name.
7) On the Content tab, click Save and Close.
Tips
You can also create custom portlets from the Customize page of the Dashboards page.

173
About Portfolios
A portfolio is a collection of projects. Group projects into portfolios so you can easily view
data from more than one project at a time. For example, you might filter a dashboard by
a portfolio to view a wide range of information for multiple related projects at one time.
In a more strategic sense, you should group projects and programs together to facilitate
the effective new product development and management of those projects to optimize
your organization's success at meeting business objectives.
Using portfolios, you can review summary data and status information for the group as a
whole or for individual projects in a portfolio.
You can create portfolios for your own use or for sharing with other users. You can also
create global portfolios, which are available to all users.
Portfolio views, such as pie charts, enable you to visually compare portfolios. For
example, compare costs for all projects in region A (one portfolio) vs. region B (another
portfolio).
Historical snapshots of grouped project data, called scenarios, aid in your analysis of
project groups on the Portfolio Analysis and Capacity Planning pages.
Working with Portfolios
To begin using the analysis features in the portfolios section, you must already have
created and updated multiple projects. Begin your work in the portfolios section by
creating and configuring at least one portfolio. It's also possible for another user to create
one and share it with you. Over time, your team will create additional portfolios, views,
and scenarios in order to perform comparative analysis, obtain status and ROI, and
perform other operations.
When creating a portfolio, decide whether you want to hand pick the projects that it will
comprise, or if you want the application to create and periodically update the set of
projects in your portfolio based on your filter criteria. Either way, you can change these
settings at any time.
Note: An administrative option is available to increase or decrease
the refresh interval for filtered portfolios. Refer to Filter Portfolio Stale
Period in the P6 Administrator's Guide.
Portfolios

174
Creating Portfolios
Perform these steps to create a new group of projects called a portfolio. When creating
a portfolio, decide whether you want to hand pick the projects that it will comprise
(manual), or if you want the application to create the set of projects in your portfolio
based on your filter criteria (automatic). Either way, you can change these settings at
any time.
To create a portfolio:
1) From the Portfolios menu, select Manage Portfolios.
2) On the Manage Portfolios page, click Create Project Portfolio.
3) On the Create Portfolio page:
a. In the Project Portfolio Name field, enter a unique portfolio name.
b. In the Manage this portfolio area, decide if you want to add projects to the
portfolio manually or automatically using a filter. The fields on the Create Portfolio
page will adjust based on your selections.
If you selected Manually, add the projects you want to include from the
Available Projects list to the Selected Projects list.
If you selected By Filter, enter your filter criteria.
c. Configure access to the portfolio by making a selection from the This portfolio is
available to options.
To restrict access to the new portfolio to only you, select Current User.
To designate a global portfolio, select All Users.
To restrict access to only another user, select Another User, and make a
selection from the Select a User dialog box.
d. Click Save.
Tips
To edit a portfolio, including its projects or filter criteria, click Details.
There are two alternate ways to create a portfolio:
Click Portfolios, click Portfolio Analysis, and then select a scorecard in the View
field. From the toolbar, click Create Portfolio from Selected Projects.
Click Portfolios, click Capacity Planning, and then click Create Portfolio from
Selected Projects.
Creating Projects While Working with Portfolios
Generally, you create projects while working in the Projects section of the application.
However, you can also create a project while viewing a portlet in the Dashboards
section or analyzing a portfolio in the Portfolios section. Refer to the tasks below:
Creating Projects in a Portfolio Portlet (see "Creating Projects in a Portfolio View
Scorecard Portlet" on page 175)

Portfolios
175
Creating Projects on the Portfolio Analysis Page (on page 175)
Creating Projects in a Portfolio View Scorecard Portlet
Generally, you create projects while working on the EPS page in the Projects section of
the application. However, it is also possible to create what-if projects while viewing a
portfolio view scorecard portlet on a dashboard.
To create a project in a portfolio view scorecard portlet:
1) Click Dashboards.
2) On the Dashboards page, click a dashboard.
3) On the dashboard, locate your portfolio view scorecard portlet's titlebar and click
Click here to maximize or minimize this section to expand and maximize it.
4) In the expanded and maximized portfolio view scorecard portlet:
a. Select a project row.
b. Click Add.
5) For the first project you create, if defaults are not already set, the Add Project dialog
box appears:
a. Select a default Parent EPS element.
b. Select a default Responsible Manager.
c. Click Select.
6) In the portfolio view scorecard portlet:
a. Select your new project row by clicking on it in the Name column.
b. Enter a name for your new project to replace the default name.
c. Click Save.
Tips
When you create a project from a scorecard on a dashboard, the project is
automatically added to the filter currently associated with the dashboard. However,
if the dashboard is filtered by a global portfolio and you do not have the required
security privilege to edit global portfolios, the new project is removed from the
scorecard when you click Save.
You can change the Project Status field on the General detail window of the EPS
page. For example, you may later want to change a project from What If to Planned
status.
Creating Projects on the Portfolio Analysis Page
Generally, you create projects while working on the EPS page in the Projects section of
the application. However, it is also possible to create what-if projects while analyzing
portfolios. During the process of evaluating a portfolio, you will often want to capture a
new project idea.

176
To create a project on the portfolio analysis page:
1) Click Portfolios.
2) On the Portfolios navigation bar, click Portfolio Analysis.
3) On the Portfolio Analysis page:
a. Make sure you are working with the primary portfolio (at top or left) and not the
comparison set for the next steps.
b. In the Scenario list, select a scenario for your analysis.
c. In the View list, select a portfolio view scorecard.
d. In the scorecard, select a row where you want to add a new project.
e. Click Add Project.
4) For the first project you create, if defaults are not already set, the Add Project dialog
box appears:
a. Select a default Parent EPS element.
b. Select a default Responsible Manager.
c. Click Select.
5) On the Portfolio Analysis page, click Save.
Tip
You can change the what-if project's Project Status field value on the General detail
window of the EPS page. For example, you may later want to change a project from
What If to Planned status.
Assigning Projects to a Portfolio
When comparing portfolios on the Portfolio Analysis page, you can assign a project to
the selected portfolio in either half of the page.
To assign a project to the selected portfolio:
1) Open a portfolio in the Portfolios section using one of the following methods:
Click Portfolios to open the last portfolio you were working with.
Click the Portfolios menu and choose one of the most-recently used
portfolios.
Click the Portfolios menu and choose Open Portfolio to select a group of
projects by portfolio type, EPS node, or project code.
2) On the Portfolios navigation bar, click Portfolio Analysis.
3) On the Portfolio Analysis page:
a. In either work area, choose a scorecard view in from the View list.
b. In the same work area, select <Latest Data> from the Scenario field list.

Portfolios
177
c. In the same work area, click Assign a Project to this Portfolio
4) In the Select Project dialog select a project, then click Assign.
Tips
You cannot assign a project to a portfolio when displaying a scenario; you must
select <Latest Data>.
The selected portfolio must be manually-administered; you cannot assign a project to
a filtered portfolio.
Defining Performance Thresholds
To help you assess the relative performance, earned value, index calculations, and other
metrics for a WBS, project, or portfolio, you can set performance thresholds. These
thresholds capture the current calculations, variances, and metrics and re-route them
into one of four ranges or "buckets" as follows:
Exceptional: Indicates that a WBS, project, or portfolio is exceeding
expectations.
Acceptable: Indicates that a WBS, project, or portfolio is performing within an
expected range.
Warning: Indicates that a WBS, project, or portfolio needs attention and is
performing below expectations.
Critical: Indicates that a WBS, project, or portfolio requires significant corrective
action.
The threshold values you set for a project apply to all users viewing metrics for that
project from the Workspace page and Portfolios pages. You have the option of
overriding these thresholds for your own use on a personal dashboard. Both sets of steps
are detailed below.
To define performance thresholds for a project:
1) Click Projects and select Open Projects.
2) In the Open Projects dialog box, select one or more projects by name, code, EPS, or
portfolio. Click OK.
3) On the Projects navigation bar, click Workspace.
4) On the Workspace page, click Customize.
5) On the Workspace Details page:
a. Click to collapse all the sections except Performance Threshold.
b. Click to expand the Performance Threshold section and then expand
Performance, Earned Value, and Index.
c. For each parameter, shown with its color-coded visual indicator, enter a threshold
value. For lists, select a value from the list.
d. Click Save and Close.

178
6) If you opened more than one project, select the next project in the Select Project list
and repeat these steps after clicking Customize.
To define your own performance thresholds:
1) Click the Administer menu and select My Preferences.
2) On the My Preferences page, click Global tab.
3) On the Global tab:
a. Click to collapse all the sections except Performance Threshold.
b. Click to expand the Performance Threshold section and then expand
Performance, Earned Value, and Index.
c. For each parameter, shown with its color-coded visual indicator, enter a threshold
value. For lists, select a value from the list.
d. Click Save and Close.
Tips
If any logical constraints are not satisfied by your selections, a message appears at the
top of the page. For example, if you set a warning to 25 days late, a critical threshold
cannot be set to 10 days late; logical constraints require that critical thresholds be
greater than warning thresholds. Correct the thresholds and try saving again.

179
Portfolio Views
About Portfolio Views
A portfolio view is a scorecard or chart providing high-level information spanning an
entire group of projects. Portfolio views can appear in an individual user's personal
dashboard or shared among users in shared dashboards. They are also used when
comparing portfolios on the Portfolio Analysis page.
Working with Portfolio Views
Each user’s personal portfolio views and any global portfolio views appear on the
Portfolio Views page. From this page, you can manage the following types of portfolio
views:
Scorecard: Similar to tables or spreadsheets, you can display the columns you want in
scorecards on the Portfolio Analysis page, the Capacity Planning page, or the
Portfolio View portlet. To assist with more sophisticated analysis on a set of projects,
you can also use a scorecard to conduct a waterline analysis. A waterline is a visual
modeling tool that ranks projects into two separate groups by sorting and applying a
constraining limit. Scorecards also permit you to edit some of their fields.
Bubble Chart: A bubble chart displays four project data fields. The X-axis represents
the values from one data field, the Y-axis represents a second field, the size of the
bubble represents a third, and the field selected for grouping the data represents a
fourth field. A bubble chart is useful when you want to analyze three independent
project variables at one time, grouped by a fourth set of values.
Pie Chart: A pie chart is a circular chart divided into proportional slices, where each
slice represents its contribution to the whole. The size of the slice represents the value
of the selected data field. A pie chart is useful for analyzing relative parts of a whole.
Histogram: There are three types of bar charts, or histograms.
Basic Histogram: A basic histogram lets you analyze project data in a vertical bar
chart format. You can select a project data field to display on the X-axis and
another field to display on the Y-axis of the chart; typically, the X-axis represents
categorical data, and the Y-axis represents individual data values.

180
Side-by-Side Histogram: A histogram where categorized data can be grouped,
side-by-side, to assist with comparisons. A side-by-side histogram chart is useful
when analyzing relative parts of a whole. For example, use a side-by-side
histogram to analyze original budget based on project status.
Stacked Histogram: A more sophisticated version of the histogram, where
categorized data is grouped, or stacked, to assist with comparisons. A stacked
histogram is useful when analyzing relative parts of a whole.
Creating Portfolio Views
When creating portfolio views, specify the scorecard or chart type, the project
information you want to appear, and the users who will have access to the view. Portfolio
view types include scorecard, bubble chart, pie chart, and three types of histograms
(basic, side-by-side, and stacked).
To create a portfolio view:
1) Click the Portfolios menu and choose Manage Portfolio Views.
2) On the Portfolio Views page, click Create View.
3) On the Create View dialog, decide if your new view should be entirely new or based
on an existing view.
To create an entirely new view, expand New Portfolio View, select a chart type,
and click OK.
To create a new view based on an existing view, expand Existing View, select one
from the expanded user and global views shown and click OK.
4) On the Create Portfolio View page, expand any collapsed groupings, complete the
required fields, and specify any additional details about the view. The fields on the
Create Portfolio View page automatically adjust based on the value you select for
the Type field.
5) Click Save.
Tips
You can save a portfolio view as a scenario and save a scenario as a portfolio view.
You can use any of these alternate methods to create a portfolio view:
Click Portfolios, click Portfolio Analysis, and then click Create Portfolio View.
Click Portfolios, click Portfolio Analysis, configure a particular view or scenario, and
then click Save As.
Click Dashboards, select a dashboard, and then click Customize. In the Portfolio
Views group, click Add. Using this method, your new view appears in the Portfolio
View portlet with the title you assigned to it.

Portfolios
181
Working with Portfolio View Scorecards
A scorecard is a type of portfolio view you can use to analyze project data in a table
with projects in rows and up to 30 data fields in columns. You can display scorecards on
the Portfolio Analysis page, the Capacity Planning page, and the Portfolio View portlet,
and choose the columns of information you want to display. A scorecard is beneficial
when you want to analyze data in a spreadsheet-type format.
To assist with more sophisticated analysis of a set of projects, you can also use a
scorecard to conduct a waterline analysis. A waterline is a visual modeling tool that ranks
projects into two separate groups by sorting and applying a constraining limit.
It is also possible to edit some global and project data in a scorecard, such as project
codes, user-defined fields, and responsible manager. Additionally, you can add projects
with default data and delete projects directly from a scorecard.
Table of Key Scorecard Elements
Item Description
Portfolio Analysis toolbar.
Portfolio Analysis settings area.
More/Basic buttons: Click More to display more options in the Portfolio
Analysis settings area. Click Basic to hide the additional settings.

182
Item Description
Scorecard work area: The first scorecard will appear in this upper work
area.
Scorecard work area: The second scorecard will appear in this lower
work area. In this example, the user has customized the view with a
waterline. Use a waterline to analyze a project group by sorting projects
into two separate groups based on a defined sorting and constraint limit.
Projects above the waterline, displayed with a white background, are
those that fall outside the constraint limit value; all other projects,
displayed with a light blue background, appear below the waterline.
Project Selection checkboxes: Check a box to add a project's data to
the cumulative Total line.
Note: To support comparative analysis, the Portfolio Analysis work
area is divided into two parts. The elements above generally
appear within both parts.
More About Scorecards
You can save the same scorecard view used on the Portfolio Analysis page and display it
in private or share it later in a portlet on a dashboard.

Portfolios
183
Note: The application also makes use of general tables of data also
referred to sometimes as scorecards; however, they are not the
same as your individually named portfolio view scorecards.
Table of Related Scorecards
Item Description
Dashboard: The John's Projects dashboard. You can show portfolio views
on private, multi-user, or global dashboards.
Scorecard in a portlet: The Budget View scorecard in a portlet on a
dashboard. This example demonstrates a named portfolio view of type
scorecard.
Click here to maximize or minimize this section button: Click to
maximize and expand the scorecard. Additional command links will
appear at the top of this portlet when it is maximized.
Scorecard on the Capacity Planning page: This example demonstrates a
general table format also referred to as a scorecard; however, this is not
a named portfolio view of type scorecard.

184
Working with Portfolio View Bubble Charts
In addition to plotting data along the X axis and Y axis, bubble charts also adjust the
relative size of each entity's bubble or circle to depict a third value, and they group the
data by still a fourth value.
Example: A user wants to analyze original budget, cost variance, and at completion
total cost for each project in a portfolio. The user also wants to compare this data to
another portfolio grouping projects by division/office and showing risk level, actual total
cost, and at completion total cost. The user navigates to the Portfolio Analysis page and
customizes the portfolio views, filters, scenarios, and bubble chart options shown below.
The user sets Original Budget to display on the X-axis and Cost Variance on the Y-axis.
Next, the user selects At Completion Total Cost as the bubble size and sets the Group by
to Project. When the chart appears, each bubble represents a single project; the size of
the bubble represents the At Completion Total Cost value for the project; the bubble's
position on the X-axis represents the original budget value for the project; and the
bubble's position on the Y-axis represents the cost variance value for the project. The user
configures a second bubble chart to display Risk Level on the X-axis, Actual Total Cost on
the Y-axis, and At Completion Total Cost for the bubble size. This time, the projects in the
portfolio are grouped into bubbles by division/office.

Portfolios
185
Note: To support comparative analysis, the Portfolio Analysis work
area is divided into two identical parts with the only difference
being the data that appears in each part. The elements below
appear within each part.
Table of Key Bubble Chart Elements
Item Description
Portfolio Analysis toolbar.
Filter: The currently applied filter appears. The top chart's filter is
determined by the currently selected portfolio. You can set the bottom
chart's filter by clicking .
More/Basic buttons: Click More to display more options in the Portfolio
Analysis Settings area. Click Basic to hide the additional settings.
Portfolio Analysis settings area.
Bubble Chart work area: Your chart will appear in this main work area.
Legend: Based on the Group By field, each item in the legend is given a
color based on the selected color theme.

186
Working with Portfolio View Pie Charts
A pie chart is a circular chart divided into slices, where each slice represents a particular
group. The size of the slice represents the value of the selected data field, relative to the
group's total value. A pie chart is useful for analyzing relative parts of a whole.
Example 1: You can create a pie chart to analyze current budget for projects, based on
project status. To do this, customize the chart and select Current Budget as the data
field, then choose to group by Project Status. When the chart displays, each slice
represents a single project status (e.g., Planned, Active, Inactive, What If); the size of the
slice represents the current budget value for all projects assigned the project status.
Example 2: The pie chart below shows At Completion Total Costs in slices representing
Location.
Table of Common Pie Chart Elements
Item Description
Portfolio Analysis toolbar.
Portfolio Analysis settings area.
More and Basic buttons: Click More to display more options in the
Portfolio Analysis Settings area. Click Basic to hide the additional
settings.
Legend: Based on the Group By field, each item in the legend is given a
color based on the selected color theme.

Portfolios
187
Item Description
Slice: Each data group's proportionate contribution to the total is
represented by a color-coded wedge or piece of the pie. In the
example, this slice represents Mainland Europe's cost of 163,385 which
equates to 13% of the At Completion Total Cost by Location.
Working with Portfolio View Histograms
Histograms provide bars to help you compare data. Three similar types of histograms are
available: basic, side-by-side, and stacked.

188
Example: Todd wants to analyze original budget values for each responsible manager
(OBS) in the organization. He also wants to compare this data to another portfolio
showing original budget for each risk level. He navigates to the Portfolio Analysis page
and customizes the portfolio views, filters, scenarios, and histogram chart options shown
below. He sets Responsible Manager to appear on the X-axis and Original Budget on the
Y-axis. When the chart appears, each bar represents a responsible manager (OBS)
element; the size of the bar represents the Original Budget. He configures a second
histogram to display Risk Level on the X-axis and Original Budget on the Y-axis.
Table of Key Histogram Elements
Item Description
Tooltip: Mouse over a bar to view a summary.
Show all values on axis: Select this option to include all values on the
X-axis and not just values with data. The histogram includes Very Low and
Very High risk level values even though there is no data to display.

Portfolios
189
Item Description
Side-by-Side Histogram: The Group By field is added. In this example,
Actual Labor Cost is tracked along the Y-axis for each Division/Office
grouped by low, medium, and high Risk Level along the X-axis.
Stacked Histogram: The Stack By field is added instead of the Group By
field. In this example, remaining labor costs expressed in units of time
(hours) are graphed for each phase. The data is stacked by location.


191
Portfolio Scenarios
About Portfolio Scenarios
Scenarios are snapshots of historical project data at a given point in time. You can use
them to compare against the latest summarized data, or to compare to other scenarios.
About What-if Analysis
Rooted in business management principles of sound decision theory (which option
should we pursue?) is the what-if analysis technique aimed at assessing the results and
impacts of potential scenarios. Its name stems from the question, "What if the scenario
actually came to fruition?"
Use what-if scenarios and what-if projects to determine the impact different costs or
investments have on business goals. Unanticipated adversities can make a business or
project unstable and proactive handling of these uncertainties is required. With what-if
scenario analysis, your organization can evaluate the feasibility of completing the
project under unfavorable conditions, prepare contingency and response plans to avoid
or overcome the worst scenario, and mitigate the impact of uncertain or unexpected
situations.
P6 portfolio scenarios help you calculate multiple project costs or durations and
compare different sets of assumptions about project activities. Sample scenarios might
include the following:
What if we extend the duration of a particular project phase?
What if regulatory changes require us to invest more in certain areas?
What if the price of a critical component increases to unsustainable levels?
What if a crucial part is delayed?
Working with Portfolio Scenarios
Use scenarios to compare against the latest summarized data, or to compare to other
scenarios. The list of available scenarios includes scenarios you have access rights to
view that are associated with the open project group. As you modify the data displayed
on the tab (for example, you change the type of Capacity Planning chart you want to
view or change the list of selected projects and roles), you can create new scenarios or
save changes to the view to further assist you in role planning.
Creating Portfolio Scenarios
Create portfolio scenarios to capture a specific state you can later use for what-if
analysis.
To create a portfolio scenario:

192
1) Open a portfolio in the Portfolios section using one of the following methods:
Click Portfolios to open the last portfolio you were working with.
Click the Portfolios menu and choose one of the most-recently used
portfolios.
Click the Portfolios menu and choose Open Portfolio to select a group of
projects by portfolio type, EPS node, or project code.
2) On the Portfolios navigation bar, click Portfolio Analysis.
3) On the Portfolio Analysis page:
a. In the View list, select a portfolio view. If you need to create a view, click
Create Portfolio View.
b. Configure the current view in the lower work area by performing any of the
following optional steps.
1. Click Filter by to filter the current view by EPS, portfolio, or project code.
2. In the Scenario list, select an existing scenario.
3. Click More and make your selections on the settings area.
4. Click Save As.
4) In the Save As dialog box, enter a Title, choose the New Scenario option, and click
Save.
Tips
Another way to create a scenario is to click Capacity Planning, configure the options on
that page, and then click Save As.
Sending E-Mail About Scenarios
Perform these steps when you want to notify other users about a particular scenario and
its associated filter so that they can share a portfolio view or use your scenario as a basis
for creating their own. The Subject line displays the scenario name, while the body of the
e-mail displays the scenario name and associated filter.
To send e-mail about a scenario:
1) Click the Portfolios menu and select Manage Scenarios.
2) On the Scenarios page:
a. Click Expand Item to view the available global, multi-user, and user scenarios
sorted by EPS element, project code value, or portfolio.
b. In the row for your selected scenario, click E-Mail.
3) In the Send dialog box:
a. Select the recipients in the To and cc lines. You can also manually enter e-mail
addresses. If access to the scenario was limited to certain users, their e-mail
addresses are automatically entered in the To line.

Portfolios
193
b. You can also modify the Subject line or provide additional text in the message
body.
c. Click Send E-mail. A message box will appear confirming the message has been
sent.
Tip
To review the scenario before sending e-mail, click Portfolios, click Portfolio
Analysis, and select it in the Scenario field.
The e-mail button does not appear on the Scenarios page for scenarios where the
This scenario is available to field has been set to the Current User option. In other
words, you cannot send e-mail to anyone about a private scenario that only you can
access.


195
Capacity Planning
About Capacity Planning
Executives, managers, and planners tasked with managing a portfolio of existing projects
and new opportunities in the pipeline need a way to evaluate both active and
proposed projects to answer one essential question: Do we have the resource capacity
to successfully complete all the work? The Capacity Planning process helps answer this
question. It reveals when your organization is over or under allocated. Decisions to
proceed, delay, freeze, or terminate projects can then be made.
Working with the Capacity Planning Page
Use the Capacity Planning page to perform What-if analysis, graphically change project
forecast dates, and apply waterline analysis techniques to assist with critical,
executive-level decision making. Before assessing capacity or demand on resources,
create resource and role estimates for each project. During your analysis, you can
create and update scenarios that provide varying snapshots of project and role
allocation data. After conducting your analysis, you can create new portfolios
containing only the projects that meet your planning criteria.
When you choose to display a stacked histogram, area chart, or spreadsheet, the
Capacity Planning chart displays the total at completion units or costs over time for the
combination of selected roles and projects. Each of these charts contains the same
information in different formats with a data stacking option for the projects and roles you
select.

196
When you choose to display a net availability chart, the chart displays each selected
role's under- or over-allocated units over time for the currently selected projects. The limit
line is always placed at zero. If the total units for a role equals the limit, no bar is displayed
for that role. Bars placed above the limit line indicate net under-allocation for the
associated role during the displayed time period; bars placed below the limit line
indicate net over-allocation for the associated role during the displayed time period.

Portfolios
197
Table of Key Capacity Planning Page Elements
Item Description
Navigation: Before you begin, first open the portfolio you want to work
with. After clicking Capacity Planning, remember to click Show
Capacity Planning Chart in the toolbar. This displays the four (4) main
screen areas used in capacity planning.
Scorecard: Use this table to analyze, sort, and select projects. Only the
projects you mark in the check box column appear in the Capacity
Planning chart.
Note: The scorecard on this page is not related to the set of defined portfolio view scorecards.
Gantt chart: View current and forecast schedules. Drag the bars to adjust
the Capacity Planning chart data.
Role Selection Area: Mark the check boxes for the roles you want to
include in the Capacity Planning chart.
Capacity Planning Chart (Under-Allocated): View role allocation as a
stacked histogram, area chart, net availability chart, or spreadsheet.
Capacity Planning Chart (Over-Allocated): Customize the chart to show
a limit line representing the maximum capacity of all resources for the
currently selected roles by timescale period.
Customize Capacity Planning Chart: Customize the columns, grouping,
waterline, or chart options. You can customize the chart to display units
or costs, a limit line, and an allocation limit line. You can also choose to
show data for all projects in the database (except what-if projects),
rather than for the projects you select in the scorecard.
If you elect to view costs, but do not have the required security privileges
to view costs for any project in the selected project group, the Capacity
Planning chart does not display any data. This option is not available for
the net availability chart because the chart displays only units.
Note: The net availability charts are often the best place to begin a
resource capacity or demand analysis since they represent a
streamlined birds-eye view. These charts include all related projects
and roles in a single view allowing you to expand or drill down into
only the roles with perceived problems.

198
Analyzing Role Allocation (Capacity Planning)
You can analyze role allocation over time for one or more projects on the Capacity
Planning page. Using multiple chart formats and role groupings, you can identify areas of
under-allocation or over-allocation. Using scenarios, you can also perform what-if
analysis.
To analyze role allocation:
1) Open a portfolio in the Portfolios section using one of the following methods:
Click Portfolios to open the last portfolio you were working with.
Click the Portfolios menu and choose one of the most-recently used
portfolios.
Click the Portfolios menu and choose Open Portfolio to select a group of
projects by portfolio type, EPS node, or project code.
2) On the Portfolios navigation bar, click Capacity Planning.
3) On the Capacity Planning page:
a. Click Show Capacity Planning Chart to display the scorecard (top left), Gantt
chart (top right), role selector (bottom left), and Capacity Planning chart (bottom
right).
b. (Optional) Choose to complete any number of the following optional sub-steps:
1. Click Customize to set column, grouping, sorting, waterline, and other chart
options.
2. Click the Scenario list to apply a scenario. Select <Latest Data> to display the
latest summarized data for the project group.
Note: If you customize the Capacity Planning page to display
allocation data for all projects in the database (rather than for
selected projects only), you cannot apply a scenario.
3. In the scorecard (top left), mark or clear the check box next to each project to
include or exclude the project's data in the Capacity Planning chart. Data in
the Capacity Planning chart is updated to reflect your changes.
4. In the role selector (bottom left), click Group Roles By or Search to
pinpoint the roles you want to analyze in the chart. Mark or clear the check
box next to each role to include or exclude the role's allocation data in the
Capacity Planning chart. Role data is immediately updated in the chart.
Note: When grouped by Current Portfolio Roles or Role Team, all
child roles are automatically selected when you select a parent
role.
5. In the Capacity Planning chart (bottom right) toolbar, select a chart or
spreadsheet format, and then choose how you want to stack the chart (by
project, role, project code, or staffed versus unstaffed units or costs).

Portfolios
199
6. Drag your mouse over a color-coded section of the chart to view the capacity
data for that section.


201
About Projects
A project is any temporary series of activities performed in some coordinated
arrangement in order to create a product, service, or measurable business result.
Projects have a definite beginning and end. A project is concluded when its objectives
have been reached or when the project is terminated.
Working with Projects
Opening Projects
If no projects are open when you log on to P6 or if you are a new user, clicking Projects
will take you directly to the EPS page as long as this page is available in your user
interface view. If you do not have access to the EPS page or you navigate to another
page in the Projects section, the Open Projects dialog box is displayed when you click
Projects. You can use this dialog box to open the projects or groups of projects you need.
Once you have projects open, the next time you click Projects in the P6 navigation bar
(and each time thereafter), the application automatically opens the last project or
project group you opened. You can always open a different project or project group
from the Open Projects dialog box, the most recently used projects list in the Projects
menu, or the EPS page. To access the Open Projects dialog box at any time, select Open
Projects from the Projects menu.
Note: When you upgrade P6, the projects you previously had open
are not lost. When you click Projects, the application will open the
last open project or group of projects.
Project Profiles
To restrict or grant access to projects and their data, you must assign project profiles to
users. A project profile is a role-based profile that limits privileges to specific project data,
such as baselines and the WBS. Project profiles are linked to users through one or more
OBS assignments. You assign responsibilities to specific projects and work within projects
by assigning OBS elements to various levels of the EPS and each project’s WBS.
The combination of the user assignment to an OBS element, and the OBS assignment to
the EPS/project/WBS, determines which projects and project data the user can view. For
each OBS element a user is assigned to, the user’s assigned project security profile (per
OBS assignment) further determines the project data the user can view or edit.
Projects

202
Opening Projects, Portfolios, or Templates
You can open a single template, project, or group of projects such as a portfolio from
several locations in the application. Select a related topic below:
Tips
After initial installation or upgrade, the first time you launch P6 and click Projects, the EPS
page will open if this page is available in your user interface view. If the EPS page is not
available in your user interface view or you navigate to another page in the Projects
section, the Open Projects dialog box will open.
Opening Projects from Dashboard Portlets
You can open projects from within certain project-related portlets such as My Projects or
Project Health. You must have OBS access, be the owner, or assigned as a resource or
activity owner in the project. In these portlets, wherever the project name appears as a
link, you can click it to open the project in the Projects section.
Note: Not all portlets allow you to open projects in this fashion. For
example, the Project Statistics and Schedule Performance portlets
will not open the project when its project link is clicked. Instead,
these portlets offer more detailed views into the data they
represent.
To open a project from within a portlet:
1) Click Dashboards.
2) On the Dashboards page, select a dashboard tab.
3) On the dashboard tab, expand the portlet and select a project.
Tips
In scorecard Portfolio View portlets, click next to the project you want to open.
In the Project Gantt Chart portlet, hold down the Ctrl key to select multiple projects
and click Open Projects in the portlet toolbar to open them.
Opening Recently Used Projects, Templates, or Portfolios
Open recently used projects, templates, or portfolios from a list of your previous selections
stored for quick access.
To open recently used projects, templates, or portfolios:
Click the Projects menu and select a project from the most recently used list.
Tips
The maximum number of items available in the most recently used lists for projects and
portfolios is determined by your administrator.

Projects
203
Opening Selected Projects or Templates
Perform these steps to open a template or one or more projects from the Open Projects
dialog box.
To open templates or projects:
1) Click the Projects menu and select Open Projects.
2) In the Open Projects dialog box:
a. Click Select Project Type and select Projects or Templates.
b. Click Group by:
Select EPS or Project Codes to organize available templates.
Or
Select EPS, Portfolios, or Project Codes to organize available projects.
c. In the Available Templates or Available Projects list:
Add a template to the Selected Templates list.
Add projects or groups of projects to the Selected Projects list.
d. Click OK.
Tips
You can open a combination of items, for example, an EPS node and a portfolio.
Press Shift+click or Ctrl+click to select the projects, or select an EPS to open all of its
projects. When you open an EPS node, the application opens all projects belonging
to that EPS node and its children EPS nodes. You cannot open a template in
combination with any other item including another template. If a template is already
listed in the Selected Templates list, the application will not allow you to move
another template into the list.
You cannot select a project code; you can only select project code values. When
the dialog is organized by project codes, you must expand the list of project codes to
display the values associated with those codes.
Opening the Last Project or Projects
After navigating away from the Projects section and then returning to it from other
sections of the application, the last project, template, or project group you had open is
re-opened by default.
To open the last project or project group:
Click Projects.
Opening Dependent Projects
When an activity in one project has a relationship to an activity in another project
(external relationship), these projects are dependent on each other. When working with
projects on the Activities page, you can open a project's dependent projects.

204
To open dependent projects:
1) Open one or more projects in the Projects section using one of the following methods:
Click Projects to open the last project or group of projects you were working
with.
Click the Projects menu and choose one of the most-recently used projects
or group of projects.
Click the Projects menu and choose Open Projects to select a project or
group of projects by portfolio type, EPS node, or project code.
2) On the Projects navigation bar, click Activities.
3) On the Activities page, click the Actions menu and select Open Dependent
Projects.
4) In the Open Dependent Projects dialog box, select a dependent project and click
OK.
Tips
To open multiple dependent projects, use Ctrl+click or Shift+click to select them. The
Open Dependent Projects dialog box lists all currently open projects.
If a dependent project is already open, a message displays. Click OK to close the
message and the dialog.

205
The EPS
About the Enterprise Project Structure (EPS)
The enterprise project structure (EPS) represents the hierarchical structure of all projects in
the database. The EPS can be subdivided into as many levels or nodes as needed to
represent work at your organization. Nodes at the highest, or root, level might represent
divisions within your company, project phases, site locations, or other major groupings
that meet the needs of your organization; projects always represent the lowest level of
the hierarchy. Every project must be included in an EPS node.
The number of EPS levels and their structure depend on the scope of your projects and
how you want to summarize data. For example, you might want to define increasingly
lower levels of EPS nodes, similar to an outline, to represent broad areas of work that
expand into more detailed projects. Specify as many projects as needed to fulfill the
requirements of your operations executives and program managers.
Multiple levels enable you to manage projects separately while retaining the ability to roll
up and summarize data to higher levels. For example, you can summarize information for
each node in the EPS. Conversely, you can use top-down budgeting from higher-level
EPS nodes down through their lower-level projects for cost control.
User access and privileges to nodes within the EPS hierarchy are implemented through a
global organizational breakdown structure (OBS) that represents the management
responsible for the projects in the EPS. Each manager in the OBS is associated with an
area of the EPS, either by node or by project, and the WBS of the particular level of the
hierarchy.
Once you have added users and associated them with OBS elements and project
profiles, you can define the EPS and assign a responsible manager (OBS element) to
each level. You must specify a responsible manager for each node of the EPS.
Working with the EPS
Your database of projects is arranged in a hierarchy called the enterprise project
structure (EPS). The EPS can be subdivided into as many levels or nodes as needed to
parallel work at your organization. Nodes at the highest, or root, level might represent
divisions within your company, project phases, site locations, or other major groupings
that meet the needs of your organization. Projects always represent the lowest level of
the hierarchy. Every project must be included in an EPS node.
Ideally, one person or group controls the EPS across the organization. The project control
coordinator creates the hierarchical structure that identifies the company-wide projects.
The coordinator works with the project manager in each area of the organization to
define basic project information for each group and to develop standards before any
projects are added.
Organizational breakdown structure (OBS)

206
User access and privileges to nodes within the EPS hierarchy are implemented through a
global OBS that represents the management responsible for each project. Each
manager in the OBS is associated with an area of the EPS, either by node or by project,
and the WBS of the particular level of the hierarchy.
Build the hierarchy
After you set up an EPS, you can define additional data about each EPS node, such as
anticipated dates, budgets, and spending plans. Use the detail windows on the EPS
page to specify this information. Or, you can begin adding projects under the applicable
nodes in the structure if you have access rights to these functions. Access rights are set by
your application administrator.
Throughout the application, when selecting projects to work with, you can open all
projects that belong to an EPS node or sort them by EPS. When you create a project, you
must specify a single parent EPS node.
The EPS Page
Item Description
Actions, Edit, and View menus: Use these menus to customize the EPS
page. See Actions Menu on EPS Page, Edit Menu on EPS Page, or View
Menu on EPS Page.
EPS toolbars: Customize the toolbars to include toolbuttons that you use
often. See Customize Toolbar Items Dialog Box.

Projects
207
Item Description
Project View toolbar: Determines how you see data on the EPS page.
Project table: Displays each project within the EPS. In this example, the
data is grouped to three (3) levels by EPS, grouped at a fourth level by
Original Budget, and sorted by Risk Level.
EPS Gantt chart: Displays project and EPS data in a Gantt chart format.
Creating EPS Elements
Create enterprise project structure (EPS) elements to represent the hierarchical positions
of all the projects in your database. You can create sibling EPSs to represent those that
are hierarchically equal, or child EPSs to represent those that are subordinate.
To create EPS elements:
1) Click Projects.
2) On the Projects navigation bar, click EPS.
3) On the EPS page:
a. Select an EPS. The EPS can act as a sibling or a parent.
b. Click the Actions menu:
To add a sibling, select Add Add Sibling EPS (Shift+Insert).
To add a child, select Add Add Child EPS (Ctrl+Insert).
c. Enter a name in the EPS/Project Name field of the new EPS.
d. Click the Actions menu and select Save (Ctrl+S).
Tips
You might find it helpful to apply the EPS Only standard filter when creating an EPS
element. This will remove all projects and templates from the view so you can easily
see where your new EPS fits into the EPS hierarchy as a whole. See Applying Filters (on
page 232).
To create an EPS, the entire EPS hierarchy must be visible, so you might have to
configure your grouping or filter settings. Grouping should be configured to have the
Field list set to EPS and the To Level list set to All. Also, the Hide if empty option cannot
be selected. See Configuring Project View Grouping (on page 231). Filtering cannot
be configured to display projects that belong to an EPS as this will select the Hide if
empty option. See Configuring Project View Filters (on page 232).
The application automatically names the new EPS New EPS, New EPS-1, New EPS-2, et
cetera.

208
You can also right-click an EPS on the table and select Add Child EPS or Add Sibling
EPS to create an EPS.
Configuring the EPS
Configure the EPS for your organization to develop a hierarchy that establishes the way
your organization operates. Divide the EPS into multiple levels or nodes to represent the
work that needs to be done in your organization. You can then assign projects to these
nodes and levels to reflect work that needs to be done in each area.
The number of EPS levels and their structure depend on the scope of your projects and
how you want to summarize data. For example, you might want to define increasingly
lower levels of EPS nodes, similar to an outline, to represent broad areas of work that
branch into more detailed projects.
To configure the EPS:
1) Click Projects.
2) On the Projects navigation bar, click EPS.
3) On the EPS page:
a. Create the EPSs you need to represent the divisions in your company, site
locations, or other major groupings of projects. See Creating EPS Elements (on
page 207).
b. Use the Move Up (Ctrl+Alt+Up), Move Down (Ctrl+Alt+Down), Move Left
(Ctrl+Alt+Left), and Move Right (Ctrl+Alt+Right) arrows on the Edit menu to
arrange the EPS nodes in a hierarchy that establishes the highest level and lowest
level EPSs.
c. Add projects to the EPS nodes. See Creating Projects (on page 208) or Creating
Projects from Existing Projects or Templates (on page 209).
4) On the EPS page, click the Actions menu and select Save (Ctrl+S).
Tips
The farther to the left an EPS is, the higher-level EPS it is.
About Projects
A project is any temporary series of activities performed in some coordinated
arrangement in order to create a product, service, or measurable business result.
Projects have a definite beginning and end. A project is concluded when its objectives
have been reached or when the project is terminated.
Creating Projects
Create projects to define a set of activities and WBSs that work toward a common goal.
To create a project:

Projects
209
1) Click Projects.
2) On the Projects navigation bar, click EPS.
3) On the EPS page:
a. Select the EPS element to which you want to add the new project.
b. Click the Actions menu and select Add Add Project.
4) In the Add Project dialog box:
a. Click the General tab and select an option or enter a value in each required field.
Note: You can add a description or a Must Finish By date. You can
also copy the project from an existing project or template.
b. Click Create.
Tips
To configure advanced options, you must select a project to copy. This will enable
the Advanced tab. If you select to copy a template, the Advanced tab will not be
enabled.
You can also right-click the table and select Add Project to create a project.
You can copy existing projects to create new projects. See Cutting, Copying, and
Pasting Data (on page 115).
Creating Projects from Existing Projects or Templates
In place of making a project from scratch, you can use a template or a copy of an
existing project as a starting point.
To create a project from an existing project or template:
1) Click Projects.
2) On the Projects navigation bar, click EPS.
3) On the EPS page:
a. Select the EPS element to which you want to add the new project.
b. Click the Actions menu and select Add Add Project.
4) In the Add Project dialog box, click the General tab.
5) On the General tab:
a. Select an option or enter a value in each required field.
b. In the Copy from existing project or template field, click Select Project or
Template to Copy and select an option from the dialog box.
Note: Click Select Project Type and select Projects or
Templates to open the list of projects or templates.
c. Click Create.

210
Tips
To configure advanced options, you must select a project to copy. This will enable
the Advanced tab. If you select to copy a template, the Advanced tab will not be
enabled.
You can also right-click the table, select Add Project, and follow steps 4. and 5. to
create a project from an existing project or template.
Deleting Projects or EPSs
Delete projects or EPSs when they are no longer necessary.
To delete projects or EPSs:
1) Click Projects.
2) On the Projects navigation bar, click EPS.
3) On the EPS page:
a. Select the project or EPS to delete.
b. Click the Actions menu and select Delete (Delete).
c. In the Primavera P6 dialog box, click Yes.
d. Click the Actions menu and select Save (Ctrl+S).
Caution:
You cannot retrieve deleted projects.
When you delete a project or EPS, you are also deleting all of
the WBSs, activities, and projects (if you are deleting an EPS)
contained therein.
Opening Projects or Templates in the EPS
You can open projects or templates from the EPS page. When you then move to other
areas of the application, such as the Workspace page, these projects or templates will
be open.
To open EPS node projects or templates:
1) Click Projects.
2) On the Projects navigation bar, click EPS.
3) On the EPS page:
a. Select a project, project template, or EPS to open.
Note: If you select an EPS, all the projects contained in that EPS will
also open.

Projects
211
b. Click the Actions menu and select Open Project or Open Project
Template.
Tips
You can open more than one project or EPS at a time. Use Shift+click or Ctrl+click to
select all the items you want to open.
You can also right-click a project and select Open Project or Open Project Template
from the menu to open a project or project template.
You cannot open a template in combination with any other item.
To close a project, right-click the project you want to close and select Close Project.
To close all of the open projects on the EPS page, click the Actions menu on the EPS
page and select Close All.
When a project is open, it will display an open folder icon . When a project is
closed, its corresponding folder icon will also be closed .
The Team Usage, Workspace, Documents, and Issues pages are not available if you
are working with a project template.
Customizing Detail Windows
You can customize which detail windows appear on the EPS or Activities pages.
To customize detail windows:
1) Open one or more projects in the Projects section using one of the following methods:
Click Projects to open the last project or group of projects you were working
with.
Click the Projects menu and choose one of the most-recently used projects
or group of projects.
Click the Projects menu and choose Open Projects to select a project or
group of projects by portfolio type, EPS node, or project code.
2) On the Project navigation bar, click Activities or EPS.
3) On the Activities or EPS page:
a. Select a view from the Activity or EPS View list.
b. Click the View menu and select Customize Detail Windows.
4) In the Customize Detail Windows dialog box:
a. In the Area section, select one of the options to determine which listing of detail
windows is available for you to customize.
b. In the Detail Window section, select or clear the options beside detail windows to
add or remove them from the page.
c. Click Save.

212
Tips
Select or clear the option beside the Detail Window title to add all or remove all the
detail windows.
Right-click a detail window tab to customize detail windows. Click Customize on the
menu to open the Customize Detail Windows dialog box, or click a detail window
name to add or remove it from the page.
Click and drag detail windows to change their order. Otherwise, the detail windows
appear in the same order that they appear in the Customize Detail Windows dialog
box.
Click Float on the detail window to convert it to a dialog box. You can then drag
this dialog box to change its position.
When you navigate to a new page, you can save or cancel the view changes you
made to the detail windows. These changes will only be saved for the view selected
in the Activity or EPS View list.
Configuring Project Preferences
Set project preferences to configure basic settings for the selected project.
To configure project preferences:
1) Click Projects.
2) On the Projects navigation bar, click EPS.
3) On the EPS page:
a. Select a project.
b. Click the Actions menu and select Set Project Preferences....
4) In the Project Preferences dialog box, configure the tabs as needed for the selected
project.
a. Configure the Calculations tab. See Configuring Project Calculations (on page
213).
b. Configure the Contract Management tab. See Linking Contract Management
Data.
c. Configure the Defaults tab. See Configuring Project Defaults (on page 214).
d. Configure the General tab. See Configuring General Project Preferences (on page
214).
e. Configure the Progress Reporter tab. See Configuring P6 Progress Reporter (on
page 215).
f. Configure the Summarization tab. See Configuring Project Summarization (on
page 215).
g. When you are finished, click Save and Close.

Projects
213
Configuring Project Calculations
Configure project calculations to define how the application will compute values
concerning activities, earned value, and units and costs.
To configure project calculations:
1) Click Projects.
2) On the Projects navigation bar, click EPS.
3) On the EPS page:
a. Select a project.
b. Click the Actions menu and select Set Project Preferences....
4) In the Project Preferences dialog box, click the Calculations tab.
5) On the Calculations tab:
a. Configure the options in each section.
b. Click Save to continue working or click Save and Close if you are finished.
Linking P6 and Contract Management Projects
When the P6 and Contract Management applications are linked, you can then link a
specific project in P6 to a Contract Management project. This will enable you to view
up-to-date contractual information for the project within portlets.
To link a P6project to a Contract Management project:
1) Click Projects.
2) On the Projects navigation bar, click EPS.
3) On the EPS page:
a. Select a project.
b. Click the Actions menu and select Set Project Preferences....
4) In the Project Preferences dialog box, click the Contract Management tab.
5) On the Contract Management tab, click Group Name: Project Name .
6) In the Primavera P6 dialog box, log on to Contract Management.
7) In the Select Project and Group dialog box, expand a project, select a group, and
click OK.
8) In the Project Preferences dialog box, click Save to continue working or click Save
and Close if you are finished.

214
Tips
To link the project to a Contract Management project, you must have a valid user name
and password. If you have a Contract Management user name and password that is the
same as the user name and password with which you are currently logged in to P6, you
are not prompted to login again. If you do not have the same user name and password
for both applications, you must enter a valid Contract Management user name and
password in the Primavera P6 dialog box.
Configuring Project Defaults
Configure project defaults to define how new activities and assignments will display in a
project.
To configure project defaults:
1) Click Projects.
2) On the Projects navigation bar, click EPS.
3) On the EPS page:
a. Select a project.
b. Click the Actions menu and select Set Project Preferences....
4) In the Project Preferences dialog box, click the Defaults tab.
5) On the Defaults tab:
a. Configure the defaults to represent how you want the application to handle new
activities and assignments.
b. Click Save to continue working or click Save and Close if you are finished.
Configuring General Project Preferences
Configure general project preferences to specify general information concerning the
project such as when the fiscal year begins.
To configure general project preferences:
1) Click Projects.
2) On the Projects navigation bar, click EPS.
3) On the EPS page:
a. Select a project.
b. Click the Actions menu and select Set Project Preferences....
4) In the Project Preferences dialog box, click the General tab.
5) On the General tab:
a. Configure the field and list.
b. Click Save to continue working or click Save and Close if you are finished.

Projects
215
Configuring P6 Progress Reporter
Configure statusing and managing activities options to specify how users interact with
activities.
To configure P6 Progress Reporter:
1) Click Projects.
2) On the Projects navigation bar, click EPS.
3) On the EPS page:
a. Select a project.
b. Click the Actions menu and select Set Project Preferences....
4) In the Project Preferences dialog box, click the Progress Reporter tab.
5) On the Progress Reporter tab:
a. Configure the options for each section.
b. Click Save to continue working or click Save and Close if you are finished.
Configuring Project Summarization
You can configure how projects are summarized.
To configure project summarization:
1) Click Projects.
2) On the Projects navigation bar, click EPS.
3) On the EPS page:
a. Select a project.
b. Click the Actions menu and select Set Project Preferences....
4) In the Project Preferences dialog box, click the Summarization tab.
5) On the Summarization tab:
a. Select or clear the Enable Summarization option.
b. If you select the option, configure the newly enabled options and list.
c. Click Save to continue working or click Save and Close if you are finished.
Tips
If you clear the Enable Summarization option on the table, you will be asked if you would
like to delete the summary information. If there is no summary information, then the
application will not prompt you.
About Gantt Charts
A Gantt chart is a graphical representation of the duration and sequence of activities or
projects. It is useful for planning, scheduling, and monitoring progress against a timeline.

216
Working with the Activity Gantt Chart
Use the Activity Gantt chart to view the progression and relationships of activities or
projects on a timeline.
Gantt chart bars and activity dates or durations
You can easily update dates and durations by resizing or moving Gantt chart bars. When
you change bar positions in a Gantt chart, the start and finish date columns update
automatically to reflect the new bar position. After moving a Gantt bar, when you save
your changes, the remaining duration is recalculated based on the new dates and the
activity or project calendar. Because this calendar is applied when you save, if you
move but do not resize a Gantt bar, the duration might shorten or lengthen based on the
calendar's nonworktime.
Note: If you click the center of a bar and drag it along the
timescale, you will be prompted to add a Start On or After
constraint. In the Gantt chart, you can impose only a Start On or
After constraint.
Customizing the Gantt chart
You can change the progress line options or the timescale for the Gantt chart in the
Customize Activity View dialog box.
Viewing the Gantt chart
In the Gantt chart, a vertical blue line represents the current data date for the project.
Vertical sightlines appear at each minor increment (bottom) of the timescale. Horizontal
sightlines appear at the bottom of every fifth table row. The timescale background is
shaded to indicate nonworktime based on the global default calendar.
Activity highlight
To quickly locate the activities you need to update, you can use the Progress Spotlight
feature, which highlights all activities that should have progressed during a specific time
period. This time period is defined by the smallest increment of the current timescale
since the last data date. For example, if the current timescale is set to Month/Week,
Progress Spotlight highlights all activities that should have progressed during the week
since the data date.
Configuring Gantt Charts
Configure the Gantt chart to adjust activity beginning and finishing dates as well as
constraints.
To configure the Gantt chart:
1) Open one or more projects in the Projects section using one of the following methods:
Click Projects to open the last project or group of projects you were working
with.

Projects
217
Click the Projects menu and choose one of the most-recently used projects
or group of projects.
Click the Projects menu and choose Open Projects to select a project or
group of projects by portfolio type, EPS node, or project code.
2) On the Project navigation bar, click Activities or EPS.
3) On the Activities or EPS page, click the View menu and select Gantt Chart.
4) On the Gantt chart:
a. To resize bars, select a bar and click and drag the beginning or end of it to a new
date. (Only applicable on the Activities page.)
b. To focus the Gantt chart on a specific time interval, double-click a year, quarter,
month, week, or day on the timescale. The Gantt chart timescale will expand or
shrink to show the entire time interval.
c. To expand a specific area of the Gantt chart, click the timescale at the top of the
Gantt chart once (the pointer will become a double-headed arrow), move the
pointer to select the portion of the timescale you want to expand, and click again.
You can perform this step several times.
d. To apply a Start On or After Activity Constraint, click the middle of a bar and drag it
along the timescale. (Only applicable on the Activities page.)
5) On the Activities or EPS page, click the View menu and select Save (Ctrl+S).
Tips
To back out of a zoom, double-click the top bar of the timescale.
For more information on configuring Gantt charts, see Configuring Activity View Gantt
Chart (on page 289) or Configuring Project View Gantt Chart (on page 235).
After resizing or moving a Gantt bar, when you save your changes, the activity
remaining duration is recalculated based on the new dates and the activity's
calendar. Because the calendar for the activity is applied when you save, a date you
specified for an activity might change slightly if it occurs during calendar
nonworktime. Also, if you move, but do not resize, a Gantt bar, the duration might
shorten or lengthen based on the activity calendar's nonworktime.
If you select the option Do not show this again in the Activity Constraint dialog box, it
will not reappear until the next time you log in.
To create or configure activity relationships in the Gantt chart, see Creating Activity
Relationships (on page 314) or Configuring Activity Relationships (on page 315).
About the Activity Table
The Activity Table presents all WBS and activity information for the currently open projects
in a familiar table format. You can customize Activity Table columns, filters, grouping,
sorting, fonts, and colors.

218
For example, you might change the information displayed in columns to show
scheduling data, resource and cost data, user-defined fields, or any data items you
select, including calculated data. You can also format specific information to call
attention to it by using the filter, group and sort, and other table display features.
Use the Activity Table to:
Create a list of activities and activity information quickly when you don't need to see
the information graphically over time as in a Gantt chart.
Group activities that share a common attribute into hierarchies. For example, focus
on activities by resource, responsibility, or date. Once you organize activities into
groups, you can summarize or "roll up" project data to simplify their presentation.
Sort activities to arrange them in an order you specify. For example, to view activities
chronologically, you might sort them by a date field.
About Baselines
A baseline is a copy, or snapshot, of project data at a given time. Because a baseline is a
static representation of a project plan, it can be used as a benchmark against which to
measure performance as a project progresses.
You can create multiple baselines to establish metrics throughout the project life cycle.
Typically, you would want to create an initial baseline once the project plan is approved,
then you would create additional baselines according to your organization's
requirements. For example, you could create new baselines at specific reporting
intervals.
Although many baselines can be created for a project, only two baselines can be used
at any given time to display and compare data. These are known as the Project Baseline
and User's Primary Baseline. The current project can also be used as the baseline, for
example, in situations where no other baseline yet exists.
The Project Baseline is a single metric for comparison that enables all members of a team
to have a shared and consistent set of data against which to evaluate project progress.
There is only one Project Baseline at any time. All pages that display summarized data
compare and display data against the Project Baseline.
The User's Primary Baseline is an optional personal baseline that is used to evaluate
project progress.
Related Topics
About Baseline Types ............................................................................................. 464

Projects
219
Working with Baselines
Before you update a schedule for the first time, you should create a baseline plan. The
simplest baseline plan is a complete copy, or snapshot, of the original schedule. This
snapshot provides a target against which you can track a project's cost, schedule, and
performance. You can save a copy of the current project to use as the baseline or you
can convert another project in the EPS hierarchy to a baseline for the current project.
To help categorize, or track, multiple baselines for a single project, you can assign each
baseline a type that reflects its purpose, for example, initial planning baseline, What-if
project baseline, customer sign-off, or midproject baseline.
Regardless of the number of baselines you store for a project, at any given time you can
only select at most two baselines for use in making comparisons in P6. The project-level
baseline is used for project/activity usage spreadsheets and profiles, as well as for
earned value calculations.
You can convert another project in the EPS hierarchy to a baseline for use in comparisons
with the current project. Before converting a project to a baseline, if you still want to
have access to the original project, you should make a copy of it. Once you convert a
project to a baseline, it is no longer available in the project hierarchy. You can restore a
baseline, making it available again as a separate project in the project hierarchy, in
order to modify it or update it.
Note: You must have the Edit Project Details Except
Costs/Financials and Assign Project Baseline project privileges to
set the project baseline.

220
Table of Working with Baseline Elements
Item Description
Define Baselines: Use Define Baselines to add, modify, convert, and
restore projects and baselines.
Add Baselines: When you add a baseline, give it a name, assign it a type,
and decide if you want to make it the Project Baseline or User's Primary
Baseline for the currently selected project. Baseline designations are
made in the projects rows of the table highlighted in blue.
Convert a Project to Baseline: Save a copy of the baseline before you
convert it. Convert a project to use it as a baseline for a current project.
Restore a Baseline: Use restore a baseline to modify a baseline project.
You must first unlink a baseline from its current project by restoring it as a
separate project. You can then work with this restored baseline project as
you would any other project in the EPS.
Baseline Type: Assign baseline types to baselines to help categorize
multiple baselines for a single project. Configure the available baseline
types along with your other Enterprise Data settings.
Project Baseline: Lists the available baselines for the selected project.
Select the baseline to use as the project baseline. If a baseline does not
exist, the current project is the default value.
User's Primary Baseline: Select the user's primary baseline from the list of
available baselines. If a baseline does not exist, the current project is the
default value.
Note: You can define up to three baselines for a project in P6
Professional.
Creating Baselines
Create baselines to measure project performance.
To create a baseline:
1) Open the project or projects for which you want to create a baseline using one of the
following methods:
Click Projects to open the last project or group of projects you were working
with.
Click the Projects menu and select one of the most-recently used projects
or group of projects.

Projects
221
Click the Projects menu and select Open Projects to select a project or
group of projects by portfolio type, EPS node, or project code.
2) On the Project Navigation bar, click Activities or EPS.
3) On the Activities or EPS page, click the Actions menu and select Define
Baselines....
4) In the Baselines dialog box:
a. Select the project to which you will add the baseline.
b. Click Add Baseline.
c. Enter a name in the Baseline Name field.
d. Select a type from the Baseline Type list.
e. Click Save (Ctrl+S).
Tips
The application automatically assigns the baseline a name based on the selected
project. For example, if you select Project A, the application will name the newly
created baseline A - B1.
Specify the default Project Baseline and User's Primary Baseline by selecting from the
list of available baselines for each project in the table on the Baselines dialog box.
Click Convert a Project to Baseline and select a project to convert a project into a
baseline.
Select a baseline and click Restore a Baseline to remove the baseline and make it a
project.
About the Summarizer Service
Many features in P6 and P6 Professional use summary enterprise or project data
calculations spanning multiple records and therefore rely on the creation of
up-to-the-minute summarized data. When you think of summary data, think of math
sums: totals and subtotals. You already have all the project data, you just want it added
up and presented to you so you can easily evaluate it.
To ensure that enterprise records are current, you need to summarize projects.
Summarization performs the series of calculations that update records with any new
information that has been entered since the last update. Summary data tables
temporarily store and share the data.
The summarizer is responsible for generating the following data:
Project and WBS-level summary data including subtotals for each month, week, and
financial period
Resource and role summary data including subtotals for each WBS, month, week,
and financial period
Enterprise-level summary data including project and resource subtotals for each EPS
element

222
Summarizer services update project records for the selected projects.
Example: You want to see resource assignments spanning multiple resources and break
out the subtotals by project and WBS. By summarizing the selected projects, the
database performs the calculations necessary to display subtotals for all cost and unit
fields by resource, by project, by WBS, and by time period.
Working with the Summarizer Service
You can summarize data at any time or you can use the Scheduled Services page to
schedule a time when data are regularly summarized. For example, set the application
to summarize every Monday at 8:00 a.m. In each case, project data are summarized
according to the settings you specify and the new summary values are saved to the
project database, overwriting any previously calculated summary data. If you run the
summarizer from the Scheduled Services page, you can select to summarize an EPS
rather than individual projects. Otherwise, an EPS node uses the sum of all the project
records beneath it.
Resources
Resource-related features in P6 that use summary data rely on the creation of enterprise
(EPS) resource records. Each record is the sum of all assignments for a resource. When
you summarize a project, the application creates resource records for that project. Each
time the service runs, the records are updated.
Summarizing Projects
Summarize projects to maintain up-to-date project data.
To summarize projects:
1) Open one or more projects in the Projects section using one of the following methods:
Click Projects to open the last project or group of projects you were working
with.
Click the Projects menu and choose one of the most-recently used projects
or group of projects.
Click the Projects menu and choose Open Projects to select a project or
group of projects by portfolio type, EPS node, or project code.
2) On the Projects navigation bar, click EPS.
3) On the EPS page:
a. Select a project or EPS node.
b. Click the Actions menu and select Summarize Projects.

Projects
223
Tips
When you summarize projects from the Activities page, the application will
summarize any of the currently open projects. When you summarize from the EPS
page, only the selected projects will be summarized.
You can have the application summarize projects automatically. See Creating
Schedule Services (see "Creating Scheduled Services" on page 395).
These services are removed from the database based on the ASAP Cleanup Rate
your P6 administrator specifies on the Configurations tab in P6 Administrator
application. Once the time is met all ASAP jobs that have a status other than running
or delegated will be removed from the table automatically. Running and delegated
jobs will be removed if they are older than the cleanup rate or if they are older than
one day, whichever is greater.
You can also summarize projects from the Actions menu of the Activities page.
About Importing and Exporting Projects
You can import and export information to and from P6 using external files and then share
this information with other P6 EPPM users, Oracle Primavera Contractor users, other
project management tools (such as Microsoft Project and Microsoft Excel), and your
organization's human resource and accounting systems. You can also use external files
to archive your projects or create a backup of your database.
You can import and export project data between P6 and other applications using the
following file formats:
Oracle Primavera's XML format which enables you to share project information stored
in the P6 EPPM database.
Microsoft Project XML format which enables you to share information with Microsoft
Project 2007.
Note: All project data is stored in a central database. You can also
import projects using the Primavera XER format in P6 Professional.
Working with Primavera XML Project Import/Export
You can import projects in Primavera XML format or Microsoft Project XML format.
When you import Primavera XML projects several considerations apply:
You are not required to have All Resources access. The import process continues
even for users without full resource access.
You can import resources at or below your access level in your resource hierarchy.
This includes the ability to create new resources at or below your level.
If the import would result in the creation of resources above your level in the resource
hierarchy, it will not continue.

224
If the import would result in the creation of resources at or below your level in your
resource hierarchy, and this new data is in conflict with existing resource data, it will
not continue. For example, if resource IDs are in conflict.
To prevent the import process from attempting to create new resources in P6, select
the Do Not Import option for Resources. This option will still match existing resources
and allow their assignments to be imported and updated, but it will not import new
resources.
Even when you have sufficient project security access, if you do not have the proper
resource access, you will not be able to assign or modify a resource above your
access level in the resource hierarchy to a project to which the resource is already
assigned.
Even when you have sufficient project security access, if you do not have the proper
resource access, you will not be able to export projects, in their entirety, when
resources are above your access level in the resource hierarchy. The export will not
necessarily fail, but data will be limited since not all resources in the project can be
included.
Exporting Projects using Microsoft Project XML
You can export projects to locations outside of P6 using the Microsoft XML format to
share information with Microsoft Project.
To export projects using Microsoft Project XML format:
1) Click Projects.
2) On the Projects navigation bar, click EPS.
3) On the EPS page, click the Actions menu and select Import/Export , XML
Project Import/Export....
4) In the XML Project Import/Export dialog box, click the Export tab.
5) On the Export tab:
a. In the Export Type field, select Microsoft Project XML 2007.
b. In the Microsoft Project Template field, select a template.
c. In the Export Project field, click Select Project and select a project from the
dialog box.
d. Click Export.
Tips
Click the Status tab to see the status of the export. On the Status tab, you can delete the
export.
Configuring Microsoft Project Templates
Configure Microsoft® Project® templates to define data exchange options for both
exporting to and importing from Microsoft® Project®.

Projects
225
To configure Microsoft® Project® templates:
1) Click Projects.
2) On the Projects navigation bar, click EPS.
3) On the EPS page, click the Actions menu and select Import/Export , XML
Project Import/Export....
4) In the XML Project Import/Export dialog box, click the Import or Export tab.
5) On the Import or Export tab:
a. Select Microsoft Project XML from the Import or Export Type list.
b. Select a template from the Microsoft Project Template list.
c. Click MSP Import Template Options or MSP Export Template Options.
6) In the Modify Template dialog box:
a. Configure the lists, options, and fields on each tab.
b. Click Save.
Tips
The area you select from the Select Subject Area list on the Custom Field Mapping tab
determines what appears in the Project Management and Microsoft Project Fields.
Exporting Projects using Primavera XML Format
You can export projects to locations outside P6 using the Primavera XML format to share
project information between Project Management databases.
To export projects using Primavera XML format:
1) Click Projects.
2) On the Projects navigation bar, click EPS.
3) On the EPS page, click the Actions menu and select Import/Export , XML
Project Import/Export....
4) In the XML Project Import/Export dialog box, click the Export tab.
5) On the Export tab:
a. In the Export Type field, select Primavera XML.
b. In the Export Project field, click Select Project and select a project from the
dialog box.
c. Click Export.
Tips
Click the Status tab to see the status of the export. On the Status tab, you can delete the
export.

226
Importing Projects using Microsoft Project XML
You can import projects using the Microsoft Project XML format to create and manage
them as new projects in P6.
Note: To import a project via XML using P6 or P6 Professional, your
user account's Resource Access field must be set to All Resources.
This change can be made temporarily and then restored on the
Users Page.
To import projects using the Microsoft Project XML format:
1) Click Projects.
2) On the Projects navigation bar, click EPS.
3) On the EPS page, click the Actions menu and select Import/Export , XML Project
Import/Export....
4) In the Import/Export Project dialog box, choose the Import tab.
5) On the Import tab:
a. In the Import Type field, select Microsoft Project XML.
b. In the Import File field, click Browse.
6) In the File Upload dialog box, select a file and click Open.
7) On the Import tab:
a. In the Microsoft Project Template field, select a template.
b. Select an option for Select Import Action.
If you select Create New Project, click Select Parent EPS and select the
EPS where you want to import the XML file.
c. Click Import.
Tips
Click the Status tab to see the status of the import. On the Status tab, you can also
delete the import.
Do not import a Microsoft Project XML file that was exported from P6, back into P6.
Instead, do the following:
1. Export the project to Microsoft Project XML from P6.
2. Open the project in Microsoft Project.
3. Save the project as an XML file in Microsoft Project.
4. Import the project into P6 and create a new project.
Importing Projects using Primavera XML Format
You can import projects using the Primavera XML format and create or update a project.
To import projects using Primavera XML format:

Projects
227
1) Click Projects.
2) On the Projects navigation bar, click EPS.
3) On the EPS page, click the Actions menu and select Import/Export , XML Project
Import/Export....
4) In the Import/Export Project dialog box, choose the Import tab.
5) On the Import tab:
a. In the Import Type field, select Primavera XML.
b. In the Import File field, click Browse.
6) In the File Upload dialog box, select a file and click Open.
7) On the Import tab:
a. Select an option for Select Import Action.
If you select Create New Project, click Select Parent EPS and select the
EPS where you want to import the XML file.
If you select Update Existing Project, click Select Project and select the
project where you want to import the XML file.
b. Click Import.
Tips
Click the Status tab to see the status of the import. On the Status tab, you can also delete
the import.
Exporting Projects to Excel
You can export the list of projects in your project view to a Microsoft® Excel® (.xls) file.
To export projects:
1) Click Projects.
2) On the Projects navigation bar, click EPS.
3) On the EPS page:
a. Select a project view from the EPS View list.
b. Configure the project view to determine what data are exported. See Configuring
Project Views (on page 229).
c. Click the Actions menu and select Import/Export Export to Excel.
4) In the File Download dialog box, click Open to open the Excel spreadsheet or Save to
save the file to your computer.
Tips
All data, except grouping row information, are exported as they appear in the current
project view.

228
About Budget Change Logs
A Budget Change Log helps you keep track of budget alterations as they occur. The
Current Budget field (original budget plus approved budget changes) and Proposed
Budget field (original budget plus approved and pending budget amounts) incorporate
changes so you have up-to-date and accurate budget information for each EPS node
or project.
The Budget Change Log enables you to track modifications that affect the budget; this
log also provides a clear indication of the who, what, when, where, and how behind the
change.
Change amounts are not incorporated in the current budget until these amounts have
an Approved status. Only authorized project participants can issue budget changes and
mark them as approved. You can post a change amount as Pending; the program
manager of the affected EPS node, or the project manager of the affected project, must
then mark the amount as Approved or Not Approved. The module recalculates the new
budgeted amount and adjusts the current budget based on approved changes to the
log:
Proposed Budget equals Original Budget plus Approved Budget Changes plus
Pending Budget Changes
Current Budget equals Original Budget plus Approved Budget Changes
Creating Budget Change Requests
Create budget change requests when seeking approval to change an EPS or WBS
budget.
To create budget change requests:
1) Click Projects.
2) On the Projects navigation bar, click EPS.
3) On the EPS page, select an EPS or project and click the Budget Log detail window.
Note: You can also create budget change requests for WBSs or
projects from the Budget Log detail window of the Activities page.
4) In the Budget Log detail window:
a. Click Add (Insert) to add a budget log line item.
b. Enter a value in the Amount and Responsible fields.
c. Select Pending from the Status list.
5) On the EPS page, click the Actions menu and select Save (Ctrl+S).
Tips
The person listed in Responsible will move the request to Approved or Not Approved.

Projects
229
The program manager of the affected EPS node or the project manager or the
affected project will enter a reason for approval or denial in the Reason field.
Approving/Denying Budget Change Requests
If you have the authority, you can approve or deny a budget change request.
To approve or deny a budget change request:
1) Click Projects.
2) On the Projects navigation bar, click EPS.
3) On the EPS page, select the EPS or project with a budget change request and click
the Budget Log detail window.
4) In the Budget Log detail window:
a. Select and review the budget change request.
b. Select Approved or Not Approved from the Status list.
c. Enter reasoning for the new status in the Reason field.
5) On the EPS page, click the Actions menu and select Save (Ctrl+S).
Tips
To update the original budget, enter the amount in the Original Budget field and
press enter. The Current Budget and Proposed Budget are updated with the new
value.
Only authorized project participants can issue budget changes and mark them as
Approved.
You can also approve or deny budget change requests for WBSs or projects from the
Budget Log detail window of the Activities page.
About Project Views
Project views are the visual layout of project and EPS node information. Project views are
customizable; you can change their filters, Gantt chart options, columns, et cetera.
Selecting the best view or customizing a view that suits your needs can facilitate the
process of recording project data. For example, to quickly record a range of details for a
project or projects, you might select a table view which maximizes the number of data
columns available.
Configuring Project Views
Configure project views to define how you see a project. Project views affect the filters,
grouping, columns, et cetera that are applied to the EPS page. Detail window visibility is
also affected by the selected project view.
To configure project views:
1) Click Projects.

230
2) On the Projects navigation bar, click EPS.
3) On the EPS page:
1. Click the EPS View list and select a project view.
2. Click the View menu and select Customize View....
4) In the Customize Project View dialog box:
a. Configure the Columns tab. See Configuring Project View Columns (on page 230).
b. Configure the Grouping tab. See Configuring Project View Grouping (on page
231).
c. Configure the Filters tab. See Configuring Project View Filters (on page 232).
d. Configure the Bars tab. See Configuring Project View Bars (on page 234).
e. Configure the Gantt Chart tab. See Configuring Project View Gantt Chart (on page
235).
f. Configure the Access tab. See Configuring Project View Access (on page 235).
g. Click OK.
Tips
You can modify any view you create. You can only modify multi-user and global
project views if you have the appropriate security privileges.
Many of these configurations, configuring columns and filters for example, do not
require you to open the Customize Project View dialog box. If the necessary
toolbuttons are available on your toolbar, you can use them to configure the project
view.
Configuring Project View Columns
Configure project view columns to specify which columns are visible in the Gantt chart or
table.
To configure project view columns:
1) Click Projects.
2) On the Projects navigation bar, click EPS.
3) On the EPS page:
a. Click the EPS View list and select a project view.
b. Click the View menu and select Customize View....
4) In the Customize Project View dialog box, click the Columns tab.
5) On the Columns tab:
a. In the Select the columns to display section, customize the Selected Columns list.
See Configuring Columns or Values (on page 91).
b. In the Column Options section, select an option from each list.
c. Click OK.

Projects
231
Tips
The top-to-bottom order of fields in the Selected Columns list corresponds to the
left-to-right display order of the columns on the EPS page.
You can display a maximum of 30 columns.
To move multiple columns at a time into the Selected Columns list, use Shift+click or
Ctrl+click to select the appropriate columns, then click the right arrow.
Click Font Picker and select a font and size from the dialog box to change the font for
a column.
If you make changes to the Responsible Manager column for an EPS, the application
will prompt you to decide if you want to assign these changes to the child EPS
elements of the selected EPS. The responsible manager will not be changed for the
child projects of this EPS; project responsible managers must be changed individually.
You can customize project view columns from the View menu. Click the View menu
and select Columns.
Configuring Project View Grouping
Configure grouping to define how fields are grouped on the EPS page.
To configure project view grouping:
1) Click Projects.
2) On the Projects navigation bar, click EPS.
3) On the EPS page:
a. Click the EPS View list and select a project view.
b. Click the View menu and select Customize View....
4) In the Customize Project View dialog box, click the Grouping tab.
5) On the Grouping tab, configure the grouping options for each section and click OK.
Tips
When activities are grouped, the Gantt chart displays a summary bar for each group.
The summary bar represents the time period from the earliest Start to the latest Finish
for the group.
Use the To Level list to select the number of hierarchy levels when grouping by a
hierarchical field. When grouping by dates, use the To Level list to select a time
interval.
The band color you select will be displayed in the table.
You can also customize project view grouping from the View menu. Click the View
menu and select Group.
Grouping bands are displayed by default when you group by a project code or EPS
even if the bands are empty. Select the Hide if empty option in the Customize View or
Customize Groupings dialog boxes to remove these bands from view.

232
Configuring Project View Filters
You can modify or create filters. These filters can then be applied to several different
project views.
To customize project view filters:
1) Click Projects.
2) On the Projects navigation bar, click EPS.
3) On the EPS page:
a. Click the EPS View list and select a project view.
b. Click the View menu and select Customize View....
4) In the Customize Project View dialog box, click the Filters tab.
5) On the Filters tab:
a. You can modify a filter. See Configuring Filters (on page 234).
b. You can create a filter. See Creating Filters (on page 233).
c. You can apply filters. See Applying Filters (on page 232).
d. Click OK when finished.
Tips
You can also customize project view filters from the View menu. Click the View menu,
click the Filters submenu, and select Filters.
Applying Filters
Apply filters to a project to specify the data you want to display. You can add
user-created filters or select from the list of standard filters.
To apply filters:
1) Open one or more projects in the Projects section using one of the following methods:
Click Projects to open the last project or group of projects you were working
with.
Click the Projects menu and choose one of the most-recently used projects
or group of projects.
Click the Projects menu and choose Open Projects to select a project or
group of projects by portfolio type, EPS node, or project code.
2) On the Project navigation bar, click Activities or EPS.
3) On the Activities or EPS page:
a. Click the Activity View or EPS View list and select a view to which you will add the
filters.
b. Click the View menu and select Customize View....
4) In the Customize Activity View or Customize Project View dialog box, click the Filters
tab.

Projects
233
5) On the Filters tab:
a. Select an option from the Show matches for list.
b. In the Apply to View column, select the option for each filter you want to apply.
c. Click OK.
Tips
If you have Team Member module access, either assigned as a resource or activity
owner, applying the My Activities filter will have no affect on the activity list display
because your access is already restricted to your assigned and owner activities.
You can also click the View menu and select Filters from the Filters submenu to open
the Customize Filters dialog box. You can apply filters from this dialog box.
If you want to save the application of these filters to the view, click Yes in the
Primavera P6 dialog box which opens when you navigate away from the page.
Creating Filters
Create filters to to narrow activity or project information to a specific data group.
To create filters:
1) Open one or more projects in the Projects section using one of the following methods:
Click Projects to open the last project or group of projects you were working
with.
Click the Projects menu and choose one of the most-recently used projects
or group of projects.
Click the Projects menu and choose Open Projects to select a project or
group of projects by portfolio type, EPS node, or project code.
2) On the Project navigation bar, click Activities or EPS.
3) On the Activities or EPS page:
a. Click the Activity or EPS View list and select a view to which you will add the filters.
b. Click the View menu and select Customize View....
4) In the Customize Activity View or Customize Project View dialog box, click the Filters
tab.
5) On the Filters tab, click Add Filter.
6) In the Create Filter dialog box:
a. Click the Definition tab and configure the fields and lists for one or more filter
statements.
b. Click the Access tab and define user access.
c. Click OK.

234
Tips
To add more criteria statements, click . To remove a criteria statements, click . To
nest a criteria statement inside another, click . You can add up to ten levels of
nesting.
You can also click the View menu and select Filters from the Filters submenu to open
the Customize Filters dialog box. From this dialog box, you can create filters.
Configuring Filters
You can configure the detailed statements of a filter and who can use it.
To configure filters:
1) Open one or more projects in the Projects section using one of the following methods:
Click Projects to open the last project or group of projects you were working
with.
Click the Projects menu and choose one of the most-recently used projects
or group of projects.
Click the Projects menu and choose Open Projects to select a project or
group of projects by portfolio type, EPS node, or project code.
2) On the Project navigation bar, click Activities or EPS.
3) On the Activities or EPS page:
a. Click the Activity or EPS View list and select a view to which you will add the filters.
b. Click the View menu and select Customize View....
4) In the Customize Activity View or Customize Project View dialog box, select a filter
and click Modify Filter.
5) In the Modify Filter dialog box:
a. Click the Definition tab and configure the fields and lists to edit the filter
statements.
b. Click the Access tab, and select an access option.
c. Click OK.
Tips
You can not edit Standard Filters.
To add more filter statements to the Definition tab, click . To remove a filter, click .
To nest a criteria statement inside another, click . You can add up to ten levels of
nesting.
You can also click the View menu and select Filters from the Filters submenu to open
the Customize Filters dialog box. You can configure filters from this dialog box.
Configuring Project View Bars
Configure bars to represent different items on the timeline in the Gantt chart.
To configure project view bars:

Projects
235
1) Click Projects.
2) On the Projects navigation bar, click EPS.
3) On the EPS page:
a. Click the EPS View list and select a project view.
b. Click the View menu and select Customize View....
4) In the Customize Project View dialog box, click the Bars tab.
5) On the Bars tab, configure the bar options in each section and click OK.
Tips
The color you select for the Color option determines how the bar will be represented.
You might find it helpful to vary the position of the label on the Current bar.
Click Font Picker and select a font and size from the dialog box to change the font for
a bar.
You can also customize activity view bars from the View menu. Click Gantt Chart
Options on the View menu and click the Bars tab.
Configuring Project View Gantt Chart
Configure Gantt chart options to determine how the chart will display.
To configure project view Gantt chart:
1) Click Projects.
2) On the Projects navigation bar, click EPS.
3) On the EPS page:
a. Click the EPS View list and select a project view.
b. Click the View menu and select Customize View....
4) In the Customize Project View dialog box, click the Gantt Chart tab.
5) On the Gantt Chart tab, configure the Gantt chart options in each section and click
OK.
Tips
You can also configure the Gantt chart from the View menu. Click Gantt Chart Options
on the View menu and click the Gantt Chart tab.
Configuring Project View Access
Configure project view access to define who can see a view.
To configure project view access:
1) Click Projects.
2) On the Projects navigation bar, click EPS.
3) On the EPS page:

236
a. Click the EPS View list and select a project view.
b. Click the View menu and select Customize View....
4) In the Customize Project View dialog box, click the Access tab.
5) On the Access tab, select one of the access options and click OK.
Tips
Unless you specify otherwise, Current User is the default access.
About Bars
Bars are used in different views to graphically represent the project timeline. They can
symbolize milestones, activities, or projects. Available bar types are:
Current bar: Spans the early remaining/actual start to the early remaining/actual
finish for each activity, and indicates how the schedule is progressing according to
the original plan.
Float bar: Shows the total amount of time that an activity can be delayed without
delaying completion of a project.
Free Float bar: Shows the amount of time that an activity can be delayed without
causing subsequent activities to be delayed.
Late bar: Shows the late start to the late finish of an activity.
Percent Complete bar: Shows the completion percentage of an activity.
Plan bar: Shows the forecasted status of planned activities, and is used for simulating
the outcome of the project schedule as part of project planning.
Primary baseline bar: Shows the primary baseline start and finish dates of an activity,
and indicates how the schedule is progressing according to the original plan.
Project baseline bar: Shows the project baseline start and finish dates of an activity,
and indicates how the schedule is progressing according to the original plan.
About Columns (Fields)
Fields hold data. They generally either allow you to enter values or just display the field's
current value (called a read-only field).
Pages with tables often permit you to configure the fields that make up the columns of
the table. See Showing or Hiding Columns in a Table (on page 91).
About Grouping and Sorting
To simplify the display of complex tables of data, you can group rows of similar data and
sort the grouped bands as well as the data under them. Grouping helps you block
distracting data and focus only on the information you need. It also permits you to
collapse and expand hierarchical arrangements of your data rather than navigate large
flat lists.

Projects
237
About Gantt Charts
A Gantt chart is a graphical representation of the duration and sequence of activities or
projects. It is useful for planning, scheduling, and monitoring progress against a timeline.
About Filters
As you work with increasing amounts of data over time, you will recognize a need to limit
your focus to only the data most relevant to your particular task or need. A filter is a
predefined constraint you place on data so that data that does not meet your filter
criteria is hidden and only the data you need are shown.
About Funding Sources
Funding sources are the agencies, businesses, or groups that provide funding for a
project. You can keep funding sources in a dictionary that categorizes and groups similar
funds in a hierarchy. The dictionary allows you to quickly assign specific funding sources
to budgets as a project develops. You can assign the same funding source multiple times
with varying amount and share contributions for different levels of the EPS. The amount
contributed by a specific funding source is called the fund share value.
Assigning Project Funding Sources
Configure funding sources to update the amount and fund share of a funding source in
a project budget.
To assign a funding source:
1) Click Projects.
2) On the Projects navigation bar, click EPS.
3) On the EPS page, select a project or EPS to which you want to assign a funding source
and click the Funding detail window.
4) In the Funding detail window, click Add (Insert).
5) In the Select Funding Source dialog box, select a funding source and click OK.
6) On the EPS page, click the Actions menu and select Save (Ctrl+S).
About Notebooks
A notebook is another name for a log or binder of electronic details about an activity,
WBS, project, or EPS element. All the notes users enter or paste into the notebook,
including e-mail messages, web links, tables, and other entries, share a single common
theme called a notebook topic. See About Notebook Topics (on page 238).
238
Working with Notebooks
Notebook topics are created by the administrator on the Enterprise Data page of the
Administer menu. These topics are then assigned to activity, WBS, project, or EPS node
notebooks.
About Notebook Topics
Notebook topics help multiple users apply a common theme or label to shared
information about an activity, WBS, project, or EPS element such as its purpose,
completion instructions, or other helpful notes. For example, you might place an e-mail
message, a web link, a table of observations, and a series of text notes into a notebook
topic called Budget Recommendations to capture the ongoing cost impacts of a
recurring project.
Assigning Notebook Topics
Depending on the page you are working on, you can assign notebook topics to a
selected project or activity.
To assign a notebook topic to a project:
1) Click Projects.
2) On the Projects navigation bar, click EPS.
3) On the EPS page, select a project or EPS node and click the Notebooks detail
window.
4) In the Notebooks detail window, click Assign (Insert).
5) In the Select Notebook Topic dialog box, select a notebook topic, click Assign, then
Close.
6) On the EPS page, click the Actions menu and select Save (Ctrl+S).
Tips
You can also create notebook topic descriptions. In the Notebooks detail window,
double-click the Description field and click (browse). Enter a description in the
dialog box.
You can also assign notebook topics to activities from the Notebooks detail window
of the Activities page or the Activity Details page of the Open Requests for Resources
portlet of the Dashboards page.

Projects
239
About Project Codes
Project codes help you track different projects based on characteristics they share. You
can use project codes to arrange projects hierarchically when your EPS contains many
projects within many levels. If you have many projects in the hierarchy, project codes
help you group and filter potentially vast amounts of information spanning different areas
of the organization. The application supports an almost unlimited number of hierarchical
project codes and values; you can establish as many as you need to meet the filtering,
sorting, and reporting requirements of your organization.
Assigning Project Codes
Assign project codes to categorize projects.
To assign a project code:
1) Open one or more projects in the Projects section using one of the following methods:
Click Projects to open the last project or group of projects you were working
with.
Click the Projects menu and choose one of the most-recently used projects
or group of projects.
Click the Projects menu and choose Open Projects to select a project or
group of projects by portfolio type, EPS node, or project code.
2) On the Projects navigation bar, click EPS.
3) On the EPS page, select a project and click the Codes detail window.
4) In the Codes detail window, click Assigning Project Codes (Insert).
5) In the Select Project Codes dialog box, assign codes and click Close.
6) On the EPS page, click the Actions menu and click Save (Ctrl+S).
About P6 Progress Reporter
The P6 Progress Reporter module is a Web-based project communication and
timekeeping system. As a team-level tool for project participants, it helps project
participants focus on the work at hand with a simple cross-project to-do list of their
upcoming assignments. Project team members can record time worked and enter
information about their project assignments. Regardless of location, team members can
communicate timesheet and activity status directly to their managers.
Because all project participants can use P6 Progress Reporter to enter up-to-the-minute
information about their assignments and to record the time they spent working on each
one, project managers can make crucial project decisions with the confidence that only
comes from having the most current information possible. Timesheet review and
approval takes place directly from within P6.

240
About Contract Management
Oracle Primavera Contract Management is a multi-user, multi-project database that
manages all aspects of contract control including changes and submittals. It can be
used in conjunction with P6 EPPM.
Essential features include:
Provides information to keep contracts on-time and within budget
Enables you to cross-reference and link documents for quick, easy retrieval
Maintains historical data that can be used for the life of the project and referenced in
future projects
Aids in resolving disputes or claims
Linking P6/P6 Professional and Contract Management Applications
Perform the steps below to link P6 and P6 Professional to Contract Management. This link
at the application level allows you to establish links at the project level. When the
applications and projects are linked, P6/P6 Professional users can directly navigate to, or
directly show data from, the Contract Management application.
To link P6/P6 Professional to Contract Management:
1) Click the Administer menu and select Application Settings.
2) On the Application Settings pane, click the General tab.
3) On the General tab:
a. Enter a URL in the Contract Management URL field of the Contract Management
section.
b. Click Save and Close.
About Project Templates
Project templates are reusable models of projects you can store and use later, in whole
or in part, to save time and standardize your operations.
A template includes all the details, best practices, and de facto standards your
organization associates with projects of a particular type. For example, use project
templates to create a library of predefined project structures that can later be used as
starting points for new projects. In addition, specific WBS branches and their activities
can be copied from projects or templates and inserted wherever you need them.
You can organize your template projects within the EPS, assign them project codes, and
provide them with descriptions to aid in reuse. You can create templates from projects or
to create projects from templates. You can also create projects based on other projects,
and templates based on other templates.

Projects
241
Working with Project Templates
Project templates act as a format that you can use when creating new projects or
templates.
Working with project templates
The Documents, Issues, Team Usage, and Workspace pages are not available for project
templates. If you navigate to one of these pages while working with a project template,
you will see the message: Project templates are not supported on this page. When
working with templates on the Activities or EPS pages, the Issues and Documents detail
windows are visible but their icons are disabled.
Creating project templates
You can create a brand new project template, or you can copy and modify an existing
template or project to make a new template. If you select to copy a project or template,
you can copy the entire template, or you might insert only the WBS portion into a project.
Because issues and documents are not available for project templates, when you copy
an existing project to make a template, the issue and document information does not
carry over.
When you copy a project to create a template, some fields are automatically cleared of
any values and disabled to prevent the reuse of data out of context. For example,
actual dates and costs are not permitted in templates.
Opening project templates
Project templates cannot be opened in conjunction with other project templates or with
projects. If you open a project or a project template on the EPS page when you have a
project template open, the initial project template will close. Conversely, if you have a
project or group of projects open and you open a project template, the projects will
close.
This is also true when working in the Open Projects dialog box. For example, when you
have a project template open, the Open Projects dialog box will display the template in
the Selected Templates list. If you add a project to the Selected list, the application will
remove the project template from the list. If you already have a project template
selected, the application will not allow you to add another template to the list. On the
other hand, if you try to open a project template when projects are already open, the
projects are replaced by the project template.
Creating Project Templates
You can create project templates to act as a standard or format for future projects.
To create project templates:
1) Click Projects.
2) On the Projects navigation bar, click EPS.

242
3) On the EPS page:
a. Select the EPS element to which you want to add the new project template.
b. Click the Actions menu and select Add Add Project Template.
4) In the Add Project Template dialog box:
a. Click the General tab and configure each required field.
Note: You can add a description or copy from an existing project
or template.
b. Click Create.
Tips
To configure advanced options, you must select to copy from an existing project or
template. This will enable the Advanced tab.
If you choose to copy from an existing project, select either the Use Actual Costs and
Units or Use Planned Costs and Units option. If you select to copy from a template, the
application will disable the Use Actual Costs and Units option.
You can also right-click the table and select Add Project Template to create a
project template.

243
Activities
About Activities
Also known as tasks, events, or work packages, activities are the lowest level
manageable work elements in a project or WBS. Activities typically have expected
durations, costs, and resource or role requirements. Milestone activities, however, have
no duration or cost. Collectively, all activities form the foundation of the entire project,
driving resource assignments, relationships, constraints, expenses, and durations.
Activities are sometimes further divided into any number of discrete steps.
Working with Activities
Although you might view activities any number of ways in P6, including on dashboards,
workspaces, reports, and the Resource Assignments page, the most common way to
work with project activities is on the Activities page and, specifically, in the Activity Table.
The Activity Table
Item Description
Open Projects: Open the projects you want to work with using the Open
Projects menu item. Then click the navigation bar icon for the Activities
page. The page shows which projects are currently open.

244
Item Description
Activity View: Next, select an activity view that already includes the
Activity Table or click Table. The view should be sorted hierarchically
by WBS in order to optimize your ability to manage WBS elements and
activities within them. When working with activities, always make sure you
have set the grouping, sorting, and filtering view options that help you
focus on only the data that matches your needs.
Menus and Toolbars: The menus and customizable toolbars on the
Activities page provide you with convenient access to the commands of
most importance to your work.
Activity Table: You can select activities and update them within the table
itself or on the detail windows. In the table, you can modify, Cut, Copy,
Paste, and Fill Down values. When multiple projects are open, you can
copy and paste activities between projects just as you would within a
single project. When you cut or copy an activity, all attributes are copied
along with it.
Activity Gantt: Refer to the optional Gantt chart to supplement your work
in the table with a visual representation of the schedule.
Assignments detail window: Update resource and role assignments in this
detail window. The first resource also appears in the Primary Resource
column in the table. In this example, the Assignments detail window is
floatable, meaning it can freely be moved within the screen.
Steps detail window: Break the activity down into smaller units called
steps. The progress of steps can also be measured. In this example, some
progress has been recorded in the Step % Complete field for each of
three steps for the activity. The user in this example, has also elected to
dock the Steps detail window above the other windows but below the
Activity Table.
General detail window: Record basic details about the activity in this
detail window. You can show or hide the series of detail windows that
appears for each activity and WBS.
Note: Using P6 Administrator application, your administrator can set
a default value for the maximum number of activities that appear
within an activity view.
Creating Activities
Create activities to define a more detailed breakdown of projects or WBSs.
To create activities:
1) Open one or more projects in the Projects section using one of the following methods:

Projects
245
Click Projects to open the last project or group of projects you were working
with.
Click the Projects menu and choose one of the most-recently used projects
or group of projects.
Click the Projects menu and choose Open Projects to select a project or
group of projects by portfolio type, EPS node, or project code.
2) On the Projects navigation bar, click Activities.
3) On the Activities page:
a. Select a project, WBS, or activity; the new activity will be added beneath your
selection.
b. Click the Actions menu and select Add Add Activity.
c. Enter a name in the WBS/Activity field.
d. Click the Actions menu and select Save (Ctrl+S).
Tips
Right-click a project, WBS, or activity and select Add Activity to quickly add an
activity.
The application automatically names new activities New Activity.
You can create up to 15000 activities per activity view.
Configuring General Activity Information
You can configure some of the general information for activities, including Activity Type,
Duration Type, and activity constraints.
To configure general activity information:
1) Open one or more projects in the Projects section using one of the following methods:
Click Projects to open the last project or group of projects you were working
with.
Click the Projects menu and choose one of the most-recently used projects
or group of projects.
Click the Projects menu and choose Open Projects to select a project or
group of projects by portfolio type, EPS node, or project code.
2) On the Projects navigation bar, click Activities.
3) On the Activities page, select an activity and click the General detail window.
4) In the General detail window, configure the Details, Durations, Units and Costs, Status,
and Constraints sections to represent the information you want to display for that
activity.
5) On the Activities page, click the Actions menu and select Save (Ctrl+S).

246
Recalculating Assignment Costs
Recalculate assignment costs to update price per time values on activities. This ensures
that project costs reflect any updates.
To recalculate assignment costs:
1) Open one or more projects in the Projects section using one of the following methods:
Click Projects to open the last project or group of projects you were working
with.
Click the Projects menu and choose one of the most-recently used projects
or group of projects.
Click the Projects menu and choose Open Projects to select a project or
group of projects by portfolio type, EPS node, or project code.
2) On the Projects navigation bar, click Activities.
3) On the Activities page:
a. Select an activity.
b. Click the Actions menu and select Run Recalculate Assignment Costs.
4) In the Recalculate Assignment Costs dialog box:
a. (Optional) Select the Synchronize Overtime Factor option to synchronize the
overtime factor defined for each resource when recalculating costs.
b. Click Recalculate.
Tips
When activity dates change, run Recalculate Assignment Costs to update resource
costs based on the new dates.
These services are removed from the database based on the ASAP Cleanup Rate
your P6 administrator specifies on the Configurations tab in P6 Administrator
application. Once the time is met all ASAP jobs that have a status other than running
or delegated will be removed from the table automatically. Running and delegated
jobs will be removed if they are older than the cleanup rate or if they are older than
one day, whichever is greater.
Sending Project Data to ERP
If P6 is configured to function with an Oracle Enterprise Resource Planning (ERP)
application, such as JD Edwards EnterpriseOne, and your administrator has granted you
appropriate security privileges, you can send project cost data for an approved and
baselined project to the configured ERP application for integration. The data from your
projects then becomes available within your ERP applications for assignment and
tracking.
To send project data to ERP:
1) Open one or more projects in the Projects section using one of the following methods:

Projects
247
Click Projects to open the last project or group of projects you were working
with.
Click the Projects menu and choose one of the most-recently used projects
or group of projects.
Click the Projects menu and choose Open Projects to select a project or
group of projects by portfolio type, EPS node, or project code.
2) On the Projects navigation bar, click Activities.
3) On the Activities page, click the Actions menu and select Import/Export
Send to ERP.
Note: Any pending changes are automatically saved.
4) In the Send Projects to ERP dialog box:
a. Select the projects you want to send to ERP.
b. Select or clear the options.
c. Click Send.
Customizing Detail Windows
You can customize which detail windows appear on the EPS or Activities pages.
To customize detail windows:
1) Open one or more projects in the Projects section using one of the following methods:
Click Projects to open the last project or group of projects you were working
with.
Click the Projects menu and choose one of the most-recently used projects
or group of projects.
Click the Projects menu and choose Open Projects to select a project or
group of projects by portfolio type, EPS node, or project code.
2) On the Project navigation bar, click Activities or EPS.
3) On the Activities or EPS page:
a. Select a view from the Activity or EPS View list.
b. Click the View menu and select Customize Detail Windows.
4) In the Customize Detail Windows dialog box:
a. In the Area section, select one of the options to determine which listing of detail
windows is available for you to customize.
b. In the Detail Window section, select or clear the options beside detail windows to
add or remove them from the page.
c. Click Save.

248
Tips
Select or clear the option beside the Detail Window title to add all or remove all the
detail windows.
Right-click a detail window tab to customize detail windows. Click Customize on the
menu to open the Customize Detail Windows dialog box, or click a detail window
name to add or remove it from the page.
Click and drag detail windows to change their order. Otherwise, the detail windows
appear in the same order that they appear in the Customize Detail Windows dialog
box.
Click Float on the detail window to convert it to a dialog box. You can then drag
this dialog box to change its position.
When you navigate to a new page, you can save or cancel the view changes you
made to the detail windows. These changes will only be saved for the view selected
in the Activity or EPS View list.
About Activity Types
One of many attributes for an activity, the Activity Type determines how the activity is
scheduled according to various scheduling scenarios:
Task Dependent: This type of activity indicates that assigned resources should be
scheduled based on the activity's calendar, rather than the calendars of the
resources.
Resource Dependent: This type of activity indicates that resources should be
scheduled based on their assigned calendars. Use this type when the activity
duration may be affected by resource availability.
Level of Effort: This type of activity indicates that it is ongoing with a duration
determined by its dependent activities. The duration is calculated based on the
schedule dates of its predecessors and successors. Administrative activities are
typically designated as Level of Effort.
Start Milestone: This type of activity indicates the beginning of a major project phase.
Activities of this type have a duration of zero (0) with no resource assignments.
Finish Milestone: This type of activity indicates the end of a major project phase.
Activities of this type have a duration of zero (0) with no resource assignments.
About Suspending and Resuming Activities
When updating progress for a project, you might need to record that the work on a
particular activity has been suspended or resumed after a period of inactivity. For
example, an activity might be suspended or resumed due to a plant shutdown. To
record this, you must enter suspend and resume dates. The suspend date is the date on
which an activity's progress has, or is planned to be, stopped. The resume date is the
date progress on an activity begins again. When you indicate a suspend or resume date,
work for the activity is considered to be suspended or resumed at the beginning of the
specified day.

Projects
249
About WBS Summary Activities
A WBS summary activity type represents a group of activities that share a common work
breakdown structure (WBS) level. The summary-level WBS activity enables the rollup of
dates for the activity group. Rollup values for a WBS summary activity are calculated
when the project is scheduled. The duration of a WBS summary activity extends from the
start of the earliest activity in a group to the finish of the latest activity.
The WBS summary activity type combines the summary capabilities of the WBS structure
with task-level attributes such as relationships, resource assignments, and notebooks. Use
this activity type to roll up dates, duration, and percent complete values for a group of
activities that share a common WBS code.
The WBS code of a WBS summary activity determines which activities comprise the
group. For example, a WBS summary activity assigned to WBS code A, would roll up
values for all activities under any subordinate WBS that relates to code A: A.1, A.1.1, A.2,
A.2.1, and so on. If the WBS summary activity in this case were assigned to WBS code A.1,
it would roll up values for activities under WBS A.1 and A.1.1, but not for those activities
under A.2 or A.2.1.
About Gantt Charts
A Gantt chart is a graphical representation of the duration and sequence of activities or
projects. It is useful for planning, scheduling, and monitoring progress against a timeline.
Working with the Activity Gantt Chart
Use the Activity Gantt chart to view the progression and relationships of activities or
projects on a timeline.
Gantt chart bars and activity dates or durations
You can easily update dates and durations by resizing or moving Gantt chart bars. When
you change bar positions in a Gantt chart, the start and finish date columns update
automatically to reflect the new bar position. After moving a Gantt bar, when you save
your changes, the remaining duration is recalculated based on the new dates and the
activity or project calendar. Because this calendar is applied when you save, if you
move but do not resize a Gantt bar, the duration might shorten or lengthen based on the
calendar's nonworktime.
Note: If you click the center of a bar and drag it along the
timescale, you will be prompted to add a Start On or After
constraint. In the Gantt chart, you can impose only a Start On or
After constraint.
Customizing the Gantt chart
You can change the progress line options or the timescale for the Gantt chart in the
Customize Activity View dialog box.

250
Viewing the Gantt chart
In the Gantt chart, a vertical blue line represents the current data date for the project.
Vertical sightlines appear at each minor increment (bottom) of the timescale. Horizontal
sightlines appear at the bottom of every fifth table row. The timescale background is
shaded to indicate nonworktime based on the global default calendar.
Activity highlight
To quickly locate the activities you need to update, you can use the Progress Spotlight
feature, which highlights all activities that should have progressed during a specific time
period. This time period is defined by the smallest increment of the current timescale
since the last data date. For example, if the current timescale is set to Month/Week,
Progress Spotlight highlights all activities that should have progressed during the week
since the data date.
Configuring Gantt Charts
Configure the Gantt chart to adjust activity beginning and finishing dates as well as
constraints.
To configure the Gantt chart:
1) Open one or more projects in the Projects section using one of the following methods:
Click Projects to open the last project or group of projects you were working
with.
Click the Projects menu and choose one of the most-recently used projects
or group of projects.
Click the Projects menu and choose Open Projects to select a project or
group of projects by portfolio type, EPS node, or project code.
2) On the Project navigation bar, click Activities or EPS.
3) On the Activities or EPS page, click the View menu and select Gantt Chart.
4) On the Gantt chart:
a. To resize bars, select a bar and click and drag the beginning or end of it to a new
date. (Only applicable on the Activities page.)
b. To focus the Gantt chart on a specific time interval, double-click a year, quarter,
month, week, or day on the timescale. The Gantt chart timescale will expand or
shrink to show the entire time interval.
c. To expand a specific area of the Gantt chart, click the timescale at the top of the
Gantt chart once (the pointer will become a double-headed arrow), move the
pointer to select the portion of the timescale you want to expand, and click again.
You can perform this step several times.
d. To apply a Start On or After Activity Constraint, click the middle of a bar and drag it
along the timescale. (Only applicable on the Activities page.)
5) On the Activities or EPS page, click the View menu and select Save (Ctrl+S).
Projects
251
Tips
To back out of a zoom, double-click the top bar of the timescale.
For more information on configuring Gantt charts, see Configuring Activity View Gantt
Chart (on page 289) or Configuring Project View Gantt Chart (on page 235).
After resizing or moving a Gantt bar, when you save your changes, the activity
remaining duration is recalculated based on the new dates and the activity's
calendar. Because the calendar for the activity is applied when you save, a date you
specified for an activity might change slightly if it occurs during calendar
nonworktime. Also, if you move, but do not resize, a Gantt bar, the duration might
shorten or lengthen based on the activity calendar's nonworktime.
If you select the option Do not show this again in the Activity Constraint dialog box, it
will not reappear until the next time you log in.
To create or configure activity relationships in the Gantt chart, see Creating Activity
Relationships (on page 314) or Configuring Activity Relationships (on page 315).
About the Activity Table
The Activity Table presents all WBS and activity information for the currently open projects
in a familiar table format. You can customize Activity Table columns, filters, grouping,
sorting, fonts, and colors.
For example, you might change the information displayed in columns to show
scheduling data, resource and cost data, user-defined fields, or any data items you
select, including calculated data. You can also format specific information to call
attention to it by using the filter, group and sort, and other table display features.
Use the Activity Table to:
Create a list of activities and activity information quickly when you don't need to see
the information graphically over time as in a Gantt chart.
Group activities that share a common attribute into hierarchies. For example, focus
on activities by resource, responsibility, or date. Once you organize activities into
groups, you can summarize or "roll up" project data to simplify their presentation.
Sort activities to arrange them in an order you specify. For example, to view activities
chronologically, you might sort them by a date field.
About Activity Networks
An Activity Network is a graphical display of activities and their logical relationships
according to the WBS. You can use an Activity Network to view activity relationship paths
and the flow of work through a project. Activity Networks also allow you to examine and
edit an activity and its predecessors and successors.

252
Working with Activities in the Activity Network
In addition to the Activity Table format, you can also view activities in an Activity
Network. You can also include your choice of WBS and activity detail windows in this
alternate viewing format.
The Activity Network maps the WBS elements and activities in your project into a series of
interconnected boxes. Arrows between boxes represent the relationships between
activities. The standard color-coded activity status icons also appear in this viewing
format: black diamonds represent milestones, and other status icons reveal when an
activity is not yet started, in progress, completed, or critical. Activity boxes
outlined in red represent critical activities while activity boxes outlined in blue are not.
Activity Network
Item Description
Activity View: Select an activity view that already includes the Activity
Network or click Activity Network.

Projects
253
Item Description
Activity Network: The arrow from a predecessor activity points to its
successor. Solid red lines between boxes represent critical relationships,
while blue lines represent non-critical relationships. Solid lines represent
driving relationships, which indicate when a predecessor activity
influences the start date of its successor. The predecessor drives the start
date of the successor activity by causing it to start earlier or later than the
scheduled date depending on the finish date of the predecessor.
Dashed lines represent non-driving relationships, which include all
predecessor and successor activity relationships: Start-to-Start,
Finish-to-Start, Start-to-Finish, and Finish-to-Finish. You can show only
driving relationships or show all relationships.
Customize Activity Network: You can customize the content and
arrangement of the boxes that represent your activities in the network. If
you select the Show progress option on the Customize Activity Network
dialog box or on the Activity Network tab of the Customize Activity View
dialog box, you can view activity progress in the Activity Network.
Completed activities are marked with an X across the activity box.
Activities in progress are marked with a slash (\) across the activity box.
Detail Windows: The same WBS and Activity detail windows are available
with any activity viewing format. In this example, the user has elected to
show the Risks detail window. When you select an Activity Network box,
the selected box displays a light blue background while the boxes that
are not selected display a gray background.
Note: P6 identifies relationships as driving when all of the following
are true: 1) the successor activity has Free Float less than or equal
to zero; 2) the activity does not have a Start On or Finish On
constraint; and, 3) the activity does not have an Actual Finish date.
About Calendar View
The Calendar View displays activities in a monthly calendar format. Bars on the calendar
represent each activity and its duration.

254
Working with Activities in Calendar View
In addition to the Activity Table format, you can also view activities in a calendar format,
including a special Day View detail window. You can also include your choice of WBS
and activity detail windows in this alternate viewing format.
The Activity Calendar Viewing Format
Item Description
Activity View: Select an activity view that already includes the Calendar
or click Calendar View.
Calendar Work Area: View project activities in the calendar by month.
Use the controls at the top to view the next or previous month. In
Calendar View, activity bars display in the color specified within the First
Bar section of the Bars tab in the Customize Activity Views dialog box, or
as the color assigned to an activity code value. Critical activities display
as red bars. Milestones display as black diamonds.
Day View Detail Window: Double-click an activity in the Calendar View to
see the activities assigned to an individual day. When more activities are
scheduled on a day than can be displayed in a day of Calendar View,
an ellipsis is displayed within the day.

Projects
255
Item Description
Detail Windows: The same WBS and activity detail windows are available
with any activity viewing format. In this example, the user has elected to
show the Trace Logic detail window below the Calendar View.
About Siblings and Children
Siblings and children represent levels in a hierarchy. Elements at the same level are
siblings, and are of equal importance. A subordinate element is a child.
About Work Breakdown Structures (WBS)
A WBS, or work breakdown structure, is a hierarchical arrangement of work activities that
divides a project into discrete levels, phases, or layers. The WBS is structured in levels of
work detail, beginning with the deliverable and separated into identifiable work
elements.
When creating a project, the project manager typically develops the WBS first. The
manager assigns documents to each WBS element, and then defines activities to
complete that element. In addition to document and activity assignments, each WBS
element can also have specific earned value calculation settings, issue assignments,
and notebook topics.
Each project has its own WBS hierarchy with the top-level WBS element equal to that of
each enterprise project structure (EPS) node or project. Each WBS element can contain
more detailed WBS levels, activities, or both.
Working with WBS Elements
If you have the required privilege, you can add, modify, or delete WBS elements.
Before you begin
To add, edit, or delete WBS elements, whether you are working with a single project or a
group of projects, you must be working in an EPS view that is organized based on all
levels of the WBS hierarchy. Either select this type of view from the EPS View list or, if
necessary, create one.
Add WBS elements
Except for the top level element of the WBS hierarchy, which represents the project, you
can add a WBS element at the same level as an existing element (sibling) or at a
subordinate level (child). At the top level of the WBS, you can add only child elements.
Modify WBS elements

256
Horizontal arrows change the level of an element in the hierarchy. Vertical arrows
change the position of an element within its current level.
Delete WBS elements
If you attempt to delete a WBS that has activities associated with it, you must specify
what you want to do with the activities:
To delete the WBS, but reassign its activities to the parent WBS, select Merge.
To delete both the WBS and its associated activities, select Delete.
Note: These two options also appear if the WBS has both activities
and planned resource allocations. However, resource allocations
cannot be merged. Regardless of the option you choose, the
planned resource allocations are deleted. For this reason, when a
WBS has planned resource allocations but no activities, these
options do not appear.
Creating a WBS
Create a work breakdown structure to divide a project into levels. You can create sibling
WBSs to represent WBSs that are hierarchically equal, or child WBSs to represent WBSs that
are subordinate to projects or other WBSs.
To create a WBS:
1) Open one or more projects in the Projects section using one of the following methods:
Click Projects to open the last project or group of projects you were working
with.
Click the Projects menu and choose one of the most-recently used projects
or group of projects.
Click the Projects menu and choose Open Projects to select a project or
group of projects by portfolio type, EPS node, or project code.
2) On the Projects navigation bar, click Activities.
3) On the Activities page:
a. Select a WBS or project. The WBS can act as a sibling or a parent. The project will
act as a parent.
b. Click the Actions menu:
To add a sibling, select Add Add Sibling WBS (Shift+Insert).
To add a child, select Add Add Child WBS (Ctrl+Insert).
c. Enter a name in the WBS/Activity field of the new WBS.
d. Click the Actions menu and select Save (Ctrl+S).

Projects
257
Tips
To add, edit, or delete WBS elements, whether you are working with a single project or
a group of projects, you must be working in an activity view that is organized based
on all levels of the WBS hierarchy. This type of view is identified by the (WBS) icon.
Click the Activity View list on the Activities toolbar, and select this type of view or, if
necessary, create one. See Creating Activity Views (see "Creating Views" on page
282).
The WBS will automatically be assigned a name based upon the project or WBS you
select. For example, if the project or WBS is named WBS: Business Project 1.5, the
application will automatically name the new WBS: Business Project 1.6.
You can also right-click a WBS or project and select Add Sibling WBS or Add Child WBS
to create a WBS.
Adding a WBS from Template
You can add a predefined WBS element from a template to a project.
To add a WBS from template:
1) Open one or more projects in the Projects section using one of the following methods:
Click Projects to open the last project or group of projects you were working
with.
Click the Projects menu and choose one of the most-recently used projects
or group of projects.
Click the Projects menu and choose Open Projects to select a project or
group of projects by portfolio type, EPS node, or project code.
2) On the Projects navigation bar, click Activities.
3) On the Activities page:
a. Click the View menu and select Table.
b. Click the View menu and select Group....
c. On the Customize Groupings dialog box, set the Level 1 field to WBS and the Sort
Order to Hierarchy. Click OK.
d. In the Activity Table, right-click a project or WBS element and select Add WBS
from Template.
4) In the Select WBS dialog box, select a WBS from the list of templates and click OK.
5) On the Activities page:
a. Update the name in the WBS/Activity field.
b. Click the Actions menu and select Save (Ctrl+S).
Tips
The application automatically assigns the WBS element a name based upon the
selected WBS.

258
Configuring General WBS Information
Configure WBS information to account for any updates or changes made to the WBS.
To configure general WBS information:
1) Open one or more projects in the Projects section using one of the following methods:
Click Projects to open the last project or group of projects you were working
with.
Click the Projects menu and choose one of the most-recently used projects
or group of projects.
Click the Projects menu and choose Open Projects to select a project or
group of projects by portfolio type, EPS node, or project code.
2) On the Projects navigation bar, click Activities.
3) On the Activities page, select a WBS and click the General detail window.
4) In the General detail window:
a. Add the columns you need to configure to the detail window. See Showing and
Hiding Columns in a Table (see "Showing or Hiding Columns in a Table" on page
91).
b. Select an option or enter a value for each field.
5) On the Activities page, click the Actions menu and select Save (Ctrl+S).
About Baselines
A baseline is a copy, or snapshot, of project data at a given time. Because a baseline is a
static representation of a project plan, it can be used as a benchmark against which to
measure performance as a project progresses.
You can create multiple baselines to establish metrics throughout the project life cycle.
Typically, you would want to create an initial baseline once the project plan is approved,
then you would create additional baselines according to your organization's
requirements. For example, you could create new baselines at specific reporting
intervals.
Although many baselines can be created for a project, only two baselines can be used
at any given time to display and compare data. These are known as the Project Baseline
and User's Primary Baseline. The current project can also be used as the baseline, for
example, in situations where no other baseline yet exists.
The Project Baseline is a single metric for comparison that enables all members of a team
to have a shared and consistent set of data against which to evaluate project progress.
There is only one Project Baseline at any time. All pages that display summarized data
compare and display data against the Project Baseline.
The User's Primary Baseline is an optional personal baseline that is used to evaluate
project progress.

Projects
259
Related Topics
About Baseline Types ............................................................................................. 464
Working with Baselines
Before you update a schedule for the first time, you should create a baseline plan. The
simplest baseline plan is a complete copy, or snapshot, of the original schedule. This
snapshot provides a target against which you can track a project's cost, schedule, and
performance. You can save a copy of the current project to use as the baseline or you
can convert another project in the EPS hierarchy to a baseline for the current project.
To help categorize, or track, multiple baselines for a single project, you can assign each
baseline a type that reflects its purpose, for example, initial planning baseline, What-if
project baseline, customer sign-off, or midproject baseline.
Regardless of the number of baselines you store for a project, at any given time you can
only select at most two baselines for use in making comparisons in P6. The project-level
baseline is used for project/activity usage spreadsheets and profiles, as well as for
earned value calculations.
You can convert another project in the EPS hierarchy to a baseline for use in comparisons
with the current project. Before converting a project to a baseline, if you still want to
have access to the original project, you should make a copy of it. Once you convert a
project to a baseline, it is no longer available in the project hierarchy. You can restore a
baseline, making it available again as a separate project in the project hierarchy, in
order to modify it or update it.

260
Note: You must have the Edit Project Details Except
Costs/Financials and Assign Project Baseline project privileges to
set the project baseline.
Table of Working with Baseline Elements
Item Description
Define Baselines: Use Define Baselines to add, modify, convert, and
restore projects and baselines.

Projects
261
Item Description
Add Baselines: When you add a baseline, give it a name, assign it a type,
and decide if you want to make it the Project Baseline or User's Primary
Baseline for the currently selected project. Baseline designations are
made in the projects rows of the table highlighted in blue.
Convert a Project to Baseline: Save a copy of the baseline before you
convert it. Convert a project to use it as a baseline for a current project.
Restore a Baseline: Use restore a baseline to modify a baseline project.
You must first unlink a baseline from its current project by restoring it as a
separate project. You can then work with this restored baseline project as
you would any other project in the EPS.
Baseline Type: Assign baseline types to baselines to help categorize
multiple baselines for a single project. Configure the available baseline
types along with your other Enterprise Data settings.
Project Baseline: Lists the available baselines for the selected project.
Select the baseline to use as the project baseline. If a baseline does not
exist, the current project is the default value.
User's Primary Baseline: Select the user's primary baseline from the list of
available baselines. If a baseline does not exist, the current project is the
default value.
Note: You can define up to three baselines for a project in P6
Professional.
Creating Baselines
Create baselines to measure project performance.
To create a baseline:
1) Open the project or projects for which you want to create a baseline using one of the
following methods:
Click Projects to open the last project or group of projects you were working
with.
Click the Projects menu and select one of the most-recently used projects
or group of projects.
Click the Projects menu and select Open Projects to select a project or
group of projects by portfolio type, EPS node, or project code.
2) On the Project Navigation bar, click Activities or EPS.

262
3) On the Activities or EPS page, click the Actions menu and select Define
Baselines....
4) In the Baselines dialog box:
a. Select the project to which you will add the baseline.
b. Click Add Baseline.
c. Enter a name in the Baseline Name field.
d. Select a type from the Baseline Type list.
e. Click Save (Ctrl+S).
Tips
The application automatically assigns the baseline a name based on the selected
project. For example, if you select Project A, the application will name the newly
created baseline A - B1.
Specify the default Project Baseline and User's Primary Baseline by selecting from the
list of available baselines for each project in the table on the Baselines dialog box.
Click Convert a Project to Baseline and select a project to convert a project into a
baseline.
Select a baseline and click Restore a Baseline to remove the baseline and make it a
project.
About Scheduling
Schedule is the order in which activities occur over the course of a project. A schedule
follows the constraints imposed by activity relationships and the date types to which an
activity must adhere. A good project schedule can serve as a key management tool for
making decisions and predicting whether the project will finish on time and within
budget. When there are updates to activities or resources, you can reschedule projects
to account for these changes. Regularly updating schedules and comparing them with
baseline schedules ensures that you are using resources effectively, monitoring project
costs against budget, and keeping track of actual durations and costs.
Scheduling Projects
Schedule projects to keep track of activities, actual durations, and costs. Knowing where
these stand will help you when making decisions and predictions about the project.
To schedule projects:
1) Open one or more projects in the Projects section using one of the following methods:
Click Projects to open the last project or group of projects you were working
with.
Click the Projects menu and choose one of the most-recently used projects
or group of projects.

Projects
263
Click the Projects menu and choose Open Projects to select a project or
group of projects by portfolio type, EPS node, or project code.
2) On the Projects navigation bar, click Activities.
3) On the Activities page, click the Actions menu and select Run Scheduler...
(F9).
4) In the Schedule Project dialog box:
a. Configure the options and fields.
b. Click Schedule.
Tips
See Configuring General Scheduling Options (on page 263) or Configuring Advanced
Scheduling Options (on page 264).
This schedules all open projects at the same time. If you do not have scheduling
privileges for all the open projects, Scheduler is disabled.
You can have the application schedule projects automatically. See Creating
Schedule Services (see "Creating Scheduled Services" on page 395).
These services are removed from the database based on the ASAP Cleanup Rate
your P6 administrator specifies on the Configurations tab in P6 Administrator
application. Once the time is met all ASAP jobs that have a status other than running
or delegated will be removed from the table automatically. Running and delegated
jobs will be removed if they are older than the cleanup rate or if they are older than
one day, whichever is greater.
Configuring General Scheduling Options
Configure general scheduling options to define general defaults used when scheduling
projects.
To configure general scheduling options:
1) Open one or more projects in the Projects section using one of the following methods:
Click Projects to open the last project or group of projects you were working
with.
Click the Projects menu and choose one of the most-recently used projects
or group of projects.
Click the Projects menu and choose Open Projects to select a project or
group of projects by portfolio type, EPS node, or project code.
2) On the Projects navigation bar, click Activities.
3) On the Activities page, click the Actions menu and select Run Scheduler...
(F9).
4) In the Schedule Project dialog box, click Options.
5) In the Scheduling Options dialog box, click the General tab.
6) On the General tab:

264
a. Select or clear the options.
b. If your selections enable a field or list, enter a value or select an option from the list.
c. Click Save.
Tips
When multiple projects are open, the scheduling options that display by default are
the options defined for the first project listed.
These options are applied to all open projects; close or open projects to control
which projects are configured.
Activities whose float does not exceed the value you specify in the Total Float less
than or equal to field are considered critical.
Configuring Advanced Scheduling Options
Configure advanced scheduling options to define float paths.
To configure advanced scheduling options:
1) Open one or more projects in the Projects section using one of the following methods:
Click Projects to open the last project or group of projects you were working
with.
Click the Projects menu and choose one of the most-recently used projects
or group of projects.
Click the Projects menu and choose Open Projects to select a project or
group of projects by portfolio type, EPS node, or project code.
2) On the Projects navigation bar, click Activities.
3) On the Activities page, click the Actions menu and select Run Scheduler...
(F9).
4) In the Schedule Project dialog box, click Options.
5) In the Scheduling Options dialog box, click the Advanced tab.
6) On the Advanced tab, select the Calculate multiple float paths option.
a. Select Total Float or Free Float.
b. Enter or select a value for each field.
c. Click Save.
Tips
These options are applied to all open projects; close or open projects to control
which projects are configured.
You can select any activity in the Display Multiple Float Paths ending with activity
dialog box; however, typically this activity is a milestone or some other major activity
in the project schedule.
To optimize performance, type a low number (10 or less) in the Specify the number of
paths to calculate field.

Projects
265
About Float
Float is a discretionary measure of a schedule's flexibility or slack. While managers are
most often concerned with overall network float variance along the critical path (Total
Float), the float time for a single activity (Free Float) is also helpful in managing day to
day operations. For example, if an activity has ten days of free float, management may
decide to assign its intended resource to another task.
Free Float is the maximum number of hours or days an activity can be delayed without
also delaying the early start dates of any immediate successor activities.
Total Float is the total maximum number of hours or days an activity can be delayed
without also delaying the project finish date or another scheduling constraint. Total Float
is calculated using the critical path method to determine the variance between early
finish and late finish dates.
About Critical Path Activities
Critical path activities are project tasks that must start and finish on time to ensure that a
project ends on schedule. A delay in any critical path activity will delay completion of
the project, unless the project plan can be adjusted so that successor tasks finish more
quickly than planned. Critical activities can be one of two types: float and longest path.
Float is a measure of schedule flexibility. The application uses the Critical Path Method
(CPM) to generate a project schedule. This method calculates four dates for each
activity in the project plan: Early Start, Late Start, Early Finish, and Late Finish. If the Early
Start date and Late Start date for an activity are the same, the activity is said to have
zero float. Activities that have zero float must start on time to prevent the schedule from
slipping. When an imposed finish date creates a schedule that is shorter than the
duration calculated to complete the activities on the critical path, a project has
negative float. A project with negative float is behind schedule.
To meet the specific requirements of your project, you can specify the float tolerance
used to identify activities as critical. For example, in some situations you might want
critical activities to be those with zero or negative float. In other situations, activities with
float of three days or less might be identified as critical.
Longest path defines the sequence of driving activities that determine the project end
date. Longest path calculation includes interproject relationships. Therefore, activities
designated as on the longest path might change depending on whether you schedule a
project alone or with its related projects. If a project has interproject relationships and
you schedule it alone, the interproject relationships are treated as scheduling constraints.
The longest path is broken when activities are no longer driven by relationships; that is,
when activity dates are driven by constraints or resource leveling.
Working with Critical Path Activities
Analyze the schedule using multiple critical float paths

266
When you schedule a project, you can choose to calculate multiple critical float paths
(sequences of activities) that affect the project schedule. By calculating multiple critical
float paths, you can determine the most critical path in the project schedule, along with
sub-critical paths that affect the completion of the most critical path.
While you can determine the critical path of activities based on total float or longest
path, these methods do not offer insight into sub-critical paths that might also affect the
project schedule. For example, if you choose to identify critical activities based on a
maximum total float threshold, P6 will identify all activities beyond the threshold as critical
even if the activities have no relationships or do not affect the project end date.
Likewise, if you choose to identify critical activities based on longest path, P6 will identify
the critical path of activities but will not identify sub-critical paths that affect the critical
path.
On the Advanced tab of the Scheduling Options dialog box, you can choose to
calculate a specific number of critical float paths based on total float or free float. You
can also choose the activity you want the float paths to end on. By choosing an activity,
you can calculate multiple float paths that affect the entire project schedule, a specific
part of the schedule, or a milestone in the schedule.
When you schedule the project, P6 identifies the most critical float path in the schedule
and assigns those activities a Float Path value of 1. Then, depending on the number of
paths you choose to calculate, P6 identifies other float paths (sub-critical float paths)
that affect the most critical float path and numbers the paths in ascending order
(beginning with 2) based on the criticality of the path.
After you schedule a project, you can display the Float Path and Float Path Order
columns in the table on the Activities page. Group by Float Path to view the activities in
each critical float path, then sort by Float Path Order to view the order in which the
activities were processed.
Note: Calculating multiple critical float paths does not affect how
you define critical activities. When you schedule a project, you
must choose to define critical activities by a maximum float time or
by longest path on the General tab of the Scheduling Options
dialog box. When you run the scheduler, activities are flagged as
critical based on this setting. If you also choose to calculate
multiple critical float paths, the float paths are calculated after the
project has been scheduled. Critical activities that are not part of a
critical float path remain tagged as critical.

Projects
267
About Schedule Preview
After modifying activity, relationship, and assignment data, but before deciding to
formally schedule a project, use the optional Schedule Preview feature to estimate
schedule changes without actually committing them to the project. Schedule Preview
automatically recalculates the schedule for activities that have changed or were
affected by a change to a relationship, resource assignment, or another activity. You
can then decide to commit these changes to the schedule or, if the preview produces
unwanted results, discard them. If Schedule Preview is disabled, changes to activities are
not reflected in the schedule until you manually calculate the schedule again.
Enabling Schedule Preview
Enable Schedule Preview to have the application automatically calculate the schedule
for a project each time you add or delete an activity relationship, change an activity
duration or relationship type, or change anything that affects schedule dates. This
feature is available on the Activities page when you open a single project; it is disabled if
more than one project is open.
To enable Schedule Preview for a project:
1) Open the project you need to schedule using one of the following methods:
Click Projects to open the last project you were working with.
Click the Projects menu and select one of the most-recently used projects.
Click the Projects menu and select Open Projects to select a project by
portfolio type, EPS node, or project code.
2) On the Projects navigation bar, click Activities.
3) On the Activities page:
a. Click the Actions menu and select Run Schedule Preview to turn on
Schedule Preview mode.
b. Update one or more activities; the activities will automatically be rescheduled.
c. Click the Actions menu and select Save (Ctrl+S).
4) In the Schedule Project dialog box:
a. To keep the changes and schedule the project, click Yes.
b. If you do not want to keep these changes or do not want to schedule the project,
click No.
Tips
The Schedule Preview icon is disabled if more than one project is open, or if you do
not have the Schedule Project privilege for the open project.
To turn Schedule Preview mode off, click the Actions menu and select Run
Schedule Preview again so it is not highlighted on the Run menu.

268
If filters are applied to your current view, the application will prompt you to remove
the filters before the project is scheduled. You might find it helpful to create an
unfiltered activity view that you can use when you want to enable the Schedule
Preview. See Creating Views (on page 282) for help. If the removal of filters from the
current view causes you to exceed your activity limit, you will receive a message and
the feature will not be turned on. You will then need to ask your administrator to
increase the activity limit to run this feature.
About Resource Leveling
Resource leveling is an automated process that can change the start date of activities.
Level resources in your project schedule to ensure that resource demand does not
exceed resource availability. Typically, you level during the forward pass through a
project. This determines the earliest dates to schedule an activity when sufficient
resources will be available to perform the task. If forward leveling delays the project's
early finish date, a backward pass might be necessary to recalculate late dates.
During resource leveling, the resource requirements of all scheduled activities are
compared to the maximum quantity available at the time of leveling, and an activity is
only scheduled to occur when its resource demands can be met. To accomplish this,
tasks can be delayed to resolve resource availability conflicts.
Leveling Resources
Level one or more projects whenever the required shared or critical resources have
limited supply or availability or to generally keep resource usage at a constant level. For
example, when a resource has been assigned to more than one activity during the same
time period, level the projects to eliminate potential resource over-allocation. In short,
resource leveling re-distributes work among other available resources.
To level resources:
1) Open one or more projects in the Projects section using one of the following methods:
Click Projects to open the last project or group of projects you were working
with.
Click the Projects menu and choose one of the most-recently used projects
or group of projects.
Click the Projects menu and choose Open Projects to select a project or
group of projects by portfolio type, EPS node, or project code.
2) On the Projects navigation bar, click Activities.
3) On the Activities page, click the Actions menu and select Run Leveler...
(Shift+F9).
4) In the Level Resources dialog box:

Projects
269
a. Select the Options tab to configure resource leveling options and set optional
leveling priorities to specify which assignments are leveled first when a conflict
exists.
b. Select the Resources tab to specify which resources should be leveled.
c. (Optional) Click Save to save your settings and close the dialog box.
d. Click Level.
Tips
You can have the application level resources automatically. See Creating Schedule
Services (see "Creating Scheduled Services" on page 395).
These services are removed from the database based on the ASAP Cleanup Rate
your P6 administrator specifies on the Configurations tab in P6 Administrator
application. Once the time is met all ASAP jobs that have a status other than running
or delegated will be removed from the table automatically. Running and delegated
jobs will be removed if they are older than the cleanup rate or if they are older than
one day, whichever is greater.
Configuring Resource Leveling Options and Priorities
Level resources in your project schedules to ensure that resource demand does not
exceed resource availability. To handle scheduling conflicts that might occur during
leveling, you can add priorities that specify which project or activity is leveled first. Before
leveling, configure the options and priorities specified in the steps below.
To configure resource leveling options and priorities:
1) Click the Projects menu and select Open Projects.
2) On the Open Projects dialog box, open the projects for which you need to configure
resource leveling options and priorities. See Opening Projects, Portfolios, or Templates
(on page 202).
3) On the Projects navigation bar, click EPS.
4) On the EPS page, click the View menu and select Columns.
5) In the Customize Columns dialog box, expand the General section in the Available
Columns list and double-click Project Leveling Priority to add it to the Selected
Columns list and click OK.
6) On the EPS page:
a. Enter a value in the Project Leveling Priority field for each project.
Note: Enter a value from 1, the highest priority, to 100, the lowest.
The default is 10.
b. Click the Actions menu and select Save (Ctrl+S).
7) On the Projects navigation bar, click Activities.
8) On the Activities page, click the View menu and select Columns.

270
9) In the Customize Columns dialog box, expand the General section in the Available
Columns list and double-click Activity Leveling Priority to add it to the Selected
Columns list and click OK.
10) On the Activities page:
a. Enter a value in the Activity Leveling Priority field only for those activities that
require a specific change to their leveling priority. For example, a Normal activity
might become a Top priority.
b. Click the Actions menu and select Run Leveler... (Shift+F9).
11) In the Level Resources dialog box, click the Options tab.
12) On the Options tab:
a. Select the Consider assignments in other projects with priority equal or higher than
option and select a value from the list to include in the leveling process projects
that are not currently open, but that do fit the required priority level.
b. Select or clear the Preserve scheduled early and late dates option to determine if
the leveling process can alter activity dates or not.
If you select this option, configure the options it enables.
c. Select or clear the Recalculate assignment costs when leveling option to
determine if the application should automatically recalculate assignment costs if
they are affected by the leveling.
d. Select the Display leveling log upon completion option if you would like to see a
summary of activities delayed by leveling and exceptions made for critical
activities.
e. In the Leveling Priorities section, specify priorities that will be used to level the
activities. Add priorities in the order in which you want the application to consider
them. For each priority you add, repeat the following steps:
1. Click Add.
2. In the Field Name list, select Project Leveling Priority, Activity Leveling Priority, or
another field.
3. In the Sort Order list, select Ascending, Descending, or, for some fields,
Hierarchy.
13) In the Level Resources dialog box, click the Resources tab.
14) On the Resources tab, select an option and click Save.
Note: If you select Selected Resources, add resources to the
Selected Resources list. See Customizing Selected Lists (see
"Configuring Columns or Values" on page 91).
Tips
You cannot edit the Project Leveling Priority of a project if you do not have the
appropriate security privileges or if the project is checked out or opened exclusively by
another user.

Projects
271
About The Apply Actuals Feature
After progress is recorded by approving timesheets, entering actual data, or setting the
Auto Compute Actuals option, you can run the Apply Actuals feature to update the
schedule. The Apply Actuals feature runs as a service and schedules activities with
progress and/or activities that have the Auto Compute Actuals option set.
When you run Apply Actuals, you can move the data date. P6 schedules activities only
within the specified time period (between the current data date and new data date)
and calculates progress for those activities that are set to automatically calculate
actuals.
Working with the Apply Actuals Feature
Before you run the Apply Actuals command, decide which method you will use to
update progress, Auto Compute Actuals or P6 Progress Reporter (timesheets). If using the
Auto Compute Actuals method, ensure project managers have marked the Auto
Compute Actuals option for select activities, resources, and expenses. If using timesheets,
make sure all project resources have recorded their timesheets in P6 Progress Reporter
and those timesheets have been approved.
When you run the Apply Actuals command, both methods are invoked to determine the
actuals that are applied to a given project:
1. Auto Compute Actuals method: Actual values and dates are progressed for the
activities (and their resources and expenses) that are scheduled to occur
between the last data date and the new one. This method acts on activities,
resources, and expenses that have their Auto Compute Actuals option selected.
2. Timesheets method: Actual timesheet hours from P6 Progress Reporter are applied.
This method acts on resource assignments for resources with the Uses timesheets
option set. In P6 Progress Reporter you also have the option of updating the
following, depending on what fields are being updated:
a. Actual units
b. Actual and Remaining Units

272
c. Actual and Percent Complete
Table of Key Elements When Applying Actuals
Item Description
Uses Timesheets option: Select this option to indicate you want to allow
this resource to enter hours using timesheets provided by P6 Progress
Reporter. When applying actuals to the schedule, actual duration units
(e.g., hours) for all the selected resource's assignments will be updated
based on timesheet data.

Projects
273
Item Description
Auto Compute Actuals option: Select this option to indicate you want
actual hours to be updated for resources (shown in this example),
activities, and/or expenses when project actuals are applied.
Auto Compute Actuals option: Select this option to indicate you want
actual hours to be updated for activities (shown in this example),
resources, and/or expenses when project actuals are applied.
Apply Actuals icon: Click this toolbar icon or select it from the Actions
menu to open the Apply Actuals dialog box.
Apply Actuals dialog box: From the list of open projects, select the ones
you want actuals to be applied to. You can also apply a new data date.
Right-click and select Fill Down to apply the new date to multiple
projects. Select a method for calculating the remaining durations in the
Remaining Duration Calculation field.
Example (Labor Resource): Sarah enters her hours for the most recent timesheet period in
P6 Progress Reporter. She then submits her timesheet for review and approval. Once
approved, the timesheet hours are ready to be applied to the project. Paul, the project
manager, runs the Apply Actuals command. P6 looks for all approved timesheets that fall
within the timesheet period and that are less than or equal to the New Data Date value
Paul entered on the Apply Actuals dialog box. Only Sarah's approved actuals that fall
within the timesheet period will get posted. If she enters actuals in timesheets for 5 weeks
but the timesheet period is set for every 2 weeks, the entries that were entered for the 5th
week will not get posted until the next timesheet period. Her approved actual hours will
be applied to the Actual Units field for the appropriate Labor or Non-Labor assignment
which will then trigger the Remaining Units, Actual Duration and Percent Complete fields
to be recalculated.
Example (Non-Labor Resource): A special pump is listed as a non-labor resource for a
project. Since non-labor resources cannot enter actual hours per day in a timesheet, a
designated user defined as a resource enters a lump sum amount of hours used for the
non-labor resource per timesheet period in the Prior Actuals field. When the Apply
Actuals command runs against the project, P6 determines if a value appears in this field,
and if it does, it applies this value (with a special calculation for AIA ERP integrations) to
the Actual Units field.
Applying Actuals to a Project
Apply actuals to update progress on the currently selected projects as of the specified
data date.
To apply actuals:
1) Open one or more projects in the Projects section using one of the following methods:

274
Click Projects to open the last project or group of projects you were working
with.
Click the Projects menu and choose one of the most-recently used projects
or group of projects.
Click the Projects menu and choose Open Projects to select a project or
group of projects by portfolio type, EPS node, or project code.
2) On the Projects navigation bar, click Activities.
3) On the Activities page, click the Actions menu and select Run Apply
Actuals.
4) In the Apply Actuals dialog box:
a. Select the projects to which you want to apply actuals.
b. Select a date from the New Data Date calendar.
c. Select an option from the Remaining Duration Calculation list.
d. Click Apply.
Tips
You can have the application apply actuals automatically. See Creating Schedule
Services (see "Creating Scheduled Services" on page 395).
These services are removed from the database based on the ASAP Cleanup Rate
your P6 administrator specifies on the Configurations tab in P6 Administrator
application. Once the time is met all ASAP jobs that have a status other than running
or delegated will be removed from the table automatically. Running and delegated
jobs will be removed if they are older than the cleanup rate or if they are older than
one day, whichever is greater.
About Updating Progress
To determine how a project is performing and what remains to be done, update its
progress weekly, daily, or as frequently as required. Updating your projects is a two-step
process. First, you record the work progress. Then, you update the project data to reflect
the reported progress; also known as applying actuals.
You can record work progress in a number of ways: you can record progress for
individual activities or resources by entering status data you have collected; you can use
P6 Progress Reporter and collect actual data from resources using timesheets; or you can
automatically calculate progress based on the schedule plan.
Working with Updating Progress
To determine how a project is performing and what remains to be done, update its
progress. Updating a project to reflect the actual work performed to date can be
achieved using any of the following methods:

Projects
275
Manually record progress: Record progress for individual activities or resources by
entering status data from each contributor. Then, run the Apply Actuals feature.
Automatically calculate progress: For individual activities, resources, and expenses,
use the convenient Auto-Compute Actuals feature to estimate work progress based
on the schedule plan. Then, run the Apply Actuals feature. Using these features, the
application calculates and applies the expected progress from the previous data
date to the new data date you specify.
After you update work progress, run the Apply Actuals feature to update actual and
remaining values as of a specified data date. To regularly update a project so that it
reflects current actual and remaining values, run the Apply Actuals process using the
Scheduled Services page.
About the Auto Compute Actuals Feature
Instead of manually recording actual progress or collecting data from P6 Progress
Reporter users, you can automatically calculate expected progress based on the
schedule plan. This technique, which uses an option called auto-compute actuals, is a
quick and convenient way to update your project.
Working with the Auto-Compute Actuals Feature
You can use the auto compute actuals option to automatically calculate expected
progress based on the schedule plan. The auto compute actuals feature is available for
individual activities, resources, or expenses. Because the auto-compute actuals option is
available for these individual elements, you can choose to selectively perform automatic
progress calculations as needed for your project.
Activities
If you select to compute actuals automatically for an activity, the application calculates
the actual dates, percent complete, remaining duration, and actual and remaining units
for all assigned resources and for the activity expenses.
Caution: If you are collecting timesheet data for an activity, you
should not choose the auto-compute actuals option. If you
auto-compute actuals for an activity, when you update the
project, actual and remaining units/costs are automatically
updated for all of the activity's assigned resources. If assigned
resources have existing actuals that they reported for the activity
through P6 Progress Reporter, their reported data is overwritten by
the auto-compute calculations.
If you want to automatically update progress for some, but not all, of an activity's
resource assignments, clear the Auto Compute Actuals option for the activity and select
the option for the specific resources you want to update automatically.
Resources

276
If you select to compute actuals automatically for a resource, the application calculates
the actual and remaining units for all of the resource's assignments.
Note: To turn on the Auto Compute Actuals option for individual
resources, you must have access to the features available through
the Resources section of P6 and have access to the specific
resources through Resource Security privileges.
Expenses
If you select to compute actuals automatically for an expense, the application will
automatically calculate the estimated expenditure for an expense, based on the
schedule plan.
Applying Auto Compute Actuals to Activities
Apply auto compute actuals to activities and P6 will calculate the actual dates, percent
complete, remaining duration, and actual and remaining units for assigned resources
and activity expenses.
To apply auto compute actuals:
1) Open one or more projects in the Projects section using one of the following methods:
Click Projects to open the last project or group of projects you were working
with.
Click the Projects menu and choose one of the most-recently used projects
or group of projects.
Click the Projects menu and choose Open Projects to select a project or
group of projects by portfolio type, EPS node, or project code.
2) On the Projects navigation bar, click Activities.
3) On the Activities page:
1. Click the Activity View list and select an activity view.
2. Click the View menu and select Customize View....
4) In the Customize Activity View dialog box, click the Columns tab.
5) On the Columns tab, expand General in the Available Columns list and double-click
Auto Compute Actuals to add it to the Selected Columns list.
6) In the Customize Activity View dialog box, click OK.
7) On the Activities page:
a. Select the Auto Compute Actuals option for one or more activities.

Projects
277
Caution: If you are collecting timesheet data for an activity, you
should not select the auto compute actuals option. If you auto
compute actuals for an activity, when you update the project,
actual and remaining units/costs are automatically updated for all
of the activity's assigned resources. If assigned resources have
existing actuals that they reported for the activity through P6
Progress Reporter, their reported data is overwritten by the auto
compute calculations.
b. Click the Actions menu and select Save (Ctrl+S).
About Store Period Performance
Using the Store Period Performance feature, you can track actual to date units and
costs. Storing period performance records actuals for the selected financial period along
with earned value and planned value, so you can track previous periods and compare
current and future trends. Users can store period performance for any predefined period
in the Financial Period dictionary.
Storing Period Performance
Use the Store Period Performance feature, to track actual units and costs to date. This
feature allows you to track previous periods and compare current and future trends.
To store period performance:
1) Open one or more projects in the Projects section using one of the following methods:
Click Projects to open the last project or group of projects you were working
with.
Click the Projects menu and choose one of the most-recently used projects
or group of projects.
Click the Projects menu and choose Open Projects to select a project or
group of projects by portfolio type, EPS node, or project code.
2) On the Projects navigation bar, click Activities.
3) On the Activities page, click the Actions menu and select Run Store Period
Performance.
4) In the Store Period Performance dialog box, select projects for which you want to
store performance and click Store.
Tips
To select or clear all projects, select or clear the option at the top of the options
column.

278
These services are removed from the database based on the ASAP Cleanup Rate
your P6 administrator specifies on the Configurations tab in P6 Administrator
application. Once the time is met all ASAP jobs that have a status other than running
or delegated will be removed from the table automatically. Running and delegated
jobs will be removed if they are older than the cleanup rate or if they are older than
one day, whichever is greater.
About Importing and Exporting Data
Import/Export features allow you to bring data into P6 as well as export data to other
tools when needed.
Available Import Options:
Import Projects from other Oracle Primavera users or Microsoft Project
Import Activities
Import Resources
Import Appointments as personal non-work exception time from Microsoft Outlook
and other applications that support the iCalendar format
Available Export Options:
Export Projects
Export Activities
Export Resources
Export Resource Allocation and Cost
Export Project Data to an ERP System
Importing Activities from Excel
You can import new activities into a P6 project from a Microsoft® Excel® (.xls) file.
To import activities:
1) Open one or more projects in the Projects section using one of the following methods:
Click Projects to open the last project or group of projects you were working
with.
Click the Projects menu and choose one of the most-recently used projects
or group of projects.
Click the Projects menu and choose Open Projects to select a project or
group of projects by portfolio type, EPS node, or project code.
2) On the Projects navigation bar, click Activities.
3) On the Activities page, click the Actions menu and select Import/Export
Import from Excel.
4) In the Import Activities dialog box:
a. Click Import File and select a file from the dialog box.

Projects
279
b. Click Select Project and select a project from the dialog box.
c. Click Import.
5) On the Activities page, click the Actions menu and select Save (Ctrl+S).
Tips
The import file must be in Microsoft® Excel® (.xls) format.
Exporting Activities to Excel
You can export activity data to a Microsoft® Excel® (.xls) file.
To export activities:
1) Open one or more projects in the Projects section using one of the following methods:
Click Projects to open the last project or group of projects you were working
with.
Click the Projects menu and choose one of the most-recently used projects
or group of projects.
Click the Projects menu and choose Open Projects to select a project or
group of projects by portfolio type, EPS node, or project code.
2) On the Projects navigation bar, click Activities.
3) On the Activities page:
a. Select a view from the Activity View list.
b. Configure the activity view to determine what data are exported. See Configuring
Activity Views (on page 283).
c. Click the Actions menu and select Import/Export Export to Excel.
4) In the File Download dialog box, click Open to open the Excel spreadsheet or Save to
save the file to your computer.
Tips
All data, except grouping row information, are exported as they appear in the current
activity view.
Creating Import Templates
Create a Microsoft® Excel® template to use when importing new activities into a P6
project.
To create import templates:
1) Open one or more projects in the Projects section using one of the following methods:
Click Projects to open the last project or group of projects you were working
with.

280
Click the Projects menu and choose one of the most-recently used projects
or group of projects.
Click the Projects menu and choose Open Projects to select a project or
group of projects by portfolio type, EPS node, or project code.
2) On the Projects navigation bar, click Activities.
3) On the Activities page:
a. Select an activity view from the Activity View list and configure it to include the
columns you want in the import template. See Configuring Activity View Columns
(on page 284).
b. Click the Actions menu and select Import/Export Create Import
Template.
4) In the File Download dialog box, click Open to modify the template or click Save to
save and close it.
Tips
The import template is created as a Microsoft Excel file with the default file name,
ExportDataToSpreadsheet.
When you select columns for your activity view, include Activity ID or Activity Name to
ensure that these fields are added to the import file spreadsheet. These fields are
required in the spreadsheet to ensure that activities added during import are uniquely
identified in your project when the import has completed.
About Progress Spotlight
Progress Spotlight highlights the activities that should have progressed during a specific
time period. A yellow curtain is dropped behind the activities to enable quick navigation
to the activities in this timeperiod. Use the Progress Spotlight feature (View, Progress
Spotlight) to highlight activities in the layout that have started, progressed, or finished
between the previous data date and the new data date.
About Relationship Lines
Relationship lines graphically illustrate the links between activities in Gantt charts and
Activity Networks. Whether the relationship line is connected to the beginning or end of
an activity bar determines the type of relationship. For more information on relationships,
see About Relationships (on page 314).

Projects
281
About Progress Lines
A progress line is a way to graphically trace progress on activities and see how a project
is performing with regard to its scheduled deadlines. When a progress line is drawn to the
left of the data date, the activity is behind schedule. When a progress line is drawn to the
data date, the activity is on schedule. When a progress line is drawn to the right of the
data date, the activity is ahead of schedule.
Progress lines can be either progress point lines or variance lines. As a progress point line,
the progress line shows either the remaining duration of an activity or the percent of the
activity that has been completed. Progress points are determined by calculating the
difference between current and baseline dates for each activity, or based on actual
progress determined by each activity's remaining duration or percent complete. As a
variance line, the progress line can represent an inconsistency between the planned
and actual start dates or finish dates of a task.
About Activity Views
An activity view is the visual layout of project information. For each view, you can
customize data and content-specific choices such as grouping, column selection, and
visual display options. Selecting the best view for your needs can facilitate the process of
recording project data. For example, to quickly record a range of details for new
activities, you might select a table view which maximizes the number of data columns
available. Or, to automatically apply a particular attribute, such as WBS or activity code,
to newly added activities, you could select a view which groups activities based on that
attribute.
Working with Activity Views
Using activity views
Configure the Activities page and the Customize Activity View dialog box to customize
the views that display the project and activity data you require in a format that meets
your needs. You can save these settings with the view. Save the changes if you want
them to appear the next time you work with the view. Do not save the changes if you
only want your alterations to last for the session.
The view list on the Activities toolbar provides quick and easy access to all activity views
that are available to you. While working with activities, choosing the best view for your
needs can facilitate the process of recording project data.
Choose and organize the data content of a view
You can configure the content and organization of any activity view you create. For
activity views you can access but did not create, you can review activity view settings,
but you cannot make changes.
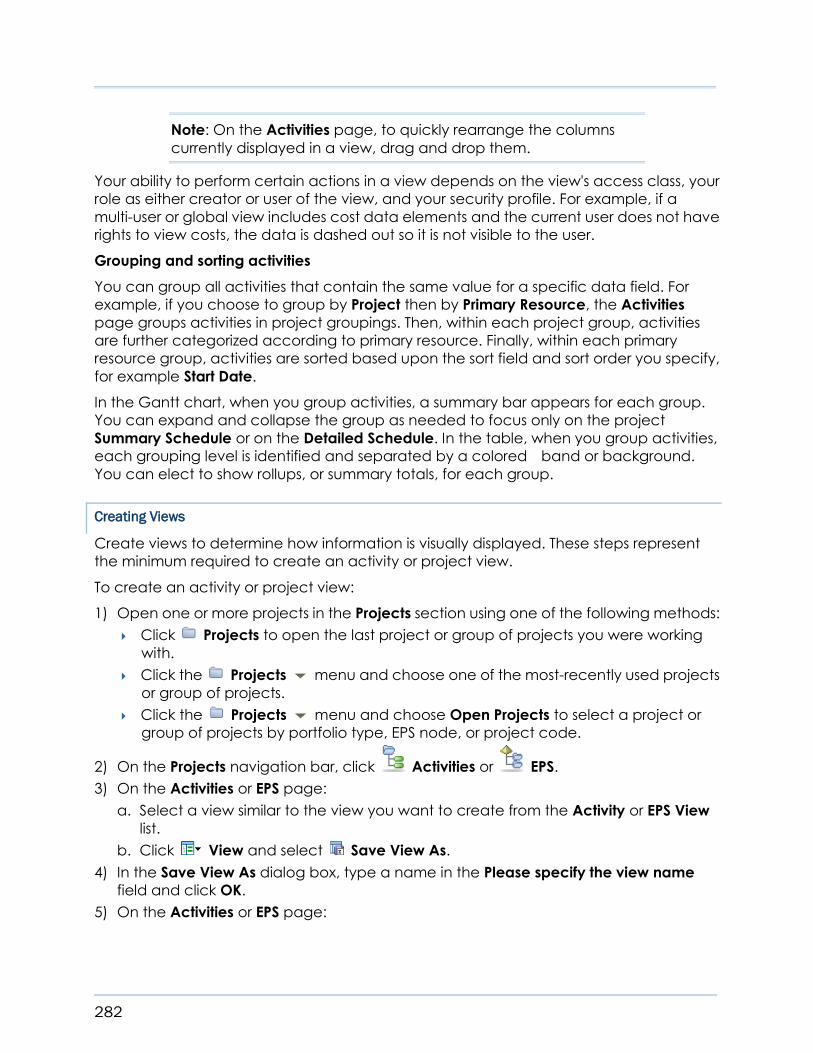
282
Note: On the Activities page, to quickly rearrange the columns
currently displayed in a view, drag and drop them.
Your ability to perform certain actions in a view depends on the view's access class, your
role as either creator or user of the view, and your security profile. For example, if a
multi-user or global view includes cost data elements and the current user does not have
rights to view costs, the data is dashed out so it is not visible to the user.
Grouping and sorting activities
You can group all activities that contain the same value for a specific data field. For
example, if you choose to group by Project then by Primary Resource, the Activities
page groups activities in project groupings. Then, within each project group, activities
are further categorized according to primary resource. Finally, within each primary
resource group, activities are sorted based upon the sort field and sort order you specify,
for example Start Date.
In the Gantt chart, when you group activities, a summary bar appears for each group.
You can expand and collapse the group as needed to focus only on the project
Summary Schedule or on the Detailed Schedule. In the table, when you group activities,
each grouping level is identified and separated by a colored band or background.
You can elect to show rollups, or summary totals, for each group.
Creating Views
Create views to determine how information is visually displayed. These steps represent
the minimum required to create an activity or project view.
To create an activity or project view:
1) Open one or more projects in the Projects section using one of the following methods:
Click Projects to open the last project or group of projects you were working
with.
Click the Projects menu and choose one of the most-recently used projects
or group of projects.
Click the Projects menu and choose Open Projects to select a project or
group of projects by portfolio type, EPS node, or project code.
2) On the Projects navigation bar, click Activities or EPS.
3) On the Activities or EPS page:
a. Select a view similar to the view you want to create from the Activity or EPS View
list.
b. Click View and select Save View As.
4) In the Save View As dialog box, type a name in the Please specify the view name
field and click OK.
5) On the Activities or EPS page:

Projects
283
a. Configure the new view to have the properties you want. See Configuring Activity
Views (on page 283) or Configuring Project Views (on page 229).
b. Click the Actions menu and select Save (Ctrl+S) when you are finished.
Tips
The application will add your new view to the Users section of the Activity or EPS View list.
Configuring Activity Views
Configure activity views to define how you see activity data. Activity views affect the
filters, grouping, and columns that are applied to the Activities page. Detail window
visibility is also affected by the selected activity view.
To configure activity views:
1) Open one or more projects in the Projects section using one of the following methods:
Click Projects to open the last project or group of projects you were working
with.
Click the Projects menu and choose one of the most-recently used projects
or group of projects.
Click the Projects menu and choose Open Projects to select a project or
group of projects by portfolio type, EPS node, or project code.
2) On the Projects navigation bar, click Activities.
3) On the Activities page:
1. Click the Activity View list and select an activity view.
2. Click the View menu and select Customize View....
4) In the Customize Activity View dialog box:
a. Configure the Columns tab. See Configuring Activity View Columns (on page 284).
b. Configure the Grouping tab. See Configuring Activity View Grouping (on page
284).
c. Configure the Filters tab. See Configuring Activity View Filters (on page 285).
d. Configure the Bars tab. See Configuring Activity View Bars (on page 288).
e. Configure the Gantt Chart tab. See Configuring Activity View Gantt Chart (on
page 289).
f. Configure the Activity Network tab. See Configuring Activity View Activity Network
(see "Configuring Activity Network" on page 290).
g. Configure the Access tab. See Configuring Activity View Access (on page 290).
h. Click OK.
Tips
You can modify any view you create. You can only modify multi-user and global
activity views if you have the appropriate security privileges.

284
Many of these configurations, configuring columns and filters for example, do not
require you to open the Customize Activity View dialog box. If the necessary
toolbuttons are available on your toolbar, you can use them to configure the activity
view.
Configuring Activity View Columns
Configure activity view columns to specify which columns are visible in the Gantt chart or
table.
To configure columns:
1) Open one or more projects in the Projects section using one of the following methods:
Click Projects to open the last project or group of projects you were working
with.
Click the Projects menu and choose one of the most-recently used projects
or group of projects.
Click the Projects menu and choose Open Projects to select a project or
group of projects by portfolio type, EPS node, or project code.
2) On the Projects navigation bar, click Activities.
3) On the Activities page:
a. Click the Activity View list and select an activity view to configure.
b. Click the View menu and select Customize View....
4) In the Customize Activity View dialog box, click the Columns tab.
5) On the Columns tab:
a. In the Select the columns to display section, customize the Selected Columns list.
See Customizing Selected Lists (see "Configuring Columns or Values" on page 91).
b. In the Column Options section, select an option from each list.
c. Click OK.
Tips
You can display a maximum of 30 columns.
Click Font Picker and select a font and size from the dialog box to change the font for
a column.
You can customize activity view columns from the View menu. Click the View menu
and select Columns.
Configuring Activity View Grouping
Configure grouping to define how fields are grouped on the Activities page.
To configure activity view grouping:
1) Open one or more projects in the Projects section using one of the following methods:
Click Projects to open the last project or group of projects you were working
with.

Projects
285
Click the Projects menu and choose one of the most-recently used projects
or group of projects.
Click the Projects menu and choose Open Projects to select a project or
group of projects by portfolio type, EPS node, or project code.
2) On the Projects navigation bar, click Activities.
3) On the Activities page:
a. Click the Activity View list and select an activity view to configure.
b. Click the View menu and select Customize View....
4) In the Customize Activity View dialog box:
a. Click the Grouping tab and configure the grouping options in each section.
b. Click OK.
Tips
When activities are grouped, the Gantt chart on the Activities page displays a
summary bar for each group. The summary bar represents the time period from the
earliest Early Start to the latest Early Finish for the group.
Use the To Level list to select the number of hierarchy levels when grouping by a
hierarchical field. When grouping by dates, use the To Level list to select a time
interval.
The band color you select will display in the table and the Activity Network.
You can also access activity view grouping from the View menu. Click the View menu
and select Group.
Grouping bands are displayed by default when you group by a project code or EPS
even if the bands are empty. Select the Hide if empty option in the Customize View or
Customize Groupings dialog boxes to remove these bands from view.
Configuring Activity View Filters
You can modify or create filters. These filters can then be applied to several different
activity views.
To configure activity view filters:
1) Open one or more projects in the Projects section using one of the following methods:
Click Projects to open the last project or group of projects you were working
with.
Click the Projects menu and choose one of the most-recently used projects
or group of projects.
Click the Projects menu and choose Open Projects to select a project or
group of projects by portfolio type, EPS node, or project code.
2) On the Projects navigation bar, click Activities.
3) On the Activities page:
a. Click the Activity View list and select an activity view to configure.

286
b. Click the View menu and select Customize View....
4) In the Customize Activity View dialog box, click the Filters tab.
5) On the Filters tab:
a. You can modify a filter. See Configuring Filters (on page 234).
b. You can create a filter. See Creating Filters (on page 233).
c. You can apply filters. See Applying Filters (on page 232).
d. Click OK when finished.
Tips
The My Activities filter displays all project activities you are either assigned to as a
resource or designated as the activity owner.
For the Activities occurring within (blank) days or Activities finishing within (blank)
days filters, specify a number of days.
You can also customize activity view filters from the View menu. Click the View menu
and select Filters from the Filters submenu.
Applying Filters
Apply filters to a project to specify the data you want to display. You can add
user-created filters or select from the list of standard filters.
To apply filters:
1) Open one or more projects in the Projects section using one of the following methods:
Click Projects to open the last project or group of projects you were working
with.
Click the Projects menu and choose one of the most-recently used projects
or group of projects.
Click the Projects menu and choose Open Projects to select a project or
group of projects by portfolio type, EPS node, or project code.
2) On the Project navigation bar, click Activities or EPS.
3) On the Activities or EPS page:
a. Click the Activity View or EPS View list and select a view to which you will add the
filters.
b. Click the View menu and select Customize View....
4) In the Customize Activity View or Customize Project View dialog box, click the Filters
tab.
5) On the Filters tab:
a. Select an option from the Show matches for list.
b. In the Apply to View column, select the option for each filter you want to apply.
c. Click OK.

Projects
287
Tips
If you have Team Member module access, either assigned as a resource or activity
owner, applying the My Activities filter will have no affect on the activity list display
because your access is already restricted to your assigned and owner activities.
You can also click the View menu and select Filters from the Filters submenu to open
the Customize Filters dialog box. You can apply filters from this dialog box.
If you want to save the application of these filters to the view, click Yes in the
Primavera P6 dialog box which opens when you navigate away from the page.
Creating Filters
Create filters to to narrow activity or project information to a specific data group.
To create filters:
1) Open one or more projects in the Projects section using one of the following methods:
Click Projects to open the last project or group of projects you were working
with.
Click the Projects menu and choose one of the most-recently used projects
or group of projects.
Click the Projects menu and choose Open Projects to select a project or
group of projects by portfolio type, EPS node, or project code.
2) On the Project navigation bar, click Activities or EPS.
3) On the Activities or EPS page:
a. Click the Activity or EPS View list and select a view to which you will add the filters.
b. Click the View menu and select Customize View....
4) In the Customize Activity View or Customize Project View dialog box, click the Filters
tab.
5) On the Filters tab, click Add Filter.
6) In the Create Filter dialog box:
a. Click the Definition tab and configure the fields and lists for one or more filter
statements.
b. Click the Access tab and define user access.
c. Click OK.
Tips
To add more criteria statements, click . To remove a criteria statements, click . To
nest a criteria statement inside another, click . You can add up to ten levels of
nesting.
You can also click the View menu and select Filters from the Filters submenu to open
the Customize Filters dialog box. From this dialog box, you can create filters.
Configuring Filters
You can configure the detailed statements of a filter and who can use it.

288
To configure filters:
1) Open one or more projects in the Projects section using one of the following methods:
Click Projects to open the last project or group of projects you were working
with.
Click the Projects menu and choose one of the most-recently used projects
or group of projects.
Click the Projects menu and choose Open Projects to select a project or
group of projects by portfolio type, EPS node, or project code.
2) On the Project navigation bar, click Activities or EPS.
3) On the Activities or EPS page:
a. Click the Activity or EPS View list and select a view to which you will add the filters.
b. Click the View menu and select Customize View....
4) In the Customize Activity View or Customize Project View dialog box, select a filter
and click Modify Filter.
5) In the Modify Filter dialog box:
a. Click the Definition tab and configure the fields and lists to edit the filter
statements.
b. Click the Access tab, and select an access option.
c. Click OK.
Tips
You can not edit Standard Filters.
To add more filter statements to the Definition tab, click . To remove a filter, click .
To nest a criteria statement inside another, click . You can add up to ten levels of
nesting.
You can also click the View menu and select Filters from the Filters submenu to open
the Customize Filters dialog box. You can configure filters from this dialog box.
Configuring Activity View Bars
Configure bars to represent different items on the timeline in the Gantt chart and the
Calendar View.
To configure activity view bars:
1) Open one or more projects in the Projects section using one of the following methods:
Click Projects to open the last project or group of projects you were working
with.
Click the Projects menu and choose one of the most-recently used projects
or group of projects.
Click the Projects menu and choose Open Projects to select a project or
group of projects by portfolio type, EPS node, or project code.

Projects
289
2) On the Projects navigation bar, click Activities.
3) On the Activities page:
a. Click the Activity View list and select an activity view to configure.
b. Click the View menu and select Customize View....
4) In the Customize Activity View dialog box, click the Bars tab.
5) On the Bars tab, configure the bar options in each section and click OK.
Tips
The Color option you select determines how the bar will be represented, whether by
color or code.
You can configure options for up to three bars.
A Late bar does not display if the project has not been scheduled.
The Progress bar is blue.
Select the Show Critical option to represent critical activities with a red bar instead of
the color you selected for the Current bar.
You might find it helpful to vary the position of the label on the Current bar.
Click Font Picker and select a font and size from the dialog box to change the font for
a bar.
You can also customize activity view bars from the View menu. Click Gantt Chart
Options on the View menu and click the Bars tab.
Configuring Activity View Gantt Chart
Configure Gantt chart options to determine how the chart will display.
To configure Gantt chart options:
1) Open one or more projects in the Projects section using one of the following methods:
Click Projects to open the last project or group of projects you were working
with.
Click the Projects menu and choose one of the most-recently used projects
or group of projects.
Click the Projects menu and choose Open Projects to select a project or
group of projects by portfolio type, EPS node, or project code.
2) On the Projects navigation bar, click Activities.
3) On the Activities page:
a. Click the Activity View list and select an activity view to configure
b. Click the View menu and select Customize View....
4) In the Customize Activity View dialog box:
a. Click the Gantt Chart tab and configure the Gantt chart options in each section.
b. Click OK.

290
Tips
Bar necking extends down to the day.
You can also select Gantt Chart Options on the View menu and click the Gantt Chart
tab in the Customize Gantt Chart Options dialog box to configure Gantt charts.
Configuring Activity Network
Configure an Activity Network to determine how the network displays in the activity view.
To configure an Activity Network:
1) Open one or more projects in the Projects section using one of the following methods:
Click Projects to open the last project or group of projects you were working
with.
Click the Projects menu and choose one of the most-recently used projects
or group of projects.
Click the Projects menu and choose Open Projects to select a project or
group of projects by portfolio type, EPS node, or project code.
2) On the Projects navigation bar, click Activities.
3) On the Activities page:
a. Click the Activity View list and select an activity view to configure.
b. Click the View menu and select Customize View....
4) In the Customize Activity View dialog box, click the Activity Network tab.
5) On the Activity Network tab, configure the options, fields, and level and click OK.
Tips
Select the Split Row option in the Activity Box section to divide a row into two fields.
The Second Field list for that row is disabled until the Split Row option is selected.
You can also customize Activity Network options from the View menu. In the Activity
Network view, select Activity Network Options on the View menu.
Configuring Activity View Access
Configure activity view access to define which users will have access to a particular
view.
To configure access:
1) Open one or more projects in the Projects section using one of the following methods:
Click Projects to open the last project or group of projects you were working
with.
Click the Projects menu and choose one of the most-recently used projects
or group of projects.
Click the Projects menu and choose Open Projects to select a project or
group of projects by portfolio type, EPS node, or project code.

Projects
291
2) On the Projects navigation bar, click Activities.
3) On the Activities page:
a. Click the Activity View list and select an activity view to configure.
b. Click the View menu and select Customize View....
4) In the Customize Activity View dialog box, click the Access tab.
5) On the Access tab, select one of the access options and click OK.
Tips
Unless you specify otherwise, Current User is the default access.
If you select List of Users, search for the user, or select users from the Available Users
list.
Sending E-Mail of an Activity View
You can send e-mail of an activity view to distribute details about activities or projects.
To send e-mail of an activity view:
1) Open one or more projects in the Projects section using one of the following methods:
Click Projects to open the last project or group of projects you were working
with.
Click the Projects menu and choose one of the most-recently used projects
or group of projects.
Click the Projects menu and choose Open Projects to select a project or
group of projects by portfolio type, EPS node, or project code.
2) On the Projects navigation bar, click Activities.
3) On the Activities page, click the View menu and select E-mail View.
4) In the E-mail View dialog box:
a. Edit the recipient list, message, and subject as needed.
b. Click Send E-mail.
Tips
You must have an e-mail address listed in you user profile to send an e-mail.
About Bars
Bars are used in different views to graphically represent the project timeline. They can
symbolize milestones, activities, or projects. Available bar types are:
Current bar: Spans the early remaining/actual start to the early remaining/actual
finish for each activity, and indicates how the schedule is progressing according to
the original plan.

292
Float bar: Shows the total amount of time that an activity can be delayed without
delaying completion of a project.
Free Float bar: Shows the amount of time that an activity can be delayed without
causing subsequent activities to be delayed.
Late bar: Shows the late start to the late finish of an activity.
Percent Complete bar: Shows the completion percentage of an activity.
Plan bar: Shows the forecasted status of planned activities, and is used for simulating
the outcome of the project schedule as part of project planning.
Primary baseline bar: Shows the primary baseline start and finish dates of an activity,
and indicates how the schedule is progressing according to the original plan.
Project baseline bar: Shows the project baseline start and finish dates of an activity,
and indicates how the schedule is progressing according to the original plan.
About Columns (Fields)
Fields hold data. They generally either allow you to enter values or just display the field's
current value (called a read-only field).
Pages with tables often permit you to configure the fields that make up the columns of
the table. See Showing or Hiding Columns in a Table (on page 91).
About Filters
A filter is a set of instructions that determines which data display in the current window.
You can create filters or use the predefined filters available in the application. There are
three types of filters: user-defined, global, or standard. User-defined filters can be
created for multiple users or only the creator of the filter. Global filters are available to all
users for all projects. Standard filters are also available to all users for all projects;
however, users cannot modify standard filters. You can apply a combination of filters to
narrow the data selection even further.
About Grouping and Sorting
To simplify the display of complex tables of data, you can group rows of similar data and
sort the grouped bands as well as the data under them. Grouping helps you block
distracting data and focus only on the information you need. It also permits you to
collapse and expand hierarchical arrangements of your data rather than navigate large
flat lists.
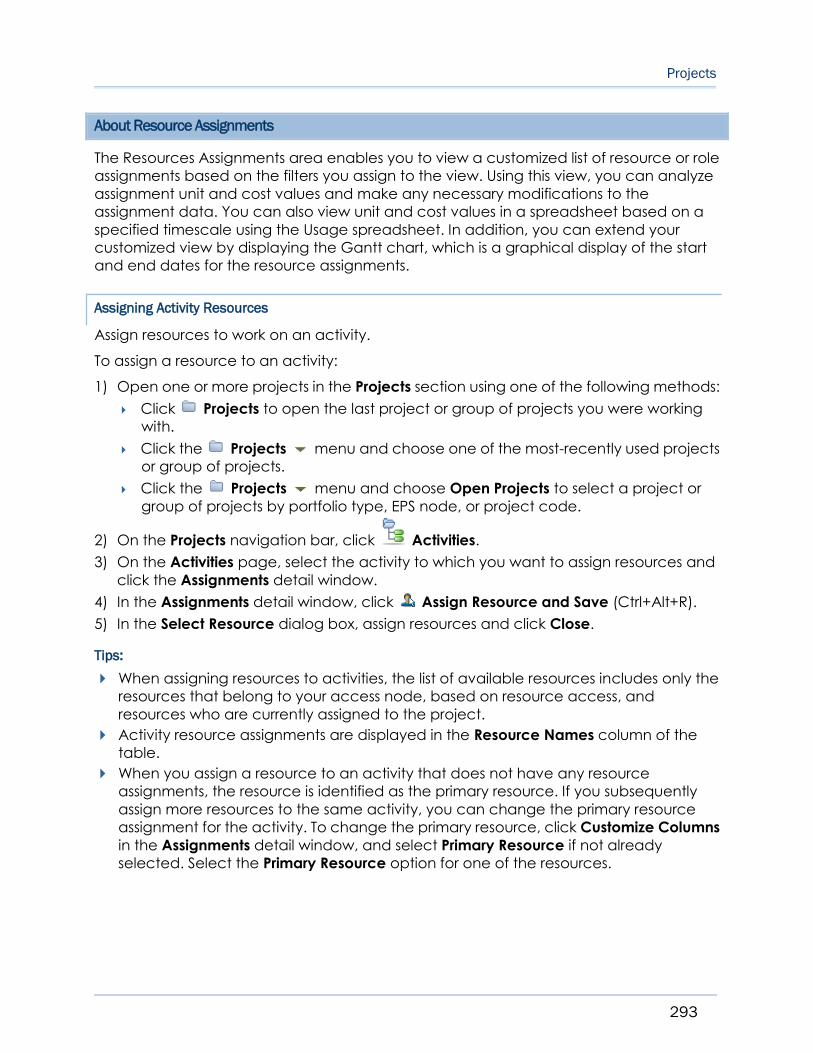
Projects
293
About Resource Assignments
The Resources Assignments area enables you to view a customized list of resource or role
assignments based on the filters you assign to the view. Using this view, you can analyze
assignment unit and cost values and make any necessary modifications to the
assignment data. You can also view unit and cost values in a spreadsheet based on a
specified timescale using the Usage spreadsheet. In addition, you can extend your
customized view by displaying the Gantt chart, which is a graphical display of the start
and end dates for the resource assignments.
Assigning Activity Resources
Assign resources to work on an activity.
To assign a resource to an activity:
1) Open one or more projects in the Projects section using one of the following methods:
Click Projects to open the last project or group of projects you were working
with.
Click the Projects menu and choose one of the most-recently used projects
or group of projects.
Click the Projects menu and choose Open Projects to select a project or
group of projects by portfolio type, EPS node, or project code.
2) On the Projects navigation bar, click Activities.
3) On the Activities page, select the activity to which you want to assign resources and
click the Assignments detail window.
4) In the Assignments detail window, click Assign Resource and Save (Ctrl+Alt+R).
5) In the Select Resource dialog box, assign resources and click Close.
Tips:
When assigning resources to activities, the list of available resources includes only the
resources that belong to your access node, based on resource access, and
resources who are currently assigned to the project.
Activity resource assignments are displayed in the Resource Names column of the
table.
When you assign a resource to an activity that does not have any resource
assignments, the resource is identified as the primary resource. If you subsequently
assign more resources to the same activity, you can change the primary resource
assignment for the activity. To change the primary resource, click Customize Columns
in the Assignments detail window, and select Primary Resource if not already
selected. Select the Primary Resource option for one of the resources.

294
You can also assign resources to an activity from the Resources dialog box on the
Team Usage page, the Resources dialog box on the Role Usage tab of the Analysis
page, the Open Requests for Resources portlet of the Dashboards page, or the
Activities page Actions menu. To assign resources from the Actions menu on the
Activities page, select an activity and click Assign Resource on the Actions menu.
Configuring Activity Resources
You can configure resource information for activities, including the Planned Units/Time,
Proficiency, or Rate Type for a resource.
To configure activity resources:
1) Open one or more projects in the Projects section using one of the following methods:
Click Projects to open the last project or group of projects you were working
with.
Click the Projects menu and choose one of the most-recently used projects
or group of projects.
Click the Projects menu and choose Open Projects to select a project or
group of projects by portfolio type, EPS node, or project code.
2) On the Projects navigation bar, click Activities.
3) On the Activities page, select an activity and click the Assignments detail window.
4) In the Assignments detail window:
a. Select a resource.
b. Add the columns you need to configure to the detail window. See Showing and
Hiding Columns in a Table (see "Showing or Hiding Columns in a Table" on page
91).
c. Select an option or enter a value for each field.
d. Click Apply Changes (Ctrl+S).
Tips
You can also configure activity resources from the Open Requests for Resources portlet
of the Dashboards page.
Requesting Resources for Activities
When planning for an activity you can assign a role to the activity and replace that role
with the appropriate resource at a later time. To assign a role with specific search criteria,
including role proficiency, resource name, and resource code, use the Request
Resources feature.
To request resources:
1) Open one or more projects in the Projects section using one of the following methods:

Projects
295
Click Projects to open the last project or group of projects you were working
with.
Click the Projects menu and choose one of the most-recently used projects
or group of projects.
Click the Projects menu and choose Open Projects to select a project or
group of projects by portfolio type, EPS node, or project code.
2) On the Projects navigation bar, click Activities.
3) On the Activities page, select an activity and click the Assignments detail window.
4) In the Assignments detail window, click Request Resources (Ctrl+Alt+Q).
5) In the Open a request for a resource dialog box, enter criteria for the resource and
click Save.
Tips
The list of available resources includes only the resources you have access to, based
on resource security, and current project resources.
You must specify a Primary Role.
The resource request criteria is stored and available when assigning resources to roles
using the Open Request for Resource portlet from Dashboards or the Role Usage tab
from the Resources Analysis page.
Specifying Resource Assignment Rates
You can set rate information for resources or roles.
To specify resource assignment rates:
1) Open one or more projects in the Projects section using one of the following methods:
Click Projects to open the last project or group of projects you were working
with.
Click the Projects menu and choose one of the most-recently used projects
or group of projects.
Click the Projects menu and choose Open Projects to select a project or
group of projects by portfolio type, EPS node, or project code.
2) On the Projects navigation bar, click Activities.
3) On the Activities page, select an activity in the table and click the Assignments detail
window.
4) In the Assignments detail window:
a. Add the Rate Type and Rate Source columns. See Showing and Hiding Columns in
a Table (see "Showing or Hiding Columns in a Table" on page 91).
b. Select an option for the type and source.
c. Click Apply Changes (Ctrl+S).

296
Tips
When you save your changes, costs for the assignment are recalculated based on the
new rate: Cost equals Units times Price/Unit. You can add the Price/Unit column to the
detail window to view the price used. To manually specify a price/unit, select Override in
the Rate Source field and type a value in the Price/Unit field.
Adding Activity Resource Estimates
You can plan resource usage by adding resource estimates to activities.
To add resource estimates:
1) Open one or more projects in the Projects section using one of the following methods:
Click Projects to open the last project or group of projects you were working
with.
Click the Projects menu and choose one of the most-recently used projects
or group of projects.
Click the Projects menu and choose Open Projects to select a project or
group of projects by portfolio type, EPS node, or project code.
2) On the Projects navigation bar, click Activities.
3) On the Activities page, select an activity and click the Assignments detail window.
4) In the Assignments detail window:
a. Assign a resource or role to the selected activity. See Assigning Activity Resources
(on page 293) or Assigning Activity Roles (on page 297).
b. Add the Planned Units/Time, Planned Units, Planned Cost, and Planned Duration
columns to the detail window. See Showing and Hiding Columns in a Table (see
"Showing or Hiding Columns in a Table" on page 91).
c. Select an option or enter a value for each field.
d. Click Apply Changes (Ctrl+S).
About the Recalculate Assignment Costs Feature
Whenever any of the five (5) possible price per unit values changes for a resource or role
already assigned to activities, run the Recalculate Assignment Costs feature. This feature
recalculates any changed assignment costs.
You should also run this feature during sheduling or leveling because dates will change
and resources might be using time varying rates. This means their activities can shift into
periods with different effective prices. Therefore, the costs would have to be
recalculated.
The Recalculate Assignment Costs feature only applies to currently open projects. This
provides project managers with control over recalculating costs only when prices have
changed.

Projects
297
When another user changes prices for resources or roles, P6 will display a message
indicating that the Recalculate Assignment Costs feature should be run in order for
project assignments to use the new values.
This feature can be run at any time from the Activities page or scheduled as a service.
About Resources
A resource is any quantifiable item in limited supply and of sufficient value to justify
tracking and assigning to specific activities for a project. Resources include general or
specialized labor, non-labor items such as equipment, and material items such as bricks.
Resources perform roles, if defined. Resources are indirectly assigned to activities by first
planning the role required. It is also possible to directly assign resources to activities. For
example, Chris, a level 2 contractor with the confirmed skills and status, is directly
assigned to activity 01. However, a technician level 4 role is assigned to activity 02. The
project will proceed while management determines the best available resource to fulfill
this role.
About Roles
Roles represent personnel job titles or skills needed to execute projects. Architect,
general laborer, quality assurance tester, and engineer are all examples of possible roles.
You can create a standard set of roles that you then assign to labor and non-labor
resources and activities for all projects in the organization. You can establish an unlimited
number of roles and organize them in a hierarchy for easier management and
assignment. The set of roles you assign to an activity defines the activity’s skill
requirements. You can also define multiple price per unit rates and unit per time limits for
each role to accurately plan future costs and allocation.
You can assign one or more roles to individual resources. When you assign roles to a
resource, you also indicate their proficiency in that role and identify which role is their
primary role. A primary role is the main role the resource is currently performing. The
proficiency level describes the resource's skill level in that role. For example, Joe is a
resource and fills the role of both software engineer and manager. He has been a
software engineer for 20 years and is 1 - Master in that role; however, his primary role is
manager, which he has been for 5 years and his proficiency level is 3- Skilled.
Assign roles to activities as you would resources during project schedule and cost
planning. When your plans are finalized, you can replace roles with resources, based on
each activity’s role and skill requirements.
Assigning Activity Roles
Assign roles to an activity to show which roles can perform the work required by that
activity.
To assign a role to an activity:

298
1) Open one or more projects in the Projects section using one of the following methods:
Click Projects to open the last project or group of projects you were working
with.
Click the Projects menu and choose one of the most-recently used projects
or group of projects.
Click the Projects menu and choose Open Projects to select a project or
group of projects by portfolio type, EPS node, or project code.
2) On the Projects navigation bar, click Activities.
3) On the Activities page, select an activity and click the Assignments detail window.
4) In the Assignments detail window, click Assign Role and Save (Ctrl+Alt+O).
5) In the Select Role dialog box, assign roles and click Close.
Tips
You can also assign roles from the Resources section, the Open Requests for Resources
portlet of the Dashboards page, or the Activities page Actions menu. To assign roles from
the Actions menu of the Activities page, select an activity and click Assign Role on the
Actions menu.
Configuring Activity Roles
You can configure role information for activities.
To configure activity roles:
1) Open one or more projects in the Projects section using one of the following methods:
Click Projects to open the last project or group of projects you were working
with.
Click the Projects menu and choose one of the most-recently used projects
or group of projects.
Click the Projects menu and choose Open Projects to select a project or
group of projects by portfolio type, EPS node, or project code.
2) On the Projects navigation bar, click Activities.
3) On the Activities page, select an activity and click the Assignments detail window.
4) In the Assignments detail window:
a. Select a role.
b. Add the columns you need to configure to the detail window. See Showing and
Hiding Columns in a Table (see "Showing or Hiding Columns in a Table" on page
91).
c. Select an option or enter a value for each field.
5) In the Assignments detail window, click Apply Changes (Ctrl+S).

Projects
299
Tips
You can also configure activity roles from the Open Requests for Resources portlet of the
Dashboards page.
Assigning Resource Curves to Resource or Role Assignments from the Activities Page
You can assign a resource distribution curve to any resource or role assignment on
activities with a duration type of Fixed Duration and Units/Time or Fixed Duration & Units.
Resource usage and costs are distributed evenly during an activity unless you specify
nonlinear distribution using curves.
To assign a resource curve:
1) Open one or more projects in the Projects section using one of the following methods:
Click Projects to open the last project or group of projects you were working
with.
Click the Projects menu and choose one of the most-recently used projects
or group of projects.
Click the Projects menu and choose Open Projects to select a project or
group of projects by portfolio type, EPS node, or project code.
2) On the Projects navigation bar, click Activities.
3) On the Activities page, to set the Duration Type to Fixed Duration and Units/Time or
Fixed Duration & Units, click the View menu and select Columns. (If the Duration
Type is already set, select an activity and go to step 5.b.)
4) In the Customize Columns dialog box:
a. Expand General in the Available Columns section.
b. Double-click Duration Type.
c. Click OK.
5) On the Activities page:
a. Select Fixed Duration and Units/Time or Fixed Duration & Units from the Duration
Type list for the activity whose curve you want to configure.
b. Click the Assignments detail window.
Note: The activity must have a resource or role assigned to it. See
Assigning Activity Resources (on page 293) or Assigning Activity
Roles (on page 297).
6) In the Assignments detail window, double-click the Curve field, and click .
7) In the Select Curves dialog box, select a curve and click OK.
8) On the Activities page, click the Actions menu and select Save (Ctrl+S).

300
Tips
If you assign a resource curve to an assignment with a manual curve, the
manually-entered future period values will be overwritten.
Resource curves do not support expenses. The Accrual Type will continue to spread
the expenses.
If the Curve column is not available, add it to the detail window. See Showing and
Hiding Columns in a Table (see "Showing or Hiding Columns in a Table" on page 91).
You can also assign resource curves to resource or role assignments from the
Resources Assignments page. See Assigning Resource Curves to Resource or Role
Assignments from the Resources Assignments Page (on page 419).
About Activity Codes
Activity codes enable you to categorize activities into logical groups based on your
organization's criteria. An activity code can be one of three types: Global, EPS, or
Project. Global activity codes organize activities across all projects in an organization.
EPS activity codes organize activities within a specific branch or node of the enterprise
project structure (EPS). Project activity codes categorize activities based on specific
features within a project.
Activity codes represent broad categories of information, a department or project
manager for instance. You can create multiple activity codes according to specific
categories, then assign different values for each code. For example, assume your
organization has many departments and you want to review activities within each
department. You can first create an activity code "department," then assign different
values such as quality assurance, finance, and sales. You can then associate activities
with specific departments.
A key characteristic of an activity code as opposed to an activity user defined field is
that activity codes will only allow entries from a predefined list of values. After you create
activity codes, users can assign activity code values to activities to group, sort, and filter
project data based on these values.
Creating Activity Code Values for Activities
You can quickly create activity code values in the Activity Codes detail window of the
Activities page.
To create activity code values in the Activity Codes detail window:
1) Open one or more projects in the Projects section using one of the following methods:
Click Projects to open the last project or group of projects you were working
with.
Click the Projects menu and choose one of the most-recently used projects
or group of projects.
Click the Projects menu and choose Open Projects to select a project or
group of projects by portfolio type, EPS node, or project code.

Projects
301
2) On the Projects navigation bar, click Activities.
3) On the Activities page, select an activity and click the Codes detail window.
4) In the Codes detail window, click Assign (Insert).
5) In the Select Code Value dialog box:
a. Select the Global, EPS, or Project option for a list of activity codes.
b. Select an activity code to which you will add the value.
c. Click Add Code Value.
6) In the Add Activity Code Value dialog box, enter a value in each field and click
Create.
7) In the Select Code Value dialog box:
Assign the value to the selected activity and click Close.
Or
Click Close.
8) On the Activities page, click the Actions menu and select Save (Ctrl+S).
Tips
In the Code Value field, you must enter a value that is unique across the project.
You can also create activity code values from the Enterprise Project Data dialog box
or the Administer menu, see Creating Activity Code Values (on page 488).
Assigning Activity Code Values to Activities
Assign activity code values to selected activities to group and filter data.
To assign activity code values:
1) Open one or more projects in the Projects section using one of the following methods:
Click Projects to open the last project or group of projects you were working
with.
Click the Projects menu and choose one of the most-recently used projects
or group of projects.
Click the Projects menu and choose Open Projects to select a project or
group of projects by portfolio type, EPS node, or project code.
2) On the Projects navigation bar, click Activities.
3) On the Activities page, select an activity and click the Codes detail window.
4) In the Codes detail window, click Assign (Insert).
5) In the Select Code Value dialog box, assign code values and click Close.
6) On the Activities page, click the Actions menu and select Save (Ctrl+S).

302
About Documents
A document is a file or work product that you create and add to your Primavera work
environment. The application provides document management capabilities that enable
you to store, organize, manage, and access documents in a secure environment. The
available document management functionality depends on your configuration. When
the content repository is configured, the complete set of advanced document
management capabilities is available, including check in, check out, and document
reviews. When the content repository is not configured, a limited set of document
management features is available, such as adding, deleting, and relating items to
documents.
When a configured content repository is installed, P6 supports up to three general classes
of documents: project, private, and workgroup. Project documents are documents that
you relate to a project via P6. Only users with the necessary securities can edit project
documents. Private documents are documents that you add to P6 for your own use.
Private documents are not associated with any project and are available only to you.
Workgroup documents are documents that are added to a specific project workgroup.
These documents are available only to members of the workgroup.
When the content repository is not configured for use with P6, you can perform limited
actions on project documents only, and private and workgroup documents are not
available.
Assigning Documents to Activities
You can assign relevant documents to activities, projects, and WBSs.
To assign documents:
1) Open one or more projects in the Projects section using one of the following methods:
Click Projects to open the last project or group of projects you were working
with.
Click the Projects menu and choose one of the most-recently used projects
or group of projects.
Click the Projects menu and choose Open Projects to select a project or
group of projects by portfolio type, EPS node, or project code.
2) On the Projects navigation bar, click Activities.
3) On the Activities page, select an activity and click the Documents detail window.
Note: To assign a document to a project or WBS, select a project or
WBS in place of an activity.
4) In the Documents detail window, click Assign (Insert).
5) In the Select Document dialog box, assign documents and click Close.
6) On the Activities page, click the Actions menu and select Save (Ctrl+S).

Projects
303
About Expenses
Expenses are non-resource costs associated with a project and assigned to a project’s
activities. An expense is typically a one-time expenditure for non-reusable items.
Expenses are project-specific and not time-based. Some examples include facilities,
travel, consulting, and training. Each expense has an actual, remaining, and at
completion value for both cost and units that is either budgeted or planned.
Expense categories classify and standardize expenses, and organize and maintain your
expense information.
Creating Expenses
Create expenses to show costs that you expect each activity to accrue.
To create expenses:
1) Open one or more projects in the Projects section using one of the following methods:
Click Projects to open the last project or group of projects you were working
with.
Click the Projects menu and choose one of the most-recently used projects
or group of projects.
Click the Projects menu and choose Open Projects to select a project or
group of projects by portfolio type, EPS node, or project code.
2) On the Projects navigation bar, click Activities.
3) On the Activities page, select an activity and click the Expenses detail window.
4) In the Expenses detail window:
a. Click Add Expense Item (Insert).
b. Enter a name in the Expense Item field.
5) On the Activities page, click the Actions menu and select Save (Ctrl+S).
Configuring Expenses
Configure expenses to update costs associated with an activity.
To configure expenses:
1) Open one or more projects in the Projects section using one of the following methods:
Click Projects to open the last project or group of projects you were working
with.
Click the Projects menu and choose one of the most-recently used projects
or group of projects.
Click the Projects menu and choose Open Projects to select a project or
group of projects by portfolio type, EPS node, or project code.
2) On the Projects navigation bar, click Activities.

304
3) On the Activities page, select an activity and click the Expenses detail window.
4) In the Expenses detail window:
a. Select an expense.
b. Add the columns you need to configure to the detail window. See Showing and
Hiding Columns in a Table (see "Showing or Hiding Columns in a Table" on page
91).
c. Select an option or enter a value for each field.
5) On the Activities page, click the Actions menu and select Save (Ctrl+S).
Configuring Auto Compute Actuals for Expenses
You can configure auto compute actuals for activity expenses.
To configure auto compute actuals:
1) Open one or more projects in the Projects section using one of the following methods:
Click Projects to open the last project or group of projects you were working
with.
Click the Projects menu and choose one of the most-recently used projects
or group of projects.
Click the Projects menu and choose Open Projects to select a project or
group of projects by portfolio type, EPS node, or project code.
2) On the Projects navigation bar, click Activities.
3) On the Activities page, select an activity and click the Expenses detail window.
4) In the Expenses detail window:
a. Select an expense item.
b. Select the Auto Compute Actuals option in the Auto Compute Actuals column.
5) On the Activities page, click the Actions menu and select Save (Ctrl+S).
Tips
If the Auto Compute Actuals column is not displayed, add it to the detail window. See
Showing and Hiding Columns in a Table (see "Showing or Hiding Columns in a Table" on
page 91).
About Feedback
Feedback is the exchange of activity-specific notes between team members. Notes are
added to activities either to or from the resource.
Adding Feedback
Add feedback to or from an activity resource for selected activities.
To add feedback:

Projects
305
1) Open one or more projects in the Projects section using one of the following methods:
Click Projects to open the last project or group of projects you were working
with.
Click the Projects menu and choose one of the most-recently used projects
or group of projects.
Click the Projects menu and choose Open Projects to select a project or
group of projects by portfolio type, EPS node, or project code.
2) On the Projects navigation bar, click Activities.
3) On the Activities page, select the activity about which you want to add feedback
and click the Feedback detail window.
4) In the Feedback detail window:
If you are the resource, click the field under Feedback from Resources, enter
feedback, and click Add.
If you are not the resource, click the field under Notes to Resources, enter
feedback, and click Add.
5) On the Activities page, click the Actions menu and select Save (Ctrl+S).
Tips
Once added, feedback cannot be modified.
Anyone with rights to view the activity can read the feedback.
Adding the New Feedback Column
Add the New Feedback column to act as a visual cue when there are new notes in the
Feedback detail window.
To add the feature feature:
1) Open one or more projects in the Projects section using one of the following methods:
Click Projects to open the last project or group of projects you were working
with.
Click the Projects menu and choose one of the most-recently used projects
or group of projects.
Click the Projects menu and choose Open Projects to select a project or
group of projects by portfolio type, EPS node, or project code.
2) On the Projects navigation bar, click Activities.
3) On the Activities page, click the View menu and select Columns.
4) In the Customize Columns dialog box:
a. Expand Timesheet Feedback in the Available Columns list and double-click New
Feedback to add it to the Selected Columns list.
b. Click OK.

306
Acknowledging Feedback
Acknowledge feedback you receive to show that you have seen comments about an
activity. This task assumes that you have added the feedback feature to your table or
Gantt chart. See Adding the New Feedback Column (on page 305).
To acknowledge feedback:
1) Open one or more projects in the Projects section using one of the following methods:
Click Projects to open the last project or group of projects you were working
with.
Click the Projects menu and choose one of the most-recently used projects
or group of projects.
Click the Projects menu and choose Open Projects to select a project or
group of projects by portfolio type, EPS node, or project code.
2) On the Projects navigation bar, click Activities.
3) On the Activities page:
a. Select the activity with new feedback. (The new New Feedback column option
will be selected.)
b. Click the Feedback detail window to read and respond to the feedback. See
Adding Feedback (on page 304).
c. Clear the option to acknowledge you have read the feedback.
d. Click the Actions menu and select Save (Ctrl+S).
Tips
The message is displayed with the timestamp when the note was sent and the name of
the sender.
About Status
Status is a brief representation of an activity's condition at any given time. Status tracks
the duration, beginning and ending dates, percent complete, units and costs, and
constraints associated with an activity.
Configuring Status
Configure status to define percent complete and start and finish dates.
To configure status:
1) Open one or more projects in the Projects section using one of the following methods:
Click Projects to open the last project or group of projects you were working
with.
Click the Projects menu and choose one of the most-recently used projects
or group of projects.

Projects
307
Click the Projects menu and choose Open Projects to select a project or
group of projects by portfolio type, EPS node, or project code.
2) On the Projects navigation bar, click Activities.
3) On the Activities page, select an activity and click the Status detail window.
4) In the Status detail window, in the Status section:
a. Select or clear the Started and Finished options.
b. If you select an option, click and select a date from the calendar.
c. In the Status section, enter a percentage in the Activity % Complete field.
5) On the Activities page, click the Actions menu and select Save (Ctrl+S).
Configuring Status Units and Costs
Configure status units and costs to define the units and cost for a selected activity.
To configure status units and costs:
1) Open one or more projects in the Projects section using one of the following methods:
Click Projects to open the last project or group of projects you were working
with.
Click the Projects menu and choose one of the most-recently used projects
or group of projects.
Click the Projects menu and choose Open Projects to select a project or
group of projects by portfolio type, EPS node, or project code.
2) On the Projects navigation bar, click Activities.
3) , select an activity and click the Status detail window.
4) In the Status detail window, in the Units and Costs section:
a. Select an option from the list.
b. Enter a value with a time unit abbreviation in each field.
5) On the Activities page, click the Actions menu and select Save (Ctrl+S).
Tips
You can only enter At Completion Cost/Units for activities that are not started or in
progress.
The application will calculate the values for Remaining Cost/Units and Actual
Cost/Units.

308
About Duration Types
Duration type is the basis for estimating the selected activity's completion time. It
determines whether the schedule, resource availability, or costs are most important
when updating activities. The duration type applies only when you have resources
assigned to the activity. Select one of the following duration types based on which factor
is most important (least flexible) in planning your project: Fixed Duration & Units/Time,
Fixed Duration & Units, Fixed Units/Time, or Fixed Units.
Fixed Duration & Units/Time or Fixed Duration & Units: Indicate that the schedule is a
limiting factor in your project. The activity's duration does not change regardless of the
number of resources assigned when you modify or update activities. You usually select
one of these duration types when you are using task-dependent activities. When you
update the remaining duration for the activity, you can select to calculate either the
remaining units or the units per timeperiod. The duration type enables you to control
which variables of an equation are calculated when you change a value.
If you want to recalculate the remaining units and keep the units/time for the resource
constant, select Fixed Duration & Units/Time. The application uses the equation:
Remaining Units = Units/Time x Remaining Duration. For example, if a resource is assigned
to an activity for 8 hours/day for 5 days, the remaining units or work is calculated as 40
hours.
If instead you want to keep the remaining units constant and recalculate the units/time,
select Fixed Duration & Units. The application uses the equation: Units/Time = Remaining
Units/Remaining Duration. For example, if a resource is assigned to work 40 hours in 5
days, the units/time is calculated as 8 hours/day.
Fixed Units/Time: Indicates that resource availability is the most critical aspect of your
project. In this case, the units/time or rate of the resource remains constant, even if the
activity's duration or work effort changes. You most often use this duration type when you
are planning resource-dependent activities.
Fixed Units: Indicates that the budget (units or cost) is a limiting factor; that is, the total
amount of work is fixed. When you update activities, the work effort required to complete
the activity does not change, even if the activity's duration or the resource rate changes.
Typically, you would use this type in conjunction with resource-dependent activities.
Increasing resources can decrease the activity duration.
Working with Duration Types
Duration type options
Duration type determines whether the schedule, resource availability, or cost is most
inflexible when calculations are performed to reflect activity progress. Duration type
affects update calculations only when resources are assigned to an activity.
Choose a duration type based on which factor is the most important, or least flexible, in
planning your project.

Projects
309
If schedule is most important, choose Fixed Duration and Units/Time or Fixed
Duration and Units.
If resource availability is most important, choose Fixed Units/Time.
If total work effort or fixed costs are most important, choose Fixed Units.
Configuring Status Durations
Configure status durations to define time assignments for activities.
To configure status durations:
1) Open one or more projects in the Projects section using one of the following methods:
Click Projects to open the last project or group of projects you were working
with.
Click the Projects menu and choose one of the most-recently used projects
or group of projects.
Click the Projects menu and choose Open Projects to select a project or
group of projects by portfolio type, EPS node, or project code.
2) On the Projects navigation bar, click Activities.
3) , select an activity and click the Status detail window.
4) In the Status detail window, in the Durations section, enter a value with a time unit
abbreviation in each field.
5) On the Activities page, click the Actions menu and select Save (Ctrl+S).
Tips
You can only enter At Completion Duration for activities that are not started or in
progress.
The application will calculate the values for Remaining Duration and Actual Duration.
Durations are rounded to the nearest half hour.
You can quickly and easily change durations in the Gantt chart by dragging and
resizing activity bars. The application will automatically update the activity durations
for you.
About Constraints
Constraints are recognized real-world restrictions that affect project performance. Any
factor that potentially delays when an activity can be scheduled is a constraint. The
most typical constraints are date restrictions. Constraints can apply to the entire project
or only to individual activities and can even reflect external project requirements that
cannot be built into the network logic. Some examples of constraints are: must finish by
(project-level constraint) and start on or after (activity-level constraint).

310
Working with Activity Constraints
P6 supports the following types of activity constraints:
Start On: Imposes the specific start date you select. The Start On constraint can delay an
activity's early start or move forward an activity's late start to satisfy the constraint date.
Start On or Before: Defines the latest date an activity can start. This constraint only affects
late dates and can decrease total float. When calculating a schedule, P6 imposes the
start on or before constraint in the backward pass only if the calculated late start date
will be later than the imposed date.
Start On or After: Defines the earliest date an activity can begin. This constraint affects
only early dates. When calculating a schedule, P6 imposes the start on or after constraint
in the forward pass only if the calculated early start date will be earlier than the imposed
date.
Finish On: Imposes the specific finish date you select. The Finish On constraint can delay
an activity's early finish or move forward an activity's late finish to satisfy the constraint
date.
Finish On or Before: Defines the latest time an activity can finish. The finish on or before
constraint affects only late dates.
Finish On or After: Defines the earliest date an activity can finish. The finish on or after
constraint reduces float to coordinate parallel activities, ensuring that the finish of an
activity is not scheduled before the specified date. It is usually applied to activities with
few predecessors that must finish before the next phase of a project.
As Late As Possible: Imposes a restriction on an activity with positive float to allow it to
start as late as possible without delaying its successors. When calculating a schedule, P6
sets the activity's early dates as late as possible without affecting successor activities. This
option disables the calendar icon.
Mandatory Start: Imposes the early and late start dates you select. P6 uses the
mandatory early start date regardless of its effect on network logic. A mandatory early
start date could affect the late dates for all activities that lead to the constrained activity
and all early dates for the activities that lead from the constrained activity.
Mandatory Finish: Imposes the early and late finish dates you select. P6 uses the
mandatory finish date regardless of its effect on network logic. This constraint affects the
late dates for all activities that lead to the constrained activity and all early dates for the
activities that lead from the constrained activity.
Configuring Status Constraints
Configure status constraints to show restrictions on project performance.
To configure status constraints:
1) Open one or more projects in the Projects section using one of the following methods:

Projects
311
Click Projects to open the last project or group of projects you were working
with.
Click the Projects menu and choose one of the most-recently used projects
or group of projects.
Click the Projects menu and choose Open Projects to select a project or
group of projects by portfolio type, EPS node, or project code.
2) On the Projects navigation bar, click Activities.
3) , select an activity and click the Status detail window.
4) In the Status detail window, in the Constraints section:
a. Select a constraint from the Primary Constraint list.
b. Click the Primary Constraint and select a date from the calendar.
Note: You may add a Secondary Constraint.
5) On the Activities page, click the Actions menu and select Save (Ctrl+S).
Tips
When mandatory constraints are placed on calendar nonworktime, the early date is
moved forward to the next valid worktime and the late date is moved back (earlier) to
the first valid worktime. This can cause negative float in the schedule.
About Issues
Issues are perceived problems within a schedule that require attention or corrective
action. When you create them in the Activities section, you can associate them with a
single project or workgroup and assign them to a responsible manager in the OBS for
follow-up based on priority. You can also associate issues with a single activity. When
adding new issues to a project or workgroup, you can control the information you
capture for each new issue. You can choose to receive e-mail notifications when new
issues of a certain priority are added, when existing issues are modified, or when issues
are assigned a specific issue code.
You can also think of issues as impediments, action items, open items, punch lists, logs, or
concerns. Over time, if you do not resolve or close open issues or issues placed on hold,
they can become risks.
Issue codes enable you to organize and categorize issues in a way that is meaningful to
you. For example, you can create an issue code titled Severity, and subsequently create
issue code values: High, Medium, and Low. You can assign each of these code values to
issues across multiple projects, enabling you to categorize each issue according to how
severe it is. Similarly, you can create codes to categorize issues by responsibility,
subproject, or any other classification you require to organize issues. Assigning issue
codes enables you to quickly search for and view issues according to specific criteria.

312
Creating Activity Issues
Create activity issues to identify problems that must be addressed before a project can
be completed.
To create activity issues:
1) Open one or more projects in the Projects section using one of the following methods:
Click Projects to open the last project or group of projects you were working
with.
Click the Projects menu and choose one of the most-recently used projects
or group of projects.
Click the Projects menu and choose Open Projects to select a project or
group of projects by portfolio type, EPS node, or project code.
2) On the Projects navigation bar, click Activities.
3) On the Activities page, select an activity and click the Issues detail window.
Note: To create a project or WBS issue, select a project or WBS in
place of an activity.
4) In the Issues detail window:
a. Click Add Issue (Insert).
b. Enter or select a value for the Issue Name, Priority, Status, and Responsible
Manager fields.
5) On the Activities page, click the Actions menu and select Save (Ctrl+S).
Tips:
You cannot add an issue to a project that is checked out or locked.
The application automatically names the issue New Issue. Update the issue so it has a
unique name.
Configuring Activity Issues
Configure activity issues to account for changes since the last update on the issue.
To configure activity issues:
1) Open one or more projects in the Projects section using one of the following methods:
Click Projects to open the last project or group of projects you were working
with.
Click the Projects menu and choose one of the most-recently used projects
or group of projects.
Click the Projects menu and choose Open Projects to select a project or
group of projects by portfolio type, EPS node, or project code.
2) On the Projects navigation bar, click Activities.

Projects
313
3) On the Activities page, select an activity and click the Issues detail window.
Note: To configure a project or WBS issue, select a project or WBS in
place of an activity.
4) In the Issues detail window:
a. Select an issue.
b. Add the columns you need to configure to the detail window. See Showing and
Hiding Columns in a Table (see "Showing or Hiding Columns in a Table" on page
91).
c. Select an option or enter a value for each field.
5) On the Activities page, click the Actions menu and select Save (Ctrl+S).
About Notebooks
A notebook is another name for a log or binder of electronic details about an activity,
WBS, project, or EPS element. All the notes users enter or paste into the notebook,
including e-mail messages, web links, tables, and other entries, share a single common
theme called a notebook topic. See About Notebook Topics (on page 238).
Working with Notebooks
Notebook topics are created by the administrator on the Enterprise Data page of the
Administer menu. These topics are then assigned to activity, WBS, project, or EPS node
notebooks.
About Notebook Topics
Notebook topics help multiple users apply a common theme or label to shared
information about an activity, WBS, project, or EPS element such as its purpose,
completion instructions, or other helpful notes. For example, you might place an e-mail
message, a web link, a table of observations, and a series of text notes into a notebook
topic called Budget Recommendations to capture the ongoing cost impacts of a
recurring project.
Assigning Notebook Topics
Depending on the page you are working on, you can assign notebook topics to a
selected project or activity.
To assign a notebook topic to a project:
1) Click Projects.
2) On the Projects navigation bar, click EPS.

314
3) On the EPS page, select a project or EPS node and click the Notebooks detail
window.
4) In the Notebooks detail window, click Assign (Insert).
5) In the Select Notebook Topic dialog box, select a notebook topic, click Assign, then
Close.
6) On the EPS page, click the Actions menu and select Save (Ctrl+S).
Tips
You can also create notebook topic descriptions. In the Notebooks detail window,
double-click the Description field and click (browse). Enter a description in the
dialog box.
You can also assign notebook topics to activities from the Notebooks detail window
of the Activities page or the Activity Details page of the Open Requests for Resources
portlet of the Dashboards page.
About Relationships
A relationship defines how an activity relates to the start or finish of another activity or
assignment. An activity can have as many relationships as necessary to model the work
that must be done. These relationships are used together with activity durations to
determine schedule dates. Relationships can also exist between activities in different
projects; this type of relationship is referred to as an external relationship.
Activities that are dependent on one another are known as predecessors and
successors, where the first activity is the predecessor and the second is the successor.
Between these two types of activities, there are four possible relationship types:
Finish to Start - The successor activity cannot start until its predecessor finishes.
Finish to Finish - The successor activity cannot finish until its predecessor finishes.
Start to Start - The successor activity cannot start until its predecessor starts.
Start to Finish - The successor activity cannot finish until its predecessor starts.
A permitted modification to these logical relationships is called lag. Lag values can be
positive numbers (a delay, slower, deceleration of progress) or negative numbers (lead
time, faster, acceleration of progress). For example, in a Finish to Start relationship, if you
specify a ten-day lag (+10), the successor activity cannot start until ten days after the
predecessor has finished. Likewise, if you specify a negative ten-day lag (–10), the
successor activity could start ten days before the related predecessor activity finishes.
Creating Activity Relationships
Create activity relationships to show interdependencies between activities.
To create an activity relationship:
1) Open one or more projects in the Projects section using one of the following methods:

Projects
315
Click Projects to open the last project or group of projects you were working
with.
Click the Projects menu and choose one of the most-recently used projects
or group of projects.
Click the Projects menu and choose Open Projects to select a project or
group of projects by portfolio type, EPS node, or project code.
2) On the Projects navigation bar, click Activities.
3) On the Activities page:
a. Click the View menu and select Gantt Chart.
b. Click the View menu and select Show Relationship Lines.
Note: If Hide Relationship Lines is displayed in the View menu,
the lines are already set to show. Exit the menu and return to the
Gantt chart.
c. Right-click the bar to which you want to assign a relationship and click Create
Relationship.
Note: Your cursor will become a cross.
d. With the cross, click the beginning or end of the bar and then click the beginning
or end of the bar you want to relate.
Note: Where you click each bar determines the type of
relationship. See About Relationships (on page 314).
e. Click the Actions menu and select Save (Ctrl+S).
Tips
You can scroll through the Gantt chart while your cursor is a cross to find a related bar.
To delete a relationship, right-click the relationship line and select Delete Relationship.
If multiple projects are open, you can create external relationships.
You can also view or configure existing predecessor or successor relationships, from
the Predecessors or Successors detail windows.
Configuring Activity Relationships
Configure activity relationships to adjust interdependencies between different activities.
To configure activity relationships:
1) Open one or more projects in the Projects section using one of the following methods:
Click Projects to open the last project or group of projects you were working
with.

316
Click the Projects menu and choose one of the most-recently used projects
or group of projects.
Click the Projects menu and choose Open Projects to select a project or
group of projects by portfolio type, EPS node, or project code.
2) On the Projects navigation bar, click Activities.
3) On the Activities page:
a. Click the View and select Gantt Chart.
b. Click the View menu and select Show Relationship Lines.
Note: If Hide Relationship Lines is displayed in the View menu,
the lines are already set to show. Exit the menu and return to the
Gantt chart.
c. Right-click the relationship line of the relationship you want to configure and click
Edit Relationship.
4) In the Edit Relationship dialog box, configure the relationship type and lag and click
OK.
5) On the Activities page, click the Actions menu and select Save (Ctrl+S).
Tips
You can also configure relationships from the Predecessor and Successor detail
windows. See Configuring Predecessor Relationships (on page 317) or Configuring
Successor Relationships (on page 318).
Assigning Predecessor Relationships
You can assign predecessor relationships to the activities in a project.
To assign a predecessor relationship:
1) Open one or more projects in the Projects section using one of the following methods:
Click Projects to open the last project or group of projects you were working
with.
Click the Projects menu and choose one of the most-recently used projects
or group of projects.
Click the Projects menu and choose Open Projects to select a project or
group of projects by portfolio type, EPS node, or project code.
2) On the Projects navigation bar, click Activities.
3) On the Activities page, select an activity to which you want to assign a predecessor
and click the Predecessors detail window.
4) In the Predecessors detail window, click Assign (Insert).
5) In the Select Predecessor Activity dialog box, assign activities and click Close.

Projects
317
6) On the Activities page, click the Actions menu and select Save (Ctrl+S).
Tips
You can assign relationships to multiple activities at one time. Select multiple activities
using Ctrl+click or Shift+click. Right-click the selected activities and select Link
Selected Activities. Based on their sequence in the view, the application creates
Finish to Start relationships between selected activities. That is, a Finish to Start
relationship is applied between the first and second activity, between the second
and third activity, and so on. If an activity pair already has an Finish to Start
relationship, the application tries, in turn, to apply each of the other relationship
types, if possible. Otherwise, no relationship is applied to the pair.
When selecting a predecessor or successor activity, you can choose from activities in
the open projects only.
Configuring Predecessor Relationships
Configure predecessor relationships to define lag or relationship type.
To configure predecessor relationships:
1) Open one or more projects in the Projects section using one of the following methods:
Click Projects to open the last project or group of projects you were working
with.
Click the Projects menu and choose one of the most-recently used projects
or group of projects.
Click the Projects menu and choose Open Projects to select a project or
group of projects by portfolio type, EPS node, or project code.
2) On the Projects navigation bar, click Activities.
3) On the Activities page, select an activity whose predecessor relationships you want
to configure and click the Predecessors detail window.
4) In the Predecessors detail window:
a. Select a relationship.
b. Add the columns you need to configure to the detail window if they are not
already available. See Showing and Hiding Columns in a Table (see "Showing or
Hiding Columns in a Table" on page 91).
c. Select an option or enter a value for each field.
5) On the Activities page, click the Actions menu and select Save (Ctrl+S).
Tips
You can also configure activity relationships from the Gantt chart. See Configuring
Activity Relationships (on page 315).

318
Assigning Successor Relationships
You can assign successor relationships to the activities in your project.
To assign a successor relationship:
1) Open one or more projects in the Projects section using one of the following methods:
Click Projects to open the last project or group of projects you were working
with.
Click the Projects menu and choose one of the most-recently used projects
or group of projects.
Click the Projects menu and choose Open Projects to select a project or
group of projects by portfolio type, EPS node, or project code.
2) On the Projects navigation bar, click Activities.
3) On the Activities page, select an activity to which you want to assign successors and
click the Successors detail window.
4) In the Successors detail window, click Assign (Insert).
5) In the Select Successor Activity dialog box, assign activities and click Close.
6) On the Activities page, click the Actions menu and select Save (Ctrl+S).
Tips
You can assign relationships to multiple activities at one time. Select multiple activities
using Ctrl+click or Shift+click. Right-click the selected activities and select Link
Selected Activities. Based on their sequence in the view, the application creates
Finish to Start relationships between selected activities. That is, a Finish to Start
relationship is applied between the first and second activity, between the second
and third activity, and so on. If an activity pair already has an Finish to Start
relationship, the application tries, in turn, to apply each of the other relationship
types, if possible. Otherwise, no relationship is applied to the pair.
When selecting a predecessor or successor activity, you can choose from activities in
the open projects only.
Configuring Successor Relationships
Configure successor relationships to define lag or relationship type.
To configure successor relationships:
1) Open one or more projects in the Projects section using one of the following methods:
Click Projects to open the last project or group of projects you were working
with.
Click the Projects menu and choose one of the most-recently used projects
or group of projects.
Click the Projects menu and choose Open Projects to select a project or
group of projects by portfolio type, EPS node, or project code.

Projects
319
2) On the Projects navigation bar, click Activities.
3) On the Activities page, select an activity whose successor relationships you want to
configure and click the Successors detail window.
4) In the Successors detail window:
a. Select a relationship.
b. Add the columns you need to configure to the detail window if they are not
already available. See Showing and Hiding Columns in a Table (see "Showing or
Hiding Columns in a Table" on page 91).
c. Select an option or enter a value for each field.
5) On the Activities page, click the Actions menu and select Save (Ctrl+S).
Tips
You can also configure activity relationships from the Gantt chart. See Configuring
Activity Relationships (on page 315).
About Risks
Risks are any uncertain events or conditions that, if they occur, have a positive or
negative effect on project objectives. Risks are also known as threats, warnings,
imperatives, escalation notices, or jeopardies. Positive risks are often classified as
opportunities which, if they occur, are realized as rewards. Thorough documentation and
analysis of risks over multiple projects offer lessons, and potentially cost and time savings,
for all future projects.
Working with Project Risks
The risk register on the Risks page is the main area of the application where you identify
and manage risks for a project. Additionally, you can add risks to a project from the
Projects EPS page, and add risks to a project and assign the risks to activities from the
Activities page.

320
Once you add a risk to the risk register, you can perform further analysis on the risk and
create one or more risk response plans which include activities to reduce the negative
impact of the risk. See About Risk Response Plans (on page 371).
Table of Project Risks Elements
Item Description
Risks toolbar. See Risks Toolbar.

Projects
321
Item Description
Risks work area: Risks for all the projects you have open display in the risk
register. You can group by field name, such as project name to view all
risks organized by project, or create a filter to view only the risks that
interest you.
When adding a risk to the risk register, you supply a name for the risk,
identify the risk as a threat or an opportunity, identify the current status of
the risk, identify the owner of the risk, and then assign the values for
probability, schedule, cost, and any other applicable user-defined
impacts. The values for probability, schedule, cost, and additional
user-defined impacts are used to calculate the risk score.
Note: If the Probability, Cost, and Schedule fields
are disabled, a risk scorning matrix has not been
assigned to the project. You can still use the risk
register to track your risks; however, you cannot use
the qualitative risk analysis features in the
application until you create a risk scoring matrix
and assign it to the project.
Risks detail windows:
Response Plans: The area where you add response plans and response
plan action items. See Working with Risk Response Plans (on page 371).
Activities: The area where you associate scheduled activities in your
project to an identified risk. Refer to the example above to see a list of
the project activities impacted by risk R001: Concrete supply
constrained.
Description: The area used to provide a detailed explanation of the risk.
Cause: The area used to explain why this risk is occurring.
Effect: The area used to describe the impact this risk has on this project.
Notes: The area used to capture any additional information regarding
the risk.
Probability and Impact Diagram: The Probability and Impact Diagram
(PID) is a graphical representation of the probability and impact
thresholds assigned to the risk scoring matrix associated with the project.
Assigning a Risk to an Activity
Assign a risk to an activity to explicitly identify the activity impacted by the risk.

322
You can assign a risk to an activity while you are adding project risks on the Risks page or
while managing your activities on the Activities page.
To assign a risk to an activity from the Risks page:
1) Click Projects.
2) On the Projects navigation bar, click Risks.
3) , click on a risk.
4) Click on the Activities detail window and click Assign Activities .
5) On the Select Activity dialog box:
a. Select an activity and click Assign.
b. Select any additional activities impacted by the risk and click Assign.
c. Click Close.
6) On the Risks page, click Save (Ctrl+S).
To assign a risk to an activity from the Activities page:
1) Click Projects.
2) On the Projects navigation bar, click Activities.
3) On the Activities page, select the activity you want to assign a risk.
4) On the Risks detail window, click Assign Risk.
5) On the Select Risk dialog box, select a risk and click OK.
6) On the Activities page, click Save (Ctrl+S).
About Steps
Steps make it possible to describe and report progress for activity work at a granular level
by breaking an activity into its component parts.
Steps can have a step weight that quantifies the portion of an activity's total work that
each step represents. On a project per project basis, you can use step weights to
calculate Activity Percent Complete. For example, three steps are assigned to an
activity; the first step has a weight of 2, and the second and third steps each have a
weight of 1. When you mark the first step (weight of 2) as complete, the percent
complete is 50. When you mark the first and second steps complete, the percent
complete is 75. When all three steps are marked complete, the percent complete is 100.
Working with Activity Steps
How can I use activity steps?

Projects
323
Activity steps make it possible to describe and report progress for activity work at a more
granular level of detail. If you have privileges to edit activities, you can add individual
steps to activities, or you can add predefined groups of steps based on templates that
have been defined for your organization. You can specify a weight for each step to
show how much work for the activity is contained in a step.
Activity step templates
Step templates enable an organization to define groups of steps that can be shared by
many projects. By creating templates for groups of activity steps that are relevant in
many projects, an organization can streamline data entry and ensure that work is
identified consistently throughout the organization.
In P6, when adding steps to an activity, you can choose from a list of available
templates. You can use more than one template, but you can add steps from only one
template at a time.
If you use a template to add steps to an activity, you can edit the step details but not the
step name.
Weighted activity steps
To indicate the portion of activity work that a single step represents, you can assign it a
numerical value, or weight. Once work for a step is underway, Primavera can use the
step weight and the reported progress of step work (Step Percent Complete) to
calculate the percentage of total work that has been completed for the activity
(Activity Percent Complete).
Creating Activity Steps
Create steps to break activities down into their component parts.
To create steps:
1) Open one or more projects in the Projects section using one of the following methods:
Click Projects to open the last project or group of projects you were working
with.
Click the Projects menu and choose one of the most-recently used projects
or group of projects.
Click the Projects menu and choose Open Projects to select a project or
group of projects by portfolio type, EPS node, or project code.
2) On the Projects navigation bar, click Activities.
3) On the Activities page, select an activity you want to break down into smaller parts
and click the Steps detail window.
4) In the Steps detail window, repeat the following for each step you want to add to the
activity:
a. Click Add Activity Step (Insert).
b. Enter a value in the Step Name, Step % Complete, and Step Weight fields.

324
5) On the Activities page, click the Actions menu and select Save (Ctrl+S).
Tips
You can also create steps on the Activity Details page of the Open Requests for
Resources portlet of the Dashboards page.
Configuring Activity Steps
Configure steps to show percent complete and to give a description of the step.
To configure steps:
1) Open one or more projects in the Projects section using one of the following methods:
Click Projects to open the last project or group of projects you were working
with.
Click the Projects menu and choose one of the most-recently used projects
or group of projects.
Click the Projects menu and choose Open Projects to select a project or
group of projects by portfolio type, EPS node, or project code.
2) On the Projects navigation bar, click Activities.
3) On the Activities page, select an activity and click the Steps detail window.
4) In the Steps detail window, repeat the following for each step you need to configure:
a. Select a step.
b. Add the columns you need to configure to the detail window if they are not
already available. See Showing and Hiding Columns in a Table (see "Showing or
Hiding Columns in a Table" on page 91).
c. Select an option or enter a value for each field.
5) On the Activities page, click the Actions menu and select Save (Ctrl+S).
Tips
Select the Completed option if the step is finished.
You can also configure steps from the Activity Details page of the Open Requests for
Resources portlet of the Dashboards page.
About Step Templates
Step templates enable you to define a group of steps common to multiple activities, and
then assign the template to different activities. By creating templates for groups of
activity steps that are relevant in many projects, an organization can streamline data
entry and ensure that work is identified consistently throughout the organization.
Adding Activity Steps from a Step Template
Add steps from a step template to add a group of predefined steps to an activity.

Projects
325
To add steps from a step template to an activity:
1) Open one or more projects in the Projects section using one of the following methods:
Click Projects to open the last project or group of projects you were working
with.
Click the Projects menu and choose one of the most-recently used projects
or group of projects.
Click the Projects menu and choose Open Projects to select a project or
group of projects by portfolio type, EPS node, or project code.
2) On the Projects navigation bar, click Activities.
3) On the Activities page, select an activity and click the Steps detail window.
4) In the Steps detail window, click Add from Template (Ctrl+Alt+S).
5) In the Select Activity Step Template dialog box, assign templates and click Close.
6) On the Activities page, click the Actions menu and select Save (Ctrl+S).
Tips
Step templates are created on the Enterprise Data or Enterprise Project Data page.
About Trace Logic
Trace logic provides a graphical display of dependency relationships for an activity. You
can step forward or backward through a sequence of activities to focus on predecessor
and successor relationships.This alternative viewing format enables you to examine a
path of relationships while still viewing the entire project.
Trace logic provides visual cues to help you read the diagram. The selected activity is
highlighted in blue. Activity boxes with a red border represent critical activities. Activity
boxes to the left of the selected activity are predecessors. Activity boxes to the right are
successors. Solid lines represent driving relationships, while dashed lines represent
non-driving relationships.
You can manage activity relationships using the detail windows or Gantt chart on the
Activities page. When multiple projects are open, you can even add relationships
between activities in different projects. You can view activity relationships in the Trace
Logic detail window on the Activities page. You can use Trace Logic to determine why
an activity is scheduled at a particular time. It also helps answer questions such as:
Were any of an activity's predecessors delayed?
Do any predecessors or successors have an obsolete constraint?
Are two activities that should be linked start to start currently linked finish to start?
Why is there negative float?
Viewing Relationships with Trace Logic
Use trace logic to follow activity relationships throughout a project.

326
To view relationships with trace logic:
1) Open one or more projects in the Projects section using one of the following methods:
Click Projects to open the last project or group of projects you were working
with.
Click the Projects menu and choose one of the most-recently used projects
or group of projects.
Click the Projects menu and choose Open Projects to select a project or
group of projects by portfolio type, EPS node, or project code.
2) On the Projects navigation bar, click Activities.
3) On the Activities page, select an activity and click the Trace Logic detail window.
4) In the Trace Logic detail window:
a. The selected activity is shown with its predecessor and successor activities.
b. Click another activity in the detail window to see its connections to predecessor
and successor activities.
c. Click Pan and click and drag the detail window contents.
d. Click Trace Logic Options (Ctrl+Y) to configure the number of predecessor and
successor levels shown.
Tips
Click the top edge of the Trace Logic detail window and drag upward to make the
window larger.
About Budget Change Logs
A Budget Change Log helps you keep track of budget alterations as they occur. The
Current Budget field (original budget plus approved budget changes) and Proposed
Budget field (original budget plus approved and pending budget amounts) incorporate
changes so you have up-to-date and accurate budget information for each EPS node
or project.
The Budget Change Log enables you to track modifications that affect the budget; this
log also provides a clear indication of the who, what, when, where, and how behind the
change.
Change amounts are not incorporated in the current budget until these amounts have
an Approved status. Only authorized project participants can issue budget changes and
mark them as approved. You can post a change amount as Pending; the program
manager of the affected EPS node, or the project manager of the affected project, must
then mark the amount as Approved or Not Approved. The module recalculates the new
budgeted amount and adjusts the current budget based on approved changes to the
log:
Proposed Budget equals Original Budget plus Approved Budget Changes plus
Pending Budget Changes

Projects
327
Current Budget equals Original Budget plus Approved Budget Changes
Creating Budget Change Requests
Create budget change requests when seeking approval to change an EPS or WBS
budget.
To create budget change requests:
1) Click Projects.
2) On the Projects navigation bar, click EPS.
3) On the EPS page, select an EPS or project and click the Budget Log detail window.
Note: You can also create budget change requests for WBSs or
projects from the Budget Log detail window of the Activities page.
4) In the Budget Log detail window:
a. Click Add (Insert) to add a budget log line item.
b. Enter a value in the Amount and Responsible fields.
c. Select Pending from the Status list.
5) On the EPS page, click the Actions menu and select Save (Ctrl+S).
Tips
The person listed in Responsible will move the request to Approved or Not Approved.
The program manager of the affected EPS node or the project manager or the
affected project will enter a reason for approval or denial in the Reason field.
Approving/Denying Budget Change Requests
If you have the authority, you can approve or deny a budget change request.
To approve or deny a budget change request:
1) Click Projects.
2) On the Projects navigation bar, click EPS.
3) On the EPS page, select the EPS or project with a budget change request and click
the Budget Log detail window.
4) In the Budget Log detail window:
a. Select and review the budget change request.
b. Select Approved or Not Approved from the Status list.
c. Enter reasoning for the new status in the Reason field.
5) On the EPS page, click the Actions menu and select Save (Ctrl+S).

328
Tips
To update the original budget, enter the amount in the Original Budget field and
press enter. The Current Budget and Proposed Budget are updated with the new
value.
Only authorized project participants can issue budget changes and mark them as
Approved.
You can also approve or deny budget change requests for WBSs or projects from the
Budget Log detail window of the Activities page.
About Earned Value
Earned Value Project Management, or EVPM, is the best practice concerned with early
comparisons between baseline or planned project data and actual or earned project
data to arrive at an accurate assessment of true schedule and cost performance. The
basic concepts are rooted in early Twentieth Century industrial engineering and factory
productivity techniques.
You have probably already practiced at least a basic form of this technique. If you have
ever verified that the work performed was actually accomplished prior to paying a
contractor's invoice, you were utilizing a simple form of Earned Value. Whenever you
measure the physical work performed against a baseline project plan, you are
employing basic principles of EVPM. When you need a reliable way to predict the true
cost performance of a project including its final costs, scheduling, and resource
requirements, you will use Earned Value calculations.
Spanning industries and decades, Earned Value is also known by any of the following
titles:
Planned Value of Work Accomplished (PVWA)
Budgeted Cost of Work Performed (BCWP)
Cost/Schedule Control Systems Criteria (C/SCSC)
PERT/Costs
Earned Value Management (EVM)
Performance Measurement
Example: Executive management wants to assess a critical project early in its schedule.
The project has a planned value of 10 million dollars for 10 WBS units of equal value and is
expected to last 1 year. At the end of 3 months, its actual costs are 3 million dollars,
however, it has only completed 20% of the work, namely 2 units or 2 million dollars of
earned value. This project is behind its baseline schedule by 1 million dollars. It is
performing at 67%. The project will require a 50% increase in funding or 5 million dollars to
complete the work. This is calculated based on its 10 million dollar budget divided by .67
to yield 15 million. If the project is required to return to its original time schedule, it will
require additional resources and/or overtime.

Projects
329
Configuring WBS Earned Value
Configure earned value to define the techniques and settings used for earned value
computations.
To configure WBS earned value:
1) Open one or more projects in the Projects section using one of the following methods:
Click Projects to open the last project or group of projects you were working
with.
Click the Projects menu and choose one of the most-recently used projects
or group of projects.
Click the Projects menu and choose Open Projects to select a project or
group of projects by portfolio type, EPS node, or project code.
2) On the Projects navigation bar, click Activities.
3) On the Activities page, select a WBS and click the Earned Value detail window.
4) In the Earned Value detail window:
a. Select one option for each technique section.
b. If your selections enable fields, selectors, or options, select an option or enter a
value for each field.
5) On the Activities page, click the Actions menu and select Save (Ctrl+S).
About Milestones
A milestone represents any significant event, goal, or gate in a project. Although P6
considers them a type of activity, milestones have zero duration; at any given moment
they are either achieved or not. Some examples of milestones in an office building
addition project might include the following:
project definition complete
structure complete
end bidding process.
Milestones can also be assigned at the WBS-level, and each one given a weight which
indicates its importance to the project schedule. When you mark a milestone as
complete, the weight is used to calculate the performance percent complete of all
activities included in the WBS level.
During project planning, you will want to identify the major milestones as they will help
you monitor the project's progress.
Creating WBS Milestones
Create WBS milestones to specify goals for a project.
To create WBS milestones:

330
1) Open one or more projects in the Projects section using one of the following methods:
Click Projects to open the last project or group of projects you were working
with.
Click the Projects menu and choose one of the most-recently used projects
or group of projects.
Click the Projects menu and choose Open Projects to select a project or
group of projects by portfolio type, EPS node, or project code.
2) On the Projects navigation bar, click Activities.
3) On the Activities page, select a project or WBS and click the WBS Milestones detail
window.
4) In the WBS Milestones detail window, repeat the following steps for each milestone
you want to add:
a. Click Add (Insert) to add a WBS milestone line item.
b. Enter a value in each field.
c. Select or clear the Completed option.
5) On the Activities page, click the Actions menu and select Save (Ctrl+S).
Tips
The Percent Complete field within the the WBS Milestones detail window indicates the
percentage of tasks completed toward achieving the milestone.
Use the Move Up and Move Down arrows to arrange the milestones.
The weight you apply to a milestone is used to calculate the earned value of the
percent of activities completed in achieving the milestone.

331
Team Usage
About Team Usage
Team usage is the display of cost or usage data at the team level and for individual roles
and resources assigned to a project. You can view this data in a graphical (histogram) or
numeric (spreadsheet) timescale.
Customizing Team Usage
Customize team usage to define timescale, limits, and display.
To customize team usage:
1) Open one or more projects in the Projects section using one of the following methods:
Click Projects to open the last project or group of projects you were working
with.
Click the Projects menu and choose one of the most-recently used projects
or group of projects.
Click the Projects menu and choose Open Projects to select a project or
group of projects by portfolio type, EPS node, or project code.
2) On the Projects navigation bar, click Team Usage.
3) On the Team Usage page, click Customize.
4) In the Customize dialog box, configure the team usage lists and options and click
Save.
Tips
To show the histogram legend, select the Histogram option, right-click on the Histogram
chart, and select Show Histogram Legend.
Assigning Resources to Unstaffed Activities
You can assign resources to activities that currently have no resources.
To assign resources to unstaffed activities:
1) Open one or more projects in the Projects section using one of the following methods:
Click Projects to open the last project or group of projects you were working
with.
Click the Projects menu and choose one of the most-recently used projects
or group of projects.
Click the Projects menu and choose Open Projects to select a project or
group of projects by portfolio type, EPS node, or project code.
2) On the Projects navigation bar, click Team Usage.

332
3) On the Team Usage page:
a. If more than one project is open, select a project from the Select Projects list.
b. Click the Organized By list and select Roles.
c. In the left pane, expand a project and select a role.
d. In the right pane, select the Spreadsheet option and click a project.
4) In the Resources dialog box:
a. Select the Unstaffed option to display the unstaffed activities for this project.
b. Select the Select option for each unstaffed activity to which you want to assign
the same resource.
c. Click Assign Resource and assign a resource from the dialog box.
d. Click Close.
Tips
The list of resources you can select from is determined by your resource access
privileges and individual resource's current project association.
To review allocation details before assigning, in the Select Resource dialog box, select
a resource and click Show Detail.
To search for resources who meet specific requirements, see Searching Resources (on
page 333).
You can also assign resources to activities from the Assignments detail window of the
Activities page, the Open Requests for Resources portlet of a dashboard, or the Roles
tab of the Administration page of the Resources section.
Exporting Team Usage Spreadsheets
You can export project team allocation and cost data to a Microsoft Excel *.xls file.
To export team usage spreadsheets:
1) Open one or more projects in the Projects section using one of the following methods:
Click Projects to open the last project or group of projects you were working
with.
Click the Projects menu and choose one of the most-recently used projects
or group of projects.
Click the Projects menu and choose Open Projects to select a project or
group of projects by portfolio type, EPS node, or project code.
2) On the Projects navigation bar, click Team Usage.
3) On the Team Usage page:
a. If more than one project is open, select a project from the Select Projects list.
b. Select an option from the Organized By list.
c. Expand a project and select a resource or role from the left pane.
d. Select the Spreadsheet option in the right pane and click Export Spreadsheet.

Projects
333
4) In the File Download dialog box, click Open or Save.
Note: If you select Save, navigate to a file location in the Save As
dialog box and click Save.
Tips
You can also export spreadsheets from the Overallocated Resources portlet of the
Workspace page.
Searching Resources
You can search for resources to assign to one or more activities.
To search resources:
1) Open one or more projects in the Projects section using one of the following methods:
Click Projects to open the last project or group of projects you were working
with.
Click the Projects menu and choose one of the most-recently used projects
or group of projects.
Click the Projects menu and choose Open Projects to select a project or
group of projects by portfolio type, EPS node, or project code.
2) On the Projects navigation bar, click Team Usage.
3) On the Team Usage page:
a. If more than one project is open, select a project from the Select Projects list.
b. Click the Organized By list and select Roles.
c. In the left pane, expand a project and select the role that the resource must be
able to fill.
d. In the right pane, select the Spreadsheet display option and select the project that
contains the activities to which you want to assign resources.
4) In the Resources dialog box:
a. Select the Unstaffed and Staffed option to show all available activities in that
project.
b. Select the Select option for the activities to which you want to assign resources
and click Search.
c. In the Define Search Criteria section, specify search criteria.
d. In the Define Sort Criteria section, specify criteria to sort the resources.
Note: You must select Sort results by availability to enable the
options in this section.
e. Click Save as Template if you would like to use this criteria as a template in the
future.

334
f. Click Run Search to display the resources that match these requirements.
g. In the list of Resource Search Results:
If you find a desirable resource, select the Select option for the resource and
click Assign Resource.
If you did not find a desirable resource, click Search and begin the search
again.
h. When you are finished, close the Resources dialog box.
Tips
To search using a template, click Select Template in the Resources dialog box and
select a template from the dialog box.
To return to the resource staffing list, click Resource Staffing in the Resources dialog
box.
You can also search resources from the Resource Search Criteria page of the Open
Requests for Resources portlet of the Dashboards page.
In the search criteria, if you specify a primary role and no other role, only those
resources who are available and are assigned that primary role will be included in the
search results. To find all available resources who have the specified role assigned,
even if it is not their primary role, leave the primary role text entry box blank and type
the role you want to search for in the second text entry box of the role criteria section.
Sending E-Mail to a Project Manager
You can send e-mail to the manager of a particular project.
To send e-mail to a project manager:
1) Open one or more projects in the Projects section using one of the following methods:
Click Projects to open the last project or group of projects you were working
with.
Click the Projects menu and choose one of the most-recently used projects
or group of projects.
Click the Projects menu and choose Open Projects to select a project or
group of projects by portfolio type, EPS node, or project code.
2) On the Projects navigation bar, click Team Usage.
3) On the Team Usage page:
a. If more than one project is open, select a project from the Select Projects list.
b. Click the Organized By list and select Resources.
c. In the left pane, expand the project and select a resource.
d. In the right pane, select the Spreadsheet display option and click a project. The
manager of this project will receive your e-mail.
4) In the Resource Project Activities dialog box, click E-mail project manager.
5) In the E-mail dialog box:

Projects
335
a. Edit the recipient list, message, and subject as needed.
b. Click Send E-mail.
Tips
You must have an e-mail address listed in you user profile to send an e-mail.


337
Issues
About Issues
Issues are perceived problems within a schedule that require attention or corrective
action. When you create them in the Activities section, you can associate them with a
single project or workgroup and assign them to a responsible manager in the OBS for
follow-up based on priority. You can also associate issues with a single activity. When
adding new issues to a project or workgroup, you can control the information you
capture for each new issue. You can choose to receive e-mail notifications when new
issues of a certain priority are added, when existing issues are modified, or when issues
are assigned a specific issue code.
You can also think of issues as impediments, action items, open items, punch lists, logs, or
concerns. Over time, if you do not resolve or close open issues or issues placed on hold,
they can become risks.
Issue codes enable you to organize and categorize issues in a way that is meaningful to
you. For example, you can create an issue code titled Severity, and subsequently create
issue code values: High, Medium, and Low. You can assign each of these code values to
issues across multiple projects, enabling you to categorize each issue according to how
severe it is. Similarly, you can create codes to categorize issues by responsibility,
subproject, or any other classification you require to organize issues. Assigning issue
codes enables you to quickly search for and view issues according to specific criteria.
Working with Issues
Issues are known problems within an activity, project, or workgroup that require attention
or corrective action.
Viewing issues
You can view issues from several areas within the application:
From a dashboard, you can access the My Issues portlet to view issues you are
associated with in the context of the filter criteria selected for the dashboard.
From the Workspace page, you can access the Project Issues portlet to view issues
associated with the project selected in the Select Project list.
From the Workgroup Workspace page, you can access the Issues portlet to view
issues associated with the workgroups to which you belong.
From the Issues page, you can access issues for any open project. On the Issues
page, you can view all of the issues for all open projects at one time.
From the Activities or EPS page, you can access the Issues detail window to view
issues associated with an activity, WBS, or project.

338
In each of these areas, depending on your security privileges, you can customize the
issue display. For example, you can choose to view issues in either a list or chart format.
You can also configure group, sort, and filter options to focus on issues that are most
important to you. Additionally, you can add, revise, or delete issues from each of these
areas. When adding new issues to a project or workgroup, the issue forms feature
enables you to control the information you capture for each new issue. If you add issues
from a detail window, the issue is added as a line item and does not require the selection
of an issue form.
Note: Issues cannot be used with template projects.
Organizing and managing issues
To help organize and manage issues for your project or workgroup, additional issue
management features are available, depending on your security privileges.
To organize issues, you can assign enterprise-level issue codes, which enable you to
categorize issues in a way that is meaningful to you.
The features for organizing and managing issues are accessible via the Enterprise Data
option on the Administer menu. Use the issues options in the Enterprise Data pane to add,
edit, and delete issue codes and issue user-defined fields. These options appear only if
you have the required privileges.
Creating Project Issues
Create project issues to identify problems within a schedule that must be addressed
before the project can be completed.
To create issues:
1) Open one or more projects in the Projects section using one of the following methods:
Click Projects to open the last project or group of projects you were working
with.
Click the Projects menu and choose one of the most-recently used projects
or group of projects.
Click the Projects menu and choose Open Projects to select a project or
group of projects by portfolio type, EPS node, or project code.
2) On the Projects navigation bar, click Issues.
3) On the Issues page, expand a project and click Add an Issue.
4) In the Select an Issue Form dialog box, select a form to act as the foundation of the
issue and click OK.
5) On the Add Issue page, configure the issue fields and lists and click Save.
Tips
You cannot add an issue to a project that is checked out or locked. You also cannot
create issues for template projects.

Projects
339
If no issue forms are assigned to the project, the Default Form is the only form you can
choose. The Default Form displays all issue fields.
You can also create project issues from the Project Issues portlet of the Workspace
page, the Issues detail window of the Activities or EPS page, or the My Issues portlet
of the Dashboards page.
If you are adding an issue from the My Issues portlet, you can choose any issue form
assigned to any project that falls within the filter criteria specified for a dashboard.
Issue forms are organized by project.
Configuring Project Issues
Configure project issues to update issues that have been identified for a project.
To configure project issues:
1) Open one or more projects in the Projects section using one of the following methods:
Click Projects to open the last project or group of projects you were working
with.
Click the Projects menu and choose one of the most-recently used projects
or group of projects.
Click the Projects menu and choose Open Projects to select a project or
group of projects by portfolio type, EPS node, or project code.
2) On the Projects navigation bar, click Issues.
3) On the Issues page, expand a project and click an issue.
4) On the Details of page configure the following sections as necessary:
a. In the General section, configure the fields and lists.
b. Expand the Description section, and enter a description in the text field.
c. Expand the Issue Codes section and assign issue codes. See Assigning Issue
Codes (on page 342).
d. Expand the Related Items section and assign related documents or issues. See
Assigning Related Items to Issues (on page 340).
Tips
You can also configure workgroup issues from the Issues portlet of the Workgroup
Workspace page.
You can also configure issues from the Project Issues portlet of the Workspace page
or the My Issues portlet of the Dashboards page.
Customizing Project Issues
Customize project issues to define how columns, filters, groups, and charts are displayed
in the user interface.
To customize project issues:
1) Open one or more projects in the Projects section using one of the following methods:

340
Click Projects to open the last project or group of projects you were working
with.
Click the Projects menu and choose one of the most-recently used projects
or group of projects.
Click the Projects menu and choose Open Projects to select a project or
group of projects by portfolio type, EPS node, or project code.
2) On the Projects navigation bar, click Issues.
3) On the Issues page, click Customize.
4) In the Customize Project Issues dialog box:
a. Click the Columns tab and configure the Selected Columns and Sort lists. See
Configuring Columns or Values (on page 91).
b. Click the Filter tab and select to show all available issues or define a filter.
c. Click the Group tab and configure the grouping lists and options.
d. Click the Chart tab and configure the chart format.
e. Click Save.
Tips
Select the All Issues option on the Filter tab if you do not want to apply a filter. To
construct a filter, select Custom Filter and configure the fields and lists to create one
or more filter statements.
You can also customize project issues from the Project Issues portlet of the Workspace
page, the Issues portlet of the Workgroup Workspace page, or the My Issues portlet
of the Dashboards page.
Assigning Related Items to Issues
You can assign related documents and issues to an issue.
To assign related items to an issue:
1) Open one or more projects in the Projects section using one of the following methods:
Click Projects to open the last project or group of projects you were working
with.
Click the Projects menu and choose one of the most-recently used projects
or group of projects.
Click the Projects menu and choose Open Projects to select a project or
group of projects by portfolio type, EPS node, or project code.
2) On the Projects navigation bar, click Issues.
3) On the Issues page, expand a project and select an issue.
4) On the Details of page, expand the Related Items section.
5) In the Related Items section:

Projects
341
To relate documents, click Relate Documents and select documents from the
dialog box.
To related issues, click Relate Issues and select issues from the dialog box.
Tips
To remove a document or issue, select the option next to the name of the item and
click Remove.
The instructions in this topic assume that the content repository is configured.
The Related Documents dialog box will only display documents of the selected
project.
You can also assign items to issues from the Project Issues portlet of the Workspace
page. You can assign items to workgroup issues from the Issues portlet of the
Workgroup Workspace page.
Sending E-Mail about Issues
You can send e-mails about project and workgroup issues that include basic information,
such as project, issue name, priority and due date.
To send issue e-mails:
1) Open one or more projects in the Projects section using one of the following methods:
Click Projects to open the last project or group of projects you were working
with.
Click the Projects menu and choose one of the most-recently used projects
or group of projects.
Click the Projects menu and choose Open Projects to select a project or
group of projects by portfolio type, EPS node, or project code.
2) On the Projects navigation bar, click Issues.
3) On the Issues page, expand a project and click E-Mail for one of the issues.
4) In the E-mail dialog box:
a. Edit the recipient list, message, and subject as needed.
b. Click Send E-mail.
Tips
You must have an e-mail address listed in you user profile to send an e-mail.
The e-mail message is pre-filled with the addresses of the project manager and
responsible manager. The subject area is pre-filled with basic information, such as
project, issue name, priority and due date.
You can also send issue e-mails from the Issues portlet of the Workgroup Workspace
page, the Project Issues portlet of the Workspace page, or the My Issues portlet on
the Dashboards page.

342
About Issue Codes
Issue codes enable you to organize and categorize issues in a way that is meaningful to
you. For example, you can create an issue code titled Severity, and subsequently create
issue code values: High, Medium, and Low. You can assign each of these code values to
issues across multiple projects, enabling you to categorize each issue according to how
severe it is. Similarly, you can create codes to categorize issues by responsibility,
subproject, or any other classification you require to organize issues. Assigning issue
codes enables you to quickly search for and view issues according to specific criteria.
Assigning Issue Codes
You can assign issue codes to organize and categorize issues in a way that is meaningful
to you.
To assign an issue code:
1) Open one or more projects in the Projects section using one of the following methods:
Click Projects to open the last project or group of projects you were working
with.
Click the Projects menu and choose one of the most-recently used projects
or group of projects.
Click the Projects menu and choose Open Projects to select a project or
group of projects by portfolio type, EPS node, or project code.
2) On the Projects navigation bar, click Issues.
3) On the Issues page, expand a project and select an issue.
4) On the Details of page, expand the Issue Codes section and click Assign Issue Codes.
5) In the Select Issue Codes detail window, select a code and click Assign.
Tips
You can only assign one issue code at a time. Click Assign Issue Codes again to
assign another code.
You can also assign issue codes from the Project Issues portlet on the Workspace
page or the My Issues portlet on the Dashboards page.
About Issue Forms
An issue form is a template, or framework, that you can use to create new issues. Issue
forms specify the information required for adding a new issue to the project. You can
create issue forms to capture issue information specific to a department in your
organization, or for any other specific purpose.

Projects
343
Creating Issue Forms
Create an issue form to capture all the attributes your organization wants to track when
users add issues to a project. Each form helps maintain consistency when future issues
are identified. Project members must select an issue form to serve as a template when
they want to create a new issue.
To create an issue form:
1) Click Projects.
2) On the Projects navigation bar, click Issues.
3) On the Issues page, click Issue Forms.
4) In the Issue Forms pane, click Modify and then click Add Form.
5) In the Select a Form to Copy dialog box, select an existing form or the default form to
copy as the basis for your new form. Click OK.
6) On the Issue Forms page:
a. Enter a name in the Form Name field.
b. Select or clear the Display options to determine which attributes appear when
users add new issues based on this form.
c. To associate issues with codes, expand the Issue Codes section, click Assign Issue
Codes, and select issue codes from the dialog box.
d. To associate issues with UDFs, expand the User Defined Fields section, click Assign
User Defined Fields, and select user-defined fields from the dialog box.
7) For all the attributes you assigned or marked with the Display check box:
a. Set their Default Value fields, if available. Select a value from the list, enter a value
in the field, or click and select a value from the dialog box.
b. Select the Required check box for each attribute you want to designate as
mandatory. Users must provide data for these fields when adding new issues
based on this form.
8) On the Issue Forms page, click the Access tab.
9) On the Access tab, click Assign Projects.
10) In the Select a Project dialog box, select a project in which you want to make this
form available for users adding new issues. Click Assign. Repeat this step for all
projects in which this issue form should be available. Click Close.
11) Click Save.
Tips
To modify a form, navigate to the Issue Form Details page and select a form in the
Issue Forms pane.
To delete an issue code, user-defined field, or project assignment, click Delete in
the item's row. To delete an entire issue form, select the form first in the Issue Forms
pane. Then, in that same pane, click Modify, and then click Delete.

344
Assigning Projects to Issue Forms
You can specify the issue forms you want to make available for use in a project. When
you assign a project to an issue form, it becomes available for project members to use
when they add a new issue to a project or workgroup within the project.
To assign projects to issue forms:
1) Open one or more projects in the Projects section using one of the following methods:
Click Projects to open the last project or group of projects you were working
with.
Click the Projects menu and choose one of the most-recently used projects
or group of projects.
Click the Projects menu and choose Open Projects to select a project or
group of projects by portfolio type, EPS node, or project code.
2) On the Projects navigation bar, click Issues.
3) On the Issues page, click Issue Forms.
4) On the Issue Forms page, click the Access tab.
5) On the Access tab, expand the Projects section and click Assign Projects.
6) In the Select a Project dialog box, assign projects to the issue form and click Close.
7) On the Access tab, click Save.
Tips
You can assign multiple projects to issue forms.
Your access to pages, tabs, and menu items is controlled by the settings defined in
your assigned user interface view. Depending on your view settings, you might be
able to change your view preferences to show or hide items according to your
needs.

345
Risks
About Risks
Risks are any uncertain events or conditions that, if they occur, have a positive or
negative effect on project objectives. Risks are also known as threats, warnings,
imperatives, escalation notices, or jeopardies. Positive risks are often classified as
opportunities which, if they occur, are realized as rewards. Thorough documentation and
analysis of risks over multiple projects offer lessons, and potentially cost and time savings,
for all future projects.


347
Risk Enterprise Data
Working with Risks Enterprise Data
Risk Enterprise data is used to setup categories, risk scoring matrices, and thresholds that
are standard across your company. The categories and matrices that are assigned to a
project can be displayed in the risk register, which is located in the Projects section under
Risks.
Risk Categories page - Risk categories are used to categorize and organize project risks.
They are global across the enterprise and are a mechanism to group risks across multiple
projects to see risk trends across the organization as well as a single project. Technical,
Operational, External are examples of risk categories that might apply to a typical
project. The risk categories are created in the Risks Enterprise Data area and assigned on
the Risks page under Projects.
Risk Scoring Matrices page - Create a risk scoring matrix to perform qualitative risk
analysis on your project risks. When creating a risk scoring matrix, you must define the
probability, tolerance, cost, and schedule impacts. Additionally, you can add
user-defined impacts to the matrix. You must also assign a risk scoring method (Highest
Impact, Average Impact, and Average Individual Impact) to the matrix. A probability
and impact diagram is created based on the information assigned in the matrix. Click on
the Probability and Impact Diagram detail window to view the diagram.
To use the risk scoring matrix, you must add the projects you want to use the matrix to the
risk scoring matrix from the Projects detail window. You can also assign a risk scoring
matrix to a project from the EPS page from the Projects section.
Note: You can add risks to a project without a risk scoring matrix;
however, you cannot perform qualitative risk analysis and will not
be able to assign probability or impact thresholds without a risk
scoring matrix. You can add a risk scoring matrix to the project at
any time.
Risk Thresholds page - Create risk thresholds, including probability, tolerance, cost
impact, schedule impact, and any additional user-defined impacts, for use in the risk
scoring matrix.
Risk UDFs page - Risk UDFs are used to track additional information about the risk that is
not provided by the standard risk fields. Create Risk user-defined fields (UDFs) when it is
necessary to view additional data fields on the Risks page. A risk UDF can include a text
string, a numerical value, start date, finish date, cost, integer, or indicator.
Configuring Risk Enterprise Data
You can configure enterprise data to include risk categories and risk UDFs, and to define
the criteria for performing qualitative risk analysis using a risk scoring matrix.

348
To define the criteria for performing qualitative risk analysis, perform the following tasks:
1) Creating Risk Thresholds (on page 350)
2) Creating Risk Scoring Matrices (on page 357)
3) Assigning a Risk Scoring Matrix to a Project (on page 358)
To configure risk categories or risk UDFs, see:
Creating Risk Categories (on page 361)
Creating Risk UDFs (on page 363)

349
Risk Thresholds
About Risk Thresholds
Risk thresholds are a range of values (monetary, time, quality, technical, etc.) used in
rating or assessing the impact of the risk to the project. A risk reaching or crossing over the
defined risk threshold requires attention and might require a risk response action.
These thresholds are the inputs used to create a risk scoring matrix, which is the overall
scoring mechanism used to perform qualitative risk analysis on your project risks.
Working with Risk Thresholds
From the Risk Thresholds page, you create risk thresholds for use in your risk scoring
matrices.
Risk thresholds necessary for a risk scoring matrix are:
Probability: The likelihood of a risk occurring.
Tolerance: The acceptability or manageability of a risk on a project.
Schedule: The amount of time the risk will increase or decrease the project schedule.
Cost: The cost impact if a risk occurs.
You can also add additional user-defined impacts necessary for the calculation of your
risk score.
Table of Risk Threshold Elements
Item Description
Risk Threshold toolbar. See Enterprise Data Risk Thresholds Toolbar.

350
Item Description
Risk Threshold work area: You define the risk threshold name, type
(Probability, Tolerance, Schedule Impact, Cost Impact, User-Defined
Impact), and number of thresholds levels in this work area. Each threshold
can have 2 - 9 levels; however, the cost impact, schedule impact, and
any user-defined impacts must have the same number of levels for a
given risk scoring matrix.
In the example above, the Cost Impact, Schedule Impact, Probability,
and Tolerance thresholds are defined for the Harbour Pointe Assisted
Living construction project. The Cost Impact and Schedule Impact
thresholds are each defined with 5 levels and the Probability threshold is
also defined with 5 levels. The risk scoring matrix that will be using these
thresholds will have a matrix size of 5 x 5.
For each risk scoring matrix, only one threshold for Probability, Tolerance,
Schedule Impact, and Cost Impact is allowed. You can add as many
user-defined impacts as necessary. You create multiple thresholds of the
same type, but with different values, when you create multiple risk
scoring matrices.
Levels detail window: The details for each level are defined in this
window. Define a name for each level and a code, which is a short
name or abbreviation for the name. Also, define the range of
acceptable values for that level; the range levels could be a percentage
value, dollar amount, number of days, or a text string depending on the
chosen threshold. You can define a color for each threshold level;
however, you should define colors for the tolerance threshold. The colors
for the threshold are used to give visual representation in the risk register.
The colors for the tolerance threshold are used in the Probability and
Impact Diagram (PID) to visually represent the threshold values. More
importantly, the colors display in the Score and Score (text) fields on the
risk register on the Projects Risks page. This enables you to easily identify
where in the risk scoring matrix this risk falls in terms of severity.
In the example above, the Tolerance threshold is defined with 3 levels
(High, Medium, and Low) and each range is assigned a color. You will
see the impact the color makes after you create a risk scoring matrix,
assign the thresholds to the matrix, and assign a risk scoring method. See
Working with Risk Scoring Matrices (on page 354).
Creating Risk Thresholds
You create risk thresholds, which you then use as inputs when creating a risk scoring
matrix. When creating risk thresholds, you must define the probability threshold, cost
impact threshold, schedule impact threshold, and tolerance threshold. You can also
define as many user-defined impacts as necessary.

Projects
351
To create risk thresholds:
1) Click the Projects menu and select Enterprise Project Data, or click the
Administer menu and select Enterprise Data.
2) Risks and click Risk Thresholds.
3) Repeat the following for each threshold you want to create:
a. On the Risk Thresholds page:
1. Click Add (Insert).
2. In the Name field, double-click and type a threshold name.
3. In the Type field, double-click and select a type of risk from the list.
4. In the Levels field, double-click and select a level number from the list.
b. In the Levels detail window, a default value is assigned for the Code, Name, and
Range values. You can use the default values provided, or double-click any field
to customize that field.
You can define a color for each threshold level to visually represent the values
when working the risk register on the Project Risks page. However, you should
define colors for the tolerance threshold. The colors for the tolerance threshold are
used to color the Score field on the risk register on the Projects Risks page. This
enables you to easily identify where in the risk scoring matrix this risk falls in terms of
severity.
4) On the Risk Thresholds page, click Save (Ctrl+S).
Modifying Risk Thresholds
If you are going to change the type or level of a threshold that is currently assigned to a
scoring matrix, you must first remove the threshold from the risk scoring matrix and assign
a new threshold.
To delete a threshold from a risk scoring matrix:
1) Click the Projects menu and select Enterprise Project Data, or click the
Administer menu and select Enterprise Data.
2) In the Enterprise Data pane, expand Risks and click Risk Scoring Matrices.
3) Repeat the following for each risk scoring matrix that includes the threshold you are
modifying.
a. On the Risk Scoring Matrices page:
1. Locate the risk scoring matrix that includes the threshold you are modifying.
2. Double-click in the appropriate threshold field.
b. In the Select Threshold dialog box, choose a different threshold and click Assign,
and then click Close.
4) On the Risk Scoring Matrices page, click Save (Ctrl+S).
To modify a risk threshold:

352
1) Click the Administer menu and select Enterprise Data.
2) In the Enterprise Data pane, expand Risks and click Risk Thresholds.
3) On the Risk Thresholds page:
a. Locate the threshold you are modifying.
b. Double-click in the field you are modifying and update the value.
Note: If you are modifying the number of levels assigned to a
threshold, all data for existing levels are overwritten and replaced
with the default values for that level.
c. Click Save (Ctrl+S).

353
Risk Scoring Matrices
About Risk Scoring Matrices
A risk scoring matrix is a qualitative analysis tool used to calculate the impact of a risk on
a project. A risk scoring matrix includes probability threshold values, cost and impact
threshold values, and any additional user-defined impact threshold values, which are all
used in the calculation of the risk score. The score is used to give an overall rating of a risk
depending on the probability and impact thresholds assessed in the project. The scores
are used to help determine if the risk should be addressed during the course of the
project, or if the risk does not present a significant impact to the cost or schedule of the
project.

354
Working with Risk Scoring Matrices
Use the Risk Scoring Matrices page to create a risk scoring matrix for one or more
projects. The inputs to the risk scoring matrix are the risk thresholds, which you create on
the Risk Thresholds page from the Enterprise Data section.
Table of Risk Scoring Matrices Elements
Item Description
Risk Scoring Matrices toolbar. See Enterprise Data Risk Scoring Matrices
Toolbar.

Projects
355
Item Description
Risk Scoring Matrices work area: This work area contains all the risk
scoring matrices defined for your company. The number of risk scoring
matrices you create is determined by risk analysis practices incorporated
in your business. You might have one corporate-wide risk scoring matrix
that is used for all projects, or you might have a need for separate
matrices which are used depending on different factors, such as project
size. For example, a project that is a new development might require
different cost impact and schedule impact threshold values than a
project for a new feature development on an existing product.
There might also be situations where a project is a joint-venture or is
performed by a contractor and the prime owner's matrix must be used.
However, for any project, only one matrix is assigned.
In the work area above, you can see this company has a need for
multiple risk scoring matrices, including a separate risk scoring matrix for
the Harbour Pointe Assisted Living construction project.
When creating a risk scoring matrix, you choose a matrix size based on
the number of levels assigned to your probability and impact thresholds
defined on the Risk Thresholds page. Using the Harbour Pointe Risk
Scoring Matrix as an example, the risk scoring matrix is 5 x 5. The first 5
represents the number of levels assigned to the probability threshold and
the second 5 represents the number of levels assigned to the cost and
schedule impact thresholds.
Next you choose the risk scoring method to use for risk score calculations.
For more information on risk scoring methods, see Risk Scoring Method.

356
Item Description
Risk Scoring Matrices detail windows:
Description: The area used to describe the risk scoring matrix.
Projects: The area where you assign the matrix to one or more projects.
Note that only one matrix can be assigned to a single project. If a matrix
is not assigned to a project, risks can still be entered in the risk register on
the Projects Risks page; however, the probability, cost impact, and
schedule impact threshold fields are disabled, and you cannot use the
qualitative analysis features of the application. At any time you can
create a matrix and assign it to an existing project.
Probability and Impact Diagram (PID): The PID is a graphical
representation of the selections made in the Risk Scoring Matrices work
area. The number of rows and columns is determined by the matrix size.
The rows are the probability levels and the columns are the impact levels.
The code and name fields for the impact threshold levels are
customizable when creating a threshold; therefore, the column labels for
the impacts are "Severity n." The number of severity columns reflects the
number of levels assigned to the impact thresholds.
The color coding indicates the tolerance threshold assigned to the risk
scoring matrix. These same tolerance colors are also visible in the Score
and Score (Text) fields on the risk register on the Projects Risks page when
risk values are entered.
Probability: The details of the probability threshold assigned to the matrix
needed to perform a qualitative assessment on project risks. This detail
window is read-only. To change anything related to the threshold,
navigate to the Risk Thresholds page.
Impacts: The details for the impact thresholds assigned to the matrix. A
cost and schedule impact must be defined for the matrix to perform a
qualitative assessment on project risks. An unlimited number of
user-defined impact thresholds can be assigned to the matrix. From this
detail window you can add or delete impacts to the matrix; however,
you cannot modify the threshold values. To change anything related to
the threshold, navigate to the Risk Thresholds page.
Tolerance: The details for the tolerance threshold assigned to the matrix.
This detail window is read-only. To change anything related to the
threshold, navigate to the Risk Thresholds page.

Projects
357
Creating Risk Scoring Matrices
Create a risk scoring matrix to perform qualitative analysis on project risks. Project risk is
assessed based on the thresholds defined in the risk scoring matrix.
Before creating a risk scoring matrix, you need to first define risk thresholds.
To create a risk scoring matrix:
1) Click the Projects menu and select Enterprise Project Data, or click the
Administer menu and select Enterprise Data.
2) In the Enterprise Data pane, expand Risks and choose Risk Scoring Matrices.
3) On the Risk Scoring Matrices page:
a. Click Add (Insert).
b. In the Name field, click and type a unique name.
c. In the Matrix Size field, double-click and click .
4) In the Select Matrix Size dialog box:
a. Choose a threshold level for the Probability and Impact fields.
Note: You must have already defined thresholds with the number
of levels you are assigning to the matrix (see Creating Risk
Thresholds (on page 350)). If you do not have a threshold with the
same number of levels, you will be able to select the matrix size, but
you will not be able to add a threshold.
b. Click OK.
5) On the Risk Scoring Matrices page, double-click in the Probability Threshold field and
click .
6) In the Select Probability Threshold dialog box, choose a probability and click OK.
7) On the Risk Scoring Matrices page, double-click in the Impact Thresholds field and
click .
8) In the Select Impact Thresholds dialog box:
a. Select a Cost Impact and click Assign.
b. Select a Schedule Impact and click Assign.
c. Select any additional impacts and click Assign.
d. Click Close.
9) On the Risk Scoring Matrices page, double-click in the Tolerance Threshold field and
click .
10) In the Select Tolerance Threshold dialog box, choose a tolerance and click OK.
11) On the Risk Scoring Matrices page, double-click in the Risk Scoring Method field and
select a risk scoring method from the list. For a detailed description of each method,
see Risk Scoring Method Description.
12) In the Description detail window, type a description of the risk scoring matrix.

358
13) On the Risk Scoring Matrices page, click Save (Ctrl+S).
Assigning a Risk Scoring Matrix to a Project
You need to assign a scoring matrix to a project before it can be used to prioritize risks.
Once you assign a scoring matrix to a project, it is available for use from the risk register
on the Projects Risks page.
You can assign a risk scoring matrix to a project from different areas in the application,
depending on the tasks you are working on at the time.
When setting up a project, see Assigning a Risk Scoring Matrix to a Project from the
EPS Page (see "Assigning a Risk Scoring Matrix to a Project from the EPS Page" on
page 359).
When defining a risk scoring matrix and applying the matrix to multiple projects, see
Assigning a Risk Scoring Matrix to a Project from the Enterprise Data Pane (on page
358).
When managing a portfolio, see Assigning a Risk Scoring Matrix to a Project from the
Portfolios Section (on page 359).
Assigning a Risk Scoring Matrix to a Project from the Enterprise Data Pane
You need to assign a risk scoring matrix to a project before it can be used to prioritize
risks. Once you assign a scoring matrix to a project, it is available for use from the risk
register on the Projects Risks page.
You can assign a risk scoring matrix to a project from multiple locations in the application.
Use this method when you are defining a risk scoring matrix and need to apply the matrix
to one or more projects.
To assign a risk scoring matrix to a project from the Enterprise Data pane:
1) Click the Projects menu and select Enterprise Project Data, or click the
Administer menu and select Enterprise Data.
2) In the Enterprise Data pane, expand Risks and choose Risk Scoring Matrices.
3) On the Risk Scoring Matrices page, click the Projects detail window.
4) In the Projects detail window, click Add (Insert).
5) In the Select Project dialog box:
a. Select a project and click Assign.
Note: If the project you selected is assigned to another risk scoring
matrix, the threshold values you previously set for the project are
removed. You will need to select values using the newly assigned
risk scoring matrix.
b. Select any additional projects and click Assign.
c. Click Close.
6) On the Risk Scoring Matrices page, click Save (Ctrl+S).

Projects
359
Assigning a Risk Scoring Matrix to a Project from the EPS Page
You need to assign a risk scoring matrix to a project before it can be used to prioritize
risks. Once you assign a scoring matrix to a project, it is available for use from the risk
register on the Projects Risks page.
You can assign a risk scoring matrix to a project from multiple locations in the application.
Use this method when you are setting up a project or modifying project settings.
To assign a risk scoring matrix to a project from the EPS page:
1) Click Projects.
2) On the Projects navigation bar, click EPS.
3) On the EPS page:
a. Locate the project you want to associate with a risk scoring matrix.
b. Double-click in the Risk Scoring Matrix field and click .
4) In the Select Risk Scoring Matrix dialog box, select a matrix and click OK.
Note: If the project you selected is assigned to another risk scoring
matrix, the threshold values you previously set for the project are
removed. You will need to select values using the newly assigned
risk scoring matrix.
5) On the EPS page, click Save (Ctrl+S).
Tips
If the Risk Scoring Matrix field is not visible, click View and select Columns. In the
Customize Columns dialog box, expand General and double-click Risk Scoring Matrix to
move it to the Selected Columns list. Click OK.
Assigning a Risk Scoring Matrix to a Project from the Portfolios Section
You need to assign a risk scoring matrix to a project before it can be used to prioritize
risks. Once you assign a scoring matrix to a project, it is available for use from the risk
register on the Projects Risks page.
You can assign a risk scoring matrix to a project from multiple locations in the application.
Use this method when you are creating or modifying a portfolio.
To assign a risk scoring matrix from the Portfolios section:
1) Click Portfolios.
2) On the Portfolios navigation bar, click Portfolio Analysis.
3) On the Portfolio Analysis page:
a. Click the View field and select a scorecard view from the list.
b. Select a project.
c. In the Risk Scoring Matrix field, double-click and click .

360
4) In the Select Risk Scoring Matrix dialog box, choose a risk scoring matrix and click OK.
Note: If the project you selected is assigned to another risk scoring
matrix, the threshold values you previously set for the project are
removed. You will need to select values using the newly assigned
risk scoring matrix.
5) On the Portfolio Analysis page, click Save (Ctrl+S).
Tips
If the Risk Scoring Matrix field is not visible, click Customize. In the Customize Scorecard
dialog box, click the Columns tab. On the Columns tab, expand General and
double-click Risk Scoring Matrix to move it to the Selected Columns list. Click Apply.

361
Risk Categories
About Risk Categories
Risk categories are a classification of risk types customized to your specific project or
business that are used to categorize and organize project risks. Categorizing risks enables
you to analyze the types of risks occurring and see trends within the project or across
multiple projects. This visibility will enable you to more effectively manage risks over the
long term.
Creating Risk Categories
Create a risk category to categorize and organize project risks.
To create a risk category:
1) Click the Projects menu and select Enterprise Project Data, or click the
Administer menu and select Enterprise Data.
2) In the Enterprise Data pane, expand Risks and click Risk Categories.
3) On the Risk Categories page:
a. Click Add (Insert).
b. In the Category field, double-click and type a unique name.
c. Click Save (Ctrl+S).
Tips
To display the Category field on the Projects Risks page, click Select Columns on the Risks
toolbar and select Category.


363
Risk UDFs
About Risk User Defined Fields
User defined fields allow you to create and maintain data specific to your organization.
For example, you can track additional activity data, such as delivery dates and
purchase order numbers. You can also track additional resource data or project
cost-related data, such as profit, variances, and revised budgets. User defined fields are
global, so they can be used across all projects in your organization.
Creating Risk UDFs
Create risk user-defined fields (UDFs) to store additional project risk data on the Projects
Risks page that is pertinent to your project or business and is not available from the
default fields. For example, you might need to include a location field to identify where
the risk might occur, or a ranking field to determine the order in which the risks will be
handled.
User-defined fields can be of many types: text, start date, finish date, cost, number,
integer, or indicator. Data from UDFs is not used in scoring calculations.
To create a risk UDF:
1) Click the Projects menu and select Enterprise Project Data, or click the
Administer menu and select Enterprise Data.
2) In the Enterprise Data pane, expand Risks and click Risk UDFs.
3) On the Risk UDFs page:
a. Click Add (Insert).
b. In the User Defined Field, double-click and type a name.
c. In the Data Type field, double-click and choose a data type from the list.
d. Click Save (Ctrl+S).


365
Project Risks
Working with Project Risks
The risk register on the Risks page is the main area of the application where you identify
and manage risks for a project. Additionally, you can add risks to a project from the
Projects EPS page, and add risks to a project and assign the risks to activities from the
Activities page.
Once you add a risk to the risk register, you can perform further analysis on the risk and
create one or more risk response plans which include activities to reduce the negative
impact of the risk. See About Risk Response Plans (on page 371).
Table of Project Risks Elements
Item Description
Risks toolbar. See Risks Toolbar.

366
Item Description
Risks work area: Risks for all the projects you have open display in the risk
register. You can group by field name, such as project name to view all
risks organized by project, or create a filter to view only the risks that
interest you.
When adding a risk to the risk register, you supply a name for the risk,
identify the risk as a threat or an opportunity, identify the current status of
the risk, identify the owner of the risk, and then assign the values for
probability, schedule, cost, and any other applicable user-defined
impacts. The values for probability, schedule, cost, and additional
user-defined impacts are used to calculate the risk score.
Note: If the Probability, Cost, and Schedule fields
are disabled, a risk scorning matrix has not been
assigned to the project. You can still use the risk
register to track your risks; however, you cannot use
the qualitative risk analysis features in the
application until you create a risk scoring matrix
and assign it to the project.
Risks detail windows:
Response Plans: The area where you add response plans and response
plan action items. See Working with Risk Response Plans (on page 371).
Activities: The area where you associate scheduled activities in your
project to an identified risk. Refer to the example above to see a list of
the project activities impacted by risk R001: Concrete supply
constrained.
Description: The area used to provide a detailed explanation of the risk.
Cause: The area used to explain why this risk is occurring.
Effect: The area used to describe the impact this risk has on this project.
Notes: The area used to capture any additional information regarding
the risk.
Probability and Impact Diagram: The Probability and Impact Diagram
(PID) is a graphical representation of the probability and impact
thresholds assigned to the risk scoring matrix associated with the project.

Projects
367
Managing Project Risks
You can perform qualitative analysis on your project risks. Using the tasks listed below, you
can identify a risk for your project and assign probability and impact values to this risk to
calculate a risk score. Additionally, you can assign activities to the risk and create a risk
response plan, which can include actions to mitigate the risk.
1) Creating Project Risks (on page 367)
2) Assigning an Activity to a Risk (see "Assigning a Risk to an Activity" on page 321)
3) Developing a Risk Response Plan (on page 372)
Creating Project Risks
Add project risks to capture potential threats or opportunities that might impact your
project.
For convenience, you can add risks to projects from different areas in the application,
depending on the tasks you are performing at the time.
You can capture risks in the Projects section from the Risks, Activities, or EPS page.
Adding Detailed Project-Level Risks - The Risks page is the risk register where all risk
data for the projects you are working on is stored. You can customize the page using
filters or grouping to view a specific list of project risks. From this page, you can assign
probability and impact values to obtain a risk score, and create risk response plans
that include response plan action items to reduce or eliminate the negative impact
of the risk. If you previously added risks to a project from the Activities page or the EPS
page, you can use this page to add more detailed information about the risk and
perform qualitative analysis.
Adding Risks to Activities - Use the Activities page when you are working in the
detailed activity level to quickly add a risk or assign an existing risk to activity. When
you plan to perform a more detailed analysis on your project risks, use the Risks page.
Adding High-Level Project Risks - Use the EPS page when you are working at the
project level to quickly add a risk to a project. You can enter basic risk information
from this page, including ID, Name, Owner, Category, Type, and Status. When you
plan to enter more detailed information about the risk and perform an analysis on
your project risks, use the Risks page.
Adding Detailed Project-Level Risks
Add project risks to capture potential threats or opportunities that might impact your
project, and to perform qualitative analysis to reduce or eliminate negative impact on
the project.
Note: If a risk scoring matrix is not assigned to the project, you can
add general risk information to the Risks page, but you will not be
able to enter values for probability, schedule and cost, which are
values used to generate the risk score. See Assigning a Risk Scoring
Matrix to a Project (on page 358).

368
To add detailed project-level risks:
1) Click Projects.
2) On the Projects navigation bar, click Risks.
3) On the Risks page, click Add a Risk (Insert).
4) If multiple projects are open, select a project from the Select Project dialog box and
click OK.
5) On the Risks page:
a. In the ID field, click and type an ID for the risk.
b. In the Name field, click and type the risk name.
c. In the Type field, double-click and select the type of risk from the list.
d. In the Status field, double-click and select the current status for the risk.
e. In the Owner field, double-click then click .
6) In the Select Owner dialog box, select an owner for the risk and click Assign.
7) On the Risks page:
a. In the Probability field, double-click and select a probability from the list.
b. In the Schedule field, double-click and select a schedule impact from the list.
c. In the Cost field, double-click and select a cost impact from the list.
d. Complete any addition fields on the table that are relevant for this risk, including
any user-defined fields.
Note: To display additional columns, click Select Columns and
select the column to add to the table.
8) You can provide more information using the Cause, Description, Effect, and Notes
detail windows.
9) On the Risks page, click Save (Ctrl+S).
Tip
Click the Probability and Impact Diagram detail window to view the risk scoring matrix
assigned to the project.
Adding Project Risks to Activities
Add project risk to activities to capture potential threats or opportunities that might
impact your project. Use this method if you want to quickly associate a risk to an activity.
You can add a new project risk to an activity, or assign an existing project risk to an
activity.
To add a new or assign an exisitng project risk to an activity:
1) Open one or more projects in the Projects section using one of the following methods:
Click Projects to open the last project or group of projects you were working
with.

Projects
369
Click the Projects menu and choose one of the most-recently used projects
or group of projects.
Click the Projects menu and choose Open Projects to select a project or
group of projects by portfolio type, EPS node, or project code.
2) On the Projects navigation bar, click Activities.
3) On the Activities page, select an activity and click the Risks detail window.
4) To add a new risk to an activity, in the Risks detail window:
a. Click Add a Risk (Insert).
b. Enter a value in the ID field.
c. Enter a value in the Name field.
d. Select a type from the Type list.
e. Select a status from the Status list.
5) To assign an existing risk to the activity, in the Risks detail window:
a. Click Assign Risk.
b. In the Select Risk dialog box:
1. Click on a risk.
2. Click Assign.
3. Assign any additional risks, and then click Close.
6) On the Activities page, click the Actions menu and select Save (Ctrl+S).
Adding High-Level Project Risks
Add project risks to capture potential threats or opportunities that might impact your
project.
Use this method to quickly add a risk to a project. You can enter basic risk information
from this page, including ID, Name, Owner, Category, Type, and Status.
To add a high-level project risk:
1) Click Projects.
2) On the Projects navigation bar, click EPS.
3) On the EPS page, click on a project, and then click the Risks detail window.
4) On the Risks detail window:
a. Click Add a Risk (Insert).
b. In the ID field, double-click and type an ID for the risk.
c. In the Name field, double-click and type the risk name.
d. In the Type field, double-click and select the type of risk from the list.
e. In the Status field, double-click and select the current status for the risk.
f. In the Category field, double-click and select a category from the list, if
applicable.

370
g. In the Owner field, double-click then click .
5) In the Select Resource dialog box, select an owner for the risk and click OK.
6) On the EPS page, click Save (Ctrl+S).
Assigning a Risk to an Activity
Assign a risk to an activity to explicitly identify the activity impacted by the risk.
You can assign a risk to an activity while you are adding project risks on the Risks page or
while managing your activities on the Activities page.
To assign a risk to an activity from the Risks page:
1) Click Projects.
2) On the Projects navigation bar, click Risks.
3) , click on a risk.
4) Click on the Activities detail window and click Assign Activities .
5) On the Select Activity dialog box:
a. Select an activity and click Assign.
b. Select any additional activities impacted by the risk and click Assign.
c. Click Close.
6) On the Risks page, click Save (Ctrl+S).
To assign a risk to an activity from the Activities page:
1) Click Projects.
2) On the Projects navigation bar, click Activities.
3) On the Activities page, select the activity you want to assign a risk.
4) On the Risks detail window, click Assign Risk.
5) On the Select Risk dialog box, select a risk and click OK.
6) On the Activities page, click Save (Ctrl+S).

371
Risk Response Plans
About Risk Response Plans
Response planning allows you to identify and document methods you might use to
manage project risks. When you identify an area with a risk, create a risk response plan to
determine what actions could be taken to promote the most favorable outcome.
Working with Risk Response Plans
The Response Plans detail window is the area in the risk register where you create plans
for handling the identified risks. Once you have identified which project risks need further
action, create a response plan and assign response plan action items for each risk to
reduce the negative impact on the project.

372
Table of Risk Response Plan Elements
Item Description
Response Plans toolbar: See Response Plans Toolbar.
Response Plan row: Create one or more response plans while you are in
the planning phase and indicate the response type. When you have
analyzed your response options, choose one response plan by selecting
the Active option next to the appropriate response plan.
In the example above, two response plans have been created for the
Concrete supply constrained risk. The first plan is to accept the risk and
take no action; the second plan is to reduce the impact of the risk by
contracting with alternative suppliers. You can see this second plan was
selected as the plan of choice.
Response Action Item rows: Each risk response plan can have multiple
response plan action items. Response action items are additional
activities you perform to reduce the impact of the risk.
For each response action item, assign the probability, schedule impact,
cost impact, and any additional user-defined impacts, which is based on
the outcome of the action item, to obtain a post-mitigated score.
In the example above, three activities are assigned to the risk plan. The
risk score will not significantly decrease until all three response items are
complete. By taking action on this risk and creating a response plan, we
can see that the impact of this risk can be significantly reduced.
Developing a Risk Response Plan
Once you have identified a risk for your project, you can then create a risk response plan
to help manage the project risk. A risk response plan includes a name for the plan and
response plan action items. You can create multiple risk response plans for a risk each
with multiple response action items. When you determine which plan will best meet the
project needs, you select the Active option next to the appropriate response plan. One
response plan must always be active.
To develop a risk response plan complete the following tasks:
1) Adding Risk Response Plans (on page 372)
2) Adding Risk Response Plan Action Items (on page 373)
3) Assigning Activities to Risk Response Plan Action Items (on page 374)
Adding Risk Response Plans
Add one or more response plans to a risk to plan alternative activities that might reduce
the probability of a risk occurring, or to reduce the impact of the risk.

Projects
373
1) Click Projects.
2) On the Projects navigation bar, click Risks.
3) On the Risks page, click on a risk, and then click the Response Plans detail window.
4) On the Response Plans detail window:
a. Click Add (Insert).
b. In the ID field, double-click and type a response plan ID.
c. In the Name field, double-click and type a name for the new response plan.
d. In the Response Type field, double-click and select a response type from the list.
5) On the Risks page, click Save (Ctrl+S).
Note: After you decide which response plan you are implementing,
select the Active option next to the appropriate response plan.
Adding Risk Response Plan Action Items
Each risk response plan can include multiple response plan action items.
To add a risk response plan action item:
1) Click Projects.
2) On the Projects navigation bar, click Risks.
3) On the Risks page, click on a risk, and then click the Response Plans detail window.
4) Repeat the following for each response action you want to add to a risk response
plan:
a. On the Response Plans detail window:
1. Click on the response plan for which you are adding a response action and
click Add a Response Action.
2. In the ID field, double-click and type an ID for the response action item.
3. In the Name field, double-click and type a name for the response action item.
4. In the Owner field, double-click and click .
b. On the Select Owner dialog box, select a name and click OK.
c. On the Response Plans detail window:
1. In the Status field, double-click and select a status from the list.
2. In the Start Date field, double-click and select a start date from the calendar.
This is an optional field. If you assign an activity to the response action, the
activity date and total cost for the activity will override the values you just
entered.
3. In the Probability field, double-click and select a probability based on the
response action.
Note: If a risk scoring matrix is not assigned to your project, the
Probability, Schedule, and Cost fields are disabled.

374
4. In the Schedule field, double-click and select a schedule impact based on the
response action.
5. In the Cost field, double-click and select a cost impact based on the response
action.
6. If there are any user-defined impact fields, double-click in the field and select
an impact based on the response action.
5) On the Risks page, click Save (Ctrl+S).
Note: After you decide which response plan you are implementing,
select the Active option next to the appropriate response plan.
Assigning Activities to Risk Response Plan Action Items
Existing activities can be assigned to a response plan action item to identify the activities
necessary to respond to the risk. If you need a new activity for the response action, first
create that activity, then assign it to a response plan action item.
The cost values for the assigned activity are used in the cost calculations for the response
plan, and the activity start and finish dates are displayed in the response plan.
To assign an activity to a risk response plan action item:
1) Click Projects.
2) On the Projects navigation bar, click Risks.
3) On the Risks page, click on a risk and then click the Response Plans detail window.
4) Repeat the following for each response plan action item:
a. On the Response Plans detail window:
1. Expand the appropriate risk response plan and click on the response plan
action item for which you are adding an activity.
2. In the Activity field, double-click and click .
b. On the Select Activity dialog box, click the activity and click Assign.
Note: If the Activity field is not displayed, click Select Columns
and click Activity.
5) On the Risks page, click Save (Ctrl+S).
Exporting Risk Data
Risks data can be saved to an Excel spreadsheet (*.xls). All data is exported as it appears
in the current view. Customize the rows to display only the data you want to export.
To export risk data:
1) Click Projects.
2) On the Projects navigation bar, click Risks.

Projects
375
3) On the Risks page, customize the table using the customize features. The fields that
are visible on the page are the fields that are exported to the Excel spreadsheet.
Click Select Columns to select the columns you want displayed in the
spreadsheet.
Click Customize Filter to filter the data by an existing filter, or create a new filter
to customize your view.
4) Click Export to Excel.
If prompted, select whether you want to open or save the export file.


377
Documents
About Documents
A document is a file or work product that you create and add to your Primavera work
environment. The application provides document management capabilities that enable
you to store, organize, manage, and access documents in a secure environment. The
available document management functionality depends on your configuration. When
the content repository is configured, the complete set of advanced document
management capabilities is available, including check in, check out, and document
reviews. When the content repository is not configured, a limited set of document
management features is available, such as adding, deleting, and relating items to
documents.
When a configured content repository is installed, P6 supports up to three general classes
of documents: project, private, and workgroup. Project documents are documents that
you relate to a project via P6. Only users with the necessary securities can edit project
documents. Private documents are documents that you add to P6 for your own use.
Private documents are not associated with any project and are available only to you.
Workgroup documents are documents that are added to a specific project workgroup.
These documents are available only to members of the workgroup.
When the content repository is not configured for use with P6, you can perform limited
actions on project documents only, and private and workgroup documents are not
available.
Working with Documents
There are three types of documents: project, private, and workgroup. P6 supports
document management features for project documents. When the optional content
repository is installed, P6 also supports private and workgroup documents.
Project documents are documents that a user relates to a project. You can work with
project documents from the Documents page, the Project Documents portlet on the
Workspace page, or the Documents portlet on the Workgroup Workspace page. It is also
possible to convert a project document to a private document.
You can add private documents for your own use. Private documents are not associated
with any project and are available only to you. You can add private documents to the
My Documents portlet on a dashboard. All private documents are stored in the My
Documents portlet on the Private Documents tab.
Workgroup documents are added to a specific project workgroup, which can be
thought of as a subset of a project. These documents are available only to viewers of the
workgroup. On the Workgroup Workspace page, workgroup documents are stored on
the Workgroup tab of the Documents portlet. Generally, users who have rights to a
project can see a workgroup and its contents.

378
The availability of a document and the actions you can perform on the document
depend on several factors:
Project and workgroup documents are available only to users who have access to
the corresponding project or workgroup. Private documents are available only to the
person who adds them.
A wider set of features including check in, check out, and versioning are available
only for content repository documents. When the content repository is not configured
for use with P6, you can perform limited actions on project documents only. Private
and workgroup documents are not available. All project documents appear in a flat
list under the project name in the Project Documents portlet and the Documents
page, regardless of whether they were added to the project via P6 or P6 Professional.
The security policy of a project document determines which actions you can perform
on that document; for example, you might only be able to view a document.
Note: Documents cannot be used with project templates.
Adding Documents to a Project without the Content Repository
In standard P6 configurations without the optional content repository, you can add
project documents directly from your computer or a network server to the project. These
documents are available to everyone who has access to the project.
To add a document to a project:
1) Open one or more projects in the Projects section using one of the following methods:
Click Projects to open the last project or group of projects you were working
with.
Click the Projects menu and choose one of the most-recently used projects
or group of projects.
Click the Projects menu and choose Open Projects to select a project or
group of projects by portfolio type, EPS node, or project code.
2) On the Projects navigation bar, click Documents.
3) On the Documents page, if you opened more than one project, select a project from
the Select Project list.
4) In the Documents pane:
a. Click Modify.
b. Click Add Document.
5) On the Add Document page, click Add.
6) In the Select File dialog box:
a. Navigate to and select a file.
b. Click Open.
7) On the Add Document page:

Projects
379
a. Enter a name in the Title field.
b. Complete any of the remaining fields, including the optional Description for the
document.
c. Click Save.
Tips
You cannot add documents to template projects.
You can also add documents to a workgroup within the project from the Project
Documents portlet of the Workspace page.
Assigning Documents to Workgroups
Assign documents to a workgroup if they are related to the content the workgroup
covers.
To assign documents to a workgroup:
1) Open one or more projects in the Projects section using one of the following methods:
Click Projects to open the last project or group of projects you were working
with.
Click the Projects menu and choose one of the most-recently used projects
or group of projects.
Click the Projects menu and choose Open Projects to select a project or
group of projects by portfolio type, EPS node, or project code.
2) On the Projects navigation bar, click Documents.
3) On the Documents page, click the Project tab.
4) On the Project tab:
a. Expand a project and select a document.
b. Click Access Level Options Assign to Workgroup.
5) In the Select Workgroup dialog box, select a workgroup and click OK.
Tips
The Assign to Workgroup option is disabled if the document is already assigned to a
workgroup.
You can only assign documents to workgroups of the selected project.
Creating Document Folders
If P6 is configured to use the content repository, you can create document folders as a
method of document organization in a project.
To create document folders:
1) Open one or more projects in the Projects section using one of the following methods:
Click Projects to open the last project or group of projects you were working
with.

380
Click the Projects menu and choose one of the most-recently used projects
or group of projects.
Click the Projects menu and choose Open Projects to select a project or
group of projects by portfolio type, EPS node, or project code.
2) On the Projects navigation bar, click Documents.
3) On the Documents page, click the Project tab.
4) On the Project tab, select a project to which you will add the folder and click
Add Options Add Folder.
5) In the Add Folder dialog box:
a. Enter a name in the Folder Name field.
b. Select a policy from the Security Policy list.
c. Click OK.
Tips
Types of policies:
Read Only: The folder is not editable by other users.
Shared: The folder can be viewed, moved, edited, and deleted by other users.
Personal: The folder is hidden from other users.
You can also create document folders from the Documents portlet of the Workgroup
Workspace page, the Project Documents portlet of the Workspace page, or the My
Documents portlet of the Dashboards page.
Creating Document Templates
If P6 is configured to use the content repository, you can create document templates
that you can use as a foundation when adding new documents.
To create document templates:
1) Open one or more projects in the Projects section using one of the following methods:
Click Projects to open the last project or group of projects you were working
with.
Click the Projects menu and choose one of the most-recently used projects
or group of projects.
Click the Projects menu and choose Open Projects to select a project or
group of projects by portfolio type, EPS node, or project code.
2) On the Projects navigation bar, click Documents.
3) On the Documents page, click the Project tab.
4) On the Project tab, select a project and click Add Options Create New
Template.
5) In the Select File dialog box, select a file and click Open.
6) On the Project tab, click the General tab.

Projects
381
7) On the General tab:
a. Enter a name in the Title field.
b. Select a policy from the Security Policy list.
c. Click Save.
Tips
Select the Template Document option to make this document a template.
Types of policies:
Read Only: The folder is not editable by other users.
Shared: The folder can be viewed, moved, edited, and deleted by other users.
Personal: The folder is hidden from other users.
You can also create document templates from the Documents portlet of the
Workgroup Workspace page, the Project Documents portlet of the Workspace page,
or the My Documents portlet of the Dashboards page.
Copying Documents from Existing Templates
If P6 is configured to use the content repository, you can copy documents from
templates to add a new document based on an existing template.
To copy documents from templates:
1) Open one or more projects in the Projects section using one of the following methods:
Click Projects to open the last project or group of projects you were working
with.
Click the Projects menu and choose one of the most-recently used projects
or group of projects.
Click the Projects menu and choose Open Projects to select a project or
group of projects by portfolio type, EPS node, or project code.
2) On the Projects navigation bar, click Documents.
3) On the Documents page, click the Project tab.
4) On the Project tab, select a project and click Add Options Copy from existing
template.
5) In the Select a Template to copy from dialog box, select a template and click OK.
6) On the Project tab:
a. Click the General tab and enter a name in the Title field.
b. Click and configure each tab as necessary.
c. Click Save.
Tips
The Select a Template to copy from dialog box displays all the template documents
that exist for the project.

382
Types of policies:
Read Only: The folder is not editable by other users.
Shared: The folder can be viewed, moved, edited, and deleted by other users.
Personal: The folder is hidden from other users.
You can also create document templates from the Documents portlet of the
Workgroup Workspace page, the Project Documents portlet of the Workspace page,
or the My Documents portlet of the Dashboards page.
Sending E-Mail about Documents
You can send e-mail for a project or workgroup document that includes basic details
and a bookmark link to the document.
To send document e-mails:
1) Open one or more projects in the Projects section using one of the following methods:
Click Projects to open the last project or group of projects you were working
with.
Click the Projects menu and choose one of the most-recently used projects
or group of projects.
Click the Projects menu and choose Open Projects to select a project or
group of projects by portfolio type, EPS node, or project code.
2) On the Projects navigation bar, click Documents.
3) On the Documents page, click the Project tab.
4) On the Project tab, select a document and click E-mail Document Details.
5) In the E-mail dialog box:
a. Edit the recipient list, message, and subject as needed.
b. Click Send E-mail.
Tips
You must have an e-mail address listed in you user profile to send an e-mail.
You can also send document e-mails from the Documents portlet of the Workgroup
Workspace page, the Project Documents portlet of the Workspace page, the My
Documents portlet of the Dashboards page, or the Documents page (without the
content repository).

Projects
383
About the Content Repository
The content repository allows users to collaboratively share and manage documents in
the application. The document management functionality available to you depends on
your configuration. When the content repository is configured, the complete set of
advanced document management capabilities is available, including check in, check
out, and document reviews. When the content repository is not configured, a limited set
of document management features is available, such as adding, deleting, and relating
items to documents.
Working with the Content Repository
Document management capabilities
The content repository functionality provides advanced document management
capabilities. With advanced functionality, you can use document version control
features to manage shared access to documents, organize project documents into a
folder hierarchy structure, and start or participate in document reviews.
Specifically, you can:
Download documents
Check in, check out, and undo check out documents
Search for documents
View a document's history
View a document's versions
Add, delete, and rename project folders
Move project documents to a different folder location
Start a document review
Terminate a document review
Review a document
Send e-mail about a document
Repository storage
Your content repository stores documents created in P6 in a folder reserved for these
documents. This folder is referred to as your P6 repository. Depending on your access
privileges and configured content repository, you can access documents that were
created outside P6. These documents are stored in their own folders in the content
repository.
Repository authentication
The application offers two content repository authentication modes. Authentication can
be configured for either single or multiple user authentication. In single user
authentication mode, all users access the repository using a single administrator user
login that is set during repository configuration. In multiple user authentication mode,
each user is authenticated based on their individual login.

384
Single user authentication mode is useful when you want users to have full access to the
content repository through P6 without having to maintain an equivalent list of users for
both P6 and the repository. This allows a repository administrator to maintain one set of
credentials for the repository. Single user authentication is also useful for quickly setting up
test repositories that can be accessed by testers with minimal fuss.
Multiple user authentication mode is the default mode. Multiple user authentication
mode provides increased security by restricting content repository access on an
individual user basis. Because it uses native auditing fields it also allows a clear audit of
who has created and modified files.
Adding Documents to a Project and Storing Them in the Content Repository
You can add documents from your computer or a network server to the content
repository and designate them as private, read-only, or shared within the current project.
When you add shared documents, they are ready for document reviews.
Note: This topic assumes that you have setup the optional content
repository.
To add a document to a project and store that document in the content repository:
1) Open one or more projects in the Projects section using one of the following methods:
Click Projects to open the last project or group of projects you were working
with.
Click the Projects menu and choose one of the most-recently used projects
or group of projects.
Click the Projects menu and choose Open Projects to select a project or
group of projects by portfolio type, EPS node, or project code.
2) On the Projects navigation bar, click Documents.
3) On the Documents page, click the Project tab.
4) On the Project tab:
a. Expand a project.
b. (Optional) Expand one or more folders. If necessary, create a folder. See the
related topics.
c. Click Add Options Add Document.
5) In the Select File dialog box:
a. Select a document.
b. Click Open.
6) On the Project tab:
a. Click any of the five tabs and complete the data fields.
b. Click Save.

Projects
385
Tips
You can complete all available document management functions on the copy,
which has no relationship to the original document.
To add a document to a folder, select the folder before you click the Add Options
menu. You cannot add a document to a read-only folder.
At any time, you can privatize documents that you added to the application. To
make a document private, select the document in the Projects Documents portlet or
on the Documents page, click Access Level Options/Make Private.
You can also add public documents from the Project Documents portlet of the
Workspace page, the Documents portlet of the Workgroup Workspace page, or the
My Documents portlet of the Dashboards page.
Adding Documents to a Project from the Content Repository
In addition to adding documents to the repository, you can also add them to projects
from the content repository. When you add an existing repository document you can
decide to copy it for a fresh start within the new assigned project or simply link to it.
Note: This topic assumes that you have setup the optional content
repository.
To add a document from the repository and copy it or link it to a project:
1) Open one or more projects in the Projects section using one of the following methods:
Click Projects to open the last project or group of projects you were working
with.
Click the Projects menu and choose one of the most-recently used projects
or group of projects.
Click the Projects menu and choose Open Projects to select a project or
group of projects by portfolio type, EPS node, or project code.
2) On the Projects navigation bar, click Documents.
3) On the Documents page, click the Project tab.
4) On the Project tab:
a. Expand a project.
b. (Optional) Expand one or more folders. If necessary, create a folder. See the
related topics.
c. Click Add Options Add from content repository.
5) In the Select Document dialog box:
a. Select a document. If necessary, expand any folders or use the search field.
b. Select the Copy selected document or Link to selected document option.
c. Click OK.
6) On the Project tab:
a. Click any of the five tabs and complete the data fields.

386
b. Click Save.
Tips
Add a copy when you want project members to change the new document. Add a
link to a content repository document when you want to preserve the original
document.
The link displays in the folder you selected in your document view, indicating that you
have created a link to the document in its location in the content repository.
You can also link to repository documents from the Documents portlet of the
Workgroup Workspace page, the My Documents portlet of the Dashboards page,
and the Project Documents portlet of the Workspace page.
Checking Out Documents
Check out a document to save a copy to your local machine or another specified
location. Checking out a document locks the document to prevent others users from
making simultaneous updates to it. When a document is checked out, users can still view
and download the document, but they cannot modify, delete, or check it out.
To check out a document:
1) Open one or more projects in the Projects section using one of the following methods:
Click Projects to open the last project or group of projects you were working
with.
Click the Projects menu and choose one of the most-recently used projects
or group of projects.
Click the Projects menu and choose Open Projects to select a project or
group of projects by portfolio type, EPS node, or project code.
2) On the Projects navigation bar, click Documents.
3) On the Documents page, click the Project tab.
4) On the Project tab, select a project and click Check Out options Check out.
5) In the Check Out Document dialog box, click Check Out document to .
6) In the Save As dialog box, select a location and click Save.
7) In the Check Out Document dialog box:
a. Select or clear the option to determine if you want the document to automatically
open after it is checked out.
b. Click Check Out.
Tips
To undo a check out, click Undo Check Out on the Check Out options menu.
When an item is checked out, it will have a beside it.
The content repository must be configured for use with P6 to enable the functionality
described in this topic.

Projects
387
You can also check out documents from the My Documents portlet of the
Dashboards page, the Documents portlet of the Workgroup Workspace page, and
the Project Documents portlet of the Workspace page.
Checking In Documents
Check in a document when you are finished with it. You must check in a document to lift
the lock that a check out places on a document.
To check in a document:
1) Open one or more projects in the Projects section using one of the following methods:
Click Projects to open the last project or group of projects you were working
with.
Click the Projects menu and choose one of the most-recently used projects
or group of projects.
Click the Projects menu and choose Open Projects to select a project or
group of projects by portfolio type, EPS node, or project code.
2) On the Projects navigation bar, click Documents.
3) On the Documents page, click the Project tab.
4) On the Project tab, select a checked out document and click Check Out
options Check in.
5) In the Check In Document dialog box:
a. Click Select Document and verify that the path to the document is correct.
b. Click the Comments field and enter any comments you want to include with the
document.
c. Select the Delete Local Files option if you want the application to automatically
delete the document from your local drive or other location.
d. Click Check In.
Tips
When an item is checked out, it will have a beside it.
The content repository must be configured for use with P6 to enable the functionality
described in this topic.
You can also check out documents from the My Documents portlet of the
Dashboards page, the Documents portlet of the Workgroup Workspace page, and
the Project Documents portlet of the Workspace page.
Configuring Document Details
If P6 is configured to use the content repository, you can view and edit detailed
information for private documents, workgroup documents, and documents you have
privileges to modify.

388
To configure document details:
1) Open one or more projects in the Projects section using one of the following methods:
Click Projects to open the last project or group of projects you were working
with.
Click the Projects menu and choose one of the most-recently used projects
or group of projects.
Click the Projects menu and choose Open Projects to select a project or
group of projects by portfolio type, EPS node, or project code.
2) On the Projects navigation bar, click Documents.
3) On the Documents page, click the Project tab.
4) On the Project tab:
a. Expand a project and select a document.
b. Click the General tab and configure the fields, options, and lists as necessary.
c. (Optional) Click the Description tab and enter a description in the field.
d. Click the Related Items tab to relate items. See Assigning Related Items to
Documents (on page 388).
e. Click Save.
Tips
You can also click Edit Details in the My Documents portlet of the Dashboards page,
the Project Documents portlet of the Workspace page, or the Documents portlet of
the Workgroup Workspace page to access the Document Details dialog box.
Assigning Related Items to Documents
You can assign related activities, WBSs, issues, and documents to a document.
To assign related items to a document:
1) Open one or more projects in the Projects section using one of the following methods:
Click Projects to open the last project or group of projects you were working
with.
Click the Projects menu and choose one of the most-recently used projects
or group of projects.
Click the Projects menu and choose Open Projects to select a project or
group of projects by portfolio type, EPS node, or project code.
2) On the Projects navigation bar, click Documents.
3) On the Documents page, click the Project tab.
4) On the Project tab:
a. Expand a project and select a document.
b. Click the Related Items tab.
5) On the Related Items tab:

Projects
389
To relate activities or WBSs, click Relate Activities or WBS and select activities or
WBSs from the dialog box.
To relate issues, click Relate Issues and select issues from the dialog box.
To relate documents, click Relate Documents and select documents from the
dialog box.
6) On the Project tab, click Save.
Tips
You can also click Edit Details in the My Documents portlet of the Dashboards page, the
Project Documents portlet of the Workspace page, or the Documents portlet of the
Workgroup Workspace page to access the Related Items tab of the Document Details
dialog box. Expand the Related Items section on the Details of page of the Documents
page to assign related items to documents when your content repository is not
configured.
About Document Reviews
A document review is a process in which a specific version of a document is assigned to
one or more people to review. At some organization, reviews represent a helpful way of
sharing information and gathering specific comments or feedback from others. At others,
this type of collaboration is required as part of a quality process or compliance directive.
Initiate a review when you have a document that requires the approval of one or more
people. For example, you might have a new document that requires that four other
members of your department review it. Before making the document available to all
members of the project, you have each department member review the document for
accuracy.
Note: Document reviews require installation of the content
repository with P6.
When starting a document review, you can specify reviewers and select a review type.
These review types determine the approval requirements and reviewer sequence:
Anyone May Review: Enables any of the listed reviewers to approve or reject the
document version. Once one reviewer approves it, the review status changes to Review
Approved; once one reviewer rejects it, the review status changes to Review Rejected.
Everyone Must Review: Requires each listed reviewer to respond to the document review
to complete it. To change the review status to Review Approved, all reviewers must
approve the document. To change the review status to Review Rejected, only one
reviewer needs to reject the document.

390
Everyone Must Review in Sequence: Requires each listed reviewer to respond to the
document review in a designated sequence to complete it. To change the review status
to Review Approved, all reviewers must approve the document. To change the review
status to Review Rejected, only one reviewer needs to reject the document. Once one
reviewer rejects the document, the review is complete.
Reviewing Documents
If you have P6 installed with configured workflow and content repositories, you can start
or participate in a document review.
Select one of the links below based on whether you are starting or participating in the
review:
Creating Document Reviews (on page 390)
Responding to Document Reviews (see "Participating in Document Reviews" on page
163)
Creating Document Reviews
If you have the optional content repository installed with P6, you can initiate a document
review.
To create a document review:
1) Open one or more projects in the Projects section using one of the following methods:
Click Projects to open the last project or group of projects you were working
with.
Click the Projects menu and choose one of the most-recently used projects
or group of projects.
Click the Projects menu and choose Open Projects to select a project or
group of projects by portfolio type, EPS node, or project code.
2) On the Projects navigation bar, click Documents.
3) On the Documents page, click the Projects tab.
4) On the Projects tab:
a. Select the document you want reviewed.
b. Click Start Review.
5) In the Start Review dialog box:
a. Enter a value in each required field.
b. Click Assign Reviewers and select one or more reviewers from the dialog box.
Note: If you select the review type Everyone Must Review In
Sequence, use the Up and Down arrows to arrange the
sequence of reviewers.
c. (Optional) Click Due Date and select a date by which the reviewers must
complete the review.

Projects
391
d. Click Create Review.
Tips
Reviews you have initiated appear on the My Reviews tab of the Document Reviews
portlet on the dashboard. Click Edit Details, and view a list of all reviewer responses,
review details, and the names of reviewers who have not yet responded to the
review. Once the review is complete, the document no longer appears in the
Document Reviews portlet. You can subsequently access details for the completed
review from the Document Details dialog box.
If the Start Review button is disabled, this indicates one of the following conditions
exists, preventing the start of a new review:
The current version of the document is in review or has been reviewed
A previous version of the document is in review
Multiple documents are selected (You can send only one document for review at
a time)
The project or document is already checked out for exclusive use
The document's Security Policy is set to Personal
You do not have the appropriate privileges
A template is open
You can also create document reviews from the Project Documents or
Communication Center portlets of the Workspace page or the My Documents portlet
of the Dashboards page.
Searching for Documents
You can search for documents using a basic search with keywords and operators or you
can conduct an advanced search and construct more complex search queries for
documents.
Click one of the following links to see how to perform a quick or advanced search:
Searching for Documents (Advanced Search) (on page 392)
Searching for Documents (Quick Search) (on page 392)
Tips
From a dashboard, you can search your private documents, and all project
documents to which you have access.
From a workgroup, you can search all documents that belong to the workgroup, and
all other documents in that project.
You can only search for project documents that have been added in P6 by a user
who has a configured content repository installed.
Documents are listed in order of their relevance to the search criteria. Documents
that are most closely related to the search criteria appear first in the list.

392
Searching for Documents (Advanced Search)
You can perform advanced searches for documents using authors and dates.
To search for documents:
1) Open one or more projects in the Projects section using one of the following methods:
Click Projects to open the last project or group of projects you were working
with.
Click the Projects menu and choose one of the most-recently used projects
or group of projects.
Click the Projects menu and choose Open Projects to select a project or
group of projects by portfolio type, EPS node, or project code.
2) On the Projects navigation bar, click Documents.
3) On the Documents page, click the Project tab.
4) On the Project tab, click Search Options Search.
5) In the Document Search dialog box, click Advanced .
6) In the Advanced Search Options section:
Expand the Search by Person section and configure the Author list.
And/Or
Expand the Search by Date section and configure the option and fields.
7) In the Document Search dialog box, click Search.
Tips
You can search by author, by creation date, or both. If you enter a value in both
sections, the application searches for all documents that were added by the author
and created between the dates you list.
The application lists the most relevant documents first.
Click Clear Criteria to reset the Document Search dialog box.
You can only search for project documents that have been added to P6 by a user
with a configured content repository.
To clear the search results, click Search Options/Clear Search Results.
When using any of the Advanced Search options, you can only search the most
current versions of documents.
You can also search for documents from the Project Documents portlet of the
Workspace page, the Documents portlet of the Workgroup Workspace page, and
the My Documents portlet of the Dashboards page.
Searching for Documents (Quick Search)
You can perform quick searches for documents using only text.
To search for documents:
1) Open one or more projects in the Projects section using one of the following methods:

Projects
393
Click Projects to open the last project or group of projects you were working
with.
Click the Projects menu and choose one of the most-recently used projects
or group of projects.
Click the Projects menu and choose Open Projects to select a project or
group of projects by portfolio type, EPS node, or project code.
2) On the Projects navigation bar, click Documents.
3) On the Documents page, click the Project tab.
4) On the Project tab, click Search Options Search.
5) In the Document Search dialog box:
a. Enter keywords and operators in the Search Text field.
b. (Optional) Select the Search title and contents option to search document titles
and content.
c. Enter a value in the Limit results to (maximum 100) field to specify a limit on the
number of search results.
d. Click Search.
Tips
Type operators in capital letters.
The application lists the most relevant documents first.
Click Clear Criteria to reset the Document Search dialog box.
You can only search for project documents that have been added in P6 by a user
who has a configured content repository installed.
To clear the search results, click Search Options/Clear Search Results.
You can also search for documents from the Project Documents portlet of the
Workspace page, the Documents portlet of the Workgroup Workspace page, and
the My Documents portlet of the Dashboards page.
Viewing Documents
If P6 is configured to use the content repository, you can view public documents or your
private documents. If you belong to a workgroup, you can also view workgroup
documents.
To view documents:
1) Open one or more projects in the Projects section using one of the following methods:
Click Projects to open the last project or group of projects you were working
with.
Click the Projects menu and choose one of the most-recently used projects
or group of projects.
Click the Projects menu and choose Open Projects to select a project or
group of projects by portfolio type, EPS node, or project code.

394
2) On the Projects navigation bar, click Documents.
3) On the Documents page, click the Project tab.
4) On the Project tab:
a. Expand a project and select a document.
b. Click View Options View.
5) In the Opening dialog box, select the Open with option to open the file or select the
Save File option to save the file to your computer and click OK.
Tips
If P6 is configured with a content repository and you have the appropriate privileges,
you can view documents with AutoVue from the Documents detail window of the
Activities page.
You can also view documents from the Documents detail window of the Activities
page, the Project Documents portlet of the Workspace page, or the My Documents
portlet of the Dashboards page.
Downloading Documents
If P6 is installed with a configured content repository and workflow repository, you can
download a read-only copy of a document to your local machine or another specified
location.
Downloading enables you to keep a personal copy of the document and make
modifications to it in the document's native application. Any changes you make to the
document are saved locally and do not affect the original document in P6.
To download documents:
1) Open one or more projects in the Projects section using one of the following methods:
Click Projects to open the last project or group of projects you were working
with.
Click the Projects menu and choose one of the most-recently used projects
or group of projects.
Click the Projects menu and choose Open Projects to select a project or
group of projects by portfolio type, EPS node, or project code.
2) On the Projects navigation bar, click Documents.
3) On the Documents page, select the Project tab.
4) On the Project tab, expand a project, select a document, and click View
Options Download.
5) In the Download Document dialog box:
a. Click the Path field and enter a path or click and select a download location
from the dialog box.

Projects
395
b. Select the Open Document option if you want the document to open
automatically after it is saved.
c. Click Download.
Tips
a. You can also download documents from the My Documents portlet of the
Dashboards page, the Project Documents portlet of the Workspace page, and the
Documents portlet of the Workgroup Workspace page.
About Scheduled Services
Scheduled Services runs a service at the time and frequency that you select for the
projects that you choose. You can schedule the following types of services: schedule,
apply actuals, level, and summarize. Use this feature to schedule services so you do not
have to manually run them.
Creating Scheduled Services
You can schedule services to run at intervals you choose on projects that you select.
Available services include apply actuals, level, schedule, and summarize.
To create scheduled services:
1) Click the Projects menu and select Scheduled Services.
2) On the Scheduled Services page, click Add (Insert).
3) In the Edit Service dialog box:
a. Enter or select a value for every field.
b. Select or clear the Enable Service option.
c. Click Add and assign one or more projects from the dialog box.
d. Click Save.
Tips
You can also enable or disable services directly on the Scheduled Services page;
select or clear the Enabled option for the service you want to enable or disable.
You cannot schedule services for project templates.
Configuring Scheduled Services
You can configure the name, time, frequency, projects, and settings for a scheduled
service.
To configure scheduled services:
1) Click the Projects menu and select Scheduled Services.
2) On the Scheduled Services page, click Edit.
3) In the Edit Service dialog box:

396
a. Configure the fields and lists.
b. Select or clear the Enable Service option.
c. In the Select Projects table:
1. Click Add and assign one or more projects or groups from the dialog box.
2. Click Delete to remove projects or groups from the table.
d. Click Save.
Tips
You cannot change the Service Type.
You can also enable or disable services directly on the Scheduled Services page;
select or clear the Enabled option for the service you want to enable or disable.
Services for project templates cannot be scheduled, they must be run manually.
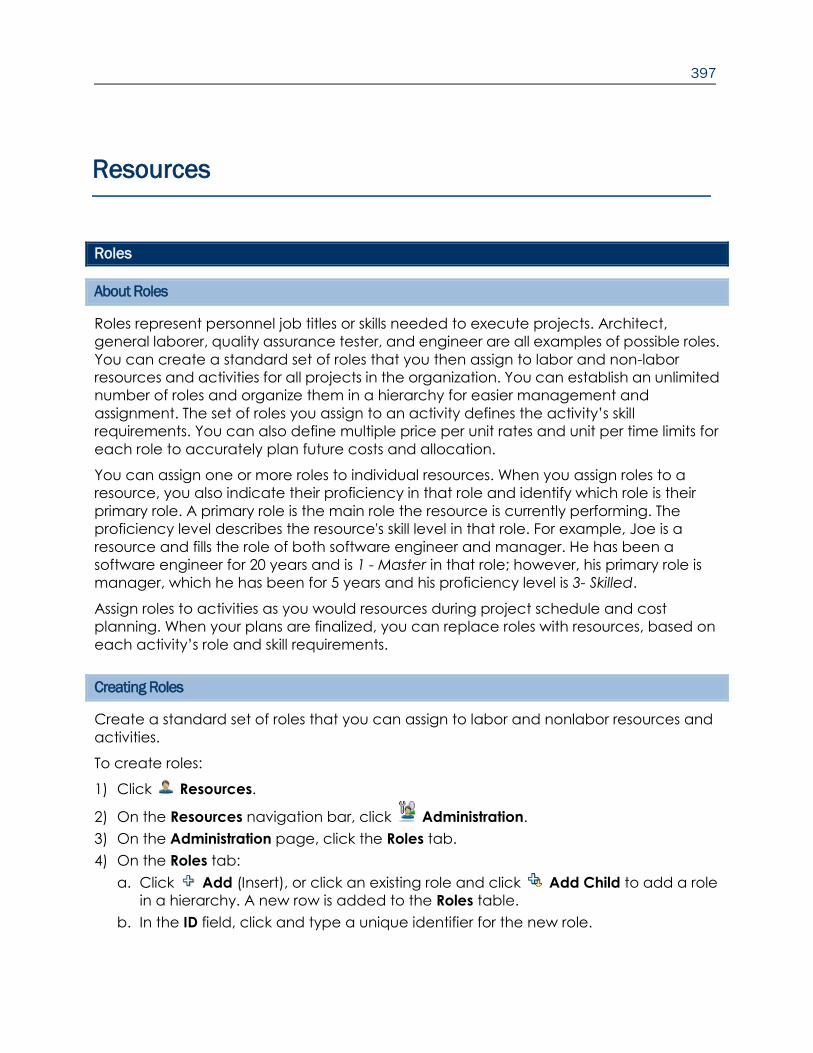
397
Roles
About Roles
Roles represent personnel job titles or skills needed to execute projects. Architect,
general laborer, quality assurance tester, and engineer are all examples of possible roles.
You can create a standard set of roles that you then assign to labor and non-labor
resources and activities for all projects in the organization. You can establish an unlimited
number of roles and organize them in a hierarchy for easier management and
assignment. The set of roles you assign to an activity defines the activity’s skill
requirements. You can also define multiple price per unit rates and unit per time limits for
each role to accurately plan future costs and allocation.
You can assign one or more roles to individual resources. When you assign roles to a
resource, you also indicate their proficiency in that role and identify which role is their
primary role. A primary role is the main role the resource is currently performing. The
proficiency level describes the resource's skill level in that role. For example, Joe is a
resource and fills the role of both software engineer and manager. He has been a
software engineer for 20 years and is 1 - Master in that role; however, his primary role is
manager, which he has been for 5 years and his proficiency level is 3- Skilled.
Assign roles to activities as you would resources during project schedule and cost
planning. When your plans are finalized, you can replace roles with resources, based on
each activity’s role and skill requirements.
Creating Roles
Create a standard set of roles that you can assign to labor and nonlabor resources and
activities.
To create roles:
1) Click Resources.
2) On the Resources navigation bar, click Administration.
3) On the Administration page, click the Roles tab.
4) On the Roles tab:
a. Click Add (Insert), or click an existing role and click Add Child to add a role
in a hierarchy. A new row is added to the Roles table.
b. In the ID field, click and type a unique identifier for the new role.
Resources

398
c. In the Name field, click and type a unique role name.
d. To create or modify a hierarchy of roles, use the arrows on the toolbar to
position the new row.
For example, if a Project Manager role exists in the system and you just created a
Design Manager role, which is a type of Project Manager, use the up/down arrows
to position the new Design Manager role under Project Manager, and then click
the right arrow to indent the new row.
e. Click the Description detail window.
5) In the Description detail window, type a description of the role's responsibilities.
6) On the Roles tab, click the Prices detail window.
7) In the Prices detail window, click in a rate type field and enter the rate. Repeat for all
applicable rate fields.
8) On the Roles tab, click the Limits detail window.
9) In the Limits detail window:
a. Click Add (Insert) to define the units/time for the role over time.
b. In the Effective Date field, double-click and select the effective date on the
calendar.
c. In the Max Units/Time field, click and type the maximum work units per time for this
role.
10) On the Roles tab, click Save (Ctrl+S).
Tip
Click Select Columns to select any additional fields that you want in the table. Then,
enter data in the additional fields you added.
Assigning a Resource to a Role
The set of roles you assign to a resource describes the resource's skill capabilities. These
role assignments make it easy to assign resources to activities according to role. You can
also assign roles to activities directly when you are unsure of the actual resources
available to work on the activities. You can later replace the roles with the applicable
resources.
To assign a role to a resource from the Roles tab:
1) Click Resources.
2) On the Resources navigation bar, click Administration.
3) On the Administration page, click the Roles tab.
4) On the Roles tab:
a. Click the name of the role.
b. Click the Resources detail window.
5) In the Resources detail window, click Add (Insert).

Resources
399
6) In the Select Resource dialog box:
a. Choose a resource and click Assign.
b. Choose any additional resources for the role and click Assign.
c. Click Close.
7) In the Resources detail window:
a. To change the proficiency level for that resource, double-click the Proficiency
field and select a level.
b. If this is the primary role for the resource, select the Primary Role option for the
resource.
8) On the Roles tab, click Save (Ctrl+S).
Tips
You can also assign a role to a resource from the Resources tab. Use this method if you
want to view all roles assigned to a single resource. See Assigning a Role to a Resource
(on page 404).
Assigning a Role Team to a Role
Using role teams can simplify resource planning. You can do this from either the Roles tab
or the Role Teams tab in the Resource Administration area. Use this method if you want to
view all role teams assigned to a particular role.
To assign a role to a role team:
1) Click Resources.
2) On the Resources navigation bar, click Administration.
3) On the Administration page, click the Roles tab.
4) On the Roles tab:
a. Click the role you are assigning to a role team.
b. Click the Role Teams detail window.
5) In the Role Teams detail window, click Add (Insert).
6) In the Select Role Team dialog box:
a. Expand either the Global or User category, choose a role team, and click Assign.
b. Choose any additional role teams and click Assign.
c. Click Close.
7) On the Roles tab, click Save (Ctrl+S).
Tips
You can also assign a role to a role team from the Role Teams tab. Use this method if you
want to view all roles assigned to a particular role team. See Assigning a Role to a Role
Team (on page 401).

400
Assigning Rates to Roles
Use this procedure to assign rates to the roles you created. Assigning rates to roles
enables you to more accurately determine total resource (and activity) costs. You can
assign up to five rate types depending on number of rate types set up by your
administrator.
To assign role rates:
1) Click Resources.
2) On the Resources navigation bar, click Administration.
3) On the Administration page, click the Roles tab.
4) On the Roles tab:
a. Click a role.
b. Click the Prices detail window.
5) In the Prices detail window, click in the appropriate price fields and enter an amount.
The default time period is price per hour unless you specify another time period.
6) On the Roles tab, click Save (Ctrl+S).
Assigning Work Limits to Roles
Assign role work limits to define the maximum amount of work units the selected role can
perform in a single work period.
To assign limits to a role:
1) Click Resources.
2) On the Resources navigation bar, click Administration.
3) On the Administration page, click the Roles tab.
4) On the Roles tab:
a. Click a role.
b. Click the Limits detail window.
5) In the Limits detail window:
a. Click Add (Insert).
b. In the Effective Date field, double-click to open the calendar and choose a date
to start the Max/Unit limit.
c. In the Max Units/Time field, click and type the maximum work units per time for this
role. Enter these values as units per duration or as a percentage, depending on
your choice in the Time Unit Format area on the Global tab of the My Preferences
page.
6) On the Roles tab, click Save (Ctrl+S).

401
Role Teams
About Role Teams
A role team is a collection of roles that are often needed on the same project or the
same activities. Role teams are useful when you want to categorize and view allocation
for related roles. Role teams allow you to categorize and group roles so you can readily
find data relating to a particular role. When working with tabs and pages that display
role data, you can choose to organize the hierarchy by role team. You can view team
data such as total team units or individual unit values. If you have the required security
privilege, you can create global role teams. All users that have access rights to view
resource data can create user role teams.
Creating Role Teams
Use this procedure to create role teams. Role teams let you categorize roles so you can
view and analyze data that relates to a specific group that interests you. When working
with tabs and pages that display role data, you can choose to organize the hierarchy by
role team, then choose to view team data, such as total units for the team, or individual
unit values for each team member.
1) Click Resources.
2) On the Resources navigation bar, click Administration.
3) On the Administration page, click the Role Teams tab.
4) On the Role Teams tab:
a. Click either Global Role Teams or User Role Teams.
b. Click Add (Insert). A new row is added to the Role Teams table.
c. In the Name field, double-click and type a role name.
d. Click Save (Ctrl+S).
5) To assign roles to the role team, see Assigning a Role to a Role Team (on page 401).
Assigning a Role to a Role Team
Use this task to assign a role to a role team. You can assign a role to a role team from the
Role Teams tab or the Roles tab. Use this method if you want to view all roles assigned to
a particular role team.
To assign a role to a role team:
1) Click Resources.
2) On the Resources navigation bar, click Administration.
3) On the Administration page, click the Role Teams tab.
4) On the Role Teams tab:

402
a. Expand either the Global Role Team or User Role Teams category, and click the
role team for which you are assigning a role.
b. Click the Roles detail window.
5) In the Roles detail window, click Add (Insert).
6) In the Select Role dialog box:
a. Choose a role and click Assign.
b. Choose any additional roles to assign to the role team and click Assign.
c. Click Close.
7) On the Role Teams tab, click Save (Ctrl+S).
Tips
To view all role teams assigned to a particular role, assign a role to a role team from the
Roles tab. See Assigning a Role Team to a Role (on page 399).

403
Resources
About Resources
A resource is any quantifiable item in limited supply and of sufficient value to justify
tracking and assigning to specific activities for a project. Resources include general or
specialized labor, non-labor items such as equipment, and material items such as bricks.
Resources perform roles, if defined. Resources are indirectly assigned to activities by first
planning the role required. It is also possible to directly assign resources to activities. For
example, Chris, a level 2 contractor with the confirmed skills and status, is directly
assigned to activity 01. However, a technician level 4 role is assigned to activity 02. The
project will proceed while management determines the best available resource to fulfill
this role.
Adding Resources
Use this task to add resources to the resource pool. Resources include the personnel and
equipment that perform work on activities across all projects. Resources are generally
reused between activities and/or projects. Resources can be distinguished as either
labor, material, or nonlabor. Labor and nonlabor resources are always time-based, and
material resources, such as consumable items, use a unit of measure you can specify.
To add a resource:
1) Click Resources.
2) On the Resources navigation bar, click Administration.
3) On the Administration page, click the Resources tab.
4) On the Resources tab:
a. Click Add (Insert), or click an existing resource and click Add Child to add a
resource in a hierarchy. A new row is added to the table.
b. Click the General detail window.
5) In the General detail window, enter information in the appropriate fields.
6) On the Resources tab:
a. Click Select Columns and select any additional column headings that you
need in your view.
b. Double-click in any additional fields to enter data.
c. Click the Notes detail window.
7) In the Notes detail window, type any notes you want to capture for the resource.
8) On the Resources tab, click Save (Ctrl+S).

404
Tips
See Creating Import Templates (on page 410) and Importing Resource Data (on page
411) to learn more about adding resources to the resource pool by importing resource
data from a Microsoft® Excel (.xls) spreadsheet.
Assigning a Role to a Resource
The set of roles you assign to a resource describes the resource's skill capabilities. These
role assignments make it easy to assign resources to activities according to role. You can
also assign roles to activities directly when you are unsure of the actual resources
available to work on those activities. You can later replace the roles with the applicable
resources.
To assign a role to a resource:
1) Click Resources.
2) On the Resources navigation bar, click Administration.
3) On the Administration page, click the Resources tab.
4) On the Resources tab:
a. Click the resource.
b. Click the Roles detail window.
5) In the Roles detail window, click Add (Insert).
6) In the Select Role dialog box:
a. Choose a role and click Assign.
b. Choose any additional roles for the resource and click Assign.
c. Click Close.
7) In the Roles detail window:
a. To change the proficiency level for that role, double-click the Proficiency field and
select a level.
b. A resource can have many roles. The first role added is marked as the primary role.
To change this, select the Primary Role field for the appropriate role.
8) On the Resources tab, click Save (Ctrl+S).
Tips
To view all resources assigned to a particular role, assign a role to a resource from the
Roles tab. See Assigning a Resource to a Role (on page 398).
Assigning a Resource Team to a Resource
Use this task to assign a resource team to a resource. You can do this from either the
Resources tab or the Resource Teams tab. Use this method if you want to view all the
resource teams assigned to a single resource.

Resources
405
To assign a resource to a resource team:
1) Click Resources.
2) On the Resources navigation bar, click Administration.
3) On the Administration page, click the Resources tab.
4) On the Resources tab:
a. Click the name of the resource you are assigning to a resource team.
b. Click the Resource Teams detail window.
5) In the Resource Teams detail window, click Add (Insert).
6) In the Select Resource Team dialog box:
a. Expand either the Global or User category, choose a resource team, and click
Assign.
Note: If you need to create a new resource team click on the
Global or User category, and then click Add Team.
b. Select additional teams, if necessary, and click Assign.
c. Click Close.
7) On the Resources tab, click Save (Ctrl+S).
Tips
To view all resources assigned to a particular resource team, assign a resource to a
resource team from the Resource Team tab. See Assigning a Resource to a Resource
Team (on page 414).
Configuring Resource Settings
Use the Settings detail window available from the Administration Resources tab to define
settings for the resource, such as the resource calendar and default units/time, as well as
P6 Progress Reporter settings.
To configure resource settings:
1) Click Resources.
2) On the Resources navigation bar, click Administration.
3) On the Administration page, click the Resources tab.
4) On the Resources tab, select the resource for which you want to define general
settings.
5) Click the Settings detail window, review the following options and make selections
based on your project needs.
Calendar: See Assigning Calendars to Resources (on page 406).

406
Default Units/Time: Use the default value or change the default units/time value. Enter
these values as units per duration or as a percentage, depending on your choice in
the Units/Time Format area of the My Preferences page.
Overtime Allowed: Select to enable the labor resource to record overtime hours for
activities.
Overtime Factor: Type the number by which the resource's standard price should be
multiplied to determine the resource's overtime price.
Auto Compute Actuals: Select to automatically calculate the selected resource's
actual quantity of work according to the project plan rather than reported hours in P6
Progress Reporter. Clear this option if you plan to select Uses Timesheets.
Currency: Click to select a currency that is different from the default currency,
and click OK.
Calculate Costs from Units: Select this option to indicate that any new assignment for
this resource will have its cost recalculated whenever any quantity changes occur,
such as changing an activity's remaining duration.
Progress Reporting Settings: See Configuring Timesheet Reporting for Resources (on
page 407).
6) On the Resources tab, click Save (Ctrl+S).
Assigning Calendars to Resources
Assign a global or resource calendar to a resource to determine when the resource is
available to work.
To assign a calendar to a resource:
1) Click Resources.
2) On the Resources navigation bar, click Administration.
3) On the Administration page, click the Resources tab.
4) On the Resources tab:
a. Click a resource.
b. Click the Settings detail window.
5) In the Settings detail window, click in the Calendar field.
6) In the Select Calendar Name dialog box:
a. Choose the Global or Resource option.
b. Choose a calendar.
Note: If you want a personal calendar for the resource, click Create
Personal Calendar. See About My Calendar (on page 455). You
can also create a personal calendar from the Enterprise Data
page. See Creating Resource Calendars (on page 472).
c. Click OK.

Resources
407
7) On the Resource tab, click Save (Ctrl+S).
Tips
You can perform the same procedure from the Calendars field on the Resources tab.
A resource can edit exceptions to their personal calendar. See Configuring My
Calendar (on page 456). To view a personal calendar, the resource must be a user in
the system.
Configuring Timesheet Reporting for Resources
Configure timesheet reporting if you are using P6 Progress Reporter.
To configure timesheet reporting for a resource:
1) If the resource is not already defined as a user in the system:
a. Add the user. See Creating Users (see "Creating User Accounts for P6 EPPM" on
page 517).
b. Assign the resource to the new user. See Assigning Associated Resources (on
page 519).
2) Enable access to P6 Progress Reporter. See Assigning Module Access (on page 520)
and mark the Team Member or Progress Reporter option.
3) Set the timesheet configuration options for the resource if you are implementing
non-automatic approval. See Configuring Resource Settings for Timesheet Reporting
(on page 407).
Tips
For faster setup of timesheet reporting, you can set Application Setting options to
automatically require timesheet use and designate a default approval manager
whenever you create a new resource. See Configuring Timesheets Settings (on page
461).
Configuring Resource Settings for Timesheet Reporting
Configure timesheet reporting settings if you are using P6 Progress Reporter and are
implementing non-automatic approval.
To configure resource settings for timesheet reporting:
Note: You must perform these steps in order when configuring
these settings for the first time for each new resource.
1) Click Resources.
2) On the Resources navigation bar, click Administration.
3) On the Administration page, click the Resources tab.
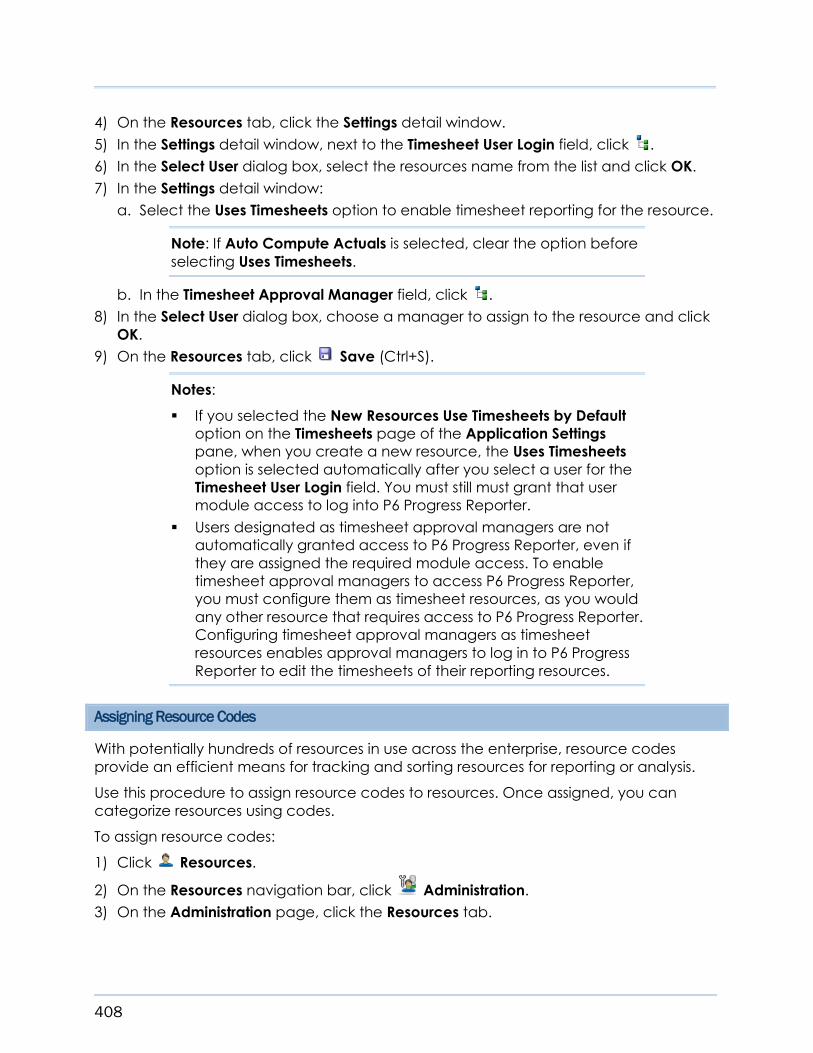
408
4) On the Resources tab, click the Settings detail window.
5) In the Settings detail window, next to the Timesheet User Login field, click .
6) In the Select User dialog box, select the resources name from the list and click OK.
7) In the Settings detail window:
a. Select the Uses Timesheets option to enable timesheet reporting for the resource.
Note: If Auto Compute Actuals is selected, clear the option before
selecting Uses Timesheets.
b. In the Timesheet Approval Manager field, click .
8) In the Select User dialog box, choose a manager to assign to the resource and click
OK.
9) On the Resources tab, click Save (Ctrl+S).
Notes:
If you selected the New Resources Use Timesheets by Default
option on the Timesheets page of the Application Settings
pane, when you create a new resource, the Uses Timesheets
option is selected automatically after you select a user for the
Timesheet User Login field. You must still must grant that user
module access to log into P6 Progress Reporter.
Users designated as timesheet approval managers are not
automatically granted access to P6 Progress Reporter, even if
they are assigned the required module access. To enable
timesheet approval managers to access P6 Progress Reporter,
you must configure them as timesheet resources, as you would
any other resource that requires access to P6 Progress Reporter.
Configuring timesheet approval managers as timesheet
resources enables approval managers to log in to P6 Progress
Reporter to edit the timesheets of their reporting resources.
Assigning Resource Codes
With potentially hundreds of resources in use across the enterprise, resource codes
provide an efficient means for tracking and sorting resources for reporting or analysis.
Use this procedure to assign resource codes to resources. Once assigned, you can
categorize resources using codes.
To assign resource codes:
1) Click Resources.
2) On the Resources navigation bar, click Administration.
3) On the Administration page, click the Resources tab.

Resources
409
4) On the Resources tab:
a. Click a resource.
b. Click the Codes detail window.
5) On the Codes detail window, click Add (Insert).
6) On the Select Resource Code dialog:
a. Choose a resource code and click Assign.
b. Select additional resource codes, if necessary, and click Assign.
Note: You can only select one value from each code name
category. If you try to assign a second value from the same
category, the first value will be replaced with the new value.
c. Click Close.
7) On the Resources tab, click Save (Ctrl+S).
Assigning Resource Rates
Use this procedure to assign rates to resources. You can assign multiple rates to resources
to reflect price changes over time. For example, suppose the price per unit for a group of
resources was $20.00 per hour for the months January through June, but the price rate
increases to $30.00 starting in July through December. You can assign time-varying rates
for resources to more accurately determine total resource (and activity) costs.
To assign resource rates:
1) Click Resources.
2) On the Resources navigation bar, click Administration.
3) On the Administration page, click the Resources tab.
4) On the Resources tab:
a. Click a resource.
b. Click the Units and Prices detail window.
5) In the Units and Prices detail window:
a. Click Add (Insert).
b. In the Effective Date field, double-click to open the calendar and choose a date
to start the new rate.
c. In the Max Units/Time field, double-click and type the maximum work units per
time for this resource.
d. In the appropriate price fields, double-click and type an amount. The default time
period is price per hour unless you specify another time period.
6) On the Resources tab, click Save (Ctrl+S).

410
Creating Import Templates
Create a Microsoft® Excel® template to use when importing resource data.
To create an import template:
1) Click Resources.
2) On the Resources navigation bar, click Administration.
3) On the Administration page, click the Resources tab.
4) On the Resources tab:
a. Click Select Columns and choose the columns you want available in the
import template. The following fields are available for import:
Resource ID
Resource Name
Resource Type
Active
Parent Resource
Note: Enter the ID for the Parent Resource.
Office Phone
Other Phone
Notes
Employee ID
Title
Overtime Factor
Overtime Allowed
Calculate Costs from Units
Resource Codes
User-Defined fields
Note: Fields that are not in this list, but are visible in the table are
exported to the spreadsheet and marked with an asterisk. You can
edit the fields in the spreadsheet; however, the data in these fields
is not imported into the resources table.
5) Click Create Import Template.
6) In the File Download dialog box, click Open to modify the template or click Save to
save and close it.
Note: Do not move or change the first two rows in the spreadsheet.

Resources
411
Tips
When entering resource data in the Excel spreadsheet:
Be sure to include a Resource ID and Resource Name for each resource, otherwise all
data for that resource is excluded from the import.
For fields that include a check box in the application, enter the values true/false, or
y/n. The default system setting values are applied to these fields if no value is entered.
The following is a list of the check box fields available for import along with their
default values:
Active = true
Calculate Costs from Units = true
Overtime Allowed = false
Importing Resource Data
Use this procedure to import resource data from a Microsoft® Excel (.xls) spreadsheet.
Before you perform this procedure, you must create an import template and populate
the Excel file with resource data. See Creating Import Templates (on page 410).
To import resource data:
1) Click Resources.
2) On the Resources navigation bar, click Administration.
3) On the Administration page, click the Resources tab.
4) On the Resources tab, click Import from Excel.
5) In the Import Resources dialog box, click .
6) In the Open dialog box, browse to the name of the file (.xls) you want to import and
click Open.
7) In the Import Resources dialog box, click Import.
If errors are detected during the import, click View Log in the Import Successful or
Import Failed dialog box. If you want to save the log file, click Save.


413
Resource Teams
About Resource Teams
Resource teams provide a convenient way for you to associate personnel into smaller,
more meaningful groups within an organization. Using resource teams increases
efficiency in staffing activities, tracking allocation, and communicating project progress
and performance. When working with pages and tabs that display resource data, such
as the Resources Planning, Assignments, or Analysis pages, you can choose to organize
by resource team. You can then choose to view team data, such as total units for the
team, or view individual unit values for each team member. For example, the Resource
Usage tab available from the Analysis page provides total allocation data for the team,
as well as for each team resource when the tab is grouped by Resource Team.
Global resource teams are available to all users. User resource teams are only accessible
to the user currently logged in. You can create and modify user resource teams for your
personal use. If you have the required security privilege, you can also create and modify
global resource teams.
In addition to viewing Resource Teams from the Resources section, you can view the
resources that belong to a team, including each resource's primary role and number of
active projects, by viewing the Resource Team Summary portlet on the Dashboards
page.
Creating Resource Teams
Create resource teams to reduce potentially large resource pools into smaller, more
meaningful and manageable groups.
To create a resource team:
1) Click Resources.
2) On the Resources navigation bar, click Administration.
3) On the Administration page, click the Resource Teams tab.
4) On the Resource Teams tab:
a. If you are creating a global resource team, click the Global Resource Teams row
and click Add (Insert).
If you are creating a team only for your use, click the User Resource Teams row
and click Add (Insert).
b. In the Name field, double-click and type a resource team name.
5) In the Resources detail window, click Add (Insert).
6) In the Select Resource dialog box:
a. Choose a resource and click Assign.
b. Choose any additional resources to add to the resource team and click Assign.

414
c. Click Close.
7) On the Resource Teams tab, click Save (Ctrl+S).
Assigning a Resource to a Resource Team
Use this task to assign a resource to a resource team. You can assign a resource to a
resource team from the Resource tab or the Resource Teams tab. Use this method if you
want to view all resources assigned to a particular resource team.
To assign a resource to a resource team:
1) Click Resources.
2) On the Resources navigation bar, click Administration.
3) On the Administration page, click the Resource Teams tab.
4) On the Resource Teams tab, expand either the Global Resource Teams or the User
Resource Teams category and click a resource team name.
5) In the Resources detail window, click Add (Insert).
6) In the Select Resource dialog box:
a. Choose a resource and click Assign.
b. Select additional resources, if necessary, and click Assign.
c. Click Close.
7) On the Resource Teams tab, click Save (Ctrl+S).
Tips
To view all resource teams assigned to a particular resource, assign a resource to a
resource team from the Resources tab. See Assigning a Resource Team to a Resource
(on page 404).

415
Resource Assignments
About Resource Assignments
The Resources Assignments area enables you to view a customized list of resource or role
assignments based on the filters you assign to the view. Using this view, you can analyze
assignment unit and cost values and make any necessary modifications to the
assignment data. You can also view unit and cost values in a spreadsheet based on a
specified timescale using the Usage spreadsheet. In addition, you can extend your
customized view by displaying the Gantt chart, which is a graphical display of the start
and end dates for the resource assignments.
Working with Resource Assignments in the Gantt Chart
The Resources Assignments area enables you to view a customized list of resources
based on the filters you assign to the view. You can extend this customized view by
displaying the Gantt chart, which is a graphical display of the start and end dates for the
resource assignments.
To customize the resource assignments view in the Gantt chart, you can:
Customize the Gantt bar type, height, color, label, and position.
Set the timescale and gray scale for non-worked hours.
Modify the start and end dates for assignments.
Viewing Resource Assignments in a Gantt Chart
View the Gantt chart for a graphical display of the start and end dates for resource
assignments.
To view resource assignment activities in a Gantt chart:
1) Click Resources.
2) On the Resources navigation bar, click Assignments.
3) On the Assignments page, click Gantt Chart. The Gantt chart displays next to the
resource table.
4) To view the start and end dates of assignments for a particular resource, double-click
the Gantt chart next to the row in the resource table that contains the resource.
5) To change the timescale on the Gantt chart, right-click the dates at the top of the
Gantt chart and choose another timescale.
Tips
To customize the list of resources displayed in the table, click the Filters menu and choose
to use an existing filter, or create a new filter.

416
Customizing the Resources Assignments Gantt Chart Bars
Customize the settings for the Gantt chart view on the Resources Assignments page. You
can set features for up to three bars per assignment.
To customize the resource assignments Gantt chart bars:
1) Click Resources.
2) On the Resources navigation bar, click Assignments.
3) On the Assignments page, click View and choose Gantt Chart Options.
4) In the Customize Gantt Chart Options dialog box, click the Bars tab.
5) On the Bars tab:
a. Click the Type list and choose one of the following bar types:
Note: Set at least one bar to Current Bar.
Current Bar - Shows a bar that spans the early start date/actual start date to
the early finish date/actual finish date for each assignment. For a Current
bar, you can select an additional option for showing the progress of
activities.
Late Bar - Shows the late start date to the late finish date of an assignment.
A Late bar does not display if the project has not been scheduled.
Plan Bar - Shows the planned start date to the planned finish date of an
assignment. This bar is used for simulating the outcome of the project
schedule as part of project planning.
b. In the Height field, select the height in pixels of each bar.
c. In the Color options, choose to display the bar with a selected color or to set an
activity code for the bar.
Note: Your administrator sets color definitions of activity codes.
To select a bar color, click to display the Color dialog. Select the color to
display from the Swatches, HSB, or RGB tab, then click OK.
To set the bar color by activity code, click and choose an activity code
from the Select Activity Code dialog. Click OK.
d. Select the Show Necking option to apply bar necking to each of the three bars.
Bar necking refers to indentations of bars in the Gantt chart during periods of
nonwork time.
e. Set Current Bar Options:
1. Select the Show Progress option to chart progress, or actual work, along the
Current bar. The Progress bar is blue.
2. In the Label field, select a bar label.
3. In the Label Position field, select the location on the bar to position its label.

Resources
417
Note: When you display many bars at once, for greater ease in
reading the bar labels and identifying a specific bar, you might find
it helpful to vary the position of the label on each bar.
4. In the Label Font field, click and select options for the font type, size, and
color of the bar label.
f. Click OK.
Setting the Resources Detailed Assignments Gantt Chart Timescale
Set the timescale interval of the Gantt chart and apply shading for non-work time.
Note: If you only want to change the timescale, right-click the date
bar in the Gantt chart and choose another timescale.
To set the timescale interval and apply shading for non-work time:
1) Click Resources.
2) On the Resources navigation bar, click Assignments.
3) On the Assignments page, click View and choose Gantt Chart Options.
4) In the Customize Gantt Options dialog box, click the Gantt Options tab.
5) On the Gantt Options tab:
a. Click the Timescale list and select the timescale for the Gantt chart.
Note: If the Week/Day timescale is selected, the following fields are
not applicable:
Period Actual Units
Period At Completion Units
Period Actual Cost
Period Actual Completion Cost
b. Select Show shading for non-work time to apply shading to non-work time
represented in the Gantt chart.
c. Click the Color list and select the shade of gray to apply.
d. Click OK.
Modifying Resource Assignment Dates in the Gantt Chart
Modify resource assignment dates on the Resource Assignments Gantt chart.
From the Gantt chart, you can modify:
Start and finish dates for assignments that do not have Actual Start dates

418
Finish dates for assignments that do not have Actual Finish dates
To modify resource assignment dates:
1) Click Resources.
2) On the Resources navigation bar, click Assignments.
3) On the Assignments page, click Gantt Chart.
4) In the Gantt chart, click the bar to select it, and then click the selection handle at the
end of the bar and drag it to the preferred date.
5) On the Assignments page, click Save (Ctrl+S).
Tips
To display the Actual Start or Actual Finish columns, click Customize Columns to add
additional columns to your view.
To change the timescale on the Gantt chart, right-click the dates at the top of the
chart and choose another timescale.
Viewing Assignment Unit and Cost Spreads
Use the usage spreadsheet to view live unit and cost spreads for an activity assignment
for a resource or role.
To view the assignments usage spreadsheet:
1) Click Resources.
2) On the Resources navigation bar, click Assignments.
3) On the Assignments page, click Usage Spreadsheet.
Note: To customize the list of resources displayed in the table, click
Customize Filter and either use an existing filter or add a new
filter.
4) To modify the usage spreadsheet settings, click View and select Usage Options.
5) In the Customize Usage Options dialog box:
a. In the Available Columns area, choose one or more columns and click Select
Items (Ctrl+Alt+RIGHT) to move the columns to the Selected Columns list.
Note: If the Week/Day timescale is selected, the following fields are
not applicable:
Period Actual Units
Period At Completion Units
Period Actual Cost
Period Actual Completion Cost

Resources
419
You can change this setting on the Gantt Chart tab of the
Customize View dialog box.
b. Choose the Start Date minus an optional amount of time and End Date plus an
optional amount of time.
c. Select Calculate average for units and costs if you are dividing the unit and cost
fields by a value, and then type a value in the Divide values by field.
d. Click OK.
Exporting Resource Assignment Data
Use this task to save customized detailed resource assignment information to a
Microsoft® Excel spreadsheet (*.xls). All data is exported as it appears in the current view.
To export resource assignment data:
1) Click Resources.
2) On the Resources navigation bar, click Assignments.
3) On the Assignments page:
a. Customize the table using the customize features. The fields that are visible on the
page are the fields that are exported to the Excel spreadsheet, including the fields
that display for the Usage Spreadsheet.
Click Customize Columns to choose the columns to display in the
spreadsheet.
Click Customize Filter to filter the data by an existing filter, or create a
new filter to customize your view.
b. Click Export to Excel.
If prompted, choose whether you want to open or save the export file.
Assigning Resource Curves to Resource or Role Assignments from the Resources Assignments Page
You can assign a resource distribution curve to any resource or role assignment on
activities with a duration type of Fixed Duration and Units/Time or Fixed Duration & Units.
Resource usage and costs are distributed evenly during an activity unless you specify
nonlinear distribution using custom curves.
To assign a resource curve:
1) Click Resources.
2) On the Resources navigation bar, click Assignments.
3) On the Assignments page, display the Curves column if it is not visible on the table. To
display the Curves column:
a. Click Customize Columns.
4) In the Customize Columns dialog box:

420
a. Expand General and double-click Curve to move it to the Selected Columns list.
b. Click OK.
5) On the Assignments page:
a. Click the row with the resource or role.
b. Double-click the Curve field, and click .
6) In the Select Curves dialog box, choose a curve and click OK.
7) On the Assignments page, click Save (Ctrl+S).
Note: You can also assign resource curves to resource or role
assignment from the Projects Activities page. See Assigning
Resource Curves to Resource or Role Assignments from the
Activities Page (on page 299).
Applying the Progress Spotlight to the Resources Assignments View
To quickly locate the activities you need to update, you can use the Progress Spotlight
feature, which highlights all activities that should have progressed during a specific time
period. This time period is defined by the smallest increment of the current timescale
starting with the current date. For example, if the current timescale is set to Month/Week,
Progress Spotlight highlights all activities that should have progressed during the week
starting with today's date.
To show or hide the Progress Spotlight:
1) Click Resources.
2) On the Resources navigation bar, click Assignments.
3) On the Assignments page:
a. Click Gantt Chart, if the Gantt chart is not selected.
b. Click View and select Progress Spotlight.
Tips
In the Gantt chart, Progress Spotlight displays a yellow background, or curtain, to
indicate the time period during which progress should have occurred. You can drag
the end point of the highlighted area to extend or compress the time period.
In the table, all activities that should have progressed are highlighted. You can use
Ctrl+ the Up or Down arrow key to navigate to each highlighted activity in sequence,
recording progress in the appropriate data columns.

421
Resource Planning
About Resource Planning
The Planning page is a valuable tool to use to quickly and easily establish resource
demand on a proposed project without the need to perform time-consuming
resource-loading on a detailed project plan. This high-level allocation data can be
maintained through the life of the project and referenced when planning resources at a
more detailed level. While resources may not be assigned to specific activities at this
point, a portion of their time can be allocated towards the project, which informs project
managers of the intended commitment of the resource to the project. This helps to avoid
overallocation of resources during project planning.
Use the Resource Planning spreadsheet on the Planning page to specify, review, or
modify project-level and WBS-level allocation data for individual resources and roles
across a project lifecycle. For each resource or role assignment, you can record total
allocated units, which are calculated live and distributed across the project timescale, or
you can record individual timescale allocated values, which are summed to provide an
allocation units total. For resource assignments, you can base your allocation decisions
on the resources' current availability, which is recalculated live as you edit allocated
values.
You can view resource planning data for any project you have access to, but you can
only add, modify, and delete resource or role assignments if you have the required
project-level security privileges. Because the security privileges can be applied down to
the WBS level, it is possible for you to have the capability to assign resources and roles to
some, but not all, WBS elements within a project.
Customizing the Resource Planning Spreadsheet
For high-level future project planning, use the resource planning spreadsheet on the
Planning page to allocate resources and roles at the project and WBS levels. Assigning
roles is useful during the early planning stages of a project when resource availability is
not well known and you want to assign a temporary placeholder for a future resource
assignment.
To customize the resource planning spreadsheet:
1) Click Resources.
2) On the Resources navigation bar, click Planning.
3) On the Planning page, click Filter and Group By.
4) In the Filter by dialog box:
a. Select a single project or filter the project display by portfolio, project, project
code, resource, resource team, resource code, role, or role team.

422
Choose Portfolio or Project Code Value to view all projects you have access
to within the portfolio or project code.
Choose Resource to view all projects the resource is assigned to and to
which you have access.
Choose Resource Teams to view all the projects that all resources on the
team are assigned to and to which you have access.
Choose Resource Codes to view all resources assigned to the selected
resource code and to which you have access.
Choose Roles to view all projects that the selected role is assigned to and to
which you have access.
Choose Role Teams to view all projects that the selected role team is
assigned to and to which you have access.
b. Click OK.
5) On the Planning page, click Customize.
6) In the Customize Spreadsheet dialog, make selections to customize your view.
a. On the General tab:
Choose the start date for the spreadsheet, and the time units and timescale
increments.
Clear the Show Availability row to improve performance and select Hide
WBS if empty to facilitate easier viewing when you want to plan allocation
only at the project level.
If you choose the Automatically summarize on leaving spreadsheet option,
make sure you have High level resource planning option enabled. This
option is available from the Projects EPS page from either the Summary Type
column or on the Summarization pane of the Project Preferences dialog
box.
Note: Summarization is a performance intensive process. Contact
your administrator before turning this option on.
If your Resource Planning spreadsheet is filtered by resource, resource team,
resource code, role, or role team, you can choose to select Show other
assignments when filtered by resources or roles.
If your Resource Planning spreadsheet is filtered by role or role team, you
can select either Show other assignments when filtered by resources or roles
or Show only unassigned role requests.
Note: If you disable the Show other assignments when filtered by
resources or roles option, the total units column and timescale
intervals columns in the the Resources Planning spreadsheet show
the summary totals only for the displayed allocated elements.
b. On the Columns tab, choose columns you want to display in the spreadsheet.

Resources
423
c. Click Save.
Tips
When you filter, an administration application setting determines the maximum
number of projects that are available in the spreadsheet. If you filter by a group that
includes more projects than the maximum defined, you will not see all projects in the
group. If you require a higher maximum, contact your administrator.
To expand the spreadsheet display to use the entire window, click Full Screen.
Assigning Projects or WBS Elements to Resources or Roles
You can assign one or more projects or WBS elements to one or more resources on the
Planning page when the Resource Planning spreadsheet is filtered by resource, resource
team, or resource code. You can also assign projects or WBS elements to roles when the
spreadsheet is filtered by role or role team.
To assign projects or WBS elements to a resource or role:
1) Click Resources.
2) On the Resources navigation bar, click Planning.
3) On the Planning page, click Filter and Group By if you need to change your
selection.
4) In the Filter by dialog box:
a. Choose Resources, Resource Teams, or Resource Codes.
b. Click a resource, resource team, or resource code.
c. Click OK.
5) On the Planning page, right-click a resource assignment row and choose Assign
Project.
6) In the Assign Project dialog box:
To assign a project, select the project you want to assign, then click Assign.
To assign a WBS, select the project from the projects list, then click Assign WBS. On
the Assign WBS dialog box, select the WBS you want to assign, then click Assign. If
the selected project does not contain at least one WBS, a message appears
prompting you to select another project.
7) In the Assign Project dialog box, click Close.
8) On the Planning page, click Save.

424
Assigning Resources or Roles to Projects or WBS Elements
For high-level, future project planning or when a project does not require resource
assignments at the activity level, use the Resource Planning spreadsheet on the Planning
page to allocate and manage resources at the project and WBS levels. You can also use
the spreadsheet to allocate roles at the project and WBS levels; assigning roles is useful
during the early planning stages of a project when resource availability is not well known
and you want to assign a temporary placeholder for a future resource assignment.
To assign a resource or role to a project or WBS element:
1) Click Resources.
2) On the Resources navigation bar, click Planning.
3) On the Planning page, click Filter and Group By if you need to change your
selection.
4) In the Filter by dialog box, select a portfolio, project code, or project to filter resource
planning data, and then click OK.
5) On the Planning page, double-click a project name to expand the project, and click
the project or WBS row.
6) On the Planning page, to assign a resource or a role, choose one of the following
options:
Click Assign Resource to select from a list of resources.
In the Select a Resource dialog box, choose a resource, click Assign, and
then Close.
Click Assign Resource Using Search to search for resources who meet specific
requirements. For example, you can search for resources that are assigned a
specific role or resource code.
a. In the Assign by Search dialog box, select your search criteria and click Run
Search.
b. In the Search Results dialog box, select a resource and click Assign Resource.
Note: When you assign a resource using the Assign Resource
Using Search functionality, the search criteria you specify is saved;
a Yes link appears in the Search Criteria column beside the
assignment, indicating search criteria is specified. This saved
search criteria can be useful at a later time if you ever need to
modify the resource assignment and want to reuse the same
criteria.
Click Assign Role to select from a list of roles.
In the Select Role dialog box, choose a role, click Assign, and then Close.
Notes:

Resources
425
Once a role is assigned, you can then define search criteria for
the assignment to assist with future staffing of the role. Defining
search criteria enables you to more accurately identify the type
of resource required to staff the role.
To define search criteria, click the Yes or No link in the Search
Criteria field. The Yes or No link indicates whether saved search
criteria exists for the assignment.
7) On the Planning page:
a. Clear the Committed option if the assignments are not definitely committed to the
project.
Note: When calculating resource availability, only the committed
assignments are considered.
b. Click Save.
Tips
The list of resources you can select from, the resource pool, and the list of resources
returned as search results include only the resources you have access to, based on
resource security, and current project resources. Also, you cannot assign material
resources. When searching, you have an option to filter nonlabor resources from the
results.
Modifying Resource or Role Assignment Dates
Use the Resource Planning spreadsheet to modify the assignment dates for a project.
To modify resource or role assignment dates:
1) Click Resources.
2) On the Resources navigation bar, click Planning.
3) On the Planning page:
a. Locate the project the resource or role is assigned to, and then click the resource
or role.
Note: See Customizing the Resource Planning Spreadsheet (on
page 421) if the project you want is not in view.
b. Double-click the Start or Finish field and choose a date, or select the Life of Project
option to assign the resource or role for the full project duration.
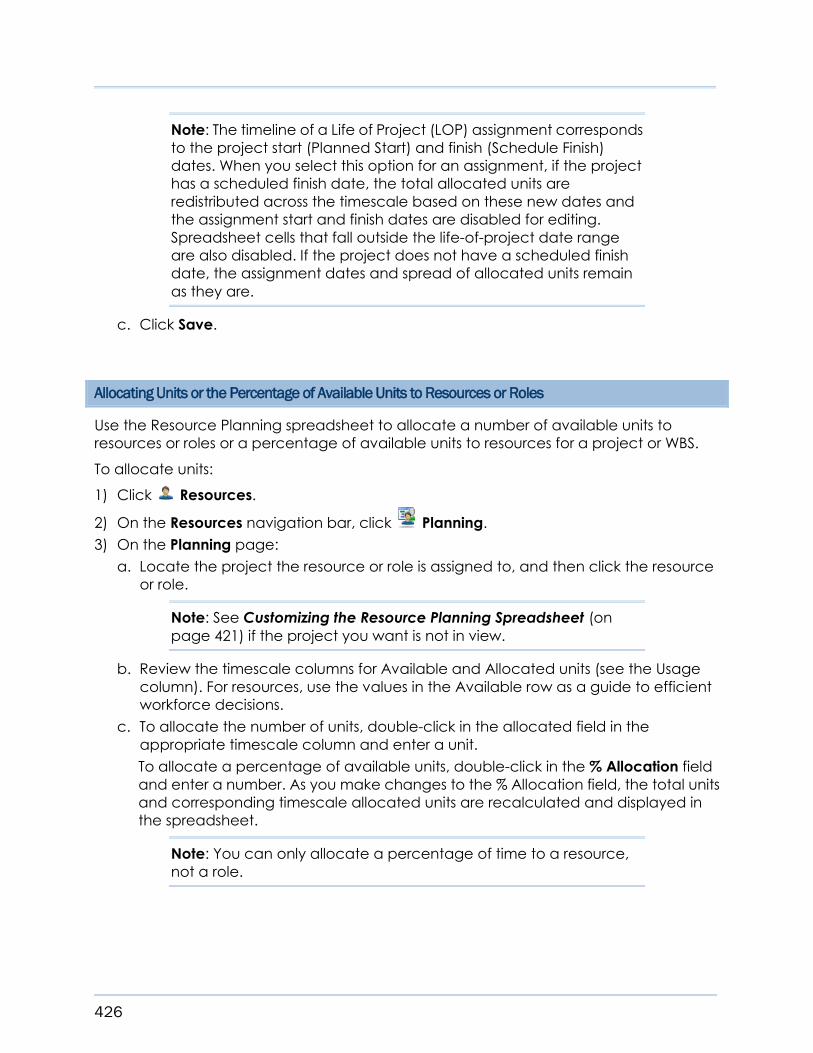
426
Note: The timeline of a Life of Project (LOP) assignment corresponds
to the project start (Planned Start) and finish (Schedule Finish)
dates. When you select this option for an assignment, if the project
has a scheduled finish date, the total allocated units are
redistributed across the timescale based on these new dates and
the assignment start and finish dates are disabled for editing.
Spreadsheet cells that fall outside the life-of-project date range
are also disabled. If the project does not have a scheduled finish
date, the assignment dates and spread of allocated units remain
as they are.
c. Click Save.
Allocating Units or the Percentage of Available Units to Resources or Roles
Use the Resource Planning spreadsheet to allocate a number of available units to
resources or roles or a percentage of available units to resources for a project or WBS.
To allocate units:
1) Click Resources.
2) On the Resources navigation bar, click Planning.
3) On the Planning page:
a. Locate the project the resource or role is assigned to, and then click the resource
or role.
Note: See Customizing the Resource Planning Spreadsheet (on
page 421) if the project you want is not in view.
b. Review the timescale columns for Available and Allocated units (see the Usage
column). For resources, use the values in the Available row as a guide to efficient
workforce decisions.
c. To allocate the number of units, double-click in the allocated field in the
appropriate timescale column and enter a unit.
To allocate a percentage of available units, double-click in the % Allocation field
and enter a number. As you make changes to the % Allocation field, the total units
and corresponding timescale allocated units are recalculated and displayed in
the spreadsheet.
Note: You can only allocate a percentage of time to a resource,
not a role.

Resources
427
For example, assume a resource works for 8 hours/day (specified in the resource's
calendar). If you want to allocate 50% of the resource's time for project A from Mar
12, 2006 (Start) to Mar 16, 2006 (End), you can specify 50% in the % Allocation field.
Based on this, total units would be calculated as 20 hours (4 hours/day times 5
days). The timescale allocated units would be recalculated and displayed
depending on display options set. See Customizing the Resource Planning
Spreadsheet (on page 421).
d. Click Save.
Notes:
When calculating spreadsheet Allocated values for resource
assignments, to determine total working hours for the time
period, the application uses the resource's calendar and the
hours/day setting defined in the Global Preferences; for role
assignments, the application uses the project calendar. The
application also uses the Global Preferences hours/time period
settings to convert time units for display based on the Time Units
Display option you choose.
Each time you edit the allocated total units for a resource or
role, the corresponding timescale allocated values are
recalculated and updated in the spreadsheet; for a resource,
the timescale available values are also recalculated.
When you edit a spreadsheet interval allocated value, total
allocated units for the resource or role are recalculated; a
resource's availability is also recalculated. Additionally, if the
spreadsheet interval you edit is prior to the current assignment
start date or later than the current assignment finish date, the
corresponding assignment date is adjusted to reflect the
change.
The Resource Planning spreadsheet uses summary data to
calculate availability, so it reflects values as of the last date the
summarizer was run for a project. Assignment changes within a
project after that date will not be reflected until the project is
again summarized. See Summarizing Projects (on page 222).
Synchronizing Resource Planning Dates
Use this procedure to synchronize resource planning dates. If a project is rescheduled
after you have designated Life of Project (LOP) assignments, or if you change a project's
forecast dates, assignment start and finish dates might no longer be accurate.
To synchronize resource planning dates:
1) Click Resources.
2) On the Resources navigation bar, click Planning.

428
3) On the Planning page:
a. To ensure that assignment dates match the current project timeline, filter the
Resource Planning spreadsheet to display only the project that has been
rescheduled or that has new forecast dates.
b. Click Synchronize Resource Dates.
4) On the Synchronize Dates dialog box:
a. Select one of the following synchronization options.
If you rescheduled a project and want to match LOP assignments to current
project dates, choose Life of Project assignments to Project dates.
When you choose this option, if the project has a scheduled finish, all LOP
assignment dates are revised to match the project Planned Start and Schedule
Finish dates and are disabled for editing. For each LOP resource assignment,
the total allocated units are redistributed across the timescale based on these
new dates. Spreadsheet cells that fall outside the life-of-project date range are
disabled. For any resource that has no available worktime during the new
project timeline, total allocated units are set to zero.
If you changed a project's forecast dates and want to match all high-level
planning assignments to the new forecast dates, choose All resource
planning assignments to Forecast dates.
When you choose this option, the project start date is moved to the forecast
start date and all resource planning assignments are moved accordingly. For
example, if the forecast start date is one month later than the original project
start date, all resource planning assignments are pushed out one month. When
moving the dates of a resource planning assignment, if the new date falls on a
non-work day, the assignment is moved to the first available work day that falls
after the non-work day. For example, for a resource working on a standard
five-day calendar, if moving an assignment one month causes the assignment
to start on a Saturday (non-work day), the assignment start date is moved to
Monday (the next available work day).
b. Click OK.
Splitting a Resource or Role Assignment
You can split resource or role units allocated to a project or WBS between two resources.
For example, you might initially assign all development work on a WBS to one resource,
then decide you want to assign another resource to the WBS and split the units 50:50.
Another common use is when you are in the early planning stages of a project and are
at the point of identifying roles needed for the project, but do not necessarily need to
assign specific resources. For example, you determine that three full-time developers are
needed to complete this project. On the Planning page, you can assign one developer
role and assign the number of hours that would equal full-time work for three employees.
As employees are identified for the role, use the split resource feature to reassign the
workload.

Resources
429
To split units for a resource or role:
1) Click Resources.
2) On the Resources navigation bar, click Planning.
3) On the Planning page:
a. Customize the spreadsheet as described in Customizing the Resource Planning
Spreadsheet (on page 421).
b. Click in the resource assignment row, then click Split resource assignment.
4) In the Select a Resource dialog box:
a. Select the resource between which you want to split the units.
b. Specify what percentage of the units you want to allocate to the selected
resource.
Note: You can also split the units across a time range without
assigning any percentage. For example, two resources might work
for a task jointly: the first resource is allocated from Jan 4, 2010
(Start) to April 16, 2010 (End), the second resource is allocated from
March 15, 2010 (Start) to April 16, 2010. The application splits the
units between the two resources across the specified time range;
the total units and timescale allocated units for both resources are
recalculated and updated in the spreadsheet.
c. If necessary, select the start date and finish date.
d. Click Assign.
Note: You can split the same assignment multiple times.
Categorizing Resource or Role Assignments using Status Codes
You can classify resource or role assignments using a set of status codes. Status codes
enable you to categorize resource or role assignments based on certain criteria that is
meaningful to you. The application comes with a set of default status code, or your
administrator can integrate a different set of status codes depending on your
organization's business needs.
For example, you might want to categorize role assignments by staffing status. In this
case, you might use status codes such as draft, filled, and submitted, then associate a
role assignment with a specific status, such as filled.
To categorize resource or role assignments:
1) Click Resources.
2) On the Resources navigation bar, click Planning.
3) On the Planning page, double-click the Status field and click .

430
4) In the Select status dialog box, choose a code and click OK.
5) On the Planning page, click Save.
Tips
If the Status column is not visible, click Customize. Click the Columns tab, double-click
Status from Available Columns, and click OK.
Exporting the Resource Planning Spreadsheet
Use this task to save the Resource Planning spreadsheet to a Microsoft® Excel
spreadsheet (*.xls). All data is exported as it appears in the current view.
To export the Resource Planning spreadsheet:
1) Click Resources.
2) On the Resources navigation bar, click Planning.
3) On the Planning page:
a. Customize the spreadsheet as described in Customizing the Resource Planning
Spreadsheet (on page 421).
b. Click Export Spreadsheet.
If prompted, choose whether you want to open or save the export file.

431
Resource Analysis
About Resource Analysis
The Resources Analysis section enable you to compare resource utilization between
resource teams, project resources, and department resource all from one central
location using the Role Usage, Resource Usage, and Resource Analysis tabs.
The Resource Analysis tab offers four chart options (histogram, stacked histogram, area
chart, and pie chart) to help you examine allocation data for individual resources, as
well as total values for resource teams and resource codes.
The Role Usage and Resource Usage tabs enable you to view resource allocation as a
histogram (total allocation across time) or as a spreadsheet (of resource allocation
values by project). You can view totals for an entire resource grouping (for example, role,
resource code, or resource team) or for individual resources.
You can customize the view on these tabs to view resource information specific to your
needs.
Analyzing Resource Allocations
Use this procedure to analyze resource allocations. The Resource Analysis page offers
four chart options to help you examine allocation data for individual resources, as well as
total values for resource teams and resource codes. Chart data reflects remaining plus
actual summary values.
You can customize options, along with filtering and grouping capabilities, to help you
focus on the data you want to see.
To analyze resource allocation:
1) Click Resources.
2) On the Resources navigation bar, click Analysis.
3) On the Analysis page, click the Resource Analysis tab.
4) On the Resource Analysis tab:
a. In the Group by list, choose to group by Resource Hierarchy, Resource Team,
Resource Codes, or Primary Role.
b. Click the resource, resource team, or resource code for which you want to
analyze allocation.

432
When you organize by resource team or resource code and select a team node
or resource code value, the selected chart displays total usage for all resources
you have access to that are associated with that team or code value. Selecting
an individual team member or resource who has the code value assigned displays
their allocation data. When you organize by resource hierarchy, selecting a parent
resource node does not roll up and display total usage for all child resources. The
hierarchy lists only those resources you have access to.
c. In the Chart Type list, select the type of chart you want to view (Histogram,
Stacked Histogram, Area Chart, or Pie Chart).
d. In the Filter by list, select the applicable filter.
Note: If you select a resource team or resource code that includes
either all material resources, or a mix of material and
labor/nonlabor resources, no chart data displays for Units. Since
these resource types use varying units of measure, for example,
time units for labor versus gallons for a material resource, total data
values for the team or code would not be meaningful.
e. Click Customize.
5) On the Customize chart dialog box, specify the information to display in the
histogram, as appropriate. You can:
Select to display unit or cost data.
Select the timescale. Choose a calendar interval (for example, Month/Week), or
choose Financial Period to display the range of financial periods if financial
periods are defined.
Note: Administrative options for summarizing resource and role
data are set in the Application Settings General page under the
Administer menu; if the options to summarize data by calendar
or financial period intervals are not selected, the corresponding
timescale options are not available. See Configuring General
Settings (on page 460).
Choose to display limit or allocation limit lines.
Choose to display the entire date range or a specific date range.
Select specific start and finish dates if you selected display a specific date range.
Select a color scheme.
Choose a chart display option (2-D or 3-D).
When you finish, click Save.
Tips
In a histogram or area chart, move the mouse over the corresponding area or bar to
display numeric allocation totals for a project or project code.

Resources
433
Assigning Resources to Unstaffed Activities
Use this procedure to assign resources to activities to fulfill staffing requests. Resources
include the personnel and equipment that perform work on activities across all projects.
Resources are generally reused between activities and/or projects.
1) Click Resources.
2) On the Resources navigation bar, click Analysis.
3) On the Analysis page, click the Role Usage tab.
4) On the Role Usage tab:
a. Click the Group By list and select Role Hierarchy, and then select a role.
b. Select the Spreadsheet display option.
Note: If costs, rather than units, are displayed, click Customize. On
the Customize dialog box, choose to display Units and click Save.
c. Click the name of the project that has unstaffed units to display the project's
unstaffed activities.
5) On the Resource Staffing dialog box, select the check box next to each unstaffed
activity you want to staff with the same resource and click Assign Resource. Activities
that have specific resource requirements associated with them display Yes in the
Search Criteria column.
Note: To search for resources who meet specific requirements, click
Search. Specify new criteria required to staff the activity. To save
this new criteria, click Save as Template. Or, to search using
previously saved criteria, click Select Template. When finished
specifying search criteria, click Run Search to display available
resources.
6) In the Select Resource dialog box, select a resource. To review resource allocation
before assigning a resource, click Show Detail. This displays the selected resource's
assignments based on summarized data. If you want to assign the selected resource
to the activity, click Assign.
7) Close the Resource Staffing dialog box.
Tips
Resource usage data is based on summary data. Any changes made to assignments
within a project will not be reflected until the project is summarized. See Summarizing
Projects (on page 222).
A Global preference setting lets you choose to automatically summarize the project
after assigning resources, so that summary data always reflects current resource
usage. To choose this option, click the Administer menu and select My Preferences,
then click the Global tab if not already displayed. In the Resources section, select
Automatically summarize project after assigning resources. Click Save and Close.

434
You can view staffing requests in the Open Requests for Resources portlet; the portlet
is available for display in dashboards. See Configuring Dashboard Content (on page
132).
The list of resources you can select from is determined by your resource security
privileges and individual resource's current project association.
Viewing Role Usage
Use the Role Usage tab to view detailed role assignment information in histogram and
spreadsheet format.
1) Click Resources.
2) On the Resources navigation bar, click Analysis.
3) , click the Role Usage tab.
4) On the Role Usage tab:
a. In the Group By list, choose to view roles by Role Hierarchy or Role Team.
b. Click a role name.
c. In the Display field, choose Spreadsheet or Histogram.
The spreadsheet shows staffed and unstaffed values per project. Click a role name
to see resources who can fulfill that role. Click a project name, if available, to see
the list of activities with the role assignment. See Assigning Resources to Unstaffed
Activities (on page 433) for more information.
The histogram you use to analyze the staffing requirements for any item in the role
hierarchy, whether the item you select represents one role or a group of roles. It
also enables you to easily identify staffing requirements by role and project, and
shows when a particular role is overloaded.
d. Click Customize.
5) In the Customize dialog box:
a. In the Display list, choose the display format (units or costs).
Choose units to view role use over the selected timescale interval; choose costs to
view how much money is being spent over time.
b. In the Timescale field, choose a timescale interval.
Choose a calendar interval (for example, Month/Week), or choose Financial
Period to display the range of financial periods if financial periods are defined.
Note: Administrative options for summarizing resource and role
data are set in the Application Settings General page under the
Administer menu; if the options to summarize data by calendar
or financial period intervals are not selected, the corresponding
timescale options are not available. See Configuring General
Settings (on page 460).

Resources
435
c. Choose to show or hide a Limit line. The Limit line shows maximum availability
based on the resource's calendar and Max units/time setting, along with
application settings for hours per time period.
d. Choose to show or hide the Allocation Limit line. This line shows the role's maximum
availability based on Allocated planning values specified in the Resource Planning
spreadsheet. Use this limit line to evaluate whether detailed activity assignments
are in line with what was planned.
e. Click Save.
Tip
The role usage data displayed on the Role Usage tab is based on summary data, so it
reflects values as of the last date the summarizer was run for a project. Assignment
changes within a project after that date will not be reflected until the project is again
summarized.
Viewing Resource Usage
Use the Resource Usage tab to view resource allocation as a histogram (total allocation
across time) or as a spreadsheet (of resource allocation values by project). You can view
totals for an entire resource grouping (role, resource code, or resource team) or for
individual resources.
1) Click Resources.
2) On the Resources navigation bar, click Analysis.
3) , click the Resource Usage tab.
4) On the Resource Usage tab:
a. In the Group By list, choose to view resources by Resource Hierarchy, Resource
Teams, Resource Codes, or Primary Role.
b. Click a resource name, resource code, resource team, or primary role.
Note: When you select a resource code, resource team, or primary
role, data for the entire node displays. You can select a resource
name below the node to display data for a single resource or
choose a resource from the Resource Hierarchy list.
c. In the Display field, choose Spreadsheet or Histogram.
The spreadsheet shows more resource usage detail by displaying actual resource
allocation values per time period and per project. For example, you can view
each resource's work hours by project. The table indicates if and when the
individual is overallocated, and also identifies time periods where the resource is
underallocated.

436
Histograms enable you to analyze the resource allocation for the item you select,
whether the item you select represents one resource or a group of resources such
as a resource team. It also enables you to easily identify resource allocation
requirements and shows when a particular resource is overloaded.
d. Click Customize.
5) In the Customize dialog box:
a. In the Display list, choose the display format (units or costs).
Choose units to view resource use over the selected timescale interval; choose
costs to view how much money is being spent over time.
b. In the Timescale field, choose a timescale interval.
Choose a calendar interval (for example, Month/Week), or choose Financial
Period to display the range of financial periods if financial periods are defined.
Note: Administrative options for summarizing resource and role
data are set in the Application Settings General page under the
Administer menu; if the options to summarize data by calendar
or financial period intervals are not selected, the corresponding
timescale options are not available. See Configuring General
Settings (on page 460).
c. Choose to show or hide a Limit line. The Limit line shows maximum availability
based on the resource's calendar and Max units/time setting, along with
application settings for hours per time period.
d. Choose to show or hide the Allocation Limit line. This line shows the resource's
maximum availability based on Allocated planning values specified in the
Resource Planning spreadsheet. Use this limit line to evaluate whether detailed
activity assignments are in line with what was planned.
The resource usage summary data displayed in this view is based on either
detailed activity-level assignments or high-level (project, WBS) planning
assignments, depending on an option setting on the Summarization pane of the
Project Preferences dialog box accessed from the EPS page. To evaluate activity
level assignments against planned allocations, choose the summarize project
option for detailed activity resources assignments. You must have user access to
the project, appropriate module access, and required security privileges to specify
this setting.
When a project is summarized at the detail level, the date range for the timescale
is derived from activity start and finish dates. If the selected resource only has
high-level assignments outside that date range, the Allocation Limit line might not
appear. Changing to a larger timescale increment, for example from m/w to y/q,
might cause the Allocation Limit to appear.
e. Click Save.

Resources
437
Tip
The resource usage data displayed on the Resource Usage tab is based on summary
data, so it reflects values as of the last date the summarizer was run for a project.
Assignment changes within a project after that date will not be reflected until the project
is again summarized.
Exporting Resource or Role Usage Data
Use this task to save customized resource or role usage data from the Resources Analysis
section to a Microsoft® Excel spreadsheet (*.xls). All spreadsheet rows and the entire
visible timescale are exported.
To export resource or role usage data:
1) Click Resources.
2) On the Resources navigation bar, click Analysis.
3) On the Analysis page, click the Resource Usage tab or the Role Usage tab.
4) On the Resource Usage or Role Usage tab:
a. Click the Group By list and select a group type option.
The resources available depend on your selection, along with your resource
security settings. If you select an individual resource, the spreadsheet displays
allocation data for that resource. If the resource is a parent resource, you can
select the resource's children (if any); if the resource is a child resource, no other
resources are available.
If you select a resource code, resource team, or primary role on the Resource
Usage tab, the spreadsheet displays summary allocation data for the code, team,
or role; you can select an individual resource belonging to the code, team, or role.
When you select a code, team, or role, you can only view allocation data for
resources that you have access rights to view; resources you do not have access
rights to view are not listed.
b. Click a resource, role, code, or team name.
c. Click the Spreadsheet display option.
d. Click Customize.
5) In the Customize dialog box:
a. Modify the display or timescale options, or choose to show limits.
For units display, if a resource code or resource team consists only of material
resources or a mix of labor, nonlabor, and material resources, the spreadsheet
summary row displays dashes instead of totals. Summing unit values for mixed
resource types does not provide an accurate total because labor and nonlabor
resources are usually associated with time (such as hours or days), and material
resources are often expressed in non-time units of measure.
b. Click Save.
6) On the Resource Usage or Role Usage tab, click Export Spreadsheet.

438
If prompted, choose whether you want to open or save the export file.
Exporting Resource Data
Resource information, including resource unit and cost allocation data, high-level
planning information, and resource and role usage information can be saved to a
Microsoft® Excel spreadsheet (*.xls).
All data is exported as it appears in the current view. Customize the rows using the
customization options on the page, which are either a Customize link or a customize
columns button, to display only the data you want to export.
Use the following tasks to export data from the Resources section:
Exporting Resource Administration Data (on page 438)
Exporting Resource Assignment Data (on page 419)
Exporting the Resource Planning Spreadsheet (on page 430)
Exporting Resource or Role Usage Data (on page 437)
Exporting Resource Administration Data
Use this task to save customized resource or role information to a Microsoft® Excel
spreadsheet (*.xls) for a single resource or multiple resources. All data is exported as it
appears in the current view.
To export resource or role data:
1) Click Resources.
2) On the Resources navigation bar, click Administration.
3) On the Administration page, click either the Resources or Roles tab.
4) On the Resources or Roles tab:
a. Click Select Columns. Choose any additional columns you would like to display
in the spreadsheet. You can also remove columns by selecting a column heading
with a check mark.
If there are children assigned to a parent resource or role, expand the resource or
role to view the information in the spreadsheet. There can be multiple child levels.
Expand until all the information you want to view is visible.
b. Click Export to Excel.
If prompted, choose whether you want to open or save the export file.
Exporting Resource Assignment Data
Use this task to save customized detailed resource assignment information to a
Microsoft® Excel spreadsheet (*.xls). All data is exported as it appears in the current view.
To export resource assignment data:

Resources
439
1) Click Resources.
2) On the Resources navigation bar, click Assignments.
3) On the Assignments page:
a. Customize the table using the customize features. The fields that are visible on the
page are the fields that are exported to the Excel spreadsheet, including the fields
that display for the Usage Spreadsheet.
Click Customize Columns to choose the columns to display in the
spreadsheet.
Click Customize Filter to filter the data by an existing filter, or create a
new filter to customize your view.
b. Click Export to Excel.
If prompted, choose whether you want to open or save the export file.
Exporting the Resource Planning Spreadsheet
Use this task to save the Resource Planning spreadsheet to a Microsoft® Excel
spreadsheet (*.xls). All data is exported as it appears in the current view.
To export the Resource Planning spreadsheet:
1) Click Resources.
2) On the Resources navigation bar, click Planning.
3) On the Planning page:
a. Customize the spreadsheet as described in Customizing the Resource Planning
Spreadsheet (on page 421).
b. Click Export Spreadsheet.
If prompted, choose whether you want to open or save the export file.
Exporting Resource or Role Usage Data
Use this task to save customized resource or role usage data from the Resources Analysis
section to a Microsoft® Excel spreadsheet (*.xls). All spreadsheet rows and the entire
visible timescale are exported.
To export resource or role usage data:
1) Click Resources.
2) On the Resources navigation bar, click Analysis.
3) On the Analysis page, click the Resource Usage tab or the Role Usage tab.
4) On the Resource Usage or Role Usage tab:
a. Click the Group By list and select a group type option.

440
The resources available depend on your selection, along with your resource
security settings. If you select an individual resource, the spreadsheet displays
allocation data for that resource. If the resource is a parent resource, you can
select the resource's children (if any); if the resource is a child resource, no other
resources are available.
If you select a resource code, resource team, or primary role on the Resource
Usage tab, the spreadsheet displays summary allocation data for the code, team,
or role; you can select an individual resource belonging to the code, team, or role.
When you select a code, team, or role, you can only view allocation data for
resources that you have access rights to view; resources you do not have access
rights to view are not listed.
b. Click a resource, role, code, or team name.
c. Click the Spreadsheet display option.
d. Click Customize.
5) In the Customize dialog box:
a. Modify the display or timescale options, or choose to show limits.
For units display, if a resource code or resource team consists only of material
resources or a mix of labor, nonlabor, and material resources, the spreadsheet
summary row displays dashes instead of totals. Summing unit values for mixed
resource types does not provide an accurate total because labor and nonlabor
resources are usually associated with time (such as hours or days), and material
resources are often expressed in non-time units of measure.
b. Click Save.
6) On the Resource Usage or Role Usage tab, click Export Spreadsheet.
If prompted, choose whether you want to open or save the export file.
About Reports
Reports are collections of meaningful data saved in a common file format, designed
according to a particular template, and delivered to the right recipients. As permitted,
you can use the set of pre-defined BI Publisher reports or additional reports created by
your administrator. See Pre-defined BI Publisher Reports.
Note: Data for reports is accurate up to the last time the reporting
database was updated.
You can elect to run a report in one of two basic ways:
Reports

Reports
441
1) On-demand: This type of report generation has many other names, including ASAP,
instant, ad-hoc, and "on the fly". As these names imply, the application accepts
various input criteria from you in real time and then instantly generates and delivers
the selected report to an e-mail address, or prompts you to save or open the file
depending on output type.
2) Scheduled: This type of report generation requires that you first configure the options
and other details necessary to generate the report, but doesn't actually generate the
report output until the scheduled day and time. You can also generate previously
scheduled reports on-demand.
Note: Your ability to run and schedule reports comes from security
settings managed in BI Publisher. Contact your administrator for
more information.

442
Working with Reports
The reports section of the application hosts an array of reports integrated with BI
Publisher. The role assigned to you determines the extent of your permissions when using
reports in P6.

Reports
443
Reports Screen Elements
Item Description
View menu: Use the view menu to switch between the Reports view and
the Schedules view.
Reports view: The Reports view displays the list of reports you have access
to run. Run a report on-demand, or use the Schedule detail window to
schedule a report run. The remaining screen element descriptions in this
table provide more details on the Reports view.
Schedules view: The Schedules view displays the list of all reports you
have scheduled to run, organized by run frequency (Once, Daily,
Weekly, Monthly). You can suspend or activate the report run by
deseleting or selecting the Enabled option. Click on a report schedule
name and view an explanation of the report in the Description detail
window.
Reports view work area: Reports are listed by name and grouped by
folder. The report list, group names, and hierarchical structure are
defined in BI Publisher. See Pre-defined BI Publisher Reports for a list of all
reports that accompany P6. Your P6 administrator can remove
pre-defined reports and create additional reports for your use.
From this page, you can view report details including the file formats
available for each report. You can also run a report on-demand or print a
list of reports in your view.
Reports view detail windows:
Schedules detail window: This detail window lists all the scheduled report
runs for the selected report. Use this detail window to add a new
scheduled report run, suspend or activate a report run by selecting or
clearing the Enabled option, and view the history of report runs. You can
also run a scheduled report on-demand from this window.
Description detail window: This detail window provides an explanation of
the report.
Scheduling Reports
Use this task to schedule reports and configure report delivery settings.
To schedule a report:
1) Click Reports.
2) On the Reports page:
a. Click View and select Reports.
3) Select a report, and then click the Schedule detail window., click Add (Insert).

444
Note: You can also schedule a new report using an existing report
schedule. To do this, click Replicate Schedule instead of
Add (Insert), and then continue to follow the steps below.
4) In the Report Settings dialog box, click the Options tab.
5) On the Options tab:
a. In the Schedule Name field, enter a name that identifies the report schedule.
b. In the Template list, choose a template to apply to the report.
c. In the Format list, choose a file format for the delivery of the report.
d. Next to the Delivery Type field, click and enter or select e-mail addresses for
the intended report recipients.
e. In the Notification section, choose to send yourself status notification of the report
run.
f. In the Report Parameters section, enter or choose values for the parameters
specified in the Field Name column.
Caution: To avoid system performance issues, be as specific as
possible when entering values for reports. Narrow down your
choices to include only what is absolutely necessary.
6) In the Report Settings dialog box, click the Schedule tab.
7) On the Schedule tab:
a. Select a recurrence pattern from the Run list.
b. In the Schedule Options section, complete the fields shown. The screen elements
in this section are dynamically updated based on your selection in the Run list.
For example, for Daily scheduled jobs, enter the Start Date, Finish Date, Run Time,
and select one or more days for the report to run.
8) In the Report Settings dialog box, click Save.
Running Reports On-Demand
Use this task to configure report settings and immediately run a report.
To run a report on-demand:
1) Click Reports.
2) On the Report page:
a. Click View and select Reports.
b. Select a report.
c. Click Run Report.
3) In the Report Settings dialog box:
a. In the File Name field, enter a file name for the report.

Reports
445
b. In the Template list, choose a template to apply to the report.
c. In the Format list, choose a file format for the delivery of the report.
d. In the Delivery Type list, choose to have the report sent through e-mail or display
the file immediately.
If you chose E-mail, click and enter or select e-mail addresses for the
intended report recipients.
If you chose File, the report will display after you click Run.
e. If you chose E-mail, in the Notification section, choose to send yourself a status
notification of the report run.
f. In the Report Parameters section, enter or choose values for the parameters
specified in the Field Name column.
Caution: To avoid system performance issues, be as specific as
possible when entering values for reports. Narrow down your
choices to include only what is absolutely necessary.
g. Click Run.
Exporting a List of Reports
Use this task to save a customized list of available reports to a Microsoft® Excel
spreadsheet (*.xls).
All data is exported as it appears in the current view.
To export a list of reports:
1) Click Reports.
2) On the Reports page:
a. Click View and select Schedules or Reports.
b. Modify the table to view only the list of reports you want to export.
Expand or collapse group headings.
Click Columns. Choose any additional columns you would like to
display in the spreadsheet. A check mark indicates the column is selected.
You can also remove columns by clicking on a column name with a check
mark.
c. Click Export to Excel.
If prompted, choose whether you want to open or save the export file.
Viewing the Report Run History
Use this task to view the list of all runs for the selected report schedule since the last history
deletion.

446
Note: The run history is only captured for scheduled reports, or
on-demand reports delivered by e-mail.
To view the report run history:
1) Click Reports.
2) On the Reports page:
a. Click View and select Reports.
3) Select a report, and then click the Schedule detail window., select a schedule name
and click History.
4) On the History dialog box, review the recent report runs.
To clear the history, click Delete All History.
Click Save or Cancel to close the History dialog box.

447
About Administration
Administration allows you to control access to features and configure global preferences
for all application users in P6 and P6 Professional. The Administer menu presents a list with
the following choices:
Note: Many of the features described in this section require
additional settings to be configured in the P6 Administrator
application. See the P6 EPPM Administrator’s Guide.
My Preferences: Presents options for users to configure their own default application
behavior and data.
My Calendar: Appears only if you have been assigned a personal resource calendar.
Presents options for users to configure their own resource calendar.
Application Settings: Presents options to specify default administrative preferences
established by the P6 Administrator.
Enterprise Data: Presents options to configure the essential application framework your
users will need to manage all projects and is established by the P6 Administrator.
User Access: Presents options to add users, configure what features a user can access
and view as established by the P6 Administrator, assign Organizational Breakdown
Structures (OBS) to users, configure module access to P6 EPPM applications, and add
project and global security profiles to users.
User Interface Views: Presents options to configure how users see the interface view so
the user can view only the selected features established by the P6 administrator.
About My Preferences
My Preferences offers options for you to customize the data display format across all
sections of P6. The options you customize are exclusively yours. You can alter global
preferences, including formats for time units, dates, and currencies. You can also
customize view preferences if the P6 Administrator gives you access to do so. Some view
preferences you can customize include menu items and pages. Finally, you can change
your password.
Administration

448
Working with My Preferences
In My Preferences, you can adjust global, view, and password preferences. You can use
My Preferences to personalize your workspace, but the P6 Administrator can limit what
you can access or establish settings that everyone must use.
Table of My Preferences Elements
Item Description
Global tab: Enables you to adjust application-wide preferences to suit
your needs, such as currency and time and date formats. Click the
arrows for each section to adjust your global preferences.
View tab: Enables you to change what you will see as you work in P6.
Click the arrows for each section to select what menu items and pages
you can see. For example, if you do not need Application Settings on the
Administer menu, clear Application Settings.
Password tab: Enables you to change your password. The password
policy will change depending on whether it is disabled or enabled. If the
password policy is enabled, the text will change to "Password must be
between 8 and 20 characters and contain at least 1 letter and 1
number."

Administration
449
Customizing My Preferences Global Preferences
Customize global preferences to create a working environment that suits your needs. The
global preferences you select affect only your interaction with the application; other
users are not affected by your changes.
Global preferences is broken down into several sections. To see how to customize a
section, use any of the tasks listed below.
Customizing Global Currency Preferences
Customize currency preferences to determine how currency is displayed in the
application.
To customize currency preferences:
1) Click the Administer menu and select My Preferences.
2) On the My Preferences page, click the Global tab.
3) On the Global tab, expand the Currency section.
4) In the Currency section, click the Select Currency icon.
5) In the Select Currency dialog box, select a currency and click OK.
6) On the Global tab:
a. In the Currency section, mark or clear the Show decimal places and Show
currency symbol options to suit your needs.
b. Click Save and Close.
Tips
You can double-click the Currency field and type a currency name rather than search
for a currency.
Customizing Global Date Format Preferences
Customize date format preferences to determine how dates are displayed in the
application.
To customize date format preferences:
1) Click the Administer menu and select My Preferences.
2) On the My Preferences page, click the Global tab.
3) On the Global tab, expand the Date Format section.
4) In the Date Format section:
a. Expand the Date format subsection:
1. Click the Date format list, and choose a format.

450
2. Mark the Date format options for how you want the date to display.
b. Expand the Time format subsection:
1. Click the Time format list, and choose a format.
2. Mark the Show minutes option if you want minutes to display.
c. Click the Separator list, and choose a separator.
5) On the Global tab, click Save and Close.
Customizing Global General Preferences
Customize general preferences on the Global tab to enable miscellaneous options for
P6, such as sending an e-mail to resources upon adding or removing assignments.
Note: The P6 Administrator must setup an e-mail server for this
functionality to work.
To customize general preferences:
1) Click the Administer menu and select My Preferences.
2) On the My Preferences page, click the Global tab.
3) On the Global tab, expand the General section.
4) In the General section, mark or clear the options.
5) On the Global tab, click Save and Close.
Customizing Global Issues Preferences
Customize global issues preferences to determine how issues are displayed in the
application.
To customize global issues preferences:
1) Click the Administer menu and select My Preferences.
2) On the My Preferences page, click the Global tab.
3) On the Global tab, expand the Issues section.
4) In the Issues section, mark or clear options for each of the statements.
a. To have an issue emailed that has a certain priority, click the priority list and
choose a value.
b. To select an issue code, click the Select an Issue Code icon.
c. In the Select an Issue Code dialog box, select an issue code and click OK.
5) On the Global tab, click Save and Close.
Customizing Global Performance Threshold Preferences
Customize performance threshold preferences to specify parameters for Performance,
Earned Value, and Index values that appear in dashboard Project Performance portlets
and on the Portfolios Performance Status tab.

Administration
451
To customize performance threshold preferences:
1) Click the Administer menu and select My Preferences.
2) On the My Preferences page, click the Global tab.
3) On the Global tab, expand the Performance Threshold section.
4) In the Performance Threshold section:
a. Expand the Performance subsection:
1. Double-click each field and type a value.
2. Click each list and choose a value.
b. Expand the Earned Value subsection, and click each list and choose a value.
c. Expand the Index subsection, and click each list and choose a value.
5) On the Global tab, click Save and Close.
Customizing Global Project Score Preferences
You can customize your own project score preferences to determine how the project will
be scored in the application.
To customize project score preferences:
1) Click the Administer menu and select My Preferences.
2) On the My Preferences page, click the Global tab.
3) On the Global tab, expand the Project Score section.
4) In the Project Score section:
a. Mark or clear the option to Calculate Project Score based on selected Project
Codes. If you mark the option:
Click the Project Codes link.
In the Customize Project Score dialog box, use the common controls to add
or remove project code fields from the Selected Columns list and click Save.
See Configuring Columns or Values (on page 91).
b. In the High is greater than or equal to field, enter a value between 1 and 100.
c. In the Medium is greater than or equal to field, enter a value between 1 and 100
that is also less than the High is greater than or equal to field.
5) On the Global tab, click Save and Close.
Customizing Global Resources Preferences
Customize resources preferences to determine how resources will be displayed in the
application.
To customize resources preferences:
1) Click the Administer menu and select My Preferences.
2) On the My Preferences page, click the Global tab.
3) On the Global tab, expand the Resources section.

452
4) In the Resources section:
a. Expand the Resource Staffing subsection, and mark or clear the options.
b. Expand the Resource Assignments subsection, and mark one option for each of
the statements.
c. In the Number of available items to search for Roles, Resources, and Resource
Codes field, enter a value.
Note: The value specifies the number of search criteria items
allowed. The maximum valid value is 10.
5) On the Global tab, click Save and Close.
Customizing Global Row Number Preferences
Customize row number preferences to determine the maximum number of rows that can
be displayed in the application.
To customize row number preferences:
1) Click the Administer menu and select My Preferences.
2) On the My Preferences page, click the Global tab.
3) On the Global tab:
a. Double-click the Maximum number of rows displayed in each section field and
type a value.
Note: The value you place in the Maximum number of rows
displayed in each section setting will not apply to view or
dictionary grids.
b. Double-click the Maximum number of rows displayed in trees and picklists field
and type a value.
c. Click Save and Close.
Tips
If the number of items exceed the maximum you specify for Maximum number of
rows displayed in each section, a Next link appears for you to navigate to the next
page of the list.
If the number of items available to display exceeds the maximum you specify for
Maximum number of rows displayed in trees and picklists, a message appears to
inform you that you are viewing a partial list.
Customizing Global Time Units Format Preferences
Customize time units format preferences to determine how time will be displayed in the
application.
To customize time units format preferences:

Administration
453
1) Click the Administer menu and select My Preferences.
2) On the My Preferences page, click the Global tab.
3) On the Global tab, expand the Time Units Format section.
4) In the Time Units Format section:
a. Expand the Display Time Units in subsection:
1. Click the Display Time Units in list, and choose a unit.
2. Mark or clear the options.
Note: You must select the Show unit label option to mark the Show
sub units option.
3. Click the Decimal places list, and choose a number of decimal places.
b. Expand the Display Durations in subsection:
1. Click the Display Durations in list, and choose a unit.
2. Mark or clear the options.
Note: You must select the Show unit label option to mark the Show
sub units option.
3. Click the Decimal places list, and choose a number of decimal places.
c. Expand the Unit/Time Format subsection, and select one option.
5) On the Global tab, click Save and Close.
Sending E-Mail Notifications about Resource Assignments
An automatic notification feature can be configured to send e-mail to the affected
resources when you add, change, or remove a resource assignment.
To configure P6 to automatically send e-mail about resource assignments:
1) Click the Administer menu and select My Preferences.
2) On the My Preferences page, click the Global tab.
3) On the Global tab, expand the General section.
4) In the General section:
a. Select the Send e-mail to resources upon adding or removing assignments option.
b. The system automatically selects the Prompt before sending e-mail option. Clear
the option if you do not want prompts.
5) On the Global tab, click Save and Close.

454
Tips
The address and subject line for the e-mail are generated based on the specific
assignment circumstances. For example, when you first assign a resource to an
activity, the e-mail subject line tells the resource they have been assigned and
provides the activity name. In all cases, the message text includes the project name,
resource start and finish dates, planned units, and planned units/time.
When the automatic e-mail option is on, confirmation messages are sent to you,
indicating the names of the recipients.
If a resource does not have an e-mail address specified on the Resources tab of the
Administration page, no e-mail can be sent.
When a resource is replaced on an activity, an e-mail is sent to the removed resource
and to the replacement resource.
Customizing My Preferences View Preferences
Customize view preferences to specify the items that appear in the Administer,
Dashboards, Portfolios, Projects, and Resources sections. You can edit only your view
preferences if you have been assigned edit rights. If you do not have edit rights, the
options are disabled.
To customize view preferences:
1) Click the Administer menu and select My Preferences.
2) On the My Preferences page, click the View tab.
3) On the View tab, expand the Administer section.
4) In the Administer section, expand the Menu Items subsection and mark or clear the
options.
5) On the View tab, expand the Dashboards section.
6) In the Dashboards section:
a. Expand the Menu Items subsection and mark or clear the options.
b. Expand the Displayed Dashboards section to view the dashboards.
7) On the View tab, expand the Portfolios section.
8) In the Portfolios section:
a. Expand the Menu Items subsection, and mark or clear the options.
b. Expand the Pages subsection, and mark or clear the options.
9) On the View tab, expand the Projects section.
10) In the Projects section:
a. Expand the Menu Items subsection, and mark or clear the options.
b. Expand the Pages subsection, and mark or clear the options.
11) On the View tab, expand the Resources section.
12) In the Resources section:
a. Expand the Menu Items subsection, and mark or clear the options.

Administration
455
b. Expand the Pages subsection, and mark or clear the options.
13) On the View tab, click Save and Close.
Tips
Mark the option next to Menu Items or Pages to automatically mark all the options in
the list. Clear the option to automatically clear all the options in the list.
Click the Move Up or Move Down arrows to arrange the menus items.
Changing Your Own Password
Users can change their own password at any time.
Note: You cannot change passwords if you are running P6 EPPM in
LDAP or SSO authentication mode.
To change your own password:
1) Click the Administer menu and select My Preferences.
2) On the My Preferences page, click the Password tab.
3) On the Password tab:
a. In the Current Password field, enter the current password.
b. In the New Password field, enter a new password.
Notes:
When the Password Policy is enabled in Application Settings,
the password must be between 8 and 20 characters and
contain at least one number and one letter.
When the Password Policy is disabled in Application Settings,
the password must be between 1 and 20 characters. P6 EPPM
does not allow blank passwords.
c. In the Confirm New Password field, enter the new password again for verification.
d. Click Save.
About My Calendar
My Calendar allows you to customize your own personal resource calendar. Use My
Calendar to add or modify work and nonwork days, or import exception time from an
existing calendar. Mark your planned vacation days and update other personal
nonwork exception days so your project manager is able to more accurately assign
activities and track your availability for current and upcoming projects.
Note: You will only see My Calendar in the Administer menu if you
have been assigned a personal resource calendar.

456
Configuring My Calendar
If you are assigned a personal resource calendar, you can perform the following tasks:
Setting Work Hours Per Time Period for My Calendar
Configure the work hours per time period settings to specify the default number of hours
in a work period for a calendar. The values you specify here are used as conversation
factors when displaying time units in increments other than hours. Any
resource-dependent activity that uses this resource calendar will use these values as
conversion factors for these activities.
To use this feature, the Use assigned calendar to specify the number of work hours for
each time period option must be selected in Application Settings. See Configuring Time
Periods Settings (on page 462).
To set the number of work hours for each time period:
1) Click the Administer menu and select My Calendar.
2) On the My Calendar page, click Edit Hours Per Period.
3) In the Set Time Periods dialog box, click and type an hour value in each field, and
then click OK.
4) Click Save.
Configuring the Standard Work Week for My Calendar
Configure the standard work week for the calendar to set the work and nonwork days
and hours.
To configure the standard work week:
1) Click the Administer menu and select My Calendar.
2) On the My Calendar page, click the Standard Work Week tab.
3) On the Standard Work Week tab, right-click on a working or nonworking timeslot and
use the menu options to adjust the workday. You can also resize the working time to
increase or decrease the work hours.
4) Click Save (Ctrl+S).
Modifying Calendar Days on My Calendar
Modify calendar days to account for work or nonwork days or hours that are different
than the standard hours defined on the Standard Work Week tab. For example, you
might choose to specify vacation days by setting the standard working days to
nonworking days.
To modify work or nonwork calendar days:
1) Click the Administer menu and select My Calendar.
2) On the My Calendars page, click the Calendar tab.

Administration
457
3) On the Calendar tab, right-click a working or nonworking day and use the menu
options to adjust the workday.
4) Click Save (Ctrl+S).
Importing Events to My Calendar
You can import special events into My Calendar. The imported time appears in your
calendar as nonwork exception time. For example, an organization might distribute a file
of holidays or special travel events that it wants all employees to import into their
personal calendars.
The following conditions must be met before you import the events:
The duration of the event must exceed the total standard worktime for a given day;
or, it must represent an all day event.
The events you import must be formatted in the iCalendar (.ics) file format. This means
you might have to export your appointments in another scheduling application to an
.ics file.
To import special nonwork events into My Calendar:
1) Click the Administer menu and select My Calendar.
2) On the My Calendars page, click Import.
3) In the Import Calendar Events dialog box:
a. Click to browse iCalendar files.
b. Select a file and then click Open.
c. Select the check boxes for the events you want to import. Select the check box in
the column header to import all events.
d. Click Import.
4) A message box will appear alerting you when the import is complete. Click OK.
5) On the My Calendars page:
a. Scan through the calendar to verify the exception time appears on days where it
is expected.
b. Click Save (Ctrl+S).
Example: You import a calendar event for a specific day with hours
that exceed the standard work hours set for that day. The imported
event will set the entire day to nonwork exception time. Using
precise numbers, if your standard work week designates 8 hours of
work for Monday, and you import a file that has a nonwork period
of 9 hours named "Approved Comp Time," the entire day will
appear as nonwork exception time in your calendar.

458
About Application Settings
Application Settings enables your organization to define a series of application-wide
parameters and values that apply globally and to all projects in an enterprise project
structure (EPS). Use these settings to customize the application to meet specific project
management requirements and standards. The P6 Administrator can choose to hide
Application Settings from users. If users can view Application Settings, they must have the
proper security privileges to edit them.
Working with Application Settings
Use Application Settings to specify default administrative preferences established by the
P6 Administrator. The P6 Administrator must give you access to Application Settings to
view them and the "Edit Application Settings" privilege for you to adjust them.
Table of Application Settings Elements
Item Description
Data Limits: Specify the maximum number of levels for hierarchical
structures and the maximum number of codes and baselines.
Earned Value: Specify default settings for calculating earned value.
General: Specify general default options, such as the weekday on which
the calendar week begins.
ID Lengths: Specify the maximum number of characters for IDs and
codes.

Administration
459
Item Description
Timesheets: Specify default setup options when using P6 Progress
Reporter.
Time Periods: Define the default number of hours in a workday,
workweek, workmonth, and workyear, or specify that the default number
of work hours for each time period is defined per calendar.
Configuring Data Limits Settings
Data limits allows you to specify the maximum number of levels for hierarchical structures.
You can also specify the maximum number of baselines and activity codes that can be
included in a project.
To configure data limits settings:
1) Click the Administer menu and select Application Settings.
2) On the Application Settings pane, click Data Limits.
3) On the Data Limits page:
a. Click the up and down arrows for each item to set maximums.
b. Click Save and Close.
Configuring Earned Value Settings
Configure earned value settings to specify defaults for calculating earned value.
To configure earned value settings:
1) Click the Administer menu and select Application Settings.
2) On the Application Settings pane, click Earned Value.
3) On the Earned Value page:
a. In the Technique for computing performance percent complete section, mark an
option.
Note: If you mark the Custom % Complete option, use the up and
down arrows to select a percent.
b. In the Technique for computing estimate to complete (ETC) section, mark the first
option or mark one of the other four options to define a formula.
Note: If you mark the PF = option, click the field and type a value to
be equal to PF.
c. In the Earned Value Calculation section, choose an option from the list.

460
d. Click Save and Close.
Tips
You can mark only one option in each section.
Configuring General Settings
Perform the steps below to configure general application settings including calendar
and activity duration defaults, URLs for related applications, summarization time periods
(also used to store past period performance actuals), and to enable the optional
password policy setting.
To configure general settings:
1) Click the Administer menu and select Application Settings.
2) On the Application Settings pane, click General.
3) On the General page:
a. In the Starting Day of Week section, click the list and choose a day of the week.
b. In the Password Policy section, select the option to enable the policy.
Notes:
You cannot change passwords if you are running P6 EPPM in
LDAP or SSO authentication mode.
When the Password Policy is disabled in Application Settings,
the password must be between 1 and 20 characters. P6 EPPM
does not allow blank passwords.
When the Password Policy is enabled in Application Settings,
the password must be between 8 and 20 characters and
contain at least one number and one letter.
c. In the Contract Management section, click the URL field and enter the URL.
d. In the Summarization Periods section:
1. Select the By Calendar option, the By Financial Periods option, or both.
2. If you select By Calendar, select a time interval value for the WBS Level and
Resource/Role Assignment Level fields.
e. In the Activity Duration section, double-click the field and type the duration.
Note: Include the time unit in the field. For example, 5.0d for 5 days.
f. In the Code Separator section, double-click the field and type a separator.
g. In the Document Management section, click the field and type the P6 URL.
h. Click Save and Close.

Administration
461
Tips
Triple-click a field to select an entire URL.
In the Summarization Periods section, rather than spreading units and costs evenly
throughout the length of a project (when you select By Calendar), you can also view
how actual units and costs were incurred by selecting By Financial Periods. You can
then store and edit period performance for any predefined financial period.
Configuring ID Lengths Settings
Configure ID lengths settings to specify the maximum number of characters allowed for
IDs and codes.
To configure ID lengths settings:
1) Click the Administer menu and select Application Settings.
2) On the Application Settings pane, click ID Lengths.
3) On the ID Lengths page:
a. Click Increase or Decrease for each code or ID to specify maximum lengths.
b. Click Save and Close.
Tips
ID and code lengths cannot exceed 20 characters.
Configuring Timesheets Settings
Configure timesheets settings to specify default setup options for P6 Progress Reporter.
You can specify general timesheets settings and how timesheets are approved before
project data is updated.
To configure timesheets settings:
1) Click the Administer menu and select Application Settings.
2) On the Application Settings pane, click Timesheets.
3) On the Timesheets page:
a. In the General Settings section, mark or clear options.
b. In the Timesheet Approval Level section, mark an approval type.
Note: If you mark the Two approval levels option, you can also add
the stipulation that the Project Manager must approve first.
c. In the Default Resource manager field, click Select User.
d. Click Save and Close.

462
Configuring Time Periods Settings
Configure time periods settings to specify time period abbreviations and the default
number of hours in a work period. The Hours per Time Period are used as conversion
factors when users choose to display time units and durations in units other than hours. For
example, if the default Hours/Day is set to 8.0, when a user enters 1d as a duration, this
value is stored as 8h in the database.
To configure time periods settings:
1) Click the Administer menu and select Application Settings.
2) On the Application Settings pane, click Time Periods.
3) On the Time Periods page:
a. In the Hours per Time Period section, double-click each field and type a value.
Note: If you select the Use assigned calendar to specify the
number of work hours for each time period option, the Hours per
Time Period values on this tab are ignored and the module
converts units and durations using the Hours per Time Period values
defined in the activity’s or resource’s assigned calendar. Using a
task-dependent activity as an example, the module converts units
and durations for the activity using the settings defined in the
activity’s assigned calendar. You should type values for each time
period even if you mark this option since the Hours per Time Period
values on this tab are still used in the following cases:
The Planning page of the Resources section in P6.
The Planning Resources tab in the project and WBS views in P6
Professional.
In these cases the Use assigned calendar to specify the number of
work hours for each time period option will be ignored even if
selected.
b. In the Time Period Abbreviations section, enter one-letter abbreviations for each
time period.
c. Click Save and Close.
About Enterprise Data
Enterprise data is a defined series of application-wide parameters and values that apply
to all projects. Your organization can use these settings to customize your projects to
meet specific project management requirements and standards. While all users can
view these settings, a user must have the proper security privileges to edit them.
The P6 Administrator uses enterprise data to define standard categories and values you
can apply across all projects, including custom categories and category values for
projects, resources, and WBS elements.

Administration
463
Working with Enterprise Data
Use the Enterprise Data page to configure various types of data settings routinely used by
other features in the application. Your settings reflect the data recognized by your
industry or organization and help to meet your project management requirements and
standards.
Table of Enterprise Data Elements
Item Description
Global section: Click Global to customize global data, such as currencies
and financial periods.
Projects section: Click Projects to customize project-specific data, such
as baseline types and funding sources.
Activities section: Click Activities to customize activity data, such as
activity codes and cost accounts.
Resources section: Click Resources to customize resource and role data,
such as rate types and resource codes.

464
Item Description
Risks section: Click Risks to customize risk data, such as risk categories
and thresholds.
Issues section: Click Issues to customize issue data, such as issue codes
and UDFs.
Documents section: Click Documents to customize document data, such
as document categories and statuses.
About Baseline Types
Baseline types enable you to categorize and standardize baselines across projects. Types
are assigned to baselines to help categorize, or track, multiple baselines for a single
project. Examples of baseline types include: Customer Sign-Off, Initial Planning,
Management Sign-Off, Mid Project Status, and What-If Project Plan baselines. The P6
Administrator defines the available baseline types.
Creating Baseline Types
Create baseline types to label and standardize the use of baselines across all projects at
your organization.
Example: Your organization has a quality process that requires all projects to be
baselined after their initial planning phase. Create a baseline type called Initial Planning
Baseline and move it to the top of the sort order. Project users can later label the
baselines they create after planning with this type designation and use it to identify
particular baselines going forward.
To create a baseline type:
1) Click the Projects menu and select Enterprise Project Data, or click the
Administer menu and select Enterprise Data.
2) In the Enterprise Data pane, expand Projects and click Baseline Types.
3) On the Baseline Types page:
a. Click Add (Insert).
b. In the Type field, double-click and type a unique type.
c. Click Save (Ctrl+S).
Tips
Click the Move Up or Move Down arrows to adjust the sort order. When users work with
baselines in other parts of the application, the Baseline Type field will show them in this
sequence. These buttons are available only when the list is not sorted alphabetically.

Administration
465
To change the name of a baseline type, double-click it and enter a new name. The
change applies to any projects with baselines of that particular type.
About Funding Sources
Funding sources are the agencies, businesses, or groups that provide funding for a
project. You can keep funding sources in a dictionary that categorizes and groups similar
funds in a hierarchy. The dictionary allows you to quickly assign specific funding sources
to budgets as a project develops. You can assign the same funding source multiple times
with varying amount and share contributions for different levels of the EPS. The amount
contributed by a specific funding source is called the fund share value.
Creating Funding Sources
Create funding sources to name and describe the agencies, businesses, or groups that
provide funding for a project.
To create a funding source:
1) Click the Projects menu and select Enterprise Project Data, or click the
Administer menu and select Enterprise Data.
2) In the Enterprise Data pane, expand Projects and click Funding Sources.
3) On the Funding Sources page:
a. Click Add (Insert).
b. Move the funding source to the correct location in the list and hierarchical position
by clicking the Move Up (Ctrl+Alt+Up), Move Down (Ctrl+Alt+Down),
Move Left (Ctrl+Alt+Left), and Move Right (Ctrl+Alt+Right) arrows.
c. In the Name field, double-click and type a name.
d. In the Description field, double-click and click .
4) In the Description detail window, type a brief narrative about the funding source.
5) On the Funding Sources page, click Save (Ctrl+S).
About Notebook Topics
Notebook topics help multiple users apply a common theme or label to shared
information about an activity, WBS, project, or EPS element such as its purpose,
completion instructions, or other helpful notes. For example, you might place an e-mail
message, a web link, a table of observations, and a series of text notes into a notebook
topic called Budget Recommendations to capture the ongoing cost impacts of a
recurring project.
Creating Notebook Topics
Create notebook topics to provide specified instructions or a description for performing
an activity. Notebook topics can also be assigned at the EPS, project, and WBS levels.
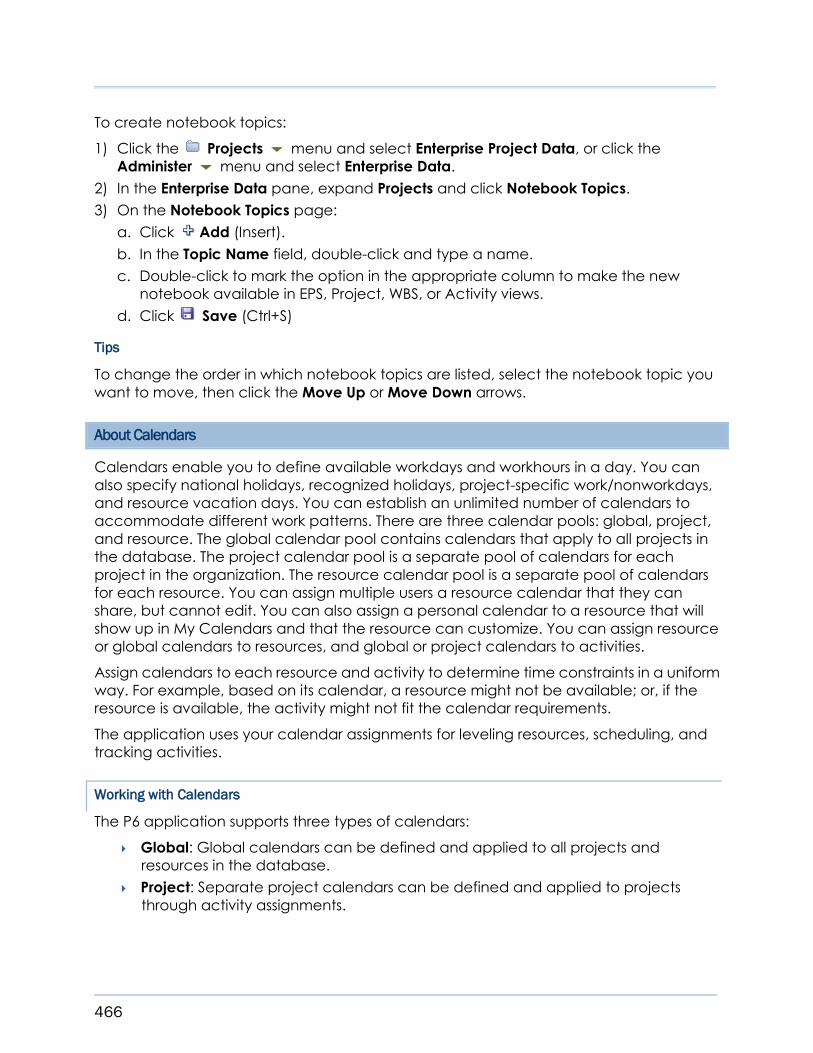
466
To create notebook topics:
1) Click the Projects menu and select Enterprise Project Data, or click the
Administer menu and select Enterprise Data.
2) In the Enterprise Data pane, expand Projects and click Notebook Topics.
3) On the Notebook Topics page:
a. Click Add (Insert).
b. In the Topic Name field, double-click and type a name.
c. Double-click to mark the option in the appropriate column to make the new
notebook available in EPS, Project, WBS, or Activity views.
d. Click Save (Ctrl+S)
Tips
To change the order in which notebook topics are listed, select the notebook topic you
want to move, then click the Move Up or Move Down arrows.
About Calendars
Calendars enable you to define available workdays and workhours in a day. You can
also specify national holidays, recognized holidays, project-specific work/nonworkdays,
and resource vacation days. You can establish an unlimited number of calendars to
accommodate different work patterns. There are three calendar pools: global, project,
and resource. The global calendar pool contains calendars that apply to all projects in
the database. The project calendar pool is a separate pool of calendars for each
project in the organization. The resource calendar pool is a separate pool of calendars
for each resource. You can assign multiple users a resource calendar that they can
share, but cannot edit. You can also assign a personal calendar to a resource that will
show up in My Calendars and that the resource can customize. You can assign resource
or global calendars to resources, and global or project calendars to activities.
Assign calendars to each resource and activity to determine time constraints in a uniform
way. For example, based on its calendar, a resource might not be available; or, if the
resource is available, the activity might not fit the calendar requirements.
The application uses your calendar assignments for leveling resources, scheduling, and
tracking activities.
Working with Calendars
The P6 application supports three types of calendars:
Global: Global calendars can be defined and applied to all projects and
resources in the database.
Project: Separate project calendars can be defined and applied to projects
through activity assignments.

Administration
467
Resource: Resource calendars can be defined and applied to each individual
resource.
Begin by defining one or more global calendars and then link any project or resource
calendars to them. Changes to a global calendar apply to all project and resource
calendars linked to it.
Assign global or resource calendars to resources, and global or project calendars to
activities. You can establish an unlimited number of calendars to accommodate
different work patterns. For example, if some activities require a five day workweek, while
others are performed part-time (such as Monday, Wednesday, and Friday), you can
create different calendars and assign them to the activities and resources in your
projects.
An activity’s Activity Type field value determines whether the activity uses the calendar
of an assigned resource or its project calendar.
Creating Global Calendars
Create global calendars to identify global work or nonwork days. You can use global
calendars as base calendars when creating a resource or project calendar. The
exception days in a global calendar appear in the resource or project calendar and are
identified by a (globe).
To create a global calendar:
1) Click the Administer menu and select Enterprise Data.
2) In the Enterprise Data pane, expand Global and click Global Calendars.
3) On the Global Calendars page, click Add (Insert).
4) In the Select Calendar to Copy dialog box:
a. Select the Global or Resource option.
Note: This determines which list of calendars you can select.
b. Select a calendar and click OK.
5) On the Global Calendars page, click the Calendar tab.
6) On the Calendar tab, triple-click the Name field and enter a name.
Note: The application automatically assigns the name New
Calendar.
7) On the Global Calendars page, click Save (Ctrl+S).
8) To configure the global calendar, see Configuring Global Calendars (on page 467).
Configuring Global Calendars
Perform the following tasks when creating or updating a global calendar:
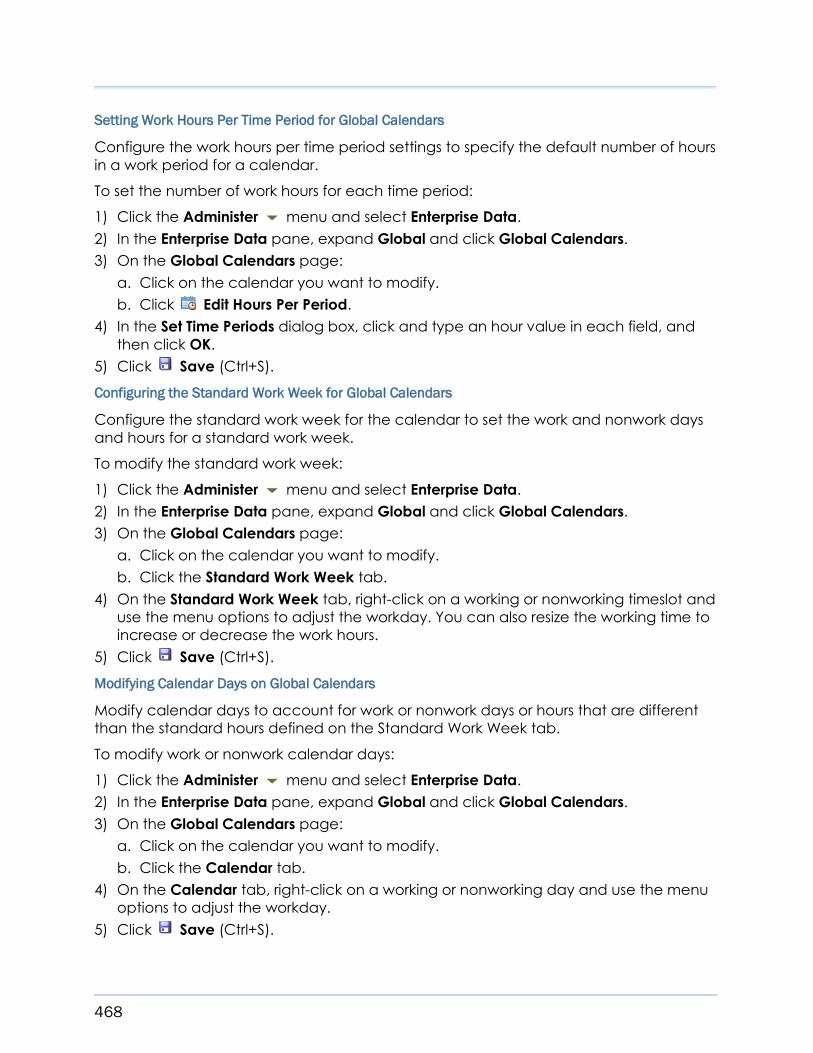
468
Setting Work Hours Per Time Period for Global Calendars
Configure the work hours per time period settings to specify the default number of hours
in a work period for a calendar.
To set the number of work hours for each time period:
1) Click the Administer menu and select Enterprise Data.
2) In the Enterprise Data pane, expand Global and click Global Calendars.
3) On the Global Calendars page:
a. Click on the calendar you want to modify.
b. Click Edit Hours Per Period.
4) In the Set Time Periods dialog box, click and type an hour value in each field, and
then click OK.
5) Click Save (Ctrl+S).
Configuring the Standard Work Week for Global Calendars
Configure the standard work week for the calendar to set the work and nonwork days
and hours for a standard work week.
To modify the standard work week:
1) Click the Administer menu and select Enterprise Data.
2) In the Enterprise Data pane, expand Global and click Global Calendars.
3) On the Global Calendars page:
a. Click on the calendar you want to modify.
b. Click the Standard Work Week tab.
4) On the Standard Work Week tab, right-click on a working or nonworking timeslot and
use the menu options to adjust the workday. You can also resize the working time to
increase or decrease the work hours.
5) Click Save (Ctrl+S).
Modifying Calendar Days on Global Calendars
Modify calendar days to account for work or nonwork days or hours that are different
than the standard hours defined on the Standard Work Week tab.
To modify work or nonwork calendar days:
1) Click the Administer menu and select Enterprise Data.
2) In the Enterprise Data pane, expand Global and click Global Calendars.
3) On the Global Calendars page:
a. Click on the calendar you want to modify.
b. Click the Calendar tab.
4) On the Calendar tab, right-click on a working or nonworking day and use the menu
options to adjust the workday.
5) Click Save (Ctrl+S).

Administration
469
Setting the Default Global Calendar
Choose a calendar to use as the default when new calendars are created.
To set the default global calendar:
1) Click the Administer menu and select Enterprise Data.
2) In the Enterprise Data pane, expand Global and click Global Calendar.
3) On the Global Calendar page:
a. Click on the calendar you want to designate as the default calendar.
b. Click Set As Default Calendar.
c. Click Save (Ctrl+S).
Creating Project Calendars
Create project calendars to determine work or nonwork time for a project.
To create a project calendar:
1) Click the Projects menu and select Enterprise Project Data, or click the
Administer menu and select Enterprise Data.
2) In the Enterprise Data pane, expand Projects and click Project Calendars.
3) On the Project Calendars page:
a. Click on a project.
Note: If the project you need is not open, click Select Projects.
Choose one or more projects and click OK.
b. Click Add (Insert).
4) In the Select Calendar to Copy dialog box:
a. Select the Global, Resource, or Project option.
Note: This determines which list of calendars you can select.
b. Select a calendar and click OK.
5) On the Project Calendars page, click the Calendar tab.
6) On the Calendar tab, click in the Name field and enter a name for the project
calendar.
7) On the Project Calendars page, click Save (Ctrl+S).
Tips
To configure the project calendar, see Configuring Project Calendars (on page 470).

470
Configuring Project Calendars
Perform the following tasks when creating or updating a project calendar:
Assigning a Base Calendar to a Project Calendar
Assign a base calendar to determine holidays and exceptions for the selected project
calendar.
To assign a base calendar:
1) Click the Projects menu and select Enterprise Project Data, or click the
Administer menu and select Enterprise Data.
2) In the Enterprise Data pane, expand Projects and click Project Calendars.
3) On the Project Calendars page:
a. Expand a project.
Note: If the project you need is not open, click Select Projects.
Choose one or more projects and click OK.
b. Select a calendar to assign a base calendar.
c. Click Select a Base Calendar.
4) In the Select Base Calendar dialog box, select a calendar and click OK.
5) Click Save (Ctrl+S).
Tips
The (globe) on calendar days indicates exception days marked in the base
calendar. You can modify these exceptions days and the globe will disappear. If you set
the calendar day back to standard, the exception day will reset and the globe will
reappear.
Setting Work Hours Per Period for a Project Calendar
Configure the work hours per time period settings to specify the default number of hours
in a work period for a calendar.
To set the number of work hours for each time period:
1) Click the Projects menu and select Enterprise Project Data, or click the
Administer menu and select Enterprise Data.
2) In the Enterprise Data pane, expand Projects and click Project Calendars.
3) On the Project Calendars page:
a. Expand a project.
Note: If the project you need is not open, click Select Projects.
Choose one or more projects and click OK.
b. Click on the calendar you want to modify.

Administration
471
c. Click Edit Hours Per Period.
4) In the Set Time Periods dialog box, click and type an hour value in each field, and
then click OK.
5) Click Save (Ctrl+S).
Configuring the Standard Work Week for Project Calendars
Configure the standard work week for the calendar to set the work and nonwork days
and hours for a standard work week.
To configure the standard work week:
1) Click the Projects menu and select Enterprise Project Data, or click the
Administer menu and select Enterprise Data.
2) In the Enterprise Data pane, expand Projects and click Project Calendars.
3) On the Project Calendars page:
a. Expand a project.
Note: If the project you need is not open, click Select Projects.
Choose one or more projects and click OK.
b. Click on the calendar you want to modify.
c. Click the Standard Work Week tab.
4) On the Standard Work Week tab, right-click on a working or nonworking timeslot and
use the menu options to adjust the workday. You can also resize the working time to
increase or decrease the work hours.
5) Click Save (Ctrl+S).
Modifying Calendar Days on Project Calendars
Modify calendar days to account for work or nonwork days or hours that are different
than the standard hours defined on the Standard Work Week tab.
1) Click the Projects menu and select Enterprise Project Data, or click the
Administer menu and select Enterprise Data.
2) In the Enterprise Data pane, expand Projects and click Project Calendars.
3) On the Project Calendars page:
a. Expand a project.
Note: If the project you need is not open, click Select Projects.
Choose one or more projects and click OK.
b. Click on the calendar you want to modify.
c. Click the Calendar tab.
4) On the Calendar tab, right-click on a working or nonworking day and use the menu
options to adjust the workday.
5) Click Save (Ctrl+S).

472
Tips
The (globe) on calendar days indicates exception days in the base calendar. You
can modify these exceptions days and the globe will disappear. If you set the calendar
day back to standard, the Global exception day will reset and the globe will reappear.
Changing a Project Calendar to a Global Calendar
You can turn an existing project calendar into a global calendar.
To make a project calendar a global calendar:
1) Click the Projects menu and select Enterprise Project Data, or click the
Administer menu and select Enterprise Data.
2) In the Enterprise Data pane, expand Projects and click Project Calendars.
3) On the Project Calendars page:
a. Expand a project.
Note: If the project you need is not open, click Select Projects.
Choose one or more projects and click OK.
b. Click on the calendar you want to change to global.
4) On the toolbar, click Promote to Global Calendar.
5) Click Save (Ctrl+S).
Creating Resource Calendars
Create a resource calendar to determine when a resource can work.
To create a resource calendar:
1) Click the Resources menu and select Enterprise Resource Data, or click the
Administer menu and select Enterprise Data.
2) In the Enterprise Data pane, expand Resources and click Resource Calendars.
3) On the Resource Calendars page:
a. Click on Personal Calendars to create a private calendar for the resource, or click
on Shared Calendars to create a calendar for multiple resources to share that the
resources cannot edit.
b. Click Add (Insert).
4) If you are creating a Personal Calendar, in the Select Resource dialog box, select a
resource and click OK.
If you are creating a Shared Calendar, in the Select Calendar To Copy dialog box:
a. Choose Global or Resource calendar to use as the base for the new calendar.
b. Click on a global or resource calendar.
c. Click OK.
5) On the Resource Calendars page, click the Calendar tab.

Administration
473
6) On the Calendar tab, click in the Name field and enter a name for the personal or
resource calendar.
7) On the Resource Calendars page, click Save (Ctrl+S).
8) To configure the resource calendar, see Configuring Resource Calendars (on page
473).
Related Topics
About Calendars ..................................................................................................... 466
Working with Calendars ......................................................................................... 466
Creating Global Calendars ................................................................................... 467
Configuring Global Calendars .............................................................................. 467
Creating Project Calendars ................................................................................... 469
Configuring Project Calendars .............................................................................. 470
Configuring Resource Calendars .......................................................................... 473
About My Calendar ................................................................................................ 455
Creating Global Calendars ................................................................................... 467
Creating Project Calendars ................................................................................... 469
Configuring Resource Calendars
Perform the following tasks when creating or updating a resource calendar:
Assigning a Base Calendar to a Resource Calendar
Assign a base calendar to apply all the exception days (i.e. holidays and other work or
nonwork days) from the base calendar for the selected resource calendar.
To assign a base calendar:
1) Click the Resources menu and select Enterprise Resource Data, or click the
Administer menu and select Enterprise Data.
2) In the Enterprise Data pane, expand Resources and click Resource Calendars.
3) On the Resource Calendars page, expand Shared Calendars or Personal Calendars.
a. Select a calendar to assign a base calendar.
b. Click Select a Base Calendar.
4) In the Select Base Calendar dialog box, select a calendar and click OK.
5) Click Save (Ctrl+S).
Tips
The (globe) on calendar days indicates exception days marked in the base
calendar. You can modify these exceptions days and the globe will disappear. If you
set the calendar day back to standard, the exception day will reset and the globe
will reappear.
If you are editing your personal calendar, you cannot change the base calendar.

474
Assigning a Resource to a Resource Calendar
Resources can be assigned a personal calendar or a shared calendar. A resource is
assigned to a personal calendar when creating a personal calendar. See Creating
Resource Calendars (on page 472).
To assign a resource to a shared calendar:
1) Click the Resources menu and select Enterprise Resource Data, or click the
Administer menu and select Enterprise Data.
2) In the Enterprise Data pane, expand Resources and click Resource Calendars.
3) On the Resource Calendars page:
a. Click on a shared calendar.
Note: Click the Used By tab to view resources currently assigned to
the shared calendar.
b. Click Assign Resource.
4) In the Select Resource dialog box:
a. Choose a resource and click Assign.
b. Assign any additional resources to the shared calendar, and then click Close.
5) On the Resource Calendars page, click Save (Ctrl+S).
Tips
If you need to remove a resource from a shared calendar, navigate to the correct
resource or global calendar you want to assign to the resource, and then assign the
resource.
You can also assign a calendar to a resource from the Resources tab on the Resources
Administration page. See Assigning Calendars to Resources (on page 406).
Setting Work Hours Per Time Period for a Resource Calendar
Configure the work hours per time period settings to specify the default number of hours
in a work period for a calendar.
To use this feature, the Use assigned calendar to specify the number of work hours for
each time period option must be selected in Application Settings. See Configuring Time
Periods Settings (on page 462).
To set the number of work hours for each time period:
1) Click the Resources menu and select Enterprise Resource Data, or click the
Administer menu and select Enterprise Data.
2) In the Enterprise Data pane, expand Resources and click Resource Calendars.
3) On the Resource Calendars page:
a. Click on the calendar you want to modify.
b. Click Edit Hours Per Period.

Administration
475
4) In the Set Time Periods dialog box, click and type an hour value in each field, and
then click OK.
5) Click Save (Ctrl+S).
Configuring the Standard Work Week for Resource Calendars
Configure the standard work week for the calendar to set the work and nonwork days
and hours for a standard work week.
To configure the standard work week:
1) Click the Resources menu and select Enterprise Resource Data, or click the
Administer menu and select Enterprise Data.
2) In the Enterprise Data pane, expand Resources and click Resource Calendars.
3) On the Resource Calendars page:
a. Click on the calendar you want to modify.
b. Click the Standard Work Week tab.
4) On the Standard Work Week tab, right-click on a working or nonworking timeslot and
use the menu options to adjust the workday. You can also resize the working time to
increase or decrease the work hours.
5) Click Save (Ctrl+S).
Modifying Calendar Days
Modify calendar days to account for work or nonwork days or hours that are different
than the standard hours defined on the Standard Work Week tab. For example, if you are
using a personal calendar, you might choose to specify vacation days by setting the
standard working days to nonworking days.
To modify work or nonwork calendar days:
1) Click the Resources menu and select Enterprise Resource Data, or click the
Administer menu and select Enterprise Data.
2) In the Enterprise Data pane, expand Resources and click Resource Calendars.
3) On the Resource Calendars page:
a. Click on the calendar you want to modify.
b. Click the Calendar tab.
4) On the Calendar tab, right-click on a working or nonworking day and use the menu
options to adjust the workday.
5) Click Save (Ctrl+S).
Tips
The (globe) on calendar days indicates exception days in the base calendar. You
can modify these exceptions days and the globe will disappear. If you set the calendar
day back to standard, the Global exception day will reset and the globe will reappear.

476
Changing the Calendar Type
You can change the type of calendar you created from a resource calendar to a global
calendar, a personal calendar to a shared calendar, or a shared calendar to a personal
calendar.
1) Click the Resources menu and select Enterprise Resource Data, or click the
Administer menu and select Enterprise Data.
2) In the Enterprise Data pane, expand Resources and click Resource Calendars.
3) On the Resource Calendars page, click on a personal or shared calendar.
To change a calendar from a resource calendar to a global calendar:
On the Resource Calendars toolbar, click Promote to Global Calendar.
To change a personal calendar to a shared calendar, or to change a shared
calendar to a personal calendar:
Note: If you are converting a shared calendar to a personal
calendar, you must remove all but one resource before
proceeding with this step. To remove a resource from a calendar,
navigate to the correct calendar for the resource and assign the
resource to that calendar.
4) Click Convert to Personal Calendar or Convert to Shared Calendar.
About Project Codes
Project codes help you track different projects based on characteristics they share. You
can use project codes to arrange projects hierarchically when your EPS contains many
projects within many levels. If you have many projects in the hierarchy, project codes
help you group and filter potentially vast amounts of information spanning different areas
of the organization. The application supports an almost unlimited number of hierarchical
project codes and values; you can establish as many as you need to meet the filtering,
sorting, and reporting requirements of your organization.
Creating Project Codes
Create project codes to represent project evaluation criteria. These steps represent the
minimum required to create a project code.
To create a project code:
1) Click the Projects menu and select Enterprise Project Data, or click the
Administer menu and select Enterprise Data.
2) In the Enterprise Data pane, expand Projects and click Project Codes.
3) On the Project Codes page:
a. Click Add Code (Insert).

Administration
477
b. Move the project code to the correct location in the list by clicking the Move
Down (Ctrl+Alt+Down) and Move Up (Ctrl+Alt+Up) arrows.
c. In the Name field, double-click and type a unique code.
d. In the Maximum Length field, double-click and click the up or down arrow to
specify project code value length.
e. Click Save (Ctrl+S) .
Tips
Project codes at the same level are siblings. Subordinate project codes are children.
Creating Project Code Values
Create project code values to group, sort, and filter project data.
To create project code values:
1) Click the Projects menu and select Enterprise Project Data, or click the
Administer menu and select Enterprise Data.
2) In the Enterprise Data pane, expand Projects and click Project Codes.
3) On the Project Codes page:
a. Select a code.
b. Click Add Code Value.
Note: The code value will be added to the selected project code.
c. Move the project code value to the correct location in the list and hierarchical
position by clicking the Move Up (Ctrl+Alt+Up), Move Down
(Ctrl+Alt+Down), Move Left (Ctrl+Alt+Left), and Move Right (Ctrl+Alt+Right)
arrows.
d. In the Name field, double-click and type a code value.
Note: The code value cannot exceed the Maximum Length
specified by the project code.
e. In the Description field, double-click and type a brief narrative about the code
value.
f. In the Weight field, double-click and type a value. Weight defaults to 0.0 if you do
not type a value.
Note: The weight reflects the ranking of this value against other
values in the project code.
4) Click Save (Ctrl+S).

478
Tips
Project code values at the same level are siblings. Subordinate project code values are
children.
Configuring Project Codes
Configure project codes to add security, code weight, and a description to the code.
To configure a project code:
1) Click the Projects menu and select Enterprise Project Data, or click the
Administer menu and select Enterprise Data.
2) In the Enterprise Data pane, expand Projects and click Project Codes.
3) On the Project Codes page:
a. Select the code you want to configure.
b. In the Secure field, mark the option to make the code read-only for users without
the necessary security privileges to make changes.
Note: You can designate a project code as secure only if you have
the appropriate security privilege; otherwise, this option does not
display.
c. In the Weight field, double-click and type the project code weight.
Note: The weight reflects the ranking of this code against other
project codes.
d. In the Maximum Code Value Weight field, double-click and type a value.
e. Click Save (Ctrl+S).
Configuring Project Code Values
Configure project code values to describe and weigh the importance of the code
value.
To configure project code values:
1) Click the Projects menu and select Enterprise Project Data, or click the
Administer menu and select Enterprise Data.
2) In the Enterprise Data pane, expand Projects and click Project Codes.
3) On the Project Codes page:
a. Select the code value you want to configure.
b. In the Description field, double-click and type a brief narrative about the code
value.
c. In the Weight field, double-click and type a value.

Administration
479
Note: The weight reflects the ranking of this value against other
values in the project code.
d. Click Save (Ctrl+S).
About User Defined Fields
User defined fields allow you to create and maintain data specific to your organization.
For example, you can track additional activity data, such as delivery dates and
purchase order numbers. You can also track additional resource data or project
cost-related data, such as profit, variances, and revised budgets. User defined fields are
global, so they can be used across all projects in your organization.
You can also create project user defined fields. Project user defined fields track
information specific to projects. For example, your organization might require a custom
field to track project profit. Project user defined fields are unique in that you can define a
formula or statement to automatically calculate field values, and identify graphical
indicators to display for a field, based on its value.
Creating Project UDFs
Create project user defined fields (UDFs) if the predefined fields do not meet your needs.
Project UDFs have formulas that automatically calculate values for the field.
To create a project UDF:
1) Click the Projects menu and select Enterprise Project Data, or click the
Administer menu and select Enterprise Data.
2) In the Enterprise Data pane, expand Projects and click Project UDFs.
3) On the Project UDFs page:
a. Click Add (Insert).
b. In the User Defined Field, double-click and type a name.
c. In the Data Type field, double-click and choose a type from the list.
d. In the UDF Type field, double-click and choose Manual or Formula from the list.
Note: Choosing Formula enables the fields in the Formula detail
window, allowing you to define a formula or statement to
calculate the value of the field. If no calculation is required,
choose Manual.
4) In the Formula detail window, define a formula or statement. See Defining Formulas
for User Defined Fields (on page 480) or Defining Statements for User Defined Fields (on
page 481).
5) In the Indicators detail window, define a graphical indicator. See Defining Indicators
for User Defined Fields (on page 480).
6) On the Project UDFs page, click Save (Ctrl+S).

480
Tips
You cannot define a formula for fields with 'Indicator' marked.
If you define an indicator, a checkmark will appear in the Indicator field.
You can edit the Indicator detail window only if you select Integer, Cost, and
Number.
Defining Formulas for User Defined Fields
Define formulas to calculate values for the user defined field.
Before defining a formula, you need to first create a project user defined field. To create
a project user defined field see Creating Project UDFs (on page 479).
To define formulas for user defined fields:
1) Click the Projects menu and select Enterprise Project Data, or click the
Administer menu and select Enterprise Data.
2) In the Enterprise Data pane, expand Projects and click Project UDFs.
3) On the Project UDFs page, select a UDF and click the Formula detail window.
Note: The UDF Type must be set to Formula to access the Formula
detail window.
4) In the Formula detail window:
a. Click the Fields list and choose a field.
Note: You can select any existing project-related field defined in
the project management database, including project codes, or
any other user defined field that exists for your organization.
b. Click Insert Field.
c. Continue to build your formula by inserting fields and using the operator buttons.
5) Click Save (Ctrl+S).
Tips
Operator buttons include: +, -, *, /, (, and ).
Defining Indicators for User Defined Fields
Define indicators for user defined fields (UDFs) that will display based on criteria set for
field values. For example, you can choose a graphical indicator to display when the
value of the field equals a certain number, or when the value of the field falls between a
certain range of dates.
Before defining an indicator, you need to first create a project user defined field. To
create a project user defined field see Creating Project UDFs (on page 479).

Administration
481
Note: You can identify graphical indicators only for fields with a
'Cost', 'Integer', or 'Number' Data Type.
To define indicators for UDFs:
1) Click the Projects menu and select Enterprise Project Data, or click the
Administer menu and select Enterprise Data.
2) In the Enterprise Data pane, expand Projects and click Project UDFs.
3) On the Project UDFs page, select a UDF and click the Indicators detail window.
Note: You can also follow these steps for the Summary Indicators
detail window
4) In the Indicators detail window repeat the following for each parameter statement:
a. Click the Select Parameter list and choose a parameter.
b. Mark the Value or Field option.
1. If you mark the Value option, double-click the field and type a value.
2. If you mark the Field option, click the list and select a field.
Note: If you select a "is within the range of" or "is not in the range of"
condition, use the Value field to specify the lower range value and
the High Value field to specify the upper range value.
c. Click each Indicator list and choose an indicator.
5) On the Project UDFs page, click Save (Ctrl+S).
Tips
Click to add another indicator statement or to remove a statement.
Defining Statements for User Defined Fields
Define statements to calculate values for the user defined field.
Before defining a statement, you need to first create a project user defined field. To
create a project user defined field see Creating Project UDFs (on page 479).
To define statements for user defined fields:
1) Click the Projects menu and select Enterprise Project Data, or click the
Administer menu and select Enterprise Data.
2) In the Enterprise Data pane, expand Projects and click Project UDFs.
3) On the Project UDFs page, select a UDF and click the Formula detail window.
Note: The UDF Type must be set to Formula to access the Formula
detail window.

482
4) In the Formula detail window:
a. Click Advanced .
b. Click IF/THEN/ELSE.
Note: The default statement 'IF (condition) THEN (expression) ELSE
(expression)' is displayed in the detail window.
c. Highlight a (condition) or (expression) entry and its parentheses.
d. Click the Fields list and choose a field.
Note: You can select any existing project-related field defined in
the project management database, including project codes, or
any other user defined field that exists for your organization.
e. Click Insert Field.
Note: The selected field will replace the highlighted (condition) or
(expression) entry.
f. Continue to replace fields and use the operator, relational operator, and
expression buttons to build your statement.
Note: Relational operators (<, >, =, <>) are only valid for the 'IF'
condition statement.
5) On the Project UDFs page, click Save (Ctrl+S).
Tips
Text values must be enclosed in quotes. For example: IF [Division]="Marketing."
Numeric values do not require quotes. For example: IF [Proposed Budget]>500000.
Only the = (equal) and <> (not equal) relational operators are valid for text values.
Date values must be enclosed in quotes and follow the dd-mm-yyyy format. For
example, IF [Start Date]>"01-APR-2007".
Operator buttons include: +, -, *, /, (, and ). Expression buttons include: AND, OR, and
IF/THEN/ELSE.
You can also replace (condition) and (expression) entries by deleting the entries and
their parentheses, placing the cursor in the appropriate location in the statement,
and following steps 4.d. through 4.f.
Creating WBS UDFs
Create WBS user defined fields (UDFs) if the predefined fields do not meet your needs.
To create a WBS UDF:
1) Click the Projects menu and select Enterprise Project Data, or click the
Administer menu and select Enterprise Data.

Administration
483
2) In the Enterprise Data pane, expand Projects and click WBS UDFs.
3) On the WBS UDFs page:
a. Click Add (Insert).
b. In the User Defined Field, double-click and type a name.
c. In the Data Type field, double-click and choose a type from the list.
d. Click Save (Ctrl+S).
Creating Activity UDFs
Create activity user defined fields (UDFs) if the predefined fields do not meet your needs.
To create an activity UDF:
1) Click the Projects menu and select Enterprise Project Data, or click the
Administer menu and select Enterprise Data.
2) In the Enterprise Data pane, expand Activities and click Activity UDFs.
3) On the Activity UDFs page:
a. Click Add (Insert).
b. In the User Defined Field, double-click and type a name.
c. In the Data Type field, double-click and choose a type from the list.
d. Click Save (Ctrl+S).
Creating Expense UDFs
Create expense user defined fields (UDFs) if the predefined fields do not meet your
needs.
To create an expense UDF:
1) Click the Projects menu and select Enterprise Project Data, or click the
Administer menu and select Enterprise Data.
2) In the Enterprise Data pane, expand Activities and click Expense UDFs.
3) On the Expense UDFs page:
a. Click Add (Insert).
b. In the User Defined Field, double-click and type a name.
c. In the Data Type field, double-click and choose a type from the list.
4) Click Save (Ctrl+S).
Creating Step UDFs
Create step user defined fields (UDFs) if the predefined fields do not meet your needs.
To create a step UDF:
1) Click the Projects menu and select Enterprise Project Data, or click the
Administer menu and select Enterprise Data.

484
2) In the Enterprise Data pane, expand Activities and click Step UDFs.
3) On the Step UDFs page:
a. Click Add (Insert).
b. In the User Defined Field, double-click and type a name.
c. In the Data Type field, double-click and choose a type from the list.
d. Click Save (Ctrl+S).
Creating Risk UDFs
Create risk user-defined fields (UDFs) to store additional project risk data on the Projects
Risks page that is pertinent to your project or business and is not available from the
default fields. For example, you might need to include a location field to identify where
the risk might occur, or a ranking field to determine the order in which the risks will be
handled.
User-defined fields can be of many types: text, start date, finish date, cost, number,
integer, or indicator. Data from UDFs is not used in scoring calculations.
To create a risk UDF:
1) Click the Projects menu and select Enterprise Project Data, or click the
Administer menu and select Enterprise Data.
2) In the Enterprise Data pane, expand Risks and click Risk UDFs.
3) On the Risk UDFs page:
a. Click Add (Insert).
b. In the User Defined Field, double-click and type a name.
c. In the Data Type field, double-click and choose a data type from the list.
d. Click Save (Ctrl+S).
Creating Issue UDFs
Create issue user defined fields (UDFs) if the predefined fields do not meet your needs.
To create an issue UDF:
1) Click the Projects menu and select Enterprise Project Data, or click the
Administer menu and select Enterprise Data.
2) In the Enterprise Data pane, expand Issues and click Issue UDFs.
3) On the Issue UDFs page:
a. Click Add (Insert).
b. In the User Defined Field, double-click and type a name.
c. In the Data Type field, double-click and choose a type from the list.
4) Click Save (Ctrl+S).
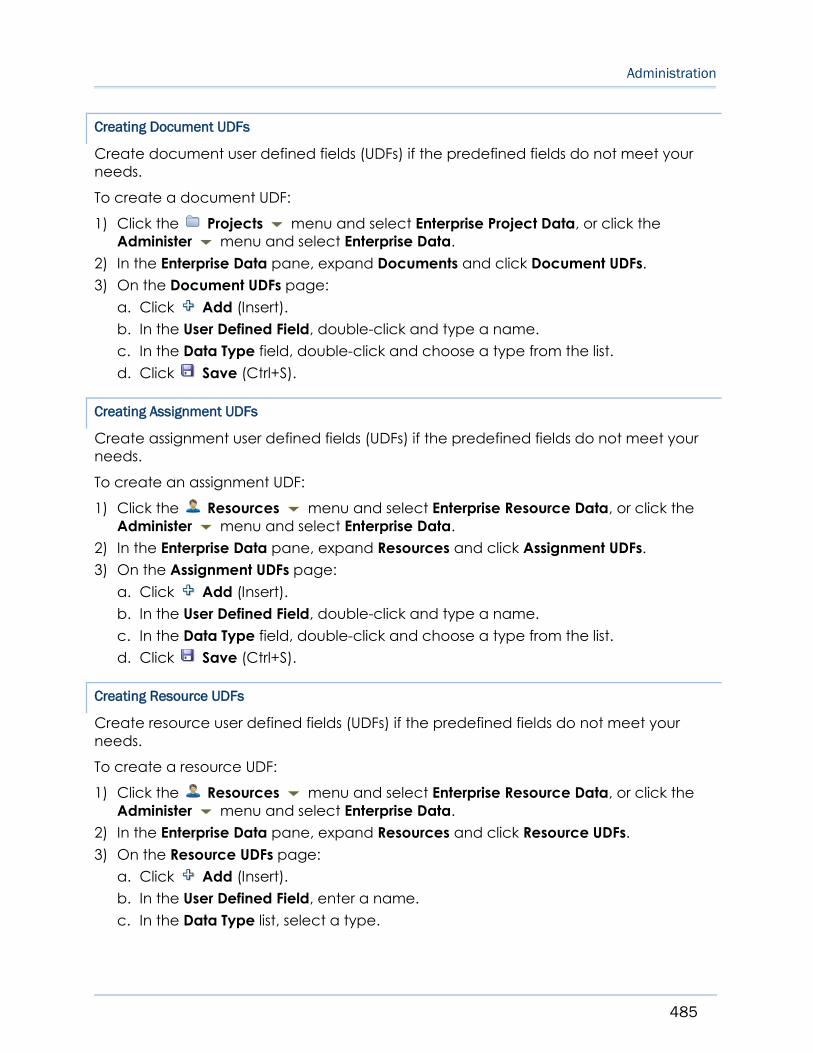
Administration
485
Creating Document UDFs
Create document user defined fields (UDFs) if the predefined fields do not meet your
needs.
To create a document UDF:
1) Click the Projects menu and select Enterprise Project Data, or click the
Administer menu and select Enterprise Data.
2) In the Enterprise Data pane, expand Documents and click Document UDFs.
3) On the Document UDFs page:
a. Click Add (Insert).
b. In the User Defined Field, double-click and type a name.
c. In the Data Type field, double-click and choose a type from the list.
d. Click Save (Ctrl+S).
Creating Assignment UDFs
Create assignment user defined fields (UDFs) if the predefined fields do not meet your
needs.
To create an assignment UDF:
1) Click the Resources menu and select Enterprise Resource Data, or click the
Administer menu and select Enterprise Data.
2) In the Enterprise Data pane, expand Resources and click Assignment UDFs.
3) On the Assignment UDFs page:
a. Click Add (Insert).
b. In the User Defined Field, double-click and type a name.
c. In the Data Type field, double-click and choose a type from the list.
d. Click Save (Ctrl+S).
Creating Resource UDFs
Create resource user defined fields (UDFs) if the predefined fields do not meet your
needs.
To create a resource UDF:
1) Click the Resources menu and select Enterprise Resource Data, or click the
Administer menu and select Enterprise Data.
2) In the Enterprise Data pane, expand Resources and click Resource UDFs.
3) On the Resource UDFs page:
a. Click Add (Insert).
b. In the User Defined Field, enter a name.
c. In the Data Type list, select a type.

486
d. Click Save (Ctrl+S) .
About Work Breakdown Structures (WBS)
A WBS, or work breakdown structure, is a hierarchical arrangement of work activities that
divides a project into discrete levels, phases, or layers. The WBS is structured in levels of
work detail, beginning with the deliverable and separated into identifiable work
elements.
When creating a project, the project manager typically develops the WBS first. The
manager assigns documents to each WBS element, and then defines activities to
complete that element. In addition to document and activity assignments, each WBS
element can also have specific earned value calculation settings, issue assignments,
and notebook topics.
Each project has its own WBS hierarchy with the top-level WBS element equal to that of
each enterprise project structure (EPS) node or project. Each WBS element can contain
more detailed WBS levels, activities, or both.
Creating WBS Categories
Create WBS categories to organize, filter, and report WBS information in all projects.
To create WBS categories:
1) Click the Projects menu and select Enterprise Project Data, or click the
Administer menu and select Enterprise Data.
2) In the Enterprise Data pane, expand Projects and click WBS Category.
3) On the WBS Category page:
a. Click Add (Insert).
b. In the Category field, double-click and type a name.
c. Click Save (Ctrl+S).
Tips
To change a category value, double-click it, then type a new name. The change
applies to all projects to which the WBS item is assigned.
If you change the WBS category, the category’s values or value assignments do not
change.
About Activity Codes
Activity codes enable you to categorize activities into logical groups based on your
organization's criteria. An activity code can be one of three types: Global, EPS, or
Project. Global activity codes organize activities across all projects in an organization.
EPS activity codes organize activities within a specific branch or node of the enterprise
project structure (EPS). Project activity codes categorize activities based on specific
features within a project.

Administration
487
Activity codes represent broad categories of information, a department or project
manager for instance. You can create multiple activity codes according to specific
categories, then assign different values for each code. For example, assume your
organization has many departments and you want to review activities within each
department. You can first create an activity code "department," then assign different
values such as quality assurance, finance, and sales. You can then associate activities
with specific departments.
A key characteristic of an activity code as opposed to an activity user defined field is
that activity codes will only allow entries from a predefined list of values. After you create
activity codes, users can assign activity code values to activities to group, sort, and filter
project data based on these values.
Creating Activity Codes
Create activity codes organizes activities into groups. Activity codes can be one of three
levels: global, EPS, or project.
To create activity codes:
1) Click the Projects menu and select Enterprise Project Data, or click the
Administer menu and select Enterprise Data.
2) In the Enterprise Data pane, expand Activities and click Activity Codes.
3) On the Activity Codes page, click the Global, EPS, or Project tab to determine the
level for the activity code.
4) On the Global, EPS, or Project tab, click the Add Activity Code icon.
a. Move the activity code to the correct location in the list by clicking the Move
Up (Ctrl+Alt+Up) and Move Down (Ctrl+Alt+Down) arrows.
b. In the Name field, double-click and type a unique code.
Note: Project-level activity codes must be unique across all
projects. Enterprise-level activity codes must be unique across all
EPSs. Global activity codes must be unique across the organization.
c. In the Maximum Length field, double-click and click the up or down arrow to
specify project code value length.
d. In the Secure field, mark the option to make the code read-only for users without
the necessary security privileges to make changes.
Note: You can designate an activity code as secure only if you
have the appropriate security privilege; otherwise, this option does
not display.
e. Click Save (Ctrl+S).
Tips
Activity codes at the same level are siblings. Subordinate activity codes are children.

488
Click Move to Global to move an EPS-level or project-level activity code to a
global-level activity code. Click Move to EPS to move a project-level activity code to
an EPS-level activity code.
If you are working on the Project tab and the project you need is not visible, click
Select Projects. In the Select Projects dialog box, select a project and click OK. For
help adding projects to the Selected Projects list, see Customize Columns or Values
(see "Configuring Columns or Values" on page 91).
Creating Activity Code Values
Create activity code values to represent variations within the larger scope of the activity
code. It is these values, not the activity codes, that you will assign to projects. You can
add code values for project-level, EPS-level, and global activity codes. These steps
represent the minimum required to create an activity code value. To configure an
activity code value, see Configuring Activity Code Values (on page 489).
To create activity code values:
1) Click the Projects menu and select Enterprise Project Data, or click the
Administer menu and select Enterprise Data.
2) In the Enterprise Data pane, expand Activities and click Activity Codes.
3) On the Activity Codes page, click the Global, EPS, or Project tab to determine the
level for the activity code value.
4) On the Global, EPS, or Project tab:
a. Select a code.
b. Click Add Activity Code Value.
Note: The code value will be assigned to the selected code.
c. Move the activity code value to the correct location in the list and hierarchical
position by clicking the Move Up (Ctrl+Alt+Up), Move Down
(Ctrl+Alt+Down), Move Left (Ctrl+Alt+Left), and Move Right (Ctrl+Alt+Right)
arrows.
d. In the Name field, double-click and type a code value unique to that tree level.
Note: The code value cannot exceed the Maximum Length
specified by the activity code.
e. Click Save (Ctrl+S).
Tips
Activity code values at the same level are siblings. Subordinate activity code values
are children.

Administration
489
You can also assign project-level activity code values to an open project. On the
Projects navigation bar, click Activities and click the Codes detail window. In the
Codes detail window, click Assign Activity Code Value. In the Select Code Value
dialog box, you can assign a preexisting code value or add a new code value. To
assign an existing code value, mark Global, EPS, or Project and select an activity
code value from that level. To add a new code value, select an activity code and
click Add Code Value. Type a name and description and click Create.
To select multiple projects in the Select Projects dialog box, press the Ctrl key and
click the projects to be selected.
Each time you update the list of projects on the Project tab, the application saves the
list of displayed projects.
If you are working on the Project tab and the project you need is not visible, click
Select Projects. In the Select Projects dialog box, select a project and click OK. The
dialog box only displays the projects you have access to view. For help adding
projects to the Selected Projects list, see Customize Columns or Values (see
"Configuring Columns or Values" on page 91).
Configuring Activity Code Values
Configure activity code values to reflect changing variations within the larger scope of
the activity code.
To configure activity code values:
1) Click the Projects menu and select Enterprise Project Data, or click the
Administer menu and select Enterprise Data.
2) In the Enterprise Data pane, expand Activities and click Activity Codes.
3) On the Activity Codes page, click the Global, EPS, or Project tab that matches the
level you need to configure.
4) On the Global, EPS, or Project tab, select an activity code value.
a. In the Description field, double-click and type a brief narrative about the code
value.
b. In the Color field, double-click and click to change the color automatically
assigned to this value.
c. In the Color dialog box, select a color and click OK.
Note: In the Gantt chart and the Activity Calendar, activity status
shown by activity code will display the color you apply to the
activity code value.
5) On the Activity Codes page, click Save.
Tips
Activity code values at the same level are siblings. Subordinate activity code values
are children.

490
You can also configure activity code values from the Codes detail window on the
Activities page. In the Codes detail window, double-click the Code Value field for an
activity code and click . Select a new value from the dialog box.
If you are working on the Project tab and the project you need is not visible, click
Select Projects. In the Select Projects dialog box, select a project and click OK. For
help adding projects to the Selected Projects list, see Customize Columns or Values
(see "Configuring Columns or Values" on page 91).
Configuring EPS-Level Activity Codes
Configure enterprise project structure (EPS)-level activity codes to reflect a company's
work needs.
To configure EPS level activity codes:
1) Click the Projects menu and select Enterprise Project Data, or click the
Administer menu and select Enterprise Data.
2) In the Enterprise Data pane, expand Activities and click Activity Codes.
3) On the Activity Codes page, click the EPS tab.
4) In the EPS tab:
a. Move activity code values to different EPS levels in the list and hierarchical position
by clicking the Move Up, Move Down, Move Left, and Move Right
arrows.
b. Click Save.
About Cost Accounts
Cost accounts enable you to monitor project expenses, activity costs, and earned value
throughout the project life cycle. Costs are attached to activities and resources so you
can track the amount of work accomplished against the amount of money spent. You
can assign default or created cost accounts to any project.
Cost accounts are established in a hierarchy. For example, if you created a cost
account for a project component such as hardware, you would create other cost
accounts beneath this component to show its parts such as coding and installation.
Creating Cost Accounts
Create cost accounts to track activity cost and earned value throughout the project life
cycle. You can associate predefined cost accounts with expenses to categorize them.
To create cost accounts:
1) Click the Projects menu and select Enterprise Project Data, or click the
Administer menu and select Enterprise Data.
2) In the Enterprise Data pane, expand Activities and click Cost Accounts.
3) On the Cost Accounts page:

Administration
491
a. Click Add (Insert).
b. Move the cost account to the correct location in the list and hierarchical position
by clicking the Move Up (Ctrl+Alt+Up), Move Down (Ctrl+Alt+Down),
Move Left (Ctrl+Alt+Left), and Move Right (Ctrl+Alt+Right) arrows.
c. In the ID field, double-click and type a unique ID.
d. In the Name field, double-click and type a name.
e. In the Description field, double-click and click .
4) In the Description detail window, type a brief narrative about the cost account.
5) On the Cost Accounts page, click Save (Ctrl+S) .
About Expenses
Expenses are non-resource costs associated with a project and assigned to a project’s
activities. An expense is typically a one-time expenditure for non-reusable items.
Expenses are project-specific and not time-based. Some examples include facilities,
travel, consulting, and training. Each expense has an actual, remaining, and at
completion value for both cost and units that is either budgeted or planned.
Expense categories classify and standardize expenses, and organize and maintain your
expense information.
Creating Expense Categories
Create an expense category to organize and track various expense types within an
organization.
To create expense categories:
1) Click the Projects menu and select Enterprise Project Data, or click the
Administer menu and select Enterprise Data.
2) In the Enterprise Data pane, expand Activities and click Expense Categories.
3) On the Expense Categories page:
a. Click Add (Insert).
b. In the Category field, double-click and type a name.
c. Click Save (Ctrl+S).
Tips
To change an expense category, double-click it, then type a new name. The change
applies to all projects to which the expense item is assigned.

492
About Step Templates
Step templates enable you to define a group of steps common to multiple activities, and
then assign the template to different activities. By creating templates for groups of
activity steps that are relevant in many projects, an organization can streamline data
entry and ensure that work is identified consistently throughout the organization.
Creating Step Templates
Create step templates to specify reusable sets of steps common to many activities. This
task represents the minimum steps required to create a step template. To configure a
step template, see Configuring Step Templates (on page 492).
To create step templates:
1) Click the Projects menu and select Enterprise Project Data, or click the
Administer menu and select Enterprise Data.
2) In the Enterprise Data pane, expand Activities and click Step Templates.
3) On the Step Templates page:
a. Click Add (Insert).
b. In the Template Name field, double-click and type a name.
c. Click Save (Ctrl+S).
Configuring Step Templates
Configure step templates to add, delete, or arrange the steps assigned to a template.
To configure a step template:
1) Click the Projects menu and select Enterprise Project Data, or click the
Administer menu and select Enterprise Data.
2) In the Enterprise Data pane, expand Activities and click Step Templates.
3) On the Step Templates page, select a template.
4) In the Step Template detail window, you can add, delete, or arrange steps.
To add steps, click Add (Insert).
a. In the Step Name field, double-click and type a name.
b. In the Description field, double-click and click .
c. In the Description dialog box, type a brief narrative about the step and click OK.
d. In the Weight field, double-click and type a weight value.
To delete steps, select a step and click Delete (Delete).
To arrange steps, select a step and click the Move Up (Ctrl+Alt+Up) and
Move Down (Ctrl+Alt+Down) arrows.
5) On the Step Templates page, click Save (Ctrl+S).

Administration
493
About Risks
Risks are any uncertain events or conditions that, if they occur, have a positive or
negative effect on project objectives. Risks are also known as threats, warnings,
imperatives, escalation notices, or jeopardies. Positive risks are often classified as
opportunities which, if they occur, are realized as rewards. Thorough documentation and
analysis of risks over multiple projects offer lessons, and potentially cost and time savings,
for all future projects.
Working with Risks Enterprise Data
Risk Enterprise data is used to setup categories, risk scoring matrices, and thresholds that
are standard across your company. The categories and matrices that are assigned to a
project can be displayed in the risk register, which is located in the Projects section under
Risks.
Risk Categories page - Risk categories are used to categorize and organize project risks.
They are global across the enterprise and are a mechanism to group risks across multiple
projects to see risk trends across the organization as well as a single project. Technical,
Operational, External are examples of risk categories that might apply to a typical
project. The risk categories are created in the Risks Enterprise Data area and assigned on
the Risks page under Projects.
Risk Scoring Matrices page - Create a risk scoring matrix to perform qualitative risk
analysis on your project risks. When creating a risk scoring matrix, you must define the
probability, tolerance, cost, and schedule impacts. Additionally, you can add
user-defined impacts to the matrix. You must also assign a risk scoring method (Highest
Impact, Average Impact, and Average Individual Impact) to the matrix. A probability
and impact diagram is created based on the information assigned in the matrix. Click on
the Probability and Impact Diagram detail window to view the diagram.
To use the risk scoring matrix, you must add the projects you want to use the matrix to the
risk scoring matrix from the Projects detail window. You can also assign a risk scoring
matrix to a project from the EPS page from the Projects section.
Note: You can add risks to a project without a risk scoring matrix;
however, you cannot perform qualitative risk analysis and will not
be able to assign probability or impact thresholds without a risk
scoring matrix. You can add a risk scoring matrix to the project at
any time.
Risk Thresholds page - Create risk thresholds, including probability, tolerance, cost
impact, schedule impact, and any additional user-defined impacts, for use in the risk
scoring matrix.

494
Risk UDFs page - Risk UDFs are used to track additional information about the risk that is
not provided by the standard risk fields. Create Risk user-defined fields (UDFs) when it is
necessary to view additional data fields on the Risks page. A risk UDF can include a text
string, a numerical value, start date, finish date, cost, integer, or indicator.
Configuring Risk Enterprise Data
You can configure enterprise data to include risk categories and risk UDFs, and to define
the criteria for performing qualitative risk analysis using a risk scoring matrix.
To define the criteria for performing qualitative risk analysis, perform the following tasks:
1) Creating Risk Thresholds (on page 350)
2) Creating Risk Scoring Matrices (on page 357)
3) Assigning a Risk Scoring Matrix to a Project (on page 358)
To configure risk categories or risk UDFs, see:
Creating Risk Categories (on page 361)
Creating Risk UDFs (on page 363)
About Risk Scoring Matrices
A risk scoring matrix is a qualitative analysis tool used to calculate the impact of a risk on
a project. A risk scoring matrix includes probability threshold values, cost and impact
threshold values, and any additional user-defined impact threshold values, which are all
used in the calculation of the risk score. The score is used to give an overall rating of a risk
depending on the probability and impact thresholds assessed in the project. The scores
are used to help determine if the risk should be addressed during the course of the
project, or if the risk does not present a significant impact to the cost or schedule of the
project.

Administration
495
Working with Risk Scoring Matrices
Use the Risk Scoring Matrices page to create a risk scoring matrix for one or more
projects. The inputs to the risk scoring matrix are the risk thresholds, which you create on
the Risk Thresholds page from the Enterprise Data section.
Table of Risk Scoring Matrices Elements
Item Description
Risk Scoring Matrices toolbar. See Enterprise Data Risk Scoring Matrices
Toolbar.

496
Item Description
Risk Scoring Matrices work area: This work area contains all the risk
scoring matrices defined for your company. The number of risk scoring
matrices you create is determined by risk analysis practices incorporated
in your business. You might have one corporate-wide risk scoring matrix
that is used for all projects, or you might have a need for separate
matrices which are used depending on different factors, such as project
size. For example, a project that is a new development might require
different cost impact and schedule impact threshold values than a
project for a new feature development on an existing product.
There might also be situations where a project is a joint-venture or is
performed by a contractor and the prime owner's matrix must be used.
However, for any project, only one matrix is assigned.
In the work area above, you can see this company has a need for
multiple risk scoring matrices, including a separate risk scoring matrix for
the Harbour Pointe Assisted Living construction project.
When creating a risk scoring matrix, you choose a matrix size based on
the number of levels assigned to your probability and impact thresholds
defined on the Risk Thresholds page. Using the Harbour Pointe Risk
Scoring Matrix as an example, the risk scoring matrix is 5 x 5. The first 5
represents the number of levels assigned to the probability threshold and
the second 5 represents the number of levels assigned to the cost and
schedule impact thresholds.
Next you choose the risk scoring method to use for risk score calculations.
For more information on risk scoring methods, see Risk Scoring Method.

Administration
497
Item Description
Risk Scoring Matrices detail windows:
Description: The area used to describe the risk scoring matrix.
Projects: The area where you assign the matrix to one or more projects.
Note that only one matrix can be assigned to a single project. If a matrix
is not assigned to a project, risks can still be entered in the risk register on
the Projects Risks page; however, the probability, cost impact, and
schedule impact threshold fields are disabled, and you cannot use the
qualitative analysis features of the application. At any time you can
create a matrix and assign it to an existing project.
Probability and Impact Diagram (PID): The PID is a graphical
representation of the selections made in the Risk Scoring Matrices work
area. The number of rows and columns is determined by the matrix size.
The rows are the probability levels and the columns are the impact levels.
The code and name fields for the impact threshold levels are
customizable when creating a threshold; therefore, the column labels for
the impacts are "Severity n." The number of severity columns reflects the
number of levels assigned to the impact thresholds.
The color coding indicates the tolerance threshold assigned to the risk
scoring matrix. These same tolerance colors are also visible in the Score
and Score (Text) fields on the risk register on the Projects Risks page when
risk values are entered.
Probability: The details of the probability threshold assigned to the matrix
needed to perform a qualitative assessment on project risks. This detail
window is read-only. To change anything related to the threshold,
navigate to the Risk Thresholds page.
Impacts: The details for the impact thresholds assigned to the matrix. A
cost and schedule impact must be defined for the matrix to perform a
qualitative assessment on project risks. An unlimited number of
user-defined impact thresholds can be assigned to the matrix. From this
detail window you can add or delete impacts to the matrix; however,
you cannot modify the threshold values. To change anything related to
the threshold, navigate to the Risk Thresholds page.
Tolerance: The details for the tolerance threshold assigned to the matrix.
This detail window is read-only. To change anything related to the
threshold, navigate to the Risk Thresholds page.

498
Creating Risk Scoring Matrices
Create a risk scoring matrix to perform qualitative analysis on project risks. Project risk is
assessed based on the thresholds defined in the risk scoring matrix.
Before creating a risk scoring matrix, you need to first define risk thresholds.
To create a risk scoring matrix:
1) Click the Projects menu and select Enterprise Project Data, or click the
Administer menu and select Enterprise Data.
2) In the Enterprise Data pane, expand Risks and choose Risk Scoring Matrices.
3) On the Risk Scoring Matrices page:
a. Click Add (Insert).
b. In the Name field, click and type a unique name.
c. In the Matrix Size field, double-click and click .
4) In the Select Matrix Size dialog box:
a. Choose a threshold level for the Probability and Impact fields.
Note: You must have already defined thresholds with the number
of levels you are assigning to the matrix (see Creating Risk
Thresholds (on page 350)). If you do not have a threshold with the
same number of levels, you will be able to select the matrix size, but
you will not be able to add a threshold.
b. Click OK.
5) On the Risk Scoring Matrices page, double-click in the Probability Threshold field and
click .
6) In the Select Probability Threshold dialog box, choose a probability and click OK.
7) On the Risk Scoring Matrices page, double-click in the Impact Thresholds field and
click .
8) In the Select Impact Thresholds dialog box:
a. Select a Cost Impact and click Assign.
b. Select a Schedule Impact and click Assign.
c. Select any additional impacts and click Assign.
d. Click Close.
9) On the Risk Scoring Matrices page, double-click in the Tolerance Threshold field and
click .
10) In the Select Tolerance Threshold dialog box, choose a tolerance and click OK.
11) On the Risk Scoring Matrices page, double-click in the Risk Scoring Method field and
select a risk scoring method from the list. For a detailed description of each method,
see Risk Scoring Method Description.
12) In the Description detail window, type a description of the risk scoring matrix.

Administration
499
13) On the Risk Scoring Matrices page, click Save (Ctrl+S).
Assigning a Risk Scoring Matrix to a Project
You need to assign a scoring matrix to a project before it can be used to prioritize risks.
Once you assign a scoring matrix to a project, it is available for use from the risk register
on the Projects Risks page.
You can assign a risk scoring matrix to a project from different areas in the application,
depending on the tasks you are working on at the time.
When setting up a project, see Assigning a Risk Scoring Matrix to a Project from the
EPS Page (see "Assigning a Risk Scoring Matrix to a Project from the EPS Page" on
page 359).
When defining a risk scoring matrix and applying the matrix to multiple projects, see
Assigning a Risk Scoring Matrix to a Project from the Enterprise Data Pane (on page
358).
When managing a portfolio, see Assigning a Risk Scoring Matrix to a Project from the
Portfolios Section (on page 359).
Assigning a Risk Scoring Matrix to a Project from the Enterprise Data Pane
You need to assign a risk scoring matrix to a project before it can be used to prioritize
risks. Once you assign a scoring matrix to a project, it is available for use from the risk
register on the Projects Risks page.
You can assign a risk scoring matrix to a project from multiple locations in the application.
Use this method when you are defining a risk scoring matrix and need to apply the matrix
to one or more projects.
To assign a risk scoring matrix to a project from the Enterprise Data pane:
1) Click the Projects menu and select Enterprise Project Data, or click the
Administer menu and select Enterprise Data.
2) In the Enterprise Data pane, expand Risks and choose Risk Scoring Matrices.
3) On the Risk Scoring Matrices page, click the Projects detail window.
4) In the Projects detail window, click Add (Insert).
5) In the Select Project dialog box:
a. Select a project and click Assign.
Note: If the project you selected is assigned to another risk scoring
matrix, the threshold values you previously set for the project are
removed. You will need to select values using the newly assigned
risk scoring matrix.
b. Select any additional projects and click Assign.
c. Click Close.
6) On the Risk Scoring Matrices page, click Save (Ctrl+S).

500
Assigning a Risk Scoring Matrix to a Project from the EPS Page
You need to assign a risk scoring matrix to a project before it can be used to prioritize
risks. Once you assign a scoring matrix to a project, it is available for use from the risk
register on the Projects Risks page.
You can assign a risk scoring matrix to a project from multiple locations in the application.
Use this method when you are setting up a project or modifying project settings.
To assign a risk scoring matrix to a project from the EPS page:
1) Click Projects.
2) On the Projects navigation bar, click EPS.
3) On the EPS page:
a. Locate the project you want to associate with a risk scoring matrix.
b. Double-click in the Risk Scoring Matrix field and click .
4) In the Select Risk Scoring Matrix dialog box, select a matrix and click OK.
Note: If the project you selected is assigned to another risk scoring
matrix, the threshold values you previously set for the project are
removed. You will need to select values using the newly assigned
risk scoring matrix.
5) On the EPS page, click Save (Ctrl+S).
Tips
If the Risk Scoring Matrix field is not visible, click View and select Columns. In the
Customize Columns dialog box, expand General and double-click Risk Scoring Matrix to
move it to the Selected Columns list. Click OK.
Assigning a Risk Scoring Matrix to a Project from the Portfolios Section
You need to assign a risk scoring matrix to a project before it can be used to prioritize
risks. Once you assign a scoring matrix to a project, it is available for use from the risk
register on the Projects Risks page.
You can assign a risk scoring matrix to a project from multiple locations in the application.
Use this method when you are creating or modifying a portfolio.
To assign a risk scoring matrix from the Portfolios section:
1) Click Portfolios.
2) On the Portfolios navigation bar, click Portfolio Analysis.
3) On the Portfolio Analysis page:
a. Click the View field and select a scorecard view from the list.
b. Select a project.
c. In the Risk Scoring Matrix field, double-click and click .

Administration
501
4) In the Select Risk Scoring Matrix dialog box, choose a risk scoring matrix and click OK.
Note: If the project you selected is assigned to another risk scoring
matrix, the threshold values you previously set for the project are
removed. You will need to select values using the newly assigned
risk scoring matrix.
5) On the Portfolio Analysis page, click Save (Ctrl+S).
Tips
If the Risk Scoring Matrix field is not visible, click Customize. In the Customize Scorecard
dialog box, click the Columns tab. On the Columns tab, expand General and
double-click Risk Scoring Matrix to move it to the Selected Columns list. Click Apply.
About Risk Thresholds
Risk thresholds are a range of values (monetary, time, quality, technical, etc.) used in
rating or assessing the impact of the risk to the project. A risk reaching or crossing over the
defined risk threshold requires attention and might require a risk response action.
These thresholds are the inputs used to create a risk scoring matrix, which is the overall
scoring mechanism used to perform qualitative risk analysis on your project risks.
Working with Risk Thresholds
From the Risk Thresholds page, you create risk thresholds for use in your risk scoring
matrices.
Risk thresholds necessary for a risk scoring matrix are:
Probability: The likelihood of a risk occurring.
Tolerance: The acceptability or manageability of a risk on a project.
Schedule: The amount of time the risk will increase or decrease the project schedule.
Cost: The cost impact if a risk occurs.

502
You can also add additional user-defined impacts necessary for the calculation of your
risk score.
Table of Risk Threshold Elements
Item Description
Risk Threshold toolbar. See Enterprise Data Risk Thresholds Toolbar.

Administration
503
Item Description
Risk Threshold work area: You define the risk threshold name, type
(Probability, Tolerance, Schedule Impact, Cost Impact, User-Defined
Impact), and number of thresholds levels in this work area. Each threshold
can have 2 - 9 levels; however, the cost impact, schedule impact, and
any user-defined impacts must have the same number of levels for a
given risk scoring matrix.
In the example above, the Cost Impact, Schedule Impact, Probability,
and Tolerance thresholds are defined for the Harbour Pointe Assisted
Living construction project. The Cost Impact and Schedule Impact
thresholds are each defined with 5 levels and the Probability threshold is
also defined with 5 levels. The risk scoring matrix that will be using these
thresholds will have a matrix size of 5 x 5.
For each risk scoring matrix, only one threshold for Probability, Tolerance,
Schedule Impact, and Cost Impact is allowed. You can add as many
user-defined impacts as necessary. You create multiple thresholds of the
same type, but with different values, when you create multiple risk
scoring matrices.
Levels detail window: The details for each level are defined in this
window. Define a name for each level and a code, which is a short
name or abbreviation for the name. Also, define the range of
acceptable values for that level; the range levels could be a percentage
value, dollar amount, number of days, or a text string depending on the
chosen threshold. You can define a color for each threshold level;
however, you should define colors for the tolerance threshold. The colors
for the threshold are used to give visual representation in the risk register.
The colors for the tolerance threshold are used in the Probability and
Impact Diagram (PID) to visually represent the threshold values. More
importantly, the colors display in the Score and Score (text) fields on the
risk register on the Projects Risks page. This enables you to easily identify
where in the risk scoring matrix this risk falls in terms of severity.
In the example above, the Tolerance threshold is defined with 3 levels
(High, Medium, and Low) and each range is assigned a color. You will
see the impact the color makes after you create a risk scoring matrix,
assign the thresholds to the matrix, and assign a risk scoring method. See
Working with Risk Scoring Matrices (on page 354).
Creating Risk Thresholds
You create risk thresholds, which you then use as inputs when creating a risk scoring
matrix. When creating risk thresholds, you must define the probability threshold, cost
impact threshold, schedule impact threshold, and tolerance threshold. You can also
define as many user-defined impacts as necessary.

504
To create risk thresholds:
1) Click the Projects menu and select Enterprise Project Data, or click the
Administer menu and select Enterprise Data.
2) Risks and click Risk Thresholds.
3) Repeat the following for each threshold you want to create:
a. On the Risk Thresholds page:
1. Click Add (Insert).
2. In the Name field, double-click and type a threshold name.
3. In the Type field, double-click and select a type of risk from the list.
4. In the Levels field, double-click and select a level number from the list.
b. In the Levels detail window, a default value is assigned for the Code, Name, and
Range values. You can use the default values provided, or double-click any field
to customize that field.
You can define a color for each threshold level to visually represent the values
when working the risk register on the Project Risks page. However, you should
define colors for the tolerance threshold. The colors for the tolerance threshold are
used to color the Score field on the risk register on the Projects Risks page. This
enables you to easily identify where in the risk scoring matrix this risk falls in terms of
severity.
4) On the Risk Thresholds page, click Save (Ctrl+S).
Modifying Risk Thresholds
If you are going to change the type or level of a threshold that is currently assigned to a
scoring matrix, you must first remove the threshold from the risk scoring matrix and assign
a new threshold.
To delete a threshold from a risk scoring matrix:
1) Click the Projects menu and select Enterprise Project Data, or click the
Administer menu and select Enterprise Data.
2) In the Enterprise Data pane, expand Risks and click Risk Scoring Matrices.
3) Repeat the following for each risk scoring matrix that includes the threshold you are
modifying.
a. On the Risk Scoring Matrices page:
1. Locate the risk scoring matrix that includes the threshold you are modifying.
2. Double-click in the appropriate threshold field.
b. In the Select Threshold dialog box, choose a different threshold and click Assign,
and then click Close.
4) On the Risk Scoring Matrices page, click Save (Ctrl+S).
To modify a risk threshold:

Administration
505
1) Click the Administer menu and select Enterprise Data.
2) In the Enterprise Data pane, expand Risks and click Risk Thresholds.
3) On the Risk Thresholds page:
a. Locate the threshold you are modifying.
b. Double-click in the field you are modifying and update the value.
Note: If you are modifying the number of levels assigned to a
threshold, all data for existing levels are overwritten and replaced
with the default values for that level.
c. Click Save (Ctrl+S).
About Risk Categories
Risk categories are a classification of risk types customized to your specific project or
business that are used to categorize and organize project risks. Categorizing risks enables
you to analyze the types of risks occurring and see trends within the project or across
multiple projects. This visibility will enable you to more effectively manage risks over the
long term.
Creating Risk Categories
Create a risk category to categorize and organize project risks.
To create a risk category:
1) Click the Projects menu and select Enterprise Project Data, or click the
Administer menu and select Enterprise Data.
2) In the Enterprise Data pane, expand Risks and click Risk Categories.
3) On the Risk Categories page:
a. Click Add (Insert).
b. In the Category field, double-click and type a unique name.
c. Click Save (Ctrl+S).
Tips
To display the Category field on the Projects Risks page, click Select Columns on the Risks
toolbar and select Category.

506
About Issues
Issues are perceived problems within a schedule that require attention or corrective
action. When you create them in the Activities section, you can associate them with a
single project or workgroup and assign them to a responsible manager in the OBS for
follow-up based on priority. You can also associate issues with a single activity. When
adding new issues to a project or workgroup, you can control the information you
capture for each new issue. You can choose to receive e-mail notifications when new
issues of a certain priority are added, when existing issues are modified, or when issues
are assigned a specific issue code.
You can also think of issues as impediments, action items, open items, punch lists, logs, or
concerns. Over time, if you do not resolve or close open issues or issues placed on hold,
they can become risks.
Issue codes enable you to organize and categorize issues in a way that is meaningful to
you. For example, you can create an issue code titled Severity, and subsequently create
issue code values: High, Medium, and Low. You can assign each of these code values to
issues across multiple projects, enabling you to categorize each issue according to how
severe it is. Similarly, you can create codes to categorize issues by responsibility,
subproject, or any other classification you require to organize issues. Assigning issue
codes enables you to quickly search for and view issues according to specific criteria.
Creating Issue Codes
Create issue codes to organize project issues in a way that is meaningful to your
organization.
To create an issue code:
1) Click the Projects menu and select Enterprise Project Data, or click the
Administer menu and select Enterprise Data.
2) In the Enterprise Data pane, expand Issues and click Issue Codes.
3) On the Issue Codes page:
a. Click Add Code.
b. In the Name field, enter a unique name for the issue code.
c. Mark the Secure option to make the code read-only for users without the
necessary security privileges to make changes.
d. Click Save (Ctrl+S).
Tips
You can designate an issue code as secure only if you have the appropriate security
privilege; otherwise, this option does not appear.

Administration
507
Creating Issue Code Values
Create issue code values to represent variations within the larger scope of the issue
code.
To create an issue code value:
1) Click the Projects menu and select Enterprise Project Data, or click the
Administer menu and select Enterprise Data.
2) In the Enterprise Data pane, expand Issues and click Issue Codes.
3) On the Issue Codes page:
a. Select a code.
b. Click Add Code Value.
Note: The code value will be added to the selected issue code.
c. Move the issue code value to the correct location in the list and hierarchical
position by clicking the Move Up (Ctrl+Alt+Up), and Move Down
(Ctrl+Alt+Down) arrows.
d. In the Name field, double-click and type a unique code value.
e. In the Description field, double-click and type a brief narrative about the issue
code value.
4) Click Save (Ctrl+S).
Tips
Issue code values at the same level are siblings. Subordinate issue code values are
children.
About Document Categories and Statuses
Document category and status designations can help you track project work products
and documents. For example, document category designations can identify documents
that are project standards or project deliverables. Document status designations can
identify which documents are in review or completed.
Creating Document Categories
Create document categories to organize documents. Each category serves as a folder
for easy retrieval of the document.
To create document categories:
1) Click the Projects menu and select Enterprise Project Data, or click the
Administer menu and select Enterprise Data.
2) In the Enterprise Data pane, expand Documents and click Document Categories.
3) On the Document Categories page:

508
a. Click Add (Insert).
b. In the Name field, enter a name.
c. Click Save (Ctrl+S).
Tips
To change a name of a category, double-click the selected name and enter a new
name. If you change a document category's name, the change is applied to all
document assignments.
To change the order in which a document category is displayed, select it, then click
the Move Up or Move Down arrows.
Creating Document Statuses
Create document statuses to identify the current status of work products and documents
within a project.
To create a document status:
1) Click the Projects menu and select Enterprise Project Data, or click the
Administer menu and select Enterprise Data.
2) In the Enterprise Data pane, expand Documents and click Document Statuses.
3) On the Document Statuses page:
a. Click Add (Insert).
b. In the Name field, double-click and type a name.
c. Click Save (Ctrl+S).
Tips
To change a status type, double-click it, then type a new name. The change applies to
all projects to which the document is assigned.
About Currencies
Currencies are the monetary units used to store costs for all projects in the database.
Monetary units are stored in the database with a base currency that you select. The base
currency is used to display costs in windows and dialog boxes. If you select a different
currency than the base currency to view costs, the exchange rate for the base currency
is always 1.0. The base currency value is multiplied by the current exchange rate for the
view currency to calculate the values displayed in cost fields. For example, if the base
currency is U.S. Dollars, the view currency is Euros, and the exchange rate for Euros is .75,
a value of 10 dollars is displayed as 7.5 Euros in cost fields for windows and dialog boxes.
Similarly, if you enter 7.5 Euros in a cost field, it is stored in the database as 10 dollars.
Admin Superusers and users with the 'Edit Currency' privilege can change the base
currency and define additional view currency types. When you enter values in cost and
price fields, they are always displayed in the user's view currency.

Administration
509
Adding a Currency
To add a currency:
1) Click the Administer menu and select Enterprise Data.
2) In the Enterprise Data pane, expand Global and click Currencies.
3) On the Currencies page:
a. Right-click on a row and choose Add (Insert).
b. In the new row added at the bottom of the list, specify the appropriate values for
the new currency.
c. Click Save (Ctrl+S).
Defining a Base Currency
The base currency is U.S. dollars by default. The exchange rate for the base currency is
always one.
To define a different currency as the base:
1) Click the Administer menu and select Enterprise Data.
2) In the Enterprise Data pane, expand Global and click Currencies.
3) On the Currencies page:
a. Select the row that has BASE RATE in the Exchange Rate field.
b. Double-click in the ID, Name, and Currency Symbol fields and enter the base
currency's information.
For example, if you want the pound to be the new base currency, you can type in
U.K. for the ID, British Pound for the name, and £ for the currency symbol.
c. Display other fields, such as decimal digits and positive format, and edit as
needed.
4) Click Save (Ctrl+S)
About Financial Periods
Financial periods are predefined time periods you can apply to financial or scheduling
data throughout the application to consistently measure and compare that data.
Customized financial periods provide more accurate display and reporting of actual
costs and units according to time increments recognized by your finance and
accounting staff. Users can focus on a financial period and pinpoint how actual costs
were incurred during that time.
A calendar year with 355 days, a fiscal quarter ending July 15, and a week from Sunday
to Saturday are all examples of financial periods.

510
You must have the Add/Edit/Delete Financial Period Dates global privilege to create,
modify, or remove data in the Financial Periods dialog box. To store past period actuals
for a project’s defined financial periods, you must have the Store Period Performance
and Add/Edit Activities Except Relationships project privileges. To edit past period actual
data in P6 Professional after storing period performance, users must have the Edit Period
Performance project privilege.
Creating Financial Periods
Create financial periods to measure and compare financial data. You can create
annual, monthly, or weekly periods.
To create a financial period:
1) Click the Administer menu and select Enterprise Data.
2) In the Enterprise Data pane, expand Global and click Financial Periods.
3) On the Financial Periods page:
a. Click the Add icon.
b. To change the default name for the new financial period, click the Name field,
and enter a name.
c. To change the Start Date field, directly enter a new date, or select a date from the
common calendar tool.
d. To change the Finish Date field, directly enter a new date, or select a date from
the common calendar tool.
4) Click Save (Ctrl+S).
Tips
To save time, consider generating financial periods in a batch rather than
individually. To create a financial period batch see Creating a Financial Period Batch
(on page 511).
Although the application will alert you in each case, be aware of the following
constraints when creating or configuring financial periods:
You cannot introduce gaps in a series of financial periods. Any new periods you
create must start or end flush with any existing entries. For example, if October 7-13
and October 14-20 are existing financial periods, you can create a new one that
either ends on October 6 or starts on October 21.
You cannot overlap financial periods. In order to serve their purpose, financial periods
must represent unique slices of time.
You can create financial periods with a duration of fewer than seven days (one
week); however, you cannot view them in timescales in P6. Use P6 Professional if you
need to view data by financial periods spanning increments of fewer than seven
days (one week).

Administration
511
Creating a Financial Period Batch
You can create annual or quarterly periods one at a time; however, to speed the time
required to add monthly or weekly periods, consider using the Generate Financial Period
Batch feature.
To create a financial period batch:
1) Click the Administer menu and select Enterprise Data.
2) In the Enterprise Data pane, expand Global and click Financial Periods.
3) On the Financial Periods page, click Add Batch.
4) In the Generate Financial Periods dialog box:
a. In the Batch Start Date field, click Select Batch Start Date and select a date from
the calendar or type a start date.
Note: For example, the 31st of January 2010 would be 31-Jan-10.
b. In the Batch Finish Date field, click Select Batch Finish Date and select a date
from the calendar or type a start date in day-month-year format.
c. Select a Period Cycle and use the up and down arrows to specify a number of
weeks or months.
d. Click Create.
5) In the Primavera P6 alert dialog box, click OK to acknowledge that one new financial
period has been created.
6) On the Financial Periods page:
a. In the Name field, double-click and type a name.
b. Click Save (Ctrl+S).
Tips
Although you are alerted in each case, be aware of the following constraints when
creating or configuring financial periods:
You cannot introduce gaps in a series of financial periods. Any new periods you
create must start or end flush with any existing entries. For example, if October 7-13
and October 14-20 are existing financial periods, you can create a new one that
either ends on October 6 or starts on October 21.
You cannot overlap financial periods. In order to serve their purpose, financial periods
must represent unique slices of time.
You can create financial periods with a duration of fewer than seven days (one
week); however, you cannot view them in timescales in P6. Use P6 Professional if you
need to view data by financial periods spanning increments of fewer than seven
days (one week).

512
About Overhead Codes
Overhead codes provide P6 Progress Reporter users with a way to categorize their time.
When applied on their timesheets, the codes help users log hours that are not associated
with project activities. For example, users can enter time for vacations, holidays, sick time,
or general administrative work.
Creating Overhead Codes
Create overhead codes for P6 Progress Reporter users to add overhead activities to their
timesheets to log timesheet hours that are not associated with the project.
To create an overhead code:
1) Click the Administer menu and select Enterprise Data.
2) In the Enterprise Data pane, expand Global and click Overhead Codes.
3) On the Overhead Codes page:
a. Click Add (Insert).
b. In the Name field, double-click and type a unique code.
c. In the Description field, double-click and type a unique name.
d. Click Save (Ctrl+S).
Tips
When you specify that two approval levels are required to approve timesheets,
timesheets that contain only overhead activities bypass project manager approval and
are sent directly to the resource/cost manager for approval. For timesheets containing a
mix of regular and overhead activities, project managers can view, but not approve, the
overhead activities.
About Timesheet Periods
The timesheet period is the amount of time a timesheet covers. The administrator defines
the time covered by timesheet periods; for example, every two weeks, every four weeks,
or every month. The administrator must create timesheet periods before the user can
view and enter time on their timesheets.
Creating Timesheet Periods
Use timesheet periods to create ranges for your timesheets.
To create a timesheet period:
1) Click the Administer menu and select Enterprise Data.
2) In the Enterprise Data pane, expand Global and click Timesheet Periods.
3) On the Timesheet Periods page:
a. Click Add (Insert).

Administration
513
b. In the Start Date field, double-click, click the down arrow, and select a date.
c. In the End Date field, double-click, click the down arrow, and select a date.
d. Click Save (Ctrl+S).
About Resource and Role Rate Types
The rate type determines the price per unit used to calculate costs for the assignment. In
today's global economy, different resources and roles command varying levels of pay.
Moreover, those rates can change over time. The price per unit, or rate, applied to a
resource or role assignment for an activity is determined by that assignment's specific
Rate Type or Rate Source field values.
A rate type is a user-defined title for a specific price-per-unit of work. Up to five global
user-defined rate types can be defined as part of your enterprise data settings. Examples
of rate types include Standard, Internal, External, Hourly, Weekly, and Special. To illustrate
how they are used, a resource might be assigned at an Hourly rate of $175 per hour but
for other assignments the same resource might be assigned at a Weekly rate of $5,000
per week or $125 per hour.
Configuring Resource and Role Rate Types
Configure resource and role rate type titles to determine what is displayed whenever the
rate types are displayed in a list or column.
1) Click the Resources menu and select Enterprise Resource Data, or click the
Administer menu and select Enterprise Data.
2) In the Enterprise Data pane, expand Resources and click Rate Types.
3) On the Resource and Role Rate Types page:
a. Double-click a User Defined Title field and type a rate type title.
Note: For example, you might want to define two rate types as
Commercial Rate and Government Rate.
b. Click Save (Ctrl+S).
About Resource Codes
Resource codes provide another way to categorize project resources. Grouping by
resource codes enables you to quickly see activities assigned to an area of responsibility
and activities being performed by a specific group in your organization.
Creating Resource Codes
Create resource codes to group and arrange resources.
To create resource codes:

514
1) Click the Resources menu and select Enterprise Resource Data, or click the
Administer menu and select Enterprise Data.
2) In the Enterprise Data pane, expand Resources and click Resource Codes.
3) On the Resource Codes page:
a. Click Add Code (Insert).
b. Move the code to the correct location in the list by clicking the Move Up
(Ctrl+Alt+Up) and Move Down (Ctrl+Alt+Down) arrows.
c. In the Name field, click and type a code.
d. In the Maximum Length field, double-click and click the up and down arrows to
specify a maximum code value length.
e. In the Secure field, double-click to mark the option to make the code read-only for
users without the necessary security privileges to make changes.
Note: You can designate a resource code as secure only if you
have the appropriate security privilege; otherwise, this option does
not display.
f. Click Save (Ctrl+S).
Creating Resource Code Values
Create resource code values to represent variations within the larger scope of the
resource code.
To create resource code values:
1) Click the Resources menu and select Enterprise Resource Data, or click the
Administer menu and select Enterprise Data.
2) In the Enterprise Data pane, expand Resources and click Resource Codes.
3) On the Resource Codes page:
a. Select a code.
b. Click Add Code Value.
Note: The code value will be added to the selected resource
code.
c. Move the code value to the correct location and hierarchical position by clicking
the Move Up (Ctrl+Alt+Up), Move Down (Ctrl+Alt+Down), Move Left
(Ctrl+Alt+Left), and Move Right (Ctrl+Alt+Right) arrows.
d. In the Name field, double-click and type a code value.
Note: The code value cannot be longer than the maximum length
specified by the resource code.

Administration
515
e. In the Description field, double-click and type a brief narrative about the code
value.
f. Click Save (Ctrl+S).
About Resource Curves
Resource curves allow the user to specify the allocation of resources and costs over the
duration of an activity. Resource units and costs are distributed evenly throughout an
activity unless you specify nonlinear distribution using resource curves.
Defining Resource Curves
Define resource curves to specify how you want resource units or costs spread over the
duration of an activity. There are twelve default resource curves defined in the
application. You can add a new curve, which is based on the default linear curve, or
copy and modify one of the default resource curves or an existing Global curve to
create a custom global resource curve.
To define a custom resource curve:
1) Click the Resources menu and select Enterprise Resource Data, or click the
Administer menu and select Enterprise Data.
2) In the Enterprise Data pane, expand Resources and click Resource Curves.
3) On the Resource Curves page, you can copy an existing curve to use as a base for
defining a new curve or add a new curve. The new curve defaults to a linear curve.
To copy an existing curve:
1. In the Name field, expand the Default group, or the Global group if you have
an existing resource curve to use, and select an existing curve to copy the
curve value percentages.
2. Click Copy (Ctrl+C).
3. Click the Global field and click Paste (Ctrl+V).
To add a new curve, click Add (Insert).
4) On the Resource Curves page, in the Name field under the Global group,
double-click and type a name for the resource curve.
5) On the Curves detail window:
a. Edit the curve value percentages to create a curve that indicates how your
costs/units should distribute over time. Curves are defined by 21 points (at 5%
intervals from 0 to 100).
b. Click Prorate to make the total of the distribution values equal to 100% while
maintaining the shape you specified.
6) On the Resource Curves page, click Save (Ctrl+S).

516
About Units of Measure
A unit of measure is a standardized way to define a unit of time or material. You can
change units of measure in a project to alter how materials such as graphs and
spreadsheets are depicted. You can also modify the list of unit of measure abbreviations
that the application refers to for conversions.
Creating Units of Measure
Create units of measure labels to assign to material resources.
To create units of measure:
1) Click the Resources menu and select Enterprise Resource Data, or click the
Administer menu and select Enterprise Data.
2) In the Enterprise Data pane, expand Resources and click Units of Measure.
3) On the Units of Measure page:
a. Click Add (Insert).
b. In the Unit Abbreviation field, double-click and type an abbreviation.
c. In the Unit Name field, double-click and type a name for the unit.
d. Move the unit of measure to a different location in the list by clicking the Move
Up (Ctrl+Alt+Up) and Move Down (Ctrl+Alt+Down) arrows.
e. Click Save (Ctrl+S).
About User Access
User access helps you create user accounts, assign access, manage the organizational
breakdown structure (OBS) and configure profiles. The User Access page presents a list of
tabs:
Users: Presents options to modify security attributes and project and module access for
all users of P6 EPPM modules.
OBS: Presents options to configure the OBS hierarchy.
Global Security Profiles: Presents options to assign or omit global privileges to profiles.
Project Security Profiles: Presents options to assign or omit project privileges to profiles.

Administration
517
About Users
The Users page allows you to add and remove users, assign global and project profiles to
users, access resources, and assign or remove access to projects and P6 EPPM products.
For example, you can make users an Admin Superuser, giving them read/write privileges
for application-wide information and features, or you can assign a user no global
privileges. You can assign module access and allow the users to access only the modules
you want them to access, and you can use the project access tab to assign responsible
managers and give them security profiles, such as Administrator.
The Default Admin Superuser
For security reasons, Oracle strongly recommends that you replace the default
Admin Superuser (admin) in P6 immediately after a manual database installation or an
upgrade from P6 version 7.0 and earlier. Since P6 requires that at least one Admin
Superuser exists at all times, execute the procedures below in the order specified.
Follow the steps in Creating Users (see "Creating User Accounts for P6 EPPM" on page
517) to create a new user.
Follow the steps in Assigning Global Security Profiles (on page 520) to assign "Admin
Superuser" as the global profile for the new user.
Follow the steps in Assigning Module Access (on page 520) to assign at least one of
the following module access rights: Portfolios, Projects, or Resource.
Delete the original Admin Superuser, "Admin" by default.
Creating User Accounts for P6 EPPM
Follow these steps to create new user accounts for applications in P6 EPPM including P6,
P6 Professional, and P6 Progress Reporter. These steps represent the minimum you must
do to create a user account. To configure a user account, see Configuring User Access
(on page 519).
To create a new user account:
1) Click the Administer menu and select User Access.
2) On the User Access page, click Users.
3) On the Users page, click the Add icon.
4) What appears next depends on your security configuration:
a. If P6 is running in native authentication mode, the Add User dialog box will appear:
1. Fill in the Login Name, Personal name, Password, and Confirm Password fields.
2. Click Add.
3. If the ability to edit a personal resource calendar or access to P6 Progress
Reporter is required, you can select an Associated Resource in the Users table
at this time, or you can create the link when you add resources.

518
4. In the Users table, add the columns for e-mail address and telephone number
(if not already present), and enter the appropriate data.
5. Click Save.
Notes:
Your user name can be a maximum of 30 characters.
The assigned Global Security Profile will determine the location
of the user in the Users tab hierarchy.
When the Password Policy is disabled in Application Settings,
the password must be between 1 and 20 characters. P6 EPPM
does not allow blank passwords.
When the Password Policy is enabled in Application Settings,
the password must be between 8 and 20 characters and
contain at least one number and one letter.
b. If P6 is running in SSO or LDAP authentication mode, the Add Users from LDAP
dialog box appears for you to provision users from the LDAP repository:
Note: You must have the Add/Edit/Delete Users privilege and the
Provision Users from LDAP privilege to search the LDAP directory.
You do not need the Provision Users from LDAP privilege to import
users from an LDIF file.
1. Either click the Load LDIF button, or enter an LDAP query (for example, uid=*)
under Search users. If a search was previously performed by a user with the
privilege to search the LDAP directory, the last query entered by that user will
appear.
2. If you clicked the Load LDIF button, browse to the location of the LDIF file, and
click Open. If you entered an LDAP query, click Search.
Note: Depending on your P6 administrative configuration settings,
you might be prompted to log into the LDAP server.
3. A list of users will appear, grouped by status. For example, LDAP repository users
that do not exactly match P6 EPPM users will be grouped together. If users exist
in the LDAP repository, the User Name, Actual Name, E-mail, and Phone fields
are populated (if you previously mapped those fields through the P6
Administrator application settings).
Note: The User Name field is equivalent to the Login Name field in
P6. The Actual Name field is equivalent to the Personal Name field.
4. Select the option next to each user account that you wish to import, or select
the option in the fields bar to select all users. New and modified users are
automatically selected.

Administration
519
5. Click Import.
Note: The new users will be assigned the default global profile.
Tips
Give each user a unique name with up to 30 alpha-numeric characters.
Oracle recommends the use of strong passwords. Strong passwords in P6 EPPM
are defined as passwords containing between 8 and 20 characters and at least one
numeric and one alpha character. To further strengthen the password, use a mixture
of upper and lower case letters.
For security reasons, Oracle strongly recommends that you replace the default
Admin Superuser (admin) immediately after a manual database installation or an
upgrade from P6 version 7.0 and earlier. For guidelines on this process, see The Default
Admin Superuser (on page 517).
Configuring User Access
For security purposes, configure user access controls to grant or deny user's access to
data.
To configure user access, select the appropriate link:
Assigning Associated Resources (on page 519)
Assigning Global Security Profiles (on page 520)
Assigning Module Access (on page 520)
Assigning Project Access (see "Assigning OBS Elements to Users" on page 521)
Assigning Resource Access (on page 521)
Tips
The Users page holds many more additional options you can use to configure user
access. For help viewing hidden columns, see Showing and Hiding Columns in a Table
(see "Showing or Hiding Columns in a Table" on page 91).
Assigning Associated Resources
Assign an associated resource to the user profile to connect the user with a resource in
the application. Each user can have only one resource assigned, and a resource cannot
be assigned to more than one user at the same time. Not all users require an associated
resource, but users must have a resource assigned to enable them to edit their personal
resource calendars and use P6 Progress Reporter. Also, by associating a resource with a
user, the user will be able to see all projects to which the resource is assigned via activities
if the user has Team Member access.
To assign an associated resource:
1) Click the Administer menu and select User Access.
2) On the User Access page, click Users.

520
3) On the Users page:
a. Select a user.
b. In the Associated Resource field, double-click and click .
4) In the Select Resource dialog box, select a resource and click Assign.
5) On the Users page, click Save.
Assigning Global Security Profiles
Every user is assigned a global security profile by default. You can change a global
security profile for every user to control user access to application-wide information.
To change the user's global security profile:
1) Click the Administer menu and select User Access.
2) On the User Access page, click Users.
3) On the Users page:
a. Select a user.
b. In the Global Security Profile field, double-click and choose a profile from the list.
Note: The assigned Global Security Profile will determine the
location of the user in the Users tab hierarchy if they are grouped
by the global profile.
c. Click Save.
Tips
You must have the appropriate privileges to assign security attributes.
An Admin Superuser is a global security profile that gives a user read/write privileges
for application-wide information and features. The Admin Superuser always has
access to all resources. If resource security is enabled, resource access settings are
not applicable. To make global information read-only for a user, choose No Global
Privileges. The No Global Privileges profile provides read-only access to all global
data except costs and secure codes.
Assigning Module Access
Assign user module access to allow or deny the user access to different parts of the
application.
To assign user module access:
1) Click the Administer menu and select User Access.
2) On the User Access page, click Users.
3) On the Users page:
a. Select a user.
b. In the Module Access field, double-click and click .

Administration
521
4) In the Module Access detail window, select options to grant access to each module
or feature set.
5) On the Users page, click Save.
Assigning OBS Elements to Users
Assign OBS elements to a user to control their access to the EPS and projects.
Caution: Users assigned to an OBS that is assigned to the root EPS
have access to all projects at all levels.
To assign OBS elements to a user:
1) Click the Administer menu and select User Access.
2) On the User Access page, click Users.
3) On the Users page, select a user.
4) In the Project Access detail window:
a. Click Add OBS.
b. In the Select Responsible Manager dialog box, select an OBS element from the list
and click Assign.
Note: The default project security profile will automatically be
assigned when the Responsible Manager is selected.
c. In the Project Access detail window, select a different project security profile, if
needed.
5) On the Users page, click Save.
Tips
You can also assign users to OBS elements using the Users Detail Window of the OBS
Page.
Project access settings are not applicable to users with the special Admin Superuser
global security profile. The Admin Superuser profile always has access to all projects.
To remove an OBS assignment, select an element in the Project Access detail window
and click Delete.
Assigning Resource Access
You can control which resources a user can access.
To control resource access:
1) Click the Administer menu and select User Access.
2) On the User Access page, click Users.
3) On the Users page:
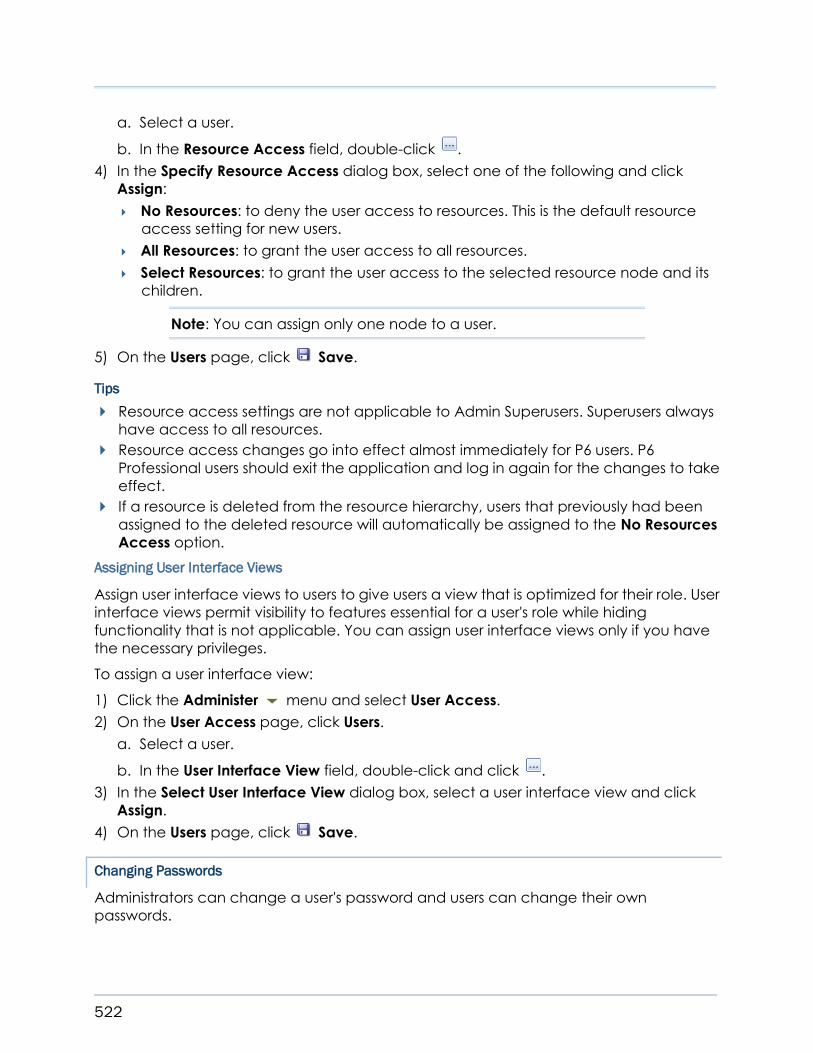
522
a. Select a user.
b. In the Resource Access field, double-click .
4) In the Specify Resource Access dialog box, select one of the following and click
Assign:
No Resources: to deny the user access to resources. This is the default resource
access setting for new users.
All Resources: to grant the user access to all resources.
Select Resources: to grant the user access to the selected resource node and its
children.
Note: You can assign only one node to a user.
5) On the Users page, click Save.
Tips
Resource access settings are not applicable to Admin Superusers. Superusers always
have access to all resources.
Resource access changes go into effect almost immediately for P6 users. P6
Professional users should exit the application and log in again for the changes to take
effect.
If a resource is deleted from the resource hierarchy, users that previously had been
assigned to the deleted resource will automatically be assigned to the No Resources
Access option.
Assigning User Interface Views
Assign user interface views to users to give users a view that is optimized for their role. User
interface views permit visibility to features essential for a user's role while hiding
functionality that is not applicable. You can assign user interface views only if you have
the necessary privileges.
To assign a user interface view:
1) Click the Administer menu and select User Access.
2) On the User Access page, click Users.
a. Select a user.
b. In the User Interface View field, double-click and click .
3) In the Select User Interface View dialog box, select a user interface view and click
Assign.
4) On the Users page, click Save.
Changing Passwords
Administrators can change a user's password and users can change their own
passwords.

Administration
523
Administrators: See Changing User Passwords (on page 523).
Users: See Changing Your Own Password (on page 455).
Changing User Passwords
Administrators can change users' passwords.
To change a user password:
1) Click the Administer menu and select User Access.
2) On the User Access page, click the Users tab.
3) On the Users tab:
a. Select a user.
b. Click Change Password.
4) In the Change Password dialog box:
a. In the New Password field, enter a new password.
Notes:
When the Password Policy is enabled in Application Settings,
the password must be between 8 and 20 characters and
contain at least one number and one letter.
When the Password Policy is disabled in Application Settings,
the password must be between 1 and 20 characters. P6 EPPM
does not allow blank passwords.
b. In the Confirm New Password field, enter the new password again for verification
and click OK.
5) On the Users tab, click Save.
Tips
You cannot change passwords if you are running P6 EPPM in LDAP or SSO authentication
mode.
Counting Users
As an aid in determining whether you have reached licensing limitations, use the Count
feature to view the number of users assigned access to each P6 EPPM module:
1) Click the Administer menu and select User Access.
2) On the User Access page, click Users.
3) In the Users tab, click Count.
4) In the Count dialog box, view the user count by module.
a. If needed, click Export to Excel or Print to create an output of the results.

524
About the OBS
The organizational breakdown structure (OBS) is a hierarchical way to represent the
managers responsible for the projects in your enterprise. You can associate the
responsible managers with their areas of the enterprise project structure (EPS) with either
an EPS node or a project. When you associate a responsible manager with an EPS node,
any projects you add to that branch of the EPS are assigned that manager element by
default. An OBS supports large projects that involve several project managers with
different areas of responsibility.
To access a project, a user must have access permissions for an OBS element within the
project. You can then assign users to OBS elements. When you assign users to OBS
elements, users get access privileges to projects and EPS nodes where they have OBS
access. The type of access granted to a user is determined by the project security profile
assigned to the user.
Creating an OBS
Create an organizational breakdown structure (OBS) to hierarchically represent the
managers responsible for your projects. You must have the appropriate privileges to
create an OBS.
To create a new OBS:
1) Click the Administer menu and select User Access.
2) On the User Access page, click OBS.
3) On the OBS page:
a. Click Add.
Note: The OBS is automatically added as a child of another OBS.
b. Move the OBS to the correct location in the list and hierarchical position by
clicking the Move Up, Move Down, Move Left, or Move Right arrows.
c. In the OBS Name field, double-click and type a unique name.
d. Click the Users detail window.
4) In the Users detail window, remove or assign users to the OBS.
To remove a user from the OBS, select a user and click the Delete icon.
To assign a user to the OBS, click the Add icon.
5) In the Select Users dialog box, select a user and click OK.
6) On the OBS page, click Save.
Tips
When you set up enterprise project structure (EPS) nodes, a root OBS is automatically
assigned to the root EPS.
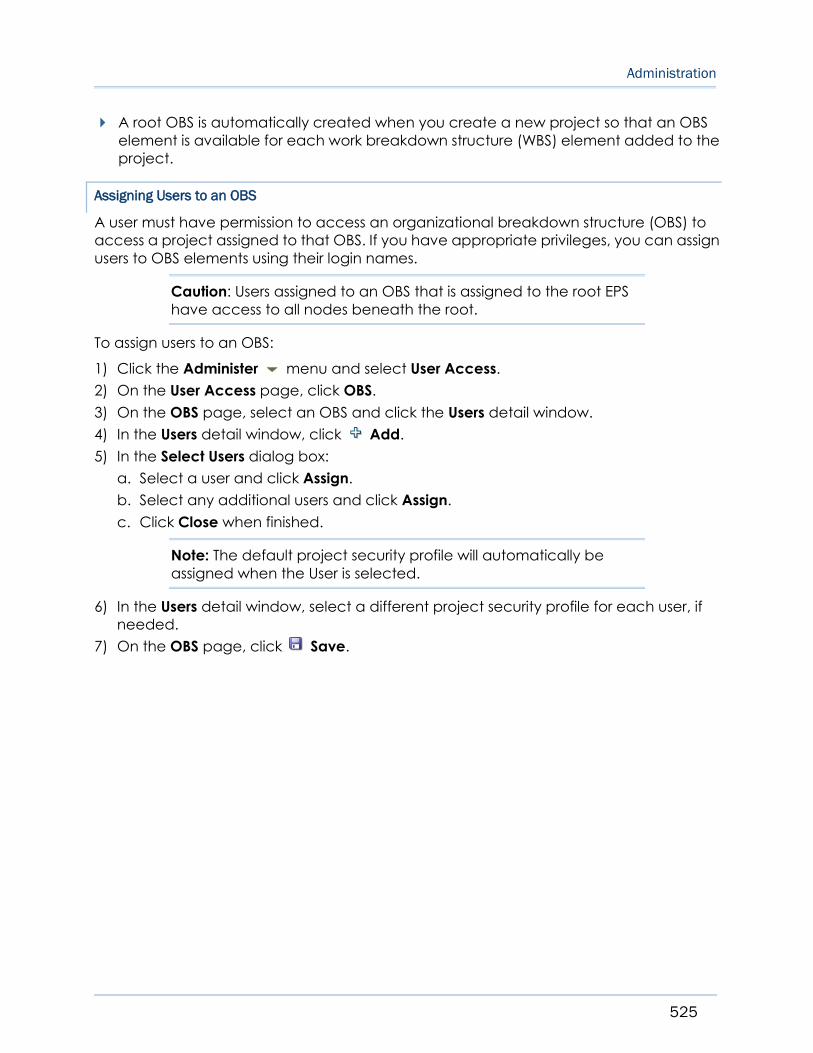
Administration
525
A root OBS is automatically created when you create a new project so that an OBS
element is available for each work breakdown structure (WBS) element added to the
project.
Assigning Users to an OBS
A user must have permission to access an organizational breakdown structure (OBS) to
access a project assigned to that OBS. If you have appropriate privileges, you can assign
users to OBS elements using their login names.
Caution: Users assigned to an OBS that is assigned to the root EPS
have access to all nodes beneath the root.
To assign users to an OBS:
1) Click the Administer menu and select User Access.
2) On the User Access page, click OBS.
3) On the OBS page, select an OBS and click the Users detail window.
4) In the Users detail window, click Add.
5) In the Select Users dialog box:
a. Select a user and click Assign.
b. Select any additional users and click Assign.
c. Click Close when finished.
Note: The default project security profile will automatically be
assigned when the User is selected.
6) In the Users detail window, select a different project security profile for each user, if
needed.
7) On the OBS page, click Save.

526
About Security Profiles
A security profile is a collection of security permissions. There are two types of security
profiles: global security profiles and project security profiles. A global security profile
determines the user's access to application-wide information. The global security profile
provides read-only access to all global data except cost and resource data. Privileges
can be added to global security profiles to allow users to add, edit, and delete global
data, and view global cost data. A project security profile determines the user's level of
access to each project within the enterprise project structure. When you assign a project
security profile to a user, you also associate the project security profile with an
organizational breakdown structure (OBS) element/responsible manager. When an OBS
node is assigned to a user, the default project security profile is automatically assigned.
The user's access privileges, as defined in the project security profile, will then apply only
to those elements of the enterprise project structure (EPS) that are assigned to the OBS
element/responsible manager you selected.
P6 Professional and P6 require that all users have a global security profile. As an
administrator, you create global security profiles and assign individual access privileges
associated with them. To control access to global information, you create global security
profiles, and then assign them to individual users. If you want to give users access to all
global information, create a global security profile with all privileges.
You can also choose to assign the Admin Superuser global security profile. Admin
Superuser is an application-generated global security profile. You cannot edit the Admin
Superuser profile. One user must have the Admin Superuser profile, and you can assign
Admin Superuser profiles to as many people as you want, though you should limit the
number of users you assign to it. An Admin Superuser can add, edit, and delete
information by default, where all other users will have to be assigned the proper
privileges to do so.
To allow users to only see certain project information, you can create project security
profiles. A project security profile defines a set of privileges for access to project
information. You create project security profiles, then assign these profiles and specific
OBS elements to users. The assigned OBS element determines the EPS and work
breakdown structure (WBS) elements where the user can access project information. The
assigned project security profile determines the type of access privileges the user has to
that project information.

Administration
527
The application requires that all WBS elements have an assigned responsible OBS. If a
user's project security profile assignment includes a WBS element's responsible OBS, then
the user can access all activities, risks, and issues related to that WBS element. Similarly,
project issues also have an assigned responsible OBS. If a user's project security profile
assignment includes an issue's responsible OBS, then the user can access that issue. You
can assign a project security profile called Project Superuser, if you want to give a user
access to all information belonging to a project. You can assign Project Superuser profiles
to as many people as you want. Project Superuser is an application-generated project
security profile. You cannot edit the Project Superuser profile. A Project Superuser can
add, edit, and delete information by default, where all other users will have to be
assigned the proper privileges to do so.
Working with Security Profiles
Global Security Profiles:
A global security profile determines a user’s access to application-wide information and
settings, such as resources, global codes, and the OBS. P6 requires that you assign a
global security profile to each user.
You can define an unlimited number of global security profiles in P6. In addition, P6
provides two predefined global security profiles: Admin Superuser and No Global
Privileges.
The Admin Superuser profile allows complete access to all global information and all
projects. It also shows the full Administer menu, even when the currently assigned user
interface view settings do not. For the pages and menus of the other sections, even
for users with the Admin Superuser profile, the current user interface view settings still
apply. The Admin Superuser profile is assigned to the application (administrative) user
created during the P6 EPPM database installation.
For security reasons, Oracle strongly recommends that you replace the default
Admin Superuser (admin) immediately after a manual database installation or an
upgrade from P6 version 7.0 and earlier. Also, limit the Admin Superuser assignment to
only those individuals who require access to all data. At least one user must be
assigned to the Admin Superuser profile. If only one user is assigned to this profile, P6
will not allow that user to be deleted.
The No Global Privileges profile restricts access to global data. Assign this profile to
anyone who is strictly a P6 Progress Reporter user and does not require access to P6
Professional or P6. If a user with rights to P6 Professional or P6 is assigned this profile, the
user can log in to these applications but will not have access to project data and will
have read-only access to global data. If a user is assigned this profile and is also
assigned to an OBS element, the user will have access to project data as defined for
the OBS element, but access to other global data is restricted.

528
The Admin Superuser can designate that users have the ability to add/delete, edit,
assign, or view secure codes. Secure codes enable privileged users to hide Project,
Activity, Resource, and Issue codes from users that do not have security privileges to view
them. Also, users with privileges to Edit Security Profiles can restrict other users to edit,
assign, and view privileges. For example, management could track project approval
processes through secure codes that others cannot edit or, in some cases, view.
Tip
When defining each global security profile, some privileges are structured hierarchically.
In other words, if a user is granted add or delete privileges, that user automatically has
edit, assign, and view privileges. If a user is granted edit privileges, that user is
automatically granted assign and view privileges. If a user is granted assign privileges,
that user is automatically assigned view privileges.
Project Security Profiles:
A project profile is a role-based profile that limits privileges to specific project data, such
as baselines, the WBS, and expenses. P6 does not require that each user be assigned a
project profile; however, users cannot access projects unless they are assigned a project
profile or the global profile, Admin Superuser.
You can create an unlimited number of project profiles in P6. In addition, P6 provides a
predefined project profile called Project Superuser. The Project Superuser profile allows
complete access to elements within a project. For security reasons, limit the Project
Superuser assignment to only those individuals who require access to all project data.
Project profiles are applied to users via OBS assignments. P6 requires that all EPS and WBS
elements, and projects, are assigned a responsible OBS. The combination of the project
profile/user assignment to an OBS assignment, and the OBS assignment to the EPS/WBS,
determines which projects and data the user can access. The default profile is
automatically assigned when an OBS is assigned to a user.
Tip
When defining each project profile, some privileges are structured hierarchically. In other
words, if a user is granted add or delete privileges, that user automatically has edit,
assign, and view privileges. If a user is granted edit privileges, that user is automatically
granted assign and view privileges. If a user is granted assign privileges, that user is
automatically assigned view privileges.
Creating Global Security Profiles
Create a global security profile to determine user access to application-wide
information.
To create a global security profile:
1) Click the Administer menu and select User Access.
2) On the User Access page, click Global Security Profiles.

Administration
529
3) On the Global Security Profiles page:
a. Click Add.
b. In the Profile Name field, double-click and type a unique name.
c. In the Description field, double-click and type a description.
d. In the Default field, select the option if you want this profile to be the new default.
e. Click each detail window and select options to assign privileges to the profile.
Note: Select the Privilege option in the detail window's header to
assign all privileges in the window. Clear the Privilege option to
disable all privileges in the window.
4) On the Global Security Profiles page, click Save (Ctrl+S) .
Tips
Provide clear profile names and descriptions to help you manage profiles.
Create a default global profile with few or no privileges.
To save time, consider copying, pasting, and then modifying a profile: select the
closest matching profile and click Copy. All privilege options are also copied. Click
Paste. The new profile will appear with a unique name based on the original. For
example, if you copied PM Set, the copy is named PM Set-1.
Creating Project Security Profiles
Create a project security profile to determine a user's level of access to each project
within the enterprise project structure. A user can only access projects they have been
assigned.
To create a project security profile:
1) Click the Administer menu and select User Access.
2) On the User Access page, click Project Security Profiles.
3) On the Project Security Profiles page:
a. Click Add.
b. In the Profile Name field, double-click and type a unique name.
c. In the Description field, double-click and type a description.
d. In the Default field, select the option if you want this profile to be the new default.
e. Click each detail window and select options to assign privileges to the profile.
Note: Select the Privilege option in the detail window's header to
assign all privileges in the window. Clear the Privilege option to
disable all privileges in the window.
4) Click Save (Ctrl+S).

530
Tips
Provide clear profile names and descriptions to help you manage profiles.
Create a default project profile with few or no privileges.
To save time, consider copying, pasting, and modifying an existing profile: select the
closest matching profile and click Copy. All privilege options are also copied. Click in
the list and click Paste. The new profile will appear with a unique name based on the
original. For example, if you copied PM Set, the copy is named PM Set-1.
About User Interface Views
A user interface view is a pre-configured set of options you assign to users so their view of
Dashboards, Portfolios, Projects, Resources, and Administration is optimized for their role.
User interface views permit visibility to features essential for a user's role while hiding
functionality that is not applicable.
When creating a user interface view, you can choose to create a new user interface
view and configure the view from scratch, or you can choose to use an existing view as a
template and make any necessary adjustments. For each user interface view, you can
choose the pages and menu items you want to display, and the order in which they
appear in each section. Users with the same or similar roles would likely be assigned
parallel views.
To further enhance a role-specific configuration, you can assign global dashboards and
multi-user dashboards created by you to a user interface view. If you assign a multi-user
dashboard to a user interface view, only users who have access to the dashboard as
specified on the Access tab of the Create Dashboard page can view the dashboard.
Users who have access to Manage Dashboards (in the Dashboards menu) enabled in
their view can use the Manage Dashboards page to create dashboards and choose
which dashboards are displayed on their dashboards home page.
After creating user interface views that correspond to the roles in your organization, you
can assign users to the views. When assigning users to each user interface view, you can
allow users to edit the options you defined. Users who have the right to edit user interface
views can modify their views to suit their needs. Once you assign users to views, users can
view their settings on the View Preferences tab. The View Preferences tab is not available
to users with Team Member access. You can also select a default view for all new users
who are not yet assigned a view.
Access that an administrator grants a user always takes precedence over settings
specified in the user's assigned interface view. For example, if a user’s assigned view
provides access to items in the Resources section but the user does not have module
access to the Resources section, the user will not be able to access this section.
Working with User Interface Views
Administrators:

Administration
531
When creating a User Interface View, you can choose to configure the view from
scratch, or you can use an existing view as a template and adjust it as necessary. For
each user interface view, you choose the pages and menu items you want to display
and the order in which they appear in each section.
You can assign global and multi-user dashboards to a user interface view. Users can
customize their own views, within bounds set by their administrators, and can use the
Manage Dashboards page to create custom dashboards displayed on the Dashboards
home page.
After creating user interface views that correspond to the roles in your organization, you
can assign users to the views. When assigning users to each user interface view, you can
designate that users can edit the options you define for a user interface view. You can
also select a default view for all new users who are not yet assigned a view. Existing users
who are not yet assigned a view can access all functionality.
Once you assign users to views, users can view their view settings on the View
Preferences tab.
Users:
Your P6 administrator can select the pages and menu items available to you, and the
order in which the items appear in each section. For example, if you are a Resource
Manager with module access rights to all sections of the application, but your role is
limited to planning resource allocation and assigning resources to activities, your
administrator can create a user interface view that:
In the Projects section, provides access to the Workspace, Team Usage, and Activities
pages; hides all menu items and all other pages.
In the Resources section, provides full access to tabs and menu items.
In the Portfolios section, provides access to only the Capacity Planning page.
In the Dashboards section, provides access to all menu items (except for the Approve
Timesheets menu item because your organization does not use timesheets), as well as
some global dashboards and multi-user dashboards configured by your
administrator.
Note: For additional information on User Interface Views see the P6
EPPM Administrator's Guide.
Creating User Interface Views
Create a user interface view to optimize user to module interaction. The user interface
view permits visibility to features essential for a role while hiding functionality that is not
applicable. You can choose to create a brand new user interface view or modify an
existing view.
To create a user interface view:
1) Click the Administer menu and select User Interface Views.

532
2) On the User Interface Views page, click Create User Interface View.
3) On the Copy from Existing User Interface View dialog box:
a. Choose New User Interface View to create a new user interface view, or select an
existing user interface view to use as a starting point.
b. Click OK.
4) On the Create User Interface View page, click the Content tab:
a. Enter a unique name for the new user interface view.
b. Expand each section and select options for menu items and pages you want to
include in the view.
If you select the option next to Menu Items or Pages, all items will be
included in the view. Conversely, if you clear the option, none of those items
will be displayed in the view.
Click the Move Down or Move Up to configure the sequence of
items. The first item listed in each section is designated as the first page for
that section. For example, if Activities is the first item listed for Projects Tab
Icons, when a user opens a project, the Activities page will be displayed
automatically.
5) On the Create User Interface View page:
a. Click the Activity Editing tab.
b. Expand each section and select the option in the Edit field to allow the user to edit
that section.
If you select the option next to the name of the section, all items in that
section will be editable. Global Activity Codes, EPS Activity Codes, Project
Activity Codes, and User Defined do not have the select all option; you must
select each code individually.
6) On the Create User Interface View page, click the Users tab:
a. Select a user from the Available Users window to assign the user to that view.
Click Select to move the user to the Selected Users column.
Select the Allow Editing option to enable the user to edit the contents of
their interface view.
b. Select a user from the Selected Users window to remove the user from that view.
Click De-select to remove the user.
7) Click Save and Close.
Tips
Users can view their interface view settings on the My Preferences page View tab.
Continue to configure views over time in line with changing roles, capabilities,
features, and organizational needs.
You can quickly add users to a user interface view by double-clicking their name in
the Available Users column. Likewise, you can remove users from a view by
double-clicking their name in the Selected Users window.

Administration
533
You can also assign user interface views on the Users page. See Assigning User
Interface Views (on page 522).
Configuring User Interface Views
Configure user interface views over time in line with changing roles, capabilities, and
organizational needs. The changes you make will affect all users assigned to the view.
To configure a user interface view:
1) Click the Administer menu and select User Interface Views.
2) On the User Interface Views page, select a view from the User Interface View for new
users list to designate it as the default user interface view. It will automatically be
assigned to new user accounts.
3) On the User Interface Views page, in the View Name column, select the view you
want to configure.
4) On the User Interface View Details page, click the Content tab.
5) On the Content tab:
a. In the User Interface View Name field modify the name if necessary.
b. Expand each section and mark options for the menu items and pages you want to
include in the view. Select the options labeled Menu Items or Pages to include all
its options in the view. Conversely, clear the options to deselect all of its options.
c. Click Save.
6) On the User Interface View Details page, click the Activity Editing tab.
7) On the Activity Editing tab, expand each category under the Available Columns list
and mark the Edit option to allow the user to edit the fields in that category. If
available, mark the option next to the category name to make all fields editable.
Clear the option to make all fields read-only. Click Save.
8) On the User Interface View Details page, click the Users tab.
9) On the Users tab:
a. Select a user from the Available Users list to assign to the currently selected view.
Click Select to move the user to the Selected Users list.
Mark the Allow Editing option to allow the user to set their own personal
preferences for the contents of their interface view.
b. Select a user from the Selected Users window to remove the user from that view.
Click De-select to remove the user.
10) Click Save and Close.
Tips
You must have at least one page option selected in the Projects, Resources, and
Portfolios sections on the Content tab.

534
To assign multiple users to the view on the User Interface View Details page Users tab,
press the Ctrl key as you click multiple users. You can also double-click each user
name in the Available Users list. You can quickly remove users from a view by
double-clicking their names in the Selected Users window.
Click Move Down or Move Up to configure the sequence of pages or
dashboards. The first item listed in each section is designated as the first page for that
section. For example, if Activities is the first page listed and its check box is selected
under the Projects section, when a user with this view opens a project, the Activities
page will appear automatically.

535
Access Tab of the Create Filter Dialog Box of the Assignments Page
Overview
Use this tab to configure user access for the filter.
Screen Elements
This filter is available to options
The value indicating who can access the filter.
Current User: Enables you to access the filter.
All Users: Enables all users to access the filter.
List of Users: Enables only the users you specify to access the filter.
Getting Here
1) Click Resources.
2) On the Resources navigation bar, click Assignments.
3) On the Assignments page, click Filters menu on the view toolbar or view menu
and select Add New Filter.
4) In the Create Filter dialog box, click the Access tab.
Access Tab of the Create or Modify Filter Dialog Box
Overview
Use this tab to configure user access for filters on the Activities or EPS pages.
Screen Elements
This filter is available to options
The value indicating who can access the filter.
Current User: Enables you to access the filter.
All Users: Enables all users to access the filter.
List of Users: Enables only the users you specify to access the filter.
Getting Here
1) Click Projects.
Context-Sensitive Help Topics

536
2) On the Projects navigation bar, click Activities or EPS.
3) On the Activities or EPS page:
a. Select a view from the Activity View or EPS View list.
b. Click the View menu and select Customize View....
4) In the Customize Activity View or Customize Project View dialog box, click the Filters
tab.
5) On the Filters tab, click Add New Filter or select a filter and click Modify Filter.
6) In the Create Filter or Modify Filter dialog box, click the Access tab.
Access Tab of the Customize Activity View Dialog Box
Overview
Use this tab to provide view access to the current user, all users, or a selected list of users.
Screen Elements
This view is available to options
The value indicating who can access the view.
Current User: Enables you to access the view.
All Users: Enables all users to access the view.
List of Users: Enables only the users you specify to access the view.
Getting Here
1) Click Projects.
2) On the Projects navigation bar, click Activities.
3) On the Activities page:
a. Select a view from the Activity View list.
b. Click the View menu and select Customize View....
4) In the Customize Activity View dialog box, click the Access tab.
Access Tab of the Customize Dashboard Page
Overview
Use this tab to set user access to the current dashboard.
Screen Elements
This dashboard is available to options
Determines which user accounts can access the current dashboard:
Current User: Limits access to only the current user.

Context-Sensitive Help Topics
537
All Users: Provides access to all users.
List of Users: Limits access to a specified list of users. Select the users from a
common set of controls.
Tips
You must have the appropriate security privilege to specify All Users access. You cannot
change the access setting for a multi-user dashboard created by another user.
Getting Here
1) Click Dashboards.
2) On the Dashboards page, select a dashboard.
3) On the dashboard, click Customize.
4) On the Dashboard Details page, click the Access tab.
Access Tab of the Customize Project View Dialog Box
Overview
Use this tab to provide access to the current user, all users, or selected users.
Screen Elements
This view is available to options
The value indicating who can access the view.
Current User: Enables you to access the view.
All Users: Enables all users to access the view.
List of Users: Enables only the users you specify to access the view.
Getting Here
1) Click Projects.
2) On the Projects navigation bar, click EPS.
3) On the EPS page:
a. Select a view from the EPS View list.
b. Click the View menu and select Customize View....
4) In the Customize Project View dialog box, click the Access tab.
Access Tab of the Customize Resources Assignments View Dialog Box of the Assignments
Page
Overview
Use this tab to provide access to the current user, all users, or a selected list of users.

538
Screen Elements
This view is available to options
The value indicating who can access the view.
Current User: Enables you to access the view.
All Users: Enables all users to access the view.
List of Users: Enables only the users you specify to access the view.
List of Users options:
Search field
The name of a user to find.
Available Users
The list of users who are available to access the view. Select a user or press Ctrl or Shift
and click multiple users to have access to the view. Click the arrows to move users
between the Available Users and Selected Users fields.
Selected Users
The names of users who will have access to the view after you click OK.
Customize Columns
See Customize Columns or Values.
Getting Here
1) Click Resources.
2) On the Resources navigation bar, click Assignments.
3) On the Assignments page, click View and select Customize View.
4) In the Customize Resource Assignments View dialog box, click the Access tab.
Access Tab of the Issue Forms Page
Overview
Use this tab to configure the form name and assign projects to the selected issue form.
Screen Elements
Form Name field
The name of the selected issue form.
Projects section
The projects assigned to the selected issue form.

Context-Sensitive Help Topics
539
Assign Projects link
Click to assign projects to the issue form.
Getting Here
1) Click Projects.
2) On the Projects navigation bar, click Issues.
3) On the Issues page, click Issue Forms.
4) On the Issue Forms page, click the Access tab.
Action Required Tab of the Document Reviews Portlet
Overview
Use this tab to view and approve or reject documents you have been assigned to
review.
Screen Elements
Action Required Tab toolbar
See Action Required Tab Toolbar (see "Action Required for Document Reviews
Toolbar" on page 1175).
Name field
The name of the document. For example, document category designations can
identify documents that are project standards or project deliverables.
Initiator field
The name of the user who started the review.
Date Initiated field
The date the review began.
Due Date field
The date all reviewers need to complete the review. If no due date is specified for the
review, then this field appears blank.
Getting Here
1) Click Dashboards.
2) On the Dashboards page, select a dashboard.
3) On the dashboard, expand the Document Reviews portlet and click the Action
Required tab.

540
Action Required Tab of the Workflows Portlet
Overview
Use this tab to view any workflow tasks that are waiting for you to take action or provide
input. The number in parentheses shown on the tab indicates how many tasks require
your attention. For example, if the tab displayed Action Required (3) three tasks are
awaiting input. The tasks are either assigned to you specifically, or to a group or role
defined in BPM to which you currently belong.
Note: Because two editions of BPM are supported, the actual fields
and values you see may vary from the ones described in this
documentation.
Screen Elements
Action Required for Workflows toolbar
See Action Required for Workflows Toolbar (on page 1175).
Added By field
The Personal Name of the user who created the task. For example, the initiator of the
workflow will also be listed here as the user who added tasks by way of simply starting
the workflow. This field displays the value External to P6 if the task was initiated in
another application, and not in P6.
Added Date field
The date the task was created.
Approvers field
The names of the workflow reviewers who have approved the task.
Assigned Date field
The date the task was assigned to you, your group, or your role.
Claimed By field
The Personal Name of the user currently handling a task that had previously been
broadly assigned to a group, role, or more than one user. If the user has no P6
personal name, for example, if the user only had an account in BPM, this field will
show their user ID instead.
Due Date field
The deadline for the activity prescribed by each task within a workflow.
Expired Date field
The date the task was determined to have expired.

Context-Sensitive Help Topics
541
Finish Date field
The date the activity prescribed by the human task was completed.
ID field
The unique numeric identifier for each human task within each workflow instance.
Initiator field
The Personal Name of the user who initiated this instance of the current workflow
including all its tasks. This field displays the value External to P6 if the workflow was
initiated by another application or event, and not in P6.
Last Modified By field
The Personal Name of the user associated with the most recent changes to any of the
tasks within the workflow or to the workflow itself. This includes workflow initiation, and
task claiming, reassigning, approving, escalating, and other actions. This field displays
the value Workflowsystem if the change was made by another application or system
event.
Last Modified Date field
The date the human task was last changed. This includes claiming, reassigning,
approving, escalating, and other actions.
Name of Workflow Instance field
The unique name for the specific instance of a workflow. For example, Project
Request for 2014 Expansion or Green Team Project Initiation.
Task Name field
The unique name for the human task. For example, Review Documents or Gather
Committee Feedback.
Original Assignee field
The user originally assigned to the task when this workflow was initiated. As a workflow
advances to its next stages, the task might be reassigned, claimed, or modifed by
other users; however, this field will continue to display the first assigned user.
Owner field
The assigned key members of the workflow instance. Arranged in a
comma-separated list, these values include all users, groups, and roles designated as
owners.
Priority field
An indication of the importance of each task relative to other tasks in the workflow.
Depending on your edition of BPM, you may see numbers or text values. The numbers
used range from 1 (highest priority) to 5 (lowest priority). Text values include lowest,
low, normal, high, and highest. The default setting is 3 or normal.

542
Category or Process field
The name of the original workflow type or template from which this instance of the
workflow is derived. When multiple tasks share the same or similar names, refer to this
field to view the originating or parent workflow.
Reviewers field
The members assigned to the human task. Arranged in a comma-separated list, these
values include all users, groups, and roles that were previously assigned, are currently
assigned, or will be assigned to the task.
Stage field
The name of the current workflow phase. The stage also provides an indication of the
workflow's current progress within the total sequence of all its defined phases. For
example, Stage 1: Just Initiated vs. Stage 5: Final Review.
Start Date field
The date the activity prescribed by the human task was started.
Status field
The current state of the workflow task. Values include:
Alerted: The task has alerted its assigned user, group, or role.
Assigned: The task has been claimed or assigned to a user, group, or role.
Completed: The task has been finished.
Errored: The task cannot advance because of an error.
Expired: The task has exceeded its deadline and is still not complete.
Information Requested: The task is the subject of a separate request by
another user for additional information to assist with the current activity it is
prescribing.
Suspended: The task has been placed on hold.
Withdrawn: The task has been identified as obsolete or no longer applicable to the workflow.Tips
If you are not associated with any project workflows or have not set your filter options to
display them, the "No information is available" message appears.
Getting Here
1) Click Dashboards.
2) On the Dashboards page, select a dashboard.
3) On the dashboard, expand the Workflows portlet.
4) In the Workflows portlet, click the Action Required tab.

Context-Sensitive Help Topics
543
Activities Detail Window of the Project Security Profiles Page
Overview
Use this detail window to assign activity privileges to the selected project security profile.
Screen Elements
Privilege field
The name of the security permission that is assigned (option selected) or denied
(option cleared) to users of the currently selected profile.
Privilege option
The option in the column header that determines whether the privileges are all
assigned (selected), all denied (clear), or individually configured (indicated with a
dash or - sign).
Add/Edit Activities Except Relationships option
Determines whether the profile will enable users to create and modify all activity
information in projects, except activity relationships. Users assigned a profile with this
privilege can also designate another user as an activity owner. To modify activity IDs,
users must also have the 'Edit Activity ID' project privilege assigned to their profile. To
use the Recalculate Assignment Costs feature, users must also have the 'View Project
Costs/Financials' project privilege assigned to their profile.
Delete Activities option
Determines whether the profile will enable users to remove activities from projects.
Add/Edit/Delete Activity Relationships option
Determines whether the profile will enable users to create, modify, and remove
activity relationships assigned to projects.
Edit Activity ID option
Determines whether the profile will enable users to modify activity IDs. To modify
activity IDs, users must also have the 'Add/Edit Activities Except Relationships' project
privilege assigned to their profile.
Add/Edit/Delete Expenses option
Determines whether the profile will enable users to create, modify, and remove
expenses assigned to projects.
Getting Here
1) Click the Administer menu and select User Access.
2) On the User Access page, click Project Security Profiles.
3) On the Project Security Profiles page, click the Activities detail window.

544
Activities Detail Window of the Risks Page
Overview
Use this detail window to assign and view activities that are impacted by the risk.
Screen Elements
Activities Detail Window toolbar
See Risk Activities Toolbar (on page 1333).
Activity ID field
The unique identifying code for the activity.
Activity Name field
The name of the activity. The activity name does not have to be unique.
Activity Type field
The type of activity.
Task Dependent: Activities are scheduled using the activity's calendar rather than
the calendars of the assigned resources. Choose task dependent when you want
to control the duration of the activity yourself (that is, no resources are assigned),
or when one or more resources assigned to the same activity can work according
to the same calendar. The activity is scheduled according to the activity’s
calendar, not the resource calendars. For example, you might have an activity to
cure concrete; you know how long the task takes and the addition of resources
won’t complete the task any earlier. You would designate this activity as task
dependent.
Resource Dependent: Activities are scheduled using the calendars of the assigned
resources. This type is used when several resources are assigned to the activity, but
they might work separately. Choose resource dependent when you want to
schedule each resource according to his/her own time schedule, or resource
calendar, not the activity calendar. The assigned resource availability determines
the start and finish dates of the activity. Typically, you use this type when multiple
resources assigned to the same activity can work independently, or when
availability can affect the activity’s duration. For example, an activity that requires
an Inspector might be delayed if that resource is assigned to multiple projects or is
on vacation.
Start or Finish Milestone: Milestone activities are zero-duration without resources,
marking a significant project event. Choose start milestone or finish milestone to
indicate that the activity marks the beginning or end of a major stage in the
project. Milestones have zero duration. They can have expenses assigned to
them, but not resources. In an office building addition project, examples of
milestones might include Project Definition Complete, Structure Complete, or End
Bidding Process.

Context-Sensitive Help Topics
545
Level of Effort: Activities have a duration that is determined by its dependent
activities and are typically administration type. Choose level of effort to indicate
that the activity’s duration depends on its predecessor and/or successor activities.
A level of effort activity is usually one that is ongoing, such as clerical work,
change management, or project management tasks. For example, site cleanup
could be considered a level of effort activity; it occurs repeatedly and is
dependent on the completion of a phase.
WBS Summary: Activities that are used to roll up date, duration, and percent
complete values for a group of activities that share a common WBS code level.
Choose WBS Summary to indicate that the activity is a summary-level WBS activity.
A WBS Summary activity represents a group of activities that share a common WBS
level. The summary-level WBS activity enables roll-ups of dates for the activity
group. The duration of a WBS Summary activity extends from the start of the
earliest activity in a group to the finish of the latest activity. WBS codes control
which activities are part of a WBS Summary activity; P6 incorporates any activities
that share a component of the WBS Summary activity's WBS code into the WBS
Summary activity. For example, all activities whose WBS codes begin with A (A.1,
A.1.1, A.1.2, etc.) can be part of one WBS Summary activity whose WBS code is A.
At a lower level, all activities whose WBS codes start with A.1 (A.1.1, A.1.2, etc.)
can be part of a WBS Summary activity whose WBS code is A.1.
Actual Duration field
The total working time from the activity actual start date to the actual finish date for
completed activities, or the current data date for in-progress activities.
The actual working time is computed using the activity's calendar.
ctual Finish field
The date on which the activity is actually finished.
Actual Start field
The date on which the activity is actually started.
Actual Total Cost field
The sum of the actual labor cost, the actual nonlabor cost and the actual expense
cost.
Calculated as Actual Labor Cost plus Actual Nonlabor Cost plus Actual Expense Cost
as of the project data date.
At Completion Total Cost field
The total cost at completion for the activity including labor resources, nonlabor
resources, material resources and project expenses.
Early Finish field
The earliest possible date the activity can finish.

546
The date is calculated based on network logic, schedule constraints, and resource
availability. Early finish dates can change as the project progresses and changes are
made to the project management plan.
Early Start field
The earliest possible date the remaining work for the activity can begin.
The date is calculated based on network logic, schedule constraints, and resource
availability. Early start dates can change as the project progresses and as changes
are made to the project management plan.
Finish Date field
For completed activities, the actual finish date. For not started and in-progress
activities, set to the planned finish date if the project has not been scheduled. When
scheduled, set to the remaining early finish date.
Planned Duration field
The total working time from the activity planned start date to the planned finish date.
The planned working time is calculated using the activity's calendar.
Planned Finish field
The date the activity is scheduled to finish.
This date is calculated by the project scheduler but can be updated manually by the
project manager. This date is not changed by the project scheduler after the activity
has started.
Planned Start field
The proposed start date of the project.
This date the activity is scheduled to begin is calculated by the project scheduler but
can be updated manually by the project manager. This date is not changed by the
project scheduler after the activity has been started.
Planned Total Cost field
The planned total cost for the activity, including labor resources, nonlabor resources,
material resources, and project expenses.
Calculated as Planned Labor Cost plus Planned Nonlabor Cost plus Planned Material
Cost plus Planned Expense Cost.
Project ID field
The unique identifier of the project.
Project Name field
The name of the associated project.

Context-Sensitive Help Topics
547
Remaining Duration field
The total working time from the activity remaining start date to the remaining finish
date.
The remaining working time is calculated using the activity's calendar. Before the
activity is started, the remaining duration is the same as the planned duration. After
the activity is completed the remaining duration is zero.
Remaining Total Cost field
The remaining total cost for the activity, including labor resources, nonlabor
resources, material resources, and project expenses.
Calculated as Remaining Labor Costs plus Remaining Nonlabor Costs plus Remaining
Material Costs plus Remaining Expense Costs.
Start Date field
For started activities, the actual start date. For not started activities, set to the planned
start date until the project is scheduled. When scheduled, set to the remaining early
start date.
Total Float field
The amount of time the activity can be delayed before delaying the project finish
date.
Calculated as Late Start minus Early Start or as Late Finish minus Early Finish.
Getting Here
1) Click Projects.
2) On the Projects navigation bar, click Risks.
3) On the Risks page, click the Activities detail window.
Activities Page
Overview
Use this page as your central project management tool for all project activities and their
associated details. This includes all WBS elements, activities, steps, issues, notebooks,
resource assignments, risks, and other details. The Activities page can display schedules
for any single project or group of projects you choose. Tabbed navigation, inline editing,
and graphical drag and drop features help you quickly update project activities and run
important operations including Schedule, Apply Actuals, and Level Resources.
Initially, this page displays a table with a Gantt chart, but you can customize this
presentation of live project data, creating and saving multiple activity views, or data
layouts, to meet your needs. The convenient Activity View list enables you to quickly
switch between views, and you can manage multiple detail windows in tabs that you
can reposition.

548
Screen Elements
Activities toolbar
The activities toolbar is made up of three separate toolbars with matching menus:
Actions (see "Actions Menu on Activities Page" on page 1178), Edit (see "Edit Menu on
Activities Page" on page 1253), and View (see "View Menu on Activities Page" on
page 1365). The Activity View toolbar, also located on the Activities page, is a fixed
toolbar used to select activity views, and to show or hide alternative formats such as
the Activity Network or the Gantt chart. See Activities Toolbar (on page 1182).
Activities work area
The main work area for viewing project data in your choice of the following
customizable formats:
Table (see "Table Format of the Activities Page" on page 1115)
Gantt chart (see "Gantt Chart Format of the Activities Page" on page 776)
Activity Network (see "Activity Network Format of the Activities Page" on page 560)
Calendar (see "Calendar View Format of the Activities Page" on page 612)
Activity Table columns:
The default fields that appear as columns in the Activity Table are described below.
For descriptions of all possible fields, see Available Columns of the Activities Page (on
page 1189).
Start field
The planned start date for an activity not yet started or the actual start date for an
activity that has already started.
Finish field
The planned finish date for an activity not yet finished or the actual finish date for an
activity that has already finished.
Remaining Duration field
The total working time from the activity remaining start date to the remaining finish
date.
The remaining working time is calculated using the activity's calendar. Before the
activity is started, the remaining duration is the same as the planned duration. After
the activity is completed the remaining duration is zero.
Activity % Complete field
The percent of the activity that has been completed.
Calculated as (Original or Planned Duration minus Remaining Duration) divided by
Original or Planned Duration.
If the activity's percent complete type is set to Physical, the application will not
calculate a value for the Activity % Complete field.

Context-Sensitive Help Topics
549
Units % Complete equals (Actual Labor Units plus Actual Non-labor Units) divided by
(Actual Labor Units plus Actual Non-labor Units plus Remaining Labor Units plus
Remaining Non-labor Units).
Primary Resource field
The person primarily responsible for performing or overseeing work related to a
specific activity. The first resource you assign to an activity is automatically identified
as the activity's primary resource.
WBS-level detail windows:
WBS Budget Log Detail Window of the Activities Page (on page 1156)
WBS Documents Detail Window of the Activities Page (on page 1157)
WBS Earned Value Detail Window of the Activities Page (on page 1158)
WBS General Detail Window of the Activities Page (on page 1160)
WBS Issues Detail Window of the Activities Page (on page 1162)
WBS Milestones Detail Window of the Activities Page (on page 1164)
WBS Notebooks Detail Window of the Activities Page (on page 1164)
Activity-level detail windows:
Assignments Detail Window of the Activities Page (on page 586)
Codes Detail Window of the Activities Page (on page 620)
Documents Detail Window of the Activities Page (on page 721)
Expenses Detail Window of the Activities Page (on page 763)
Feedback Detail Window of the Activities Page (on page 767)
General Detail Window of the Activities Page (on page 785)
Issues Detail Window of the Activities Page (on page 852)
Notebooks Detail Window of the Activities Page (on page 904)
Predecessors Detail Window of the Activities Page (on page 944)
Risks Detail Window of the Activities Page (on page 1049)
Steps Detail Window of the Activities Page (on page 1099)
Successors Detail Window of the Activities Page (on page 1110)
Trace Logic Detail Window of the Activities Page (on page 1130)
Getting Here
1) Click Projects.
2) On the Projects navigation bar, click Activities.

550
Activities Portlet of the Workgroup Workspace Page
Overview
Use this portlet to view, assign, and remove activities and milestones associated with the
Workgroup.
Your ability to assign and remove activities in the Activities portlet is dependent on your
access rights to project data. If you have OBS access to the project, you can assign and
remove any project activities. If you are a team member, you can only assign and
remove activities to which you are assigned as a resource. If you are the project owner,
you can assign and remove activities, provided you have OBS access to the project.
Screen Elements
Assign link
Assigns activities to the Workgroup. The Select an Activity dialog displays all activities
you have access rights to view and assign, organized by WBS.
When you assign an activity to a Workgroup, any issues and documents associated
with the activity are automatically assigned to their respective portlets in the
Workgroup.
Remove link
Removes an activity from the portlet. When you remove an activity, any associated
issues and documents are automatically removed from their respective portlets. You
can only remove activities that you have access rights to remove.
Note: Removing an activity from this portlet does not delete the activity or its
associated items from the project.
Activity Name field
The name of the activity. The activity name does not have to be unique.
Start Date field
For started activities, the actual start date. For not started activities, set to the planned
start date until the project is scheduled. When scheduled, set to the remaining early
start date.
Finish Date field
For completed activities, the actual finish date. For not started and in-progress
activities, set to the planned finish date if the project has not been scheduled. When
scheduled, set to the remaining early finish date.
Primary Resource Name field
The name of the resource.

Context-Sensitive Help Topics
551
Getting Here
From the Workgroup Workspace page:
1) Click Projects.
2) On the Projects navigation bar, click Workspace.
3) On the Workspace page, expand the Workgroups portlet and select a workgroup.
4) On the Workgroup Workspace page, expand the Activities portlet.
From the Dashboards page:
1) Click Dashboards.
2) On the Dashboards page, select a dashboard tab.
3) On the dashboard tab, expand the My Workgroups portlet and select a workgroup.
4) On the Workgroup Workspace page, expand the Activities portlet.
Activities Work Area of the Timesheet Approval Page
Overview
Use this work area to review the activities assigned to a resource and reflected on a
particular timesheet. The activity data provided is designed to assist you in evaluating
whether you should approve or reject the resource's timesheet.
Screen Elements
Activity ID field
The unique identifier of the activity to which the resource is assigned.
Actual Overtime Units field
The actual overtime units worked by the resource on this activity.
This value is calculated from timesheets when project actuals are applied or can be
entered directly by the project manager.
Actual Regular Units field
The actual non-overtime units worked by the resource on this activity.
This value is calculated from timesheets when project actuals are applied or can be
entered directly by the project manager.
Activity Status field
The current status of the activity.
Auto Compute Actuals option
Determines whether the activity actual and remaining units, and start and finish dates
for the resource are calculated automatically using the planned dates, planned
units, and the activity's schedule percent complete.

552
If this option is selected, the actual/remaining units and actual dates are
automatically updated when project actuals are applied. This assumes that all work
by the resource proceeds according to plan.
This option is not available if the Uses Timesheets option is selected.
E-mail Address field
The e-mail address for the resource.
Employee ID field
The resource identifier within the organization, typically the employee number or
social security number.
Pend Remaining Units field
The estimate of the resource's remaining units on this activity.
The pending remaining units is entered by each resource using timesheets. This value
is copied to the resource's remaining units for the activity when project actuals are
applied. The project manager specifies whether resources update their percent
complete or remaining units for each project.
Pending % Complete field
The estimate of the percentage of the resource's units of work completed on this
activity.
The pending percent complete is entered by each resource using timesheets. This
value is used to compute the resource's remaining units for the activity when project
actuals are applied. The project manager specifies whether resources update their
percent complete or remaining units for each project.
Price/Unit field
The non-overtime price per time for the resource.
This price is used to compute costs for any activities the resource is assigned to.
Calculated as Units multiplied by Price Per Time.
Project ID field
The unique identifier of the project.
Project Name field
The name of the project.
Office Phone field
The office phone number for the resource.
Other Phone field
The alternate phone numbers for the resource.

Context-Sensitive Help Topics
553
Overtime Factor field
The overtime factor used to compute the overtime price for the resource. The default
is 1.5.
Used in overtime calculations where the rate is multiplied by the overtime factor to
figure the total overtime price.
Rate Source field
The value that indicates which price/unit will be used to calculate costs for the
assignment, such as Resource, Role, and Override.
When a resource and only a resource is assigned to an activity, the rate source will
automatically equal Resource. When a role and only a role is assigned to an activity,
the rate source will automatically equal Role. When both a resource and role are
assigned to the activity, the rate source can be either Resource or Role determined
by the Rate Source Preference. In any case, the Override value allows you to specify
any other price/unit.
Rate Type field
Determines which of the five user-defined resource and role rate types will be used to
calculate the cost for the resource assignment.
Remaining Units field
The remaining units of work to be performed by this resource on this activity.
Before the activity is started, the remaining units are the same as the planned units.
After the activity is completed, the remaining units are zero.
Resource ID field
The unique identifier of the resource.
Resource ID Name field
The identifying code and name of the resource.
Resource Name field
The name of the resource.
Role ID field
The unique identifier for the role the resource is performing on this activity.
You can assign a resource to the same activity more than once, performing different
roles. The project manager controls whether the same resource can be assigned to
an activity more than once.
Role ID Name field
The identifying code and name of the role.

554
Role Name field
The name of the role assigned to the resource for the selected activity.
Status field
The current state of the timesheet. Timesheets can have a status of Not Started, Not
Submitted, Submitted, Resubmitted, Approved, PM Approved, RM Approved, or
Rejected. The Action Required status displays all timesheets that currently require your
review.
WBS Code field
The unique identifier of the WBS for the associated activity.
WBS Name field
The name of the WBS element.
Getting Here
Click the Dashboards and select Approve Timesheets.
Activity Codes Details Page of the Activity Form Page
Overview
Use this page to assign resource codes to the selected resource.
Screen Elements
Code Assignment field
The name of the activity code that is assigned to the selected activity.
Getting Here
From the Workgroup Workspace page:
1) Click Projects.
2) On the Projects navigation bar, click Workspace.
3) On the Workspace page, expand any portlet containing activities.
4) In the portlet, click an activity.
5) On the Activity Form page, expand the Codes section and select an activity code.
From the Dashboards page:
1) Click Dashboards.
2) On the Dashboards page, select a dashboard tab.
3) On the dashboard tab, expand any portlet containing activities.
4) In the portlet, click an activity.
5) On the Activity Form page, expand the Codes section and select an activity code.

Context-Sensitive Help Topics
555
Activity Codes Page
Overview
Use this page to configure activity codes.
Screen Elements
Global tab
Click this tab to view or add a Global activity code. For information about the fields
on this page, see Global Tab of the Activity Codes Page (on page 817).
EPS tab
Click this tab to view or add an EPS activity code. For information about the fields on
this page, see EPS Tab of the Activity Codes Page (on page 757).
Project tab
Click this tab to view or add a Project activity code. For information about the fields
on this page, see Project Tab of the Activity Codes Page (on page 973).
Tips
To assign code values to activities on the Activities page, customize your activity view
to display project activity codes as columns in the table. From these columns, you
can assign activity code values to activities.
Getting Here
1) Click the Projects menu and select Enterprise Project Data, or click the
Administer menu and select Enterprise Data.
2) In the Enterprise Data pane, expand Activities and click Activity Codes.
Activity Details Dialog Box of the Resource Staffing Dialog Box
Overview
Use this dialog box to configure the resources, steps, and notebooks for the selected
activity.
Screen Elements
Resources section
See Resources Section of the Activity Details Dialog Box (on page 1026).
Steps section
See Steps Section of the Activity Details Dialog Box (on page 1106).

556
Notebooks section
See Notebook Section of the Activity Details Dialog Box (on page 901).
Return link
Navigates to the previous screen.
Getting Here
1) Click Resources.
2) On the Resources navigation bar, click Analysis.
3) On the Analysis page, click the Role Usage tab.
4) On the Role Usage tab, select a role and select to display the Spreadsheet.
5) In the Spreadsheet, click a project name.
6) In the Resource Staffing dialog box, click an activity name.
Activity Details of the Resources Dialog Box
Overview
Use this dialog box to view and define detailed information associated with the selected
activity.
Screen Elements
Resources section
See Resources Section of Activity Details of the Resources Dialog Box (on page 1024).
Steps section
See Steps Section of Activity Details of the Resources Dialog Box (on page 1104).
Notebooks section
See Notebook Section of Activity Details of the Resources Dialog Box (on page 900).
Return link
Navigates to the previous screen.
Getting Here
1) Click Projects.
2) On the Projects navigation bar, click Team Usage.
3) On the Team Usage page:
a. Select a project from the Select Project list.
b. Click the Organized By list and select Roles.
1. Expand a project and select a role in the left pane.

Context-Sensitive Help Topics
557
2. Select the Spreadsheet option and click a project in the right pane.
4) In the Resources dialog box, select the Unstaffed and Staffed option and click an
activity name.
Activity Editing Tab of the User Interface View Details Page
Overview
Use this tab to configure the columns a user can edit in activities or resource assignments.
Screen Elements
Available Columns
Displays all available columns.
Edit option
Determines whether users assigned to the current user interface view are permitted to
edit the selected available field or column.
Tips
For all categories except for Activity Code and User Defined Field options, marking
the check box at the category level selects all options under the category. For
example, you can mark the check box of the Dates category to select all options
under Dates, then selectively clear check boxes of options that you do not want to
select.
Getting Here
To modify an existing user interface view:
1) Click the Administer menu and select User Interface Views.
2) On the User Interface Views page, click a View.
3) On the Details of page, click the Activity Editing tab.
To modify an new user interface view:
1) Click the Administer menu and select User Interface Views.
2) On the User Interface Views page, click Create User Interface View.
3) In the Copy from Existing User Interface View dialog box, click New User Interface
View or an existing view and click OK.
4) On the Create User Interface View page, click the Activity Editing tab.

558
Activity Form Page
Overview
On this page you can view and edit information and attributes of an activity such as
predecessor and successor relationships between activities, completion status, weighted
milestones, notebooks and documents related to the activity, and other information.
Screen Elements
Return link
Navigates to the Workspace page.
Delete Activity link
Deletes the currently selected activity.
General section
See General Section of the Activity Form Page (on page 795).
Resources section
See Resources Section of the Activity Form Page (on page 1028).
Steps section
See Steps Section of the Activity Form Page (on page 1107).
Notebook section
See Notebook Section of the Activity Form Page (on page 902).
User Defined section
See User Defined Section of the Activity Form Page (on page 1137).
Relationships section
See Relationships Section of the Activity Form Page (on page 989).
Codes section
See Codes Section of the Activity Form Page (on page 626).
Status section
See Status Section of the Activity Form Page (on page 1094).
Expenses section
See Expenses Section of the Activity Form Page (on page 765).
Documents section
See Documents Section of the Activity Form Page (on page 726).

Context-Sensitive Help Topics
559
Tips
To edit or delete details in the General or Status section, click the appropriate Edit link.
To edit or delete an item in any other section, click the item name. For example, in the
Steps section click a step or in the Documents section click a document title.
Getting Here
From the Workspace page:
1) Click Projects.
2) On the Projects navigation bar, click Workspace.
3) On the Workspace page, expand any portlet containing activities.
4) In the portlet, click an activity.
From the Dashboards page:
1) Click Dashboards.
2) On the Dashboards page, select a dashboard tab.
3) On the dashboard tab, expand any portlet containing activities.
4) In the portlet, click an activity.
Activity List for WBS Dialog Box
Overview
Use this dialog box to view activities by WBS from within a portfolio scorecard.
Screen Elements
Customize button
Configures the columns that appear in the list.
Activity Name field
The name of the activity. The activity name does not have to be unique.
Actual Start field
The date on which the activity is actually started.
ctual Finish field
The date on which the activity is actually finished.
Activity Percent Complete field
The activity percent complete.

560
This value is tied to the activity duration percent complete, units percent complete, or
physical percent complete, depending on the setting for the activity's percent
complete type, which is either duration, units, or physical. Always in the range 0 to
100.
Tips
Click More and then click Customize to include the Activities column in the
scorecard.
Getting Here
1) Open a portfolio in the Portfolios section using one of the following methods:
Click Portfolios to open the last portfolio you were working with.
Click the Portfolios menu and choose one of the most-recently used
portfolios.
Click the Portfolios menu and choose Open Portfolio to select a group of
projects by portfolio type, EPS node, or project code.
2) On the Portfolios navigation bar, click Portfolio Analysis.
3) On the Portfolio Analysis page, select a scorecard from the View field.
4) In the scorecard, select a WBS.
5) In the Activities column, click the View link.
Activity Network Format of the Activities Page
Overview
Use the Activity Network format to view activities and their relationships across multiple
projects. You can also print a network diagram for multiple projects.
Screen Elements
Title bar
The Group By field name.
Activity ID
The activity identifier that is unique within the project.
Activity Name field
The name of the activity.
Start
The current start date of the activity. For a non-started activity, this is the planned start
date. For a started activity, this is the actual start date.

Context-Sensitive Help Topics
561
Finish
The current finish date of the activity. For a not-started activity, this is the planned
finish date. For an in-progress activity, this is the remaining finish date. Once the
activity is completed, this is the actual finish date.
Activity Status field
The current status of the activity.
Icon Indicators
Boxes represent the project's activities, WBS, and other activity grouping structures.
Icons indicate the type of boxes:
Group: can be expanded to display activities by double-clicking within the box
WBS: can be expanded to display activities by double-clicking within the box
Milestone: has no lower levels
Activity boxes have status icons:
: not yet started
: in progress
: completed
: critical
Tips
These screen elements are the default settings for Activity Network activity boxes.
Getting Here
1) Click Projects.
2) On the Projects navigation bar, click Activities.
3) On the Activities page, click the View menu and select Activity Network.
Activity Network Tab of the Customize Activity View Dialog Box
Overview
Use this tab to select options for displaying activity boxes in the Activity Network.
Screen Elements
Activity Box section:
Split Row option
Determines whether to display two fields for the row in the activity box. Selecting the
option causes the Second field lists to become active.

562
Each activity box contains four rows by default. Each row can be divided into two
sections, allowing for up to eight fields to be displayed per activity box. Click the lists
to select the content to be displayed.
Field lists
Determines what will display in the first four rows of the activity box.
Second field lists
The options to be used as the four possible secondary fields that display in an activity
box when the Split Row option is selected for a row.
Preview section
The beforehand look at the composition of the activity box. The options and list values
you select in the Activity Box section affect what is displayed in this section.
Options section
Expand Grouping Bands to Level list
The value to expand up to 20 or all grouping bands.
Show Only Driving Relationships option
Determines whether to show only driving relationships between activities in the
Activity Network. When this option is not selected, the application will display all
relationships between activities in the Activity Network.
Show Progress option
Determines whether to display progress by marking an X on completed activities or
projects and a slash (\) on those in progress.
Getting Here
1) Click Projects.
2) On the Projects navigation bar, click Activities.
3) On the Activities page:
a. Select a view from the Activity View list.
b. Click the View menu and select Customize View....
4) In the Customize Activity View dialog box, click the Activity Network tab.
Activity Tab of the Modify Template Dialog Box of the Import/Export Project Dialog Box
Overview
Use this tab to configure activity import and export options.

Context-Sensitive Help Topics
563
Screen Elements
Import section:
Import milestones with resource assignments as options
Start milestones with expenses: Imports milestones as start milestone activities with
related expenses. If selected, the Import Microsoft Project's fixed costs as expenses
should be selected to ensure that expenses related to milestones are imported.
Activities with resource assignments: Imports task dependent activities with
associated resource assignments.
Import Microsoft Project's Task ID field to options
Activity ID: Imports the Task ID field to the Activity ID of P6.
User defined text field: Imports the Task ID field to a user defined text field.
Import Microsoft Project's fixed costs as expenses option
Determines whether to import Microsoft Project fixed costs to P6 expenses.
This option causes expenses related to milestones to be imported if the option Start
Milestones with Expenses was previously selected.
Export section:
Export Activity ID to Microsoft Projects task field option
Determines whether to export a P6 activity ID to a Microsoft Project task field.
Getting Here
1) Click Projects.
2) On the Projects navigation bar, click EPS.
3) On the EPS page, click the Actions menu and select Import/Export XML Project
Import/Export....
4) In the Import/Export Project dialog box, click the Import or Export tab.
5) On the Import or Export tab:
a. Select Microsoft Project XML (2007) from the Import or Export Type list.
b. Click MSP Export Template Options or MSP Import Template Options.
6) In the Modify Template dialog box, click the Activity tab.
Activity UDFs Page
Overview
Use this page to add and configure user defined fields for activities.

564
Screen Elements
User Defined Fields Toolbar
See User Defined Fields Toolbar (on page 1361).
User Defined Field field
The name of the user-defined field.
Data Type field
The name of the type of data that corresponds to each user-defined field. The data
type you select determines the type of data you can specify in a field. The following
data types are available:
Text: Allows you to use text or a combination of text and numbers.
Start Date: Allows you to enter Start Date information only.
Finish Date: Allows you to enter Finish Date information only.
Cost: Allows you to enter currency values.
Number: Allows you to use numerals with two decimal places.
Integer: Allows you to use numeric data, but not a number related to money.
Indicator: Allows you to use an indicator field that you can use to enter
color-coded icon values in columns and display color-coded text in reports.
Getting Here
1) Click the Projects menu and select Enterprise Project Data, or click the
Administer menu and select Enterprise Data.
2) In the Enterprise Data pane, expand Activities and click Activity UDFs.
Add Activity Expenses Page of the Activity Form Page
Overview
Use this page to create activity expense items.
Screen Elements
Name field
The name for the expense that is unique in the activity.
Expense Category field
The classification code or name for the expense category.
Expense categories are useful for organizing and tracking various expense types
within an organization.
Planned Cost field
The planned cost for the project expense.

Context-Sensitive Help Topics
565
Calculated as Planned Units multiplied by Price Per Unit.
Cost Account field
The default cost account associated with the resource, role, or expense.
Getting Here
From the Workgroup Workspace page:
1) Click Projects.
2) On the Projects navigation bar, click Workspace.
3) On the Workspace page, expand any portlet containing activities.
4) In the portlet, click an activity.
5) On the Activity Form page, expand the Expenses section and click Add Activity
Expenses.
From the Dashboards page:
1) Click Dashboards.
2) On the Dashboards page, select a dashboard tab.
3) On the dashboard tab, expand any portlet containing activities.
4) In the portlet, click an activity.
5) On the Activity Form page, expand the Expenses section and click Add Activity
Expenses.
Add Document Page (without Content Repository)
Overview
Use this page to add new documents to the selected project. This topic applies to
deployments in which the optional content repository is not configured for use with P6.
Screen Elements
Files (Public Location) field
The selected work product or document's publicly-accessible file location.
Add: Enables you to select files to add to the project.
Delete: Deletes the currently selected file.
Title field
The identifying name of the document.
File Path field
The file location.

566
Format field
The file type associated with the document.
If the file type is not a supported document format, or you want to change the file
format, use the list to select a file type. If a file format is not selected, the file is
assigned a 'C file' file type format.
Author field
The person who authored or created the document.
Version field
The version of the document on which the activity was performed.
Revision Date field
The date of the document's last update.
Description field
A more detailed summary for the item. The description provides more information
than short names or titles. It can give background information or establish a purpose
for the item. These details help differentiate between items with similar names and are
especially useful in multi-user environments.
Tips
When you click on a file in the Files field, the Title, File Path, Format, and Description fields
display information corresponding to that particular file.
Getting Here
From the Documents page:
1) Click Projects.
2) On the Projects navigation bar, click Documents.
3) On the Documents page:
a. Click Modify.
b. Click Add Document.
From the Workspace page:
1) Click Projects.
2) On the Projects navigation bar, click Workspace.
3) On the Workspace page, expand the Project Documents portlet.
4) In the Project Documents portlet, click Add Document.

Context-Sensitive Help Topics
567
Add Folder Dialog Box
Overview
Use this dialog box to add a document folder to the repository and set its security policy.
Screen Elements
Folder Name field
The unique name to identify the folder.
This is a required field.
Security Policy list
The security policy for the selected document or folder:
Personal: Can be viewed, modified, or deleted only by the user who added it to
the project.
Read-Only: Can be viewed by any project team member, but team members
cannot modify or delete it.
Shared: Can be viewed, modified, or deleted by any project team member.
Getting Here
From the Documents page:
1) Click Projects.
2) On the Projects navigation bar, click Documents.
3) On the Documents page, click the Projects tab.
4) On the Projects tab, select a document and click Add Options Add Folder.
From the Workspace page:
1) Click Projects.
2) On the Projects navigation bar, click Workspace.
3) On the Workspace page, expand the Project Documents portlet.
4) In the Project Documents portlet, select a document and click Add Options
Add Folder.
From the Dashboards page:
1) Click Dashboards.
2) On the Dashboards page, select a dashboard tab.
3) On the dashboard tab, expand the My Documents portlet.
4) In the My Documents portlet, select a document and click Add Options Add
Folder.

568
Add Issue Page
Overview
Use this page to create a new issue you want to track for an activity in the currently open
projects.
Screen Elements
Select the project to associate with this issue field
The project associated with the selected issue.
This field displays on the Add Issue page. In this case, the list of available projects
includes only those in the currently selected project group for which you have the
security privilege required to add issues.
Issue Name field
The name or description of the issue.
Applies to field
The activity, project, or WBS with which the issue is associated.
Date Identified field
The date on which the issue was identified. By default, this field displays today's date.
Identified By field
The name of the person who identified the issue. By default, this field displays your user
name.
Owner field
The list of available resources you can select from depends upon your resource
access security privileges.
Priority field
The level of importance assigned to the issue.
Resolution Date field
The planned (open issue) or actual (closed issue) resolution date for the issue.
Responsible Manager field
The name of the person responsible for the issue.
If you have edit privileges, you can select a different Responsible Manager. The list of
available resources depends upon your resource access security privileges.
Status field
The current status of the issue: Open, On Hold, Closed.

Context-Sensitive Help Topics
569
Description field
A more detailed summary for the item. The description provides more information
than short names or titles. It can give background information or establish a purpose
for the item. These details help differentiate between items with similar names and are
especially useful in multi-user environments.
Getting Here
From the Issues page:
1) Click Projects.
2) On the Projects navigation bar, click Issues.
3) On the Issues page, click Add an Issue.
4) In the Select an Issue Form dialog box, select a form and click OK.
From the Workgroup Workspace page:
1) Click Projects.
2) On the Projects navigation bar, click Workspace.
3) On the Workspace page, expand the Workgroups portlet and click a workgroup.
4) On the Workgroup Workspace page, expand the Issues portlet and click Add Issue.
5) In the Select an Issue Form dialog box, select a form and click OK.
From the Workspace page:
1) Click Projects.
2) On the Projects navigation bar, click Workspace.
3) On the Workspace page, expand the Project Issues portlet and click Add.
4) In the Select an Issue Form dialog box, select a form and click OK.
Add Steps Page of the Activity Form Page
Overview
Use this page to save new step information for an activity.
Details
Step Name field
The name of the step, which is unique to the activity.
Step Weight field
The weight that is assigned to the step.
This user-defined field is used to calculate the physical percent complete when the
project option is set.

570
Getting Here
From the Workgroup Workspace page:
1) Click Projects.
2) On the Projects navigation bar, click Workspace.
3) On the Workspace page, expand any portlet containing activities.
4) In the portlet, click an activity.
5) On the Activity Form page, expand the Steps section and select Add Steps.
From the Dashboards page:
1) Click Dashboards.
2) On the Dashboards page, select a dashboard tab.
3) On the dashboard tab, expand any portlet containing activities.
4) In the portlet, click an activity.
5) On the Activity Form page, expand the Steps section and select Add Steps.
Add User Dialog Box
Overview
If the password policy is enabled, you will use the Add User dialog box to add a user.
Screen Elements
Login Name field
Allows you to enter the login name for the user. Your user name can be a maximum of
30 characters.
Personal Name field
Allows you to enter the login name for the user.
Password field
When the Password Policy is enabled in Application Settings, the password must
be between 8 and 20 characters and contain at least one number and one letter.
When the Password Policy is disabled in Application Settings, the password must be
between 1 and 20 characters. P6 EPPM does not allow blank passwords.
Confirm Password field
To confirm the password, enter the password.
When the Password Policy is enabled in Application Settings, the password must
be between 8 and 20 characters and contain at least one number and one letter.
When the Password Policy is disabled in Application Settings, the password must be
between 1 and 20 characters. P6 EPPM does not allow blank passwords.

Context-Sensitive Help Topics
571
Getting Here
1) Click the Administer menu and select User Access.
2) On the User Access page, click Users.
3) On the Users tab, click Add.
Add Users from LDAP Dialog Box of the Users Page
Overview
Use this dialog box to search for and import users into P6 from your LDAP repository. You
can add users from the LDAP repository when your global profile has the privilege
Provision Users From LDAP. The dialog box allows you to import multiple users at once.
Periodically, you can check back to view any user accounts that were modified within
the LDAP repository and re-import those users to keep P6 up to date.
Screen Elements
Search users field
The search criteria you want to use to find specific users in the LDAP repository. By
default, your most recent search criteria appears.
Search button
Activates the search based on your search criteria.
User Name field
The system-compliant user login name.
Actual Name field
The full name of the user.
E-mail field
Displays the user's e-mail.
Phone field
Displays the user's telephone number.
User Status field
An indication of the relative state of the user account in both the LDAP repository and
P6. By default, the user accounts shown in your search results on this dialog box are
grouped hierarchically by the following status types:
User does not exist in the database: Shows users who exist in the LDAP repository
but not in the P6 database. When you select these accounts and click Import,
they are imported as new records in P6 .

572
User modified: Shows user accounts that have similar information in both P6 and
the LDAP repository, but that also have been modified in the P6 EPPM database or
LDAP repository. When you select these accounts and click Import, the two
account records are synchronized.
User records match: Shows users who have the same information in both P6 and
the LDAP repository.
Load LDIF button
Opens a dialog box where you can select an .ldif file pre-populated with the LDAP
users you want to import into P6. Use this method to import new P6 user accounts in
batches.
Import button
Imports selected users into your database.
Cancel button
Cancels the current command or operation. Reverts any information you changed
back to its previous state and closes the current page or dialog box.
Tips
You must be an LDAP user to add another LDAP user to the application.
Getting Here
1) Click the Administer menu and select User Access.
2) On the User Access page, click Users.
3) On the Users tab, click Add
Administration Detail Window of the Global Security Profiles Page
Overview
Use this detail window to assign administration privileges to the selected global security
profile.
Screen Elements
Privilege field
The name of the security permission that is assigned (option selected) or denied
(option cleared) to users of the currently selected profile.
Privilege option
The option in the column header that determines whether the privileges are all
assigned (selected), all denied (clear), or individually configured (indicated with a
dash or - sign).

Context-Sensitive Help Topics
573
Add/Edit/Delete OBS option
Determines whether the profile will enable users to create, modify, and remove
hierarchical data for the global Organizational Breakdown Structure.
Add/Edit/Delete Security Profiles option
Determines whether the profile will enable users to create, modify, and remove
global and project security profiles, which grant access to application-wide and
project-specific information.
Add/Edit/Delete Users option
Determines whether the profile will enable users to create, modify, and remove P6
EPPM user data. To search the LDAP directory when provisioning, users must also have
the Provision Users from LDAP global privilege.
Add/Edit/Delete User Interface Views option
Determines whether the profile will enable users to create, modify, and remove User
Interface Views configurations, which control the functionality users can access in P6.
Edit Application Settings option
Determines whether the profile will enable users to modify application settings, which
set global preferences for P6 EPPM.
Provision Users from LDAP option
Determines whether the profile will enable users to search the LDAP directory when
provisioning. For users who do not have this privilege assigned to their profile, the
option to load an LDIF file to provision users will still be enabled. To search the LDAP
directory, users also must also have the 'Add/Edit/Delete Users' global privilege.
Getting Here
1) Click the Administer menu and select User Access.
2) On the User Access page, click Global Security Profiles.
3) On the Global Security Profiles page, click the Administration detail window.
Administration Page
Overview
Use this page to create, modify, and delete resources, resource teams, roles, and role
teams.
Screen Elements
Administration Page tabs:
Resources Tab of the Administration Page (on page 1033)
Resource Teams Tab of the Administration Page (on page 1016)

574
Roles Tab of the Administration Page (on page 1057)
Role Teams Tab of the Administration Page (on page 1054)
Getting Here
1) Click Resources.
2) On the Resources navigation bar, click Administration.
Advanced Tab of the Add Project Dialog Box
Overview
Use this tab to choose the project, WBS, activity, and baseline data you want to copy
from an existing project to use as a basis for a new project.
Screen Elements
Project & WBS Data options:
Documents option
Determines whether or not to copy document data to the project.
Funding Sources option
Determines whether to copy funding source data to the project or template.
Issues option
Determines whether or not to copy issue data to the project.
Risks option
Determines whether or not to copy risk data to the project or template.
Activities option
Determines whether to copy activity data to the project or template.
Notebooks option
Determines whether to copy project notebook data to the project or template.
WBS Milestones option
Determines whether to copy WBS milestone data to the project or template.
High Level Resource Planning Assignments option
Determines whether to copy high-level resource planning assignment data to the
project.
Reports option
Determines whether to copy report data to the project.

Context-Sensitive Help Topics
575
Summary Data option
Determines whether to copy summary data to the project.
Activity Data options:
Activity Codes option
Determines whether or not to copy activity code data to the project or template.
Expenses option
Determines whether to copy expense data to the project or template.
Notebooks option
Determines whether to copy activity notebook data to the project or template.
Relationships option
Determines whether to copy relationship data to the project or template.
Resource and Role Assignments option
Determines whether or not to copy resources and role assignment data to the project
or template.
Steps option
Determines whether to copy step data to the project or template.
Financial Period Data option
Determines whether to copy financial period data to the project.
Baselines options:
Select the Include option for each baseline with data that you want to copy to the
project.
Tips
To enable the Advanced tab, you must select a project in the Copy from existing project
or template field on the General tab.
Getting Here
1) Click Projects.
2) On the Projects navigation bar, click EPS.
3) On the EPS page, expand an EPS element.
4) Within the EPS element, right-click the EPS element or any project and select
Add Project.
5) In the Add Project dialog box:
a. Complete the required fields.

576
b. Click Select Project or Template to Copy and select a project (not a template)
from the dialog box.
c. Click the Advanced tab.
Related Topics
General Tab of the Add Project Dialog Box ....................................................... 802
Advanced Tab of the Add Project Template Dialog Box
Overview
Use this tab to select project, WBS, and activity data that you want to copy from an
existing project or template to use as a basis for a new project template.
Screen Elements
Project & WBS Data options:
Funding Sources option
Determines whether to copy funding source data to the project or template.
Risks option
Determines whether or not to copy risk data to the project or template.
Activities option
Determines whether to copy activity data to the project or template.
Notebooks option
Determines whether to copy project notebook data to the project or template.
WBS Milestones option
Determines whether to copy WBS milestone data to the project or template.
Activity Data options:
Activity Codes option
Determines whether or not to copy activity code data to the project or template.
Expenses option
Determines whether to copy expense data to the project or template.
Notebooks option
Determines whether to copy activity notebook data to the project or template.

Context-Sensitive Help Topics
577
Relationships option
Determines whether to copy relationship data to the project or template.
Resource and Role Assignments option
Determines whether or not to copy resources and role assignment data to the project
or template.
Steps option
Determines whether to copy step data to the project or template.
Getting Here
1) Click Projects.
2) On the Projects navigation bar, click EPS.
3) On the EPS page, expand an EPS element.
4) Within the EPS element, right-click the EPS element or any project and select
Add Project Template.
5) In the Add Project Template dialog box on the General tab:
a. Complete the required fields.
b. Click Select Project or Template to Copy and select a project or template from
the dialog box.
c. Click the Advanced tab.
Related Topics
General Tab of the Add Project Template Dialog Box ..................................... 803
Advanced Tab of the Scheduling Options Dialog Box
Overview
Use this tab to specify whether you want to calculate multiple critical float paths.
Calculating multiple critical float paths enables you to determine the most critical path,
along with the sub-critical paths that affect completion.
Screen Elements
Calculate multiple float paths option
Determines whether to calculate multiple critical float paths (sequences of activities)
in the project schedule. You can specify the number of critical float paths to identify
in the Specify the number of paths to calculate field. If you do not select this option,
you cannot edit the remaining fields.

578
Calculate multiple paths using options
Determines whether to calculate multiple paths using Total Float or Free Float.
Total Float: Based on the activity you want the paths to end on, P6 determines
which predecessor activity has the most critical Relationship Total Float on the
backward pass. This process repeats until an activity is reached that has no
relationship. P6 begins the forward pass from this activity and determines which
successor activity has the most critical Relationship Successor Total Float. These
activities represent the most critical float path. The process begins again until the
remaining sub-critical paths are calculated.
Free Float: Defines critical float paths based on longest path. The most critical path
will be identical to the critical path that is derived when you select Define critical
activities as: Longest Path on the General tab. In a multi-calendar project, the
longest path is calculated by identifying the activities that have an early finish
equal to the latest calculated early finish for the project and tracing all driving
relationships for those activities back to the project start date. After the most
critical path is identified, P6 will calculate the remaining sub-critical paths.
Display multiple float paths ending with activity field
The activity in the WBS to represent the end of the float paths.
Typically, this is a milestone activity or some other significant activity that has a start
date or end date that cannot change.
Specify the number of paths to calculate field
The number of critical float paths to calculate.
If you specify 5, P6 will calculate the five most critical float paths ending with the
activity you selected. Each float path is ranked from most critical to least critical and
stores the value for each activity in the Float Path field.
For example, if you calculate five float paths, a value of 1 is stored in the Float Path
field for each activity in the most critical float path; a value of 5 is stored for each
activity in the least critical float path.
To view the critical float paths after you schedule the project, on the Activities page,
create a view that groups activities by Float Path and sort them by Float Path Order. A
Float Path value of 1 indicates that those activities are part of the most critical float
path. The Float Path Order value indicates the order in which the activities were
processed.
Getting Here
1) Click Projects.
2) On the Projects navigation bar, click Activities.
3) On the Activities page, click the Actions menu and select Run Scheduler...
(F9).
4) In the Schedule Project dialog box, click Options.

Context-Sensitive Help Topics
579
5) In the Scheduling Options dialog box, click the Advanced tab.
Analysis Page
Overview
Use this page to compare resource utilization between resource teams, project
resources, and department resource, all from one central location.
The Resource Analysis tab offers four chart options (histogram, stacked histogram, area
chart, and pie chart) to help you examine allocation data for individual resources, as
well as total values for resource teams and resource codes.
The Role Usage and Resource Usage tabs enable you to view resource allocation as a
histogram (total allocation across time) or as a spreadsheet (of resource allocation
values by project). You can view totals for an entire resource grouping (for example, role,
resource code, or resource team) or for individual resources.
Screen Elements
Analysis Page tabs:
Role Usage Tab of the Analysis Page (on page 1054)
Resource Usage Tab of the Analysis Page (on page 1018)
Resource Analysis Tab of the Analysis Page (on page 997)
Getting Here
1) Click Resources.
2) On the Resources navigation bar, click Analysis.
Application Settings Pane
Overview
Use this pane to select pages where you configure application settings.
Screen Elements
Data Limits page
See Data Limits Page (on page 702).
Earned Value page
See Earned Value Page (on page 727).
General page
See General Page (on page 793).

580
ID Lengths page
See ID Lengths Page (on page 833).
Timesheets page
See Timesheets Page (on page 1125).
Time Periods page
See Time Periods Page (on page 1119).
Getting Here
Click the Administer menu and choose Application Settings.
Apply Actuals Dialog Box of the Activities Page
Overview
Use this dialog box to select which currently open projects the Apply Actuals service
should update. You can also specify a new data date, change the Remaining Duration
Calculation, and view the most recent date the service was run.
Screen Elements
Apply Actuals option
Determines which projects are included when the Apply Actuals command runs. Only
selected projects are included.
Project Name field
The name of each project. Can be arranged in an ascending or descending order.
Data Date field
The date used as the starting point to calculated the schedule.
The project status is up to date as of the data date. The data date is modified when
project actuals are applied.
New Data Date field
The new date that is set for project data. This date affects the outcome of applying
actuals.
Project Planned Start field
The date the project is planned to begin.
Remaining Duration Calculation list
The designated method for calculating remaining activity durations. This field is only
used for calculations where you have elected to use P6 Progress Reporter timesheets
as the basis for applying actuals.

Context-Sensitive Help Topics
581
When this field is set to Always Recalculate, its default value, all activities are treated
as fixed units and fixed units/time. When set to Based on Duration Type, the remaining
duration is based on the activity duration type.
Last Apply Actuals Date field
The most recent date the apply actuals were run. This date is used to determine if
new, approved timesheet data exists when P6 data is sent to the ERP system.
Tips
View the status of the Apply Actuals service in the Service Status dialog box.
Getting Here
1) Click Projects.
2) On the Projects navigation bar, click Activities.
3) On the Activities page, click the Actions menu and select Run Apply Actuals.
Approve Document Review Dialog Box
Overview
Use this dialog box to approve a document in review. You also have the option of
making comments or attaching another document. For example, you might attach an
electronic copy of a signed document with your approval comments.
Screen Elements
Name field
The name of the review.
Description field
The details of the review as defined in the Start Review dialog box. If no description is
specified for the review, then this field appears blank.
Initiator field
The name of the user who started the review.
Due Date field
The date all reviewers need to complete the review. If no due date is specified for the
review, then this field appears blank.
Comments field
The comments about the document review. You can type any comments or
responses you have for the review.

582
Attachments field
The documents attached to the document. The browse button allows you to attach a
single file to the review document.
Approve button
Approves the document review and stores any accompanying comments or
attached files.
Getting Here
1) Click Dashboards.
2) On the Dashboards page, select a dashboard.
3) On the dashboard, expand the Document Reviews portlet and click the Action
Required tab.
4) On the Action Required tab, select a document and click Approve Document.
Assign by Search Dialog Box of the Planning Page
Overview
Use the Assign by Search dialog box of the Planning page to search for and assign a
resource using new search criteria or from a pre-existing template. You can also create a
new search template. If this dialog box is used to assign a resource, a "Yes" will appear in
the Search Criteria field on the Planning page; click Yes to display this search criteria
used to find the assigned resource.
Screen Elements
Run Search link
Displays a list of available resource who meet the specified criteria.
Select Template link
Displays a list of preexisting search criteria from which you can select to search by.
Save as Template link
Saves the current search criteria as a template to use again.
Start field
The date you need the resource or role to begin working on the selected project.
Finish field
The date the resource or role is expected to finish working on the selected project.
Requested Units field
The number of resource/role units to assign to the project.

Context-Sensitive Help Topics
583
The time unit increment reflects the current settings of your global preferences, not
the time unit display setting of the Planning page.
Show Results Matching field
Determines what criteria is used in your search.
All search criteria: Finds a resource based on all selections of search criteria that you
select from or enter in the fields of the dialog box.
Any search criteria: Finds a resource based on a random criteria search.
Roles field
The name of the roles to use in the search. Unless you specify only one resource and
no other criteria, you must specify a primary role. When a single resource is selected
with no other criteria, the search criteria will include the primary role of the resource
you specify. If that resource does not have a primary role, a message displays to ask
you to select a primary role.
Proficiency field
The resource's proficiency at performing this role.
The values are 1 - Master, 2 - Expert, 3 - Skilled, 4 - Proficient, and 5 - Inexperienced. If
you do not have the proper privilege, you cannot access this field.
Resources field
The names of specific resources to use in the search.
The displayed hierarchy includes only those resources that belong to your access
node, based on resource security, and current project resources. If you chose the
option to show results that match all criteria, you can specify only one resource.
Resource Codes field
The specific codes to use in the search. If you chose the option to show results that
match all criteria, you can specify only one code value for each resource code you
select.
Sort results by availability option
Determines whether to sort the results by resource availability.
Do not show overallocated resources option
Determines whether to show overallocated resources.
Show only labor resources option
Determines whether to show only labor resources. This option filters out nonlabor and
material resources, which cannot be assigned on the Planning page.
Getting Here
1) Click Resources.

584
2) On the Resources navigation bar, click Planning.
3) On the Planning page, select a project name then click Assign Resource Using
Search.
Assign Project Manager Delegate Dialog Box of the Timesheet Approval Page
Overview
Use this dialog box to assign and activate a project manager delegate. After selecting a
delegate, you can activate and deactivate the delegate's approval rights at any time.
Screen Elements
Search field
The means to find a project.
Clear Results button
Clears the for field and removes the options based on your entered criteria to display
all possible codes.
Selector option
Determines the delegates to be Resource or Project Manager. Selecting the option
and clicking OK enables delegate rights; clearing the option removes delegate rights.
Project ID field
The unique identifier of the project.
Project Name field
The name of the associated project.
Delegate field
The delegate user's login name.
Getting Here
1) Click the Dashboards menu and select Approve Timesheets.
2) On the Timesheet Approval page, select Project Manager from the Approving as list
and click Assign Delegate.
Assign Resource Manager Delegate Dialog Box of the Timesheet Approval Page
Overview
Use this dialog box to assign and activate rights for a resource manager delegate. After
selecting a delegate, you can activate or deactivate the delegate's approval rights at
any time.

Context-Sensitive Help Topics
585
Screen Elements
Selector option
Determines the delegates to be Resource or Project Manager. Selecting the option
and clicking OK enables delegate rights; clearing the option removes delegate rights.
Delegate field
The delegate user's login name.
Getting Here
1) Click the Dashboards menu and select Approve Timesheets.
2) On the Timesheet Approval page, select Resource Manager from the Approving as
list and click Assign Delegate.
Assignment UDFs Page
Overview
Use this page to add and configure user defined fields for assignments.
Screen Elements
User Defined Fields toolbar
See User Defined Fields Toolbar (on page 1361).
User Defined Field field
The name of the user-defined field.
Data Type field
The name of the type of data that corresponds to each user-defined field. The data
type you select determines the type of data you can specify in a field. The following
data types are available:
Text: Allows you to use text or a combination of text and numbers.
Start Date: Allows you to enter Start Date information only.
Finish Date: Allows you to enter Finish Date information only.
Cost: Allows you to enter currency values.
Number: Allows you to use numerals with two decimal places.
Integer: Allows you to use numeric data, but not a number related to money.
Indicator: Allows you to use an indicator field that you can use to enter
color-coded icon values in columns and display color-coded text in reports.
Getting Here
To access enterprise data:

586
1) Click the Administer menu and select Enterprise Data.
2) In the Enterprise Data pane, expand Resources and click Assignment UDFs.
To access enterprise resource data:
1) Click the Resources menu and select Enterprise Resource Data.
2) In the Enterprise Data pane, select Assignment UDFs.
Assignments Detail Window of the Activities Page
Overview
Use this detail window to assign resources or roles to the selected activity. You can also
submit resource requests to a resource manager, revise an assignment, specify details
(such as units, costs, and rate), remove an assigned resource, and send e-mail to all
assigned resources and roles.
Note: All fields described here are available when you click a
resource or role name to edit assignment details. However, unless
you customize the detail window to include them, some of these
fields do not appear.
Screen Elements
Assignments toolbar
See Assignments Toolbar of the Activities Page (on page 1187).
Actual Cost field
The actual non-overtime plus overtime cost for the resource assignment on the
activity.
Calculated as Actual Regular Cost plus Actual Overtime Cost.
Actual Duration field
The total working time from the activity actual start date to the actual finish date for
completed activities, or the current data date for in-progress activities.
The actual working time is computed using the activity's calendar.
Actual Units field
The number of work units the resource has spent working on the selected activity. It is
the sum of the actual labor units and the actual nonlabor units.
Calculated as Actual Labor Units plus Actual Nonlabor Units.
At Completion Cost field
The sum of the actual costs plus remaining costs for the resource assignment on the
activity.

Context-Sensitive Help Topics
587
Calculated as Actual Costs plus Remaining Costs.
At Completion Units field
The sum of the actual units and remaining units for the resource assignment on the
activity.
Calculated as Actual Units plus Remaining Units.
Calculate Costs from Units option
Determines whether to override the cost calculation setting specified for the assigned
resource or role. To have cost for this assignment calculated (Cost equals Units
multiplied by Price/Unit), select this option. To manually record resource or role costs
for this activity, clear this option. If you elect not to calculate costs from units, the
resource or role costs for the assignment will not be updated when units or rates
change.
If you select this option, the costs for the assignment will be recalculated based on
current units and rates.
Cost Account field
The cost account associated with the resource assignment.
Curve field
The resource's units and costs distributed over the duration of an activity.
A curve can only be assigned to activities that have a duration type of Fixed Duration
and Units or Fixed Duration and Units/Time.
A manual curve type indicates that the assignment's future period resource
distribution was manually entered in the Resource Usage Spreadsheet of P6
Professional. If you select a different curve type, the manually-entered distribution is
deleted, and the units and costs for the assignment are redistributed according to the
curve you select. Be sure this is the appropriate course of action before replacing a
manual curve with another curve.
Drive Activity Dates option
Determines whether new resource/role assignments drive activity dates by default.
Planned Cost field
The planned cost for the resource assignment on the activity.
Calculated as Planned Units multiplied by Price Per Time.
Planned Duration field
The planned working time for the resource assignment on the activity, from the
resource's planned start date to the planned finish date.
Planned Units field
The planned units for all labor resources assigned to the activity.

588
Planned Units/Time field
The budgeted or planned units per time at which the resource is expected to work on
this activity.
For example, a person assigned full time would work for 8 hours per day (8h/d).
Price/Unit field
The non-overtime price per unit of time for the resource or role.
When the option to Calculate Costs from Units is selected, this price is used to
compute cost for the activity assignment, using the formula: Cost equals Units
multiplied by Price divided by Unit.
For resources and roles that have specified rates, Price/Unit corresponds to the Rate
Source and Rate Type applied to the activity and is not editable. If an assigned
resource or role does not have specified rates, the project default price/unit is used
and cannot be edited on this tab. To manually enter a Price/Unit for the activity
assignment, you must select Override as the Rate Source.
If the project default price/unit is applied to the activity, a caret symbol (^) appears
beside the value.
An asterisk symbol (*) beside the value indicates that multiple, time-varying, resource
rates or shift calendars will be applied during the duration of the activity. An asterisk
and caret symbol (*^) beside the price/unit value indicate that the project default
price/unit is in effect at the start of the activity and a time-varying rate is also in effect
within the activity assignment duration.
Primary Resource option
Determines whether the corresponding resource is the activity's primary resource.
Typically, the primary resource is the person responsible for the overall work on the
activity and for updating activity status.
Proficiency field
The skill level of the resource: Master, Expert, Skilled, Proficient, or Inexperienced.
Rate Source field
The value that indicates which price/unit will be used to calculate costs for the
assignment, such as Resource, Role, and Override.
When a resource and only a resource is assigned to an activity, the rate source will
automatically equal Resource. When a role and only a role is assigned to an activity,
the rate source will automatically equal Role. When both a resource and role are
assigned to the activity, the rate source can be either Resource or Role determined
by the Rate Source Preference. In any case, the Override value allows you to specify
any other price/unit.
Rate Type field
The price/unit used to calculate costs for the resource or role assignment.

Context-Sensitive Help Topics
589
Resources and Roles can have up to five rate types, with each rate type reflecting a
different price/unit. Rate types are defined in P6. When you add a new assignment,
the rate type defaults to the setting specified for the project. When you edit a rate
type and click Save, the Price/Unit is updated to reflect your change, and if the Calc
Cost from Units option is selected, costs are recalculated.
Remaining Cost field
The remaining cost for the resource assignment on the activity.
Calculated as Remaining Units multiplied by Cost/Time.
Remaining Duration field
The total working time from the activity remaining start date to the remaining finish
date.
The remaining working time is calculated using the activity's calendar. Before the
activity is started, the remaining duration is the same as the planned duration. After
the activity is completed the remaining duration is zero.
Remaining Units field
The remaining units of work to be performed by this resource on this activity.
Calculated as Budgeted or Planned Units minus Actual Units.
Remaining Units/Time field
The units/time at which the resource is expected to perform the remaining work on
the activity.
Resource ID Name field
The identifying code and name of the resource.
Resource Name field
The name of the resource assigned to the activity.
Resource Type field
The resource type. Valid values are:
Labor: Indicates that the selected resource performs labor, measured in units of time.
Nonlabor: Indicates that the resource is a nonlabor resource, such as equipment,
measured in units of time.
Material: Indicates that the resource has a unit of measure other than time. You can
select a unit of measure for the material resource.
Role ID Name field
The identifying code and name of the role.
Role Name field
The name of the role assigned to the resource for the selected activity.

590
Search Criteria field
The resource request used as a search template to search for a qualified resource.
User Defined fields
The fields specific to your company's use of the application.
Information that needs to be captured for all resource assignments can be stored in a
user-defined field. User-defined fields are created by the system administrator.
Tips
If you have more than one activity selected, the detail window will not be visible.
Getting Here
1) Click Projects.
2) On the Projects navigation bar, click Activities.
3) On the Activities page, select an activity and click the Assignments detail window.
Assignments Page
Overview
Use this page to view and modify resource assignment data using filters, which enables
you to view resource assignment data for only the resources or projects that you need to
view.
From this page you can also view a Gantt chart of your current start and finish dates for
an assignment and view a spreadsheet that shows spreads by days, weeks, months,
quarters, years, and financial periods.
Screen Elements
Assignments toolbar
See Assignments Toolbar (on page 1185).
Resource Assignments Table columns
The default fields that appear as columns in Resource Assignments table are
described below. For descriptions of all possible fields, see Available Columns of the
Assignments Page (on page 1213).
Activity ID field
The unique identifier of the activity assigned to the resource or role.
Activity Name field
The name of the activity assigned to the resource or role.

Context-Sensitive Help Topics
591
Resource field
The name of the resource.
Role field
The name of the role.
Planned Units field
The planned units of work for the resource assignment on the activity.
Actual Units field
The sum of the actual non-overtime and the overtime units worked by the resource on
this activity.
This value is calculated from timesheets when project actuals are applied or can be
entered directly by the project manager.
Calculated as Actual Regular Units plus Actual Overtime Units.
Remaining Units field
The remaining units of work to be performed by this resource on this activity.
Before the activity is started, the remaining units are the same as the planned units.
After the activity is completed, the remaining units are zero.
Getting Here
1) Click Resources.
2) On the Resources navigation bar, click Assignments.
Bars Tab of the Customize Activity View Dialog Box
Overview
Use this tab to customize options for Calendar View and Gantt chart bars.
Screen Elements
First/Second/Third Bar sections:
The options to modify each bar's size, height, and color. Use the Type list to determine
whether the Height and Color fields become available. If <none> is selected, other
options will not be available for modification and those bars will not be displayed.
Type list
Determines the type of bar. See About Bars.
Height list
Determines the height of the bar in pixels.

592
Color options
The options for selecting the color of the bar or for setting the bar to represent an
activity code.
Show Necking option
Determines whether the thickness of Gantt chart bars should be reduced to show
periods of non-work time. When bar necking is enabled, the horizontal bars
representing activities "neck down" during periods of inactivity.
Example: Joan starts a 5-day activity before leaving on vacation for 3 weeks and
then finishes it when she returns. Without bar necking, this simple one week activity
might look as though it took four weeks to complete because Joan was on vacation
for three weeks. With this feature, the bar appears narrow over the vacation period
while her actual progress before and after the non-work time appear in the usual
thickness.
Current Bar Options section:
Show Progress option
Determines whether to display activity or project progress. Progress is displayed as a
blue bar inside the other bars in the Gantt chart.
Show Critical option
Determines how to show critical activities in the Gantt chart. Select the option to
represent critical activities with a red bar instead of the color you selected for the
Current bar.
Label list
The type of label to display for the activity or project bars in the Gantt chart.
Label position list
The position of the label above its related activity or project bar in the Gantt chart.
Label font field
The configurable options for the font.
Necking section:
Use calendar non-work time option
Determines whether to show calendar non-work time, such as holidays and
weekends. Select the option to use necking to show non-work time.
Note: To enable necking, select both the Show necking option for the bar to which
you want to apply necking and the Use calendar non-work time option. If necking
does not display, you might need to schedule the project. See Scheduling Projects for
more information.

Context-Sensitive Help Topics
593
Use activity non-work time option
Determines whether to display activity non-work time. For example, the suspension of
an activity through the use of suspend/resume dates or the non-work time of an
activity that started out of sequence.
Note: To enable necking, select both the Show necking option for the bar to which
you want to apply necking and the Use activity non-work time option. If necking does
not display, you might need to schedule the project. See Scheduling Projects for more
information.
Getting Here
1) Click Projects.
2) On the Projects navigation bar, click Activities.
3) On the Activities page:
a. Select a view from the Activity View list.
b. Click the View menu and select Customize View....
4) In the Customize Activity View dialog box, click the Bars tab.
Bars Tab of the Customize Gantt Chart Options Dialog Box of the Activities Page
Overview
Use this tab to configure properties, options, and necking of up to three bar types on the
Gantt chart of the Activities page.
Screen Elements
First/Second/Third Bar sections:
The options to modify each bar's size, height, and color. Use the Type list to determine
whether the Height and Color fields become available. If <none> is selected, other
options will not be available for modification and those bars will not be displayed.
Type list
Determines what type of bar is displayed. See About Bars.
Height list
Determines the height of the bar in pixels.
Color options
The options for selecting the color of the bar or for setting the bar to represent an
activity code.

594
Show Necking option
Determines whether the thickness of Gantt chart bars should be reduced to show
periods of non-work time. When bar necking is enabled, the horizontal bars
representing activities "neck down" during periods of inactivity.
Example: Joan starts a 5-day activity before leaving on vacation for 3 weeks and
then finishes it when she returns. Without bar necking, this simple one week activity
might look as though it took four weeks to complete because Joan was on vacation
for three weeks. With this feature, the bar appears narrow over the vacation period
while her actual progress before and after the non-work time appear in the usual
thickness.
Current Bar Options section:
Use the following options to modify the label for the current bar selection.
Show Progress option
Determines whether to display activity or project progress. Progress is displayed as a
blue bar inside the other bars in the Gantt chart.
Show Critical option
Determines how to show critical activities in the Gantt chart. Select the option to
represent critical activities with a red bar instead of the color you selected for the
Current bar.
Label list
The type of label to display for the activity or project bars in the Gantt chart.
Label position list
The position of the label above its related activity or project bar in the Gantt chart.
Label font field
The configurable options for the font.
Necking section:
Use the following options to modify necking options.
Use calendar non-work time option
Determines whether to show calendar non-work time, such as holidays and
weekends. Select the option to use necking to show non-work time.
Note: To enable necking, select both the Show necking option for the bar to which
you want to apply necking and the Use calendar non-work time option. If necking
does not display, you might need to schedule the project. See Scheduling Projects for
more information.

Context-Sensitive Help Topics
595
Use activity non-work time option
Determines whether to display activity non-work time. For example, the suspension of
an activity through the use of suspend/resume dates or the non-work time of an
activity that started out of sequence.
Note: To enable necking, select both the Show necking option for the bar to which
you want to apply necking and the Use activity non-work time option. If necking does
not display, you might need to schedule the project. See Scheduling Projects for more
information.
Tips
You must be in the Gantt chart view for the Gantt Chart Options option to be enabled.
Getting Here
1) Click Projects.
2) On the Projects navigation bar, click Activities.
3) On the Activities page:
a. Select a view from the Activity View list.
b. Click the View menu and select Gantt Chart Options.
4) In the Customize Gantt Chart Options dialog box, click the Bars tab.
Bars Tab of the Customize Gantt Chart Options Dialog Box of the Assignments Page
Overview
Use the Bars tab of the Customize Gantt Chart Options dialog box to modify the type,
height, color, and necking options of up to three bars, and additional font and progress
options for the current bar.
Screen Elements
First/Second/Third Bar areas:
Use the following options to modify each bar's type, height, color, and necking
options. Use the type list to determine whether the height and color fields become
available. If <none> is selected, other options will not be available for modification
and those bars will not be displayed.
Type list
Determines what type of bar is displayed. See About Bars.
Height list
Determines the height of the bar in pixels.

596
Color options
The options for selecting the color of the bar or for setting the bar to represent an
activity code.
Show Necking option
Determines whether the thickness of Gantt chart bars should be reduced to show
periods of non-work time. When bar necking is enabled, the horizontal bars
representing activities "neck down" during periods of inactivity.
Example: Joan starts a 5-day activity before leaving on vacation for 3 weeks and
then finishes it when she returns. Without bar necking, this simple one week activity
might look as though it took four weeks to complete because Joan was on vacation
for three weeks. With this feature, the bar appears narrow over the vacation period
while her actual progress before and after the non-work time appear in the usual
thickness.
Non-work time for resource assignment bars are based on the calendar non-work
time and activity type.
If activity type is Task Dependent then the activity’s calendar will be used for
displaying non-work time.
If activity type is Resource Dependent then the resource’s calendar will be used
for displaying non-work time.
Current Bar Options area:
Use the following options to modify the label for the current bar selection.
Show Progress option
Determines whether to indicate progress by displaying a blue bar for actuals.
Label list
The type of label to display above the assignment line in the Gantt chart.
Label position list
The position of where the label will display above its related assignments line in the
Gantt chart.
Label font field
The configurable options for the font.
Getting Here
1) Click Resources.
2) On the Resources navigation bar, click Assignments.
3) On the Assignments page, click the View menu and select Gantt Chart Options.
4) In the Customize Gantt Chart Options dialog box, click the Bars tab.

Context-Sensitive Help Topics
597
Bars Tab of the Customize Gantt Chart Options Dialog Box of the EPS Page
Overview
Use this tab to configure properties and options of up to three bar types in the Gantt
chart.
Screen Elements
First/Second/Third Bar sections:
The options to modify each bar's size, height, and color. Use the Type list to determine
whether the Height and Color fields become available. If <none> is selected, other
options will not be available for modification and those bars will not be displayed.
Type list
Determines what type of bar is displayed. See About Bars.
Height list
Determines the height of the bar in pixels.
Color option
The color applied to the bar.
Current Bar Options section:
Show Progress option
Determines whether to display activity or project progress. Progress is displayed as a
blue bar inside the other bars in the Gantt chart.
Label list
The type of label to display for the activity or project bars in the Gantt chart.
Label position list
The position of the label above its related activity or project bar in the Gantt chart.
Label font field
The configurable options for the font.
Getting Here
1) Click Projects.
2) On the Projects navigation bar, click EPS.
3) On the EPS page:
a. Select a view from the EPS View list.
b. Click the View menu and select Gantt Chart Options.

598
4) In the Customize Gantt Chart Options dialog box, click the Bars tab.
Bars Tab of the Customize Project View Dialog Box
Overview
Use this tab to customize options for Gantt chart bars.
Screen Elements
First/Second/Third Bar sections:
The options to modify each bar's size, height, and color. Use the Type list to determine
whether the Height and Color fields become available. If <none> is selected, other
options will not be available for modification and those bars will not be displayed.
Type list
Determines what type of bar is displayed. See About Bars.
Height list
Determines the height of the bar in pixels.
Color option
The color applied to the bar.
Current Bar Options section:
Show Progress option
Determines whether to display activity or project progress. Progress is displayed as a
blue bar inside the other bars in the Gantt chart.
Label list
The type of label to display for the activity or project bars in the Gantt chart.
Label position list
The position of the label above its related activity or project bar in the Gantt chart.
Label font field
The configurable options for the font.
Getting Here
1) Click Projects.
2) On the Projects navigation bar, click EPS.
3) On the EPS page:
a. Select a view from the EPS View list.

Context-Sensitive Help Topics
599
b. Click the View menu and select Customize View....
4) In the Customize Project View dialog box, click the Bars tab.
Bars Tab of the Customize Resource Assignments View Dialog Box of the Assignments Page
Overview
Use the Bars tab of the Customize Resource Assignments View to modify the type, height,
color, and necking options of up to three bars.
Screen Elements
First/Second/Third Bar areas:
Use the following options to modify each bar's type, height, and color. Use the type list
to determine whether the height and color fields become available. If <none> is
selected, other options will not be available for modification and those bars will not
be displayed.
Type list
Determines what type of bar is displayed. See About Bars.
Height list
Determines the height of the bar in pixels.
Color options
The options for selecting the color of the bar or for setting the bar to represent an
activity code.
Show Necking option
Determines whether the thickness of Gantt chart bars should be reduced to show
periods of non-work time. When bar necking is enabled, the horizontal bars
representing activities "neck down" during periods of inactivity.
Example: Joan starts a 5-day activity before leaving on vacation for 3 weeks and
then finishes it when she returns. Without bar necking, this simple one week activity
might look as though it took four weeks to complete because Joan was on vacation
for three weeks. With this feature, the bar appears narrow over the vacation period
while her actual progress before and after the non-work time appear in the usual
thickness.
Non-work time for resource assignment bars are based on the calendar non-work
time and activity type.
If activity type is Task Dependent then the activity’s calendar will be used for
displaying non-work time.
If activity type is Resource Dependent then the resource’s calendar will be used
for displaying non-work time.

600
Current Bar Options area:
Use the following options to modify the label for the current bar selection.
Show Progress option
Determines whether to indicate progress by displaying a blue bar for actuals.
Label list
The type of label to display above the assignment line in the Gantt chart.
Label position list
The position of where the label will display above its related assignments line in the
Gantt chart.
Label font field
The configurable options for the font.
Getting Here
1) Click Resources.
2) On the Resources navigation bar, click Assignments.
3) On the Assignments page, click the View and select Customize View.
4) In the Customize Resource Assignments View dialog box, click the Bars tab.
Baseline Types Page
Overview
Use this page to add and configure baseline types for projects.
Screen Elements
Baseline Types toolbar
See Enterprise Data Baseline Types Toolbar (on page 1257).
Type field
This field displays the baseline type names. You can use the baseline type name to
categorize your baselines by purpose; for example, customer sign-off, initial planning,
management sign-off, mid-project status, and what-if baselines. To edit, double-click
on a selected name. Right-click to display the Add, Delete, Find, and Find Next
options in addition to the toolbar icons.
Getting Here
1) Click the Projects menu and select Enterprise Project Data, or click the
Administer menu and select Enterprise Data.
2) In the Enterprise Data pane, expand Projects and click Baseline Types.

Context-Sensitive Help Topics
601
Baselines Dialog Box
Overview
Use this dialog box to add, select, delete, convert, or restore project baselines.
Screen Elements
Baselines Dialog Box toolbar
See Baselines Dialog Box Toolbar (on page 1243).
Baseline Name field
The name of the selected baseline. You can enter a name for a new baseline in this
field.
Baseline Type field
The baseline type; this can be used to categorize the baseline's purpose.
Data Date field
The current data date for the project.
The project status is up-to-date as of the data date. The data date is modified when
project actuals are applied.
Project Baseline field
The project baseline for the selected project.
User's Primary Baseline field
The user's primary baseline for the selected project.
Getting Here
From the Activities page:
1) Click Projects.
2) On the Projects navigation bar, click Activities.
3) On the Activities page, click the Actions menu and select Define Baselines....
From the EPS page:
1) Click Projects.
2) On the Projects navigation bar, click EPS.
3) On the EPS page, click the Actions menu and select Define Baselines....

602
BEI - Activities with No Project Baseline Finish Date Section of the Schedule Check Report
Dialog Box
Overview
Use this section to view the data on activities that matched the requirements for the
Baseline Execution Index (BEI) check. This check measures the number of activities that
have been completed as a ratio to those activities that should have been completed
according to the baseline.
Only a subset of the activities in the open projects are checked to see if they are
complete or should have been completed. WBS summary activities, activities with no
actual finish date, milestones, and Level of Effort activities are removed from the subset
to create the list of completed activities. WBS summary activities, milestones, Level of
Effort activities, and activities with a baseline finish later than the data date are removed
to create the list of activities that should have been completed. The number of
completed activities is then divided by the number of activities that should have been
completed to find the BEI ratio.
Note: If an activity does not have a Baseline Finish, then the
application assumes that the baseline is greater than the data
date. If one or more activities have no Baseline Finish, then a
section is added to the BEI section to report these activities.
Screen Elements
Project ID field
The unique identifying code of the project containing the activity which failed the
check.
Activity ID field
The unique identifying code of the activity which failed the check.
Activity Description field
The brief description of the listed activity.
Getting Here
1) Click Projects.
2) On the Projects navigation bar, click Activities.
3) On the Activities page, click the Actions menu and select Run Check
Schedule....
4) In the Check Schedule dialog box:
a. Select the BEI - Baseline Execution Index option.
b. Click Check Schedule.

Context-Sensitive Help Topics
603
5) In the Schedule Check Report dialog box, expand the BEI - Activities with no project
baseline finish date section.
Budget Log Detail Window of the EPS Page
Overview
Use this detail window to create, delete, or modify the budget log for a selected project.
A budget log specifies details about a line item, including who has signature approval,
the approval status, the reason why the expense was required, and so on.
Screen Elements
Budget Log toolbar
See Budget Log Toolbar (on page 1245).
Date field
The date of the budgeted line item.
Amount field
The amount of the budgeted line item.
Responsible field
The name of the person with signature approval for the line item.
Status field
The approval status of the line item.
Reason field
The reason why the expense was required.
Change Number field
The quantity purchased.
Tips
If you have more than one project selected, the detail window will not be visible.
Getting Here
1) Click Projects.
2) On the Projects navigation bar, click EPS.
3) On the EPS page, select a project and click the Budget Log detail window.

604
Calculations Page of the Project Preferences Dialog Box
Overview
Use this page to set options that determine how the application will handle project
calculations for activities, earned value, and units and costs.
Screen Elements
Activity Progress Removed options
Reset planned duration and units to remaining: Determines whether the application
will respread planned values to match the remaining units.
Reset remaining duration and units to planned: Determines whether the application
will respread remaining values to match the planned units.
Activity % Complete from Steps option
Determines whether to use the steps for each activity to calculate its Activity %
Complete field value.
For example, if 3 of 4 steps were selected, the Activity % Complete would be 75%.
Link Planned and At Completion option
Determines whether to recalculate all of the planned unit and cost values using the
remaining costs and units for activities that have not started.
When updating units or costs options
Add actual to remaining: Determines whether P6 Professional will calculate a new
at completion value when the remaining units or actual units change. At
Completion Units equal Remaining Units plus Actual Units.
Subtract actual from at completion: Determines whether P6 Professional will
calculate a new remaining units value when the at completion or actual units
change. Remaining Units equal At Completion Units minus Actual Units.
Link Percent Complete with Actuals option
Determines whether the actual units and cost values are recalculated when duration
percent complete is updated.
Link Actual and Period Actual Units and Cost option
Determines whether to recalculate all actual and period actual unit and cost values
using the actual values to date based on the financial period values.
Baseline to be used for earned value calculations options
Determines whether the Project Baseline or User's Primary Baseline will act as the
baseline for earned value calculations.

Context-Sensitive Help Topics
605
Getting Here
1) Click Projects.
2) On the Projects navigation bar, click EPS.
3) On the EPS page, click the Actions menu and select Set Project Preferences....
4) In the Project Preferences dialog box, click Calculations in the Project Preferences
pane.
Calendar Tab of the Global Calendars Page
Overview
Use this tab to view and specify work hours for the global calendar.
Screen Elements
Name field
The name for the new calendar.
Show Exceptions Only menu
This menu allows you to change what you see on your calendar. You can choose to
Show Exceptions Only or Show All Work Time to display specific work hours.
Month button
Displays a single month view. The left arrow displays the previous month, the right
arrow displays the following month.
Year button
Displays a 12 month view for the currently selected year. The left arrow displays the
previous year, the right arrow displays the following year.
Previous Month
Displays the previous month. Moves back one month per click.
Next Month
Displays the next month. Moves forward one month per click.
Day fields
The boxes that represent a single day. You can right-click to display Edit Calendar Day
and Set as Nonwork to edit each day to your preferences.
Standard
The application displays the day with a white background if the day consists of
standard work hours.

606
Exception
The application displays the day with a light blue background if the day consists of
hours worked but not the standard hours.
Exception Nonwork
The application displays the day with a dark blue background if there are no worked
hours and the day is not a typical Nonwork day.
Nonwork
The application displays the day with a light gray background if the day is a Standard
Nonwork day.
Getting Here
1) Click the Administer menu and select Enterprise Data.
2) In the Enterprise Data pane, expand Global and click Global Calendars.
3) On the Global Calendars page, click the Calendar tab.
Calendar Tab of the Project Calendars Page
Overview
Use this tab to view and specify work hours for the project calendar.
Screen Elements
Name field
The name for the new calendar.
Base Calendar field
The available calendars that you can use to determine exemption dates in the
current calendar.
Show Exceptions Only menu
This menu allows you to change what you see on your calendar. You can choose to
Show Exceptions Only or Show All Work Time to display specific work hours.
Month button
Displays a single month view. The left arrow displays the previous month, the right
arrow displays the following month.
Year button
Displays a 12 month view for the currently selected year. The left arrow displays the
previous year, the right arrow displays the following year.

Context-Sensitive Help Topics
607
Previous Month
Displays the previous month. Moves back one month per click.
Next Month
Displays the next month. Moves forward one month per click.
Day fields
The boxes that represent a single day. You can right-click to display Edit Calendar Day
and Set as Nonwork to edit each day to your preferences.
Standard
The application displays the day with a white background if the day consists of
standard work hours.
Exception
The application displays the day with a light blue background if the day consists of
hours worked but not the standard hours.
Exception Nonwork
The application displays the day with a dark blue background if there are no worked
hours and the day is not a typical Nonwork day.
Nonwork
The application displays the day with a light gray background if the day is a Standard
Nonwork day.
Global Exception indicator
Indicates an exception of standard work hours in the Project and/or Resource
Calendar View. Exceptions, created from the base exception calendar, include any
difference in work periods from the standard work week; these hours can be less than,
more than, or equal but different to the typical workday hours.
Getting Here
1) Click the Projects menu and select Enterprise Project Data, or click the
Administer menu and select Enterprise Data.
2) In the Enterprise Data pane, expand Projects and click Project Calendars.
3) On the Project Calendars page, click the Calendar tab.
Calendar Tab of the Resource Calendars Page
Overview
Use this tab to view and specify work hours for the resource calendar.

608
Screen Elements
Name field
The name for the new calendar.
Base Calendar field
The available calendars that you can use to determine exemption dates in the
current calendar.
Show Exceptions Only menu
This menu allows you to change what you see on your calendar. You can choose to
Show Exceptions Only or Show All Work Time to display specific work hours.
Month button
Displays a single month view. The left arrow displays the previous month, the right
arrow displays the following month.
Year button
Displays a 12 month view for the currently selected year. The left arrow displays the
previous year, the right arrow displays the following year.
Previous Month
Displays the previous month. Moves back one month per click.
Next Month
Displays the next month. Moves forward one month per click.
Day fields
The boxes that represent a single day. You can right-click to display Edit Calendar Day
and Set as Nonwork to edit each day to your preferences.
Standard
The application displays the day with a white background if the day consists of
standard work hours.
Exception
The application displays the day with a light blue background if the day consists of
hours worked but not the standard hours.
Exception Nonwork
The application displays the day with a dark blue background if there are no worked
hours and the day is not a typical Nonwork day.

Context-Sensitive Help Topics
609
Nonwork
The application displays the day with a light gray background if the day is a Standard
Nonwork day.
Global Exception indicator
Indicates an exception of standard work hours in the Project and/or Resource
Calendar View. Exceptions, created from the base exception calendar, include any
difference in work periods from the standard work week; these hours can be less than,
more than, or equal but different to the typical workday hours.
Getting Here
To access enterprise data:
1) Click the Administer menu and select Enterprise Data.
2) In the Enterprise Data pane, expand Resources and click Resource Calendars.
3) On the Resource Calendars page, click the Calendar tab.
To access enterprise resource data:
1) Click the Resources menu and select Enterprise Resource Data.
2) In the Enterprise Data pane, click Resource Calendars.
3) On the Resource Calendars page, click the Calendar tab.
Calendar Tab of the View Calendar Dialog Box
Overview
Use this tab to view work hours for the calendar.
Screen Elements
Base Calendar field
The calendar that is used as the basis of the current calendar.
Show Exceptions Only menu
Determines whether to display exceptions only or to show all work time.
Month button
Displays a single month view. The left arrow displays the previous month, the right
arrow displays the following month.
Year button
Displays a 12 month view for the currently selected year. The left arrow displays the
previous year, the right arrow displays the following year.
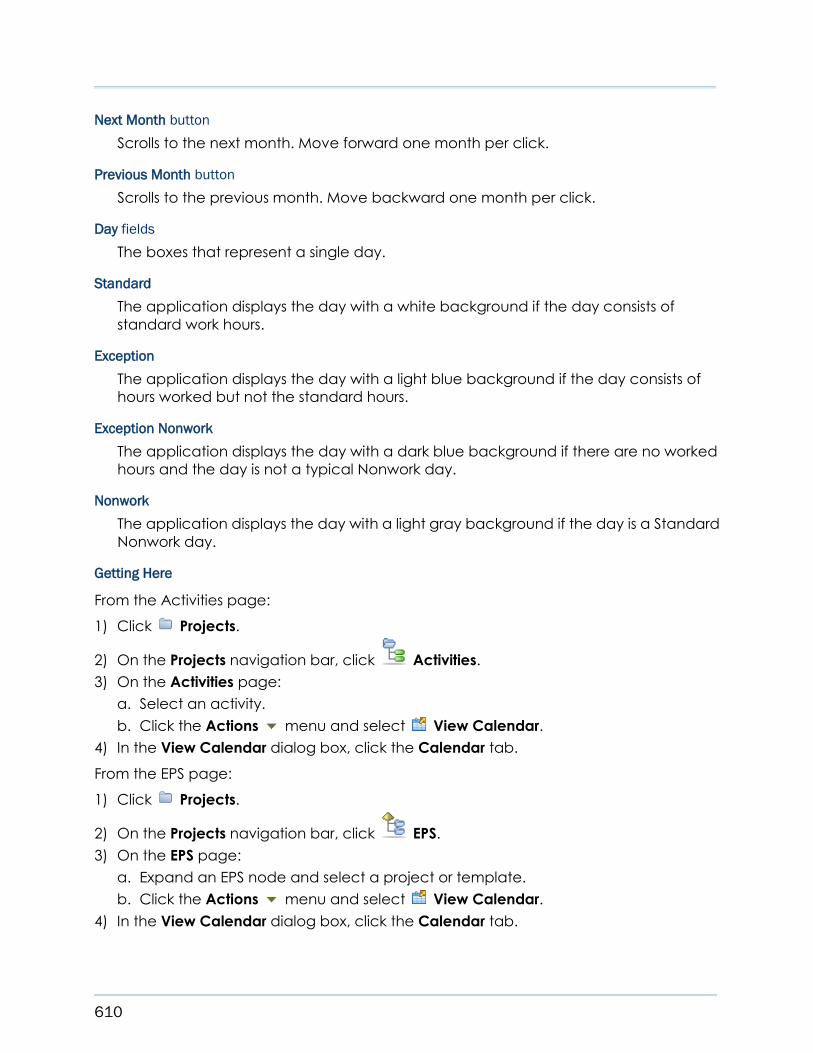
610
Next Month button
Scrolls to the next month. Move forward one month per click.
Previous Month button
Scrolls to the previous month. Move backward one month per click.
Day fields
The boxes that represent a single day.
Standard
The application displays the day with a white background if the day consists of
standard work hours.
Exception
The application displays the day with a light blue background if the day consists of
hours worked but not the standard hours.
Exception Nonwork
The application displays the day with a dark blue background if there are no worked
hours and the day is not a typical Nonwork day.
Nonwork
The application displays the day with a light gray background if the day is a Standard
Nonwork day.
Getting Here
From the Activities page:
1) Click Projects.
2) On the Projects navigation bar, click Activities.
3) On the Activities page:
a. Select an activity.
b. Click the Actions menu and select View Calendar.
4) In the View Calendar dialog box, click the Calendar tab.
From the EPS page:
1) Click Projects.
2) On the Projects navigation bar, click EPS.
3) On the EPS page:
a. Expand an EPS node and select a project or template.
b. Click the Actions menu and select View Calendar.
4) In the View Calendar dialog box, click the Calendar tab.

Context-Sensitive Help Topics
611
Calendar Tab of the View Calendar Dialog Box
Overview
Use this tab to view work hours for the calendar.
Screen Elements
Base Calendar field
The available calendars that you can use to determine exemption dates in the
current calendar.
Show Exceptions Only menu
This menu allows you to change what you see on your calendar. You can choose to
Show Exceptions Only or Show All Work Time to display specific work hours.
Month button
Displays a single month view. The left arrow displays the previous month, the right
arrow displays the following month.
Year button
Displays a 12 month view for the currently selected year. The left arrow displays the
previous year, the right arrow displays the following year.
Previous Month
Displays the previous month. Moves back one month per click.
Next Month
Displays the next month. Moves forward one month per click.
Day fields
The boxes that represent a single day. You can right-click to display Edit Calendar Day
and Set as Nonwork to edit each day to your preferences.
Standard
The application displays the day with a white background if the day consists of
standard work hours.
Exception
The application displays the day with a light blue background if the day consists of
hours worked but not the standard hours.
Exception Nonwork
The application displays the day with a dark blue background if there are no worked
hours and the day is not a typical Nonwork day.

612
Nonwork
The application displays the day with a light gray background if the day is a Standard
Nonwork day.
Getting Here
1) Click Resources.
2) On the Resources navigation bar, click Assignments.
3) On the Assignments page:
a. Click on a resource name.
b. Click Actions and select View Calendar.
4) In the View Calendar dialog box, click the Calendar tab.
Calendar View Format of the Activities Page
Overview
Use this alternative viewing format for the Activities page to display and edit your
project's activities in a familiar monthly calendar.
Screen Elements
Activities toolbar
In the Calendar View, the Edit toolbar is not displayed. See Activities Toolbar (on page
1182).
Next Month
Scrolls forward to the next month in a Calendar View.
Previous Month
Scrolls backward to the previous month in a Calendar View.
Today link
Returns to the current day.
Day View detail window
See Day View Detail Window of the Calendar View of the Activities Page (on page
703).
Hovering over an activity bar will display:
Project ID
The unique identifier assigned to the project.

Context-Sensitive Help Topics
613
Project Name
The name of the project.
Activity ID
The activity identifier that is unique within the project.
Activity Name field
The name of the activity.
Tips
When more activities are scheduled on a day than can be displayed in a day of the
Calendar View, an ellipsis is displayed within the day.
Getting Here
1) Click Projects.
2) On the Projects navigation bar, click Activities.
3) On the Activities page, select a project, WBS element, or activity, click the View
menu and select Calendar View.
Cause Detail Window of the Risks Page
Overview
Use this detail window to write a description of the cause of the selected risk.
Screen Elements
Text Editor toolbar
See Text Editor Toolbar (on page 1352).
Work area
Use this area to enter text and modify it using the Text Editor Toolbar.
Getting Here
1) Click Projects.
2) On the Projects navigation bar, click Risks.
3) On the Risks page, click the Cause detail window.
Change Password Dialog Box of the Users Page
Overview
Use this dialog box to change the password for the selected user.

614
Screen Elements
New Password field
When the Password Policy is disabled in Application Settings, the password must be
between 1 and 20 characters. P6 EPPM does not allow blank passwords.
When the Password Policy is enabled in Application Settings, the password must
be between 8 and 20 characters and contain at least one number and one letter.
Confirm New Password field
To confirm the change, enter the new password.
When the Password Policy is disabled in Application Settings, the password must be
between 1 and 20 characters. P6 EPPM does not allow blank passwords.
When the Password Policy is enabled in Application Settings, the password must
be between 8 and 20 characters and contain at least one number and one letter.
Getting Here
1) Click the Administer menu and select User Access.
2) On the User Access page, click Users.
3) On the Users page, right-click a Login Name and click Change Password
(Ctrl+Shift+F9).
Chart Tab of the Customize Project Issues Dialog Box
Overview
Use this tab to select a chart type and color theme in addition to displaying what group
by and filter criteria the chart is based on. This tab applies only when you select to display
issues in Chart format.
Additional information in the Chart group by and Chart filter by sections lets you know
what group and filter criteria the issue count data in the chart is based on. You can
change these grouping and filtering selections on the Group and Filter tabs. Note that
the Chart tab applies only when you select to display issues in Chart format.
Screen Elements
Select the chart format area
Chart Type list
The formats in which to display your issues. Select from:

Context-Sensitive Help Topics
615
Histogram: A bar chart that displays issue count information based on your Level 1
and Level 2 grouping selections on the Group tab. For example, if your Level 1 Group
by selection is Status, and your Level 2 Group by selection is Priority, the histogram
chart displays the number of issues for each Status field value: Open, Closed, or On
Hold. It also displays the number of issues for each Priority field value: Top, High,
Normal, Low, Lowest. If you do not have a Level 2 Group by selection, the chart
displays information based only on your Level 1 Group by selection.
The sort order you specify for the Level 2 Group by selection on the Group tab
determines the order in which the columns appear, left to right, on the chart; an
ascending sort order lists values from lowest to highest, and a descending sort order
lists values from highest to lowest. If you do not have a Level 2 Group by selection, the
chart displays the sort order you specify for the Level 1 Group by selection.
Stacked Histogram: A stacked bar chart that displays issue count information based
on your Level 1 and Level 2 grouping selections on the Group tab. For example, if your
Level 1 Group by selection is Status, and your Level 2 Group by selection is Priority, the
histogram chart displays the number of issues for each Status field value: Open,
Closed, or On Hold. It also displays the number of issues for each Priority field value:
Top, High, Normal, Low, Lowest. Note that you must have both Level 1 and Level 2
grouping selections to display this type of chart.
The sort order you specify for the Level 2 Group by selection on the Group tab
determines the order in which the columns appear, left to right, on the chart; an
ascending sort order lists values from lowest to highest, and a descending sort order
lists values from highest to lowest.
Pie Chart: Displays issue count information based on your Level 1 grouping selection
on the Group tab. Each slice of the pie chart displays the number of issues assigned to
each Level 1 Group by selection field value. For example, if your Level 1 Group by
selection is Status, the pie chart represents the number of issues for each Status field
value: Open, Closed, or On Hold.
The sort order you specify for the Level 1 Group by selection on the Group tab
determines the order in which the slices appear, clockwise, in the chart; an
ascending sort order lists values from lowest to highest, and a descending sort by
order lists values from highest to lowest.
You can select to display the chart in either Primary Colors or Pastel Colors from the
Color Theme list.
Color Theme list
Determines whether to display the color theme in pastel or primary colors.
Chart Group by area
The area on the Chart tab where you can see grouping information.
Field field
The field chosen on the Group tab.

616
Sort Order field
The order in which the information is sorted; chosen on the Group tab.
To change the chart Group by settings, click the Group tab. link
Redirects the page to the Group tab in the Customize Project Issues dialog box.
Chart Filter area
The issue information presented in the chart will be filtered based on the criteria set on
the Filter tab.
To change the chart Filter settings, click the Filter tab. link
Redirects the page to the Filters tab of the Customize Project Issues dialog box.
Getting Here
From the Issues page:
1) Click Projects.
2) On the Projects navigation bar, click Issues.
3) On the Issues page, click the Customize link.
4) In the Customize Project Issues dialog box, click the Chart tab.
From the Workspace page:
1) Click Projects.
2) On the Projects navigation bar, click Workspace.
3) On the Workspace page, expand the Project Issues portlet and click Customize.
4) In the Customize Project Issues dialog box, click the Chart tab.
From the Dashboards page:
1) Click Dashboards.
2) On the Dashboards page, select a dashboard tab.
3) On the dashboard tab, expand the My Issues portlet and click Customize.
4) In the Customize My Issues dialog box, click the Chart tab.
Check Schedule Dialog Box
Overview
Use this dialog box to define and select criteria on which to run a report and check the
health of the schedule.
Screen Elements
Logic option
Determines whether this information will be used as criteria on which to run the report.

Context-Sensitive Help Topics
617
This check identifies activities that do not have a predecessor and successor. This
helps to identify how well the schedule is linked together. The default target is less
than 5 percent.
Negative Lags option
Determines whether this information will be used as criteria on which to run the report.
This check identifies negative lag relationships between activities. This helps to avoid
critical path and total float distortion in the schedule. The default target is less than 1
percent.
Lags option
Determines whether this information will be used as criteria on which to run the report.
This check identifies positive lag relationships between activities, showing the
relationships that might constrain a schedule. The default target is less than 5 percent.
Long Lags option
Determines whether this information will be used as criteria on which to run the report.
The value in the field should have a number and a time abbreviation. This value is
stored in hours. The default value is 352h (44 days at 8 hours per day).
This check identifies lags that are longer than the value you specify. The default target
is less than 5 percent.
Relationship Types option
Determines whether this information will be used as criteria on which to run the report.
This check identifies Finish to Start relationships. The default target is greater than 90
percent.
Hard Constraints option
Determines whether this information will be used as criteria on which to run the report.
This check identifies the constraints that prevent activities from being moved because
of schedule logic. The default target is less than 1 percent.
Soft Constraints option
Determines whether this information will be used as criteria on which to run the report.
This check identifies the constraints that do not prevent an activity from being moved
because of schedule logic. The default target is less than 5 percent.
Large Float option
Determines whether this information will be used as criteria on which to run the report.
The value in the field should have a number and a time abbreviation. The default
value is 352h (44 days at 8 hours per day).

618
This check identifies activities with a total float longer than the value you specify.
Activities with a large float might be missing predecessors or successors. A high
number of large floats might indicate that the network is unstable and not logic
driven. The default target is less than 1 percent.
Negative Float option
Determines whether this information will be used as criteria on which to run the report.
This check identifies activities with a total float less than 0. Activities with a negative
float need to be justified. Negative float might indicate that the schedule needs to be
corrected. The default target is less than 1 percent.
Large Durations option
Determines whether this information will be used as criteria on which to run the report.
The value in the field should have a number and a time abbreviation. The default
value is 352h (44 days at 8 hours per day).
This check identifies activities with a remaining duration greater than the value you
specify. Large duration activities could potentially be broken down into more discrete
activities that provide better insight into cost and schedule. The default target is less
than 5 percent.
Invalid Progress Dates option
Determines whether this information will be used as criteria on which to run the report.
This check identifies actual dates that occur after the data date or incomplete
activity dates scheduled before the data date. This helps to identify activities with
invalid dates. The default target is less than 1 percent.
Resource/Cost option
Determines whether this information will be used as criteria on which to run the report.
This check identifies the resources/costs assigned to each activity. A plan without
resources and costs is not as meaningful. The default target is less than 1 percent.
Late Activities option
Determines whether this information will be used as criteria on which to run the report.
This check identifies activities that are planned to finish later than their baseline finish.
This indicates how well the project is performing against the currently selected
baseline. The default target is less than 5 percent.
BEI option
Determines whether the Baseline Execution Index (BEI) will be used as criteria on
which to run the report.
This check measures the number of activities that have been completed as a ratio to
those activities that should have been completed according to the baseline. The
default target is a BEI of 0.95 or greater.

Context-Sensitive Help Topics
619
Target selector
Determines the value associated with the option. If the value follows a < symbol, the
target is to have the option item be less than the listed value. If the value follows a >
symbol, the target is to have the option item be greater than the listed value. The
value is a percentage for all checks except BEI which is a ratio.
Getting Here
1) Click Projects.
2) On the Projects navigation bar, click Activities.
3) On the Activities page, click the Actions menu and select Run Check
Schedule....
Check Summary Section of the Schedule Check Report Dialog Box
Overview
Use this section to view a summary of project health based on the checks in the report.
Screen Elements
Check field
The type of check.
Description field
The brief summary of the check.
Target field
The target value. You select this value using the Target selector in the Check Schedule
dialog box.
Actual field
The percentage of the items found that match the check divided by the total
number of items checked. The Actual field for the BEI check displays a ratio. The cell is
green if you hit your target, red if the target was missed.
Found field
The number of items found that match the check criteria.
Total field
The total number of items that were checked when the report ran.
Getting Here
1) Click Projects.
2) On the Projects navigation bar, click Activities.

620
3) On the Activities page, click the Actions menu and select Run Check
Schedule....
4) In the Check Schedule dialog box, click Check Schedule.
5) In the Schedule Check Report dialog box, expand the Check Summary section.
Codes Detail Window of the Activities Page
Overview
Use this detail window to assign codes to activities, edit a code value assignment, or
remove a code assignment.
Screen Elements
Codes toolbar
See Codes Toolbar of the Activities Page (on page 1248).
Activity Code field
The code that uniquely identifies the activity within the project.
Code Value field
The alphanumeric or descriptive value of the activity code.
Code Description field
The description provided for the activity code when it was created.
Tips
If you have more than one activity selected, the detail window will not be visible.
Getting Here
1) Click Projects.
2) On the Projects navigation bar, click Activities.
3) On the Activities page, select an activity and click the Activity Codes detail window.
Codes Detail Window of the EPS Page
Overview
Use this detail window to assign codes to projects, edit a code value assignment, or
remove a code assignment.

Context-Sensitive Help Topics
621
Screen Elements
Codes toolbar
See Codes Toolbar of the EPS Page (on page 1249).
Name field
The name assigned to the selected project code.
Value field
The value assigned to the selected project code.
Description field
A more detailed summary for the item. The description provides more information
than short names or titles. It can give background information or establish a purpose
for the item. These details help differentiate between items with similar names and are
especially useful in multi-user environments.
Tips
If you have more than one project selected, the detail window will not be visible.
Getting Here
1) Click Projects.
2) On the Projects navigation bar, click EPS.
3) On the EPS page, select a project and click the Codes detail window.
Codes Detail Window of the Global Security Profiles Page
Overview
Use this detail window to assign codes privileges to the selected global security profile.
Screen Elements
Privilege field
The name of the security permission that is assigned (option selected) or denied
(option cleared) to users of the currently selected profile.
Privilege option
The option in the column header that determines whether the privileges are all
assigned (selected), all denied (clear), or individually configured (indicated with a
dash or - sign).

622
Add Global Activity Codes option
Determines whether the profile will enable users to create global activity codes and
code values data. This privilege also selects the 'Edit Global Activity Codes' global
privilege.
Edit Global Activity Codes option
Determines whether the profile will enable users to modify global activity codes data.
This privilege also enables users to create, modify, and remove global activity code
values.
Delete Global Activity Codes option
Determines whether the profile will enable users to remove global activity codes and
code values data. This privilege also selects the 'Add Global Activity Codes' and 'Edit
Global Activity Codes' global privileges.
Add Global Issue Codes option
Determines whether the profile will enable users to create global issue codes and
code values data. This privilege also selects the 'Edit Global Issue Codes' global
privilege.
Edit Global Issue Codes option
Determines whether the profile will enable users to modify global issue codes data.
This privilege also enables users to create, modify, and remove global issue code
values.
Delete Global Issue Codes option
Determines whether the profile will enable users to remove global issue codes and
code values data. This privilege also selects the 'Add Global Issue Codes' and 'Edit
Global Issue Codes' global privileges.
Add Project Codes option
Determines whether the profile will enable users to create project codes and code
values data. This privilege also selects the 'Edit Project Codes' global privilege.
Edit Project Codes option
Determines whether the profile will enable users to modify project codes data. This
privilege also enables users to create, modify, and remove project code values.
Delete Project Codes option
Determines whether the profile will enable users to remove project codes and code
values data. This privilege also selects the 'Add Project Codes' and 'Edit Project
Codes' global privileges.

Context-Sensitive Help Topics
623
Add Resource Codes option
Determines whether the profile will enable users to create resource codes and code
values data. This privilege also selects the 'Edit Resource Codes' global privilege.
Edit Resource Codes option
Determines whether the profile will enable users to modify resource codes data. This
privilege also enables users to create, modify, and remove resource code values.
Delete Resource Codes option
Determines whether the profile will enable users to remove resource codes and code
values data. This privilege also selects the 'Add Resource Codes' and 'Edit Resource
Codes' global privileges.
Add/Delete Secure Codes option
Determines whether the profile will enable users to create and remove all secure
project codes, global and EPS-level activity codes, and resource codes and code
values data, as well as all secure issue codes and code values data. This privilege also
selects the 'Edit Secure Codes,' 'Assign Secure Codes,' and 'View Secure Codes'
global privileges.
Edit Secure Codes option
Determines whether the profile will enable users to modify all secure project codes,
global and EPS-level activity codes, and resource codes and code values data, as
well as all secure issue codes and code values data. This privilege also selects the
'Assign Secure Codes' and 'View Secure Codes' global privileges.
Assign Secure Codes option
Determines whether the profile will enable users to assign all secure project codes,
global and EPS-level activity codes, and resource codes and code values data, as
well as all secure issue codes and code values data. This privilege also selects the
'View Secure Codes' global privilege.
View Secure Codes option
Determines whether the profile will enable users to display all secure project codes,
global and EPS-level activity codes, and resource codes and code values data, as
well as all secure issue codes and code values data.
Getting Here
1) Click the Administer menu and select User Access.
2) On the User Access page, click Global Security Profiles.
3) On the Global Security Profiles page, click the Codes detail window.

624
Codes Detail Window of the Project Security Profiles Page
Overview
Use this detail window to assign codes privileges to the selected project security profile.
Screen Elements
Privilege field
The name of the security permission that is assigned (option selected) or denied
(option cleared) to users of the currently selected profile.
Privilege option
The option in the column header that determines whether the privileges are all
assigned (selected), all denied (clear), or individually configured (indicated with a
dash or - sign).
Add Project Activity Codes option
Determines whether the profile will enable users to create project activity codes and
code values data. This privilege also selects the 'Edit Project Activity Codes' project
privilege.
Edit Project Activity Codes option
Determines whether the profile will enable users to modify project activity codes
data. This privilege also enables users to create, modify, and remove project activity
code values.
Delete Project Activity Codes option
Determines whether the profile will enable users to remove project activity codes and
code values data. This privilege also selects the 'Add Project Activity Codes' and 'Edit
Project Activity Codes' project privileges.
Add EPS Activity Codes option
Determines whether the profile will enable users to create EPS-level activity codes
and code values. This privilege also selects the 'Edit EPS Activity Codes' project
privilege.
Edit EPS Activity Codes option
Determines whether the profile will enable users to modify the name of EPS-level
activity codes. This privilege also enables users to create, modify, and remove
EPS-level activity code values.
Delete EPS Activity Codes option
Determines whether the profile will enable users to remove EPS-level activity codes
and code values data. This privilege also selects the 'Add EPS Activity Codes' and 'Edit
EPS Activity Codes' project privileges.

Context-Sensitive Help Topics
625
Getting Here
1) Click the Administer menu and select User Access.
2) On the User Access page, click Project Security Profiles.
3) On the Project Security Profiles page, click the Codes detail window.
Codes Detail Window of the Resources Tab of the Administration Page
Overview
Use this detail window to view and assign resource codes to the selected resource.
Screen Elements
Add (Insert)
Assigns a resource code to the resource.
Delete (Delete)
Deletes or removes the currently selected data items or table rows.
Caution: Your selected data is permanently deleted once you click Save.
Resource selector (Ctrl+Up Arrow) or (Ctrl+Down Arrow)
Cycles through the available resources and determines which data display in the
detail window. Click (Ctrl+Up Arrow) to move to the previous resource, or click
(Ctrl+Down Arrow) to move to the next resource. The content in the detail window is
refreshed with the data for the selected resource.
Name field
The name of the assigned resource code.
Value field
The resource code value assigned to the selected resource.
Description field
The description of the associated resource code.
Getting Here
1) Click Resources.
2) On the Resources navigation bar, click Administration.
3) On the Administration page, click the Resources tab.
4) On the Resources tab, click the Codes detail window.

626
Codes Section of the Activity Form Page
Overview
Use this section to assign activity codes and edit and remove code assignments.
Screen Elements
Assign Activity Codes link
Opens a dialog box in which you can search for and select an activity code to assign.
See Working with 'Select a Value' Dialog Boxes for further details on how to use the
dialog box.
Activity Code field
The code that uniquely identifies the activity within the project. Click an activity code
to display the Details page for the activity code. See Activity Codes Details Page of
the Activity Form Page (on page 554).
Code Value field
The value of the assigned code.
Description field
A more detailed summary for the item. The description provides more information
than short names or titles. It can give background information or establish a purpose
for the item. These details help differentiate between items with similar names and are
especially useful in multi-user environments.
Getting Here
From the Workgroup Workspace page:
1) Click Projects.
2) On the Projects navigation bar, click Workspace.
3) On the Workspace page, expand any portlet containing activities.
4) In the portlet, click an activity.
5) On the Activity Form page, expand the Codes section.
From the Dashboards page:
1) Click Dashboards.
2) On the Dashboards page, select a dashboard tab.
3) On the dashboard tab, expand any portlet containing activities.
4) In the portlet, click an activity.
5) On the Activity Form page, expand the Codes section.

Context-Sensitive Help Topics
627
Columns Tab of the Customize Activity View Dialog Box
Overview
Use this tab to modify the the columns of your activity view.
Screen Elements
Available Columns list
The list of columns available for display. Double-clicking a column in the Available
Columns list moves it to the Selected Columns list.
Selected Columns list
The columns you selected from the Available Columns list. Double-clicking a column
in the Selected Columns list removes it from the list. See Configuring Columns or
Values, for help configuring the list of selected columns.
Columns Options section:
Sort by list
The element used to sort items in the table and Gantt chart.
Sort Order list
Determines whether the application sorts values in ascending or descending order.
Show first column as list
The list of fields names to use as the first or first and second columns in the view.
Font field
The font, size, and style from the Table Font dialog box. These configurable options will
be applied to the columns.
Tips
For a full list of available columns, see Available Columns of the Activities Page (on page
1189).
Getting Here
1) Click Projects.
2) On the Projects navigation bar, click Activities.
3) On the Activities page:
a. Select a view from the Activity View list.
b. Click the View menu and select Customize View....
4) In the Customize Activity View dialog box, click the Columns tab.

628
Columns Tab of the Customize Cost Worksheet Dialog Box
Overview
Use this tab to modify options for displaying columns.
Screen Elements
Customize Columns area
Use this area to configure which columns display. See Configuring Columns or Values
for further details.
Sort by list
Determines the column sort criteria.
Sort Order list
Determines whether the application sorts values in ascending or descending order.
Default button
Changes all fields to default settings.
Getting Here
From the Workspace page:
1) Click Projects.
2) On the Projects navigation bar, click Workspace.
3) On the Workspace page, expand the Cost Worksheet portlet.
4) In the Cost Worksheet portlet, click Customize.
5) In the Customize Project Cost Worksheet dialog box, click the Columns tab.
From the Dashboards page:
1) Click Dashboards.
2) On the Dashboards page, select a dashboard.
3) On the selected dashboard, expand the Cost Worksheet portlet.
4) In the Cost Worksheet portlet, click Customize.
5) In the Customize Dashboard Cost Worksheet dialog box, click the Columns tab.
Columns Tab of the Customize Project Issues Dialog Box
Overview
Use this tab to configure options for modifying displayed columns.

Context-Sensitive Help Topics
629
Screen Elements
Select the custom columns to display area
The area where you can configure which columns display. See Configuring Columns
or Values.
Sort by list
Determines the column sort criteria.
Sort Order list
Determines how columns are sorted.
Default button
Changes all fields to default settings.
Getting Here
From the Issues page:
1) Click Projects.
2) On the Projects navigation bar, click Issues.
3) On the Issues page, click Customize.
4) In the Customize Project Issues dialog box, click the Columns tab.
From the Workspace page:
1) Click Projects.
2) On the Projects navigation bar, click Workspace.
3) On the Workspace page, expand the Project Issues portlet and click Customize.
4) In the Customize Project Issues dialog box, click the Columns tab.
From the Dashboards page:
1) Click Dashboards.
2) On the Dashboards page, select a dashboard tab.
3) On the dashboard tab, expand the My Issues portlet and click Customize.
4) In the Customize My Issues dialog box, click the Columns tab.
Columns Tab of the Customize Project Statistics Dialog Box
Overview
Use this dialog box to configure columns for the Project Statistics portlet.
Screen Elements
See Common Screen Elements for Customizing Columns or Values (on page 634).

630
Sort by list
Determines the column sort criteria.
Sort Order list
Determines how columns are sorted.
Getting Here
From the Workspace page:
1) Click Projects.
2) On the Projects navigation bar, click Workspace.
3) On the Workspace page, click Customize.
4) On the Customize page, click the Content tab and expand the Project Performance
section.
5) In the Project Performance section, expand Project Statistics and click Customize
Columns.
6) In the Customize Project Statistics dialog box, click the Columns tab.
From the Dashboards page:
1) Click Dashboards.
2) On the Dashboards page, select a dashboard tab.
3) On the dashboard tab, click Customize.
4) On the Dashboard Details page, click the Content tab and expand the Project
Performance section.
5) In the Project Performance section, expand Project Statistics and click Customize.
6) In the Customize Project Statistics dialog box, click the Columns tab.
Columns Tab of the Customize Project View Dialog Box
Overview
Use this tab to modify the the columns of your project view.
Screen Elements
Available Columns list
The list of columns available for display. Double-clicking a column in the Available
Columns list moves it to the Selected Columns list.
Selected Columns list
The columns you selected from the Available Columns list. Double-clicking a column
in the Selected Columns list removes it from the list. See Configuring Columns or
Values, for help configuring the list of selected columns.

Context-Sensitive Help Topics
631
Column Options section:
Sort by list
The element used to sort items in the table and Gantt chart.
Sort Order list
Determines whether the application sorts values in ascending or descending order.
Show first column as list
The list of fields names to use as the first or first and second columns in the view.
Font field
The font, size, and style from the Table Font dialog box. These configurable options will
be applied to the columns.
Tips
For a full list of available columns, see Available Columns of the EPS Page (on page 1223).
Getting Here
1) Click Projects.
2) On the Projects navigation bar, click EPS.
3) On the EPS page:
a. Select a view from the EPS View list.
b. Click the View menu and select Customize View....
4) In the Customize Project View dialog box, click the Columns tab.
Columns Tab of the Customize Resource Assignments View Dialog Box of the Assignments
Page
Overview
Use this tab to modify the columns available in the assignments view.
Screen Elements
Available Columns list
The list of columns available for display. Double-clicking a column in the Available
Columns list moves it to the Selected Columns list.
Selected Columns list
The columns you selected from the Available Columns list. Double-clicking a column
in the Selected Columns list removes it from the list. See Configuring Columns or
Values, for help configuring the list of selected columns.

632
Customizing Columns
See Customize Columns or Values.
Column Options area
Provides options that affect the display of columns and the content you choose to
present.
Sort by list
The element used to sort items in the table and Gantt chart.
Sort Order list
Determines whether the application sorts values in ascending or descending order.
Show first column as list
The list of fields names to use as the first or first and second columns in the view.
Font field
The font, size, and style from the Table Font dialog box. These configurable options will
be applied to the columns.
Tips
For a full list of available columns, see Available Columns of the Assignments Page (on
page 1213).
Getting Here
1) Click Resources.
2) On the Resources navigation bar, click Assignments.
3) On the Assignments page, click View and select Customize View.
4) In the Customize Resource Assignments View dialog box, click the Columns tab.
Columns Tab of the Customize Risks Portlet Dialog Box
Overview
Use this tab to configure the columns in the My Risks portlet on a dashboard or the
Project Risks portlet on a project workspace.
Screen Elements
Customize Columns area
See Configuring Columns or Values.
Getting Here
From the Dashboards page:

Context-Sensitive Help Topics
633
1) Click Dashboards.
2) On the Dashboards page, select a dashboard.
3) On the dashboard, expand the My Risks portlet and click Customize.
4) In the Customize Risks dialog box, click the Columns tab.
From the Workspace page:
1) Click Projects.
2) On the Projects navigation bar, click Workspace.
3) On the Workspace page, expand the Project Risks portlet and click Customize.
4) In the Customize Risks dialog box, click the Columns tab.
Columns Tab of the Customize Scorecards Dialog Box of the Portfolio Views Section of the
Customize Dashboard Page
Overview
Use this tab to configure the display of columns in a scorecard portfolio view.
Screen Elements
Select the custom columns to display area
Configure the columns to display in the scorecard. See Configuring Columns or
Values.
Sort by list
Determines the column sort criteria.
Sort Order list
Determines whether the application sorts values in ascending or descending order.
Show Project Requests option
Determines whether to analyze potential projects along with approved projects in the
scorecard. If you select this option, only a limited number of columns will display
values for the requested projects. If you choose to show requested projects, they will
not be included in a scorecard if the page on which you are viewing the scorecard is
filtered by a portfolio. Filter by code or EPS element instead to view project requests.
Getting Here
1) Click Dashboards.
2) On the Dashboards page, select a dashboard.
3) On the dashboard, click Customize.
4) On the Dashboard Details page, click the Content tab.
5) On the Content tab, expand the Portfolio Views section and expand a view.

634
6) In the view section, select Scorecard from the Type list and click Customize.
7) In the Customize Scorecard dialog box, click the Columns tab.
Columns Tab of the Customize Spreadsheet Dialog Box of the Planning Page
Overview
Use the Columns tab of the Customize Spreadsheet dialog box to modify which columns
are viewed in the Planning spreadsheet. See Customize Columns or Values for further
details.
Screen Elements
Available Columns list
The list of columns available for display. Double-clicking a column in the Available
Columns list moves it to the Selected Columns list.
Selected Columns list
The columns you selected from the Available Columns list. Double-clicking a column
in the Selected Columns list removes it from the list. See Configuring Columns or
Values, for help configuring the list of selected columns.
Getting Here
1) Click Resources.
2) On the Resources navigation bar, click Planning.
3) On the Planning page, click the Customize link.
4) In the Customize Spreadsheet dialog box, click the Columns tab.
Common Screen Elements for Customizing Columns or Values
Overview
When the list of available fields or columns for a table is relatively long, use the set of
screen elements described below to customize them. Essentially, you move the items you
want from the available side to the selected side.
This common set of controls appears throughout the application and offers similar
functionality for customizing the fields, columns, or values you want to add or remove
from a list, table, view, scorecard, or other entity.
Screen Elements
Available columns or values
The list of all the available fields or values for the item you are configuring. If arranged
in a hierarchy, click to expand a group and view its sub-items.

Context-Sensitive Help Topics
635
Selected columns or values
The list of selected fields or values you want to appear in your customized list, table,
view, scorecard, or other entity. The order of the items in the list from top to bottom
corresponds to their order in the table from left to right.
Select Items (Ctrl+Alt+Right Arrow)
Adds the selected item or items from the available list to the selected list.
Deselect Items (Ctrl+Alt+Left Arrow)
Removes the selected item or items from the selected list.
Move Item Up (Ctrl+Alt+Up Arrow)
Advances the selected item up in the sequence (moves a table column to the left).
Move Item Up (Ctrl+Alt+Down Arrow)
Advances the selected item down in sequence (moves a table column to the right).
Communication Center Portlet of the Dashboards Page
Overview
Use this portlet to communicate with other users who are associated with a project. All of
your associated projects are listed in the portlet. You can communicate with all or only
select project team members.
Screen Elements
Name field
The project name. The arrow displays the associated user name or resource name for
project team members.
Office Phone field
The office phone number for the resource.
Project association field
The team member's association with the project.
E-Mail tab
Displays the Send an e-mail link.
Send an e-mail link
Sends an e-mail to the resource team.
The link displays a dialog box that displays the e-mail address(es) of the selected
team members and allows for you to enter alternate e-mail addresses in the Cc field.

636
Tips
The "No information is available" message displays in this portlet if no project teams or
team members meet the filtering criteria specified for a dashboard or Project
Workspace.
Click a project name link to open its activities page.
Getting Here
1) Click Dashboards.
2) On the Dashboards page, select a dashboard.
3) On the dashboard, expand the Communication Center portlet.
Communication Center Portlet of the Workspace Page
Overview
Use this portlet to share data and communicate with other P6 users who are associated
with a project, including the project owner. All projects you are associated with are listed
in the portlet; you can select to communicate with all of a project's team members or
with members you select.
Screen Elements
Name field
The project name and the user's Personal Name or Resource Name for Project Team
Members.
Office Phone field
The office phone number for the resource.
Project association field
The team member's association with the project.
Send an e-mail link
Sends an e-mail to the resource team.
The link displays a dialog box that displays the e-mail address(es) of the selected
team members and allows for you to enter alternate e-mail addresses in the Cc field.
Getting Here
1) Click Projects.
2) On the Projects navigation bar, click Workspace.
3) On the Workspace page, expand the Communication Center portlet.
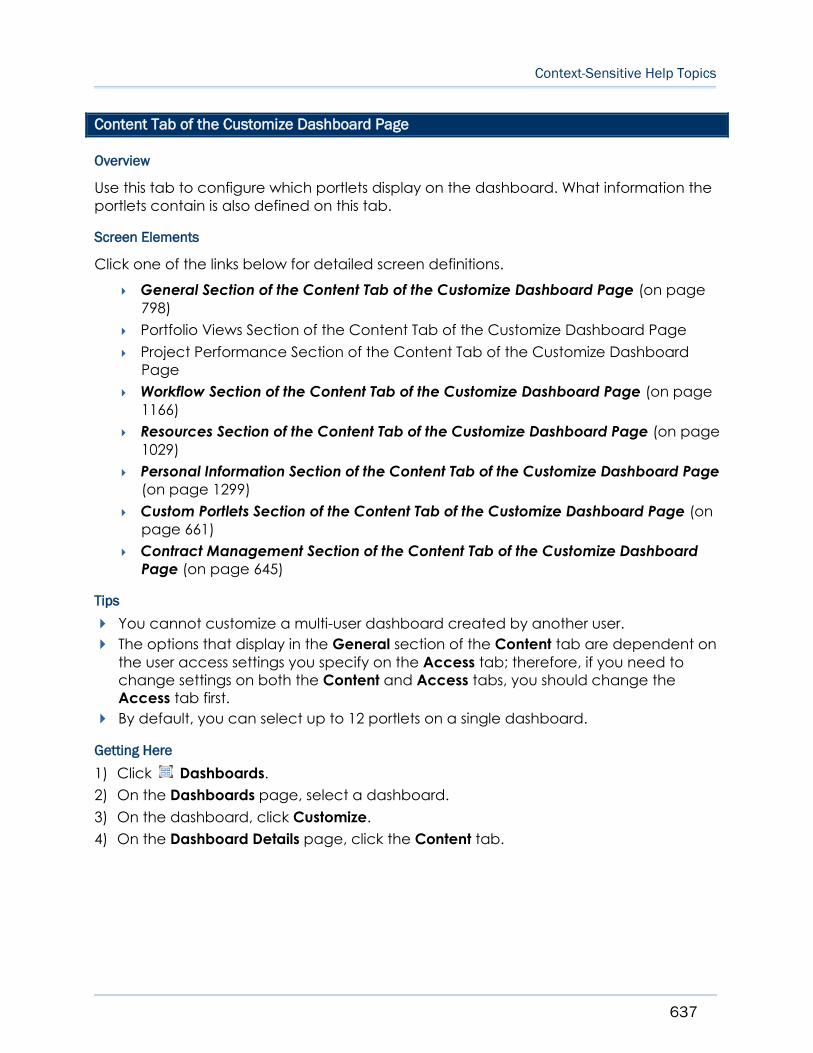
Context-Sensitive Help Topics
637
Content Tab of the Customize Dashboard Page
Overview
Use this tab to configure which portlets display on the dashboard. What information the
portlets contain is also defined on this tab.
Screen Elements
Click one of the links below for detailed screen definitions.
General Section of the Content Tab of the Customize Dashboard Page (on page
798)
Portfolio Views Section of the Content Tab of the Customize Dashboard Page
Project Performance Section of the Content Tab of the Customize Dashboard
Page
Workflow Section of the Content Tab of the Customize Dashboard Page (on page
1166)
Resources Section of the Content Tab of the Customize Dashboard Page (on page
1029)
Personal Information Section of the Content Tab of the Customize Dashboard Page
(on page 1299)
Custom Portlets Section of the Content Tab of the Customize Dashboard Page (on
page 661)
Contract Management Section of the Content Tab of the Customize Dashboard
Page (on page 645)
Tips
You cannot customize a multi-user dashboard created by another user.
The options that display in the General section of the Content tab are dependent on
the user access settings you specify on the Access tab; therefore, if you need to
change settings on both the Content and Access tabs, you should change the
Access tab first.
By default, you can select up to 12 portlets on a single dashboard.
Getting Here
1) Click Dashboards.
2) On the Dashboards page, select a dashboard.
3) On the dashboard, click Customize.
4) On the Dashboard Details page, click the Content tab.

638
Content Tab of the Customize Workgroup Workspace Page
Overview
Use this tab to customize the content that is available on the Workgroup Workspace
page.
Screen Elements
Issues option
Determines whether associated issues of the selected workgroup are displayed. See
Customize Project Issues Dialog Box (on page 686) for further details.
Activities option
Determines whether activities associated with the selected workgroup are displayed.
Workgroup Name field
The name of the selected workgroup. Click a name to open the Workgroup
Workspace for that workgroup.
Maximum number of rows displayed in Workgroup lists field
The maximum number of rows displayed in a workgroup list. If the number of rows in a
portlet exceeds the number specified in the 'Maximum number of rows displayed in
Workgroup lists' field, Prev and Next links appear.
Last modified by < > on < > field
The name of the user who last modified the information on the Content tab and the
date and time of modification.
Getting Here
From the Workgroup Workspace page:
1) Click Projects.
2) On the Projects navigation bar, click Workspace.
3) On the Workspace page, expand the Workgroups portlet and select a workgroup.
4) On the Workgroup Workspace page, click Customize.
5) On the Customize page, click the Content tab.
From the Dashboards page:
1) Click Dashboards.
2) On the Dashboards page, select a dashboard tab.
3) On the dashboard tab, expand the My Workgroups portlet and select a workgroup.
4) On the Workgroup Workspace page, click Customize.
5) On the Customize page, click the Content tab.

Context-Sensitive Help Topics
639
Content Tab of the User Interface View Details Page
Overview
Use this tab to configure the menu items, pages, and dashboards users of the current
user interface view are permitted to view.
Screen Elements
User Interface View Name field
The unique name for the User Interface View. The naming scheme you choose for user
interface views might reflect the roles or permissions of their intended users. For
example, Intern, Associate, Project Staff, Manager, and Executive are all possible user
interface view names in a series offering distinct but sometimes overlapping access to
menus and pages.
Administer section
Enables you to customize which administrative functions you can access from the
Administer menu.
Menu Items options
Determines which Administer menu items you can access. By selecting the Menu
Items option itself, you can access all menu items.
Application Settings: Enables your organization to define a series of
application-wide parameters and values that apply globally and to set defaults
and settings that affect how the application behaves. For example, configure
general application settings including calendar and activity duration defaults,
URLs for related applications, summarization time periods (also used to store past
period performance actuals), and also enable the optional password policy
setting.
Enterprise Data: Enables you to define series of application-wide data that apply
to all projects. For example, you can set global data, such as currencies and
financial periods; project data, such as baseline types and funding sources;
activity data, such as activity codes and step templates; resource data, such as
rate types and units of measure; risk data, such as risk categories and scoring
matrices; issue data, such as issue codes and UDFs; and document data, such as
document categories and statuses.
User Access: Enables you to create user accounts, assign access, manage the
organizational breakdown structure (OBS) and configure profiles.
User Interface Views: Enables you to create pre-configured sets of options you
assign to users so their view of Dashboards, Portfolios, Projects, Resources, and
Administration is optimized for their role. User interface views permit visibility to
features essential for a user's role while hiding functionality that is not applicable.

640
Dashboards section
Enables you to customize which functions you can access from the Dashboards
menu.
Menu Items options
Determines which functions you can access under the Dashboards menu. By
selecting the Menu Items option itself, you can acccess all menu items.
Manage Dashboards: Enables you to access Dashboards, which are customizable
pages consisting of the data you need to perform your role. Dashboard data
appears in one or more smaller regions called portlets.
Approve Timesheets: Enables you to approve timesheets submitted through P6
Progress Reporter. Timesheets allow users to record hours for assigned activities.
Displayed Dashboards option
Lists the dashboards you can access, based on what your P6 administrator assigned
to you.
Assign link
Allows the administrator to assign Global or Multiple User dashboards to the user
interface view.
Remove link
Allows the administrator to remove dashboards from the user's view.
Move Down
Moves the selected item one level down in the sort order.
Move Up
Moves the selected item one level up in the sort order.
Portfolios section
Enables you to customize which functions you can access from the Portfolios
menu and which pages you can access within the Portfolios section.
Menu Items option
Determines which functions you can access from the Portfolios menu. By
selecting the Menu Items option itself, you can acccess all menu items.
Manage Portfolio Views: Enables you to create, modify, and delete portfolio views.
A portfolio view is a scorecard or chart providing high-level information spanning
an entire group of projects.
Manage Scenarios: Enables you to create, modify, or delete scenarios, and
determine who can access them. A scenario is a snapshot of historical project
data; you can use it to compare against the latest summarized data, or to
compare to other scenarios.
Context-Sensitive Help Topics
641
Open Portfolio: Enables you to open a group of projects by EPS, code, or portfolio.
Manage Portfolios: Enables you to review the list of projects in each portfolio, and
to create, modify, and delete portfolios.
Pages option
Determines which pages you can access. If you select the Pages option itself, you
can access all pages.
Portfolio Analysis: Use this page to analyze portfolio data, conduct side-by-side
comparisons of two project groups, and apply what-if scenarios and waterline
analysis techniques to assist with executive-level critical decision making.
Capacity Planning: Use this page to analyze role allocation and cost over time.
Performance Status: Use this page to display summarized schedule and cost or
labor unit data based on the performance metric you select.
Gantt Chart: Use this page to display timescaled performance or earned value
schedule information at the WBS level, along with unit or cost data, in a
spreadsheet or histogram.
ROI: Use this page to display cost/benefit information based on live data for the
open project group.
Details: Use this page to modify a group of projects, called a portfolio.
Projects section
Enables you to customize which functions you can access from the Projects
menu and which pages you can access within the Projects section.
Menu Items option
Determines which functions you can access from the Projects menu. By
selecting the Menu Items option itself, you can acccess all menu items.
Open Projects: Enables you to open projects by EPS, project code, or portfolio.
Enterprise Project Data: Enables you to configure project-related enterprise
project for your entire organization.
Scheduled Services: Enables you to schedule, verify status, modify, and delete
routine recurring project management jobs, called services.
Pages option
Determines which pages you can access. If you select the Pages option itself, you
can access all pages.
EPS: Use this page to manage the Enterprise Project Structure (EPS) and its projects.
The EPS page displays schedules for any single project or group of projects you
choose with detail windows, a Gantt chart, and a table.
Activities: Use this page as your central project management tool for all project
activities and their associated details. This includes all WBS elements, activities,
steps, issues, notebooks, resource assignments, risks, and other details.

642
Workspace: Use this page to view information specific to each project, including
project management and project performance information.
Team Usage: Use this page to view cost or usage data at the team level and for
individual roles and resources assigned to the project you are working with.
Issues: Use this page to view a list or chart of all the issues for the currently open
projects or portfolios.
Documents:
With a content repository enabled: Use this page to view, check in, check
out, and download selected documents from one or more projects,
associate additional items with a selected document, and compare
documents across projects.
Without a content repository enabled: Use this page to view document
details and send e-mail about a document.
Risks: Use this page to add, modify, or delete project risks.
Resources section
Enables you to customize which functions you can access from the Resources
menu and which pages you can access within the Resources section.
Menu Items option
Determines whether to display the Resources menu, which provides the option to
view the Enterprise Resource Data page.
Pages option
Determines which pages you can access. If you select the Pages option itself, you
can access all pages.
Administration: Use this page to create, modify, and delete resources, resource
teams, roles, and role teams.
Planning: Use the Resource Planning spreadsheet on the Planning page to specify,
review, or modify project-level and WBS-level allocation data for individual
resources and roles across a project lifecycle.
Assignments: Use this page to view and modify resource assignment data using
filters, which enables you to view resource assignment data for only the resources
or projects that you need to view.
Analysis: Use this page to compare resource utilization between resource teams,
project resources, and department resource, all from one central location.
Getting Here
To modify an existing user interface view:
1) Click the Administer menu and select User Interface Views.
2) On the User Interface Views page, click a View.
3) On the Details of page, click the Content tab.

Context-Sensitive Help Topics
643
To modify a new user interface view:
1) Click the Administer menu and select User Interface Views.
2) On the User Interface Views page, click Create User Interface View.
3) In the Copy from Existing User Interface View dialog box, click New User Interface
View or an existing view and click OK.
4) On the Create User Interface View page, click the Content tab.
Content Tab of the Workspace Details Page
Overview
Use this tab to customize the content that is available on the Workspace page.
Screen Elements
Project section
See Project Section of the Content Tab of the Customize Workspace Page (on page
967).
Contract Management section
See Contract Management Section of the Content Tab of the Customize Workspace
Page (on page 646).
Custom Portlets section
See Custom Portlet Section of the Content Tab of the Customize Workspace Page (see
"Custom Portlet Section of the Content Tab of the Workspace Page" on page 661).
Performance Threshold section
See Performance Threshold Section of the Content Tab of the Customize Workspace
Page (see "Performance Threshold Section of the Content Tab of the Workspace Page"
on page 918).
Project Collaboration section
See Project Collaboration Section of the Content Tab of the Customize Workspace
Page (see "Project Collaboration Section of the Content Tab of the Workspace Details
Page" on page 954).
Project Performance section
See Project Performance Section of the Content Tab of the Customize Workspace
Page.
Maximum number of rows displayed in project workspace lists field
The maximum number of rows you want to appear in Project Workspace portlet lists.
When a list contains more rows than the number specified, Prev and Next links will
appear. The default setting is 10 rows.

644
Note: Some portlets do not adhere to this setting and instead use scroll bars to include
more data than will fit in an alloted space.
Last modified by < > on < > field
The name of the user who last modified the information on the Content tab and the
date and time of modification.
Getting Here
1) Click Projects.
2) On the Projects navigation bar, click Workspace.
3) On the Workspace page, click Customize.
4) On the Customize page, click the Content tab.
Contract Documents Portlet of the Workspace Page
Overview
Available only in environments integrating P6 with Contract Management, this portlet
displays document types, such as change orders or contracts, from Contract
Management. Select a document type and log in to access the document or create a
new document.
Screen Elements
Contract Documents portlet
Click the document name to open the document in Contract Management, which
will open in a new browser. This information can be accessed with a valid user name
and password.
Getting Here
1) Click Projects.
2) On the Projects navigation bar, click Workspace.
3) On the Workspace page, expand the Contract Documents portlet.
Contract Issues Portlet of the Workspace Page
Overview
The Contract Issues portlet displays the number of issues based on status that exist for the
project in Contract Management. If you have a valid user name and password, you can
additionally access Contract Management from this portlet to view detailed information
about issues for a specific status.

Context-Sensitive Help Topics
645
Screen Elements
Contract Issues portlet
The Contract Issues portlet displays current issues, including the number of new and
closed issues. Place the cursor over a section of the chart to display the number of
issues for that type.
Getting Here
1) Click Projects.
2) On the Projects navigation bar, click Workspace.
3) On the Workspace page, expand the Contract Issues portlet.
Contract Management Page of the Project Preferences Dialog Box
Overview
Use this page to link the selected project to a Contract Management project.
Screen Elements
Group Name: Project Name field
The name of the Contract Management project.
Getting Here
1) Click Projects.
2) On the Projects navigation bar, click EPS.
3) On the EPS page, click the Actions menu and select Set Project Preferences....
4) In the Project Preferences dialog box, click Contract Management in the Project
Preferences pane.
Contract Management Section of the Content Tab of the Customize Dashboard Page
Overview
Use this section to enable and configure the Cost Worksheet portlet in the currently
selected dashboard.
Screen Elements
Cost Worksheet option
Determines whether to display the Cost Worksheet portlet. Use the following
configurable options to modify this portlet:
Customize link: Displays a dialog box with configurable options for modifying the
spreadsheet columns and grouping displayed in the Cost Worksheet portlet.

646
Allow Team Members to view this section option: Determines whether to allow
users with a Team Member module access setting to view this section.
Getting Here
1) Click Dashboards.
2) On the Dashboards page, select a dashboard.
3) On the dashboard, click the Customize link.
4) On the Customize Dashboard page, expand the Contract Management section.
Contract Management Section of the Content Tab of the Customize Workspace Page
Overview
Use this section to customize which portlets relating to Contract Management will
appear on the Workspace page.
Screen Elements
Contract Issues option
Determines whether to display the Contract Issues portlet. Use the following
configurable options to modify this portlet:
Customize link: Displays a dialog box with configurable options for modifying the
Issues chart displayed in the Contract Issues portlet.
Allow Team Members to view this section option: Determines whether to allow
users with a Team Member module access setting to view this section.
Contract Documents option
Determines whether to display the Contract Documents portlet. Use the following
configurable options to modify this portlet:
Customize link: Displays a dialog box with configurable options for selecting
documents displayed in the Contract Documents portlet.
Allow Team Members to view this section option: Determines whether to allow
users with a Team Member module access setting to view this section.
Contract Reports option
Determines whether to display the Contract Reports portlet. Use the following
configurable options to modify this portlet:
Customize link: Displays a dialog box with configurable options for selecting
reports displayed in the Contract Reports portlet.
Allow Team Members to view this section option: Determines whether to allow
users with a Team Member module access setting to view this section.

Context-Sensitive Help Topics
647
Cost Worksheet option
Determines whether to display the Cost Worksheet portlet. Use the following
configurable options to modify this portlet:
Customize link: Displays a dialog box with configurable options for modifying the
spreadsheet columns and grouping displayed in the Cost Worksheet portlet.
Allow Team Members to view this section option: Determines whether to allow
users with a Team Member module access setting to view this section.
Request for Information (RFI) option
Determines whether to display the Request for Information (RFI) portlet. Use the
following configurable options to modify this portlet:
Customize link: Displays a dialog box with configurable options for modifying the
Request for Information chart displayed in the portlet.
Allow Team Members to view this section option: Determines whether to allow
users with a Team Member module access setting to view this section.
RFI Turnaround Time option
Determines whether to display the RFI Turnaround Time portlet. Use the following
configurable options to modify this portlet:
Customize link: Displays a dialog box with configurable options for modifying the
RFI Turnaround Time chart displayed in the portlet.
Allow Team Members to view this section option: Determines whether to allow
users with a Team Member module access setting to view this section.
Safety option
Determines whether to display the Safety portlet. Use the following configurable
options to modify this portlet:
Customize: Displays a dialog box with configurable options for modifying the
Safety chart displayed in the portlet.
Allow Team Members to view this section: Determines whether to allow users with a
Team Member module access setting to view this section.
Submittals option
Determines whether to display the Submittals portlet. Use the following configurable
options to modify this portlet:
Customize link: Displays a dialog box with configurable options for modifying the
Submittals chart displayed in the portlet.
Allow Team Members to view this section option: Determines whether to allow
users with a Team Member module access setting to view this section.
Getting Here
1) Click Projects.
2) On the Projects navigation bar, click Workspace.

648
3) On the Workspace page, click Customize.
4) On the Customize Workspace page, click the Content tab and expand the Contract
Management area.
Contract Reports Portlet of the Workspace Page
Overview
Use this portlet to view reports from Contract Management. Available only in
environments integrating P6 with Contract Management, this portlet displays reports from
Contract Management. If you have a valid user name and password for the Contract
Management, click any one of these reports to open it directly from the workspace.
Screen Elements
Contract Reports portlet
Click a report name to open the report in Contract Management which will display in
a new browser. This information can only be accessed if you have a valid user name
and password.
Getting Here
1) Click Projects.
2) On the Projects navigation bar, click Workspace.
3) On the Workspace page, expand the Contract Reports portlet.
Copy Project Options Dialog Box
Overview
Use this dialog box to select the project data that will be copied along with the project.
Screen Elements
Project & WBS Data options:
Documents option
Determines whether or not to copy document data to the project.
Funding Sources option
Determines whether to copy funding source data to the project or template.
Issues option
Determines whether or not to copy issue data to the project.

Context-Sensitive Help Topics
649
Risks option
Determines whether or not to copy risk data to the project or template.
Activities option
Determines whether to copy activity data to the project or template.
Notebooks option
Determines whether to copy project notebook data to the project or template.
WBS Milestones option
Determines whether to copy WBS milestone data to the project or template.
High Level Resource Planning Assignments option
Determines whether to copy high-level resource planning assignment data to the
project.
Reports option
Determines whether to copy report data to the project.
Summary Data option
Determines whether to copy summary data to the project.
Activity Data options:
Activity Codes option
Determines whether or not to copy activity code data to the project or template.
Expenses option
Determines whether to copy expense data to the project or template.
Activity Notebooks option
Determines whether to copy activity notebook data to the project or template.
Relationships option
Determines whether to copy relationship data to the project or template.
Resource and Role Assignments option
Determines whether or not to copy resources and role assignment data to the project
or template.
Steps option
Determines whether to copy step data to the project or template.
Financial Period Data option
Determines whether to copy financial period data to the project.

650
Baselines options:
Select the Include option for each baseline with data that you want to copy to the
project.
Tips
You can also select the Copy option from the Edit menu. The same is true when
pasting the project.
You can only copy and paste one project at a time. Once you have pasted a
project, Paste is disabled. To paste the project again, you must copy the project
again.
The project will be pasted wherever you right-click and select Paste.
Getting Here
1) Click Projects.
2) On the Projects navigation bar, click EPS.
3) On the EPS page:
a. Right-click a project to copy and select Copy (Ctrl+C).
b. Right-click and select Paste (Ctrl+V).
Cost Accounts Page
Overview
Use this page to add and configure cost accounts.
Screen Elements
Cost Accounts toolbar
See Enterprise Data Cost Accounts Toolbar (on page 1260).
ID field
The ID you assign to the cost account.
Name field
The name you assign to the cost account. Cost accounts are established in a
hierarchy. For example, if you created a cost account for a project component such
as hardware, you would create other cost accounts beneath this component to
show its parts such as coding and installation.
Description field
The description of each corresponding cost account.
Description detail Window
See Description Detail Window of the Cost Accounts Page (on page 709).

Context-Sensitive Help Topics
651
Tips
By clicking ID, Name, or Description, the fields can be arranged in an ascending,
descending, or the standard order of creation for each.
Right-click in any field to display the options to Add, Add Child, Delete, Cut, Copy,
Paste, Find, and Find Next.
Getting Here
1) Click the Projects menu and select Enterprise Project Data, or click the
Administer menu and select Enterprise Data.
2) In the Enterprise Data pane, expand Activities and click Cost Accounts.
Cost Worksheet Portlet
Overview
Use this portlet to view cost data for all linked projects. Available only in environments
integrating P6 with Contract Management. This enables you to have a more complete
view of projects and their contract status.
Screen Elements
Cost Worksheet
The central location where costing information can be collected and tracked in
addition to quickly reviewing the financial status of the project.
The Cost Worksheet tracks costs distributed from contracts, Purchase Orders,
requisitions, Proposals, Change Orders, and trends. Use the Cost Worksheet to closely
track budgeted costs, committed costs, actual expenditures, and budget revisions
caused by changes in Contract Management.
Customize link
Displays a dialog box or page that allows you to configure the current page, tab,
dialog box, or portlet. See Customize Cost Worksheet Dialog Box (on page 674).
Tips
If you have the required privilege, you can customize the Cost Worksheet portlet to
specify up to twenty columns to appear in the portlet. These are in addition to the
default Cost Code column.
Getting Here
From the Workspace page:
1) Click Projects.
2) On the Projects navigation bar, click Workspace.

652
3) On the Workspace page, select a project from the Select Project list and expand the
Cost Worksheet portlet.
From the Dashboards page:
1) Click Dashboards.
2) On the Dashboards page, select a dashboard tab.
3) On the dashboard tab, expand the Cost Worksheet portlet.
Count Dialog Box of the Users Page
Overview
Use this dialog box to view the number of users assigned to each module.
Screen Elements
Export to Excel
Exports all data as it appears in the current view to a Microsoft® Excel spreadsheet
(.xls) file. Customize the rows to display only the data you want to export.
Prints the current page, table, chart, or item.
Module field
The name of each module. This field is read-only.
User Count field
The User Count for each module. This field is read-only. You can also use the Users
dialog box to quickly display the number of users assigned to access each P6 EPPM
module. This will be help track how many licenses are assigned to P6 EPPM since the
removal of the license file constraint.
Getting Here
1) Click the Administer menu and select User Access.
2) On the User Access page, click Users.
3) On the Users tab, click Count.
Create Filter Dialog Box of the Assignments Page
Overview
Use the Create Filter dialog box of the Assignments page to define criteria and user
access for a new filter.

Context-Sensitive Help Topics
653
Screen Elements
Name field
The name of the new or selected filter.
Create Filter dialog box tabs:
Definition Tab of the Create Filter Dialog Box of the Assignments Page (on page 706)
Access Tab of the Create Filter Dialog Box of the Assignments Page (on page 535)
Getting Here
1) Click Resources.
2) On the Resources navigation bar, click Assignments.
3) On the Assignments page, click Filters menu on the view toolbar or view menu
and select Add New Filter.
Create or Modify Filter Dialog Box of the Activities Page
Overview
Use this dialog box to define the criteria and user access for a new filter.
Screen Elements
Name field
The name of the new or selected filter.
Definition tab
See Definition Tab of the Create or Modify Filter Dialog Box of the Activities Page (see
"Definition Tab of the Create or Modify Filter Dialog Box" on page 707).
Access tab
See Access Tab of the Create or Modify Filter Dialog Box of the Activities Page (see
"Access Tab of the Create or Modify Filter Dialog Box" on page 535).
Getting Here
To access the Create Filter dialog box:
1) Click Projects.
2) On the Projects navigation bar, click Activities.
3) On the Activities page:
a. Select a view from the Activity View list.
b. Click View the menu and select Customize View....
4) In the Customize Activity View dialog box, click the Filters tab.

654
5) On the Filters tab, click Add New Filter.
To access the Modify Filter dialog box:
1) Click Projects.
2) On the Projects navigation bar, click Activities.
3) On the Activities page:
a. Select a view from the Activity View list.
b. Click the View menu and select Customize View....
4) In the Customize Activity View dialog box, click the Filters tab.
5) On the Filters tab, select a filter and click Modify Filter.
Create Portfolio Page
Overview
Use this page to create and configure a group of projects, called a portfolio. Use
portfolios to group multiple projects spanning EPS and project code boundaries that are
most relevant to you so you can review and analyze data at a summary level. You can
even create portfolios of other portfolios.
Screen Elements
Portfolio Name field
The unique name of the project portfolio according to its access type, user specific or
global.
For example, two users could have a portfolio with the same name, but no two global
portfolios can have the same name.
Manage this portfolio options
Manually option
By Filter option
This portfolio is available to options
Choose a user access option for the portfolio.
Current User: Only you, the currently logged in user, will be able to view this
portfolio.
All Users: Every user will be able to view this global portfolio.
Another User: Only the user you select will be able to view this portfolio.
Project Selection area
For manually managed portfolios, use this area to configure the projects in your
portfolio. Move projects from the Available Projects side to the Selected Projects side.
See Customize Columns or Values.

Context-Sensitive Help Topics
655
If By Filter option is chosen under the Manage this Portfolio field, the following options
appear:
Select Filter Criteria
Select from one of the following options:
All of the following: Only projects meeting all the filter criteria will be included in the
portfolio.
Any of the following: Projects meeting any one of the filter criteria will be included
in the portfolio.
Parameter field
A field from one of the following options:
General
User Defined Fields
Project Codes
Is field
Select from one of the following options:
equals
is not equal to
Getting Here
1) Click the Portfolios menu and choose Manage Portfolios.
2) On the Manage Portfolios page, click the Create Project Portfolio link.
Critical Activities Behind Schedule Portlet of the Workspace Page
Overview
Use this portlet to view all project activities identified as critical. This means they have zero
or negative float, a zero or negative finish date variance, and are behind schedule for
the project.
Screen Elements
Activity indicator
A visual indicator of the activity type and its current status within the WBS or project.
Possible indicators include:
The activity has not yet started.
The activity has started and is in progress.
The activity has finished.
The activity has been identified as critical.
The activity is a milestone.

656
Activity field
The name of the activity.
Days Late field
The number of workperiods that an activity has been delayed.
Total Float field
The number of workperiods that an activity can be delayed without affecting the
project finish date.
Tips
When you schedule the project, critical activities are identified according to the
scheduling options you select. You can identify critical activities using a total float
threshold, the longest path of activities in the schedule, or multiple critical float paths.
A "No information is available" message appears when a project baseline has not
been specified, the current project is set as the project baseline, or there are no
critical activities behind schedule.
Click an activity name to views its details.
Getting Here
1) Click Projects.
2) On the Projects navigation bar, click Workspace.
3) On the Workspace page, expand the Critical Activities behind Schedule portlet.
Currencies Page
Overview
Use this page to configure the monetary unit or base currency used to store cost data for
all projects in the database. You can also add and configure monetary units on this
page.
Screen Elements
Currencies toolbar
See Currencies Toolbar (see "Enterprise Data Currencies Toolbar" on page 1261).
Base Exchange Rate field
Displays the exchange rate between the selected currency and the base currency.
The exchange rate for the base currency is always 1.0. When a user selects a different
currency than the base currency to view cost data, the base currency value is
multiplied times the current exchange rate for the view currency to calculate the
values displayed in cost and price fields.

Context-Sensitive Help Topics
657
For example, if the base currency is U.S. Dollars, the view currency is Euros, and the
exchange rate for Euros is .75, a value of $10 stored in the database is displayed as 7.5
Euros in cost and price fields. Similarly, if you enter 7.5 Euros in a cost or price field, it is
stored in the database as $10.
Currency Symbol field
The symbol used to define the currency. Double-click to edit. Allows one to three
non-numeric characters or symbols.
Decimal Digits field
The number of decimal places the currency will show. Double-click to edit.
Decimal Symbol field
The symbol used for decimal places. Click the arrow to choose period or comma.
Digit Grouping System field
The available options to group digits. Click the arrow to choose period or comma.
ID field
The abbreviation (ID) for the currency. Double-click to edit. This field allows one to six
alpha-numeric characters or symbols. The characters must be in uppercase.
Name field
The name chosen for the currency. Double-click to edit. This field allows 1-80
alpha-numeric characters or symbols.
Negative Format field
The format used to show the currency value as negative. Click the arrow to choose a
negative format.
Positive Format field
The format used to show the currency value as positive. Click the arrow to choose a
positive format.
Tips
The base currency is the monetary unit used to store cost data for all projects in the
database and is controlled by a global administrative setting in P6. The default base
currency for P6 EPPM is US dollars ($). The view currency is the monetary unit used to
display cost data in P6 EPPM and is controlled by a user preference.
The exchange rate for the base currency is always 1.0. When a user selects a different
currency than the base currency to view cost data, the base currency value is multiplied
times the current exchange rate for the view currency to calculate the values displayed
in cost and price fields.

658
For example, if the base currency is U.S. Dollars, the view currency is Euros, and the
exchange rate for Euros is .75, a value of $10 stored in the database is displayed as 7.5
Euros in cost and price fields. Similarly, if you enter 7.5 Euros in a cost or price field, it is
stored in the database as $10.
When data is displayed in a view currency that is different than the base currency, some
cost and price values can vary slightly (e.g., due to rounding). As long as the correct
base currency is selected during database installation, a user can view completely
accurate cost and price data by changing the view currency to match the base
currency.
For information on adding view currencies, refer to Adding a Currency.
Getting Here
1) Click the Administer menu and select Enterprise Data.
2) In the Enterprise Data pane, expand Global and click Currencies.
Currency Section of Global Tab of the My Preferences Page
Overview
Use this section to specify a currency type, symbol, and number of decimal places to be
used throughout the application.
Screen Elements
Currency field
The preferred currency for viewing cost data.
Show decimal places option
Determines whether to display decimal places.
Show currency symbol option
Determines whether to display the chosen currency symbol.
Getting Here
1) Click the Administer menu and select My Preferences.
2) On the My Preferences page, click the Global tab.
3) On the Global tab, expand the Currency section.

Context-Sensitive Help Topics
659
Curve Definition Detail Window of the Resource Curves Page
Overview
Use this detail window to view and configure the graphical representation of the
selected resource curve. Resource curves allow the user to specify the allocation of
resources and costs over the duration of an activity. Resource units and costs are
distributed evenly throughout an activity unless you specify nonlinear distribution using
resource curves. You can add a new curve, which is based on the default linear curve, or
copy and modify one of the default resource curves or an existing Global curve to
create a custom global resource curve.
Screen Elements
Prorate
Prorate allows you to adjust values in the curve window proportionally to retain the
curve's shape while making the bars equal to 100%. If the curve does not equal 100%,
the curve will automatically prorate when you click save.
Getting Here
1) Click the Resources menu and select Enterprise Resource Data, or click the
Administer menu and select Enterprise Data.
2) In the Enterprise Data pane, expand Resources and click Resource Curves.
3) On the Resource Curves page, click the Curves Definition detail window.
Custom Field Mapping Tab of the Modify Template Dialog Box of the Import/Export Project
Dialog Box
Overview
Use this tab to customize field mappings for imports and exports.
Screen Elements
Select Subject Area list
Determines the area of the product for which you want to define custom field
mappings.
Project Management field list
The user defined field to map to the Microsoft Project field.
Microsoft Project field list
The field from Microsoft Project for which you can map to a user defined field in P6.
(This field is read-only.)

660
Tips
The Import or Export Type must be set as Microsoft Project XML (2007) to enable the
options icons.
Getting Here
1) Click Projects.
2) On the Projects navigation bar, click EPS.
3) On the EPS page, click the Actions menu and select Import/Export XML Project
Import/Export.
4) In the Import/Export Project dialog box, click the Import or Export tab.
5) On the Import or Export tab:
a. Select Microsoft Project XML (2007) from the Import or Export Type list.
b. Click MSP Export Template Options or MSP Import Template Options.
6) In the Modify Template dialog box, click the Custom Field Mapping tab.
Custom Portlet
Overview
Use this portlet as a convenient access point to frequently used web sites, intranets, and
other online data.
Screen Elements
Title field
The name you assign to a custom portlet when it is configured. This title appears on
the dashboard or workspace to identify the portlet.
URL content
The content associated with the URL you specified for this custom portlet.
Getting Here
From the Dashboards page:
1) Click Dashboards.
2) On the Dashboards page, select a dashboard.
3) On the dashboard, expand the Custom portlet.
From the Workspace page:
1) Click Projects.
2) On the Projects navigation bar, click Workspace.
3) On the Workspace page, expand the Custom portlet.

Context-Sensitive Help Topics
661
Custom Portlet Section of the Content Tab of the Workspace Page
Overview
Use this area to create custom portlets in the workspace.
Screen Elements
Add link
Adds a new portlet ready for customization.
Custom Portlet option
Determines whether to display a specific title and URL as the content of a custom
portlet in a dashboard.
Title field: The name that displays in the title bar of the custom portlet.
URL field: The URL of the interface for the custom portlet.
Getting Here
1) Click Projects.
2) On the Projects navigation bar, click Workspace.
3) On the Workspace page, click Customize.
4) On the Customize page, click the Content tab.
5) On the Content tab, expand the Custom Portlets area.
Custom Portlets Section of the Content Tab of the Customize Dashboard Page
Overview
Use this section to create and modify portlets that link out to URLs that you specify.
Screen Elements
Add link
Adds a new portlet ready for customization.
Custom Portlet option
Determines whether to display a specific title and URL as the content of a custom
portlet in a dashboard.
Title field: The name that displays in the title bar of the custom portlet.
URL field: The URL of the interface for the custom portlet.
Getting Here
1) Click Dashboards.
2) On the Dashboards page, select a dashboard.

662
3) On the dashboard, click the Customize link.
4) On the Dashboard Details page, click the Content tab.
5) On the Content tab, expand the Custom Portlets section.
Customize Activity List for WBS Dialog Box
Overview
Use this dialog box to configure the columns you want to view on the Activities for WBS
dialog box from within a portfolio view of type scorecard.
Screen Elements
Available Columns
A list of the fields or columns available for you to select for the view or list you are
customizing.
Selected Columns
The fields or columns you have selected in order of importance.
Getting Here
1) Open a portfolio in the Portfolios section using one of the following methods:
Click Portfolios to open the last portfolio you were working with.
Click the Portfolios menu and choose one of the most-recently used
portfolios.
Click the Portfolios menu and choose Open Portfolio to select a group of
projects by portfolio type, EPS node, or project code.
2) On the Portfolios navigation bar, click Portfolio Analysis.
3) On the Portfolio Analysis page, select a scorecard from the View field.
4) In the scorecard, select a WBS.
5) In the Activities column, click the View link.
6) On the Activity List for WBS dialog box, click Customize.
Customize Activity Network Dialog Box of the Activities Page
Overview
Use this dialog box to configure the displayed information on the Activity Network page.

Context-Sensitive Help Topics
663
Screen Elements
Activity Box section:
Split Row option
Determines whether to display two fields for the row in the activity box. Selecting the
option causes the Second field lists to become active.
Each activity box contains four rows by default. Each row can be divided into two
sections, allowing for up to eight fields to be displayed per activity box. Click the lists
to select the content to be displayed.
Field lists
Determines what will display in the first four rows of the activity box.
Second field lists
The options to be used as the four possible secondary fields that display in an activity
box when the Split Row option is selected for a row.
Preview section
The beforehand look at the composition of the activity box. The options and list values
you select in the Activity Box section affect what is displayed in this section.
Options section:
Expand Grouping Bands to Level list
The value to expand up to 20 or all grouping bands.
Show Only Driving Relationships option
Determines whether to show only driving relationships between activities in the
Activity Network. When this option is not selected, the application will display all
relationships between activities in the Activity Network.
Show Progress option
Determines whether to display progress by marking an X on completed activities or
projects and a slash (\) on those in progress.
Tips
You must be in the Activity Network view for the Activity Network Options option to be
enabled.
Getting Here
1) Click Projects.
2) On the Projects navigation bar, click Activities.
3) On the Activities page:
664
a. Select a view from the Activity View list.
b. Click the View menu and select Activity Network Options....
Customize Activity View Dialog Box
Overview
Use this dialog box to customize Activity View settings including columns, grouping, filters,
bars, Gantt chart, Activity Network, and access for a new or existing view.
Screen Elements
View Name field
The name of the selected view.
The view is determined by your selection in the View list.
Columns tab
See Columns Tab of the Customize Activity View Dialog Box (on page 627).
Grouping tab
See Grouping Tab of the Customize Activity View Dialog Box (on page 824).
Filters tab
See Filters Tab of the Customize Activity View Dialog Box (on page 771).
Bars tab
See Bars Tab of the Customize Activity View Dialog Box (on page 591).
Gantt Chart tab
See Gantt Chart Tab of the Customize Activity View Dialog Box (on page 779).
Activity Network tab
See Activity Network Tab of the Customize Activity View Dialog Box (on page 561).
Access tab
See Access Tab of the Customize Activity View Dialog Box (on page 536).
Getting Here
1) Click Projects.
2) On the Projects navigation bar, click Activities.
3) On the Activities page:
a. Select a view from the Activity View list.
b. Click the View menu and select Customize View....

Context-Sensitive Help Topics
665
Customize Capacity Planning Chart Tab
Overview
Use this tab to set options for the Gantt chart and Capacity Planning chart. In the
Timescale section, choose the timescale interval you want to display in both charts.
Screen Elements
Display list
Determines whether the chart will be displayed by Costs or Units.
Display usage across options
Select from one of the following options in which to display usage across:
selected projects option
all projects (excluding what-if projects) option
Show Limit option
Determines whether to show the limit.
Show Allocation Limit option
Determines whether to show the allocation limit.
Show 3-D option
Determines whether to display the chart in 3-D.
Color Theme list
Determines whether the chart will display with a pastel or primary color theme.
Timescale list
Determines the timescale. Select from the following intervals:
Year/Month
Year/Quarter
Quarter/Month
Month/Week
Financial Period
The available timescale options are determined by the selected summarization
option on the General tab of the Application Settings page. The calendar timescale
options are only available if the By Calendar option is selected. The Financial Period
option is only available if the By Financial Periods option is selected. If both options are
selected, you can select from a calendar or financial period timescale.

666
Tips
You can also customize the page to display allocation in the Capacity Planning chart
for all projects in the database, rather than for the projects you select in the
scorecard.
Getting Here
1) Open a portfolio in the Portfolios section using one of the following methods:
Click Portfolios to open the last portfolio you were working with.
Click the Portfolios menu and choose one of the most-recently used
portfolios.
Click the Portfolios menu and choose Open Portfolio to select a group of
projects by portfolio type, EPS node, or project code.
2) On the Portfolios navigation bar, click Capacity Planning.
3) On the Capacity Planning page, click the Customize link.
4) In the Customize Capacity Planning dialog box, click the Chart tab.
Customize Capacity Planning Columns Tab
Overview
Use this tab to configure the columns you want to appear in the scorecard portion of the
Capacity Planning page.
Screen Elements
Column selector
Standard tool for configuring the columns you want to display.
SeeCustomize Columns or Values.
Sort by field
Determines the category to sort your information by.
Select a field from one of the following field types:
Baseline
Budget
Cost
Dates
Durations
Earned Value
General
Number of Activities
Percent Complete

Context-Sensitive Help Topics
667
Project Codes
Summary
Units
User Defined
Sort Order list
Determines whether to sort information in an ascending or descending order.
Getting Here
1) Click Portfolios.
2) On the Portfolios navigation bar, click Capacity Planning.
3) On the Capacity Planning page, click the Customize link.
4) In the Customize Capacity Planning dialog box, click the Columns tab.
Customize Capacity Planning Dialog Box
Overview
Use this dialog box to customize the Capacity Planning page. The General, Group, and
Waterline tabs apply only to the scorecard. On the General tab, choose the columns
you want to display; on the Group tab, select group and sort options; on the Waterline
tab, specify options for sorting projects into two separate groups based on the selected
criteria.
Screen Elements
Columns tab
Presents column (or field) and sort options. See Customize Capacity Planning
Columns Tab (on page 666).
Grouping tab
See Customize Capacity Planning Grouping Tab (on page 668).
Waterline tab
See Customize Capacity Planning Waterline Tab (on page 669).
Chart tab
See Customize Capacity Planning Chart Tab (on page 665).
Work Area
Displays the data and controls for each tab.

668
Apply button
Applies your settings to the item you are customizing without closing the current page
or dialog box. This allows you to view the results of your changes and to continue
adjusting other settings.
Default
Resets the options on the current tab to their original values. Only available when the
Columns tab is active.
Tips
On the Customize page, you can specify the columns of information you want to
display in the scorecard. For example, you can display project dates, project costs, or
project score information. Customize options also let you identify additional group by
levels, sorting, and waterline options.
Getting Here
1) Click Portfolios.
2) On the Portfolios navigation bar, click Capacity Planning.
3) On the Capacity Planning page, click the Customize link.
Customize Capacity Planning Grouping Tab
Overview
The Group Tab displays configurable options for modifying grouping options in capacity
planning.
Screen Elements
Levels fields
Select one of the following fields for each level preferred to 10 to determine how data
is grouped:
Budget
Costs
Dates
Durations
Earned Value
General
Project Codes
Summary
Units
User Defined

Context-Sensitive Help Topics
669
To Level field
Select a number from 1 to 10 to determine the number of fields displaying the
information chosen in the level. This option is only available when a field from Project
Codes is selected.
Background Color field
The color to be displayed as a background for each level of chosen data displayed.
Text Color field
Select a color to be displayed for text for each level of chosen data displayed.
Sort Order field
Determines whether to display data in an ascending or descending order.
Show field title in band option
Determines whether to display the field title in band.
Show field rollups in band option
Determines whether to display the field rollups in band.
Getting Here
1) Click Portfolios.
2) On the Portfolios navigation bar, click Capacity Planning.
3) On the Capacity Planning page, click the Customize link.
4) In the Customize Capacity Planning dialog box, click the Grouping tab.
Customize Capacity Planning Waterline Tab
Overview
This tab applies only to portfolio views of type scorecard.
You can display a waterline to help analyze a project group and model your strategy. A
waterline sorts projects in the scorecard into two separate groups based on your defined
constraint limit. Projects above the waterline, displayed with a white background, are
those that collectively meet the constraint limit value; all other projects, displayed with a
light blue background, appear below the waterline.
Screen Elements
Waterline area
See Customize Scorecard Waterline Tab (on page 695).
Getting Here
1) Open a portfolio in the Portfolios section using one of the following methods:

670
Click Portfolios to open the last portfolio you were working with.
Click the Portfolios menu and choose one of the most-recently used
portfolios.
Click the Portfolios menu and choose Open Portfolio to select a group of
projects by portfolio type, EPS node, or project code.
2) On the Portfolios navigation bar, click Capacity Planning.
3) On the Capacity Planning page, click the Customize link.
4) In the Customize Capacity Planning dialog box, click the Waterline tab.
Customize Chart Dialog Box of the Resource Analysis Chart Portlet
Overview
Use this dialog box to configure how the chart will display in the portlet.
Screen Elements
Chart Type list
Determines the type of chart to be displayed.
Display list
Determines whether the chart will be displayed by Costs or Units.
Show Limit option
Determines whether to show the limit.
Show Allocation Limit option
Determines whether to show the allocation limit.
Display resource allocation fields
The specified number of weeks for which to display the resource allocation. Enter
values for how many weeks prior and after the current date.
Color Theme list
Determines whether to display the color theme in pastel or primary colors.
Getting Here
1) Click Dashboards.
2) On the Dashboards page, select a dashboard.
3) On the dashboard, expand the Resource Analysis Chart portlet and click Customize.

Context-Sensitive Help Topics
671
Customize Chart Dialog Box of the Resource Analysis Tab of the Analysis Page
Overview
Use the Customize Chart dialog box of the Resource Analysis tab to select a timescale
increment, unit or cost data, and the limit line type. You can also select a color scheme
and decide whether to show the chart in 3-D. The options available in this dialog box
depend on the type of chart selected.
Screen Elements
Display list
Determines whether the chart will be displayed by Costs or Units.
Timescale list
Determines the timescale. Select from the following intervals:
Year/Month
Year/Quarter
Quarter/Month
Month/Week
Financial Period
The available timescale options are determined by the selected summarization
option on the General tab of the Application Settings page. The calendar timescale
options are only available if the By Calendar option is selected. The Financial Period
option is only available if the By Financial Periods option is selected. If both options are
selected, you can select from a calendar or financial period timescale.
Show Limit option
Determines whether to show the limit.
Show Allocation Limit option
Determines whether to show the allocation limit.
Display entire date range/Display a specific date range options
Determines whether to display the date range or a specified date range.
Start field
The start date for the specific date range.
Finish field
The finish date for the specific date range.
Color Theme list
Determines whether the chart will display with a pastel or primary color theme.

672
Show 3-D option
Determines whether to display the chart in 3-D.
Getting Here
1) Click Resources.
2) On the Resources navigation bar, click Analysis.
3) On the Analysis page, click the Resource Analysis tab.
4) On the Resource Analysis tab, select a resource and click Customize.
Customize Columns Dialog Box of the Activities Page
Overview
Use this dialog box to configure columns for the table or the Gantt chart on the Activities
page.
Screen Elements
Available Columns list
The list of columns available for display. Double-clicking a column in the Available
Columns list moves it to the Selected Columns list.
Selected Columns list
The columns you selected from the Available Columns list. Double-clicking a column
in the Selected Columns list removes it from the list. See Configuring Columns or
Values, for help configuring the list of selected columns.
Column Options section:
Sort by list
The element used to sort items in the table and Gantt chart.
Sort Order list
Determines whether the application sorts values in ascending or descending order.
Show first column as list
The list of fields names to use as the first or first and second columns in the view.
Font field
The font, size, and style from the Table Font dialog box. These configurable options will
be applied to the columns.
Tips
For a full list of available columns, see Available Columns of the Activities Page (on
page 1189).

Context-Sensitive Help Topics
673
You must be in the table or Gantt chart view for the Columns option to be enabled.
Getting Here
1) Click Projects.
2) On the Projects navigation bar, click Activities.
3) On the Activities page:
a. Select a view from the Activity View list.
b. Click the View menu and select Columns.
Customize Columns Dialog Box of the EPS Page
Overview
Use this dialog box to configure columns for the table or Gantt chart.
Screen Elements
Available Columns list
The list of columns available for display. Double-clicking a column in the Available
Columns list moves it to the Selected Columns list.
Selected Columns list
The columns you selected from the Available Columns list. Double-clicking a column
in the Selected Columns list removes it from the list. See Configuring Columns or
Values, for help configuring the list of selected columns.
Column Options section:
Sort by list
Determines the column sort criteria.
Sort Order list
Determines whether to sort information in an ascending or descending order.
Show first column as list
Determines whether Project Name or Project ID is shown as the first column.
Font field
The font, size, and style from the Table Font dialog box. These configurable options will
be applied to the columns.
Tips
For a full list of available columns, see Available Columns of the EPS Page (on page 1223).

674
Getting Here
1) Click Projects.
2) On the Projects navigation bar, click EPS.
3) On the EPS page:
a. Select a view from the EPS View list.
b. Click the View menu and select Columns.
Customize Cost Worksheet Dialog Box
Overview
Use this dialog box to modify columns and grouping.
Screen Elements
Columns tab
See Columns Tab of the Customize Cost Worksheet Dialog Box (on page 628).
Group tab
See Group Tab of the Customize Cost Worksheet Dialog Box (on page 819).
Getting Here
From the Workspace page:
1) Click Projects.
2) On the Projects navigation bar, click Workspace.
3) On the Workspace page, expand the Cost Worksheet portlet.
4) In the Cost Worksheet portlet, click Customize.
From the Dashboards page:
1) Click Dashboards.
2) On the Dashboards page, select a dashboard.
3) On the selected dashboard, expand the Cost Worksheet portlet.
4) In the Cost Worksheet portlet, click Customize.
Customize Dashboard Page
Overview
Use this page to create a new dashboard, customize the selected dashboard for the
current user, or to configure the selected shared dashboard for other users. This includes
any of the following:
Showing or hiding a portlet

Context-Sensitive Help Topics
675
Setting a dashboard filter
Designing the layout of portals
Restoring default settings
Screen Elements
Content tab
See Content Tab of the Customize Dashboard Page (on page 637).
Layout tab
See Layout Tab of the Customize Dashboard Page (on page 864).
Access tab
See Access Tab of the Customize Dashboard Page (on page 536).
Getting Here
From the Manage Dashboards page:
1) Click the Dashboards menu and select Manage Dashboards.
2) On the Manage Dashboards page, expand Displayed Dashboards or Available
Dashboards and select a dashboard.
From the Dashboards page:
1) Click Dashboards.
2) On the Dashboards page, select a dashboard.
3) On the dashboard, click Customize.
Customize Detail Windows Dialog Box of the Activities Page
Overview
Use this dialog box to determine which detail windows for activities or WBSs will display on
the Activities page.
Screen Elements
Area section
Determines which set of detail windows will be available.
Detail Window option
Determines which detail windows are displayed. Select the option next to the Detail
Window title to select all the detail windows.
Reset to Defaults button
Restores all options to default settings.

676
Tips
You can also right-click a detail window on the Activities page and select
Customize... to open the Customize Detail Windows dialog box.
Detail window customization is saved per view.
Getting Here
1) Click Projects.
2) On the Projects navigation bar, click Activities.
3) On the Activities page, click the View menu and select Customize Detail
Windows....
Customize Detail Windows Dialog Box of the EPS Page
Overview
Use this dialog box to determine which detail windows for EPS nodes or projects will
display on the EPS page.
Screen Elements
Area section
Determines which set of detail windows will be available.
Detail Window option
Determines which detail windows are displayed. Select the option next to the Detail
Window title to select all the detail windows.
Tips
You can also right-click a detail window on the Activities page and select
Customize... to open the Customize Detail Windows dialog box.
Detail window customization is saved per view.
Getting Here
1) Click Projects.
2) On the Projects navigation bar, click EPS.
3) On the EPS page, click the View menu and select Customize Detail Windows....
Customize Dialog Box of the Portfolio View Portlet
Overview
Use this dialog box to customize bubble chart, pie chart, histogram, stacked histogram,
and side-by-side histogram portlets.

Context-Sensitive Help Topics
677
Note: Not all the fields listed below will apply. The type of chart you
select automatically refreshes the applicable fields.
Screen Elements
Title field
The name of the view and the title that appears in the title bar of the portlet. The title
can contain up to 255 characters, and it does not have to be unique. (This is a
required field.)
Type list
Determines the type of chart to be displayed.
Note: If you change the type to Scorecard, the information on the page changes to
accommodate scorecard details.
X-Axis list
The data field represented on the X-axis of the chart. This field is not displayed for a
pie chart.
Y-Axis list
The data field represented on the Y-axis of the chart. This field is not displayed for a
pie chart.
Group By list
The data field used to group projects in the chart. Grouping gathers, or groups, all of
the projects together that contain the same value for the selected data field. This
field is not displayed for a histogram.
Bubble Size list
Determines the size of the bubbles that display in a bubble chart.
Color Theme list
The option to view chart elements in pastel or primary colors.
Show 3-D option
Determines whether to display the chart in 3-D format. Clearing this option displays
the chart in 2-D format.
Show horizontal gridlines option
Determines whether to display horizontal gridlines in the chart. This field is not
displayed for a pie chart.

678
Show vertical gridlines option
Determines whether vertical gridlines are displayed in the chart. This field is not
displayed for a pie chart.
Show all values on axis, not just assigned values option
Determines whether to display all values on the X axis and Y axis, even if there is no
assigned value.
For example, if you choose to display Project Status on the X axis, the X axis displays all
types of Project Status (Active, Inactive, What-If), even if no projects are assigned to a
status type. This option only applies when you choose to display project code, project
status, or risk level on the X or Y axis. This option is not displayed for a pie chart.
Data list
The data field represented in a pie chart.
Show pie data label option
Determines whether to display the value for the customize option you select in the
Data field. For example, if you choose to display Actual Cost data in the pie chart, the
chart displays the Actual Cost value next to each section of the pie chart.
Show group by label option
Determines whether to display the value for the customize option you select in the
Group By field. For example, if you choose to group the chart by project, the chart
displays the project name next to each section of the pie chart.
Show percentage option
Determines whether to display the percentage of each slice of the pie chart.
Tips
If you select a Portfolio View portlet that has Scorecard listed in the Type list, you will see
the Customize Scorecard dialog box in place of the Customize dialog box.
Getting Here
1) Click Dashboards.
2) On the Dashboards page, select a dashboard.
3) On the dashboard, expand a Portfolio View portlet. (For example, a bubble chart
portlet.)
4) In the Portfolio View portlet, click Customize.
Customize Dialog Box of the Team Usage Page
Overview
Use this dialog box to configure spreadsheet or histogram display and timescale.

Context-Sensitive Help Topics
679
Screen Elements
Display list
The cost viewing options: Units or Cost. The capability to view costs is dependent on
your security privileges. If you do not have access to costs data and you select the
Costs option, no data appears.
By default, actual units and costs are spread evenly across the time period from the
Actual Start to the Data Date, or Actual Finish if there is one. A Global Preference
setting lets you choose to view actuals values based on data stored for custom
financial periods (past period actuals). When you choose this option, actual units and
costs are spread evenly across the dates defined for each financial period. When this
option is turned on, under/over allocated values are also calculated based on the
stored period data for actual units. Additionally, the histogram legend indicates that
Period Actual Units or Costs are being displayed.
However, if projects are summarized by financial period (which is controlled on the
General tab of the Application Settings page), this global preference setting for
displaying past period actuals is ignored. In this case, when you display a Financial
Period timescale, the page displays past period actual values if performance has
been stored for a financial period; for financial periods that do not have stored
performance, the page displays all unit and cost values in financial period intervals.
Timescale list
Determines the timescale. Select from the following intervals:
Year/Month
Year/Quarter
Quarter/Month
Month/Week
Financial Period
The available timescale options are determined by the selected summarization
option on the General tab of the Application Settings page. The calendar timescale
options are only available if the By Calendar option is selected. The Financial Period
option is only available if the By Financial Periods option is selected. If both options are
selected, you can select from a calendar or financial period timescale.
Show option
Determines whether to view resource data for the Current Project Only or for All
Projects to which the resource is assigned.
Choose to display resources' maximum availability based on their designated
calendars and units/time values (Limit) or based on allocated values (Allocation Limit)
specified by Resource Managers during high-level planning.

680
Limit option
Determines whether to display maximum availability based on the resource's
calendar and maximum units/time setting and the application settings for hours per
time period.
This option is based on live data to help you evaluate usage against the benchmark.
Allocation Limit option
Determines whether the resource's maximum availability is based on Allocated
planning values specified by a resource manager. These values, which are recorded
at the project or WBS level, can be entered by users with appropriate module access
in the Resource Planning spreadsheet (Planning page).
Use this limit line to evaluate whether your detailed activity assignments are in line with
what the resource manager has planned.The resource usage summary data
displayed in the Allocation Limit view is based on either activity-level assignments or
high-level (project, WBS) planning assignments, depending on an option setting on
the Project Details Settings page. To evaluate activity level assignments against
planned allocations, choose the summarize project option for detailed activity
resource assignments. This option is based on live data to help you evaluate usage
against the benchmark.
Because resource usage data is based on summary data, it reflects values as of the
last date the summarizer was run for a project. Assignment changes within a project
after that date will not be reflected until the project is again summarized from the
Activities or EPS pages. For more detail about summarized resource data, see
Resource Data and Summarization.
Note: When summarizing at the detail level, the date range for the timescale is
derived from activity start and finish dates. If the selected resource only has high-level
assignments outside that date range, the Allocation Limit line might not appear.
Changing to a larger timescale increment, for example from Month/Week to
Year/Quarter might cause the Allocation Limit to appear.
Getting Here
1) Click Projects.
2) On the Projects navigation bar, click Team Usage.
3) On the Team Usage page, click the Customize link.
Customize Filters Dialog Box of the Activities Page
Overview
Use this dialog box to configure and apply one or more filters to the current activity view.

Context-Sensitive Help Topics
681
Screen Elements
Customize Filters dialog box
The Customize Filters dialog box contains the same screen elements as the Filters tab
on the Customize Activity View dialog box. See Filters Tab of the Customize Activity
View Dialog Box (on page 771) for information.
Getting Here
1) Click Projects.
2) On the Projects navigation bar, click Activities.
3) On the Activities page:
a. Select a view from the Activity View list.
b. Click the View menu and select Filters Filters.
Customize Filters Dialog Box of the Assignments Page
Overview
Use the Customize Filters dialog box of the Assignments page to configure and apply one
or more filters to the current view to constrain or reduce the quantity of resources shown.
Screen Elements
Customize Filters Dialog Box Toolbar
See Filters Dialog Box Toolbar (on page 1288).
Name field
The names of existing, predefined filters that are grouped by type:
Standard Filters: Predefined filters that are already in the application.
Global Filters: Filters that are available to all users.
Multiple User Filters: User-defined filters available to more than one person.
User-Defined Filters: Filters that you created.
Apply to View option
Determines which filters, if any, will be applied to the current view.
Getting Here
1) Click Resources.
2) On the Resources navigation bar, click Assignments.
3) On the Assignments page, click Filters menu on the view toolbar or view menu
and click Filters.
682
Customize Filters Dialog Box of the EPS Page
Overview
Use this dialog box to configure and apply one or more filters to the current view to
constrain or reduce the quantity of projects shown on the EPS page.
Screen Elements
This dialog box contains the same elements as the Filters tab of the Customize Project View dialog box.
See Filters Tab of the Customize Project View Dialog Box (on page 771) for more
details.
Getting Here
1) Click Projects.
2) On the Projects navigation bar, click EPS.
3) On the EPS page:
a. Select a view from the EPS View list.
b. Click the View menu and select Filters Filters.
Customize Gantt Chart Options Dialog Box of the Activities Page
Overview
Use this dialog box to configure the appearance and properties of Gantt chart bars,
lines, and timescales on the Activities page.
Screen Elements
Bars tab
Displays bar type, height, color, and label options. See Bars Tab of the Customize
Gantt Chart Options Dialog Box of the Activities Page (on page 593).
Gantt Chart tab
Displays Gantt chart timescale and non-work time color shading options. See Gantt
Chart Tab of the Customize Gantt Chart Options Dialog Box of the Activities Page (on
page 780).
Getting Here
1) Click Projects.
2) On the Projects navigation bar, click Activities.
3) On the Activities page:
a. Select a view from the Activity View list.

Context-Sensitive Help Topics
683
b. Click the View menu and select Gantt Chart Options.
Customize Gantt Chart Options Dialog Box of the Assignments Page
Overview
Use this dialog box to set the type, height, and color of Gantt chart bars and to set
timescale options.
Screen Elements
Bars tab
Displays bar type, height, color, and label options. See Bars Tab of the Customize
Gantt Chart Options Dialog Box of the Assignments Page (on page 595).
Gantt Chart tab
Displays Gantt chart timescale and non-work time color shading options. See Gantt
Chart Tab of the Customize Gantt Chart Options Dialog Box of the Assignments Page
(on page 782).
Getting Here
1) Click Resources.
2) On the Resources navigation bar, click Assignments.
3) On the Assignments page, click View and select Gantt Chart Options.
Customize Gantt Chart Options Dialog Box of the EPS Page
Overview
Use this dialog box to configure the appearance and properties of bars and the lines
and timescales of the Gantt chart on the EPS page.
Screen Elements
Bars tab
Displays bar type, height, color, and label options. See Bars Tab of the Customize
Gantt Chart Options Dialog Box of the EPS Page (on page 597).
Gantt Chart tab
Displays EPS Gantt chart timescale and non-work time color shading options. See
Gantt Chart Tab of the Customize Gantt Chart Options Dialog Box of the EPS Page (on
page 782).

684
Apply button
Applies your settings to the item you are customizing without closing the current page
or dialog box. This allows you to view the results of your changes and to continue
adjusting other settings.
Getting Here
1) Click Projects.
2) On the Projects navigation bar, click EPS.
3) On the EPS page:
a. Select a view from the EPS View list.
b. Click the View menu and select Gantt Chart Options.
Customize Groupings Dialog Box of the Activities Page
Overview
Use this dialog box to organize data in categories that share a common attribute, such
as WBS, code value, or resource on the Activities page. Group by simple, one-level lists of
information or by multiple data items; group criteria can also be arranged in hierarchies
of data at multiple level up to 20. If you limit the number of levels, you can group
additional data items.
Screen Elements
Customize Groupings dialog box
The Customize Groupings dialog box contains configurable options identical to those
on the Grouping tab of the Customize Activity View dialog box. See Grouping Tab of
the Customize Activity View Dialog Box (on page 824) for further details.
Tips
Grouping bands are displayed by default when you group by a project code or EPS
even if the bands are empty. Select the Hide if empty option in the Customize View or
Customize Groupings dialog boxes to remove these bands from view.
Getting Here
1) Click Projects.
2) On the Projects navigation bar, click Activities.
3) On the Activities page:
a. Select a view from the Activity View list.
b. Click the View menu and select Group....

Context-Sensitive Help Topics
685
Customize Groupings Dialog Box of the EPS Page
Overview
Use this dialog box to organize data into categories that share a common attribute, such
as WBS, code value, or resource in the table on the EPS page. Group by simple, one-level
lists of information or by multiple data items; group criteria can also be arranged in
hierarchies of data at multiple levels. If you limit the number of levels, you can group
additional data items.
Screen Elements
Field list
The field you want to use to arrange the data into smaller more manageable groups.
Data rows with similar field values can be arranged into expandable hierarchies with
up to 10 or 20 levels and sorted by group to reduce visual complexity and speed user
access to specific data.
To Level list
The level to which values of a hierarchy are shown, or, if a date is selected, the way
dates are broken up for the group bands.
Band Color list
The color to display for each hierarchical level.
Text Color list
The color for the text to be displayed within each grouping band.
Sort Order list
Determines whether columns are sorted in ascending or descending order, or by
hierarchy.
Band Options section:
Show field title option
Determines whether to show the title of the title of the field in the table or Gantt chart.
Show field rollups option
Determines whether to display summarized values, such as the dates of the table or
Gantt chart.
Clear the option to prevent this information from displaying.
Show field rollups option
Determines whether to display summarized values, such as the dates of the Gantt
chart or table.

686
Hide if empty option
Determines whether to hide grouping bands that do not contain any projects (if on
the EPS page) or activities (if on the Activities page).
Display text in bands using section:
ID/Code option
The short name or ID/Code within the grouping band.
If you select this option and EPS is selected in the field list, you can edit the EPS code in
the first column on the EPS page.
Name/Description option
The long name or name/description within the grouping band.
If you select this option and EPS is selected in the field list, you can edit the EPS
description in the first column on the EPS page.
ID/Code and Name/ Description option
The short and long name within the grouping band.
If you select this option and EPS is selected in the field list, you can edit the EPS code in
the first column on the EPS page.
Tips
Grouping bands are displayed by default when you group by a project code or EPS
even if the bands are empty. Select the Hide if empty option in the Customize View or
Customize Groupings dialog boxes to remove these bands from view.
Getting Here
1) Click Projects.
2) On the Projects navigation bar, click EPS.
3) On the EPS page:
a. Select a view from the EPS View list.
b. Click the View menu and select Group.
Customize Project Issues Dialog Box
Overview
Use this dialog box to configure options for columns, filters, groups, and charts.
Screen Elements
Columns tab
See Columns Tab of the Customize Project Issues Dialog Box (on page 628).

Context-Sensitive Help Topics
687
Filter tab
See Filter Tab of the Customize Project Issues Page (see "Filter Tab of the Customize
Project Issues Dialog Box" on page 768).
Group tab
See Group Tab of the Customize Project Issues Dialog Box (on page 820).
Chart tab
See Chart Tab of the Customize Project Issues Dialog Box (on page 614).
Tips
The customize options you select apply only to you.
If you select to filter by the Owner field, the list of available resources from which you
can select depends upon your resource access privileges.
When you modify an existing Sort by selection, grouping level, or filter criteria
statement, the text <secure field> might display. This indicates that you do not have
the required privilege to view this field or value; however, you can select a different
field or value from the list.
Getting Here
From the Issues page:
1) Click Projects.
2) On the Projects navigation bar, click Issues.
3) On the Issues page, click Customize.
From the Workspace page:
1) Click Projects.
2) On the Projects navigation bar, click Workspace.
3) On the Workspace page, expand the Project Issues portlet and click Customize.
From the Dashboards page:
1) Click Dashboards.
2) On the Dashboards page, select a dashboard tab.
3) On the dashboard tab, expand the My Issues portlet and click Customize.
Customize Project Score Dialog Box of the Project Score Section of the Global Tab of the My
Preferences Page
Overview
Use this dialog box to customize the project score columns.

688
Screen Elements
Customize Columns
See Configuring Columns or Values.
Getting Here
1) Click the Administer menu and select My Preferences.
2) On the My Preferences page, click the Global tab.
3) On the Global tab, expand the Project Score section.
4) Under the Project Score section, click the Project Codes link.
Customize Project Statistics Dialog Box
Overview
Use this dialog box to configure which columns are displayed on the Project Statistics
portlet and Project Statistics page.
Screen Elements
Select the custom columns to display for Project Statistics section
See Common Screen Elements for Customizing Columns or Values (on page 634).
Default button
Changes all fields to default settings.
Getting Here
From the Workspace page:
1) Click Projects.
2) On the Projects navigation bar, click Workspace.
3) On the Workspace page, expand the Project Statistics portlet and click Customize.
From the Dashboards page:
1) Click Dashboards.
2) On the Dashboards page, expand the Project Statistics portlet and click Customize.
Customize Project View Dialog Box
Overview
Use this dialog box to customize Project View settings including columns, grouping, filters,
bars, Gantt chart, and access for a new or existing view.

Context-Sensitive Help Topics
689
Screen Elements
View Name field
The name of the selected view.
The view is determined by your selection in the View list.
Columns tab
See Columns Tab of the Customize Project View Dialog Box (on page 630).
Grouping tab
See Grouping Tab of the Customize Project View Dialog Box (on page 826).
Filters tab
See Filters Tab of the Customize Project View Dialog Box (on page 771).
Bars tab
See Bars Tab of the Customize Project View Dialog Box (on page 598).
Gantt Options tab
See Gantt Chart Tab of the Customize Project View Dialog Box (on page 783).
Access tab
See Access Tab of the Customize Project View Dialog Box (on page 537).
Getting Here
1) Click Projects.
2) On the Projects navigation bar, click EPS.
3) On the EPS page:
a. Select a view from the EPS View list.
b. Click the View menu and select Customize View....
Customize Resource Assignments View Dialog Box of the Assignments Page
Overview
Use this dialog box to customize settings of all parts of the Resource Assignments view,
including the Gantt chart, the usage spreadsheet, layout of elements opened within the
assignments view, filters, and access privileges.
Screen Elements
View Name field
The name of the selected view.
The view is determined by your selection in the View list.

690
Customize Resource Assignments View dialog box tabs:
Columns Tab of the Customize Resource Assignments View Dialog Box of the
Assignments Page (on page 631)
Grouping Tab of the Customize Resource Assignments View Dialog Box of the
Assignments Page (on page 828)
Filters Tab of the Customize Resource Assignments View Dialog Box of the Assignments
Page (on page 772)
Bars Tab of the Customize Resource Assignments View Dialog Box of the Assignments
Page (on page 599)
Gantt Chart Tab of the Customize Resource Assignments View Dialog Box of the
Assignments Page (on page 784)
Usage Tab of the Customize Resource Assignments View Dialog Box of the
Assignments Page (on page 1134)
Access Tab of the Customize Resources Assignments View Dialog Box of the
Assignments Page (on page 537)
Getting Here
1) Click Resources.
2) On the Resources navigation bar, click Assignments.
3) On the Assignments page, click View and select Customize View.
Customize Risks Dialog Box
Overview
Use this dialog box to customize the columns and filters applied to the My Risks or Project
Risks portlets.
Screen Elements
Columns tab
See Columns Tab of the Customize Risks Dialog Box (see "Columns Tab of the
Customize Risks Portlet Dialog Box" on page 632).
Filter tab
See Filter Tab of the Customize Risks Dialog Box (on page 770).
Tips
You can customize the My Risks portlet for any dashboard you create.
You cannot customize the portlet for multi-user dashboards created by another user,
even if you have access to view the dashboard.
For global dashboards, you must have the required security privileges to edit global
dashboards to customize the portlet.

Context-Sensitive Help Topics
691
Getting Here
From the Dashboards page:
1) Click Dashboards.
2) On the Dashboards page, select a dashboard.
3) On the dashboard, expand the My Risks portlet and click Customize.
From the Workspace page:
1) Click Projects.
2) On the Projects navigation bar, click Workspace.
3) On the Workspace page, expand the Project Risks portlet and click Customize.
Customize Scorecard Columns Tab
Overview
The Columns Tab displays configurable options for modifying displayed columns in the
scorecard view.
Screen Elements
Select the custom columns to display area
Configure the columns to display in the scorecard. See Customize Columns or Values.
Sort by field
Select one of the following fields to determine your preferred option to sort your data:
Baseline
Budget
Cost
Dates
Durations
Earned Value
General
Number of Activities
Percent Complete
Project Codes
Summary
Units
User Defined
Sort Order field
Determines whether to display data in an ascending or descending order.

692
Show Project Requests option
Determines whether to display project requests.
Default button
Changes all fields to default settings.
Getting Here
1) Click Portfolios.
2) On the Portfolios navigation bar, click Portfolio Analysis.
3) On the Portfolio Analysis Settings area, select a scorecard in the View field.
4) On the Portfolio Analysis , click More to access the Scorecard Settings area.
5) On the Scorecard Settings area, click the Customize link.
6) In the Customize Scorecard dialog box,Settings area select the Columns tab.
Customize Scorecard Dialog Box
Overview
The Customize Scorecard Dialog Box displays configurable options for viewing portfolio
data in a scorecard. Use the following fields to modify your scorecard view.
Screen Elements
Columns Tab
See Customize Scorecard Columns Tab (on page 691).
Group Tab
See Customize Scorecard Group Tab (on page 693).
Waterline Tab
See Customize Scorecard Waterline Tab (on page 695).
Getting Here
1) Click Portfolios.
2) On the Portfolios navigation bar, click Portfolio Analysis.
3) On the Portfolio Analysis Settings area, select a scorecard in the View field.
4) On the Portfolio Analysis Settings area, click More to access the Scorecard Settings
area.
5) On the Scorecard Settings area, click the Customize link.

Context-Sensitive Help Topics
693
Customize Scorecard Dialog Box of the Portfolio Views Section of the Customize Dashboard
Page
Overview
Use this dialog box to configure scorecard viewing options.
Screen Elements
Columns tab
See Columns Tab of the Customize Scorecard Dialog Box of the Portfolio Views Section
of the Customize Dashboard Page (see "Columns Tab of the Customize Scorecards
Dialog Box of the Portfolio Views Section of the Customize Dashboard Page" on page
633).
Group tab
See Group Tab of the Customize Scorecard Dialog Box of the Portfolio Views Section of
the Customize Dashboard Page (on page 823).
Getting Here
1) Click Dashboards.
2) On the Dashboards page, select a dashboard.
3) On the dashboard, click Customize.
4) On the Dashboard Details page, click the Content tab.
5) On the Content tab, expand Portfolio Views and expand a view.
6) In the view section, select Scorecard from the Type list and click Customize.
Customize Scorecard Group Tab
Overview
The Group Tab displays configurable options for modifying grouping options in the
scorecard view.
Screen Elements
Levels fields
Select one of the following fields for each level preferred to 10 to determine how data
is grouped:
Budget
Costs
Dates
Durations
Earned Value

694
General
Project Codes
Summary
Units
User Defined
To Level field
Select a number from 1 to 10 to determine the number of fields displaying the
information chosen in the level. This option is only available when a field from Project
Codes is selected.
Background Color field
Select a color to be displayed as a background for each level of chosen data
displayed.
Text Color field
The color to be displayed for text for each level of chosen data displayed.
Sort Order field
Determines whether to display data in an ascending or descending order.
Show field title in band option
Determines whether to display the field title in band.
Show field rollups in band option
Determines whether to display the field rollups in band.
Getting Here
1) Click Portfolios .
2) On the Portfolios navigation bar, click Portfolio Analysis.
3) On the Portfolio Analysis Settings area, select a scorecard in the View field.
4) On the Portfolio Analysis Settings area, click More to access the Scorecard Settings
area.
5) On the Scorecard Settings area, click the Customize link.
6) In the Customize Scorecard dialog box, select the Group tab.

Context-Sensitive Help Topics
695
Customize Scorecard Waterline Tab
Overview
You can display a waterline to help analyze a project group and model your strategy. A
waterline sorts projects in the scorecard into two separate groups based on your defined
constraint limit. Projects above the waterline, displayed with a white background, are
those that collectively meet the constraint limit value; all other projects, displayed with a
light blue background, appear below the waterline.
Screen Elements
Display waterline on scorecard option
Determines whether to display the waterline on scorecard. By choosing this option,
any groupings and sorts defined elsewhere will be lost.
Parameter field
Select a field from one of the following categories to set the waterline level limit. The
available list of fields are pre-filtered to include only numeric project-level fields.
Budget
Cost
Durations
Earned Value
General
Number of Activities
Percent Complete
Units
User Defined
Is field
Select from one of the following options to determine the logical constraint between
the parameter and an entered value.
Is less than
Is less than or equals
Is greater than
Is greater than or equals
Value field
Enter a value for the field to complete the waterline level limit. For example, enter 100
to complete a limit where the Parameter field is Total Activities and the Is field is set to
Is less than.

696
First rank by field
Select a field from one of the following categories to sort the scorecard:
Baseline
Budget
Cost
Dates
Durations
Earned Value
General
Number of Activities
Percent Complete
Project Codes
Summary
Units
User Defined
Sort Order field
Select an Ascending (A to Z; 1 up to high value) or Descending (Z to A; high value
down to 1) sort order for data rows sorted by the First rank by field.
Then rank by field
Select a field from one of the following categories to sort the scorecard a second
time. For example, if multiple rows share the same Parent EPS, they will all appear
when sorted by this field. Choose a second field to further sort the data.
Baseline
Budget
Cost
Dates
Durations
Earned Value
General
Number of Activities
Percent Complete
Project Codes
Summary
Units
User Defined

Context-Sensitive Help Topics
697
Sort Order field
Select an Ascending (A to Z; 1 up to highest value) or Descending (Z to A; highest
value down to 1) sort order for data rows sorted by the First rank by field.
Getting Here
1) Open a portfolio in the Portfolios section using one of the following methods:
Click Portfolios to open the last portfolio you were working with.
Click the Portfolios menu and choose one of the most-recently used
portfolios.
Click the Portfolios menu and choose Open Portfolio to select a group of
projects by portfolio type, EPS node, or project code.
2) On the Portfolios navigation bar, click Portfolio Analysis.
3) On the Portfolio Analysis Settings area, select a scorecard in the View field.
4) On the Portfolio Analysis Settings area, click More to access the Scorecard Settings
area.
5) On the Scorecard Settings area, click the Customize link.
6) In the Customize Scorecard dialog box, select the Waterline tab.
Customize Spreadsheet Dialog Box of the Planning Page
Overview
Use the Customize Spreadsheet dialog box of the Planning page to modify the currently
selected spreadsheet.
Screen Elements
Customize Spreadsheet tabs:
General Tab of the Customize Spreadsheet Dialog Box of the Planning Page (on page
804)
Columns Tab of the Customize Spreadsheet Dialog Box of the Planning Page (on page
634)
Getting Here
1) Click Resources.
2) On the Resources navigation bar, click Planning.
3) On the Planning page, click the Customize link.
Customize Spreadsheet or Histogram Dialog Box of the Analysis Page
Overview
Use this dialog to customize the display options for the spreadsheet or histogram.

698
Screen Elements
Display list
Determines whether the chart will be displayed by Costs or Units.
Timescale list
Determines the timescale. Select from the following intervals:
Year/Month
Year/Quarter
Quarter/Month
Month/Week
Financial Period
The available timescale options are determined by the selected summarization
option on the General tab of the Application Settings page. The calendar timescale
options are only available if the By Calendar option is selected. The Financial Period
option is only available if the By Financial Periods option is selected. If both options are
selected, you can select from a calendar or financial period timescale.
Show Limit option
Determines whether to show the limit. The limit shows the maximum availability based
on the resource's calendar and Max units/time setting, along with application settings
for hours per time period.
Show Allocation Limit option
Determines whether to show the allocation limit. This line shows the role's maximum
availability based on Allocated planning values specified in the Resource Planning
spreadsheet. Use this limit indicator to evaluate whether detailed activity assignments
are in line with what was planned.
Getting Here
1) Click Resources.
2) On the Resources navigation bar, click Analysis.
3) On the Analysis page, click the Role Usage tab or the Resource Usage tab.
4) On the Role Usage tab or the Resource Usage tab:
a. Select a role or resource.
b. Click the Customize link above the spreadsheet or histogram.
Customize Toolbar Items Dialog Box
Overview
Use this dialog box to determine which icons from the Actions, Edit, and View menus will
display on the corresponding toolbars.

Context-Sensitive Help Topics
699
Screen Elements
Toolbar section
Determines which toolbar items will be available to customize.
Actions: Will display options for toolbuttons associated with the Actions menu.
Edit: Will display options for toolbuttons associated with the Edit menu.
View: Will display options for toolbuttons associated with the View menu.
Toolbar Item option
The available icons for each corresponding toolbar. For example, when the Actions
toolbar is selected, all icons available for the Actions toolbar are displayed. Select the
option next to the Toolbar Item title to select all icons to be displayed for the specified
toolbar.
Reset to Defaults button
Restores all options to default settings.
Getting Here
1) Click Projects.
2) On the Projects navigation bar, click Activities or EPS.
3) On the Activities or EPS page, click the View menu and select Toolbars
Customize Toolbars....
Customize Toolbar Items Dialog Box of the Assignments Page
Overview
Use this dialog box to determine which icons from the Actions, Edit, and View menus will
be displayed on the corresponding toolbars.
Screen Elements
Toolbar section
Determines which toolbar items will be available to customize.
Actions: Will display options for toolbuttons associated with the Actions menu.
Edit: Will display options for toolbuttons associated with the Edit menu.
View: Will display options for toolbuttons associated with the View menu.
Toolbar Item option
The available icons for each corresponding toolbar. For example, when the Actions
toolbar is selected, all icons available for the Actions toolbar are displayed. Select the
option next to the Toolbar Item title to select all icons to be displayed for the specified
toolbar.

700
Reset to Defaults button
Restores all options to default settings.
Getting Here
1) Click Resources.
2) On the Resources navigation bar, click Assignments.
3) On the Assignments page, click the View menu and select Toolbars .
4) On the Toolbars menu, select Customize Toolbars....
Customize Usage Options Dialog Box of the Assignments Page
Overview
The Customize Usage Options Dialog Box contains identical elements regarding the
customization of columns and options as the Usage tab of the Customize Resource
Assignments View dialog box. See Usage Tab of the Customize Resource Assignments
View Dialog Box of the Assignments Page (on page 1134) for further details.
Getting Here
1) Click Resources.
2) On the Resources navigation bar, click Assignments.
3) On the Assignments page, click View and select Usage Options.
Dashboards Page
Overview
Use this page to view and work with dashboards where you can arrange portlets
containing information about the portfolios, projects, resources, and activities specific to
your needs. The information in dashboards is controlled by your module access, security
settings, administrator configuration, user interface view settings, activity and project
assignments, filtering criteria, and how you customize your content and layout.
Note: The Dashboards page displays dashboards available to you
as defined in your user interface view. If you have no user interface
view, the default Personal Workspace dashboard will appear
when you first log into the application.
You can customize the Dashboards page to display user-defined (private), multi-user,
and global dashboards. Each dashboard appears as a named tab on the Dashboards
page.

Context-Sensitive Help Topics
701
Screen Elements
Expand All link
Expands all portlets (when portlets are collapsed).
Collapse All link
Collapses all portlets to display only their title bars (when portlets are expanded).
Customize link
Click to customize the content, layout, and access of dashboards if you have the
required security privilege. See Customize Dashboard Page (on page 674).
Filter by field
The portfolio, project code, or project that the application uses to filter the
dashboard. The portlets only display information that meet the selected filtering
criteria.
You can change the Filter by option for a private (user-defined) dashboard, and for
any multi-user or global dashboard you create.
All data displayed on a dashboard is filtered by the portfolio, project code value, or
project. For example, the Project Health portlet only displays performance and
schedule information for projects that meet the selected filtering criteria.
You can change the Filter by option for a private (user-defined) dashboard, and for
any multi-user or global dashboard you create. For multi-user and global dashboards
you have access rights to view, you can change the Filter by option only if the Restrict
users from changing dashboard filter option is not selected on the Customize
Dashboard page.
Notes:
When you organize the Filter by dialog box by project code,
you cannot select a project code; you must expand the
project codes to display and select a project code value.
Similarly, when you organize the Filter by dialog by project, you
cannot select an EPS; you must expand the EPS nodes to
display and select a project.
You can only choose one portfolio, project code value, or
project as the dashboard filter.
Tips
You can display multiple dashboards on the Dashboards page. If there is not enough
room to display all tabs on the page, a black triangular arrow appears after the last
tab. Click it to view a list of dashboards and select one.
You cannot modify multi-user dashboards created by another user, even if you have
access rights to view the dashboard.

702
Getting Here
Click Dashboards.
Data Limits Page
Overview
Use this page to specify maximum levels for hierarchical structures. You can also specify
baseline and activity code maximums.
Screen Elements
Maximum Tree Levels
Enter values for the following:
EPS/WBS tree maximum levels: Enter a value of 1-50.
OBS tree maximum levels: Enter a value of 1-25.
Resources tree maximum levels: Enter a value of 1-25.
Role tree maximum levels: Enter a value of 1-25.
Cost Account tree maximum levels: Enter a value of 1-25.
Activity Code tree maximum levels: Enter a value of 1-25.
Resource Code tree maximum levels: Enter a value of 1-25.
Project Code Tree maximum levels: Enter a value of 1-25.
Maximum Codes and Baselines
Enter values for the following:
Maximum activity codes per project: Enter a value of 0-500.
Maximum baselines per project: Enter a value of at least 1.
Maximum baselines copied with project: Enter a value of 1-21.
Tips
If you change maximum hierarchy level settings, the new settings apply only when
you add new elements or edit existing elements.
Getting Here
1) Click the Administer menu and select Application Settings.
2) On the Application Settings pane, click Data Limits.
Date Format Section of the Global Tab of the My Preferences Page
Overview
Use this section to specify the format of date and time fields throughout the application.

Context-Sensitive Help Topics
703
Screen Elements
Date format list
Select how the date is displayed. (e.g., Day, Month, Year)
Four Digit year option: Determines whether the four digit year is displayed.
Month name option: Determines whether the month name is displayed.
Leading zeros option: Determines whether leading zeros are displayed.
Time format list
Select if you want the time displayed in 12 hour, 24 hour, or not at all.
Show minutes option: Determines whether the minutes are shown.
Separator list: Select one of the following to use for separating the day, month,
and year: /, -, or .
Getting Here
1) Click the Administer menu and select My Preferences.
2) On the My Preferences page, click the Global tab.
3) On the Global tab, expand the Date Format section.
Day View Detail Window of the Calendar View of the Activities Page
Overview
Use this detail window to view the complete list of activities scheduled that day and the
start and finish hour of activities that occur completely within that day.
Screen Elements
Activities list
The activities for the specified month.
Hours section
The start and finish hour of activities that occur completely within the selected day.
Hovering over an activity bar will display:
Project Name
The name of the project.
Project ID
The unique identifier assigned to the project.
Activity ID
The activity identifier that is unique within the project.

704
Activity Name field
The name of the activity.
Getting Here
1) Click Projects.
2) On the Projects navigation bar, click Activities.
3) On the Activities page, click the View menu and select Calendar View.
4) On the Calendar View page, double-click an activity bar.
Defaults Page of the Project Preferences Dialog Box
Overview
Use this page to configure default settings for new activities and assignments.
Screen Elements
Duration Type list
Determines whether the schedule, resource availability, or costs are most important
when updating activities. The duration type applies only when you have resources
assigned to the activity. Choose a duration type based on which factor is most
important (least flexible) in planning your project.
Percent Complete Type list
Determines the way in which the application calculates the percent complete for the
activity.
This default activity percent complete type will be applied to all new activities added
to a project. If you change this setting for an existing project that has activities, the
percent complete type of those existing activities will not be changed.
Activity Type list
Determines how duration and schedule dates are calculated for an activity:
Task Dependent: If resources should be scheduled based on the activity's
calendar.
Resource Dependent: If resources should be scheduled based on their assigned
calendars.
Level of Effort: For an ongoing activity whose duration depends on other activities.
The duration of a Level of Effort activity is calculated based on the schedule dates
from its predecessors and successors.
Start or Finish Milestone: If an activity marks the beginning or end of a major
project phase.
WBS Summary: For an activity with a particular WBS code.

Context-Sensitive Help Topics
705
Calendar field
The default calendar for new activities.
Cost Account field
The default cost account associated with the resource, role, or expense.
Price/Unit field
The default price/unit used to calculate the cost for activities that have
labor/non-labor units but no assigned resources and for activities that have assigned
resources or roles that do not have a specified price/unit.
To change the price/unit, type a new amount followed by a forward slash (/) and
time unit designation, for example, $20/h.
Activity ID Prefix field
The single or combination of letters and/or numbers to act as the Activity ID Prefix. This
field can contain 1 to 20 characters.
Activity ID Suffix field
The single or combination of letters and/or numbers to set as the Activity ID Suffix. The
value must be a number between 1 and 999,999.
Increment field
The number to act as the increment. The number must be a value between 1 and
99,999.
Rate Type list
The rate type that corresponds to a specific price/unit value defined for a resource or
role. A resource or role can have up to five rate types and corresponding price/unit
values.
The default rate type setting determines which of a resource's or role's price/unit
values is initially applied to new assignments within a project. The rate type on the
assignment can be edited to change the price/unit.
If the Default Rate Type setting for a project that has existing assignments is changed,
the rate type of those existing assignments will not be changed.
Drive activity dates by default option
Determines whether to set drive activity dates by default.
Resources can be assigned to the same activity more than once option
Determines whether resources can work on the same activity multiple times.
Tips
Changes to the defaults will only be applied to activities new to the project. Existing
activities will not be affected.

706
Getting Here
1) Click Projects.
2) On the Projects navigation bar, click EPS.
3) On the EPS page, click the Actions menu and select Set Project Preferences....
4) In the Project Preferences pane, click Defaults.
Definition Tab of the Create Filter Dialog Box of the Assignments Page
Overview
Use this tab to define the logical constraints and data criteria for the filter.
Screen Elements
Match any/all of the following rules list
Determines whether the filter should match any or all rules.
Field Name field
The name of the parameter used to filter data in the Assignments view. Parameters
are grouped in the following categories:
General: Displays fields that provide typical project information. Examples include
Activity ID and Activity Status.
Dates: Displays fields that provide important dates used during the project
lifecycle. Examples include Actual Finish and Planned Start.
Durations: Displays fields that provide data on the length of time needed to
complete an assignment and the lag time built in between assignments. Examples
include Actual Duration and Planned Lag.
Costs: Displays fields that provide cost information from different aspects of the
project. Examples include Actual Cost and Remaining Cost.
Units: Displays fields that provide resource work unit data. Examples include Actual
Regular Units and Planned Units.
Resource: Displays fields that provide resource data and settings. Examples
include Resource ID and Default Units/Time.
Percent Complete: Displays fields that provide the amount of time completed or
remaining on the resource assignments.
User Defined: Displays additional resource assignment fields created to capture
important information that is not available from the standard fields.
Resource User Defined: Displays additional resource fields created to capture
important information that is not available from the standard fields.
Global Activity Codes: Displays the global activity code fields defined in the
system.
Resource Codes: Displays the global resource code fields defined in the system.

Context-Sensitive Help Topics
707
Project Codes: Displays the global project code fields defined in the system.
Note: This field appears without a label in the user interface. It is
always the field furthest to the left in a row of three (3) data criteria
fields.
Constraint field
The list of available constraints. This field appears without a label in the user interface.
It is always the field in the center of the row of three (3) data criteria fields.
Value field
The value on which to filter.
Note: This field appears without a label in the user interface. It is
always the field furthest to the right in a row of three (3) data
criteria fields.
Remove a Row button
Subtracts a row of filter criteria.
Add a Row button
Adds a row of filter criteria.
Add Filter Criteria button
Adds a sub-row of filter criteria. This filter criteria is combined with its parent criteria to
create a very specific criteria statement.
Getting Here
1) Click Resources.
2) On the Resources navigation bar, click Assignments.
3) On the Assignments page, click Filters menu on the view toolbar or view menu
and select Add New Filter.
4) In the Create Filter dialog box, click the Definition tab.
Definition Tab of the Create or Modify Filter Dialog Box
Overview
Use this tab to define the logical constraints and data criteria for the filter.
Screen Elements
Match any/all of the following rules list
Determines whether the filter should match any or all rules.
708
Field Name field
The name of the field used for the filtering parameter. Select from one of the following
categories:
General: Displays fields concerned with basic information. Examples include
Activity ID or Owner.
Costs: Displays fields concerned with cost. Examples include Actual Expense Cost
or Original Budget.
Dates: Displays fields concerned with dates. Examples include Actual Finish or
Planned Start.
Durations: Displays fields concerned with durations. Examples include Free Float or
Remaining Duration.
Units: Displays fields concerned with units. Examples include Actual Labor Units or
Planned Labor Units.
Multiple Float Paths: Displays fields concerned with multiple float paths. Examples
include Float Path or Float Path Order.
Percent Complete: Displays fields concerned with percent complete. An example
is Percent Complete Type.
Timesheet Feedback: Displays fields concerned with timesheet feedback.
Examples include New Feedback and Review Status.
Project Codes: Displays fields concerned with project codes. Examples include
Current Phase and Location.
Summary: Displays fields concerned with summary information. Examples include
Contains Summary Data and Enable Summarization.
User Defined: Displays fields concerned with items the user creates and defines.
Global Activity Codes: Displays fields concerned with global activity codes.
Examples include Phase or Project ID.
Project Activity Codes: Displays fields concerned with project activity codes.
Examples include Contracts and Phase.
Notes:
This field appears without a label in the user interface. It is
always the field furthest to the left in a row of three (3) data
criteria fields.
The categories available depend on whether you open the
Create or Modify Filter dialog box from the Activities or EPS
page.
Constraint field
The list of available constraints. This field appears without a label in the user interface.
It is always the field in the center of the row of three (3) data criteria fields.

Context-Sensitive Help Topics
709
Value field
The value on which to filter.
Note: This field appears without a label in the user interface. It is always the field
furthest to the right in a row of three (3) data criteria fields.
Remove a Row button
Subtracts a row of filter criteria.
Add a Row button
Adds a row of filter criteria.
Add Filter Criteria button
Adds a sub-row of filter criteria. This filter criteria is combined with its parent criteria to
create a very specific criteria statement.
Getting Here
1) Click Projects.
2) On the Projects navigation bar, click Activities or EPS.
3) On the Activities or EPS page:
a. Select a view from the Activity View or EPS View list.
b. Click the View menu and select Customize View....
4) In the Customize Activity View or Customize Project View dialog box, click the Filters
tab.
5) On the Filters tab, click Add New Filter or select a filter and click Modify Filter.
6) In the Create Filter or Modify Filter dialog box, click the Definition tab.
Description Detail Window of the Cost Accounts Page
Overview
Use this detail window to write a description of the selected cost account.
Screen Elements
Text Editor toolbar
See Text Editor Toolbar (on page 1352).
Work area
Use this area to enter text and modify it using the Text Editor Toolbar.

710
Tips
Right-click to display more options. In addition to the toolbar options, Cut, Copy,
Paste, Font Options, Page Properties, Paragraph Properties, and Insert Table are all
offered.
Getting Here
1) Click the Projects menu and select Enterprise Project Data, or click the
Administer menu and select Enterprise Data.
2) In the Enterprise Data pane, expand Activities and click Cost Accounts.
3) On the Cost Accounts page, click the Description detail window.
Description Detail Window of the EPS Page
Overview
Use this detail window to enter a description of the selected project.
Screen Elements
Text field
Enter a description of the selected project in this field.
Tips
If you have more than one project selected, the detail window will not be visible.
Getting Here
1) Click Projects.
2) On the Projects navigation bar, click EPS.
3) On the EPS page, select a project and click the Description detail window.
Description Detail Window of the Funding Sources Page
Overview
Use this detail window to write a description of the selected funding source.
Screen Elements
Text Editor Toolbar
See Text Editor Toolbar (on page 1352).
Work Area
Use this area to enter a description about the funding source and modify it using the
Text Editor Toolbar.

Context-Sensitive Help Topics
711
Tips
Right-click to display more options. In addition to the toolbar options, Cut, Copy,
Paste, Font Options, Page Properties, Paragraph Properties, and Insert Table are all
offered.
Getting Here
1) Click the Projects menu and select Enterprise Project Data, or click the
Administer menu and select Enterprise Data.
2) In the Enterprise Data pane, expand Projects and click Funding Sources.
3) On the Funding Sources page, click the Description detail window.
Description Detail Window of the OBS Page
Overview
Use this detail window to write a description of the selected organizational breakdown
structure (OBS).
Screen Elements
Text Editor toolbar
See Text Editor Toolbar (on page 1352).
Work area
Use this area to enter text and modify it using the Text Editor Toolbar.
Getting Here
1) Click the Administer menu and select User Access.
2) On the User Access page, click OBS.
3) On the OBS page, click the Description detail window.
Description Detail Window of the Reports Page
Overview
This detail window provides a read-only description for the currently selected report.
Screen Elements
Description field
The unique descriptive summary for this report. The report description is useful in
distinguishing among reports with similar titles or to help users better understand the
utility of the report within your organization.

712
Getting Here
1) Click Reports.
2) On the Reports page:
a. Click View and select Reports.
b. Select a report and click the Description detail window.
Or
a. Click View and select Schedules.
b. Click a report name.
Description Detail Window of the Risk Scoring Matrices Page
Overview
Use this detail window to write a description of the selected risk scoring matrix.
Screen Elements
Text Editor Toolbar
See Text Editor Toolbar (on page 1352).
Work area
Use this area to enter text and modify it using the Text Editor Toolbar.
Getting Here
1) Click the Projects menu and select Enterprise Project Data, or click the
Administer menu and select Enterprise Data.
2) In the Enterprise Data pane, expand Risks and click Risk Scoring Matrices.
3) On the Risk Scoring Matrices page, click the Description detail window.
Description Detail Window of the Risks Page
Overview
Use this detail window to write a description of the selected risk.
Screen Elements
Text Editor toolbar
See Text Editor Toolbar (on page 1352).
Work area
Use this area to enter text and modify it using the Text Editor Toolbar.

Context-Sensitive Help Topics
713
Getting Here
1) Click Projects.
2) On the Projects navigation bar, click Risks.
3) On the Risks page, click the Description detail window.
Description Detail Window of the Roles Tab of the Administration Page
Overview
Use the Description detail window to add or edit a description for a role.
Screen Elements
Text Editor toolbar
See Text Editor Toolbar (on page 1352).
Work area
The area where you can enter a description for a role. Use the Text Editor Toolbar (on
page 1352) to modify entered text.
Getting Here
1) Click Resources.
2) On the Resources navigation bar, click Administration.
3) On the Administration page, click the Roles tab.
4) On the Roles tab, click the Description detail window.
Description Section of the Documents Details Page (without content repository)
Overview
Use this tab to enter and format notes about the document.
Screen Elements
Text Editor toolbar
See Text Editor Toolbar (on page 1352).
Work area
The area where you can enter a description. Use the Text Editor Toolbar (on page
1352) to modify text.
Getting Here
From the Documents page:
1) Click Projects.

714
2) On the Projects navigation bar, click Documents.
3) On the Documents page:
a. Select a project from the Select Project list if applicable.
b. Select a document from the left pane.
4) On the Document Details page, expand the Description section.
From the Workspace page:
1) Click Projects.
2) On the Projects navigation bar, click Workspace.
3) On the Workspace page:
a. Select a project from the Select Project list if applicable.
b. Expand the Project Documents portlet.
4) In the Project Documents portlet, expand the project and select a document.
5) On the Document Details page, expand the Description section.
Description Tab of the Document Details Section (with content repository)
Overview
Use this tab to enter and format notes about the document.
Screen Elements
Text Editor toolbar
See Text Editor Toolbar (on page 1352).
Work area
The area where you can enter a description. Use the Text Editor Toolbar (on page
1352) to modify text.
Tips
The document you select and where you access it might change which tabs are visible.
Getting Here
From the Documents page:
1) Click Projects.
2) On the Projects navigation bar, click Documents.
3) On the Documents page, click the Project tab.
4) On the Project tab, select a document and click the Description tab.
From the Workspace page:

Context-Sensitive Help Topics
715
1) Click Projects.
2) On the Projects navigation bar, click Workspace.
3) On the Workspace page, expand the Project Documents portlet and click the Project
tab.
4) On the Project tab, select a document and click Edit Details.
5) In the Document Details dialog box, click the Description tab.
From the Dashboards page:
1) Click Dashboards.
2) On the Dashboards page, select a dashboard tab.
3) On the dashboard tab, expand the My Documents portlet and click the Private
Documents tab.
4) On the Private Documents tab, select a document and click Edit Details.
5) In the Document Details dialog box, click the Description tab.
Document Categories Page
Overview
Use this page to add and configure document categories.
Screen Elements
Document Categories Toolbar
See Categories Toolbar (see "Enterprise Data Categories Toolbar" on page 1258).
Name field
The name of the document. For example, document category designations can
identify documents that are project standards or project deliverables.
Getting Here
1) Click the Projects menu and select Enterprise Project Data, or click the
Administer menu and select Enterprise Data.
2) In the Enterprise Data pane, expand Documents and click Document Categories.
Document Details Dialog Box
Overview
Use this dialog box to view the details for a document if you have the content repository
configured. With the appropriate access, based on a document's security policy, you
can edit a document's details.

716
Screen Elements
General tab
See General Tab of the Document Details Dialog Box of the Documents Portlet.
Description tab
See Description Tab of the Document Details Dialog Box of the Documents Portlet. This
tab is available when you are viewing a document on the Project Tab of the
Documents Portlet.
Related Items tab
See Related Items Tab of the Document Details Dialog Box of the Documents Portlet.
This tab is available when you are viewing a document on the Project Tab of the
Documents Portlet.
Version tab
See Version Tab of the Document Details Dialog Box of the Documents Portlet.
History tab
See History Tab of the Document Details Dialog Box of the Documents Portlet.
Getting Here
From the Workspace page:
1) Click Projects.
2) On the Projects navigation bar, click Workspace.
3) On the Workspace page, expand the Project Documents portlet and click the Project
tab.
4) On the Project tab, select a document and click Edit Details.
From the Dashboards page:
1) Click Dashboards.
2) On the Dashboards page, select a dashboard tab.
3) On the dashboard tab, expand the My Documents portlet and click the Private
Documents tab.
4) On the Private Documents tab, select a document and click Edit Details.
Document Details Page of the Documents Page (without content repository)
Overview
Use this section to view document details. With appropriate privileges, you can edit the
document's details.

Context-Sensitive Help Topics
717
Screen Elements
E-mail link
Enables you to configure and send an e-mail about a document. The Subject field
contains the title of the document. The application automatically populates the
message with specific information such as the associated project name, document
name, author, and version number. You can add additional information as
necessary.
General section
See General Section of the Documents Details Page (without content repository) (on
page 799).
Description section
See Description Section of the Documents Details Page (without content repository)
(on page 713).
Related Items section
See Related Items Section of the Document Details Page (without content repository)
(on page 984).
Getting Here
1) Click Projects.
2) On the Projects navigation bar, click Documents.
3) On the Documents page:
a. Select a project from the Select Project list if applicable.
b. Select a document from the left pane.
Document Details Section of the Documents Page (with content repository)
Overview
Use this section to view a project document's details. Also, with the appropriate access,
based on a document's security policy, you can edit a document's details.
Screen Elements
General tab
See General Tab of the Document Details Section (on page 805).
Description tab
See Description Tab of the Document Details Section (with content repository) (on
page 714).

718
Related Items tab
See Related Items Tab of the Document Details Section (with content repository) (on
page 985).
Version tab
See Version Tab of the Document Details Section (with content repository) (on page
1145).
History tab
See History Tab of the Document Details Section (with content repository) (on page
832).
Getting Here
1) Click Projects.
2) On the Projects navigation bar, click Documents.
3) On the Documents page, click the Project tab and select a document.
Document Review Details Dialog Box of the Project Tab
Overview
Use this dialog box to view detailed information for a selected document that is under
review or that has already been reviewed.
Screen Elements
Name field
The name of the review.
Description field
A more detailed summary for the item. The description provides more information
than short names or titles. It can give background information or establish a purpose
for the item. These details help differentiate between items with similar names and are
especially useful in multi-user environments.
Initiator field
The name of the user who started the review.
Due Date field
The date all reviewers need to complete the review. If no due date is specified for the
review, then this field appears blank.
Review Type list
Determines the type of review:

Context-Sensitive Help Topics
719
Anyone May Review: Enables any one of the listed reviewers to approve or reject
the document version. Once one reviewer approves it, the review status changes
to Review Approved; once one reviewer rejects it, the review status changes to
Review Rejected.
Everyone Must Review: Requires each listed reviewer to respond to the document
review to complete it. To change the review status to Review Approved, all
reviewers must approve the document. To change the review status to Review
Rejected, only one reviewer needs to reject the document.
Everyone Must Review in Sequence: Requires each listed reviewer to respond to
the document review in a designated sequence to complete it. To change the
review status to Review Approved, all reviewers must approve the document. To
change the review status to Review Rejected, only one reviewer needs to reject
the document. Once one reviewer rejects the document, the review is complete.
Pending Reviewers field
The names of the users who are assigned to the review and have not yet responded.
Getting Here
From the Documents page:
1) Click Projects.
2) On the Projects navigation bar, click Documents.
3) On the Documents page, click the Project tab.
4) On the Project tab, select a document and click the Version tab.
5) On the Version tab, click Review Status for a version.
From the Workspace page:
1) Click Projects.
2) On the Projects navigation bar, click Workspace.
3) On the Workspace page, expand the Project Documents portlet.
4) On the Project Documents portlet, click the Project tab.
5) On the Project tab, select a document and click Edit Details.
6) In the Document Details dialog box, click the Version tab.
7) On the Version tab, click Review Status for a version.
From the Dashboards page:
1) Click Dashboards.
2) On the Dashboards page, expand the My Documents portlet and click the Recent
Documents tab.
3) On the Recent Documents tab, select a project and click Edit Details.
4) In the Document Details dialog box, click the Version tab.
5) On the Version tab, click Review Status for a version.

720
Document Reviews Portlet
Overview
Use this portlet to view document reviews that either you have initiated or that require
action from you. The data displayed in this portlet is independent of the portfolio, project,
and project code filtering specified in the dashboard's Filter by field.
The Document Reviews portlet is unavailable if the content repository is not installed in
your P6 environment. For information about the status of the content or workflow
repositories, contact your P6 administrator.
Screen Elements
Action Required tab
See Action Required Tab of the Document Reviews Portlet (on page 539).
My Reviews tab
See My Reviews Tab of the Document Reviews Portlet (on page 892).
Getting Here
1) Click Dashboards.
2) On the Dashboards page, select a dashboard.
3) On the dashboard, expand the Document Reviews portlet.
Document Statuses Page
Overview
Use this page to add and configure document statuses.
Screen Elements
Document Statuses toolbar
See Enterprise Data Document Statuses Toolbar (on page 1263).
Name field
The name of the status. For example, document status designations can identify
which documents are in review or completed.
Getting Here
1) Click the Projects menu and select Enterprise Project Data, or click the
Administer menu and select Enterprise Data.
2) In the Enterprise Data pane, expand Documents and click Document Statuses.

Context-Sensitive Help Topics
721
Document UDFs Page
Overview
Use this page to add and configure user defined fields for documents.
Screen Elements
User Defined Fields toolbar
See User Defined Fields Toolbar (on page 1361).
User Defined Field field
The name of the user-defined field.
Data Type field
The name of the type of data that corresponds to each user-defined field. The data
type you select determines the type of data you can specify in a field. The following
data types are available:
Text: Allows you to use text or a combination of text and numbers.
Start Date: Allows you to enter Start Date information only.
Finish Date: Allows you to enter Finish Date information only.
Cost: Allows you to enter currency values.
Number: Allows you to use numerals with two decimal places.
Integer: Allows you to use numeric data, but not a number related to money.
Indicator: Allows you to use an indicator field that you can use to enter
color-coded icon values in columns and display color-coded text in reports.
Getting Here
1) Click the Projects menu and select Enterprise Project Data, or click the
Administer menu and select Enterprise Data.
2) In the Enterprise Data pane, expand Documents and click Document UDFs.
Documents Detail Window of the Activities Page
Overview
Use this detail window to relate or remove documents from an activity or to view a
related document.
Note: Your ability to manage document relationships depends on
two factors: your application security privileges and the security
policy of an individual document (if the document was added
from the content repository).

722
Screen Elements
Documents toolbar
See Documents Toolbar of the Activities Page (on page 1251).
Title field
The title of a document assigned to the activity.
Document Category list
The classification label used to organize documents.
Note: This field only contains data for WP&Doc documents, or documents that were
not added from the content repository. This field is blank for documents that were
added from the content repository.
Status field
The status of the document.
Document status designations are created in the Admin Categories dialog box in P6.
Public Location field
The selected document's publicly-accessible file location. All project participants can
view this file.
Note: This field only contains data for WP&Doc documents, or documents that were
not added from the content repository. This field is blank for documents that were
added from the content repository.
Tips
If you have more than one activity selected, the detail window will not be visible.
If you have a project template open, the icons in the detail window will be disabled.
Getting Here
1) Click Projects.
2) On the Projects navigation bar, click Activities.
3) On the Activities page, select an activity and click the Documents detail window.
Documents Details Page of the Activity Form Page
Overview
Use this page to review the details of a selected document.
Screen Elements
Document field
The name of the document. This field can be modified.

Context-Sensitive Help Topics
723
Remove Assignment link
Removes the document assignment.
Getting Here
From the Workgroup Workspace page:
1) Click Projects.
2) On the Projects navigation bar, click Workspace.
3) On the Workspace page, expand any portlet containing activities.
4) In the portlet, click an activity.
5) On the Activity Form page, expand the Documents section and click a document
title.
From the Dashboards page:
1) Click Dashboards.
2) On the Dashboards page, select a dashboard tab.
3) On the dashboard tab, expand any portlet containing activities.
4) In the portlet, click an activity.
5) On the Activity Form page, expand the Documents section and click a document
title.
Documents Page (with content repository)
Overview
Use this page to view, check in, check out, and download selected documents from one
or more projects, associate additional items with a selected document, and compare
documents across projects. With appropriate privileges, you can edit document
information or use a selected document as a template for creating new documents of
the same type for multiple projects.
Screen Elements
Project tab
See Project Tab of the Documents Page (with content repository) (on page 974).
WP & Docs tab
See WP & Docs Tab of the Documents Page (with content repository) (on page 1173).
Document Details section
See Document Details Section of the Documents Page (with content repository) (on
page 717).

724
Tips
The actions that are available for a document depend on the document security
policy.
The ability to start a review is only available with an installed and configured content
repository. See your P6 administrator.
Depending on the configuration of your content repository, the ability to search by
author might not be available. For information about P6 features supported by your
content repository, see your P6 administrator.
If P6 is used with the Oracle Universal Content Management content repository, your
workgroup documents display in the search results from the My Documents portlet.
Getting Here
1) Click Projects.
2) On the Projects navigation bar, click Documents.
Documents Page (without content repository)
Overview
Use this page to view document details and send e-mail about a document. This page
also enables you to associate additional items with the document and, with appropriate
privileges, edit document information.
Screen Elements
Select Project field
The list of open projects. You can select only one project at atime. Any changes you
make apply only to the currently selected project.
Refresh
Refreshes the current screen with any new, updated, or removed data.
Modify
Displays the following options to modify the issue forms page:
Close Modify: Closes the Modify options.
Add Form: Enables you to select a form to add.
Delete: Deletes the currently selected issue forms.
Search list
The criteria with which to search.
for field
Enter information to search with the corresponding Search list choice.

Context-Sensitive Help Topics
725
Search button
Displays options based on your entered criteria.
Clear Results button
Clears the for field and removes the options based on your entered criteria to display
all possible codes.
Organized By list
The criteria by which to organize search results. Select from Document Category,
Document Hierarchy, or Document Status.
Getting Here
1) Click Projects.
2) On the Projects navigation bar, click Documents.
Documents Portlet of the Workgroup Workspace Page
Overview
Use this portlet to view and access all documents that belong to the workgroup. You can
view project documents that are related to activities assigned to the workgroup, as well
as create and manage documents that only members of the workgroup can access
and share.
When a content repository is installed, the Documents portlet contains two tabs: Project
and Workgroup.
Screen Elements
Project tab
See Project Tab of the Documents Portlet of the Workgroup Workspace Page (on page
974).
Workgroup tab
See Workgroup Tab of the Documents Portlet of the Workgroup Workspace Page (on
page 1167).
Tips
A appears beside a document if it is checked out.
Your ability to modify or perform actions on a project document associated with a
workgroup activity depends on the document's security policy. Security policies do
not apply to workgroup documents.
Getting Here
From the Workspace page:

726
1) Click Projects.
2) On the Projects navigation bar, click Workspace.
3) On the Workspace page, expand the Workgroups portlet and select a workgroup.
4) On the Workgroup Workspace page, expand the Documents portlet.
From the Dashboards page:
1) Click Dashboards.
2) On the Dashboards page, select a dashboard tab.
3) On the dashboard tab, expand the My Workgroups portlet and select a workgroup.
4) On the Workgroup Workspace page, expand the Documents portlet.
Documents Section of the Activity Form Page
Overview
Use this section to assign documents to activities and view the details of these
documents.
Screen Elements
Assign Documents link
Opens a dialog box with all possible documents that can be assigned to the activity.
Title field
The title of a document assigned to the activity.
Document Category list
The classification label used to organize documents.
Note: This field only contains data for WP&Doc documents, or documents that were
not added from the content repository. This field is blank for documents that were
added from the content repository.
Status field
The status of the document.
Document status designations are created in the Admin Categories dialog box in P6.
Public Location field
The selected document's publicly-accessible file location. All project participants can
view this file.
Note: This field only contains data for WP&Doc documents, or documents that were
not added from the content repository. This field is blank for documents that were
added from the content repository.

Context-Sensitive Help Topics
727
Getting Here
From the Workgroup Workspace page:
1) Click Projects.
2) On the Projects navigation bar, click Workspace.
3) On the Workspace page, expand any portlet containing activities.
4) In the portlet, click an activity.
5) On the Activity Form page, expand the Documents section.
From the Dashboards page:
1) Click Dashboards.
2) On the Dashboards page, select a dashboard tab.
3) On the dashboard tab, expand any portlet containing activities.
4) In the portlet, click an activity.
5) On the Activity Form page, expand the Documents section.
Earned Value Page
Overview
Use this page to specify default settings for calculating earned value. You can change
the settings for specific WBS elements in the Earned Value detail window in Activities
page.
Screen Elements
Technique for computing performance percent complete
In this section, choose one of the following for computing performance percent
complete:
Activity % Complete: Select to calculate the earned value according to activity
completion percentages.
0/100 % Complete: Select to calculate the earned value as 100 percent after the
activity ends.
Use WBS Milestones: Select to calculate the earned value by defining milestones
at the WBS level and assigning a weight to each of them.
50/50 % Complete: Select to calculate the earned value as 50 percent after the
activity starts and until it ends. After the activity ends, the activity's earned value is
100 percent.
Custom % Complete: Enter a percent to calculate earned value after the activity
starts and until the activity ends. After the activity ends, the activity's earned value
is 100 percent.

728
Technique for computing estimate to complete (ETC)
In this section, choose a performance factor (PF) or remaining cost for computing
earned-value estimate-to-complete (ETC):
ETC = remaining cost for activity
or
ETC equals PF multiplied by (Budget at Completion minus Earned Value), where:
PF=1
PF=1/Cost Performance Index
PF=1/(Cost Performance Index*Schedule Performance Index)
PF=Enter Value
Earned Value Calculation
In this section, choose how to calculate the earned value:
When calculating earned value from a baseline use Choose 'At completion with
current dates,' 'Budgeted values with planned dates,' or 'Budgeted values with
current dates.'
Getting Here
1) Click the Administer menu and select Application Settings.
2) On the Application Settings pane, click Earned Value.
Earned Value Performance Portlet of the Dashboards Page
Overview
Use this portlet to view both current and forecast earned value schedule variance (SV),
cost variance (CV), or labor unit variance calculations. Data is calculated and displayed
in either costs or labor units, depending on your preference. Negative values indicate
unfavorable performance. Status indicators help you gauge whether a variance is within
an acceptable range or whether you will need to take corrective action, based on the
thresholds you define.
Screen Elements
To Date - Schedule (SV) field
For costs, calculated as: Earned Value Cost minus Planned Value Cost.
For labor units, calculated as: Earned Value Labor Units minus Planned Value Labor
Units.
To Date - Cost (CV) field
Calculated as: Earned Value Cost minus Actual Cost.

Context-Sensitive Help Topics
729
To Date - Labor Units (CV) field
Calculated as: Earned Value Labor Units minus Actual Labor Units
Forecast at Completion - Schedule field
For costs, calculated as: Budget at Completion multiplied by Schedule Variance
Index (SVI), where SVI equals SV divided by Planned Value Cost.
For labor units, calculated as: Baseline (BL) Labor Units multiplied by SVI Labor Units,
where SVI equals SV divided by Planned Value Labor Units.
Forecast at Completion - Cost field
Calculated as: Budget at Completion multiplied by Cost Variance Index (CVI), where
CVI equals CV divided by Earned Value Cost.
Forecast at Completion - Labor Units field
Calculated as: Baseline (BL) Labor Units multiplied by Cost Variance Index (CVI) Labor
Units, where CVI equals CV divided by Earned Value Labor Units.
Tips
The Earned Value Performance portlet calculates and displays data in cost or labor
units based on the option selected on the Global tab in My Preferences.
If a dashboard's Filter by option is set to a portfolio or project code, the portlet lists
each project included in the portfolio or project code filter and displays each
project's earned value performance data.
You can click a project name in the portlet to display the Performance Status page or
the associated Project Workspace; the page displayed depends on your module
access.
Getting Here
1) Click Dashboards.
2) On the Dashboards page, select a dashboard.
3) On the dashboard, expand the Earned Value Performance portlet.
Earned Value Performance Portlet of the Workspace Page
Overview
The Earned Value Performance portlet displays both current and forecast earned value
schedule variance (SV), cost variance (CV), and labor unit variance calculations.
Negative values indicate unfavorable performance. Status indicators help you gauge
whether a variance is within an acceptable range or whether you will need to take
corrective action, based on the thresholds you define.

730
Screen Elements
Legend
Key to performance threshold indicators. Use these visual indicators to quickly scan
values based on thresholds you define:
Critical: Indicates that a WBS, project, or portfolio requires significant corrective
action.
Warning: Indicates that a WBS, project, or portfolio needs attention and is
performing below expectations.
Acceptable: Indicates that a WBS, project, or portfolio is performing within an
expected range.
Exceptional: Indicates that a WBS, project, or portfolio is exceeding
expectations.
To Date area:
Schedule field
Calculated as: Earned Value Labor Units minus Planned Value Labor Units
The variance percentage is calculated as: (Earned Value Labor Units minus Planned
Value Labor Units) divided by Planned Value Labor Units.
Labor Units field
Calculated as: Earned Value Labor Units minus Actual Labor Units
The variance percentage is calculated as: (Earned Value Labor Units minus Actual
Labor Units) divided by Earned Value Labor Units.
Forecast at Completion area:
Schedule field
Calculated as: Budget At Completion multiplied by Schedule Variance Index
Where: Schedule Variance Index equals Schedule Variance divided by Planned
Value Labor Units
The variance percentage is calculated as: (Budget At Completion multiplied by
Schedule Variance Index) divided by Budget At Completion.
Labor Units field
Calculated as: BAC Labor Units multiplied by Cost Variance Index
Where: CVI equals CV divided by Earned Value Labor Units
The variance percentage is calculated as: (BAC Labor Units multiplied by CVI)
divided by BAC Labor Units.

Context-Sensitive Help Topics
731
Tips
In the Project Workspace, the Earned Value Performance portlet calculates and
displays data in cost or labor units based on the option selected in the Project
Performance section of the Customize Workspace page.
Project Workspace portlets display data for the selected project only. When multiple
projects are open, you must select the project you want to work with from the Select
Project box at the top right of the Workspace page. When a single project is open,
the Select Project box does not appear.
Getting Here
1) Click Projects.
2) On the Projects navigation bar, click Workspace.
3) On the Workspace page, expand the Earned Value Performance portlet.
Edit Dates and Constraints Page of the Activity Form Page
Overview
Use this page to edit dates and constraints for the activity.
Screen Elements
Start Date option
Determines whether the activity has started.
Start Date field
For started activities, the actual start date. For not started activities, set to the planned
start date until the project is scheduled. When scheduled, set to the remaining early
start date.
Finish Date option
Determines whether the activity has finished.
Finish Date field
For completed activities, the actual finish date. For not started and in-progress
activities, set to the planned finish date if the project has not been scheduled. When
scheduled, set to the remaining early finish date.
Suspend Date field
The date work has stopped on a given activity for an unknown, but temporary, period
of time. For example, an event might force an activity to be interrupted or resource
constraints might put an activity on hold.

732
The suspend date must be later than the actual start date, which the activity must
have. The progress of the activity can be resumed by setting the resume date. The
suspend/resume period behaves like a non-work time on the activity calendar or
resource calendar for task and resource dependent activities.
Resume Date field
The date when a suspended task or resource dependent activity is resumed. The
resume date must be later than the suspend date and earlier than the actual finish
date.
The suspend/resume period behaves like a non-work time on the activity calendar or
resource calendar for task and resource dependent activities.
Duration Percent Complete field
The percent complete of the activity duration. The type of percent you see depends
on the percent complete type you select for the activity in the General section of the
Activity Form page.
The planned duration is taken from the current plan, not from the baseline.
Calculated as (Planned Duration minus Remaining Duration) divided by Planned
Duration multiplied by 100. Always in the range 0 to 100.
Primary Constraint list
Determines the primary constraint on the activity. Choose from one of the following
options:
Start On: Imposes the specific start date you choose. The Start On constraint can
delay an activity's early start or move forward an activity's late start to satisfy the
constraint date.
Start On or Before: Defines the latest date an activity can start. This constraint only
affects late dates and might decrease total float. When calculating a schedule,
P6 imposes the start on or before constraint in the backward pass only if the
calculated late start date will be later than the imposed date
Start On or After: Defines the earliest date an activity can begin. This constraint
affects only early dates. When calculating a schedule, P6 imposes the start on or
after constraint in the forward pass only if the calculated early start date will be
earlier than the imposed date.
Finish On: Imposes the specific finish date you choose. The Finish On constraint can
delay an activity's early finish or move forward an activity's late finish to satisfy the
constraint date
Finish On or Before: Defines the latest time an activity can finish. The finish on or
before constraint affects only late dates.
Finish On or After: Defines the earliest date an activity can finish. The finish on or
after constraint reduces float to coordinate parallel activities, ensuring that the
finish of an activity is not scheduled before the specified date. It is usually applied
to activities with few predecessors that must finish before the next phase of a
project.

Context-Sensitive Help Topics
733
As Late As Possible: Imposes a restriction on an activity with positive float to allow it
to start as late as possible without delaying its successors. When calculating a
schedule, P6 sets the activity's early dates as late as possible without affecting
successor activities.
Mandatory Start: Imposes the early and late start dates you choose. P6 uses the
mandatory early start date regardless of its effect on network logic. A mandatory
early start date could affect the late dates for all activities that lead to the
constrained activity and all early dates for the activities that lead from the
constrained activity.
Mandatory Finish: Imposes the early and late finish dates you choose. P6 uses the
mandatory finish date regardless of its effect on network logic. This constraint
affects the late dates for all activities that lead to the constrained activity and all
early dates for the activities that lead from the constrained activity.
Primary Constraint Date field
The date associated with the primary constraint, if the activity has a primary
constraint assigned.
Secondary Constraint list
Determines the secondary constraint on the activity. Available only when the Primary
Constraint is not Start On, Finish On, Mandatory Start, or Mandatory Finish. Choose
from one of the following options:
Start On or After: Defines the earliest date an activity can begin. This constraint
affects only early dates. When calculating a schedule, P6 imposes the start on or
after constraint in the forward pass only if the calculated early start date will be
earlier than the imposed date.
Finish On or After: Defines the earliest date an activity can finish. The finish on or
after constraint reduces float to coordinate parallel activities, ensuring that the
finish of an activity is not scheduled before the specified date. It is usually applied
to activities with few predecessors that must finish before the next phase of a
project.
Secondary Constraint Date field
The date associated with the secondary constraint, if the activity has a secondary
constraint assigned.
This field is only available if a primary constraint is already entered.
Expected Finish field
The date the activity's primary resource expects the activity to end.
Only the primary resource can edit this field if the activity has started.
Getting Here
From the Workgroup Workspace page:

734
1) Click Projects.
2) On the Projects navigation bar, click Workspace.
3) On the Workspace page, expand any portlet containing activities.
4) In the portlet, click an activity.
5) On the Activity Form page, expand the Status section and click Edit dates and
constraint.
From the Dashboards page:
1) Click Dashboards.
2) On the Dashboards page, select a dashboard tab.
3) On the dashboard tab, expand any portlet containing activities.
4) In the portlet, click an activity.
5) On the Activity Form page, expand the Status section and click Edit dates and
constraint.
Edit Day Dialog Box of Calendars
Overview
Use this dialog box to edit the work time for the selected day.
Screen Elements
Set day as field
This setting indicates whether the application will treat this day as Work or Nonwork
day.
Total work hours option
If you select this option, you can manually enter the total work hours for the day.
Total work hours field
The total work hours for the day. For example, 8.5.
Detail work hours option
If you select this option, you can manually enter a series of work hour ranges for the
day.
From: fields
The starting times for each detailed work hour range.
To: fields
The ending times for each detailed work hour range.

Context-Sensitive Help Topics
735
Create work time button
Adds a new work hour range to the series.
Remove work period button
Removes a work hour range from the series.
Set to Standard button
Sets the selected calendar day work or nonwork hours to the standard work time.
Getting Here
To access enterprise project data:
1) Click the Projects menu and select Enterprise Project Data.
2) In the Enterprise Project Data dialog box, expand Projects and click Project
Calendars.
3) On the Project Calendars page, select a calendar and click the Calendar tab or
Standard Work Week tab.
4) On the Calendar tab or Standard Work Week tab, right-click a day and choose Edit
Calendar Day.
To access enterprise resource data:
1) Click the Resources menu and select Enterprise Resource Data.
2) In the Enterprise Data pane, click Resource Calendars.
3) On the Resource Calendars page, select a calendar and click the Calendar tab or
Standard Work Week tab.
4) On the Calendar tab or Standard Work Week tab, right-click a day and choose Edit
Calendar Day.
To access enterprise data:
1) Click the Administer menu and select Enterprise Data.
2) In the Enterprise Data pane, perform one of the following steps:
expand Global and click Global Calendars.
expand Projects and click Project Calendars.
expand Resources and click Resource Calendars.
3) On the Global, Project, or Resource Calendars page, select a calendar and click the
Calendar tab or Standard Work Week tab.
4) On the Calendar tab or Standard Work Week tab, right-click a day and choose Edit
Calendar Day.

736
Edit Duration and Units Page of the Activity Form Page
Overview
Use this page to edit the duration and units for the activity.
Screen Elements
Planned Duration field
The total working time from the activity planned start date to the planned finish date.
The planned working time is calculated using the activity's calendar.
Actual Duration field
The total working time from the activity actual start date to the actual finish date for
completed activities, or the current data date for in-progress activities.
The actual working time is computed using the activity's calendar.
Remaining Duration field
The total working time from the activity remaining start date to the remaining finish
date.
The remaining working time is calculated using the activity's calendar. Before the
activity is started, the remaining duration is the same as the planned duration. After
the activity is completed the remaining duration is zero.
Planned Labor Units field
The expected number of units or the expected total cost required to complete the
activity.
Actual Labor Units field
The expected number of units that have been expended or the total cost that has
been incurred for the selected activity.
Remaining Labor Units field
The remaining units for all labor resources assigned to the activity.
The remaining units reflects the work remaining to be done for the activity. Before the
activity is started, the remaining units are the same as the planned units. After the
activity is completed, the remaining units are zero.
Planned Non-Labor Units field
The expected number of units or the expected total cost required to complete the
activity.
Actual Non-Labor Units field
The number of units that have been expended or the total cost that has been
incurred for the selected activity.

Context-Sensitive Help Topics
737
Remaining Non-Labor Units field
The remaining units for all non-labor resources assigned to the activity.
The remaining units reflects the work remaining to be done for the activity. Before the
activity is started, the remaining units are the same as the planned units. After the
activity is completed, the remaining units are zero.
Getting Here
From the Workgroup Workspace page:
1) Click Projects.
2) On the Projects navigation bar, click Workspace.
3) On the Workspace page, expand any portlet containing activities.
4) In the portlet, click an activity.
5) On the Activity Form page, expand the Status section and click Edit duration and
units.
From the Dashboards page:
1) Click Dashboards.
2) On the Dashboards page, select a dashboard tab.
3) On the dashboard tab, expand any portlet containing activities.
4) In the portlet, click an activity.
5) On the Activity Form page, expand the Status section and click Edit duration and
units.
Edit Relationship Dialog Box of the Activities Page
Overview
Use this dialog box to edit the lag and type of relationship that exists between two
activities. In order to edit a relationship, the Show Relationship Lines option in the View
menu must be enabled.
Screen Elements
Predecessor field
The name of the selected activity's predecessor in a read-only field.
Successor field
The name of the selected activity's successor in a read-only format.
Relationship Type field
The relationship between two activities. Select from the following types:
Finish to Start: A relationship in which the start of a successor activity depends on
the completion of its predecessor activity. This is the default activity relationship.

738
Finish to Finish: A relationship in which the finish of a successor activity depends on
the finish of its predecessor activity.
Start to Start: A relationship between activities in which the start of a successor
activity depends on the start of its predecessor.
Start to Finish: A relationship between activities in which a successor activity
cannot complete until its predecessor activity starts.
Lag field
The amount of time the predecessor activity was delayed, affecting the ability of its
successor activity to start or finish.
Getting Here
1) Click Projects.
2) On the Projects navigation bar, click Activities.
3) On the Activities page, click the View menu and select Gantt Chart.
4) In the Gantt chart, right-click on an activity relationship line and select Edit
Relationship.
Edit Resource Assignment Dialog Box
Overview
Use Activity Resource Details to assign resources and specify details for the resources
such as units, costs, and rate.
Screen Elements
General area
Enter information in the following fields to display in the Resources section:
Resource field
The name of the resource.
Role field
The name of the role.
Primary Resource option
Determines whether the corresponding resource is the activity's primary resource.
Typically, the primary resource is the person responsible for the overall work on the
activity and for updating activity status.
Units area
Enter information in the following fields to display in the Resources section:

Context-Sensitive Help Topics
739
Planned field
The expected number of units required to complete the activity.
Actual field
The exact number of units that have been expended or the total cost that has been
incurred for the selected activity.
Remaining field
The number of units required to complete the activity.
Remaining Units/Time field
The units per time required to complete the activity.
Getting Here
1) Click Resources.
2) On the Resources navigation bar, click Analysis.
3) On the Analysis page, click the Role Usage tab.
4) On the Role Usage tab, select a role and select to display the Spreadsheet.
5) On the Spreadsheet, click a project name.
6) In the Resource Staffing dialog box, click an activity name.
7) In the Activity Details dialog box, expand the Resources section and click a Role
Name.
Edit Resource Assignment Section of Activity Details of the Resources Dialog Box
Overview
Use this dialog box to assign resources and specify details for the resources such as units,
costs, and rate.
Screen Elements
Resource field
The name for the resource. Click the name of a resource to view their usage in a
spreadsheet or histogram format.
Role field
The name of the role.
Primary Resource option
Determines whether the corresponding resource is the activity's primary resource.
Typically, the primary resource is the person responsible for the overall work on the
activity and for updating activity status.

740
Units area
The information to display in the Resources section:
Planned field
The expected number of units required to complete the activity.
Actual field
The exact number of units that have been expended or the total cost that has been
incurred for the selected activity.
Remaining field
The number of units required to complete the activity.
Remaining Units/Time field
The units per time required to complete the activity.
Delete Assignment link
Deletes the current assignment.
Getting Here
From the Team Usage page:
1) Click Projects.
2) On the Projects navigation bar, click Team Usage.
3) On the Team Usage page:
a. If more than one project is open, select a project from the Select Project list.
b. Click the Organized By list and select Roles.
c. Expand a project and select a role in the left pane.
d. Select the Spreadsheet option and click a project in the right pane.
4) In the Resources dialog box:
a. Click the Unstaffed and Staffed option to show all activities.
b. Select an activity.
5) On the Activity Details page, expand the Resources section and click a resource or
role.
From the Dashboards page:
1) Click Dashboards.
2) On the Dashboards page, expand the Open Requests for Resources portlet and
select a project or role name, depending on your customization options.
3) On the Resource Staffing Details page:
a. Click the Unstaffed and Staffed option to show all activities.
b. Select an activity.

Context-Sensitive Help Topics
741
4) On the Activity Details page, expand the Resources section and click a resource or
role.
Edit Resource or Role Details Page of the Open Requests for Resources Portlet
Overview
Use this page to configure an activity's resource, role, or units.
Screen Elements
Resource field
The name for the resource. Click the name of a resource to view their usage in a
spreadsheet or histogram format.
Role field
The name of the role.
Primary Resource option
Determines whether this resource is the main resource for the activity.
Units area
Enter information in the following fields to display in the Resources section:
Planned field
The expected number of units required to complete the activity.
Actual field
The exact number of units that have been expended or the total cost that has been
incurred for the selected activity.
Remaining field
The number of units required to complete the activity.
Remaining Units/Time field
The units per time required to complete the activity.
Getting Here
1) Click Dashboards.
2) On the Dashboards page, select a dashboard.
3) On the dashboard, expand the Open Requests for Resources portlet.
4) In the Open Requests for Resources portlet, select a project or a role name.
5) On the Resource Staffing page, select an activity.
6) On the Activity Details page, expand the Resources section and select a resource or
role.

742
Add or Edit Service Dialog Box of the Scheduled Services Page
Overview
Use this dialog box to create or modify the type, time, frequency, and projects for a
service.
Screen Elements
Service Name field
The name of the selected service.
Service Type list
Determines which type of service will run.
Enable Service option
Determines whether the scheduled service you are creating or editing should be
enabled.
Run Service lists
Determines how often the service will run.
Start Time selector
Determines the time the service will run.
Select Projects table
The projects to which the application will apply the scheduled services.
Add
Enables you to select a project, group of projects, or EPS to add to the Select Projects
table. You can select from any project to which you have OBS access. The Assign
button is disabled if you do not have the appropriate security for a project, the
project or EPS is already assigned to the service, or the parent of the selected EPS
node is already in the Select Projects table.
Delete
Deletes the selected item or items permanently.
Use this project's settings field
Enables you to select the project which will determine the schedule or resource
leveling settings to apply to the service when it is run. This field is only available for
schedule or level services.

Context-Sensitive Help Topics
743
Tips
You cannot modify the Service Type if projects are assigned to the service. If there are no
projects assigned, the list is enabled.
Getting Here
The Add Service dialog box:
1) Click the Projects menu and select Scheduled Services.
2) On the Scheduled Services page, click Add.
The Edit Service dialog box:
1) Click the Projects menu and select Scheduled Services.
2) On the Scheduled Services page, select a service and click Edit.
Edit Spending and Benefit Plans of Project Page
Overview
Use this page to edit spending and benefit plans for each time period in which your
organization wants to track ROI for a specific project. You can also use the page to
specify the annual discount rate and period.
Screen Elements
Date field
The month, quarter, or year in which you want to track ROI for this project. The dates
listed correspond to the choice you made in the Specify the timescale for entering
ROI spending and benefit plans list on the previous page. You will see one of the
following series of dates for editing your spending and benefit plans depending on
the timescale selected:
Twelve (12) months within a single year
Eight (8) quarters spanning two (2) years
Ten (10) years
Spending Plan field
The anticipated or actual project spending for the corresponding time period.
Benefit Plan field
The anticipated or actual profit or benefit portion for each time period. Typically, the
benefit plan begins after the project has completed.

744
Note: The plan values you enter should not be discounted and can
represent positive or negative amounts. Regardless of the
timescale selected for display, spending and benefit plan values
are stored in the database by month. Quarterly and decade totals
are computed by totaling the respective 3-month or 12-month
periods. When you edit a value on a year/quarter timescale, the
new value is stored into the database in the first month of the
quarter; the remaining two months store a value of zero. Likewise,
when you edit a value on a decade/year timescale, the new
value is stored into the database in the first month of the year; the
remaining eleven months store a value of zero.
Annual Discount Rate field
The interest rate associated with the cost of an investment from your commercial
bank or another funding source. Valid values are 0 to 100. This rate is used to
calculate Total Spending Plan Present Value and Total Benefit Plan Present Value.
For example, an annual growth rate of an investment such as 4.75% can be used as
an annual discount rate. This rate is used when a future value is assumed and you are
trying to find the required net present value.
Discount Application Period list
The time interval (month, quarter, or year) used to determine how the discount rate is
applied in calculating the present value of the spending and benefit plans. When you
change this field value, the application recalculates the discounted TPV of both the
spending and benefit plans as well as the NPV, ROI, and Payback Period for the
project.
Getting Here
1) Click Portfolios.
2) On the Portfolio navigation bar, click ROI.
3) On the Portfolio ROI page, click the Details link for a project.
4) On the Return on Investment of Project page, click Edit Spending and Benefit Plans.
Effect Detail Window of the Risks Page
Overview
Use this detail window to write a description of the effect of the selected risk.
Screen Elements
Text Editor toolbar
See Text Editor Toolbar (on page 1352).

Context-Sensitive Help Topics
745
Work area
Use this area to enter text and modify it using the Text Editor Toolbar.
Getting Here
1) Click Projects.
2) On the Projects navigation bar, click Risks.
3) On the Risks page, click the Effect detail window.
Enterprise Data Page
Overview
Use this page to configure the enterprise data for your entire organization.
Screen Elements
Enterprise Data Category list
A list of all the enterprise data types grouped by category. Select an entry in the list to
open its enterprise data settings.
Global category
Currencies: Enables you to define the monetary units used to store costs for all
projects in the database.
Financial Periods: Enables you to define predefined time periods you can apply to
financial or scheduling data to consistently measure and compare data.
Global Calendars: Enables you to define available workdays, workhours, holidays,
and so on that apply to all projects in the database.
Overhead Codes: Enables you to categorize users' non-project-related time,
which they use with timesheets, for example, sick time, vacation, and so on.
Timesheet Periods: Enables you to define the amount of time timesheets cover, for
example, every two weeks or every month.
Projects category
Baseline Types: Enables you to categorize and standardize baselines across
projects.
Funding Sources: Enables you to define the agencies, businesses, or groups that
provide funding for projects.
Notebook Topics: Enables you to define types of notebook topics and allows
multiple users to apply a common theme or label to shared information.
Project Calendars: Enables you to define standard work weeks for projects.
Project Codes: Enables you to track different projects based on characteristics
they share.
Project UDFs: Enables you to define organization-specific data related to projects.

746
WBS Categories: Enables you to clasify work breakdown structures (WBSs), to help
you organize, filter, report, and maintain WBS information.
WBS UDFs: Enables you to define organization-specific data related to work
breakdown structures.
Activities category
Enables you to create, modify, and delete various activity-related data.
Activity Codes: Enables you to categorize activities into logical groups based on
your organization's criteria.
Activity UDF: Enables you to define organization-specific data related to activities.
Cost Accounts: Enables you to monitor project expenses, activity costs, and
earned value throughout the project life cycle.
Expense Categories: Enables you to classify and standardize expenses, and
organize and maintain your expense information.
Expense UDFs: Enables you to define organization-specific data related to
expenses.
Step Templates: Enables you to define a group of steps common to multiple
activities, and then assign the template to different activities.
Step UDFs: Enables you to define organization-specific data related to steps.
Resources category
Enables you to create, modify, and delete various resource-related data.
Assignment UDFs: Enables you to define organization-specific data related to
resource assignments.
Rate Types: Enables you to define price/units used to calculate costs for resource
assignments.
Resource Calendars: Enables you to define resource-specific workdays and
workhours in a day.
Resource Codes: Enables you to categorize resources into logical groups based
on your organization's criteria.
Resource Curves: Enables you to define custom resource curves, which specify the
allocation of resources and costs over the duration of an activity. Resource units
and costs are distributed evenly throughout an activity unless you specify
nonlinear distribution using resource curves.
Resource UDFs: Enables you to define organization-specific data related to
resources.
Units of Measure: Enables you to define standardized ways to define units of time
or materials.

Context-Sensitive Help Topics
747
Risks category
Risk Categories: Enables you to clasify risk types for your specific project or business
that are used to categorize and organize project risks. Categorizing risks enables
you to analyze the types of risks occurring and see trends within the project or
across multiple projects.
Risk Thresholds: Enables you to define ranges of values (for example, ontetary,
time, quality, technical, etc.) to use in rating or assessing the impact of a risk to a
project.
Risk Scoring Matrix: Enables you to calculate the impact of risk on a project, to
help you determine if the risk should be addressed during the course of the
project, or if the risk does not present a significant impact to the cost or schedule
of the project.
Risk UDFs: Enables you to define organization-specific data-User Defined Fields
(UDFs)-related to risks.
Issues category
Issue Codes: Enables you to categorize issues into logical groups based on your
organization's criteria.
Issue UDFs: Enables you to define organization-specific data related to issues.
Documents category
Enables you to create, modify, and delete various documents-related data.
Document Categories: Enables you to classify documents into
organization-specific categories, such as project standards or project
deliverables.
Document Statuses: Enables you to define organization-specific statuses for
documents, such as in review, approved, or completed.
Document UDFs: Enables you to define organization-specific data related to
documents.
Getting Here
Click the Projects menu and select Enterprise Project Data, or click the Administer
menu and select Enterprise Data.
Enterprise Project Data Dialog Box
Overview
Use this dialog box to configure the enterprise project data for your entire organization.
Note: This dialog box presents only a subset of enterprise data for
projects and activities. To view all enterprise data, see the
alternate steps under Getting Here at the bottom of the page.

748
Screen Elements
Enterprise Project Data Category list
The list of all the enterprise project data categories and types.
Projects category
Baseline Types: Enables you to categorize and standardize baselines across
projects.
Funding Sources: Enables you to define the agencies, businesses, or groups that
provide funding for projects.
Notebook Topics: Enables you to define types of notebook topics and allows
multiple users to apply a common theme or label to shared information.
Project Calendars: Enables you to define standard work weeks for projects.
Project Codes: Enables you to track different projects based on characteristics
they share.
Project UDFs: Enables you to define organization-specific data related to projects.
WBS Categories: Enables you to clasify work breakdown structures (WBSs), to help
you organize, filter, report, and maintain WBS information.
WBS UDFs: Enables you to define organization-specific data related to work
breakdown structures.
Activities category
Enables you to create, modify, and delete various activity-related data.
Activity Codes: Enables you to categorize activities into logical groups based on
your organization's criteria.
Activity UDF: Enables you to define organization-specific data related to activities.
Cost Accounts: Enables you to monitor project expenses, activity costs, and
earned value throughout the project life cycle.
Expense Categories: Enables you to classify and standardize expenses, and
organize and maintain your expense information.
Expense UDFs: Enables you to define organization-specific data related to
expenses.
Step Templates: Enables you to define a group of steps common to multiple
activities, and then assign the template to different activities.
Step UDFs: Enables you to define organization-specific data related to steps.
Risks category
Risk Categories: Enables you to clasify risk types for your specific project or business
that are used to categorize and organize project risks. Categorizing risks enables
you to analyze the types of risks occurring and see trends within the project or
across multiple projects.

Context-Sensitive Help Topics
749
Risk Thresholds: Enables you to define ranges of values (for example, ontetary,
time, quality, technical, etc.) to use in rating or assessing the impact of a risk to a
project.
Risk Scoring Matrix: Enables you to calculate the impact of risk on a project, to
help you determine if the risk should be addressed during the course of the
project, or if the risk does not present a significant impact to the cost or schedule
of the project.
Risk UDFs: Enables you to define organization-specific data-User Defined Fields
(UDFs)-related to risks.
Issues category
Issue Codes: Enables you to categorize issues into logical groups based on your
organization's criteria.
Issue UDFs: Enables you to define organization-specific data related to issues.
Documents category
Enables you to create, modify, and delete various documents-related data.
Document Categories: Enables you to classify documents into
organization-specific categories, such as project standards or project
deliverables.
Document Statuses: Enables you to define organization-specific statuses for
documents, such as in review, approved, or completed.
Document UDFs: Enables you to define organization-specific data related to
documents.
Getting Here
To navigate to project enterprise data:
Click the Projects menu and select Enterprise Project Data.
To navigate to all enterprise data:
Click the Administer menu and select Enterprise Data.
Enterprise Resource Data Dialog Box
Overview
Use this dialog box to configure the enterprise resource data for your entire organization.
Select a type of enterprise resource data to open its own individual page where you can
create, modify, and delete entries.
Note: This dialog box presents only the subset of enterprise data for
resources. To view all enterprise data, see the alternate steps under
Getting Here below.

750
Screen Elements
Enterprise Resource Data pane
Resources category
Enables you to create, modify, and delete various resource-related data.
Assignment UDFs: Enables you to define organization-specific data related to
resource assignments.
Rate Types: Enables you to define price/units used to calculate costs for resource
assignments.
Resource Calendars: Enables you to define resource-specific workdays and
workhours in a day.
Resource Codes: Enables you to categorize resources into logical groups based
on your organization's criteria.
Resource Curves: Enables you to define custom resource curves, which specify the
allocation of resources and costs over the duration of an activity. Resource units
and costs are distributed evenly throughout an activity unless you specify
nonlinear distribution using resource curves.
Resource UDFs: Enables you to define organization-specific data related to
resources.
Units of Measure: Enables you to define standardized ways to define units of time
or materials.
Getting Here
To access enterprise resource data:
Click the Resources menu and choose Enterprise Resource Data.
To access enterprise data:
1) Click the Administer menu and select Enterprise Data.
2) In the Enterprise Data pane, expand an entry in the Enterprise Data pane.
EPS and Projects Detail Window of the Project Security Profiles Page
Overview
Use this detail window to assign EPS and projects privileges to the selected project
security profile.
Screen Elements
Privilege field
The name of the security permission that is assigned (option selected) or denied
(option cleared) to users of the currently selected profile.

Context-Sensitive Help Topics
751
Privilege option
The option in the column header that determines whether the privileges are all
assigned (selected), all denied (clear), or individually configured (indicated with a
dash or - sign).
Add/Edit/Delete EPS Except Costs/Financials option
Determines whether the profile will enable users to create, modify, and remove EPS
hierarchy nodes, edit EPS notebook, and edit all EPS-related data except financial
information.
Edit EPS Costs/Financials option
Determines whether the profile will enable users to modify EPS budget logs, funding
sources, and spending plans.
Add Projects option
Determines whether the profile will enable users to create, copy, and paste projects
within the EPS node. To create project templates, users must also have the
'Add/Edit/Delete Project Templates' global privilege assigned to their profile.
Delete Projects option
Determines whether the profile will enable users to delete, cut, and paste projects
within the EPS node. To delete project templates, users must also have the
'Add/Edit/Delete Project Templates' global privilege assigned to their profile.
Edit Project Details Except Costs/Financials option
Determines whether the profile will enable users to edit fields in General, Defaults,
Resources, and Settings tabs in Project preferences. This privilege also enables users to
assign or remove a risk scoring matrix to a project in the Risk Scoring Matrices page in
Enterprise Data. To assign a project baselines, users must also have the 'Assign Project
Baselines' project privilege assigned to their profile.
Add/Edit/Delete WBS Except Costs/Financials option
Determines whether the profile will enable users to create, modify, and remove WBS
hierarchy nodes, notebook entries, earned value settings, milestones (steps), work
products and documents, and dates.
Edit WBS Costs/Financials option
Determines whether the profile will enable users to modify WBS budget logs, funding
sources, spending plan, and financial data at the project level. This privilege also
enables users to edit cost data at the activity level, including resource assignments.
This privilege also selects the 'View Project Costs/Financials' project privilege.

752
View Project Costs/Financials option
Determines whether the profile will enable users to display all monetary values for
projects. For users who do not have this privilege assigned to their profile, all areas that
display monetary values will display dashes and cannot be edited. To use the
Recalculate Assignment Costs feature, users must also have the 'Add/Edit Activities
Except Relationships' project privilege assigned to their profile. To display the resource
price/unit, users must have the 'View Resource and Role Costs/Financials' global
privilege assigned to their profile.
Delete Project Data with Timesheet Actuals option
Determines whether the profile will enable users to delete activities and resource
assignments for projects that have timesheet actuals. To delete project data at all
different levels (activity, WBS, project, and EPS), users must also have the appropriate
privileges assigned to their profile. For example, to delete activities with timesheet
actuals, users must also have the 'Delete Activities' project privilege assigned to their
profile. To delete activities and WBS nodes with timesheet actuals, users must
additionally have the 'Add/Edit/Delete WBS Except Costs/Financials' project privilege
assigned to their profile.
Tips
To modify templates, you must have the same project privileges that are required to
modify projects.
Getting Here
1) Click the Administer menu and select User Access.
2) On the User Access page, click Project Security Profiles.
3) On the Project Security Profiles page, click the EPS and Projects detail window.
EPS Budget Log Detail Window of the EPS Page
Overview
Use this detail window to create, delete, or modify an EPS node budget log. A budget
log specifies details about a line item, including who has signature approval, the
approval status, the reason why the expense was required, and so on.
Screen Elements
Budget Log toolbar
See Budget Log Toolbar (on page 1245).
Amount field
The amount of the budgeted line item.

Context-Sensitive Help Topics
753
Change Number field
The quantity purchased.
Date field
The date of the budgeted line item.
Reason field
The reason why the expense was required.
Responsible field
The name of the person with signature approval for the line item.
Status field
The approval status of the line item.
Tips
If you have more than one EPS selected, the detail window will not be visible.
Getting Here
1) Click Projects.
2) On the Projects navigation bar, click EPS.
3) On the EPS page, select an EPS node and click the Budget Log detail window.
EPS Funding Detail Window of the EPS Page
Overview
Use this detail window to assign, configure, or remove funding sources from an EPS node.
Screen Elements
Funding toolbar
See Funding Toolbar (on page 1290).
Amount field
The amount of the budgeted line item.
Fund Share field
The percentage of the total fund that is allocated to the current project or EPS.
Funding Source field
The name of a funding source assigned to the current project or EPS.

754
Tips
If you have more than one EPS selected, the detail window will not be visible.
Getting Here
1) Click Projects.
2) On the Projects navigation bar, click EPS.
3) On the EPS page, select an EPS node and click the Funding detail window.
EPS General Detail Window of the EPS Page
Overview
Use this detail window to add or modify information about the selected EPS node.
Screen Elements
EPS selector
Cycles through the available EPSs and determines which data display in the detail
window. Click or to change which EPS and its corresponding data are
displayed.
Details section:
EPS ID field
An identifier that is unique to the EPS node.
EPS Name field
The name of the EPS.
Responsible Manager field
The name of the manager responsible for the completion of the EPS tasks.
Planned Dates section:
Anticipated Start field
The date the project is expected to start.
Anticipated Finish field
The date the project is expected to finish.
Tips
If you have more than one EPS selected, the detail window will not be visible.
Getting Here
1) Click Projects.

Context-Sensitive Help Topics
755
2) On the Projects navigation bar, click EPS.
3) On the EPS page, select an EPS node and click the General detail window.
EPS Notebooks Detail Window of the EPS Page
Overview
Use this detail window to configure notebook topics and descriptions for the selected EPS
node.
Screen Elements
Notebooks toolbar
See Notebooks Toolbar (on page 1295).
Tips
If you have more than one EPS selected, the detail window will not be visible.
Getting Here
1) Click Projects.
2) On the Projects navigation bar, click EPS.
3) On the EPS page, select an EPS node and click the Notebooks detail window.
EPS Page
Overview
Use this page to manage the Enterprise Project Structure (EPS) and its projects. The EPS
page displays schedules for any single project or group of projects you choose with
detail windows, a Gantt chart, and a table. Use the EPS page to quickly update project
details and run important operations including summarizing, creating templates, and
importing or exporting project data.
Initially, this page displays a table with a Gantt chart, but you can customize this
presentation of project data, creating and saving multiple EPS views, or data layouts, to
meet your needs. The convenient EPS View list enables you to quickly switch between
views, and you can manage multiple detail windows in tabs that you can reposition.
Note: If you do not have EPS/OBS access to an EPS element, but
you do have access to a project in an EPS, you will still be able to
view the project on this page.

756
Screen Elements
EPS toolbar
The EPS toolbar is made up of three separate toolbars with matching menus: Actions
(see "Actions Menu on EPS Page" on page 1180), Edit (see "Edit Menu on EPS Page" on
page 1254), and View (see "View Menu on EPS Page" on page 1368). The EPS View
toolbar, also located on the EPS page, is a fixed toolbar used to move between EPS
views like the table and the Gantt chart. See EPS Toolbar (on page 1286).
EPS work area
The main work area for viewing project data in your choice of the following
customizable formats:
Gantt chart (see "Gantt Chart Format of the EPS Page" on page 778)
Table (see "Table Format of the EPS Page" on page 1115)
EPS Table columns
The default fields that appear as columns in the EPS table are described below. For
descriptions of all possible fields, see Available Columns of the EPS Page (on page
1223).
Project ID field
The unique identifier of the project.
Project Name field
The name of each project. Can be arranged in an ascending or descending order.
Risk Level field
The risk level for each project. Double-click to display the list and choose from Very
High, High, Medium, Low, or Very Low.
Strategic Priority field
The project’s priority in the strategic plan.
This number ranges from 1 to 10,000 with a default of 500. Use of the priority value,
such as whether to place higher priority at the lower end of the scale, toward the
endpoint 1, or at the higher end, toward 10,000, is at the discretion of the user.
Total Activities field
The number of activities in the project.
EPS Node-level detail windows:
EPS Budget Log Detail Window of the EPS Page (on page 752)
EPS Funding Detail Window of the EPS Page (on page 753)
EPS General Detail Window of the EPS Page (on page 754)
EPS Notebooks Detail Window of the EPS Page (on page 755)

Context-Sensitive Help Topics
757
Project-level detail windows:
Budget Log Detail Window of the EPS Page (on page 603)
Codes Detail Window of the EPS Page (on page 620)
Description Detail Window of the EPS Page (on page 710)
Funding Detail Window of the EPS Page (on page 775)
General Detail Window of the EPS Page (on page 789)
Issues Detail Window of the EPS Page (on page 853)
Notebooks Detail Window of the EPS Page (on page 905)
Risks Detail Window of the EPS Page (see "Risks Detail Window" on page 1047)
Getting Here
1) Click Projects.
2) On the Projects navigation bar, click EPS.
EPS Tab of the Activity Codes Page
Overview
Use this tab to configure all existing enterprise project structure (EPS)-level activity codes
and values for your organization.
Screen Elements
Toolbar
See Activity Codes Toolbar (see "Enterprise Data Activity Codes Toolbar" on page
1255).
Name field
This field displays the name of an activity code or value. Activity codes enable you to
categorize activities into logical groups based on your organization's criteria. You can
define unlimited hierarchical activity codes to fulfill the filtering, sorting, and reporting
requirements for your activities, and arrange them hierarchically for easier
management and assignment. EPS activity codes organize activities within a specific
branch or node of the enterprise project structure (EPS).
Description field
This field shows the description you entered for the activity code or value.
Maximum Length field
Indicates the maximum length for an activity code or value. The value cannot
exceed the maximum character length specified for the activity code.

758
Color field
The color for the activity code value.
Secure option
Secure codes enable privileged users to hide Project, Activity, Issue and Resource
codes from users that do not have security privileges to view them. Secure codes are
structured hierarchically. In other words, if a user is granted add/delete privileges, that
user automatically has edit, assign, and view privileges. If a user is granted edit
privileges, that user is automatically granted assign and view privileges. If a user is
granted assign privileges, that user is automatically assigned view privileges.
Tips
You can specify the maximum number of EPS-level activity codes that can be
defined for an EPS and maximum Activity Code tree levels on the Data Limits tab of
Admin Preferences in P6.
Getting Here
1) Click the Projects menu and select Enterprise Project Data, or click the
Administer menu and select Enterprise Data.
2) In the Enterprise Data pane, expand Activities and click Activity Codes.
3) On the Activity Codes page, click the EPS tab.
Exceptions Section of the Leveling Report Log
Overview
Use this section to view the number of critical activities, activities with unsatisfied
constraints, activities with unsatisfied relationships, and activities with external dates.
Screen Elements
Critical Activities field
The number of critical activities in the selected project.
Activities with unsatisfied constraints field
The number of activities with constraints that have not been addressed.
Activities with unsatisfied relationships field
The number of activities with relationships that have not been addressed.
Activities with external dates field
The number of activities with external dates.
Getting Here
1) Click Projects.

Context-Sensitive Help Topics
759
2) On the Projects navigation bar, click Activities.
3) On the Activities page, click the Actions menu and select Run Leveler...
(Shift+F9).
4) In the Level Resources dialog box, click the Options tab.
5) On the Options tab, select the Display leveling log upon completion and click Level.
6) In the Leveling Report Log, expand the Exceptions section.
Exceptions Section of the Scheduling Report Dialog Box of the Activities Page
Overview
Use this section to view the number of critical activities, activities with unsatisfied
constraints, activities with unsatisfied relationships, and activities with external dates.
Screen Elements
Critical Activities field
The number of critical activities in the selected project.
Activities with unsatisfied constraints field
The number of activities with constraints that have not been addressed.
Activities with unsatisfied relationships field
The number of activities with relationships that have not been addressed.
Activities with external dates field
The number of activities with external dates.
Getting Here
1) Click Projects.
2) On the Projects navigation bar, click Activities.
3) On the Activities page, click the Actions menu and select Run Scheduler...
(F9).
4) In the Schedule Project dialog box:
a. Configure the options and select the Display scheduling log upon completion
option.
b. Click Schedule.
5) In the Scheduling Reports dialog box, expand the Exceptions section.

760
Expense Categories Page
Overview
Use this page to add and configure expense categories.
Screen Elements
Expense Categories toolbar
See Categories Toolbar (see "Enterprise Data Categories Toolbar" on page 1258).
Category field
The name you assign to each category. Use expense categories to organize and
track various expense types within an organization.
Getting Here
1) Click the Projects menu and select Enterprise Project Data, or click the
Administer menu and select Enterprise Data.
2) In the Enterprise Data pane, expand Activities and click Expense Categories.
Expense Details Page of the Activity Form Page
Overview
Use this page to edit the general, unit, and cost details for the selected expense of the
current activity.
Screen Elements
Expense Item field
The name for the expense that is unique for the activity.
The same name can be used for expenses associated with other activities.
Activity field
The name of the activity.
Expense Category field
The classification code or name for the expense category.
Expense categories are useful for organizing and tracking various expense types
within an organization. Expense categories are created in P6, typically by an
administrator.
Vendor field
The name of the vendor providing the product or service associated with the
expense.

Context-Sensitive Help Topics
761
Accrual Type field
The accrual type for the project expense.
Start of Activity: Indicates the entire expense costs are accrued at the start date of
the activity.
End of Activity: Indicates entire expense costs are accrued at the finish date of the
activity.
Uniform Over Activity: Indicates the expense costs are accrued uniformly over the
duration of the activity.
Document Number field
The document number for the expense.
Use this for the purchase order number, invoice number, requisition number, or similar,
as needed.
Cost Account field
The default cost account associated with the resource, role, or expense.
Auto Compute Actuals option
Determines whether to calculate the expense actual and remaining units based on
the budgeted or planned cost and the activity's percent complete.
Planned Units field
The sum of planned labor units and planned nonlabor units.
Actual Units field
The number of work units the resource has spent working on the selected activity. It is
the sum of the actual labor units and the actual nonlabor units.
Calculated as Actual Labor Units plus Actual Nonlabor Units.
Remaining Units field
The remaining units of work to be performed by this resource on this activity.
Calculated as Budgeted or Planned Units minus Actual Units.
Unit Of Measure field
The unit of measure for the project expense.
Planned Cost field
The planned total cost for the activity, including labor resources, nonlabor resources,
and project expenses.
Calculated as Planned Labor Cost plus Planned Nonlabor Cost plus Planned Expense
Cost.

762
Actual Cost field
The actual total cost for the activity, including labor resources, nonlabor resources,
and project expenses.
Calculated as Actual Labor Costs plus Actual Nonlabor Costs plus Actual Expense
Costs.
Remaining Cost field
The remaining total cost for the activity, including labor resources, nonlabor
resources, and project expenses.
Calculated as Remaining Labor Costs plus Remaining Nonlabor Costs plus Remaining
Expense Costs.
Price/Unit field
The planned price per unit for the project expense.
This number is multiplied by the planned number of units to compute the planned
cost.
Getting Here
From the Workgroup Workspace page:
1) Click Projects.
2) On the Projects navigation bar, click Workspace.
3) On the Workspace page, expand any portlet containing activities.
4) In the portlet, click an activity.
5) On the Activity Form page, expand the Expenses section and click an expense item.
From the Dashboards page:
1) Click Dashboards.
2) On the Dashboards page, select a dashboard tab.
3) On the dashboard tab, expand any portlet containing activities.
4) In the portlet, click an activity.
5) On the Activity Form page, expand the Expenses section and click an expense item.
Expense UDFs Page
Overview
Use this page to add and configure user defined fields for expenses.
Screen Elements
Expense User Defined Field toolbar
See User Defined Fields Toolbar (on page 1361).

Context-Sensitive Help Topics
763
User Defined Field field
The name of the user-defined field.
Data Type field
The name of the type of data that corresponds to each user-defined field. The data
type you select determines the type of data you can specify in a field. The following
data types are available:
Text: Allows you to use text or a combination of text and numbers.
Start Date: Allows you to enter Start Date information only.
Finish Date: Allows you to enter Finish Date information only.
Cost: Allows you to enter currency values.
Number: Allows you to use numerals with two decimal places.
Integer: Allows you to use numeric data, but not a number related to money.
Indicator: Allows you to use an indicator field that you can use to enter
color-coded icon values in columns and display color-coded text in reports.
Getting Here
1) Click the Projects menu and select Enterprise Project Data, or click the
Administer menu and select Enterprise Data.
2) In the Enterprise Data pane, expand Activities and click Expense UDFs.
Expenses Detail Window of the Activities Page
Overview
Use this detail window to add, revise, or delete activity expenses.
Screen Elements
Expenses toolbar
See Expenses Toolbar of the Activities Page (on page 1287).
Expense Item field
The name for the expense that is unique for the activity.
The same name can be used for expenses associated with other activities.
Expense Category field
The classification code or name for the expense category.
Expense categories are useful for organizing and tracking various expense types
within an organization. Expense categories are created in P6, typically by an
administrator.

764
Planned Cost field
The planned cost for the project expense.
Calculated as Planned Units multiplied by Price Per Unit.
Actual Cost field
The actual cost for the project expense.
Remaining Cost field
The remaining cost for the project expense. Before actual expenses are made,
remaining cost should be the same as planned cost.
While the activity is in progress, the remaining cost should be updated to reflect the
estimated remaining cost required for the expense. After the expense is completed,
the remaining cost should be zero.
Planned Units field
The planned units for all labor resources assigned to the activity.
Actual Units field
The actual units used to complete the assignment.
Calculated as Budgeted Units multiplied by Duration percent complete.
Remaining Units field
The remaining Units for completing the assignment.
Calculated as Remaining Duration multiplied by Remaining Units per Time.
At Completion Units field
The sum of the actual units and remaining units for the resource assignment on the
activity.
Calculated as Actual Units plus Remaining Units.
Vendor field
The name of the vendor providing the product or service associated with the
expense.
Accrual Type field
The accrual type for the project expense.
Start of Activity: Indicates the entire expense costs are accrued at the start date of
the activity.
End of Activity: Indicates entire expense costs are accrued at the finish date of the
activity.
Uniform Over Activity: Indicates the expense costs are accrued uniformly over the
duration of the activity.

Context-Sensitive Help Topics
765
Document Number field
The document number for the expense.
Use this for the purchase order number, invoice number, requisition number, or similar,
as needed.
Auto Compute Actuals option
Determines whether to calculate the expense actual and remaining units based on
the budgeted or planned cost and the activity's percent complete.
Unit Of Measure field
The unit of measure for the project expense.
Price/Unit field
The price per unit for the expense.
Cost Account field
The default cost account associated with the resource, role, or expense.
User Defined fields
The fields specific to your company's use of the application.
Information that needs to be captured for all expenses can be stored in a
user-defined field. User-defined fields are created by the system administrator.
Tips
Use the Auto Compute Actuals option when you want to assume that all work for the
activity is proceeding on schedule.
If you have more than one activity selected, the detail window will not be visible.
Getting Here
1) Click Projects.
2) On the Projects navigation bar, click Activities.
3) On the Activities page, select an activity and click the Expenses detail window.
Expenses Section of the Activity Form Page
Overview
Use this section to add, revise, and/or delete activity expenses.
Screen Elements
Add Activity Expenses link
Enables you to add expenses to the activity. See Add Activity Expenses Page of the
Activity Form Page (on page 564).

766
Expense Item field
The name for the expense that is unique for the activity.
The same name can be used for expenses associated with other activities.
Expense Category field
The classification code or name for the expense category.
Expense categories are useful for organizing and tracking various expense types
within an organization. Expense categories are created in P6, typically by an
administrator.
Planned Cost field
The planned total cost for the activity, including labor resources, nonlabor resources,
and project expenses.
Calculated as Planned Labor Cost plus Planned Nonlabor Cost plus Planned Expense
Cost.
Actual Cost field
The actual total cost for the activity, including labor resources, nonlabor resources,
and project expenses.
Calculated as Actual Labor Costs plus Actual Nonlabor Costs plus Actual Expense
Costs.
Remaining Cost field
The remaining total cost for the activity, including labor resources, nonlabor
resources, and project expenses.
Calculated as Remaining Labor Costs plus Remaining Nonlabor Costs plus Remaining
Expense Costs.
Getting Here
From the Workgroup Workspace page:
1) Click Projects.
2) On the Projects navigation bar, click Workspace.
3) On the Workspace page, expand any portlet containing activities.
4) In the portlet, click an activity.
5) On the Activity Form page, expand the Expenses section.
From the Dashboards page:
1) Click Dashboards.
2) On the Dashboards page, select a dashboard tab.
3) On the dashboard tab, expand any portlet containing activities.
4) In the portlet, click an activity.
5) On the Activity Form page, expand the Expenses section.

Context-Sensitive Help Topics
767
Export Tab of the Import/Export Project Dialog Box
Overview
Use this tab to configure export type, project template, and project.
Screen Elements
Export Type list
Select Primavera XML or Microsoft Project XML from the menu to act as the export
type.
Microsoft Project Template list
The template to use for importing or exporting a project. To enable this list, you must
select Microsoft Project XML from the Import Type or Export Type list.
Export Project field
The project selected to export.
Export button
Exports the project with your selected options.
Getting Here
1) Click Projects.
2) On the Projects navigation bar, click EPS.
3) On the EPS page, click the Actions menu and select Import/Export XML Project
Import/Export.
4) In the Import/Export Project dialog box, click the Export tab.
Feedback Detail Window of the Activities Page
Overview
Use this detail window to collaborate with members of your team by writing and
exchanging notes. The Feedback detail window tracks the note history.
Note: When writing your correspondence, please be aware of rules
of etiquette, as all team members with appropriate privileges can
view your note. Once posted, activity feedback notes cannot be
removed. You can set the format of time stamps for notes in My
Preferences.

768
Screen Elements
Activity selector
Cycles through the available activities and determines which data display in the
detail window. Click or to change which activity and its corresponding data
are displayed.
Feedback from Resource field
The notes received from the resource.
Notes To Resources field
The notes directed to the resource.
Add button
Submits your feedback for display in the Notes From Resource and Notes To Resource
sections.
Tips
If you have more than one activity selected, the detail window will not be visible.
Getting Here
1) Click Projects.
2) On the Projects navigation bar, click Activities.
3) On the Activities page, select an activity and click the Feedback detail window.
Filter Tab of the Customize Project Issues Dialog Box
Overview
Use this tab to define filters for project issues.
Screen Elements
Select the fields to filter by area
Determines whether all issues are displayed or only the ones that make it through the
filter you specify.
All Issues option
Determines whether to include all issues. If you select the Custom Filter option instead,
you can then create filters to narrow the available issues.
Custom Filter option
Select to enable fields you can then use to create filter statements.

Context-Sensitive Help Topics
769
Filter Description field
The brief summary of the filter.
Select Filter Criteria field
Determines how much of the filter criteria is used: All of the Following or Any of the
Following.
Parameter list
Determines what parameter will act as a variable in the filter statement.
Is list
Select an option to set a relationship between the Parameter and Value fields.
Value field
Enter a value that either equals or is not equal to the parameter, chosen with the
correct parameter and is fields.
Tips
If you select to create a custom filter, type a description for the filter in the Description
field. The description appears at the top of the issues list. It is a required field, and you
can type up to a maximum of 100 characters. In the Select Filter Criteria list, select to
display issues that meet all or any of the filtering criteria you specify. If you select Any
of the following, any issue that meets at least one of the specified filtering conditions
displays in the issues list.
To create a filter criteria statement, in the Parameter list, select a field. Next, select an
operator from the Is list. In the Value field, type or select a value to complete the
filtering criteria statement.
You can create up to three criteria statements for a custom filter.
Getting Here
From the Issues page:
1) Click Projects.
2) On the Projects navigation bar, click Issues.
3) On the Issues page, click the Customize link.
4) In the Customize Project Issues dialog box, click the Filter tab.
From the Workspace page:
1) Click Projects.
2) On the Projects navigation bar, click Workspace.
3) On the Workspace page, expand the Project Issues portlet and click Customize.
4) In the Customize Project Issues dialog box, click the Filter tab.
From the Dashboards page:

770
1) Click Dashboards.
2) On the Dashboards page, select a dashboard tab.
3) On the dashboard tab, expand the My Issues portlet and click Customize.
4) In the Customize My Issues dialog box, click the Filter tab.
Filter Tab of the Customize Risks Dialog Box
Overview
Use this tab to configure what risks will display in the risks portlet.
Screen Elements
Display Risks list
Determines how to display risks.
Show Risks where I have access rights option
Determines whether to display Risks where you have access rights.
Show Risks where I am the Project Owner option
Determines whether to display Risks where you are the Project Owner.
Show Risks where I am the Risk Owner option
Determines whether to display Risks where you are the Risk Owner.
Show Risks where I am assigned as a resource option
Determines whether to display Risks where you are an assigned as a resource.
Getting Here
From the Dashboards page:
1) Click Dashboards.
2) On the Dashboards page, select a dashboard.
3) On the dashboard, expand the My Risks portlet and click Customize.
4) In the Customize Risks dialog box, click the Filter tab.
From the Workspace page:
1) Click Projects.
2) On the Projects navigation bar, click Workspace.
3) On the Workspace page, expand the Project Risks portlet and click Customize.
4) In the Customize Risks dialog box, click the Filter tab.

Context-Sensitive Help Topics
771
Filters Tab of the Customize Activity View Dialog Box
Overview
Use this tab to configure and apply one or more filters to the current activity view to
constrain or reduce the quantity of activities shown on the Activities page.
Screen Elements
Filters Tab toolbar
See Filters Tab Toolbar (on page 1289).
Name field
The names of existing, predefined filters that are grouped by type:
Standard Filters: Predefined filters that are already in the application.
Global Filters: Filters that are available to all users.
Multiple User Filters: User-defined filters available to more than one person.
User-Defined Filters: Filters that you created.
Apply to View option
Determines which filters, if any, will be applied to the current view.
Getting Here
1) Click Projects.
2) On the Projects navigation bar, click Activities.
3) On the Activities page:
a. Select a view from the Activity View list.
b. Click the View menu and select Customize View....
4) In the Customize Activity View dialog box, click the Filters tab.
Filters Tab of the Customize Project View Dialog Box
Overview
Use this tab to configure and apply one or more filters to the current project view to
constrain or reduce the quantity of project shown on the EPS page.
Screen Elements
Filters Tab toolbar
See Filters Tab Toolbar (on page 1289).
Name field
The names of existing, predefined filters that are grouped by type:

772
Standard Filters: Predefined filters that are already in the application.
Global Filters: Filters that are available to all users.
Multiple User Filters: User-defined filters available to more than one person.
User-Defined Filters: Filters that you created.
Apply to View option
Determines which filters, if any, will be applied to the current view.
Clear button
Clears all fields.
Getting Here
1) Click Projects.
2) On the Projects navigation bar, click EPS.
3) On the EPS page:
a. Select a view from the EPS View list.
b. Click the View menu and select Customize View....
4) In the Customize Project View dialog box, click the Filters tab.
Filters Tab of the Customize Resource Assignments View Dialog Box of the Assignments Page
Overview
Use this tab to configure and apply one or more filters to the current view to constrain or
reduce the quantity of resources displayed on the Assignments page.
Screen Elements
Filters Toolbar
See Filters Dialog Box Toolbar (on page 1288).
Name field
The names of existing, predefined filters that are grouped by type:
Standard Filters: Predefined filters that are already in the application.
Global Filters: Filters that are available to all users.
Multiple User Filters: User-defined filters available to more than one person.
User-Defined Filters: Filters that you created.
Apply to View option
Determines which filters, if any, will be applied to the current view.

Context-Sensitive Help Topics
773
Clear button
Clears all fields.
Getting Here
1) Click Resources.
2) On the Resources navigation bar, click Assignments.
3) On the Assignments page, click View and select Customize View.
4) In the Customize Resource Assignments View dialog box, click the Filters tab.
Financial Periods Page
Overview
Use this page to add and configure customized financial periods to provide more
accurate reporting of actual units and costs. Users can use the Store Period Performance
dialog box on the Activities page to store period performance in a specified financial
period.
Screen Elements
Financial Periods toolbar
See Financial Periods Toolbar (see "Enterprise Data Financial Periods Toolbar" on page
1264).
Financial Period (batch) dialog box
See Generate Financial Periods Dialog Box of the Financial Periods Page (on page
811).
Name field
The name chosen for the Financial Period. This field can be modified by
double-clicking a selected name.
Start Date field
The date that the Financial Period began.
Finish Date field
The date that the Financial Period ended.
Tips
Right-click in any field to display the options to Add, Delete, Find, and Find Next.
Getting Here
1) Click the Administer menu and select Enterprise Data.
2) In the Enterprise Data pane, expand Global and click Financial Periods.

774
Formula Detail Window of the Project UDFs Page
Overview
Use this detail window to define formulas for the selected project user defined field.
Screen Elements
Fields list
Choose from one of the following fields:
Budget
Cost
Dates
Durations
Earned Value
General
Number of Activities
Percent Complete
Project Codes
Units
User Defined
Insert Field button
Inserts the selected field into the formula.
Formula buttons
Use this section to define a formula or if/then/else statement to calculate field values.
You can define a formula or if/then/else statement only if the field has a Formula
calculation type. Click Advanced to display the logical operation buttons and
click Basic to hide them.
Arithmetic operation buttons:
+
-
*
/
(
)
Logical operation buttons:
<
>
=

Context-Sensitive Help Topics
775
< >
AND
OR
IF/THEN/ELSE
Formula Editor
Displays the formula you have created with the fields list and formula buttons.
Getting Here
1) Click the Projects menu and select Enterprise Project Data, or click the
Administer menu and select Enterprise Data.
2) In the Enterprise Data pane, expand Projects and click Project UDFs.
3) On the Project UDFs page, select a user-defined field and click the Formula detail
window.
Funding Detail Window of the EPS Page
Overview
Use this detail window to assign, configure, or remove funding sources from a project.
Screen Elements
Funding toolbar
See Funding Toolbar (on page 1290).
Amount field
The amount of the budgeted line item.
Fund Share field
The percentage of the total fund that is allocated to the current project or EPS.
Funding Source field
The name of a funding source assigned to the current project or EPS.
Tips
If you have more than one project selected, the detail window will not be visible.
Getting Here
1) Click Projects.
2) On the Projects navigation bar, click EPS.

776
3) On the EPS page, select a project and click the Funding detail window.
Funding Sources Page
Overview
Use this page to configure project funding sources and their hierarchy.
Screen Elements
Funding Sources toolbar
See Enterprise Data Funding Sources Toolbar (on page 1265).
Funding Source field
Funding sources are the agencies, businesses, or groups that provide funding for a
project. You can keep funding sources in a dictionary that categorizes and groups
similar funds in a hierarchy. The dictionary allows you to quickly assign specific funding
sources to budgets as a project develops. You can assign the same funding source
multiple times with varying amount and share contributions for different levels of the
EPS. The amount contributed by a specific funding source is called the fund share
value.
Description field
This field displays a description that corresponds to the Funding Source name.
Description detail window
See Description Detail Window of the Funding Sources Page (on page 710).
Getting Here
1) Click the Projects menu and select Enterprise Project Data, or click the
Administer menu and select Enterprise Data.
2) In the Enterprise Data pane, expand Projects and click Funding Sources.
Gantt Chart Format of the Activities Page
Overview
Use the Gantt chart format to view the dates, progress, and relationships of activities in a
project.
Screen Elements
Relationship Lines
The depiction of a relationship between different activities. Whether the relationship
line is touching the beginning or end of each Gantt bar determines the type of
relationship.

Context-Sensitive Help Topics
777
Timescale list
The Gantt chart time interval options. Select from one of the following intervals:
Year/Quarter
Year/Month
Quarter/Month
Month/Week
Week/Day
Financial Period
The Financial Period option is available if financial periods exist in Enterprise Data and
are configured properly.
Hovering over an activity bar will display:
Bar Type field
The type of bar. For more information, see About Bars.
ID field
The activity identifier that is unique within the project.
Name field
The name of the activity.
Start Date field
For started activities, the actual start date. For not started activities, set to the planned
start date until the project is scheduled. When scheduled, set to the remaining early
start date.
Finish Date field
For completed activities, the actual finish date. For not started and in-progress
activities, set to the planned finish date if the project has not been scheduled. When
scheduled, set to the remaining early finish date.
Getting Here
1) Click Projects.
2) On the Projects navigation bar, click Activities.
3) On the Activities page, click the View menu and select Gantt Chart.
Related Topics
Working with the Activity Gantt Chart ................................................................. 216

778
Gantt Chart Format of the EPS Page
Overview
Use the Gantt chart format to view project duration, dates, and progress in an EPS node.
Screen Elements
Timescale list
The Gantt chart time interval options. Select from one of the following intervals:
Year/Quarter
Year/Month
Quarter/Month
Month/Week
Week/Day
Financial Period
The Financial Period option is available if financial periods exist in Enterprise Data and
are configured properly.
Hovering over a project bar will display:
Bar Type field
The type of bar. For more information, see About Bars.
ID field
The project identifier that is unique within the EPS node.
Name field
The name of the project, portfolio, project code, or WBS.
Start Date field
The current start date of the project. For a not started project, the date field is the
project's planned start date. For an project that has started or is complete, this date
field is the project's actual start date.
Finish Date field
The current finish date of the project. For a not-started project, this is the planned finish
date. For an in-progress project, this is the remaining finish date. Once the project is
completed, this is the actual finish date.
Getting Here
1) Click Projects.
2) On the Projects navigation bar, click EPS.

Context-Sensitive Help Topics
779
3) On the EPS page, click the View menu and select Gantt Chart.
Gantt Chart Tab of the Customize Activity View Dialog Box
Overview
Use this tab to modify how the Gantt chart appears.
Screen Elements
Progress Line section:
Show Progress Line option
Determines whether to show a progress line on the Gantt chart.
Note: A progress line provides a visual representation of the variance between
selected criteria such as the start or finish dates of an activity and its baseline, or the
progress of an activity based on its remaining duration or percent of completion.
Style list
Determines whether the progress line is solid, dashed, or of another style.
Color field
The colors available to display the progress line.
Size list
The thickness of the progress line, between 1 and 10 points.
Draw Progress Line section:
Based on the difference between the current and baseline activity's option
Determines whether the progress line is based on the activity's Start Dates or Finish
Dates.
By connecting progress points based on activity's option
Determines whether to base the connecting progress points on Select Remaining
Duration or Percent Complete.
Baseline to use for calculating Progress Line list
Determines whether the Project Baseline or User's Primary Baseline is used for
calculating the Progress Line.
Timescale section:
Timescale list
The Gantt chart time interval options. Select from one of the following intervals:
Year/Quarter

780
Year/Month
Quarter/Month
Month/Week
Week/Day
Financial Period
The Financial Period option is available if financial periods exist in Enterprise Data and
are configured properly.
Show shading for non-worktime option
Determines whether to apply a shade of gray to calendar non-worktime in the Gantt
chart.
Select a shade of gray from the Color menu.
Getting Here
1) Click Projects.
2) On the Projects navigation bar, click Activities.
3) On the Activities page:
a. Select a view from the Activity View list.
b. Click the View menu and select Customize View....
4) In the Customize Activity View dialog box, click the Gantt Chart tab.
Gantt Chart Tab of the Customize Gantt Chart Options Dialog Box of the Activities Page
Overview
Use this tab to configure progress lines and timescale for the Gantt chart on the Activities
page.
Screen Elements
Progress Line section:
Style list
Determines whether the progress line is solid, dashed, or of another style.
Color field
The colors available to display the progress line.
Size list
The thickness of the progress line, between 1 and 10 points.

Context-Sensitive Help Topics
781
Draw Progress Line section:
Based on the difference between the current and baseline activity's option
Determines whether the progress line is based on the activity's Start Dates or Finish
Dates.
By connecting progress points based on activity's option
Determines whether to base the connecting progress points on Select Remaining
Duration or Percent Complete.
Baseline to use for calculating Progress Line list
Determines whether the Project Baseline or User's Primary Baseline is used for
calculating the Progress Line.
Timescale section:
Timescale list
The Gantt chart time interval options. Select from one of the following intervals:
Year/Quarter
Year/Month
Quarter/Month
Month/Week
Week/Day
Financial Period
The Financial Period option is available if financial periods exist in Enterprise Data and
are configured properly.
Show shading for non-work time option
Determines whether to apply a shade of gray to calendar non-work time in the Gantt
chart. Select the shade of gray from the Color list.
Color list
The shades of gray available to represent the shading for non-work.
This list is disabled if the Show shading for non-work time option is cleared.
Getting Here
1) Click Projects.
2) On the Projects navigation bar, click Activities.
3) On the Activities page:
a. Select a view from the Activity View list.
b. Click the View menu and select Gantt Chart Options.
4) In the Customize Gantt Chart Options dialog box, click the Gantt Chart tab.

782
Gantt Chart Tab of the Customize Gantt Chart Options Dialog Box of the Assignments Page
Overview
Use the Gantt Chart tab of the Customize Gantt Chart Options dialog box to modify the
date format for the timescale.
Screen Elements
Timescale list
The Gantt chart time interval options. Select from one of the following intervals:
Year/Quarter
Year/Month
Quarter/Month
Month/Week
Week/Day
Financial Period
The Financial Period option is available if financial periods exist in Enterprise Data and
are configured properly.
Show shading for non-work time option
Determines whether to apply a shade of gray to calendar non-work time in the Gantt
chart. Select the shade of gray from the Color list.
Color list
The shades of gray available to represent the shading for non-work.
This list is disabled if the Show shading for non-work time option is cleared.
Getting Here
1) Click Resources.
2) On the Resources navigation bar, click Assignments.
3) On the Assignments page, click the View menu and select Gantt Chart
Options.
4) In the Customize Gantt Chart Options Dialog Box, click the Gantt Chart tab.
Gantt Chart Tab of the Customize Gantt Chart Options Dialog Box of the EPS Page
Overview
Use this tab to configure the timescale for the Gantt chart.

Context-Sensitive Help Topics
783
Screen Elements
Timescale list
The Gantt chart time interval options. Select from one of the following intervals:
Year/Quarter
Year/Month
Quarter/Month
Month/Week
Week/Day
Financial Period
The Financial Period option is available if financial periods exist in Enterprise Data and
are configured properly.
Show shading for non-work time option
Determines whether to apply a shade of gray to calendar non-work time in the Gantt
chart. Select the shade of gray from the Color list.
Color list
The shades of gray available to represent the shading for non-work.
This list is disabled if the Show shading for non-work time option is cleared.
Getting Here
1) Click Projects.
2) On the Projects navigation bar, click EPS.
3) On the EPS page:
a. Select a view from the EPS View list.
b. Click the View menu and select Gantt Chart Options.
4) In the Customize Gantt Chart Options dialog box, click the Gantt Chart tab.
Gantt Chart Tab of the Customize Project View Dialog Box
Overview
Use this tab to modify how the Gantt chart appears.
Screen Elements
Timescale section:
Timescale list
The Gantt chart time interval options. Select from one of the following intervals:
Year/Quarter

784
Year/Month
Quarter/Month
Month/Week
Week/Day
Financial Period
The Financial Period option is available if financial periods exist in Enterprise Data and
are configured properly.
Show shading for non-worktime option
Determines whether to apply a shade of gray to calendar non-worktime in the Gantt
chart.
Select a shade of gray from the Color menu.
Color list
The shades of gray available to represent the shading for non-work.
This list is disabled if the Show shading for non-work time option is cleared.
Getting Here
1) Click Projects.
2) On the Projects navigation bar, click EPS.
3) On the EPS page:
a. Select a view from the EPS View list.
b. Click the View menu and select Customize View....
4) In the Customize Project View dialog box, click the Gantt Chart tab.
Gantt Chart Tab of the Customize Resource Assignments View Dialog Box of the Assignments
Page
Overview
Use the Gantt Chart tab of the Customize Resource Assignments View dialog box to
modify the date format for the timescale.
Screen Elements
Timescale list
The Gantt chart time interval options. Select from one of the following intervals:
Year/Quarter
Year/Month
Quarter/Month
Month/Week

Context-Sensitive Help Topics
785
Week/Day
Financial Period
The Financial Period option is available if financial periods exist in Enterprise Data and
are configured properly.
Show shading for non-work time option
Determines whether to apply a shade of gray to calendar non-work time in the Gantt
chart. Select the shade of gray from the Color list.
Color list
The shades of gray available to represent the shading for non-work.
This list is disabled if the Show shading for non-work time option is cleared.
Getting Here
1) Click Resources.
2) On the Resources navigation bar, click Assignments.
3) On the Assignments page, click the View and select Customize View.
4) In the Customize Resource Assignments View dialog box, click the Gantt Chart tab.
General Detail Window of the Activities Page
Overview
Use this detail window to configure activity durations, general information, constraints,
and units and costs.
Screen Elements
Activity selector
Cycles through the available activities and determines which data display in the
detail window. Click or to change which activity and its corresponding data
are displayed.
Details section:
Activity ID field
The unique identifier of the activity.
System generated.
Activity Name field
The name of the activity. The activity name does not have to be unique.
Activity Type list
Determines how duration and schedule dates are calculated for an activity:

786
Task Dependent: If resources should be scheduled based on the activity's
calendar.
Resource Dependent: If resources should be scheduled based on their assigned
calendars.
Level of Effort: For an ongoing activity whose duration depends on other activities.
The duration of a Level of Effort activity is calculated based on the schedule dates
from its predecessors and successors.
Start or Finish Milestone: If an activity marks the beginning or end of a major
project phase.
WBS Summary: For an activity with a particular WBS code.
Durations section:
Planned Duration field
The total working time from the activity planned start date to the planned finish date.
The planned working time is calculated using the activity's calendar.
Actual Duration field
The total working time from the activity actual start date to the actual finish date for
completed activities, or the current data date for in-progress activities.
The actual working time is computed using the activity's calendar.
Remaining Duration field
The total working time from the activity remaining start date to the remaining finish
date.
The remaining working time is calculated using the activity's calendar. Before the
activity is started, the remaining duration is the same as the planned duration. After
the activity is completed the remaining duration is zero.
At Completion Duration field
The total working time from the activity's current start date to the current finish date.
The current start date is the planned start date until the activity is started, then it is the
actual start date. The current finish date is the activity planned finish date while the
activity is not started, the remaining finish date while the activity is in progress, and the
actual finish date once the activity is completed. The total working time is calculated
using the activity's calendar.
Duration Type list
Determines whether the schedule, resource availability, or costs are most important
when updating activities. The duration type applies only when you have resources
assigned to the activity. Choose a duration type based on which factor is most
important (least flexible) in planning your project.

Context-Sensitive Help Topics
787
Units and Costs section:
Units and Cost list
Determines which types of units and costs the application will track: Labor Units, Labor
Costs, Non-Labor Units, Non-Labor Costs, or Material Costs.
The fields that display in this section depend upon what type of unit or cost you
choose.
Planned <unit or cost> field
The Planned unit or cost. This field name varies on your choice from the Units and
Costs list.
Actual <unit or cost> field
The Actual unit or cost. This field name varies based on your selection from the Units
and Costs list.
Remaining <unit or cost> field
The remaining unit or cost. This field name varies on your choice from the Units and
Costs list.
At Completion <unit or cost> field
The At Completion unit or cost. This field name varies on your choice from the Units
and Costs list.
Status section:
Started option
Determines whether the activity has started. Click to select the date from a
calendar.
Finished option
Determines whether the activity has been completed. Click to select the date
from a calendar.
Activity % Complete field
The percent of the activity that has been completed.
Calculated as (Original or Planned Duration minus Remaining Duration) divided by
Original or Planned Duration.
If the activity's percent complete type is set to Physical, the application will not
calculate a value for the Activity % Complete field.
Units % Complete equals (Actual Labor Units plus Actual Non-labor Units) divided by
(Actual Labor Units plus Actual Non-labor Units plus Remaining Labor Units plus
Remaining Non-labor Units).

788
Percent Complete Type list
Determines whether activity percent complete is calculated based on:
Physical: Select to specify that the activity's percent complete will be entered by
the user for this activity.
Duration: Select to specify that the activity's percent complete be calculated
from the actuals and remaining duration.
Units: Select to specify that the activity's percent complete be calculated from
the actuals and remaining units.
Constraints section:
Primary Constraint list
Determines the primary constraint on the activity. Choose from one of the following
options:
Start On: Imposes the specific start date you choose. The Start On constraint can
delay an activity's early start or move forward an activity's late start to satisfy the
constraint date.
Start On or Before: Defines the latest date an activity can start. This constraint only
affects late dates and might decrease total float. When calculating a schedule,
P6 imposes the start on or before constraint in the backward pass only if the
calculated late start date will be later than the imposed date
Start On or After: Defines the earliest date an activity can begin. This constraint
affects only early dates. When calculating a schedule, P6 imposes the start on or
after constraint in the forward pass only if the calculated early start date will be
earlier than the imposed date.
Finish On: Imposes the specific finish date you choose. The Finish On constraint can
delay an activity's early finish or move forward an activity's late finish to satisfy the
constraint date
Finish On or Before: Defines the latest time an activity can finish. The finish on or
before constraint affects only late dates.
Finish On or After: Defines the earliest date an activity can finish. The finish on or
after constraint reduces float to coordinate parallel activities, ensuring that the
finish of an activity is not scheduled before the specified date. It is usually applied
to activities with few predecessors that must finish before the next phase of a
project.
As Late As Possible: Imposes a restriction on an activity with positive float to allow it
to start as late as possible without delaying its successors. When calculating a
schedule, P6 sets the activity's early dates as late as possible without affecting
successor activities.

Context-Sensitive Help Topics
789
Mandatory Start: Imposes the early and late start dates you choose. P6 uses the
mandatory early start date regardless of its effect on network logic. A mandatory
early start date could affect the late dates for all activities that lead to the
constrained activity and all early dates for the activities that lead from the
constrained activity.
Mandatory Finish: Imposes the early and late finish dates you choose. P6 uses the
mandatory finish date regardless of its effect on network logic. This constraint
affects the late dates for all activities that lead to the constrained activity and all
early dates for the activities that lead from the constrained activity.
Secondary Constraint list
Determines the secondary constraint on the activity. Available only when the Primary
Constraint is not Start On, Finish On, Mandatory Start, or Mandatory Finish. Choose
from one of the following options:
Start On or After: Defines the earliest date an activity can begin. This constraint
affects only early dates. When calculating a schedule, P6 imposes the start on or
after constraint in the forward pass only if the calculated early start date will be
earlier than the imposed date.
Finish On or After: Defines the earliest date an activity can finish. The finish on or
after constraint reduces float to coordinate parallel activities, ensuring that the
finish of an activity is not scheduled before the specified date. It is usually applied
to activities with few predecessors that must finish before the next phase of a
project.
Tips
If you have more than one activity selected, the detail window will not be visible.
Getting Here
1) Click Projects.
2) On the Projects navigation bar, click Activities.
3) On the Activities page, select an activity and click the General detail window.
General Detail Window of the EPS Page
Overview
Use this detail window to add or modify information about the selected project.
Screen Elements
Project selector
Cycles through the available projects and determines which data display in the detail
window. Click or to change which project and its corresponding data are
displayed.
790
Project ID field
The unique identifying code for the project.
Project Name field
The name of the project.
Details section:
Project Status list
The status of the selected project. Use status to identify active or inactive projects.
You can select What-If status for analysis before establishing a more permanent
project schedule, or Planned status for use during the project planning phase. For
Inactive status, a project-level option on the Progress Reporter tab of the Project
Preferences dialog box controls whether P6 Progress Reporter users can view inactive
projects.
Responsible Manager field
The project’s assigned organizational breakdown structure (OBS) element.
A responsible manager is required for each project and each level of the EPS.
Project Owner field
The resource designated as responsible for the project.
The project owner designation provides a user with viewing access for the project.
Total Activities field
The number of activities in the project.
Checked Out By field
The name of the user who checked out the project. If the project is not checked out,
this field is blank.
Date Checked Out field
The date and time the user checked out the project. If the project is not checked out,
this field is blank.
Planned Dates section:
Anticipated Start field
The date the project is expected to start.
Anticipated Finish field
The date the project is expected to finish.
Project Planned Start field
The date the project is planned to begin.

Context-Sensitive Help Topics
791
Must Finish By field
The date constraint placed on the project end date.
Actual Dates section:
Actual Start field
The actual start date of the project, if the project has started.
Actual Finish field
The actual finish date of the project.
Scheduled Finish field
The calculated latest early finish date, which is based on the schedule most recently
generated for the project.
Data Date field
The date used as the starting point to calculate the schedule. Each project has its
own data date.
Tips
If you have more than one project selected, the detail window will not be visible.
Getting Here
1) Click Projects.
2) On the Projects navigation bar, click EPS.
3) On the EPS page, select a project and click the General detail window.
General Detail Window of the Resources Tab of the Administration Page
Overview
Use the General detail window of the Resources tab to modify basic information about a
selected resource.
Screen Elements
Resource selector (Ctrl+Up Arrow) or (Ctrl+Down Arrow)
Cycles through the available resources and determines which data display in the
detail window. Click (Ctrl+Up Arrow) to move to the previous resource, or click
(Ctrl+Down Arrow) to move to the next resource. The content in the detail window is
refreshed with the data for the selected resource.
Resource ID field
The unique identifier for the resource.

792
Name field
The name of the resource.
Active option
Determines whether the resource is currently active. A marked option indicates the
resource is active.
Non-active resources might have left the organization, but are not deleted from the
system since they might have actual hours.
Office Phone field
The office phone number for the resource.
Resource Type field
The resource type. Valid values are:
Labor: Indicates that the selected resource performs labor, measured in units of time.
Nonlabor: Indicates that the resource is a nonlabor resource, such as equipment,
measured in units of time.
Material: Indicates that the resource has a unit of measure other than time. You can
select a unit of measure for the material resource.
Employee ID field
The resource identifier within the organization, typically the employee number or
social security number.
Parent Resource field
A resource categorized at a higher level than the current resource, in a resource
hierarchy.
The parent resource is generally the larger department or organization for which you
work.
For example, a salesperson might be assigned to an element of the resource
hierarchy called Region 1 Sales.
Other Phone field
The alternate phone numbers for the resource.
Unit of Measure field
The unit of measure this material resource uses.
Title field
The job title for the resource, such as Senior Engineer.
E-mail field
The e-mail address for the resource.

Context-Sensitive Help Topics
793
Getting Here
1) Click Resources.
2) On the Resources navigation bar, click Administration.
3) On the Administration page, click the Resources tab.
4) On the Resources tab, click the General detail window.
General Page
Overview
Use this page to specify general default options.
Screen Elements
Starting Day of Week
First day of week for calendars list: Use the arrow to choose a day. The start day of
the week affects how all days in a week are displayed in profiles, spreadsheets,
and other layouts in which a weekly timescale can be displayed. For example, if
Wednesday is selected as the starting day of the week, the week is displayed as
WTFSSMT.
Note: When using View Calendar or going to Calendar views in
Enterprise Data, the First day of week for calendars setting is
ignored.
Activity Duration
Default duration for new activities field: The number of days you enter here is the
default duration for new activities in all projects. Having a default duration
simplifies the process of adding new activities.
Password Policy
Use the Password Policy to authorize a password that is 8-20 characters long and
that contains at least one letter and one number.
Enable password policy option: Determines whether to enable the password
policy.
Code Separator
Specify the character for separating concatenated codes. It is also the default
WBS code separator for new projects. field: The character you enter separates
hierarchy levels in roles, resource codes, project codes, cost accounts, issue
codes, and activity codes; it is also the default separator for WBS codes in all new
projects.

794
Contract Management
Contract Management URL field: The Contract Management URL you enter will
enable access to Contract Management from P6.
Document Management
P6 URL field: The P6 URL you enter in P6 to enable users to view content repository
documents in P6 Professional.
Summarization Periods
Specify the interval to summarize and store project and resource spreads.
By Calendar option: Determines whether to display the summarization periods by
calendar.
WBS Level list: Use the list arrow to choose Week or Month.
Resource/Role Assignment Level list: Use the list arrow to choose Week or Month.
By Financial Periods option: Determines whether to display the summarization
periods by financial periods.
Getting Here
1) Click the Administer menu and select Application Settings.
2) On the Application Settings pane, click General.
General Page of the Project Preferences Dialog Box
Overview
Use this tab to view or configure basic project information.
Screen Elements
Character for separating code fields for the WBS tree field
The character(s), such as a period, used to separate code fields. You may use one or
two characters.
Fiscal year begins on the 1st day of list
The list of months to determine when the fiscal year begins.
Getting Here
1) Click Projects.
2) On the Projects navigation bar, click EPS.
3) On the EPS page, click the Actions menu and select Set Project Preferences....
4) In the Project Preferences pane, click General.

Context-Sensitive Help Topics
795
General Section of the Activity Form Page
Overview
Use this section to view dates and duration and to communicate with the project
manager about the activity. If you are the primary resource for the activity, you can use
the General section to edit the start, finish, and expected finish dates.
Screen Elements
Edit General Information link
Enables you to edit activity information that is presented as read-only in the General
section.
Activity ID field
The unique identifier of the activity.
System generated.
Activity Name field
The name of the activity. The activity name does not have to be unique.
WBS field
The name of the WBS that corresponds to the selected activity.
Calendar field
The name of the calendar selected for the resource.
Primary Resource option
Determines whether the corresponding resource is the activity's primary resource.
Typically, the primary resource is the person responsible for the overall work on the
activity and for updating activity status.
Activity Type field
The type of activity.
Task Dependent: Activities are scheduled using the activity's calendar rather than
the calendars of the assigned resources. Choose task dependent when you want
to control the duration of the activity yourself (that is, no resources are assigned),
or when one or more resources assigned to the same activity can work according
to the same calendar. The activity is scheduled according to the activity’s
calendar, not the resource calendars. For example, you might have an activity to
cure concrete; you know how long the task takes and the addition of resources
won’t complete the task any earlier. You would designate this activity as task
dependent.

796
Resource Dependent: Activities are scheduled using the calendars of the assigned
resources. This type is used when several resources are assigned to the activity, but
they might work separately. Choose resource dependent when you want to
schedule each resource according to his/her own time schedule, or resource
calendar, not the activity calendar. The assigned resource availability determines
the start and finish dates of the activity. Typically, you use this type when multiple
resources assigned to the same activity can work independently, or when
availability can affect the activity’s duration. For example, an activity that requires
an Inspector might be delayed if that resource is assigned to multiple projects or is
on vacation.
Start or Finish Milestone: Milestone activities are zero-duration without resources,
marking a significant project event. Choose start milestone or finish milestone to
indicate that the activity marks the beginning or end of a major stage in the
project. Milestones have zero duration. They can have expenses assigned to
them, but not resources. In an office building addition project, examples of
milestones might include Project Definition Complete, Structure Complete, or End
Bidding Process.
Level of Effort: Activities have a duration that is determined by its dependent
activities and are typically administration type. Choose level of effort to indicate
that the activity’s duration depends on its predecessor and/or successor activities.
A level of effort activity is usually one that is ongoing, such as clerical work,
change management, or project management tasks. For example, site cleanup
could be considered a level of effort activity; it occurs repeatedly and is
dependent on the completion of a phase.
WBS Summary: Activities that are used to roll up date, duration, and percent
complete values for a group of activities that share a common WBS code level.
Choose WBS Summary to indicate that the activity is a summary-level WBS activity.
A WBS Summary activity represents a group of activities that share a common WBS
level. The summary-level WBS activity enables roll-ups of dates for the activity
group. The duration of a WBS Summary activity extends from the start of the earliest
activity in a group to the finish of the latest activity. WBS codes control which
activities are part of a WBS Summary activity; P6 incorporates any activities that
share a component of the WBS Summary activity's WBS code into the WBS
Summary activity. For example, all activities whose WBS codes begin with A (A.1,
A.1.1, A.1.2, etc.) can be part of one WBS Summary activity whose WBS code is A.
At a lower level, all activities whose WBS codes start with A.1 (A.1.1, A.1.2, etc.) can
be part of a WBS Summary activity whose WBS code is A.1.
Duration Type field
The duration type of the activity.
Fixed Units/Time: The resource units per time are constant when the activity
duration or units are changed. This type is used when an activity has fixed
resources with fixed productivity output per time period.

Context-Sensitive Help Topics
797
Fixed Duration and Units/Time: The activity duration is constant as the units or
resource units per time are changed. This type is used when the activity is to be
completed within a fixed time period regardless of the resources assigned.
Fixed Units: The activity units are constant when the duration or resource units per
time are changed. This type is used when the total amount of work is fixed, and
increasing the resources can decrease the activity duration.
Percent Complete Type field
The way in which the application calculates the percent complete for the activity.
Auto Compute Actuals option
Determines whether to calculate the expense actual and remaining units based on
the budgeted or planned cost and the activity's percent complete.
Started option
Determines whether the activity has started.
Finished option
Determines whether the activity has been completed.
Remaining Duration field
The total working time from the activity remaining start date to the remaining finish
date.
The remaining working time is calculated using the activity's calendar. Before the
activity is started, the remaining duration is the same as the planned duration. After
the activity is completed the remaining duration is zero.
Total Duration field
The activity's actual duration plus the remaining duration.
Percent Complete field
The activity percent complete.
This value is tied to the activity duration percent complete, units percent complete, or
physical percent complete, depending on the setting for the activity's percent
complete type, which is either duration, units, or physical. Always in the range 0 to
100.
Getting Here
From the Workgroup Workspace page:
1) Click Projects.
2) On the Projects navigation bar, click Workspace.
3) On the Workspace page, expand any portlet containing activities.
4) In the portlet, click an activity.

798
5) On the Activity Form page, expand the General section.
From the Dashboards page:
1) Click Dashboards.
2) On the Dashboards page, select a dashboard tab.
3) On the dashboard tab, expand any portlet containing activities.
4) In the portlet, click an activity.
5) On the Activity Form page, expand the General section.
General Section of the Content Tab of the Customize Dashboard Page
Overview
Use this section to configure basic dashboard properties such as title, filter, and portlet
rows.
Screen Elements
Dashboard Title field
The unique title for the dashboard.
Dashboard Filter field
The selected filter for displaying information on the dashboard.
Restricts users from changing dashboard filter option
Determines whether to allow users to change the dashboard filter.
User Filter field
The Selected filter for displaying information on the dashboard specific to the user.
This field is unavailable if Restrict users from changing dashboard filter option is
selected.
Maximum number of rows displayed in dashboard portlets field
The maximum number of rows you want to display in the dashboard portlets.
Getting Here
1) Click Dashboards.
2) On the Dashboards page, select a dashboard.
3) On the dashboard, click Customize.
4) On the Dashboard Details page, click the Content tab.
5) On the Content tab, expand the General section.

Context-Sensitive Help Topics
799
General Section of the Documents Details Page (without content repository)
Overview
This section displays configurable options for general document information of the
selected document.
Screen Elements
Title field
The identifying name of the document.
Author field
The person who authored or created the document.
Version field
The latest or most current version of the document.
Revision Date field
The date of the document's last update.
Document Category list
The classification label used to organize documents.
Reference Number field
The document's reference or catalog number.
The reference number is defined by the user.
Public Location field
The selected document's publicly-accessible file location. All project participants can
view this file.
Private Location field
The selected document's private file location. Typically, the private location is found
on the user's personal computer rather than a location that anyone could access.
Browse button
Enables you to select a file for a Public or Private Location from the Select dialog box.
Open button
Enables you to launch the file (if it is recognized by the system) or open the file
location (if you have permissions to view the location). If the system can perform
neither of these functions, you will receive an error message.
Deliverable option
Determines whether the work product or document is a project deliverable.

800
Status list
The current review status of the document. If the document is not under review, this
field is blank.
Owner field
The person responsible for the document.
If you have the appropriate privileges, you can browse to assign a person to this field.
Getting Here
From the Documents page:
1) Click Projects.
2) On the Projects navigation bar, click Documents.
3) On the Documents page:
a. Select a project from the Select Project list if applicable.
b. Select a document from the left pane.
From the Workspace page:
1) Click Projects.
2) On the Projects navigation bar, click Workspace.
3) On the Workspace page:
a. Select a project from the Select Project list if applicable.
b. Expand the Project Documents portlet.
4) In the Project Documents portlet, expand the project and select a document.
General Section of the Global Tab of the My Preferences Page
Overview
Use this section to modify general preferences.
Screen Elements
Send e-mail to resources upon adding or removing assignments option
When a resource is replaced on an activity, an e-mail is sent to the removed resource
and to the replacement resource.
When the automatic e-mail option is on, confirmation messages are sent to you,
indicating the names of the recipients. If a resource does not have an e-mail address
stored in the project database, no e-mail can be sent. In this case, you will know that
the resource was not notified because you will not receive a confirmation message
with that resource's name.

Context-Sensitive Help Topics
801
Prompt before sending e-mail option
Determines whether to prompt you before sending an e-mail.
Calculate performance and earned value information by
Select from one of the following options to calculate performance and earned value
information. Calculate Performance and Earned Value Information lets you choose
whether to display earned value information, performance indicators, and indices
based on cost or labor units. For example, when you display earned value information
on the Portfolios Performance Status tab, you will see either Costs or Labor Units data,
depending on how you set this preference.
Cost option: Select to display earned value information, performance indicators,
and indices based on cost.
Labor Units option: Select to display earned value information, performance
indicators, and indices based on labor units.
Display actual and earned value using financial period data option
Display actual and earned value using financial period data lets you choose to view
information based on past period actuals data that has been stored for custom
financial periods. This option applies to the histogram and spreadsheet displays in the
Portfolios Gantt Chart, Projects Team Usage view, and Resources Usage view.
When you choose this option, stored financial period values for actuals are distributed
evenly from the start to the finish date defined for a financial period and earned
value calculations are based on these stored period quantities.
If you do not choose this option, actuals data is spread evenly from the actual start to
the data date or actual finish date of the activity or assignment.
Note: If you choose this option but period performance has not
been stored, total reported actuals display in the timescale period
representing the data date. For more information, contact your P6
administrator or Project Management Office.
If projects are summarized by financial period (which is controlled in Application
Settings in P6), this option is ignored. When projects are summarized by financial
period and you display a financial period timescale, the profile displays past period
actual values if performance has been stored for a financial period; for financial
periods that do not have stored performance, the profile displays all unit and cost
values in financial period intervals.
Display text under page icons option
Display text under page icons enables you to show or hide toolbar button text on the
Portfolios and Projects toolbars.
Getting Here
1) Click the Administer menu and select My Preferences.
2) On the My Preferences page, click the Global tab.

802
3) On the Global tab, expand the General section.
General Tab of the Add Project Dialog Box
Overview
Use this tab to define the unique qualities of a new project. You can start with an empty
project and add new activities or base your new project off an existing template or
project.
Screen Elements
Project ID field
The unique identifying code for the project.
Project Name field
The name of the project.
Description field
A more detailed summary for the item. The description provides more information
than short names or titles. It can give background information or establish a purpose
for the item. These details help differentiate between items with similar names and are
especially useful in multi-user environments.
EPS field
The node in the EPS hierarchy where this template belongs. Click to select an EPS
from the dialog box. See Working with 'Select a Value' Dialog Boxes for more details.
Responsible Manager field
The project’s assigned organizational breakdown structure (OBS) element.
A responsible manager is required for each project and each level of the EPS.
Planned Start field
The proposed start date of the project.
Copy from Existing Project or Template field
The predefined project or template that the application will copy to create a new
project.
Getting Here
1) Click Projects.
2) On the Projects navigation bar, click EPS.
3) On the EPS page, expand the EPS element where you want to add the new
project.

Context-Sensitive Help Topics
803
4) Within the EPS element, right-click the EPS element or any project and select
Add Project.
5) In the Add Project dialog box, click the General tab.
Related Topics
Advanced Tab of the Add Project Dialog Box ................................................... 574
General Tab of the Add Project Template Dialog Box
Overview
Use this tab to define the properties of a new project template. You can start with a
clean template and add new activities or base your new template off of an existing
template or project.
Screen Elements
Template ID field
The unique alphanumeric short name (up to 20 characters) you assign to your new
project template.
Template Name field
The long name (up to 100 characters) of your project template.
Description field
A more detailed summary for the item. The description provides more information
than short names or titles. It can give background information or establish a purpose
for the item. These details help differentiate between items with similar names and are
especially useful in multi-user environments.
EPS field
The node in the EPS hierarchy where this project belongs. Click to select an EPS
element from the dialog box. See Working with 'Select a Value' Dialog Boxes for more
details.
Responsible Manager field
The project’s assigned organizational breakdown structure (OBS) element.
A responsible manager is required for each project and each level of the EPS.
Copy from Existing Project or Template field
The predefined project or template that the application will copy to create a new
project.

804
Use Actual Costs and Units option
Determines whether the application uses actual units and costs.
This option is only available if you have elected to create the new project by copying
an existing project or template. The Use Actual Costs and Units option is only enabled
if the existing project or template contains actuals.
Use Planned Costs and Units option
Determines whether the application uses planned units and costs.
This option is only available if you have elected to create the new project by copying
an existing project or template.
Getting Here
1) Click Projects.
2) On the Projects navigation bar, click EPS.
3) On the EPS page, expand the EPS element where you want to add the new
project.
4) Within the EPS element, right-click the EPS element or any project and select
Add Project Template.
5) In the Add Project dialog box, click the General tab.
Related Topics
Advanced Tab of the Add Project Template Dialog Box ................................. 576
General Tab of the Customize Spreadsheet Dialog Box of the Planning Page
Overview
Use the General tab of the Customize Spreadsheet dialog box to select the information
that is displayed in the spreadsheet.
Screen Elements
Time Units Display list
Determines the units to display time.
Decimal places list
The number of decimal places to include in the currency display: 0, 1, or 2.
Timescale list
Determines the timescale. Select from the following intervals:
Month/Week
Year/Month

Context-Sensitive Help Topics
805
Year/Quarter
Decade/Year
Financial Period
The available timescale options are determined by the selected summarization
option on the General page of the Application Settings pane. The calendar
timescale options are only available if the By Calendar option is selected. The
Financial Period option is only available if the By Financial Periods option is selected. If
both options are selected, you can select from a calendar or financial period
timescale.
Spreadsheet Start Date field
Determines the date to begin displaying resource allocation data.
Show Availability option
Determines whether to show availability.
Automatically summarize on leaving spreadsheet option
Determines whether to automatically summarize projects upon leaving the
spreadsheet.
Hide WBS if empty option
Determines whether to hide the WBS if it does not contain information.
Show other assignments when filtered by resources or roles option
Determines whether to show other assignments not specific to the selected resource
or role. If disabled, the total units column and timescale interval columns show the
summary totals only for the displayed allocated elements.
Show only unassigned role requests option
Determines whether to show only unassigned role requests. If disabled, role
assignments that are not assigned to any resources will be hidden.
Getting Here
1) Click Resources.
2) On the Resources navigation bar, click Planning.
3) On the Planning page, click the Customize link.
4) In the Customize Spreadsheet dialog box, click the General tab.
General Tab of the Document Details Section
Overview
This tab displays configurable options for general document information of the selected
document.

806
Screen Elements
Title field
The identifying name of the document.
Access Level field
The list of who can access the document. There are three access levels:
Project: If you have access to the project, you will have access to this document.
Workgroup: If you are included in the workgroup you will have access to this
document.
Private: Only the user who created the document will have access.
Security Policy list
The security policy for the selected document or folder:
Personal: Can be viewed, modified, or deleted only by the user who added it to
the project.
Read-Only: Can be viewed by any project team member, but team members
cannot modify or delete it.
Shared: Can be viewed, modified, or deleted by any project team member.
Template Document option
Determines whether the document is to be used as a template. This template in turn
can be used to create new documents.
Author field
The person who authored or created the document.
Version field
The latest or most current version of the document.
Last Modified By field
The name of the person who last modified the document. (This field is read-only.)
Modified Date field
The date and time the document was last modified.
Format field
The application format that the selected document was created in or checked in as,
after being updated. (This field is read-only.)
Size field
The document size in KB. (This field is read-only.)

Context-Sensitive Help Topics
807
Review Status field
The current review status of the document. If the document is not under review, this
field is blank.
The review statuses are Blank, In Review, Approved, Rejected, and Terminated.
Owner field
The person responsible for the document.
If you have the appropriate privileges, you can browse to assign a person to this field.
Document Category list
The list of classifications that can be used to organize various documents.
The category is set up in the client/server application by the user.
Reference Number field
The document's reference or catalog number.
The reference number is defined by the user.
Tips
The document you select and where you access the General tab might change which
screen elements are visible.
Getting Here
From the Documents page:
1) Click Projects.
2) On the Projects navigation bar, click Documents.
3) On the Documents page, click the Project tab.
4) On the Project tab, select a document and click the General tab.
From the Dashboards page:
1) Click Dashboards.
2) On the Dashboards page, select a dashboard tab.
3) On the dashboard tab, expand the My Documents portlet and click the Private
Documents tab.
4) On the Private Documents tab, select a document and click Edit Details.
5) In the Document Details dialog box, click the General tab.
From the Workspace page:
1) Click Projects.
2) On the Projects navigation bar, click Workspace.
3) On the Workspace page, expand the Project Documents portlet and click the Project
tab.

808
4) On the Project tab, select a document and click Edit Details.
5) In the Document Details dialog box, click the General tab.
General Tab of the Modify Template Dialog Box of the Import/Export Project Dialog Box
Overview
Use this tab to configure basic information for the template.
Screen Elements
Template Name field
The name for the import/export template. This field is required and can contain up to
40 characters.
Select a currency list
Determines the currency used in cost fields.
Import Microsoft Project summary tasks as WBS summary activities option
Determines whether to import a summary task from Microsoft Project as a P6 WBS
summary task in addition to the WBS hierarchical element.
Select the Microsoft Project baseline to use for planned/budgeted values list
Determines which of the ten Microsoft Project baselines the application will use for
planned or budgeted values.
Selecting 0 indicates the current project baseline.
Tips
The Import or Export Type must be set as Microsoft Project XML (2007) to enable the
options icons.
Getting Here
1) Click Projects.
2) On the Projects navigation bar, click EPS.
3) On the EPS page, click the Actions menu and select Import/Export XML Project
Import/Export.
4) In the Import/Export Project dialog box, click the Import or Export tab.
5) On the Import or Export tab:
a. Select Microsoft Project XML (2007) from the Import or Export Type list.
b. Click MSP Export Template Options or MSP Import Template Options.
6) In the Modify Template dialog box, click the General tab.

Context-Sensitive Help Topics
809
General Tab of the Scheduling Options Dialog Box
Overview
Use this tab to specify various scheduling options such as schedule progressed activities,
calculate start-to-start lag, and the method (Total Float or Longest Path) by which you
want to analyze critical activities.
Screen Elements
Ignore relationships to and from other projects option
Determines whether to ignore activity relationships between projects.
Make open-ended activities critical option
Determines whether to label open-ended activities as critical during the scheduling.
Use expected finish dates option
Determines whether to schedule activity finish dates as the expected finish dates..
Level resources during scheduling option
Determines whether to level resources automatically each time you schedule a
project.
This is the only scheduling option that is saved at the user level, so will likely vary
among project users, generating inconsistent results.
This option is not available unless the Oracle Primavera Job Service is used for
scheduling. Based on administrative settings, scheduling jobs are run using either the
Web Scheduler or Job Service. The Web Scheduler, which is enabled by default does
not provide the option to level resources when scheduling. To level resources, you
must use the Primavera Job Service. Contact your P6 administrator for information
and assistance.
Recalculate assignment costs after scheduling option
Determines whether the application should enforce that costs remain accurate when
rescheduled dates reflect a rate change.
Select to recalculate the costs of resource or role assignments that use multiple rates.
When scheduling progressed activities use option
Determines the type of logic used to schedule dependent activities with
out-of-sequence progress. For example, a Finish to Start relationship in which the
predecessor has not finished but the successor has started.
Retained Logic: The remaining duration of a progressed activity is not scheduled
until all of its predecessors are finished.
Progress Override: The schedule ignores network logic and allows the activity to
progress without delay.
Actual Dates: Backward and forward passes are calculated using actual dates.

810
Calculate Start-to-Start lag from option
Determines when you want the successor to start. When a start to start relationship
exists and the predecessor starts out of sequence, the scheduler delays the successor
activity until the lag expires and all predecessor relationships have been satisfied. Use
this option to specify whether to subtract the lag from the predecessor's internal early
start date or its actual start date.
Early Start: Calculates the expired lag as the number of work periods between the
actual start and the data date and determines the successor's start date as the
predecessor's internal early start plus any remaining lag. Select this option when
the successor's start depends on the amount of work that the predecessor activity
accomplishes.
Actual Start: Determines the successor's start date as the data date plus any
remaining lag. Select this option when you want the successor's start to depend
on the time elapsed from the predecessor's actual start (regardless of the amount
of work that has been accomplished in the predecessor activity).
Define critical activities as option
Determines the method used to identify critical activities:
Total float less than or equal to: Select this option to identify critical activities based
on the lack of flexibility in their scheduled dates. Enter a number and time unit to
specify a minimum float duration. When the project is scheduled, activities with
total float values less than or equal to this value are marked critical. The value you
specify is automatically converted into the time units you specified in My
Preferences.
Longest Path: Select this option to define critical activities based on the sequence
of driving activities that determine the project end date.
Calculate float based on finish date of option
Determines whether to calculate float based on the finish date of each project or
opened projects.
Each Project: Schedules external relationships on the backward pass using each
project’s finish date for open-ended activities, including activities that have an
external relationship.
Opened Projects: Schedules external relationships on the backward pass using the
latest finish date of all opened projects and external relationship dates to
calculate late dates of activities. Float for open-ended activities is calculated
using the latest finish date of all opened projects, allowing for more float than the
Each project option. Each Project's Scheduled Finish date field is calculated as the
latest finish date of all opened projects.
Compute Total Float As option
Determines the method to calculate total float for all activities based on the following
methods:

Context-Sensitive Help Topics
811
Start Float: The difference between the early and late start dates (Start Float
equals Late Start minus Early Start).
Finish Float: The difference between the early and late finish dates (Finish Float
equals Late Finish minus Early Finish).
Smallest value: Select to use the most critical value, which is the smaller of the start
float and finish float values.
Calendar for scheduling Relationship Lag is list
The calendar used to calculate relationship lag. The default calendar for new
activities is specified on the Administration > Calendars page or in P6 Professional.
Predecessor Activity Calendar: Calculates lag based on the predecessor activity's
calendar
Successor Activity Calendar: Calculates lag based on the successor activity's
calendar
24 hour Calendar: Specifies work time 7 days/week and 24 hours/day
Project Default Calendar: Uses the calendar that is designated as the default for
new activities
Getting Here
1) Click Projects.
2) On the Projects navigation bar, click Activities.
3) On the Activities page, click the Actions and select Run Scheduler....
4) In the Schedule Project dialog box, click Options.
5) In the Scheduling Options dialog box, click the General tab.
Generate Financial Periods Dialog Box of the Financial Periods Page
Overview
Use this dialog box to automatically create new financial periods at the same time.
Screen Elements
Last Period Finish Date
This field displays the finish date of last period. This field is read-only.
Batch Start Date field
This field displays date, month, year, and the day of the week. Enter a date for the
batch to start or click to choose a date.
Batch Finish Date field
This field displays date, month, year, and the day of the week. Enter a date for the
batch to finish or click to choose a date.

812
Period Cycle field
Choose from one of the following to set as the period cycle:
Every [ ] Weeks: Select 1-52 to set the period cycle by weeks.
Every [ ] Months: Select 1-100 to set the period cycle by months.
Every Year: Select to set the period by years.
Tips
Although you are alerted in each case, be aware of the following constraints when
creating or configuring financial periods:
You cannot introduce gaps in a series of financial periods. Any new periods you
create must start or end flush with any existing entries. For example, if October 7-13
and October 14-20 are existing financial periods, you can create a new one that
either ends on October 6 or starts on October 21.
You cannot overlap financial periods. In order to serve their purpose, financial periods
must represent unique slices of time.
You can create financial periods with a duration of fewer than seven days (one
week); however, you cannot view them in timescales in P6. Use P6 Professional if you
need to view data by financial periods spanning increments of fewer than seven
days (one week).
Getting Here
1) Click the Administer menu and select Enterprise Data.
2) In the Enterprise Data pane, expand Global and click Financial Periods.
3) On the Financial Periods page, click Add Batch.
Generate Timesheet Periods Dialog Box of the Timesheet Periods Page
Overview
Use this dialog box to automatically create new timesheet periods at the same time.
Screen Elements
Last Period Finish Date
This field displays the finish date of last period. This field is read-only.
Batch Start Date field
This field displays date, month, year, and the day of the week. Enter a date for the
batch to start or click to choose a date.
Batch Finish Date field
This field displays date, month, year, and the day of the week. Enter a date for the
batch to finish or click to choose a date.

Context-Sensitive Help Topics
813
Period Cycle field
Choose from one of the following to set as the period cycle:
Every Week: Select to set the period cycle to every week.
Every Two Weeks: Select to set the period cycle to every two weeks.
Every Four Weeks: Select to set the period cycle to every four weeks.
Every Month: Select to set the period cycle to every month.
Getting Here
1) Click the Administer menu and select Enterprise Data.
2) In the Enterprise Data pane, expand Global and click Timesheet Periods.
3) On the Timesheet Periods page, click Add Batch.
Global Calendars Page
Overview
Use this page to view or configure global calendar information and options.
Screen Elements
Global Calendars Toolbar
See Enterprise Data Global Calendar Toolbar (on page 1267).
Calendar tab
See Calendar Tab of the Global Calendars Page (on page 605).
Standard Work Week tab
See Standard Work Week Tab of the Global Calendars Page (on page 1085).
Used By tab
See Used By Tab of the Global Calendars Page (on page 1135).
Search field
The means to find a project.
Search
Displays options for finding a specific matching entry or entries based on search
criteria.
Calendar List
Displays a list of all available calendars to view.
Getting Here
1) Click the Administer menu and select Enterprise Data.

814
2) In the Enterprise Data pane, expand Global and click Global Calendars.
Global Data Detail Window of the Global Security Profiles Page
Overview
Use this detail window to assign global data privileges to the selected global security
profile.
Screen Elements
Privilege field
The name of the security permission that is assigned (option selected) or denied
(option cleared) to users of the currently selected profile.
Privilege option
The option in the column header that determines whether the privileges are all
assigned (selected), all denied (clear), or individually configured (indicated with a
dash or - sign).
Add/Edit/Delete Categories and Overhead Codes option
Determines whether the profile will enable users to create, modify, and remove
categories and overhead codes data, which can be applied to all projects.
Overhead codes are only available to P6 Progress Reporter users.
Add/Edit/Delete Cost Accounts option
Determines whether the profile will enable users to create, modify, and remove cost
accounts data.
Add/Edit/Delete Currencies option
Determines whether the profile will enable users to create, modify, and remove
currencies data.
Add/Edit/Delete Financial Period Dates option
Determines whether the profile will enable users to create, modify, and remove
financial periods data. To edit period data, users must also have the 'Edit Period
Performance' project privilege assigned to their profile.
Add/Edit/Delete Funding Sources option
Determines whether the profile will enable users to create, modify, and remove
funding source data.
Add/Edit/Delete Global Calendars option
Determines whether the profile will enable users to create, modify, and remove
global calendars data.

Context-Sensitive Help Topics
815
Add/Edit/Delete Global Portfolios option
Determines whether the profile will enable users to create, modify, and remove
global portfolio configurations in Manage Portfolios Views.
Add/Edit/Delete Global Scenarios option
Determines whether the profile will enable users to create, modify, and remove
scenarios configurations in the Manage Scenarios link.
Add/Edit/Delete Rick Categories, Matrices, and Thresholds option
Determines whether the profile will enable users to create, modify, and remove risk
categories, risk scoring matrices, and risk thresholds data.
Add/Edit/Delete Timesheet Period Dates option
Determines whether the profile will enable users to create, modify, and remove
individual timesheet periods and batches of timesheet periods.
Add/Edit/Delete User Defined fields option
Determines whether the profile will enable users to create, modify, and remove User
Defined fields. Even without this privilege, users can still display User Defined fields
information.
Getting Here
1) Click the Administer menu and select User Access.
2) On the User Access page, click Global Security Profiles.
3) On the Global Security Profiles page, click the Global Data detail window.
Global Data Section of the Import Tab of the Import/Export Project Dialog Box
Overview
Use this section to select an import action when the same data exists in the import file
and project being updated.
Screen Elements
Name field
The name of the global or project data element that will be imported. Use in
correspondence with the Import Action lists to select an action for each name.
Import Action list
Determines what action to take when importing:
Insert New: Retains data in the existing methodology and adds any new data
items. For example, if a new role was added to the data, but you don’t want to
change the existing roles, select Insert New to add the new role to the existing
methodology.

816
Keep Existing: Retains data in the existing methodology and does not overwrite
them with the updated data; adds new data if the record does not exist.
Update Existing: Overwrites data in the existing methodology with updated data;
adds new data if the record does not exist.
Do Not Import: Retains data in the existing methodology and does not import the
updated data.
Getting Here
1) Click Projects.
2) On the Projects navigation bar, click EPS.
3) On the EPS page, click the Actions menu and select Import/Export XML Project
Import/Export.
4) In the Import/Export Project dialog box, click the Import tab.
5) On the Import tab:
a. Select Primavera XML from the Import Type list.
b. Click Advanced .
Global Security Profiles Page
Overview
Use this page to configure global security profiles by assigning privileges on the seven
detail windows. The options you configure in each tab apply to the selected profile.
Screen Elements
Global Security Profiles toolbar
See User Access Security Profiles Toolbar (on page 1358).
Profile Name field
The name of the global security profile.
Description field
The full description for the profile.
Default field
Default option is to assign this security profile to new users.
Note: Only one profile can be the active default.
Assigned Privileges field
View privileges assigned to the profile.

Context-Sensitive Help Topics
817
Global Security Profile detail windows
Administration Detail Window of the Global Security Profiles Page (on page 572)
Codes Detail Window of the Global Security Profiles Page (on page 621)
Global Data Detail Window of the Global Security Profiles Page (on page 814)
Resources Detail Window of the Global Security Profiles Page (on page 1020)
Templates Detail Window of the Global Security Profiles Page (on page 1118)
Tools Detail Window of the Global Security Profiles Page (on page 1128)
Views and Reports Detail Window of the Global Security Profiles Page (on page 1152)
Getting Here
1) Click the Administer menu and select User Access.
2) On the User Access page, click Global Security Profiles.
Global Tab of the Activity Codes Page
Overview
Use this tab to configure all existing global activity codes and values for your
organization.
Screen Elements
Activity Codes Global toolbar
The elements of the toolbar are described in Activity Codes Toolbar (see "Enterprise
Data Activity Codes Toolbar" on page 1255).
Name field
This field displays the name of an activity code or value. Activity codes enable you to
categorize activities into logical groups based on your organization's criteria. You can
define unlimited hierarchical activity codes to fulfill the filtering, sorting, and reporting
requirements for your activities, and arrange them hierarchically for easier
management and assignment. Global activity codes organize activities across all
projects in an organization.
Description field
This field shows the description you entered for the activity code or value.
Maximum Length field
Indicates the maximum length for an activity code or value. The value cannot
exceed the maximum character length specified for the activity code.
Color field
The color for the activity code value.

818
Secure option
Secure codes enable privileged users to hide Project, Activity, Issue and Resource
codes from users that do not have security privileges to view them. Secure codes are
structured hierarchically. In other words, if a user is granted add/delete privileges, that
user automatically has edit, assign, and view privileges. If a user is granted edit
privileges, that user is automatically granted assign and view privileges. If a user is
granted assign privileges, that user is automatically assigned view privileges.
Tips
You can specify the maximum number of global activity codes and maximum
Activity Code tree levels on the Data Limits tab of Admin Preferences in P6.
Getting Here
1) Click the Projects menu and select Enterprise Project Data, or click the
Administer menu and select Enterprise Data.
2) In the Enterprise Data pane, expand Activities and click Activity Codes.
3) On the Activity Codes page, click the Global tab.
Global Tab of the My Preferences Page
Overview
Use this tab to customize data display formats for all sections of the application.
Screen Elements
Maximum number of rows displayed in each section field
For pages with standard lists of data (not tables), the number of rows that display
together before the list is divided. Generally, the lower the number, the better
performance will be since the user interface is displaying fewer rows of data.
Example: You specify a value of five in this field. Later, you navigate to the Portfolio
Status page or Project Issues page. Up to five rows will be listed. If more than five rows
of data are available, a [Next >>] link appears for you to navigate to the next five
items in the list.
Note: This preference does not apply to workspace portlets. To
specify the number of rows that display for lists in the portlets of a
specific workspace, customize the workspace.
Maximum number of rows displayed in trees and pick lists field
This field controls the number of elements that display in hierarchical lists, such as the
EPS/project hierarchy in the Open Projects dialog box.
If the number of items available to display exceeds the maximum you specify, a
message appears to inform you that you are viewing only a partial list.

Context-Sensitive Help Topics
819
Click one of the links below for other detailed screen definitions.
General Section of the Global Tab of the My Preferences Page
Currency Section of Global Tab of the My Preferences Page
Time Units Format Section of the Global Tab of the My Preferences Page
Date Format Section of the Global Tab of the My Preferences Page
Resources Section of the Global Tab of the My Preferences Page
Issues Section of the Global Tab of the My Preferences Page
Project Score Section of Global Tab of the My Preferences Page
Performance Threshold Section of the Global Tab of the My Preferences Page
Getting Here
1) Click the Administer menu and select My Preferences.
2) On the My Preferences page, click the Global tab.
Group Tab of the Customize Cost Worksheet Dialog Box
Overview
Use this tab to modify grouping options.
Screen Elements
Level 1 field
Determines how data is grouped at the first level.
Band Color list
The color to display for each hierarchical level.
Text Color list
The color for the text to be displayed within each grouping band.
Sort Order list
Determines whether the application sorts values in ascending or descending order.
Show field title in band option
Determines whether to display the title of the field in the band.
Getting Here
From the Workspace page:
1) Click Projects.
2) On the Projects navigation bar, click Workspace.
3) On the Workspace page, expand the Cost Worksheet portlet.

820
4) In the Cost Worksheet portlet, click Customize.
5) In the Customize Project Cost Worksheet dialog box, click the Group tab.
From the Dashboards page:
1) Click Dashboards.
2) On the Dashboards page, select a dashboard.
3) On the selected dashboard, expand the Cost Worksheet portlet.
4) In the Cost Worksheet portlet, click Customize.
5) In the Customize Dashboard Cost Worksheet dialog box, click the Group tab.
Group Tab of the Customize Project Issues Dialog Box
Overview
Use this tab to select how you want to arrange or group issues.
On this tab, you can select up to three levels, or fields, by which you want to group issues.
Grouping gathers all of the issues together that contain the same value for the selected
field. For example, if you select to group by Status, all issues with an Open status are
grouped together, all issues with an On Hold status are grouped together, and all issues
with a Closed status are grouped together. To display issues in the Chart format, you must
select at least one group by level. Each selected grouping level appears with a colored
band when displaying issues in the List format. From the Band Color list, you can select
the background color you want to display for each grouping level. The Text list lets you
select the color of the text that displays in the grouping level band.
You can additionally mark or clear the following options to customize the text that
appears in each colored band:
Screen Elements
Field list
The field you want to use to arrange the data into smaller more manageable groups.
Data rows with similar field values can be arranged into expandable hierarchies with
up to 10 or 20 levels and sorted by group to reduce visual complexity and speed user
access to specific data.
Band Color field
The color to visually represent each hierarchical level.
Text Color list
The color for the text to be displayed within each grouping band.
Sort Order list
The type of sorting, either ascending (A to Z; 1 to 10) or descending (Z to A; 10 to 1),
that you want applied to the data in each grouping level.

Context-Sensitive Help Topics
821
For example, if you group by a field called Zone with possible values of A, B, and C
and select a descending sort order, the group of Zone: C rows appears first, followed
by the group of Zone: B rows, and finally the group of Zone: A rows. Choose
ascending to restore an alphabetic order.
Screen elements for grouping and column selection often accompany one another.
The preferred default sort order for the main table's rows is specified on the Columns
tab, if available.
Show field title in band option
Determines whether to display the selected field name in each grouping level
followed by the field value in the format field Name: Value. You can click each level
or band to expand its list of entries.
For example, if you set up a grouping level by a field called Zone, the following text
appears in the bands of actual table data:
Zone: Zone A
Zone: Zone B
Zone: Zone C
Show field rollups in band option
Determines whether to display summary information for all cost, numeric, integer, start
date, and end date fields in the grouping level.
Show ID/Code Value in band option
Determines whether to display the issue code value associated with the grouping
level.
This option applies only when grouping by an issue code.
Show Name/Code Description in band option
Determines whether to display the issue code description associated with the
grouping level.
This option applies only when grouping by an issue code.
Getting Here
From the Issues page:
1) Click Projects.
2) On the Projects navigation bar, click Issues.
3) On the Issues page, click Customize.
4) In the Customize Project Issues dialog box, click the Group tab.
From the Workspace page:
1) Click Projects.
2) On the Projects navigation bar, click Workspace.

822
3) On the Workspace page, expand the Project Issues portlet and click Customize.
4) In the Customize Project Issues dialog box, click the Group tab.
From the Dashboards page:
1) Click Dashboards.
2) On the Dashboards page, select a dashboard tab.
3) On the dashboard tab, expand the My Issues portlet and click Customize.
4) In the Customize My Issues dialog box, click the Group tab.
Group Tab of the Customize Project Statistics Dialog Box
Overview
Use this tab to configure grouping options for the Project Statistics portlet.
Screen Elements
Field list
The field you want to use to arrange the data into smaller more manageable groups.
Data rows with similar field values can be arranged into expandable hierarchies with
up to 10 or 20 levels and sorted by group to reduce visual complexity and speed user
access to specific data.
To Level list
The level to which values of a hierarchy are shown, or, if a date is selected, the way
dates are broken up for the group bands.
Band Color field
The color to visually represent each hierarchical level.
Text Color list
The color for the text to be displayed within each grouping band.
Sort Order list
The type of sorting, either ascending (A to Z; 1 to 10) or descending (Z to A; 10 to 1),
that you want applied to the data in each grouping level.
For example, if you group by a field called Zone with possible values of A, B, and C
and select a descending sort order, the group of Zone: C rows appears first, followed
by the group of Zone: B rows, and finally the group of Zone: A rows. Choose
ascending to restore an alphabetic order.
Screen elements for grouping and column selection often accompany one another.
The preferred default sort order for the main table's rows is specified on the Columns
tab, if available.

Context-Sensitive Help Topics
823
Show field title in band option
Determines whether to display the selected field name in each grouping level
followed by the field value in the format field Name: Value. You can click each level
or band to expand its list of entries.
For example, if you set up a grouping level by a field called Zone, the following text
appears in the bands of actual table data:
Zone: Zone A
Zone: Zone B
Zone: Zone C
Show field rollups in band option
Determines whether to display summary information for all cost, numeric, integer, start
date, and end date fields in the grouping level.
Getting Here
From the Workspace page:
1) Click Projects.
2) On the Projects navigation bar, click Workspace.
3) On the Workspace page, click Customize.
4) On the Customize page, click the Content tab.
5) On the Content tab, expand the Project Performance section.
6) In the Project Performance section, expand Project Statistics and click Customize
Columns.
7) In the Customize Project Statistics dialog box, click the Group tab.
From the Dashboards page:
1) Click Dashboards.
2) On the Dashboards page, select a dashboard tab.
3) On the dashboard tab, click Customize.
4) On the Dashboard Details page, click the Content tab.
5) On the Content tab, expand the Project Performance section.
6) In the Project Performance section, expand Project Statistics and click Customize.
7) In the Customize Project Statistics dialog box, click the Group tab.
Group Tab of the Customize Scorecard Dialog Box of the Portfolio Views Section of the
Customize Dashboard Page
Overview
Use this tab to configure how information is grouped in a scorecard portfolio view.

824
Screen Elements
Level field list
The field used for each level preferred to 10 to determine how data is grouped.
To Level list
The number from 1 to 10 that determines the number of fields displaying the
information chosen in the level. This option is only available when a field from Project
Codes is selected.
Background Color field
The color to be displayed as a background for each level of chosen data displayed.
Text Color field
The color to be displayed for text for each level of chosen data displayed.
Sort Order list
Determines whether to sort information in an ascending or descending order.
Show field title in band option
Determines whether to display the field title in band.
Show field rollups in band option
Determines whether to display the field rollups in band.
Getting Here
1) Click Dashboards.
2) On the Dashboards page, select a dashboard.
3) On the dashboard, click Customize.
4) On the Dashboard Details page, click the Content tab.
5) On the Content tab, expand the Portfolio Views section and expand a view.
6) In the view section, select Scorecard from the Type list and click Customize.
7) In the Customize Scorecard dialog box, click the Group tab.
Grouping Tab of the Customize Activity View Dialog Box
Overview
Use this tab to determine how fields are grouped.
Screen Elements
Select fields to group by section:

Context-Sensitive Help Topics
825
Field list
The field you want to use to arrange the data into smaller more manageable groups.
Data rows with similar field values can be arranged into expandable hierarchies with
up to 10 or 20 levels and sorted by group to reduce visual complexity and speed user
access to specific data.
To Level list
The level to which values of a hierarchy are shown, or, if a date is selected, the way
dates are broken up for the group bands.
Band Color field
The color to visually represent each hierarchical level.
Text Color list
The color for the text to be displayed within each grouping band.
Sort Order list
Determines whether columns are sorted in ascending or descending order, or by
hierarchy.
Band Options section
Show field title option
Determines whether to show the title of the field in the table or Gantt chart.
Show field rollups option
Determines whether to display summarized values, such as the dates of the table or
Gantt chart.
Clear the option to prevent this information from displaying.
Hide if empty option
Determines whether to hide grouping bands that do not contain any projects (if on
the EPS page) or activities (if on the Activities page).
Display text in bands using section:
ID/Code option
The short name or ID/Code within the grouping band.
If you select this option and EPS is selected in the field list, you can edit the EPS code in
the first column on the EPS page.
Name/Description option
The long name or name/description within the grouping band.
If you select this option and EPS is selected in the field list, you can edit the EPS
description in the first column on the EPS page.

826
ID/Code and Name/ Description option
The short and long name within the grouping band.
If you select this option and EPS is selected in the field list, you can edit the EPS code in
the first column on the EPS page.
Tips
Grouping bands are displayed by default when you group by a project code or EPS
even if the bands are empty. Select the Hide if empty option in the Customize View or
Customize Groupings dialog boxes to remove these bands from view.
Getting Here
1) Click Projects.
2) On the Projects navigation bar, click Activities.
3) On the Activities page:
a. Select a view from the Activity View list.
b. Click the View menu and select Customize View....
4) In the Customize Activity Views dialog box, click the Grouping tab.
Grouping Tab of the Customize Project View Dialog Box
Overview
Use this tab to determine how fields are grouped.
Screen Elements
Field list
The field you want to use to arrange the data into smaller more manageable groups.
Data rows with similar field values can be arranged into expandable hierarchies with
up to 10 or 20 levels and sorted by group to reduce visual complexity and speed user
access to specific data.
To Level list
The level to which values of a hierarchy are shown, or, if a date is selected, the way
dates are broken up for the group bands.
Band Color field
The color to visually represent each hierarchical level.
Text Color list
The color for the text to be displayed within each grouping band.

Context-Sensitive Help Topics
827
Sort Order list
Determines whether columns are sorted in ascending or descending order, or by
hierarchy.
Band Options section
Show field title option
Determines whether to show the title of the field in the table or Gantt chart.
Show field rollups option
Determines whether to display summarized values, such as the dates of the table or
Gantt chart.
Clear the option to prevent this information from displaying.
Hide if empty option
Determines whether to hide grouping bands that do not contain any projects (if on
the EPS page) or activities (if on the Activities page).
Display text in bands using section:
ID/Code option
The short name or ID/Code within the grouping band.
If you select this option and EPS is selected in the field list, you can edit the EPS code in
the first column on the EPS page.
Name/Description option
The long name or name/description within the grouping band.
If you select this option and EPS is selected in the field list, you can edit the EPS
description in the first column on the EPS page.
ID/Code and Name/ Description option
The short and long name within the grouping band.
If you select this option and EPS is selected in the field list, you can edit the EPS code in
the first column on the EPS page.
Tips
Grouping bands are displayed by default when you group by a project code or EPS
even if the bands are empty. Select the Hide if empty option in the Customize View or
Customize Groupings dialog boxes to remove these bands from view.
Getting Here
1) Click Projects.
2) On the Projects navigation bar, click EPS.

828
3) On the EPS page:
a. Select a view from the EPS View list.
b. Click the View menu and select Customize View....
4) In the Customize Project View dialog box, click the Grouping tab.
Grouping Tab of the Customize Resource Assignments View Dialog Box of the Assignments
Page
Overview
Use this tab to determine how fields are grouped.
Screen Elements
Field list
The field you want to use to arrange the data into smaller more manageable groups.
Data rows with similar field values can be arranged into expandable hierarchies with
up to 10 or 20 levels and sorted by group to reduce visual complexity and speed user
access to specific data.
To Level list
The level to which values of a hierarchy are shown, or, if a date is selected, the way
dates are broken up for the group bands.
Band Color field
The color to visually represent each hierarchical level.
Text Color list
The color for the text to be displayed within each grouping band.
Sort Order list
Determines whether columns are sorted in ascending or descending order, or by
hierarchy.
Band Options:
Show field title option
Determines whether to show the title of the field in the table or Gantt chart.
Show field rollups option
Determines whether to display summarized values, such as the dates of the table or
Gantt chart.
Clear the option to prevent this information from displaying.

Context-Sensitive Help Topics
829
Display text in bands using:
ID/Code option
The short name or ID/Code within the grouping band.
Name/Description option
The long name or name/description within the grouping band.
ID/Code and Name/ Description option
The short and long name within the grouping band.
Getting Here
1) Click Resources.
2) On the Resources navigation bar, click Assignments.
3) On the Assignments page, click View and select Customize View....
4) In the Customize Resource Assignments View dialog box, click the Grouping tab.
Hard Constraints - Constraints That Prevent Activities Being Moved Section of the Schedule
Check Report Dialog Box
Overview
Use this section to view activities with hard constraints. Hard constraints override logical
relationships and thereby prevent activities from being scheduled according to the
logic. Hard constraints should only be used when they reflect real dates. Examples of
hard constraints are Mandatory Start and Mandatory Finish. If possible, replace hard
constraints with logical relationships.
Only a subset of all the activities in the open projects are checked. WBS summary
activities, activities with an actual finish date, and Level of Effort activities are removed
from the subset to create a list of activities that are checked for Hard Constraints. Start
constraints are ignored if they are on activities that have an actual start. The Actual
percentage is calculated as the number of activities found that match the check
divided by the total number of subset activities checked.
Screen Elements
Project ID field
The unique identifying code of the project containing the activity which failed the
check.
Activity ID field
The unique identifying code of the activity which failed the check.
830
Activity Description field
The brief description of the listed activity.
Constraint Type field
The type of constraint that is preventing the activity from being moved.
Hard constraint types include: Mandatory Start and Mandatory Finish.
Soft constraint types include: Finish On, Finish On or After, Finish On or Before, Start On,
Start On or After, and Start On or Before.
Constraint Date field
The date, if applicable, to which the activity must adhere.
Position field
The constraint position: primary or secondary.
Getting Here
1) Click Projects.
2) On the Projects navigation bar, click Activities.
3) On the Activities page, click the Actions menu and select Run Check
Schedule....
4) In the Check Schedule dialog box:
a. Select the Hard Constraints - Constraints that prevent activities being moved
option.
b. Click Check Schedule.
5) In the Schedule Check Report dialog box, expand the Hard Constraints - Constraints
that prevent activities being moved section.
History Dialog Box
Overview
Use this dialog box to view details about the jobs for the currently selected report
including the date and time each job was run and its status.
Note: The run history is only captured for scheduled reports or
on-demand reports delivered by e-mail.
Screen Elements
Run Date field
The date and time the report schedule ran.

Context-Sensitive Help Topics
831
User field
The identifier for the user who created the scheduled job.
Status field
The state of the individual reports run from the schedule or on-demand delivered by
e-mail.
Results are:
Completed: The scheduled report run is successful.
Failed: The scheduled report run encountered an error and the report did not run.
Delete All History button
Deletes the historical report run records for the selected schedule.
Getting Here
1) Click Reports.
2) On the Reports page:
a. Click View and select Reports.
b. Select a report, and then click the Schedule detail window.
3) In the Schedule detail window, click History.
History of Workflow Instance Dialog Box
Overview
Use this dialog box to view a chronology of the actions that have been performed for the
human tasks in the currently selected workflow instance.
Screen Elements
Date field
The date the human task was last changed. A change includes claiming, reassigning,
approving, escalating, and other actions.
Action field
The type of change that occurred for each activity in the history. Examples include
instance created marking the start of a workflow, instance entered activity marking
entry into the next task or stage of the workflow, and instance completed activty
marking the end of the task or stage.
Depending on your edition of BPM, you may see the type of operation performed by
a user upon a human task within the workflow. Valid action values include:

832
Escalated: The task was reassigned further up the organizational chain of command
or given priority.
Suspended: The task was put on hold.
Purged: The task was purged.
Deleted: The task was deleted.
Withdrawn: The task was withdrawn.
Submitted: The task was submitted to users within the workflow.
Reassigned: The task was reassigned to another user, group, or role.
Claimed: The task was claimed for exclusive follow-up action by the user making the
claim.
Approved: The task was approved or supported by the reviewer.
Rejected: The task was rejected or not-supported by the reviewer.
User field
The Personal Name of the user associated with the change to the human tasks within
the workflow. This includes claiming, reassigning, approving, escalating, and other
actions. This field displays the value Workflowsystem if the change was made by
another application or system event.
Stage field
The name of the current workflow phase. The stage also provides an indication of the
workflow's current progress within the total sequence of all its defined phases. For
example, Stage 1: Just Initiated vs. Stage 5: Final Review.
Getting Here
1) Click Dashboards.
2) On the Dashboards page, select a dashboard.
3) On the dashboard, expand the Workflows portlet.
4) In the Workflows portlet, click the My Workflows tab.
5) On the My Workflows tab, select a workflow instance and click History.
History Tab of the Document Details Section (with content repository)
Overview
Use this tab to view an audit trail of all actions that have been performed on a selected
document. You can see all document activities, the user who performed the activity,
and when the activity occurred.
Screen Elements
Date field
The date and time the activity was performed.

Context-Sensitive Help Topics
833
User field
The name of the user who performed the activity.
Action field
The activity performed on the selected document. Examples include Created
Document and Review Terminated.
Version field
The version of the document on which the activity was performed.
Getting Here
From the Documents page:
1) Click Projects.
2) On the Projects navigation bar, click Documents.
3) On the Documents page, click the Project tab.
4) On the Project tab, select a document and click the History tab.
From the Dashboards page:
1) Click Dashboards.
2) On the Dashboards page, select a dashboard tab.
3) On the dashboard tab, expand My Documents and select the Private Documents
tab.
4) On the Private Documents tab, select a document and click Edit Details.
5) In the Document Details dialog box, click the History tab.
From the Workspace page:
1) Click Projects.
2) On the Projects navigation bar, click Workspace.
3) On the Workspace page, expand the Project Documents portlet and click the Project
tab.
4) On the Project tab, select a document and click Edit Details.
5) In the Document Details dialog box, click the History tab.
ID Lengths Page
Overview
Use this page to specify the maximum number of characters for IDs and codes.

834
Table of Screen Elements
Specify the number of characters to allow for ID fields at each tree level
You can enter a value of 1-20 for the following options:
Project ID maximum characters
WBS Code maximum characters
Resources ID maximum characters
Activity ID maximum characters
Cost Account ID maximum characters
Role ID maximum characters
Getting Here
1) Click the Administer menu and select Application Settings.
2) On the Application Settings pane, click ID Lengths.
Impacts Detail Window of the Risk Scoring Matrices Page
Overview
Use this detail window to assign impacts to the selected risk scoring matrix.
Screen Elements
Add (Insert)
Adds impact thresholds to the risk scoring matrix. You must define a cost and
schedule impact for a risk scoring matrix. User-defined impacts are optional.
Delete (Delete)
Deletes or removes the currently selected data items or table rows.
Caution: Your selected data is permanently deleted once you click Save.
Type field
The type of impact threshold assigned to the risk scoring matrix. Types of impacts are
schedule, cost, and user-defined. You must define a cost and schedule impact for a
risk scoring matrix. User-defined impacts are optional.
Name field
The name of the selected cost, schedule, or user-defined impact.
Severity fields
The ranges and values assigned to the chosen thresholds. The number of severity
fields is determined by the number of levels chosen for the impact thresholds.

Context-Sensitive Help Topics
835
Getting Here
1) Click the Projects menu and select Enterprise Project Data, or click the
Administer menu and select Enterprise Data.
2) In the Enterprise Data pane, expand Risks and click Risk Scoring Matrices.
3) On the Risk Scoring Matrices page, click the Impacts detail window.
Import Calendar Events Dialog Box
Overview
Use this dialog box to select a file containing nonwork exception time to import into My
Calendar.
Screen Elements
File field
The name of the specific nonwork time from an .ics file to be imported into a personal
calendar.
Import nonwork time option
Determines which nonwork time is imported from the .ics file. By default, all nonwork
time is selected. When the option at the top of the column is cleared, you can select
individual entries.
Name field
The name of the nonwork time set in the calendar. This field is read-only.
Start field
The start date of the nonwork time. This field is read-only.
Finish field
The finish date of the non-work time.
Getting Here
1) Click the Administer menu and select My Calendar.
2) On the My Calendar page, click Import.
Import Tab of the Import/Export Project Dialog Box
Overview
Use this tab to import information to a central database.

836
Screen Elements
Import Type list
Determines whether the Primavera XML or Microsoft Project XML import type is used.
If you select Primavera XML, the Advanced button becomes available. Clicking the
Advanced button allows you to determine how data is updated when projects are
imported.
Import File field
The file to be imported.
Click browse and select a Primavera XML or Microsoft Project XML file to import.
Microsoft Project Template list
The template to use for importing or exporting a project. To enable this list, you must
select Microsoft Project XML from the Import Type or Export Type list.
Select Import Action section:
Create New Project option
Select to create a new project.
Update Existing Project option
Determines whether to update an existing project.
Advanced button
Displays Global Data and Project Data options. Modify the selected options by
selecting the action to take when the same data exists in the import file and project
being updated.
See Global Data Section of the Import Tab of the XML Project Import/Export Dialog
Box (see "Global Data Section of the Import Tab of the Import/Export Project Dialog
Box" on page 815) for more details on the Global Data area.
See Project Data Section of the Import Tab of the XML Project Import/Export Dialog
Box (see "Project Data Section of the Import Tab of the Import/Export Project Dialog
Box" on page 956) for more details on the Project Data area.
Basic button
Hides Global Data and Project Data options.
Import button
Imports a file or project with your selected options.
Getting Here
1) Click Projects.
2) On the Projects navigation bar, click EPS.

Context-Sensitive Help Topics
837
3) On the EPS page, click the Actions menu and select Import/Export XML Project
Import/Export.
4) In the Import/Export Project dialog box, click the Import tab.
Import/Export Project Dialog Box
Overview
Use this dialog box to import and export information to and from this database using
external files and then share this information with other P6 Professional users, Oracle
Primavera Contractor users, other project management tools (such as Microsoft® Project
2007 and Microsoft® Excel®), and your organization's human resource and accounting
systems. You can also use external files to archive your projects or create a backup of
your database.
You can import and export between P6 and other applications using the following file
formats:
Oracle Primavera's P6 Professional XML format, which enables you to share project
information between Project Management databases.
Microsoft Project XML format enables you to share information with Microsoft Project
2007.
Screen Elements
Import tab
See Import Tab of the Import/Export Project Dialog Box (on page 835).
Export tab
See Export Tab of the Import/Export Project Dialog Box (on page 767).
Status tab
See Status Tab of the Import/Export Project Dialog Box (on page 1097).
Getting Here
1) Click Projects.
2) On the Projects navigation bar, click EPS.
3) On the EPS page, click the Actions menu and select Import/Export XML Project
Import/Export.

838
Index Performance Portlet of the Dashboards Page
Overview
Use this portlet to view Schedule Performance Index (SPI), Cost Performance Index (CPI),
and To Complete Performance Index (TCPI) calculations. SPI indicates whether you are
meeting earned and planned values within your schedule; CPI indicates whether you
have spent money over the budget to date; TCPI enables you to determine the level of
performance needed to achieve the cost or time objectives. Status indicators help you
gauge whether these index values are within an acceptable range or whether you will
need to take corrective action, based on thresholds you define.
Screen Elements
Legend
Key to performance threshold indicators. Use these visual indicators to quickly scan
values based on thresholds you define:
Critical: Indicates that a WBS, project, or portfolio requires significant corrective
action.
Warning: Indicates that a WBS, project, or portfolio needs attention and is
performing below expectations.
Acceptable: Indicates that a WBS, project, or portfolio is performing within an
expected range.
Exceptional: Indicates that a WBS, project, or portfolio is exceeding
expectations.
Projects list
The available projects. Selecting a project allows the user to view the index
performance for each project and WBS within the project.
Schedule Performance Index (SPI) field
A measure of the work accomplished as a percentage of the work scheduled.
SPI indicates whether you are meeting earned and planned values within your
schedule. You can set performance thresholds for SPI calculated values to determine
whether you need to take corrective action.
Calculated as: Earned Value of Cost or Quantity divided by Planned Value of Cost or
Quantity
The variance percentage is calculated as: Earned Value divided by Planned Value.
Cost Performance Index (CPI) field
A measure of the value of work accomplished as a percentage of the actual costs.
CPI indicates whether you have spent money over the budget to date. You can set
performance thresholds for CPI calculated values to determine whether you need to
take corrective action.

Context-Sensitive Help Topics
839
Calculated as: Earned Value divided by Actual Cost
Where: Actual Cost equals actual equipment cost plus actual expense cost plus
actual work cost plus material cost
The variance percentage is calculated as: Earned Value divided by Actual Cost.
To Complete Performance Index (TCPI) field
A measure of the value of the project work that is remaining. TCPI is essentially a ratio
of the remaining work to the remaining funds. It helps determine the level of
performance that must be achieved on the remaining work to meet recognized
business goals, such as the Budget at Completion (BAC) or the Estimate at
Completion (EAC).
You can set performance thresholds for calculated TCPI values to display visual
indicators that help you determine whether you need to take corrective action.
Calculated as: (BAC minus Earned Value) divided by (EAC minus Actual Cost or Units)
Where: BAC equals base equipment cost plus base expense cost plus base work cost
plus base material cost; EAC equals (actual equipment cost plus actual expense cost
plus actual work cost plus actual material cost) plus (remaining equipment cost plus
remaining expense cost plus remaining work cost plus remaining material cost);
Actual Cost equals actual equipment cost plus actual expense cost plus actual work
cost plus actual material cost
Tips
The Index Performance portlet calculates and displays data in cost or labor units
based on the option selected on the Global tab in My Preferences.
If a dashboard's Filter by option is set to a portfolio or project code, the portlet lists
each project included in the portfolio or project code filter and displays each
project's index performance data.
You can click a project name in the portlet to display the Performance Status page or
the associated Project Workspace; the page displayed depends on your module
access.
Getting Here
1) Click Dashboards.
2) On the Dashboards page, select a dashboard.
3) On the dashboard, expand the Index Performance portlet.
Index Performance Portlet of the Workspace Page
Overview
Use this portlet to view the schedule performance index (SPI), cost performance index
(CPI), and to complete performance index (TCPI) calculations. Use the status indicators
to help you gauge whether these index values are within an acceptable range or
whether you will need to take corrective action, based on thresholds you define.

840
Screen Elements
Legend
Key to performance threshold indicators. Use these visual indicators to quickly scan
values based on thresholds you define:
Critical: Indicates that a WBS, project, or portfolio requires significant corrective
action.
Warning: Indicates that a WBS, project, or portfolio needs attention and is
performing below expectations.
Acceptable: Indicates that a WBS, project, or portfolio is performing within an
expected range.
Exceptional: Indicates that a WBS, project, or portfolio is exceeding
expectations.
Schedule Performance Index (SPI) field
A measure of the work accomplished as a percentage of the work scheduled.
SPI indicates whether you are meeting earned and planned values within your
schedule. You can set performance thresholds for SPI calculated values to determine
whether you need to take corrective action.
Calculated as: Earned Value of Cost or Quantity divided by Planned Value of Cost or
Quantity
The variance percentage is calculated as: Earned Value divided by Planned Value.
Cost Performance Index (CPI) field
A measure of the value of work accomplished as a percentage of the actual costs.
CPI indicates whether you have spent money over the budget to date. You can set
performance thresholds for CPI calculated values to determine whether you need to
take corrective action.
Calculated as: Earned Value divided by Actual Cost
Where: Actual Cost equals actual equipment cost plus actual expense cost plus
actual work cost plus material cost
The variance percentage is calculated as: Earned Value divided by Actual Cost.
To Complete Performance Index (TCPI) field
A measure of the value of the project work that is remaining. TCPI is essentially a ratio
of the remaining work to the remaining funds. It helps determine the level of
performance that must be achieved on the remaining work to meet recognized
business goals, such as the Budget at Completion (BAC) or the Estimate at
Completion (EAC).
You can set performance thresholds for calculated TCPI values to display visual
indicators that help you determine whether you need to take corrective action.
Calculated as: (BAC minus Earned Value) divided by (EAC minus Actual Cost or Units)

Context-Sensitive Help Topics
841
Where: BAC equals base equipment cost plus base expense cost plus base work cost
plus base material cost; EAC equals (actual equipment cost plus actual expense cost
plus actual work cost plus actual material cost) plus (remaining equipment cost plus
remaining expense cost plus remaining work cost plus remaining material cost);
Actual Cost equals actual equipment cost plus actual expense cost plus actual work
cost plus actual material cost
Tips
The Index Performance portlet data is derived from your choice of cost or labor units.
Make this selection in the Project Performance section of the Workspace Details page.
Getting Here
1) Click Projects.
2) On the Projects navigation bar, click Workspace.
3) On the Workspace page, expand the Index Performance portlet.
Indicators Detail Window of the Project UDFs Page
Overview
Use this detail window to define one or more graphical indicators to appear with the
currently selected project user-defined field. The parameters you define are based on
the relationship between your UDF's value and other values or fields.
Screen Elements
Parameter field
The comparison operator expressing the relationship between the project UDF value
and the value, range, or field you specify. When you select a parameter of is within
range of or is not within range of, the value or field you enter in the Value column
represents the low values in the range, and the High Value column represents the
high values in the range.
Value options
Determines whether the project UDF value should be compared with a value you
specify or a field value you choose from the list.
Value/Field field
The manually-specified value or field-supplied value used for the logical comparison
to define this indicator. When you select a comparison parameter of is within range of
or is not within range of, the value or field in this column represents the low value in the
range.

842
High Value options
Determines whether the project UDF value should be compared with a range defined
by a high value you specify or determined by a field value for comparison
parameters of only is within range of or is not within range of.
High Value/Field field
The manually-specified value or field-supplied value representing the high value of
the optional range used in the comparison parameter for each indicator.
Indicator field
The graphical image or icon used to symbolically represent a specific project UDF
value relative to another value, range, or relationship you define.
Bubble Color field
The color used in portfolio view bubble charts to represent this project UDF value or
range relative to others.
Add Row button
Adds an additional row to the bottom of the detail window so you can define
another indicator.
Remove Row button
Removes the current row and indicator parameters from the detail window.
Getting Here
1) Click the Projects menu and select Enterprise Project Data, or click the
Administer menu and select Enterprise Data.
2) In the Enterprise Data pane, expand Projects and click Project UDFs.
3) On the Project UDFs page, select a user-defined field and click the Indicators detail
window.
Invalid Progress Dates - Activities with Actual Dates After the Data Date Section of the
Schedule Check Report Dialog Box
Overview
Use this section to view activities that have actual dates after the data date.
Only a subset of the activities in the open projects are checked. WBS summary activities,
Level of Effort activities, and activities with actual finish dates before the data date are
removed from the subset to create the list of activities checked for actual start or finish
dates occurring after the data date. The Actual percentage is calculated as the number
of activities found that match the check divided by the number of subset activities
checked.

Context-Sensitive Help Topics
843
Screen Elements
Project ID field
The unique identifying code of the project containing the activity which failed the
check.
Activity ID field
The unique identifying code of the activity which failed the check.
Activity Description field
The brief description of the listed activity.
Data Date field
The date used as the starting point to calculate the schedule. Each project has its
own data date.
Actual Start Date field
The actual start date of the activity, if the activity has started.
Working hours before data date field
The number of hours between the data date and the actual start date. Calculated as
the Data Date minus the Actual Start Date.
Actual Finish Date field
The actual finish date of the activity.
Working hours before data date field
The number of hours between the data date and the actual finish date. Calculated
as the Data Date minus the Actual Finish Date.
Getting Here
1) Click Projects.
2) On the Projects navigation bar, click Activities.
3) On the Activities page, click the Actions menu and select Run Check
Schedule....
4) In the Check Schedule dialog box:
a. Select the Invalid Progress Dates - Activities with invalid progress dates option.
b. Click Check Schedule.
5) In the Schedule Check Report dialog box, expand the Invalid Progress Dates -
Activities with actual dates after the data date section.

844
Invalid Progress Dates - Incomplete Activities Before the Data Date Section of the Schedule
Check Report Dialog Box
Overview
Use this section to view incomplete activities that are scheduled before the data date.
Only a subset of the activities in the open projects are checked. WBS summary activities,
Level of Effort activities, and activities with actual finish dates before the data date are
removed from the subset to create the list of activities checked for planned dates that
occur before the data date. The Actual percentage is calculated as the number of
activities found that match the check divided by the number of subset activities
checked.
Screen Elements
Project ID field
The unique identifying code of the project containing the activity which failed the
check.
Activity ID field
The unique identifying code of the activity which failed the check.
Activity Description field
The brief description of the listed activity.
Data Date field
The date used as the starting point to calculate the schedule. Each project has its
own data date.
Start Date field
The scheduled start date of the activity that is before the data date.
Working hours before data date field
The number of hours between the data date and the scheduled start. Calculated as
the Data Date minus the Start Date.
Finish Date field
The scheduled finish date of the activity that is before the data date.
Working hours before data date field
The number of hours between the data date and the scheduled finish date.
Calculated as the Data Date minus the Finish Date.
Getting Here
1) Click Projects.

Context-Sensitive Help Topics
845
2) On the Projects navigation bar, click Activities.
3) On the Activities page, click the Actions menu and select Run Check
Schedule....
4) In the Check Schedule dialog box:
a. Select the Invalid Progress Dates - Activities with invalid progress dates option.
b. Click Check Schedule.
5) In the Schedule Check Report dialog box, expand the Invalid Progress Dates -
Incomplete activities before the data date section.
Issue Codes Page
Overview
Use this page to add and configure issue codes and code values for projects.
Screen Elements
Issue Codes toolbar
See Enterprise Data Issue Codes Toolbar (on page 1268).
Name field
The name of each issue. Issue codes enable you to organize and categorize issues in
a way that is meaningful to you. For example, you can create an issue code titled
Severity, and subsequently create issue code values: High, Medium, and Low. You
can assign each of these code values to issues across multiple projects, enabling you
to categorize each issue according to how severe it is. Similarly, you can create
codes to categorize issues by responsibility, subproject, or any other classification you
require to organize issues. Assigning issue codes enables you to quickly search for and
view issues according to specific criteria.
Description field
The description to each corresponding issue.
Secure option
Secure codes enable privileged users to hide Project, Activity, Issue and Resource
codes from users that do not have security privileges to view them. Secure codes are
structured hierarchically. In other words, if a user is granted add/delete privileges, that
user automatically has edit, assign, and view privileges. If a user is granted edit
privileges, that user is automatically granted assign and view privileges. If a user is
granted assign privileges, that user is automatically assigned view privileges.
Getting Here
1) Click the Projects menu and select Enterprise Project Data, or click the
Administer menu and select Enterprise Data.

846
2) In the Enterprise Data pane, expand Issues and click Issue Codes.
Issue Codes Section of the Issue Forms Page
Overview
Use this section to edit and remove existing issue code assignments as well as assign issue
codes to the form. Each issue code assigned will be displayed on the Add Issue page for
all issues created from this form.
Screen Elements
Assign Issue Codes link
Enables you to select an issue code to assign.
Issue Codes section
The area where you can view, assign, or configure issue codes:
Getting Here
1) Click Projects.
2) On the Projects navigation bar, click Issues.
3) On the Issues page, click Issue Forms.
4) On the Issue Forms page, select an issue form and expand the Issue Codes section.
Issue Details Page
Overview
Use this page to view or modify details about a specific project issue. If you have the
required security privilege, you can additionally modify issue information, relate items,
assign issue codes, and remove the issue.
Screen Elements
General area
Use the following field to modify general options:
Issue Name field
The name of the project issue.
In P6 Professional, issues which are automatically generated by the threshold monitor
are named after the threshold parameter that triggered the project issue.
Responsible Manager field
The name of the person responsible for the issue.

Context-Sensitive Help Topics
847
If you have edit privileges, you can select a different Responsible Manager. The list of
available resources depends upon your resource access security privileges.
Owner field
The list of available resources you can select from depends upon your resource
access security privileges.
Priority list
Determines the priority of the activity when performing resource leveling.
Status field
The current status of the issue: Open, On Hold, Closed.
Identified By field
The name of the person who identified the issue. By default, this field displays your user
name.
Date Identified field
The date on which the issue was identified. By default, this field displays today's date.
Resolution Date field
The planned (open issue) or actual (closed issue) resolution date for the issue.
Applies to field
The activity, project, or WBS with which the issue is associated.
Description section
The brief summary of the item at hand. The field or section might be editable.
Issue Codes section
The area where you can view, assign, or configure issue codes:
Assign Issue Codes link
Enables you to select an issue code to assign.
Issue Code field
The name of the issue code.
Code Value field
The value of the assigned code.

848
Description field
A more detailed summary for the item. The description provides more information
than short names or titles. It can give background information or establish a purpose
for the item. These details help differentiate between items with similar names and are
especially useful in multi-user environments.
User Defined fields section
The section where you can assign values to user-defined fields associated with the
issue:
Related Items section
The section where you can assign related documents or issues to the issue:
Name field
The name of the item related to the issue.
Description field
A more detailed summary for the item. The description provides more information
than short names or titles. It can give background information or establish a purpose
for the item. These details help differentiate between items with similar names and are
especially useful in multi-user environments.
Relate Documents link
Enables you to select a document to relate to the currently selected document. See
Working with 'Select a Value' Dialog Boxes for further details.
Relate Issue link
Enables you to select an issue to relate to the currently selected document. See
Working with 'Select a Value' Dialog Boxes for further details.
Remove link
Removes the selected related item. You must first select the option beside an item's
name before you click the Remove link.
Tips
When editing a workgroup issue, if you associate a project activity with the issue, the
same issue will also appear as a project issue on the Project Issues portlet and Issues
page. If you remove the project activity from the issue, the issue no longer appears as a
workgroup issue in the Issues portlet on the Workgroup page; it only appears as a project
issue.
Getting Here
From the Issues page:
1) Click Projects.

Context-Sensitive Help Topics
849
2) On the Projects navigation bar, click Issues.
3) On the Issues page, select an issue.
From the Dashboards page:
1) Click Dashboards.
2) On the Dashboards page, select a dashboard tab.
3) On the dashboard tab, expand the My Issues portlet.
4) In the My Issues portlet, expand a project and select an issue.
From the Workspace page:
1) Click Projects.
2) On the Projects navigation bar, click Workspace.
3) On the Workspace page, expand the Project Issues portlet and select an issue.
Issue Form Tab of the Issue Forms Page
Overview
Use this tab to view and configure details about an issue form including what is displayed
or required and the assigned issue codes or user-defined fields.
Screen Elements
Form Name field
The name of the selected issue form.
Field Name area:
Issue Name field
The name or description of the issue.
Applies to field
The activity, project, or WBS with which the issue is associated.
Date Identified field
The date on which the issue was identified. By default, this field displays today's date.
Owner field
The resource responsible for the selected issue.
If you have edit privileges, you can select a different owner. The list of available
resources you can select from depends upon your resource access security privileges.
Priority list
Determines the priority of the activity when performing resource leveling.

850
Resolution Date field
The planned (open issue) or actual (closed issue) resolution date for the issue.
Responsible Manager field
The name of the person responsible for the issue.
If you have edit privileges, you can select a different Responsible Manager. The list of
available resources depends upon your resource access security privileges.
Status field
The current status of the issue: Open, On Hold, Closed.
Display section
The options to display the selected item on the issue form.
Default Value section
The section where you can assign items to the selected field Name item.
Required section
The options that you can select to require a user to enter information in that field on
the issue form.
Issue Codes section
See Issue Codes Section of the Issue Forms Page (on page 846).
User Defined Fields section
See User Defined Fields Section of the Issue Forms Page (on page 1136).
Getting Here
1) Click Projects.
2) On the Projects navigation bar, click Issues.
3) On the Issues page, click Issue Forms.
4) On the Issue Forms page, click the Issue Form tab.
Issue Forms Page
Overview
Use this page to view details about a specific issue form, create new forms, modify
information such as the name of the form, and determine which fields appear on the
Add Issue page for all future issues created from the form. Additionally, you can assign
issue codes and user-defined fields.

Context-Sensitive Help Topics
851
Screen Elements
Refresh
Refreshes the current screen with any new, updated, or removed data.
Modify
Displays the following options to modify the issue forms page:
Close Modify: Closes the Modify options.
Add Form: Enables you to select a form to add.
Delete: Deletes the currently selected issue forms.
Search list
The criteria with which to search.
for field
The search inquiry based on your selection in the Search list.
Search button
Displays options based on your entered criteria.
Clear Results button
Clears the for field and removes the options based on your entered criteria to display
all possible codes.
Issue Form tab
See Issue Form Tab of the Issue Forms Page (on page 849).
Access tab
See Access Tab of the Issue Forms Page (on page 538).
Getting Here
1) Click Projects.
2) On the Projects navigation bar, click Issues.
3) On the Issues page, click Issue Forms.
Issue UDFs Page
Overview
Use this page to add and configure user defined fields for issues.

852
Screen Elements
User Defined Fields toolbar
See User Defined Fields Toolbar (on page 1361).
User Defined Field field
The name of the user-defined field.
Data Type field
The name of the type of data that corresponds to each user-defined field. The data
type you select determines the type of data you can specify in a field. The following
data types are available:
Text: Allows you to use text or a combination of text and numbers.
Start Date: Allows you to enter Start Date information only.
Finish Date: Allows you to enter Finish Date information only.
Cost: Allows you to enter currency values.
Number: Allows you to use numerals with two decimal places.
Integer: Allows you to use numeric data, but not a number related to money.
Indicator: Allows you to use an indicator field that you can use to enter
color-coded icon values in columns and display color-coded text in reports.
Getting Here
1) Click the Projects menu and select Enterprise Project Data, or click the
Administer menu and select Enterprise Data.
2) In the Enterprise Data pane, expand Issues and click Issue UDFs.
Issues Detail Window of the Activities Page
Overview
Use this detail window to list and manage issues associated with the selected activity.
Screen Elements
Issues toolbar
See Issues Toolbar (on page 1292).
Issue Name field
The name of the project issue.
In P6 Professional, issues which are automatically generated by the threshold monitor
are named after the threshold parameter that triggered the project issue.
Priority list
Determines the priority of the activity when performing resource leveling.

Context-Sensitive Help Topics
853
Issue Status Code field
The current status of the project issue.
Owner field
The resource responsible for the issue.
Applies To field
The activity, project, or WBS to which the issue is associated.
Identified By field
The name of the person who identified the issue.
Date Identified field
The date that the issue was identified.
Responsible Manager field
The name of the manager responsible for the issue.
Resolution Date field
The date that the issue was resolved.
Description field
The description of the topic.
Tips
If you have more than one activity selected, the detail window will not be visible.
If you have a project template open, the icons in the detail window will be disabled.
Getting Here
1) Click Projects.
2) On the Projects navigation bar, click Activities.
3) On the Activities page, select an activity and click the Issues detail window.
Issues Detail Window of the EPS Page
Overview
Use this detail window to list and manage issues associated with the selected project.
Screen Elements
Issues toolbar
See Issues Toolbar (on page 1292).

854
Issue Name field
The name or description of the issue.
Priority list
Determines the priority of the activity when performing resource leveling.
Status field
The current status of the issue: Open, On Hold, Closed.
Owner field
The resource responsible for the selected issue.
If you have edit privileges, you can select a different owner. The list of available
resources you can select from depends upon your resource access security privileges.
Responsible Manager field
The name of the person responsible for the issue.
If you have edit privileges, you can select a different Responsible Manager. The list of
available resources depends upon your resource access security privileges.
Description field
A more detailed summary for the item. The description provides more information
than short names or titles. It can give background information or establish a purpose
for the item. These details help differentiate between items with similar names and are
especially useful in multi-user environments.
Tips
If you have a project template open, the icons in the detail window will be disabled.
If you have more than one project selected, the detail window will not be visible.
Getting Here
1) Click Projects.
2) On the Projects navigation bar, click EPS.
3) On the EPS page, select a project and click the Issues detail window.
Issues Page
Overview
Use this page to view a list or chart of all the issues for the currently open projects or
portfolios. This page helps you manage issues in the following ways:
View issue status and priority
View a short description or link directly to the full issue details page

Context-Sensitive Help Topics
855
Send e-mail about issues to multiple recipients who have configured their My
Preferences settings to automatically receive issue notifications
Screen Elements
Add an Issue link
Displays a dialog box in which you can search and select a form to create a new
project issue. Use the Add Issue page that is displayed once a form is chosen to
record basic issue information (such as responsible manager, owner, priority, and a
description).
Expand All/Collapse All link
Shows or hides the contents of each group of issues. To show or hide the contents of a
single group of issues, click or beside the grouping band. You can specify
grouping options when you customize the issues list. If you do not have any grouping
options selected, these links are not enabled.
Customize link
Enables you to specify how issues should be filtered, grouped, charted, and
columnized. For viewing issues in List format, you can specify the columns of
information you want to display. For viewing issues in chart format, you can specify
chart type and color options. The customize options you choose apply only to you.
Issue Forms link
Redirects you to the Issue Forms page. See Issue Forms Page (on page 850).
Display options
Determine the format in which you want to display project issues. The display option
applies for all users who can access the Project Issues portlet.
List: this option displays issues in a list, and enables you to add, edit, or delete
issues. By default, all issues display in the List format, but you can customize the list
to display only the issues you want to see. You can also select the columns of
information you want to display, and choose how to group and sort issues in the
list.
Chart: this option enables you to graphically display issue count information based
on your customized group and filter selections. The Chart format enables you to
graphically display issue count information based on your customized group and
filter selections. When you customize the portlet, you can change these group
and filter options. You can additionally customize the portlet to specify chart type
and color options. To view group by and issue count details, move the mouse over
each bar or slice in the chart.
To view issues in Chart format, you must customize the portlet and select at least one
grouping level option; otherwise, the chart does not display. To select grouping level
options, click Customize and then click the Group tab. To rotate the display of a pie
chart, you can click and drag the chart either clockwise or counter clockwise.

856
Issue Name field
The name or description of the issue.
Priority field
The level of importance assigned to the issue.
Responsible Manager field
The name of the person responsible for the issue.
If you have edit privileges, you can select a different Responsible Manager. The list of
available resources depends upon your resource access security privileges.
Owner field
The resource responsible for the selected issue.
If you have edit privileges, you can select a different owner. The list of available
resources you can select from depends upon your resource access security privileges.
Resolution Date field
The date the selected issue was resolved.
Status field
The current status of the issue: Open, On Hold, Closed.
Description field
A more detailed summary for the item. The description provides more information
than short names or titles. It can give background information or establish a purpose
for the item. These details help differentiate between items with similar names and are
especially useful in multi-user environments.
E-mail field
The e-mail dialog prepopulated with issue details.
Tips
When sorting by a specific issue column in the List format, an up-facing triangle
indicates the column is sorted in ascending order, and a down-facing triangle
indicates the column is sorted in descending order.
To add, edit, or delete an issue, you must have the required security privilege.
All issues that are added to a workgroup, and are then associated with a project
activity, appear as project issues on the Issues page, as well as in the Project Issues
portlet on the Workspace page.
Getting Here
1) Click Projects.
2) On the Projects navigation bar, click Issues.

Context-Sensitive Help Topics
857
Issues Portlet of the Workgroup Workspace Page
Overview
Use this portlet to view information about issues that belong to the workgroup. The
information that appears depends on the display format and customize options you
select.
Screen Elements
Add link
Enables you to create a new project issue. You can select the issue form you want to
use to create the issue, then subsequently use the Add Issue page to record basic
issue information, such as responsible manager, owner, priority, and a description.
Expand All/Collapse All link
Shows or hides the contents of each group of issues. To show or hide the contents of a
single group of issues, click or beside the grouping band. You can specify
grouping options when you customize the issues list. If you do not have any grouping
options selected, these links are not enabled.
Customize link
Displays a dialog box for specifying how you want to filter, group, and sort issues. For
viewing issues in List format, you can specify the columns of information you want to
display. For viewing issues in Chart format, you can specify chart type and color
options. The customize options you choose apply for all users who can access the
Project Issues portlet. Refer to Customizing the Project Issues portlet for more detailed
information. See Customize Project Issues Dialog Box (on page 686).
Display options:
List option
Determines whether issues are displayed in a list, and enables you to add, edit, or
delete issues.
By default, all issues display in the List format, but you can customize the list to display
only the issues you want to see. You can also select the columns of information you
want to display, and choose how to group and sort issues in the list.
Chart option
Determines whether issue count information is graphically displayed based on your
customized group and filter selections.
The Chart format enables you to graphically display issue count information based on
your customized group and filter selections. When you customize the portlet, you can
change these group and filter options. You can additionally customize the portlet to
specify chart type and color options. To view group by and issue count details, move
the mouse over each bar or slice in the chart.
858
Filter field
The name of the filter currently applied to the portlet. By default, all issues display, but
you can customize the portlet to apply a custom filter. If a custom filter is applied, the
filter description appears in this field, and only those issues that meet the filter criteria
appear for both the List and Chart format.
Issue Name field
The name or description of the issue.
Priority field
The level of importance assigned to the issue.
Owner field
The resource responsible for the selected issue.
If you have edit privileges, you can select a different owner. The list of available
resources you can select from depends upon your resource access security privileges.
Resolution Date field
The date the selected issue was resolved.
Status field
The current status of the issue: Open, On Hold, Closed.
E-mail field
The e-mail dialog prepopulated with issue details.
Tips
The "No information is available" message appears when no workgroup issues have
been added, or when your filtering criteria excludes existing issues.
When a project activity is associated with a workgroup issue, the issue will also appear
as a project issue on the Project Issues portlet and the Issues page. If the activity
association is removed, the issue no longer appears in the Issues portlet on the
Workgroup page; it only appears as a project issue.
To view issues in chart format, you must customize the portlet and select at least one
grouping level option; otherwise, the chart does not display. To select grouping level
options, click Customize, and then click the Group tab.
To rotate the display of a pie chart, you can click and drag the chart either clockwise
or counter clockwise.
Getting Here
From the Workspace page:
1) Click Projects.
2) On the Projects navigation bar, click Workspace.

Context-Sensitive Help Topics
859
3) On the Workspace page, expand the Workgroups portlet and select a workgroup.
4) On the Workgroup Workspace page, expand the Issues portlet.
From the Dashboards page:
1) Click Dashboards.
2) On the Dashboards page, select a dashboard.
3) On the dashboard, expand the My Workgroups portlet and select a workgroup.
4) On the Workgroup Workspace page, expand the Issues portlet.
Issues Section of the Global Tab of the My Preferences Page
Overview
Use this section to configure e-mail notifications for issues.
Screen Elements
Send me a notification when
Use the following options to determine whether you receive a notification and when.
Issues are added with priority of [ ] or higher option
Determines whether issues that are added with a priority you specify from the list are
sent. Value options are Top, High, Normal, Low, and Lowest.
Issues are assigned issue code field
Determines whether issues that are assigned an issue code are sent. Click to
display a dialog box with search options to assign an issue code.
Issues are modified option
Determines whether issues that are modified are sent.
Only notify me about Issues for Projects and Workgroups if I
The following options determine whether you are notified about issues for Projects
and Workgroups when one or multiple selections are made:
have project access rights option
Determines whether you are notified about issues for Projects and Workgroups if you
have Project access rights.
have issue access rights option
Determines whether you are notified about issues for Projects and Workgroups if you
have Issue access rights.

860
am the Project Owner option
Determines whether you are notified about issues for Projects and Workgroups if you
are the Project Owner.
am the Issue Owner option
Determines whether you are notified about issues for Projects and Workgroups if you
are the Issue Owner.
am assigned as a resource to that activity option
Determines whether you are notified about issues for Projects and Workgroups if you
are assigned as a resource to the specified activity.
Getting Here
1) Click the Administer menu and select My Preferences.
2) On the My Preferences page, click the Global tab.
3) On the Global tab, expand the Issues section.
Lags - Relationships with a Positive Lag Duration Section of the Schedule Check Report Dialog
Box
Overview
Use this section to identify relationships with positive lags. Lags are a scheduled delay
between activities. It is important to identify lags in the schedule as they can manipulate
float and constrain a schedule. You can replace a lag with a task to avoid the problems
that lags can create.
Only a subset of all the internal and external links in the open projects are checked. Any
links between activities that both have actual finish dates are removed from the subset
to create the list of links checked for positive lag. The Actual percentage is calculated as
the number of links found that match the check divided by the total number of subset
links checked.
Screen Elements
Predecessor Project ID field
The identifying code for the project containing the predecessor activity that failed
the check.
Predecessor Activity ID field
The identifying code for the predecessor activity that failed the check.
Predecessor Activity Description field
The brief description of the predecessor activity.

Context-Sensitive Help Topics
861
Relationship Type field
The relationship between two activities. See About Relationships for more
information on relationship types.
Lag Duration (hours) field
The number of hours of lag duration.
Successor Project ID field
The identifying code of the project that contains the successor activity.
Successor Activity ID field
The identifying code of the successor activity.
Successor Activity Description field
The brief description of the successor activity.
Getting Here
1) Click Projects.
2) On the Projects navigation bar, click Activities.
3) On the Activities page, click the Actions menu and select Run Check
Schedule....
4) In the Check Schedule dialog box:
a. Select the Lags - Relationships with a positive lag duration option.
b. Click Check Schedule.
5) In the Schedule Check Report dialog box, expand the Lags - Relationships with a
positive lag duration section.
Large Durations - Activities That Have a Remaining Duration Greater Than 352 Hours Section
of the Schedule Check Report Dialog Box
Overview
Use this section to view activities with duration greater than the value you listed in the
Large Durations field in the Check Schedule dialog box. Activities with a large duration
are difficult to manage. You can break these activities down into smaller activities which
provide a better insight into cost and schedule.
Only a subset of the activities in the open projects are checked. WBS summary activities,
activities with an actual finish date, milestones, and Level of Effort activities are removed
from the subset to create the list of activities checked for large remaining duration. The
Actual percentage is calculated as the number of activities found that match the check
divided by the number of subset activities checked.

862
Screen Elements
Project ID field
The unique identifying code of the project containing the activity which failed the
check.
Activity ID field
The unique identifying code of the activity which failed the check.
Activity Description field
The brief description of the listed activity.
Remaining Duration (hours) field
The activity's remaining duration in hour format.
Getting Here
1) Click Projects.
2) On the Projects navigation bar, click Activities.
3) On the Activities page, click the Actions menu and select Run Check
Schedule....
4) In the Check Schedule dialog box:
a. Select the Large Durations - Activities that have a remaining duration greater than
352 hours option.
b. Click Check Schedule.
5) In the Schedule Check Report dialog box, expand the Large Durations - Activities that
have a remaining duration greater than 352 hours section.
Large Float - Activities with a Total Float Greater Than 352 Hours Section of the Schedule
Check Report Dialog Box
Overview
Use this section to view activities with a float greater than the number of hours you
specify in the Large Float field in the Check Schedule dialog box. Activities with a large
float might be missing a suitable predecessor or successor. A high percentage of large
floats can indicate an unstable network that is not logic driven.
Only a subset of the activities in the open projects are checked. WBS summary activities,
activities with an actual finish date, and Level of Effort activities are removed from the
subset to create the list of activities checked for total float greater than the specified
value. The Actual percentage is calculated as the number of activities found that match
the check divided by the total number of subset activities checked.

Context-Sensitive Help Topics
863
Screen Elements
Project ID field
The unique identifying code of the project containing the activity which failed the
check.
Activity ID field
The unique identifying code of the activity which failed the check.
Activity Description field
The brief description of the listed activity.
Total Float (hours) field
The total number of hours an activity can be delayed before the project is delayed.
Zero hours indicate that the activity cannot be delayed at all and negative float
indicates that the project is already behind schedule.
Getting Here
1) Click Projects.
2) On the Projects navigation bar, click Activities.
3) On the Activities page, click the Actions menu and select Run Check
Schedule....
4) In the Check Schedule dialog box:
a. Select the Large Float - Activities with a total float greater than 352 hours option.
b. Click Check Schedule.
5) In the Schedule Check Report dialog box, expand the Large Float - Activities with a
total float greater than 352 hours section.
Late Activities - Activities Scheduled to Finish Later Than the Project Baseline Section of the
Schedule Check Report Dialog Box
Overview
Use this section to view activities that are scheduled to finish later than the project
baseline. This indicates how well the project is performing against the currently selected
baseline.
Only a subset of the activities in the open projects are checked. WBS summary activities,
activities with an actual finish date, milestones, and Level of Effort activities are removed
from the subset to create the list of activities checked for a Baseline Finish Variance of
less than 0. The Actual percentage is calculated as the number of activities found that
match the check divided by the total number of subset activities checked.

864
Screen Elements
Project ID field
The unique identifying code of the project containing the activity which failed the
check.
Activity ID field
The unique identifying code of the activity which failed the check.
Activity Description field
The brief description of the listed activity.
Finish Variance (hours) field
The number of hours the task has been delayed.
Getting Here
1) Click Projects.
2) On the Projects navigation bar, click Activities.
3) On the Activities page, click the Actions menu and select Run Check
Schedule....
4) In the Check Schedule dialog box:
a. Select the Late Activities - Activities scheduled to finish later than the project
baseline option.
b. Click Check Schedule.
5) In the Schedule Check Report dialog box, expand the Late Activities - Activities
scheduled to finish later than the project baseline section.
Layout Tab of the Customize Dashboard Page
Overview
Use this tab to arrange the size and position of portlets on a dashboard.
Screen Elements
Dashboard Portlets work area
A customizable arrangement of the selected portlets simulating their actual size and
position on the dashboard.
Narrow option
The application displays the selected portlet as a narrow box.
Wide option
The application displays the selected portlet as a wide box.

Context-Sensitive Help Topics
865
Moves the selected portlet left in the workspace layout
Moves the selected portlet up in the workspace layout
Moves the selected portlet right in the workspace layout
Moves the selected portlet down in the workspace layout
Getting Here
1) Click Dashboards.
2) On the Dashboards page, select a dashboard.
3) On the selected dashboard, click Customize.
4) On the Dashboard Details page, click the Layout tab.
Layout Tab of the Customize Workgroup Workspace Page
Overview
Use this tab to arrange the layout of the selected portlets from the Content tab.
Screen Elements
Portlet Name group
The enabled portlets and their locations and size on the page.
Narrow option
The application displays the selected portlet as a narrow box.
Wide option
The application displays the selected portlet as a wide box.
Moves the selected portlet left in the workspace layout
Moves the selected portlet up in the workspace layout
Moves the selected portlet right in the workspace layout
Moves the selected portlet down in the workspace layout
Getting Here
From the Workspace page:
1) Click Projects.
2) On the Projects navigation bar, click Workspace.
3) On the Workspace page, expand the Workgroups portlet and click a workgroup.
4) On the Workgroup Workspace page, click Customize.

866
5) On the Customize page, click the Layout tab.
From the Dashboards page:
1) Click Dashboards.
2) On the Dashboards page, select a dashboard tab.
3) On the dashboard tab, expand the My Workgroups portlet and select a workgroup.
4) On the Workgroup Workspace page, click Customize.
5) On the Customize page, click the Layout tab.
Layout Tab of the Workspace Details Page
Overview
Use this tab to size and position portlets in a workspace.
Screen Elements
Workspace Portlets work area
A customizable arrangement of the selected portlets simulating their actual size and
position on the workspace. You can drag and drop portlets in this work area.
Narrow option
The application displays the selected portlet as a narrow box.
Wide option
The application displays the selected portlet as a wide box.
Moves the selected portlet left in the workspace layout
Moves the selected portlet up in the workspace layout
Moves the selected portlet right in the workspace layout
Moves the selected portlet down in the workspace layout
Getting Here
1) Click Projects.
2) On the Projects navigation bar, click Workspace.
3) On the Workspace page, click Customize.
4) On the Workspace Details page, click the Layout tab.

Context-Sensitive Help Topics
867
Level Resources Dialog Box of the Activities Page
Overview
Use this dialog box to ensure that resource demand does not exceed resource
availability.
Screen Elements
Options tab
See Options Tab of the Level Resources Dialog Box of the Activities Page (on page
912).
Resources tab
See Resources Tab of the Level Resources Dialog Box of the Activities Page (on page
1037).
Level button
Compares the resource requirements of all scheduled activities to the maximum
quantity available at the time of leveling.
Getting Here
1) Click Projects.
2) On the Projects navigation bar, click Activities.
3) On the Activities page, click the Actions menu and select Run Leveler...
(Shift+F9).
Leveling Report Log
Overview
When you level open projects, you have the option of generating this log in a new
window. Use it to view details about the projects you just leveled.
Screen Elements
Scheduling Settings section
See Scheduling Settings Section of the Leveling Report Log (on page 1073).
Leveling Settings section
See Leveling Settings Section of the Leveling Report Log (on page 869).
Statistics section
See Statistics Section of the Leveling Report Log (on page 1092).

868
Errors section
Activities that have invalid relationship loops field: Displays a value for the specified
field in a read-only format.
Warnings section
See Warnings Section of the Leveling Report Log (on page 1154).
Leveling Warnings section
See Leveling Warnings Section of the Leveling Report Log (on page 870).
Scheduling Results section
See Scheduling Results Section of the Leveling Report Log (on page 1072).
Leveling Results section
See Leveling Results Section of the Leveling Report Log (on page 868).
Exceptions section
See Exceptions Section of the Leveling Report Log (on page 758).
Getting Here
1) Click Projects.
2) On the Projects navigation bar, click Activities.
3) On the Activities page, click the Actions menu and select Run Leveler...
(Shift+F9).
4) In the Level Resources dialog box, click the Options tab.
5) On the Options tab, select the Display leveling log upon completion and click Level.
Leveling Results Section of the Leveling Report Log
Overview
Use this section to view the results of leveling for the selected project. All fields are
read-only.
Screen Elements
Activities that cannot be Leveled field
The list of activities that the application cannot level in a read-only format.
Activities delayed by Leveling table
The ID and name of activities that have been delayed in a read-only format. Also
shows the Project ID and Project Name of the project to which the activity belongs.

Context-Sensitive Help Topics
869
Project ID field
The unique identifying code for the project.
Project Name field
The name of the project.
Activity ID field
The unique identifier of the activity.
System generated.
Activity Name field
The name of the activity. The activity name does not have to be unique.
Activities indirectly delayed by Leveling field
The activities indirectly delayed by leveling in a read-only format.
Getting Here
1) Click Projects.
2) On the Projects navigation bar, click Activities.
3) On the Activities page, click the Actions menu and select Run Leveler...
(Shift+F9).
4) In the Level Resources dialog box, click the Options tab.
5) On the Options tab, select the Display leveling log upon completion and click Level.
6) In the Leveling Report Log, expand the Leveling Results section.
Leveling Settings Section of the Leveling Report Log
Overview
Use this section to view the configuration of various leveling settings. All fields are
read-only.
Screen Elements
Preserve scheduled early and late dates option
Determines whether to retain the project's current early dates before scheduling.
Level resources only within activity total float option
Determines whether to delay activities with resource conflicts only up to their late
dates (late finish when based on finish float, late start when based on start float).
Minimum preserved float field
The minimum amount of float maintained for each activity during leveling.

870
Maximum percent to over allocate resources field
The maximum percentage by which resource availability can be increased.
Consider assignments in closed projects option
Determines whether the assignments contained in closed projects will be considered
when leveling.
Consider closed projects with Priority equal/higher than field
Determines which closed projects, based on their priority level, will be considered
when leveling.
Level all resources option
Determines whether to level all the resources within the project.
Priorities field
The value for the specified field in a read-only format.
Getting Here
1) Click Projects.
2) On the Projects navigation bar, click Activities.
3) On the Activities page, click the Actions menu and select Run Leveler...
(Shift+F9).
4) In the Level Resources dialog box, click the Options tab.
5) On the Options tab, select the Display leveling log upon completion and click Level.
6) In the Leveling Report Log, expand the Leveling Settings section.
Leveling Warnings Section of the Leveling Report Log
Overview
Use this section to view the leveling warnings for various projects.
Screen Elements
Non-driving resource assignments moved off activity dates due to leveling field
The value for the specified field in a read-only format.
Getting Here
1) Click Projects.
2) On the Projects navigation bar, click Activities.
3) On the Activities page, click the Actions menu and select Run Leveler...
(Shift+F9).

Context-Sensitive Help Topics
871
4) In the Level Resources dialog box, click the Options tab.
5) On the Options tab, select the Display leveling log upon completion and click Level.
6) In the Leveling Report Log, expand the Leveling Warnings section.
Levels Detail Window of the Risk Thresholds Page
Overview
Use this detail window to view level configurations for the selected risk threshold.
Screen Elements
Threshold Sort
Sorts the threshold name order from lowest to highest or highest to lowest.
Code field
The short name for the threshold level.
For example, a risk threshold with three levels named High, Medium, and Low, might
have the codes H, M, L to represent the level names.
Name field
The name of the threshold level.
An example of names for a threshold with three levels are High, Medium, and Low.
Range field
The user-defined range for each threshold level where the breadth of the range
specifies the amount of risk associated with the assigned level.
This field allows for text or numeric data depending on the threshold type.
Probability: The value is a percentage.
Tolerance: The value is a number.
Cost Impact: The value is the cost.
Schedule Impact: The value is a duration.
User-defined Impact: The value is text.
Color field
The color representing the threshold in the score field or probability and impact
diagram (PID).
Getting Here
1) Click the Projects menu and select Enterprise Project Data, or click the
Administer menu and select Enterprise Data.
2) In the Enterprise Data pane, expand Risks and click Risk Thresholds.
3) On the Risk Thresholds page, click the Levels detail window.

872
Limits Detail Window of the Roles Tab of the Administration Page
Overview
Use this detail window to define the units/time for the role over time.
Screen Elements
Add (Insert)
Adds a role limit row.
Delete (Delete)
Deletes or removes the currently selected data items or table rows.
Caution: Your selected data is permanently deleted once you click Save.
Role selector (Ctrl+Up Arrow) or (Ctrl+Down Arrow)
Cycles through the available roles and determines which data display in the detail
window. Click (Ctrl+Up Arrow) to move to the previous role, or click (Ctrl+Down
Arrow) to move to the next role. The content in the detail window is refreshed with the
data for the selected role.
Effective Date field
Displays the date that the corresponding units/time period goes into effect for the
role.
Max Units/Time field
The maximum work units per time this role can perform on all their assigned activities.
This number should correspond to the number of people who can fill this role.
Getting Here
1) Click Resources.
2) On the Resources navigation bar, click Administration.
3) On the Administration page, click the Roles tab.
4) On the Roles tab, click the Limits detail window.
Links to Closed Projects - Activities with Links to Closed Projects Section of the Schedule
Check Report Dialog Box
Overview
Use this section to view data for activities that have links to closed projects.

Context-Sensitive Help Topics
873
Screen Elements
Predecessor Project ID field
The identifying code for the project containing the predecessor activity that failed
the check.
Predecessor Activity ID field
The identifying code for the predecessor activity that failed the check.
Predecessor Activity Description field
The brief description of the predecessor activity.
Relationship Type field
The relationship between two activities. See About Relationships for more
information on relationship types.
Lag Duration (hours) field
The number of hours of lag duration.
Successor Project ID field
The identifying code of the project that contains the successor activity.
Successor Activity ID field
The identifying code of the successor activity.
Successor Activity Description field
The brief description of the successor activity.
Tips
Asterisks (*) are used in the report to show which activities are contained in closed
projects.
Getting Here
1) Click Projects.
2) On the Projects navigation bar, click Activities.
3) On the Activities page, click the Actions menu and select Run Check
Schedule....
4) In the Check Schedule dialog box, configure the options and click Check Schedule.
5) In the Schedule Check Report dialog box, expand the Links to Closed Projects -
Activities with links to closed projects section.

874
Logic - Activities Missing Predecessors or Successors Section of the Schedule Check Report
Dialog Box
Overview
Use this section to identify activities missing a predecessor, successor, or both. This
indicates how well or poorly the schedule is linked together.
Only a subset of all the activities in the open projects are checked. WBS summary
activities and activities with an actual finish date are removed to create the list of
activities that are checked for missing logic. In the logic check, activities with an actual
start or that are Start Milestones pass the predecessor check even if they do not have a
predecessor. Finish Milestone activities always pass the successor check even if they do
not have a successor. Activities with external predecessors or successors pass the check.
Any of the remaining activities that were found to not have a predecessor or successor
are then reported in the check. The Actual percentage is calculated as the number of
activities found that match the check divided by the number of subset activities
checked.
Screen Elements
Project ID field
The unique identifying code of the project containing the activity which failed the
check.
Activity ID field
The unique identifying code of the activity which failed the check.
Activity Description field
The brief description of the listed activity.
State field
The items that the listed activity is missing; whether predecessor, successor, or both.
Getting Here
1) Click Projects.
2) On the Projects navigation bar, click Activities.
3) On the Activities page, click the Actions menu and select Run Check
Schedule....
4) In the Check Schedule dialog box:
a. Select the Logic - Activities missing predecessors or successors option.
b. Click Check Schedule.
5) In the Schedule Check Report dialog box, expand the Logic - Activities missing
predecessors or successors section.

Context-Sensitive Help Topics
875
Long Lags - Relationships with a Lag Duration Greater Than 352 Hours Section of the
Schedule Check Report Dialog Box
Overview
Use this section to identify relationships with lags longer than than the number of hours
you specify in the Long Lags field of the Check Schedule dialog box. Lags, especially
long lags, can manipulate float and constrain a schedule.
Only a subset of all the internal and external links in the open projects are checked. Any
links between activities that both have actual finish dates are removed from the subset
to create the list of links checked for long lag. The Actual percentage is calculated as
the number of links found that match the check divided by the total number of subset
links checked.
Screen Elements
Predecessor Project ID field
The identifying code for the project containing the predecessor activity that failed
the check.
Predecessor Activity ID field
The identifying code for the predecessor activity that failed the check.
Predecessor Activity Description field
The brief description of the predecessor activity.
Relationship Type field
The relationship between two activities. See About Relationships for more information
on relationship types.
Lag Duration (hours) field
The number of hours of lag duration.
Successor Project ID field
The identifying code of the project that contains the successor activity.
Successor Activity ID field
The identifying code of the successor activity.
Successor Activity Description field
The brief description of the successor activity.
Getting Here
1) Click Projects.

876
2) On the Projects navigation bar, click Activities.
3) On the Activities page, click the Actions menu and select Run Check
Schedule....
4) In the Check Schedule dialog box:
a. Select the Long Lags - Relationships with a lag duration greater than 352 hours
option.
b. Click Check Schedule.
5) In the Schedule Check Report dialog box, expand the Long Lags - Relationships with a
lag duration greater than 352 hours section.
Manage Dashboards Page
Overview
Use this page to view all dashboards available in your user interface view and those that
are currently displayed on the Dashboards page.
Note: This page displays the global and multi-user dashboards
available to you as defined in your view settings, along with your
private, user dashboards. If you have the appropriate rights, you
can modify the list of available dashboards that display on this
page.
Screen Elements
Create Dashboard link
Enables you to create a new dashboard based on another dashboard or the default
dashboard settings.
Search field
The means to find a project.
Title field
The dashboard name. The dashboard name links to redirect the current view to the
Content tab of the Customize Dashboard page.
Filter field
The portfolio, project, or project code filter defined for the dashboard.
Available To field
Indicates the user access for each dashboard:
Global: All users can view the dashboard.
User: Only you (the currently logged on user) can access the dashboard.

Context-Sensitive Help Topics
877
Multiple Users: A select group of users, including you, have access to the
dashboard.
Created By column
The login name of the person who created the dashboard.
Date Created column
The date and time the dashboard was created.
Move Down
Moves the selected item one level down in the sort order.
Move Up
Moves the selected item one level up in the sort order.
Delete link
Removes the selected item.
Getting Here
Click the Dashboards menu and select Manage Dashboards.
Manage Portfolio Views Page
Overview
This page lists all portfolio views available to you. Use this page to create, modify, and
delete portfolio views. A portfolio view is a scorecard or chart providing high-level
information spanning an entire group of projects.
Screen Elements
Create View button
Creates a new portfolio view.
Search field
Incremental search field. As you type, the list of entries is refreshed and matching
scenario names automatically expand in the list. To reset the list, clear the search
field.
List of Entries
Arranged by the types of portfolio views

878
Title
Displays the name of the view. The list of views is organized by type: Bubble Chart,
Histogram, Pie Chart, Scorecard, Side-by-side Histogram, and Stacked Histogram. The
total number of views available for each type is displayed in parentheses.
Available to
Indicates the user access for the view:
Global: All users with module access to global portfolio views can use the view.
User: Restricted to current, specified user.
Getting Here
Click the Portfolios menu and choose Manage Portfolio Views.
Manage Portfolios Page
Overview
The Manage Portfolios page lists all global and user portfolios. Use this page to review the
list of projects inside each portfolio and to create, modify, and delete portfolios.
Screen Elements
Create Project Portfolio link
The link opens the Create Portfolio page.
Portfolios
The name of the portfolio with an icon that indicates its type.
Projects
Click to view a list of all projects contained in a selected portfolio.
Available to
Specifies whether the portfolio is available to an individual user or globally to those
with the appropriate access rights.
# of Projects
Lists the number of projects you have access to within a portfolio.
Getting Here
Click the Portfolios or Dashboards menu and choose Manage Portfolios.

Context-Sensitive Help Topics
879
Manage Scenarios Page
Overview
The Scenarios page enables you to view the list of all scenarios available to you. Use this
page to modify and delete scenarios, view or add notes for a scenario, and send e-mail
to users associated with a scenario. Each entry represents a project code, EPS node, or
portfolio and includes an identifying icon, name or title, and the number of associated
scenarios. Only entries with existing scenarios are defined.
Screen Elements
Search field
Enter information, such as title, to search for a specific scenario.
Title field
Displays the name of the scenario as a hyperlink you can click to open.
List of entries
Click to expand an entry in the list to view its scenarios.
Available To
Indicates the user access level for each scenario:
Global: all users can view the scenario.
User: only you (the currently logged on user) can access the scenario.
Multiple Users: a select group of users, including you, have access to the scenario.
Created By
The username of the person who created the scenario.
Date Created
The date and time the scenario was created.
Notes
Click to view or add notes for the scenario.
Displays options for sending information about the currently selected item to one or
more recipients via electronic mail. For user scenarios, this field is blank.
Tips
The notes you append to a scenario are not related to the application-wide
Notebooks feature.
880
Getting Here
Click the Portfolios menu and choose Manage Scenarios.
Milestone Status Portlet of the Workspace Page
Overview
Use this portlet to view the project milestones completed or due within a specified
number of days before and after the current date. Milestones are sorted by their due
dates. E-mail links let you easily contact team members associated with each milestone.
Screen Elements
Milestone Name field
The name of the milestone activity. For example, Start Foundation Phase II or Structure
Completed.
Responsible Resource field
The primary resource, if any, associated with this milestone.
Due field
The date the remaining work is scheduled to finish or, if the milestone is completed,
the actual date.
Note: The Due date that appears for milestones depends on two
factors: the Project Baseline that is currently selected and the status
of the activity.
If the current project is used as the Project Baseline, the Due date reflects the
remaining start/finish for not completed milestones and the actual start/finish for
completed milestones. Otherwise, the Due date reflects the Project Baseline
start/finish date of the milestone activity, whether completed or not.
Completed field
The actual finish date.
Displays options for sending information about the currently selected item to one or
more recipients via electronic mail.
Tips
The "No information is available" message appears in this portlet when no milestones exist
for the project, or when no milestones meet the date range criteria specified when you
configured the workspace to display this portlet.

Context-Sensitive Help Topics
881
Getting Here
1) Click Projects.
2) On the Projects navigation bar, click Workspace.
3) On the Workspace page, expand the Milestone Status portlet.
Modify Template Dialog Box of the Import/Export Project Dialog Box
Overview
Use this dialog box to create a new template or modify an existing template to
exchange data between P6 and Microsoft Project or other third-party applications.
When importing from Microsoft Project to P6, you are required to use an import file and
an import template. You can create or select and customize an import template in this
dialog box.
Screen Elements
General tab
See General Tab of the Modify Template Dialog Box of the Import/Export Project Page
(see "General Tab of the Modify Template Dialog Box of the Import/Export Project
Dialog Box" on page 808).
Activity tab
See Activity Tab of the Modify Template Dialog Box of the Import/Export Project Page
(see "Activity Tab of the Modify Template Dialog Box of the Import/Export Project
Dialog Box" on page 562).
Resource tab
See Resource Tab of the Modify Template Dialog Box of the Import/Export Project
Page (see "Resource Tab of the Modify Template Dialog Box of the Import/Export
Project Dialog Box" on page 1013).
Notebooks tab
See Notebooks Tab of the Modify Project Template Dialog Box of the Import/Export
Project Page (see "Notebooks Tab of the Modify Project Template Dialog Box of the
Import/Export Project Dialog Box" on page 906).
Custom Field Mapping tab
See Custom Field Mapping Tab of the Modify Template Dialog Box of the
Import/Export Project Page (see "Custom Field Mapping Tab of the Modify Template
Dialog Box of the Import/Export Project Dialog Box" on page 659).

882
Tips
In addition to importing entire projects into and exporting projects from P6 EPPM
version 8.0, you can import activities into a current project or export activities to a
project in P6 or another application.
The Import or Export Type must be set as Microsoft Project XML (2007) to enable the
options icons.
Getting Here
1) Click Projects.
2) On the Projects navigation bar, click EPS.
3) On the EPS page, click the Actions menu and select Import/Export XML Project
Import/Export.
4) In the Import/Export Project dialog box, click the Import or Export tab.
5) On the Import or Export tab:
a. Select Microsoft Project XML (2007) from the Import or Export Type lists.
b. Click MSP Export Template Options or MSP Import Template Options.
Module Access Detail Window of the Users Page
Overview
Use this detail window to assign module access for the selected user. Users cannot log
into P6 without one of the following module access options marked: Projects, Portfolios,
Resources, Team Member, or Enterprise Reporting. If the user only has a P6 Professional,
P6 Analytics, Progress Reporter, API, or Web Services license, they will be prompted that
they don't have a valid license.
Screen Elements
Module field
The name of each module. This field is read-only.
Enterprise Reports option
Determines user access to the Reports section in P6. By selecting this module access
option, an ODS database user is created for the P6 EPPM user as long as the user
name matches Oracle database user name requirements. For example, if the P6
EPPM user name begins with anything other than a letter, an ODS database user
cannot be created. If the P6 EPPM user name contains spaces or disallowed special
characters, they will be removed when creating the ODS database user name.
Disallowed special characters include: { } [ ] : ; < > , . ? ! @ # $ % ^ & * ( ) - _ | / \ ~ `. For
example, a P6 EPPM user name of "mgr.example.com" will be created as
"mgrexamplecom" in the ODS database. Once an ODS database user is created, the
P6 user will be able to view and run reports to which the user has access in Oracle BI
Publisher.

Context-Sensitive Help Topics
883
Notes:
If running in LDAP or SSO authentication mode and a user is
granted Enterprise Reports module access, you will not be able
to log into the ODS database directly through Oracle BI
Publisher with the P6 EPPM user name if it contains spaces or
disallowed special characters.
In order for a user to log into the ODS database directly (for
example, using SQL Plus) with the P6 EPPM user name, a system
database administrator must first reset the ODS database user's
password.
Integration API option
Determines user access to log into the PMDB database through P6 Integration API via
Java.
P6 Analytics option
Determines user access only to the Star database through Oracle Business
Intelligence. By selecting this module access option, a Star user is created for the P6
EPPM user as long as the user name matches Oracle database user name
requirements. For example, if the P6 EPPM user name begins with anything other than
a letter, a Star user cannot be created. Once a Star user is created, the user will be
able to access the Oracle Business Intelligence Dashboards application.
P6 Professional option
Determines user access to P6 Professional, including Primavera Timescaled Logic
Diagram.
Portfolios option
Determines user access to the following functionality in P6: the Portfolios section,
Project Performance portlets, the Portfolio View portlet in the Dashboards section,
document management functionality (if the Content Repository is configured), and
workflow functionality (if the Workflows Repository is configured).
Progress Reporter option
Determines user access to P6 Progress Reporter. For users who require access to P6
Progress Reporter, you must grant them either Team Member or Progress Reporter
module access.
Projects option
Determines user access to the following functionality in P6: the Projects section,
Project Performance portlets in the Dashboards section, document management
functionality (if the Content Repository is configured), and workflow functionality (if
the Workflows Repository is configured).

884
Resources option
Determines user access to the following functionality in P6: the Resources section,
Resources portlets in the Dashboards section, document management functionality
(if the Content Repository is configured), and workflow functionality (if the Workflows
Repository is configured).
Team Member option
Determines user access to P6 Progress Reporter and to limited functionality in P6, such
as the Dashboards and Projects sections (Workspace and Activities pages). For User
Interface Views, only the options on the Activity Editing tab apply to Team Members.
Access to P6 functionality is additionally determined by a user’s OBS access and
relationship to the project, that is, whether the user is assigned as a resource to
activities and designated as an activity owner. You must clear all other module
access options in order to select Team Member module access; conversely, you must
clear Team Member module access in order to select any other module access
option.
Web Services option
Determines user access to P6 Web Services, which uses open standards, including
XML, SOAP, and WSDL, to seamlessly integrate P6 EPPM functionality into other
applications. Using P6 Web Services, organizations can share P6 EPPM data between
applications independent of operating system or programming language.
Access option
Determines whether to grant access to each corresponding module.
Getting Here
1) Click the Administer menu and select User Access.
2) On the User Access page, click Users.
3) On the Users page, click the Module Access detail window.
My Activities Portlet
Overview
Use this portlet to view activities to which you are either assigned as a resource or
designated as the activity owner. The portlet displays activities based on assignment
dates and your current portlet customization settings. You can click an activity to open it.
Screen Elements
Enter Time link
Accesses P6 Progress Reporter.

Context-Sensitive Help Topics
885
Note: This link is available only with the appropriate configuration
and access rights. Contact your P6 administrator for more
information.
Activity Name field
The unique name for each activity.
Start Date field
For started activities, the actual start date. For not started activities, set to the planned
start date until the project is scheduled. When scheduled, set to the remaining early
start date.
Finish Date field
For completed activities, the actual finish date. For not started and in-progress
activities, set to the planned finish date if the project has not been scheduled. When
scheduled, set to the remaining early finish date.
Remaining Units field
The remaining Units for completing the assignment.
Calculated as Remaining Duration multiplied by Remaining Units per Time.
Primary Resource option
Determines whether the corresponding resource is the activity's primary resource.
Typically, the primary resource is the person responsible for the overall work on the
activity and for updating activity status.
Tips
The "No information is available" message appears in the My Activities portlet if you:
have no activities scheduled during the range of days specified on the Content
tab of the Dashboard Details page.
are not assigned as a resource or owner to any activities in, or do not have the
appropriate access rights to, the projects included in the portfolio, project, or
project code filter specified in the dashboard's Filter by field.
Note: If the dashboard containing the portlet is your private
dashboard, or a multi-user or global dashboard you created, you
can change the Filter by option at any time; if the dashboard is a
multi-user or global dashboard created by another user, your
ability to change the Filter by option is controlled by dashboard
settings.
Getting Here
1) Click Dashboards.

886
2) On the Dashboards page, select a dashboard.
3) On the dashboard, expand the My Activities portlet.
My Calendar Dialog Box
Overview
Use the My Calendar dialog box to view and manage your own personal resource
calendar. For example, you can:
Rename your calendar or change your base calendar.
Edit your standard work week or day, including designating special non work days.
Import appointments from outside P6.
Screen Elements
My Calendar toolbar
See My Calendar Dialog Box Toolbar (on page 1293).
Calendar tab
The Calendar tab displays work hours that can be modified. This tab is identical to the
Calendar tab of the Resource Calendar. See Calendar Tab of the Resource
Calendars Page (on page 607) for further details.
Standard Work Week tab
The Standard Work Week tab displays the length of work hours in a day as well as
calculates the total number of hours worked in a specific day. This tab is identical to
the Standard Work Week tab of the Resource Calendar. See Standard Work Week
Tab of the Resource Calendars Page (on page 1087) for further details.
Getting Here
Click the Administer menu and select My Calendar.
Note: The My Calendar link will only appear on the Administer
menu when your user access account has an Associated Resource
and that resource has a personal resource calendar.

Context-Sensitive Help Topics
887
My Calendar Portlet
Overview
Use this portlet to see a week's worth of activities that pertain to your projects. The My
Calendar portlet displays all activities that you are either assigned to as a resource or
designated as the activity owner. Display the current week or click past or future dates to
see the list of activities and milestones for the selected week. The selected week is
highlighted in blue.
Screen Elements
Calendar
The different months and activities associated with each month.
The arrows to the left display the previous month and the arrows to the right display
next month. The selected week is highlighted in blue.
Activities list
The list of activities for specified month above.Activities can be displayed and hidden
by the arrows.
Tips
Click a project or activity to view more detailed project or activity data. You can edit
details only if you have the required access rights.
Getting Here
1) Click Dashboards.
2) On the Dashboards page, select a dashboard.
3) On the dashboard, expand the My Calendar portlet.
My Documents Portlet
Overview
Use this portlet for quick access to project documents you have recently worked on or
accessed. It also enables you to create and manage private documents for your own
personal use.
By default, the My Documents portlet contains two tabs:
Recent Project Documents
My Private Documents
Screen Elements
Recent Documents tab
See Recent Documents Tab of the My Documents Portlet (on page 982).

888
Private Documents tab
See Private Documents Tab of the My Documents Portlet (with content repository) (on
page 947).
Tips
This portlet appears only if P6 is configured to use the content repository
A dashboard's Filter by selection does not apply to documents displayed in this
portlet.
A appears beside a document if it is checked out.
Documents added via P6 Professional do not appear in the Project Documents
portlet. You can access these documents from the WP & Docs tab on the Project
Documents portlet of the Project Workspace.
Getting Here
1) Click Dashboards.
2) On the Dashboards page, select a dashboard.
3) On the dashboard, expand the My Documents portlet.
My Issues Portlet
Overview
Use this portlet to view information about issues with which you are associated . The
information that appears depends on the display format and customize options you
select.
Screen Elements
Add link
Enables you to create a new project issue. You can select the issue form you want to
use to create the issue, then subsequently use the Add Issue page to record basic
issue information, such as responsible manager, owner, priority, and a description.
Customize link
Opens a dialog box with configurable options for viewing your issues. This dialog box is
identical to the Customize Issues dialog box of the Projects section. See Customize
Project Issues Dialog Box (on page 686).
Display options
Determine the format in which you want to display project issues. The display option
applies for all users who can access the Project Issues portlet.

Context-Sensitive Help Topics
889
List: this option displays issues in a list, and enables you to add, edit, or delete
issues. By default, all issues display in the List format, but you can customize the list
to display only the issues you want to see. You can also select the columns of
information you want to display, and choose how to group and sort issues in the
list.
Chart: this option enables you to graphically display issue count information based
on your customized group and filter selections. The Chart format enables you to
graphically display issue count information based on your customized group and
filter selections. When you customize the portlet, you can change these group
and filter options. You can additionally customize the portlet to specify chart type
and color options. To view group by and issue count details, move the mouse over
each bar or slice in the chart.
To view issues in Chart format, you must customize the portlet and select at least one
grouping level option; otherwise, the chart does not display. To select grouping level
options, click Customize and then click the Group tab. To rotate the display of a pie
chart, you can click and drag the chart either clockwise or counter clockwise.
Filter field
The name of the filter currently applied to the portlet. By default, all issues display, but
you can customize the portlet to apply a custom filter. If a custom filter is applied, the
filter description appears in this field, and only those issues that meet the filter criteria
appear for both the List and Chart format.
Issue Name field
The name or description of the issue.
Priority field
The level of importance assigned to the issue.
Owner field
The resource responsible for the selected issue.
If you have edit privileges, you can select a different owner. The list of available
resources you can select from depends upon your resource access security privileges.
Resolution Date field
The date the selected issue was resolved.
Status field
The current status of the issue: Open, On Hold, Closed.
E-mail field
The e-mail dialog prepopulated with issue details.

890
Tips
The "No information is available" message is displayed when no workgroup issues
have been added, or when your filtering criteria excludes existing issues.
When a project activity is associated with a workgroup issue, the issue will also appear
as a project issue on the Project Issues portlet and the Issues page. If the activity
association is removed, the issue no longer appears in the Issues portlet on the
Workgroup Workspace page; it only appears as a project issue.
Getting Here
1) Click Dashboards.
2) On the Dashboards page, select a dashboard.
3) On the dashboard, expand the My Issues portlet.
My Preferences Page
Overview
Use this page to customize options that influence all sections of the application.
Screen Elements
Global tab
See Global Tab of the My Preferences Page (on page 818).
View tab
See View Tab of the My Preferences Page (on page 1148).
Password tab
See Password Tab of the My Preferences Page (on page 917).
Getting Here
Click the Administer menu and choose My Preferences.
My Projects Portlet
Overview
Use this portlet to view projects you are the owner of, have OBS access to, or are
assigned to as a resource or as an activity owner. The portlet displays the project start
and finish dates, current percent complete, date last summarized, and the project
owner. You can click a project name link to open the project.

Context-Sensitive Help Topics
891
Screen Elements
Name field
The name of the project. The icon next to the project name indicates your association
with the project, the type of project, and its check-out status.
Start Date field
The earliest start date derived from all activities in the project baseline if the project
has not started. If the project has started or finished, this is the earliest actual start date
derived from all activities. This field is blank for new projects that have not yet been
summarized.
Finish Date field
The latest finish date derived from all activities in the project baseline if the project has
not started. If the project is in progress, this is the date the remaining work is scheduled
to end. If the project is finished, this is the latest actual finish date derived from all
activities. This field is blank for new projects that have not yet been summarized.
Percent Complete field
The duration Percent Complete for the project.
Calculated as (Planned Duration minus Remaining Duration) divided by Planned
Duration. This field is blank for projects that have not been summarized.
Last Summarized field
The date the project was last summarized. This field is blank for projects that have not
been summarized.
Project Owner field
The resource designated as responsible for the project.
The project owner designation provides a user with viewing access for the project.
Tips
The "No information is available" message appears in this portlet if you are not
associated with any projects, if no projects meet your portfolio, project, or project
code filtering criteria, or if you have cleared all of the My Projects display options on
the Dashboard Details page.
Click a project name to view more details about the project; the page that displays
when you open the project is determined by your user interface view settings.
Depending on the settings defined in your view, you might be able to change your
view preferences.
Getting Here
1) Click Dashboards.
2) On the Dashboards page, select a dashboard.

892
3) On the dashboard, expand the My Projects portlet.
My Reviews Tab of the Document Reviews Portlet
Overview
Use this tab to display a list of all document reviews that you have created along with
their initiation date and due date.
Screen Elements
My Reviews Tab toolbar
See My Reviews Toolbar (on page 1294).
Name field
The name of the review. This field displays the selected document's name by default.
Initiator field
The name of the user who initiated the review.
Date Initiated field
The date and time the review was initiated.
Due Date field
The date all reviewers need to complete the review. If no due date is specified for the
review, then this field appears blank.
Status field
The current status of the document.
Tips
If you have not created any document reviews, the "No information is available"
message displays.
Getting Here
1) Click Dashboards.
2) On the Dashboards page, select a dashboard.
3) On the dashboard, expand the Document Reviews portlet and click the My Reviews
tab.

Context-Sensitive Help Topics
893
My Risks Portlet
Overview
Using your portfolio, project, or project code filter criteria specified for the current
dashboard, the My Risks portlet displays information about your associated risks. You can
customize the portlet to specify the columns of information you want to display, as well as
the types of risks you want to appear.
Screen Elements
Customize link
Specifies the columns of information you want to display and filters risks based on
status.See Customize Risks Dialog Box (on page 690).
Name field
The name of the risk.
ID field
The unique identifier for the risk.
Category field
The name for a particular type of risk classification. Use risk categories to identify and
organize project risks consistently throughout your organization.
Technical, Operational, External are examples of risk categories that might apply to a
typical project.
Owner field
The resource that has ownership of the risk.
Description field
The description of the risk.
Cause field
The description of the cause of the risk.
Effect field
The resulting effect of the presence of the risk.
Notes field
The notes or comments entered for the associated with the risk.
Status field
The current state of the risk. Valid values are:
Proposed: The risk is identified and awaits approval.

894
Open: The risk is approved as a valid risk to the project.
Active: The risk is currently impacting the project.
Rejected (Closed): The risk is not seen as a valid risk to the project and therefore
will not be tracked and managed by the project. The data for this risk cannot be
modified once it is closed.
Managed (Closed): The risk occurred and was successfully managed by the
project team and is no longer an active risk. The data for this risk cannot be
modified once it is closed.
Impacted (Closed): The risk occurred, impacted the project and is no longer an
active risk. The data for this risk cannot be modified once it is closed.
Type field
The classification of the risk as a threat or an opportunity.
A threat will have a negative impact on your project, while an opportunity can have
a perceived benefit to the project.
User Defined field
Fields defined by your P6 administrator that are not standard in the application, but
are necessary to capture additional data for the project or the company.
Tips
The "No information is available" message appears when your project and risk filtering
criteria excludes risks that are associated with you, or when you don't have risks
associated with you.
Getting Here
1) Click Dashboards.
2) On the Dashboards page, select a dashboard.
3) On the dashboard, expand the My Risks portlet.
My Workflows Tab of the Workflows Portlet
Overview
Use this tab to monitor workflows where you are assigned as a reviewer, owner, or
initiator, and have been granted permission in BPM to access all stages of the workflow.
Screen Elements
My Workflows toolbar
See My Workflows Toolbar (on page 1294).
Days Pending field
The total number of days the workflow has been assigned and awaiting action.

Context-Sensitive Help Topics
895
Calculated as the Current Date minus the Assigned Date of the oldest currently
assigned human task for the currently logged in user.
Due Date field
The deadline for this workflow and all its tasks based on predefined expectations for
workflows within this particular business process.
ID field
The unique numeric identifier for each workflow instance.
Initiated Date field
The date the workflow instance was originally initiated.
Instance field
The unique name assigned to each individual instance of the original predefined
workflow.
Formatted as "Instance Name of Process Name."
Initiator field
The name of the person who initiated the request.
Last Modified By field
The Personal Name of the user associated with the most recent changes to any of the
tasks within the workflow or to the workflow itself. This includes workflow initiation, and
task claiming, reassigning, approving, escalating, and other actions. This field displays
the value Workflowsystem if the change was made by another application or system
event.
Last modified date field
The date when this workflow was most recently changed. The most recent change to
any task within this workflow is reflected in this date.
Name field
The name of the predefined or master workflow. The workflows that appear in the My
Workflows tab are instances or copies of this original predefined workflow.
Pending Tasks field
The total number of pending tasks for the current stage of the workflow.
Pending User field
The name of the user, role, or group of users assigned to the oldest pending task
holding up the workflow's advancement to the next stage.
Priority field
The current priority of the workflow instance.

896
Category or Process field
The name of the original workflow type or template from which this instance of the
workflow is derived. When multiple tasks share the same or similar names, refer to this
field to view the originating or parent workflow.
Stage field
The name of the current workflow phase. The stage also provides an indication of the
workflow's current progress within the total sequence of all its defined phases. For
example, Stage 1: Just Initiated vs. Stage 5: Final Review.
Status field
The current state of the workflow instance.
Values include In Progress (in process), Failed (completed with errors), Approved
(completed), and Rejected (aborted). The names in parentheses are the BPM values.
Getting Here
1) Click Dashboards.
2) On the Dashboards page, select a dashboard.
3) On the dashboard, expand the Workflows portlet.
4) In the Workflows portlet, click the My Workflows tab.
My Workgroups Portlet of the Dashboards Page
Overview
Use this portlet to view, by project, all workgroups with which you are associated.
Worgkgroups are organized by project.
Note: You cannot add or delete workgroups from the My
Workgroups portlet.
Screen Elements
Workgroup Name field
Displays the name of the project and each workgroup associated with each project.
Click beside the project name to display all associated workgroups. Click to
hide the workgroups. Click the project name to open the Project Workspace page;
see Workspace Page (on page 1172). Click the workgroup name to open the
Workgroup Workspace page; see Workgroup Workspace Page.

Context-Sensitive Help Topics
897
Tips
The Workgroups portlet is the only portlet on the Project workspace that displays
information based on your association to the workgroup; other Project Workspace
portlets display the same information to all members of the project team who can
access the workspace.
Project Workspace portlets display data for the selected project only. When multiple
projects are open, you must choose the project you want to work with in the Select
Project box at the top right of the Project Workspace. When a single project is open,
the Select Project box does not appear.
The "No information is available" message displays in the My Workgroups and
Workgroups portlets when you are not associated with any workgroups.
Getting Here
1) Click Dashboards.
2) On the Dashboards page, select a dashboard.
3) On the dashboard, expand the My Workgroups portlet.
Negative Float - Activities with a Total Float Less Than 0 Section of the Schedule Check Report
Dialog Box
Overview
Use this section to view activities with negative float. Negative float can occur when a
constraint or actual date creates a schedule that is shorter than the duration calculated
to complete the activities on the critical path. Activities with negative float are critical.
Only a subset of the activities in the open projects are checked. WBS summary activities,
activities with an actual finish date, and Level of Effort activities are removed from the
subset to create the list of activities checked for negative float. The Actual percentage is
calculated as the number of activities found that match the check divided by the total
number of subset activities checked.
Screen Elements
Project ID field
The unique identifying code of the project containing the activity which failed the
check.
Activity ID field
The unique identifying code of the activity which failed the check.
Activity Description field
The brief description of the listed activity.

898
Total Float (hours) field
The total number of hours an activity can be delayed before the project is delayed.
Zero hours indicate that the activity cannot be delayed at all and negative float
indicates that the project is already behind schedule.
Getting Here
1) Click Projects.
2) On the Projects navigation bar, click Activities.
3) On the Activities page, click the Actions menu and select Run Check
Schedule....
4) In the Check Schedule dialog box:
a. Select the Negative Float - Activities with a total float less than 0 option.
b. Click Check Schedule.
5) In the Schedule Check Report dialog box, expand the Negative Float - Activities with
a total float less than 0 section.
Negative Lags - Relationships with a Lag Duration of Less Than 0 Section of the Schedule
Check Report Dialog Box
Overview
Use this section to identify relationships with negative lags. Negative lags can affect
critical path and distort total float. When activity durations change, activities with
negative lag can be scheduled unrealistically. Negative lags can be used to schedule
overlapping activities. For example, when digging a trench, workers can start laying pipe
in the completed sections of the trench while the rest of the trench is still in progress. To
avoid the distortion that negative lag can cause, you might consider using positive lag
on a Start to Start relationship rather than a negative lag on a Finish to Start relationship.
Only a subset of all the internal and external links in the open projects are checked. Any
links between activities that both have actual finish dates are removed from the subset
to create the list of links checked for negative lag. The Actual percentage is calculated
as the number of links found that match the check divided by the total number of subset
links checked.
Screen Elements
Predecessor Project ID field
The identifying code for the project containing the predecessor activity that failed
the check.
Predecessor Activity ID field
The identifying code for the predecessor activity that failed the check.

Context-Sensitive Help Topics
899
Predecessor Activity Description field
The brief description of the predecessor activity.
Relationship Type field
The relationship between two activities. See About Relationships for more
information on relationship types.
Lag Duration (hours) field
The number of hours of lag duration.
Successor Project ID field
The identifying code of the project that contains the successor activity.
Successor Activity ID field
The identifying code of the successor activity.
Successor Activity Description field
The brief description of the successor activity.
Getting Here
1) Click Projects.
2) On the Projects navigation bar, click Activities.
3) On the Activities page, click the Actions menu and select Run Check
Schedule....
4) In the Check Schedule dialog box:
a. Select the Negative Lags - Relationships with a lag duration of less than 0 option.
b. Click Check Schedule.
5) In the Schedule Check Report dialog box, expand the Negative Lags - Relationships
with a lag duration of less than 0 section.
Notebook Details Page of the Activity Form Page
Overview
Use this page to view, update, or remove the activity notebook topics.
Screen Elements
Remove Assignment link
Removes the notebook assignment.
Getting Here
From the Workgroup Workspace page:

900
1) Click Projects.
2) On the Projects navigation bar, click Workspace.
3) On the Workspace page, expand any portlet containing activities.
4) In the portlet, click an activity.
5) On the Activity Form page, expand the Notebook section and select a notebook
topic.
From the Dashboards page:
1) Click Dashboards.
2) On the Dashboards page, select a dashboard tab.
3) On the dashboard tab, expand any portlet containing activities.
4) In the portlet, click an activity.
5) On the Activity Form page, expand the Notebook section and select a notebook
topic.
Notebook Section of Activity Details of the Resources Dialog Box
Overview
Use this section to view notebook topics associated with the activity, along with
descriptive text.
Screen Elements
Assign Notebook Topic link
Opens a dialog box to search for and select a notebook topic to assign. See Working
with 'Select a Value' Dialog Boxes for further details of use of this dialog box.
Topic Name field
The name of the notebook topic. Click to display the work area for modifying the
description field. See Text Editor Toolbar (on page 1352) for further details.
Description field
A more detailed summary for the item. The description provides more information
than short names or titles. It can give background information or establish a purpose
for the item. These details help differentiate between items with similar names and are
especially useful in multi-user environments.
Getting Here
From the Team Usage page:
1) Click Projects.
2) On the Projects navigation bar, click Team Usage.

Context-Sensitive Help Topics
901
3) On the Team Usage page:
a. If more than one project is open, select a project from the Select Project list.
b. Click the Organized By list and select Roles.
1. Expand a project and select a role in the left pane.
2. Select the Spreadsheet option and click a project in the right pane.
4) In the Resources dialog box:
a. Click the Unstaffed and Staffed option to show all activities.
b. Click an activity name.
5) On the Activity Details page, expand the Notebook section.
From the Dashboards page:
1) Click Dashboards.
2) On the Dashboards page, expand the Open Requests for Resources portlet and
select a project or a role name depending on your customization options.
3) On the Resource Staffing Details page:
a. Click the Unstaffed and Staffed option.
b. Select an activity.
4) On the Activity Details page, expand the Notebook section.
Notebook Section of the Activity Details Dialog Box
Overview
Use the Notebook section of the Activity Details dialog box to view notebook topics
associated with the activity, along with descriptive text.
Screen Elements
Assign Notebook Topic link
Displays a dialog box to search for and select a notebook topic to assign. See
Selection Dialog Boxes for further details of use of this dialog box.
Topic Name field
The name of the notebook topic. Click to display the work area for modifying the
description field. See Text Editor Toolbar (on page 1352) for further details.
Description field
A more detailed summary for the item. The description provides more information
than short names or titles. It can give background information or establish a purpose
for the item. These details help differentiate between items with similar names and are
especially useful in multi-user environments.

902
Getting Here
1) Click Resources.
2) On the Resources navigation bar, click Analysis.
3) On the Analysis page, click the Role Usage tab.
4) On the Role Usage tab, select a role and select to display the Spreadsheet.
5) On the Spreadsheet, click a project name.
6) In the Resource Staffing dialog box, click an activity name then expand the Notebook
section.
Notebook Section of the Activity Form Page
Overview
Use this section to view notebook topics associated with the activity, along with
descriptive text.
Screen Elements
Assign Notebook Topic link
Opens a dialog box to search for and select a notebook topic to assign. See Working
with 'Select a Value' Dialog Boxes for further details of use of this dialog box.
Topic Name field
The name of the notebook topic.
Description field
A more detailed summary for the item. The description provides more information
than short names or titles. It can give background information or establish a purpose
for the item. These details help differentiate between items with similar names and are
especially useful in multi-user environments.
Getting Here
From the Workgroup Workspace page:
1) Click Projects.
2) On the Projects navigation bar, click Workspace.
3) On the Workspace page, expand any portlet containing activities.
4) In the portlet, click an activity.
5) On the Activity Form page, expand the Notebook section.
From the Dashboards page:
1) Click Dashboards.
2) On the Dashboards page, select a dashboard tab.
Context-Sensitive Help Topics
903
3) On the dashboard tab, expand any portlet containing activities.
4) In the portlet, click an activity.
5) On the Activity Form page, expand the Notebook section.
Notebook Topics Page
Overview
Use this page to add and configure notebook topics.
Screen Elements
Notebook Topics toolbar
See Enterprise Data Notebook Topics Toolbar (on page 1270).
Topic Name field
This field displays available topic names.
EPS option
Determines whether the selected notebook topic is available for assignment to an
EPS node.
Project option
Determines whether the selected notebook topic is available for assignment to a
project.
WBS option
Determines whether the selected notebook topic is available for assignment to a
WBS.
Activity option
Determines whether the selected notebook topic is available for assignment to an
activity.
Getting Here
1) Click the Projects menu and select Enterprise Project Data, or click the
Administer menu and select Enterprise Data.
2) In the Enterprise Data pane, expand Projects and click Notebook Topics.

904
Notebook Topics Portlet of the Workspace Page
Overview
Use this portlet to review notebook descriptions for all projects within the open project
group. Notebooks are used to set up general categories for information relating to
activity, project, EPS, and WBS notes. You can use HTML editing features to modify
notebooks.
Screen Elements
Notebook Topic field
The name of the notebook topic. Click the name of a notebook topic to edit the
description using the work area and Text Editor Toolbar. See Text Editor Toolbar (on
page 1352) for further details.
Description field
A more detailed summary for the item. The description provides more information
than short names or titles. It can give background information or establish a purpose
for the item. These details help differentiate between items with similar names and are
especially useful in multi-user environments.
Getting Here
1) Click Projects.
2) On the Projects navigation bar, click Workspace.
3) On the Workspace page, expand the Project Notebook Topics portlet.
Notebooks Detail Window of the Activities Page
Overview
Use this detail window to assign a notebook topic to an activity, view, add, or assign a
notebook topic, or remove a topic assignment.
Screen Elements
Notebooks toolbar
See Notebooks Toolbar (on page 1295).
Topic field
The name of the assigned topic.

Context-Sensitive Help Topics
905
Description field
A more detailed summary for the item. The description provides more information
than short names or titles. It can give background information or establish a purpose
for the item. These details help differentiate between items with similar names and are
especially useful in multi-user environments.
Tips
If you have more than one activity selected, the detail window will not be visible.
Getting Here
1) Click Projects.
2) On the Projects navigation bar, click Activities.
3) On the Activities page, select an activity and click the Notebooks detail window.
Notebooks Detail Window of the EPS Page
Overview
Use this detail window to configure notebook topics and descriptions for the selected
project.
Screen Elements
Notebooks toolbar
See Notebooks Toolbar (on page 1295).
Topic field
The name of the associated notebook topic.
Description field
A more detailed summary for the item. The description provides more information
than short names or titles. It can give background information or establish a purpose
for the item. These details help differentiate between items with similar names and are
especially useful in multi-user environments.
Tips
If you have more than one project selected, the detail window will not be visible.
Getting Here
1) Click Projects.
2) On the Projects navigation bar, click EPS.
3) On the EPS page, select a project and click the Notebooks detail window.

906
Notebooks Tab of the Modify Project Template Dialog Box of the Import/Export Project Dialog
Box
Overview
Use this tab of the to select the notebook topics you want to use to exchange data with
Microsoft Project notes. Notes from the import file are imported into the selected
notebook topics. Data from the notebook topics are exported to Microsoft Project notes.
Screen Elements
Project notes list
The Microsoft Project notebook topic to exchange data with a project notebook.
WBS notes list
The Microsoft Project notebook topic to exchange data with a P6 WBS notebook.
Activity notes list
The Microsoft Project notebook topic selected to exchange data with an activity
notebook.
Export all notebook topics to Microsoft Project note option
Determines whether to export all notebook topics associated with the project, WBS, or
activity to the notes field in Microsoft Project.
For export, this option overrides the previously-selected notebook topics.
Tips
The Import or Export Type must be set as Microsoft Project XML (2007) to enable the
options icons.
Getting Here
1) Click Projects.
2) On the Projects navigation bar, click EPS.
3) On the EPS page, click the Actions menu and select Import/Export XML Project
Import/Export.
4) In the Import/Export Project dialog box, click the Import or Export tab.
5) On the Import or Export tab:
a. Select Microsoft Project XML (2007) from the Import or Export Type list.
b. Click MSP Export Template Options or MSP Import Template Options.
6) In the Modify Template dialog box, click the Notebooks tab.

Context-Sensitive Help Topics
907
Notes Detail Window of the Resources Tab of the Administration Page
Overview
Use this detail window to add, view, or update notes describing a resource.
Screen Elements
Text Editor Toolbar
See Text Editor Toolbar (on page 1352).
Work area
The area where you can enter a note. Use the Text Editor Toolbar (on page 1352) to
modify text.
Getting Here
1) Click Resources.
2) On the Resources navigation bar, click Administration.
3) On the Administration page, click the Resources tab.
4) On the Resources tab, click the Notes detail window.
Notes Detail Window of the Risks Page
Overview
Use this detail window to write notes about the selected risk.
Screen Elements
Text Editor toolbar
See Text Editor Toolbar (on page 1352).
Work area
Use this area to enter text and modify it using the Text Editor Toolbar.
Getting Here
1) Click Projects.
2) On the Projects navigation bar, click Risks.
3) On the Risks page, click the Notes detail window.

908
OBS Page
Overview
Use this page to configure the organizational breakdown structure (OBS) for your
enterprise.
Screen Elements
OBS toolbar
See User Access OBS Toolbar (on page 1356).
OBS Name field
The unique name for the OBS element. OBS elements represent responsible managers
arranged in a hierarchy.
Description field
The description that corresponds with the OBS name.
Responsibility detail window
See Responsibility Detail Window of the OBS Page (on page 1041).
Users detail window
See Users Detail Window of the OBS Page (on page 1140).
Description detail window
See Description Detail Window of the OBS Page (on page 711).
Getting Here
1) Click the Administer menu and select User Access.
2) On the User Access page, click OBS.
Open a Request for a Resource Dialog Box
Overview
Use this dialog box to search for a resource to assign to an activity.
Screen Elements
Find a resource matching options
Determines what criteria is used in your search:
All search criteria: Finds a resource based on all selections of search criteria that
you select from or enter in the fields of the dialog box.
Any search criteria: Finds a resource based on a random criteria search.

Context-Sensitive Help Topics
909
Roles field
The name of the roles to use in the search. Unless you specify only one resource and
no other criteria, you must specify a primary role. When a single resource is selected
with no other criteria, the search criteria will include the primary role of the resource
you specify. If that resource does not have a primary role, a message displays to ask
you to select a primary role.
Proficiency field
The resource's proficiency at performing this role.
The values are 1 - Master, 2 - Expert, 3 - Skilled, 4 - Proficient, and 5 - Inexperienced. If
you do not have the proper privilege, you cannot access this field.
Resources field
The names of specific resources to use in the search.
The displayed hierarchy includes only those resources that belong to your access
node, based on resource security, and current project resources. If you chose the
option to show results that match all criteria, you can specify only one resource.
Resource Codes field
The specific codes to use in the search. If you chose the option to show results that
match all criteria, you can specify only one code value for each resource code you
select.
Getting Here
1) Click Resources.
2) On the Resources navigation bar, click Assignments.
3) On the Assignments page:
a. Click the resource.
b. Click the Yes or No link in the Search Criteria column.
Note: If the Search Criteria column is not visible, click Customize
Columns. In the Customize Columns dialog box, expand General
and double-click Search Criteria to move the column to the
Selected Columns list. Click OK.
Open a Request for a Resource Dialog Box of the Assignments Detail Window of the Activities
Page
Overview
Use this dialog box to search for a resource to assign to an activity.

910
Screen Elements
Find a resource matching options
Determines what criteria is used in your search:
All search criteria: Finds a resource based on all selections of search criteria that
you select from or enter in the fields of the dialog box.
Any search criteria: Finds a resource based on a random criteria search.
Roles field
Determines the organizational roles to use as criteria in searching for a resource.
Proficiency field
The resource's proficiency at performing this role.
The values are 1 - Master, 2 - Expert, 3 - Skilled, 4 - Proficient, and 5 - Inexperienced. If
you do not have the proper privilege, you cannot access this field.
Resources field
The resource assigned to a task.
Resource Codes field
The search query for a resource by resource code.
Primary Role field
The name of the primary job title or skill for the resource.
Getting Here
1) Click Projects.
2) On the Projects navigation bar, click Activities.
3) On the Activities page, select an activity and click the Assignments detail window.
4) In the Assignments detail window, click Request Resources (Ctrl+Alt+Q).
Open Portfolio Dialog Box
Overview
Use the Open Portfolio dialog box to open a group of projects by EPS, code, or portfolio.
After opening a portfolio, the application will continue to open that same portfolio
whenever you click Portfolios.
Screen Elements
Group by
View the project groups by EPS, portfolio, or project code. Select an option from the
menu:

Context-Sensitive Help Topics
911
EPS: Each EPS node contains projects that belong to a specific organizational entity
defined by your administrator at the corporate or strategic level.
Portfolio: Each portfolio contains projects specified manually by the portfolio
creator or automatically according to filter criteria. The list of portfolios available for
you to open includes all global portfolios, portfolios created by other users you have
rights to access, and all portfolios you created.
Project Codes: Each project code group contains projects that have been
assigned to a specific user-defined code, or category, by your administrator at the
corporate or strategic level.
Columns
Displays a menu of the available fields you can show or hide as columns in the current
table.
Search (Ctrl+F)
Displays options for finding a specific matching entry or entries based on search
criteria.
Getting Here
Click the Portfolios menu and choose Open Portfolio.
Open Projects Dialog Box
Overview
Use this dialog box to limit the volume of information appearing in the Projects section to
only the current project or projects of most interest to you. You can search, identify, and
select any number of projects to open. If you specify a portfolio, EPS node, or project
code to open, every project you have access to in this group will open.
This dialog box is also used to open project templates.
Screen Elements
Open Projects dialog box toolbar
See Open Projects Dialog Box Toolbar (on page 1296).
Available Projects and Selected Projects sections
See Configuring Columns or Values.
Description section
The brief summary of the item at hand. The field or section might be editable.

912
Tips
To limit the number of projects that display in the dialog box, enter the value you want in
the Maximum number of rows displayed in trees and pick lists field in Global Preferences.
Getting Here
Click the Projects menu and select Open Projects.
Open Requests for Resources Portlet
Overview
Use this portlet to view the staffing for projects to which you are associated.
Screen Elements
Name field
The names of the unstaffed roles for the current role team, organized and filtered
according to your portlet preferences. Each project or role name is a link that displays
the activities for the role and enables you to access the resource staffing features.
Unstaffed Units field
The total units that require resource assignments for each role. Units for all roles are
totaled at the level you organize by.
Staffed Units field
The total units currently assigned to individual resources for each role.
Getting Here
1) Click Dashboards.
2) On the Dashboards page, select a dashboard.
3) On the dashboard, expand the Open Requests for Resources portlet.
Options Tab of the Level Resources Dialog Box of the Activities Page
Overview
Use this tab to configure leveling options and priorities.
Screen Elements
Consider assignments in other projects with priority equal or higher than field
The numeric priority level used when considering assignments in other projects during
the leveling process.

Context-Sensitive Help Topics
913
For example, if resources are assigned across multiple projects, you can determine
whether to consider the resource assignments in other projects when leveling. A
leveling priority number is assigned to each project. In the Level Resources dialog box,
mark the option to consider assignments in other projects and specify the priority
value you want to consider.
Preserve scheduled early and late dates option
Determines whether early and late dates are preserved as scheduled or adjusted
during the leveling process.
If you mark this option, the project’s current early dates are retained before leveling.
To review the leveled early dates, select to show the Remaining Start/Finish dates or
the Start and Finish dates. In addition, when you preserve these dates, the module
only forward-levels the schedule, which means that the early dates of activities from
the start to the finish of the project are scheduled.
If you clear this option, the application also performs backward leveling. Backward
leveling schedules activities to occur as late as possible without delaying the project
finish. The application reverses the leveling process, beginning at the project’s late
finish and working towards the beginning of the project. If insufficient resources are
available to schedule an activity on its late dates, the activity is advanced to an
earlier date. When the schedule is leveled forward and backward (by clearing the
option) the project’s early and late start/finish dates are updated.
Level resources only within activity total float option
Determines whether to delay activities with resource conflicts only up to their late
dates (late finish when based on finish float, late start when based on start float).
Preserve minimum activity float field
The minimum amount of total float you want to maintain for each activity during
leveling.
Maximum percent to over allocate resources field
The maximum percentage by which resource availability can be increased.
Recalculate assignment costs when leveling option
Determines whether to recalculate the costs of assignments when leveling.
Display leveling log upon completion option
Determines whether to display the leveling log when leveling is complete.
Leveling Priorities table
The priorities associated with the resources and the sort order for each.
Your priorities are used to handle scheduling conflicts that might occur during
leveling, and determine which project or activity is leveled first. The table displays the
type of priority, and the order in which the item specified in the priority is leveled.
914
Add Leveling Priority
Creates a new leveling priority row in the Leveling Priorities table.
Delete
Deletes the selected item or items permanently.
Field Name field
The fields considered to be leveling priorities.
Sort Order list
Determines whether the application sorts values in ascending or descending order.
Getting Here
1) Click Projects.
2) On the Projects navigation bar, click Activities.
3) On the Activities page, click the Actions menu and select Run Leveler...
(Shift+F9).
4) In the Level Resources dialog box, click the Options tab.
Options Tab of the Report Settings Dialog Box
Overview
Set the options on this tab to determine how your scheduled report output will be
generated, formatted, and delivered.
Screen Elements
Report Name field
The title for the report defined in BI Publisher.
Schedule Name field
The name for the report schedule. A single report will have multiple schedule names.
For example, an original source report named Quality Report can be scheduled and
given the following schedule names: Weekly Quality Report, Monthly Team Quality
Report, and Region 3 Quality Report.
Template list
The template you want to use to apply style to the report data.
Format list
The file formats that you can use for file output.

Context-Sensitive Help Topics
915
Delivery Type field
The way users will access or take delivery of this report. On-demand reports can be
delivered by electronic mail as attachments or downloaded as files. You can only
deliver scheduled reports by electronic mail.
E-mail Options button
Launches the E-mail Options dialog box used to enter all e-mail recipients for the
selected report.
Notification options
Determines the types of e-mail status notifications the user who scheduled the report
should receive when the scheduled report attempts to run.
Report Completed option: Determines whether e-mail is sent if the report is delivered
without errors.
Report Complete with warnings option: Determines whether e-mail is sent if the report
is delivered, but has errors.
Report Failed option: Determines whether e-mail is sent if the report failed to run.
Report Parameters table
If a report has field parameters predefined in BI Publisher, they will appear here in P6. You
must specify report parameter values in order to generate valid output. For example, a
weekly timesheet compliance report would require that you specify the start and finish
dates for the target period of the report.
Caution: To avoid system performance issues, be as specific as
possible when entering values for reports. Narrow down your
choices to include only what is absolutely necessary.
Field Name field
The key field used by P6 to construct valid data for each specific instance of report
output.
Value field
The parameter value for the field shown in the field Name column. The field changes
to a picklist, date editor, check box, combo box, or a text field depending on the
settings pre-defined for the field Name. The data entered in a text field must be
accurate, otherwise the report will fail to run.
Example: Jay in Accounting would like to run a report showing
data derived from three active projects, X, Y, and Z. Janice, VP of
Strategic Development, wants the same report but is only
concerned at the moment with Project Y. They each
independently schedule the same report; however, they specify
different report parameter values for Project ID:
916
Jay: Project X, Project Y, Project Z
Janice: Project Y
Getting Here
1) Click Reports.
2) On the Reports page:
a. Click View and select Reports.
b. Select a report, and then click the Schedule detail window.
3) In the Schedule detail window, click Add (Insert).
4) In the Report Setting dialog box, click the Options tab.
Overallocated Resources Portlet of the Workspace Page
Overview
Use this portlet to view the name and role of each project resource that is overallocated.
You can click on a resource name to view allocation details.
Screen Elements
View Project team link
Redirects you to the Team Usage page.
Resource Name field
The name of a resource who is overallocated for the current project.
Roles on Project field
The resource's assigned roles for the project.
Tips
The No information is available message displays when there are no overallocated
resources for the project.
Getting Here
1) Click Projects.
2) On the Projects navigation bar, click Workspace.
3) On the Workspace page, expand the Overallocated Resources portlet.
Overhead Codes Page
Overview
Use this page to add, configure, and export overhead codes.

Context-Sensitive Help Topics
917
Screen Elements
Overhead Codes toolbar
See Enterprise Data Overhead Codes Toolbar (on page 1271).
Name field
This field displays the overhead code name.This field can be modified by
double-clicking on a select code.
Description field
The description of the overhead code.
Getting Here
1) Click the Administer menu and select Enterprise Data.
2) In the Enterprise Data pane, expand Global and click Overhead Codes.
Password Tab of the My Preferences Page
Overview
Use this tab to change your own password.
Screen Elements
Current Password field
Enter the current password for the selected user.
New Password field
When the Password Policy is disabled in Application Settings, the password must be
between 1 and 20 characters. P6 EPPM does not allow blank passwords.
When the Password Policy is enabled in Application Settings, the password must
be between 8 and 20 characters and contain at least one number and one letter.
Confirm New Password field
To confirm the change, enter the new password.
When the Password Policy is disabled in Application Settings, the password must be
between 1 and 20 characters. P6 EPPM does not allow blank passwords.
When the Password Policy is enabled in Application Settings, the password must
be between 8 and 20 characters and contain at least one number and one letter.
Tips
You cannot change passwords if you are running P6 EPPM in LDAP or SSO
authentication mode.

918
Getting Here
1) Click the Administer menu and select My Preferences.
2) On the My Preferences page, click the Password tab.
Performance Threshold Section of the Content Tab of the Workspace Page
Overview
Use this section to specify parameters for Performance, Earned Value, and Index values
that appear in project performance portlets. The values you specify determine which
visual indicators apply to each metric.
Screen Elements
Performance section
Use the options in this section to define what is considered Exceptional, Warning, or
Critical when assessing schedule performance for a project, WBS, or EPS. The values
you specify determine which indicators apply to the Schedule to date, Labor units to
date, Schedule at completion, and Labor units at completion metrics.
Exceptional: For schedule values, the minimum number of days that the
project, WBS, or EPS must be ahead of schedule to be considered exceptional. For
labor units, the minimum percentage under 100 that the labor units variance must
be less than to display the exceptional indicator. For example, if you set the
exceptional threshold at 10% and the actual labor units variance is 85%, then that
item would be considered exceptional.
Warning: For a schedule value, the minimum number of days that the project,
WBS, or EPS must be behind schedule to display the warning indicator. For labor
units, the minimum percentage over 100 that the labor units variance must be
greater than to display the warning indicator.
Critical: For a schedule value, the minimum number of days that the project,
WBS, or EPS must be behind schedule to display the critical indicator. For labor
units, the minimum percentage over 100 that the labor units variance must be
greater than to display the critical indicator.
Some examples of threshold percentage calculations are as follows:
Labor units to date: (Earned Value Labor Units minus Actual Labor Units) divided by
Earned Value Labor Units
Labor units at completion: (Budget At Completion Labor Units minus Estimate At
Completion Labor Units) divided by Budget At Completion Labor Units
Earned Value section
Use the options in this section to define what is considered Exceptional, Warning, and
Critical when assessing earned value performance for a project, WBS, or EPS. The
values you specify determine which indicators apply to the Schedule to date, Labor
units to date, Schedule at completion, and Labor units at completion metrics.

Context-Sensitive Help Topics
919
Exceptional: The minimum percentage under 100 that the schedule or labor
units variance must be less than to display the exceptional indicator. For example,
if you set the exceptional threshold at 10% and the actual earned value variance
is 85%, then that item would be considered exceptional.
Warning: The minimum percentage over 100 that the schedule or labor units
variance must be greater than to display the warning indicator.
Critical: The minimum percentage over 100 that the schedule or labor units
variance must be greater than to display the critical indicator.
Some examples of threshold percentage calculations are as follows:
Schedule to date: (Earned Value Labor Units minus Planned Value Labor Units)
divided by Planned Value Labor Units
Labor units to date: (Earned Value Labor Units minus Actual Labor Units) divided by
Earned Value Labor Units
Schedule at completion: (Budget At Completion multiplied by Schedule Variance
Index) divided by Budget At Completion
Labor units at completion: (Budget At Completion Labor Units multiplied by Cost
Variance Index) divided by Budget At Completion Labor Units
Index section
Use the options in this section to define what is Exceptional, Warning, and Critical
when assessing index performance. The values you specify determine which
indicators apply to the Cost Performance Index (CPI), Schedule Performance Index
(SPI), and To Complete Performance Index (TCPI).
Exceptional: The minimum percentage over 100 that the index variance must
be greater than to display the exceptional indicator. For example, if you set the
exceptional threshold at 10% and the actual index variance is 115%, then that
item would be considered exceptional.
Warning: The minimum percentage under 100 that the index variance must be
less than to display the warning indicator.
Critical: The minimum percentage under 100 that the index variance must be
less than to display the critical indicator.
Some examples of percentage calculations are as follows:
CPI: Earned Value divided by Actual Units
SPI: Earned Value divided by Planned Value
TCPI: (Budget At Completion minus Earned Value) divided by (Estimate At
Completion minus Actual Units)
Getting Here
1) Click Projects.
2) On the Projects navigation bar, click Workspace.
3) On the Workspace page, click Customize.

920
4) On the Customize page, click the Content tab.
5) On the Content tab, expand the Performance Threshold section.
Performance Threshold Section of the Global Tab of the My Preferences Page
Overview
Use this section to specify parameters for Performance, Earned Value, and Index values
that appear in dashboard Project Performance portlets and on the Portfolios
Performance Status tab. The settings you specify in Global Preferences only apply to the
dashboard portlets; for each project, you can specify project-specific Performance
Threshold settings when you customize the project Workspace.
Screen Elements
Performance section
Use the options in this section to define what is considered Exceptional, Warning, or
Critical when assessing schedule performance for a project, WBS, or EPS. The values
you specify determine which indicators apply to the Schedule to date, Labor units to
date, Schedule at completion, and Labor units at completion metrics.
Exceptional: For schedule values, the minimum number of days that the
project, WBS, or EPS must be ahead of schedule to be considered exceptional. For
labor units, the minimum percentage under 100 that the labor units variance must
be less than to display the exceptional indicator. For example, if you set the
exceptional threshold at 10% and the actual labor units variance is 85%, then that
item would be considered exceptional.
Warning: For a schedule value, the minimum number of days that the project,
WBS, or EPS must be behind schedule to display the warning indicator. For labor
units, the minimum percentage over 100 that the labor units variance must be
greater than to display the warning indicator.
Critical: For a schedule value, the minimum number of days that the project,
WBS, or EPS must be behind schedule to display the critical indicator. For labor
units, the minimum percentage over 100 that the labor units variance must be
greater than to display the critical indicator.
Some examples of threshold percentage calculations are as follows:
Labor units to date: (Earned Value Labor Units minus Actual Labor Units) divided by
Earned Value Labor Units
Labor units at completion: (Budget At Completion Labor Units minus Estimate At
Completion Labor Units) divided by Budget At Completion Labor Units

Context-Sensitive Help Topics
921
Earned Value section
Use the options in this section to define what is considered Exceptional, Warning, and
Critical when assessing earned value performance for a project, WBS, or EPS. The
values you specify determine which indicators apply to the Schedule to date, Labor
units to date, Schedule at completion, and Labor units at completion metrics.
Exceptional: The minimum percentage under 100 that the schedule or labor
units variance must be less than to display the exceptional indicator. For example,
if you set the exceptional threshold at 10% and the actual earned value variance
is 85%, then that item would be considered exceptional.
Warning: The minimum percentage over 100 that the schedule or labor units
variance must be greater than to display the warning indicator.
Critical: The minimum percentage over 100 that the schedule or labor units
variance must be greater than to display the critical indicator.
Some examples of threshold percentage calculations are as follows:
Schedule to date: (Earned Value Labor Units minus Planned Value Labor Units)
divided by Planned Value Labor Units
Labor units to date: (Earned Value Labor Units minus Actual Labor Units) divided by
Earned Value Labor Units
Schedule at completion: (Budget At Completion multiplied by Schedule Variance
Index) divided by Budget At Completion
Labor units at completion: (Budget At Completion Labor Units multiplied by Cost
Variance Index) divided by Budget At Completion Labor Units
Index section
Use the options in this section to define what is Exceptional, Warning, and Critical
when assessing index performance. The values you specify determine which
indicators apply to the Cost Performance Index (CPI), Schedule Performance Index
(SPI), and To Complete Performance Index (TCPI).
Exceptional: The minimum percentage over 100 that the index variance must
be greater than to display the exceptional indicator. For example, if you set the
exceptional threshold at 10% and the actual index variance is 115%, then that
item would be considered exceptional.
Warning: The minimum percentage under 100 that the index variance must be
less than to display the warning indicator.
Critical: The minimum percentage under 100 that the index variance must be
less than to display the critical indicator.
Some examples of percentage calculations are as follows:
CPI: Earned Value divided by Actual Units
SPI: Earned Value divided by Planned Value
TCPI: (Budget At Completion minus Earned Value) divided by (Estimate At
Completion minus Actual Units)

922
Getting Here
1) Click the Administer menu and select My Preferences.
2) On the My Preferences page, click the Global tab.
3) On the Global tab, expand the Performance Threshold section.
Planning Page
Overview
The Planning page is a valuable tool to use to quickly and easily establish resource
demand on a proposed project without the need to perform time-consuming
resource-loading on a detailed project plan. This high-level allocation data can be
maintained through the life of the project and referenced when planning resources at a
more detailed level. While resources may not be assigned to specific activities at this
point, a portion of their time can be allocated towards the project, which informs project
managers of the intended commitment of the resource to the project. This helps to avoid
overallocation of resources during project planning.
Use the Planning page spreadsheet to specify, review, or modify project-level and
WBS-level allocation data for individual resources and roles across a project lifecycle. For
each resource or role assignment, you can record total allocated units, which are
calculated live and distributed across the project timescale, or you can record individual
timescale allocated values, which are summed to provide an allocation units total. For
resource assignments, you can base your allocation decisions on the resources' current
availability, which is recalculated live as you edit allocated values.
On this page, you can choose to work with a single project or all projects associated with
a single portfolio, project code, resource, resource team, resource code, role, or role
team.
Screen Elements
Synchronize Resource Dates link
Ensures all assignments are based on the current project timeline.
Export Spreadsheet link
Exports the current spreadsheet to a Microsoft Excel .xls file.
Full Screen mode link
Expands the current work area so it fills the entire display in a separate window.
Nonessential controls are hidden from this mode.

Context-Sensitive Help Topics
923
Resource Analysis link
Redirects you to the Analysis page in order to evaluate resource usage and costs in
customizable chart formats. Examine units or costs for an individual resource or
summary values for all resources belonging to a resource team or code. See
Resource Analysis Tab of the Analysis Page (on page 997).
Customize link
Displays a dialog box with configurable options for customizing the Planning page.
See Customize Spreadsheet Dialog Box of the Planning Page (on page 697).
Filter and group by
The items to be displayed.
If portfolio or project code value is selected, all projects you have access to within the
portfolio or project code value are displayed in the Resource Planning spreadsheet.
If resource is selected, all projects the resource is assigned to, and that you have
access to, are displayed.
If resource team is selected, all projects that all resources on the team are assigned
to, and that you have access to, are displayed.
If resource code is selected, all projects that all resources on the resource code are
assigned to, and that you have access to, are displayed.
If role is selected, all projects that the selected role is assigned to and that you have
access to, are displayed.
If role team team is selected, all projects that all roles on the team are assigned to,
and that you have access to, are displayed.
Planning Toolbar
See Planning Toolbar (on page 1302).
Name field
The name of the project element.
Role field
The name of the role assigned to the project or WBS.
Search Criteria field
The indication of whether there is saved search criteria.
Committed field
Determines whether a resource is committed.
The resource assignment is stable and unlikely to change. When calculating
availability, only assignments that are marked as committed are considered.

924
Start Date field
The planned start date of the project, or the start date for the WBS, or resource or role
assignment. If the spreadsheet is grouped by portfolio, the start date is the earliest
planned start date of all projects within the portfolio.
Finish Date field
The scheduled finish date of the project, or the finish date for the WBS, or resource or
role assignment. If the spreadsheet is grouped by portfolio, the finish date is the latest
scheduled finish date of all projects within the portfolio.
Project Forecast Start field
The alternate start date to be used by the scheduler.
The user sets the alternate start date by dragging the project bar in the Gantt chart
while manually leveling the resource profile in a resource analysis layout.
Forecast Finish Date field
The planned finish date of a project or WBS based in a what-if scenario designed to
stimulate project performance and outcomes and plan resource allocation.
Life of Project option
Determines whether to assign the resource or role for the full project duration.
Status field
The status codes used to classify resource or role assignments.
Usage field
Determines whether the resource or role is allocated.
Total Units field
The total number of units allocated to the project.
View Total Units by Hour, Day, Week, or Month.
% Allocation field
The percentage of available resource units.
As you make changes to the % Allocation field, the total units and corresponding
timescale allocated units are recalculated and displayed in the spreadsheet.
Tips
Designating a resource or role assignment as Life of Project sets the assignment start
and finish dates to match these project dates, if there is a scheduled finish date.
At the WBS level, Start and Finish reflect the earliest assignment start date and latest
assignment finish date, respectively.
At the portfolio, project code value, and resource levels, Start and Finish reflect the
earliest Planned Start and latest scheduled Finish, respectively.

Context-Sensitive Help Topics
925
At the portfolios, project codes, and project levels, the total units column (labeled as
Total Hours, Days, Weeks, or Months) and timescale interval columns display a
summary total of allocated units for all resources and roles. For example, if you
choose project A when filtering the spreadsheet by projects, allocated units of all
resources belonging to project A would roll up and show summary totals in the total
units column and timescale interval columns in the spreadsheet. To show the
summary totals at the WBS level, expand the WBS to show assignments.
Getting Here
1) Click Resources
2) On the Resources navigation bar, click Planning.
Portfolio Analysis Page
Overview
Use this page to analyze portfolio data, conduct side-by-side comparisons of two project
groups, and apply what-if scenarios and waterline analysis techniques to assist with
executive-level critical decision making. The Portfolio Analysis page is divided into two
halves. Information related to one project group appears on one side and information
specific to a second project group appears on the other side.
For each project group, you can choose to display the latest summarized data, or a
snapshot of historical project data that has been saved as a scenario. You can also
select a portfolio view to determine the layout of project data.
Screen Element
Compare options
Choose one of the following options for viewing the two selected project groups.
Vertically (stacked)
Horizontally (side-by-side)
Portfolio Analysis toolbar
See Portfolio Analysis Toolbar (on page 1304).
Portfolio Analysis Settings bar
See Portfolio Analysis Settings Area (on page 1303)
Work Area
Displays the data or chart you selected in the View field on the settings bar.
Getting Here
1) Click Portfolios.
2) On the Portfolios navigation bar, click Portfolio Analysis.

926
Portfolio Capacity Planning Page
Overview
Use this page to analyze role allocation and cost over time. Multiple chart formats display
role allocation for the projects and roles you select, enabling you to quickly identify areas
of under or over allocation.
Using this page, you can perform what-if analysis, graphically change project forecast
dates, and apply waterline analysis techniques to assist with critical, executive-level
decision making. During your analysis, you can create and update scenarios that
provide varying snapshots of project and role allocation data. After conducting your
analysis, you can create portfolios containing only the projects that meet your planning
criteria.
Screen Elements
Capacity Planning toolbar
See Capacity Planning Toolbar (on page 1247).
Scorecard area
The scorecard displays project data in spreadsheet format.
When you select an option in the scorecard, the project's role allocation is included in
the Capacity Planning chart at the bottom of the page.
Gantt Chart area
The Gantt chart displays current and forecast data according to the timescale you
specify when you customize the page. Each project in the scorecard has two
corresponding bars: the Current Bar (top) and Forecast Bar (bottom).
The Current Bar is based on the project start and finish dates; blue indicates current
project progress, while green indicates remaining work. The Forecast Bar spans from
the project's forecast start date to the forecast finish date. If forecast dates have not
been defined, the Forecast Bar spans from the remaining start date to the remaining
finish date.
When the page displays the latest summarized data, you can move the Forecast Bar
to change the forecast dates; you cannot move the Forecast Bar when displaying
scenario data, and you can never move the Current Bar.
Note: If the project group you are viewing is an EPS containing child EPS nodes, the
Gantt chart displays a yellow Summary Bar rather than an orange Forecast Bar
because forecast dates do not apply to EPS nodes.
Capacity Planning Chart area
In the lower half of the work area, the Capacity Planning Chart area consists of the
following components:

Context-Sensitive Help Topics
927
Chart toolbar; see Capacity Planning Chart Toolbar (on page 1245)
Role selector
Capacity Planning Chart
Chart legend
Role selector
The role selector displays roles according to the Group By or Search options you
specify.
When the page displays the latest summarized data, you can choose to group roles
by the current portfolio's roles, the role hierarchy, or role teams, or you can search for
roles. When displaying scenario data, the role selector only displays the current
portfolio's roles. The allocations for the roles you select are displayed in the Capacity
Planning chart at the bottom of the page. For example, if you only choose the Project
Manager role in the role selector, the Capacity Planning chart only displays the
Project Manager role's allocation. You can use this information to determine which
projects or time periods the Project Manager role is under- or over-allocated.
Capacity Planning Chart work area
The Capacity Planning chart displays historical scenario data or the latest
summarized data according to the type of chart you choose to view, the roles and
projects you select, the customize options you choose, and global preference
settings for calculating role limits.
Whichever chart type you choose, when you hover over a color-coded section of the
chart, the application displays the data pertaining to that section.For each role you
select in the role selector, the Capacity Planning chart displays role allocation over
time for the projects you select in the scorecard or for all projects in the database
(click Customize to choose options). The chart can display role allocation as a
stacked histogram, area chart, net availability chart, or spreadsheet. You can choose
to display role allocation per project, role, or project code, or you can choose to
display staffed versus unstaffed units or costs. Additionally, you can compare data for
the current project group's roles versus roles assigned to all other projects.
Tips
To display the Financial Period timescale, projects must be summarized by financial
period and financial periods must be properly configured. To display a calendar
timescale (for example, Month/Week), projects must be summarized by calendar
intervals.
The scorecard on this page does not display WBS rows, only project rows. On the
Portfolio Analysis page and the Portfolio View portlet, scorecards display WBS rows
along with project rows.
Getting Here
1) Open a portfolio in the Portfolios section using one of the following methods:
Click Portfolios to open the last portfolio you were working with.

928
Click the Portfolios menu and choose one of the most-recently used
portfolios.
Click the Portfolios menu and choose Open Portfolio to select a group of
projects by portfolio type, EPS node, or project code.
2) On the Portfolios navigation bar, click Capacity Planning.
Portfolio Details Page
Overview
Use this page to modify a group of projects, called a portfolio. Use portfolios to group
multiple projects according to filter criteria or manual selection based on portfolio
management goals not limited to projects of a particular EPS level or those sharing the
same project code. Portfolios enable you to review and analyze data easily at a
summary level. You can even create portfolios consisting of other portfolios.
Screen Elements
Portfolio Name field
The unique name of the project portfolio according to its access type, user specific or
global.
For example, two users could have a portfolio with the same name, but no two global
portfolios can have the same name.
Filter last refreshed on field
For filtered portfolios only, displays the date and time the portfolio's filter was last
refreshed.
Manage this portfolio options
Choose one of the two options for configuring the portfolio:
Manually: You will configure the projects you want added to or removed from the
portfolio.
By Filter: The portfolio will dynamically configure and refresh itself over time based
on criteria you specify.
This portfolio is available to options
Choose a user access option for the portfolio.
Current User: Only you, the currently logged in user, will be able to view this
portfolio.
All Users: Every user will be able to view this global portfolio.
Another User: Only the user you select will be able to view this portfolio.
If Manual option is chosen under the Manage this Portfolio field, the following options will
be available:

Context-Sensitive Help Topics
929
Manual Portfolio selection controls
Configure the projects you want to include in your portfolio. See Customize Columns
or Values.
If By Filter option is chosen under the Manage this Portfolio field, the following options will
be available:
Select Filter Criteria
Select from one of the following options:
All of the Following
Any of the Following
Parameter field
Select from one of the following options:
General
User Defined fields
Project Codes
Is field
Select from one of the following options:
equals
is not equal to
Value field
Enter a value that either equals or is not equal to the parameter, chosen with the
correct parameter and is fields.
Tips
Portfolio names must be unique according to their access type, that is, user specific or
global. For example, two users could have a portfolio with the same name, but no
two of a single user's portfolios or global portfolios can have the same name.
You can only modify a portfolio if you were its original creator.
Filtered portfolios automatically refresh themselves according to an interval set by
your administrator. To manually refresh a filtered portfolio so it captures the most
recent projects meeting the filter criteria, click Save.
Getting Here
1) Click the Portfolios menu and select Manage Portfolios.
2) On the Manage Portfolios page, click on a portfolio.

930
Portfolio Gantt Chart Page
Overview
Use this page to display timescaled performance or earned value schedule information
at the WBS level, along with unit or cost data, in a spreadsheet or histogram. The Gantt
chart summary and baseline bars reflect data for all projects in the currently open
project group down to the WBS level.
Screen Elements
Customize button
Opens a dialog box for choosing display options for the Gantt chart, such as the
timescale increment and the type of data to display.
Display options
Options for displaying the data associated with the Gantt chart in either a
spreadsheet or histogram format.
Spreadsheet option
Displays the chart data in a timescaled row and column format.
Histogram option
Displays the chart data as a timescaled bar chart.
Legend area
Displays the actual work, remaining work, baseline, summary, and project duration
colors represented in the chart.
Gantt Chart work area
Displays the Gantt chart including its timeline. Position your mouse cursor over a bar to
display a summary.
Zoom In
Increases the current magnification of items in the work area so they appear larger.
Zoom Out
Decreases the current magnification of items in the work area so they appear smaller.
Spreadsheet or Histogram area
Based on the choice you made for the Display options field, this area displays either
the spreadsheet or histogram. In the histogram, click and hold the mouse button
down on a bar to view baseline, actual, and remaining data, including cumulative
totals.

Context-Sensitive Help Topics
931
List of projects, codes, portfolios, or EPS nodes
Depending on the type of project group or portfolio you open, a list of its sub-items
might appear below the chart. Click a hyperlink in the list to open the item.
Tips
Because the Gantt chart uses summarized data, it is only as current as the last date
the summarizer was run for each project. Furthermore, the number of WBS levels you
can summarize and view is determined by the Summarize to WBS Level setting.
Configure this setting and view the date and time of the last summarization on the
Summarization Page of the Project Preferences Dialog Box (on page 1112).
To view detail bars for the group, click Expand next to the summary bar or
double-click a bar.
To adjust the width of the timescale increments, click Zoom In or Zoom Out. Or,
click and drag a timescale interval to the left or right.
The histogram displays only the positive values for bars and cumulative curves. Click
on an individual bar or curve to review any negative values.
The blue dotted vertical line represents the data date of the selected project, or the
earliest data date of all projects in the selected EPS, portfolio, or project code.
To print the Gantt chart, spreadsheet, or histogram, right click and choose Print.
To show or hide the legend in a Gantt chart with histogram, right-click the chart and
then mark or clear the check box beside the legend you want to display.
Labor resource fields, such as budgeted or planned units, will not display a time unit
designation (h, d, w, m, or y) unless you have set your preferences to show time units.
Getting Here
1) Open a portfolio in the Portfolios section using one of the following methods:
Click Portfolios to open the last portfolio you were working with.
Click the Portfolios menu and choose one of the most-recently used
portfolios.
Click the Portfolios menu and choose Open Portfolio to select a group of
projects by portfolio type, EPS node, or project code.
2) On the Portfolios navigation bar, click Gantt Chart.
Portfolio Performance Status Page
Overview
Use this page to display summarized schedule and cost or labor unit data based on the
performance metric you select. To date and forecast data are provided at the group,
project, and WBS levels.

932
Arranged by EPS, portfolio, or project code, each entry represents a project, code, EPS
node, or portfolio and includes an identifying icon, name, and summary data including a
visual indicator. When a name appears as a hyperlink, you can open it by clicking the
link. Click Return to go back.
Screen Elements
Return
Navigates back to the previous page.
Schedule, Earned Value, or Index selector
Displays the performance status information using the metric you select, shown in
bold.
Performance Status legend
Displays the series of visual indicators and their short descriptions. By default, there are
four (4) indicators representing customizable metrics to help you quickly assess status
and identify areas that require attention.
Critical
Warning
Acceptable
Exceptional
To Date Schedule column
Displays the actual vs. schedule date variance expressed in units of time. For
example, 10 days ahead or behind schedule.
To Date Labor Units column
Displays actual vs. schedule labor unit or cost variance.
Forecast at Completion Schedule column
Displays the estimated schedule variance at completion.
Forecast at Completion Labor Units column
Displays the estimated labor unit or cost variance at completion.
Page: n of N
Displays the page number and total page count for the Performance Summary.
[Next >>] link
Advances to the next page.
[<< Previous] link
Returns to the previous page.

Context-Sensitive Help Topics
933
Getting Here
1) Open a portfolio in the Portfolios section using one of the following methods:
Click Portfolios to open the last portfolio you were working with.
Click the Portfolios menu and choose one of the most-recently used
portfolios.
Click the Portfolios menu and choose Open Portfolio to select a group of
projects by portfolio type, EPS node, or project code.
2) On the Portfolios navigation bar, click Performance Status.
Portfolio ROI Page
Overview
Use this page to display cost/benefit information based on live data for the open project
group. After recording spending and benefit plan data, the discount rate, and the rate
application period on the Project Details ROI page, navigate to this page to view Net
Present Value (NPV), ROI, and payback period calculations. If you attempt to view a
chart on the Portfolio ROI page but no discount rate or spending/benefit plan data has
been recorded for the project, a message appears to notify you.
At the project level, you can view a time-distributed chart showing project-level
spending, cash inflow, and NPV.
Screen Elements
Return
Navigates back to the previous page.
Name field
The name of the project, code, EPS node, or portfolio.
Annual Discount Rate field
The interest rate associated with the cost of an investment from your commercial
bank or another funding source. Valid values are 0 to 100. This rate is used to
calculate Total Spending Plan Present Value and Total Benefit Plan Present Value.
For example, an annual growth rate of an investment such as 4.75% can be used as
an annual discount rate. This rate is used when a future value is assumed and you are
trying to find the required net present value.
Total Benefit Plan field
The sum of the monthly benefit plan.When you select an EPS node, project Code, or
portfolio in the hierarchy, this is the sum of Total Benefit for all projects in the group.
Calculated as Plan period $ divided by (1 plus annual discount rate) multiplied by n

934
Where n equals the current discount application period value (e.g., for yearly over 8
years, values are calculated for n equals year 0, year 1, year 2, ... year 7). The project
start date is used as the beginning of period 0. If the project start date or annual
discount rate change, Total Spending Plan PV, Total Benefit Plan PV, NPV, ROI, and
Payback Period are recalculated.
Payback Period field
The length of time required to elapse before net profits have recovered the initial and
periodic costs of an investment.
Total Spending Plan field
The sum of the monthly spending plan.When you select an EPS node, project Code,
or portfolio in the hierarchy, this is the sum of Total Spending for all projects in the
group.
Calculated as Plan period $ divided by (1 plus annual discount rate) multiplied by n
where n equals the current discount application period value (e.g., for yearly over 8
years, values are calculated for n equals year 0, year 1, year 2, ... year 7). The project
start date is used as the beginning of period 0. If the project start date or annual
discount rate change, Total Spending Plan PV, Total Benefit Plan PV, NPV, ROI, and
Payback Period are recalculated.
Net Present Value field
The difference between the present value (PV) of the future cash flows from an
investment and its investment cost. Present value of the expected cash flows is
computed by discounting them at the required rate of return or discount rate. Positive
net present value (NPV) is an indicator of projects that should be pursued.
Calculated as Total Benefit Plan (PV) minus Total Spending Plan (PV).
Return on Investment field
A calculation of the expected return or benefit over and above the investment costs
of a project or portfolio, expressed as a percentage.
Calculated as the Net Present Value divided by the Total Spending Plan Present
Value.
For example, a project is expected to cost 1.0 million dollars with a total benefit of 1.2
million dollars. It's NPV is $200,000. The return on investment is 20%.
Details link
Opens the Return on Investment of Project page where you can view NPV, ROI, and
Payback Period for a project or edit its spending and benefit plans.
View Chart link
Displays the cumulative NPV curve and per period spending and benefit bars across
the timescale, based on the time increment you select.
To view a value legend for a specific timescale increment, click on a bar or the curve.

Context-Sensitive Help Topics
935
To print the chart, right-click it and choose Print.
To show or hide the chart legend, right-click over the chart, then mark or clear Show
Histogram Legend.
Tips
Arranged according to your choice of EPS, portfolio, or project code, each entry on
the page represents a project, code, EPS node, or portfolio and includes an
identifying icon, name, and ROI data. When a name appears as a hyperlink, click it to
open it. Click Return to go back.
To view a value legend for a specific timescale increment, click on a bar or point
along the curve.
To print the chart, right-click it and choose Print.
To show or hide the chart legend, right-click over the chart, then mark or clear Show
Histogram Legend.
Getting Here
1) Open a portfolio in the Portfolios section using one of the following methods:
Click Portfolios to open the last portfolio you were working with.
Click the Portfolios menu and choose one of the most-recently used
portfolios.
Click the Portfolios menu and choose Open Portfolio to select a group of
projects by portfolio type, EPS node, or project code.
2) On the Portfolios navigation bar, click ROI.
Portfolio Scenario Details Page
Overview
Use this page to view and modify details about an existing scenario.
Screen Elements
Title field
A name for the scenario. The title can contain up to 255 characters, and it does not
have to be unique.
This scenario is available to options
Mutually exclusive options for setting which users can access the scenario. Choose
one of the following:
Current User
All Users
List of Users

936
Selected Users area
Only appears when the This scenario is available to option is set to List of Users. Use
the controls in this area to configure the users who have access to this scenario. See
Customize Columns or Values.
Search
Displays a search field and any related options and controls for finding a specific
matching entry or entries based on your search criteria. Search by user name or
personal name.
Search for field
The item you want to find. Type the full name or as many characters as you know to
limit the search.
Go button
Searches for the chosen and entered information.
Getting Here
1) Click the Portfolios menu and choose Manage Scenarios.
2) On the Manage Scenarios page, expand a portfolio in the Title column and click on a
scenario.
Portfolio Scenario Notes Dialog Box
Overview
Use this dialog box to enter notes about a scenario.
Screen Elements
Date field
Displays the date the note was added.
Added By field
Displays the name of who added the note.
Note field
Enter the note in this box.
Tips
To create a scenario, see
After they are saved, notes cannot be modified.
Getting Here
1) Click the Portfolios menu and choose Manage Scenarios.

Context-Sensitive Help Topics
937
2) On the Manage Scenarios page, expand a portfolio in the Title column.
3) Locate a scenario in the list, and click Scenario Notes in the Notes column.
Portfolio Scenario Save As Dialog Box
Overview
Use this dialog box to save the current portfolio scenario as a new portfolio scenario.
Screen Elements
Title field
Enter a unique title name for your portfolio.
This scenario is available to option
The value indicating who can access the scenario.
Current User: Enables you to access the scenario.
All Users: Enables all users to access the scenario.
List of Users: Enables only the users you specify to access the scenario.
Getting Here
1) Click Portfolios.
2) On the Portfolios navigation bar, click Capacity Planning.
3) On the Capacity Planning page, click Save As.
Portfolio View Details Page
Overview
Use this page to create a portfolio view, or modify details about an existing portfolio
view. You can specify the type of project information you want to display in the view,
and choose who can access it.
Screen Elements
Title
The name of the portfolio view. Because P6 portfolio view titles support up to 255
characters, this field can include descriptive information helpful to users in identifying
each view. Histogram of Remaining Effort by Sponsor and At Completion Variance
Analysis by Product Bubble Chart are examples of portfolio views that have been
assigned helpful descriptive titles. The portfolio view title appears in the portlet titlebar.

938
Type
The type of chart to be displayed. If you change the type to Scorecard, the
information that displays on the page changes so you can input scorecard details.
X-Axis
The data field represented in the X-axis of the chart. This field is not displayed for a pie
chart.
Y-Axis
The data field represented in the Y-axis of the chart. This field is not displayed for a Pie
chart.
Group By
The data field used to group projects in the chart. Grouping gathers, or groups,
together all of the projects that contain the same value for the selected data field.
This field is not displayed for a Histogram.
Bubble Size
Specifies the size of the bubbles that display in a Bubble chart.
Color Theme
The type of colors included in the chart: pastel or primary.
Show 3-D
Displays the chart in 3-D format. Clearing this option displays the chart in 2-D format.
Show horizontal gridlines
Displays horizontal gridlines in the chart. This field is not displayed for a Pie chart.
Show vertical gridlines
Displays vertical gridlines in the chart. This field is not displayed for a Pie chart.
Show all values on axis, not just assigned values
Displays all values on the X axis and Y axis, even if there is no assigned value. For
example, if you choose to display Project Status on the X axis, the X axis displays all
types of Project Status (Active, Inactive, What-If), even if no projects are assigned to a
status type. This option only applies when you choose to display project code, project
status, or risk level on the X or Y axis. This option is not displayed for a Pie chart.
Data
The data field represented in a Pie chart.

Context-Sensitive Help Topics
939
Show pie data label
For each section of the Pie chart, displays the value for the customize option you
select in the Data field. For example, if the data you choose to display in the Pie chart
is Actual Cost, the chart displays the Actual Cost value next to each section of the Pie
chart.
Show group by label
For each section of the Pie chart, displays the value for the customize option you
select in the Group By field. For example, if you choose to group the chart by Project,
the chart displays the Project Name next to each section of the Pie chart.
Show percentage
Displays the percentage of each slice of the Pie chart.
Select user access to this view
Specify user access to the view. You can make the view available only to you
(Current User) or for another user you select. If you have the required security
privilege, you can make the view available to all users with module access to
portfolio views, indicating it is a global portfolio view.
Select the custom columns to display
select each column of information you want to display in the scorecard, and specify
any sorting options you require. The top-to-bottom order of the fields in the Selected
Columns list determines how the columns display, left to right, in the scorecard.
Sort by
Use the Sort by list to specify how you want to sort all projects in the scorecard. If you
choose to display a waterline on the scorecard, the fields you select to sort by in the
Select waterline options section override your selection for this field.
Sort Order
From the Sort Order list, you can select to list projects in the scorecard in either
ascending (e.g., A to Z) or descending (e.g., Z to A) order.
Show Project Requests option
Determines whether to analyze potential projects along with approved projects in the
scorecard. If you select this option, only a limited number of columns will display
values for the requested projects. If you choose to show requested projects, they will
not be included in a scorecard if the page on which you are viewing the scorecard is
filtered by a portfolio. Filter by code or EPS element instead to view project requests.

940
Select the fields to group by
Choose up to ten levels, or fields, by which you want to group projects in the
scorecard. Grouping gathers, or groups, all of the projects together that contain the
same value for the selected field. For example, if you select to group by Project
Status, all projects with a Planned status are grouped together, all projects with an
Active status are grouped together, all projects with an Inactive status are grouped
together, and all projects with a What-if status are grouped together. Group by
options are not available when you have a waterline displayed in the scorecard.
Select waterline options
Specify waterline options to help analyze projects in the scorecard. Waterlining ranks
projects into two groups by sorting and applying a constraining limit. When you
display a waterline, the projects in the scorecard are sorted into two separate groups
based on the defined constraint limit and sort by options you specify. The projects
above the waterline, displayed with a white background, are those that collectively
meet the constraint limit value; all other projects, displayed with a light blue
background, appear below the waterline.
Getting Here
1) Click the Portfolios menu and choose Manage Portfolio Views.
2) On the Manage Portfolio Views page, click the Create View link and configure a new
view; or expand a view type and click on an existing view.
Portfolio View Portlet
Overview
Use this portlet to analyze project data for an entire portfolio in a chart or scorecard
format. You can customize the exact data fields you want to display and the type of
chart or scorecard you want to view. When displaying a scorecard, you can also add
and delete projects, export data, and even edit certain project data. As you analyze
data for a project group, you might identify issues with a particular project or require
more detailed project information. In this case, click Open Project.
Screen Elements
Title
The name of the portfolio view. Because P6 portfolio view titles support up to 255
characters, this field can include descriptive information helpful to users in identifying
each view. Histogram of Remaining Effort by Sponsor and At Completion Variance
Analysis by Product Bubble Chart are examples of portfolio views that have been
assigned helpful descriptive titles. The portfolio view title appears in the portlet titlebar.

Context-Sensitive Help Topics
941
Screen Elements for Charts
The following screen elements apply only to bubble, histogram, and pie chart
portfolio views (not scorecards).
Chart toolbar
The first icon that appears in your portlet's toolbar is based on the selection you made
in the portfolio view Type field.
Bubble Chart: Displays the bubble chart.
Histogram Chart: Displays the stacked, side-by-side, or standard histogram.
Pie Chart: Displays the pie chart.
Spreadsheet
Displays the actual source data used to generate the chart.
Customize link
Opens a dialog box for modifying how the information is presented in the chart. See
Portfolio Views Section of the Content Tab of the Customize Dashboard Page for
further details.
Screen Elements for Scorecards
The following screen elements apply only to scorecard portfolio views.
Save link
Saves any changes made to project data within the current portfolio.
Cancel link
Cancels any pending changes made to project data within the current portfolio.
Add link
Creates a new What If project within the current portfolio.
Note: The first time you click this link in the portlet, the Add Project
dialog box appears prompting you to select the default
Responsible Manager for all newly created projects.
Delete link
Deletes the currently selected project from the database.
Expand link
Shows the contents of each group. To show the contents of individual groups, click
beside the group title.

942
Collapse link
Hides the contents of each group. To hide the contents of individual groups, click
beside the group title.
Export Spreadsheet link
Exports the scorecard data to a spreadsheet file.
Customize link
Enables you to set the Title, Type, and applicable options for the portfolio view.
Scorecard table
The scorecard presents its data in a table or spreadsheet format. You can customize
the fields displayed as columns.
Total summary row
Dates, sums, and other totals calculated from all the data in the scorecard.
Open Project icon
Opens the selected project in the Projects section. The default destination page (EPS,
Activities, Workspace, etc.) is determined by your user interface view settings and My
Preferences page view settings.
Tips
When viewing a scorecard in the portlet, if you add or delete a project or edit project
data, you must save your changes before navigating to another page. If you do not,
any projects you add or delete, and any data you edit, will not be saved to the
database.
When you customize a dashboard, you can add up to 50 Portfolio View portlets. You
can add any existing portfolio views (global or user views) to a private dashboard;
however, you can add only existing global views to a global or multi-user dashboard.
Any new portfolio views you add to a private dashboard are added as user views;
any new portfolio views you add to a global or multi-user dashboard are added as
global views. You can modify a portfolio view from the Portfolios page to change
whether it is a user or a global view.
Information displayed in the Portfolio View portlet is based on summarized data, so it is
current as of the last date the summarizer was run for a project. You can easily
determine the date the summarizer was last run if you are displaying a scorecard
view. To determine the date, add the column Last Summarized Date, which is
available under the Summary section of the Available Columns list when you
customize the portlet.
Getting Here
1) Click Dashboards.
2) On the Dashboards page, select a dashboard.

Context-Sensitive Help Topics
943
3) On the dashboard, expand the Portfolio View portlet.
Portfolio View Save As Dialog Box
Overview
Use this dialog box to save the current portfolio view as a new portfolio view or as a new
scenario.
Screen Elements
Title field
A name for the portfolio.
Save the portfolio view as a options
Choose one of the following options:
New Portfolio View
New Scenario
This portfolio view is available to options
The value indicating who can access the view.
Current User: Enables you to access the view.
All Users: Enables all users to access the view.
Another User: Enables only the users you specify to access the view.
Getting Here
1) Click Portfolios.
2) On the Portfolios navigation bar, click Portfolio Analysis.
3) On the Portfolio Analysis page, click Save As.
Portfolios Page
Overview
Use the Portfolios page to start your review, analysis, and evaluation of high-level
summarized data about projects grouped into portfolios. This page presents a shared
toolbar of buttons (or tabs) for navigating to other pages in the portfolios section.
Screen Elements
Portfolios toolbar
See Portfolios Toolbar (see "Portfolios Navigation Bar" on page 1305). The first button in
this configurable toolbar is your current portfolios home page.

944
Work Area
The main work area for each portfolio page. Each tabbed page presents its own
separate data, buttons, links, toolbars, charts, and other items in the work area.
Tips
The term "home" page is given to the first page (or tab) that appears when you open
this section of the application. Your assigned user interface view determines the first
page that appears as your Portfolios home page.
Getting Here
Click Portfolios.
Predecessors Detail Window of the Activities Page
Overview
Use this detail window to assign or configure predecessor relationships for the selected
activity.
Screen Elements
Predecessors toolbar
See Predecessors Toolbar of the Activities Page (on page 1311).
Project ID field
The unique identifier of the project.
Project Name field
The name of the associated project.
Activity ID field
The unique identifier of the activity.
System generated.
Activity Name field
The name of the activity. The activity name does not have to be unique.
Relationship Type field
The relationship between two activities. Select from the following types:
Finish to Start: A relationship in which the start of a successor activity depends on
the completion of its predecessor activity. This is the default activity relationship.
Finish to Finish: A relationship in which the finish of a successor activity depends on
the finish of its predecessor activity.

Context-Sensitive Help Topics
945
Start to Start: A relationship between activities in which the start of a successor
activity depends on the start of its predecessor.
Start to Finish: A relationship between activities in which a successor activity
cannot complete until its predecessor activity starts.
Lag field
The amount of time the predecessor activity was delayed, affecting the ability of its
successor activity to start or finish.
This value is specified by the project manager and is used by the project scheduler
when scheduling activities.
The time lag is based on the successor activity's calendar.
Tips
If you have more than one activity selected, the detail window will not be visible.
Getting Here
1) Click Projects.
2) On the Projects navigation bar, click Activities.
3) On the Activities page, select an activity and click the Predecessors detail window.
Predecessors Section of the Relationships Section of the Activity Form Page
Overview
Use this section to add, revise, or remove a predecessor relationship.
Screen Elements
Assign predecessor activity link
Opens a dialog box to search for and select a predecessor activity. See Working with
'Select a Value' Dialog Boxes.
Project ID field
The unique identifier of the project containing the predecessor activity.
Activity ID field
The unique identifier of the predecessor activity.
System generated.
Activity Name field
The name of the selected activity's predecessor. See Relationships Details Page of the
Activity Form Page (on page 988) for further details.

946
Relationship Type field
The relationship between two activities. Select from the following types:
Finish to Start: A relationship in which the start of a successor activity depends on
the completion of its predecessor activity. This is the default activity relationship.
Finish to Finish: A relationship in which the finish of a successor activity depends on
the finish of its predecessor activity.
Start to Start: A relationship between activities in which the start of a successor
activity depends on the start of its predecessor.
Start to Finish: A relationship between activities in which a successor activity
cannot complete until its predecessor activity starts.
Lag field
The amount of time the predecessor activity was delayed, affecting the ability of its
successor activity to start or finish.
Getting Here
From the Workgroup Workspace page:
1) Click Projects.
2) On the Projects navigation bar, click Workspace.
3) On the Workspace page, expand any portlet containing activities.
4) In the portlet, click an activity.
5) On the Activity Form page, expand the Relationships section.
From the Dashboards page:
1) Click Dashboards.
2) On the Dashboards page, expand any portlet containing activities.
3) In the portlet, click an activity.
4) On the Activity Form page, expand the Relationships section.
Prices Detail Window of the Roles Tab of the Administration Page
Overview
Use this detail window to define the price/unit for up to five available rate types for each
role.

Context-Sensitive Help Topics
947
Screen Elements
Role selector (Ctrl+Up Arrow) or (Ctrl+Down Arrow)
Cycles through the available roles and determines which data display in the detail
window. Click (Ctrl+Up Arrow) to move to the previous role, or click (Ctrl+Down
Arrow) to move to the next role. The content in the detail window is refreshed with the
data for the selected role.
Price/Unit fields
The non-overtime price for the role, which is used to compute costs for any activities
the role is assigned to. You can define up to five rate types, or price/unit values, per
role. Price/unit is a default name and can be modified by your P6 administrator.
Examples of Price/Unit names include Internal Rate, External Rate and Standard Rate.
Getting Here
1) Click Resources.
2) On the Resources navigation bar, click Administration.
3) On the Administration page, click the Roles tab.
4) On the Roles tab, click the Prices detail window.
Private Documents Tab of the My Documents Portlet (with content repository)
Overview
Use this tab to view all private documents that you have added.
Screen elements
Private Documents Tab toolbar
See Private Documents Toolbar (on page 1316).
Title field
Displays the name of the project and the titles of all associated documents.
Version field
The latest or most current version of the document.
Creation Date field
The date and time that the selected document was created.
Modified Date field
The date and time the document was last modified.

948
Tips
Add Document enables you to create a new private document only.
Getting Here
1) Click Dashboards.
2) On the Dashboards page, select a dashboard.
3) On the dashboard, expand the My Documents portlet and click the Private
Documents tab.
Probability and Impact Diagram Detail Window of the Risk Scoring Matrices Page
Overview
Use this detail window to view a graphical representation of probability, impact, and
tolerance thresholds defined for a selected risk scoring matrix.
Screen Elements
Toggle between text and numeric score ratings
The risk scoring matrix score is available in a numeric or a text format.
: Displays the numeric score ratings of the severity fields.
: Displays the text score ratings of the severity fields.
Probability field
The values defined for the probability threshold assigned to the risk scoring matrix.
Severity fields
The ranges and values assigned to the chosen thresholds. The number of severity
fields is determined by the number of levels chosen for the impact thresholds.
Getting Here
1) Click the Projects menu and select Enterprise Project Data, or click the
Administer menu and select Enterprise Data.
2) In the Enterprise Data pane, expand Risks and click Risk Scoring Matrices.
3) On the Risk Scoring Matrices page, click the Probability and Impact Diagram detail
window.
Probability and Impact Diagram Detail Window of the Risks Page
Overview
Use this detail window to view a graphical representation of probability and impact for a
selected risk scoring matrix.

Context-Sensitive Help Topics
949
Screen Elements
Toggle between text and numeric score ratings
The risk scoring matrix score is available in a numeric or a text format.
: Displays the numeric score ratings of the severity fields.
: Displays the text score ratings of the severity fields.
Probability field
The values defined for the probability threshold assigned to the risk scoring matrix.
Severity fields
The ranges and values assigned to the chosen thresholds. The number of severity
fields is determined by the number of levels chosen for the impact thresholds.
Getting Here
1) Click Projects.
2) On the Projects navigation bar, click Risks.
3) On the Risks page, click the Probability and Impact Diagram detail window.
Probability Detail Window of the Risk Scoring Matrices Page
Overview
Use this detail window to view the probability threshold assigned to the selected risk
scoring matrix.
Screen Elements
Code field
Displays the code values defined for the probability threshold assigned to the risk
scoring matrix.
Name field
Displays the name for each value defined for the probability threshold assigned to the
risk scoring matrix.
Range field
The threshold range values defined for the probability assigned to the risk scoring
matrix.
Getting Here
1) Click the Projects menu and select Enterprise Project Data, or click the
Administer menu and select Enterprise Data.
2) In the Enterprise Data pane, expand Risks and click Risk Scoring Matrices.

950
3) On the Risk Scoring Matrices page, click the Probability detail window.
Progress Reporter Page of the Project Preferences Dialog Box
Overview
Use this page to configure options for statusing and managing activities within P6
Progress Reporter.
Screen Elements
Specify the field resources use to status their activities options
Select from Percent Complete or Remaining Units.
Primary resources can mark activities as completed option
Determines whether primary resources can mark activities as completed.
Resources can mark assignments as completed option
Determines whether resources can mark assignments as completed.
Resources can view activities from an inactive project option
Determines whether resources can view activities from an inactive project.
Resources can assign themselves to activities option
Determines whether resources can assign themselves to activities.
Getting Here
1) Click Projects.
2) On the Projects navigation bar, click EPS.
3) On the EPS page, click the Actions menu and select Set Project Preferences....
4) In the Project Preferences pane, click Progress Reporter.
Project Access Detail Window of the Users Page
Overview
Use this detail window to assign user access permissions to projects under different
responsible managers.
Screen Elements
Assign OBS
Enables you to select an OBS to assign to the selected user.

Context-Sensitive Help Topics
951
Remove OBS Assignment
Removes the OBS Assignment from the selected user.
Responsible Manager field
List of OBS elements assigned to this user. This field is read-only.
Project Security Profile field
From the list of project security profiles, you can select the security profile you want to
apply for each OBS assignment. The type of access granted to a user is determined
by the project security profile assigned to the user.
Getting Here
1) Click the Administer menu and select User Access.
2) On the User Access page, click Users.
3) On the Users page, click the Project Access detail window.
Project Calendar Portlet of the Workspace Page
Overview
Use this portlet to view a week's worth of activities that pertain to your project. In a
workspace, the Project Calendar portlet displays all activities scheduled for the selected
week. Display the current week or click past or future dates to see the list of activities and
milestones for the selected week. The selected week is highlighted in blue.
Screen Elements
Calendar
The graphic displaying different months and your activities associated with each
month. Click the left and right arrows to move to the previous or next months. The
selected week is highlighted in blue.
Activities list
The activities for the specified month.
Tips
Click a project or activity link to view more detailed project or activity data.
Getting Here
1) Click Projects.
2) On the Projects navigation bar, click Workspace.
3) On the Workspace page, expand the Project Calendar portlet.

952
Project Calendars Page
Overview
Use this page to configure project calendars, define the standard work week, and view
the activities using a given calendar.
Screen Elements
Project Calendar Toolbar
See Enterprise Data Project Calendar Toolbar (on page 1272).
Calendar tab
See Calendar Tab of the Project Calendars Page (on page 606).
Standard Work Week tab
See Standard Work Week Tab of the Project Calendars Page (on page 1086).
Used By tab
See Used By Tab of the Project Calendars Page (on page 1135).
Search field
The means to find a project.
Search
Displays options for finding a specific matching entry or entries based on search
criteria.
Calendar List
Displays a list of all available calendars to view.
Getting Here
1) Click the Projects menu and select Enterprise Project Data, or click the
Administer menu and select Enterprise Data.
2) In the Enterprise Data pane, expand Projects and click Project Calendars.
Project Codes Page
Overview
Use this page to add and configure project codes and code values.
Screen Elements
Project Codes toolbar
See Enterprise Data Project Codes Toolbar (on page 1274).

Context-Sensitive Help Topics
953
Name field
This field displays the name of a project code or value. Project codes help to organize
the projects in your EPS in groups according to specific categories. You can define
unlimited hierarchical project codes to fulfill the filtering, sorting, and reporting
requirements for your projects, and arrange them hierarchically for easier
management and assignment.
Description field
This field displays a description of the corresponding project code.
Maximum Length field
The field displays the maximum length of the project code. You can arrange codes
by ascending, descending, or random order.
Secure option
Secure codes enable privileged users to hide Project, Activity, Issue and Resource
codes from users that do not have security privileges to view them. Secure codes are
structured hierarchically. In other words, if a user is granted add/delete privileges, that
user automatically has edit, assign, and view privileges. If a user is granted edit
privileges, that user is automatically granted assign and view privileges. If a user is
granted assign privileges, that user is automatically assigned view privileges.
Weight field
This field displays the weight of each project code. Weighted project codes make it
possible to rank or prioritize projects by using numerical values to calculate a project
score. P6 calculates project score based on the weights associated with project
codes and project code values assigned to a project. To use project scoring features,
you must create weighted project codes and code values and assign them to the
projects you want to rank.
Weight Percent field
P6 will calculate the percent value that corresponds to the code's weight.
Maximum Code Value Weight field
This field shows the maximum allowed weight value for a specific project code type.
Getting Here
1) Click the Projects menu and select Enterprise Project Data, or click the
Administer menu and select Enterprise Data.
2) In the Enterprise Data pane, expand Projects and click Project Codes.

954
Project Collaboration Section of the Content Tab of the Workspace Details Page
Overview
Use this section to configure which portlets are displayed on the Workspace page.
Screen Elements
Communication Center option
Determines whether to display the Communication Center portlet.
Show Team Members who are assigned as resources option
Determines whether to display the team members who are assigned as resources.
Show Team Members who have access rights option
Determines whether to display the team members who have access rights.
Project Calendar option
Determines whether to display the Project Calendar portlet. This portlet includes an
adjustable monthly calendar and, if enabled, shows any activities for the currently
selected week in the calendar.
Show activities option
Determines whether activities should appear in the Project Calendar portlet for the
currently selected week you select in the calendar.
Workgroups option
Determines whether to display the workgroups portlet on the Workspace page.
Getting Here
1) Click Projects.
2) On the Projects navigation bar, click Workspace.
3) On the Workspace page, click Customize.
4) On the Workspace Details page, click the Content tab.
5) On the Content tab, expand the Project Collaboration section.
Project Data Detail Window of the Project Security Profiles Page
Overview
Use this detail window to assign project data privileges to the selected project security
profile.

Context-Sensitive Help Topics
955
Screen Elements
Privilege field
The name of the security permission that is assigned (option selected) or denied
(option cleared) to users of the currently selected profile.
Privilege option
The option in the column header that determines whether the privileges are all
assigned (selected), all denied (clear), or individually configured (indicated with a
dash or - sign).
Add/Edit/Delete Issues and Issue Thresholds option
Determines whether the profile will enable users to create, modify, and remove
thresholds and issues assigned to projects. The privilege also enables users to assign
issue codes to project issues.
Add/Edit/Delete Project Baselines option
Determines whether the profile will enable users to create, modify, and remove
baselines for projects.
Add/Edit/Delete Project Calendars option
Determines whether the profile will enable users to create, modify, and remove
calendars assigned to projects.
Add/Edit/Delete Risks option
Determines whether the profile will enable users to create, modify, and remove risks
assigned to projects.
Add/Edit/Delete Template Documents option
Determines whether the profile will enable users to create, modify, remove project
template documents. If the content repository is installed and configured, this
privilege also enables users to check out and start reviews for project template
documents. A profile must be assigned the 'Add/Edit/Delete Work Products and
Documents' project privilege before you can select this privilege.
Add/Edit/Delete Work Products and Documents option
Determines whether the profile will enable users to create, modify, and remove
project documents that do not have a security policy applied. Document security
policies are available only in P6 and only for documents stored in the content
repository. When the content repository is installed and configured, this privilege also
enables users to create document folders in P6.
Add/Edit Workgroups option
Determines whether the profile will enable users to create and modify workgroups.

956
Delete Workgroups option
Determines whether the profile will enable users to remove workgroups.
Edit Workspace and Workgroup Preferences option
Determines whether the profile will enable users to customize the project workspace
and workgroup preferences.
Assign Project Baselines option
Determines whether the profile will enable users to assign project baselines to
projects. To assign project baselines, users must also have the 'Edit Project Details
Except Costs/Financials' project privilege assigned to their profile.
Getting Here
1) Click the Administer menu and select User Access.
2) On the User Access page, click Project Security Profiles.
3) On the Project Security Profiles page, click the Project Data detail window.
Project Data Section of the Import Tab of the Import/Export Project Dialog Box
Overview
Use this section to select an import action when the same data exists in the import file
and project being updated. Select Delete to delete those values in the database that
are not contained in the file you are importing.
Screen Elements
Name field
The name of the project, code, EPS node, or portfolio. Use in correspondence with the
Import Action lists to select an action for each name.
Import Action list
Determines what action to take when importing:
Keep Existing: Retains data in the existing methodology and does not overwrite
them with the updated data; adds new data if the record does not exist.
Update Existing: Overwrites data in the existing methodology with updated data;
adds new data if the record does not exist.
Do Not Import: Retains data in the existing methodology and does not import the
updated data.
Delete option
Determines whether to delete the selected item.
Context-Sensitive Help Topics
957
Getting Here
1) Click Projects.
2) On the Projects navigation bar, click EPS.
3) On the EPS page, click the Actions menu and select Import/Export XML Project
Import/Export.
4) In the Import/Export Project dialog box, click the Import tab.
5) On the Import tab:
a. Select Primavera XML from the Import Type list.
b. Click Advanced .
Project Documents Portlet of the Workspace Page (with content repository)
Overview
Use this portlet to view all documents that have been added to the project, modify
document details, and to add new documents to the project.
Screen Elements
Project tab
See Project Tab of the Project Documents Portlet of the Workspace Page (with content
repository) (on page 975).
WP & Docs tab
See WP & Docs Tab of the Project Documents Portlet of the Workspace Page (with
content repository) (on page 1174).
Getting Here
1) Click Projects.
2) On the Projects navigation bar, click Workspace.
3) On the Workspace page, expand the Project Documents portlet.
Project Documents Portlet of the Workspace Page (without content repository)
Overview
Use this portlet to share project documents, view document details, and add new
documents related to the current project.
Details
Add Document link
Enables you to add documents to the selected project.

958
Title field
Displays the name of the project and the titles of all associated documents.
Version field
The latest or most current version of the document.
Revision Date field
The date of the document's last update.
Tips
You can add documents to the project only if you have project access and the
required privilege.
To control the number of documents that display, click Customize at the top of the
workspace and enter a number in the Maximum number of rows displayed in project
workspace lists field.
Project Workspace portlets display data for the selected project only. When multiple
projects are open, you must select the project you want to work with in the Select
Project list at the top right of the Workspace page. When a single project is open, the
Select Project list does not appear.
Getting Here
1) Click Projects.
2) On the Projects navigation bar, click Workspace.
3) On the Workspace page, expand the Project Documents portlet.
Project Gantt Chart Portlet
Overview
Use this portlet to quickly view the status of projects and review its milestones.
The table on the left side of the portlet lists projects that meet the portfolio, project code
value, or project filter criteria specified in the dashboard's Filter by field. In the table, you
can expand the project rows to display a list of each project's start and finish milestone
activities. You can filter the milestones that display in the portlet by selecting an activity
code filter.
The Gantt chart on the right side of the portlet displays a bar for each project, which
represents the span between the Project Planned Start and Scheduled Finish dates of the
project. The blue section of each project bar indicates current progress, while the green
section of each bar indicates remaining effort. When you expand a project row in the
table to display the project's milestone activities, the Gantt chart shows milestone icons (
) for each start and finish milestone activity in the project and baseline milestone ( )
icons for each start and finish milestone in the baseline if one has been applied to the
project.

Context-Sensitive Help Topics
959
Screen Elements
Project Gantt Chart Portlet toolbar
See Project Gantt Chart Portlet Toolbar (on page 1318).
ID field
The unique identifier of the project and associated milestones. This field is fixed and
cannot be modified using the customize columns icon.
Name field
The name of the project and associated milestones.
Start field
The start date of the project and associated milestones.
Scheduled Finish field
The calculated latest early finish date, which is based on the schedule most recently
generated for the project.
BL Start field
The current earliest start date of all activities in the project baseline.
BL Finish field
The current latest finish date of all activities in the project baseline.
Project Gantt Chart area
The Current Bar is drawn using the Project Planned Start and Scheduled Finish date
fields. Progress is displayed as blue and future work as green. Milestones appear as
black diamonds. The Baseline Bar is drawn underneath the Current Bar using the BL
Start and BL Finish dates of the project. Baselines and baseline milestones are
displayed in yellow.
Tip
Position your mouse pointer over a milestone to view its name and dates.
Getting Here
1) Click Dashboards.
2) On the Dashboards page, select a dashboard.
3) On the dashboard, expand the Project Gantt Chart portlet.

960
Project Health Portlet of the Dashboards Page
Overview
Use this portlet to quickly see how well a portfolio or individual project is performing.
Status indicators (shown below) identify areas where you might need to focus attention
or implement corrective action.
Screen Elements
Exceptional
Indicates that a project or portfolio is exceeding expectations.
Acceptable
Indicates that a project or portfolio is performing as expected.
Warning
Indicates that the project or portfolio needs attention and is near critical.
Critical
Indicates that the project or portfolio requires significant corrective action.
Tips
Status indicators are based on performance thresholds you set on the Global tab in
My Preferences. You can set performance thresholds to correspond to each of the
status indicators.
Project Workspace portlets display data for the selected project only. When multiple
projects are open, you must choose the project you want to work with in the Select
Project list at the top right of the Project Workspace. When a single project is open,
the Select Project list does not appear.
Getting Here
1) Click Dashboards.
2) On the Dashboards page, select a dashboard.
3) On the dashboard, expand the Project Health portlet.
Project Health Portlet of the Workspace Page
Overview
Use this portlet to view how well a portfolio or individual project is performing. Status
indicators identify areas where you might need to focus attention or implement
corrective action.

Context-Sensitive Help Topics
961
Screen Elements
Exceptional
Indicates that a project or portfolio is exceeding expectations.
Acceptable
Indicates that a project or portfolio is performing as expected.
Warning
Indicates that a project or portfolio needs attention and is near critical.
Critical
Indicates that a project or portfolio requires significant corrective action.
Getting Here
1) Click Projects.
2) On the Projects navigation bar, click Workspace.
3) On the Workspace page, expand the Project Health portlet.
Project Issues Portlet of the Workspace Page
Overview
Use this portlet to view information about issues that belong to the project. The
information that appears depends on the display format and customize options you
select.
Screen Elements
Add link
Enables you to create a new project issue. You can select the issue form you want to
use to create the issue, then subsequently use the Add Issue page to record basic
issue information, such as responsible manager, owner, priority, and a description.
Expand All/Collapse All link
Shows or hides the contents of each group of issues. To show or hide the contents of a
single group of issues, click or beside the grouping band. You can specify
grouping options when you customize the issues list. If you do not have any grouping
options selected, these links are not enabled.

962
Customize link
Displays a dialog box for specifying how you want to filter, group, and sort issues. For
viewing issues in List format, you can specify the columns of information you want to
display. For viewing issues in Chart format, you can specify chart type and color
options. The customize options you choose apply for all users who can access the
Project Issues portlet. Refer to Customizing the Project Issues portlet for more detailed
information. See Customize Project Issues Dialog Box (on page 686).
Display options
Determine the format in which you want to display project issues. The display option
applies for all users who can access the Project Issues portlet.
List: this option displays issues in a list, and enables you to add, edit, or delete
issues. By default, all issues display in the List format, but you can customize the list
to display only the issues you want to see. You can also select the columns of
information you want to display, and choose how to group and sort issues in the
list.
Chart: this option enables you to graphically display issue count information based
on your customized group and filter selections. The Chart format enables you to
graphically display issue count information based on your customized group and
filter selections. When you customize the portlet, you can change these group
and filter options. You can additionally customize the portlet to specify chart type
and color options. To view group by and issue count details, move the mouse over
each bar or slice in the chart.
To view issues in Chart format, you must customize the portlet and select at least one
grouping level option; otherwise, the chart does not display. To select grouping level
options, click Customize and then click the Group tab. To rotate the display of a pie
chart, you can click and drag the chart either clockwise or counter clockwise.
Filter field
The name of the filter currently applied to the portlet. By default, all issues display, but
you can customize the portlet to apply a custom filter. If a custom filter is applied, the
filter description appears in this field, and only those issues that meet the filter criteria
appear for both the List and Chart format.
Issue Name field
The name or description of the issue.
Priority field
The level of importance assigned to the issue.
Owner field
The resource responsible for the selected issue.
If you have edit privileges, you can select a different owner. The list of available
resources you can select from depends upon your resource access security privileges.

Context-Sensitive Help Topics
963
Resolution Date field
The date the selected issue was resolved.
Status field
The current status of the issue: Open, On Hold, Closed.
E-mail field
The e-mail dialog prepopulated with issue details.
Tips
When sorting by a specific issue column in the List format, a indicates the column is
sorted in ascending order, and a indicates the column is sorted in descending order.
To add, edit, or delete an issue, you must have the required security privilege.
To customize the portlet, you must have the required security privilege, as well as the
required access.
All issues that are added to a workgroup, and are then associated with a project
activity, appear as project issues on the Project Issues portlet in the Project
Workspace, as well as on the Issues page.
Project Workspace portlets display data for the selected project only. When multiple
projects are open, you must select the project you want to work with in the Select
Project box at the top right of the Project Workspace. When a single project is open,
the Select Project box does not appear.
Getting Here
1) Click Projects.
2) On the Projects navigation bar, click Workspace.
3) On the Workspace page, expand the Project Issues portlet.
Project Notebooks Portlet of the Dashboards Page
Overview
Use this portlet to view all notebooks assigned to the selected project. In a dashboard,
the Project Notebooks portlet displays all of the notebooks assigned to the projects that
meet the dashboard's selected filter criteria.
Notebooks are used to store and share notes relating to a project. When you add notes
for a given notebook topic, you can enter text and use HTML editing features such as
formatting text and lists, inserting pictures, adding hyperlinks and e-mail links, and
inserting tables.
Screen Elements
Notebook Topic field
The title or name for the notebook topic assigned to the current project.

964
Description field
A web presentation of the notes for the currently selected notebook topic.
Getting Here
1) Click Dashboards.
2) On the Dashboards page, select a dashboard.
3) On the dashboard, expand the Project Notebooks portlet.
Project Preferences Dialog Box
Overview
Use this page to configure project data and settings for the currently open and selected
project, its activities, and related items.
Screen Elements
Calculations page
See Calculations Page of the Project Preferences Dialog Box (on page 604).
Contract Management page
See Contract Management Page of the Project Preferences Dialog Box (on page 645).
Defaults page
See Defaults Page of the Project Preferences Dialog Box (on page 704).
General page
See General Page of the Project Preferences Dialog Box (on page 794).
Progress Reporter page
See Progress Reporter Page of the Project Preferences Dialog Box (on page 950).
Summarization page
See Summarization Page of the Project Preferences Dialog Box (on page 1112).
Getting Here
1) Click Projects.
2) On the Projects navigation bar, click EPS.
3) On the EPS page:
a. Select a project.
b. Click the Actions menu and select Set Project Preferences....

Context-Sensitive Help Topics
965
Project Risks Portlet
Overview
Use this portlet to view information about risks that belong to the selected project. You
can customize the portlet to specify the columns of information you want to display, as
well as the types of risks you want to appear.
Screen Elements
Customize link
Specifies the columns of information you want to display and filters risks based on
status.
Category field
The name for a particular type of risk classification. Use risk categories to identify and
organize project risks consistently throughout your organization.
Technical, Operational, External are examples of risk categories that might apply to a
typical project.
Cause field
The description of the cause of the risk.
Description field
The description of the risk.
Effect field
The resulting effect of the presence of the risk.
ID field
The unique identifier for the risk.
Name field
The name of the risk.
Notes field
The notes or comments entered for the associated with the risk.
Owner field
The resource that has ownership of the risk.
Status field
The status of the response action item. The response action item usually goes through
a process from being proposed to sanctioned, and then if it is not rejected it is
planned into the project.

966
Proposed: The default status. Action has been proposed.
Sanctioned: The action has been proposed and sanctioned.
Rejected: The action has been proposed and then rejected. This action is not used
to drive the post-response position and its cost is not included in the Total Cost.
In-Progress: The response action item has started and there is some work still
remaining.
Complete: The response action item has been completed.
Type field
The type of risk.
User Defined field
Fields defined by your P6 administrator that are not standard in the application, but
are necessary to capture additional data for the project or the company.
Getting Here
1) Click Projects.
2) On the Projects navigation bar, click Workspace.
3) On the Workspace page, expand the Project Risks portlet.
Project Score Section of Global Tab of the My Preferences Page
Overview
Use this section to configure how the project score is calculated.
Screen Elements
Calculate Project Score based on selected Project Codes option
Determines whether to calculate project scores based on project codes.
Project Codes link
Displays a dialog box with configurable options to determine what project code to
select for the project score. See Customize Project Score Dialog Box of the Project
Score Section of the Global Tab of the My Preferences Page (on page 687).
High is greater than or equal to: field
The high value will be greater than or equal to the value entered in this field.
Medium is greater than or equal to: field
The medium value will be greater than or equal to the value entered in this field.
Low is greater than:0
Indicates that the low value must be greater than 0.

Context-Sensitive Help Topics
967
Getting Here
1) Click the Administer menu and select My Preferences.
2) On the My Preferences page, click the Global tab.
3) On the Global tab, expand the Project Score section.
Project Section of the Content Tab of the Customize Workspace Page
Overview
Use this section to configure the core project data portlets you want to show on the
Workspace page. This includes issues, risks, notebooks, documents, activities, and
milestones.
Screen Elements
Project Documents option
Determines whether to display the Project Documents portlet.
In this portlet, users can add, view, download, and check out project documents.
Advanced document management capabilities are available when the optional
Content Repository is configured for use.
Allow Team Members to view this section option
Determines whether team members can view the portlet.
Project Risks option
Determines whether to display the Project Risks portlet.
Users can view, but not add or edit, project risks.
Customize link
Displays a dialog box or page that allows you to configure the current page, tab,
dialog box, or portlet. See Customize Risks Dialog Box.
Project Issues option
Determines whether to display the Project Issues portlet.
Users with OBS access to the project can add and edit issues if they are assigned the
required project privilege. Users without OBS access to the project can view, but not
add or edit, project issues.
Customize link
Displays a dialog box or page that allows you to configure the current page, tab,
dialog box, or portlet. See Customize Project Issues Dialog Box (on page 686).
Project Notebooks option
Determines whether to display the Notebook Topics portlet.

968
Overallocated Resources option
Determines whether to display the Overallocated Resources portlet.
This portlet lists the name and role of each project resource who is overallocated. You
can click a resource name to view allocation details.
Critical Activities Behind Schedule option
Determines whether to display the Critical Activities Behind Schedule portlet.
Users can view all activities behind schedule for the project. For users without OBS
access to the project, all activity details accessed from this portlet are read-only. For
users with OBS access to the project, users can edit activity details accessed from this
portlet if they have the appropriate security privileges and are a resource on the
activity or are the activity owner.
Milestone Status option
Determines whether to display the Milestone Status portlet where users can view
milestones for the project.
Users with OBS access to the project can edit activity details accessed from this
portlet if they have the appropriate security privileges and are a resource on the
activity or are the activity owner. For users without OBS access to the project, all
activity details accessed from this portlet are read-only.
Displays milestones completed <#> days before today and field
The number of days to display completed milestones prior to the current date.
Completed and not completed <#> days after today field
The number of days to display completed and not completed milestones after the
current date.
Getting Here
1) Click Projects.
2) On the Projects navigation bar, click Workspace.
3) On the Workspace page, click Customize.
4) On the Workspace Details page, click the Content tab.
5) On the Content tab, expand the Project section.
Project Security Profiles Page
Overview
Use this page to configure project security profiles and define assigned privileges. Define
specific privileges for the profile using the detail windows. The options you configure on
each detail window apply to the selected profile.

Context-Sensitive Help Topics
969
Screen Elements
Project Security Profiles toolbar
See User Access Security Profiles Toolbar (on page 1358).
Profile Name field
The name of the global security profile.
Description field
The full description for the profile.
Default field
Default option is to assign this security profile to new users.
Note: Only one profile can be the active default.
Assigned Privileges field
View privileges assigned to the profile.
Project Security Profiles detail windows
Activities Detail Window of the Project Security Profiles Page (on page 543)
Codes Detail Window of the Project Security Profiles Page (on page 624)
EPS and Projects Detail Window of the Project Security Profiles Page (on page 750)
Project Data Detail Window of the Project Security Profiles Page (on page 954)
Related Applications Detail Window of the Project Security Profiles Page (on page
983)
Resource Assignments Detail Window of the Project Security Profiles Page (on page
998)
Timesheets Detail Window of the Project Security Profiles Page (on page 1125)
Tools Detail Window of the Project Security Profiles Page (on page 1129)
Views and Reports Detail Window of the Project Security Profiles Page (on page 1153)
Getting Here
1) Click the Administer menu and select User Access.
2) On the User Access page, click Project Security Profiles.

970
Project Statistics Page
Overview
Use this page to view project information in columns of your choice, down to the WBS
level. For each WBS level, you can view a list of activities and their resource assignments.
The activity and resource assignment lists are customizable, allowing you to select the
columns of data you are interested in. You can also export the contents of the page to a
comma separated value (.csv) file suitable for use with a spreadsheet application such
as OpenOffice Calc or Microsoft Excel.
Note: Data is current as of the last date the summarizer service was
run for the project. To determine the date a project was last
summarized, you can add the column Last Summarized Date. This
column is available under the Summary section of the Available
Columns list.
For the project element you select in the Project Statistics portlet, the page displays a
summary row and a row for each component one level down from the project element
you selected. For example, selecting a project in the Project Statistics portlet displays a
summary row for the project and individual statistics rows for each top-level WBS element
in the project.
Screen Elements
Export Spreadsheet link
Exports the current project data to a .csv file.
Customize link
Displays a dialog box or page that allows you to configure the current page, tab,
dialog box, or portlet.
Name field
The name of the project, code, EPS node, or portfolio.
Project Owner field
The resource designated as responsible for the project.
The project owner designation provides a user with viewing access for the project.
Start field
The date that the remaining work for the project element is scheduled to begin.
This date is computed by the project scheduler. Before the project starts, the
remaining start date is the same as the planned start date.
Finish field
The date that the remaining work for the project element is scheduled to finish.

Context-Sensitive Help Topics
971
This date is computed by the Project Scheduler. Before the project starts, the
remaining finish date is the same as the planned finish date.
Tips
The same columns appear in both the Project Statistics portlet and the Project Statistics
page; customizing the columns in one location automatically changes the other
location.
Getting Here
You can access the Statistics page from the Project Statistics portlet in a dashboard or
the Project Workspace. In a dashboard, the portlet displays project data based on the
dashboard's specified portfolio, project, or project code filter. In a Project Workspace,
portlet data is project-specific.
From the Workspace page:
1) Click Projects.
2) On the Projects navigation bar, click Workspace.
3) On the Workspace page, expand the Project Statistics portlet and click a project
name.
From the Dashboards page:
1) Click Dashboards.
2) On the Dashboards page, select a dashboard.
3) On the dashboard, expand the Project Statistics portlet and click a project name.
Project Statistics Portlet
Overview
Use this portlet to analyze project information in row and column format for a particular
project or project group. Depending on your information needs, you can customize the
portlet to select the columns of information you want to appear, and specify the display
format to analyze data in a way that is meaningful to you.
The information displayed in the portlet depends upon where it appears:
In a dashboard, the portlet displays the information you select down to the WBS level
for all projects included in the current dashboard filter. For example, if you filter a
dashboard by a portfolio, the Project Statistics portlet displays data for all projects
included in that portfolio.
In a project workspace, the portlet displays the information you select down to the
WBS level for the currently open project.

972
Screen Elements
Customize link
Displays a dialog box or page that allows you to configure the current page, tab,
dialog box, or portlet. See Customize Project Statistics Dialog Box (on page 688).
Display List option
Displays the projects in a list by the code or portfolio used to filter the dashboard.
When you display the portlet using the list format, each project and WBS appear as
hyperlinks you can click to navigate to successively deeper levels within the project.
Display Group option
Displays the projects in a hierarchical table you can expand and collapse. When you
display the portlet using the group format, each project and WBS appear as levels or
nodes you can click to expand successively deeper levels within the project.
Name field
The name of the project, portfolio, project code, or WBS.
Project Owner field
The resource designated as responsible for the project.
The project owner designation provides a user with viewing access for the project.
Start field
The date that the remaining work for the project element is scheduled to begin.
This date is computed by the project scheduler. Before the project starts, the
remaining start date is the same as the planned start date.
Finish field
The date that the remaining work for the project element is scheduled to finish.
This date is computed by the Project Scheduler. Before the project starts, the
remaining finish date is the same as the planned finish date.
Tips
Information displayed in the Project Statistics portlet is based on summarized data, so
it is current as of the last date the summarizer was run for a project. To easily
determine this date, add the column Last Summarized Date, which is available under
the Summary section of the Available Columns list when you customize the portlet.
However, activity-level information is based on live data.
To specify filter criteria for a dashboard, use the Filter by list at the top of the
dashboard tab. For any dashboard you create, you can select to filter data by
portfolio, project, or project code; for multi-user and global dashboards created by
other users, your ability to change the filter is determined by the Restrict users from
changing the dashboard filter setting on the Customize Dashboards page.

Context-Sensitive Help Topics
973
Project Workspace portlets display data for the selected project only. When multiple
projects are open, you must select the project you want to work with in the Select
Project list at the top right of the Workspace page. When a single project is open, the
Select Project list does not appear.
Getting Here
From the Workspace page:
1) Click Projects.
2) On the Projects navigation bar, click Workspace.
3) On the Workspace page, expand the Project Statistics portlet.
From the Dashboards page:
1) Click Dashboards.
2) On the Dashboards page, select a dashboard.
3) On the dashboard, expand the Project Statistics portlet.
Project Tab of the Activity Codes Page
Overview
Use this tab to configure all project activity codes and values specific to the projects you
select.
Screen Elements
Toolbar
See Activity Codes Toolbar (see "Enterprise Data Activity Codes Toolbar" on page
1255).
Name field
This field displays the name of an activity code or value. Activity codes enable you to
categorize activities into logical groups based on your organization's criteria. You can
define unlimited hierarchical activity codes to fulfill the filtering, sorting, and reporting
requirements for your activities, and arrange them hierarchically for easier
management and assignment. Project activity codes categorize activities based on
specific features within a project.
Description field
This field shows the description you entered for the activity code or value.
Maximum Length field
Indicates the maximum length for an activity code or value. The value cannot
exceed the maximum character length specified for the activity code.

974
Color field
The color for the activity code value.
Tips
You can specify the maximum number of project-level activity codes that can be
defined for a project and maximum tree levels on the Data Limits tab of Admin
Preferences in P6.
Getting Here
1) Click the Projects menu and select Enterprise Project Data, or click the
Administer menu and select Enterprise Data.
2) In the Enterprise Data pane, expand Activities and click Activity Codes.
3) On the Activity Codes page, click the Project tab.
Project Tab of the Documents Page (with content repository)
Overview
Use this tab to view a list of projects and their associated documents.
Screen Elements
Project Tab toolbar
See Project Tab Toolbar of the Documents Page (on page 1319).
Document Details section
See Document Details Section of the Documents Page (with content repository) (on
page 717)
Getting Here
1) Click Projects.
2) On the Projects navigation bar, click Documents.
3) On the Documents page, click the Project tab.
Project Tab of the Documents Portlet of the Workgroup Workspace Page
Overview
The Project tab contains all of the project documents that have been added to the
portlet.

Context-Sensitive Help Topics
975
Screen Elements
Project Tab toolbar
See Project Tab Toolbar of the Documents Portlet of the Workgroup Workspace Page
(on page 1322).
Title field
The activity name and all of its associated documents.
Version field
The document's version or revision number.
Creation Date field
The date and time that the selected document was created.
Modified Date field
The date and time the document was last modified.
Getting Here
From the Workspace page:
1) Click Projects.
2) On the Projects navigation bar, click Workspace.
3) On the Workspace page, expand the Workgroups portlet and select a workgroup.
4) On the Workgroup Workspace page, expand the Documents portlet and click the
Project tab.
From the Dashboards page:
1) Click Dashboards.
2) On the Dashboards page, select a dashboard tab.
3) On the dashboard tab, expand the My Workgroups portlet.
4) In the My Workgroups portlet, expand a project and select a workgroup.
5) On the Workgroup Workspace page, expand the Documents portlet and click the
Project tab.
Project Tab of the Project Documents Portlet of the Workspace Page (with content repository)
Overview
Use this tab to view all of the documents that have been added to the project.

976
Screen Elements
Project Tab toolbar
See Project Tab Toolbar of the Project Documents Portlet (on page 1323).
Title field
Displays the name of the project and the titles of all associated documents.
Version field
The document's version or revision number.
Creation Date field
The date and time that the selected document was created.
Modified Date field
The date and time the document was last modified.
Getting Here
1) Click Projects.
2) On the Projects navigation bar, click Workspace.
3) On the Workspace page, expand the Project Documents portlet and click the Project
tab.
Project UDFs Page
Overview
Use this page to create and configure user defined fields for projects.
Screen Elements
User Defined Field field
The name of the user-defined field.
Data Type field
The name of the type of data that corresponds to each user-defined field. The data
type you select determines the type of data you can specify in a field. The following
data types are available:
Text: Allows you to use text or a combination of text and numbers.
Start Date: Allows you to enter Start Date information only.
Finish Date: Allows you to enter Finish Date information only.
Cost: Allows you to enter currency values.
Number: Allows you to use numerals with two decimal places.
Integer: Allows you to use numeric data, but not a number related to money.

Context-Sensitive Help Topics
977
Indicator: Allows you to use an indicator field that you can use to enter
color-coded icon values in columns and display color-coded text in reports.
UDF Type field
Indicates whether a formula is specified for the field. A formula is any custom
calculation created for the field to automatically determine field values.
Indicator field
Indicates that at least one graphical indicator is defined for the project user defined
field. A graphical indicator is any icon selected to display based on criteria set for
field values.
Display Data Value field
Determines whether the value of the calculated UDF displays in the column.
Display Indicator field
Determines whether the indicator of the calculated UDF displays in the column.
Formula detail window
See Formula Detail Window of the Project UDFs Page (on page 774).
Indicators detail window
See Indicators Detail Window of the Project UDFs Page (on page 841).
Summary Indicators detail window
See Summary Indicators Detail Window of the Project UDFs Page.
Getting Here
1) Click the Projects menu and select Enterprise Project Data, or click the
Administer menu and select Enterprise Data.
2) In the Enterprise Data pane, expand Projects and click Project UDFs.
Projects Checked Have Links to the Following Closed Projects Section of the Schedule Check
Report Dialog Box
Overview
Use this section to view any closed projects that have relationships to or from the projects
being checked. The details of these relationships are displayed at the end of the report.
Screen Elements
Closed Project ID field
The identifying code of the closed project that is linked to the currently open project.

978
Closed Project Description field
The brief description of the closed project which is linked to the currently open
project.
Data Date field
The date used as the starting point to calculate the schedule. Each project has its
own data date.
Links to/from Closed Project field
The number of links between the closed project and the open projects that were
checked.
Getting Here
1) Click Projects.
2) On the Projects navigation bar, click Activities.
3) On the Activities page, click the Actions menu and select Run Check
Schedule....
4) In the Check Schedule dialog box, configure the options and click Check Schedule.
5) In the Schedule Check Report dialog box, expand the Projects Checked have links to
the following Closed Projects section.
Projects Checked Section of the Schedule Check Report Dialog Box
Overview
Use this section to view projects that were checked and included in the report.
Screen Elements
Project ID field
The unique identifying code for each project that the application checked.
Project Description field
The brief description of the project.
Data Date field
The date used as the starting point to calculate the schedule. Each project has its
own data date.
Total Activities field
The number of activities in the project.
Complete Activities field
The total number of activities in the project with an actual finish date.

Context-Sensitive Help Topics
979
Total Links field
The total number of links to or from activities in open projects. This number includes
links that exist between activities in open projects and activities in closed projects.
Getting Here
1) Click Projects.
2) On the Projects navigation bar, click Activities.
3) On the Activities page, click the Actions menu and select Run Check
Schedule....
4) In the Check Schedule dialog box, configure the options and click Check Schedule.
5) In the Schedule Check Report dialog box, expand the Projects Checked section.
Projects Detail Window of the Risk Scoring Matrices Page
Overview
Use this detail window to add or remove projects for the selected risk scoring matrix.
Screen Elements
Add (Insert)
Adds a project to the currently selected risk scoring matrix. A risk scoring matrix must
be assigned to a project to perform qualitative analysis on project risks.
Delete (Delete)
Deletes or removes the currently selected data items or table rows.
Caution: Your selected data is permanently deleted once you click Save.
Project ID field
The unique identifier of the project associated with the risk.
Project Name field
The name of the associated project.
Getting Here
1) Click the Projects menu and select Enterprise Project Data, or click the
Administer menu and select Enterprise Data.
2) In the Enterprise Data pane, expand Risks and click Risk Scoring Matrices.
3) On the Risk Scoring Matrices page, click the Projects detail window.

980
Projects Page
Overview
Use this page to plan projects and manage them to completion.
Screen Elements
Workspace
Displays the Workspace page in the Projects section, which enables you to display
specified, as well as create, custom portlets. These portlets will display information
directly related to specific projects which enables you to focus on the project data
you want to monitor most often.
EPS
Displays the EPS page in the Projects section, which enables you to view the
hierarchical structure of the project database. This page is defined within P6 and is
used, among other things, to implement and maintain secure access to project data
throughout the enterprise.
Activities
Displays the Activities page in the Projects section which enables you to switch
between views and manage multiple views with various features. This page includes
customizable table, calendar, Gantt chart, and Activity Network views.
Team Usage
Displays the Team Usage page in the Projects section, which enables you to display
timescaled information in histogram or spreadsheet format. This page displays costs or
usage data at the team level and for individual roles and resources assigned to the
project with which you are currently working.
Issues
Displays the Issues page in the Projects section, which provides filtering and charting
features in addition to the capability to add issues and display issue details. This page
lists issues for the open project or project group.
Risks
Displays the Risks page in the Projects section, which enables you to customize the
page to specify which types of risks you want to view. The Risks page displays
information about the risks that belong to the selected project.
Context-Sensitive Help Topics
981
Documents
Displays the Documents page in the Projects section, which enables you to view,
check in, check out, and download selected documents from one or more projects.
With appropriate privileges, you can edit document information or use a selected
document as a template for creating new documents of the same type for multiple
projects.
Getting Here
Click Projects.
Rate Types Page
Overview
Use this page to create a title for each of the five available Price/Unit fields. The title
should describe what the rate type represents. It will appear wherever the rate types are
displayed in a list or column.
Screen Elements
Rate Types toolbar
See Rate Types Toolbar (see "Enterprise Data Rate Types Toolbar" on page 1276).
Default Title field
Displays the default title for the Rate Type. This field is read-only.
User Defined Title field
A title that you create to correspond with the Default Title. The title should describe
what the rate type represents, such as External or Internal Rate.
Getting Here
To access enterprise data:
1) Click the Administer menu and select Enterprise Data.
2) In the Enterprise Data pane, expand Resources and click Rate Types.
To access enterprise resource data:
1) Click the Resources menu and select Enterprise Resource Data.
2) In the Enterprise Resource Data pane, click Rate Types.

982
Recent Documents Tab of the My Documents Portlet
Overview
Use this tab to view project documents on which you have performed some recent
action. For example, all documents that you have created, viewed, downloaded, or
checked out appear in this folder. The Recent Documents tab lists up to fifty documents,
grouped by project. Click next to a project name to view documents associated with
the project.
Screen Elements
Recent Documents toolbar
See Private Documents Toolbar (on page 1316).
You can customize the following columns, using the Customize Columns button on the toolbar.
Title field
The identifying name of the document.
Version field
The latest or most current version of the document.
Project field
The name of the associated project.
Access Time field
The date and time the document was last accessed.
Getting Here
1) Click Dashboards.
2) On the Dashboards page, select a dashboard.
3) On the dashboard, expand the My Documents portlet and click the Recent
Documents tab.
Reject Document Review Dialog Box
Overview
Use this dialog box to reject a document and make comments.
Screen Elements
Name field
The name of the review.

Context-Sensitive Help Topics
983
Description field
Displays the description, if provided, in a read-only field.
Initiator field
Displays the name of the initiator of the document review in a read-only field.
Due Date field
The date all reviewers need to complete the review. If no due date is specified for the
review, then this field appears blank.
Comments field
Enter comments of the document review. (This field is optional.)
Attachments field
Click to search and select a file to attach. (This field is optional.)
Reject button
Click to reject the document review and send any comments and/or attachments
included.
Getting Here
1) Click Dashboards.
2) On the Dashboards page, select a dashboard.
3) On the dashboard, expand the Document Reviews portlet and click the Action
Required tab.
4) On the Action Required tab, select an action and click the Reject Document.
Related Applications Detail Window of the Project Security Profiles Page
Overview
Use this detail window to assign related applications privileges to the selected project
security profile.
Screen Elements
Privilege field
The name of the security permission that is assigned (option selected) or denied
(option cleared) to users of the currently selected profile.
Privilege option
The option in the column header that determines whether the privileges are all
assigned (selected), all denied (clear), or individually configured (indicated with a
dash or - sign).

984
Import/View Contract Management Data option
Determines whether the profile will enable users to import and display data from
Contract Management in P6 Professional.
Administer Project External Applications option
Determines whether the profile will enable users to modify entries in the External
Applications feature in P6 Professional.
Getting Here
1) Click the Administer menu and select User Access.
2) On the User Access page, click Project Security Profiles.
3) On the Project Security Profiles page, click the Related Applications detail window.
Related Items Section of the Document Details Page (without content repository)
Overview
Use this section to view all items that are related to the document by name and
description. Related items can include activities, documents, WBS, or issues.
Screen Elements
Name field
The name of the related item.
Description field
A more detailed summary for the item. The description provides more information
than short names or titles. It can give background information or establish a purpose
for the item. These details help differentiate between items with similar names and are
especially useful in multi-user environments.
Relate Activities or WBS link
Enables you to select an activity or a WBS to associate with the currently selected
document. See Working with 'Select a Value' Dialog Boxes for further details.
Relate Issue link
Enables you to select an issue to relate to the currently selected document. See
Working with 'Select a Value' Dialog Boxes for further details.
Relate Documents link
Enables you to select a document to relate to the currently selected document. See
Working with 'Select a Value' Dialog Boxes for further details.

Context-Sensitive Help Topics
985
Remove link
Removes the selected related item. You must first select the option beside an item's
name before you click the Remove link.
Getting Here
From the Documents page:
1) Click Projects.
2) On the Projects navigation bar, click Documents.
3) On the Documents page:
a. Select a project from the Select Project list if applicable.
b. Select a document from the left pane.
4) On the Document Details page, expand the Related Items section.
From the Workspace page:
1) Click Projects.
2) On the Projects navigation bar, click Workspace.
3) On the Workspace page:
a. Select a project from the Select Project list if applicable.
b. Expand the Project Documents portlet.
4) In the Project Documents portlet, expand the project and select a document.
5) On the Document Details page, expand the Related Items section.
Related Items Tab of the Document Details Section (with content repository)
Overview
Use this tab to view all items that are related to the document by name and description.
Related items can include activities, documents, WBSs, or issues.
Screen Elements
Related Items toolbar
See Related Items Toolbar of the Project Tab (on page 1327).
Name field
The name of the project, code, EPS node, or portfolio.
Description field
A more detailed summary for the item. The description provides more information
than short names or titles. It can give background information or establish a purpose
for the item. These details help differentiate between items with similar names and are
especially useful in multi-user environments.

986
Tips
The document you select and where you access it can change which tabs are visible.
Getting Here
From the Documents page:
1) Click Projects.
2) On the Projects navigation bar, click Documents.
3) On the Documents page, click the Project tab.
4) On the Project tab, select a document and click the Related Items tab.
From the Dashboards page:
1) Click Dashboards.
2) On the Dashboards page, select a dashboard tab.
3) On the dashboard tab, expand the My Documents portlet and click the Private
Documents tab.
4) On the Private Documents tab, select a document and click Edit Details.
5) In the Document Details dialog box, click the Related Items tab.
From the Workspace page:
1) Click Projects.
2) On the Projects navigation bar, click Workspace.
3) On the Workspace page, expand the Project Documents portlet and click the Project
tab.
4) On the Project tab, select a document and click Edit Details.
5) In the Document Details dialog box, click the Related Items tab.
Relationship Types - The Majority of Relationships Should be Finish to Start Section of the
Schedule Check Report Dialog Box
Overview
Use this section to view the percentage of each relationship type in the schedule. To
ensure schedule stability, the majority of relationships should be Finish to Start.
Only a subset of all the internal and external links in the open projects are checked. Any
links between activities that both have actual finish dates are removed from the subset
to create the list of links checked for relationship type. The Actual percentage is
calculated as the number of links found that match the check divided by the total
number of subset links checked.

Context-Sensitive Help Topics
987
Screen Elements
Relationship Type field
The relationship between two activities. See About Relationships for more information
on relationship types.
Count field
The number of relationships of that type.
% field
The percentage of that type of relationship. Calculated as the number of
relationships of a certain type divided by total relationships checked.
Predecessor Project ID field
The identifying code for the project containing the predecessor activity that failed
the check.
Predecessor Activity ID field
The identifying code for the predecessor activity that failed the check.
Predecessor Activity Description field
The brief description of the predecessor activity.
Lag Duration (hours) field
The number of hours of lag duration.
Successor Project ID field
The identifying code of the project that contains the successor activity.
Successor Activity ID field
The identifying code of the successor activity.
Successor Activity Description field
The brief description of the successor activity.
Getting Here
1) Click Projects.
2) On the Projects navigation bar, click Activities.
3) On the Activities page, click the Actions menu and select Run Check
Schedule....
4) In the Check Schedule dialog box:
a. Select the Relationship Types - The majority of relationships should be Finish to Start
option.
b. Click Check Schedule.

988
5) In the Schedule Check Report dialog box, expand the Relationship Types - The
majority of relationships should be Finish to Start section.
Relationships Details Page of the Activity Form Page
Overview
Use this page to add predecessor and successor activities or to remove a relationship.
Screen Elements
Activity field
The name of the activity.
Relationship Type field
The relationship between two activities. Select from the following types:
Finish to Start: A relationship in which the start of a successor activity depends on
the completion of its predecessor activity. This is the default activity relationship.
Finish to Finish: A relationship in which the finish of a successor activity depends on
the finish of its predecessor activity.
Start to Start: A relationship between activities in which the start of a successor
activity depends on the start of its predecessor.
Start to Finish: A relationship between activities in which a successor activity
cannot complete until its predecessor activity starts.
Lag field
The amount of time the predecessor activity was delayed, affecting the ability of its
successor activity to start or finish.
Delete Relationship button
Deletes the current relationship.
Getting Here
From the Workgroup Workspace page:
1) Click Projects.
2) On the Projects navigation bar, click Workspace.
3) On the Workspace page, expand any portlet containing activities.
4) In the portlet, click an activity.
5) On the Activity Form page, expand the Relationships section and select an activity
from the Predecessors or Successors section.
From the Dashboards page:
1) Click Dashboards.

Context-Sensitive Help Topics
989
2) On the Dashboards page, select a dashboard tab.
3) On the dashboard tab, expand any portlet containing activities.
4) In the portlet, click an activity.
5) On the Activity Form page, expand the Relationships section and select an activity
from the Predecessors or Successors section.
Relationships Section of the Activity Form Page
Overview
Use this section to select the appropriate option to view a list of the activity's
predecessors or successors, along with status, dates, and primary resource contact
information.
Screen Elements
Predecessors section
See Predecessors Section of the Relationships Section of the Activity Form Page (on
page 945).
Successors section
See Successors Section of the Relationships Section of the Activity Form Page (on
page 1111).
Getting Here
From the Workgroup Workspace page:
1) Click Projects.
2) On the Projects navigation bar, click Workspace.
3) On the Workspace page, expand any portlet containing activities.
4) In the portlet, click an activity.
5) On the Activity Form page, expand the Relationships section.
From the Dashboards page:
1) Click Dashboards.
2) On the Dashboards page, select a dashboard tab.
3) On the dashboard tab, expand any portlet containing activities.
4) In the portlet, click an activity.
5) On the Activity Form page, expand the Relationships section.

990
Report Settings Dialog Box
Overview
Set the options on this dialog box to determine how your on-demand report output will
be generated, formatted, and delivered.
Screen Elements
Report Name field
The title for the report defined in BI Publisher.
File Name field
The name assigned to the report file.
Template list
The template you want to use to apply style to the report data.
Format list
The file formats that you can use for file output.
Delivery Type field
The way users will access or take delivery of this report. On-demand reports can be
delivered by electronic mail as attachments or downloaded as files. You can only
deliver scheduled reports by electronic mail.
E-mail Options button
Launches the E-mail Options dialog box used to enter all e-mail recipients for the
selected report.
Notification options
Determines the types of e-mail status notifications the user who scheduled the report
should receive when the scheduled report attempts to run.
Report Completed option: Determines whether e-mail is sent if the report is delivered
without errors.
Report Complete with warnings option: Determines whether e-mail is sent if the report
is delivered, but has errors.
Report Failed option: Determines whether e-mail is sent if the report failed to run.
Report Parameters table
If a report has field parameters predefined in BI Publisher, they will appear here in P6. You
must specify report parameter values in order to generate valid output. For example, a
weekly timesheet compliance report would require that you specify the start and finish
dates for the target period of the report.

Context-Sensitive Help Topics
991
Caution: To avoid system performance issues, be as specific as
possible when entering values for reports. Narrow down your
choices to include only what is absolutely necessary.
Field Name field
The key field used by P6 to construct valid data for each specific instance of report
output.
Value field
The parameter value for the field shown in the field Name column. The field changes
to a picklist, date editor, check box, combo box, or a text field depending on the
settings pre-defined for the field Name. The data entered in a text field must be
accurate, otherwise the report will fail to run.
Example: Jay in Accounting would like to run a report showing
data derived from three active projects, X, Y, and Z. Janice, VP of
Strategic Development, wants the same report but is only
concerned at the moment with Project Y. They each
independently schedule the same report; however, they specify
different report parameter values for Project ID:
Jay: Project X, Project Y, Project Z
Janice: Project Y
Getting Here
From the Reports view:
1) Click Reports.
2) On the Report page:
a. Click View and select Reports.
b. Select a report, and then click Run Report.
From the Schedules view:
1) Click Reports.
2) On the Reports page:
a. Click View and select Schedules.
b. Select a report, and then click Run Schedule ASAP.
Report Settings Dialog Box (Add Report Schedule)
Overview
Use this dialog box to define scheduling options, including run frequency and dates,
report format, delivery method, and report parameters.

992
Screen Elements
Report Settings dialog box tabs:
Options Tab of the Report Settings Dialog Box (on page 914)
Schedule Tab of the Report Settings Dialog Box (on page 1066)
Getting Here
From a report:
1) Click Reports.
2) On the Reports page:
a. Click View and select Reports.
b. Select a report, and then click the Schedule detail window.
3) In the Schedule detail window, click Add (Insert).
From a report schedule:
1) Click Reports.
2) On the Reports page:
a. Click View and select Schedules.
b. Select a schedule, and then click Replicate Schedule.
To view the report settings in read-only mode for scheduled report runs:
1) Click Reports.
2) On the Reports page:
a. Click View and select Schedules.
b. Select a schedule, and then click Schedule Details.
Reports Page
Overview
Use this page to manage, run, and schedule the reports available to you. The
arrangement of reports, including folder names and structure, is determined in BI
Publisher.
The Reports page can generally be used two ways based on your View list setting:
choose Reports to select a single report at the top and schedule it at the bottom, or
choose Schedules to select one of your own scheduled instances of a report at the top
and only view a description at the bottom.
Screen Elements
Reports View
See Reports View of the Reports Page (on page 993).

Context-Sensitive Help Topics
993
Schedules View
See Schedules View of the Reports Page (on page 1068).
Getting Here
Click Reports.
Note: If Reports is not visible on the P6 navigation bar, confirm that
your administrator has granted you the Enterprise Reports option in
the Module Access field.
Reports View of the Reports Page
Overview
Use this page to manage, run, and schedule the reports available to you. The
arrangement of reports, including folder names and structure, is determined in BI
Publisher.
Screen Elements
Reports toolbar
See Reports View Toolbar (on page 1328).
Report Name field
The title for the report defined in BI Publisher.
Default Format field
The standard or proprietary file format automatically used to deliver each instance of
the report. You can schedule another instance of a report where you change the
actual format that is applied to another format listed in the Available Formats field.
For example, the default might be XML but you can decide to format the specific
report instance as PDF or Microsoft Excel.
Default Template field
The common template automatically used to apply style to the raw data in the
report.
Available Formats field
The permitted file formats that can be used for file output.
The file types available for output in P6 are specified in BI Publisher. One or more of the
following outputs types are available:
HTML (.htm): The standard hypertext markup language file format used for web
pages.

994
MHTML (.mht): The variant of HTML used to combine related external files such as
images or audio with markup code into a single file for ease and portability.
XML (.xml): Standard extensible markup language file format.
PDF (.pdf): The Adobe Portable Document Format.
RTF (.rtf): Rich text format suitable for use with common word processor
applications.
Microsoft Excel (.xls): The spreadsheet data file format for Microsoft Excel.
Microsoft Excel 2000 (.xls): An older variant of the spreadsheet data file format for
Microsoft Excel 2000.
Microsoft PowerPoint (.ppt): The popular presentation or slideshow file format from
Microsoft.
Available Templates field
The permitted templates that you can use to apply styles to the raw data in the
report.
A report template is a set of style rules applied to a report in order to best format and
present its data. You can design templates using BI Publisher and also determine
which templates should be available for users to apply to their reports.
Reports view detail windows:
Description Detail Window of the Reports Page (on page 711)
Schedule Detail Window of the Reports Page (on page 1061)
Getting Here
1) Click Reports.
2) On the Reports page, click View and select Reports.
Note: If Reports is not visible on the P6 navigation bar, confirm that
your administrator has granted you the Enterprise Reports option in
the Module Access field.
Request for Information (RFI) Portlet of the Workspace Page
Overview
Use this portlet to view the number of requests for information (RFI) based on status that
exist for the project in Contract Management. If you have a valid user name and
password, you can additionally access Contract Management from this portlet to view a
list of requests for a specific status.

Context-Sensitive Help Topics
995
Screen Elements
Request for Information (RFI) portlet
The total number of RFIs, as well as the number of approved, closed, and new RFIs.
Place the cursor over a section of the chart to display the number of RFIs for that type.
Click a section to view a list of all requests for a specific status in Contract
Management in a new browser. To view this information here, you must have a valid
user name and password.
Tips
The number at the top of the portlet indicates the total number of project requests.
If you have the required security privilege, you can customize the Project Workspace
to specify how RFI information displays in the portlet. The customize options set for the
portlet apply for all projects in the organization. Depending on these options, the
status types that appear in the chart might include:
CLO = Closed
OPN = Open
PRO = Proceed
Getting Here
1) Click Projects.
2) On the Projects navigation bar, click Workspace.
3) On the Workspace page, expand the Request for Information (RFI) portlet.
Resource Analysis Chart Portlet
Overview
Use this portlet to view a variety of chart formats plotting the total (remaining plus
actuals) units or costs for a resource, resource team, or resource code you select.
Note: The Resource Analysis Chart uses summary data, so it reflects
values as of the last date the summarizer was run for the source
projects. Assignment changes within projects after that date will
not be reflected until the projects are again summarized.
The histograms display resource data summarized by calendar in weekly increments.
While the option to create charts with data summarized by financial period is
unavailable from the portlet, you can create histograms and other charts with data
summarized by calendar period or financial period on the Resource Analysis tab of the
Resource Analysis page.

996
Screen Elements
Customize link
Enables you to configure the current chart or change the chart type. See Customize
Chart Dialog Box of the Resource Analysis Chart Portlet (on page 670).
Resource field
The field to select a resource, resource team, or resource code to display in the
Resource Analysis Chart portlet.
Note: The list of resources you can select from includes only
resources you have access to, based on resource security features.
Group By field
Select a field value to determine your preferred option to group your data.
Tips
To display numeric allocation totals for a project or project code, move the mouse
over the corresponding area on a bar.
The Resource Analysis portlet is available for display in a dashboard if your
administrator granted you access to it. If it does not appear, customize a dashboard
to display it.
If you select a resource team or resource code that includes either all material
resources, or a mix of material and labor/nonlabor resources, no chart data displays
for Units. Since these resource types use varying units of measure, for example, time
units for labor versus gallons for a material resource, summing units values for the
team or code would not be meaningful.
An option setting for each project determines whether this view displays summary
data based on resource assignments at the activity or project/WBS level. If you have
the appropriate module access, you can view or change its setting. After opening
the project, click in the Projects navigation bar, then click Settings.
Getting Here
1) Click Dashboards.
2) On the Dashboards page, select a dashboard.
3) On the dashboard, expand the Resource Analysis Chart portlet.

Context-Sensitive Help Topics
997
Resource Analysis Tab of the Analysis Page
Overview
Use the Resource Analysis tab of the Analysis page to evaluate resource usage and costs
in customizable histogram, stacked histogram, area chart, and pie chart formats. You
can examine total units or costs for an individual resource or summary values for all
resources belonging to a resource team or code.
Screen Elements
Group By
Displays options for re-arranging a list of values by grouping them into a hierarchy and
sorting.
Group By list
Select from one of the following options by which to group the available resources:
Resource Hierarchy
Resource Team
Resource Codes
Primary Role
Search
Displays options for finding a specific matching entry or entries based on search
criteria.
Show Legend link
Displays interpretive information about a chart. This option is not available in the Pie
Chart view.
Plan Resources link
Redirects you to the Planning page in order to plan resource and role allocation for a
project or WBS, export resource planning data, and search for resources to allocate
to a project or WBS. See Planning Page (on page 922).
Customize link
Displays a dialog box with configurable options to customize the selected chart type.
See Customize Chart Dialog Box of the Resource Analysis Tab of the Analysis Page (on
page 671).
Chart Type list
The chart options in which to display information.

998
Histogram: A histogram lets you analyze project data in a vertical bar chart
format. You can select a project data field to display on the x-axis and another
field to display on the y-axis of the chart; typically, the x-axis represents
categorical data, and the y-axis represents individual data values.
Stacked Histogram: A stacked histogram is a more sophisticated version of the
histogram. In this type of chart, categorized data can be grouped, or stacked, to
assist with comparisons. A stacked histogram is useful when analyzing relative parts
of a whole.
Area Chart: A line chart that lets you quantitatively analyze data. The space in
between the line and the axis is usually colored.
Pie Chart: A pie chart is a circular chart divided into slices, where each slice
represents a particular group; the size of the slice represents the value of the
selected data field, specific to the group. A pie chart is useful for analyzing relative
parts of a whole.
Filter by field
The portfolio, project code, or project used to filter the displayed data.
Group by field
The project or project code used to group the data retrieved from the selected filter.
Getting Here
1) Click Resources.
2) On the Resources navigation bar, click Analysis.
3) On the Analysis page, click the Resource Analysis tab.
Resource Assignments Detail Window of the Project Security Profiles Page
Overview
Use this detail window to assign resource assignments privileges to the selected project
security profile.
Screen Elements
Privilege field
The name of the security permission that is assigned (option selected) or denied
(option cleared) to users of the currently selected profile.
Privilege option
The option in the column header that determines whether the privileges are all
assigned (selected), all denied (clear), or individually configured (indicated with a
dash or - sign).

Context-Sensitive Help Topics
999
Add/Edit Activity Resource Requests option
Determines whether the profile will enable users to create and modify resource
requests for activities.
Add/Edit/Delete Resource Assignments for Resource Planning option
Determines whether the profile will enable users to assign, modify, and remove
resource assignments on a project or WBS level in Resources. This privilege also
enables users to define search criteria and conduct a search for resource
assignments. For users who do not have this privilege assigned to their profile, the
resource assignment information on the Planning page is read-only for that particular
project or WBS. Since project-level security privileges go down to the WBS level, it is
possible to be able to assign a resource to one WBS in a project and not another.
Add/Edit/Delete Role Assignments for Resource Planning option
Determines whether the profile will enable users to assign, modify, and remove role
assignments on a project or WBS level in Resources. This privilege also enables users to
define search criteria for role assignments. For users who do not have this privilege
assigned to their profile, role assignment information on the Planning page is
read-only for that particular project or WBS. Since project-level security privileges go
down to the WBS level, it is possible to be able to assign a role to one WBS in a project
and not another.
Edit Committed Flag for Resource Planning option
Determines whether the profile will enable users to identify committed resource and
role assignments on a project or WBS level on the Planning page. The
'Add/Edit/Delete Resource Assignments for Resource Planning' project privilege is also
required for this functionality.
Edit Future Periods option
Determines whether the profile will enable users to enter, modify, and delete future
period assignment values in the Original or Planned Units and Remaining (Early) Units
fields of the Resource Usage Spreadsheet using P6 Professional. The 'Add/Edit
Activities Except Relationships' project privilege is also required for this functionality.
Edit Period Performance option
Determines whether the profile will enable users to modify period performance values
for labor and nonlabor units as well as labor, nonlabor, material, and expense costs
using P6 Professional. The 'Add/Edit Activities Except Relationships' and 'View Project
Costs/Financials' project privileges are also required for this functionality.
Getting Here
1) Click the Administer menu and select User Access.
2) On the User Access page, click Project Security Profiles.
3) On the Project Security Profiles page, click the Resource Assignments detail window.

1000
Resource Calendars Page
Overview
Use this page to view or configure resource calendar information and options.
Screen Elements
Resource Calendar toolbar
See Enterprise Data Resource Calendar Toolbar (on page 1276).
Calendar tab
See Calendar Tab of the Resource Calendars Page (on page 607).
Standard Work Week tab
See Standard Work Week Tab of the Resource Calendars Page (on page 1087).
Used By tab
See Used By Tab of the Resource Calendars Page (on page 1136).
Search field
The means to find a project.
Search
Click to display all available options to your specified search criteria entered in the
search field.
Calendar List
Displays a list of all available calendars to view.
Getting Here
To access enterprise data:
1) Click the Administer menu and select Enterprise Data.
2) In the Enterprise Data pane, expand Resources and click Resource Calendars.
To access enterprise resource data:
1) Click the Resources menu and select Enterprise Resource Data.
2) In the Enterprise Resource Data pane, click Resource Calendars.
Resource Codes Page
Overview
Use this page to add and configure resource codes and code values for projects.

Context-Sensitive Help Topics
1001
Screen Elements
Resource Codes toolbar
See Enterprise Data Resource Codes Toolbar (on page 1278).
Name field
You can categorize resources using codes. With potentially hundreds of resources
being used across an enterprise of projects, codes provide another method for
filtering the resources you need to access quickly, or for grouping resources for
analysis and summarization in layouts. You can also use resource codes to group, sort,
and filter resources in profiles and spreadsheets.
Description field
A description of the Resource Code or the Resource Code Value Names.
Maximum Length field
Indicates the maximum length for a resource code or value. The value cannot
exceed the maximum character length specified for the resource code.
Secure option
Secure codes enable privileged users to hide Project, Activity, Issue and Resource
codes from users that do not have security privileges to view them. Secure codes are
structured hierarchically. In other words, if a user is granted add/delete privileges, that
user automatically has edit, assign, and view privileges. If a user is granted edit
privileges, that user is automatically granted assign and view privileges. If a user is
granted assign privileges, that user is automatically assigned view privileges.
Getting Here
1) Click the Resources menu and select Enterprise Resource Data, or click the
Administer menu and select Enterprise Data.
2) In the Enterprise Resource Data pane, expand Resources and click Resource Codes.
Resource Curves Page
Overview
Use this page to add and configure resource curves.
Screen Elements
Resource Curves toolbar
See Enterprise Data Resource Curves Toolbar (on page 1280).
Name field
The name of the resource curve. The name is composed of alpha-numeric characters
or symbols and must be unique.

1002
Resource Curves Curve Definition window
See Curve Definition Detail Window of the Resource Curves Page (on page 659).
Getting Here
1) Click the Resources menu and select Enterprise Resource Data, or click the
Administer menu and select Enterprise Data.
2) In the Enterprise Resource Data pane, expand Resources and click Resource Curves.
Resource Details Page of the Activity Form Page
Overview
Use this page to assign resources and specify details for the resources such as units, costs,
and rate.
Screen Elements
Resource field
The name for the resource. Click the name of a resource to view their usage in a
spreadsheet or histogram format.
Role field
The name of the role.
Primary Resource option
Determines whether the corresponding resource is the activity's primary resource.
Typically, the primary resource is the person responsible for the overall work on the
activity and for updating activity status.
Proficiency field
The skill level of the resource: Master, Expert, Skilled, Proficient, or Inexperienced.
Planned field
The expected number of units required to complete the activity.
Actual field
The exact number of units that have been expended or the total cost that has been
incurred for the selected activity.
Remaining field
The number of units required to complete the activity.
Planned Units/Time field
The planned units per time at which the resource is to perform work on this activity.

Context-Sensitive Help Topics
1003
For example, a person assigned full time would perform 8 hours of work per day. A
department of five people might perform at 5 days per day.
Remaining Units/Time field
The units per time required to complete the activity.
Price/Unit field
The price per time for the resource on this activity.
This price is used to calculate the resource's cost for the activity. When the resource is
assigned to the activity, the resource's price is copied to the assignment based on the
effective date of the price and the activity start date. The assignment price is
refreshed whenever resource prices are synchronized for the project.
Planned field
The planned total cost for the activity, including labor resources, nonlabor resources,
and project expenses.
Calculated as Planned Labor Cost plus Planned Nonlabor Cost plus Planned Expense
Cost.
Actual field
The actual total cost for the activity, including labor resources, nonlabor resources,
and project expenses.
Calculated as Actual Labor Costs plus Actual Nonlabor Costs plus Actual Expense
Costs.
Remaining field
The remaining total cost for the activity, including labor resources, nonlabor
resources, and project expenses.
Calculated as Remaining Labor Costs plus Remaining Nonlabor Costs plus Remaining
Expense Costs.
Curve field
The resource's units and costs distributed over the duration of an activity.
A curve can only be assigned to activities that have a duration type of Fixed Duration
and Units or Fixed Duration and Units/Time.
A manual curve type indicates that the assignment's future period resource
distribution was manually entered in the Resource Usage Spreadsheet of P6
Professional. If you select a different curve type, the manually-entered distribution is
deleted, and the units and costs for the assignment are redistributed according to the
curve you select. Be sure this is the appropriate course of action before replacing a
manual curve with another curve.

1004
Rate Source field
The value that indicates which price/unit will be used to calculate costs for the
assignment, such as Resource, Role, and Override.
When a resource and only a resource is assigned to an activity, the rate source will
automatically equal Resource. When a role and only a role is assigned to an activity,
the rate source will automatically equal Role. When both a resource and role are
assigned to the activity, the rate source can be either Resource or Role determined
by the Rate Source Preference. In any case, the Override value allows you to specify
any other price/unit.
Rate Type field
The price/unit used to calculate costs for the resource or role assignment.
Resources and Roles can have up to five rate types, with each rate type reflecting a
different price/unit. Rate types are defined in P6. When you add a new assignment,
the rate type defaults to the setting specified for the project. When you edit a rate
type and click Save, the Price/Unit is updated to reflect your change, and if the Calc
Cost from Units option is selected, costs are recalculated.
Calc Cost from Units option
Determines whether to override the cost calculation setting that is specified for the
assigned resource or role.
Drive Activity Dates option
Determines whether to override a resource's default setting for the selected activity.
Cost Account field
The cost account associated with the resource.
Delete Assignment link
Deletes the current assignment.
Tips
You can determine the default units/time, overtime factor, and price/unit for an
activity on the Global tab of the My Preferences page.
When you add or remove activity assignments, a setting on the Global tab of the My
Preferences page, which is turned on by default, automatically e-mails affected
resources. To turn off this feature or add a prompt before sending e-mail, clear this
option or mark the option to prompt in the General section of the Global tab.
In the Select Resources and Select Roles windows:
To change the list order, select an option from the Organized by list.
When assigning resources for unstaffed roles, to list only resources who can staff an
assigned role, use the Resources by Role organize option.

Context-Sensitive Help Topics
1005
To search for a role or resource, select the search criteria from the list and type the
search variable, then click Search. Click Clear Results to return to the full resource
or role display.
Getting Here
From the Workgroup Workspace page:
1) Click Projects.
2) On the Projects navigation bar, click Workspace.
3) On the Workspace page, expand any portlet containing activities.
4) In the portlet, click an activity.
5) On the Activity Form page, expand the Resources section and click a resource.
From the Dashboards page:
1) Click Dashboards.
2) On the Dashboards page, select a dashboard tab.
3) On the dashboard tab, expand any portlet containing activities.
4) In the portlet, click an activity.
5) On the Activity Form page, expand the Resources section and click a resource.
Resource Search Criteria Dialog Box
Overview
Use the Resources Search dialog box to search for resources who meet specific
requirements.
Screen Elements
Return to Spreadsheet link
Closes the current dialog box and returns to the Spreadsheet view.
This link does not appear if you arrive at this page from the Open Requests for
Resources portlet from the Dashboard page.
Start/Finish/Total Requested Units field
Displays the information about the activity from the Resource Staffing dialog box.
If more than one activity is selected in the Resource Staffing dialog box, this field
displays the earliest actual/early start of all activities, the latest actual/early finish of all
activities, and the total remaining units of all activities.
Requested Units/Time field
The units/time at which the resource is needed to work on the selected activity.
1006
This field does not display if the activity has a resource curve assigned or when
multiple activities are selected in the Resource Staffing dialog box.
Resource Curve field
The field displays in place of Requested Units/Time if a curve is associated with this
resource assignment.
This field does not display when multiple activities are selected in the Resource
Staffing dialog box.
Define Search Criteria area
The configurable fields to define the search criteria. Defining search criteria enables
you to more accurately identify the type of resource required to staff the role.
Show Results Matching field
Determines what criteria is used in your search.
All search criteria: Finds a resource based on all selections of search criteria that you
select from or enter in the fields of the dialog box.
Any search criteria: Finds a resource based on a random criteria search.
Primary Role field
The name of the primary job title or skill for the resource.
Roles field
The name of the role(s) to use as search criteria. A Primary Role must be identified.
Proficiency field
The skill level of the resource: Master, Expert, Skilled, Proficient, or Inexperienced.
Resource field
The name for the resource. Click the name of a resource to view their usage in a
spreadsheet or histogram format.
Resource Code field
The name of the resource code.
Define Sort Criteria area
The configurable fields used to define the sort criteria.
Sort results by availability option
Determines whether to sort the results by resource availability.
Do not show overallocated resources option
Determines whether to show overallocated resources.

Context-Sensitive Help Topics
1007
Compute availability for date range options
Determines whether to search availability based on the activity start and finish or by a
custom date that you enter.
If multiple activities are selected in the Resource Staffing dialog box the Activity Start
to Finish option uses the earliest early start date and the latest early finish date of all
assignments.
Resource Staffing link
Displays the Resource Staffing dialog box without saving any changes.
Run Search link
Displays a list of available resource who meet the specified criteria. See Resource
Search Results Dialog Box (on page 1008).
Select Template link
Displays a list of preexisting search criteria from which you can select to search by.
Save as Template link
Saves the current search criteria as a template to use again.
Getting Here
From the Analysis page:
1) Click Resources.
2) On the Resources navigation bar, click Analysis.
3) On the Analysis page, click the Role Usage tab.
4) Select a role and select to display the Spreadsheet.
5) In the Spreadsheet, click a project name.
6) In the Resource Staffing dialog box:
a. Click the Unstaffed and Staffed option to show all activities.
b. Select at least one activity and click Search.
From the Team Usage page:
1) Click Projects.
2) On the Projects navigation bar, click Team Usage.
3) On the Team Usage page:
a. If more than one project is open, select a project from the Select Project list.
b. Click the Organized By list and select Roles.
1. Expand a project and select a role in the left pane.
2. Select the Spreadsheet option and click a project in the right pane.
c. In the Resources dialog box:
1. Click the Unstaffed and Staffed option to show all activities.

1008
2. Select one or more activities and click Search.
From the Dashboards page:
1) Click Dashboards.
2) On the Dashboards page, select a dashboard tab.
3) On the dashboard tab, expand the Open Requests for Resources portlet and select
project or a role, depending on your customize options.
4) On the Resource Staffing Details page:
a. Click the Unstaffed and Staffed option to show all activities.
b. Select one or more activities and click Search.
Resource Search Results Dialog Box
Overview
Use this dialog box to review results of your search and assign a resource from the list of
resources that match your criteria.
Screen Elements
Return to Spreadsheet link
Closes the current dialog box and returns to the Spreadsheet view.
Start/Finish/Total Requested Units field
Displays the information about the activity from the Resource Staffing dialog box.
If more than one activity is selected in the Resource Staffing dialog box, this field
displays the earliest actual/early start of all activities, the latest actual/early finish of all
activities, and the total remaining units of all activities.
Requested Units/Time field
The units/time at which the resource is needed to work on the selected activity.
This field does not display if the activity has a resource curve assigned or when
multiple activities are selected in the Resource Staffing dialog box.
Timescale list
Determines the timescale. Select from the following intervals:
Month/Week
Year/Month
Year/Quarter
Decade/Year
Financial Period

Context-Sensitive Help Topics
1009
The available timescale options are determined by the selected summarization
option on the General page of the Application Settings pane. The calendar
timescale options are only available if the By Calendar option is selected. The
Financial Period option is only available if the By Financial Periods option is selected. If
both options are selected, you can select from a calendar or financial period
timescale.
Resource Curve field
The field displays in place of Requested Units/Time if a curve is associated with this
resource assignment.
This field does not display when multiple activities are selected in the Resource
Staffing dialog box.
Select options
Determines whether to assign a known resource to the corresponding activity or
search for a list of possible resources.
Resource Name field
The name of the available resources that match your search criteria.
Score field
The number of units the resource will have available after being assigned to the
activity.
Calculated as Available Units of the resource across the expanded activity time
frame minus Total Requested Units.
Resource Staffing link
Displays the Resource Staffing dialog box without saving any changes.
Search link
Displays the Search dialog box without saving any changes.
Assign Resource link
Assigns the selected resource to the current activity.
Getting Here
From the Analysis page:
1) Click Resources.
2) On the Resources navigation bar, click Analysis.
3) On the Analysis page, click the Role Usage tab.
4) Select a role and select to display the Spreadsheet.
5) In the Spreadsheet, click a project name.
6) In the Resource Staffing dialog box:

1010
a. Click the Unstaffed and Staffed option to show all activities.
b. Select at least one activity and click Search.
7) In the Resource Search Criteria dialog box, enter search criteria and click the Run
Search link.
From the Team Usage page:
1) Click Projects.
2) On the Projects navigation bar, click Team Usage.
3) On the Team Usage page:
a. If multiple projects are open, select a project from the Select Project list.
b. Click the Organized By list and select Roles.
1. Expand a project and select a role in the left pane.
2. Select the Spreadsheet option and click a project in the right pane.
4) In the Resources dialog box:
a. Click the Unstaffed and Staffed option to show all activities.
b. Select one or more activities and click Search.
c. Define search and sort criteria and click Run Search.
From the Dashboards page:
1) Click Dashboards.
2) On the Dashboards page, select a dashboard tab.
3) On the dashboard tab, expand the Open Requests for Resources portlet and select a
project or role name, depending on your customization options.
4) On the Resource Staffing Details page:
a. Click the Unstaffed and Staffed option to show all activities.
b. Select one or more activities and click Search.
5) On the Resource Search Criteria page, define search and sort criteria and click Run
Search.
Resource Staffing Dialog Box
Overview
Use this dialog box to view project activities that have unstaffed and staffed assignments
for a particular role and to search for and assign resources to those activities. The activity
list is sorted alphabetically by name.
Screen Elements
Return to Spreadsheet link
Closes the current dialog box and returns to the Spreadsheet view.

Context-Sensitive Help Topics
1011
Display options
Determines whether to display only unstaffed activities, or staffed and unstaffed
activities, for the selected role.
Select options
Determines whether to assign a known resource to the corresponding activity or
search for a list of possible resources.
Activity Name field
The activity associated with the role.
To view more details about the activity, such as steps and notebook items, click the
activity name link.
Resource Name field
The name of the resource assigned to the activity.
Resource Type field
The type of resource/role assignment.
Labor: Indicates that the selected resource performs labor, which is measured in units
of time.
Nonlabor: Indicates that the selected resource does not perform labor, but its work is
measured in units of time.
Material: Indicates that the selected resource does not perform labor and its work is
measured in units you specify.
Start field
The planned start date for an activity not yet started or the actual start date for an
activity that has already started.
Finish field
The planned finish date for an activity not yet started or the remaining finish date for
an activity that has already started.
Remaining Units field
The remaining Units for completing the assignment.
Calculated as Remaining Duration multiplied by Remaining Units per Time.
Remaining Units/Time field
The units/time at which the resource is expected to perform the remaining work on
the activity.
Search Criteria field
The indication of whether there is saved search criteria.

1012
Search link
Displays configurable options to search for resources.
At least one activity must be selected. See Resource Search Criteria Dialog Box (on
page 1005).
Assign Resource link
Displays a dialog box with search options and a list of resources that includes only
resources that belong to your access node, based on resource security, and current
project resources. See Working with 'Select a Value' Dialog Boxes for further details.
Tips
Staffed resource assignments that have actual units are not listed on the Resource
Staffing page.
Getting Here
1) Click Resources.
2) On the Resources navigation bar, click Analysis.
3) On the Analysis page, click the Role Usage tab.
4) On the Role Usage tab:
a. Select a role from the list of available rows.
b. Select Spreadsheet from the Display options.
c. Click a project name.
Or
1) Click Projects.
2) On the Projects navigation bar, click Team Usage.
3) On the Team Usage page:
a. Select Roles from the Organized By list.
b. Select a role.
c. Select Spreadsheet from the Display options.
d. Click a project name.
Resource Staffing Dialog Box of the Team Usage Page
Overview
Use this dialog box to view project activities that have unstaffed and staffed assignments
for a particular search and assign resources to those activities.

Context-Sensitive Help Topics
1013
Screen Elements
This dialog box is identical to the Resource Staffing dialog box of the Role Usage tab on
the Analysis page of the Resources section. See Resource Staffing Dialog Box of the Role
Usage Tab of the Analysis Page (see "Resource Staffing Dialog Box" on page 1010) for
further details.
Getting Here
From the Team Usage page:
1) Click Projects.
2) On the Projects navigation bar, click Team Usage.
3) On the Team Usage pane:
a. If multiple projects are open, select a project from the Select Project list.
b. Click the Organized By list and select Roles.
c. Expand a project and select a role.
d. Select the Spreadsheet display option.
e. Click a project in the list below the role.
From the Dashboards page:
1) Click Dashboards.
2) On the Dashboards page, select a dashboard.
3) On the dashboard, expand the Open Requests for Resources portlet and select a
resource.
Resource Tab of the Modify Template Dialog Box of the Import/Export Project Dialog Box
Overview
Use this tab to configure resource information associated with the template.
Screen Elements
Choose the Microsoft Project field to import as the Resource ID options
Determines whether to import Microsoft Project Resource name or Resource Initials as
the P6 Resource ID.
If a resource already exists options
Determines the action to be taken:
Keep existing resource: Retains the resource in the existing project and does not
overwrite it with the resource from the import file.
Update existing resource: Overwrites the resource in the existing project with the
resource from the import file.

1014
Add a new resource: Retains the resource in the existing project and adds a new
resource for the resource in the import file. The system creates a Resource ID for
the new resource by appending a hyphen followed by a sequential number to
the Resource ID when it is imported.
Add a new resource if a resource does not exist option
Determines whether to add resources and their assignments from the import file to the
existing project.
This option only affects resources that do not currently exist in P6.
Import under resource field
The name of the resource under which to place Microsoft Project resources that do
not yet exist in P6.
All Resource Access is required to import Microsoft Project XML.
Tips
The Import or Export Type must be set as Microsoft Project XML (2007) to enable the
options icons.
Getting Here
1) Click Projects.
2) On the Projects navigation bar, click EPS.
3) On the EPS page, click the Actions menu and select Import/Export XML Project
Import/Export.
4) In the Import/Export Project dialog box, click the Import or Export tab.
5) On the Import or Export tab:
a. Select Microsoft Project XML (2007) from the Import or Export Type list.
b. Click MSP Export Template Options or MSP Import Template Options.
6) In the Modify Template dialog box, click the Resource tab.
Resource Team Summary Portlet
Overview
Use this portlet to view the resources, their primary role, and the number of active
projects for a team you select. The portlet lists those members of the resource team that
you have access to, based on resource security. For example, if you choose to view a
global resource team that includes a combination of resources within and outside of
your resource access node, you see only the team members to which you have access.
If you choose to view a resource team that is available only to you, all resources that you
added to the team are listed.

Context-Sensitive Help Topics
1015
Screen Element
Select a resource team field
The field used to select a resource team to display its members in the portlet.
E-mail resource team link
Sends an e-mail to the entire resource team.
Resource field
The name for the resource. Click the name of a resource to view their usage in a
spreadsheet or histogram format.
Primary Role field
The name of the primary job title or skill for the resource.
Active Projects field
The number of active projects to which the resource is currently assigned.
Tips
Resource usage data is based on summary data, so it reflects values as of the last
date the summarizer was run for a project. Assignment changes within a project after
that date will not be reflected until the project is again summarized on the Activities
or EPS page.
To control the number of items that display in the portlet, click Customize at the top of
the page. Then, specify a number for 'Maximum number of rows displayed in
dashboard portlets'. When the number of items exceeds the maximum, Next and
Previous links display.
You can always customize your private dashboards, as well as multi-user dashboards
you create; you cannot customize multi-user dashboards created by another user.
You must have the required security privilege to customize a global dashboard.
From the spreadsheet, for projects you have access to, you can view a list of the
resource's activities along with basic details, such as start and finish dates.
After you create a resource team, if a resource is removed from your resource access
node or your access is modified, that resource will no longer be listed in the portlet.
Getting Here
1) Click Dashboards.
2) On the Dashboards page, select a dashboard.
3) On the dashboard, expand the Resource Team Summary portlet.

1016
Resource Teams Detail Window of the Resources Tab of the Administration Page
Overview
Use this detail window to assign a resource to a resource team, view all resource teams
to which a resource is assigned, or remove a resource from a resource team.
Screen Elements
Add (Insert)
Assigns the resource to a resource team.
Delete (Delete)
Deletes or removes the currently selected data items or table rows.
Caution: Your selected data is permanently deleted once you click Save.
Resource selector (Ctrl+Up Arrow) or (Ctrl+Down Arrow)
Cycles through the available resources and determines which data display in the
detail window. Click (Ctrl+Up Arrow) to move to the previous resource, or click
(Ctrl+Down Arrow) to move to the next resource. The content in the detail window is
refreshed with the data for the selected resource.
Team Name field
The name of the team to which the resource is assigned.
Available To field
Indicates the user access for the team.
Global: all users with module access can view this team.
User: only you have access to this team.
Getting Here
1) Click Resources.
2) On the Resources navigation bar, click Administration.
3) On the Administration page, click the Resources tab.
4) On the Resources tab, click the Resource Teams detail window.
Resource Teams Tab of the Administration Page
Overview
Use this tab to create, modify, or delete a resource team.

Context-Sensitive Help Topics
1017
Screen Elements
Resource Teams Toolbar
See Teams Tabs Toolbar (on page 1351).
Name field
The name of the global or user resource team.
Resources field
The list of resources assigned to the resource team.
Resources detail window
See Resources Detail Window of the Resource Teams Tab of the Administration Page
(on page 1022).
Getting Here
1) Click Resources.
2) On the Resources navigation bar, click Administration.
3) On the Administration page, click the Resource Teams tab.
Resource UDFs Page
Overview
Use this page to configure user defined fields for resources.
Screen Elements
User Defined Fields toolbar
See User Defined Fields Toolbar (on page 1361).
User Defined Field field
The name of the user-defined field.
Data Type field
The name of the type of data that corresponds to each user-defined field. The data
type you select determines the type of data you can specify in a field. The following
data types are available:
Text: Allows you to use text or a combination of text and numbers.
Start Date: Allows you to enter Start Date information only.
Finish Date: Allows you to enter Finish Date information only.
Cost: Allows you to enter currency values.
Number: Allows you to use numerals with two decimal places.
Integer: Allows you to use numeric data, but not a number related to money.

1018
Indicator: Allows you to use an indicator field that you can use to enter
color-coded icon values in columns and display color-coded text in reports.
Getting Here
1) Click the Resources menu and select Enterprise Resource Data, or click the
Administer menu and select Enterprise Data.
2) In the Enterprise Resource Data pane, expand Resources and click Resource UDFs.
Resource Usage Tab of the Analysis Page
Overview
Use this tab to view resource allocation as a histogram (total allocation across time) or as
a spreadsheet (of resource allocation values by project). You can view totals for
individual resources or for multiple resources grouped by resource code, resource team,
or primary role.
The resource usage data displayed on this page is derived from summary data, so it is
current as of the last date the summarizer was run for a project. Assignment changes
within a project after that date will not be reflected until the project is again summarized.
See Summarizing Projects.
Screen Elements
Group By
Displays options for re-arranging a list of values by grouping them into a hierarchy and
sorting.
Group By list
Select from one of the following options by which to group the available resources:
Resource Hierarchy
Resource Team
Resource Codes
Primary Role
Search
Displays options for finding a specific matching entry or entries based on search
criteria.
Customize link
Displays a dialog box with configurable options to customize the Spreadsheet or
Histogram. See Customize Spreadsheet or Histogram Dialog Box of the Analysis Page
(on page 697).

Context-Sensitive Help Topics
1019
Export Spreadsheet link
Exports the current spreadsheet to a Microsoft Excel .xls file.
Display options
Determines whether to view information about the selected role/resource and
associated projects in Spreadsheet or Histogram format.
Zoom In
Increases the current magnification of items in the work area so they appear larger.
Zoom Out
Decreases the current magnification of items in the work area so they appear smaller.
Getting Here
1) Click Resources.
2) On the Resources navigation bar, click Analysis.
3) On the Analysis page, click the Resource Usage tab.
Resource/Cost - Activities That Do Not Have an Expense or a Resource Assigned Section of
the Schedule Check Report Dialog Box
Overview
Use this section to view activities that do not have an expense or resource assigned.
Plans without resources or costs are not as meaningful particularly when you are tracking
Earned Value.
Only a subset of the activities in the open projects are checked. WBS summary activities,
milestones, and Level of Effort activities are removed from the subset to create the list of
activities checked for no resources or expense assignments. The Actual percentage is
calculated as the number of activities found that match the check divided by the total
number of subset activities checked.
Note: There is no check for the number of units or the value of the
expenses.
Screen Elements
Project ID field
The unique identifying code of the project containing the activity which failed the
check.
Activity ID field
The unique identifying code of the activity which failed the check.

1020
Activity Description field
The brief description of the listed activity.
Getting Here
1) Click Projects.
2) On the Projects navigation bar, click Activities.
3) On the Activities page, click the Actions menu and select Run Check
Schedule....
4) In the Check Schedule dialog box:
a. Select the Resource/Cost - Activities that do not have an expense or a resource
assigned option.
b. Click Check Schedule.
5) In the Schedule Check Report dialog box, expand the Resource/Cost - Activities that
do not have an expense or a resource assigned section.
Resources Detail Window of the Global Security Profiles Page
Overview
Use this detail window to assign resources privileges to the selected global security
profile.
Screen Elements
Privilege field
The name of the security permission that is assigned (option selected) or denied
(option cleared) to users of the currently selected profile.
Privilege option
The option in the column header that determines whether the privileges are all
assigned (selected), all denied (clear), or individually configured (indicated with a
dash or - sign).
Add Resources option
Determines whether the profile will enable users to create resource data. This privilege
also selects the 'Edit Resources' global privilege.

Context-Sensitive Help Topics
1021
Edit Resources option
Determines whether the profile will enable users to modify resource data. This privilege
also enables users to assign, modify, and remove role assignments. To display
resources' price/unit in reports, users must have this privilege and the 'View Resource
and Role Costs/Financials' global privilege assigned to their profile. To display
resource skill level (a resource’s role proficiency) in the application and in reports,
users must have this privilege and the 'View Resource Role Proficiency' global
privilege assigned to their profile.
Delete Resources option
Determines whether the profile will enable users to remove resource data. This
privilege also selects the 'Add Resources' and 'Edit Resources' global privileges.
Add/Edit/Delete Resource Calendars option
Determines whether the profile will enable users to create, modify, and remove
resource calendars data. This privilege also enables users to edit Shifts in P6
Professional.
Add/Edit/Delete Resource Curves option
Determines whether the profile will enable users to create, modify, and remove
resource distribution curves definitions.
Add/Edit/Delete Roles option
Determines whether the profile will enable users to create, modify, and remove roles
data.
Add/Edit/Delete Global Resource and Role Teams option
Determines whether the profile will enable users to create, modify, and remove
global Resource Teams and Role Teams. A Resource/Role Team is a collection of
resources/roles.
Add/Edit/Delete Rate Types and Units of Measure option
Determines whether the profile will enable users to create, modify, and remove
resource rate types and units of measure data.

1022
View Resource and Role Costs/Financials option
Determines whether the profile will enable users to display all values for labor,
material, and nonlabor resource costs, price/unit values for roles, and costs for
resource and resource assignments User Defined fields. For users who do not have this
privilege assigned to their profile, all areas that display monetary values for labor,
material, and nonlabor resources and roles will display dashes and cannot be edited.
For resources, such areas include resource price/unit, values in resource spreadsheets
and histograms in Resource Analysis and Team Usage, and Cost data types for
Resource User Defined fields. For roles, the area is the price/unit value in roles data. To
display resources' price/unit, users must have this privilege and the 'Edit Resources'
global privilege assigned to their profile.
View Resource Role Proficiency option
Determines whether the profile will enable users to display, group/sort, filter, search,
and report on resource and role proficiency. To display resource skill level (a
resource’s role proficiency), users must have this privilege and the Edit Resources
global privilege assigned to their profile.
Approve Resource Timesheets option
Determines whether the profile will enable users to approve or reject submitted
timesheets as a Resource Manager.
Getting Here
1) Click the Administer menu and select User Access.
2) On the User Access page, click Global Security Profiles.
3) On the Global Security Profiles page, click the Resources detail window.
Resources Detail Window of the Resource Teams Tab of the Administration Page
Overview
Use this detail window to assign or remove resources from a resource team.
Screen Elements
Add (Insert)
Assigns a resource to the selected group.
Delete (Delete)
Deletes or removes the currently selected data items or table rows.
Caution: Your selected data is permanently deleted once you click Save.
Resource ID field
The unique identifier of the resource.

Context-Sensitive Help Topics
1023
Resource Name field
The name of the resource.
Getting Here
1) Click Resources.
2) On the Resources navigation bar, click Administration.
3) On the Administration page, click the Resource Teams tab.
4) On the Resource Teams tab, click the Resources detail window.
Resources Detail Window of the Roles Tab of the Administration Page
Overview
Use this detail window to assign resources to a role, modify resource settings, or delete a
resource from the role.
Screen Elements
Add (Insert)
Assigns a resource to the selected group.
Delete (Delete)
Deletes or removes the currently selected data items or table rows.
Caution: Your selected data is permanently deleted once you click Save.
Role selector (Ctrl+Up Arrow) or (Ctrl+Down Arrow)
Cycles through the available roles and determines which data display in the detail
window. Click (Ctrl+Up Arrow) to move to the previous role, or click (Ctrl+Down
Arrow) to move to the next role. The content in the detail window is refreshed with the
data for the selected role.
Resource field
The name of the resource.
Proficiency field
The resource's proficiency at performing this role.
The values are 1 - Master, 2 - Expert, 3 - Skilled, 4 - Proficient, and 5 - Inexperienced. If
you do not have the proper privilege, you cannot access this field.
Primary Role option
Determines whether this is the resource's main role; a role that does not have this
option selected indicates that this is a secondary role for the resource. You can only
assign one primary role per resource; a resource is not required to have a primary role.

1024
Getting Here
1) Click Resources.
2) On the Resources navigation bar, click Administration.
3) On the Administration page, click the Roles tab.
4) On the Roles tab, click the Resources detail window.
Resources Page
Overview
Use the Resources section to manage resources, including adding, modifying, or deleting
resources, resource teams, roles, and role teams. You can also plan for resources
assignments, assign resources to projects and WBSs, and analyze resource and role
usage.
Screen Elements
Resources Navigation Bar
See Resources Navigation Bar (on page 1329).
Work Area
The main work area for each resources page. Each page opened from the
navigation bar, as well as tabs included on each page, presents its own separate
data, buttons, links, toolbars, charts, and other items in the work area.
Getting Here
Click Resources.
Resources Section of Activity Details of the Resources Dialog Box
Overview
Use this section to view a list of resources assigned to an activity, report time worked on
an activity, report estimates of remaining work for your activities, report estimates of
remaining work for a non-labor or material resource, and to report completed
assignments.
Screen Elements
Assign Resources link
Opens a dialog box to search for and select a resource to assign. See Working with
'Select a Value' Dialog Boxes for further details of how to use this dialog box.

Context-Sensitive Help Topics
1025
Assign Roles link
Opens a dialog box to search for and select a role to assign. See Working with 'Select
a Value' Dialog Boxes for further details of how to use this dialog box.
E-mail these resources link
Enables you to send an e-mail about the selected activity to resources, including the
activity name and other information, such as the WBS name, Start, Finish, and
Resources.
Resource Name field
The name of the resource. Click to open the Resource Details page. See Resource
Details Page of the Activity Form Page (on page 1002) for further details.
Primary Resource option
Determines whether the corresponding resource is the activity's primary resource.
Typically, the primary resource is the person responsible for the overall work on the
activity and for updating activity status.
Role Name field
The name of the role assigned to the resource for the selected activity.
Search Criteria field
The resource request used as a search template to search for a qualified resource.
Planned Units field
The sum of planned labor units and planned nonlabor units.
Actual Units field
The number of work units the resource has spent working on the selected activity. It is
the sum of the actual labor units and the actual nonlabor units.
Calculated as Actual Labor Units plus Actual Nonlabor Units.
Remaining Units/Time field
The units per time required to complete the activity.
Resource Details
Click a resource name or a role name to display the resource details. See Edit
Resource Assignment of Activity Details of the Resources Dialog Box (see "Edit
Resource Assignment Dialog Box" on page 738).
Getting Here
From the Projects section:
1) Click Projects.

1026
2) On the Projects navigation bar, click Team Usage.
3) On the Team Usage pane:
a. If multiple projects are open, select a project from the Select Project list.
b. Click the Organized By list and select Roles.
c. Expand a project and select a role.
d. Select the Spreadsheet display option
e. Click a project in the list below the role.
4) In the Resources dialog box:
a. Click the Unstaffed and Staffed option to show all activities.
b. Select an activity.
c. Expand the Resources section.
From the Dashboards section:
1) Click Dashboards.
2) On the Dashboards page, expand the Open Requests for Resources portlet and
select a project or role name, depending on your customization options.
3) On the Resource Staffing page:
a. Click the Unstaffed and Staffed option to show all activities.
b. Select an activity.
4) On the Activity Details page, expand the Resources section.
Resources Section of the Activity Details Dialog Box
Overview
Use the Resources section of the Activity Details dialog box to view a list of resources
assigned to an activity, report time worked on an activity, report estimates of remaining
work for your activities, report estimates of remaining work for a non-labor or material
resource, and to report completed assignments.
Screen Elements
Assign Resources link
Displays a dialog box to search for and select a resource to assign. See Selection
Dialog Boxes for further details of how to use this dialog box.
Assign Roles link
Displays a dialog box to search for and select a role to assign. See Selection Dialog
Boxes for further details of how to use this dialog box.

Context-Sensitive Help Topics
1027
E-mail these resources link
Enables you to send an e-mail about the selected activity to resources, including the
activity name and other information, such as the WBS name, Start, Finish, and
Resources.
Resource Name field
The name of the resource. Click to open the Resource Details page. See Resource
Details Page of the Activity Form Page (on page 1002) for further details.
Primary Resource option
Determines whether the corresponding resource is the activity's primary resource.
Typically, the primary resource is the person responsible for the overall work on the
activity and for updating activity status.
Role Name field
The name of the role assigned to the resource for the selected activity.
Search Criteria field
The resource request used as a search template to search for a qualified resource.
Planned Units field
The sum of planned labor units and planned nonlabor units.
Actual Units field
The number of work units the resource has spent working on the selected activity. It is
the sum of the actual labor units and the actual nonlabor units.
Calculated as Actual Labor Units plus Actual Nonlabor Units.
Remaining Units/Time field
The units per time required to complete the activity.
Resource Details
Click a resource name or a role name to display the resource details. See Edit
Resource Assignment Dialog Box (on page 738).
Getting Here
1) Click Resources.
2) On the Resources navigation bar, click Analysis.
3) On the Analysis page, click the Role Usage tab.
4) On the Role Usage tab, select a role and select to display the Spreadsheet.
5) On the Spreadsheet, click a project name.
6) In the Resource Staffing dialog box, click an activity name then expand the
Resources section.

1028
Resources Section of the Activity Form Page
Overview
Use this section to view a list of resources assigned to an activity, report time worked on
an activity, report estimates of remaining work for your activities, report estimates of
remaining work for a non-labor or material resource, and to report completed
assignments.
Screen Elements
Assign Resources link
Opens a dialog box to search for and select a resource to assign. See Working with
'Select a Value' Dialog Boxes for further details of how to use this dialog box.
Assign Roles link
Opens a dialog box to search for and select a role to assign. See Working with 'Select
a Value' Dialog Boxes for further details of how to use this dialog box.
Request Resources link
Opens the Open a Request for a Resource dialog box. This dialog box is identical to
the open a request for resource located on the Activities page. See Open a Request
for a Resource Dialog Box of the Assignments Detail Window of the Activities Page (on
page 909) for more details.
E-mail these resources link
Enables you to send an e-mail about the selected activity to resources, including the
activity name and other information, such as the WBS name, Start, Finish, and
Resources.
Customize link
Opens a dialog box to customize the columns viewed in the resources portlet. See
Configuring Columns or Values for further details.
Resource Name field
The name of the resource. Click to open the Resource Details page. See Resource
Details Page of the Activity Form Page (on page 1002) for further details.
Role Name field
The name of the role assigned to the resource for the selected activity.
Search Criteria field
The resource request used as a search template to search for a qualified resource.
Planned Units field
The sum of planned labor units and planned nonlabor units.

Context-Sensitive Help Topics
1029
Actual Units field
The number of work units the resource has spent working on the selected activity. It is
the sum of the actual labor units and the actual nonlabor units.
Calculated as Actual Labor Units plus Actual Nonlabor Units.
Remaining Units field
The remaining units of work to be performed by this resource on this activity.
Calculated as Budgeted or Planned Units minus Actual Units.
Planned Units/Time field
The planned units per time at which the resource is to perform work on this activity.
For example, a person assigned full time would perform 8 hours of work per day. A
department of five people might perform at 5 days per day.
Remaining Units/Time field
The units per time required to complete the activity.
Getting
From the Workgroup Workspace page:
1) Click Projects.
2) On the Projects navigation bar, click Workspace.
3) On the Workspace page, expand any portlet containing activities.
4) In the portlet, click an activity.
5) On the Activity Form page, expand the Resources section.
From the Dashboards page:
1) Click Dashboards.
2) On the Dashboards page, select a dashboard tab.
3) On the dashboard tab, expand any portlet containing activities.
4) In the portlet, click an activity.
5) On the Activity Form page, expand the Resources section.
Resources Section of the Content Tab of the Customize Dashboard Page
Overview
Use this section to enable and configure portlets in the dashboard that display
information you can use to analyze and view resource information.

1030
Screen Elements
Resource Team Summary option
Determines whether to display the resources that belong to a team you select,
including each resource's primary role and number of active projects.
Open Requests for Resources option
Determines whether to display which roles require staffing at any time in your projects.
Display options
all projects option: Displays all projects for which you are associated.
projects based on dashboard filter option: Displays projects that obey the current
filter option.
Organize list
Determines how the portlet data is organized.
Note: The Role by Project by Project Codes option works the same
as Role by Project, but additionally filters the list by the project
code you select.
Role Team field
The currently selected role team, whose resources youwant to display if their roles
need resource assignments.
Project Code field
The currently selected project code of the projects you want to display if their roles
need resource assignments.
Resource Analysis Chart option
Determines whether to display the total (remaining plus actuals) units or costs for a
resource, resource team or resource code in a variety of chart formats.
Chart Type list
Determines the following chart options in which to view resource allocation data:
histogram, stacked histogram, pie chart, or area chart formats.
Display list
Determines whether to view by units or costs.
Limit option
Determines whether to display a limit line on the chart. When you choose to display
units, a limit line helps you easily spot under or overallocation.

Context-Sensitive Help Topics
1031
Allocation Limit option
Determines whether to display an allocation limit line on the chart.
Display resource allocation fields
The specified number of weeks for which to display the resource allocation. Enter
values for how many weeks prior and after the current date.
Color Theme list
The option to view chart elements in pastel or primary colors.
Getting Here
1) Click Dashboards.
2) On the Dashboards page, select a dashboard.
3) On the dashboard, click Customize.
4) On the Dashboard Details page, click the Content tab.
5) On the Content tab, expand the Resources section.
Resources Section of the Global Tab of the My Preferences Page
Overview
Use this section to configure resource staffing and assignment options.
Screen Elements
Resource Staffing
Expand this section to choose your resource staffing options.
Automatically summarize project after assigning resources option
Determines whether to summarize a project after you assign resources. Because
availability calculations for resource staffing features are based on summary data,
choosing this option ensures that your staffing decisions are based on the most
up-to-date resource allocation data.
When this feature is enabled, you can check the status of the summarizer job on the
Activities page in the View Service Status dialog box.
Within the resource staffing feature, click on an activity name to show limited activity
details, based on whether you select Display Resource Assignments, Display
Notebook, and/or Display Steps.
An administrative setting is also required to implement this feature. For more
information, contact your P6 administrator.
Display Resource Assignments option
Determines whether to display an activity's resource assignment details, for example,
planned units and remaining units/time.

1032
Display Notebook option
Determines whether to display activity Notebooks when viewing activity details.
Display Steps option
Determines whether to display activity steps when viewing activity details.
Resource Assignments
Expand this section to choose your resource assignment options.
When adding or removing multiple resource assignments on activities options
When adding or removing multiple resource assignments, you can choose to
preserve or recalculate units, duration, and units/time. Choose from the following
options:
Preserve the Units, Duration, and Units/Time for existing assignments: Choose this
option for units, durations, and units/time to remain constant when additional
resources are assigned to any activity. Regardless of the duration type of an
activity, this equation is always true:
Remaining Units = Remaining Duration x Remaining Units/Time
Recalculate the Units, Duration, and Units/Time for existing assignments based on
the activity Duration Type: Choose this option to calculate a resource
assignment’s remaining values based on the activity’s duration type, specified in
an activity's General tab.
When assigning a resource to an existing activity assignment options
When selecting a resource to staff an existing role assignment or replacing a current
resource assignment with a different resource, you can choose to always use the
current units/time and overtime factor of the new resource or you can choose to be
prompted every time so you can select the units/time and overtime factor you want
to apply to the assignment. Choose from the following options:
Always use the new resource's Units/Time and Overtime factor option
Always use current assignment's Units/Time and Overtime factor option
Ask me to select each time I assign option
When a resource and role share an activity assignment options
When selecting a resource to staff an existing role assignment or specifying a role for
an existing resource assignment, you can choose to always apply either the resource
or role rate (Price/Unit) to the assignment or you can choose to be prompted every
time so you can select which rate you want to apply. Use the following options:
Note: The assignment Rate Source field indicates whether the
resource or role rate is applied to an assignment. The Rate Source,
along with the Rate Type, determines the price/unit value used to
calculate costs for the assignment.

Context-Sensitive Help Topics
1033
Always use resource's Price/Unit option
Always use role's Price/Unit option
Ask me to select each time I assign option
Display the role limit based on options
In P6 Professional and P6, you can define the maximum availability (limit) over time for
each role in the Roles dictionary. By default, role limits are calculated using the limit
defined for each role's primary resource; however, you can choose to display role
limits based on the custom role limits. In P6, role limits are displayed in charts,
histograms, and spreadsheets that display role allocation data, such as the Capacity
Planning chart and Role Usage histogram. Use the following options:
Custom role limit option
Calculated primary resources' limit option
Number of available items to search for Roles, Resources, and Resource Codes field
The number of search criteria items allowed when searching for resources to staff
activities. The maximum valid value is 10.
Getting Here
1) Click the Administer menu and select My Preferences.
2) On the My Preferences page, click the Global tab.
3) On the Global tab, expand the Resources section.
Resources Tab of the Administration Page
Overview
Use this tab to add resources, including assigning the resource to a role and resource
team, assigning resource codes, and defining price and unit values.
Screen Elements
Resources toolbar
See Resources Tab Toolbar (on page 1330).
Active option
Determines whether the resource is currently active. A marked option indicates the
resource is active.
Non-active resources might have left the organization, but are not deleted from the
system since they might have actual hours.
Added By field
The name of the user that added this resource in the system.

1034
Added Date field
The date this resource record was created.
Auto Compute Actuals option
Determines whether the activity actual and remaining units, and start and finish dates
for the resource are calculated automatically using the planned dates, planned
units, and the activity's schedule percent complete.
If this option is selected, the actual/remaining units and actual dates are
automatically updated when project actuals are applied. This assumes that all work
by the resource proceeds according to plan.
This option is not available if the Uses Timesheets option is selected.
Calculate Costs from Units option
Determines whether by default any new assignments for this resource will have its
costs recalculated whenever any quantity changes occur. This setting can be
overwritten on a per project basis.
Calendar field
The name of the calendar selected for the resource.
Currency field
The name of the currency associated with this resource.
For example, US Dollars or Japanese Yen.
Default Units/Time field
The default units/time for resource assignments in projects, which is shown as either a
percentage or units/duration depending on your settings in My Preferences. If you
change the default setting, existing resource assignments are not affected. The
default setting only applies to new resource assignments.
E-mail field
The e-mail address for the resource.
Employee ID field
The resource identifier within the organization, typically the employee number or
social security number.
ID field
The unique identifier of the resource.
Integrated Resource field
Indicates whether the resource came from another Enterprise Resource Planning
(ERP) system that is integrated with this application. A blank field indicates that this is
not an integrated resource.

Context-Sensitive Help Topics
1035
Last Modified By field
The name of the user that last updated the resource record.
Last Modified Date field
The date this resource record was last updated.
Name field
The name of the resource.
Notes field
The notes about the resource.
Office Phone field
The office phone number for the resource.
Other Phone field
The alternate phone numbers for the resource.
Overtime Allowed option
Determines whether the resource is allowed to log overtime hours.
Overtime Factor field
The overtime factor used to compute the overtime price for the resource. The default
is 1.5.
Used in overtime calculations where the rate is multiplied by the overtime factor to
figure the total overtime price.
Parent Resource field
A resource categorized at a higher level than the current resource, in a resource
hierarchy.
The parent resource is generally the larger department or organization for which you
work.
For example, a salesperson might be assigned to an element of the resource
hierarchy called Region 1 Sales.
Primary Role field
The name of the primary job title or skill for the resource.
Resource Teams field
The list of resource teams to which the resource is assigned.
Resource Type field
The resource type. Valid values are:
Labor: Indicates that the selected resource performs labor, measured in units of time.

1036
Nonlabor: Indicates that the resource is a nonlabor resource, such as equipment,
measured in units of time.
Material: Indicates that the resource has a unit of measure other than time. You can
select a unit of measure for the material resource.
Timesheet Approval Manager field
The resource manager assigned to approve timesheets for the resource.
Timesheet User Login field
The user name for the timesheet user login.
Title field
The job title for the resource, such as Senior Engineer.
Unit of Measure field
The unit of measure this material resource uses.
Uses Timesheets option
Determines whether the labor resource uses P6 Progress Reporter timesheets to record
hours for assigned activities.
This option is not available if the Auto Compute Actuals option is selected.
User Defined field
Fields defined by your P6 administrator that are not standard in the application, but
are necessary to capture additional data for the project or the company.
Resource Code field
The fields specific to your company's use. These fields are created by the system
administrator.
Resource Tab detail windows:
General Detail Window of the Resources Tab of the Administration Page (on page 791)
Roles Detail Window of the Resources Tab of the Administration Page (on page 1056)
Resource Teams Detail Window of the Resources Tab of the Administration Page (on
page 1016)
Codes Detail Window of the Resources Tab of the Administration Page (on page 625)
Notes Detail Window on Resources Tab of the Administration Page (see "Notes Detail
Window of the Resources Tab of the Administration Page" on page 907)
Units and Prices Detail Window on Resources Tab of the Administration Page (see "Units
and Prices Detail Window of the Resources Tab of the Administration Page" on page
1131)
Settings Detail Window on Resources Tab of the Administration Page (see "Settings
Detail Window of the Resources Tab of the Administration Page" on page 1083)

Context-Sensitive Help Topics
1037
Getting Here
1) Click Resources.
2) On the Resources navigation bar, click Administration.
3) On the Administration page, click the Resources tab.
Resources Tab of the Level Resources Dialog Box of the Activities Page
Overview
Use this tab to specify which resources to level.
Screen Elements
Select resources to level options
Determines whether all resources or only the resources you select are leveled.
Available Resources option
The list of resources available to level.
Selected Resources option
The list of resources you selected from the available resources.
Available Resources and Selected Resources lists
See Configuring Columns or Values.
Getting Here
1) Click Projects.
2) On the Projects navigation bar, click Activities.
3) On the Activities page, click the Actions menu and select Run Leveler...
(Shift+F9).
4) In the Level Resources dialog box, click the Resources tab.
Response Plans Detail Window of the Risks Page
Overview
Use the Response Plans detail window to add response plans and response plan action
items to the risk.
Screen Elements
Response Plans toolbar
See Response Plans Toolbar (on page 1333).

1038
Active field
Indicates whether the response plan is currently active for the associated risk.
One response plan must always be active, and only one response plan can be active
at a given time for a risk.
Activity field
The activity assigned to a response action item.
Actual Cost field
The actual cost of the response plan or response action item. The actual cost of the
response plan is the sum of the actual cost of each response action item.
If an activity is assigned to the response action item, the field is set to display the
actual cost of the activity.
Added By field
The name of the user that created the response plan or response action item.
Added Date field
The date that the response plan or response action item was added.
Finish Date field
The latest finish date of all response action items displays in the response plan row.
The scheduled finish date for the project is the default finish date for a response
action item. If the scheduled finish date is not set for the project, the project must
finish by date is used. If that is not set, then the project start date is used.
If an activity is assigned to the response action item, this field is set to display the
finish date for the activity.
ID field
The unique identifier of the response plan or response action item.
Last Modified By field
The name of the user who last modified the response plan or response action item.
Last Modified Date field
The date the response plan or response action item was last updated.
Name field
The unique identifying name of the risk response plan or response action item.
Owner field
The name of the resource responsible for the response plan action item.

Context-Sensitive Help Topics
1039
Planned Cost field
The planned cost of the response action item.
If an activity is assigned to the response action item, the field is disabled and the total
cost of the activity displays.
Planned Finish Date field
The latest planned finish date of all the response action items displays in the response
plan row.
The scheduled finish date for the project is the default finish date for a response
action item. If the scheduled finish date is not set for the project, the project must
finish by date is used. If that is not set, then the project start date is used.
If an activity is assigned to the response action item, this field is set to display the
planned finish date for the activity.
Planned Start Date field
The earliest planned start date of all response plan action items displays in the
response plan row.
The project planned start date is the default planned start date for the response
action item.
If an activity is assigned to the response action item, the field is set to display the
planned start date of the activity.
Remaining Cost field
The remaining total cost required to complete the response action item in the
response plan.
If an activity is assigned to the response action item, the field is disabled and the
remaining cost of the activity displays.
If the status of the response action item is rejected, the cost will not roll up in the
remaining cost total.
Response Type field
The type of response actions implemented for threats or opportunities.
Valid values are:
Threats
Avoid: Change the project so the risk is avoided. This will usually reduce the
post-response plan probability to zero.
Transfer: Transfer the risk to another party.
Reduce: Reduce the probability and/or impact of the risk.
Accept: Accept the risk and take no action. Post-response impacts are set to the
same values as Pre-Response no matter what the response type.
Opportunities
Exploit: Actively seek out the opportunity.

1040
Facilitate: Help another party increase the likelihood of the opportunity occurring.
Enhance: Increase the probability and/or impact of the opportunity.
Reject: Reject the opportunity and take no actions.
Start Date field
The earliest start date of all response plan action items displays in the response plan
row.
The project start date is the default start date for the response action item.
If an activity is assigned to the response action item, the field is set to display the start
date of the activity.
Status field
The status of the response action item. The response action item usually goes through
a process from being proposed to sanctioned, and then if it is not rejected it is
planned into the project.
Proposed: The default status. Action has been proposed.
Sanctioned: The action has been proposed and sanctioned.
Rejected: The action has been proposed and then rejected. This action is not used
to drive the post-response position and its cost is not included in the Total Cost.
In-Progress: The response action item has started and there is some work still
remaining.
Complete: The response action item has been completed.
Post-mitigated Threshold fields:
Cost field
The cost impact of the risk after the response action item has been completed.
Probability field
The probability of the risk occurring after the response action item has been
completed.
Schedule field
The schedule impact of the risk after the response action item has been completed.
Score field
The risk score after the response action item has been completed.
Score (text) field
The text-based risk score values after the response action item has been completed.
Getting Here
1) Click Projects.

Context-Sensitive Help Topics
1041
2) On the Projects navigation bar, click Risks.
3) On the Risks page, click the Response Plans detail window.
Responsibility Detail Window of the OBS Page
Overview
Use this detail window to view the responsibilities assigned to each organizational
breakdown structure (OBS).
Screen Elements
Project ID/WBS Code field
The Project Identifier or WBS Code. This field is read-only.
Project Name/WBS Name field
The Project or WBS Name. This field is read-only.
Getting Here
1) Click the Administer menu and select User Access.
2) On the User Access page, click OBS.
3) On the OBS page, click the Responsibility detail window.
Return on Investment of Project Page
Overview
Use this page to view the project's net present value, ROI, and payback period or to edit
spending and benefit plans.
Screen Elements
Specify the timescale for entering ROI spending and benefit plans list
The time interval (month, quarter, or year) you want to use to track ROI for this project.
Note: The top of the page also displays the annual discount rate,
application period, and project start date.
Date field
The month, quarter, or year in which you want to track ROI for this project. The dates
listed correspond to the choice you made in the Specify the timescale for entering
ROI spending and benefit plans list. You will see one of the following series of dates for
viewing your spending and benefit plans depending on the timescale selected:
Twelve (12) months within a single year

1042
Eight (8) quarters spanning two (2) years
Ten (10) years
Spending Plan field
The anticipated or actual project spending for the corresponding time period.
Benefit Plan field
The anticipated or actual profit or benefit portion for each time period. Typically, the
benefit plan begins after the project has completed.
Total Present Value (Discounted) of Spending Plan field
The projected project spending for the corresponding time period. Numbers can be
positive or negative, and should be entered as non-discounted dollars.
Total Present Value (Discounted) of Benefit Plan field
The calculated total of spending and benefit plans for all periods, reduced to current
dollars by the discount rate.
Current dollars for individual spending plan and benefit plan periods are calculated
as:
Plan period $ divided by (1+discount rate)n
Where n equals the current discount application period value (for example, for yearly
over 8 years, values are calculated for n equals year 0, year 1, year 2, ... year 7). The
project start date is used as the beginning of period 0. If the project start date or
discount rate are changed, Total Spending Plan PV, Total Benefit Plan PV, NPV, ROI,
and Payback Period are recalculated.
Net Present Value field
The difference between present value of the total projected cash flow and present
value of the initial investment.
Calculated as Total Benefit Plan PV minus Total Spending Plan PV.
Return on Investment field
The efficiency of the investment.
Calculated as NPV divided by Total Spending Plan PV.
Payback Period field
The period of time required to recover the initial investment amount.
Edit Spending and Benefit Plans link
Revises the Spending Plan and Benefit Plan details. After revising information, click
Save or to exit without changing any information, click Cancel.
Context-Sensitive Help Topics
1043
Tip:
Depending on the timescale you chose in the Specify the timescale for entering ROI
spending and benefit plans list at the top, the bottom of the page will display links to the
previous and next year, two (2) years, or ten (10) years.
Getting Here
1) Click Portfolios.
2) On the Portfolio navigation bar, click ROI.
3) On the Portfolio ROI page, click the Details link for a project.
RFI Turnaround Portlet of the Workspace Page
Overview
Available only in environments integrating P6 with Contract Management, this portlet
displays the average turnaround time for requests that exist for the project in Contract
Management. The requests that appear depend on the customize options set for the
portlet. If you have a valid user name and password for Contract Management, you can
additionally access Contract Management from this portlet to view a list of requests for a
specific grouping.
Screen Elements
RFI Turnaround Time portlet
The RFI Turnaround Time portlet displays the average turnaround time for RFIs based
on the criteria that you set.
Place the cursor over a section of the chart to display the average turnaround time
for that topic. Click a section of the chart to open the RFI Turnaround Time log from
which you can directly access RFIs of the type selected with a valid user name and
password.
Tips
The number at the top of the portlet indicates the total number of project requests for
the criteria selected for the portlet.
If you have the required security privilege, you can customize the Project Workspace
to configure the way RFI information appears in the portlet. The customize options set
for the portlet apply for all projects in the organization.
Getting Here
1) Click Projects.
2) On the Projects navigation bar, click Workspace.
3) On the Workspace page, expand the RFI Turnaround Time portlet.
1044
Risk Categories Page
Overview
Use this page to create, modify, or delete categories for risk classification.
Screen Elements
Risk Categories toolbar
See Categories Toolbar (see "Enterprise Data Categories Toolbar" on page 1258).
Category field
The name for a particular type of risk classification. Use risk categories to identify and
organize project risks consistently throughout your organization.
Technical, Operational, External are examples of risk categories that might apply to a
typical project.
Getting Here
1) Click the Projects menu and select Enterprise Project Data, or click the
Administer menu and select Enterprise Data.
2) In the Enterprise Data pane, expand Risks and click Risk Categories.
Risk Scoring Matrices Page
Overview
Use this page to create, modify and delete risk scoring matrices which are used to
perform qualitative analysis on project risks. Project risk is assessed based on the values
you assign to the thresholds defined in the risk scoring matrix.
Screen Elements
Risk Scoring Matrices toolbar
See Enterprise Data Risk Scoring Matrices Toolbar (on page 1282).
Name field
The name of the risk scoring matrix.
Matrix Size field
The dimensions of the risk scoring matrix, which are defined by the number of levels
required for the probability threshold and the impact thresholds. The visual
representation of the risk scoring matrix is the probability and impact diagram (PID).

Context-Sensitive Help Topics
1045
Probability Threshold field
The name of the probability threshold, which is defined on the Risk Thresholds page,
assigned to the risk scoring matrix. The probability threshold defines the likelihood of
the risk occurring.
Impact Thresholds field
The names of the impact thresholds, which are defined on the Risk Thresholds page,
assigned to the risk scoring matrix. Each risk scoring matrix must have a cost impact,
which is the monetary impact if the risk occurs, and a schedule impact, which is the
amount of time the risk will increase or decrease the project schedule. User-defined
impacts are optional.
Tolerance Threshold field
The name of the tolerance threshold, which is defined on the Risk Thresholds page,
assigned to the risk scoring matrix. The tolerance threshold is the acceptability or
manageability of a risk on a project.
Risk Scoring Method field
The type of calculation used to obtain an overall impact value, which is then used
along with the probability to determine the score used to evaluate project risk. The
overall impact value is calculated using one of the following three methods:
Highest Impact: The overall impact for a risk is set to the highest of all the impacts
assigned to the risk.
Average Impact: The overall impact is determined by calculating the average of all
impact values.
Average Individual Impact: The overall impact is determined by combining the value
of each impact individually with the probability obtaining a score from the Probability
and Impact Diagram. The total of all impact scores is then divided by the number of
impacts.
For more information, see Risk Scoring Method Description (on page 1334).
Description field
The description of the scoring matrix.
Risk Scoring Matrices Page detail windows:
Description Detail Window of the Risk Scoring Matrices Page (on page 712).
Projects Detail Window of the Risk Scoring Matrices Page (on page 979).
Probability and Impact Diagram Detail Window of the Risk Scoring Matrices Page (on
page 948).
Probability Detail Window of the Risk Scoring Matrices Page (on page 949).
Impacts Detail Window of the Risk Scoring Matrices Page (on page 834).
Tolerance Detail Window of the Risk Scoring Matrices Page (on page 1127).

1046
Getting Here
1) Click the Projects menu and select Enterprise Project Data, or click the
Administer menu and select Enterprise Data.
2) In the Enterprise Data pane, expand Risks and click Risk Scoring Matrices.
Risk Thresholds Page
Overview
Use this page to add and configure risk thresholds.
Screen Elements
Risks toolbar
See Risk Thresholds Toolbar (on page 1336).
Name field
The name of the risk threshold.
Type field
The type of risk threshold you are defining.
Valid values are:
Probability: The likelihood of a risk occurring.
Tolerance: The acceptability or manageability of a risk on a project.
Schedule Impact:: The amount of time the risk will increase or decrease the project
schedule.
Cost Impact:: The cost impact if a risk occurs.
User-defined Impact: An impact you create for your particular project or company.
These impact values will be calculated in the risk score.
Levels field
The number of levels assigned to a threshold.
Valid values are between 2 and 9.
Risk Thresholds Page detail window:
Levels Detail Window of the Risk Thresholds Page (on page 871).
Getting Here
1) Click the Projects menu and select Enterprise Project Data, or click the
Administer menu and select Enterprise Data.
2) In the Enterprise Data pane, expand Risks and click Risk Thresholds.

Context-Sensitive Help Topics
1047
Risk UDFs Page
Overview
Use this page to add and configure user defined fields for risks.
Screen Elements
User Defined Fields toolbar
See User Defined Fields Toolbar (on page 1361).
User Defined Field field
The name of the user-defined field.
Data Type field
The name of the type of data that corresponds to each user-defined field. The data
type you select determines the type of data you can specify in a field. The following
data types are available:
Text: Allows you to use text or a combination of text and numbers.
Start Date: Allows you to enter Start Date information only.
Finish Date: Allows you to enter Finish Date information only.
Cost: Allows you to enter currency values.
Number: Allows you to use numerals with two decimal places.
Integer: Allows you to use numeric data, but not a number related to money.
Indicator: Allows you to use an indicator field that you can use to enter
color-coded icon values in columns and display color-coded text in reports.
Getting Here
1) Click the Projects menu and select Enterprise Project Data, or click the
Administer menu and select Enterprise Data.
2) In the Enterprise Data pane, expand Risks and choose Risk UDFs.
Risks Detail Window
Overview
Use this detail window to list, modify, and manage your project risks.
Screen Elements
Risks toolbar
See Risks Toolbar of the Activities and EPS Pages (on page 1339).

1048
Category field
The name for a particular type of risk classification. Use risk categories to identify and
organize project risks consistently throughout your organization.
Technical, Operational, External are examples of risk categories that might apply to a
typical project.
ID field
The unique identifier for the risk.
Name field
The name of the risk.
Owner field
The resource that has ownership of the risk.
Project ID field
The unique identifier of the project associated with the risk.
Project Name field
The name of the associated project.
Status field
The current state of the risk. Valid values are:
Proposed: The risk is identified and awaits approval.
Open: The risk is approved as a valid risk to the project.
Active: The risk is currently impacting the project.
Rejected (Closed): The risk is not seen as a valid risk to the project and therefore
will not be tracked and managed by the project. The data for this risk cannot be
modified once it is closed.
Managed (Closed): The risk occurred and was successfully managed by the
project team and is no longer an active risk. The data for this risk cannot be
modified once it is closed.
Impacted (Closed): The risk occurred, impacted the project and is no longer an
active risk. The data for this risk cannot be modified once it is closed.
Type field
The classification of the risk as a threat or an opportunity.
A threat will have a negative impact on your project, while an opportunity can have
a perceived benefit to the project.
Getting Here
1) Click Projects.
2) On the Projects navigation bar, click EPS.

Context-Sensitive Help Topics
1049
3) On the EPS page, click the Risks detail window.
Risks Detail Window of the Activities Page
Overview
Use the Risks detail window to list, modify, and manage your project risks.
Screen Elements
Risks toolbar
See Risks Toolbar of the Activities and EPS Pages (on page 1339).
Category field
The name for a particular type of risk classification. Use risk categories to identify and
organize project risks consistently throughout your organization.
Technical, Operational, External are examples of risk categories that might apply to a
typical project.
ID field
The unique identifier for the risk.
Name field
The name of the risk.
Owner field
The resource that has ownership of the risk.
Project ID field
The unique identifier of the project associated with the risk.
Project Name field
The name of the associated project.
Status field
The current state of the risk. Valid values are:
Proposed: The risk is identified and awaits approval.
Open: The risk is approved as a valid risk to the project.
Active: The risk is currently impacting the project.
Rejected (Closed): The risk is not seen as a valid risk to the project and therefore
will not be tracked and managed by the project. The data for this risk cannot be
modified once it is closed.

1050
Managed (Closed): The risk occurred and was successfully managed by the
project team and is no longer an active risk. The data for this risk cannot be
modified once it is closed.
Impacted (Closed): The risk occurred, impacted the project and is no longer an
active risk. The data for this risk cannot be modified once it is closed.
Type field
The classification of the risk as a threat or an opportunity.
A threat will have a negative impact on your project, while an opportunity can have
a perceived benefit to the project.
User Defined field
Fields defined by your P6 administrator that are not standard in the application, but
are necessary to capture additional data for the project or the company.
Getting Here
1) Click Projects.
2) On the Projects navigation bar, click Activities.
3) On the Activities page:
a. Click on an activity.
b. Click the Risks detail window.
Risks Page
Overview
Use this page to add, modify, or delete project risks.
Note: If the Probability, Schedule, and Cost fields are disabled, a
risk scoring matrix is not assigned to the current project. You can still
enter risk data on this page; however, a risk scoring matrix must be
assigned to a project to perform qualitative risk analysis.
Screen Elements
Risks toolbar
See Risks Toolbar (on page 1338).
Added By field
The name of the user that created the risk.
Added Date field
The date this risk was created.

Context-Sensitive Help Topics
1051
Category field
The name for a particular type of risk classification. Use risk categories to identify and
organize project risks consistently throughout your organization.
Technical, Operational, External are examples of risk categories that might apply to a
typical project.
Cause field
The description of the cause of the risk.
Description field
The description of the risk.
Effect field
The resulting effect of the presence of the risk.
ID field
The unique identifier for the risk.
Last Modified By field
The name of the user that last updated the risk.
Last Modified Date field
The date this risk was last updated.
Name field
The name of the risk.
Notes field
The notes or comments entered for the associated with the risk.
Owner field
The resource that has ownership of the risk.
Project ID field
The unique identifier of the project associated with the risk.
Project Name field
The name of the associated project.
Response Total Cost field
The total cost of the active response plan.
If a response plan is active, the Response Total Cost field is disabled and displays the
sum of the Remaining Cost plus Actual Cost fields for all response action items in the
response plan. Rejected response action items are not included in the calculation.

1052
Risk Scoring Matrix field
The name of the risk scoring matrix assigned to the project.
Status field
The current state of the risk. Valid values are:
Proposed: The risk is identified and awaits approval.
Open: The risk is approved as a valid risk to the project.
Active: The risk is currently impacting the project.
Rejected (Closed): The risk is not seen as a valid risk to the project and therefore
will not be tracked and managed by the project. The data for this risk cannot be
modified once it is closed.
Managed (Closed): The risk occurred and was successfully managed by the
project team and is no longer an active risk. The data for this risk cannot be
modified once it is closed.
Impacted (Closed): The risk occurred, impacted the project and is no longer an
active risk. The data for this risk cannot be modified once it is closed.
Type field
The classification of the risk as a threat or an opportunity.
A threat will have a negative impact on your project, while an opportunity can have
a perceived benefit to the project.
User Defined field
Fields defined by your P6 administrator that are not standard in the application, but
are necessary to capture additional data for the project or the company.
Pre-response Thresholds:
Cost field
The monetary impact on the project if the risk occurs.
Probability field
The probability of the risk occurring.
Schedule field
The impact on the schedule if the risk occurs.
Score field
The risk calculation based on the values defined for probability, cost impact,
schedule impact, and any additional user-defined impacts for the risk.
Score (Text) field
The text-based risk score based on the values defined for probability, cost impact,
schedule impact, and any additional user-defined impacts for the risk.

Context-Sensitive Help Topics
1053
Risks Page detail windows:
Response Plans Detail Window of the Risks Page (on page 1037)
Activities Detail Window of the Risks Page (on page 544)
Description Detail Window of the Risks Page (on page 712)
Cause Detail Window of the Risks Page (on page 613)
Effect Detail Window of the Risks Page (on page 744)
Notes Detail Window of the Risks Page (on page 907)
Probability and Impact Diagram Detail Window of the Risks Page (on page 948)
Getting Here
1) Click Projects.
2) On the Projects navigation bar, click Risks.
Role Teams Detail Window of the Roles Tab of the Administration Page
Overview
Use this detail window to assign roles to role teams.
Screen Elements
Add (Insert)
Assigns one or more role teams to the selected role.
Delete (Delete)
Deletes or removes the currently selected data items or table rows.
Caution: Your selected data is permanently deleted once you click Save.
Role selector (Ctrl+Up Arrow) or (Ctrl+Down Arrow)
Cycles through the available roles and determines which data display in the detail
window. Click (Ctrl+Up Arrow) to move to the previous role, or click (Ctrl+Down
Arrow) to move to the next role. The content in the detail window is refreshed with the
data for the selected role.
Name field
The name of the role team.
Available To field
Indicates the user access for the team.
Global: all users with module access can view this team.
User: only you have access to this team.

1054
Getting Here
1) Click Resources.
2) On the Resources navigation bar, click Administration.
3) On the Administration page, click the Roles tab.
4) On the Roles tab, click the Role Teams detail window.
Role Teams Tab of the Administration Page
Overview
Use this tab to create roles teams, assign roles to teams, and modify or delete existing role
teams.
Screen Elements
Role Teams Toolbar
See Teams Tabs Toolbar (on page 1351).
Name field
The name of the role team.
Roles field
The list of roles assigned to the selected role team.
Roles detail window
See Roles Detail Window of the Role Teams Tab of the Administration Page (on page
1057).
Getting Here
1) Click Resources.
2) On the Resources navigation bar, click Administration.
3) On the Administration page, click the Role Teams tab.
Role Usage Tab of the Analysis Page
Overview
Use this tab to view role or staffing information as a histogram (staffed, unstaffed, and
overallocated values over time) or as a spreadsheet (staffed and unstaffed values by
project). You can view totals for an entire role grouping (a parent role or role team) or for
individual roles. Use the navigation hierarchy on the left side of the page to select and
organize the roles you want to view. You can organize the view by role hierarchy or role
team.

Context-Sensitive Help Topics
1055
The usage data displayed on the Role Usage tab is based on summary data, so it reflects
values as of the last date the summarizer was run for a project. Assignment changes
within a project after that date will not be reflected until the project is again summarized.
See Summarizing Projects.
Screen Elements
Group By
Displays options for re-arranging a list of values by grouping them into a hierarchy and
sorting.
Group By list
Select from one of the following by which to group the available roles:
Role Hierarchy
Role Team
Search
Displays options for finding a specific matching entry or entries based on search
criteria.
Customize link
Displays a dialog box with configurable options to customize the Spreadsheet or
Histogram. See Customize Spreadsheet or Histogram Dialog Box of the Analysis Page
(on page 697).
Export Spreadsheet link
Exports the current spreadsheet to a Microsoft Excel .xls file.
Display options
Determines whether to view information about the selected role/resource and
associated projects in Spreadsheet or Histogram format.
Zoom In
Increases the current magnification of items in the work area so they appear larger.
Zoom Out
Decreases the current magnification of items in the work area so they appear smaller.
Getting Here
1) Click Resources.
2) On the Resources navigation bar, click Analysis.
3) On the Analysis page, click the Role Usage tab.

1056
Roles Detail Window of the Resources Tab of the Administration Page
Overview
Use this detail window to view and assign roles to the selected resource.
Details
Add (Insert)
Assigns a role.
Delete (Delete)
Deletes or removes the currently selected data items or table rows.
Caution: Your selected data is permanently deleted once you click Save.
Resource selector (Ctrl+Up Arrow) or (Ctrl+Down Arrow)
Cycles through the available resources and determines which data display in the
detail window. Click (Ctrl+Up Arrow) to move to the previous resource, or click
(Ctrl+Down Arrow) to move to the next resource. The content in the detail window is
refreshed with the data for the selected resource.
Role ID field
The unique identifier of the associated role.
Role Name field
The name of the role assigned to the resource.
Proficiency field
The resource's proficiency at performing this role.
The values are 1 - Master, 2 - Expert, 3 - Skilled, 4 - Proficient, and 5 - Inexperienced. If
you do not have the proper privilege, you cannot access this field.
Primary Role option
Determines whether this is the resource's main role; a role that does not have this
option selected indicates that this is a secondary role for the resource. You can only
assign one primary role per resource; a resource is not required to have a primary role.
Getting Here
1) Click Resources.
2) On the Resources navigation bar, click Administration.
3) On the Administration page, click the Resources tab.
4) On the Resources tab, click the Roles detail window.

Context-Sensitive Help Topics
1057
Roles Detail Window of the Role Teams Tab of the Administration Page
Overview
Use this detail window to assign or remove roles from role teams.
Screen Elements
Add (Insert)
Assigns a role.
Delete (Delete)
Deletes or removes the currently selected data items or table rows.
Caution: Your selected data is permanently deleted once you click Save.
Role Name field
The name of the role assigned to the role team.
Role ID field
The unique identifier of the associated role.
Getting Here
1) Click Resources.
2) On the Resources navigation bar, click Administration.
3) On the Administration page, click the Role Teams tab.
4) On the Role Teams tab, click the Roles detail window.
Roles Tab of the Administration Page
Overview
Use this tab to add, modify, and delete roles.
Screen Elements
Roles Tab toolbar
See Roles Tab Toolbar (on page 1340).
Calculate Cost from Units option
Determines whether by default any new assignments for this role will have its costs
recalculated whenever any quantity changes occur. This setting can be overwritten
on a per project basis.

1058
Price/Unit fields
The non-overtime price for the role, which is used to compute costs for any activities
the role is assigned to. You can define up to five rate types, or price/unit values, per
role. Price/unit is a default name and can be modified by your P6 administrator.
Examples of Price/Unit names include Internal Rate, External Rate and Standard Rate.
Description field
The responsibilities for the role.
ID field
The unique identifier for the role.
Name field
The name of the role.
Resources field
The list of resources assigned to the role.
Role Teams field
The list of role teams assigned to the role.
Roles Tab detail windows:
Description Detail Window on Roles Tab of the Administration Page (see "Description
Detail Window of the Roles Tab of the Administration Page" on page 713)
Resources Detail Window of the Roles Tab of the Administration Page (on page 1023)
Prices Detail Window of the Roles Tab of the Administration Page (on page 946)
Limits Detail Window of the Roles Tab of the Administration Page (on page 872)
Role Teams Detail Window on Roles Tab of the Administration Page (see "Role Teams
Detail Window of the Roles Tab of the Administration Page" on page 1053)
Getting Here
1) Click Resources.
2) On the Resources navigation bar, click Administration.
3) On the Administration page, click the Roles tab.
Safety Portlet
Overview
Use this portlet to view the number of open and closed safety notices, and their
dispositions (e.g. resolved or duplicate) that exist for the project in Contract
Management (formerly known as Expedition). Red indicates open documents, and blue
indicates closed documents.

Context-Sensitive Help Topics
1059
Screen Elements
Safety portlet
The Safety portlet displays documented safety violation notices, recorded injuries on
job sites, and recorded federal regulations, such as Occupational Safety and Health
Administration (OSHA).
Move the mouse over a section of the chart to display the number of safety notices
for a specific disposition. Click a section to view a list of all safety notices for a specific
disposition. This information will be displayed in Contract Management, which
displays in a new browser. This information can only be accessed here if you have a
valid user name and password.
Tips
The number at the top of the portlet indicates the total number of project safety
notices.
If you have the required privilege, you can customize the Project Workspace to
configure the way safety information appears in the portlet. The customize options set
for the portlet apply for all projects in the organization. Depending on these options,
the disposition types that appear in the chart can include:
FOLW = Follow-up needed
RSLV = Resolved
DUPE = Duplicate
UNFD = Unfounded
Getting Here
1) Click Projects.
2) On the Projects navigation bar, click Workspace.
3) On the Workspace page, expand the Safety portlet.
Schedule Check Report Dialog Box
Overview
Use this dialog box to view potential issues in a schedule. For example, the report might
identify missing logic or a large number of constraints in the schedule.
Screen Elements
Click one of the links below for detailed screen definitions:
Projects Checked Section of the Schedule Check Report Dialog Box (on page 978)
Projects Checked Have Links to the Following Closed Projects Section of the
Schedule Check Report Dialog Box (on page 977)
Check Summary Section of the Schedule Check Report Dialog Box (on page 619)

1060
Logic - Activities Missing Predecessors or Successors Section of the Schedule
Check Report Dialog Box (on page 874)
Negative Lags - Relationships with a Lag Duration of Less Than 0 Section of the
Schedule Check Report Dialog Box (on page 898)
Lags - Relationships with a Positive Lag Duration Section of the Schedule Check
Report Dialog Box (on page 860)
Long Lags - Relationships with a Lag Duration Greater Than 352 Hours Section of the
Schedule Check Report Dialog Box (on page 875)
Relationship Types - The Majority of Relationships Should be Finish to Start Section
of the Schedule Check Report Dialog Box (on page 986)
Hard Constraints - Constraints That Prevent Activities Being Moved Section of the
Schedule Check Report Dialog Box (on page 829)
Soft Constraints - Constraints That Do Not Prevent Activities Being Moved Section of
the Schedule Check Report Dialog Box (on page 1084)
Large Float - Activities with a Total Float Greater Than 352 Hours Section of the
Schedule Check Report Dialog Box (on page 862)
Negative Float - Activities with a Total Float Less Than 0 Section of the Schedule
Check Report Dialog Box (on page 897)
Large Durations - Activities That Have a Remaining Duration Greater Than 352
Hours Section of the Schedule Check Report Dialog Box (on page 861)
Invalid Progress Dates - Incomplete Activities Before the Data Date Section of the
Schedule Check Report Dialog Box (on page 844)
Invalid Progress Dates - Activities with Actual Dates After the Data Date Section of
the Schedule Check Report Dialog Box (on page 842)
Resource/Cost - Activities That Do Not Have an Expense or a Resource Assigned
Section of the Schedule Check Report Dialog Box (on page 1019)
Late Activities - Activities Scheduled to Finish Later Than the Project Baseline
Section of the Schedule Check Report Dialog Box (on page 863)
BEI - Activities with No Project Baseline Finish Date Section of the Schedule Check
Report Dialog Box (on page 602)
Links to Closed Projects - Activities with Links to Closed Projects Section of the
Schedule Check Report Dialog Box (on page 872)
Getting Here
1) Click Projects.
2) On the Projects navigation bar, click Activities.
3) On the Activities page, click the Actions menu and click Run Check
Schedule....
4) In the Check Schedule dialog box, configure the options and click Check Schedule.

Context-Sensitive Help Topics
1061
Schedule Detail Window of the Reports Page
Overview
Use this detail window to manage one or more scheduled reports. The same report can
be configured with multiple scheduled variations. For example, a listing can be
generated as a PDF and delivered through e-mail daily to one person, but delivered just
once per week to another.
Screen Elements
Schedule detail window toolbar
See Schedule Detail Window Toolbar (on page 1342).
Schedule Name field
The name for the report schedule. A single report will have multiple schedule names.
For example, an original source report named Quality Report can be scheduled and
given the following schedule names: Weekly Quality Report, Monthly Team Quality
Report, and Region 3 Quality Report.
Delivery Type field
The way users will access or take delivery of this report. On-demand reports can be
delivered by electronic mail as attachments or downloaded as files. You can only
deliver scheduled reports by electronic mail.
Enabled option
Determines whether the selected report schedule is actively generating output as
defined by its scheduling settings. When this option is selected, the schedule is active.
When this option is cleared, the schedule remains in the list with all its settings but no
future report output is actually generated.
Finish Date field
The date and time for the last report output in the schedule. For example, if a report is
scheduled to run weekly for 3 weeks this field would show the date and time of the
third and final report output.
Report Location field
The path to the predefined source report in the folders shared by P6 and BI Publisher.
Report Name field
The title for the report defined in BI Publisher.
Report Recipients field
The distribution list showing each e-mail user set to receive the report.

1062
Run Type field
The scheduled report job's recurrence pattern.
For example, run once, daily, weekly, or monthly.
Schedule ID field
A unique system-generated identifier assigned by BI Publisher to each report
schedule.
Start Date field
The date and time for the first report output in the schedule.
For example, if a report is scheduled to run weekly for 3 weeks this field would show
the date and time of the first report output.
Status field
The state of the scheduled report.
Results are:
Completed: All scheduled runs are complete.
Failed: An error occurred during the scheduled run and a report did not generate.
Pending: The entire scheduled report run is not complete. For example, if a report is
scheduled to run every Monday for 10 weeks and only 2 weeks have passed, the
status for the scheduled report run remains Pending until all 10 instances of the report
have run.
Suspended: The Enabled field is cleared and the scheduled report run will not
continue until the Enabled field is selected.
User field
The identifier for the user who created the scheduled job.
Getting Here
1) Click Reports.
2) On the Reports page:
a. Click View and select Reports.
b. Select a report and click the Schedule detail window.

Context-Sensitive Help Topics
1063
Schedule Performance Portlet of the Dashboards Page
Overview
Use this portlet to view both current and forecast schedule summary performance
information, in either costs or labor units. Positive performance schedule values indicate
that the project is ahead of schedule; negative values indicate that the project is behind
schedule. Positive performance cost values indicate that the project is under budget;
negative values indicate that the project is over budget. Status indicators help you
gauge whether a variance is within an acceptable range or whether you will need to
take corrective action, based on thresholds you define.
The following calculated data is displayed in the Schedule Performance portlet. Data is
calculated and displayed in either costs or labor units, depending on your preference
selection (see Tips).
Screen Elements
Schedule field
Calculated as: Earned Value Labor Units minus Planned Value Labor Units
The variance percentage is calculated as: (Earned Value Labor Units minus Planned
Value Labor Units) divided by Planned Value Labor Units.
To Date - Labor Units field
The value used to determine if the project is over or under labor units.
Calculated as Earned Value Labor Units minus Actual Labor Units.
Forecast at Completion - Schedule field
The estimated labor unit or cost variance at completion.
For costs: Calculated as Budget at Completion multiplied by Schedule Variance
Index (SVI), where SVI equals SV divided by Planned Value Cost.
For labor units: Calculated as Baseline (BL) Labor Units multiplied by SVI Labor Units,
where SVI equals SV divided by Planned Value Labor Units.
Forecast at Completion - Labor Units
The estimated labor unit at completion.
Calculated as BAC Labor Units minus EAC Labor Units.
Tips
The Schedule Performance portlet calculates and displays data in cost or labor units
based on the option selected in Global Preferences.
If a dashboard's Filter by option is set to a portfolio or project code, the portlet lists
each project included in the portfolio or project code filter and displays each
project's schedule performance data.

1064
You can click a project name in the portlet to display the Performance Status page or
the associated Project Workspace; the page displayed depends on your module
access.
Getting Here
1) Click Dashboards.
2) On the Dashboards page, select a dashboard.
3) On the dashboard, expand the Schedule Performance portlet.
Schedule Performance Portlet of the Workspace Page
Overview
Use this portlet to view both current and forecast schedule performance information
derived from cost or labor unit summary calculations. The values are expressed in your
preferred units of time and provide both text and visual indicators to help you
understand the data at a glance.
Screen Elements
Legend
Key to performance threshold indicators. Use these visual indicators to quickly scan
values based on thresholds you define:
Critical: Indicates that a WBS, project, or portfolio requires significant corrective
action.
Warning: Indicates that a WBS, project, or portfolio needs attention and is
performing below expectations.
Acceptable: Indicates that a WBS, project, or portfolio is performing within an
expected range.
Exceptional: Indicates that a WBS, project, or portfolio is exceeding
expectations.
To Date columns:
Schedule field
The variance between the baseline schedule and actual schedule to date. This value
is expressed in units of time accompanied by a convenient visual indicator mapped
to performance thresholds you can define. The value can be derived based on costs
or labor units; and will often yield different results.
This variance helps address the basic question, "How did we do so far?" It provides
concise answers such as 4 days early, No Progress, on schedule, or 12 days late.
Calculated as: (Baseline Duration multiplied by Performance % Complete) minus
(Baseline Duration multiplied by Schedule % Complete)

Context-Sensitive Help Topics
1065
Where: Performance % Complete equals Earned Value divided by BAC and
Schedule % Complete equals Planned Value divided by BAC
Labor Units field
Calculated as: Earned Value Labor Units minus Actual Labor Units
The variance percentage is calculated as: (Earned Value Labor Units minus Actual
Labor Units) divided by Earned Value Labor Units.
Forecast at Completion columns:
Schedule field
Calculated as: Remaining Finish Date minus Baseline Finish Date
Labor Units field
Calculated as: BAC Labor Units minus EAC Labor Units
The variance percentage is calculated as: (BAC Labor Units minus EAC Labor Units)
divided by BAC Labor Units.
Tips
The Schedule Performance portlet calculates and displays data in cost or labor units
based on the option selected in the Project Performance section of the Customize
Workspace page.
This portlet displays data for the selected project only. When multiple projects are
open, you must select the project you want to work with in the Select Project list at the
top right of the Workspace page. When a single project is open, the Select Project list
does not appear.
Getting Here
1) Click Projects.
2) On the Projects navigation bar, click Workspace.
3) On the Workspace page, expand the Schedule Performance portlet.
Schedule Project Dialog Box of the Activities Page
Overview
Use this dialog box to manage the project schedule according to your requirements.
Screen Elements
Data Date options
The options to display the data date at the starting point to calculate the schedule:
All projects use their own data date option: Specifies that all projects are to use
their own data date.

1066
Apply selected data date to all open projects option: Specifies a single date for all
projects to use as the data date. Enter a date and time into the Data Date field
which becomes available upon selecting this option.
Data Date field
The date used as the starting point to calculate the schedule. Each project has its
own data date.
Display scheduling log upon completion option
Determines whether to display the scheduling log when all options are completed
and you click the Schedule button.
Options button
Opens a dialog box with configurable options for scheduling a report. This dialog box
is identical to the Scheduling Options dialog box on the Tools page. See Scheduling
Options Dialog Box (on page 1070) for further details.
Schedule button
Saves changes and schedules the project accordingly.
Getting Here
1) Click Projects.
2) On the Projects navigation bar, click Activities.
3) On the Activities page, click the Actions menu and select Run Scheduler...
(F9).
Schedule Tab of the Report Settings Dialog Box
Overview
Set the options on this tab to determine when your scheduled report output will be
generated.
Screen Elements
Run list
The level of recurrence or frequency with which the selected report is scheduled to
generate output. The value you choose answers the question How often should report
output be generated and delivered? Valid values are described below.
Once: You want the report to generate output on a specific date at a specific
time.
Daily: You want the report to generate output once a day on specified days of
the week at a specific time.

Context-Sensitive Help Topics
1067
Weekly: You want the report to generate output once a week on a specific day of
the week at a specific time.
Monthly: You want the report to generate output once a month during specified
months of the year on a specific day within the month at a specific time.
Note: The screen elements available in the Schedule Options
section will automatically change to reflect your choice in the Run
field.
Getting Here
1) Click Reports.
2) On the Reports page:
a. Click View and select Reports.
b. Select a report, and then click the Schedule detail window.
3) In the Schedule detail window, click Add (Insert).
4) In the Report Settings dialog box, click the Schedule tab.
Scheduled Services Page
Overview
Use this page to schedule, verify status, modify, and delete routine recurring project
management jobs, called services. The services run in the order in which they appear.
The services you can schedule to run automatically include:
Apply Actuals
Summarize
Level Project Resources
Schedule Project
Screen Elements
Scheduled Services toolbar
See Scheduled Services Toolbar (on page 1343).
Enabled option
Determines whether a service is enabled.
Name field
The title of the scheduled service.
Service field
The type of service. (This is a read-only field.)

1068
Status field
The status of the service. (This is a read-only field.)
Delegated: When the summarize service is running and waiting for child records to
complete summarizing.
Pending: Status defaults to pending after initial creation or if the service is waiting
in queue to be run.
Running: When the service is running on the service machine.
Failed: When the service cannot complete, an error occurs, or data could not be
committed.
Completed: When the service completes successfully.
Owner field
The creator of the service.
Last Run field
The last time the service was run.
Next Run field
The next time the service is scheduled to run.
Service Summary detail window
See Service Summary Detail Window (on page 1081).
Getting Here
Click the Projects menu and select Scheduled Services.
Schedules View of the Reports Page
Overview
Use this page to view details for all scheduled reports, run a scheduled report
on-demand, delete scheduled reports, replicate a scheduled report, and view the
history for a scheduled run.
Screen Elements
See Reports Schedules View Toolbar (on page 1327).
Schedule Name field
The name for the report schedule. A single report will have multiple schedule names.
For example, an original source report named Quality Report can be scheduled and
given the following schedule names: Weekly Quality Report, Monthly Team Quality
Report, and Region 3 Quality Report.

Context-Sensitive Help Topics
1069
Delivery Type field
The way users will access or take delivery of this report. On-demand reports can be
delivered by electronic mail as attachments or downloaded as files. You can only
deliver scheduled reports by electronic mail.
Enabled option
Determines whether the selected report schedule is actively generating output as
defined by its scheduling settings. When this option is selected, the schedule is active.
When this option is cleared, the schedule remains in the list with all its settings but no
future report output is actually generated.
Finish Date field
The date and time for the last report output in the schedule. For example, if a report is
scheduled to run weekly for 3 weeks this field would show the date and time of the
third and final report output.
Report Location field
The path to the predefined source report in the folders shared by P6 and BI Publisher.
Report Name field
The title for the report defined in BI Publisher.
Report Recipients field
The distribution list showing each e-mail user set to receive the report.
Run Type field
The scheduled report job's recurrence pattern.
For example, run once, daily, weekly, or monthly.
Schedule ID field
A unique system-generated identifier assigned by BI Publisher to each report
schedule.
Start Date field
The date and time for the first report output in the schedule.
For example, if a report is scheduled to run weekly for 3 weeks this field would show
the date and time of the first report output.
Status field
The state of the scheduled report.
Results are:
Completed: All scheduled runs are complete.
Failed: An error occurred during the scheduled run and a report did not generate.

1070
Pending: The entire scheduled report run is not complete. For example, if a report is
scheduled to run every Monday for 10 weeks and only 2 weeks have passed, the
status for the scheduled report run remains Pending until all 10 instances of the report
have run.
Suspended: The Enabled field is cleared and the scheduled report run will not
continue until the Enabled field is selected.
User field
The identifier for the user who created the scheduled job.
Reports Schedules View detail window:
Description Detail Window of the Reports Page (on page 711)
Getting Here
1) Click Reports.
2) On the Reports page, click View and select Schedules.
Scheduling Options Dialog Box
Overview
Use this dialog box to set options in order to manage the project schedule according to
your requirements.
Screen Elements
General tab
See General Tab of the Scheduling Options Dialog Box (on page 809).
Advanced tab
See Advanced Tab of the Scheduling Options Dialog Box (on page 577).
Tips
When you access scheduling options from the Activities page, the options you select
apply to all open projects. All options are saved with the projects, except for the option
to level resources.
Getting Here
1) Click Projects.
2) On the Projects navigation bar, click Activities.
3) On the Activities page, click the Actions menu and select Run Scheduler....
4) In the Schedule Project dialog box, click Options.

Context-Sensitive Help Topics
1071
Scheduling Report Dialog Box of the Activities Page
Overview
Use this dialog box to view errors, warnings, and exceptions as well as basic information
about the job, such as option settings and statistics.
Screen Elements
Scheduling Settings section
See Scheduling Settings Section of the Scheduling Report Dialog Box of the Activities
Page (on page 1075).
Statistics section
See Statistics Section of the Scheduling Report Dialog Box of the Activities Page (on
page 1093).
Errors section
Activities that have invalid relationship loops field: Displays a value for the specified
field in a read-only format.
Warnings section
See Warnings Section of the Scheduling Report Dialog Box of the Activities Page (on
page 1155).
Scheduling Results section
See Scheduling Results Section of the Scheduling Report Dialog Box of the Activities
Page (on page 1072).
Exceptions section
See Exceptions Section of the Scheduling Report Dialog Box of the Activities Page (on
page 759).
Getting Here
1) Click Projects.
2) On the Projects navigation bar, click Activities.
3) On the Activities page, click the Actions menu and select Run Scheduler...
(F9).
4) In the Schedule Project dialog box:
a. Configure the options and select the Display scheduling log upon completion
option.
b. Click Schedule.

1072
Scheduling Results Section of the Leveling Report Log
Overview
Use this section to view the results of scheduling for the selected project. All fields are
read-only.
Screen Elements
Number of Activities Scheduled field
The number of scheduled activities for the project.
Number of Relationships with other projects field
The number of relationships between the selected project and other projects.
Earliest Data Date field
The date used as the earliest starting point to calculate the schedule.
Earliest Early Start Date field
The earliest possible date the activity can start. When scheduling on the forward pass,
if the activity has any driving resource assignments, P6 will calculate the early start
date as the earliest Early Start date of all driving resource assignments.
Latest Early Finish Date field
The latest possible date the activity can finish.
Getting Here
1) Click Projects.
2) On the Projects navigation bar, click Activities.
3) On the Activities page, click the Actions menu and select Run Leveler...
(Shift+F9).
4) In the Level Resources dialog box, click the Options tab.
5) On the Options tab, select the Display leveling log upon completion and click Level.
6) In the Leveling Report Log, expand the Scheduling Results section.
Scheduling Results Section of the Scheduling Report Dialog Box of the Activities Page
Overview
Use this section to view the results of scheduling for the selected project. All fields are
read-only.

Context-Sensitive Help Topics
1073
Screen Elements
Number of Activities Scheduled field
The number of scheduled activities for the project.
Number of Relationships with other projects field
The number of relationships between the selected project and other projects.
Earliest Data Date field
The date used as the earliest starting point to calculate the schedule.
Earliest Early Start Date field
The earliest possible date the activity can start. When scheduling on the forward pass,
if the activity has any driving resource assignments, P6 will calculate the early start
date as the earliest Early Start date of all driving resource assignments.
Latest Early Finish Date field
The latest possible date the activity can finish.
Getting Here
1) Click Projects.
2) On the Projects navigation bar, click Activities.
3) On the Activities page, click the Actions menu and select Run Scheduler...
(F9).
4) In the Schedule Project dialog box:
a. Configure the options and select the Display scheduling log upon completion
option.
b. Click Schedule.
5) In the Scheduling Reports dialog box, expand the Scheduling Results section.
Scheduling Settings Section of the Leveling Report Log
Overview
Use this section to view the configuration of various scheduling settings. All fields are
read-only.
Screen Elements
Ignore relationships to and from other projects option
Determines whether to ignore activity relationships between projects.
Make open-ended activities critical option
Determines whether to label open-ended activities as critical during the scheduling.

1074
Use expected finish dates option
Determines whether to schedule activity finish dates as the expected finish dates.
When scheduling progressed activities use option
Determines the type of logic used to schedule dependent activities with
out-of-sequence progress. For example, a Finish to Start relationship in which the
predecessor has not finished but the successor has started.
Retained Logic: The remaining duration of a progressed activity is not scheduled
until all of its predecessors are finished.
Progress Override: The schedule ignores network logic and allows the activity to
progress without delay.
Actual Dates: Backward and forward passes are calculated using actual dates.
Calculate Start-to-Start lag from option
Determines when you want the successor to start. When a start to start relationship
exists and the predecessor starts out of sequence, the scheduler delays the successor
activity until the lag expires and all predecessor relationships have been satisfied. Use
this option to specify whether to subtract the lag from the predecessor's internal early
start date or its actual start date.
Early Start: Calculates the expired lag as the number of work periods between the
actual start and the data date and determines the successor's start date as the
predecessor's internal early start plus any remaining lag. Select this option when
the successor's start depends on the amount of work that the predecessor activity
accomplishes.
Actual Start: Determines the successor's start date as the data date plus any
remaining lag. Select this option when you want the successor's start to depend
on the time elapsed from the predecessor's actual start (regardless of the amount
of work that has been accomplished in the predecessor activity).
Define critical activities as Total Float less than or equal to field
Determines which activities are critical based on the number and time unit which
specify the minimum float time for activities before they are marked critical.
Compute Total Float As option
Determines the method to calculate total float for all activities based on the following
methods:
Start Float: The difference between the early and late start dates (Start Float
equals Late Start minus Early Start).
Finish Float: The difference between the early and late finish dates (Finish Float
equals Late Finish minus Early Finish).
Smallest value: Select to use the most critical value, which is the smaller of the start
float and finish float values.

Context-Sensitive Help Topics
1075
Calendar for scheduling Relationship Lag is list
The calendar used to calculate relationship lag. The default calendar for new
activities is specified on the Administration > Calendars page or in P6 Professional.
Predecessor Activity Calendar: Calculates lag based on the predecessor activity's
calendar
Successor Activity Calendar: Calculates lag based on the successor activity's
calendar
24 hour Calendar: Specifies work time 7 days/week and 24 hours/day
Project Default Calendar: Uses the calendar that is designated as the default for
new activities
Calculate multiple float paths option
Determines whether multiple critical float paths (sequences of activities) are
calculated in the project schedule. You can specify the number of critical float paths
to identify in the Specify the number of paths to calculate field. If you do not select
this option, you cannot edit the remaining fields.
Recalculate Assignment Costs option
Determines whether the costs of resource or role assignments that use multiple rates
are recalculated.
Using this option ensures that costs remain accurate when rescheduled dates reflect
a rate change.
Getting Here
1) Click Projects.
2) On the Projects navigation bar, click Activities.
3) On the Activities page, click the Actions menu and select Run Leveler...
(Shift+F9).
4) In the Level Resources dialog box, click the Options tab.
5) On the Options tab, select the Display leveling log upon completion and click Level.
6) In the Leveling Report Log, expand the Scheduling Settings section.
Scheduling Settings Section of the Scheduling Report Dialog Box of the Activities Page
Overview
Use this section to view the configuration of various scheduling settings. All fields are
read-only.
Screen Elements
Ignore relationships to and from other projects option
Determines whether to ignore activity relationships between projects.

1076
Make open-ended activities critical option
Determines whether to label open-ended activities as critical during the scheduling.
Use expected finish dates option
Determines whether to schedule activity finish dates as the expected finish dates.
When scheduling progressed activities use option
Determines the type of logic used to schedule dependent activities with
out-of-sequence progress. For example, a Finish to Start relationship in which the
predecessor has not finished but the successor has started.
Retained Logic: The remaining duration of a progressed activity is not scheduled
until all of its predecessors are finished.
Progress Override: The schedule ignores network logic and allows the activity to
progress without delay.
Actual Dates: Backward and forward passes are calculated using actual dates.
Calculate Start-to-Start lag from option
Determines when you want the successor to start. When a start to start relationship
exists and the predecessor starts out of sequence, the scheduler delays the successor
activity until the lag expires and all predecessor relationships have been satisfied. Use
this option to specify whether to subtract the lag from the predecessor's internal early
start date or its actual start date.
Early Start: Calculates the expired lag as the number of work periods between the
actual start and the data date and determines the successor's start date as the
predecessor's internal early start plus any remaining lag. Select this option when
the successor's start depends on the amount of work that the predecessor activity
accomplishes.
Actual Start: Determines the successor's start date as the data date plus any
remaining lag. Select this option when you want the successor's start to depend
on the time elapsed from the predecessor's actual start (regardless of the amount
of work that has been accomplished in the predecessor activity).
Define critical activities as Total Float less than or equal to field
Determines which activities are critical based on the flexibility of scheduled dates.
Compute Total Float As option
Determines the method to calculate total float for all activities based on the following
methods:
Start Float: The difference between the early and late start dates (Start Float
equals Late Start minus Early Start).
Finish Float: The difference between the early and late finish dates (Finish Float
equals Late Finish minus Early Finish).
Smallest value: Select to use the most critical value, which is the smaller of the start
float and finish float values.

Context-Sensitive Help Topics
1077
Calendar for scheduling Relationship Lag is list
The calendar used to calculate relationship lag. The default calendar for new
activities is specified on the Administration > Calendars page or in P6 Professional.
Predecessor Activity Calendar: Calculates lag based on the predecessor activity's
calendar
Successor Activity Calendar: Calculates lag based on the successor activity's
calendar
24 hour Calendar: Specifies work time 7 days/week and 24 hours/day
Project Default Calendar: Uses the calendar that is designated as the default for
new activities
Calculate multiple float paths option
Determines whether multiple critical float paths (sequences of activities) are
calculated in the project schedule. You can specify the number of critical float paths
to identify in the Specify the number of paths to calculate field. If you do not select
this option, you cannot edit the remaining fields.
Recalculate Assignment Costs option
Determines whether the costs of resource or role assignments that use multiple rates
are recalculated.
Using this option ensures that costs remain accurate when rescheduled dates reflect
a rate change.
Getting Here
1) Click Projects.
2) On the Projects navigation bar, click Activities.
3) On the Activities page, click the Actions menu and select Run Scheduler...
(F9).
4) In the Schedule Project dialog box:
a. Configure the options and select the Display scheduling log upon completion
option.
b. Click Schedule.
5) In the Scheduling Reports dialog box, expand the Scheduling Settings section.
Select Projects Dialog Box of the Project Calendars Page
Overview
Use this dialog box to select projects that will filter the calendars displayed on the Project
Calendars page.

1078
Screen Elements
Select Project Dialog Box Toolbar
See Select Projects Toolbar (on page 1345).
Available/Selected Projects
See Configuring Columns or Values.
Description list
Displays the description corresponding with each project.
Getting Here
1) Click the Projects menu and select Enterprise Project Data, or click the
Administer menu and select Enterprise Data.
2) In the Enterprise Data pane, expand Projects and click Project Calendars.
3) On the Project Calendars page, click Select Projects.
Select Projects Dialog Box of the Project Tab of the Activity Codes Page
Overview
Use this dialog box to add projects to the Project tab.
Screen Elements
Select Project Type
Filters available information by project or template.
Group By
Displays a menu of the available fields you can select to group related rows in a table
into hierarchical lists you can expand and collapse. For example, group by a
Category field to arrange all rows hierarchically by their Category field values. Expand
the Category A group to view its data rows, the Category B group to view its data
rows, and so on.
Columns
Displays a menu of the available fields you can show or hide as columns in the current
table.
Search
Displays a search field and any related options and controls for finding a specific
matching entry or entries based on your search criteria. Search by user name or
personal name.

Context-Sensitive Help Topics
1079
Getting Here
1) Click the Projects menu and select Enterprise Project Data, or click the
Administer menu and select Enterprise Data.
2) In the Enterprise Data pane, expand Activities and click Activity Codes.
3) On the Activity Codes page, click the Project tab.
4) On the Project tab, click Select Projects.
Send Projects to ERP Dialog Box of the Activities Page
Overview
Use this dialog box to select the project, project data, project budget, project status,
and timesheet hours to send to ERP.
In P6 security profiles, your administrator is required to enable the integration of your
project data with your Oracle ERP system before you can send projects to your ERP
application. If you require appropriate security privileges to send projects to your
configured ERP application, see your administrator.
Screen Elements
Select the projects to send to ERP section
The list of projects available to send to your Oracle ERP system.
Project ID field
The unique identifier of the project.
Project Name field
The name of each project. Can be arranged in an ascending or descending order.
Select Data to Include:
The types of project data to include when you send the selected project to your
Oracle ERP system.
Project Budget option
Determines whether to send budget information at a specific level of the WBS, with
resource and role summaries, to your Oracle ERP system.
Project Status option
Determines whether to include project, WBS, activity, resource assignments, and
activity expense details to your Oracle ERP system.
1080
Timesheet Hours option
Determines whether to enable timesheet data to be sent to your Oracle JD Edwards
ERP application. From the Date Range menu, select the date range of timesheets to
be sent.
Note: Timesheet data is sent only when P6 is integrated with an Oracle JD Edwards
ERP application.
Send button
Creates an XML file that contains the list of projects to send and the data that is to be
sent. Your integration of P6 with the Oracle ERP system might create a new project or
synchronize with an existing project in the Oracle ERP system.
Cancel button
Closes the Send Projects to ERP dialog box and returns you to the Gantt chart view.
Getting Here
1) Click Projects.
2) On the Projects navigation bar, click Activities.
3) On the Activities page, click the Actions menu and select Import/Export
Send to ERP.
Service Status Dialog Box
dzzzzzzOverview
Use this dialog box to view the status and other details for as soon as possible (ASAP)
services running in real time such as Apply Actuals, Summarize Project, or Schedule
Project. No scheduled services appear in this dialog box.
Note: To view the status of scheduled services, see Scheduled
Services Page (on page 1067).
Screen Elements
Service Status toolbar
See Service Status Toolbar (on page 1346).
Service field
The type of service. (This is a read-only field.)
Status field
The status of the service. (This is a read-only field.)
Delegated: When the summarize service is running and waiting for child records to
complete summarizing.

Context-Sensitive Help Topics
1081
Pending: Status defaults to pending after initial creation or if the service is waiting
in queue to be run.
Running: When the service is running on the service machine.
Failed: When the service cannot complete, an error occurs, or data could not be
committed.
Completed: When the service completes successfully.
Submitted field
The date the service was submitted. (This is a read-only field.)
Completed field
The date the service was completed. (This is a read-only field.)
Initiator field
The personal name of the user who initiated the service.
Projects field
The names of the projects or EPSs that were included in the specific service job.
Getting Here
1) Click Projects.
2) On the Projects navigation bar, click Activities.
3) On the Activities page, click Actions and select View Service Status.
Service Summary Detail Window
Overview
Use this detail window to view a brief summary of the general information associated
with the selected scheduled service.
Getting Here
1) Click the Projects menu and select Scheduled Services.
2) On the Scheduled Services page, click the Service Summary detail window.
Set Time Periods Dialog Box of Calendars
Overview
Use this dialog box to specify the number of work hours for each time period. These
settings are only available if your P6 Application Settings are set to ignore the default
hours per time period specified on the Time Periods tab, and instead use the assigned
calendar to specify the number of work hours for each time period.

1082
Screen Elements
Hours/Day field
The number of work hours within a calendar day. The value you enter must be
between 1.0 and 24.0 hours.
Hours/Week field
The number of work hours within a calendar week. The value you enter must be
between 1.0 and 168.0 hours.
Hours/Month field
The number of work hours within a calendar month. The value you enter must be
between 1.0 and 744.0 hours.
Hours/Year field
The number of work hours within a calendar year. The value you enter must be
between 1.0 and 8784.0 hours.
Getting Here
To access enterprise project data:
1) Click the Projects menu and select Enterprise Project Data.
2) In the Enterprise Project Data dialog box, expand Projects and click Project
Calendars.
3) On the Project Calendars page, select a calendar and then click Edit Hours Per
Period.
To access enterprise resource data:
1) Click the Resources menu and select Enterprise Resource Data.
2) In the Enterprise Resource Data pane, click Resource Calendars.
3) On the Resource Calendars page, select a calendar and then click Edit Hours Per
Period.
To access enterprise data:
1) Click the Administer menu and select Enterprise Data.
2) In the Enterprise Data pane, perform one of the following steps:
expand Global and click Global Calendars.
expand Projects and click Project Calendars.
expand Resources and click Resource Calendars.
3) On the Global, Project, or Resource Calendars page, select a calendar and then
click Edit Hours Per Period.

Context-Sensitive Help Topics
1083
Settings Detail Window of the Resources Tab of the Administration Page
Overview
Use this detail window to choose user settings such as calendar, overtime factor,
resource currency, and P6 Progress Reporter settings.
Screen Elements
Resource selector (Ctrl+Up Arrow) or (Ctrl+Down Arrow)
Cycles through the available resources and determines which data display in the
detail window. Click (Ctrl+Up Arrow) to move to the previous resource, or click
(Ctrl+Down Arrow) to move to the next resource. The content in the detail window is
refreshed with the data for the selected resource.
Calendar field
The name of the calendar selected for the resource.
Default Units/Time field
The default units/time for resource assignments in projects, which is shown as either a
percentage or units/duration depending on your settings in My Preferences. If you
change the default setting, existing resource assignments are not affected. The
default setting only applies to new resource assignments.
Overtime Allowed option
Determines whether the resource is allowed to log overtime hours.
Overtime Factor field
The overtime factor used to compute the overtime price for the resource. The default
is 1.5.
Used in overtime calculations where the rate is multiplied by the overtime factor to
figure the total overtime price.
Auto Compute Actuals option
Determines whether the activity actual and remaining units, and start and finish dates
for the resource are calculated automatically using the planned dates, planned
units, and the activity's schedule percent complete.
If this option is selected, the actual/remaining units and actual dates are
automatically updated when project actuals are applied. This assumes that all work
by the resource proceeds according to plan.
This option is not available if the Uses Timesheets option is selected.
Currency field
The name of the currency associated with this resource.
For example, US Dollars or Japanese Yen.

1084
Calculate Costs from Units option
Determines whether by default any new assignments for this resource will have its
costs recalculated whenever any quantity changes occur. This setting can be
overwritten on a per project basis.
Timesheet User Login field
The user name for the timesheet user login.
Uses Timesheets option
Determines whether the labor resource uses P6 Progress Reporter timesheets to record
hours for assigned activities.
This option is not available if the Auto Compute Actuals option is selected.
Timesheet Approval Manager field
The resource manager assigned to approve timesheets for the resource.
Getting Here
1) Click Resources.
2) On the Resources navigation bar, click Administration.
3) On the Administration page, click the Resources tab.
4) On the Resources tab, click the Settings detail window.
Soft Constraints - Constraints That Do Not Prevent Activities Being Moved Section of the
Schedule Check Report Dialog Box
Overview
Use this section to view activities in the schedule with soft constraints. Soft constraints do
not prevent activities from being moved, but they can distort float and create negative
float.
Only a subset of activities in the open projects are checked. WBS summary activities,
activities with an actual finish date, and Level of Effort activities are removed from the
subset to create the list of activities check for Soft Constraints. Start constraints are
ignored if they are on activities that have an actual start. The Actual percentage is
calculated as the number of activities found that match the check divided by the total
number of subset activities checked.
Screen Elements
Project ID field
The unique identifying code of the project containing the activity which failed the
check.

Context-Sensitive Help Topics
1085
Activity ID field
The unique identifying code of the activity which failed the check.
Activity Description field
The brief description of the listed activity.
Constraint Type field
The type of constraint that is preventing the activity from being moved.
Hard constraint types include: Mandatory Start and Mandatory Finish.
Soft constraint types include: Finish On, Finish On or After, Finish On or Before, Start On,
Start On or After, and Start On or Before.
Constraint Date field
The date, if applicable, to which the activity must adhere.
Position field
The constraint position: primary or secondary.
Getting Here
1) Click Projects.
2) On the Projects navigation bar, click Activities.
3) On the Activities page, click the Actions menu and select Run Check
Schedule....
4) In the Check Schedule dialog box:
a. Select the Soft Constraints - Constraints that do not prevent activities being moved
option.
b. Click Check Schedule.
5) In the Schedule Check Report dialog box, expand the Soft Constraints - Constraints
that do not prevent activities being moved section.
Standard Work Week Tab of the Global Calendars Page
Overview
Use this tab to specify the length of work hours in a day or to calculate the total number
of hours worked in a particular day.
Screen Elements
Work area
The typical work week that can be modified by day and hour. After choosing a
calendar to be added while on the calendar tab, the Standard Work Week tab will
display the similar template by days and hours.

1086
Day label
The name of each day. This label begins the week with Sunday, ends with Saturday,
and cannot be modified.
Total Hours field
The total number of work hours for each day. If hours are manually changed here, the
Work Period display will automatically change to incorporate the total hours and vice
versa.
Hour list
The listing of hours in the day.
Work Period display
The application displays a box that represents worked hours and that has a direct
relationship to the Total Hours field. At the top of this box, the start time is displayed.
There can be multiple Work Period boxes displayed in one day. This box can be
dragged by left-clicking and dragging the box up or down. If another Work Period
box is in the path of the dragged box, the dragged box will shrink and perhaps erase
the other box. This box can also be sized manually by left-clicking the top or bottom
edge and dragging it to the size you want. Right-clicking a Work Period box displays
Edit Calendar Day, Remove work period, and Set as nonwork options. Right-clicking a
space on the calendar not occupied by a Work Period box, displays the Edit
Calendar Day and Create work period options.
Getting Here
1) Click the Administer menu and select Enterprise Data.
2) In the Enterprise Data pane, expand Global and click Global Calendars.
3) On the Global Calendars page, click the Standard Work Week tab.
Standard Work Week Tab of the Project Calendars Page
Overview
Use this tab to specify the length of work hours in a day or to calculate the total number
of hours worked in a particular day.
Screen Elements
Work area
The typical work week that can be modified by day and hour. After choosing a
calendar to be added while on the calendar tab, the Standard Work Week tab will
display the similar template by days and hours.

Context-Sensitive Help Topics
1087
Day label
The name of each day. This label begins the week with Sunday, ends with Saturday,
and cannot be modified.
Total Hours field
The total number of work hours for each day. If hours are manually changed here, the
Work Period display will automatically change to incorporate the total hours and vice
versa.
Hour list
The listing of hours in the day.
Work Period display
The application displays a box that represents worked hours and that has a direct
relationship to the Total Hours field. At the top of this box, the start time is displayed.
There can be multiple Work Period boxes displayed in one day. This box can be
dragged by left-clicking and dragging the box up or down. If another Work Period
box is in the path of the dragged box, the dragged box will shrink and perhaps erase
the other box. This box can also be sized manually by left-clicking the top or bottom
edge and dragging it to the size you want. Right-clicking a Work Period box displays
Edit Calendar Day, Remove work period, and Set as nonwork options. Right-clicking a
space on the calendar not occupied by a Work Period box, displays the Edit
Calendar Day and Create work period options.
Getting Here
1) Click the Projects menu and select Enterprise Project Data, or click the
Administer menu and select Enterprise Data.
2) In the Enterprise Data pane, expand Projects and click Project Calendars.
3) On the Project Calendars page, click the Standard Work Week tab.
Standard Work Week Tab of the Resource Calendars Page
Overview
Use this tab to specify the length of work hours in a day or to calculate the total number
of hours worked in a particular day.
Screen Elements
Work area
The typical work week that can be modified by day and hour. After choosing a
calendar to be added while on the calendar tab, the Standard Work Week tab will
display the similar template by days and hours.

1088
Day label
The name of each day. This label begins the week with Sunday, ends with Saturday,
and cannot be modified.
Total Hours field
The total number of work hours for each day. If hours are manually changed here, the
Work Period display will automatically change to incorporate the total hours and vice
versa.
Hour list
The listing of hours in the day.
Work Period display
The application displays a box that represents worked hours and that has a direct
relationship to the Total Hours field. At the top of this box, the start time is displayed.
There can be multiple Work Period boxes displayed in one day. This box can be
dragged by left-clicking and dragging the box up or down. If another Work Period
box is in the path of the dragged box, the dragged box will shrink and perhaps erase
the other box. This box can also be sized manually by left-clicking the top or bottom
edge and dragging it to the size you want. Right-clicking a Work Period box displays
Edit Calendar Day, Remove work period, and Set as nonwork options. Right-clicking a
space on the calendar not occupied by a Work Period box, displays the Edit
Calendar Day and Create work period options.
Getting Here
1) Click the Resources menu and select Enterprise Resource Data, or click the
Administer menu and select Enterprise Data.
2) In the Enterprise Resource Data pane, expand Resources and click Resource
Calendars.
3) On the Resource Calendars page, click the Standard Work Week tab.
Standard Work Week Tab of the View Calendar Dialog Box
Overview
Use this tab to view the work hours in a day.
Screen Elements
Work area
The typical work week broken down into days and hours.
Day label
The name of each day. This label begins the week with Sunday, ends with Saturday,
and cannot be modified.

Context-Sensitive Help Topics
1089
Total Hours field
The total number of work hours each day.
Hour list
The listing of hours in the day.
Work Period display
The box that represents worked hours and that has a direct relationship to the Total
Hours field. At the top of this box, the start time is displayed. There can be multiple
Work Period boxes displayed in one day.
Getting Here
From the Activities page:
1) Click Projects.
2) On the Projects navigation bar, click Activities.
3) On the Activities page:
a. Select an activity.
b. Click the Actions menu and select View Calendar.
4) In the View Calendar dialog box, click the Standard Work Week tab.
From the EPS page:
1) Click Projects.
2) On the Projects navigation bar, click EPS.
3) :
a. Select a project.
b. Click the Actions menu and select View Calendar.
4) In the View Calendar dialog box, click the Standard Work Week tab.
Standard Work Week Tab of the View Calendar Dialog Box
Overview
Use this tab to view the length of work hours in a day or to calculate the total number of
hours worked in a particular day.
Screen Elements
Work area
The typical work week that can be modified by day and hour. After choosing a
calendar to be added while on the calendar tab, the Standard Work Week tab will
display the similar template by days and hours.

1090
Day label
The name of each day. This label begins the week with Sunday, ends with Saturday,
and cannot be modified.
Total Hours field
The total number of work hours for each day. If hours are manually changed here, the
Work Period display will automatically change to incorporate the total hours and vice
versa.
Hour list
The listing of hours in the day.
Work Period display
The application displays a box that represents worked hours and that has a direct
relationship to the Total Hours field. At the top of this box, the start time is displayed.
There can be multiple Work Period boxes displayed in one day. This box can be
dragged by left-clicking and dragging the box up or down. If another Work Period
box is in the path of the dragged box, the dragged box will shrink and perhaps erase
the other box. This box can also be sized manually by left-clicking the top or bottom
edge and dragging it to the size you want. Right-clicking a Work Period box displays
Edit Calendar Day, Remove work period, and Set as nonwork options. Right-clicking a
space on the calendar not occupied by a Work Period box, displays the Edit
Calendar Day and Create work period options.
Getting Here
1) Click Resources.
2) On the Resources navigation bar, click Assignments.
3) On the Assignments page:
a. Click on a resource name.
b. Click Actions and select View Calendar.
4) In the View Calendar dialog box, click the Standard Work Week tab.
Start Review Dialog Box
Overview
Use this page to initiate the review process for a document.
Screen Elements
Name field
The name of the review. This field displays the selected document's name by default.

Context-Sensitive Help Topics
1091
Review Type list
Determines the type of review:
Anyone May Review: Enables any one of the listed reviewers to approve or reject
the document version. Once one reviewer approves it, the review status changes
to Review Approved; once one reviewer rejects it, the review status changes to
Review Rejected.
Everyone Must Review: Requires each listed reviewer to respond to the document
review to complete it. To change the review status to Review Approved, all
reviewers must approve the document. To change the review status to Review
Rejected, only one reviewer needs to reject the document.
Everyone Must Review in Sequence: Requires each listed reviewer to respond to
the document review in a designated sequence to complete it. To change the
review status to Review Approved, all reviewers must approve the document. To
change the review status to Review Rejected, only one reviewer needs to reject
the document. Once one reviewer rejects the document, the review is complete.
Reviewers field
The selected users assigned to review the document.
Use the arrows to move the selected users up or down in the sequence; this is the
order in which they will review if you select the option Everyone Must Review in
Sequence.
Due Date field
The date all reviewers need to complete the review. If no due date is specified for the
review, then this field appears blank.
Description field
A more detailed summary for the item. The description provides more information
than short names or titles. It can give background information or establish a purpose
for the item. These details help differentiate between items with similar names and are
especially useful in multi-user environments.
Create Review button
Creates a review based on the entered criteria. Once the review is created, the
document appears in the Action Required portlet on a dashboard for each specified
reviewer. The document also appears in the Project and Document Workflows portlet
on a dashboard.
Tips
To create the review, you must select at least one reviewer. Once a review is created,
you cannot add additional reviewers to the list. You can select as many reviewers as
you want.

1092
Use the and buttons to specify the order of the names in the list. If you have
selected the Everyone Must Review in Sequence review type, the order of the names
in the list determines the sequence in which each user is required to review the
document.
If the review type is Everyone Must View in Sequence, then all reviewers must
complete the review by the specified Due Date.
You can customize a dashboard to display the Action Required and Project and
Document Workflows portlets.
Getting Here
From the Documents page:
1) Click Projects.
2) On the Projects navigation bar, click Documents.
3) On the Documents page, click the Project tab.
4) On the Project tab, select a document and click Start Review.
From the Dashboards page:
1) Click Dashboards.
2) On the Dashboards page, select a dashboard tab.
3) On the dashboard tab, expand the My Documents portlet and select the Recent
Documents tab.
4) On the Recent Documents tab, select a document and click Start Review.
Statistics Section of the Leveling Report Log
Overview
Use this section to view activity statistics of the selected project. All fields are read-only.
Screen Elements
Number of Activities field
The number of activities associated with the selected project.
Number of Not Started Activities field
The number of activities that have not been started.
Number of In Progress Activities field
The number of activities that have been started but not completed.
Number of Completed Activities field
The number of activities that have been completed.

Context-Sensitive Help Topics
1093
Number of Relationships field
The number of relationships within the activities.
Number of Activities with constraints field
The number of activities that have constraints.
Getting Here
1) Click Projects.
2) On the Projects navigation bar, click Activities.
3) On the Activities page, click the Actions menu and select Run Leveler...
(Shift+F9).
4) In the Level Resources dialog box, click the Options tab.
5) On the Options tab, select the Display leveling log upon completion and click Level.
6) In the Leveling Report Log, expand the Statistics Section section.
Statistics Section of the Scheduling Report Dialog Box of the Activities Page
Overview
Use this section to view activity statistics of the selected project. All fields are read-only.
Screen Elements
Number of Activities field
The number of activities associated with the selected project.
Number of Not Started Activities field
The number of activities that have not been started.
Number of In Progress Activities field
The number of activities that have been started but not completed.
Number of Completed Activities field
The number of activities that have been completed.
Number of Relationships field
The number of relationships within the activities.
Number of Activities with constraints field
The number of activities that have constraints.
Tips
If use the shortcut, you must first select a project or activity.

1094
Getting Here
1) Click Projects.
2) On the Projects navigation bar, click Activities.
3) On the Activities page, click the Actions menu and select Run Scheduler...
(F9).
4) In the Schedule Project dialog box:
a. Configure the options and select the Display scheduling log upon completion
option.
b. Click Schedule.
5) In the Scheduling Reports dialog box, expand the Statistics section.
Status Section of the Activity Form Page
Overview
Use this section to add or edit activity status details, if you have the required privileges.
Screen Elements
Edit dates and constraint link
See Edit Dates and Constraint Page of the Activity Form Page (see "Edit Dates and
Constraints Page of the Activity Form Page" on page 731).
Edit duration and units link
See Edit Duration and Units Page of the Activity Form Page (on page 736).
Dates section:
Started option
Determines whether the activity has started.
Finished option
Determines whether the activity has been completed.
Start Date field
For started activities, the actual start date. For not started activities, set to the planned
start date until the project is scheduled. When scheduled, set to the remaining early
start date.
Finish Date field
For completed activities, the actual finish date. For not started and in-progress
activities, set to the planned finish date if the project has not been scheduled. When
scheduled, set to the remaining early finish date.

Context-Sensitive Help Topics
1095
Suspend Date field
The date work has stopped on a given activity for an unknown, but temporary, period
of time. For example, an event might force an activity to be interrupted or resource
constraints might put an activity on hold.
The suspend date must be later than the actual start date, which the activity must
have. The progress of the activity can be resumed by setting the resume date. The
suspend/resume period behaves like a non-work time on the activity calendar or
resource calendar for task and resource dependent activities.
Resume Date field
The date when a suspended task or resource dependent activity is resumed. The
resume date must be later than the suspend date and earlier than the actual finish
date.
The suspend/resume period behaves like a non-work time on the activity calendar or
resource calendar for task and resource dependent activities.
Duration Percent field
The calculation from the original or planned and remaining duration. The type of
percent you see depends on the percent complete type you select for the activity in
the General section of the Activity Form page.
Total Float field
The amount of time the activity can be delayed before delaying the project finish
date.
Calculated as Late Start minus Early Start or as Late Finish minus Early Finish.
Constraints section:
Primary Constraint field
The primary constraint type for the selected activity.
Primary Constraint Date field
The date associated with the primary constraint, if the activity has a primary
constraint assigned.
Secondary Constraint field
The secondary constraint type for the selected activity.
Secondary Constraint Date field
The date associated with the secondary constraint, if the activity has a secondary
constraint assigned.
This field is only available if a primary constraint is already entered.

1096
Expected Finish field
The date the activity's primary resource expects the activity to end.
Only the primary resource can edit this field if the activity has started.
Duration section:
Planned field
The expected number of work periods required to complete the selected activity.
Actual field
The number of work periods spent on the selected activity.
Remaining field
The number of work periods needed to complete the selected activity.
Labor Units section:
Planned field
The expected number of labor units required to complete the activity.
Actual field
The exact number of labor units that have been expended or the total cost that has
been incurred for the selected activity.
Remaining field
The number of labor units required to complete the activity.
Non-Labor Units section:
Planned field
The expected number of non-labor units required to complete the activity.
Actual field
The exact number of non-labor units that have been expended or the total cost that
has been incurred for the selected activity.
Remaining field
The number of non-labor units required to complete the activity.
Getting Here
From the Workgroup Workspace page:
1) Click Projects.
2) On the Projects navigation bar, click Workspace.
3) On the Workspace page, expand any portlet containing activities.

Context-Sensitive Help Topics
1097
4) In the portlet, click an activity.
5) On the Activity Form page, expand the Status section.
From the Dashboards page:
1) Click Dashboards.
2) On the Dashboards page, select a dashboard tab.
3) On the dashboard tab, expand any portlet containing activities.
4) In the portlet, click an activity.
5) On the Activity Form page, expand the Status section.
Status Tab of the Import/Export Project Dialog Box
Overview
Use this tab to view the import or export status of a project.
Screen Elements
Status toolbar
See Status Toolbar of the Import/Export Project Dialog Box (see "Status Toolbar of
Import/Export Project Dialog Box" on page 1347).
Name field
The file names that have been scheduled for import.
Action field
The action performed on the file: import or export.
Status field
The status of a current import: Complete, Running, Failed, or Pending.
The application displays a 'failed' status for an export if it fails. Otherwise, export status
is not displayed.
Submitted field
The date and time the import was scheduled.
Completed field
The date and time the import was completed.
Getting Here
1) Click Projects.
2) On the Projects navigation bar, click EPS.

1098
3) On the EPS page, click the Actions menu and select Import/Export XML Project
Import/Export.
4) In the Import/Export Project dialog box, click the Status tab.
Step Templates Page
Overview
Use this page to add and configure step templates.
Screen Elements
Activity Step Templates toolbar
See Activity Step Templates Toolbar (see "Step Templates Toolbar" on page 1347).
Template Name field
The name of the activity step template. By creating templates for groups of activity
steps that are relevant in many projects, an organization can streamline data entry
and ensure that work is identified consistently throughout the organization.
Step Count field
The number of steps you assign for each corresponding template name.
Steps detail window
See Steps Detail Window of the Step Templates Page (on page 1101).
Getting Here
To access enterprise project data:
1) Click the Projects menu and select Enterprise Project Data.
2) In the Enterprise Data pane, expand Activities and click Step Templates.
To access enterprise data:
1) Click the Administer menu and select Enterprise Data.
2) In the Enterprise Data pane, expand Activities and click Step UDFs.
Step UDFs Page
Overview
Use this page to add and configure user defined fields for steps.

Context-Sensitive Help Topics
1099
Screen Elements
User Defined Fields toolbar
See User Defined Fields Toolbar (on page 1361).
User Defined Field field
The name of the user-defined field.
Data Type field
The name of the type of data that corresponds to each user-defined field. The data
type you select determines the type of data you can specify in a field. The following
data types are available:
Text: Allows you to use text or a combination of text and numbers.
Start Date: Allows you to enter Start Date information only.
Finish Date: Allows you to enter Finish Date information only.
Cost: Allows you to enter currency values.
Number: Allows you to use numerals with two decimal places.
Integer: Allows you to use numeric data, but not a number related to money.
Indicator: Allows you to use an indicator field that you can use to enter
color-coded icon values in columns and display color-coded text in reports.
Tips
Right-click in any field to Add, Delete, Find, and Find Next.
Getting Here
To access enterprise project data:
1) Click the Projects menu and select Enterprise Project Data.
2) In the Enterprise Project Data dialog box, expand Activities and click Step UDFs.
To access enterprise data:
1) Click the Administer menu and select Enterprise Data.
2) In the Enterprise Data pane, expand Activities and click Step UDFs.
Steps Detail Window of the Activities Page
Overview
Use this detail window to add new steps, add a predefined group of steps, remove or
revise a step, or report completed progress. Select the step name to edit it.

1100
Screen Elements
Steps toolbar
See Steps Toolbar of the Activities Page (on page 1349).
Completed option
Determines whether the step has been completed.
Step % Complete field
The percent complete for the step.
Step Description field
The brief narrative for the step. The description provides more information than short
names or titles. It can give background information or establish a purpose for the step.
These details help differentiate between steps with similar names and are especially
useful in multi-user environments.
Step Name field
The name of the activity step.
Step Weight field
The weight that is assigned to the step.
This user-defined field is used to calculate the physical percent complete when the
project option is set.
Step Weight Percent field
The step weight as a percentage. (Step Weight divided by Sum of Weight for all steps)
multiplied by 100.
User Defined field
Determines the user-defined field the application will use in the chart.
Tips
If you have more than one activity selected, the detail window will not be visible.
Getting Here
1) Click Projects.
2) On the Projects navigation bar, click Activities.
3) On the Activities page, select an activity and click the Steps detail window.

Context-Sensitive Help Topics
1101
Steps Detail Window of the Step Templates Page
Overview
Use this detail window to add, organize, and weigh steps in a step template.
Screen Elements
Steps Detail Window toolbar
See Steps Detail Window Toolbar (on page 1348).
Step Name field
The name of each step that you add to the step template.
Description field
The description of each corresponding step. To modify the text in your description, use
the dialog box which contains configurable options for your description.
Weight field
The weight of each corresponding step. To indicate the portion of activity work that a
single step represents, you can assign it a numerical value, or Step Weight. Once work
for a step is underway, P6 can use the step weight and the reported progress of step
work (Step Percent Complete) to calculate the percentage of total work that has
been completed for the activity (Activity Percent Complete).
Getting Here
To access enterprise project data:
1) Click the Projects menu and select Enterprise Project Data.
2) In the Enterprise Project Data dialog box, expand Activities and click Step Templates.
3) On the Step Templates page, click the Steps detail window.
To access enterprise data:
1) Click the Administer menu and select Enterprise Data.
2) In the Enterprise Data pane, expand Activities and click Step Templates.
3) On the Step Templates page, click the Steps detail window.
Steps Details Dialog Box
Overview
Use the Steps Details page to view and modify information about the selected activity
step.

1102
Screen Elements
Step Name field
The step name, which is unique for the activity.
Step Weight field
The weight associated with the step. The step weight indicates the step’s importance
to the activity. The higher the value, the greater the importance. If no value is
entered, a default value of 1 is entered.
Step % Complete field
The completed percentage for each step.
Completed option
Determines whether the step has been completed.
Delete Step link
Deletes the currently selected activity step.
Getting Here
1) Click Resources.
2) On the Resources navigation bar, click Analysis.
3) On the Analysis page, click the Role Usage tab.
4) On the Role Usage tab, select a role and select to display the Spreadsheet.
5) On the Spreadsheet, click a project name.
6) In the Resource Staffing dialog box, click an activity name then expand the Steps
section.
7) In the Steps section, click a step name.
Steps Details of Activity Details of the Resources Dialog Box
Overview
Use this page to view and modify information about the selected activity step.
Screen Elements
Step Name field
The name of the step, which is unique to the activity.
Step Weight field
The weight associated with the step. The step weight indicates the step’s importance
to the activity. The higher the value, the greater the importance. If no value is
entered, a default value of 1 is entered.

Context-Sensitive Help Topics
1103
Step % Complete field
The completed percentage for each step.
Completed option
Determines whether the step has been completed.
Delete Step link
Deletes the currently selected activity step.
Getting Here
From the Team Usage page:
1) Click Projects.
2) On the Projects navigation bar, click Team Usage.
3) On the Team Usage page:
a. If multiple projects are open, select a project from the Select Project list.
b. Click the Organized By list and select Roles.
c. Expand a project and select a role in the left pane.
d. Select the Spreadsheet option and click a project in the right pane.
4) In the Resources dialog box:
a. Click the Unstaffed and Staffed option to show all activities.
b. Select an activity.
c. Expand the Steps section.
5) In the Steps section, click a step name.
From the Dashboards page:
1) Click Dashboards.
2) On the Dashboards page, expand the Open Requests for Resources portlet and
select a resource.
3) On the Resource Staffing Details page, select an activity.
4) On the Activity Details page, expand the Steps section and click a step.
Steps Details Page of the Activity Form Page
Overview
Use this page to view and modify information about the selected activity step.
Screen Elements
Step Name field
The name of the step, which is unique to the activity.

1104
Step Weight field
The weight associated with the step. The step weight indicates the step’s importance
to the activity. The higher the value, the greater the importance. If no value is
entered, a default value of 1 is entered.
Step % Complete field
The completed percentage for each step.
Completed option
Determines whether the step has been completed.
Description field
The description of the activity step. See Text Editor Toolbar (on page 1352) for details
for modifying entered text.
Delete Step link
Deletes the currently selected activity step.
Getting Here
From the Workgroup Workspace page:
1) Click Projects.
2) On the Projects navigation bar, click Workspace.
3) On the Workspace page, expand any portlet containing activities.
4) In the portlet, click an activity.
5) On the Activity Form page, expand the Steps section and select a step.
From the Dashboards page:
1) Click Dashboards.
2) On the Dashboards page, select a dashboard tab.
3) On the dashboard tab, expand any portlet containing activities.
4) In the portlet, click an activity.
5) On the Activity Form page, expand the Steps section and select a step..
Steps Section of Activity Details of the Resources Dialog Box
Overview
Use this page to review existing activity steps and their status. You can customize the
data columns in the Steps section to display percent complete and user defined fields. If
you are the primary resource, you can report steps as completed and, depending on
administrative and security settings, you can edit user defined fields associated with
steps.

Context-Sensitive Help Topics
1105
Screen Elements
Add Steps link
Opens the add steps page. This page is identical to the Add Steps page of the
Workspace. See Add Steps Page of the Activity Form Page (on page 569) for further
details.
Step Name field
The name of the step, which is unique to the activity. Click a step name to edit the
step. See Steps Details Dialog Box (on page 1101).
Step Weight field
The weight associated with the step. The step weight indicates the step’s importance
to the activity. The higher the value, the greater the importance. If no value is
entered, a default value of 1 is entered.
Step Weight Percent field
The step weight as a percentage. (Step Weight divided by Sum of Weight for all steps)
multiplied by 100.
Step % Complete field
The completed percentage for each step.
Completed field
The status of the step.
Displays Yes if the step is completed and No if the step is not completed.
Description field
A more detailed summary for the item. The description provides more information
than short names or titles. It can give background information or establish a purpose
for the item. These details help differentiate between items with similar names and are
especially useful in multi-user environments.
Getting Here
From the Team Usage page:
1) Click Projects.
2) On the Projects navigation bar, click Team Usage.
3) On the Team Usage page:
a. If multiple projects are open, select a project from the Select Project list.
b. Click the Organized By list and select Roles.
c. Expand a project and select a role in the left pane.
d. Select the Spreadsheet option and click a project in the right pane.
4) In the Resources dialog box:

1106
a. Click the Unstaffed and Staffed option to show all activities.
b. Select an activity.
c. Expand the Steps section.
From the Dashboards page:
1) Click Dashboards.
2) On the Dashboards page, expand the Open Requests for Resources portlet and
select a resource.
3) On the Resource Staffing Details page, select an activity.
4) On the Activity Details page, expand the Steps section.
Steps Section of the Activity Details Dialog Box
Overview
Use the Steps section of the Activity Form page to review existing activity steps and their
status. You can customize the data columns in the Steps section to display percent
complete and user defined fields. If you are the primary resource, you can report steps as
completed and, depending on administrative and security settings, you can edit user
defined fields associated with steps.
Screen Elements
Add Steps link
Click to display the add steps page. This page is identical to the Add Steps page of
the Workspace. See Add Steps Page of the Activity Form Page (on page 569) for
further details.
Step Name field
The name of the step, which is unique to the activity.See Steps Details Dialog Box (on
page 1101).
Step Weight field
The weight associated with the step. The step weight indicates the step’s importance
to the activity. The higher the value, the greater the importance. If no value is
entered, a default value of 1 is entered.
Step Weight Percent field
The step weight as a percentage. (Step Weight divided by Sum of Weight for all steps)
multiplied by 100.
Step % Complete field
The completed percentage for each step.

Context-Sensitive Help Topics
1107
Completed field
The status of the step.
Displays Yes if the step is completed and No if the step is not completed.
Description field
A more detailed summary for the item. The description provides more information
than short names or titles. It can give background information or establish a purpose
for the item. These details help differentiate between items with similar names and are
especially useful in multi-user environments.
Getting Here
1) Click Resources.
2) On the Resources navigation bar, click Analysis.
3) On the Analysis page, click the Role Usage tab.
4) On the Role Usage tab, select a role and select to display the Spreadsheet.
5) On the Spreadsheet, click a project name.
6) In the Resource Staffing dialog box, click an activity name then expand the Steps
section.
Steps Section of the Activity Form Page
Overview
Use this section to review existing activity steps and their status. You can customize the
data columns in the Steps section to display percent complete and user defined fields. If
you are the primary resource, you can report steps as completed and, depending on
administrative and security settings, you can edit user defined fields associated with
steps.
Screen Elements
Add Steps link
Opens the add steps page. See Add Steps Page of the Activity Form Page (on page
569).
Add Steps from Templates link
Opens a dialog box to search and select a template to apply. See Working with
'Select a Value' Dialog Boxes for details of use of the dialog box.
Step Name field
The name of the step, which is unique to the activity.

1108
Step Weight field
The weight associated with the step. The step weight indicates the step’s importance
to the activity. The higher the value, the greater the importance. If no value is
entered, a default value of 1 is entered.
Step Weight Percent field
The step weight as a percentage. (Step Weight divided by Sum of Weight for all steps)
multiplied by 100.
Step % Complete field
The completed percentage for each step.
Completed field
The status of the step.
Displays Yes if the step is completed and No if the step is not completed.
Description field
A more detailed summary for the item. The description provides more information
than short names or titles. It can give background information or establish a purpose
for the item. These details help differentiate between items with similar names and are
especially useful in multi-user environments.
Getting Here
From the Workgroup Workspace page:
1) Click Projects.
2) On the Projects navigation bar, click Workspace.
3) On the Workspace page, expand any portlet containing activities.
4) In the portlet, click an activity.
5) On the Activity Form page, expand the Steps section.
From the Dashboards page:
1) Click Dashboards.
2) On the Dashboards page, select a dashboard tab.
3) On the dashboard tab, expand any portlet containing activities.
4) In the portlet, click an activity.
5) On the Activity Form page, expand the Steps section.
Store Period Performance Dialog Box of the Activities Page
Overview
Use this dialog box to store past period actuals per financial period.

Context-Sensitive Help Topics
1109
Screen Elements
Project Name field
The name of each project. Can be arranged in an ascending or descending order.
Data Date field
The date used as the starting point to calculated the schedule.
The project status is up to date as of the data date. The data date is modified when
project actuals are applied.
Financial Period field
The unique identifier of the associated financial period.
Store button
Stores the period performance for the selected projects.
Getting Here
1) Click Projects.
2) On the Projects navigation bar, click Activities.
3) On the Activities page, click the Actions menu and select Run Store Period
Performance.
Submittals Portlet
Overview
Available only in environments integrating P6 with Contract Management, this portlet
displays the number of submittals based on status that exist for the project in Contract
Management. If you have a valid user name and password, you can additionally access
Contract Management from this portlet to view a list of submittals for a specific status
Screen Elements
Submittals portlet
The Submittals portlet displays a chart showing the number of submittals based on
status. Place the cursor over a section of the chart to display the number of submittals
for that type. To view this information in Contract Management, click a section and
enter a valid user name and password in the new browser.
Tips
The number at the top of the portlet indicates the total number of project submittals.

1110
If you have the required privilege, you can customize the Project Workspace to
configure the way submittals information displays in the portlet. The customize options
set for the portlet apply for all projects in the organization. Depending on these
options, the status types that appear in the chart can include:
NEW = New Item
APP = Approved
AAN = Approved as Noted
Getting Here
1) Click Projects.
2) On the Projects navigation bar, click Workspace.
3) On the Workspace page, expand the Submittals portlet.
Successors Detail Window of the Activities Page
Overview
Use this detail window to assign or configure successor relationships for the selected
activity.
Screen Elements
Successors toolbar
See Successors Toolbar of the Activities Page (on page 1350).
Activity ID field
The unique identifying code for the activity.
Activity Name field
The name of the activity to which the activity code is assigned.
Lag field
The amount of time the predecessor activity was delayed, affecting the ability of its
successor activity to start or finish.
Project ID field
The unique identifier of the project.
Project Name field
The name of the associated project.
Relationship Type field
The relationship between two activities. Select from the following types:

Context-Sensitive Help Topics
1111
Finish to Start: A relationship in which the start of a successor activity depends on
the completion of its predecessor activity. This is the default activity relationship.
Finish to Finish: A relationship in which the finish of a successor activity depends on
the finish of its predecessor activity.
Start to Start: A relationship between activities in which the start of a successor
activity depends on the start of its predecessor.
Start to Finish: A relationship between activities in which a successor activity
cannot complete until its predecessor activity starts.
Tips
If you have more than one activity selected, the detail window will not be visible.
Getting Here
1) Click Projects.
2) On the Projects navigation bar, click Activities.
3) On the Activities page, select an activity and click the Successors detail window.
Successors Section of the Relationships Section of the Activity Form Page
Overview
Use this section to add, revise or remove a successor relationship.
Screen Elements
Assign successor activity link
Opens a dialog box to search for and select a successor activity. See Working with
'Select a Value' Dialog Boxes.
Project ID field
The unique identifier of the project containing the successor activity.
Activity ID field
The unique identifier of the successor activity.
System generated.
Activity Name field
The name of the selected activity's successor. See Relationships Details Page of the
Activity Form Page (on page 988) for further details.
Relationship Type field
The relationship between two activities. Select from the following types:

1112
Finish to Start: A relationship in which the start of a successor activity depends on
the completion of its predecessor activity. This is the default activity relationship.
Finish to Finish: A relationship in which the finish of a successor activity depends on
the finish of its predecessor activity.
Start to Start: A relationship between activities in which the start of a successor
activity depends on the start of its predecessor.
Start to Finish: A relationship between activities in which a successor activity
cannot complete until its predecessor activity starts.
Lag field
The amount of time the predecessor activity was delayed, affecting the ability of its
successor activity to start or finish.
Getting Here
From the Workgroup Workspace page:
1) Click Projects.
2) On the Projects navigation bar, click Workspace.
3) On the Workspace page, expand any portlet containing activities.
4) In the portlet, click an activity.
5) On the Activity Form page, expand the Relationships section.
From the Dashboards page:
1) Click Dashboards.
2) On the Dashboards page, select a dashboard tab.
3) On the dashboard tab, expand any portlet containing activities.
4) In the portlet, click an activity.
5) On the Activity Form page, expand the Relationships section
Summarization Page of the Project Preferences Dialog Box
Overview
Use this page to configure summarization options for the selected project.
Screen Elements
Enable Summarization option
Determines whether a project will be summarized. If you select this option, the fields
on the Summarization page are enabled. If this option is cleared, the project will not
be summarized.

Context-Sensitive Help Topics
1113
Summarize project based on options
Determines whether the project is summarized based on High-level resource planning
or Detailed activity resource assignments.
Typically, use the High-level resource planning option for future projects that are
currently specifying only high-level (project and WBS) resource allocation
requirements, or for projects that are underway, but for which you do not want to
assign resources at a detailed activity level. Use the Detailed activity resource
assignments option for in-progress projects when you want to review detailed
activity-level summarized data, for example, when evaluating detailed resource
usage against planned allocation or for earned value reporting.
Summarize to WBS Level list
Determines the number of summary WBS levels stored in the database.
Last Summarized On field
The date on which the summarizer service was last run for the project.
This is useful for assessing whether summary data for the project is current.
Getting Here
1) Click Projects.
2) On the Projects navigation bar, click EPS.
3) On the EPS page, click the Actions menu and select Set Project Preferences....
4) In the Project Preferences pane, click Summarization.
Summary Indicators Detail Window of the Project UDFs Page
Overview
Use this detail window to define one or more graphical indicators to appear with the
currently selected project user-defined field when its values are summarized or grouped
in bands. The parameters you define are based on the relationship between your UDF's
summary value and other values or fields.
Screen Elements
Parameter field
The comparison operator expressing the relationship between the project UDF
summary value and the value, range, or field you specify. When you select a
parameter of is within range of or is not within range of, the value or field you enter in
the Value column represents the low values in the range, and the High Value column
represents the high values in the range.

1114
Value options
Determines whether the project UDF summary value should be compared with a
value you specify or a field value.
Value/Field field
The manually-specified value or field-supplied value used for the logical comparison
in order to define this summary indicator. When you select a comparison parameter
of is within range of or is not within range of, the value or field in this column represents
the low value in the range.
High Value options
For comparison parameters of is within range of or is not within range of only,
determines whether the project UDF summary value should be compared with a
range defined by a high value you specify or determined by a field value.
High Value/Field field
The manually-specified value or field-supplied value representing the high value of
the optional range used in the comparison parameter for the summary indicator.
Indicator field
The graphical icon used to symbolically represent a specific project UDF summary
value relative to another value, range, or relationship you define.
Bubble Color field
The color used in portfolio view bubble charts to represent this project UDF summary
value or range relative to others.
Add Row button
Adds an additional row to the bottom of the detail window so you can define
another summary indicator.
Remove Row button
Removes the current row and summary indicator parameters from the detail window.
Getting Here
To access enterprise project data:
1) Click the Projects menu and select Enterprise Project Data.
2) In the Enterprise Project Data dialog box, expand Projects and click Project UDFs.
3) On the Project UDFs page, select a user-defined field and click the Summary
Indicators detail window.
To access enterprise data:
1) Click the Administer menu and select Enterprise Data.
2) In the Enterprise Data pane, expand Projects and click Project UDFs.

Context-Sensitive Help Topics
1115
3) On the Project UDFs page, select a user-defined field and click the Summary
Indicators detail window.
Table Format of the Activities Page
Overview
Use the table format to view activity, project, and WBS information in a spreadsheet
format. Use filters and group data to see only those activities with a specific activity that
match the required criteria, or you can customize table columns. You can change the
font of the activity information and the color of the table background.
Screen Elements
Hovering over the WBS/Activity field or the Resource Names field will display the full
project, WBS, or activity name and the resource name respectively.
Tips
Right-click the table for quick access to a list of actions you can perform in the table.
Getting Here
1) Click Projects.
2) On the Projects navigation bar, click Activities.
3) On the Activities page, click the View menu and select Table.
Table Format of the EPS Page
Overview
Use this table format to display project data in a spreadsheet format. You can specify
which columns you want to include in the table and the rows display according to your
current group and sort selections. In addition, you can create filters to more narrowly
define the information you see.
Tips
Right-click the table for quick access to a list of actions you can perform in the table.
Getting Here
1) Click Projects.
2) On the Projects navigation bar, click EPS.
3) On the EPS page, click the View menu and select Table.

1116
Team Usage Page
Overview
Use this page to view cost or usage data at the team level and for individual roles and
resources assigned to the project you are working with. Information is displayed in a
timescaled histogram or spreadsheet format.
Screen Elements
Refresh
Refreshes the current screen with any new, updated, or removed data.
Organized By list
Determines whether to organize the available options by Resources or Roles.
Customize link
Displays a dialog box with configurable options to filter data to reflect current project
allocation only or allocation across all projects. See Customize Dialog Box of the Team
Usage Page (on page 678).
Export Spreadsheet link
Exports the current spreadsheet to a Microsoft Excel .xls file.
Spreadsheet view
The spreadsheet displays data for the selected role, resource, or project in a
timescaled row and column format.
Selecting a role displays totals for staffed and unstaffed units/costs for that particular
role.
Selecting a resource displays totals for allocation and limit units/costs for that
resource.
Note: Under/Overallocated is calculated as Allocated minus Limit.
Overallocated values display in red; underallocated values are
negative.
Selecting a project displays usage data for all resources or roles assigned to the
project.
To view a list of activities for a selected role or resource, select a role or resource and
click a project name in the spreadsheet.
For a resource, you can view start and finish dates, remaining units, and units percent
complete for each activity assignment. You can also e-mail the project manager.
For a role, you can view activities categorized as staffed and unstaffed. You might
assign a resource to an unstaffed activity or change the assignment on a staffed
activity. You can also search for resources.

Context-Sensitive Help Topics
1117
Note: When viewing activities for a resource, the start and finish
dates, remaining units, and units percent complete fields contain
values for the resource, not the activity. Therefore, the resource
information might not match the corresponding information for the
activity.
To view a list of active resources who can fill a selected role, click the role name in the
spreadsheet.
To save the contents of the spreadsheet to an Excel spreadsheet file (*.xls) file, click
Export Spreadsheet. The complete timescale and all spreadsheet rows are exported.
Timescale headings are adjusted to display in a single column, using Month/Day/Year
format.
Histogram view
The histogram displays a graphical view of frequencies for the selected role or
resource. In the histogram, the vertical blue dotted line represents the current data
date for the project.
To display a dialog box containing units or costs totals, click the histogram.
Depending on the histogram's timescale and where on that timescale you click, the
dialog box will display different information. For example, if the timescale is set to
Year/Quarter, the dialog box will display totals for the quarter and year you select.
Zoom In
Increases the current magnification of items in the work area so they appear larger.
(This option is available only in the Histogram view.)
Zoom Out
Decreases the current magnification of items in the work area so they appear smaller.
(This option is available only in the Histogram view.)
Tips
Units values do not display a label (h, d, w, m, y) unless you have set your Global tab
preferences to show a label for time units.
For units display, if the project team consists of only material resources or a mix of
material and labor/non-labor resources, when you select the project name in the
hierarchy, dashes display in the histogram and spreadsheet instead of team summary
bars or totals. This occurs because summing unit values for mixed resource types does
not provide an accurate total since labor and non-labor resources are usually
associated with time (such as hours or days), and material resources are often
expressed in non-time units of measure.
To adjust the width of the timescale increments, click or .
Click the role link when Team Usage is organized by role to view which resources can
perform a particular role.
The project must be summarized for data to appear in the spreadsheet or histogram.

1118
Getting Here
1) Click Projects.
2) On the Projects navigation bar, click Team Usage.
Templates Detail Window of the Global Security Profiles Page
Overview
Use this detail window to assign templates privileges to the selected global security
profile.
Screen Elements
Privilege field
The name of the security permission that is assigned (option selected) or denied
(option cleared) to users of the currently selected profile.
Privilege option
The option in the column header that determines whether the privileges are all
assigned (selected), all denied (clear), or individually configured (indicated with a
dash or - sign).
Add/Edit/Delete Activity Step Templates option
Determines whether the profile will enable users to create, modify, and remove
Activity Step Templates, which are used to add a set of common steps to multiple
activities.
Add/Edit/Delete Issue Forms option
Determines whether the profile will enable users to create, modify, and remove issue
forms.
Add/Edit/Delete Microsoft Project Templates option
Determines whether the profile will enable users to create, modify, and remove
Microsoft Project templates that are used to import/export data from/to Microsoft
Project.
Add/Edit/Delete Project Templates option
Determines whether the profile will enable users to create, modify, and remove
templates that can be used when creating new projects. To create project
templates, users must also have the 'Add Projects' project privilege assigned to their
profile. To modify templates, you must have the same project privileges that are
required to modify projects. To delete project templates, users must also have the
'Delete Projects' project privilege assigned to their profile.

Context-Sensitive Help Topics
1119
Getting Here
1) Click the Administer menu and select User Access.
2) On the User Access page, click Global Security Profiles.
3) On the Global Security Profiles page, click the Templates detail window.
Time Periods Page
Overview
Use this page to define the number of hours in a given time period. You can also specify
abbreviations for time units.
Screen Elements
Hours per Time Period
The Hours per Time Period values are used as conversion factors when users choose to
display time units and durations in units other than hours. For example, if the default
Hours/Day is set to 8.0, when a user enters 1d as a duration, this value is stored as 8h in
the database.
Specify the number of work hours for each time period field
For this field, you can enter Hours/Day from 1.0-24.0, Hours/Week from 1.0-168.0,
Hours/Month from 1.0-744.0, and Hours/Year from 1.0-8784.0.
Use assigned calendar to specify the number of work hours for each time period option
Determines whether to use the assigned calendar's Hours per Time Period values as
the conversion factors when users choose to display time units and durations in units
other than hours. If your resources and activities require different hours per time period
settings, select this option, then specify the Hours per Time Period for each defined
calendar.
If you select the Use assigned calendar to specify the number of work hours for each
time period option, the Hours per Time Period values on this tab are ignored and the
module converts units and durations using the Hours per Time Period values defined in
the activity’s or resource’s assigned calendar. Using a task-dependent activity as an
example, the module converts units and durations for the activity using the settings
defined in the activity’s assigned calendar. You should type values for each time
period even if you mark this option since the Hours per Time Period values on this tab
are still used in the following cases:
The Planning page of the Resources section in P6.
The Planning Resources tab in the project and WBS views and Global Change in
P6 Professional.
In these cases the Use assigned calendar to specify the number of work hours for
each time period option will be ignored even if selected.

1120
If you clear the Use assigned calendar to specify the number of work hours for each
time period option, the Hours per Time Period values you specify on this tab are
always used to convert time units and durations.
Time Period Abbreviations
The Time Period Abbreviations contains the one-character abbreviations for minutes,
hours, days, weeks, months, and years.
Specify the abbreviation for each time period field
Each field uses a one-character abbreviation for minutes, hours, days, weeks, months,
and years.
Getting Here
1) Click the Administer menu and select Application Settings.
2) On the Application Settings pane, click Time Periods.
Time Units Format Section of the Global Tab of the My Preferences Page
Overview
Use this section to configure how time is displayed throughout the application.
Note: P6 calculates and stores time unit values in hourly increments.
When you specify a display time increment other than hours, P6
uses the Hours per Time Period settings from Admin Preferences or
the calendar based on the setting in Application Settings in P6 to
convert hours to the time increment you specify.
Screen Elements
Display Time Units in list
Select to display time units from the following options:
Hour
Day
Week
Month
Year
Show sub units option
Determines whether to show sub units with time units. Select the Show sub units option
to display sub units in the next smaller time increment. This option is also available with
Display Durations in.

Context-Sensitive Help Topics
1121
Show unit label option
Determines whether to show the unit abbreviation with time units.
Decimal places list
Select to display 0, 1, or 2 decimal places. This option is also available with Display
Durations in.
Display Durations in list
Select to display durations from the following options:
Hour
Day
Week
Month
Year
Show duration label option
Determines whether to show the time unit abbreviation with the duration value.
Units/Time Format
Select one of the following to display resource units/time:
Show as a percentage option
Show as units/duration option
For example, if Robert is assigned a limit of eight hours/day and you assign him to a
task at a maximum limit of two hours/day, you can display this information one of two
ways: as 2h/ d or as 25 percent of his resource limit (since he is only assigned to this
task for two of his allotted eight hours per day).
Getting Here
1) Click the Administer menu and select My Preferences.
2) On the My Preferences page, click the Global tab.
3) On the Global tab, expand the Time Units Format section.
Timesheet Approval Page
Overview
Use this page to process timesheets. This includes approving or rejecting timesheets,
notifying resources about timesheet status, adding timesheet notes, and determining if a
resource has not started or not submitted a timesheet. If you are a timesheet approval
manager, you can assign delegates to act in your place when you are not available.

1122
This page displays a timesheet table and an activity work area. The timesheet table lists
timesheets, if any, for the time period and filter criteria you specify (Action Required,
Submitted, Not Submitted, etc.). For each timesheet you select, the activity work area
displays a breakdown of the number of regular, overhead, and total hours for the
associated resource. In both tables, you can group and sort based on predefined
criteria, customize the columns that display, search for timesheets or activities, and print.
Screen Elements
Approving as list
The type of manager approving the timesheets. For example, Project Manager or
Resource Manager.
This field is automatically based on your module access and timesheet approval
rights (Project Manager or Resource Manager) and is read-only unless you have rights
to approve as a Project Manager and Resource Manager; you must select one
option. If you are a delegate approval manager, this field displays the type of
manager who delegated approval rights to you (Project Manager or Resource
Manager), along with the approval manager's personal name; for example, Project
Manager delegate for John Doe.
Assign Delegate
Displays options for finding and designating an alternate user as a temporary
substitute for the approving manager.
You have an active delegate assigned
A visual reminder that you currently have at least one delegate assigned to approve
timesheets.
Timesheets filter label
A label that adjusts itself to always reflect your currently applied filter. For example, All
Timesheets for or Action Required Timesheets for (followed by your selection from the
Timesheet Periods list).
Timesheet Periods list
The list of available timesheet periods derived from your enterprise data settings.
Timesheet Approval toolbar
See Timesheet Approval toolbar (on page 1353).
Timesheet table
See Timesheet Table of the Timesheet Approval Page (on page 1123).
Activity table
See Activities Work Area of the Timesheet Approval Page (on page 551).

Context-Sensitive Help Topics
1123
Tips
If a message indicates that there is no data available, you might have selected a
combination of approval role, time period, and status for which no timesheets exist.
Getting Here
Click the Dashboards menu and select Approve Timesheets.
Timesheet Periods Page
Overview
Use this page to view, add, and delete customized timesheet periods or batches of
timesheet periods. The P6 administrator must first create timesheet periods before
timesheet users can view and enter time against their timesheets.
Screen Elements
Timesheet Periods toolbar
See Timesheet Periods Toolbar.
Timesheet Period (batch) dialog box
See Generate Timesheet Periods Dialog Box of the Timesheet Periods Page.
Start Date field
The date that the Timesheet Period began.
Finish Date field
The date that the Timesheet Period ended.
Tips
Right-click in any field to display the options to Add, Delete, Find, and Find Next.
Getting Here
1) Click the Administer menu and select Enterprise Data.
2) In the Enterprise Data pane, expand Global and click Timesheet Periods.
Timesheet Table of the Timesheet Approval Page
Overview
Use this table to view resource timesheet data.

1124
Screen Elements
Last Date Status Changed field
The date when this timesheet's status was last modified.
Last Reviewer field
The user who most recently reviewed the timesheet.
Overhead Reg/OT field
The sum of the number of overhead hours and overhead overtime hours.
Project Reg/OT field
The sum of the number of regular hours and standard overtime hours.
Resource ID field
The unique identifier of the associated resource.
Resource Name field
The name of the resource.
Reviewed Date field
The date when this timesheet was last reviewed.
Status field
The current state of the timesheet. Timesheets can have a status of Not Started, Not
Submitted, Submitted, Resubmitted, Approved, PM Approved, RM Approved, or
Rejected. The Action Required status displays all timesheets that currently require your
review.
Submitted Date field
The date when this timesheet was submitted by the resource.
Timesheet Period End Date field
The last day of the currently selected timesheet period.
Timesheet Period Start Date field
The first day of the currently selected timesheet period.
Total Hours field
The sum of the number of hours in the Project Reg/OT and Overhead Reg/OT fields.
Getting Here
Click the Dashboards menu and select Approve Timesheets.

Context-Sensitive Help Topics
1125
Timesheets Detail Window of the Project Security Profiles Page
Overview
Use this detail window to assign timesheets privileges to the selected project security
profile.
Screen Elements
Privilege field
The name of the security permission that is assigned (option selected) or denied
(option cleared) to users of the currently selected profile.
Privilege option
The option in the column header that determines whether the privileges are all
assigned (selected), all denied (clear), or individually configured (indicated with a
dash or - sign).
Approve Timesheets as Project Manager option
Determines whether the profile will enable users to approve or reject submitted
timesheets as a Project Manager in Timesheet Approval.
Getting Here
1) Click the Administer menu and select User Access.
2) On the User Access page, click Project Security Profiles.
3) On the Project Security Profiles page, click the Timesheets detail window.
Timesheets Page
Overview
Use this page to specify default timesheet options and approval levels for the P6 Progress
Reporter application.
Screen Elements
General Settings:
New resources use timesheets by default option
Determines whether to require that all new resources use timesheets, unless you
specify otherwise.

1126
Resources can assign themselves to activities by default option
Determines whether you want every newly created project to grant permission for
resources to assign themselves to activities. When you change this setting, it does not
affect existing projects; the new setting is applied only when a new project is created.
For individual projects, you can override this setting on the Project Preferences dialog
box in the EPS page.
Enable timesheet auditing option
Determines whether you want to save the history of timesheet submission, approval,
rejection, reviewers, and associated dates. To view the historical data, you must
create reports using BI Publisher.
Timesheet Approval Level:
Auto Submission - No submission or approvals is required
Select to indicate that resource timesheets do not need to be submitted or
approved.
Auto Approval - Automatically approve upon submission
Select to indicate that resource timesheets do not require management approval.
Timesheets are approved automatically when they are submitted.
One approval level - Resource manager approval required
Select to indicate that resource timesheets require approval by the resource
manager only. If you select this option, the status of all submitted timesheets remains
Submitted until the approving manager changes the timesheet’s status. If you
previously required both project manager and resource manager approval, and you
select this option, the status of all current timesheets that have received one level of
approval changes to Approved.
Two approval levels - Project and Resource managers' approval required
Select to indicate that resource timesheets require approval by project and resource
managers. If you select this option, the status of all submitted timesheets remains
"Submitted" until both managers approve the timesheet.
Project manager must approve before Resource manager
Determines whether project managers must approve timesheets before resource
managers. Becomes available if Two Approval Levels is chosen.
Default Resource manager approving timesheets when one or two approval levels required
Select the approver you want to approve timesheets for resources. The default
approver will be assigned each time you create a resource who uses timesheets.
Getting Here
1) Click the Administer menu and select Application Settings.

Context-Sensitive Help Topics
1127
2) On the Application Settings pane, click Timesheets.
Tolerance Detail Window of the Risk Scoring Matrices Page
Overview
Use this detail window to view the tolerance threshold assigned to the selected risk
scoring matrix.
Screen Elements
Code field
The short name for the threshold level.
For example, a risk threshold with three levels named High, Medium, and Low, might
have the codes H, M, L to represent the level names.
Name field
The name of the threshold level.
An example of names for a threshold with three levels are High, Medium, and Low.
Range field
The user-defined range for each threshold level where the breadth of the range
specifies the amount of risk associated with the assigned level.
This field allows for text or numeric data depending on the threshold type.
Probability: The value is a percentage.
Tolerance: The value is a number.
Cost Impact: The value is the cost.
Schedule Impact: The value is a duration.
User-defined Impact: The value is text.
Color field
The color representing the threshold in the score field or probability and impact
diagram (PID).
Getting Here
1) Click the Projects menu and select Enterprise Project Data, or click the
Administer menu and select Enterprise Data.
2) In the Enterprise Data pane, expand Risks and click Risk Scoring Matrices.
3) On the Risk Scoring Matrices page, click the Tolerance detail window.

1128
Tools Detail Window of the Global Security Profiles Page
Overview
Use this detail window to assign tools privileges to the selected global security profile.
Screen Elements
Privilege field
The name of the security permission that is assigned (option selected) or denied
(option cleared) to users of the currently selected profile.
Privilege option
The option in the column header that determines whether the privileges are all
assigned (selected), all denied (clear), or individually configured (indicated with a
dash or - sign).
Administer Global External Applications option
Determines whether the profile will enable users to create, modify, and remove
entries in the list of global external applications in P6 Professional.
Administer Scheduled Services option
Determines whether the profile will enable users to set up the Apply Actuals,
Summarize, Schedule, and Level scheduled services to run at specific time intervals.
Edit Global Change Definitions option
Determines whether the profile will enable users to create, modify, and remove
Global Change specifications available to all users in P6 Professional.
Import Project Management XER, MPP, MPX, and P3 option
Determines whether the profile will enable users to import projects, resources, and
roles from XER, MPP, MPX, and P3 formats using P6 Professional. To create new
projects when importing, users must also have the 'Create Project' project privilege
assigned to their profile. Users must be an Admin or Project Superuser to update a
project from XER or P3 formats.
Import XLS option
Determines whether the profile will enable users to import projects, resources, and
roles from XLS files. Users must also be a Project Superuser to update a project from XLS
format.
Import XML option
Determines whether the profile will enable users to import projects from P6, P6
Professional, and Microsoft Project using XML format. To create new projects when
importing, users must also have the 'Create Project' project privilege assigned to their
profile.

Context-Sensitive Help Topics
1129
Note: For Microsoft Project imports, you can only create a new project (not update
an existing one) during import. Also, P6 supports imports from Microsoft Project 2007,
while P6 Professional supports imports from Microsoft Project 2002.
View All Global/Project Data via SDK option
Determines whether the profile will enable users to view All Global and Project Data
via SDK. For Admin Superusers, access to the P6 SDK will be read/write. For all other
users, access will be read only.
Getting Here
1) Click the Administer menu and select User Access.
2) On the User Access page, click Global Security Profiles.
3) On the Global Security Profiles page, click the Tools detail window.
Tools Detail Window of the Project Security Profiles Page
Overview
Use this detail window to assign tools privileges to the selected project security profile.
Screen Elements
Privilege field
The name of the security permission that is assigned (option selected) or denied
(option cleared) to users of the currently selected profile.
Privilege option
The option in the column header that determines whether the privileges are all
assigned (selected), all denied (clear), or individually configured (indicated with a
dash or - sign).
Allow Integration with ERP System option
Determines whether the profile will enable users to send project data to an integrated
Oracle system using the Send to ERP feature on the Activities page in the Projects
section. This is a project level privilege and is not specific to each level of the WBS.
Apply Actuals option
Determines whether the profile will enable users to apply actuals to activities in
projects.
Check In/Check Out Projects option
Determines whether the profile will enable users to check projects out to work
remotely and then check them back in using P6 Professional.
1130
Edit Contract Management Project Link option
Determines whether the profile will enable users to create, edit, and delete a link to
Contract Management projects.
Level Resources option
Determines whether the profile will enable users to level resources in projects. This
privilege also selects the 'Schedule Project' project privilege.
Schedule Projects option
Determines whether the profile will enable users to schedule projects.
Monitor Project Thresholds option
Determines whether the profile will enable users to run the threshold monitor for
projects in P6 Professional.
Store Period Performance option
Determines whether the profile will enable users to track actual this period values for
actual units and costs in projects. The 'Add/Edit Activities Except Relationships' project
privilege is also required for this functionality.
Summarize Projects option
Determines whether the profile will enable users to summarize data for all projects in
the EPS.
Run Baseline Update option
Determines whether the profile will enable users to update baselines assigned to
projects with new project information using the Update Baseline tool in P6
Professional.
Run Global Change option
Determines whether the profile will enable users to run Global Change specifications
to update activity detail information in P6 Professional.
Getting Here
1) Click the Administer menu and select User Access.
2) On the User Access page, click Project Security Profiles.
3) On the Project Security Profiles page, click the Tools detail window.
Trace Logic Detail Window of the Activities Page
Overview
Use this detail window to view activity relationships using trace logic.
Context-Sensitive Help Topics
1131
Screen Elements
Trace Logic toolbar
See Trace Logic Toolbar of the Activities Page (on page 1355).
Trace Logic work area
The area in which you can view and trace logic relationships.
Activity boxes outlined in red are critical activities; activity boxes outlined in blue are
not critical activities. Solid red lines between boxes represent critical relationships,
while blue lines represent non-critical relationships. Solid lines represent driving
relationships, while dashed lines represent non-driving relationships. The selected box
has a light blue background. Boxes with a black diamond in the corner represent
milestones. Activity boxes have status icons in the corner. The status icons indicate
whether an activity is not yet started, in progress, completed, or critical.
Tips
If you have more than one activity selected, the detail window will not be visible.
Getting Here
1) Click Projects.
2) On the Projects navigation bar, click Activities.
3) On the Activities page, select an activity and click the Trace Logic detail window.
Units and Prices Detail Window of the Resources Tab of the Administration Page
Overview
Use this detail window to define the price/unit for up to five available rate types per
effective date.
Screen Elements
Add (Insert)
Adds a new unit and price row to the detail window.
Delete (Delete)
Deletes or removes the currently selected data items or table rows.
Caution: Your selected data is permanently deleted once you click Save.
Resource selector (Ctrl+Up Arrow) or (Ctrl+Down Arrow)
Cycles through the available resources and determines which data display in the
detail window. Click (Ctrl+Up Arrow) to move to the previous resource, or click
(Ctrl+Down Arrow) to move to the next resource. The content in the detail window is
refreshed with the data for the selected resource.

1132
Effective Date field
Displays the date that the corresponding units/time period and rates go into effect for
the resource.
Max Units/Time field
The maximum work units per time this resource can perform on all their assigned
activities.
For example, a person working full time could perform 8 hours of work per day. A
department of five people might perform at 5 days per day.
Price/Unit 1-5 fields
The non-overtime rates expressed as a series of price per unit values for the resource
as of the effective date. The rates are used to compute resource assignment costs for
activities. You can define up to five rates for a resource for a timespan starting on the
Effective Date. Your organization can define text titles for each rate type as part of
enterprise data.
For example, enter 54 as a Standard Rate and 64 as an External Rate. The application
will automatically format the rates per unit of time, for example, 54/h.
Shift Start Hour field
The start time of the assigned shift.
Shift start time is a value in a shift calendar assigned to a resource in P6 Professional. If
a shift calendar is assigned to a resource, then the fields in the Units and Prices detail
window are disabled. If a shift calendar does not exist for a resource, this field is
disabled.
Getting Here
1) Click Resources.
2) On the Resources navigation bar, click Administration.
3) On the Administration page, click the Resources tab.
4) On the Resources tab, click the Units and Prices detail window.
Units of Measure Page
Overview
Use this page to add and configure units of measure.
Screen Elements
Units of Measure toolbar
See Enterprise Data Units of Measure Toolbar (on page 1285).

Context-Sensitive Help Topics
1133
Unit Abbreviation field
The abbreviation of the unit of measure.
Unit Name field
The name of the unit for each corresponding abbreviation.
Getting Here
1) Click the Resources menu and select Enterprise Resource Data, or click the
Administer menu and select Enterprise Data.
2) In the Enterprise Data pane, expand Resources and click Units of Measure.
Usage Page of the Resource Team Summary Portlet
Overview
Use this page to view resource allocation for an individual resource as a histogram (total
allocation across time) or as a spreadsheet (of resource allocation values by project).
The resource usage data displayed on this page is derived from summary data, so it is
current as of the last date the summarizer was run for a project. Assignment changes
within a project after that date will not be reflected until the project is again summarized.
See Summarizing Projects.
Screen Elements
Customize link
Displays a dialog box with configurable options to customize the Spreadsheet or
Histogram. See Customize Spreadsheet or Histogram Dialog Box of the Analysis Page
(on page 697).
Export Spreadsheet link
Exports the current spreadsheet to a Microsoft Excel .xls file.
Display options
Determines whether to view information about the selected role/resource and
associated projects in Spreadsheet or Histogram format.
Zoom In
Increases the current magnification of items in the work area so they appear larger.
Zoom Out
Decreases the current magnification of items in the work area so they appear smaller.
Getting Here
1) Click Dashboards.
2) On the Dashboards page, select a dashboard.

1134
3) On the dashboard, expand the Resource Team Summary portlet and click a
resource.
Usage Tab of the Customize Resource Assignments View Dialog Box of the Assignments Page
Overview
Use the Usage tab of the Customize Resource Assignments View dialog box to select
which columns are displayed on the Usage spreadsheet as well as modify options for
displaying time distributed values and determining whether to calculate the average for
units and costs.
Screen Elements
Customize Columns
See Customize Columns or Values.
Display time distributed values for date range
Select a type of Start and End date for which to display time distributed values:
Start Date list
Determines the starting point for the timescale. You enter information according to
which fields are provided:
Current Date: The date of the current day. Enter the number and increment from
which to subtract from the current date.
Earliest Project Date: The earliest planned start date of the project.
Custom Date: The date chosen by you.
End Date list
The options to set as an end date for the timescale and enter information according
to which fields are provided:
Current Date: The date of the current day. Enter the number of days after the
current date you want to view in the timescale.
Latest Project Date: The latest scheduled finish date of all loaded project.
Custom Date: The date chosen by you.
Calculate average for units and costs option
Determines whether to calculate the average for units and costs.
Divide values by field: The number by which the average is divided. This field is only
available if the corresponding option is selected.
Getting Here
1) Click Resources.
2) On the Resources navigation bar, click Assignments.

Context-Sensitive Help Topics
1135
3) On the Assignments page, click View and select Customize View.
4) In the Customize Resource Assignments View dialog box, click the Usage tab.
Used By Tab of the Global Calendars Page
Overview
Use this tab to view the activities and resources assigned to projects on the selected
global calendar.
Screen Elements
ID field
This field displays a list of your calendars. You can expand the calendar list to display
activities assigned to that calendar.
Name field
This field displays a name that corresponds with each activity.
Getting Here
1) Click the Administer menu and select Enterprise Data.
2) In the Enterprise Data pane, expand Global and click Global Calendars.
3) On the Global Calendars page, click the Used By tab.
Used By Tab of the Project Calendars Page
Overview
Use this tab to view the activities and resources assigned to projects on the project
calendar.
Screen Elements
ID field
This field displays a list of your calendars. You can expand the calendar list to display
activities assigned to that calendar.
Name field
This field displays a name that corresponds with each activity.
Getting Here
1) Click the Projects menu and select Enterprise Project Data, or click the
Administer menu and select Enterprise Data.
2) In the Enterprise Data pane, expand Projects and click Project Calendars.
3) On the Project Calendars page, click the Used By tab.

1136
Used By Tab of the Resource Calendars Page
Overview
Use this tab to view resources assigned to the resource calendar.
Screen Elements
ID field
A list of available calendars that can be expanded to display associated resources.
Name field
This field displays a name that corresponds with each activity.
Getting Here
1) Click the Resources menu and select Enterprise Resource Data, or click the
Administer menu and select Enterprise Data.
2) In the Enterprise Data pane, expand Resources and click Resource Calendars.
3) On the Resource Calendars page, click the Used By tab.
User Access Page
Overview
Use this page to create and administer user accounts and configure their associated
levels of access to data in various areas of the application. This includes access to
application modules, resources, OBS level, and global and project security profiles.
Screen Elements
User Access pane
Users Page (on page 1141)
OBS Page (on page 908)
Global Security Profiles Page (on page 816)
Project Security Profiles Page (on page 968)
Getting Here
Click the Administer menu and choose User Access.
User Defined Fields Section of the Issue Forms Page
Overview
Use this section to edit and remove existing UDFs or assign new UDFs to the form. Each
UDF you assign displays on the Add Issue page for all issues created from this form.

Context-Sensitive Help Topics
1137
Screen Elements
Assign User Defined Fields link
Opens a dialog box for configuring user defined fields. See Configuring Columns or
Values.
User Defined fields work area
The user-defined fields assigned to the issue form.
Default Value section
The section where you can assign items to the selected field Name item.
Required section
The options that you can select to require a user to enter information in that field on
the issue form.
Tips
Depending on the assigned user-defined fields, different options appear in the Default
Value section.
Getting Here
1) Click Projects.
2) On the Projects navigation bar, click Issues.
3) On the Issues page, click the Issue Forms link.
4) On the Issue Forms page, select an issue form and expand the User Defined Fields
section.
User Defined Section of the Activity Form Page
Overview
Use this section to assign and configure user defined fields for activities.
Screen Elements
Assign User Defined Fields link
Opens a dialog box for configuring user defined fields. See Configuring Columns or
Values.
User Defined field field
The name of the selected user-defined field. Click a name to display a page on
which you can enter a value for the selected UDF. For example, if Planned Finish is
selected, the detail needed to be entered is a date for the Planned Finish field.

1138
User Defined field Value field
The corresponding value for the user defined field name.
Getting Here
From the Workgroup Workspace page:
1) Click Projects.
2) On the Projects navigation bar, click Workspace.
3) On the Workspace page, expand any portlet containing activities.
4) In the portlet, click an activity.
5) On the Activity Form page, expand the User Defined section.
From the Dashboards page:
1) Click Dashboards.
2) On the Dashboards page, select a dashboard tab.
3) On the dashboard tab, expand any portlet containing activities.
4) In the portlet, click an activity.
5) On the Activity Form page, expand the User Defined section.
User Interface View Details Page
Overview
Use this page to create or modify the content of the selected user interface view.
Screen Elements
Content Tab
Enables you to choose the menu items, pages, and Dashboard menu items that are
included in a user interface view. You can choose the order in which selected items
appear in the Dashboards, Projects, Portfolios, and Resources sections. See Content
Tab of the User Interface View Details Page.
Activity Editing Tab
Enables you to control the content a user can edit in the Activity page and Resource
Assignments page. See Activity Editing Tab of the User Interface View Details Page.
Users Tab
Enables you to assign users to a user interface view. See Users Tab of the User Interface
View Details Page.
Tips
Settings for changing user interface views are not available to users of the Team
Member application.

Context-Sensitive Help Topics
1139
Users who have access to Manage Dashboards (in the Dashboards menu) enabled in
their user interface view can use the Manage Dashboards page to create
dashboards and choose dashboards to display on their Dashboards page.
Getting Here
To modify a user interface view:
1) Click the Administer menu and select User Interface Views.
2) On the User Interface Views page, click a View.
To create a user interface view:
1) Click the Administer menu and select User Interface Views.
2) On the User Interface Views page, click Create User Interface View.
3) In the Copy from Existing User Interface View dialog box, select an existing view to use
as a starting point or click New User Interface View to start from a default view with all
menus and pages enabled and then click OK.
User Interface Views Page
Overview
Use this page to view or configure how a user views the entire application.
Screen Elements
Create User Interface View link
Click to display the Copy from Existing User Interface view dialog box. Use this dialog
box to copy an existing view, or create a new one.
User Interface View for new users field
The default user interface view automatically assigned to new users.
Search field
The means to find a project.
View Name
Displays the name of the user interface view. The icon represents a user interface
view that is not yet assigned to any users. The icon represents that the view is
assigned to at least one user.
Date Created
Displays the date this user interface view was created.
Delete link
Permanently removes the selected user interface view.

1140
Tips
The Search field on this page automatically adjusts the list of matching views based
on the name or characters you enter. You must clear the search box for all user
interface views to re-appear in the list.
Getting Here
Click the Administer menu and choose User Interface Views.
Users Detail Window of the OBS Page
Overview
Use this detail window to view and assign users for a selected organizational breakdown
structure (OBS).
Screen Elements
Assign User
You can assign users, by their login names, to the OBS elements to grant access to the
corresponding EPS nodes or projects.
Delete
Removes the currently selected user from the currently selected OBS element. You
must select both a single OBS element and a single user to perform this command.
Only the user's assignment to the OBS element is deleted, not the actual user
account.
Login Name field
Displays the Login Name for each user.
Personal Name field
The personal name for the user. This name might be a nickname, full name, reference
to a role or department, or include any information recognized by your organization
to identify the user.
For example, a global organization has three users with the following Login Name field
values to uniquely identify them: tharris, tjharris, and tsharris. The following
Personal Name values are added to assist the entire organization in identifying the
users:
tharris Thomas Harris in Accounting (USA) tjharris Thomas J. Harris in Legal (ESP) tsharris Tina S. Harris in Design (CAN)

Context-Sensitive Help Topics
1141
Project Security Profile field
From the list of project security profiles, you can select the security profile you want to
apply for each OBS assignment. The type of access granted to a user is determined
by the project security profile assigned to the user.
Getting Here
1) Click the Administer menu and select User Access.
2) On the User Access page, click OBS.
3) On the OBS page, click the Users detail window.
Users Page
Overview
Use this page to create user accounts and configure their security profiles and access
privileges.
Screen Elements
Users Toolbar
See User Access Users Toolbar (on page 1359).
Associated Resource field
The Associated Resource of each user.
E-mail field
The e-mail address for each user.
Enable Modify option
Determines whether users can modify user interface options.
Enterprise Reports option
Determines user access to the Reports section in P6. By selecting this module access
option, an ODS database user is created for the P6 EPPM user as long as the user
name matches Oracle database user name requirements. For example, if the P6
EPPM user name begins with anything other than a letter, an ODS database user
cannot be created. If the P6 EPPM user name contains spaces or disallowed special
characters, they will be removed when creating the ODS database user name.
Disallowed special characters include: { } [ ] : ; < > , . ? ! @ # $ % ^ & * ( ) - _ | / \ ~ `. For
example, a P6 EPPM user name of "mgr.example.com" will be created as
"mgrexamplecom" in the ODS database. Once an ODS database user is created, the
P6 user will be able to view and run reports to which the user has access in Oracle BI
Publisher.
Notes:

1142
If running in LDAP or SSO authentication mode and a user is
granted Enterprise Reports module access, you will not be able
to log into the ODS database directly through Oracle BI
Publisher with the P6 EPPM user name if it contains spaces or
disallowed special characters.
In order for a user to log into the ODS database directly (for
example, using SQL Plus) with the P6 EPPM user name, a system
database administrator must first reset the ODS database user's
password.
Global Security Profile field
The Global Security Profile of each user.
Integration API option
Determines whether a user has access to P6 Integration API.
Login Name field
The Login Name of the users.
The display of the following fields can be modified using the Customize Columns Icon
on the Users Toolbar.
Logged In field
The modules the selected user is currently logged into.
Module Access field
The Module Access of each user.
P6 Analytics option
Determines user access only to the Star database through Oracle Business
Intelligence. By selecting this module access option, a Star user is created for the P6
EPPM user as long as the user name matches Oracle database user name
requirements. For example, if the P6 EPPM user name begins with anything other than
a letter, a Star user cannot be created. Once a Star user is created, the user will be
able to access the Oracle Business Intelligence Dashboards application.
P6 Professional option
Determines user access to P6 Professional, including Primavera Timescaled Logic
Diagram.
Personal Name field
The personal name for the user. This name might be a nickname, full name, reference
to a role or department, or include any information recognized by your organization
to identify the user.

Context-Sensitive Help Topics
1143
For example, a global organization has three users with the following Login Name field
values to uniquely identify them: tharris, tjharris, and tsharris. The following
Personal Name values are added to assist the entire organization in identifying the
users:
tharris Thomas Harris in Accounting (USA) tjharris Thomas J. Harris in Legal (ESP) tsharris Tina S. Harris in Design (CAN)
Phone field
The phone number available for each user.
Portfolios option
Determines user access to the following functionality in P6: the Portfolios section,
Project Performance portlets, the Portfolio View portlet in the Dashboards section,
document management functionality (if the Content Repository is configured), and
workflow functionality (if the Workflows Repository is configured).
Progress Reporter option
Determines user access to P6 Progress Reporter. For users who require access to P6
Progress Reporter, you must grant them either Team Member or Progress Reporter
module access.
Project Access field
The Project Access of each user.
Projects option
Determines user access to the following functionality in P6: the Projects section,
Project Performance portlets in the Dashboards section, document management
functionality (if the Content Repository is configured), and workflow functionality (if
the Workflows Repository is configured).
Resource Access field
Displays the Resource Access of each user.
Resources option
Determines user access to the following functionality in P6: the Resources section,
Resources portlets in the Dashboards section, document management functionality
(if the Content Repository is configured), and workflow functionality (if the Workflows
Repository is configured).
Team Member option
Determines whether the user will have access to timesheets in the P6 Progress
Reporter application. In the P6 web application, enables limited access to features
such as certain dashboard and project workspace portlets (for projects the user has
rights to access) and the Activities page (for only the user's assigned activities).

1144
User Interface View field
The type of access of each user.
Project Access detail window
See Project Access Detail Window of the Users Page (on page 950).
Module Access detail window
See Module Access Detail Window of the Users Page (on page 882).
Tips
Users with the Admin Superuser global security profile will always see all user accounts on
this page. Other users will see only the user accounts permitted by their currently
assigned Resource Access settings.
Getting Here
1) Click the Administer menu and select User Access.
2) On the User Access pane, click Users.
Users Tab of the User Interface View Details Page
Overview
Use this tab to assign users to a user interface view. You can also allow or disallow the user
to edit options in the view.
Screen Elements
Users of View common controls
Common controls for selecting the users of the view. See Configuring Columns or
Values.
Allow Editing option
Determines whether to allow users of the view to modify their own view preferences.
Search
Displays options for finding a specific matching entry or entries based on search
criteria.
Search list
Select from one of the following to specify where to search:
User Name
Personal Name

Context-Sensitive Help Topics
1145
for field
Enter information to search with the corresponding Search list choice.
Go button
Searches for the chosen and entered information.
Tips
Users who have the Allow Editing privilege as assigned in their view can edit the
contents of their user interface view on the View Preferences tab.
The Available Users column lists both login name and personal name. Click to
search for users based on User Name or Personal Name, then enter your search
criteria in the Search for field. Click Go. The page displays all users who meet your
search specifications. To reset the list of available users, click again.
Getting Here
To modify an existing user interface view:
1) Click the Administer menu and select User Interface Views.
2) On the User Interface Views page, click a View.
3) On the Details of page, click the Users tab.
To modify a new user interface view:
1) Click the Administer menu and select User Interface Views.
2) On the User Interface Views page, click Create User Interface View.
3) In the Copy from Existing User Interface View dialog box, click New User Interface
View or an existing view and click OK.
4) On the Create User Interface View page, click the Users tab.
Version Tab of the Document Details Section (with content repository)
Overview
Use this tab to view a list of all the stored versions of a selected document.
Your access to Documents features and functionality are determined by the type of
content repository installed. Features not supported by your content repository are
unavailable in P6, although they might be described in P6 Help.
Screen Elements
Version field
Lists the version number. Click the link to the version number to view a specific
document version. Version 1 represents the original version of the document.

1146
Review Status field
The current review status of the document. If the document is not under review, this
field is blank.
The review statuses are Blank, In Review, Approved, Rejected, and Terminated.
Modified By field
The name of the person who last modified the document.
Modified Date field
The date and time the document was last modified.
Comments field
Any comments associated with the document version.
Getting Here
From the Documents page:
1) Click Projects.
2) On the Projects navigation bar, click Documents.
3) On the Documents page, click the Project tab.
4) On the Project tab, select a project and click the Version tab.
From the Dashboards page:
1) Click Dashboards.
2) On the Dashboards page, select a dashboard tab.
3) On the dashboard tab, expand the My Documents portlet and select the Private
Documents tab.
4) On the Private Documents tab, select a document and click Edit Details.
5) In the Document Details dialog box, click the Version tab.
From the Workspace page:
1) Click Projects.
2) On the Projects navigation bar, click Workspace.
3) On the Workspace page, expand the Project Documents portlet and click the Project
tab.
4) On the Project tab, select a document and click Edit Details.
5) In the Document Details dialog box, click the Version tab.

Context-Sensitive Help Topics
1147
View Calendar Dialog Box
Overview
Use this dialog box to view the calendar and standard work week associated with the
selected activity or project. If you select a project, the dialog box displays the calendar
for the selected project. If you select an activity, the dialog box displays the calendar for
the selected activity.
Screen Elements
Calendar tab
See Calendar Tab of the View Calendar Dialog Box (on page 609).
Standard Work Week tab
See Standard Work Week Tab of the View Calendar Dialog Box (on page 1088).
Getting Here
From the Activities page:
1) Click Projects.
2) On the Projects navigation bar, click Activities.
3) On the Activities page:
a. Select an activity.
b. Click the Actions menu and select View Calendar.
From the EPS page:
1) Click Projects.
2) On the Projects navigation bar, click EPS.
3) On the EPS page:
a. Select a project.
b. Click the Actions menu and select View Calendar.
View Calendar Dialog Box
Overview
Use the View Calendar dialog box to view the calendar and standard work week
associated with the selected project.
Screen Elements
Calendar tab
See Calendar Tab of the View Calendar Dialog Box (on page 609).

1148
Standard Work Week tab
See Standard Work Week Tab of the View Calendar Dialog Box (on page 1088).
Getting Here
1) Click Resources.
2) On the Resources navigation bar, click Assignments.
3) On the Assignments page, click Actions and select View Calendar.
View Tab of the My Preferences Page
Overview
Use this tab to customize the user interface view for all sections of the application.
Screen Elements
User Interface View Name field
The unique name for the User Interface View. The naming scheme you choose for user
interface views might reflect the roles or permissions of their intended users. For
example, Intern, Associate, Project Staff, Manager, and Executive are all possible user
interface view names in a series offering distinct but sometimes overlapping access to
menus and pages.
Administer section
Enables you to customize which administrative functions you can access from the
Administer menu.
Menu Items options
Determines which Administer menu items you can access. By selecting the Menu
Items option itself, you can access all menu items.
Application Settings: Enables your organization to define a series of
application-wide parameters and values that apply globally and to set defaults
and settings that affect how the application behaves. For example, configure
general application settings including calendar and activity duration defaults,
URLs for related applications, summarization time periods (also used to store past
period performance actuals), and also enable the optional password policy
setting.
Enterprise Data: Enables you to define series of application-wide data that apply
to all projects. For example, you can set global data, such as currencies and
financial periods; project data, such as baseline types and funding sources;
activity data, such as activity codes and step templates; resource data, such as
rate types and units of measure; risk data, such as risk categories and scoring
matrices; issue data, such as issue codes and UDFs; and document data, such as
document categories and statuses.

Context-Sensitive Help Topics
1149
User Access: Enables you to create user accounts, assign access, manage the
organizational breakdown structure (OBS) and configure profiles.
User Interface Views: Enables you to create pre-configured sets of options you
assign to users so their view of Dashboards, Portfolios, Projects, Resources, and
Administration is optimized for their role. User interface views permit visibility to
features essential for a user's role while hiding functionality that is not applicable.
Dashboards section
Enables you to customize which functions you can access from the Dashboards
menu.
Menu Items options
Determines which functions you can access under the Dashboards menu. By
selecting the Menu Items option itself, you can acccess all menu items.
Manage Dashboards: Enables you to access Dashboards, which are customizable
pages consisting of the data you need to perform your role. Dashboard data
appears in one or more smaller regions called portlets.
Approve Timesheets: Enables you to approve timesheets submitted through P6
Progress Reporter. Timesheets allow users to record hours for assigned activities.
Displayed Dashboards option
Lists the dashboards you can access, based on what your P6 administrator assigned
to you.
Portfolios section
Enables you to customize which functions you can access from the Portfolios
menu and which pages you can access within the Portfolios section.
Menu Items option
Determines which functions you can access from the Portfolios menu. By
selecting the Menu Items option itself, you can acccess all menu items.
Manage Portfolio Views: Enables you to create, modify, and delete portfolio views.
A portfolio view is a scorecard or chart providing high-level information spanning
an entire group of projects.
Manage Scenarios: Enables you to create, modify, or delete scenarios, and
determine who can access them. A scenario is a snapshot of historical project
data; you can use it to compare against the latest summarized data, or to
compare to other scenarios.
Open Portfolio: Enables you to open a group of projects by EPS, code, or portfolio.
Manage Portfolios: Enables you to review the list of projects in each portfolio, and
to create, modify, and delete portfolios.

1150
Pages option
Determines which pages you can access. If you select the Pages option itself, you
can access all pages.
Portfolio Analysis: Use this page to analyze portfolio data, conduct side-by-side
comparisons of two project groups, and apply what-if scenarios and waterline
analysis techniques to assist with executive-level critical decision making.
Capacity Planning: Use this page to analyze role allocation and cost over time.
Performance Status: Use this page to display summarized schedule and cost or
labor unit data based on the performance metric you select.
Gantt Chart: Use this page to display timescaled performance or earned value
schedule information at the WBS level, along with unit or cost data, in a
spreadsheet or histogram.
ROI: Use this page to display cost/benefit information based on live data for the
open project group.
Details: Use this page to modify a group of projects, called a portfolio.
Projects section
Enables you to customize which functions you can access from the Projects
menu and which pages you can access within the Projects section.
Menu Items option
Determines which functions you can access from the Projects menu. By
selecting the Menu Items option itself, you can acccess all menu items.
Open Projects: Enables you to open projects by EPS, project code, or portfolio.
Enterprise Project Data: Enables you to configure project-related enterprise
project for your entire organization.
Scheduled Services: Enables you to schedule, verify status, modify, and delete
routine recurring project management jobs, called services.
Pages option
Determines which pages you can access. If you select the Pages option itself, you
can access all pages.
EPS: Use this page to manage the Enterprise Project Structure (EPS) and its projects.
The EPS page displays schedules for any single project or group of projects you
choose with detail windows, a Gantt chart, and a table.
Activities: Use this page as your central project management tool for all project
activities and their associated details. This includes all WBS elements, activities,
steps, issues, notebooks, resource assignments, risks, and other details.
Workspace: Use this page to view information specific to each project, including
project management and project performance information.
Team Usage: Use this page to view cost or usage data at the team level and for
individual roles and resources assigned to the project you are working with.

Context-Sensitive Help Topics
1151
Issues: Use this page to view a list or chart of all the issues for the currently open
projects or portfolios.
Documents:
With a content repository enabled: Use this page to view, check in, check
out, and download selected documents from one or more projects,
associate additional items with a selected document, and compare
documents across projects.
Without a content repository enabled: Use this page to view document
details and send e-mail about a document.
Risks: Use this page to add, modify, or delete project risks.
Resources section
Enables you to customize which functions you can access from the Resources
menu and which pages you can access within the Resources section.
Menu Items option
Determines whether to display the Resources menu, which provides the option to
view the Enterprise Resource Data page.
Pages option
Determines which pages you can access. If you select the Pages option itself, you
can access all pages.
Administration: Use this page to create, modify, and delete resources, resource
teams, roles, and role teams.
Planning: Use the Resource Planning spreadsheet on the Planning page to specify,
review, or modify project-level and WBS-level allocation data for individual
resources and roles across a project lifecycle.
Assignments: Use this page to view and modify resource assignment data using
filters, which enables you to view resource assignment data for only the resources
or projects that you need to view.
Analysis: Use this page to compare resource utilization between resource teams,
project resources, and department resource, all from one central location.
Move Up
Moves the selected item one level up in the sort order.
Move Down
Moves the selected item one level down in the sort order.
Getting Here
1) Click the Administer menu and select My Preferences.
2) On the My Preferences page, click the View tab.
1152
Views and Reports Detail Window of the Global Security Profiles Page
Overview
Use this detail window to assign views and reports privileges to the selected global
security profile.
Screen Elements
Privilege field
The name of the security permission that is assigned (option selected) or denied
(option cleared) to users of the currently selected profile.
Privilege option
The option in the column header that determines whether the privileges are all
assigned (selected), all denied (clear), or individually configured (indicated with a
dash or - sign).
Add/Edit/Delete Global Activity and Assignment Layouts, Views and Filters option
Determines whether the profile will enable users to create, modify, and remove
global activity and resource assignment layouts, views, and filters.
Add/Edit/Delete Global Dashboards option
Determines whether the profile will enable users to create, modify, and remove
global dashboards.
Add/Edit/Delete Global Project, WBS and Portfolio Layouts, Views and Filters option
Determines whether the profile will enable users to create, modify, and remove
global project, WBS, and portfolio layouts, views, and filters. This privilege is required to
save view changes made to the Portfolio Analysis page.
Add/Edit/Delete Global Reports option
Determines whether the profile will enable users to create, modify, and remove
global reports, including editing report groups and global report batches and saving
global reports created or modified in P6 Professional.
Edit Global Tracking Layouts option
Determines whether the profile will enable users to create, modify, and remove
global tracking layouts in P6 Professional.

Context-Sensitive Help Topics
1153
Edit Projects from Scorecards option
Determines whether the profile will enable users to create, modify, and remove
projects from scorecards in the Portfolio View portlet and the Portfolio Analysis page.
This privilege is required to save data changes made to the Portfolio Analysis
page.The following project privileges are also required for scorecards: 'Edit Project
Details Except Costs/Financials' to edit project data, 'View Project Costs/Financials' to
view project cost data, 'Edit WBS Costs/Financials' to edit project cost data, 'Create
Project' to add a project, and 'Delete Project' to delete a project.
Getting Here
1) Click the Administer menu and select User Access.
2) On the User Access page, click Global Security Profiles.
3) On the Global Security Profiles page, click the Views and Reports detail window.
Views and Reports Detail Window of the Project Security Profiles Page
Overview
Use this detail window to assign views and reports privileges to the selected project
security profile.
Screen Elements
Privilege field
The name of the security permission that is assigned (option selected) or denied
(option cleared) to users of the currently selected profile.
Privilege option
The option in the column header that determines whether the privileges are all
assigned (selected), all denied (clear), or individually configured (indicated with a
dash or - sign).
Add/Edit Project Level Layouts option
Determines whether the profile will enable users to create, modify, and remove
project level layouts in the Activities, Assignments, or WBS windows in P6 Professional.
Edit Project Reports option
Determines whether the profile will enable users to modify reports, modify report
batches, and export reports for projects in P6 Professional.
Publish Project Website option
Determines whether the profile will enable users to publish a Web site for projects in P6
Professional.

1154
Getting Here
1) Click the Administer menu and select User Access.
2) On the User Access page, click Project Security Profiles.
3) On the Project Security Profiles page, click the Views and Reports detail window.
Warnings Section of the Leveling Report Log
Overview
Use this section to view warnings for various projects.
Screen Elements
Activities without predecessors/successors table
The information about the activities that do not have predecessors or successors in a
table format.
Project ID field
The unique identifying code for the project.
Project Name field
The name of the project.
Activity ID field
The unique identifier of the activity.
System generated.
Activity Name field
The name of the activity. The activity name does not have to be unique.
Out of sequence activities field
The activities which are taking more or less time to complete than originally planned.
Activities with actual date later than data date field
The activities in which the data date is before the actual date.
Milestones with invalid relationships field
The milestones which were found to have invalid relationships during the scheduling
or leveling process.
Getting Here
1) Click Projects.
2) On the Projects navigation bar, click Activities.

Context-Sensitive Help Topics
1155
3) On the Activities page, click the Actions menu and select Run Leveler...
(Shift+F9).
4) In the Level Resources dialog box, click the Options tab.
5) On the Options tab, select the Display leveling log upon completion and click Level.
6) In the Leveling Report Log, expand the Warnings section.
Warnings Section of the Scheduling Report Dialog Box of the Activities Page
Overview
Use this section to view warnings for various projects.
Screen Elements
Activities without predecessors/successors table
The information about the activities that do not have predecessors or successors in a
table format.
Project ID field
The unique identifying code for the project.
Project Name field
The name of the project.
Activity ID field
The unique identifier of the activity.
System generated.
Activity Name field
The name of the activity. The activity name does not have to be unique.
Out of sequence activities field
The activities which are taking more or less time to complete than originally planned.
Activities with actual date later than data date field
The activities in which the data date is before the actual date.
Milestones with invalid relationships field
The milestones which were found to have invalid relationships during the scheduling
or leveling process.
Tips
If use the shortcut, you must first select a project or activity.

1156
Getting Here
1) Click Projects.
2) On the Projects navigation bar, click Activities.
3) On the Activities page, click the Actions menu and select Run Scheduler...
(F9).
4) In the Schedule Project dialog box:
a. Configure the options and select the Display scheduling log upon completion
option.
b. Click Schedule.
5) In the Scheduling Reports dialog box, expand the Warnings section.
WBS Budget Log Detail Window of the Activities Page
Overview
Use this detail window to create, delete, or modify a WBS budget log.
Screen Elements
Budget Log toolbar
See Budget Log Toolbar (on page 1245).
Date field
The date of the budgeted line item.
Amount field
The amount of the budgeted line item.
Responsible field
The name of the person with signature approval for the line item.
Status field
The approval status of the line item.
Reason field
The reason why the expense was required.
Change Number field
The quantity purchased.
Tips
If you have more than one WBS selected, the detail window will not be visible.

Context-Sensitive Help Topics
1157
Getting Here
1) Click Projects.
2) On the Projects navigation bar, click Activities.
3) On the Activities page, select a WBS and click the Budget Log detail window.
WBS Category Page
Overview
Use this page to add and configure WBS categories in all projects.
Screen Elements
WBS Category toolbar
See Categories Toolbar (see "Enterprise Data Categories Toolbar" on page 1258).
Category field
The custom names of available WBS categories. You can use custom WBS categories
to organize, filter, and report WBS information in all projects.
Getting Here
1) Click the Projects menu and select Enterprise Project Data, or click the
Administer menu and select Enterprise Data.
2) In the Enterprise Data pane, expand Projects and click WBS Category.
WBS Documents Detail Window of the Activities Page
Overview
Use this detail window to assign documents to a WBS, remove or revise the relationship
between a document and a WBS, and view documents assigned to a WBS.
Screen Elements
Documents toolbar
See WBS Documents Toolbar of the Activities Page (on page 1369).
Title field
The identifying name of the document.
Document Category list
The classification label used to organize documents.

1158
Note: This field only contains data for WP&Doc documents, or documents that were
not added from the content repository. This field is blank for documents that were
added from the content repository.
Status field
The current status of the document.
Public Location field
The selected document's publicly-accessible file location. All project participants can
view this file.
Note: This field only contains data for WP&Doc documents, or documents that were
not added from the content repository. This field is blank for documents that were
added from the content repository.
Tips
If you have more than one WBS selected, the detail window will not be visible.
If you have a project template open, the icons in the detail window will be disabled.
Getting Here
1) Click Projects.
2) On the Projects navigation bar, click Activities.
3) On the Activities page, select a WBS and click the Documents detail window.
WBS Earned Value Detail Window of the Activities Page
Overview
Use this detail window to configure earned value for the selected WBS.
Screen Elements
Earned Value toolbar
See WBS Earned Value Toolbar (on page 1370).
Technique for computing performance percent complete section
The options for computing the performance percent complete.
Activity Percent Complete radio button
Determines whether to calculate earned value according to current activity
completion percentages.
Use resource curves/future period buckets option
Determines whether to include resource curves and future period buckets in the
calculation of earned value using current activity completion percentages.

Context-Sensitive Help Topics
1159
WBS Milestones Percent Complete radio button
Determines whether to calculate earned value by defining milestones at the WBS
level and assigning a level of significance or weight to each of them.
As progress occurs and you mark each milestone complete, the WBS element’s
performance percent complete is calculated based on the weight of the milestone.
0/100 radio button
Determines whether to calculate earned value as 100 percent only after the activity
ends.
50/50 radio button
Determines whether to calculate earned value as 50 percent after the activity starts
and until the activity ends. After the activity ends, the activity's earned value is 100
percent.
Custom percent complete radio button
Determines whether earned value is calculated as a percentage you specify. This
percentage applies after the activity starts and until the activity ends. After the
activity ends, the activity's earned value is 100 percent.
Technique for computing Estimate to Complete (ETC) section
The options for calculating the ETC of an activity, which can be computed as either
the remaining total cost for the activity (Remaining Total Cost), or as PF multiplied by
(Budget at Completion minus Earned Value Cost), depending on the Earned Value
technique selected for the activity's WBS.
ETC=remaining cost for activity radio button
Determines whether to calculate ETC values as the remaining cost to complete an
activity where:
Calculated as remaining duration of activity multiplied by applicable resource rates.
ETC=PF * (Budget at Completion - Earned Value) radio button
Select to calculate the ETC as a performance factor (PF) multiplied by the difference
between the Budget at Completion (BAC) and Earned Value, as in the following
equation:
ETC=PF * (BAC - EV)
PF=1 radio button: Select to set the performance factor to equal 1.
PF=1/Cost Performance Index radio button: Select to calculate the ETC as a
performance factor of 1 divided by the Cost Performance Index (CPI), where the
CPI = Earned Value Cost / Actual Cost. The equation can be interpreted as: PF
equals 1 divided by (EVC divided by AVC) equals PF equals 1 divided by CPI.

1160
PF=1/(Cost Performance Index * Schedule Performance Index) radio button:
Select to calculate the ETC as a performance factor of 1 divided by the Cost
Performance Index multiplied by the Schedule Performance Index (the Earned
Value Cost divided by the Planned Value Cost). The equation can be interpreted
as: PF equals 1 divided by (EVC divided by AVC) multiplied by (EVC divided by
PVC) equals PF equals 1 divided by (CPI multiplied by SPI).
PF=<value> radio button: Select to calculate Estimate To Complete (ETC) values
as a Performance Factor (PF) you specify multiplied by Budget At Completion
(BAC) less Earned Value Cost. If you select this option, type a factor in the PF field.
Tips
If you have more than one WBS selected, the detail window will not be visible.
Getting Here
1) Click Projects.
2) On the Projects navigation bar, click Activities.
3) On the Activities page, select a WBS and click the Earned Value detail window.
WBS General Detail Window of the Activities Page
Overview
Use this detail window to add or modify information about the selected WBS.
Screen Elements
General toolbar
See WBS General Toolbar of the Activities Page (on page 1371).
Anticipated Finish field
The expected finish date of the WBS level.
Anticipated Start field
The date the WBS level is expected to start.
Contains Summary Data option
Determines whether the project has been summarized. If the option is selected, the
project has been summarized.
Current Budget field
The current budget of the WBS.
Calculated as original budget plus approved budgets.

Context-Sensitive Help Topics
1161
Distributed Current Budget field
The sum of all budgets that were assigned to control accounts during baseline
planning.
These budgets are allocated for work and planning packages.
Forecast Finish Date field
The planned finish date of a project or WBS based in a what-if scenario designed to
stimulate project performance and outcomes and plan resource allocation.
Forecast Start Date field
The planned start date of a project or WBS based in a what-if scenario designed to
simulate project performance and outcomes and plan resource allocation.
Independent ETC Labor Units field
The user-entered estimate to complete total labor.
Independent ETC Total Cost field
The user-entered estimate to complete total cost.
Integrated WBS field
The type of system integration, if any, in place at your organization. Activities and
other project data within this WBS will be shared with the integrated solution you
choose. For example, ERP. The default value is <none>.
Original Budget field
The estimate of the total amount you require for the selected WBS, including all
contributed funds.
Parent field
The name of the WBS that is the parent of the selected WBS.
In this context, the selected WBS has inherited the attributes of its parent and is
formed one level beneath its parent in the hierarchy.
Project Status field
The current status of the activity, WBS, or project.
Proposed Budget field
The sum of the original budget and pending budgets.
Responsible Manager field
The name of the manager responsible for the completion of the WBS tasks.
Unallocated Budget field
The sum of a budget that has not been allocated to the selected WBS.

1162
WBS Category field
The category of the selected WBS. Use this category to organize, filter, and report WBS
information in all projects. The category applies to this WBS in all projects to which the
WBS item is assigned.
WBS Code field
The unique identifying code for the WBS element.
WBS Name field
The name of the selected WBS element.
WBS Path field
The WBS path if one was applied. The WBS path is a group of identical WBS levels used
across multiple projects. The WBS path lists activities grouped by WBS levels, without
displaying the project level node.
User Defined fields
The selection of user defined fields displayed in the General detail window.
Tips
To search for an item in the WBS hierarchy list, from the Search list, select a search
criteria. Type a search variable and click Search. Select a WBS and click Go, or click
Clear Result to return to the full hierarchy list.
If you have more than one WBS selected, the detail window will not be visible.
Getting Here
1) Click Projects.
2) On the Projects navigation bar, click Activities.
3) On the Activities page, select a WBS and click the General detail window.
WBS Issues Detail Window of the Activities Page
Overview
Use this detail window to manage the issues associated with the selected WBS.
Screen Elements
WBS Issues toolbar
See Issues Toolbar (on page 1292).
Issue Name field
The name or description of the issue.

Context-Sensitive Help Topics
1163
Priority field
The level of importance assigned to the issue.
Status field
The current status of the issue: Open, On Hold, Closed.
Owner field
The resource responsible for the selected issue.
If you have edit privileges, you can select a different owner. The list of available
resources you can select from depends upon your resource access security privileges.
Applies To field
The WBS to which the issue applies.
Identified By field
The name of the person who identified the issue. By default, this field displays your user
name.
Date Identified field
The date on which the issue was identified. By default, this field displays today's date.
Responsible Manager field
The name of the person responsible for the issue.
If you have edit privileges, you can select a different Responsible Manager. The list of
available resources depends upon your resource access security privileges.
Resolution Date field
The planned (open issue) or actual (closed issue) resolution date for the issue.
Description field
A more detailed summary for the item. The description provides more information
than short names or titles. It can give background information or establish a purpose
for the item. These details help differentiate between items with similar names and are
especially useful in multi-user environments.
Tips
If you have more than one WBS selected, the detail window will not be visible.
If you have a project template open, the icons in the detail window will be disabled.
Getting Here
1) Click Projects.
2) On the Projects navigation bar, click Activities.
3) On the Activities page, select a WBS and then click the Issues detail window.

1164
WBS Milestones Detail Window of the Activities Page
Overview
Use this detail window to configure milestones for the selected WBS.
Screen Elements
WBS Milestones toolbar
See WBS Milestones Toolbar of the Activities Page (on page 1371).
WBS Milestone field
The name of a milestone associated with the selected WBS.
Weight field
The weight of the milestone in relation to other milestones in the same project. The
weight value determines the importance of the milestone. For example, a milestone
with a weight of 1 has a lower measure of importance where 10 has a higher measure
of importance.
Completed option
The completion status of the WBS milestone.
When selected, indicates that the WBS milestone is complete. When clear, indicates
that the WBS milestone has not been completed.
Tips
If you have more than one WBS selected, the detail window will not be visible.
Getting Here
1) Click Projects.
2) On the Projects navigation bar, click Activities.
3) On the Activities page, select a WBS and click the WBS Milestones detail window.
WBS Notebooks Detail Window of the Activities Page
Overview
Use this detail window to add comments, diagrams, and other notes to a WBS.
Screen Elements
WBS Notebooks toolbar
See Notebooks Toolbar (on page 1295).

Context-Sensitive Help Topics
1165
Topic field
The name of the assigned topic.
Description field
A more detailed summary for the item. The description provides more information
than short names or titles. It can give background information or establish a purpose
for the item. These details help differentiate between items with similar names and are
especially useful in multi-user environments.
Tips
If you have more than one WBS selected, the detail window will not be visible.
Getting Here
1) Click Projects.
2) On the Projects navigation bar, click Activities.
3) On the Activities page, select a WBS and click the Notebooks detail window.
WBS UDFs Page
Overview
Use this page to add and configure user defined fields for work breakdown structures
(WBSs).
Screen Elements
User Defined Fields toolbar
See User Defined Fields Toolbar (on page 1361).
User Defined Field field
The name of the user-defined field.
Data Type field
The name of the type of data that corresponds to each user-defined field. The data
type you select determines the type of data you can specify in a field. The following
data types are available:
Text: Allows you to use text or a combination of text and numbers.
Start Date: Allows you to enter Start Date information only.
Finish Date: Allows you to enter Finish Date information only.
Cost: Allows you to enter currency values.
Number: Allows you to use numerals with two decimal places.
Integer: Allows you to use numeric data, but not a number related to money.

1166
Indicator: Allows you to use an indicator field that you can use to enter
color-coded icon values in columns and display color-coded text in reports.
Getting Here
1) Click the Projects menu and select Enterprise Project Data, or click the
Administer menu and select Enterprise Data.
2) In the Enterprise Data pane, expand Projects and click WBS UDFs.
Workflow Section of the Content Tab of the Customize Dashboard Page
Overview
Use this section to enable and configure the Workflow and Document Review portlets in
the currently selected dashboard.
Screen Elements
Project Workflows option
Determines whether to display the Workflows portlet. The Workflows portlet is only
available as an option if the BPM server is properly configured by your administrator.
Select from the following options:
Show initiations from the past n days field: Displays workflows that have been
initiated within the specified number of days.
Document Reviews option
Determines whether to display the Document Reviews portlet. This feature requires
additional configuration by your administrator.
Show documents initiated in the past days field
The documents that have been initiated within the past specified number of days.
Getting Here
1) Click Dashboards.
2) On the Dashboards page, select a dashboard.
3) On the dashboard, click the Customize link.
4) On the Dashboard Details page, expand the Workflow section.
Workflows Portlet
Overview
Use this portlet to initiate, coordinate, participate, and review all project workflow tasks.

Context-Sensitive Help Topics
1167
Screen Elements
Action Required tab
See Action Required Tab of the Workflows Portlet (on page 540).
My Workflows tab
See My Workflows Tab of the Workflows Portlet (on page 894).
Tips
The "No information is available" message displays if no workflows require your
attention.
The Workflows portlet is only available when you integrate P6 with BPM.
To control the number of items that appear in the My Workflows tab, click Customize.
On the Content tab, specify a number in the Show initiations in the past n days field.
Getting Here
1) Click Dashboards.
2) On the Dashboards page, select a dashboard.
3) On the dashboard, expand the Workflows portlet.
Workgroup Tab of the Documents Portlet of the Workgroup Workspace Page
Overview
Use this tab to view all documents that are private to the workgroup. Workgroup
documents are not associated with any project and are available only to members of
the workgroup.
Screen Elements
Workgroup Tab toolbar
See Workgroup Tab Toolbar of the Documents Portlet (see "Workgroup Tab Toolbar of
the Documents Portlet of the Workgroup Workspace Page" on page 1372).
Title field
Displays the name of the workgroup and the titles of all associated documents.
Version field
The document's version or revision number.
Creation Date field
The date and time that the selected document was created.
Modified Date field
The date and time the document was last modified.

1168
Getting Here
From the Workspace page:
1) Click Projects.
2) On the Projects navigation bar, click Workspace.
3) On the Workspace page, expand the Workgroups portlet and select a workgroup.
4) On the Workgroup Workspace page, expand the Documents portlet and click the
Workgroup tab.
From the Dashboards page:
1) Click Dashboards.
2) On the Dashboards page, select a dashboard tab.
3) On the dashboard tab, expand the My Workgroups portlet.
4) In the My Workgroups portlet, expand a project and select a workgroup.
5) On the Workgroup Workspace page, expand the Documents portlet and click the
Workgroup tab.
Workgroups Details Page
Overview
Use this page to modify the content and layout of portlets on the Workgroup Workspace
page.
Screen Elements
Content tab
See Content Tab of the Customize Workgroup Workspace Page (on page 638).
Layout tab
See Layout Tab of the Customize Workgroup Workspace Page (on page 865).
Getting Here
From the Workspace page:
1) Click Projects.
2) On the Projects navigation bar, click Workspace.
3) On the Workspace page, expand the Workgroups portlet and select a workgroup.
4) On the Workgroup Workspace page, click Customize.
From the Dashboards page:
1) Click Dashboards.
2) On the Dashboards page, select a dashboard tab.

Context-Sensitive Help Topics
1169
3) On the dashboard tab, expand the My Workgroups portlet and select a workgroup.
4) On the Workgroup Workspace page, click Customize.
Workgroups Portlet of the Workspace Page
Overview
Use this portlet to view all of the workgroups you are associated with for that project. If
you have the required project privileges, you can add or delete workgroups from the
portlet.
Screen Elements
Add link
Displays a dialog box in which you can enter a name to create a new workgroup.
Workgroup Name field
The name of the selected workgroup. Click a name to open the Workgroup
Workspace for that workgroup.
Getting Here
1) Click Projects.
2) On the Projects navigation bar, click Workspace.
3) On the Workspace page, expand the Workgroups portlet.
Working with the Activity Gantt Chart
Use the Activity Gantt chart to view the progression and relationships of activities or
projects on a timeline.
Gantt chart bars and activity dates or durations
You can easily update dates and durations by resizing or moving Gantt chart bars. When
you change bar positions in a Gantt chart, the start and finish date columns update
automatically to reflect the new bar position. After moving a Gantt bar, when you save
your changes, the remaining duration is recalculated based on the new dates and the
activity or project calendar. Because this calendar is applied when you save, if you
move but do not resize a Gantt bar, the duration might shorten or lengthen based on the
calendar's nonworktime.
Note: If you click the center of a bar and drag it along the
timescale, you will be prompted to add a Start On or After
constraint. In the Gantt chart, you can impose only a Start On or
After constraint.
Customizing the Gantt chart

1170
You can change the progress line options or the timescale for the Gantt chart in the
Customize Activity View dialog box.
Viewing the Gantt chart
In the Gantt chart, a vertical blue line represents the current data date for the project.
Vertical sightlines appear at each minor increment (bottom) of the timescale. Horizontal
sightlines appear at the bottom of every fifth table row. The timescale background is
shaded to indicate nonworktime based on the global default calendar.
Activity highlight
To quickly locate the activities you need to update, you can use the Progress Spotlight
feature, which highlights all activities that should have progressed during a specific time
period. This time period is defined by the smallest increment of the current timescale
since the last data date. For example, if the current timescale is set to Month/Week,
Progress Spotlight highlights all activities that should have progressed during the week
since the data date.
Workspace Details Page
Overview
Use this page to modify which portlets are displayed on the Projects Workspace page as
well as the layout of the chosen portlets.
Screen Elements
Content tab
See Content Tab of the Customize Workspace Page (see "Content Tab of the
Workspace Details Page" on page 643).
Layout tab
See Layout Tab of the Customize Workspace Page (see "Layout Tab of the Workspace
Details Page" on page 866).
Getting Here
1) Click Projects.
2) On the Projects navigation bar, click Workspace.
3) On the Workspace page, click Customize.

Context-Sensitive Help Topics
1171
Workspace of Workgroup Page
Overview
A workgroup is a space where you can focus on activities, issues, and documents
relating to a specific segment of a project. Think of a workgroup as a subset of a Project
Workspace that is used to focus on specific activities related to that project.
Note: Workgroups are always available, however if P6 is not
installed with a configured content repository, the Documents
portlet in Workgroups will not be available.
Screen Elements
Expand All link
Expands all portlets (when portlets are collapsed).
Collapse All link
Collapses all portlets to display only their title bars (when portlets are expanded).
Customize link
Displays a dialog box or page that allows you to configure the current page, tab,
dialog box, or portlet. See Customize Workgroup Workspace Page (see "Workgroups
Details Page" on page 1168) for further details.
Issues portlet
The Issues portlet on the Workspace of Workgroup page is identical to the Workgroup
Workspace page in the Projects section. See Issues Portlet of the Workgroup
Workspace Page (on page 857) for further details.
Documents portlet
The Documents portlet on the Workspace of Workgroup page is identical to the
Workgroup Workspace page in the Projects section. See Documents Portlet of the
Workgroup Workspace Page (on page 725) for further details.
Activities portlet
The Activities portlet on the Workspace of Workgroup page is identical to the
Workgroup Workspace page in the Projects section. See Activities Portlet of the
Workgroup Workspace Page (on page 550) for further details.
Tips
You can access all of your workgroups from the My Workgroups portlet in a
dashboard. You can access workgroups for a specific project from the Workgroups
portlet in the Project Workspace.

1172
A project can have any number of associated workgroups. With the required security
privilege, you can add and delete workgroups in the Workgroups portlet of the
Project Workspace.
If the number of rows in a portlet exceeds the number specified in the 'Maximum
number of rows displayed in workgroup lists' field, Previous and Next links appear.
Getting Here
From the Workspace page:
1) Click Projects.
2) On the Projects navigation bar, click Workspace.
3) On the Workspace page, expand the Workgroups portlet.
4) In the Workgroups portlet, select a workgroup.
From the Dashboards page:
1) Click Dashboards.
2) On the Dashboards page, select a dashboard tab.
3) On the dashboard tab, expand the My Workgroups portlet.
4) In the My Workgroups portlet, expand a project and select a workgroup.
Workspace Page
Overview
Use this page to view information specific to each project, including project
management and project performance information. With the proper configuration, you
can also communicate and share information and documents with other project
members in this workspace.
Screen Elements
Expand All link
Expands all portlets (when portlets are collapsed).
Collapse All link
Collapses all portlets to display only their title bars (when portlets are expanded).
Customize link
Displays a dialog box or page that allows you to configure the current page, tab,
dialog box, or portlet. See Customize Workspace Page (see "Workspace Details Page"
on page 1170).

Context-Sensitive Help Topics
1173
Tips
Contract Management is Oracle Primavera’s contract management and project
administration application.
Contract Management portlets are only available for display if your organization is set
up to access Contract Management and the project for which you are customizing
the Project Workspace is linked to a Contract Management project.
Getting Here
1) Click Projects.
2) On the Projects navigation bar, click Workspace.
WP & Docs Tab of the Documents Page (with content repository)
Overview
Use this tab to view all the documents that have been added using P6 Professional.
Screen Elements
WP and Docs Tab toolbar
See WP & Docs Tab Toolbar (on page 1375).
Getting Here
From the Documents page:
1) Click Projects.
2) On the Projects navigation bar, click Documents.
3) On the Documents page, click the WP & Docs tab.
From the Workspace page:
1) Click Projects.
2) On the Projects navigation bar, click Workspace.
3) On the Workspace page, expand the Project Documents portlet and click the WP &
Docs tab.
From the Dashboards page:
1) Click Dashboards.
2) On the Dashboards page, expand the My Documents portlet and click the WP & Docs
tab.

1174
WP & Docs Tab of the Project Documents Portlet of the Workspace Page (with content
repository)
Overview
Use this tab to view all project documents, including documents that have been added
using P6 Professional.
Screen Elements
WP & Docs toolbar
See WP & Docs Tab Toolbar (on page 1375).
Title field
The identifying name of the document.
Version field
The latest or most current version of the document.
Revision Date field
The date of the document's last update.
Getting Here
1) Click Projects.
2) On the Projects navigation bar, click Workspace.
3) On the Workspace page, expand the Project Documents portlet and click the WP &
Docs tab.

1175
Action Required for Document Reviews Toolbar
Overview
The following icons and screen elements appear in this toolbar; however, their availability
is subject to change based on your current selections, view settings, security permissions,
and other factors.
Screen Elements
Details
Enables you to view details about the document, including who initiated the review,
the due date for the review, as well as the status and type of review.
View
Opens the document.
Approve Document
Enables you to approve a document in review, make comments, and upload
attachments.
Reject Document
Enables you to reject a document in review, make comments, and upload
attachments.
Action Required for Workflows Toolbar
Overview
The following icons and screen elements appear in this toolbar; however, their availability
is subject to change based on your current selections, view settings, security permissions,
and other factors.
Screen Elements
View Form
Displays additional details about the currently selected human task shown on its
associated workflow form, if one is available, for you to review and make any
changes.
Reference Topics

1176
Note: For tasks with no associated form, this icon is disabled. To
perform an action on a workflow task with no associated form, log
into BPM and use its Actions menu. It is also possible to design a
solution using the P6 Integration API.
View Status
Displays a diagram representing the entire workflow instance and its current status.
Status is conveyed visually with a colorized border outlining the objects in the
diagram.
Columns
Displays a menu of the available fields you can show or hide as columns in the current
table.
Group By
Displays a menu of the available fields you can select to group related rows in a table
into hierarchical lists you can expand and collapse. For example, group by a
Category field to arrange all rows hierarchically by their Category field values. Expand
the Category A group to view its data rows, the Category B group to view its data
rows, and so on.
Choices include:
Category: this is the default setting. Workflow category (or process) groupings are
based on your custom folder structure configured in BPM.
Due Date: workflow due date groupings are arranged as follows:
Due Today: tasks due on the current day.
Due This Month: tasks due within the current month.
Due in the Future: tasks due at some point beyond the current month.
Past Due: tasks with due dates at some point in the past.
Initiator: groups the tasks by the initiator of their associated workflow instance.
None: Removes any hiearchical groupings and arranges the tasks into a flat list
sorted by the currently selected column.
Filter By
Displays options for reducing the number of values displayed in a list or table by
showing only selected values and removing or filtering out unwanted values.
Choices include:
All: View all the tasks in the Action Required table. This is the default setting. This
setting does not include every task in the workflow. In this particular context, it
includes all the tasks that are either assigned to you specifically, or to your
assigned group or role.
Assigned to Me: Filters the tasks so that only the ones assigned to you, the current
user, appear in the table.

Reference Topics
1177
Due This Week: Filters the tasks so that only the ones with a due date within seven
days of today appear in the table.
Actions Menu of the Assignments Page
Overview
The following icons and screen elements appear in this toolbar; however, their availability
is subject to change based on your current selections, view settings, security permissions,
and other factors.
Screen Elements
Save (Ctrl+S)
Saves any new or modified entries to the database.
Cancel (Esc)
Cancels any new or modified entries and reverts back to the last saved state.
View Calendar
Opens a read-only version of the resource's calendar.
Jump to next highlighted (Ctrl+Down)
Shifts focus to the next row highlighted by the Progress Spotlight.
Jump to previous highlighted (Ctrl+Up Arrow)
Shifts focus to the previous row highlighted by the Progress Spotlight.
Print (Ctrl+P)
Prints the current page, table, chart, or item.
Print Preview
Displays a temporary preview of the printed output. You can then decide to continue
printing or cancel.
Page Setup
Displays options for customizing the printed output.
Import/Export
The Import/Export menu contains the following icons:
Export to Excel
Exports all data as it appears in the current view to a Microsoft® Excel spreadsheet
(.xls) file. Customize the rows to display only the data you want to export.

1178
Actions Menu on Activities Page
Overview
All of the icons listed will appear on the Actions menu. You can determine which ones will
also appear on your Actions toolbar.
Screen Elements
Save (Ctrl+S)
Saves any new or modified entries to the database.
Cancel (Esc)
Cancels any new or modified entries and reverts back to the last saved state.
Add
The add menu contains the following options for adding new data to the activities
page:
Add Activity (Insert): Creates a new activity in the current project schedule.
Add Sibling WBS (Shift+Insert): Creates a new WBS entry at the same level in the
hierarchy as the currently selected WBS in the current project.
Add Child WBS (Ctrl+Insert): Creates a new WBS entry one level lower than the
currently selected WBS.
Add WBS from Template: Creates a new WBS that is based on an existing template
that you select.
Delete (Delete)
Deletes or removes the currently selected data items or table rows.
Caution: Your selected data is permanently deleted once you click Save.
Assign Resource
Opens a dialog box where you select a resource to assign to the selected activity.
Assign Role
Displays options for selecting a role to assign to the selected activity.
Define Baselines
Opens the Baselines dialog box which you can use to configure baselines.
Open Dependent Projects
Displays the current activity's dependent projects introduced when the activity shares
a cross-project relationship to an activity in another project.

Reference Topics
1179
View Calendar
Opens a read-only version of the project's calendar.
E-mail Activity Details
Sends an electronic message containing the details of the selected activity.
Jump to next highlighted (Ctrl+Down)
Shifts focus to the next row highlighted by the Progress Spotlight.
Jump to previous highlighted (Ctrl+Up Arrow)
Shifts focus to the previous row highlighted by the Progress Spotlight.
Link Selected Activities
Creates a relationship between the selected activities. The link may be seen on the
Gantt chart.
Run
The run menu contains the following actions:
Scheduler... (F9): Displays options for scheduling projects.
Schedule Preview: Enables or turns on the optional Schedule Preview mode. Click
this icon again to disable this mode. Not recommended for very large projects, the
Schedule Preview feature immediately updates the schedule as you work with
activities, steps, and resources. It is available only when a single project is open.
Example: If thousands of activities appeared in your Gantt chart,
P6 will allow you to add, modify, or delete them; however, by
default, it won't immediately update the results in order to
maximize performance. You could reschedule the project in order
to view the impacts of your changes and share them with other
users, but this will take time to perform. As a convenience, turn on
Schedule Preview to instantly preview any schedule changes
locally on your PC. This allows you to view them immediately, and
then decide to apply them or discard them.
Check Schedule...: Runs a report based on your configurations to check schedule
health.
Leveler... (Shift+F9): Displays options for resource and role leveling to prevent
resource demand from exceeding availability.
Apply Actuals: Updates actual and remaining values to reflect current progress on
the project as of the specified data date.
Recalculate Assignment Costs: Updates resource and role assignment cost data in
the project to reflect recent changes to one or more rates. Perform this command
after scheduling a project in case changes to dates cause assignments to span
periods with more than one rate in effect.

1180
Store Period Performance: Stores past period actuals per financial period.
Summarize Projects: Summarizes the open projects.
View Service Status
Opens the Service Status dialog box where you may review all of the services and
their current status.
Print (Ctrl+P)
Prints the current page, table, chart, or item.
Print Preview
Displays a temporary preview of the printed output. You can then decide to continue
printing or cancel.
Page Setup
Displays options for customizing the printed output.
Import/Export
The Import/Export menu contains the following options for importing and exporting
project data:
Import from Excel: Enables you to select an .xls file to import your data into the
current project. Your file must be formatted based on the import template.
Export to Excel: Exports the current item and applicable attributes to an .xls file.
Create Import Template: Generates an .xls file pre-filled with the field data
sequence required to import project data into the current project.
Send to ERP: Sends the current project data to an integrated enterprise reporting
system (if so equipped).
Actions Menu on EPS Page
Overview
The buttons on the Actions menu are identical to the buttons on the Actions toolbar.
Though the buttons on the menu are fixed, the same list of buttons can be configured on
the toolbar.
Screen Elements
Save (Ctrl+S)
Saves any new or modified entries to the database.
Cancel (Esc)
Cancels any new or modified entries and reverts back to the last saved state.

Reference Topics
1181
Add menu
The Add menu contains the following options:
Add Project: Enables you to create projects.
Add Project Template: Enables you to create templates.
Add Sibling EPS (Shift+Insert): Adds an EPS of the same hierarchical level as the
currently selected EPS to the EPS page.
Add Child EPS (Ctrl+Insert): Adds an EPS to the EPS page that is subordinate to the
currently selected EPS.
Delete (Delete)
Deletes or removes the currently selected data items or table rows.
Caution: Your selected data is permanently deleted once you click Save.
Open Project
Opens the currently selected project. Open projects display an open folder icon (
)next to their name.
Open Project Template
Opens the currently selected template.
Close All
Closes all open projects.
Define Baselines
Opens the Baselines dialog box which you can use to configure baselines.
Set Project Preferences...
Opens the Project Preferences dialog box which you can use to configure
calculations, Contract Management, defaults, general, Progress Reporter, and
summarization preferences for the currently selected project.
View Calendar
Opens a read-only version of the project's calendar.
Summarize Projects
Summarizes the currently selected project or EPS node.
Print (Ctrl+P)
Prints the current page, table, chart, or item.
Print Preview
Displays a temporary preview of the printed output. You can then decide to continue
printing or cancel.

1182
Page Setup
Displays options for customizing the printed output.
Import/Export menu
The Import/Export menu contains the following options for importing or exporting
project data:
Export to Excel: Exports the table to a Microsoft Excel file.
XML Project Import/Export...: Opens the Import/Export Project dialog box which
you can use to configure import, export, and status options for project data.
Activities Toolbar
Overview
The following icons and screen elements appear in this toolbar; however, their availability
is subject to change based on your current selections, view settings, security permissions,
and other factors.
Screen Elements
Actions menu
See Actions Menu on Activities Page (on page 1178).
Edit menu
See Edit Menu on Activities Page (on page 1253).
View menu
See View Menu on Activities Page (on page 1365).
Activity View toolbar
See Activity View Toolbar (on page 1182).
Activity View Toolbar
Overview
The Activity View Toolbar contains fixed toolbuttons for modifying the view of the activity.
Screen Elements
Gantt Chart
Opens the table, Gantt chart, and a corresponding toolbar. The Gantt chart enables
you to view a graphical display of progress. The Gantt chart is customizable.

Reference Topics
1183
Table
Opens the table which enables you to view column information for projects, WBSs,
and activities.
Activity Network
Opens the Activity Network which displays the relationships between activities.
Calendar View
Opens the Calendar View which displays activities in a calendar format.
View list
Identifies the view for the work area. Views are arranged in the following categories:
User: A view created by the user. Only the user can display, edit, or delete this
view.
Multiple Users: A view created by one user who designates other users who can
also display this view. Only the creator can edit or delete a multiple user view.
Global: A view that any user can display. Only the creator and users with the
required security privilege can edit or delete a global view.
View
The following icons are listed under the View list:
Save View
Saves the changes applied to the current view. If you navigate away from the page,
you are prompted to save the view or discard the changes you made.
Save View As
Displays options for saving the current view as a new view with a new name.
Delete View
Permanently removes the current view.
E-mail View
Sends a hyperlink of the current activity view to one or more users by electronic mail.
The link opens the view and, if the user has the proper security privileges, the same
projects that were open when the view was sent.
Customize View...
Opens the Customize View dialog box with options that vary depending on your
current page. The dialog box has a series of tabs to customize the columns, grouping,
filters, bars, Gantt chart, usage, and security access.

1184
Applying Actuals Based on the Auto Compute Actuals Method (Reference)
The following processing occurs behind the scenes when you Apply Actuals.
For all activities where the Planned Start Date field is less than the new data date,
set the Actual Start field equal to the Planned Start field.
Set Remaining Duration equal to the Early Finish field minus the new data date.
Set the Actual Duration equal to the Original Duration minus the Remaining
Duration.
Set Actual Units equal to the Unit Percent multiplied by the At Complete Units.
For all activities where the Planned Finish Date field is less than the new data date,
set the Actual Finish field equal to the Planned Finish field.
All Remaining values are set to At Complete values minus Actuals.
For all role assignments without a resource, processing will update progress on the
role assignment.
If Units and Cost are linked, then Remaining and Actual Cost will always be set to
Units multiplied by Price per unit.
If there are multiple price per units, then assignment actual cost will be calculated
using time-varying resource rates.
Note: Apply Actuals will take resource lags and resource curves
into consideration, just as the Auto Compute Actuals feature does.
If there is a curve applied to a resource, the application will apply
the actuals to the resource based on the distribution of the curve.
Example: A project's data date is June 1 and a user applies actuals with a new data
date of June 20. An activity is planned for June 18 and is estimated to last 10 days until
June 27. The activity's resource assignment has +5 days of lag (meaning it cannot start
until June 23). When the user applies actuals on June 20, the activity's status is updated;
however, because the assignment carries a resource lag beyond the new data date, it is
not updated.
Applying Actuals Based on the Timesheets Method (Reference)
Before you Apply Actuals, ensure the timesheets have been completed and approved.
In addition to updating actual units in timesheets, users can also update remaining units,
or actual and percent complete values.
The following processing occurs behind the scenes when you Apply Actuals.
For all approved timesheets where the timesheet period end date falls before the
new data date, set all applicable actual unit fields for activities and related labor
or nonlabor assignments based on approved actual hours from timesheets.
Recalculate Remaining Units, Actual Duration, and Percent Complete fields.

Reference Topics
1185
Very complex business rules dictate how each activity and/or assignment is
calculated based on each activity's duration type setting. These calculations also
take into consideration updates a user might make to the actual units, actual and
remaining units, or actual and percent complete values on their timesheets.
Note: If there are timesheet actuals for a resource and the resource
is changed to use Auto Compute Actuals, the actuals will be
recalculated based on the auto compute actual method. Original
timesheet actuals will remain in the database.
Assignments Toolbar
Overview
The Assignments page provides a powerful set of menus and toolbuttons, collectively
referred to as the Assignments toolbar, described below. The Actions, Edit, and View
menus are fixed by the system; however, the toolbuttons available in the toolbar are
customizable and are automatically enabled or disabled based on choices you make as
you work.
Screen Elements
Actions Menu
See Actions Menu of the Assignments Page (on page 1177).
Edit Menu
See Edit Menu of the Assignments Page (on page 1252).
View Menu
See View Menu of the Assignments Page (on page 1362).
Default toolbuttons:
Save (Ctrl+S)
Saves any new or modified entries to the database.
Cancel (Esc)
Cancels any new or modified entries and reverts back to the last saved state.
Export to Excel
Exports all data as it appears in the current view to a Microsoft® Excel spreadsheet
(.xls) file. Customize the rows to display only the data you want to export.

1186
Copy (Ctrl+C)
Copies the selected item and applicable attributes to the temporary clipboard,
leaving the original in its current location. The copied item and applicable attributes
can then be pasted into another supported location.
Fill Down (Ctrl+I)
In a selected range of cells in a single table column, inserts the value in the first or top
cell into the remaining cells down the column.
Find (Ctrl+F)
Displays options for finding matching entries based on specific search words or values
within a particular column in a table.
Columns
Displays options for showing and hiding the columns (fields) that appear in the current
table or page.
Grouping
Displays options for re-arranging a list of values by grouping them into a hierarchy and
sorting.
Filters
The filters menu contains the following options for filtering data:
Show matches for : Select all applied filters or any applied filters to determine
which matches are displayed.
Filters: Displays a dialog box with configurable options for applying filters to the
current assignments view. See Customize Filters Dialog Box of the Assignments
Page (on page 681).
Add New Filter: Displays a dialog box with configurable options for adding a
new filter to the current assignments view. See Create Filter Dialog Box of the
Assignments Page (on page 652).
Clear Filters: Clears all set filters from the current assignments view.
Gantt Chart Options
Enables you to configure how the Gantt chart and its bars display. (Available only in
the Gantt chart view.)
Usage Options
Displays the Customize Usage Options dialog box. Use this dialog box to select which
columns are displayed as well as modify options for displaying time distributed values
and determining whether to calculate the average for units and costs.

Reference Topics
1187
Expand All (Alt+Plus)
In a hierarchical list or page of child items grouped by parent items, expands the list to
show all parent and child items.
Collapse All (Alt+Minus)
In a hierarchical list, arranges entries so that only the parent items are shown and child
entries are hidden.
Full Screen Mode (F11)
Expands the current work area so it fills the entire display. Non-essential controls such
as navigation menus are hidden from this mode. When in full screen mode, click this
toolbutton again to restore the normal viewing mode.
Assignments View Toolbar
See Assignments View Toolbar (on page 1188).
Assignments Toolbar of the Activities Page
Overview
The following icons and screen elements appear in this toolbar; however, their availability is subject to
change based on your current selections, view settings, security permissions, and other factors.
Screen Elements
Apply Changes (Ctrl+S)
Saves any changes to the detail window.
Assign Resource and Save (Ctrl+Alt+R)
Opens a window where you select a resource to assign to the selected activity.
Assign Role and Save (Ctrl+Alt+O)
Opens a window where you select a role to assign to the selected activity.
Request Resources (Ctrl+Alt+Q)
Opens a window where you can request resources based on your search criteria.
Delete (Delete)
Deletes or removes the currently selected data items or table rows.
Caution: Your selected data is permanently deleted once you click Save.
Customize Columns
Displays choices for customizing the columns (fields) that appear on the selected
screen. (Available only in the Gantt chart and Table views.)

1188
Activity selector
Cycles through the available activities and determines which data display in the
detail window. Click or to change which activity and its corresponding data
are displayed.
Assignments View Toolbar
Overview
The following icons and screen elements appear in this toolbar; however, their availability
is subject to change based on your current selections, view settings, security permissions,
and other factors.
Screen Elements
Gantt Chart
Opens the Gantt chart on the right side of the page. The Gantt chart is a graphical
display of the start and end dates for the resource assignments in your view.
Table
Displays the assigned resource and corresponding role with information regarding the
associated project and assignments in a spreadsheet format. When this option is
selected, the Gantt chart is not displayed.
Usage Spreadsheet
Displays the usage spreadsheet, which allows you to view live unit and cost spreads
for the resource or role assignment.
View list
Identifies the view for the work area. Views are arranged in the following categories:
User: A view created by the user. Only the user can display, edit, or delete this
view.
Multiple Users: A view created by one user who designates other users who can
also display this view. Only the creator can edit or delete a multiple user view.
Global: A view that any user can display. Only the creator and users with the
required security privilege can edit or delete a global view.
View
The following icons are listed under the View list:
Save View
Saves the changes applied to the current view. If you navigate away from the page,
you are prompted to save the view or discard the changes you made.

Reference Topics
1189
Save View As
Displays options for saving the current view as a new view with a new name.
Delete View
Permanently removes the current view.
Customize View...
Opens the Customize View dialog box with options that vary depending on your
current page. The dialog box has a series of tabs to customize the columns, grouping,
filters, bars, Gantt chart, usage, and security access.
Available Columns of the Activities Page
Overview
The following is a comprehensive list of all the columns/fields available to add to the
table on the Activities page.
Screen Elements
Activity Count category
Activity Count field
The number of activities that are currently in progress.
Activity Resource Assignment Count field
The number of resources assigned to the activity, WBS, or project.
Actual Completed Activities field
The number of activities that have an actual finish in the project.
Actual In-Progress Activities field
The number of activities that are currently in progress.
Actual Not Started Activities field
The number of activities that are currently not started.
BL Project Completed Activities field
The number of completed activities in the project baseline.
BL Project In-Progress Activities field
The number of in-progress activities in the project baseline.
BL Project Not Started Activities field
The number of activities not started in the project baseline.

1190
BL1 Completed Activities field
The number of activities that should be completed according to the primary baseline.
BL1 In-Progress Activities field
The number of activities that should be in progress according to the primary baseline.
BL1 Not Started Activities field
The number of activities that should be not started according to the primary baseline.
Activity Steps category
Step Count field
The number of steps assigned to the activity, WBS, or project.
Steps Completed field
The number of steps that are marked as complete.
Steps In Progress field
The number of steps currently in progress.
Steps Not Started field
The number of steps that are not yet started.
Costs category
Actual Expense Cost field
The actual costs for all project expenses associated with the activity.
Actual Labor Cost field
The actual costs for all labor resources assigned to the activity.
If no resources are assigned, calculated as the Activity Actual Labor Units multiplied
by Project Default Price divided by Time.
Actual Material Cost field
The actual units for all material resources assigned to the activity.
Actual Nonlabor Cost field
The actual costs for all nonlabor resources assigned to the activity.
If no resources are assigned, calculated as the Activity Actual Nonlabor Units
multiplied by Project Default Price divided by Time.
Actual This Period Labor Cost field
The costs for all labor resources assigned to the activity incurred during this financial
period.

Reference Topics
1191
If period performance is stored, the calculation is Actual Labor Cost minus the sum of
the stored Actual This Period Labor Cost fields for all previous periods.
If the period performance is not stored, Actual This Period Labor Cost is the same as
Actual Labor Cost.
Actual This Period Material Cost field
The material costs incurred during this financial period.
If period performance is stored, the calculation is Actual Material Cost minus the sum
of the stored Actual This Period Material Cost fields for all previous periods.
If the period performance is not stored, Actual This Period Material Cost is the same as
Actual Material Cost.
Actual This Period Nonlabor Cost field
The nonlabor costs incurred during this financial period.
If period performance is stored, the calculation is Actual Nonlabor Cost minus the sum
of the stored Actual This Period Nonlabor Cost fields for all previous periods.
If the period performance is not stored, Actual This Period Nonlabor Cost is the same
as Actual Nonlabor Cost.
Actual Total Cost field
The sum of the actual labor cost, the actual nonlabor cost and the actual expense
cost.
Calculated as Actual Labor Cost plus Actual Nonlabor Cost plus Actual Expense Cost
as of the project data date.
At Completion Expense Cost field
The sum of the actual plus remaining costs for all expenses associated with the
activity.
Calculated as actual Expense Cost plus Remaining Expense cost.
At Completion Labor Cost field
The sum of the actual plus remaining costs for all labor resources assigned to the
activity.
If the activity is not started, this equals the planned labor costs. If the activity is
completed, this equals the actual labor costs.
Calculated as Actual Labor Cost plus Remaining Labor Cost.
At Completion Material Cost field
The sum of all actual and remaining costs for material resources.
At Completion Nonlabor Cost field
The sum of the actual plus remaining costs for all nonlabor resources assigned to the
activity.

1192
It is the same as the planned nonlabor costs if the activity is not started, and the
actual nonlabor costs once the activity is completed.
Calculated as Actual Nonlabor Cost plus Remaining Nonlabor Cost.
At Completion Total Cost field
The total cost at completion for the activity including labor resources, nonlabor
resources, material resources and project expenses.
BL Project Expense Cost field
The project expenses associated with the activity in the project baseline.
BL Project Labor Cost field
The cost for all labor resources assigned to the activity in the project baseline.
BL Project Material Cost field
The budgeted (at completion) cost for all material resources assigned to the activity
in the project baseline.
BL Project Nonlabor Cost field
The cost for all nonlabor resources assigned to the activity in the project baseline.
BL Project Total Cost field
The total cost for the activity in the project baseline.
BL1 Expense Cost field
The cost for all project expenses associated with the activity in the primary baseline.
BL1 Labor Cost field
The cost for all labor resources assigned to the activity in the primary baseline.
BL1 Material Cost field
The cost for all material resources assigned to the activity in the primary baseline.
BL1 Nonlabor Cost field
The cost for all nonlabor resources assigned ot the activity in the primary baseline.
BL1 Total Cost field
The total cost for the activity in the primary baseline.
Planned Expense Cost field
The planned costs for all project expenses associated with the activity.
Planned Labor Cost field
The planned costs for all labor resources assigned to the activity.

Reference Topics
1193
If no resources are assigned, calculated as Activity Planned Labor Units multiplied by
Project Default Price divided by Time.
Planned Material Cost field
The planned cost for all material resources assigned to the activity.
Planned Nonlabor Cost field
The planned costs for all nonlabor resources assigned to the activity.
If no resources are assigned, calculated as Activity Planned Nonlabor Units multiplied
by Project Default Price divided by Time.
Planned Total Cost field
The planned total cost for the activity, including labor resources, nonlabor resources,
material resources, and project expenses.
Calculated as Planned Labor Cost plus Planned Nonlabor Cost plus Planned Material
Cost plus Planned Expense Cost.
Remaining Expense Cost field
The remaining costs for all project expenses associated with the activity.
Remaining Labor Cost field
The remaining costs for all labor resources assigned to the activity.
If no resources are assigned, calculated as the Activity Remaining Labor Units
multiplied by Project Default Price divided by Time.
Remaining Material Cost field
The sum of all material resource remaining costs.
Remaining Nonlabor Cost field
The remaining costs for all nonlabor resources assigned to the activity.
If no resources are assigned, calculated as Activity Remaining Nonlabor Units
multiplied by Project Default Price divided by Time.
Remaining Total Cost field
The remaining total cost for the activity, including labor resources, nonlabor
resources, material resources, and project expenses.
Calculated as Remaining Labor Costs plus Remaining Nonlabor Costs plus Remaining
Material Costs plus Remaining Expense Costs.
Variance BL Project - Expense Cost field
The difference between the baseline project expense cost and the at completion
expense cost.
Calculated as Baseline Project Expense Cost minus At Completion Expense Cost.

1194
Variance BL Project - Labor Cost field
The difference between the baseline project labor cost and at completion labor cost.
Calculated as Baseline Project Labor Cost minus At Completion Labor Cost.
Variance BL Project - Material Cost field
The difference between baseline project material cost and at completion material
cost.
Calculated as Baseline Project Material Cost minus At Completion Material Cost.
Variance BL Project - Nonlabor Cost field
The difference between the baseline project nonlabor cost and at completion
nonlabor cost.
Calculated as Baseline Project Nonlabor Cost minus At Completion Nonlabor Cost.
Variance BL Project - Total Cost field
The difference between the baseline project total cost and the at completion total
cost.
Calculated as Baseline Project Total Cost minus At Completion Total Cost.
Variance BL1 - Expense Cost field
The difference between primary baseline expense cost and at completion expense
cost.
Calculated as Primary Baseline Expense Cost minus At Completion Expense Cost.
Variance BL1 - Labor Cost field
The difference between primary baseline labor cost and the at completion labor
cost.
Calculated as BL1 Labor Cost minus At Completion Labor Cost.
Variance BL1 - Material Cost field
The difference between primary baseline material cost and the at completion
material cost.
Calculated as BL1 Material Cost minus At Completion Material Cost.
Variance BL1 - Nonlabor Cost field
The difference between the primary baseline nonlabor cost and the at completion
nonlabor cost.
Calculated as BL1 Nonlabor Cost minus At Completion Nonlabor Cost.
Variance BL1 - Total Cost field
The difference between the primary baseline and the at completion total cost.
Calculated as BL1 minus At Completion Total Cost.

Reference Topics
1195
Dates category
Actual Finish field
The latest actual finish date of all activities in the project.
Actual Start field
The earliest actual start date of all activities in the project.
Anticipated Finish field
The anticipated finish date of WBS, project, or EPS elements.
If there are no children WBS, project, or EPS elements, the anticipated finish date will
be the finish date displayed in the columns.
Anticipated Start field
The anticipated start date of WBS, project, or EPS elements.
If there are no children WBS, project, or EPS elements, the anticipated start date will
be the start date displayed in the columns.
BL Project Finish field
The current latest finish date of all activities in the project baseline.
BL Project Start field
The current earliest start date of all activities in the project baseline.
BL1 Finish field
The current finish date of the activity in the primary baseline.
Set to the activity planned finish date while the activity is not started, the remaining
finish date while the activity is in progress, and the actual finish date once the activity
is completed.
BL1 Start field
The current start date of the activity in the primary baseline.
Set to the planned start date until the activity is started, then set to the actual start
date.
Early Finish field
The earliest possible date the activity can finish.
The date is calculated based on network logic, schedule constraints, and resource
availability. Early finish dates can change as the project progresses and changes are
made to the project management plan.
Early Start field
The earliest possible date the remaining work for the activity can begin.

1196
The date is calculated based on network logic, schedule constraints, and resource
availability. Early start dates can change as the project progresses and as changes
are made to the project management plan.
Expected Finish field
The date the activity is expected to finish according to the progress made on the
activity's work products.
External Early Start field
The date value that determines the early start date for imported activities with
external constraints lost (relations to/from external projects that do not exist in the
database).
This field is the relationship early finish date when the lost relationship type is Finish to
Start or Start to Start. When the relationship type is Start to Finish or Finish to Finish, this
field is calculated as Relationship Early Finish Date minus Remaining Duration of the
successor.
External Late Finish field
The date value that determines the Late Finish Date for imported activities with
external constraints lost (to/from external projects that do not exist in the database).
This field is the relationship late finish date when the lost relationship type is Finish to
Start or Finish to Finish. When the relationship type is Start to Start or Start to Finish, this
field is calculated as Relationship Late Start plus Remaining Duration of the
predecessor.
Finish field
The planned finish date for an activity not yet finished or the actual finish date for an
activity that has already finished.
Late Finish field
The latest possible date the activity must finish without delaying the project finish
date.
Calculated by the project scheduler based on network logic, schedule constraints,
and resource availability.
Late Start field
The latest possible date the remaining work for the activity must begin without
delaying the project finish date.
This date is calculated by the project scheduler based on network logic, schedule
constraints, and resource availability.
Planned Finish field
The date the activity is scheduled to finish.

Reference Topics
1197
This date is calculated by the project scheduler but can be updated manually by the
project manager. This date is not changed by the project scheduler after the activity
has started.
Planned Start field
The proposed start date of the project.
This date the activity is scheduled to begin is calculated by the project scheduler but
can be updated manually by the project manager. This date is not changed by the
project scheduler after the activity has been started.
Primary Constraint Date field
The constraint date for the activity, if the activity has a constraint. The activity's
constraint type determines whether this is a start date or finish date.
Activity constraints are used by the project scheduler.
Remaining Early Finish field
The date the remaining work for the activity is scheduled to finish.
Remaining Early Start field
The date the remaining work for the activity is scheduled to begin.
Remaining Late Finish field
The remaining late finish date calculated by the scheduler.
Remaining Late Start field
The remaining late start date calculated by the scheduler.
Resume Date field
The date when a suspended task or resource dependent activity is resumed. The
resume date must be later than the suspend date and earlier than the actual finish
date.
The suspend/resume period behaves like a non-work time on the activity calendar or
resource calendar for task and resource dependent activities.
Secondary Constraint Date field
The date associated with the secondary constraint, if the activity has a secondary
constraint assigned.
This field is only available if a primary constraint is already entered.
Start field
The planned start date for an activity not yet started or the actual start date for an
activity that has already started.

1198
Suspend Date field
The date work has stopped on a given activity for an unknown, but temporary, period
of time. For example, an event might force an activity to be interrupted or resource
constraints might put an activity on hold.
The suspend date must be later than the actual start date, which the activity must
have. The progress of the activity can be resumed by setting the resume date. The
suspend/resume period behaves like a non-work time on the activity calendar or
resource calendar for task and resource dependent activities.
Durations category
Actual Duration field
The total working time from the activity actual start date to the actual finish date for
completed activities, or the current data date for in-progress activities.
The actual working time is computed using the activity's calendar.
At Completion Duration field
The total working time from the activity's current start date to the current finish date.
BL Project Duration field
The duration for the activity in the project baseline. The duration is the total working
time from the activity current start date to the current finish date.
Calculated as Actual Duration plus Remaining Duration.
The total working time is calculated using the activity's calendar.
BL1 Duration field
The duration for the activity in the primary baseline. The duration is the total working
time from the activity current start date to the current finish date.
It is the same as the actual duration plus the remaining duration.
The total working time is calculated using the activity's calendar.
Free Float field
The amount of time the activity can be delayed before delaying the start date of any
successor activity.
Planned Duration field
The total working time from the activity planned start date to the planned finish date.
The planned working time is calculated using the activity's calendar.
Remaining Duration field
The total working time from the activity remaining start date to the remaining finish
date.

Reference Topics
1199
The remaining working time is calculated using the activity's calendar. Before the
activity is started, the remaining duration is the same as the planned duration. After
the activity is completed the remaining duration is zero.
Remaining Float field
The amount of time remaining by which the activity can be delayed before delaying
the project finish date.
Calculates as Late Finish minus Remaining Finish. If the remaining finish is the same as
the early finish (in general, when the activity is not started), then the remaining float is
the same as the total float.
Total Float field
The amount of time the activity can be delayed before delaying the project finish
date.
Calculated as Late Start minus Early Start or as Late Finish minus Early Finish.
Variance BL Project - Duration field
The duration between the activity's baseline project duration and the at completion
duration.
Calculated as Baseline Project Duration minus At Completion Duration.
Variance BL Project - Finish Date field
The duration between the current project finish date in the baseline project finish
date.
Variance BL Project - Start Date field
The duration between the current project start date and the baseline project start
date.
Variance BL1 - Duration field
The duration between the activity's primary baseline duration and the at complete
duration.
Variance BL1 - Finish Date field
The duration between the current project finish date and the primary baseline finish
date.
Variance BL1 - Start Date field
The duration between the current project start date and the primary baseline start
date.

1200
Earned Value category
Accounting Variance field
The difference between the planned value of work scheduled and the actual cost of
work performed.
A negative value indicates that actual costs have exceeded the scheduled costs.
Calculated as Planned Value minus Actual Cost.
Accounting Variance - Labor Units field
The difference between the planned value of work scheduled and the actual work
performed.
A negative value indicates that actual costs have exceeded the scheduled costs.
Calculated as Planned Value Labor Units minus Actual Units.
Budget At Completion field
The planned total cost through activity completion.
Calculated as Planned Labor Cost plus Planned Nonlabor Cost plus Planned Expense
Cost.
Budget At Completion - Labor Units field
The baseline labor units.
Cost Performance Index field
A measure of cost efficiency on a project.
A value less than 1 indicates that the actual cost has exceeded the planned value.
Calculated as Earned Value divided by Actual Cost.
Cost Performance Index - Labor Units field
A measure of cost efficiency on a project.
A value less than 1 indicates that the actual cost has exceeded the planned value.
Calculated as Earned Value divided by Actual Cost.
Cost Variance field
A measure of cost performance on a project.
A negative value indicates that actual costs have exceeded the value of work
performed.
Calculated as Earned Value minus Actual Cost.
Cost Variance - Labor Units field
The difference between the earned value of labor units and the actual cost of labor
units.
A negative value indicates that actual costs have exceeded the value of work
performed.

Reference Topics
1201
Calculated as Earned Value Planned Units minus Actual Units.
Cost Variance Index field
The ratio of the cost variance and the earned value of work performed.
Calculated as Cost Variance divided by Earned Value.
Cost Variance Index - Labor Units field
The ratio of the cost variance labor units and the earned value of work performed.
Calculated as Cost Variance Labor Units divided by Earned Value Labor Units.
Earned Value Cost field
The portion of the project baseline total cost of the activity that is actually completed
as of the project data date.
Budget at completion is calculated from the project baseline.
Calculated as Budget At Completion multiplied by Performance Percent Complete.
The method for computing performance percent complete depends on the Earned
Value technique selected for the activity's WBS.
Earned Value Labor Units field
The portion of the project baseline labor units that is actually completed as of the
project data date.
Baseline labor units are taken from the project baseline.
Calculated as Project Baseline Labor Units multiplied by Performance Performance
Complete. The method for computing performance percent complete depends on
the Earned Value technique selected for the activity's WBS.
Estimate At Completion - Labor Units field
The estimated labor units at completion of the activity.
Calculated as Actual Labor Units plus Estimate to Complete Labor Units. Estimate to
complete labor units is calculated based off of the earned value setting on the WBS.
Estimate At Completion Cost field
The expected total cost of a schedule activity, a work breakdown structure
component, or the project when the defined scope of work will be completed.
Calculated as Actual Cost plus Estimate to Complete Cost. The method for
calculating estimate to complete depends on the earned value technique selected
for the activity's WBS.
Estimate To Complete field
The estimated cost to complete the activity.

1202
Calculated as either the Remaining Total Cost for the activity, or as Performance
Factor multiplied by (Budget At Completion minus Earned Value), depending on the
earned-value technique selected for the activity's WBS. Budget at completion is
calculated from the project baseline.
Estimate To Complete Labor Units field
The estimated quantity to complete the activity.
Calculated as either the Remaining Total Units for the activity or as Performance
Factor multiplied by (BL Labor Units minus Earned Value) depending on the
earned-value technique selected for the activity's WBS.
Planned Value Cost field
The portion of the project baseline total cost of the activity that is scheduled to be
completed as of the project data date.
Also known as the work scheduled to be performed for the activity. The schedule
percent complete specifies how much of the activity's project baseline duration has
been completed so far. Budget at completion is calculated from the project baseline
Calculated as Budget At Completion multiplied by Schedule Percent Complete.
Planned Value Labor Units field
The product of the budget at completion and the schedule percent complete.
The schedule percent complete specifies how much of the activity's baseline
duration has been completed so far. Budget at completion is calculated from the
primary baseline.
Calculated as Budget At Completion multiplied by Schedule Percent Complete.
Schedule Performance Index field
The ratio of the earned value of work performed and the work scheduled to be
performed.
A value less than 1 indicates that less work was actually performed than was
scheduled.
Calculated Earned Value divided by Planned Value.
Schedule Performance Index - Labor Units field
The ratio of the earned value labor units and the planned value labor units.
Calculated as Earned Value Labor Units divided by Planned Value Labor Units.
Schedule Variance field
The measure of schedule performance on a project.
A negative value indicates that less work was actually performed than was
scheduled.
Calculated as Earned Value minus Planned Value.

Reference Topics
1203
Schedule Variance - Labor Units field
The difference between the earned value of work performed and the work
scheduled to be performed.
Calculated as Earned Value Labor Units minus Planned Value Labor Units.
Schedule Variance Index field
The ratio of the schedule variance and the work scheduled to be performed.
Calculated as Schedule Variance divided by Planned Value.
Schedule Variance Index - Labor Units field
The ratio of schedule variance labor units and the planned value labor units.
Calculated as the Schedule Variance Labor Units divided by Planned Value Labor
Units.
To Complete Performance Index field
The ratio of the remaining work to the remaining funds.
Calculated as (Budget At Completion minus Earned Value) divided by (Estimate At
Completion minus Actual Units).
Variance At Completion field
The difference between the project baseline total cost and the current estimate of
total cost.
A negative value indicates an estimated cost overrun. Budget At Completion is
calculated from the current project baseline.
Calculated as Budget At Completion minus Estimate At Completion.
Variance At Completion - Labor Units field
The difference between the project baseline planned total labor units and the
estimate at completion labor units.
Calculated as Project Baseline Planned Total Labor Units minus Estimate At
Completion Labor Units.
General category
Activity ID field
The unique identifying code for the activity.
Activity Leveling Priority field
Determines the priority of the activity when performing resource leveling.
Activity Name field
The name of the activity. The activity name does not have to be unique.

1204
Activity Status field
The current status of the activity.
Activity Type field
The type of activity.
Task Dependent: Activities are scheduled using the activity's calendar rather than
the calendars of the assigned resources. Choose task dependent when you want
to control the duration of the activity yourself (that is, no resources are assigned),
or when one or more resources assigned to the same activity can work according
to the same calendar. The activity is scheduled according to the activity’s
calendar, not the resource calendars. For example, you might have an activity to
cure concrete; you know how long the task takes and the addition of resources
won’t complete the task any earlier. You would designate this activity as task
dependent.
Resource Dependent: Activities are scheduled using the calendars of the assigned
resources. This type is used when several resources are assigned to the activity, but
they might work separately. Choose resource dependent when you want to
schedule each resource according to his/her own time schedule, or resource
calendar, not the activity calendar. The assigned resource availability determines
the start and finish dates of the activity. Typically, you use this type when multiple
resources assigned to the same activity can work independently, or when
availability can affect the activity’s duration. For example, an activity that requires
an Inspector might be delayed if that resource is assigned to multiple projects or is
on vacation.
Start or Finish Milestone: Milestone activities are zero-duration without resources,
marking a significant project event. Choose start milestone or finish milestone to
indicate that the activity marks the beginning or end of a major stage in the
project. Milestones have zero duration. They can have expenses assigned to
them, but not resources. In an office building addition project, examples of
milestones might include Project Definition Complete, Structure Complete, or End
Bidding Process.
Level of Effort: Activities have a duration that is determined by its dependent
activities and are typically administration type. Choose level of effort to indicate
that the activity’s duration depends on its predecessor and/or successor activities.
A level of effort activity is usually one that is ongoing, such as clerical work,
change management, or project management tasks. For example, site cleanup
could be considered a level of effort activity; it occurs repeatedly and is
dependent on the completion of a phase.

Reference Topics
1205
WBS Summary: Activities that are used to roll up date, duration, and percent
complete values for a group of activities that share a common WBS code level.
Choose WBS Summary to indicate that the activity is a summary-level WBS activity.
A WBS Summary activity represents a group of activities that share a common WBS
level. The summary-level WBS activity enables roll-ups of dates for the activity
group. The duration of a WBS Summary activity extends from the start of the
earliest activity in a group to the finish of the latest activity. WBS codes control
which activities are part of a WBS Summary activity; P6 incorporates any activities
that share a component of the WBS Summary activity's WBS code into the WBS
Summary activity. For example, all activities whose WBS codes begin with A (A.1,
A.1.1, A.1.2, etc.) can be part of one WBS Summary activity whose WBS code is A.
At a lower level, all activities whose WBS codes start with A.1 (A.1.1, A.1.2, etc.)
can be part of a WBS Summary activity whose WBS code is A.1.
Added By field
The name of the user who added the activity to the project.
Added Date field
The date the activity was inserted into the project.
Auto Compute Actuals option
Determines whether the activity actual and remaining units, and start and finish dates
for the resource are calculated automatically using the planned dates, planned
units, and the activity's schedule percent complete.
If this option is selected, the actual/remaining units and actual dates are
automatically updated when project actuals are applied. This assumes that all work
by the resource proceeds according to plan.
This option is not available if the Uses Timesheets option is selected.
Calendar field
The calendar assigned to the activity.
Cost Account IDs field
The identifying codes of the cost accounts assigned to the activity.
Cost Account Names field
The name(s) of the cost accounts assigned to the activity.
Critical option
Determines whether the activity is critical.
An activity is critical when its total float is below the critical duration specified for the
project. Delaying critical activities will delay the finish date of the project.
Duration Type field
The duration type of the activity.
1206
Fixed Units/Time: The resource units per time are constant when the activity
duration or units are changed. This type is used when an activity has fixed
resources with fixed productivity output per time period.
Fixed Duration and Units/Time: The activity duration is constant as the units or
resource units per time are changed. This type is used when the activity is to be
completed within a fixed time period regardless of the resources assigned.
Fixed Units: The activity units are constant when the duration or resource units per
time are changed. This type is used when the total amount of work is fixed, and
increasing the resources can decrease the activity duration.
Est Weight field
The estimated weight for the activity, used for top-down estimation.
Top-down estimation weights are used to calculate the proportion of units that each
activity receives in relation to the other activities within the same WBS. Top-down
estimation distributes estimated units in a top-down manner to activities using the WBS
hierarchy.
Last Modified By field
The user who last modified the activity.
Last Modified Date field
The date the activity was last modified.
Longest Path option
Determines critical activities base on the sequence of driving activities that determine
the project end date.
Owner field
The resource responsible for the activity.
Primary Constraint field
The primary constraint type for the selected activity.
Primary Resource field
The person primarily responsible for performing or overseeing work related to a
specific activity. The first resource you assign to an activity is automatically identified
as the activity's primary resource.
Project ID field
The unique identifier of the project.
Project Name field
The name of the associated project.

Reference Topics
1207
Project Status field
The current status of the activity, WBS, or project.
Secondary Constraint field
The secondary constraint type for the selected activity.
WBS field
The name of the WBS element.
WBS Code field
The unique identifier of the WBS for the associated activity.
Lists category
Expenses field
The expenses assigned to the activity.
Notebook Topics field
The name of the notebook topics assigned to the activity.
Predecessors field
The predecessor activities assigned to the activity.
Resource IDs field
The identifiers of the resources assigned to the activity.
Resource Names field
The resources assigned to the activity.
Role IDs field
The identifiers of the roles assigned to the activity.
Roles field
The name of the roles assigned to the resources for the activity.
Steps field
The names of the steps assigned to the activity.
Successors field
The successor activities assigned to the activity.
Multiple Float Paths category
Float Path field
The integer representing the critical path this activity is on.

1208
Value 1 is the most critical path, value 2 is the second most critical path.
Float Path Order field
The integer representing the order in which this object was found on one of the critical
paths.
Percent Complete category
Activity % Complete field
The percent of the activity that has been completed.
Calculated as (Original or Planned Duration minus Remaining Duration) divided by
Original or Planned Duration.
If the activity's percent complete type is set to Physical, the application will not
calculate a value for the Activity % Complete field.
Units % Complete equals (Actual Labor Units plus Actual Non-labor Units) divided by
(Actual Labor Units plus Actual Non-labor Units plus Remaining Labor Units plus
Remaining Non-labor Units).
Cost % Complete field
The percent complete of costs for all labor resources, nonlabor resources, and
expenses for the activity.
Calculated as Actual Total Cost divided by At Completion Total Cost multiplied by
100.
Cost % of Planned field
The percent complete of planned costs for all labor resources, nonlabor resources,
and expenses for the activity.
Calculated as Actual Total Cost divided by BL Planned Total Cost multiplied by 100.
The value can exceed 100.
Duration % Complete field
The activity actual duration percent of planned.
The baseline planned duration is the activity's at complete duration from the primary
baseline.
Calculated as Actual Duration divided by Baseline Planned Duration multiplied by
100. The value can exceed 100.
Duration % Of Planned field
The activity actual duration percent of planned.
The baseline duration is the activity's at completion duration from the project
baseline.
Calculated as Actual Duration divided by BL Duration multiplied by 100. The value can
exceed 100.

Reference Topics
1209
Expense Cost % Complete field
The percent complete of cost for all expenses associated with the activity.
Calculated as Actual Expense Cost divided by At Completion Expense Cost multiplied
by 100. Always in the range 0 to 100.
Labor Cost % Complete field
The percent complete of costs for all labor resources assigned to the activity.
Calculated as Actual Labor Cost divided by At Completion Labor Cost multiplied by
100. Always in the range 0 to 100.
Labor Units % Complete field
The percent complete of units for all labor resources for the activity.
Calculated Actual Labor Units divided by At Completion Labor Units multiplied by 100.
Always in the range 0 to 100.
Material Cost % Complete field
The percent complete of costs for all material resources assigned to the activity.
Calculated as Actual Nonlabor Cost divided by At Completion Nonlabor Cost
multiplied by 100. Always in the range 0 to 100.
Nonlabor Cost % Complete field
The percent complete of costs for all nonlabor resources assigned to the activity.
Calculated as Actual Nonlabor Cost divided by At Completion Nonlabor Cost
multiplied by 100. Always in the range 0 to 100.
Nonlabor Units % Complete field
The percent complete of units for all nonlabor resources for the activity.
Calculated as Actual Nonlabor Units divided by At Completion Nonlabor Units
multiplied by 100. Always in the range 0 to 100.
Percent Complete Type list
Determines the way in which the application calculates the percent complete for the
activity.
This default activity percent complete type will be applied to all new activities added
to a project. If you change this setting for an existing project that has activities, the
percent complete type of those existing activities will not be changed.
Performance % Complete field
The performance percent complete specifies what percentage of the activity's
planned worth has been earned so far.

1210
The performance percent complete is used to calculate earned value. It can be
based on the activity percent complete, on the 0/100 rule, on the 50/50 rule,
depending on the technique for computing earned-value percent complete for the
activity's WBS.
Physical % Complete field
The physical percent complete, which can either be user entered or calculated from
the activity's weighted steps.
Schedule % Complete field
The activity schedule percent complete, which specifies how much of the activity's
project baseline duration has been completed so far.
If the data date is earlier than the baseline start, the schedule percent complete is 0.
If the data date is later than the baseline finish, the schedule percent complete is 100.
The schedule percent complete indicates how much of the activity duration should
be currently completed, relative to the selected project baseline.
Calculated based on where the current data date falls relative to the activity's
project baseline start and finish dates.
Units % Complete field
The percent complete of units for all labor and nonlabor resources assigned to the
activity.
Calculated as Actual Units divided by At Completion Units multiplied by 100. Always in
the range 0 to 100.
Timesheet Feedback category
Feedback from Resource field
The notes received from the resource.
New Feedback option
Determines whether there is new information about this activity which has not yet
been reviewed. If the option is not selected, then there is no new feedback or the
feedback has already been reviewed.
Review Finish Date field
The finish date of the activity as proposed by the primary resource using timesheets,
while the activity is in for review state.
If the project manager approves the activity completion, the review finish is copied to
the actual finish.
Review Status field
The activity review status.

Reference Topics
1211
Primary resources can set the status to For Review when they believe the activity is
completed, but a primary resource is not allowed to mark activities as completed.
Units category
Actual Labor Units field
The actual units for all labor resources assigned to the activity.
Actual Nonlabor Units field
The actual units for all nonlabor resources assigned to the activity.
Actual This Period Labor Units field
The number of labor units used during this financial period.
If period performance is stored, the calculation is Actual Labor Units minus the sum of
the stored Actual This Period Labor Units fields for all previous periods.
If the period performance is not stored, Actual This Period Labor Units is the same as
Actual Labor Units.
Actual This Period Nonlabor Units field
The nonlabor units used during this financial period.
If period performance is stored, the calculation is Actual Nonlabor Units minus the sum
of the stored Actual This Period Nonlabor Units fields for all previous periods.
If the period performance is not stored, Actual This Period Nonlabor Units is the same
as Actual Nonlabor Units.
At Completion Labor Units field
The sum of the actual plus remaining units for all labor resources assigned to the
activity.
It is the same as the planned labor units if the activity is not started, and the actual
labor units once the activity is completed.
Calculated as Actual Labor Units plus Remaining Labor Units.
At Completion Nonlabor Units field
The sum of the actual plus remaining units for all nonlabor resources assigned to the
activity.
It is the same as the planned nonlabor units if the activity is not started, and the actual
nonlabor units once the activity is completed.
Calculated as Actual Nonlabor Units plus Remaining Nonlabor Units.
BL Project Labor Units field
The units for all labor resources assigned to the activity in the project baseline.
BL Project Nonlabor Units field
The units for all nonlabor resources assigned to the activity in the project baseline.

1212
BL1 Labor Units field
The units for all labor resources assigned to the activity in the primary baseline.
Calculated as Baseline Actual Labor Units plus Baseline Remaining Labor Units.
BL1 Nonlabor Units field
The units for all nonlabor resources assigned to the activity in the primary baseline.
Planned Labor Units field
The planned units for all labor resources assigned to the activities in the project.
Planned Nonlabor Units field
The planned units for all nonlabor resources assigned to the activities in the project.
Remaining Labor Units field
The remaining units for all labor resources assigned to the activities.
The remaining units reflects the work remaining to be done for the WBS.
Remaining Nonlabor Units field
The remaining units for all nonlabor resources assigned to the activities.
The remaining units reflects the work remaining to be done for the WBS.
Variance BL Project - Labor Units field
The difference between baseline labor units and at completion labor units.
Calculated as Baseline Labor Units minus At Completion Labor Units.
Variance BL Project - Nonlabor Units field
The difference between the baseline nonlabor units and the at completion non labor
units.
Calculated as Baseline Nonlabor Units minus At Completion Nonlabor Units.
Variance BL1 - Labor Units field
The difference between primary baseline labor units and the at completion labor
units.
Calculated as BL1 Labor Units minus At Completion Labor Units.
Variance BL1 - Nonlabor Units field
The difference between the primary baseline nonlabor units and the at completion
nonlabor units.
Calculated as BL1 Nonlabor Units minus At Completion Nonlabor Units.
Global Activity Codes category
This category contains global activity codes listed in alphabetical order.

Reference Topics
1213
EPS Activity Codes category
This category contains EPS activity codes listed in alphabetical order.
Project Activity Codes category
This category contains project activity codes listed in alphabetical order.
User-Defined category
This category contains user-defined columns listed in alphabetical order.
Available Columns of the Assignments Page
Overview
The following is a comprehensive list of all the columns/fields available to add to the
table on the Assignments page.
Screen Elements
Costs category
Actual Cost field
The actual non-overtime plus overtime cost for the resource assignment on the
activity.
Calculated as Actual Regular Cost plus Actual Overtime Cost.
Actual Overtime Cost field
The actual overtime cost for the resource assignment on the activity.
Calculated as Actual Overtime Units multiplied by Cost Per Time multiplied by
Overtime Factor.
Actual Regular Cost field
The actual non-overtime cost for the resource assignment on the activity.
Calculated as Actual Regular Units multiplied by Cost Per Time.
Actual This Period Cost field
The labor, nonlabor, and material costs incurred during this financial period.
If period performance is stored, the calculation is Actual Cost minus the sum of the
stored Actual This Period Cost fields for all previous periods.
If the period performance is not stored, Actual This Period Cost is the same as Actual
Cost.
At Completion Cost field
The sum of the actual costs plus remaining costs for the resource assignment on the
activity.

1214
Calculated as Actual Costs plus Remaining Costs.
Planned Cost field
The planned cost for the resource assignment on the activity.
Calculated as Planned Units multiplied by Price Per Time.
Remaining Cost field
The remaining cost for the resource assignment on the activity.
Calculated as Remaining Units multiplied by Cost/Time.
Staffed Remaining Cost field
The remaining cost for resource assignments that have a filled role.
Unstaffed Remaining Cost field
The remaining cost for resource assignments that do not have a filled role.
Dates category
Activity Finish field
The finish date of the activity to which the assignment belongs. This is the planned
finish if the activity has not started, the remaining finish if the activity is in progress, or
the actual finish if the activity has completed.
Activity Start field
The start date of the activity to which the assignment belongs.This is the planned start
date if the activity has not started, the remaining start date if the activity is in progress,
or the actual start date if the activity has started.
Actual Finish field
The date the resource actually finished working on the activity.
Actual Start field
The date the resource actually started working on the activity.
Finish field
The planned finish date for a resource assignment not yet finished or the actual finish
date for a resource assignment that has already finished.
Planned Finish field
The date the resource is scheduled to finish working on the activity.
This date is calculated by the project scheduler but can be updated manually by the
project manager. This date is not changed by the project scheduler after the activity
has been started. This is the finish date that Timesheets users follow and schedule
variance is measured against.

Reference Topics
1215
Planned Start field
The date the resource is scheduled to begin working on the activity.
This date is calculated by the project scheduler but can be updated manually by the
project manager. This date is not changed by the project scheduler after the activity
has been started. This is the start date that Timesheets users follow and schedule
variance is measured against.
Remaining Early Finish field
The date the remaining work for the resource assignment is scheduled to finish.
Remaining Early Start field
The date the remaining work for the resource assignment is scheduled to begin.
Remaining Late Finish field
The remaining late finish date calculated by the scheduler.
Remaining Late Start field
The remaining late start date calculated by the scheduler.
Start field
The planned start date for an assignment not yet started or the actual start date for
an assignment that has already started.
Durations category
Actual Duration field
The total working time from the assignment actual start date to the actual finish date
for completed assignments. Or the current data date for in-progress assignments.
At Complete Duration field
The total working time from the activity's current start date to the current finish date.
The current start date is the planned start date until the activity is started, then it is the
actual start date. The current finish date is the activity planned finish date while the
activity is not started, the remaining finish date while the activity is in progress, and the
actual finish date once the activity is completed. The total working time is calculated
using the activity's calendar.
Planned Duration field
The planned working time for the resource assignment on the activity, from the
resource's planned start date to the planned finish date.
Planned Lag field
The planned time lag between the activity's planned start date and the resource's
planned start date on the activity.

1216
If the resource is planned to start work when the activity is planned to start, the
planned lag is zero.
Remaining Duration field
The remaining working time for the resource assignment on the activity, from the
resource's remaining start date to the remaining finish date.
The remaining working time is calculated using the calendar determined by the
activity type. Resource dependent activities use the resource's calendar, other
activity types use the activity's calendar. Before the activity is started, the remaining
duration is the same as the original duration. After the activity is completed, the
remaining duration is zero.
Remaining Lag field
The time lag between the activity's remaining start date and the resource's remaining
start date on the activity.
If the resource's remaining work starts on the activity's remaining start date, the lag is
zero. Before the activity is started, the remaining lag is the same as the planned lag.
General category
Activity ID field
The unique identifying code for the activity.
Activity Name field
The name of the activity. The activity name does not have to be unique.
Activity Status field
The current status of the activity.
Activity Type list
Determines how duration and schedule dates are calculated for an activity:
Task Dependent: If resources should be scheduled based on the activity's
calendar.
Resource Dependent: If resources should be scheduled based on their assigned
calendars.
Level of Effort: For an ongoing activity whose duration depends on other activities.
The duration of a Level of Effort activity is calculated based on the schedule dates
from its predecessors and successors.
Start or Finish Milestone: If an activity marks the beginning or end of a major
project phase.
WBS Summary: For an activity with a particular WBS code.
Assigned By field
The user who assigned the resource to the assignment.

Reference Topics
1217
Assigned Date field
The date the task was assigned to you, your group, or your role.
Calculate Costs from Units option
Determines whether by default any new assignments for this resource will have its
costs recalculated whenever any quantity changes occur. This setting can be
overwritten on a per project basis.
Calendar field
The name of the calendar selected for the resource.
Cost Account field
The cost account associated with the resource assignment.
Curve field
The resource's units and costs distributed over the duration of an activity.
A curve can only be assigned to activities that have a duration type of Fixed Duration
and Units or Fixed Duration and Units/Time.
A manual curve type indicates that the assignment's future period resource
distribution was manually entered in the Resource Usage Spreadsheet of P6
Professional. If you select a different curve type, the manually-entered distribution is
deleted, and the units and costs for the assignment are redistributed according to the
curve you select. Be sure this is the appropriate course of action before replacing a
manual curve with another curve.
Drive Activity Dates option
Determines whether new resource/role assignments drive activity dates by default.
Duration Type field
The duration type of the assignment.
Fixed Units/Time: The resource units per time are constant when the assignment
duration or units are changed. This type is used when an assignment has fixed
resources with fixed productivity output per time period.
Fixed Duration and Units/Time: The assignment duration is constant as the units or
resource units per time are changed. This type is used when the assignment is to
be completed within a fixed time period regardless of the resources assigned.
Fixed Units: The assignment units are constant when the duration or resource units
per time are changed. This type is used when the total amount of work is fixed,
and increasing the resources can decrease the assignment duration.
Overtime Factor field
The overtime factor used to compute the overtime price for the resource assignment
on this activity.

1218
When the resource is assigned to the activity, the resource's overtime factor is copied
to the assignment. The assignment overtime factor is refreshed from the resource
value when resource prices are synchronized for the project.
Calculated as Standard Price multiplied by Overtime Factor.
Planned Units/Time field
The planned units per time at which the resource is to perform work on this activity.
For example, a person assigned full time would perform 8 hours of work per day. A
department of five people might perform at 5 days per day.
Price/Unit field
The price per time for the resource on this activity.
This price is used to calculate the resource's cost for the activity. When the resource is
assigned to the activity, the resource's price is copied to the assignment based on the
effective date of the price and the activity start date. The assignment price is
refreshed whenever resource prices are synchronized for the project.
Primary Resource field
The person primarily responsible for performing or overseeing work related to a
specific assignment.
Proficiency field
The resource's proficiency at performing this role.
The values are 1 - Master, 2 - Expert, 3 - Skilled, 4 - Proficient, and 5 - Inexperienced. If
you do not have the proper privilege, you cannot access this field.
Project ID field
The unique identifier of the associated project.
Project Name field
The name of the associated project.
Rate Source field
The value that indicates which price/unit will be used to calculate costs for the
assignment, such as Resource, Role, and Override.
When a resource and only a resource is assigned to an activity, the rate source will
automatically equal Resource. When a role and only a role is assigned to an activity,
the rate source will automatically equal Role. When both a resource and role are
assigned to the activity, the rate source can be either Resource or Role determined
by the Rate Source Preference. In any case, the Override value allows you to specify
any other price/unit.

Reference Topics
1219
Rate Type field
Determines which of the five user-defined resource and role rate types will be used to
calculate the cost for the resource assignment.
Remaining Units/Time field
The units per time required to complete the activity.
Resource Type field
The resource type. Valid values are:
Labor: Indicates that the selected resource performs labor, measured in units of time.
Nonlabor: Indicates that the resource is a nonlabor resource, such as equipment,
measured in units of time.
Material: Indicates that the resource has a unit of measure other than time. You can
select a unit of measure for the material resource.
Search Criteria field
The resource request used as a search template to search for a qualified resource.
WBS ID field
The unique identifier of the WBS for the activity.
WBS Name field
The name of the WBS element.
WBS Path field
The WBS path if one was applied. The WBS path is a group of identical WBS levels used
across multiple projects. The WBS path lists activities grouped by WBS levels, without
displaying the project level node.
Percent Complete category
Pending % Complete field
The estimate of the percentage of the resource's units of work completed on this
activity.
The pending percent complete is entered by each resource using timesheets. This
value is used to compute the resource's remaining units for the activity when project
actuals are applied. The project manager specifies whether resources update their
percent complete or remaining units for each project.
Units % Complete field
The percent complete of units for the resource assignment on the activity.
Always in the range 0 to 100.
Calculated as Actual Units divided by At Completion Units multiplied by 100.

1220
Resource category
Active option
Determines whether the resource is currently active. A marked option indicates the
resource is active.
Non-active resources might have left the organization, but are not deleted from the
system since they might have actual hours.
Auto Compute Actuals option
Determines whether the activity actual and remaining units, and start and finish dates
for the resource are calculated automatically using the planned dates, planned
units, and the activity's schedule percent complete.
If this option is selected, the actual/remaining units and actual dates are
automatically updated when project actuals are applied. This assumes that all work
by the resource proceeds according to plan.
This option is not available if the Uses Timesheets option is selected.
Default Units/Time field
The default units/time for resource assignments in projects, which is shown as either a
percentage or units/duration depending on your settings in My Preferences. If you
change the default setting, existing resource assignments are not affected. The
default setting only applies to new resource assignments.
E-mail Address field
The e-mail address for the resource.
Employee ID field
The resource identifier within the organization, typically the employee number or
social security number.
Max Resource Units/Time field
The maximum work units per time this resource can perform on all their assigned
activities.
For example, a person working full time could perform 8 hours of work per day. A
department of five people might perform at 5 days per day.
Max Role Units/Time field
The maximum work units per time this role can perform on assigned activities.
Office Phone field
The office phone number for the resource.
Other Phone field
The alternate phone numbers for the resource.

Reference Topics
1221
Overtime Allowed option
Determines whether the resource is allowed to log overtime hours.
Resource ID field
The unique identifier of the resource.
Resource ID Name field
The identifying code and name of the resource.
Resource Name field
The name of the resource.
Role ID field
The unique identifier for the role the resource is performing on this activity.
You can assign a resource to the same activity more than once, performing different
roles. The project manager controls whether the same resource can be assigned to
an activity more than once.
Role ID Name field
The identifying code and name of the role.
Role Name field
The name of the role assigned to the resource.
Unit of Measure field
The unit of measure this material resource uses.
Units category
Actual Overtime Units field
The actual overtime units worked by the resource on this activity.
This value is calculated from timesheets when project actuals are applied or can be
entered directly by the project manager.
Actual Regular Units field
The actual non-overtime units worked by the resource on this activity.
This value is calculated from timesheets when project actuals are applied or can be
entered directly by the project manager.
Actual This Period Units field
The labor, nonlabor, and material units used during this financial period.
If period performance is stored, the calculation is Actual Units minus the sum of the
stored Actual This Period Units fields for all previous periods.

1222
If the period performance is not stored, Actual This Period Units is the same as Actual
Units.
Actual Units field
The actual units on this resource assignment during a financial period.
At Completion Units field
The sum of the actual units and remaining units for the resource assignment on the
activity.
Calculated as Actual Units plus Remaining Units.
Pend Remaining Units field
The estimate of the resource's remaining units on this activity.
The pending remaining units is entered by each resource using timesheets. This value
is copied to the resource's remaining units for the activity when project actuals are
applied. The project manager specifies whether resources update their percent
complete or remaining units for each project.
Planned Units field
The planned units of work for the resource assignment on the activity.
Remaining Units field
The remaining units of work to be performed by this resource on this activity.
Calculated as Budgeted or Planned Units minus Actual Units.
Staffed Remaining Units field
The remaining units for resource assignments that have filled a role.
Unstaffed Remaining Units field
The remaining units for resource assignments that have not filled a role.
User-Defined Code and Field categories
Global Activity Codes category
This category contains global activity codes listed in alphabetical order.
Resource Codes category
This category contains resource codes listed in alphabetical order.
User-Defined category
This category contains user-defined columns listed in alphabetical order.
Resource User-Defined category
This category contains user-defined columns for resources listed in alphabetical order.

Reference Topics
1223
Project Codes category
This category contains project codes listed in alphabetical order.
Available Columns of the EPS Page
Overview
The following is a comprehensive list of all the columns/fields available to add to the
table on the EPS page.
Screen Elements
Baseline category
Baseline Data Date field
The data date of the project baseline for the selected project.
Project Baseline field
The project baseline for the selected project.
Budget category
Annual Discount Rate field
The interest rate associated with the cost of an investment from your commercial
bank or another funding source. Valid values are 0 to 100. This rate is used to
calculate Total Spending Plan Present Value and Total Benefit Plan Present Value.
For example, an annual growth rate of an investment such as 4.75% can be used as
an annual discount rate. This rate is used when a future value is assumed and you are
trying to find the required net present value.
Current Budget field
The sum of the original budget plus the approved and pending budgets from the
budget change log.
Current Variance field
The difference between the current budget and the total spending plan. This value is
not rolled up.
Calculated as Current Budget minus Total Spending Plan.
Distributed Current Budget field
The current budget values from one level lower.
Independent ETC Labor Units field
The user-entered ETC total labor.

1224
Independent ETC Total Cost field
The user-entered ETC total cost.
Net Present Value field
The difference between the present value (PV) of the future cash flows from an
investment and its investment cost. Present value of the expected cash flows is
computed by discounting them at the required rate of return or discount rate. Positive
net present value (NPV) is an indicator of projects that should be pursued.
Calculated as Total Benefit Plan (PV) minus Total Spending Plan (PV).
Original Budget field
The original budget for the project.
Payback Period field
The length of time required to elapse before net profits have recovered the initial and
periodic costs of an investment.
Proposed Budget field
The sum of the original budget and approved and pending budgets from the budget
change log.
Calculated as Original Budget plus Approved and Pending Budgets from the budget
change log.
Return on Investment field
A calculation of the expected return or benefit over and above the investment costs
of a project or portfolio, expressed as a percentage.
Calculated as the Net Present Value divided by the Total Spending Plan Present
Value.
For example, a project is expected to cost 1.0 million dollars with a total benefit of 1.2
million dollars. It's NPV is $200,000. The return on investment is 20%.
Total Funding field
The total amount of funding contributed to the project by your funding sources.
Unallocated Budget field
The difference between the total current and distributed current budget.
Calculated as Total Current Budget minus Distributed Current Budget.
Cost category
Actual Expense Cost field
The actual costs for all project expenses associated with the EPS.

Reference Topics
1225
Actual Labor Cost field
The actual cost for all labor resources assigned to the activity.
Actual Material Cost field
The actual units for all material resources assigned to the activity.
Actual Nonlabor Cost field
The actual units for all nonlabor resources assigned to the activity.
Actual This Period Labor Cost field
The labor costs incurred during this financial period.
If period performance is stored, the calculation is Actual Labor Cost minus the sum of
the stored Actual This Period Labor Cost fields for all previous periods.
If the period performance is not stored, Actual This Period Labor Cost is the same as
Actual Labor Cost.
Actual This Period Material Cost field
The material costs incurred during this financial period.
If period performance is stored, the calculation is Actual Material Cost minus the sum
of the stored Actual This Period Material Cost fields for all previous periods.
If the period performance is not stored, Actual This Period Material Cost is the same as
Actual Material Cost.
Actual This Period Nonlabor Cost field
The nonlabor costs incurred during this financial period.
If period performance is stored, the calculation is Actual Nonlabor Cost minus the sum
of the stored Actual This Period Nonlabor Cost fields for all previous periods.
If the period performance is not stored, Actual This Period Nonlabor Cost is the same
as Actual Nonlabor Cost.
Actual Total Cost field
The sum of the actual labor cost, the actual nonlabor cost and the actual expense
cost.
Calculated as Actual Labor Cost plus Actual Nonlabor Cost plus Actual Expense Cost
as of the project data date.
At Completion Expense Cost field
The sum of the actual plus remaining cost for all project expenses associated with the
cost account.
Calculated as Actual Expense Cost plus Remaining Expense Cost.

1226
At Completion Labor Cost field
The sum of the actual plus remaining costs for all labor resources assigned to the
activity.
It is the same as the planned labor costs if the activity is not started, and the actual
labor costs once the activity is completed.
Calculated as Actual Labor Cost plus Remaining Labor Cost.
At Completion Material Cost field
The material cost at completion. It is the sum of the actual plus remaining costs for all
material resources assigned to the activity.
It is the same as the planned material costs if the activity is not started, and the actual
material costs once the activity is completed.
Calculated as Actual Material Cost plus Remaining Material Cost.
At Completion Nonlabor Cost field
The nonlabor cost at completion. It is the sum of the actual plus remaining costs for all
nonlabor resources assigned to the activity.
It is the same as the planned nonlabor costs if the activity is not started, and the
actual nonlabor costs once the activity is completed.
Calculated as Actual Nonlabor Cost plus Remaining Nonlabor Cost.
At Completion Total Cost field
The total cost at completion for the project including labor resources, nonlabor
resources, material resources and project expenses.
BL Project Expense Cost field
The project expenses associated with the project in the project baseline.
BL Project Labor Cost field
The cost for all labor resources assigned to the project in the project baseline.
BL Project Material Cost field
The budgeted (at completion) cost for all material resources assigned to the project
in the project baseline.
BL Project Nonlabor Cost field
The cost for all nonlabor resources assigned to the project in the project baseline.
BL Project Total Cost field
The total cost for the project in the project baseline.
Planned Expense Cost field
The planned costs for all expenses associated with the project or EPS.

Reference Topics
1227
Planned Labor Cost field
The planned costs for all labor expenses associated with the project or EPS.
Planned Material Cost field
The planned cost for all expenses associated with the project or EPS.
Planned Non Labor Cost field
The planned costs for all nonlabor expenses associated with the project or EPS.
Planned Total Cost field
The planned cost for all expenses associated with the project or EPS.
Remaining Expense Cost field
The remaining costs for all project expenses associated with the activities in the EPS.
Remaining Labor Cost field
The remaining costs for all labor resources assigned to the activities.
The remaining cost reflects the cost remaining for the EPS.
Remaining Material Cost field
The remaining material costs for all project expenses associated with the activities in
the EPS.
Remaining Nonlabor Cost field
The remaining nonlabor costs for all project expenses associated with the activities in
the EPS.
Remaining Total Cost field
The remaining total cost for the project, including labor resources, nonlabor resources,
and project expenses.
Calculated as Remaining Labor Costs plus Remaining Nonlabor Costs plus Remaining
Expense Costs.
Variance - Expense Cost field
The difference between project baseline expense cost and the at completion
expense cost.
Calculated as Project Baseline Expense Cost minus At Completion Expense Cost.
Variance - Labor Cost field
The difference between the project baseline labor cost and the at completion labor
cost.
Calculated as BL Labor Cost minus At Completion Labor Cost.

1228
Variance - Material Cost field
The difference between the project baseline planned material cost and the at
completion material cost.
Calculated as Project Baseline Planned Material Cost minus At Completion Material
Cost.
Variance - Nonlabor Cost field
The difference between the project baseline labor cost and at completion labor cost.
Calculated as BL Nonlabor Cost minus At Completion Nonlabor Cost.
Variance - Total Cost field
The difference between the project baseline total cost and at completion total cost.
Calculated as BL Total Cost minus At Completion Total Cost.
Dates category
Actual Finish field
The latest actual finish date of all activities in the EPS.
Actual Start field
The earliest actual start date of all activities in the EPS.
Anticipated Finish field
The anticipated finish date of the EPS.
If the EPS has no children, the anticipated finish date will be the finish date displayed
in the columns.
Anticipated Start field
The anticipated start date of the EPS.
If the EPS has no children, the anticipated start date will be the start date displayed in
the columns.
BL Finish field
The current latest finish date of all activities in the project baseline.
BL Start field
The current earliest start date of all activities in the project baseline.
Data Date field
The date used as the starting point to calculated the schedule.
The project status is up to date as of the data date. The data date is modified when
project actuals are applied.

Reference Topics
1229
Finish field
The date that the remaining work for the project element is scheduled to finish.
This date is computed by the Project Scheduler. Before the project starts, the
remaining finish date is the same as the planned finish date.
Forecast Finish Date field
The alternate end date to be used by the scheduler.
The user sets the alternate end date by dragging the project bar in the Gantt chart
while manually leveling the resource profile in a resource analysis layout.
Forecast Start Date field
The alternate start date to be used by the scheduler.
The user sets the alternate start date by dragging the project bar in the Gantt chart
while manually leveling the resource profile in a resource analysis layout.
Last Apply Actuals Date field
The last date apply actuals was run for this project.
Must Finish By field
The date constraint placed on the project end date.
Planned Finish Date field
The latest planned finish date for the project.
Planned Start Date field
The earliest planned start date of the project.
Project Forecast Start field
The alternate start date to be used by the scheduler.
The user sets the alternate start date by dragging the project bar in the Gantt chart
while manually leveling the resource profile in a resource analysis layout.
Project Planned Start field
The planned start date of the project.
Used by the project scheduler.
Scheduled Finish field
The calculated latest early finish date, which is based on the schedule most recently
generated for the project.
Start field
The date that the remaining work for the project element is scheduled to begin.

1230
This date is computed by the project scheduler. Before the project starts, the
remaining start date is the same as the planned start date.
Durations category
Actual Duration field
The total working time from the activity actual start date to the actual finish date for
completed activities, or the current data date for in-progress activities.
The actual working time is computed using the activity's calendar.
At Completion Duration field
The duration at completion.
BL Duration field
The planned duration for the activity in the primary baseline. Planned duration is the
total working time from the activity current start date to the current finish date.
It is the same as the actual duration plus the remaining duration.
The total working time is calculated using the activity's calendar.
Planned Duration field
The total working time from the project planned start date to the planned finish date.
Remaining Duration field
The total working time from the EPS remaining start date to the remaining finish date.
Total Float field
The amount of time the activity can be delayed before delaying the project finish
date.
Calculated as Late Start minus Early Start or as Late Finish minus Early Finish.
Variance - Duration field
The duration between the activity's baseline duration and the at complete duration.
Calculated as Baseline Duration minus At Completion Duration.
Variance - Finish Date field
The duration between the finish date in the current project and the baseline finish
date.
Calculated as Finish Date minus Baseline Finish Date.
Variance - Start Date field
The duration between the start date in the current project and the baseline start
date.
Calculated as Start Date minus Baseline Start Date.
Reference Topics
1231
Earned Value category
Accounting Variance field
The difference between the planned value of work scheduled and the actual cost of
work performed.
A negative value indicates that actual costs have exceeded the scheduled costs.
Calculated as Planned Value minus Actual Cost.
Accounting Variance - Labor Units field
The difference between the planned value of work scheduled and the actual work
performed.
A negative value indicates that actual costs have exceeded the scheduled costs.
Calculated as Planned Value Labor Units minus Actual Units.
Actual Cost field
The actual cost for the project expense.
Budget At Completion field
The planned total cost through activity completion.
Calculated as Planned Labor Cost plus Planned Nonlabor Cost plus Planned Expense
Cost.
Budget At Completion - Labor Units field
The baseline labor units.
Cost Performance Index field
A measure of cost efficiency on a project.
A value less than 1 indicates that the actual cost has exceeded the planned value.
Calculated as Earned Value divided by Actual Cost.
Cost Performance Index - Labor Units field
A measure of cost efficiency on a project.
A value less than 1 indicates that the actual cost has exceeded the planned value.
Calculated as Earned Value divided by Actual Cost.
Cost Variance field
A measure of cost performance on a project.
A negative value indicates that the actual cost has exceeded the planned value.
Calculated as Earned Value minus Actual Cost.
Cost Variance - Labor Units field
The difference between the earned value labor cost and the actual value labor cost.
Calculated as Earned Value Labor Cost minus Actual Value Labor Cost.

1232
Cost Variance Index field
The ratio of the cost variance and the earned value.
Calculated as Cost Variance divided by Earned Value.
Cost Variance Index - Labor Units field
The ratio of the cost variance labor units and the earned value labor units.
Calculated as Cost Variance Labor Units divided by Earned Value Labor Units.
Earned Value Cost field
The portion of the project baseline total cost of the project that is actually completed
as of the project data date.
Earned Value Labor Units field
The ratio of the schedule variance labor units and the planned value labor units.
Calculated as Schedule Variance Labor Units divided by Planned Value Labor Units.
Estimate At Completion - Labor Units field
The estimated labor units at completion of the activity.
Calculated as Actual Labor Units plus Estimate to Complete Labor Units. Estimate to
complete labor units is calculated based off of the Earned Value setting on the EPS.
Estimate At Completion Cost field
The expected total cost of a schedule activity, a work breakdown structure
component, or the project when the defined scope of work will be completed.
Calculated as Actual Cost plus Estimate to Complete Cost. The method for
calculating estimate to complete depends on the earned value technique selected
for the activity's WBS.
Estimate To Complete field
The estimated cost to complete the project.
Calculated as Remaining Total Cost for the activity or the Performance Factor
multiplied by (Budget At Completion minus Earned Value), depending on the Earned
Value technique selected for the activity's WBS (calculated from the primary
baseline).
Estimate To Complete Labor Units field
The estimated quantity to complete the project.
Calculated as either the Remaining Total Units for the activity, or as Performance
Factor multiplied by (Baseline Planned Labor Units minus Planned Quantity of Work
Performed), depending on the Earned Value Technique selected for the activity's
WBS.

Reference Topics
1233
Planned Value Cost field
The portion of the project baseline total cost of the project that is scheduled to be
completed as of the project data date.
Planned Value Labor Units field
The portion of the baseline labor units that is scheduled to be completed as of the
project data date.
The schedule percent complete specifies how much of the activity's baseline
duration has been completed so far. The baseline labor units is taken from the current
baseline.
Calculated as Baseline Labor Units multiplied by Schedule Percent Complete.
Schedule Performance Index field
The earned value divided by the planned value.
A value less than 1 indicates that less work was actually performed than was
scheduled.
Schedule Performance Index - Labor Units field
The ratio of the earned value of labor units and the planned value of labor units.
Calculated as Earned Value Labor Units divided by Planned Value Labor Units.
Schedule Variance field
The measure of schedule performance on a project.
A negative value indicates that less work was actually performed than was
scheduled.
Calculated as Earned Value minus Planned Value.
Schedule Variance - Labor Units field
The difference between the earned value of work performed and the work
scheduled to be performed.
Calculated as Earned Value Labor Units minus Planned Value Labor Units.
Schedule Variance Index field
The ratio of schedule variance labor units and the planned value labor units.
Calculated as the Schedule Variance Labor Units divided by Planned Value Labor
Units.
Schedule Variance Index - Labor Units field
The ratio of schedule variance labor units and the planned value labor units.
Calculated as the Schedule Variance Labor Units divided by Planned Value Labor
Units.

1234
To Complete Performance Index field
The ratio of remaining work to the funds remaining.
Calculated as (Budget at Completion minus Earned Value) divided by (Estimate at
Completion minus Actual Cost).
Variance At Completion field
The difference between the project baseline total cost and the current estimate of
total cost.
A negative value indicates an estimated cost overrun. Budget At Completion is
calculated from the current project baseline.
Calculated as Budget At Completion minus Estimate At Completion.
Variance At Completion - Labor Units field
The difference between the project baseline planned total labor units and the
estimate at completion labor units.
Calculated as Project Baseline Planned Total Labor Units minus Estimate At
Completion Labor Units.
General category
Added By field
The name of the user who added the project to the EPS.
Checked Out By field
The name of the user who checked out the project. If the project is not checked out,
this field is blank.
Date Added field
The date the project was added to the EPS.
Date Checked Out field
The date and time the user checked out the project. If the project is not checked out,
this field is blank.
EPS ID field
The unique identifying code of the EPS.
EPS Name field
The name of the EPS to which the project belongs.
Integrated Project field
The type of system integration, if any, in place at your organization. Data within this
project will be shared with the integrated solution you choose. For example, ERP. The
default value is <none>.

Reference Topics
1235
Portfolios field
The portfolios associated with the project.
Project ID field
The unique identifier of the project.
Project Leveling Priority field
The priority of each project during leveling.
You can enter a value from 1 to 100, with 1 being the highest priority.
Project Name field
The name of the project.
Project Owner field
The resource designated as responsible for the project.
The project owner designation provides a user with viewing access for the project.
Project Score field
The project score, based on all project code types assigned to this project.
Project Status field
The current status of the activity, WBS, or project.
Project Website URL field
The project Web site URL, which is the Web address of the project's website.
Responsible Manager field
The project’s assigned organizational breakdown structure (OBS) element.
A responsible manager is required for each project and each level of the EPS.
Risk Level field
The risk level for each project. Double-click to display the list and choose from Very
High, High, Medium, Low, or Very Low.
Risk Scoring Matrix field
The name of the risk scoring matrix assigned to the project.
Strategic Priority field
The project’s priority in the strategic plan.
This number ranges from 1 to 10,000 with a default of 500. Use of the priority value,
such as whether to place higher priority at the lower end of the scale, toward the
endpoint 1, or at the higher end, toward 10,000, is at the discretion of the user.

1236
Type field
The type of element, whether project or EPS.
Website Root Directory field
The root directory for storing project Web site files before they are published to the
Web server.
Number of Activities category
Actual Completed Activities field
The number of activities that have an actual finish in the EPS.
Actual In-Progress Activities field
The number of activities that are currently in progress.
Actual Not-Started Activities field
The number of activities that are currently not started.
BL Completed Activities field
The number of completed activities in the project baseline.
BL In-Progress Activities field
The number of in-progress activities in the project baseline.
BL Not-Started Activities field
The number of activities not started in the project baseline.
Total Activities field
The number of activities in the project.
Percent Complete category
Cost % Complete field
The percent complete of costs for the resource assignments in the EPS.
Calculated as Actual Units divided by At Complete Units multiplied by 100. Always in
the range 0 to 100.
Cost % of Planned field
The activity actual cost percent of planned.
Calculated as Actual Total Cost divided by Baseline Total Cost multiplied by 100. The
value can exceed 100. The baseline total cost is the activity's at completion cost from
the current baseline.
Duration % Complete field
The activity actual duration percent of planned.

Reference Topics
1237
Calculated as Actual Duration divided by At Completion Duration multiplied by 100.
Duration % Of Planned field
The summary actual duration percent of planned of all activities under this EPS.
The baseline duration is the activity's at complete duration from the current baseline.
Calculated as Actual Duration divided by Baseline Duration multiplied by 100. The
value can exceed 100.
Expense Cost % Complete field
The percent complete of cost for all expenses associated with the EPS.
Calculated as Actual Expense Cost divided by At Complete Expense Cost multiplied
by 100, and it is always in the range of 0 to 100.
Labor Cost % Complete field
The percent complete of cost for all labor resources assigned to the EPS.
Calculated as Actual Labor Cost divided by At Complete Labor Cost multiplied by
100, and it is always in the range of 0 to 100.
Labor Units % Complete field
The percent complete of units for all labor resources for the EPS.
Calculated as Actual Labor Units divided by At Completion Labor Units multiplied 100.
Always in the range 0 to 100.
Material Cost % Complete field
The percent complete of cost for all material resources assigned to the EPS.
Calculated as Actual Material Cost divided by At Complete Material Cost multiplied
by 100, and it is always in the range of 0 to 100.
Nonlabor Cost % Complete field
The percent complete of cost for all non-labor resources assigned to the EPS.
Calculated as Actual Nonlabor Cost divided by At Complete Nonlabor Cost
multiplied by 100. It is always in the range of 0 to 100.
Nonlabor Units % Complete field
The percent complete of units for all nonlabor resources for the EPS.
Calculated as Actual Nonlabor Cost divided by At Completion Nonlabor Cost
multiplied by 100. Always in the range 0 to 100.
Performance % Complete field
The percent complete of performance for all labor resources, nonlabor resources,
and expenses.
Calculated as Earned Value divided by Budget At Completion multiplied by 100.
Always in the range 0 to 100.

1238
Schedule % Complete field
The measure that indicates how much of the EPS baseline duration has been
completed so far.
If the data date is earlier than the baseline start, the schedule percent complete is 0.
If the data date is later than the Baseline finish, the schedule percent complete is 100.
The schedule percent complete indicates how much of the EPS duration should be
currently completed, relative to the selected baseline.
Calculated based on where the current data date falls between the activity's
baseline start and finish dates.
Units % Complete field
The percent complete of units for the resource assignments in the EPS.
Always in the range 0 to 100.
Calculated as Actual Units divided by At Complete Units multiplied by 100.
Preferences category
Activity % Complete from Steps option
Determines if the activity percent complete is calculated from activity steps or from
manual input. If the option is selected, the activity percent complete will be
calculated based on activity steps. This option is clear by default.
Activity ID Prefix field
The single or combination of letters and/or numbers to act as the Activity ID Prefix. This
field can contain 1 to 20 characters.
Activity ID Suffix field
The single or combination of letters and/or numbers to set as the Activity ID Suffix. The
value must be a number between 1 and 999,999.
Activity Type list
Determines how duration and schedule dates are calculated for an activity:
Task Dependent: If resources should be scheduled based on the activity's
calendar.
Resource Dependent: If resources should be scheduled based on their assigned
calendars.
Level of Effort: For an ongoing activity whose duration depends on other activities.
The duration of a Level of Effort activity is calculated based on the schedule dates
from its predecessors and successors.
Start or Finish Milestone: If an activity marks the beginning or end of a major
project phase.
WBS Summary: For an activity with a particular WBS code.

Reference Topics
1239
Allow Duplicate Resource Assignments option
Determines whether resources can be assigned to an activity more than once.
Allow Negative Actual Units field
Determines if negative actual units can be entered on activities via timesheets in the
project.
Baseline Option field
The baseline the project uses. This field is disabled if the project is checked out.
Calendar field
The calendar assigned to the project.
Cost Account field
The cost account associated with the project.
Drive Activity Dates by Default option
Determines whether assignments will drive activity dates.
Duration Type list
Determines whether the schedule, resource availability, or costs are most important
when updating activities. The duration type applies only when you have resources
assigned to the activity. Choose a duration type based on which factor is most
important (least flexible) in planning your project.
Fiscal year list
Determines on which month the fiscal year begins.
Increment field
The number to act as the increment. The number must be a value between 1 and
99,999.
Increment Activity ID based on selected activity option
Determines if the activity numbering is based on the selected activity of on the
project's default settings.
Link Actual and Period Actual Units and Cost option
Determines whether to recalculate all actual and period actual unit and cost values
using the actual values to date based on the financial period values.
Link Percent Complete with Actuals option
Determines whether the actual units and cost values are recalculated when duration
percent complete is updated.

1240
Link Planned and At Completion option
Determines whether to recalculate all of the planned unit and cost values using the
remaining costs and units for activities that have not started.
Percent Complete Type list
Determines the way in which the application calculates the percent complete for the
activity.
This default activity percent complete type will be applied to all new activities added
to a project. If you change this setting for an existing project that has activities, the
percent complete type of those existing activities will not be changed.
Price/Unit field
The non-overtime price per unit of time for the project.
Primary Can Complete Activity option
Determines whether primary resources can mark activities as completed.
Rate Type field
The price/unit used to calculate costs for the project.
There can be up to five rate types, with each rate type reflecting a different
price/unit. Rate types are defined in P6.
Recalculate Units from Cost option
Determines whether units are updated with costs.
Resources Can Assign Themselves option
Determines whether resources can assign themselves to activities.
Resources Can Complete Assignments option
Determines whether resources can mark assignments as completed.
Resources Can View Inactive Projects option
Determines whether resources can view projects that are not currently active.
Resources Status Activities Using field
Determines how P6 Progress Reporter users enter their status for assignments.
WBS Code Separator field
The character used for separating code fields for the cost account tree.
This is also the WBS code separator for new projects by default.
When Activity Progress Removed field
Determines what the application will do if activity progress is removed: reset planned
duration and units or reset remaining duration and units.

Reference Topics
1241
When Updating Units or Costs field
Determines what the application will do if activity progress is removed: add actual to
remaining or subtract actual from at completion.
Summary category
Contains Summary Data option
Determines whether the project has been summarized. If the option is selected, the
project has been summarized.
Enable Summarization option
Determines whether a project will be summarized. If you select this option, the fields
on the Summarization page are enabled. If this option is cleared, the project will not
be summarized.
Last Summarized Date field
The date the project was last summarized. This field is blank for projects that have not
been summarized.
Summarize to WBS Level list
Determines the number of summary WBS levels stored in the database.
Summary Type field
The type of summary that will be used for the project. Disabled if you are working with
a template project.
Units category
Actual Labor Units field
The actual labor units.
Actual Nonlabor Units field
The actual nonlabor units.
Actual This Period Labor Units field
The number of labor units used during this financial period.
If period performance is stored, the calculation is Actual Labor Units minus the sum of
the stored Actual This Period Labor Units fields for all previous periods.
If the period performance is not stored, Actual This Period Labor Units is the same as
Actual Labor Units.
Actual This Period Nonlabor Units field
The nonlabor units used during this financial period.
If period performance is stored, the calculation is Actual Nonlabor Units minus the sum
of the stored Actual This Period Nonlabor Units fields for all previous periods.

1242
If the period performance is not stored, Actual This Period Nonlabor Units is the same
as Actual Nonlabor Units.
At Completion Labor Units field
The sum of the actual plus remaining units for all labor resources assigned to the
activity.
It is the same as the planned labor units if the activity is not started, and the actual
labor units once the activity is completed.
Calculated as Actual Labor Units plus Remaining Labor Units.
At Completion Nonlabor Units field
The nonlabor units at completion. It is the sum of the actual plus remaining units for all
nonlabor resources assigned to the activity.
It is the same as the planned nonlabor units if the activity is not started, and the actual
nonlabor units once the activity is completed.
Calculated as Actual Nonlabor Units plus Remaining Nonlabor Units.
BL Project Labor Units field
The planned units for all labor resources assigned to the activity in the project
baseline.
Calculated as Baseline Actual Labor Units plus Baseline Remaining Labor Units.
BL Project Nonlabor Units field
The units for all nonlabor resources assigned to the activity in the project baseline.
Planned Labor Units field
The planned units for all labor resources assigned to the activities in the project.
Planned Non Labor Units field
The planned units for all nonlabor resources assigned to the activities in the project.
Remaining Labor Units field
The remaining units for all labor resources assigned to the activities in the project.
The remaining units reflects the work remaining to be done for the EPS.
Remaining Nonlabor Units field
The remaining units for all nonlabor resources assigned to the activities.
The remaining units reflects the work remaining to be done for the EPS.
Variance - Labor Units field
The difference between baseline labor units and at completion labor units.
Calculated as Baseline Labor Units minus At Completion Labor Units.

Reference Topics
1243
Variance - Nonlabor Units field
The difference the between baseline nonlabor units and the at completion non labor
units.
Calculated as Baseline Nonlabor Units minus At Completion Nonlabor Units.
Project Codes category
This category contains project codes listed in alphabetical order.
User-Defined category
This category contains user-defined columns listed in alphabetical order.
Baselines Dialog Box Toolbar
Overview
The following icons and screen elements appear in this toolbar; however, their availability
is subject to change based on your current selections, view settings, security permissions,
and other factors.
Screen Elements
Save (Ctrl+S)
Saves any new or modified entries to the database.
Cancel (Esc)
Cancels any new or modified entries and reverts back to the last saved state.
Add Baseline
Creates a new project baseline.
Delete (Delete)
Deletes or removes the currently selected data items or table rows.
Caution: Your selected data is permanently deleted once you click Save.
Convert a Project to Baseline
Convert a project in the EPS hierarchy to a baseline for the current project.
Restore a Baseline
Restores a baseline converted to a project back to a baseline.
Copy Baseline
Creates a duplicate of the selected project baseline.

1244
Expand All
In a hierarchical list or page of child items grouped by parent items, expands the list to
show all parent and child items.
Collapse All
In a hierarchical list, arranges entries so that only the parent items are shown and child
entries are hidden.
Bubble Chart Settings Area
The Bubble Chart settings area displays configurable options for viewing portfolio data in
a bubble chart. Use the following fields to modify your bubble chart view.
Bubble Chart Settings:
X Axis field
Select a field value to determine information displayed through the X Axis.
Y Axis field
Select a field value to determine the information displayed through the Y Axis.
Group By list
Select a field value to determine your preferred option to group your data.
Bubble Size field
For bubble charts only, select a field value to determine the size of the bubble
displayed (optional).
Color Theme list
Determines colors displayed on the chart. Select a predefined or user-defined color
theme.
Horizontal Gridlines option
Determines whether to show or hide horizontal gridlines.
Vertical Gridlines option
Determines whether to show or hide vertical gridlines.
Show All Values on Axis option
Determines whether all values are displayed in the histogram. Select this option to
include all values on the X-axis and not just values with data.

Reference Topics
1245
Budget Log Toolbar
Overview
The following icons and screen elements appear in this toolbar; however, their availability
is subject to change based on your current selections, view settings, security permissions,
and other factors.
Screen Elements
Original Budget field
Displays the amount of the original budget. Changing the value updates the amount
of the Current Budget and Proposed Budget.
Current Budget field
Displays the amount of the current budget.
Proposed Budget field
Displays the amount of the proposed budget.
WBS/EPS node/Project selector
Cycles through the available WBSs, EPS nodes, or projects and determines which data
display in the detail window. Click or to change which element and its
corresponding data are displayed.
Add (Insert)
Adds a new line item to the Budget Log detail window.
Delete (Delete)
Deletes or removes the currently selected data items or table rows.
Caution: Your selected data is permanently deleted once you click Save.
Capacity Planning Chart Toolbar
The Capacity Planning Chart toolbar includes the following options for working with your
capacity planning chart.
Toolbar Elements
Group Roles By
Groups the capacity planning chart by role.
Group By field
Select one of the following options:
Current Portfolio Roles

1246
Role Hierarchy
Role Team
Search
Displays options for finding a specific matching entry or entries based on search
criteria.
Search field
The means to find a project.
Search options
Role Name
Mach from Start
Mach Anywhere
Stacked Histogram
The display of the capacity planning chart as a stacked histogram. Categorized data
can be grouped, or stacked, to assist with comparisons. Stacked histograms are
useful when analyzing relative parts of a whole.
Area Chart
The capacity planning chart is displayed as an area chart. The chart data displays
total allocated amount (units or cost) across time..
Net Availability Chart
The capacity planning chart as a net availability chart. This chart displays the role's
availability over time; how much the role is over or under-allocated. The Net
Availability Chart is only available for units and is always grouped by role.
Spreadsheet
Displays the actual source data used to generate the chart.
Stacked By field
Select a value for stacking or dividing the presentation of data in your capacity
planning histogram, area chart, or spreadsheet. Choose one of the pre-defined
general options or a project code.
Stack the chart by role to display the total at completion units or costs, per role.
Stack the chart by project to display the total at completion units or costs, per
project.
Stack the chart by staffed vs. unstaffed units to display the total staffed and
unstaffed units over time.
Stack the chart by project code to display the total at completion units or costs for
associated roles and projects.

Reference Topics
1247
Stack the chart by current projects vs. other projects to display the aggregate total at
completion units or costs for the combination of selected roles across all projects, split
into two values. One value represents the role allocation for the projects selected in
the current project group (current projects); the other value represents the role
allocation for all other projects in the database (other projects).
Note: While the Current Projects vs. Other Projects value is always
available in the Stacked by field, it will only provide meaningful
data when you customize the page to display data for all projects
in the database. When the chart is customized to display data only
for selected projects in the current project group, you can still
select this option; however, the chart will only display data for the
current project group.
(The Stacked by field is not available for the Net Availability Chart.)
Capacity Planning Toolbar
The Capacity Planning toolbar includes the following commands:
Toolbar Elements
Save
Saves your new or modified entries to the database.
Save As
Displays options for saving the current item as a new instance with a new name.
Cancel
Cancels any pending changes and reverts back to the last saved state.
Create Portfolio from Selected Projects
Creates a new portfolio representing one or more selected projects.
Show Scorecard Only
Displays only the scorecard, or table view, hiding the charts and role selection areas
of the Capacity Planning page.
Show Scorecard and Gantt Chart
Displays the Scorecard and Gantt chart.

1248
Show Capacity Planning Chart
Displays the resource and roles capacity planning chart for the selected portfolio,
which enables you to analyze role allocation and cost over time. Multiple chart
formats display role allocation for the projects and roles you select, enabling you to
quickly identify areas of under or over allocation.
Full Screen Mode
Expands the current work area so it fills the entire display. Non-essential controls such
as navigation menus are hidden from this mode. To exit from this mode, click
Normal Mode.
Scenario field
Select <Latest Data> or a scenario to apply to the data. The Capacity Planning page
displays historical data preserved in a scenario, or the latest summarized data
(<Latest Data>), depending on your selection.
Capacity Planning Chart legend
Describes what each colored bar represents in the chart:
indicates current values
indicates forecast values
indicate EPS values
Customize link
Opens the Customize Capacity Planning Dialog Box (on page 667) where you can
specify the columns of information you want to display in the scorecard, as well as
grouping, sorting, waterline, and chart options.
Codes Toolbar of the Activities Page
Overview
The following icons and screen elements appear in this toolbar; however, their availability
is subject to change based on your current selections, view settings, security permissions,
and other factors.
Screen Elements
Assign Activity Code Value (Ctrl+Insert)
Creates a new activity code value for the selected activity code.
Delete (Delete)
Deletes or removes the currently selected data items or table rows.
Caution: Your selected data is permanently deleted once you click Save.

Reference Topics
1249
Activity selector
Cycles through the available activities and determines which data display in the
detail window. Click or to change which activity and its corresponding data
are displayed.
Codes Toolbar of the EPS Page
Overview
The following icons and screen elements appear in this toolbar; however, their availability
is subject to change based on your current selections, view settings, security permissions,
and other factors.
Screen Elements
Assign (Insert)
Assigns project codes to the selected project.
Delete (Delete)
Deletes the selected data items or table rows.
Project selector
Cycles through the available projects and determines which data display in the detail
window. Click or to change which project and its corresponding data are
displayed.
Command Line Support
This release supports running batch report jobs and exporting projects from a command
line.
Note: To view P6 Professional reports in P6, select the Store report in
Work Products and Documents option when creating report
batches or printing reports. See the P6 Professional Help for more
information.
Customizable Menus
Users can now change the display order of menus, rearrange menu commands, delete
menus and commands, and create custom menus.

1250
Customizable Toolbars
An improved default arrangement of toolbars and command buttons reduces visual
clutter. In addition, users can fully create and customize any toolbars in the client
interface with the commands of most importance to their goals and assignments.
Document Search Criteria
When creating document search criteria, you can use a combination of keywords,
operators, and wildcard characters to define your query. Try to be as specific as possible
when coming up with search criteria.
Use the following guidelines and examples to create effective document search criteria.
Keywords
Keywords are terms and phrases, including a combination of letters, numbers, and
special characters on which you can base your search.
Example: To search for documents that contain the keyword "budget", type budget.
You can also use quotation marks when defining keywords. Quotation marks enable you
to create phrases; the application will search for the entire phrase.
Example: To search for documents that contain the entire phrase "annual budget", type
"annual budget" (with the quotation marks).
Operators
Operators enable you to establish associations, or relationships, between keywords and
phrases. Logical operators, such as Boolean operators (AND, OR, required operator +,
and prohibit operator -), place conditions on the search criteria and identify which
keywords you want to include or exclude from your search.
Note: Type Boolean operators in capital letters.
The AND operator returns all documents that contain both keywords specified on each
side of the operator.
The required operator (+) returns all documents that contain the keyword listed after the
operator.
Example: To search for documents containing both the keywords, "budget", and
"analysis", enter budget AND analysis in the search bar. Or, you could enter
+budget+analysis.
The OR operator returns all documents that contain either or both of the keywords
specified on each side of the operator.
Example: To search for documents containing the keyword "budget", "analysis", or both,
enter budget OR analysis.

Reference Topics
1251
The prohibited operator (-) excludes the keyword listed after the operator from
appearing in the search results.
Example: To search for documents that contain the keyword "budget", but not the
phrase "fiscal year", enter budget-"fiscal year".
Wildcard Characters
Wildcard characters are special characters you can use to represent unknown
characters in your search. You can use one of the following two wildcard characters in
your search:
the question mark (?) represents a single alphanumeric character
the asterisk (*) represents a string of characters and is entered by default in the search
string
Example: To search for the keywords "test" or "text" enter te?t. To search for the keywords
"test," "tests," or "tester," type test.
Note: You cannot use a wildcard character as the first character in your search criteria.
Document Security (Reference)
Only the user who added the project document can modify its security policy.
Three document security policies are available:
Personal - A personal document can be viewed, modified, or deleted only by the
user who added it to the project.
Note - Although it is associated with a project, a personal policy document does not
appear in the list of project documents for any team member except the document
owner.
Shared - A shared document can be viewed, modified, or deleted by any project
team member.
Read-Only - A read-only document can be viewed by any project team member,
but team members cannot modify or delete it.
Documents Toolbar of the Activities Page
Overview
The following icons and screen elements appear in this toolbar; however, their availability
is subject to change based on your current selections, view settings, security permissions,
and other factors.
Screen Elements
Assign Document (Insert)
Assigns documents to the selected activity.

1252
Delete (Delete)
Deletes or removes the currently selected data items or table rows.
Caution: Your selected data is permanently deleted once you click Save.
View Document
Opens a selected document for viewing.
View Document in AutoVue
Opens a document or graphic in Oracle's AutoVue. This option is available when a
content repository is installed and your P6 administrator has configured the
appropriate privileges and project access for you.
Customize Columns
Displays choices for customizing the columns (fields) that appear on the selected
screen. (Available only in the Gantt chart and Table views.)
Activity selector
Cycles through the available activities and determines which data display in the
detail window. Click or to change which activity and its corresponding data
are displayed.
Edit Menu of the Assignments Page
Overview
The following icons and screen elements appear in this toolbar; however, their availability
is subject to change based on your current selections, view settings, security permissions,
and other factors.
Screen Elements
Copy (Ctrl+C)
Copies the selected item and applicable attributes to the temporary clipboard,
leaving the original in its current location. The copied item and applicable attributes
can then be pasted into another supported location.
Fill Down (Ctrl+I)
In a selected range of cells in a single table column, inserts the value in the first or top
cell into the remaining cells down the column.
Find (Ctrl+F)
Displays options for finding matching entries based on specific search words or values
within a particular column in a table.

Reference Topics
1253
Find Next (F3)
Finds and highlights the next matching entry. Available only in tables after an original
Find operation.
Edit Menu on Activities Page
Overview
The buttons on the Edit menu are identical to the buttons on the Edit toolbar. Though the
buttons on the menu are fixed, the same list of buttons can be configured on the toolbar.
Screen Elements
Cut (Ctrl+X)
Cuts the selected item and applicable attributes to the temporary clipboard,
removing it from its current location. The item and applicable attributes can then be
pasted to another supported location.
Copy (Ctrl+C)
Copies the selected item and applicable attributes to the temporary clipboard,
leaving the original in its current location. The copied item and applicable attributes
can then be pasted into another supported location.
Paste (Ctrl+V)
Completes a Cut or Copy operation by inserting an item and its supported attributes
into a new location.
Note: The following items are not included if you paste an activity
from one project into another project: project-level activity codes,
EPS-level activity codes (if the projects belong to different EPS
nodes), work products and documents, and issues. If you are
working in a grouped activity view and paste an activity from one
group into another group, it inherits the value of the group you
paste it to, with some exceptions. For example, if your view is
grouped by activity type, and you cut a Task Dependent activity
and paste it into a Resource Dependent group, the activity type
changes to Resource Dependent. An exception to this occurs in
cases where the application business logic would be invalidated
by applying the attribute of the new group. For example, if you
copy a start milestone that has a constraint to a finish milestone
group, the activity changes to a finish milestone, but the start
constraint is removed because a finish milestone cannot have a
start constraint.

1254
Fill Down (Ctrl+I)
In a selected range of cells in a single table column, inserts the value in the first or top
cell into the remaining cells down the column.
Move Up (Ctrl+Alt+Up)
Moves the selected item one level higher in a hierarchical arrangement.
Move Down (Ctrl+Alt+Down)
Moves the selected item one level lower in a hierarchical arrangement.
Move Left (Ctrl+Alt+Left)
Moves the selected item one level to the left in a hierarchical arrangement. Outdents
text items.
Move Right (Ctrl+Alt+Right)
Moves the selected item one level to the right in a hierarchical arrangement. Indents
text items.
Find (Ctrl+F)
Displays options for finding matching entries based on specific search words or values
within a particular column in a table.
Find Next (F3)
Finds and highlights the next matching entry. Available only in tables after an original
Find operation.
Edit Menu on EPS Page
Overview
The buttons on the Edit menu are identical to the buttons on the Edit toolbar. Though the
buttons on the menu are fixed, the same list of buttons can be configured on the toolbar.
Screen Elements
Cut (Ctrl+X)
Cuts the selected item and applicable attributes to the temporary clipboard,
removing it from its current location. The item and applicable attributes can then be
pasted to another supported location.
Copy (Ctrl+C)
Copies the selected item and applicable attributes to the temporary clipboard,
leaving the original in its current location. The copied item and applicable attributes
can then be pasted into another supported location.

Reference Topics
1255
Paste (Ctrl+V)
Completes a Cut or Copy operation by inserting an item and its supported attributes
into a new location.
Fill Down (Ctrl+I)
In a selected range of cells in a single table column, inserts the value in the first or top
cell into the remaining cells down the column.
Move Up (Ctrl+Alt+Up)
Moves the selected item one level higher in a hierarchical arrangement.
Move Down (Ctrl+Alt+Down)
Moves the selected item one level lower in a hierarchical arrangement.
Move Left (Ctrl+Alt+Left)
Moves the selected item one level to the left in a hierarchical arrangement. Outdents
text items.
Move Right (Ctrl+Alt+Right)
Moves the selected item one level to the right in a hierarchical arrangement. Indents
text items.
Find (Ctrl+F)
Displays options for finding matching entries based on specific search words or values
within a particular column in a table.
Find Next (F3)
Finds and highlights the next matching entry. Available only in tables after an original
Find operation.
Enterprise Data Activity Codes Toolbar
Overview
The following icons and screen elements appear in this toolbar; however, their availability
is subject to change based on your current selections, view settings, security permissions,
and other factors.
Screen Elements
Save
Saves your new or modified entries to the database.
Cancel
Cancels any pending changes and reverts back to the last saved state.

1256
Add Activity Code
Creates a new activity code.
Add Activity Code Value
Creates a new activity code value for the currently selected activity code.
Delete
Deletes the selected item or items permanently.
Move to Global
Moves the current activity code to the global level.This option is available under the
EPS and Project Tabs.
Move to EPS
Moves the current activity code to a specific EPS level. This option is available only
under the Project Tab.
Cut
Cuts the selected item and applicable attributes to the temporary clipboard,
removing it from its current location. The item and applicable attributes can then be
pasted to another supported location.
Copy
Copies the selected item and applicable attributes to the temporary clipboard,
leaving the original in its current location. The copied item and applicable attributes
can then be pasted to another supported location.
Paste
Completes a Cut or Copy operation by inserting an item and its supported attributes
into a new location.
Find
Displays options for finding matching entries based on specific search words or values
within a particular column in a table.
Move Up
Moves the selected item one level up in the sort order.
Move Down
Moves the selected item one level down in the sort order.
Move Left
Moves the selected item one level to the left in a hierarchical arrangement. Outdents
text items.

Reference Topics
1257
Move Right
Moves the selected item one level to the right in a hierarchical arrangement. Indents
text items.
Full Screen Mode (F11)
Expands the current work area so it fills the entire display. Non-essential controls such
as navigation menus are hidden from this mode. When in full screen mode, click this
toolbutton again to restore the normal viewing mode.
Export to Excel
Exports all data as it appears in the current view to a Microsoft® Excel spreadsheet
(.xls) file. Customize the rows to display only the data you want to export.
Print (Ctrl+P)
Prints the current page, table, chart, or item.
Print Preview
Displays a temporary preview of the printed output. You can then decide to continue
printing or cancel.
Page Setup
Displays options for customizing the printed output.
Select Projects dialog box
Opens the Select Projects dialog box. This option is available only under the Project
tab. See Select Projects Dialog Box of the Project Tab of the Activity Codes Page (on
page 1078).
Enterprise Data Baseline Types Toolbar
Overview
The following icons and screen elements appear in this toolbar; however, their availability
is subject to change based on your current selections, view settings, security permissions,
and other factors.
Screen Details
Save (Ctrl+S)
Saves any new or modified entries to the database.
Cancel (Esc)
Cancels any new or modified entries and reverts back to the last saved state.

1258
Add (Insert)
Creates a new entry in the current table.
Delete (Delete)
Deletes or removes the currently selected data items or table rows.
Caution: Your selected data is permanently deleted once you click Save.
Move Up (Ctrl+Alt+Up)
Moves the selected item one level higher in a hierarchical arrangement.
Move Down (Ctrl+Alt+Down)
Moves the selected item one level lower in a hierarchical arrangement.
Find (Ctrl+F)
Displays options for finding matching entries based on specific search words or values
within a particular column in a table.
Find Next (Alt+F)
Finds and highlights the next matching entry in a column. Available only in tables after
an original Find operation.
Full Screen Mode (F11)
Expands the current work area so it fills the entire display. Non-essential controls such
as navigation menus are hidden from this mode. When in full screen mode, click this
toolbutton again to restore the normal viewing mode.
Print (Ctrl+P)
Prints the current page, table, chart, or item.
Print Preview
Displays a temporary preview of the printed output. You can then decide to continue
printing or cancel.
Page Setup
Displays options for customizing the printed output.
Enterprise Data Categories Toolbar
Overview
The following icons and screen elements appear in this toolbar; however, their availability
is subject to change based on your current selections, view settings, security permissions,
and other factors.

Reference Topics
1259
Screen Elements
Save (Ctrl+S)
Saves any new or modified entries to the database.
Cancel (Esc)
Cancels any new or modified entries and reverts back to the last saved state.
Add (Insert)
Creates a new category for managing different types of entries.
Delete (Delete)
Deletes or removes the currently selected data items or table rows.
Caution: Your selected data is permanently deleted once you click Save.
Move Up (Ctrl+Alt+Up)
Moves the selected item one level higher in a hierarchical arrangement.
Move Down (Ctrl+Alt+Down)
Moves the selected item one level lower in a hierarchical arrangement.
Find (Ctrl+F)
Displays options for finding matching entries based on specific search words or values
within a particular column in a table.
Find Next (Alt+F)
Finds and highlights the next matching entry in a column. Available only in tables after
an original Find operation.
Full Screen Mode (F11)
Expands the current work area so it fills the entire display. Non-essential controls such
as navigation menus are hidden from this mode. When in full screen mode, click this
toolbutton again to restore the normal viewing mode.
Print (Ctrl+P)
Prints the current page, table, chart, or item.
Print Preview
Displays a temporary preview of the printed output. You can then decide to continue
printing or cancel.
Page Setup
Displays options for customizing the printed output.

1260
Enterprise Data Cost Accounts Toolbar
Overview
The following icons and screen elements appear in this toolbar; however, their availability
is subject to change based on your current selections, view settings, security permissions,
and other factors.
Screen Elements
Save (Ctrl+S)
Saves any new or modified entries to the database.
Cancel (Esc)
Cancels any new or modified entries and reverts back to the last saved state.
Add (Insert)
Creates a new entry in the current table.
Delete (Delete)
Deletes or removes the currently selected data items or table rows.
Caution: Your selected data is permanently deleted once you click Save.
Cut (Ctrl+X)
Cuts the selected item and applicable attributes to the temporary clipboard,
removing it from its current location. The item and applicable attributes can then be
pasted to another supported location.
Copy (Ctrl+C)
Copies the selected item and applicable attributes to the temporary clipboard,
leaving the original in its current location. The copied item and applicable attributes
can then be pasted into another supported location.
Paste (Ctrl+V)
Completes a Cut or Copy operation by inserting an item and its supported attributes
into a new location.
Move Up (Ctrl+Alt+Up)
Moves the selected item one level higher in a hierarchical arrangement.
Move Down (Ctrl+Alt+Down)
Moves the selected item one level lower in a hierarchical arrangement.

Reference Topics
1261
Move Left (Ctrl+Alt+Left)
Moves the selected item one level to the left in a hierarchical arrangement. Outdents
text items.
Move Right (Ctrl+Alt+Right)
Moves the selected item one level to the right in a hierarchical arrangement. Indents
text items.
Find (Ctrl+F)
Displays options for finding matching entries based on specific search words or values
within a particular column in a table.
Find Next (Alt+F)
Finds and highlights the next matching entry in a column. Available only in tables after
an original Find operation.
Full Screen Mode (F11)
Expands the current work area so it fills the entire display. Non-essential controls such
as navigation menus are hidden from this mode. When in full screen mode, click this
toolbutton again to restore the normal viewing mode.
Export to Excel
Exports all data as it appears in the current view to a Microsoft® Excel spreadsheet
(.xls) file. Customize the rows to display only the data you want to export.
Print (Ctrl+P)
Prints the current page, table, chart, or item.
Print Preview
Displays a temporary preview of the printed output. You can then decide to continue
printing or cancel.
Page Setup
Displays options for customizing the printed output.
Enterprise Data Currencies Toolbar
Overview
The following icons and screen elements appear in this toolbar; however, their availability
is subject to change based on your current selections, view settings, security permissions,
and other factors.

1262
Screen Elements
Save (Ctrl+S)
Saves any new or modified entries to the database.
Cancel (Esc)
Cancels any new or modified entries and reverts back to the last saved state.
Add (Insert)
Creates a new currency type.
Delete (Delete)
Deletes or removes the currently selected data items or table rows.
Caution: Your selected data is permanently deleted once you click Save.
Copy (Ctrl+C)
Copies the selected item and applicable attributes to the temporary clipboard,
leaving the original in its current location. The copied item and applicable attributes
can then be pasted into another supported location.
Paste (Ctrl+V)
Completes a Cut or Copy operation by inserting an item and its supported attributes
into a new location.
Find (Ctrl+F)
Displays options for finding matching entries based on specific search words or values
within a particular column in a table.
Find Next (Alt+F)
Finds and highlights the next matching entry in a column. Available only in tables after
an original Find operation.
Select Columns
Displays a menu of the available fields you can show or hide as columns in the current
table.
Full Screen Mode (F11)
Expands the current work area so it fills the entire display. Non-essential controls such
as navigation menus are hidden from this mode. When in full screen mode, click this
toolbutton again to restore the normal viewing mode.
Print (Ctrl+P)
Prints the current page, table, chart, or item.

Reference Topics
1263
Print Preview
Displays a temporary preview of the printed output. You can then decide to continue
printing or cancel.
Page Setup
Displays options for customizing the printed output.
Enterprise Data Document Statuses Toolbar
Overview
The following icons and screen elements appear in this toolbar; however, their availability
is subject to change based on your current selections, view settings, security permissions,
and other factors.
Screen Elements
Save (Ctrl+S)
Saves any new or modified entries to the database.
Cancel (Esc)
Cancels any new or modified entries and reverts back to the last saved state.
Add (Insert)
Creates a new entry in the current table.
Delete (Delete)
Deletes or removes the currently selected data items or table rows.
Caution: Your selected data is permanently deleted once you click Save.
Move Up (Ctrl+Alt+Up)
Moves the selected item one level higher in a hierarchical arrangement.
Move Down (Ctrl+Alt+Down)
Moves the selected item one level lower in a hierarchical arrangement.
Find (Ctrl+F)
Displays options for finding matching entries based on specific search words or values
within a particular column in a table.
Find Next (Alt+F)
Finds and highlights the next matching entry in a column. Available only in tables after
an original Find operation.

1264
Full Screen Mode (F11)
Expands the current work area so it fills the entire display. Non-essential controls such
as navigation menus are hidden from this mode. When in full screen mode, click this
toolbutton again to restore the normal viewing mode.
Print (Ctrl+P)
Prints the current page, table, chart, or item.
Print Preview
Displays a temporary preview of the printed output. You can then decide to continue
printing or cancel.
Page Setup
Displays options for customizing the printed output.
Enterprise Data Financial Periods Toolbar
Overview
The following icons and screen elements appear in this toolbar; however, their availability
is subject to change based on your current selections, view settings, security permissions,
and other factors.
Screen Elements
Save (Ctrl+S)
Saves any new or modified entries to the database.
Cancel (Esc)
Cancels any new or modified entries and reverts back to the last saved state.
Add (Insert)
Creates a new entry in the current table.
Add Batch
Creates a new batch of financial periods.
Delete (Delete)
Deletes or removes the currently selected data items or table rows.
Caution: Your selected data is permanently deleted once you click Save.
If any past period actual values for activities, resource assignments, resource
planning, or summary data have been stored for a given financial period, then that
financial period cannot be deleted.

Reference Topics
1265
Find (Ctrl+F)
Displays options for finding matching entries based on specific search words or values
within a particular column in a table.
Find Next (Alt+F)
Finds and highlights the next matching entry in a column. Available only in tables after
an original Find operation.
Full Screen Mode (F11)
Expands the current work area so it fills the entire display. Non-essential controls such
as navigation menus are hidden from this mode. When in full screen mode, click this
toolbutton again to restore the normal viewing mode.
Print (Ctrl+P)
Prints the current page, table, chart, or item.
Print Preview
Displays a temporary preview of the printed output. You can then decide to continue
printing or cancel.
Page Setup
Displays options for customizing the printed output.
Enterprise Data Funding Sources Toolbar
Overview
The following icons and screen elements appear in this toolbar; however, their availability
is subject to change based on your current selections, view settings, security permissions,
and other factors.
Screen Elements
Save (Ctrl+S)
Saves any new or modified entries to the database.
Cancel (Esc)
Cancels any new or modified entries and reverts back to the last saved state.
Add (Insert)
Creates a new entry in the current table.
Delete (Delete)
Deletes or removes the currently selected data items or table rows.
Caution: Your selected data is permanently deleted once you click Save.

1266
If the funding sources to be deleted are currently assigned to one or more EPS nodes
or projects, then users can choose to merge assignments into a different funding
source, or delete the selected funding sources and any associated sources.
Cut (Ctrl+X)
Cuts the selected item and applicable attributes to the temporary clipboard,
removing it from its current location. The item and applicable attributes can then be
pasted to another supported location.
Copy (Ctrl+C)
Copies the selected item and applicable attributes to the temporary clipboard,
leaving the original in its current location. The copied item and applicable attributes
can then be pasted into another supported location.
Paste (Ctrl+V)
Completes a Cut or Copy operation by inserting an item and its supported attributes
into a new location.
Find (Ctrl+F)
Displays options for finding matching entries based on specific search words or values
within a particular column in a table.
Find Next (Alt+F)
Finds and highlights the next matching entry in a column. Available only in tables after
an original Find operation.
Move Up (Ctrl+Alt+Up)
Moves the selected item one level higher in a hierarchical arrangement.
Move Down (Ctrl+Alt+Down)
Moves the selected item one level lower in a hierarchical arrangement.
Move Left (Ctrl+Alt+Left)
Moves the selected item one level to the left in a hierarchical arrangement. Outdents
text items.
Move Right (Ctrl+Alt+Right)
Moves the selected item one level to the right in a hierarchical arrangement. Indents
text items.
Full Screen Mode (F11)
Expands the current work area so it fills the entire display. Non-essential controls such
as navigation menus are hidden from this mode. When in full screen mode, click this
toolbutton again to restore the normal viewing mode.

Reference Topics
1267
Export to Excel
Exports all data as it appears in the current view to a Microsoft® Excel spreadsheet
(.xls) file. Customize the rows to display only the data you want to export.
Print (Ctrl+P)
Prints the current page, table, chart, or item.
Print Preview
Displays a temporary preview of the printed output. You can then decide to continue
printing or cancel.
Page Setup
Displays options for customizing the printed output.
Enterprise Data Global Calendar Toolbar
Overview
The following icons and screen elements appear in this toolbar; however, their availability
is subject to change based on your current selections, view settings, security permissions,
and other factors.
Screen Elements
Save (Ctrl+S)
Saves any new or modified entries to the database.
Cancel (Esc)
Cancels any new or modified entries and reverts back to the last saved state.
Add (Insert)
Creates a new entry in the current table.
Delete (Delete)
Deletes or removes the currently selected data items or table rows.
Caution: Your selected data is permanently deleted once you click Save.
Exception: You cannot delete the global or project-level default calendar.
If the calendar to be deleted is currently set as the project default calendar for at
least one project, as the default calendar for at least one resource, or as the assigned
calendar for at least one activity, then you will be prompted with a message similar to
the following: "The selected calendar has assignments. Would you like to select a
replacement calendar or change the assignments to the default global calendar?
Note: Selecting a replacement calendar may cause dates to be invalid for those
projects with assignments."

1268
The application does not check your resource or project access before allowing you
to delete a calendar and replace all of the assignments with a new calendar. The
application does check to see if you have the Add/Edit/Delete Global Calendars or
Add/Edit/Delete Resource Calendars security privileges. If you have rights to a
calendar, you can delete a calendar. The application will look to see if any
assignments exist, and if they do, you will be prompted to select a replacement
calendar.
Edit Hours Per Period
Displays a dialog box in which you specify the number of work hours for each time
period. See Set Time Periods Dialog Box of Calendars (on page 1081).
Set As Default Calendar
Sets the current calendar as the default calendar.
Full Screen Mode (F11)
Expands the current work area so it fills the entire display. Non-essential controls such
as navigation menus are hidden from this mode. When in full screen mode, click this
toolbutton again to restore the normal viewing mode.
Print (Ctrl+P)
Prints the current page, table, chart, or item.
Print Preview
Displays a temporary preview of the printed output. You can then decide to continue
printing or cancel.
Enterprise Data Issue Codes Toolbar
Overview
The following icons and screen elements appear in this toolbar; however, their availability
is subject to change based on your current selections, view settings, security permissions,
and other factors.
Screen Elements
Save (Ctrl+S)
Saves any new or modified entries to the database.
Cancel (Esc)
Cancels any new or modified entries and reverts back to the last saved state.
Add Code (Insert)
Creates a new issue code.

Reference Topics
1269
Add Issue Code Value
Creates a new issue code value for the currently selected issue code.
Delete (Delete)
Deletes or removes the currently selected data items or table rows.
Caution: Your selected data is permanently deleted once you click Save.
Copy (Ctrl+C)
Copies the selected item and applicable attributes to the temporary clipboard,
leaving the original in its current location. The copied item and applicable attributes
can then be pasted into another supported location.
Paste (Ctrl+V)
Completes a Cut or Copy operation by inserting an item and its supported attributes
into a new location.
Move Up (Ctrl+Alt+Up)
Moves the selected item one level higher in a hierarchical arrangement.
Move Down (Ctrl+Alt+Down)
Moves the selected item one level lower in a hierarchical arrangement.
Find (Ctrl+F)
Displays options for finding matching entries based on specific search words or values
within a particular column in a table.
Find Next (Alt+F)
Finds and highlights the next matching entry in a column. Available only in tables after
an original Find operation.
Full Screen Mode (F11)
Expands the current work area so it fills the entire display. Non-essential controls such
as navigation menus are hidden from this mode. When in full screen mode, click this
toolbutton again to restore the normal viewing mode.
Export to Excel
Exports all data as it appears in the current view to a Microsoft® Excel spreadsheet
(.xls) file. Customize the rows to display only the data you want to export.
Print (Ctrl+P)
Prints the current page, table, chart, or item.

1270
Print Preview
Displays a temporary preview of the printed output. You can then decide to continue
printing or cancel.
Page Setup
Displays options for customizing the printed output.
Enterprise Data Notebook Topics Toolbar
Overview
The following icons and screen elements appear in this toolbar; however, their availability
is subject to change based on your current selections, view settings, security permissions,
and other factors.
Screen Elements
Save (Ctrl+S)
Saves any new or modified entries to the database.
Cancel (Esc)
Cancels any new or modified entries and reverts back to the last saved state.
Add (Insert)
Creates a new entry in the current table.
Delete (Delete)
Deletes or removes the currently selected data items or table rows.
Caution: Your selected data is permanently deleted once you click Save.
Move Up (Ctrl+Alt+Up)
Moves the selected item one level higher in a hierarchical arrangement.
Move Down (Ctrl+Alt+Down)
Moves the selected item one level lower in a hierarchical arrangement.
Find (Ctrl+F)
Displays options for finding matching entries based on specific search words or values
within a particular column in a table.
Find Next (Alt+F)
Finds and highlights the next matching entry in a column. Available only in tables after
an original Find operation.

Reference Topics
1271
Full Screen Mode (F11)
Expands the current work area so it fills the entire display. Non-essential controls such
as navigation menus are hidden from this mode. When in full screen mode, click this
toolbutton again to restore the normal viewing mode.
Print (Ctrl+P)
Prints the current page, table, chart, or item.
Print Preview
Displays a temporary preview of the printed output. You can then decide to continue
printing or cancel.
Page Setup
Displays options for customizing the printed output.
Enterprise Data Overhead Codes Toolbar
Overview
The following icons and screen elements appear in this toolbar; however, their availability
is subject to change based on your current selections, view settings, security permissions,
and other factors.
Screen Elements
Save (Ctrl+S)
Saves any new or modified entries to the database.
Cancel (Esc)
Cancels any new or modified entries and reverts back to the last saved state.
Add (Insert)
Creates a new entry in the current table.
Delete (Delete)
Deletes or removes the currently selected data items or table rows.
Caution: Your selected data is permanently deleted once you click Save.
Move Up (Ctrl+Alt+Up)
Moves the selected item one level higher in a hierarchical arrangement.
Move Down (Ctrl+Alt+Down)
Moves the selected item one level lower in a hierarchical arrangement.

1272
Find (Ctrl+F)
Displays options for finding matching entries based on specific search words or values
within a particular column in a table.
Find Next (Alt+F)
Finds and highlights the next matching entry in a column. Available only in tables after
an original Find operation.
Full Screen Mode (F11)
Expands the current work area so it fills the entire display. Non-essential controls such
as navigation menus are hidden from this mode. When in full screen mode, click this
toolbutton again to restore the normal viewing mode.
Print (Ctrl+P)
Prints the current page, table, chart, or item.
Print Preview
Displays a temporary preview of the printed output. You can then decide to continue
printing or cancel.
Page Setup
Displays options for customizing the printed output.
Enterprise Data Project Calendar Toolbar
Overview
The following icons and screen elements appear in this toolbar; however, their availability
is subject to change based on your current selections, view settings, security permissions,
and other factors.
Screen Elements
Save (Ctrl+S)
Saves any new or modified entries to the database.
Cancel (Esc)
Cancels any new or modified entries and reverts back to the last saved state.
Add (Insert)
Creates a new entry in the current table.
Delete (Delete)
Deletes or removes the currently selected data items or table rows.

Reference Topics
1273
Caution: Your selected data is permanently deleted once you click
Save.
Exception: You cannot delete the global or project-level default calendar.
If the calendar to be deleted is currently set as the project default calendar for at
least one project, as the default calendar for at least one resource, or as the assigned
calendar for at least one activity, then you will be prompted with a message similar to
the following: "The selected calendar has assignments. Would you like to select a
replacement calendar or change the assignments to the default global calendar?
Note: Selecting a replacement calendar may cause dates to be invalid for those
projects with assignments."
The application does not check your resource or project access before allowing you
to delete a calendar and replace all of the assignments with a new calendar. The
application does check to see if you have the Add/Edit/Delete Global Calendars or
Add/Edit/Delete Resource Calendars security privileges. If you have rights to a
calendar, you can delete a calendar. The application will look to see if any
assignments exist, and if they do, you will be prompted to select a replacement
calendar.
Edit Hours Per Period
Displays a dialog box in which you specify the number of work hours for each time
period.
See Set Time Periods Dialog Box of Calendars (on page 1081).
Promote to Global Calendar
Promotes the current calendar to the global calendar.
Assignments to the calendar will remain. This option is not available in the Global
Calendar View.
Select Projects
Displays the Select Projects dialog box. Use this dialog box to choose projects to
display in your current view. See Select Projects Dialog Box of the Project Calendars
Page (on page 1077).
Full Screen Mode (F11)
Expands the current work area so it fills the entire display. Non-essential controls such
as navigation menus are hidden from this mode. When in full screen mode, click this
toolbutton again to restore the normal viewing mode.
Print (Ctrl+P)
Prints the current page, table, chart, or item.

1274
Print Preview
Displays a temporary preview of the printed output. You can then decide to continue
printing or cancel.
Enterprise Data Project Codes Toolbar
Overview
The following icons and screen elements appear in this toolbar; however, their availability
is subject to change based on your current selections, view settings, security permissions,
and other factors.
Screen Elements
Save (Ctrl+S)
Saves any new or modified entries to the database.
Cancel (Esc)
Cancels any new or modified entries and reverts back to the last saved state.
Add Code (Insert)
Creates a new project code.
Add Code Value (Shift + Insert)
Creates a new project code value for the currently selected project code.
Delete
Deletes the selected item or items permanently.
Cut (Ctrl+X)
Cuts the selected item and applicable attributes to the temporary clipboard,
removing it from its current location. The item and applicable attributes can then be
pasted to another supported location.
Copy (Ctrl+C)
Copies the selected item and applicable attributes to the temporary clipboard,
leaving the original in its current location. The copied item and applicable attributes
can then be pasted into another supported location.
Paste (Ctrl+V)
Completes a Cut or Copy operation by inserting an item and its supported attributes
into a new location.
Move Up (Ctrl+Alt+Up)
Moves the selected item one level higher in a hierarchical arrangement.

Reference Topics
1275
Move Down (Ctrl+Alt+Down)
Moves the selected item one level lower in a hierarchical arrangement.
Move Left (Ctrl+Alt+Left)
Moves the selected item one level to the left in a hierarchical arrangement. Outdents
text items.
Move Right (Ctrl+Alt+Right)
Moves the selected item one level to the right in a hierarchical arrangement. Indents
text items.
Find (Ctrl+F)
Displays options for finding matching entries based on specific search words or values
within a particular column in a table.
Find Next (Alt+F)
Finds and highlights the next matching entry in a column. Available only in tables after
an original Find operation.
Select Columns
Displays a menu of the available fields you can show or hide as columns in the current
table.
Full Screen Mode (F11)
Expands the current work area so it fills the entire display. Non-essential controls such
as navigation menus are hidden from this mode. When in full screen mode, click this
toolbutton again to restore the normal viewing mode.
Export to Excel
Exports all data as it appears in the current view to a Microsoft® Excel spreadsheet
(.xls) file. Customize the rows to display only the data you want to export.
Print (Ctrl+P)
Prints the current page, table, chart, or item.
Print Preview
Displays a temporary preview of the printed output. You can then decide to continue
printing or cancel.
Page Setup
Displays options for customizing the printed output.

1276
Enterprise Data Rate Types Toolbar
Overview
The following icons and screen elements appear in this toolbar; however, their availability
is subject to change based on your current selections, view settings, security permissions,
and other factors.
Screen Elements
Save (Ctrl+S)
Saves any new or modified entries to the database.
Cancel (Esc)
Cancels any new or modified entries and reverts back to the last saved state.
Full Screen Mode (F11)
Expands the current work area so it fills the entire display. Non-essential controls such
as navigation menus are hidden from this mode. When in full screen mode, click this
toolbutton again to restore the normal viewing mode.
Print (Ctrl+P)
Prints the current page, table, chart, or item.
Print Preview
Displays a temporary preview of the printed output. You can then decide to continue
printing or cancel.
Page Setup
Displays options for customizing the printed output.
Enterprise Data Resource Calendar Toolbar
Overview
The following icons and screen elements appear in this toolbar; however, their availability
is subject to change based on your current selections, view settings, security permissions,
and other factors.
Screen Elements
Save (Ctrl+S)
Saves any new or modified entries to the database.
Cancel (Esc)
Cancels any new or modified entries and reverts back to the last saved state.

Reference Topics
1277
Add (Insert)
Creates a new entry in the current table.
Delete (Delete)
Deletes or removes the currently selected data items or table rows.
Caution: Your selected data is permanently deleted once you click
Save.
Exception: You cannot delete the global or project-level default calendar.
If the calendar to be deleted is currently set as the project default calendar for at
least one project, as the default calendar for at least one resource, or as the assigned
calendar for at least one activity, then you will be prompted with a message similar to
the following: "The selected calendar has assignments. Would you like to select a
replacement calendar or change the assignments to the default global calendar?
Note: Selecting a replacement calendar may cause dates to be invalid for those
projects with assignments."
The application does not check your resource or project access before allowing you
to delete a calendar and replace all of the assignments with a new calendar. The
application does check to see if you have the Add/Edit/Delete Global Calendars or
Add/Edit/Delete Resource Calendars security privileges. If you have rights to a
calendar, you can delete a calendar. The application will look to see if any
assignments exist, and if they do, you will be prompted to select a replacement
calendar.
Assign Resource
Opens a dialog box where you select a resource to assign to the selected calendar.
Edit Hours Per Period
Displays a dialog box in which you specify the number of work hours for each time
period. See Set Time Periods Dialog Box of Calendars (on page 1081).
Promote to Global Calendar
Promotes the current calendar to the global calendar.
Assignments to the calendar will remain.
Convert to Personal Calendar or Convert to Shared Calendar
Converts the currently viewed resource calendar to a personal calendar or a shared
calendar, depending on your selection.
Filter By
Displays options for reducing the number of values displayed in a list or table by
showing only selected values and removing or filtering out unwanted values.

1278
Full Screen Mode (F11)
Expands the current work area so it fills the entire display. Non-essential controls such
as navigation menus are hidden from this mode. When in full screen mode, click this
toolbutton again to restore the normal viewing mode.
Print (Ctrl+P)
Prints the current page, table, chart, or item.
Print Preview
Displays a temporary preview of the printed output. You can then decide to continue
printing or cancel.
Enterprise Data Resource Codes Toolbar
Overview
The following icons and screen elements appear in this toolbar; however, their availability
is subject to change based on your current selections, view settings, security permissions,
and other factors.
Screen Elements
Save (Ctrl+S)
Saves any new or modified entries to the database.
Cancel (Esc)
Cancels any new or modified entries and reverts back to the last saved state.
Add Code (Insert)
Creates a new resource code.
Add Code Value
Creates a new resource code value for the currently selected resource code.
Delete (Delete)
Deletes or removes the currently selected data items or table rows.
Caution: Your selected data is permanently deleted once you click Save.
Cut (Ctrl+X)
Cuts the selected item and applicable attributes to the temporary clipboard,
removing it from its current location. The item and applicable attributes can then be
pasted to another supported location.

Reference Topics
1279
Copy (Ctrl+C)
Copies the selected item and applicable attributes to the temporary clipboard,
leaving the original in its current location. The copied item and applicable attributes
can then be pasted into another supported location.
Paste (Ctrl+V)
Completes a Cut or Copy operation by inserting an item and its supported attributes
into a new location.
Move Up (Ctrl+Alt+Up)
Moves the selected item one level higher in a hierarchical arrangement.
Move Down (Ctrl+Alt+Down)
Moves the selected item one level lower in a hierarchical arrangement.
Move Left (Ctrl+Alt+Left)
Moves the selected item one level to the left in a hierarchical arrangement. Outdents
text items.
Move Right (Ctrl+Alt+Right)
Moves the selected item one level to the right in a hierarchical arrangement. Indents
text items.
Find (Ctrl+F)
Displays options for finding matching entries based on specific search words or values
within a particular column in a table.
Find Next (Alt+F)
Finds and highlights the next matching entry in a column. Available only in tables after
an original Find operation.
Full Screen Mode (F11)
Expands the current work area so it fills the entire display. Non-essential controls such
as navigation menus are hidden from this mode. When in full screen mode, click this
toolbutton again to restore the normal viewing mode.
Export to Excel
Exports all data as it appears in the current view to a Microsoft® Excel spreadsheet
(.xls) file. Customize the rows to display only the data you want to export.
Print (Ctrl+P)
Prints the current page, table, chart, or item.

1280
Print Preview
Displays a temporary preview of the printed output. You can then decide to continue
printing or cancel.
Page Setup
Displays options for customizing the printed output.
Enterprise Data Resource Curves Toolbar
The following icons and screen elements appear in this toolbar; however, their availability
is subject to change based on your current selections, view settings, security permissions,
and other factors.
Screen Elements
Save (Ctrl+S)
Saves any new or modified entries to the database.
Cancel (Esc)
Cancels any new or modified entries and reverts back to the last saved state.
Add (Insert)
Creates a new entry in the current table.
Delete (Delete)
Deletes or removes the currently selected data items or table rows.
Caution: Your selected data is permanently deleted once you click Save.
Copy (Ctrl+C)
Copies the selected item and applicable attributes to the temporary clipboard,
leaving the original in its current location. The copied item and applicable attributes
can then be pasted into another supported location.
Paste (Ctrl+V)
Completes a Cut or Copy operation by inserting an item and its supported attributes
into a new location.
Find (Ctrl+F)
Displays options for finding matching entries based on specific search words or values
within a particular column in a table.
Find Next (Alt+F)
Finds and highlights the next matching entry in a column. Available only in tables after
an original Find operation.

Reference Topics
1281
Full Screen Mode (F11)
Expands the current work area so it fills the entire display. Non-essential controls such
as navigation menus are hidden from this mode. When in full screen mode, click this
toolbutton again to restore the normal viewing mode.
Enterprise Data Risk Categories Toolbar
Overview
The following icons and screen elements appear in this toolbar; however, their availability
is subject to change based on your current selections, view settings, security permissions,
and other factors.
Screen Elements
Save (Ctrl+S)
Saves any new or modified entries to the database.
Cancel (Esc)
Cancels any new or modified entries and reverts back to the last saved state.
Add (Insert)
Creates a new category for managing different risk types. For example, Schedule
Constraints or New Requirements.
Delete (Delete)
Deletes or removes the currently selected data items or table rows.
Caution: Your selected data is permanently deleted once you click Save.
Move Up (Ctrl+Alt+Up)
Moves the selected item one level higher in a hierarchical arrangement.
Move Down (Ctrl+Alt+Down)
Moves the selected item one level lower in a hierarchical arrangement.
Find (Ctrl+F)
Displays options for finding matching entries based on specific search words or values
within a particular column in a table.
Find Next (Alt+F)
Finds and highlights the next matching entry in a column. Available only in tables after
an original Find operation.

1282
Full Screen Mode (F11)
Expands the current work area so it fills the entire display. Non-essential controls such
as navigation menus are hidden from this mode. When in full screen mode, click this
toolbutton again to restore the normal viewing mode.
Print (Ctrl+P)
Prints the current page, table, chart, or item.
Print Preview
Displays a temporary preview of the printed output. You can then decide to continue
printing or cancel.
Page Setup
Displays options for customizing the printed output.
Enterprise Data Risk Scoring Matrices Toolbar
Overview
The following icons and screen elements appear in this toolbar; however, their availability
is subject to change based on your current selections, view settings, security permissions,
and other factors.
Screen Elements
Save (Ctrl+S)
Saves any new or modified entries to the database.
Cancel (Esc)
Cancels any new or modified entries and reverts back to the last saved state.
Add (Insert)
Creates a new entry in the current table.
Delete (Delete)
Deletes or removes the currently selected data items or table rows.
Caution: Your selected data is permanently deleted once you click Save.
Cut (Ctrl+X)
Cuts the selected item and applicable attributes to the temporary clipboard,
removing it from its current location. The item and applicable attributes can then be
pasted to another supported location.

Reference Topics
1283
Copy (Ctrl+C)
Copies the selected item and applicable attributes to the temporary clipboard,
leaving the original in its current location. The copied item and applicable attributes
can then be pasted into another supported location.
Paste (Ctrl+V)
Completes a Cut or Copy operation by inserting an item and its supported attributes
into a new location.
Find (Ctrl+F)
Displays options for finding matching entries based on specific search words or values
within a particular column in a table.
Find Next (Alt+F)
Finds and highlights the next matching entry in a column. Available only in tables after
an original Find operation.
Select Columns
Displays a menu of the available fields you can show or hide as columns in the current
table.
Group By
Displays a menu of the available fields you can select to group related rows in a table
into hierarchical lists you can expand and collapse. For example, group by a
Category field to arrange all rows hierarchically by their Category field values. Expand
the Category A group to view its data rows, the Category B group to view its data
rows, and so on.
Full Screen Mode (F11)
Expands the current work area so it fills the entire display. Non-essential controls such
as navigation menus are hidden from this mode. When in full screen mode, click this
toolbutton again to restore the normal viewing mode.
Print (Ctrl+P)
Prints the current page, table, chart, or item.
Print Preview
Displays a temporary preview of the printed output. You can then decide to continue
printing or cancel.
Page Setup
Displays options for customizing the printed output.

1284
Enterprise Data Timesheet Periods Toolbar
Overview
The following icons and screen elements appear in this toolbar; however, their availability
is subject to change based on your current selections, view settings, security permissions,
and other factors.
Screen Elements
Save (Ctrl+S)
Saves any new or modified entries to the database.
Cancel (Esc)
Cancels any new or modified entries and reverts back to the last saved state.
Add (Insert)
Creates a new entry in the current table.
Add Batch
Creates a new batch of timesheet periods.
Delete (Delete)
Deletes or removes the currently selected data items or table rows.
Caution: Your selected data is permanently deleted once you click Save.
Find (Ctrl+F)
Displays options for finding matching entries based on specific search words or values
within a particular column in a table.
Find Next (Alt+F)
Finds and highlights the next matching entry in a column. Available only in tables after
an original Find operation.
Full Screen Mode (F11)
Expands the current work area so it fills the entire display. Non-essential controls such
as navigation menus are hidden from this mode. When in full screen mode, click this
toolbutton again to restore the normal viewing mode.
Print (Ctrl+P)
Prints the current page, table, chart, or item.
Print Preview
Displays a temporary preview of the printed output. You can then decide to continue
printing or cancel.

Reference Topics
1285
Page Setup
Displays options for customizing the printed output.
Enterprise Data Units of Measure Toolbar
Overview
The following icons and screen elements appear in this toolbar; however, their availability
is subject to change based on your current selections, view settings, security permissions,
and other factors.
Screen Elements
Save (Ctrl+S)
Saves any new or modified entries to the database.
Cancel (Esc)
Cancels any new or modified entries and reverts back to the last saved state.
Add (Insert)
Creates a new entry in the current table.
Delete (Delete)
Deletes or removes the currently selected data items or table rows.
Caution: Your selected data is permanently deleted once you click Save.
Move Up (Ctrl+Alt+Up)
Moves the selected item one level higher in a hierarchical arrangement.
Move Down (Ctrl+Alt+Down)
Moves the selected item one level lower in a hierarchical arrangement.
Find (Ctrl+F)
Displays options for finding matching entries based on specific search words or values
within a particular column in a table.
Find Next (Alt+F)
Finds and highlights the next matching entry in a column. Available only in tables after
an original Find operation.
Full Screen Mode (F11)
Expands the current work area so it fills the entire display. Non-essential controls such
as navigation menus are hidden from this mode. When in full screen mode, click this
toolbutton again to restore the normal viewing mode.
1286
Print (Ctrl+P)
Prints the current page, table, chart, or item.
Print Preview
Displays a temporary preview of the printed output. You can then decide to continue
printing or cancel.
Page Setup
Displays options for customizing the printed output.
EPS Toolbar
Overview
This toolbar contains toolbuttons also found in the Actions, Edit, and View menus and
their corresponding toolbars. These menus are fixed; however, the toobuttons available
in the toolbar are customizable and automatically enabled or disabled based on
selections you make.
Screen Elements
Actions menu
See Actions Menu on EPS Page (on page 1180).
Edit menu
See Edit Menu on EPS Page (on page 1254).
View menu
See View Menu on EPS Page (on page 1368).
EPS View toolbar
See EPS View Toolbar (on page 1286).
EPS View Toolbar
Overview
This toolbar contains fixed toolbuttons for modifying the view of the EPS.
Screen Elements
Gantt Chart
Opens the table, Gantt chart, and a corresponding toolbar. The Gantt chart enables
you to view a graphical display of progress. The Gantt chart is customizable.

Reference Topics
1287
Table
Opens the table which enables you to view column information for projects and EPSs.
View list
Identifies the view for the work area. Views are arranged in the following categories:
User: A view created by the user. Only the user can display, edit, or delete this
view.
Multiple Users: A view created by one user who designates other users who can
also display this view. Only the creator can edit or delete a multiple user view.
Global: A view that any user can display. Only the creator and users with the
required security privilege can edit or delete a global view.
View
Displays the following options:
Save View
Saves the changes applied to the current view. If you navigate away from the page,
you are prompted to save the view or discard the changes you made.
Save View As
Displays options for saving the current view as a new view with a new name.
Delete View
Permanently removes the current view.
Customize View...
Opens the Customize View dialog box with options that vary depending on your
current page. The dialog box has a series of tabs to customize the columns, grouping,
filters, bars, Gantt chart, usage, and security access.
Expenses Toolbar of the Activities Page
Overview
The following icons and screen elements appear in this toolbar; however, their availability
is subject to change based on your current selections, view settings, security permissions,
and other factors.
Screen Elements
Add Expense (Insert)
Creates a new expense for the selected activity.
Delete (Delete)
Deletes or removes the currently selected data items or table rows.

1288
Caution: Your selected data is permanently deleted once you click Save.
Customize Columns
Displays choices for customizing the columns (fields) that appear on the selected
screen. (Available only in the Gantt chart and Table views.)
Activity selector
Cycles through the available activities and determines which data display in the
detail window. Click or to change which activity and its corresponding data
are displayed.
Filters Dialog Box Toolbar
Overview
The following icons and screen elements appear in this toolbar; however, their availability
is subject to change based on your current selections, view settings, security permissions,
and other factors.
Screen Elements
Modify Filter
Opens the Modify Filter dialog box where you can modify the filter's definition and
configure the users who can access it.
Add Filter
Opens the Create Filter dialog box where you can enter a name for the filter,
configure its definition, and configure the users who can access it.
Delete
Deletes the selected item or items permanently.
Cut
Cuts the selected item and applicable attributes to the temporary clipboard,
removing it from its current location. The item and applicable attributes can then be
pasted to another supported location.
Copy
Copies the selected item and applicable attributes to the temporary clipboard,
leaving the original in its current location. The copied item and applicable attributes
can then be pasted to another supported location.
Paste
Completes a Cut or Copy operation by inserting an item and its supported attributes
into a new location.

Reference Topics
1289
Show matches for list
Determines whether assignment data displayed is based on all applied filters or any
applied filters.
Filters Tab Toolbar
Overview
The following icons and screen elements appear in this toolbar; however, their availability
is subject to change based on your current selections, view settings, security permissions,
and other factors.
Screen Elements
Modify Filter
Opens the Modify Filter dialog box where you can modify the filter's definition and
configure the users who can access it.
Add Filter
Opens the Create Filter dialog box where you can enter a name for the filter,
configure its definition, and configure the users who can access it.
Delete
Deletes the selected item or items permanently.
Cut
Cuts the selected item and applicable attributes to the temporary clipboard,
removing it from its current location. The item and applicable attributes can then be
pasted to another supported location.
Copy
Copies the selected item and applicable attributes to the temporary clipboard,
leaving the original in its current location. The copied item and applicable attributes
can then be pasted to another supported location.
Paste
Completes a Cut or Copy operation by inserting an item and its supported attributes
into a new location.
Show matches for list
Determines if activities display based on all applied filters or any applied filters.

1290
Funding Toolbar
Overview
The following icons and screen elements appear in this toolbar; however, their availability
is subject to change based on your current selections, view settings, security permissions,
and other factors.
Screen Elements
Add (Insert)
Adds a funding source to the project. You can then configure the amount and
percentage of the contribution from the fund source.
Delete (Delete)
Deletes the selected data items or table rows.
Project/EPS selector
Cycles through the available projects or EPSs and determines which data display in
the detail window. Click or to change which element and its corresponding
data are displayed.
Histogram Chart Settings Area
The Histogram Chart settings area displays configurable options for viewing portfolio
data in a histogram, side-by-side histogram, or stacked histogram chart view. Use the
following fields to modify your histogram chart view.
Screen Elements
X Axis field
Select a field value to determine information displayed through the X Axis.
Y Axis field
Select a field value to determine the information displayed through the Y Axis.
Color Theme list
Determines colors displayed on the chart. Select a predefined or user-defined color
theme.
Horizontal Gridlines option
Determines whether to show or hide horizontal gridlines.
Vertical Gridlines option
Determines whether to show or hide vertical gridlines.

Reference Topics
1291
Show 3-D option
Determines whether to show a 3-Dimensional view of chart.
Show All Values on Axis option
Determines whether all values are displayed in the histogram. Select this option to
include all values on the X-axis and not just values with data.
Group By list
Select a field value to determine your preferred option to group your data.This option
is only available for the Side-by-Side Histogram view.
Stacked by field
Select a field value to determine your preferred option to stack your data. This option
is only available for the Stacked Histogram view.
Import Templates (Reference)
The following information is important to keep in mind when creating import templates:
If a duplicate activity name exists, it will be added again as a new activity.
In the import file, column order is irrelevant and the data fields you import are not
required to match the columns in your current activity view. Data for import is
identified by the internal names of the data fields in the first row of the spreadsheet.
The import process will start at the first tab of the import file, regardless of the tab
name.
Blank rows are ignored.
The import file contains two rows of column headings that match the columns you
previously selected to display in the table or Gantt chart. The first row of headings
identify the data to be imported into each column of your activity view. Do not
change the content in columns of the first row. The second row contains descriptive
information that is not used by the import process. You can modify the content in the
second row.
If values are not provided for mandatory fields, such as the date field, a default value
will be set and corresponding data will be imported.
Although the activity view is limited to 30 columns, you can add columns to your
spreadsheet to import more than 30 fields of data.
All activity fields except for non-editable fields are available for import. Examples of
non-editable fields include: expenses, notebook topics, predecessors, resource IDs,
resource names, role IDs, steps, and successors. Non-editable columns display an
asterisk (*). You cannot import data for these fields. At least one editable field must be
provided in a row of the import file for an activity to be imported.
If an Enterprise Data field value does not exist for a Global Activity Code, Enterprise
Project Structure (EPS) Activity Code, Project Activity Code, Calendar, Cost Account,
or Primary Resource, the assignment will not be added.
Secure activity codes are not imported, even if the column exists in the spreadsheet.

1292
Durations with abbreviations that match the abbreviations set on the Time Periods
page of the Application Settings page are imported.
Issues Toolbar
Overview
The following icons and screen elements appear in this toolbar; however, their availability is subject to
change based on your current selections, view settings, security permissions, and other factors.
Screen Elements
Add Issue (Insert)
Creates a new issue.
Delete (Delete)
Deletes or removes the currently selected data items or table rows.
Caution: Your selected data is permanently deleted once you click Save.
Customize Columns
Displays choices for customizing the columns (fields) that appear on the selected
screen. (Available only in the Gantt chart and Table views.)
Activity/WBS/Project selector
Cycles through the available activities, WBSs, or projects and determines which data
display in the detail window. Click or to change which activity, WBS, or project
and its corresponding data are displayed.
Level Resources Dialog Box (Reference)
If you select Activity Leveling priority, ascending levels higher priority activities first, and
descending levels lower priority activities first.
If you select Project Leveling priority, ascending levels higher priority projects first, and
descending levels lower priority projects first.
If you select Planned Start priority, ascending levels activities with earlier planned start
dates first, and descending levels activities with later planned start dates first.
If you select Planned Finish priority, ascending levels activities with earlier planned finish
dates first, and descending levels lower activities with later planned finish dates first.
If you select Planned Duration priority, ascending levels activities with shorter original or
planned durations first, and descending levels activities with longer original or planned
durations first.
If you select Remaining Duration priority, ascending levels activities with shorter remaining
durations first, and descending levels activities with longer remaining duration first.

Reference Topics
1293
If you select Total Float priority, ascending levels activities with less total float or more
critical activities first, and descending levels activities with more total float or less critical
activities first.
If you select Early Start priority, ascending levels activities with earlier, early start dates first,
and descending levels activities with later, early start dates first.
If you select Early Finish priority, ascending levels activities with earlier, early finish dates
first, and descending levels activities with later, early finish dates first.
If you select Late Start priority, ascending levels activities with earlier, late start dates first,
and descending levels activities with later, late start dates first.
If you select Late Finish priority, ascending levels activities with earlier, late finish dates first,
and descending levels activities with later, late finish dates first.
My Calendar Dialog Box Toolbar
Overview
The following icons and screen elements appear in this toolbar; however, their availability
is subject to change based on your current selections, view settings, security permissions,
and other factors.
Screen Elements
Save (Ctrl+S)
Saves any new or modified entries to the database.
Cancel (Esc)
Cancels any new or modified entries and reverts back to the last saved state.
Edit Hours Per Period
Displays a dialog box in which you specify the number of work hours for each time
period. See Set Time Periods Dialog Box of Calendars (on page 1081).
Import
Displays a dialog box in which you search for and select files to import as calendar
events. See Import Calendar Events Dialog Box (on page 835).
Print (Ctrl+P)
Prints the current page, table, chart, or item.
Print Preview
Displays a temporary preview of the printed output. You can then decide to continue
printing or cancel.

1294
My Reviews Toolbar
Overview
The following icons and screen elements appear in this toolbar; however, their availability
is subject to change based on your current selections, view settings, security permissions,
and other factors.
Screen Elements
Edit Details
Displays the Document Details dialog box to configure the details of the selected
document.
Terminate
Stops the selected document review and removes it from view.
Filter By
Displays options for reducing the number of values displayed in a list or table by
showing only selected values and removing or filtering out unwanted values.. Select
from one of the following options:
In Review
Approved
Rejected
All
My Workflows Toolbar
Overview
The following icons and screen elements appear in this toolbar; however, their availability
is subject to change based on your current selections, view settings, security permissions,
and other factors.
Screen Elements
Initiate a Workflow
Initiates a new instance of a workflow based on your selection from a list of the
available predefined workflow templates.
History
Opens a History dialog box where you can view details for the currently selected
instance of the workflow.

Reference Topics
1295
View Status
Opens a visual image of the workflow diagram in the Workflow Instance dialog box
where you can view the current approval stage, remaining tasks required before the
workflow is appoved, and other details for this instance of the workflow.
Select Columns
Displays a menu of the available fields you can show or hide as columns in the current
table.
Group By
Displays a menu of the available fields you can select to group related rows in a table
into hierarchical lists you can expand and collapse. For example, group by a
Category field to arrange all rows hierarchically by their Category field values. Expand
the Category A group to view its data rows, the Category B group to view its data
rows, and so on.
Role list
A list of available workflow roles you can select to filter the My Workflows table. For
example, choose Initiator to filter all the entries such that only the workflows currently
assigned to the initiator role appear in the table. The default setting is All.
Status list
A list of available workflow status types you can select to filter the My Workflows table.
For example, choose Approved to filter all the entries such that only the workflows
that have been approved appear in the table. The default setting is In Progress.
Note: The Role and Status lists can be used together to filter the
data in the table. For example, you can filter by the Reviewer role
and the In Progress status to view all the current workflows awaiting
reviewer input.
Notebooks Toolbar
Overview
The following icons and screen elements appear in this toolbar; however, their availability
is subject to change based on your current selections, view settings, security permissions,
and other factors.
Screen Elements
Add Notebook Topics (Insert)
Creates a new notebook topic or category for managing notes throughout a
project's lifecycle.

1296
Delete (Delete)
Deletes or removes the currently selected data items or table rows.
Caution: Your selected data is permanently deleted once you click Save.
Activity/WBS/Project/EPS node selector
Cycles through the available activities, WBSs, projects, or EPS nodes and determines
which data display in the detail window. Click or to change which element
and its corresponding data are displayed.
Open Projects Dialog Box Toolbar
Overview
The following icons and screen elements appear in this toolbar; however, their availability
is subject to change based on your current selections, view settings, security permissions,
and other factors.
Screen Elements
Select Project Type
Filters available information by project or template.
Organized By (Ctrl+M)
Organizes information based on EPS nodes, portfolios, or project codes.
Columns (Ctrl+Q)
Displays choices for customizing the columns that appear on the current screen.
Select Activity View (Ctrl+R)
Displays a menu of activity views. Choose the view to use when the selected projects
are opened.
Search (Ctrl+F)
Displays options for finding a specific matching entry or entries based on search
criteria.
Search For (Ctrl+Shift+F)
Displays options for customizing a search.
Pages Supporting Filters
The following areas of P6 support filtering:

Reference Topics
1297
Page Description
Activities page Apply filters based on project and activity parameters to
target specific activities.
EPS page Apply filters based on EPS and project parameters to
target specific projects.
Resource Assignments page Apply filters based on resource and role parameters to
target specific assignments.
Dashboards page Apply filters based on portfolios, projects, or codes to
target specific project and portfolio data displayed in
portlets on the dashboard.
Timesheet Approval page Apply filters based on timesheet status to target specific
timesheets.
Portfolio Analysis
page
Apply filters based on EPS, portfolio, and project code to
target specific portfolio data.
Issues page and
Issues portlets
Apply filters based on issue parameters to target specific
issues.
Risks page Apply filters based on risk parameters to target specific
risks.
Create Portfolio and
Portfolio Details
pages
Apply filters based on project data, codes, and UDFs to
target specific projects that make up a portfolio.
Workflow portlet Apply basic filters to view workflow tasks on the Action
Required tab and filter by role or status on the My
Workflows tab.
Performance Status Calculations
This topic provides additional information about the formulas used to calculate the
performance status metrics shown on the Portfolio Performance Status page. The
Portfolio Performance Status page displays summarized schedule and cost or labor unit
data based on one of three performance metrics you select:
Schedule
Earned Value (SV and CV)
Index (SPI, CPI, and TCPI)
For each metric, to date and forecast data are provided at the group, project, and WBS
levels. The values you specify in the Performance Threshold area of the My Preferences
page Global tab determine which visual indicators apply to each metric.

1298
Schedule
When you select Schedule, the page displays the following calculated data:
Schedule to Date
(Baseline Duration multiplied by Performance % Complete) minus (Baseline Duration
multiplied by Schedule % Complete)
Performance % Complete = Earned Value divided by BAC
Schedule % Complete = Planned Value divided by BAC
Labor Units to Date
Earned Value Labor Units minus Actual Labor Units
threshold percentage calculation = Labor Units to date divided by Earned Value
Labor Units
Cost to Date
Earned Value — Actual Cost
threshold percentage calculation = Cost to date/Earned Value
Schedule at Completion
Remaining Finish Date - Baseline Finish Date
Labor Units at Completion
BAC Labor Units - EAC Labor Units
threshold percentage calculation = Labor Units at Completion/BAC Labor Units
Cost at Completion
BAC- EAC
threshold percentage calculation = Cost at Completion/BAC
Earned Value
When you select Earned Value, the page displays the following calculated data:
Schedule to Date (SV)
Earned Value Labor Units - Planned Value Labor Units
threshold percentage calculation = Schedule to Date/Planned Value Labor Units
Labor Units to Date (CV)
Earned Value Labor Units - Actual Labor Units
threshold percentage calculation = Labor Units to Date/Earned Value Labor Units
Cost to Date (CV)
Earned Value - Actual Cost
threshold percentage calculation = Cost to Date/Earned Value

Reference Topics
1299
Schedule at Completion
BAC*SVI
SVI = SV/Planned Value Labor Units
threshold percentage calculation = Schedule at Completion/BAC
Labor Units at Completion
BAC Labor Units*CVI
threshold percentage calculation = Labor Units at Completion/BAC Labor Units
Cost at Completion
BAC*CVI
threshold percentage calculation = Cost at Completion/BAC
Index
When you select Index, the page displays the following calculated data:
SPI
SPI = bcwp / bcws
CPI
CPI = bcwp / ACWP
ACWP = act_equip_cost + act_expense_cost + act_work_cost
TCPI
TCPI = (BAC – bcwp) / (EAC – ACWP)
BAC = base_equip_cost + base_expense_cost + base_work_cost
EAC = (act_equip_cost + act_expense_cost + act_work_cost) + (remain_equip_cost +
remain_expense_cost + remain_work_cost)
ACWP = act_equip_cost + act_expense_cost + act_work_cost
Personal Information Section of the Content Tab of the Customize Dashboard Page
Overview
Use this section to enable and configure portlets in the dashboard that display
information pertaining directly to the projects on which you are working.
Screen Elements
My Projects option
Determines whether the My Projects portlet displays on the dashboard.
Show Projects where I: options
Determines whether the following options are applied to the dashboard:

1300
have access rights
am assigned as a resource
am the Project Owner
My Workgroups option
Determines whether the My Workgroups portlet displays on the dashboard. On the
dashboard, workgroups are organized by project from all workgroups that you are
associated with and are then sorted by name within a project.
My Activities option
Determines whether the My Activities portlet displays on the dashboard.
Show Activities field
The value that determines how many days worth of activities the portlet shows.
My Risks option
Determines whether the My Risks portlet displays on the dashboard.
Customize link
Opens a dialog box with configurable options for customizing risks. See Customize
Risks Dialog Box (on page 690).
My Issues option
Determines whether the My Issues portlet displays on the dashboard.
Customize link
Opens a dialog box with configurable options for customizing issues. See Customize
Project Issues Dialog Box (on page 686).
Communication Center option
Determines whether the Communication Center portlet displays on the dashboard.
Display: options
Determines if all teams or only the teams based on the dashboard filter are displayed
in the Communication Center portlet.
Show team members who: options
Determines what team members the application displays in the Communication
Center portlet.
My Documents option
Determines whether the My Documents portlet displays on the dashboard.
My Calendar option
Determines whether the My Calendar portlet displays on the dashboard.
Reference Topics
1301
Show activities option
Determines whether project activities are shown in the portlet.
Getting Here
1) Click Dashboards.
2) On the Dashboards page, select a dashboard.
3) On the dashboard, click Customize.
4) On the Dashboard Details page, click the Content tab.
5) On the Content tab, expand the Personal Information section.
Pie Chart Settings Area
The Pie Chart settings area displays configurable options for viewing portfolio data in a
pie chart view. Use the following fields to modify your pie chart view.
Screen Elements
Data list
Select a field of data to display in the Pie Chart view.
Select an option from the following categories:
Budget
Cost
Durations
Earned Value
General
Number of Activities
Percent Complete
Units
User Defined
Group By list
Select a field value to determine your preferred option to group your data.
Color Theme list
Determines colors displayed on the chart. Select a predefined or user-defined color
theme.
Pie Data Label option
Determines whether to show the Pie Data Label.
Group by label option
Determines whether to show the Group by label.

1302
Show percentage option
Determines whether to show percentage on the chart.
Show 3-D option
Determines whether to show a 3-Dimensional view of chart.
Planning Toolbar
Overview
The following icons and screen elements appear in this toolbar; however, their availability
is subject to change based on your current selections, view settings, security permissions,
and other factors.
Screen Elements
Assign Resource
Opens a dialog box where you select a resource to assign to the selected project or
WBS.
Assign Resource Using Search
Opens a dialog box where you enter search criteria to locate a resource to assign.
Assign Role
Opens a dialog box where you select a role to assign to the selected project or WBS.
Assign Project
Open a dialog box where you select a project to assign to the selected resource.
Split Resource Assignment
Divides the selected resource assignment between the currently selected resource
and another one you choose based on an allocation percentage.
Cut
Cuts the selected item and applicable attributes to the temporary clipboard,
removing it from its current location. The item and applicable attributes can then be
pasted to another supported location.
Copy
Copies the selected item and applicable attributes to the temporary clipboard,
leaving the original in its current location. The copied item and applicable attributes
can then be pasted to another supported location.

Reference Topics
1303
Paste
Completes a Cut or Copy operation by inserting an item and its supported attributes
into a new location.
Delete
Deletes the selected item or items permanently.
Portfolio Analysis Settings Area
The Portfolio Analysis settings area displays configurable options for viewing portfolio
data.
Basic Settings
The following fields are common in all views.
Filter by field
The portfolio, project code, or project that the application uses to filter the
dashboard. The portlets only display information that meet the selected filtering
criteria.
You can change the Filter by option for a private (user-defined) dashboard, and for
any multi-user or global dashboard you create.
Scenario field
Select <Latest Data> or a scenario to apply to the data. The Portfolio Analysis page
displays historical data preserved in a scenario, or the latest summarized data
(<Latest Data>), depending on your selection.
View field
Determines how data is displayed in the work area.
Select type of view from following categories:
Bubble Chart: A Bubble chart lets you analyze three aspects of project data. The
x-axis represents one data field, the y-axis represents a second field, and the size
of the bubble represents a third field. A bubble chart is useful when you want to
analyze three independent project variables at one time.
Histogram: A histogram lets you analyze project data in a vertical bar chart
format. You can select a project data field to display on the x-axis and another
field to display on the y-axis of the chart; typically, the x-axis represents
categorical data, and the y-axis represents individual data values.
Pie Chart: A Pie chart is a circular chart divided into slices, where each slice
represents a particular group; the size of the size of the slice represents the value of
the selected data field, specific to the group. A pie chart is useful for analyzing
relative parts of a whole.
Scorecard: A scorecard lets you analyze data in a spreadsheet-type format. You
can use a scorecard to assist with more sophisticated analysis of a set of projects.

1304
Side-by-Side Histogram: A side-by-side histogram is a more sophisticated version of
the histogram. In this type of chart, categorized data can be grouped,
side-by-side, to assist with comparisons. A side-by-side chart is useful when
analyzing relative parts of a whole.
Stacked Histogram: A stacked histogram is a more sophisticated version of the
histogram. In this type of chart, categorized data can be grouped, or stacked, to
assist with comparisons. A stacked histogram is useful when analyzing relative parts
of a whole.
More Settings
Additional available settings vary according to your chosen view.
For Bubble Charts, see Bubble Chart Settings Area (on page 1244).
For Pie Charts, see Pie Chart Settings Area (on page 1301).
For Histograms, Side-by-Side Histograms, and Stacked Histograms, see Histogram
Chart Settings Area (on page 1290).
For Scorecards, see Scorecard Settings Area (on page 1345).
Portfolio Analysis Toolbar
The Portfolio Analysis toolbar includes the following:
Screen Elements
Save
Saves your new or modified entries to the database.
Save As
Displays options for saving the current item as a new instance with a new name.
Cancel
Cancels any pending changes and reverts back to the last saved state.
Create Portfolio View
Displays options for creating a new portfolio view based on either an existing view or
new attributes you define.
Maximize
Maximizes the current chart in the work area, temporarily hiding the vertical or
horizontal compare view. Click Restore to reset the page to its original view.
Print Preview
Displays a temporary preview of the printed output. You can then decide to continue
printing or cancel.

Reference Topics
1305
Scorecard View
When you choose a scorecard view, the Portfolio Analysis Toolbar displays the following
additional options:
Add Project
Displays a dialog box for selecting defaults for newly created projects. Click to
assign a Parent EPS and Responsible Manager. Click Select to close and save your
choices or Cancel to close the dialog box where all information will be lost.
Delete Project
Deletes a selected project in the view.
Create Portfolio from Selected Projects
Redirects you to the Create Portfolio page.
Waterline
Displays the Customize Scorecard dialog box and directs you to the Waterline tab.
Export Spreadsheet
Exports all data as it appears in the current view to a Microsoft® Excel spreadsheet
(.xls) file. Customize the rows to display only the data you want to export.
Portfolios Navigation Bar
Click a portfolio toolbar button to open its corresponding page.
Screen Elements
Portfolio Analysis
Opens the Portfolio Analysis page, which enables you to to analyze portfolio data,
conduct side-by-side comparisons of two project groups, and apply what-if scenarios
and waterline analysis techniques to assist with executive-level critical decision
making.
Capacity Planning
Opens the Capacity Planning page, which enables you to analyze role allocation
and cost over time. Multiple chart formats display role allocation for the projects and
roles you select, enabling you to quickly identify areas of under or over allocation.
Performance Status
Opens the Performance Status page, which displays summarized schedule and cost
or labor unit data based on the performance metric you select.

1306
Gantt Chart
Opens the Gantt Chart page, which displays timescaled performance or earned
value schedule information at the WBS level, along with unit or cost data, in a
spreadsheet or histogram.
ROI
Opens the ROI page, which displays cost/benefit information based on live data for
the open project group.
Details
Use this page to modify a group of projects, called a portfolio.
Pre-defined BI Publisher Reports
This section lists and describes the pre-defined BI Publisher reports that are supplied with
P6. You can use these reports to display various types of project and portfolio data you
need. Your administrator can modify the list of reports available for your use, including
removing pre-defined reports or adding additional reports to your view.
Report Name Description Parameters
Activity Reports
Activity Look Ahead Displays activities, along with
dates and status, occurring
within specified weeks for the
selected projects.
Project ID, Number of
Weeks
Schedule Report with
Notebooks
Provides a list of activities for
the selected projects along
with all associated notebook
topics.
Project ID
Cross Project
Relationships
Lists the projects and
associated activities that are
predecessors or successors to
the selected project,
providing visibility into cross
project impacts.
Project ID
Duration Analysis Compares planned and
actual duration of the
activities for the selected
projects along with upper and
lower thresholds to analyze
duration estimates.
Project ID

Reference Topics
1307
Activity Relationships Lists the activities for the
selected projects along with
their predecessors and
successors. Report includes
relationship type and lag
along with dates and float of
the related activities.
Project ID
Project Reports
High Level Planning
Assignments
A 9 month look ahead of high
level resources and roles
assigned to the selected
projects through the resource
planning spreadsheet.
Information includes effort,
commitment status and
dates.
Project ID
Qualitative Risk
Report
Reports on all risks for the
select projects. Includes risk
information, risk impact
assessment, impacted
activities, and risk response
plans.
Project ID
Issues Lists all issues identified for the
selected projects, grouped by
status. The issue details include
priority, criticality, and issue
description, if provided.
Project ID
Document
Assignments
Provides a list of all documents
assigned to activities and
WBSs within the specified
project, grouped by
document category.
Project ID
Project Earned Value Displays monthly actual cost,
earned value, and planned
value in both a bar chart
along with a table for the
selected projects.
Project ID
Project Status Report Provides a project overview
that includes project code
values, project costs, issues,
risks, status of the milestones,
and a list of notebook topics.
Project ID, Project Status

1308
Project Governance
Non-Compliance
Report
Lists all projects and their
critical project-level settings.
Settings that deviate from the
standard are highlighted in
the report.
Project ID
Weekly Schedule
Performance
Compares the activity actual
finish date to the baseline
finish date. Activities are
grouped by week and
project. The report will display
information starting 4 weeks
prior to the date set in the
report parameters.
Project ID, 4 Weeks Prior
To: <date>
Risk Scoring Report of the project risk
scoring matrix. Includes
threshold definitions grouped
by type (Probability,
Schedule, Cost, User-defined,
and Tolerance) and numeric
and alphanumeric probability
and impact diagrams (PIDs).
Project ID
Project Plan
Hierarchy
Displays the project plan
which lists all WBSs and
activities for the selected
project. The activity details
include the status, start and
finish dates, and the
associated activity steps.
Project ID
Portfolio Reports
Investment
Alignment Chart
Displays a bubble chart that
plots selected projects against
their strategic and financial
rating with the bubble size
representing the At
Completion Cost.
Project ID
Code Assignments Provides a list of projects for
the specified portfolio along
with the code values assigned
for the selected project code.
Project Code, Portfolio
Name

Reference Topics
1309
Project Portfolio
Review
Identifies issues and risks within
the selected portfolio and
groups them by project.
Includes status and priority of
the issue or risk along with
project-level information.
Portfolio Name
Portfolio Counts Provides a count of all
projects and activities within
the selected portfolio. In
addition, two pie charts
display representing the
number of open and closed
issues and risks.
Portfolio Name
Administrative Reports
Timesheets
Timesheets Status
without Notes
Lists timesheets for resources
along with the status,
submitted and reviewed
dates, and name of the last
reviewer.
NA
Timesheets Status
with Notes
Lists timesheets for resources
along with the status,
submitted and reviewed
dates, name of the last
reviewer, and associated
timesheet notes.
Number of Weeks
Timesheets with
Detailed Hours
Lists timesheets for the
specified date range. For
each timesheet, the activities
and detailed hours per day
are provided.
Start Date, End Date
Timesheet
Compliance
Displays a bar chart of
timesheets status by resource
team for a given period.
Includes a tabular view with
total number of approved
hours as well as percentage
completed versus those either
not started, in progress, or
rejected.
Timesheet Period Start,
Timesheet Period Finish

1310
Project Template
Management
Lists all project templates
along with status, division, and
added by person and date.
NA
Calendar Use Lists all Global, Project, and
Resource calendars, including
identification of the projects
and resources using each
calendar.
NA
Project Governance
Non-Compliance
Report
Lists core project-level settings
for each project, highlighting
setting values that are not
compliant.
Project ID
Users Lists all users and their personal
name along with their
associated resource and
global security profile.
NA
Profile Privileges Lists the privileges that are
enabled for each global and
project-level security profile.
NA
Users Project
Assignments
Displays OBS elements along
with the corresponding
security profile, EPSs, and
Projects assigned to selected
users.
User Name
Users OBS
Assignments
Displays all OBS elements
along with the corresponding
security profile assigned to
selected users.
User Name
Resource Reports
Resource Allocation
by Project
Displays a stacked histogram
that shows effort (in hours) for
selected resources, stacking
bars by project within the start
and end date ranges.
Project ID, Start Date, End
Date, Resource ID
Resource Role Skill
Sets
Lists all resources along with
their assigned roles. The
primary role and proficiency
level is identified for each role.
NA

Reference Topics
1311
Activity Resource
Assignments
Lists resources assigned to
each activity in the selected
projects. Information includes
start and finish dates along
with duration.
Project ID
Resource Stacked
Histogram
Displays a stacked histogram
that shows effort (in hours) for
selected resources, stacking
bars by resource within the
start and end date ranges.
Project ID, Start Date, End
Date, Resource ID
FTE (headcount)
report
Displays a list of roles assigned
to the selected project(s)
along with the amount of
time-phased effort for each
role, in full time equivalents, for
the specified date range.
Project ID, Start Date, End
Date
Resource Code
Assignments
Displays a list all resource
codes and resource code
values along with the
resources assigned to each
code value.
NA
Resource Role
Associations
Displays a list of all roles in the
system and the resources
assigned to each role. The
primary role and proficiency
level is identified for each
resource.
NA
Predecessors Toolbar of the Activities Page
Overview
The following icons and screen elements appear in this toolbar; however, their availability
is subject to change based on your current selections, view settings, security permissions,
and other factors.
Screen Elements
Assign (Insert)
Displays options for selecting a predecessor activity related to the current activity.

1312
Delete (Delete)
Deletes or removes the currently selected data items or table rows.
Caution: Your selected data is permanently deleted once you click Save.
Customize Columns
Displays choices for customizing the columns (fields) that appear on the selected
screen. (Available only in the Gantt chart and Table views.)
Go to Activity (Ctrl+Home)
Moves from the current activity to the preceding activity in the hierarchal standing.
Activity selector
Cycles through the available activities and determines which data display in the
detail window. Click or to change which activity and its corresponding data
are displayed.
Preferences Columns of the EPS Table
Activity % Complete from Steps option
Determines if the activity percent complete is calculated from activity steps or from
manual input. If the option is selected, the activity percent complete will be
calculated based on activity steps. This option is clear by default.
Activity ID Prefix field
The single or combination of letters and/or numbers to act as the Activity ID Prefix. This
field can contain 1 to 20 characters.
Activity ID Suffix field
The single or combination of letters and/or numbers to set as the Activity ID Suffix. The
value must be a number between 1 and 999,999.
Activity Type list
Determines how duration and schedule dates are calculated for an activity:
Task Dependent: If resources should be scheduled based on the activity's
calendar.
Resource Dependent: If resources should be scheduled based on their assigned
calendars.
Level of Effort: For an ongoing activity whose duration depends on other activities.
The duration of a Level of Effort activity is calculated based on the schedule dates
from its predecessors and successors.
Start or Finish Milestone: If an activity marks the beginning or end of a major
project phase.
WBS Summary: For an activity with a particular WBS code.

Reference Topics
1313
Allow Duplicate Resource Assignments option
Determines whether resources can be assigned to an activity more than once.
Allow Negative Actual Units field
Determines if negative actual units can be entered on activities via timesheets in the
project.
Baseline Option field
The baseline the project uses. This field is disabled if the project is checked out.
Calendar field
The calendar assigned to the project.
Cost Account field
The cost account associated with the project.
Drive Activity Dates by Default option
Determines whether assignments will drive activity dates.
Duration Type list
Determines whether the schedule, resource availability, or costs are most important
when updating activities. The duration type applies only when you have resources
assigned to the activity. Choose a duration type based on which factor is most
important (least flexible) in planning your project.
Fiscal year list
Determines on which month the fiscal year begins.
Increment field
The number to act as the increment. The number must be a value between 1 and
99,999.
Increment Activity ID based on selected activity option
Determines if the activity numbering is based on the selected activity of on the
project's default settings.
Link Actual and Period Actual Units and Cost option
Determines whether to recalculate all actual and period actual unit and cost values
using the actual values to date based on the financial period values.
Link Percent Complete with Actuals option
Determines whether the actual units and cost values are recalculated when duration
percent complete is updated.

1314
Link Planned and At Completion option
Determines whether to recalculate all of the planned unit and cost values using the
remaining costs and units for activities that have not started.
Percent Complete Type list
Determines the way in which the application calculates the percent complete for the
activity.
This default activity percent complete type will be applied to all new activities added
to a project. If you change this setting for an existing project that has activities, the
percent complete type of those existing activities will not be changed.
Price/Unit field
The non-overtime price per unit of time for the project.
Primary Can Complete Activity option
Determines whether primary resources can mark activities as completed.
Rate Type field
The price/unit used to calculate costs for the project.
There can be up to five rate types, with each rate type reflecting a different
price/unit. Rate types are defined in P6.
Recalculate Units from Cost option
Determines whether units are updated with costs.
Resources Can Assign Themselves option
Determines whether resources can assign themselves to activities.
Resources Can Complete Assignments option
Determines whether resources can mark assignments as completed.
Resources Can View Inactive Projects option
Determines whether resources can view projects that are not currently active.
Resources Status Activities Using field
Determines how P6 Progress Reporter users enter their status for assignments.
WBS Code Separator field
The character used for separating code fields for the cost account tree.
This is also the WBS code separator for new projects by default.
When Activity Progress Removed field
Determines what the application will do if activity progress is removed: reset planned
duration and units or reset remaining duration and units.

Reference Topics
1315
When Updating Units or Costs field
Determines what the application will do if activity progress is removed: add actual to
remaining or subtract actual from at completion.
Print Preview Toolbar
When you click Print Preview in the toolbar on pages that support printing (or click
Print in a portlet), a Print Preview dialog box will appear with a page-by-page on-screen
representation of what you can expect from the actual printed output. The Print Preview
dialog box provides a Print Preview toolbar of its own. Use the toolbar to help you
preview the output before deciding to print, make small adjustments, or cancel printing
and go back to make edits and try printing again later.
Prints the current page, table, chart, or item.
Page Setup
Displays options for customizing the printed output.
First Page
Displays the first page of the printed output in the print preview window.
Previous Page
Displays the previous (lower) page of the printed output in the print preview window.
Next Page
Displays the next (higher) page of the printed output in the print preview window.
Last Page
Displays the final page of the printed output in the print preview window.
Zoom Out
Decreases the current magnification of items in the work area so they appear smaller.
Zoom In
Increases the current magnification of items in the work area so they appear larger.
Portrait
Sets the page orientation to a portrait or tall format for the current page size.
Landscape
Sets the page orientation to a landscape or wide format for the current page size.

1316
Private Documents Toolbar
Overview
The following icons and screen elements appear in this toolbar; however, their availability
is subject to change based on your current selections, view settings, security permissions,
and other factors.
Screen Elements
Add Document
Enables you to select a document to add.
Add Options menu
Displays a menu of actions supplementing the Add Document icon.
Add Document: Enables you to select a document to add.
Add from content repository: Enables you to search, browse by folder, and select
a document from the repository. You can then decide to copy the selected
document or just link to it.
Copy from existing template: Enables you to search and select a template to
copy as the basis for your new document.
Create new template: Enables you to browse and select a document template to
store for future use. You can then create new documents copied from this
template.
Add Folder: Enables you to add a document folder to the repository and set its
security policy.
Edit Details
Displays the Document Details dialog box to configure the details of the selected
document. See Document Details Dialog Box of the Private Documents Tab (with
content repository) for further details.
View Document
Opens a selected document for viewing.
View Options
Select from one of the following options in which to view the selected document
View: Displays the selected document in a separate wind
Download: Allows you to download the document to your computer. You must
select a path for where the downloaded document will be saved.
Assign to Project
Reassigns the selected document to a project.

Reference Topics
1317
Delete
Deletes the selected item or items permanently.
Check out
Enables you to specify where the to check out current document to. Use the to
browse for a location. You can also select the Open Document option to determine
whether to open or just check out the document.
Check Out Options
Check out: Displays a dialog box to enter a location for where you want the
document to be checked out to. Use to browse for a location. Use the Open
Document option to determine whether or not to open the document or just
check it out.
Check in: Displays a dialog box to select a document to be checked in. Use
to browse for a document. Use the comments field to enter a comment to be
associated with the document. The Format and Version Type fields are read-only.
Click the Check In button to keep your changes and check in the document or
click cancel to close the dialog box without checking in the document.
Undo Check Out: Displays a read-only dialog box displaying the Title, Version,
and Path of the selected checked out document. If you continue to undo the
check out, any changes made to the selected document will be lost. Click Undo
Check Out to continue or click Cancel to close the dialog and keep the
document checked out.
Cut
Cuts the selected item and applicable attributes to the temporary clipboard,
removing it from its current location. The item and applicable attributes can then be
pasted to another supported location.
Move Options
Cut: Cuts the selected item and applicable attributes to the temporary
clipboard, removing it from its current location.
Paste: Inserts an item into a new location that has been cut from its previous
location.
Search
Displays options for finding a specific matching entry or entries based on search
criteria.
Search Options
Search: Displays options for finding a specific matching entry based on criteria.
Clear Search Results: Removes the options based from your entered criteria to
display all possible entries.

1318
Project Gantt Chart Portlet Toolbar
Overview
The following icons and screen elements appear in this toolbar; however, their availability
is subject to change based on your current selections, view settings, security permissions,
and other factors.
Screen Elements
Open Project(s)
Opens the currently selected projects in the Projects section using the first page set in
your preferred view or user interface view.
Filter By
Displays options for reducing the number of values displayed in a list or table by
showing only selected values and removing or filtering out unwanted values.
Set Filter - Displays a dialog box with configurable options to select an Activity
Code by which to filter. When a filter is applied, only milestones that have the
selected code value will appear in the Gantt. See Selection Dialog Boxes for
further details of use.
Clear Filter - This option is only available when a filter is currently set. Click to
remove the currently set filter and display all milestones.
Columns
Displays a menu of the available fields you can show or hide as columns in the current
table.
Timescale
The Gantt chart time interval options. The default setting is Year/Month. Select from
one of the following intervals:
Year/Quarter
Year/Month
Quarter/Month
Month/Week
Prints the current page, table, chart, or item.
Filter field
Indicates the name of the filter currently applied to the portlet. If a filter is not applied,
No Filter is displayed.

Reference Topics
1319
Legend
A read-only field that defines the bar and milestone colors in the Gantt chart.
Current Bar
Progress
Baseline Bar
Milestone
Baseline Milestone
Project Tab Toolbar of the Documents Page
Overview
The following icons and screen elements appear in this toolbar; however, their availability
is subject to change based on your current selections, view settings, security permissions,
and other factors.
Note: This topic describes functionality only available with the
optional Content Respository feature.
Screen Elements
Refresh Documents
Refreshes the current page with any new, updated, or removed documents.
Add Document
Enables you to select a document to add.
Add Options menu
Displays a menu of actions supplementing the Add Document icon.
Add Document: Enables you to select a document to add.
Add from content repository: Enables you to search, browse by folder, and select
a document from the repository. You can then decide to copy the selected
document or just link to it.
Copy from existing template: Enables you to search and select a template to
copy as the basis for your new document.
Create new template: Enables you to browse and select a document template to
store for future use. You can then create new documents copied from this
template.
Add Folder: Enables you to add a document folder to the repository and set its
security policy.

1320
Edit Details
Displays the Document Details dialog box to configure the details of the selected
document.
View
Displays the selected document in a separate window.
View Options
Select from one of the following options in which to view the selected document:
View: Displays the selected document in a separate window.
Download: Allows you to download the document to your computer. You must
select a path for where the downloaded document will be saved.
Make Private
Click to make the selected document private.
Access Level
Select from one of the following options in which to grant access of the project:
Make Private - Click to make the selected project or document private.
Assign to Project - Click to assign the selected document to a project.
Assign to Workgroup - Click to assign the selected document to a workgroup.
Delete
Deletes the selected item or items permanently.
Check out
Enables you to specify where the to check out current document to. Use the to
browse for a location. You can also select the Open Document option to determine
whether to open or just check out the document.
Check Out Options
Check out: Opens a dialog box to enter a location for where you want the
document to be checked out to. Use to browse for a location. Use the Open
Document option to determine whether to open the document or just check it
out.
Check in: Opens a dialog box to select a document to be checked in. Use
to browse for a document. Use the comments field to enter a comment to be
associated with the document. The Format and Version Type fields are read-only.
Click the Check In button to keep your changes and check in the document or
click cancel to close the dialog box without checking in the document.

Reference Topics
1321
Undo Check Out: Opens a read-only dialog box displayed the Title, Version,
and Path of the selected checked out document. If you continue to undo the
check out, any changes made to the selected document will be lost. Click Undo
Check Out to continue or click Cancel to close the dialog and keep the
document checked out.
Start Review
Opens the Start Review dialog box where you specify the reviewers, type of review,
and due date. The document review is officially initiated when you complete the
required fields on this dialog box and click Create Review.
Add to recent documents
Adds the currently selected document to the recent documents list.
Cut
Cuts the selected item and applicable attributes to the temporary clipboard,
removing it from its current location. The item and applicable attributes can then be
pasted to another supported location.
Move Options
Cut: Cuts the selected item and applicable attributes to the clipboard. This
removes them from their current locations.
Paste: Completes a cut operation by inserting the item and supported
attributes to a new location.
Displays options for sending information about the currently selected item to one or
more recipients via electronic mail.
Search
Displays options for finding a specific matching entry or entries based on search
criteria.
Search Options
Search: Displays options for finding a specific matching entry based from
search criteria.
Clear Search Results: Removes any specified results to display all documents.

1322
Project Tab Toolbar of the Documents Portlet of the Workgroup Workspace Page
Overview
The following icons and screen elements appear in this toolbar; however, their availability
is subject to change based on your current selections, view settings, security permissions,
and other factors.
Screen Elements
Edit Details
Displays the Document Details dialog box to configure the details of the selected
document.
View Document
Opens a selected document for viewing.
View Options
Select from one of the following options in which to view the selected document:
View: Displays the selected document in a separate window.
Download: Allows you to download the document to your computer. You must
select a path for where the downloaded document will be saved.
Assign to Workgroup
Reassigns the selected document to a workgroup.
Delete
Deletes the selected item or items permanently.
Check out
Enables you to specify where the to check out current document to. Use the to
browse for a location. You can also select the Open Document option to determine
whether to open or just check out the document.
Check Out Options
Check out: Opens a dialog box to enter a location for where you want the
document to be checked out to. Use to browse for a location. Use the Open
Document option to determine whether to open the document or just check it
out.
Check in: Opens a dialog box to select a document to be checked in. Use
to browse for a document. Use the comments field to enter a comment to be
associated with the document. The Format and Version Type fields are read-only.
Click the Check In button to keep your changes and check in the document or
click cancel to close the dialog box without checking in the document.

Reference Topics
1323
Undo Check Out: Opens a read-only dialog box displayed the Title, Version,
and Path of the selected checked out document. If you continue to undo the
check out, any changes made to the selected document will be lost. Click Undo
Check Out to continue or click Cancel to close the dialog and keep the
document checked out.
Start Review
Opens the Start Review dialog box where you specify the reviewers, type of review,
and due date. The document review is officially initiated when you complete the
required fields on this dialog box and click Create Review.
Displays options for sending information about the currently selected item to one or
more recipients via electronic mail.
Project Tab Toolbar of the Project Documents Portlet
Overview
The following icons and screen elements appear in this toolbar; however, their availability
is subject to change based on your current selections, view settings, security permissions,
and other factors.
Screen Elements
Add Document
Enables you to select a document to add.
Add Options menu
Displays a menu of actions supplementing the Add Document icon.
Add Document: Enables you to select a document to add.
Add from content repository: Enables you to search, browse by folder, and select
a document from the repository. You can then decide to copy the selected
document or just link to it.
Copy from existing template: Enables you to search and select a template to
copy as the basis for your new document.
Create new template: Enables you to browse and select a document template to
store for future use. You can then create new documents copied from this
template.
Add Folder: Enables you to add a document folder to the repository and set its
security policy.

1324
Edit Details
Displays the Document Details dialog box to configure the details of the selected
document.
View Document
Opens a selected document for viewing.
View Options
Select from one of the following options in which to view the selected document:
View: Displays the selected document in a separate window.
Download: Allows you to download the document to your computer. You must
select a path for where the downloaded document will be saved.
Assign to Workgroup
Reassigns the selected document to a workgroup.
Delete
Deletes the selected item or items permanently.
Check out
Enables you to specify where the to check out current document to. Use the to
browse for a location. You can also select the Open Document option to determine
whether to open or just check out the document.
Check Out Options
Check out: Enables you to specify where you want the document to be
checked out to. Use to browse for a location. Use the Open Document option
to determine whether to open the document or just check it out.
Check in: Enables you to select a document to be checked in. Use to
browse for a document. Use the comments field to enter a comment to be
associated with the document. The Format and Version Type fields are read-only.
Click the Check In button to keep your changes and check in the document or
click cancel to close the dialog box without checking in the document.
Undo Check Out: Displays the Title, Version, and Path of the checked out
document you want to revert back to its previous state. After confirming, if you
decide to continue to undo the check out, any changes made to the selected
document while it was checked out will be lost. Click Undo Check Out to continue
or click Cancel to close the dialog and keep the document checked out.
Start Review
Opens the Start Review dialog box where you specify the reviewers, type of review,
and due date. The document review is officially initiated when you complete the
required fields on this dialog box and click Create Review.

Reference Topics
1325
Displays options for sending information about the currently selected item to one or
more recipients via electronic mail.
Recent Documents Toolbar
Overview
The following icons and screen elements appear in this toolbar; however, their availability
is subject to change based on your current selections, view settings, security permissions,
and other factors.
Note: This topic describes features available only with the
installation of the P6 content repository.
Screen Elements
Edit Details
Displays the Document Details dialog box to configure the details of the selected
document.
View Document
Opens a selected document for viewing.
View Options
Displays the following options:
View: Opens the selected document in a separate window.
Download: Allows you to download the document to your PC or a network
volume. You can select the path that determines where the downloaded
document will be saved.
Make Private
Changes the document accessibility; allows access only to the owner of the
document.
Make Private Options
Select from one of the following options to modify the select document:
Make Private: Makes the selected document private to the owner.
Assign to Project: Reassigns the selected document to a project.
Assign to Workgroup: Reassigns the selected document to a workgroup.
Delete
Deletes the selected item or items permanently.

1326
Check out
Enables you to specify where the to check out current document to. Use the to
browse for a location. You can also select the Open Document option to determine
whether to open or just check out the document.
Check Out Options
Check out: Displays a dialog box to enter a location for where you want the
document to be checked out to. Use to browse for a location. Use the Open
Document option to determine whether to open the document or just check it
out.
Check in: Displays a dialog box to select a document to be checked in. Use
to browse for a document. Use the comments field to enter a comment to be
associated with the document. The Format and Version Type fields are read-only.
Click the Check In button to keep your changes and check in the document or
click cancel to close the dialog box without checking in the document.
Undo Check Out: Displays a read-only dialog box displaying the Title, Version,
and Path of the selected checked out document. If you continue to undo the
check out, any changes made to the selected document will be lost. Click Undo
Check Out to continue or click Cancel to close the dialog and keep the
document checked out.
Start Review
Opens the Start Review dialog box where you specify the reviewers, type of review,
and due date. The document review is officially initiated when you complete the
required fields on this dialog box and click Create Review.
Columns
Displays a menu of the available fields you can show or hide as columns in the current
table. Select which fields you want displayed in the portlet from the following:
Title
Version
Creation Date
Modified Date
Project
Access Time
Displays options for sending information about the currently selected item to one or
more recipients via electronic mail.

Reference Topics
1327
Related Items Toolbar of the Project Tab
Overview
The following icons and screen elements appear in this toolbar; however, their availability
is subject to change based on your current selections, view settings, security permissions,
and other factors.
Screen Elements
Relate Activities or WBS
Relates an activity or WBS element to the selected item.
Relate Issues
Relates issues to the selected item.
Relate Documents
Relates documents to the selected item.
Delete
Deletes the selected item or items permanently.
Reports Schedules View Toolbar
Overview
The following icons and screen elements appear in this toolbar; however, their availability
is subject to change based on your current selections, view settings, security permissions,
and other factors.
Screen Elements
Save (Ctrl+S)
Saves any new or modified entries to the database.
Cancel (Esc)
Cancels any new or modified entries and reverts back to the last saved state.
Delete (Delete)
Deletes or removes the currently selected data items or table rows.
Caution: Your selected data is permanently deleted once you click Save.
Schedule Details
Opens the Report Settings dialog box in read-only mode.

1328
Run Schedule ASAP
Displays options for running the selected scheduled report on-demand.
Columns
Displays a menu of the available fields you can show or hide as columns in the current
table.
Replicate Schedule
Creates a new schedule based on the selected report schedule. The Report Settings
dialog opens enabling you to modify the scheduled report settings.
History
Displays details about the report jobs for the currently selected report including the
date and time each job was run and its status.
Export to Excel
Exports all data as it appears in the current view to a Microsoft® Excel spreadsheet
(.xls) file. Customize the rows to display only the data you want to export.
Print (Ctrl+P)
Prints the current page, table, chart, or item.
Print Preview
Displays a temporary preview of the printed output. You can then decide to continue
printing or cancel.
Page Setup
Displays options for customizing the printed output.
View list
The type of data you want displayed in the reports table. Choose Reports, the default
value, to see a list of reports by category or folder. Choose Schedules to see a list of
the individually scheduled instances of a reports arranged by frequency, including
Once, Daily, Weekly, and Monthly.
Reports View Toolbar
Overview
The following icons and screen elements appear in this toolbar; however, their availability
is subject to change based on your current selections, view settings, security permissions,
and other factors.

Reference Topics
1329
Screen Elements
Run Report
Displays options for running the selected report on-demand.
Columns
Displays a menu of the available fields you can show or hide as columns in the current
table.
Find (Ctrl+F)
Displays options for finding matching entries in the Report Name column.
Find Next (F3)
Finds and highlights the next matching entry in the Report Name column after an
initial Find operation.
Export to Excel
Exports all data as it appears in the current view to a Microsoft® Excel spreadsheet
(.xls) file. Customize the rows to display only the data you want to export.
Prints the current page, table, chart, or item.
Print Preview
Displays a temporary preview of the printed output. You can then decide to continue
printing or cancel.
Page Setup
Displays options for customizing the printed output.
View list
The type of data you want displayed in the reports table. Choose Reports, the default
value, to see a list of reports by category or folder. Choose Schedules to see a list of
the individually scheduled instances of a reports arranged by frequency, including
Once, Daily, Weekly, and Monthly.
Resources Navigation Bar
Overview
Click an icon on the Resources Navigation Bar to open its corresponding page.

1330
Screen Elements
Administration
Use the Administration page to create, edit and delete resources, resource teams,
resource roles, and role teams.
Planning
Use the Planning page spreadsheet to specify, review, or modify project-level and
WBS-level allocation data for individual resources and roles across a project lifecycle.
Assignments
Use the Assignments page to view and modify resource assignment data, view a
Gantt chart of current start and finish dates for assignments, and view a spreadsheet
that displays a variety of spreads.
Analysis
Use the Analysis page to evaluate resource usage and costs in customizable
histogram, stacked histogram, area chart, and pie chart formats. Examine total units
or costs for an individual resource or summary values for all resources belonging to a
resource team or code.
Resources Tab Toolbar
Overview
The following icons and screen elements appear in this toolbar; however, their availability
is subject to change based on your current selections, view settings, security permissions,
and other factors.
Screen Elements
Save (Ctrl+S)
Saves any new or modified entries to the database.
Cancel (Esc)
Cancels any new or modified entries and reverts back to the last saved state.
Add (Insert)
Creates a new entry in the current table.
Add Child (Ctrl+Insert)
Creates a resource one level lower than the currently selected resource.

Reference Topics
1331
Delete (Delete)
Deletes or removes the currently selected data items or table rows.
Caution: Your selected data is permanently deleted once you click Save.
Cut (Ctrl+X)
Cuts the selected item and applicable attributes to the temporary clipboard,
removing it from its current location. The item and applicable attributes can then be
pasted to another supported location.
Copy (Ctrl+C)
Copies the selected item and applicable attributes to the temporary clipboard,
leaving the original in its current location. The copied item and applicable attributes
can then be pasted into another supported location.
Paste (Ctrl+V)
Completes a Cut or Copy operation by inserting an item and its supported attributes
into a new location.
Fill Down (Ctrl+I)
In a selected range of cells in a single table column, inserts the value in the first or top
cell into the remaining cells down the column.
Move Up (Ctrl+Alt+Up)
Moves the selected item one level higher in a hierarchical arrangement.
Move Down (Ctrl+Alt+Down)
Moves the selected item one level lower in a hierarchical arrangement.
Move Left (Ctrl+Alt+Left)
Moves the selected item one level to the left in a hierarchical arrangement. Outdents
text items.
Move Right (Ctrl+Alt+Right)
Moves the selected item one level to the right in a hierarchical arrangement. Indents
text items.
View Calendar
Opens a read-only version of the project's calendar.
Find (Ctrl+F)
Displays options for finding matching entries based on specific search words or values
within a particular column in a table.

1332
Find Next (Alt+F)
Finds and highlights the next matching entry in a column. Available only in tables after
an original Find operation.
Select Columns
Displays a menu of the available fields you can show or hide as columns in the current
table.
Group by
Displays options for re-arranging the information in the table by sorting the rows on the
available groupings.
Full Screen Mode (F11)
Expands the current work area so it fills the entire display. Non-essential controls such
as navigation menus are hidden from this mode. When in full screen mode, click this
toolbutton again to restore the normal viewing mode.
Export to Excel
Exports all data as it appears in the current view to a Microsoft® Excel spreadsheet
(.xls) file. Customize the rows to display only the data you want to export.
Import from Excel
Enables you to search for the Microsoft Excel (.xls) file that includes a formatted list of
resources. The resources included in the Excel file are then added to the resource
pool displayed on the Resources tab.
Create Import Template
Opens a File Download dialog enabling you to Open or Save a preformatted
spreadsheet to use to capture and import resource data including resource name,
resource type, e-mail, and office phone number.
Print (Ctrl+P)
Prints the current page, table, chart, or item.
Print Preview
Displays a temporary preview of the printed output. You can then decide to continue
printing or cancel.
Page Setup
Displays options for customizing the printed output.

Reference Topics
1333
Response Plans Toolbar
Overview
The following icons and screen elements appear in this toolbar; however, their availability
is subject to change based on your current selections, view settings, security permissions,
and other factors.
Screen Elements
Add a Response Plan (Insert)
Creates a response plan for the identified risk.
Add a Response Action
Adds a response action item to the selected response plan.
Delete (Delete)
Deletes or removes the currently selected data items or table rows.
Caution: Your selected data is permanently deleted once you click Save.
Select Columns
Displays a menu of the available fields you can show or hide as columns in the current
table.
Risk selector (Ctrl+Up Arrow) or (Ctrl+Down Arrow)
Cycles through the available risks and determines which data display in the detail
window. Click (Ctrl+Up Arrow) to move to the previous risk, or click (Ctrl+Down
Arrow) to move to the next risk. The content in the detail window is refreshed with the
data for the selected risk.
Risk Activities Toolbar
Overview
The following icons and screen elements appear in this toolbar; however, their availability
is subject to change based on your current selections, view settings, security permissions,
and other factors.
Screen Elements
Assign Activities
Displays activities for the project currently assigned to the risk. Select one or more
activities to assign to the risk.
Delete (Delete)
Deletes or removes the currently selected data items or table rows.
1334
Caution: Your selected data is permanently deleted once you click Save.
Select Columns
Displays a menu of the available fields you can show or hide as columns in the current
table.
Risk selector (Ctrl+Up Arrow) or (Ctrl+Down Arrow)
Cycles through the available risks and determines which data display in the detail
window. Click (Ctrl+Up Arrow) to move to the previous risk, or click (Ctrl+Down
Arrow) to move to the next risk. The content in the detail window is refreshed with the
data for the selected risk.
Risk Scoring Method Description
The risk scoring method is a required input to the risk scoring matrix along with threshold
values for probability, tolerance, cost impact, and schedule impact to calculate risk
score. Review the following field definition and example to learn more about how risk
scores are calculated.
Risk Scoring Method field
The type of calculation used to obtain an overall impact value, which is then used
along with the probability to determine the score used to evaluate project risk. The
overall impact value is calculated using one of the following three methods:
Highest Impact: The overall impact for a risk is set to the highest of all the impacts
assigned to the risk.
Average Impact: The overall impact is determined by calculating the average of all
impact values.
Average Individual Impact: The overall impact is determined by combining the value
of each impact individually with the probability obtaining a score from the Probability
and Impact Diagram. The total of all impact scores is then divided by the number of
impacts.
Example: Harbour Pointe Assisted Living Center Risk Scoring Method
The Harbour Pointe Assisted Living Center project is a long-term construction project
where many risks have been identified. The scoring method used to calculate risk for this
project is the Highest Impact method.

Reference Topics
1335
Risk Register Illustrating Risk Scores using the Highest Impact Risk Scoring Method
Review the following chart to see how the score was calculated for Risk R001: Concrete
supply constrained, and how the score changes depending on the risk scoring method
assigned to the risk scoring matrix. Note that there are two impact types (Schedule and
Cost) used for the calculations in this example.
Method Calculation Details Scor
e
Highest
Impact
The highest impact for the activity is the Schedule
impact, which is marked as High. High is equivalent
to Severity 4 in the Probability and Impact Diagram
(PID). Using the PID, a Severity 4 and a High
Probability gives this risk a score of 28.
28
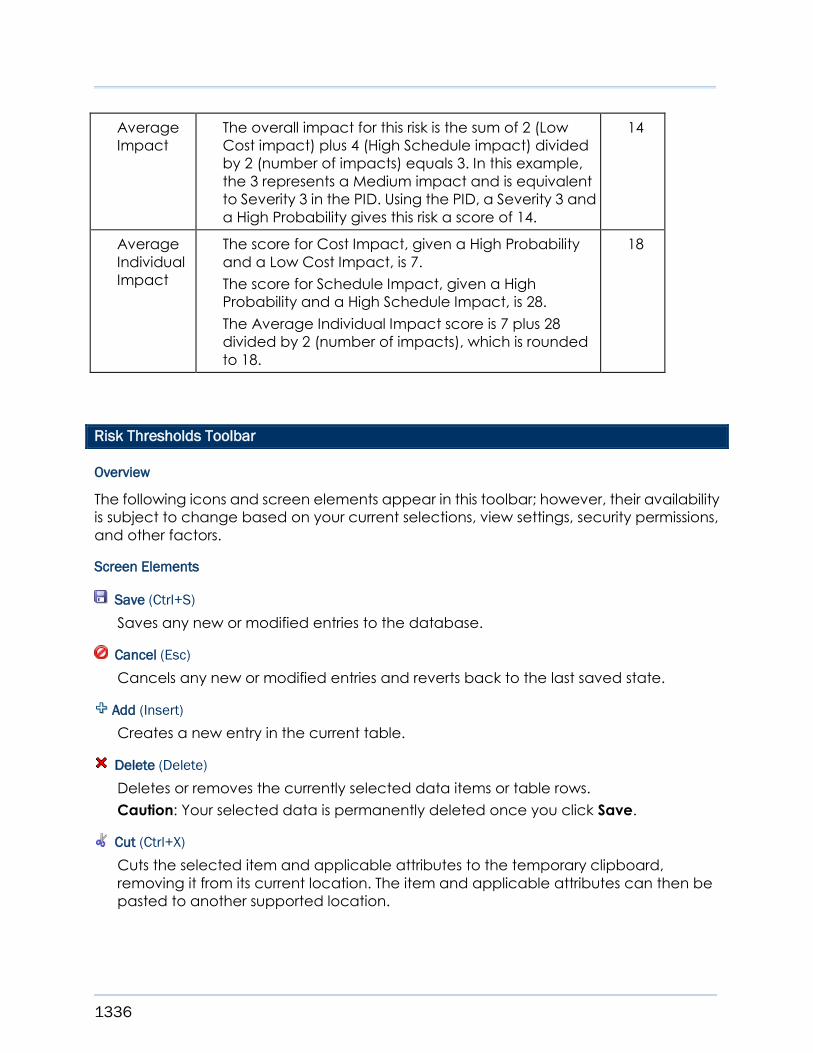
1336
Average
Impact
The overall impact for this risk is the sum of 2 (Low
Cost impact) plus 4 (High Schedule impact) divided
by 2 (number of impacts) equals 3. In this example,
the 3 represents a Medium impact and is equivalent
to Severity 3 in the PID. Using the PID, a Severity 3 and
a High Probability gives this risk a score of 14.
14
Average
Individual
Impact
The score for Cost Impact, given a High Probability
and a Low Cost Impact, is 7.
The score for Schedule Impact, given a High
Probability and a High Schedule Impact, is 28.
The Average Individual Impact score is 7 plus 28
divided by 2 (number of impacts), which is rounded
to 18.
18
Risk Thresholds Toolbar
Overview
The following icons and screen elements appear in this toolbar; however, their availability
is subject to change based on your current selections, view settings, security permissions,
and other factors.
Screen Elements
Save (Ctrl+S)
Saves any new or modified entries to the database.
Cancel (Esc)
Cancels any new or modified entries and reverts back to the last saved state.
Add (Insert)
Creates a new entry in the current table.
Delete (Delete)
Deletes or removes the currently selected data items or table rows.
Caution: Your selected data is permanently deleted once you click Save.
Cut (Ctrl+X)
Cuts the selected item and applicable attributes to the temporary clipboard,
removing it from its current location. The item and applicable attributes can then be
pasted to another supported location.
Reference Topics
1337
Copy (Ctrl+C)
Copies the selected item and applicable attributes to the temporary clipboard,
leaving the original in its current location. The copied item and applicable attributes
can then be pasted into another supported location.
Paste (Ctrl+V)
Completes a Cut or Copy operation by inserting an item and its supported attributes
into a new location.
Find (Ctrl+F)
Displays options for finding matching entries based on specific search words or values
within a particular column in a table.
Find Next (Alt+F)
Finds and highlights the next matching entry in a column. Available only in tables after
an original Find operation.
Group By
Displays a menu of the available fields you can select to group related rows in a table
into hierarchical lists you can expand and collapse. For example, group by a
Category field to arrange all rows hierarchically by their Category field values. Expand
the Category A group to view its data rows, the Category B group to view its data
rows, and so on.
Full Screen Mode (F11)
Expands the current work area so it fills the entire display. Non-essential controls such
as navigation menus are hidden from this mode. When in full screen mode, click this
toolbutton again to restore the normal viewing mode.
Print (Ctrl+P)
Prints the current page, table, chart, or item.
Print Preview
Displays a temporary preview of the printed output. You can then decide to continue
printing or cancel.
Page Setup
Displays options for customizing the printed output.

1338
Risks Toolbar
Overview
The following icons and screen elements appear in this toolbar; however, their availability
is subject to change based on your current selections, view settings, security permissions,
and other factors.
Screen Elements
Save (Ctrl+S)
Saves any new or modified entries to the database.
Cancel (Esc)
Cancels any new or modified entries and reverts back to the last saved state.
Add a Risk
Creates a new risk.
Delete (Delete)
Deletes or removes the currently selected data items or table rows.
Caution: Your selected data is permanently deleted once you click Save.
Copy (Ctrl+C)
Copies the selected item and applicable attributes to the temporary clipboard,
leaving the original in its current location. The copied item and applicable attributes
can then be pasted into another supported location.
Paste (Ctrl+V)
Completes a Cut or Copy operation by inserting an item and its supported attributes
into a new location.
Fill Down (Ctrl+I)
In a selected range of cells in a single table column, inserts the value in the first or top
cell into the remaining cells down the column.
Find (Ctrl+F)
Displays options for finding matching entries based on specific search words or values
within a particular column in a table.
Find Next (Alt+F)
Finds and highlights the next matching entry in a column. Available only in tables after
an original Find operation.

Reference Topics
1339
Select Columns
Displays a menu of the available fields you can show or hide as columns in the current
table.
Group By
Displays a menu of the available fields you can select to group related rows in a table
into hierarchical lists you can expand and collapse. For example, group by a
Category field to arrange all rows hierarchically by their Category field values. Expand
the Category A group to view its data rows, the Category B group to view its data
rows, and so on.
Filter By
Displays options for reducing the number of values displayed in a list or table by
showing only selected values and removing or filtering out unwanted values.
Full Screen Mode (F11)
Expands the current work area so it fills the entire display. Non-essential controls such
as navigation menus are hidden from this mode. When in full screen mode, click this
toolbutton again to restore the normal viewing mode.
Export to Excel
Exports all data as it appears in the current view to a Microsoft® Excel spreadsheet
(.xls) file. Customize the rows to display only the data you want to export.
Print (Ctrl+P)
Prints the current page, table, chart, or item.
Print Preview
Displays a temporary preview of the printed output. You can then decide to continue
printing or cancel.
Page Setup
Displays options for customizing the printed output.
Risks Toolbar of the Activities and EPS Pages
Overview
The following icons and screen elements appear in this toolbar; however, their availability
is subject to change based on your current selections, view settings, security permissions,
and other factors.

1340
Screen Elements
Add (Insert)
Creates a new risk.
Assign Risk
Opens a a window where you can select a risk to assign. (This icon is not available on
the Risks detail window of the EPS page.)
Delete (Delete)
Deletes or removes the currently selected data items or table rows.
Caution: Your selected data is permanently deleted once you click Save.
Customize Columns
Displays choices for customizing the columns (fields) that appear on the selected
screen. (Available only in the Gantt chart and Table views.)
Activity/Project selector
Cycles through the available activities or projects and determines which data display
in the detail window. Click or to change which activity or project and its
corresponding data are displayed.
Roles Tab Toolbar
Overview
The following icons and screen elements appear in this toolbar; however, their availability
is subject to change based on your current selections, view settings, security permissions,
and other factors.
Screen Elements
Save (Ctrl+S)
Saves any new or modified entries to the database.
Cancel (Esc)
Cancels any new or modified entries and reverts back to the last saved state.
Add (Insert)
Creates a new entry in the current table.
Add Child (Ctrl+Insert)
Creates a role one level lower than the currently selected role.

Reference Topics
1341
Delete (Delete)
Deletes or removes the currently selected data items or table rows.
Caution: Your selected data is permanently deleted once you click Save.
Cut (Ctrl+X)
Cuts the selected item and applicable attributes to the temporary clipboard,
removing it from its current location. The item and applicable attributes can then be
pasted to another supported location.
Copy (Ctrl+C)
Copies the selected item and applicable attributes to the temporary clipboard,
leaving the original in its current location. The copied item and applicable attributes
can then be pasted into another supported location.
Paste (Ctrl+V)
Completes a Cut or Copy operation by inserting an item and its supported attributes
into a new location.
Move Up (Ctrl+Alt+Up)
Moves the selected item one level higher in a hierarchical arrangement.
Move Down (Ctrl+Alt+Down)
Moves the selected item one level lower in a hierarchical arrangement.
Move Left (Ctrl+Alt+Left)
Moves the selected item one level to the left in a hierarchical arrangement. Outdents
text items.
Move Right (Ctrl+Alt+Right)
Moves the selected item one level to the right in a hierarchical arrangement. Indents
text items.
Find (Ctrl+F)
Displays options for finding matching entries based on specific search words or values
within a particular column in a table.
Find Next (Alt+F)
Finds and highlights the next matching entry in a column. Available only in tables after
an original Find operation.
Select Columns
Displays a menu of the available fields you can show or hide as columns in the current
table.

1342
Full Screen Mode (F11)
Expands the current work area so it fills the entire display. Non-essential controls such
as navigation menus are hidden from this mode. When in full screen mode, click this
toolbutton again to restore the normal viewing mode.
Export to Excel
Exports all data as it appears in the current view to a Microsoft® Excel spreadsheet
(.xls) file. Customize the rows to display only the data you want to export.
Print (Ctrl+P)
Prints the current page, table, chart, or item.
Print Preview
Displays a temporary preview of the printed output. You can then decide to continue
printing or cancel.
Page Setup
Displays options for customizing the printed output.
Schedule Detail Window Toolbar
Overview
The following icons and screen elements appear in this toolbar; however, their availability
is subject to change based on your current selections, view settings, security permissions,
and other factors.
Screen Elements
Save (Ctrl+S)
Saves any new or modified entries to the database.
Cancel (Esc)
Cancels any new or modified entries and reverts back to the last saved state.
Add (Insert)
Displays options and parameters that determine when the new report is scheduled to
run, and then adds the new scheduled report job to the table.
Delete (Delete)
Deletes or removes the currently selected data items or table rows.
Caution: Your selected data is permanently deleted once you click Save.
Schedule Details
Opens the Report Settings dialog box in read-only mode.

Reference Topics
1343
Run Schedule ASAP
Displays options for running the selected scheduled report on-demand.
Columns
Displays a menu of the available fields you can show or hide as columns in the current
table.
Replicate Schedule
Creates a new schedule based on the selected report schedule. The Report Settings
dialog opens enabling you to modify the scheduled report settings.
History
Displays details about the report jobs for the currently selected report including the
date and time each job was run and its status.
Scheduled Services Toolbar
Overview
The following icons and screen elements appear in this toolbar; however, their availability
is subject to change based on your current selections, view settings, security permissions,
and other factors.
Screen Elements
Save (Ctrl+S)
Saves any new or modified entries to the database.
Cancel (Esc)
Cancels any new or modified entries and reverts back to the last saved state.
Refresh
Refreshes the current screen with any new, updated, or removed data.
Add (Insert)
Creates a new scheduled service.
Delete (Delete)
Deletes the currently selected services.
CAUTION: If you confirm this operation, your selected data is
permanently deleted.

1344
Edit
Modifies the selected scheduled service.
Move Up (Ctrl+Alt+Up)
Moves the selected item one level higher in a hierarchical arrangement.
Move Down (Ctrl+Alt+Down)
Moves the selected item one level lower in a hierarchical arrangement.
Find (Ctrl+F)
Displays options for finding matching entries based on specific search words or values
within a particular column in a table.
Find Next (F3)
Finds and highlights the next matching entry. Available only in tables after an original
Find operation.
View Log File
Launches the log file for the selected row. This icon is disabled if there is no log file for
the selected service or no row is selected.
Run Service
Runs the selected service immediately. This sets the service Start Time to the current
time. Once the service has completed, the Start Time is reset to the time you specified
in the Edit Service dialog box. This option is disabled if no row is selected, more than
one row is selected, or if you do not have the required security privileges.
Full Screen Mode (F11)
Expands the current work area so it fills the entire display. Non-essential controls such
as navigation menus are hidden from this mode. When in full screen mode, click this
toolbutton again to restore the normal viewing mode.
Print (Ctrl+P)
Prints the current page, table, chart, or item.
Print Preview
Displays a temporary preview of the printed output. You can then decide to continue
printing or cancel.
Page Setup
Displays options for customizing the printed output.

Reference Topics
1345
Scorecard Settings Area
The Scorecard settings area displays configurable options for viewing portfolio data in a
Scorecard. Use the following fields to modify your scorecard view.
Screen Elements
Group By list
Select a field value to determine your preferred option to group your data.
Customize link
Displays customize scorecard dialog box. See: Customize Scorecard Dialog Box (on
page 692)
Select Projects Toolbar
Overview
The following icons and screen elements appear in this toolbar; however, their availability
is subject to change based on your current selections, view settings, security permissions,
and other factors.
Screen Elements
Select Project Type
Filters available information by project or template.
Group By
Displays a menu of the available fields you can select to group related rows in a table
into hierarchical lists you can expand and collapse. For example, group by a
Category field to arrange all rows hierarchically by their Category field values. Expand
the Category A group to view its data rows, the Category B group to view its data
rows, and so on.
Columns
Displays a menu of the available fields you can show or hide as columns in the current
table.
Search
Displays options for finding a specific matching entry or entries based on search
criteria.
Search For (Ctrl+Shift+F)
Displays options for customizing a search.

1346
Service Status Toolbar
Overview
The following icons and screen elements appear in this toolbar; however, their availability
is subject to change based on your current selections, view settings, security permissions,
and other factors.
Screen Elements
Refresh
Updates your screen to view the most current information.
View Log File
Launches the log file for the selected row. This icon is disabled if there is no log file for
the selected service or no row is selected.
Find (Ctrl+F)
Displays options for finding matching entries based on specific search words or values
within a particular column in a table.
Find Next (F3)
Finds and highlights the next matching entry. Available only in tables after an original
Find operation.
Filters menu
Click to add or remove filters from the Service Status dialog box. Filter options are My
Services and My Services for Open Projects. If you are an admin superuser you can
also select All Services.
Full Screen Mode (F11)
Expands the current work area so it fills the entire display. Non-essential controls such
as navigation menus are hidden from this mode. When in full screen mode, click this
toolbutton again to restore the normal viewing mode.
Print (Ctrl+P)
Prints the current page, table, chart, or item.
Print Preview
Displays a temporary preview of the printed output. You can then decide to continue
printing or cancel.
Page Setup
Displays options for customizing the printed output.

Reference Topics
1347
Status Toolbar of Import/Export Project Dialog Box
Overview
The following icons and screen elements appear in this toolbar; however, their availability
is subject to change based on your current selections, view settings, security permissions,
and other factors.
Screen Elements
Refresh
Refreshes the current screen with any new, updated, or removed data.
View Log File
Displays the log file that contains details about the import or export for analysis.
Delete
Deletes the selected row from the table.
Step Templates Toolbar
Overview
The following icons and screen elements appear in this toolbar; however, their availability
is subject to change based on your current selections, view settings, security permissions,
and other factors.
Screen Elements
Save (Ctrl+S)
Saves any new or modified entries to the database.
Cancel (Esc)
Cancels any new or modified entries and reverts back to the last saved state.
Add (Insert)
Creates a new entry in the current table.
Delete (Delete)
Deletes or removes the currently selected data items or table rows.
Caution: Your selected data is permanently deleted once you click Save.
Copy (Ctrl+C)
Copies the selected item and applicable attributes to the temporary clipboard,
leaving the original in its current location. The copied item and applicable attributes
can then be pasted into another supported location.

1348
Paste (Ctrl+V)
Completes a Cut or Copy operation by inserting an item and its supported attributes
into a new location.
Find (Ctrl+F)
Displays options for finding matching entries based on specific search words or values
within a particular column in a table.
Find Next (Alt+F)
Finds and highlights the next matching entry in a column. Available only in tables after
an original Find operation.
Move Up (Ctrl+Alt+Up)
Moves the selected item one level higher in a hierarchical arrangement.
Move Down (Ctrl+Alt+Down)
Moves the selected item one level lower in a hierarchical arrangement.
Full Screen Mode (F11)
Expands the current work area so it fills the entire display. Non-essential controls such
as navigation menus are hidden from this mode. When in full screen mode, click this
toolbutton again to restore the normal viewing mode.
Steps Detail Window Toolbar
Overview
The following icons and screen elements appear in this toolbar; however, their availability
is subject to change based on your current selections, view settings, security permissions,
and other factors.
Screen Elements
Add (Insert)
Creates a new entry in the current table.
Delete (Delete)
Deletes or removes the currently selected data items or table rows.
Caution: Your selected data is permanently deleted once you click Save.
Copy (Ctrl+C)
Copies the selected item and applicable attributes to the temporary clipboard,
leaving the original in its current location. The copied item and applicable attributes
can then be pasted into another supported location.

Reference Topics
1349
Paste (Ctrl+V)
Completes a Cut or Copy operation by inserting an item and its supported attributes
into a new location.
Columns
Displays a menu of the available fields you can show or hide as columns in the current
table.
Find (Ctrl+F)
Displays options for finding matching entries based on specific search words or values
within a particular column in a table.
Find Next (Alt+F)
Finds and highlights the next matching entry in a column. Available only in tables after
an original Find operation.
Move Up (Ctrl+Alt+Up)
Moves the selected item one level higher in a hierarchical arrangement.
Move Down (Ctrl+Alt+Down)
Moves the selected item one level lower in a hierarchical arrangement.
Steps Toolbar of the Activities Page
Overview
The following icons and screen elements appear in this toolbar; however, their availability
is subject to change based on your current selections, view settings, security permissions,
and other factors.
Screen Elements
Add Activity Step (Insert)
Creates a new step for the selected activity.
Add Activity Steps from Template (Ctrl+Alt+S)
Creates a new activity step template.
Delete (Delete)
Deletes or removes the currently selected data items or table rows.
Caution: Your selected data is permanently deleted once you click Save.
Move Up
Moves the selected item one level up in the sort order.

1350
Move Down
Moves the selected item one level down in the sort order.
Customize Columns
Displays choices for customizing the columns (fields) that appear on the selected
screen. (Available only in the Gantt chart and Table views.)
Activity selector
Cycles through the available activities and determines which data display in the
detail window. Click or to change which activity and its corresponding data
are displayed.
Successors Toolbar of the Activities Page
Overview
The following icons and screen elements appear in this toolbar; however, their availability
is subject to change based on your current selections, view settings, security permissions,
and other factors.
Screen Elements
Assign (Insert)
Displays options for selecting a successor activity related to the current activity.
Delete (Delete)
Deletes or removes the currently selected data items or table rows.
Caution: Your selected data is permanently deleted once you click Save.
Customize Columns
Displays choices for customizing the columns (fields) that appear on the selected
screen. (Available only in the Gantt chart and Table views.)
Go to Activity (Ctrl+Home)
Moves from the current activity to the preceding activity in the hierarchal standing.
Activity selector
Cycles through the available activities and determines which data display in the
detail window. Click or to change which activity and its corresponding data
are displayed.

Reference Topics
1351
Tabbed Views
By popular demand, users can now switch between open layouts, screens, or views by
clicking their identifying tab. Tabs can also be grouped, splitting the window, and then
merged back into a single group of tabs within a window. This means that all main
windows in the entire application, including Projects, Activities, and Resources, can be
displayed simultaneously as tabs and can be tiled horizontally, vertically, or some
combination of both.
Teams Tabs Toolbar
Overview
The following icons and screen elements appear in this toolbar; however, their availability
is subject to change based on your current selections, view settings, security permissions,
and other factors.
Screen Elements
Save (Ctrl+S)
Saves any new or modified entries to the database.
Cancel (Esc)
Cancels any new or modified entries and reverts back to the last saved state.
Add (Insert)
Creates a new entry in the current table.
Delete (Delete)
Deletes or removes the currently selected data items or table rows.
Caution: Your selected data is permanently deleted once you click Save.
Copy (Ctrl+C)
Copies the selected item and applicable attributes to the temporary clipboard,
leaving the original in its current location. The copied item and applicable attributes
can then be pasted into another supported location.
Paste (Ctrl+V)
Completes a Cut or Copy operation by inserting an item and its supported attributes
into a new location.
Find (Ctrl+F)
Displays options for finding matching entries based on specific search words or values
within a particular column in a table.
The Find feature on this tab only works in the Name column.
1352
Find Next (Alt+F)
Finds and highlights the next matching entry in a column. Available only in tables after
an original Find operation.
Full Screen Mode (F11)
Expands the current work area so it fills the entire display. Non-essential controls such
as navigation menus are hidden from this mode. When in full screen mode, click this
toolbutton again to restore the normal viewing mode.
Print (Ctrl+P)
Prints the current page, table, chart, or item.
Print Preview
Displays a temporary preview of the printed output. You can then decide to continue
printing or cancel.
Page Setup
Displays options for customizing the printed output.
Text Editor Toolbar
Use the commands in this toolbar to format text. These tool buttons are common to most
word processing applications and appear throughout the P6 application wherever the
text editor is used to format text.
Style list
Select Normal or a type of Heading to apply to the structure of the selected text.
Font list
Select from a list of available fonts to apply to the appearance of the selected text.
Bold
Applies the bold font style to the selected text.
Italic
Applies the italics font style to the selected text.
Underline
Applies the underline font style to the selected text.
Align Left
Formats the selected lines of text to the left margin.
Align Center
Formats the selected lines of text to the center of the page.

Reference Topics
1353
Align Right
Formats the selected lines of text to the right margin.
Align Justified
Formats the selected lines of text to both the left and right margins.
Numbering
Applies numbered list formatting to the selected text.
Bullets
Applies bulleted list formatting to the selected text.
Foreground
Displays options for customizing the color of the selected foreground text.
Highlight Color
Displays options for customizing the color of the selected text's background or
highlighting
Timesheet Approval Toolbar
Overview
The following icons and screen elements appear in this toolbar; however, their availability
is subject to change based on your current selections, view settings, security permissions,
and other factors.
Screen Elements
Approve Selected Timesheets
Approves the selected timesheets.
Reject Selected Timesheets
Rejects the selected timesheets.
Filter By
Displays options for reducing the number of values displayed in a list or table by
showing only selected values and removing or filtering out unwanted values.
Select from one of the following predefined filters based on the status of each
timesheet:
Action Required (Ctrl+Alt+C): Displays only timesheets that currently require your
review.
Submitted (Ctrl +Alt+S): Displays both submitted and resubmitted timesheets.

1354
Resubmitted (Ctrl+Alt+E): Displays all resubmitted timesheets for all timesheet
periods.
Not Submitted (Ctrl+Alt+U): Dislays timesheets with either a Not Started or Not
Submitted status.
Approved (Ctrl+Alt+P): Displays only timesheets that have already been
approved, either manually or automatically.
Rejected (Ctrl+Alt+R): Displays only the timesheets that were manually reviewed
and rejected.
All (Ctrl+Alt+A): Displays all timesheets with any status, but only for the selected
timesheet period.
Group By
Displays a menu of the available fields you can select to group related rows in a table
into hierarchical lists you can expand and collapse. For example, group by a
Category field to arrange all rows hierarchically by their Category field values. Expand
the Category A group to view its data rows, the Category B group to view its data
rows, and so on.
Columns
Displays a menu of the available fields you can show or hide as columns in the current
table.
Find
Displays options for finding matching entries based on specific search words or values
within a particular column in a table.
Displays options for sending information about the currently selected item to one or
more recipients via electronic mail.
Expand All
In a hierarchical list or page of child items grouped by parent items, expands the list to
show all parent and child items.
Collapse All
In a hierarchical list, arranges entries so that only the parent items are shown and child
entries are hidden.
Prints the current page, table, chart, or item.
Print Preview
Displays a temporary preview of the printed output. You can then decide to continue
printing or cancel.

Reference Topics
1355
Page Setup
Displays options for customizing the printed output.
Refresh
Refreshes the current screen with any new, updated, or removed data.
Toolbars Sub-Menu of the View Menu
Overview
The toolbars sub-menu displays configurable options for customizing the Actions, Edit,
and View toolbars on the Activities or EPS pages.
Screen Elements
Actions
Displays a list of icons available on the Actions toolbar. Select a menu item to show or
hide its icon on the toolbar. See Actions Menu on Activities Page (on page 1178) or
Actions Menu on EPS Page (on page 1180) for a list of available icons.
Edit
Displays a list of icons available on the Edit toolbar. Select a menu item to show or
hide its icon on the toolbar. See Edit Menu on Activities Page (on page 1253) or Edit
Menu on EPS Page (on page 1254) for a list of available icons.
View
Displays a list of icons available on the View toolbar. Select a menu item to show or
hide its icon on the toolbar. See View Menu on Activities Page (on page 1365) or View
Menu on EPS Page (on page 1368) for a list of available icons.
Customize Toolbars
Displays a dialog box where you can determine which icons from the Actions, Edit,
and View menus will be displayed on the corresponding toolbars. See Customize
Toolbar Items Dialog Box (on page 698).
Trace Logic Toolbar of the Activities Page
Overview
The following icons and screen elements appear in this toolbar; however, their availability
is subject to change based on your current selections, view settings, security permissions,
and other factors.

1356
Screen Elements
Pan
Enables a user to make fine adjustments to the current view by directly moving the
chart or diagram in the work area. This option is only available if you are working in the
Activity Network.
Zoom In
Increases the current magnification of items in the work area so they appear larger.
Zoom Out
Decreases the current magnification of items in the work area so they appear smaller.
Zoom to Fit
Adjusts the current view's height and width or timescale to fit as much of the data as
possible into the current work area.
Reset Zoom
Restores the magnification of the current work area to its default size of 100%.
Trace Logic Options (Ctrl+V)
Opens the Trace Logic details window for the selected activity.
Prints the current page, table, chart, or item.
Print Preview
Displays a temporary preview of the printed output. You can then decide to continue
printing or cancel.
Page Setup
Displays options for customizing the printed output.
User Access OBS Toolbar
Overview
The following icons and screen elements appear in this toolbar; however, their availability
is subject to change based on your current selections, view settings, security permissions,
and other factors.
Screen Elements
Save
Saves your new or modified entries to the database.

Reference Topics
1357
Cancel
Cancels any pending changes and reverts back to the last saved state.
Add
Creates a new element or responsible manager in the organizational breakdown
structure (OBS) hierarchy.
Delete
Deletes the selected item or items permanently.
Cut
Cuts the selected item and applicable attributes to the temporary clipboard,
removing it from its current location. The item and applicable attributes can then be
pasted to another supported location.
Copy
Copies the selected item and applicable attributes to the temporary clipboard,
leaving the original in its current location. The copied item and applicable attributes
can then be pasted to another supported location.
Paste
Completes a Cut or Copy operation by inserting an item and its supported attributes
into a new location.
Find
Displays options for finding matching entries based on specific search words or values
within a particular column in a table.
Find Next
Available only in tables, finds and highlights the next matching entry in the selected
column after an initial Find operation.
Move Up
Moves the selected item one level up in the sort order.
Move Down
Moves the selected item one level down in the sort order.
Move Left
Moves the selected item one level to the left in a hierarchical arrangement. Outdents
text items.
Move Right
Moves the selected item one level to the right in a hierarchical arrangement. Indents
text items.

1358
Full Screen Mode
Expands the current work area so it fills the entire display. Non-essential controls such
as navigation menus are hidden from this mode. To exit from this mode, click
Normal Mode.
Export to Excel
Exports all data as it appears in the current view to a Microsoft® Excel spreadsheet
(.xls) file. Customize the rows to display only the data you want to export.
Prints the current page, table, chart, or item.
Print Preview
Displays a temporary preview of the printed output. You can then decide to continue
printing or cancel.
Page Setup
Displays options for customizing the printed output.
User Access Security Profiles Toolbar
Overview
The following icons and screen elements appear in this toolbar; however, their availability
is subject to change based on your current selections, view settings, security permissions,
and other factors.
Screen Elements
Save
Saves your new or modified entries to the database.
Cancel
Cancels any pending changes and reverts back to the last saved state.
Add
Creates a new global security profile if on the Global Profiles tab, or a new project
security profile if on the Project Profiles tab.
Delete
Deletes the selected item or items permanently.
Any users assigned to a deleted global security profile will automatically be
reassigned to the current default global security profile.

Reference Topics
1359
Copy
Copies the selected item and applicable attributes to the temporary clipboard,
leaving the original in its current location. The copied item and applicable attributes
can then be pasted to another supported location.
Paste
Completes a Cut or Copy operation by inserting an item and its supported attributes
into a new location.
Find
Displays options for finding matching entries based on specific search words or values
within a particular column in a table.
Find Next
Available only in tables, finds and highlights the next matching entry in the selected
column after an initial Find operation.
Export to Excel
Exports all data as it appears in the current view to a Microsoft® Excel spreadsheet
(.xls) file. Customize the rows to display only the data you want to export.
Prints the current page, table, chart, or item.
Print Preview
Displays a temporary preview of the printed output. You can then decide to continue
printing or cancel.
Page Setup
Displays options for customizing the printed output.
User Access Users Toolbar
Overview
The following icons and screen elements appear in this toolbar; however, their availability
is subject to change based on your current selections, view settings, security permissions,
and other factors.
Screen Elements
Save
Saves your new or modified entries to the database.

1360
Cancel
Cancels any pending changes and reverts back to the last saved state.
Add
Creates a new user.
Delete
Deletes the selected item or items permanently.
Change Password
Enables you to specify a new password to replace or reset the old one.
Count
Shows the number of users assigned access to each module of the application. For
example, 12 users might be assigned access to the Projects module while only 3 are
assigned to the Resources module.
Cut
Cuts the selected item and applicable attributes to the temporary clipboard,
removing it from its current location. The item and applicable attributes can then be
pasted to another supported location.
Copy
Copies the selected item and applicable attributes to the temporary clipboard,
leaving the original in its current location. The copied item and applicable attributes
can then be pasted to another supported location.
Paste
Completes a Cut or Copy operation by inserting an item and its supported attributes
into a new location.
Fill Down
In a selected range of cells in a single table column, inserts the value in the first or top
cell into the remaining cells down the column.
Find
Displays options for finding matching entries based on specific search words or values
within a particular column in a table.
Find Next
Available only in tables, finds and highlights the next matching entry in the selected
column after an initial Find operation.

Reference Topics
1361
Columns
Displays a menu of the available fields you can show or hide as columns in the current
table.
Group By
Displays a menu of the available fields you can select to group related rows in a table
into hierarchical lists you can expand and collapse. For example, group by a
Category field to arrange all rows hierarchically by their Category field values. Expand
the Category A group to view its data rows, the Category B group to view its data
rows, and so on.
Full Screen Mode
Expands the current work area so it fills the entire display. Non-essential controls such
as navigation menus are hidden from this mode. To exit from this mode, click
Normal Mode.
Export to Excel
Exports all data as it appears in the current view to a Microsoft® Excel spreadsheet
(.xls) file. Customize the rows to display only the data you want to export.
Prints the current page, table, chart, or item.
Print Preview
Displays a temporary preview of the printed output. You can then decide to continue
printing or cancel.
Page Setup
Displays options for customizing the printed output.
User Defined Fields Toolbar
Overview
The following icons and screen elements appear in this toolbar; however, their availability
is subject to change based on your current selections, view settings, security permissions,
and other factors.
Screen Elements
Save (Ctrl+S)
Saves any new or modified entries to the database.
Cancel (Esc)
Cancels any new or modified entries and reverts back to the last saved state.

1362
Add (Insert)
Creates a new entry in the current table.
Delete (Delete)
Deletes or removes the currently selected data items or table rows.
Caution: Your selected data is permanently deleted once you click Save.
When a user-defined field (UDF) is deleted, all its values are also deleted from all of
their respective appearances throughout the application. This includes user interface
views, activity views, calculated UDFs, reports, Activity Networks, filters, sorts,
groupings, waterlines, and columns.
Exception: Even after they have been deleted, UDFs are preserved in any saved
scenarios.
Find (Ctrl+F)
Displays options for finding matching entries based on specific search words or values
within a particular column in a table.
Find Next (Alt+F)
Finds and highlights the next matching entry in a column. Available only in tables after
an original Find operation.
Full Screen Mode (F11)
Expands the current work area so it fills the entire display. Non-essential controls such
as navigation menus are hidden from this mode. When in full screen mode, click this
toolbutton again to restore the normal viewing mode.
Print (Ctrl+P)
Prints the current page, table, chart, or item.
Print Preview
Displays a temporary preview of the printed output. You can then decide to continue
printing or cancel.
Page Setup
Displays options for customizing the printed output.
View Menu of the Assignments Page
Overview
The following icons and screen elements appear in this toolbar; however, their availability
is subject to change based on your current selections, view settings, security permissions,
and other factors.

Reference Topics
1363
Screen Elements
Gantt Chart
Opens the Gantt chart on the right side of the page. The Gantt chart is a graphical
display of the start and end dates for the resource assignments in your view.
Table
Displays the assigned resource and corresponding role with information regarding the
associated project and assignments in a spreadsheet format. When this option is
selected, the Gantt chart is not displayed.
Usage Spreadsheet
Displays the usage spreadsheet, which allows you to view live unit and cost spreads
for the resource or role assignment.
Columns...
Opens the Customize Columns dialog box which you can use to configure which and
how columns display.
Group...
Displays options for re-arranging a list of values by grouping them into a hierarchy and
sorting.
Filters
The filters menu contains the following options for filtering data:
Show matches for : Select all applied filters or any applied filters to determine
which matches are displayed.
Filters: Displays a dialog box with configurable options for applying filters to the
current assignments view. See Customize Filters Dialog Box of the Assignments
Page (on page 681).
Add New Filter: Displays a dialog box with configurable options for adding a
new filter to the current assignments view. See Create Filter Dialog Box of the
Assignments Page (on page 652).
Clear Filters: Clears all set filters from the current assignments view.
Gantt Chart Options
Enables you to configure how the Gantt chart and its bars display. (Available only in
the Gantt chart view.) See Customize Gantt Chart Options Dialog Box of the
Assignments Page (on page 683).
Usage Options
Displays the Customize Usage Options dialog box. Use this dialog box to select which
columns are displayed as well as modify options for displaying time distributed values
and determining whether to calculate the average for units and costs.

1364
Progress Spotlight
Creates a yellow curtain or background behind assignments that should have
progressed during a specific timeperiod. You can drag the current date line to
highlight assignments that occur between today's date and a new date. (Available
only in the Gantt chart view.)
Expand All (Alt+Plus)
In a hierarchical list or page of child items grouped by parent items, expands the list to
show all parent and child items.
Collapse All (Alt+Minus)
In a hierarchical list, arranges entries so that only the parent items are shown and child
entries are hidden.
Zoom to Fit
Adjusts the current view's height and width or timescale to fit as much of the data as
possible into the current work area.
Full Screen Mode (F11)
Expands the current work area so it fills the entire display. Non-essential controls such
as navigation menus are hidden from this mode. When in full screen mode, click this
toolbutton again to restore the normal viewing mode.
Save View
Saves the changes you made to the current view. Changes include the columns you
chose to display, the grouping options you made, the filters you applied, and other
custom settings.
Save View As
Displays options for saving the current view as a new view with a new name.
Delete View
Permanently removes the current view.
Customize View...
Opens the Customize Resource Assignments View dialog box, which includes a series
of tabs for customizing columns, grouping, filters, the Gantt chart, and security
access.
Toolbars
Actions Displays a list of icons available on the Actions toolbar. Select a menu
item to show or hide its icon on the toolbar. See Actions Menu of the Assignments
Page (on page 1177) for a list of available icons.

Reference Topics
1365
Edit Displays a list of icons on available on the Edit toolbar. Select a menu item
to show or hide its icon on the toolbar. See Edit Menu of the Assignments Page (on
page 1252) for a list of available icons.
View Displays a list of icons on available on the View toolbar. Select a menu
item to show or hide its icon on the toolbar. See View Menu of the Assignments
Page (on page 1362) for a list of available icons.
Customize Toolbars... Displays a dialog box where you can determine which icons
from the Actions, Edit, and View menus will be displayed on the corresponding
toolbars. See Customize Toolbar Items Dialog Box of the Assignments Page (on
page 699).
View Menu on Activities Page
Overview
The menu items on the View menu are identical to the buttons on the View toolbar.
Though the buttons on the menu are fixed, the same list of buttons can be configured on
the toolbar.
Screen Elements
Gantt Chart
Opens the Gantt chart on the Activities page. The table and Gantt chart are tiled
side by side.
Table
Opens the table which enables you to view column information for projects, WBSs,
and activities.
Activity Network
Opens the Activity Network which displays the relationships between activities.
Calendar View
Opens the Calendar View which displays activities in a calendar format.
Columns...
Opens the Customize Columns dialog box which you can use to configure which and
how columns display.
Group...
Enables you to configure how elements are grouped.
Filters submenu
The Filters submenu contains the following options for filtering data:
Show matches for : Determines which matches are displayed.

1366
Filters: Enables you to create, configure, or apply filters. See Customize Filters
Dialog Box of the Activities Page (on page 680).
Add New Filter: Enables you to create a new filter. See Create or Modify Filter
Dialog Box of the Activities Page (on page 653).
Clear Filters: Clears all filters applied to the current view.
Gantt Chart Options
Enables you to configure how the Gantt chart and its bars display. (Available only in
the Gantt chart view.)
Activity Network Options...
Opens the Customize Activity Network dialog box, which you can use to configure
the display of Activity Network boxes and options. (Available only in the Activity
Network view.)
Progress Spotlight
Creates a yellow curtain or background behind activities that should have
progressed during a specific timeperiod. You can drag the data date line to highlight
activities that occur between the last data date and the new data date. (Available
only in the Gantt chart view.)
Show/Hide Relationship Lines
Toggles the view of activities in the Gantt chart by showing or hiding the lines and
arrows that represent their predecessor and successor relationships. (Available only in
the Gantt chart view.)
Show/Hide Progress Line
Toggles the view of the activities in the Gantt chart by showing or hiding the line that
represents progress in direct relation to the provided information displayed in the
chart. (Available only in the Gantt chart view.)
Show Only Driving Relationships/ Show All Relationships
Toggles the view of relationships in the Activity Network. Show only driving
relationships allows you to automatically and immediately identify the longest path
through your project, view the status and details of activities on the path, and make
relevant decisions regarding resources and scheduling. Show all relationships allows
you to automatically view all the existing relationships between activities in the
Activity Network. (Available only in the Activity Network view.)
Select
Enables a user to select activities in the Activity Network.

Reference Topics
1367
Pan
Enables a user to make fine adjustments to the current view by directly moving the
chart or diagram in the work area. This option is only available if you are working in the
Activity Network.
Magnify
Enables the user to select a section of the Activity Network and see a magnified
version of the section.
Expand All (Alt+Plus)
In a hierarchical list or page of child items grouped by parent items, expands the list to
show all parent and child items.
Collapse All (Alt+Minus)
In a hierarchical list, arranges entries so that only the parent items are shown and child
entries are hidden.
Zoom to Fit
Adjusts the current view's height and width or timescale to fit as much of the data as
possible into the current work area.
Full Screen Mode (F11)
Expands the current work area so it fills the entire display. Non-essential controls such
as navigation menus are hidden from this mode. When in full screen mode, click this
toolbutton again to restore the normal viewing mode.
Save View
Saves the changes applied to the current view. If you navigate away from the page,
you are prompted to save the view or discard the changes you made.
Save View As
Displays options for saving the current view as a new view with a new name.
Delete View
Permanently removes the current view.
E-mail View
Sends a hyperlink of the current activity view to one or more users by electronic mail.
The link opens the view and, if the user has the proper security privileges, the same
projects that were open when the view was sent.
Customize View...
Opens the Customize View dialog box with options that vary depending on your
current page. The dialog box has a series of tabs to customize the columns, grouping,
filters, bars, Gantt chart, usage, and security access.

1368
Customize Detail Windows
Enables you to add or remove detail windows from the page.
Toolbars sub-menu
See Toolbars Sub-Menu of the View Menu (on page 1355).
View Menu on EPS Page
Overview
The buttons on the View menu are identical to the buttons on the View toolbar. Though
the buttons on the menu are fixed, the same list of buttons can be configured on the
toolbar.
Screen Elements
Gantt Chart
Opens the table, Gantt chart, and a corresponding toolbar. The Gantt chart enables
you to view a graphical display of progress. The Gantt chart is customizable.
Table
Opens the table which enables you to view column information for projects and EPSs.
Columns...
Opens the Customize Columns dialog box which you can use to configure which and
how columns display.
Group...
Enables you to configure how elements are grouped.
Filter By
Displays options for reducing the number of values displayed in a list or table by
showing only selected values and removing or filtering out unwanted values.
Gantt Chart Options
Enables you to configure how the Gantt chart and its bars display. (Available only in
the Gantt chart view.)
Expand All (Alt+Plus)
In a hierarchical list or page of child items grouped by parent items, expands the list to
show all parent and child items.
Collapse All (Alt+Minus)
In a hierarchical list, arranges entries so that only the parent items are shown and child
entries are hidden.

Reference Topics
1369
Zoom to Fit
Adjusts the current view's height and width or timescale to fit as much of the data as
possible into the current work area.
Full Screen Mode (F11)
Expands the current work area so it fills the entire display. Non-essential controls such
as navigation menus are hidden from this mode. When in full screen mode, click this
toolbutton again to restore the normal viewing mode.
Save View
Saves the changes applied to the current view. If you navigate away from the page,
you are prompted to save the view or discard the changes you made.
Save View As
Displays options for saving the current view as a new view with a new name.
Delete View
Permanently removes the current view.
Customize View...
Opens the Customize View dialog box with options that vary depending on your
current page. The dialog box has a series of tabs to customize the columns, grouping,
filters, bars, Gantt chart, usage, and security access.
Customize Detail Windows...
Enables you to select or clear options for each detail window, to add or remove it
from the page.
Toolbars sub-menu
See Toolbars Sub-menu of the View Menu (on page 1355).
WBS Documents Toolbar of the Activities Page
Overview
The following icons and screen elements appear in this toolbar; however, their availability
is subject to change based on your current selections, view settings, security permissions,
and other factors.
Screen Elements
Assign (Insert)
Assigns a document to the selected WBS.

1370
Delete (Delete)
Deletes or removes the currently selected data items or table rows.
Caution: Your selected data is permanently deleted once you click Save.
View Document
Opens a selected document for viewing.
View Document in AutoVue
Opens a document or graphic in Oracle's AutoVue. This option is available when a
content repository is installed and your P6 administrator has configured the
appropriate privileges and project access for you.
Customize Columns
Displays choices for customizing the columns (fields) that appear on the selected
screen. (Available only in the Gantt chart and Table views.)
WBS selector
Cycles through the WBS elements in your current view. The detail window shows data
from the currently selected WBS. Click or to advance to the next or previous
WBS.
WBS Earned Value Toolbar
Overview
The following icons and screen elements appear in this toolbar; however, their availability
is subject to change based on your current selections, view settings, security permissions,
and other factors.
Screen Elements
Apply Current Settings to Child WBS Elements
Applies the current settings in the Earned Value detail window to the children of the
selected WBS.
WBS selector
Cycles through the WBS elements in your current view. The detail window shows data
from the currently selected WBS. Click or to advance to the next or previous
WBS.
Reference Topics
1371
WBS General Toolbar of the Activities Page
Overview
The following icons and screen elements appear in this toolbar; however, their availability
is subject to change based on your current selections, view settings, security permissions,
and other factors.
Screen Elements
Customize Columns
Displays choices for customizing the columns (fields) that appear on the selected
screen. (Available only in the Gantt chart and Table views.)
WBS selector
Cycles through the WBS elements in your current view. The detail window shows data
from the currently selected WBS. Click or to advance to the next or previous
WBS.
WBS Milestones Toolbar of the Activities Page
Overview
The following icons and screen elements appear in this toolbar; however, their availability
is subject to change based on your current selections, view settings, security permissions,
and other factors.
Screen Elements
Percent Complete field
Calculates earned value according to completion of the WBS element's weighed
milestones, rather than the completion percentages of the element's activities.
Add (Insert)
Creates a new WBS milestone.
Delete (Delete)
Deletes or removes the currently selected data items or table rows.
Caution: Your selected data is permanently deleted once you click Save.
Move Up
Moves the selected item one level up in the sort order.
Move Down
Moves the selected item one level down in the sort order.

1372
WBS selector
Cycles through the WBS elements in your current view. The detail window shows data
from the currently selected WBS. Click or to advance to the next or previous
WBS.
Workgroup Tab Toolbar of the Documents Portlet of the Workgroup Workspace Page
Overview
The following icons and screen elements appear in this toolbar; however, their availability
is subject to change based on your current selections, view settings, security permissions,
and other factors.
Screen Elements
Add Document
Enables you to select a document to add.
Add Options menu
Displays a menu of actions supplementing the Add Document icon.
Add Document: Enables you to select a document to add.
Add from content repository: Enables you to search, browse by folder, and select
a document from the repository. You can then decide to copy the selected
document or just link to it.
Copy from existing template: Enables you to search and select a template to
copy as the basis for your new document.
Create new template: Enables you to browse and select a document template to
store for future use. You can then create new documents copied from this
template.
Add Folder: Enables you to add a document folder to the repository and set its
security policy.
Edit Details
Displays the Document Details dialog box to configure the details of the selected
document.
View Document
Opens a selected document for viewing.
View Options
Select from one of the following options in which to view the selected document:
View: Displays the selected document in a separate window.
Download: Allows you to download the document to your computer. You must
select a path for where the downloaded document will be saved.

Reference Topics
1373
Assign to Project
Reassigns the selected document to a project.
Delete
Deletes the selected item or items permanently.
Check out
Enables you to specify where the to check out current document to. Use the to
browse for a location. You can also select the Open Document option to determine
whether to open or just check out the document.
Check Out Options
Check out: Opens a dialog box to enter a location for where you want the
document to be checked out to. Use to browse for a location. Use the Open
Document option to determine whether to open the document or just check it
out.
Check in: Opens a dialog box to select a document to be checked in. Use
to browse for a document. Use the comments field to enter a comment to be
associated with the document. The Format and Version Type fields are read-only.
Click the Check In button to keep your changes and check in the document or
click cancel to close the dialog box without checking in the document.
Undo Check Out: Opens a read-only dialog box displayed the Title, Version,
and Path of the selected checked out document. If you continue to undo the
check out, any changes made to the selected document will be lost. Click Undo
Check Out to continue or click Cancel to close the dialog and keep the
document checked out.
Start Review
Opens the Start Review dialog box where you specify the reviewers, type of review,
and due date. The document review is officially initiated when you complete the
required fields on this dialog box and click Create Review.
Add to recent documents
Adds the currently selected document to the recent documents list.
Cut
Cuts the selected item and applicable attributes to the temporary clipboard,
removing it from its current location. The item and applicable attributes can then be
pasted to another supported location.
Move Options
Cut: Cuts the selected item and applicable attributes to the clipboard. This
removes them from their current locations.

1374
Paste: Completes a cut operation by inserting the item and supported
attributes to a new location.
Displays options for sending information about the currently selected item to one or
more recipients via electronic mail.
Search
Displays options for finding a specific matching entry or entries based on search
criteria.
Search Options
Search: Displays options for finding a specific matching entry based from
search criteria.
Clear Search Results: Removes any specified results to display all documents.
Working with Activity Progress
You can update and view the progress of activities on the Activities page.
You can record activity progress directly into the Activity Table. The Progress Spotlight
can help you quickly locate activities that need to be updated as well as see all the
activities that should have progressed during a specific time period.
Progress Spotlight displays a yellow background, or curtain, behind activities to indicate
the time period during which progress should have occurred. The time period is defined
by the smallest increment of the current timescale since the last data date. For example,
if the current timescale is set to Month/Week, Progress Spotlight highlights all activities
that should have progressed during the week since the data date. You can drag the end
point of the curtain to extend or compress the time period.
To update the activities quickly, you can use Ctrl+Up or Ctrl+Down keys to navigate to
each highlighted activity in sequence. If instead you want to automatically calculate
progress for some activities, you can add the Auto-Compute Actuals column to your
activity view so you can turn this option on as needed for specific activities.
Note: The Update Progress feature, often used immediately after
the Progress Spotlight feature in P6 Professional, is not available in
P6. Users will be able to click Schedule to schedule the project;
however, the revised data date in the spotlight will not be applied.

Reference Topics
1375
WP & Docs Tab Toolbar
Overview
The following icons and screen elements appear in this toolbar; however, their availability
is subject to change based on your current selections, view settings, security permissions,
and other factors.
Screen Elements
Refresh
Refreshes the current screen with any new, updated, or removed data. (This option is
only available on the Documents page.)
Edit Details
Displays the Document Details dialog box to configure the details of the selected
document.
Delete
Deletes the selected item or items permanently.
Displays options for sending information about the currently selected item to one or
more recipients via electronic mail.
Copyright © 2022 FDOKUMEN