A Comprehensive Study of the L1551 IRS 5 Binary System
38
arXiv:astro-ph/0212074v1 3 Dec 2002 Printed January 9, 2014 A Comprehensive Study of the L1551 IRS 5 Binary System Mayra Osorio 1 , Paola D’Alessio 2 , James Muzerolle 3 , Nuria Calvet 1 , Lee Hartmann 1 ABSTRACT We model the Class I source L1551 IRS 5, adopting a flattened infalling envelope surrounding a binary disk system and a circumbinary disk. With our composite model, we calculate self-consistently the spectral energy distribution of each component of the L1551 IRS 5 system, using additional constraints from recent observations by ISO, the water ice feature from observations with SpeX, the SCUBA extended spatial brightness distribution at sub-mm wavelengths, and the VLA spatial intensity distributions at 7 mm of the binary disks. We analyze the sensitivity of our results to the various parameters involved. Our results show that a flattened envelope collapse model is required to explain simultaneously the large scale fluxes and the water ice and silicate features. On the other hand, we find that the circumstellar disks are optically thick in the millimeter range and are inclined so that their outer parts hide the emission along the line of sight from their inner parts. We also find that these disks have lower mass accretion rates than the infall rate of the envelope. Subject headings: Physical data and processes: binary, disks — stars: circum- stellar matter, formation —ISM: individual (L1551 IRS 5) 1. INTRODUCTION L1551 IRS 5 in Taurus (distance 140 pc; Kenyon, Dobrzycka & Hartmann 1994) is one of the most extensively studied young stellar objects (YSOs). It is the prototypical 1 Harvard-Smithsonian Center for Astrophysics, 60 Garden St., Cambridge, MA 02138, USA; [email protected], [email protected], [email protected], [email protected], [email protected] 2 Instituto de Astronom´ ıa, UNAM, Ap. Postal 70-264, Cd. Universitaria, 04510 M´ exico D.F., M´ exico 3 Steward Observatory, University of Arizona, 933 North Cherry Avenue, Room N204, Tucson, AZ 85721- 0065
Transcript of A Comprehensive Study of the L1551 IRS 5 Binary System
arX
iv:a
stro
-ph/
0212
074v
1 3
Dec
200
2
Printed January 9, 2014
A Comprehensive Study of the L1551 IRS 5 Binary System
Mayra Osorio1, Paola D’Alessio2, James Muzerolle3, Nuria Calvet1, Lee Hartmann1
ABSTRACT
We model the Class I source L1551 IRS 5, adopting a flattened infalling
envelope surrounding a binary disk system and a circumbinary disk. With our
composite model, we calculate self-consistently the spectral energy distribution
of each component of the L1551 IRS 5 system, using additional constraints from
recent observations by ISO, the water ice feature from observations with SpeX,
the SCUBA extended spatial brightness distribution at sub-mm wavelengths, and
the VLA spatial intensity distributions at 7 mm of the binary disks. We analyze
the sensitivity of our results to the various parameters involved. Our results show
that a flattened envelope collapse model is required to explain simultaneously the
large scale fluxes and the water ice and silicate features. On the other hand, we
find that the circumstellar disks are optically thick in the millimeter range and
are inclined so that their outer parts hide the emission along the line of sight
from their inner parts. We also find that these disks have lower mass accretion
rates than the infall rate of the envelope.
Subject headings: Physical data and processes: binary, disks — stars: circum-
stellar matter, formation —ISM: individual (L1551 IRS 5)
1. INTRODUCTION
L1551 IRS 5 in Taurus (distance 140 pc; Kenyon, Dobrzycka & Hartmann 1994) is
one of the most extensively studied young stellar objects (YSOs). It is the prototypical
1Harvard-Smithsonian Center for Astrophysics, 60 Garden St., Cambridge, MA 02138, USA;
[email protected], [email protected], [email protected], [email protected],
2Instituto de Astronomıa, UNAM, Ap. Postal 70-264, Cd. Universitaria, 04510 Mexico D.F., Mexico
3Steward Observatory, University of Arizona, 933 North Cherry Avenue, Room N204, Tucson, AZ 85721-
0065
– 2 –
embedded YSO (Strom, Strom, & Vrba 1976) with a massive molecular outflow (Snell, Loren
& Plambeck et al. 1980). Adams, Lada, & Shu (1987) identified it as a protostellar (Class
I) source with an estimated infall rate for its envelope of ∼ 10−5M⊙ yr−1. The near-infrared
spectrum exhibits first-overtone absorption in CO, suggesting that IRS 5 is an FU Ori object
(Carr, Harvey, & Lester 1987), consistent with an analysis of the optical spectrum observed
in scattered light (Mundt et al. 1985 and Stocke et al. 1988). Given the wide variety of
observational constraints available, L1551 IRS 5 is clearly an ideal system for investigating
the circumstellar environment that surrounds protostars and to understand its implications
for the general process of star formation.
The spectral energy distribution (SED) of dust thermal emission in L1551 IRS 5 and
spatial intensity profile at several wavelengths have been modeled previously by several
authors (Adams, Lada, & Shu 1987; Butner et al. 1991; Kenyon, Calvet & Hartmann
1993, hereafter KCH93; Men’shchikov & Henning 1997; White et al. 2000). Many of the
models developed so far predict SEDs with silicate absorption features much deeper than that
revealed by recent observations with the Infrared Space Observatory (ISO) and adopt outer
envelopes smaller than indicated by sub-mm SCUBA observations (Chandler & Richer 2000).
Some models assume simple power-law density distributions for the circumstellar envelope
without requiring physical self-consistency. In addition, in most of the models, L1551 IRS
5 is considered as a single-star system, while high-resolution interferometric observations
(Rodrıguez et al. 1998) indicate that IRS 5 is a binary.
In this work, we present a physically self-consistent model to investigate the circumstellar
material in L1551 IRS 5 on different scales. We assume flattened envelope models (Hartmann
et al. 1994; Hartmann, Calvet & Boss 1996, HCB96) for which we solve the transfer of
radiation following the methods described by KCH93 and HCB96. We further adopt viscous
accretion disks that take into account the irradiation by the envelope such as those described
by D’Alessio, Calvet & Hartmann (1997, DCH97). With this composite model, we self-
consistently calculate the overall SED and spectral features, the sub-mm spatial intensity
profile, the SEDs of the inner disks, and compare with observations to constrain the envelope
and disk parameters.
This paper is organized as follows. In §2 we present a description of the L1551 IRS 5
system, with a summary of the observations used in our modeling efforts. In §3 we report
spectra at 2-5 microns which constrain disk properties and ice absorption. In §4 we discuss
the main assumptions of our modeling. In §5 we present our results and in §6 we discuss
them. Finally, in §7 we present a summary and conclusions.
– 3 –
2. THE L1551 IRS 5 SYSTEM
The complexity of the inner regions of IRS 5 has been increasingly recognized in recent
years. The possibility of the central source being a binary system was first suggested by
Bieging & Cohen (1985) from cm-wave observations and Looney, Mundy, & Welch (1997)
from mm-wave data. Detailed interferometric observations at 7 mm clearly show dust emis-
sion in two compact elongated structures with diameters ∼ 20 AU, which presumably are
the circumstellar disks of a binary system (Rodrıguez et al. 1998). Each disk may have its
own ionized jet (Rodrıguez et al. 1998; Fridlund & Liseau 1998).
On somewhat larger scales, mm-wave observations suggest an elongated structure with
scales of ∼ 100-400 AU (Keene & Masson et al. 1990; Lay et al. 1994; Looney et al. 1997).
This structure may correspond to a circumbinary ring or disk, (Looney et al. 1997), as in
the case of GG Tau (Dutrey, Guilloteau & Simon 1994). A structure with size in the range
of 400 < Rext . 1000 AU has been inferred from millimeter and submillimeter continuum
observations (Ladd et al. 1995, Hogerheijde et al. 1997), but it is difficult to know if this
structure corresponds to the circumbinary disk or to the inner part of the extended envelope.
Sub-mm images of broad dynamic range obtained with SCUBA (Chandler & Richer
2000) as well as millimeter continuum observations with IRAM (Motte & Andre 2001) reveal
dust thermal emission at large scales extending ∼ 10000 AU in L1551 IRS 5. The large-
scale structure of the envelope is flattened (Saito et al. 1996; Momose et al. 1998; Fridlund
et al 2002). Observations carried out by Ladd et al. (1995) at submillimeter continuum
reveal a large-scale cross-shaped pattern with size ∼ 1400 AU which may be caused by the
outflow carving out a section of the circumstellar material, consistent with the observation
of scattered light in the outflow lobe (Strom et al. 1976; Stocke et al. 1988).
In summary, the L1551 IRS 5 system appears to contain two protostars, each surrounded
by a circumstellar disk, both encircled by a circumbinary disk, and all disks surrounded by
an extended infalling flattened envelope. Our complex model contains all these components;
we need therefore to constrain parameters using the available data over a wide range of
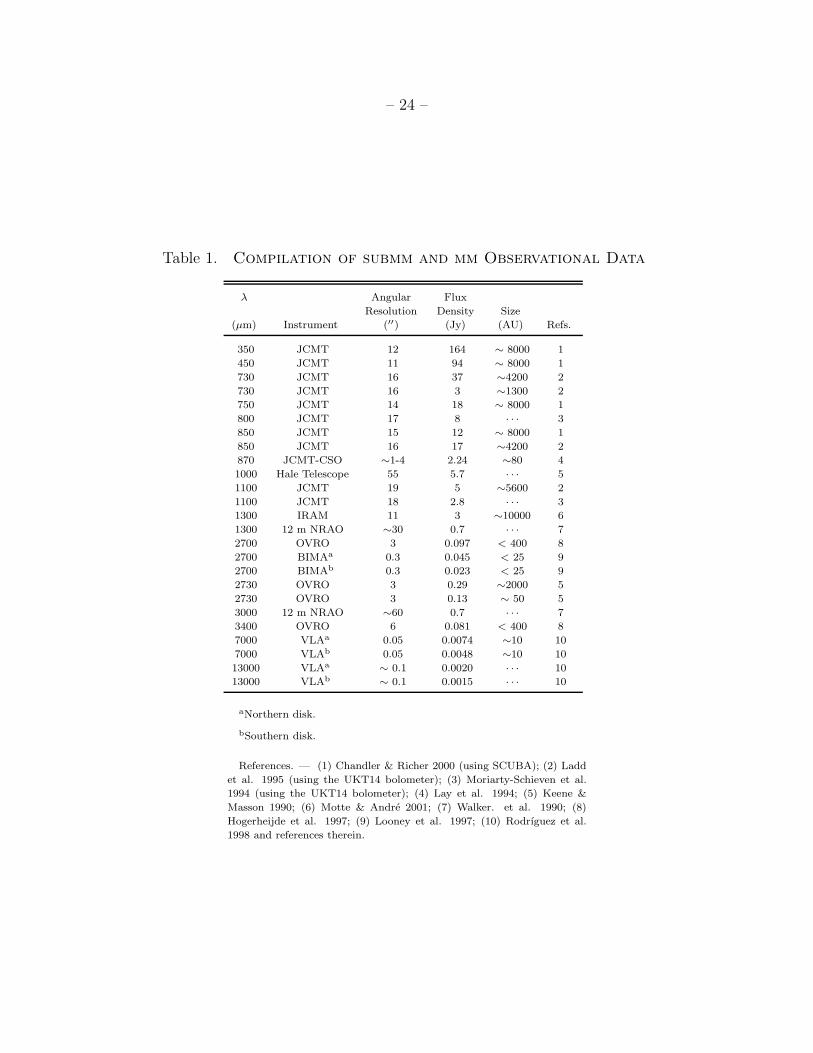
wavelengths, as outlined above. Table 1 lists the long wavelength data (λ > 300 µm) we
aim to model, compiled from the literature, with references indicated. Column 3 gives the
angular resolution of the observations, and column 5 indicates the estimated radius of the
observed structure in the corresponding reference. Fluxes at λ < 300 µm are taken from the
compilation of KCH93. We also use spectroscopic observations carried out by the ISO Long
and Short Wavelength spectrometers (LWS, SWS) toward IRS 5 (White et al. 2000), as well
as our scaled data from SpeX (§3).
– 4 –
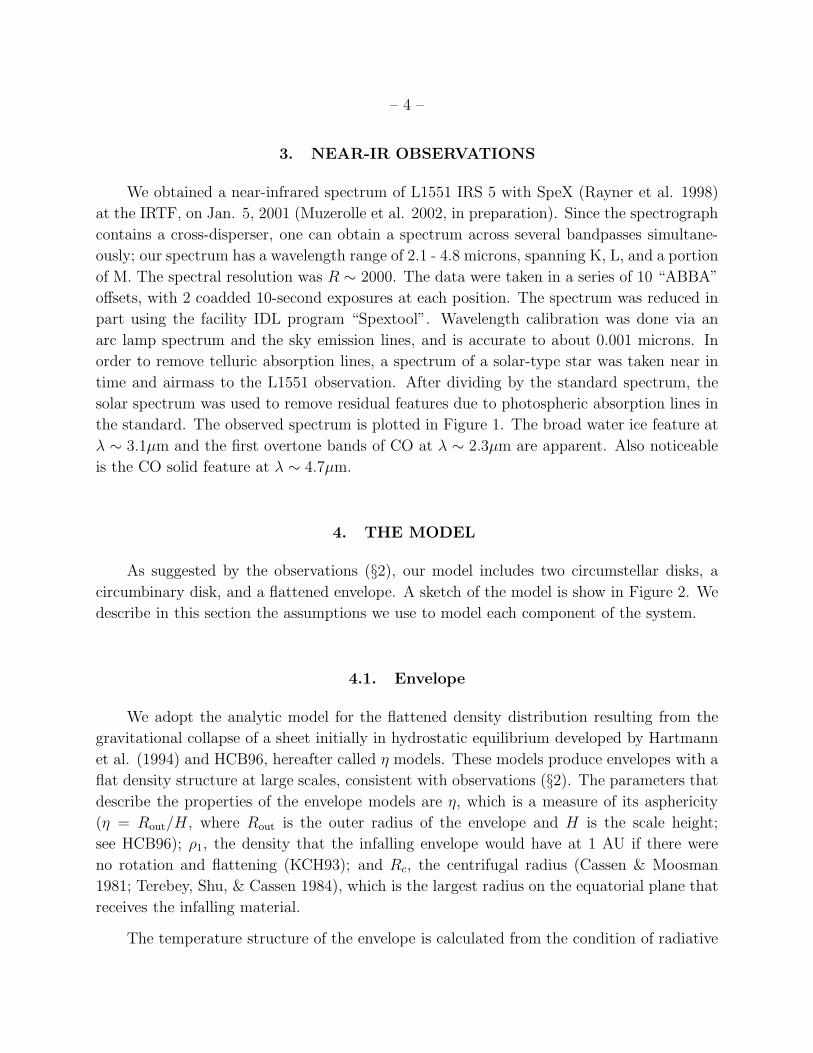
3. NEAR-IR OBSERVATIONS
We obtained a near-infrared spectrum of L1551 IRS 5 with SpeX (Rayner et al. 1998)
at the IRTF, on Jan. 5, 2001 (Muzerolle et al. 2002, in preparation). Since the spectrograph
contains a cross-disperser, one can obtain a spectrum across several bandpasses simultane-
ously; our spectrum has a wavelength range of 2.1 - 4.8 microns, spanning K, L, and a portion
of M. The spectral resolution was R ∼ 2000. The data were taken in a series of 10 “ABBA”
offsets, with 2 coadded 10-second exposures at each position. The spectrum was reduced in
part using the facility IDL program “Spextool”. Wavelength calibration was done via an
arc lamp spectrum and the sky emission lines, and is accurate to about 0.001 microns. In
order to remove telluric absorption lines, a spectrum of a solar-type star was taken near in
time and airmass to the L1551 observation. After dividing by the standard spectrum, the
solar spectrum was used to remove residual features due to photospheric absorption lines in
the standard. The observed spectrum is plotted in Figure 1. The broad water ice feature at
λ ∼ 3.1µm and the first overtone bands of CO at λ ∼ 2.3µm are apparent. Also noticeable
is the CO solid feature at λ ∼ 4.7µm.
4. THE MODEL
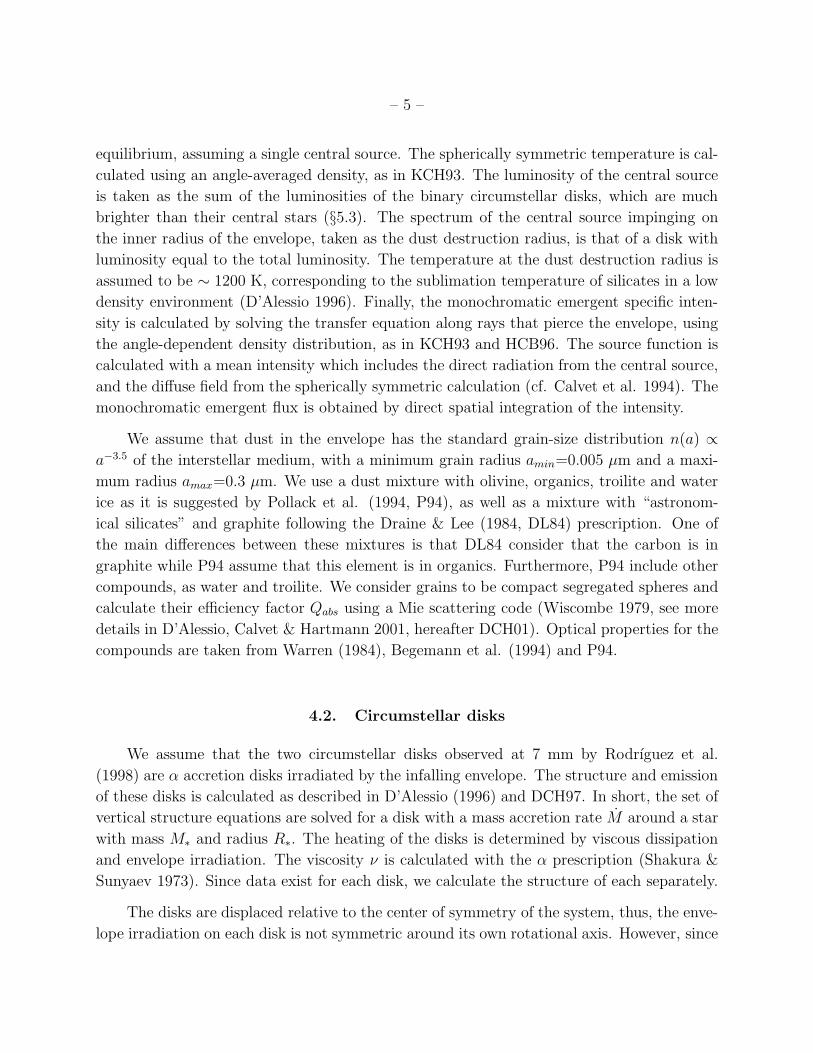
As suggested by the observations (§2), our model includes two circumstellar disks, a
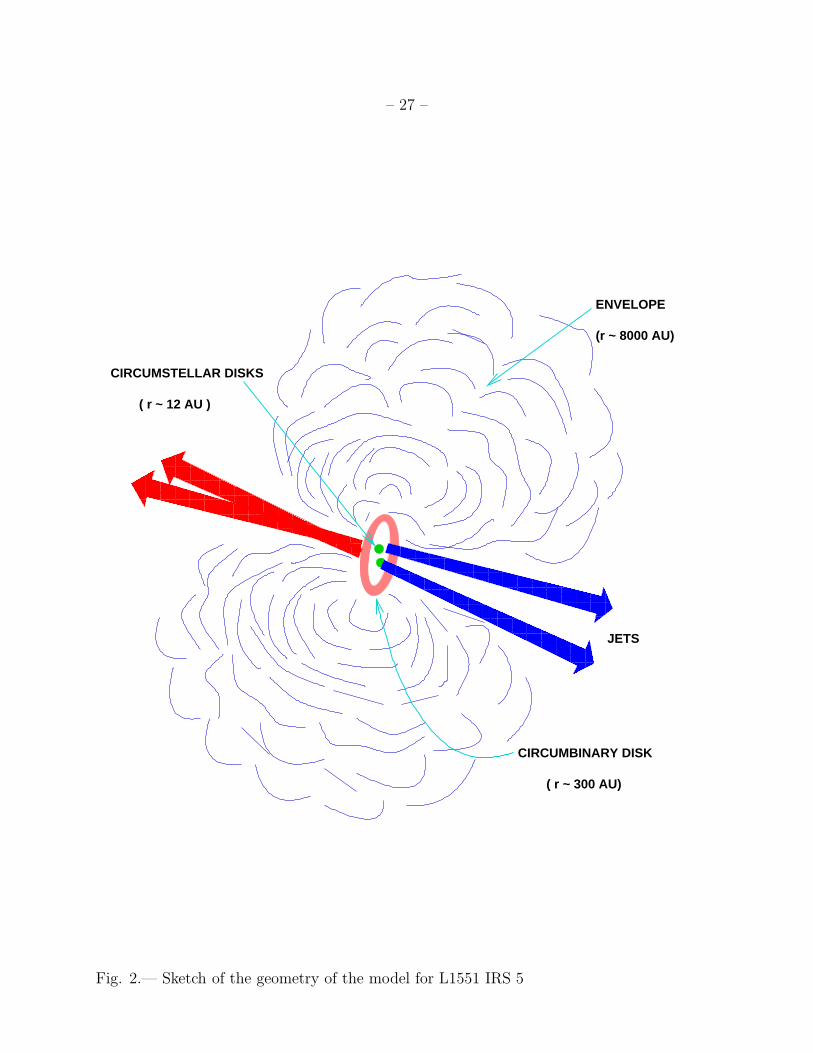
circumbinary disk, and a flattened envelope. A sketch of the model is show in Figure 2. We
describe in this section the assumptions we use to model each component of the system.
4.1. Envelope
We adopt the analytic model for the flattened density distribution resulting from the
gravitational collapse of a sheet initially in hydrostatic equilibrium developed by Hartmann
et al. (1994) and HCB96, hereafter called η models. These models produce envelopes with a
flat density structure at large scales, consistent with observations (§2). The parameters that
describe the properties of the envelope models are η, which is a measure of its asphericity
(η = Rout/H , where Rout is the outer radius of the envelope and H is the scale height;
see HCB96); ρ1, the density that the infalling envelope would have at 1 AU if there were
no rotation and flattening (KCH93); and Rc, the centrifugal radius (Cassen & Moosman
1981; Terebey, Shu, & Cassen 1984), which is the largest radius on the equatorial plane that
receives the infalling material.
The temperature structure of the envelope is calculated from the condition of radiative
– 5 –
equilibrium, assuming a single central source. The spherically symmetric temperature is cal-
culated using an angle-averaged density, as in KCH93. The luminosity of the central source
is taken as the sum of the luminosities of the binary circumstellar disks, which are much
brighter than their central stars (§5.3). The spectrum of the central source impinging on
the inner radius of the envelope, taken as the dust destruction radius, is that of a disk with
luminosity equal to the total luminosity. The temperature at the dust destruction radius is
assumed to be ∼ 1200 K, corresponding to the sublimation temperature of silicates in a low
density environment (D’Alessio 1996). Finally, the monochromatic emergent specific inten-
sity is calculated by solving the transfer equation along rays that pierce the envelope, using
the angle-dependent density distribution, as in KCH93 and HCB96. The source function is
calculated with a mean intensity which includes the direct radiation from the central source,
and the diffuse field from the spherically symmetric calculation (cf. Calvet et al. 1994). The
monochromatic emergent flux is obtained by direct spatial integration of the intensity.
We assume that dust in the envelope has the standard grain-size distribution n(a) ∝
a−3.5 of the interstellar medium, with a minimum grain radius amin=0.005 µm and a maxi-
mum radius amax=0.3 µm. We use a dust mixture with olivine, organics, troilite and water
ice as it is suggested by Pollack et al. (1994, P94), as well as a mixture with “astronom-
ical silicates” and graphite following the Draine & Lee (1984, DL84) prescription. One of
the main differences between these mixtures is that DL84 consider that the carbon is in
graphite while P94 assume that this element is in organics. Furthermore, P94 include other
compounds, as water and troilite. We consider grains to be compact segregated spheres and
calculate their efficiency factor Qabs using a Mie scattering code (Wiscombe 1979, see more
details in D’Alessio, Calvet & Hartmann 2001, hereafter DCH01). Optical properties for the
compounds are taken from Warren (1984), Begemann et al. (1994) and P94.
4.2. Circumstellar disks
We assume that the two circumstellar disks observed at 7 mm by Rodrıguez et al.
(1998) are α accretion disks irradiated by the infalling envelope. The structure and emission
of these disks is calculated as described in D’Alessio (1996) and DCH97. In short, the set of
vertical structure equations are solved for a disk with a mass accretion rate M around a star
with mass M∗ and radius R∗. The heating of the disks is determined by viscous dissipation
and envelope irradiation. The viscosity ν is calculated with the α prescription (Shakura &
Sunyaev 1973). Since data exist for each disk, we calculate the structure of each separately.
The disks are displaced relative to the center of symmetry of the system, thus, the enve-
lope irradiation on each disk is not symmetric around its own rotational axis. However, since
– 6 –
the disks are small compared to the size of the envelope, we approximate the backwarming
to be constant over each disk. The flux crossing the equatorial plane at a given distance from
the envelope center is calculated solving the 2D radiative transfer throughout the envelope,
as described in DCH97. The flux intercepted by each disk is then averaged over the disk
annuli to give the irradiation flux on the disk, Firr, or equivalently, the irradiation tempera-
ture, Tirr = (Firr/σR)1/4, which is used as input for the disk vertical structure calculations.
The envelope model used in these calculations is the one that gives the best fit of the SED
and to the large-scale brightness sub-mm distribution.
Since from present observations we cannot know if one of the disks is the dominant
luminosity source in the system, we assume the same mass accretion rate and stellar param-
eters for both disks. We also assume that the disks have the same dust composition than
the envelope. However, to explore the possibility of grain growth, we consider amax to be a
free parameter for each disk. Other input parameters are the inclination angle of each disk
(between their rotation axis and the line of sight), the viscosity parameter α (or equivalently,
its mass, DCH01), and the disk radius Rd.
4.3. Circumbinary Structure
In order to investigate whether the flattened structure at scales of 100-400 AU resolved
at millimeter and submillimeter wavelengths corresponds to a circumbinary disk, we also
included the contribution of this component. According to DCH97, for distances larger than
∼ 20 AU from its center, the temperature T and surface density Σ of a disk surrounded by
an optically thick envelope in which the heating is dominated by envelope irradiation can be
represented by power laws in radius as T ∼ T0(R/100 AU)−0.5 and Σ ∼ Σ0(R/100 AU)−1,
where R is the cylindrical radius from the disk center. The temperature T0 is fixed by
the envelope irradiation at 100 AU, and we take Σ0, the surface density at 100 AU, as
a free parameter. The circumbinary disk has a fixed outer radius given by the envelope
centrifugal radius Rc and an inner radius which is expected to be several times larger than
the maximum separation between the circumstellar disks (Artymowicz et al. 1991). We
present models with a grain size distribution similar to that in the extended envelope and
that in the circumstellar disks, as the two extreme possibilities for the state of the dust in
this disk.
– 7 –
5. MODEL RESULTS
In this section, we discuss the combination of parameters characterizing each one of the
components of the L1551 IRS 5 system that can reproduce self-consistently the observational
constraints. We have arranged the section according to the interpretation of a main con-
straint, but it should be kept in mind that the results for all components are interdependent
and the present ordering just aims to make their description easier.
5.1. Large scale fluxes
5.1.1. Envelope SED
Each range of wavelengths in the SED of the envelope is sensitive to different parameters.
The observed peak flux and its corresponding wavelength, which occurs generally at the far
infrared (IR) range, depend mostly on the density of the envelope, which fixes the scaling ρ1,
with a weak dependence upon the total luminosity of the system (see trends of KCH93 for
low mass protostars and Osorio et al. 1999, for high mass protostars). On the other hand,
the mid and near-IR fluxes are sensitive to the η parameter, the inclination to the line of
sight i, and the centrifugal radius Rc. The radius of the envelope is determined by the large
scale spatial intensity profiles (§5.2) and we take it as ∼ 8000 AU.
The apparent luminosity of the system (calculated by direct integration of the observed
SED, that would correspond to the luminosity of an isotropic source) is Lapp = 25L⊙, and
it is an indicator of the total luminosity Ltot. For a given total luminosity and model, the
apparent luminosity depends on the inclination of the system to the line of sight, especially
in systems with a high degree of flattening. For instance, for η = 2.5, the ratio Lapp/Ltot goes
from ∼ 1.4 if the system is seen pole-on, i = 0, to ∼ 0.5, for edge-on systems. Fortunately,
for the range of inclinations that produce the best fits to the observed SEDs, Lapp/Ltot ∼ 1.
Given the approximations in our treatment, specially the assumption of spherical symmetry
for the envelope temperature distribution, we take here that Ltot = Lapp.
The observed flux at the peak of the SED indicates a value of ρ1 ∼ 4.5× 10⁻¹³ g cm−3,
which also consistently results in high fluxes for the large beam size observations in the
submillimeter and millimeter ranges (§5.2). This value of ρ1, is the maximum density that
can produce the high millimeter fluxes without too much extinction in the mid-infrared. The
luminosity and ρ1 are similar to those found by KCH93 for L1551, who considered envelopes
slightly flattened in their inner part by rotation as described by Terebey, Shu & Cassen
(1984, hereafter TSC envelopes); however those models predict a very deep silicate feature
– 8 –
which is not observed.
The recent silicate (10µm) and water ice (3µm, 6µm) features observed by ISO and
SpeX place stringent limits on the envelope parameters and its geometry. Even in the
case of moderate inclination angles, TSC envelopes predict too much extinction at short
wavelengths and therefore features deeper than the observed ones. Flattened η envelopes
with the same ρ1 as in TSC envelopes, have less polar material and more equatorial material.
So, at inclination angles to the line of sight closer to the rotation axis, these envelopes have
less extinction than TSC envelopes.
To show the dependence of the SED on η, i, and Rc, we present model SEDs for different
values of these parameters, with L and ρ1 fixed by the considerations above, and compare
them with observations (§2). Further constraints come from other evidences. The nearly
pole-on case (i = 10◦) is ruled out because the outflow extends considerably in the plane of
the sky, with well-separated red- and blueshifted CO outflow lobes (Snell et al. 1980). In
addition, it is likely that the binary system formed out of lower angular momentum material
than is currently falling in; moreover, the evidence for a circumbinary disk also suggests that
infalling material has a larger specific angular momentum than that of the binary separation.
For these reasons, we will consider centrifugal radii larger than the maximum separation of
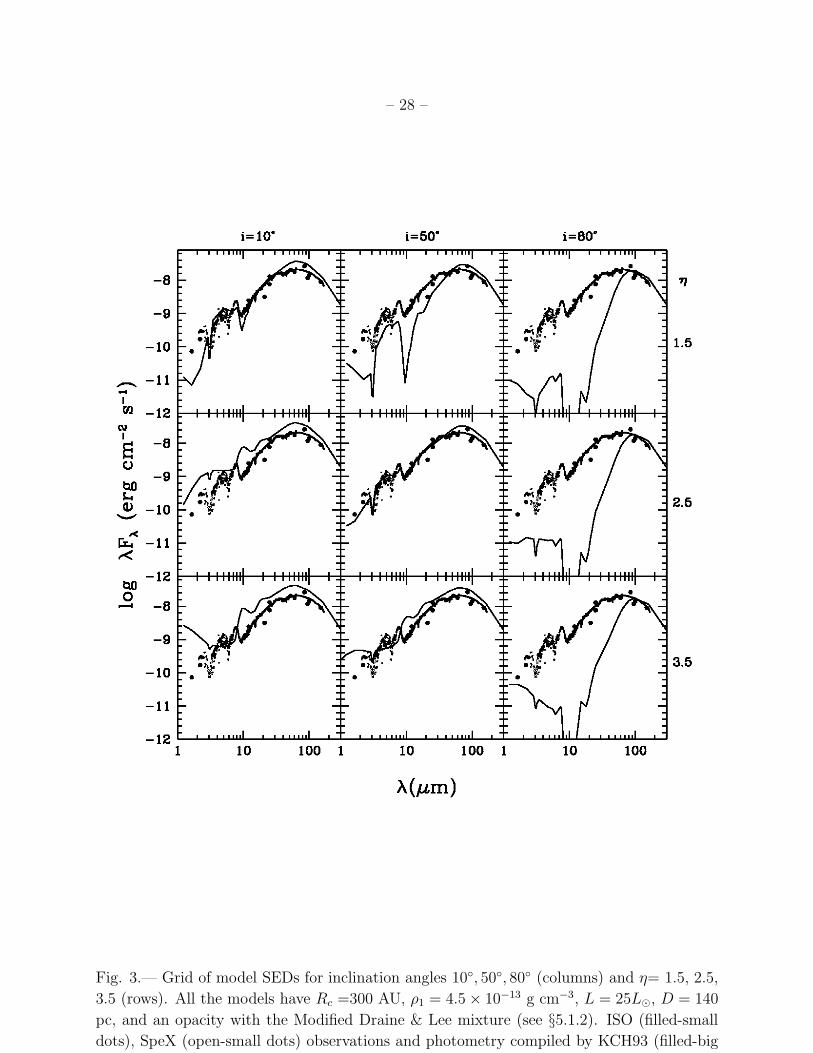
the binary sources (∼ 40 AU). Figure 3 (solid line) shows the model SEDs for Rc =300
AU for different inclinations and values of η. Model SEDs in Figure 3 were calculated with
abundances of silicates and graphite consistent with DL84 and an abundance for water ice
lower than P94 by a factor of two. We will consider the effects of dust opacities in more
detail in §5.1.2.
In general, all models for high inclination angles (∼ 80◦) predict too little near and mid-
infrared emission, regardless of the degree of flattening (η parameter). As discussed above,
models with roughly spherical envelopes (η = 1.5, similar to the case of TSC envelopes)
have too much extinction along of the line of sight and therefore exhibit deeper absorption
features than models which assume flatter envelopes. Thus, models for flattened envelopes
and with moderate inclinations explain better the observed SED; in particular the best fits
are obtained at inclination angles i ∼ 50◦ and η ∼ 2.5 for the case of Rc=300 AU, which we
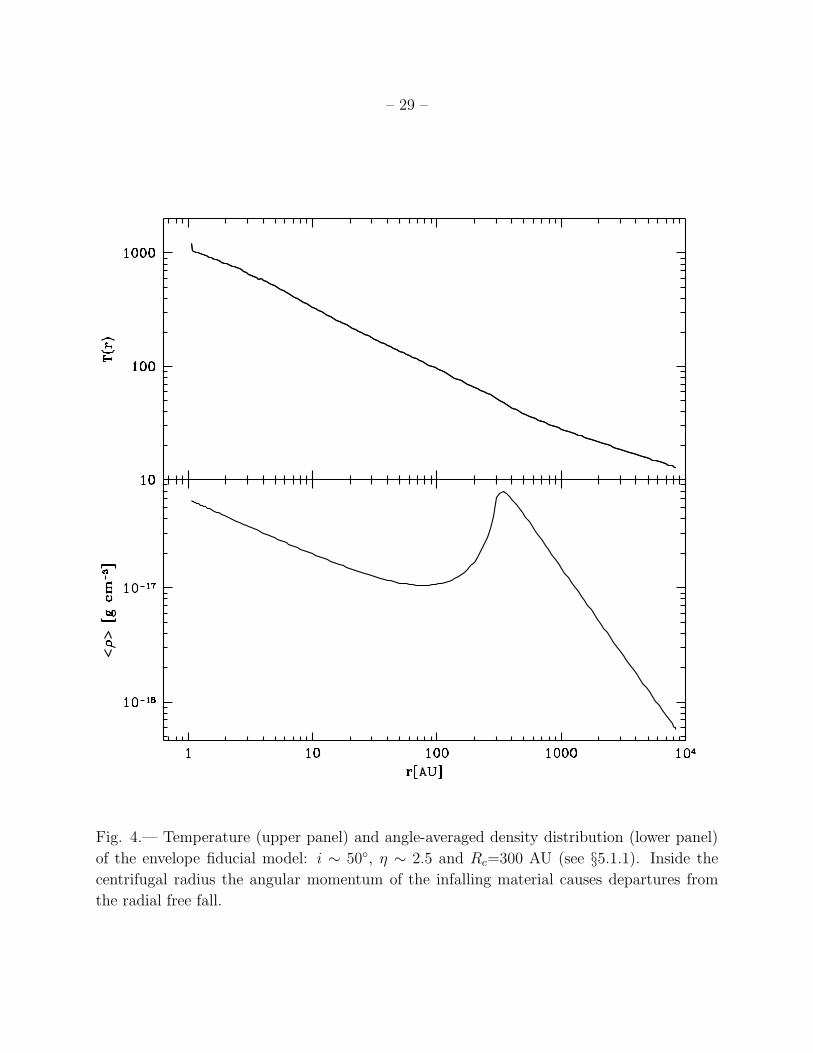
adopt as our fiducial model. The angle-averaged density and temperature distributions of
this model are shown in Figure 4.
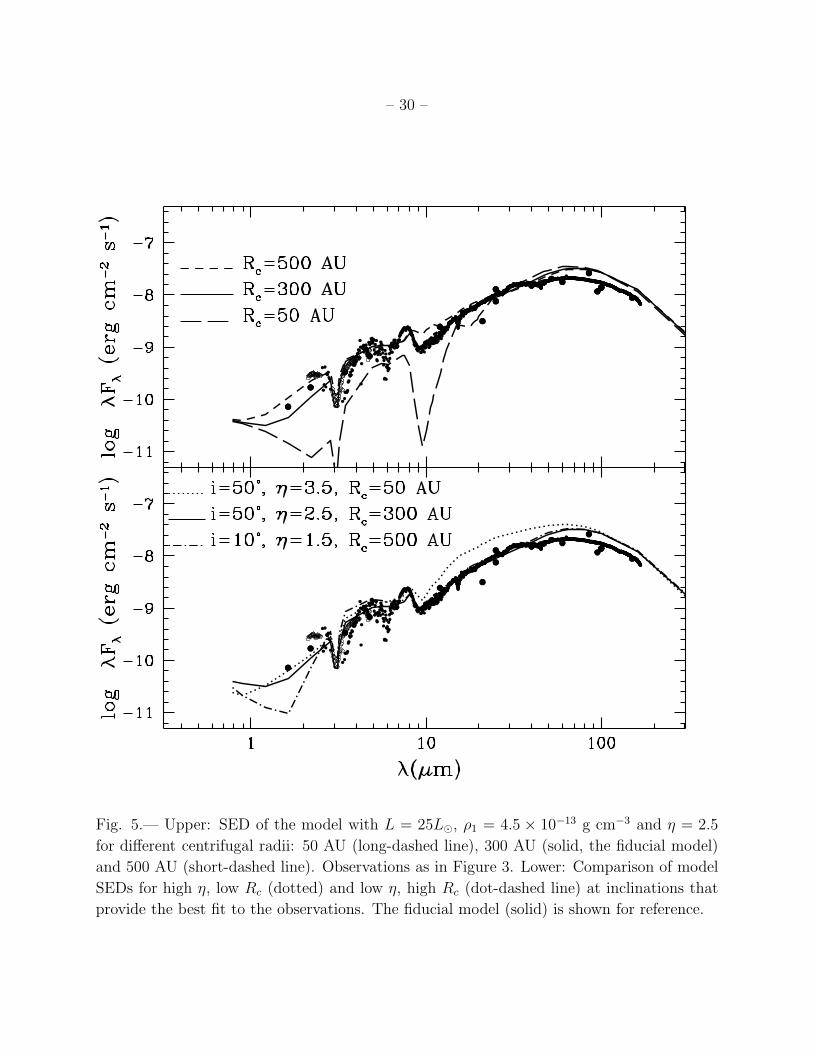
The upper panel of Figure 5 compares observations with model SEDs calculated for
i ∼ 50◦, η ∼ 2.5 and Rc = 50, 300, and 500 AU. All these models, with the same ρ1,
result in similar millimeter and centimeter fluxes because at these wavelengths the envelope
is optically thin and the emission comes from large scales. However, the near and mid-IR
fluxes are much more sensitive to η, i, and Rc. The model with small centrifugal radius has
– 9 –
too much extinction along of the light of sight resulting in too deep silicate and ice features;
the model with large Rc produces too little absorption. The parameters η, Rc, and i are
somewhat interchangeable (HCB96); for instance, both an increase in η or in Rc result in
low mean densities in the inner envelope. However, there are differences. As Rc increases,
material tends to pile up at larger distances from the luminosity source on the equatorial
plane; conversely, if Rc is small, even if the envelope is very flat there is material near the
source and thus heated to higher temperatures. So, model envelopes with large η and small
Rc tend to have higher near and mid-IR fluxes than low η models with large Rc, as shown
in the lower panel of Figure 5. The parameters are thus fairly well constrained when aiming
to fit a large range of wavelengths.
5.1.2. Effect of dust opacities on the envelope SED
One of the main uncertainties in determining the emission of YSOs lies in the dust
opacity, since the dust properties are not well known. Several models for the dust opacities
have been used so far in the interpretation of the SED of L1551 IRS 5, from interstellar
medium dust (KCH93) to mixtures of segregates and aggregates grains, the latter with cores
of silicates covered by ice mantles (White et al. 2000). They all are adjusted to fit the
observations, so it is still not clear which is the best representation of the grains for this
object.
In this work, we compare two mixtures that have been widely quoted in the literature
of YSO in recent years and determine which gives the best fit to the observations. We
calculate models for the mixture proposed by P94 for molecular envelopes, which includes
olivine, organics, troilite, and water ice, with mass fractional abundances with respect to gas
of ζsil = 0.0034, ζorg = 0.0041, ζtro = 0.000768, ζice = 0.0012. We also use the DL84 mixture,
which characterizes the interstellar medium; this mixture consists of grains of graphite and
“astronomical” silicates with a mass fractional abundances of ζsil = 0.004 and ζgra = 0.0025.
We have added water ice to the DL84 mixture, to account for the observed water ice bands,
with abundances similar or lower than that in the P94 mixture, as required to fit the obser-
vations. However, our mixtures do not consider the ice feature at 6 µm for the lack of optical
constants in this band. Furthermore, in the case of DL84 mixture we increase slightly the
silicate abundance (∼ 20 %) to improve the fit at the near IR.
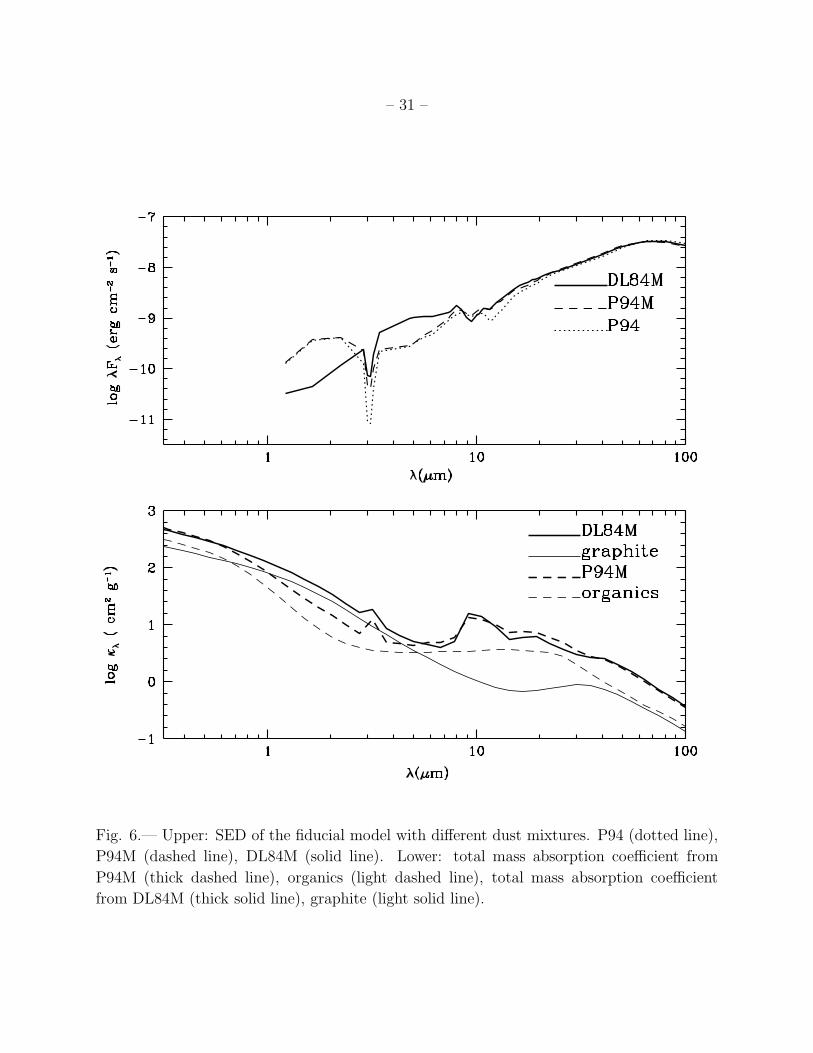
The upper panel of Figure 6 shows the model SED calculated for the parameters of
the fiducial model with three different dust mixtures: P94, P94 but with ice with approxi-
mately half of the abundance in P94, which we call P94M, and DL84, again with ice with
approximately half of the abundance in P94, which we call DL84M. As discussed in §5.1.1,
– 10 –
the model SED with DL84M at i ∼ 50◦, gives the best fit to the near to far infrared SED.
The water ice abundance is so high using P94 that the feature at 3 µm is very strong, much
more than in the observations and a feature of water ice at 12 µm appears which is also
inconsistent with the observations. However, even with a reduced water ice abundance, the
P94M SED is different from the DL84M SED: the near-IR are higher, while the mid IR flux
is lower which is in conflict with the observations.
The lower panel of Figure 6 compares the P94M and the DL84M opacities. One impor-
tant difference between the two mixtures occurs in the near infrared range (∼ 1µm - 5µm),
where the total opacity is mainly due to the carbon component of the mixture and this
element can be either in graphite or organics. Although the abundance of organics (P94M)
is higher than that of graphite (DLM84), its extinction in this interval is lower than that of
graphite (see the behavior of the curves of these components in Fig. 6). Since the opacity
is lower in the P94M mixture, the inner hot regions are more exposed with this mixture
and the emergent flux is higher around 2µm. However, also because the opacity is lower in
the near-IR range, where most of the light from the circumstellar disks heating the envelope
arises, the P94M inner envelope has a temperature ∼ 0.8 times cooler than the DL84M enve-
lope. In the mid-IR, the opacities for both mixtures have more similar values, so the depths
where τλ ∼ 1 are approximately the same. Since the same spatial regions are contributing
to the emission, but they are cooler for P94M, the emergent flux is lower. Because of these
differences, we could not find any combination of parameters (i, Rc, η) that fitted the SED
using the P94 mixture, even with lower ice content.
5.2. Millimeter Spatial Intensity Profiles
In this section, we consider the density distribution at large scales, inferred from the
millimeter spatial intensity profiles in the SCUBA images of Chandler & Richer (2000, CR00).
A comparison in two dimensions between the SCUBA images of CR00 and our predicted
images is not possible because the JCMT beam is asymmetric and time variable along the
observing run (see CR00 for details). Therefore, we averaged both the model and the data
in circular annuli centered at the peak position. This yields a mean spatial intensity profile,
I(p) where p is the angular radius from source center. We simulate the observation at each
wavelength convolving the output model with the approximate beam given by CR00; the
model includes the envelope, the circumstellar disks, and the circumbinary disk. These
components are calculated with the parameters that give the best fit to other observables,
as determined in §5.1.1, 5.3, and 5.4.
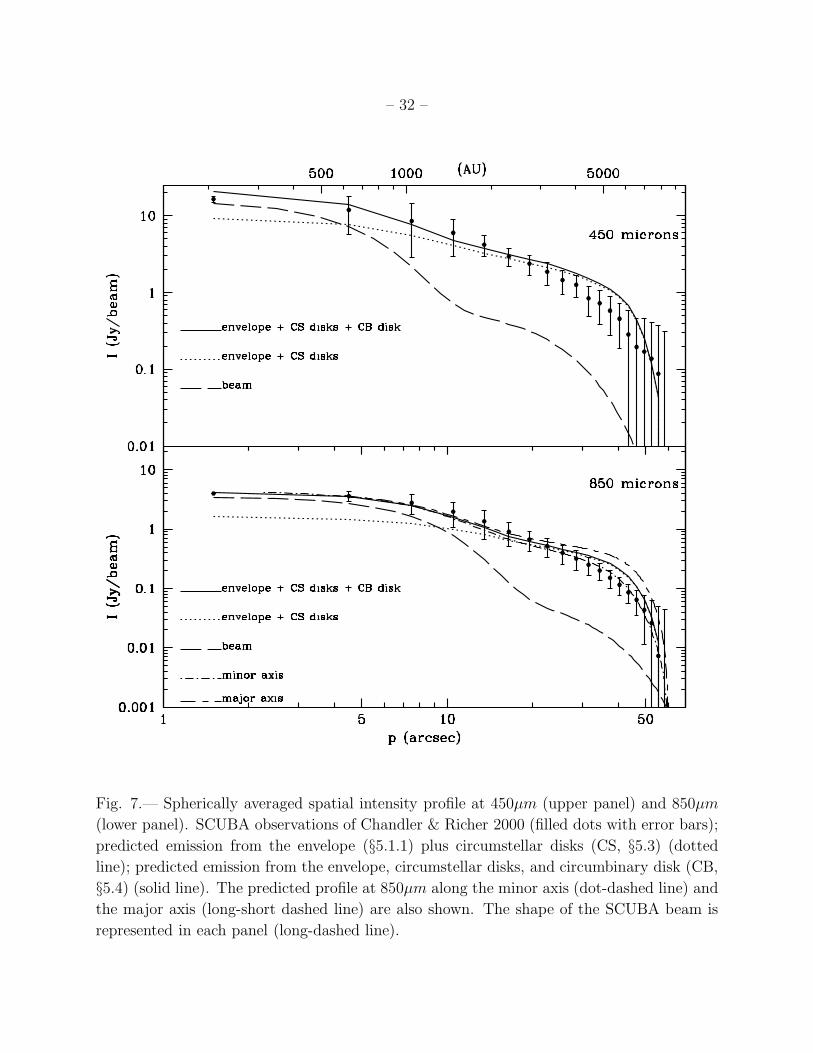
Figure 7 compares the observed and the predicted spatial profiles at 450 and 850 µm,
– 11 –
with observational errors from CR00. Following CR00, we subtracted the intensity at 60”
from both the observations and the model. The dotted line shows the predicted emission
without the circumbinary disk; the solid line includes all components of the system, showing
the importance of the circumbinary disk at small and intermediate scales. The combined
model provides a good fit to the observations, specially for 850µm, which has the highest
signal-to-noise (CR00).
To indicate the effects of flattening in the envelope, we show in Figure 7 model intensity
profiles calculated along the minor (rotational) axis and the major (equatorial) axis of the
envelope. The fact that the observed profile is closer to that of the lower intensity minor axis
suggests that there is less material at large scales than expected, even for a flat envelope,
which may be due to the effect of the wind/jet.
5.3. Circumstellar disk SEDs, 7 mm images and near IR CO absorption
The millimeter observations at high angular resolution can be used to fit the properties
of the circumstellar disks, since the contribution of the envelope and circumbinary disk are
resolved out (Rodrıguez et al. 1998 and references therein; Looney et al. 1997; also see Table
1), and long-wavelength data indicate that contamination by free-free emission from ionized
outflows is unlikely (Rodrıguez et al. 1998.)
Since we are assuming that the system luminosity arises in the disks, we can equate
Ltot/2 to the accretion luminosity of each disk, Lacc = GM∗M/R∗. Another constraint
comes from the maximum effective temperature in the disk for a steady viscous disk model,
Tmax = 0.29 (GM∗M/R∗3σ)1/4, which we can equate to ∼ 5000 K, from estimates of the
optical scattered light spectrum (Stocke et al. 1988). Combining these two constraints, we
obtain R∗ = 1.4R⊙ and (M∗/0.3M⊙)(M/2 × 10−6M⊙ yr−1) ∼ 1. We adopt M∗ ∼ 0.3M⊙,
close to the value expected for a typical low-mass T Tauri star near the birthline (Stahler
1988; Hartmann, Cassen, & Kenyon 1997), so M ∼ 2 × 10⁻⁶M⊙ yr−1. (Note that for an α
disk, the surface density Σ ∝ M/ν ∝ MM∗1/2, so we need to specify M and M∗ separately).
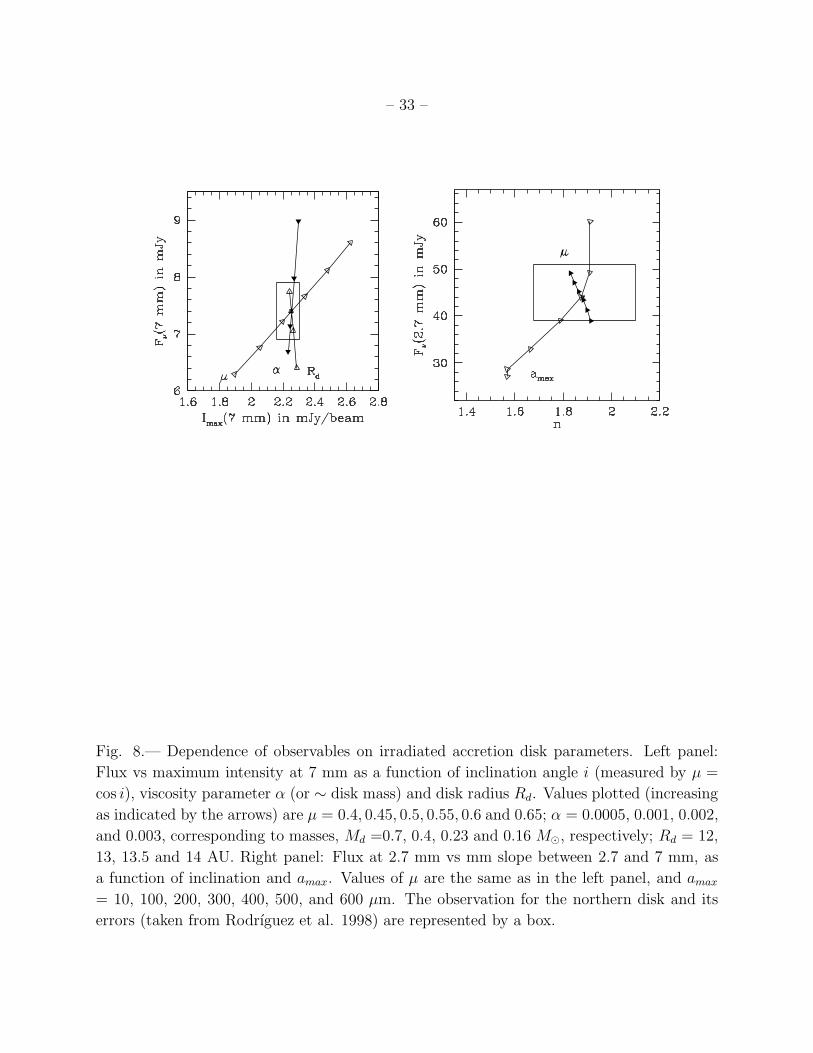
Figure 8 shows the dependence of observables on the disk model parameters. On the
left panel, we show the flux at 7 mm vs Imax, which is the maximum intensity of the disk
model image at this wavelength, calculated by convolving the emergent intensity with a
0.′′062 × 0.′′052 gaussian beam. The observed values of these quantities and the beam size
are taken from Rodrıguez et al. (1998). Results are shown for different inclination angles
(measured by µ = cos i), viscosity parameter α (or ∼ disk mass), and disk radius Rd, with
values indicated in the figure caption. In the right panel of Figure 8, we show the total
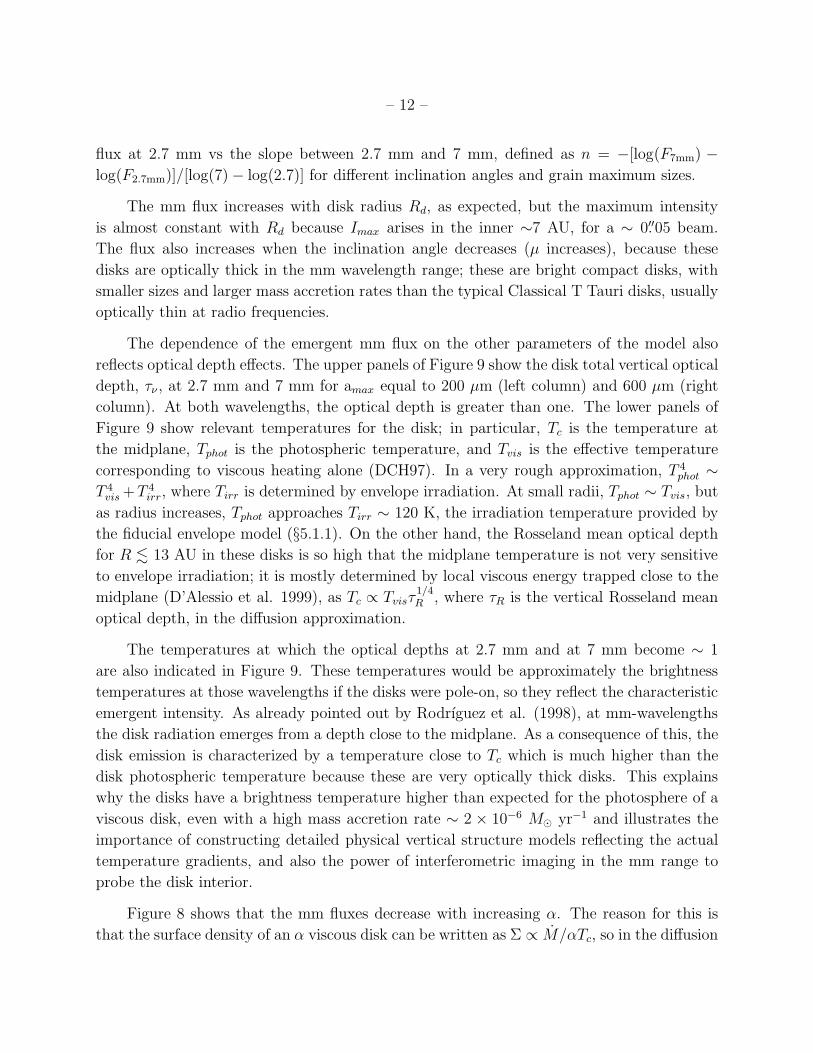
– 12 –
flux at 2.7 mm vs the slope between 2.7 mm and 7 mm, defined as n = −[log(F7mm) −
log(F2.7mm)]/[log(7) − log(2.7)] for different inclination angles and grain maximum sizes.
The mm flux increases with disk radius Rd, as expected, but the maximum intensity
is almost constant with Rd because Imax arises in the inner ∼7 AU, for a ∼ 0.′′05 beam.
The flux also increases when the inclination angle decreases (µ increases), because these
disks are optically thick in the mm wavelength range; these are bright compact disks, with
smaller sizes and larger mass accretion rates than the typical Classical T Tauri disks, usually
optically thin at radio frequencies.
The dependence of the emergent mm flux on the other parameters of the model also
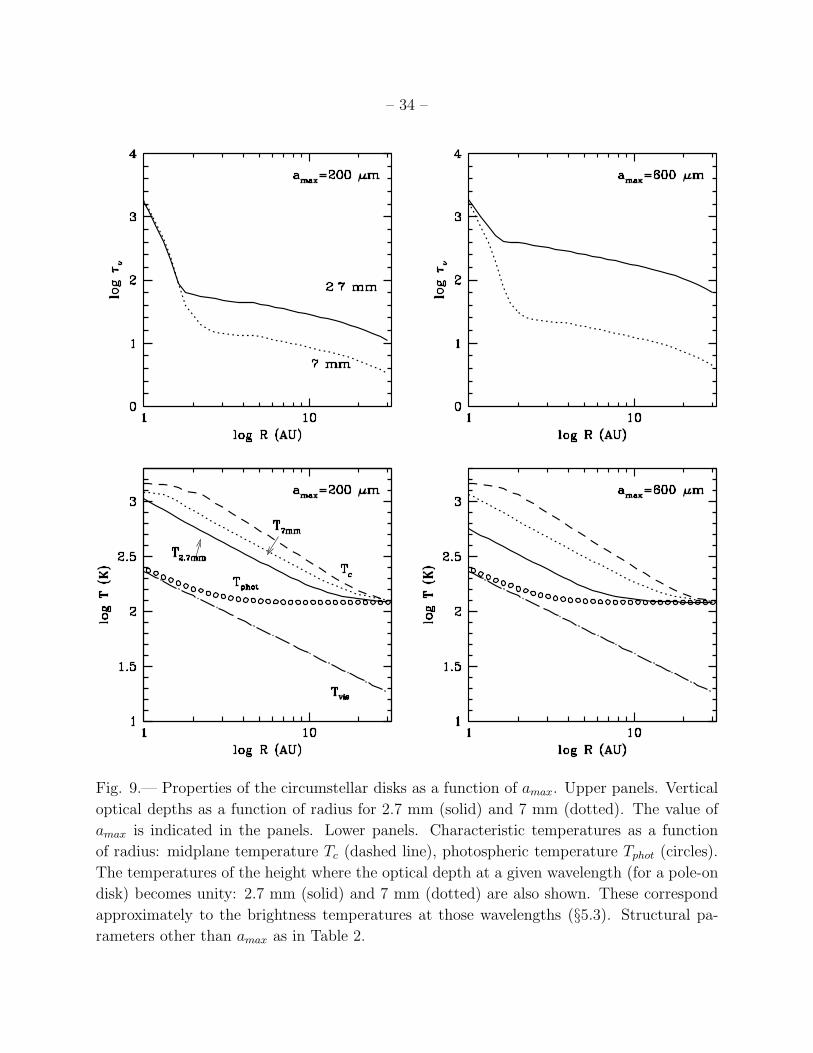
reflects optical depth effects. The upper panels of Figure 9 show the disk total vertical optical
depth, τν , at 2.7 mm and 7 mm for amax equal to 200 µm (left column) and 600 µm (right
column). At both wavelengths, the optical depth is greater than one. The lower panels of
Figure 9 show relevant temperatures for the disk; in particular, Tc is the temperature at
the midplane, Tphot is the photospheric temperature, and Tvis is the effective temperature
corresponding to viscous heating alone (DCH97). In a very rough approximation, T 4phot ∼
T 4vis +T 4
irr, where Tirr is determined by envelope irradiation. At small radii, Tphot ∼ Tvis, but
as radius increases, Tphot approaches Tirr ∼ 120 K, the irradiation temperature provided by
the fiducial envelope model (§5.1.1). On the other hand, the Rosseland mean optical depth
for R . 13 AU in these disks is so high that the midplane temperature is not very sensitive
to envelope irradiation; it is mostly determined by local viscous energy trapped close to the
midplane (D’Alessio et al. 1999), as Tc ∝ Tvisτ1/4R , where τR is the vertical Rosseland mean
optical depth, in the diffusion approximation.
The temperatures at which the optical depths at 2.7 mm and at 7 mm become ∼ 1
are also indicated in Figure 9. These temperatures would be approximately the brightness
temperatures at those wavelengths if the disks were pole-on, so they reflect the characteristic
emergent intensity. As already pointed out by Rodrıguez et al. (1998), at mm-wavelengths
the disk radiation emerges from a depth close to the midplane. As a consequence of this, the
disk emission is characterized by a temperature close to Tc which is much higher than the
disk photospheric temperature because these are very optically thick disks. This explains
why the disks have a brightness temperature higher than expected for the photosphere of a
viscous disk, even with a high mass accretion rate ∼ 2 × 10⁻⁶ M⊙ yr−1 and illustrates the
importance of constructing detailed physical vertical structure models reflecting the actual
temperature gradients, and also the power of interferometric imaging in the mm range to
probe the disk interior.
Figure 8 shows that the mm fluxes decrease with increasing α. The reason for this is
that the surface density of an α viscous disk can be written as Σ ∝ M/αTc, so in the diffusion
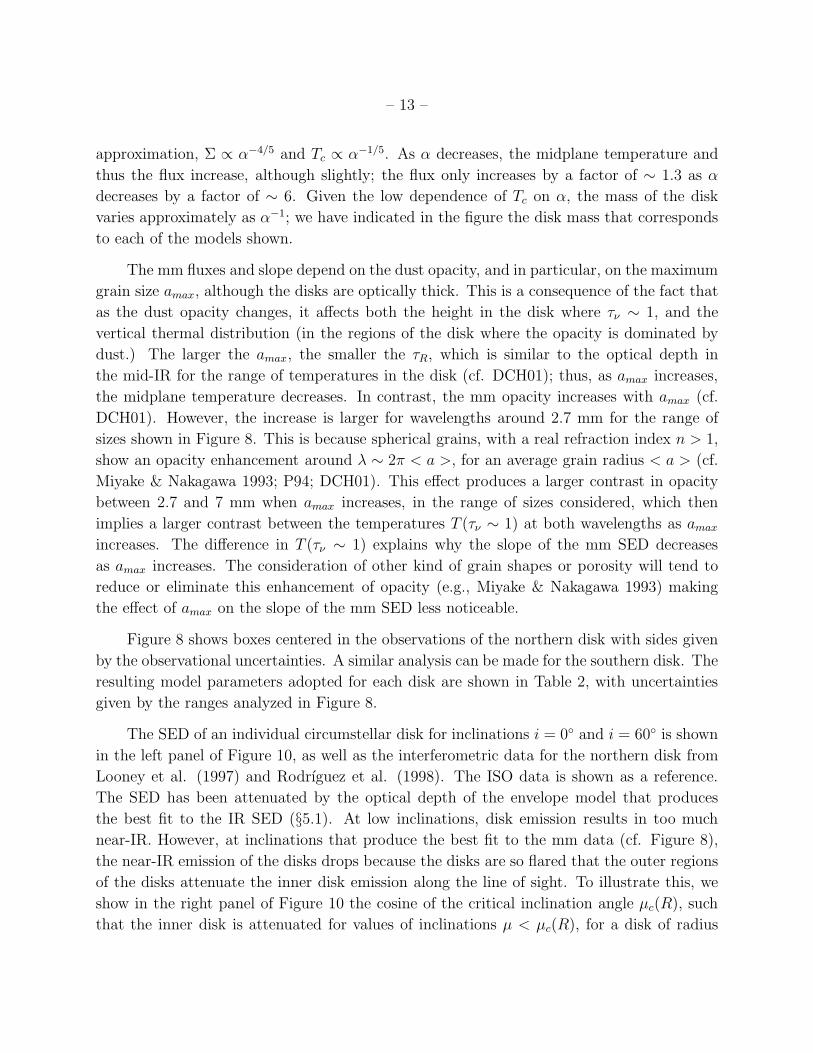
– 13 –
approximation, Σ ∝ α−4/5 and Tc ∝ α−1/5. As α decreases, the midplane temperature and
thus the flux increase, although slightly; the flux only increases by a factor of ∼ 1.3 as α
decreases by a factor of ∼ 6. Given the low dependence of Tc on α, the mass of the disk
varies approximately as α−1; we have indicated in the figure the disk mass that corresponds
to each of the models shown.
The mm fluxes and slope depend on the dust opacity, and in particular, on the maximum
grain size amax, although the disks are optically thick. This is a consequence of the fact that
as the dust opacity changes, it affects both the height in the disk where τν ∼ 1, and the
vertical thermal distribution (in the regions of the disk where the opacity is dominated by
dust.) The larger the amax, the smaller the τR, which is similar to the optical depth in
the mid-IR for the range of temperatures in the disk (cf. DCH01); thus, as amax increases,
the midplane temperature decreases. In contrast, the mm opacity increases with amax (cf.
DCH01). However, the increase is larger for wavelengths around 2.7 mm for the range of
sizes shown in Figure 8. This is because spherical grains, with a real refraction index n > 1,
show an opacity enhancement around λ ∼ 2π < a >, for an average grain radius < a > (cf.
Miyake & Nakagawa 1993; P94; DCH01). This effect produces a larger contrast in opacity
between 2.7 and 7 mm when amax increases, in the range of sizes considered, which then
implies a larger contrast between the temperatures T (τν ∼ 1) at both wavelengths as amax
increases. The difference in T (τν ∼ 1) explains why the slope of the mm SED decreases
as amax increases. The consideration of other kind of grain shapes or porosity will tend to
reduce or eliminate this enhancement of opacity (e.g., Miyake & Nakagawa 1993) making
the effect of amax on the slope of the mm SED less noticeable.
Figure 8 shows boxes centered in the observations of the northern disk with sides given
by the observational uncertainties. A similar analysis can be made for the southern disk. The
resulting model parameters adopted for each disk are shown in Table 2, with uncertainties
given by the ranges analyzed in Figure 8.
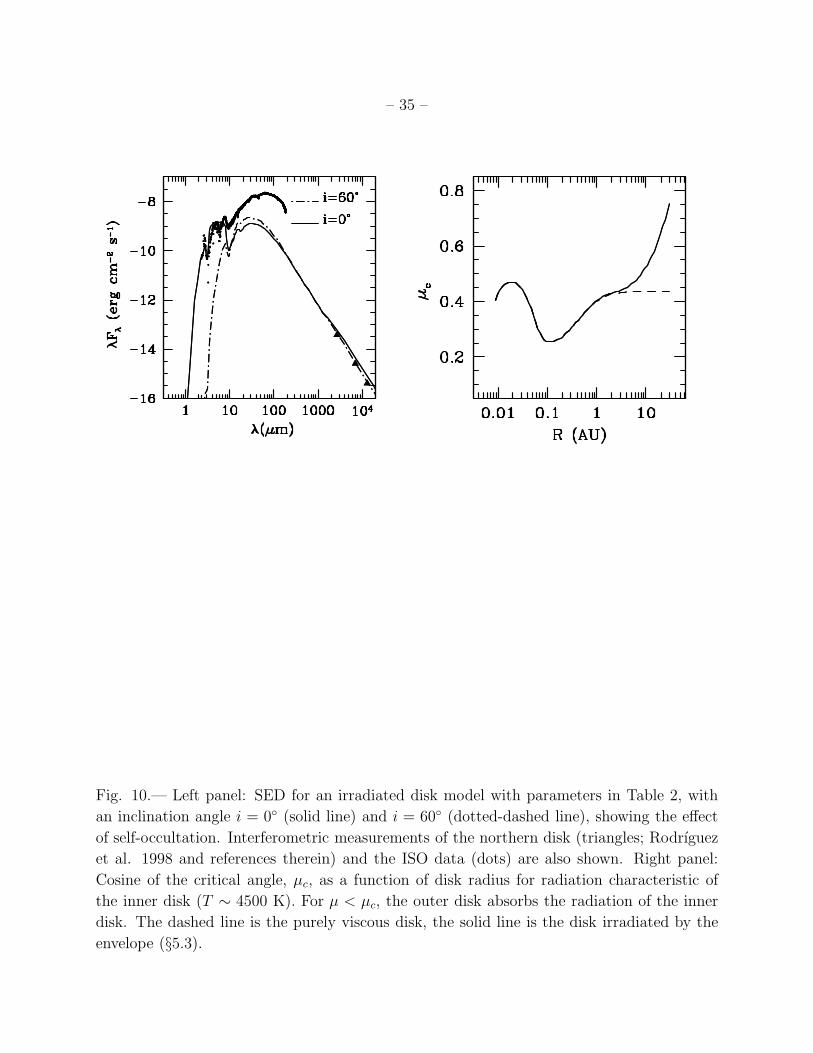
The SED of an individual circumstellar disk for inclinations i = 0◦ and i = 60◦ is shown
in the left panel of Figure 10, as well as the interferometric data for the northern disk from
Looney et al. (1997) and Rodrıguez et al. (1998). The ISO data is shown as a reference.
The SED has been attenuated by the optical depth of the envelope model that produces
the best fit to the IR SED (§5.1). At low inclinations, disk emission results in too much
near-IR. However, at inclinations that produce the best fit to the mm data (cf. Figure 8),
the near-IR emission of the disks drops because the disks are so flared that the outer regions
of the disks attenuate the inner disk emission along the line of sight. To illustrate this, we
show in the right panel of Figure 10 the cosine of the critical inclination angle µc(R), such
that the inner disk is attenuated for values of inclinations µ < µc(R), for a disk of radius
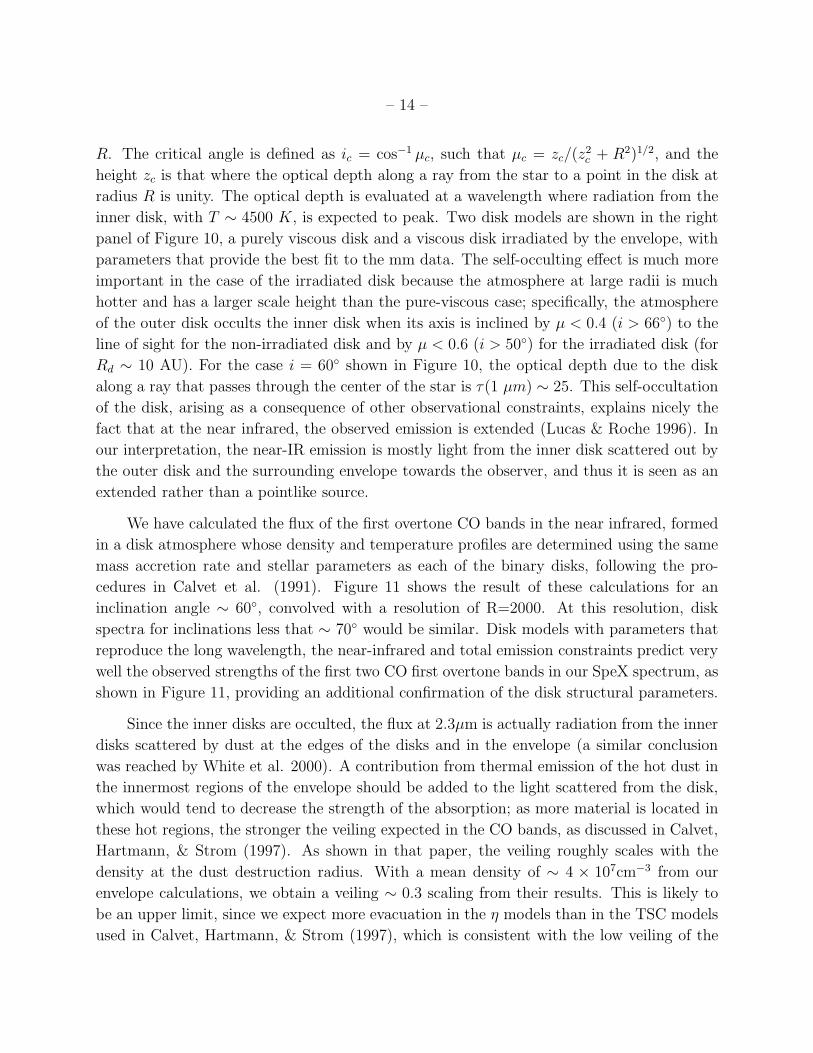
– 14 –
R. The critical angle is defined as ic = cos−1 µc, such that µc = zc/(z2c + R2)1/2, and the
height zc is that where the optical depth along a ray from the star to a point in the disk at
radius R is unity. The optical depth is evaluated at a wavelength where radiation from the
inner disk, with T ∼ 4500 K, is expected to peak. Two disk models are shown in the right
panel of Figure 10, a purely viscous disk and a viscous disk irradiated by the envelope, with
parameters that provide the best fit to the mm data. The self-occulting effect is much more
important in the case of the irradiated disk because the atmosphere at large radii is much
hotter and has a larger scale height than the pure-viscous case; specifically, the atmosphere
of the outer disk occults the inner disk when its axis is inclined by µ < 0.4 (i > 66◦) to the
line of sight for the non-irradiated disk and by µ < 0.6 (i > 50◦) for the irradiated disk (for
Rd ∼ 10 AU). For the case i = 60◦ shown in Figure 10, the optical depth due to the disk
along a ray that passes through the center of the star is τ(1 µm) ∼ 25. This self-occultation
of the disk, arising as a consequence of other observational constraints, explains nicely the
fact that at the near infrared, the observed emission is extended (Lucas & Roche 1996). In
our interpretation, the near-IR emission is mostly light from the inner disk scattered out by
the outer disk and the surrounding envelope towards the observer, and thus it is seen as an
extended rather than a pointlike source.
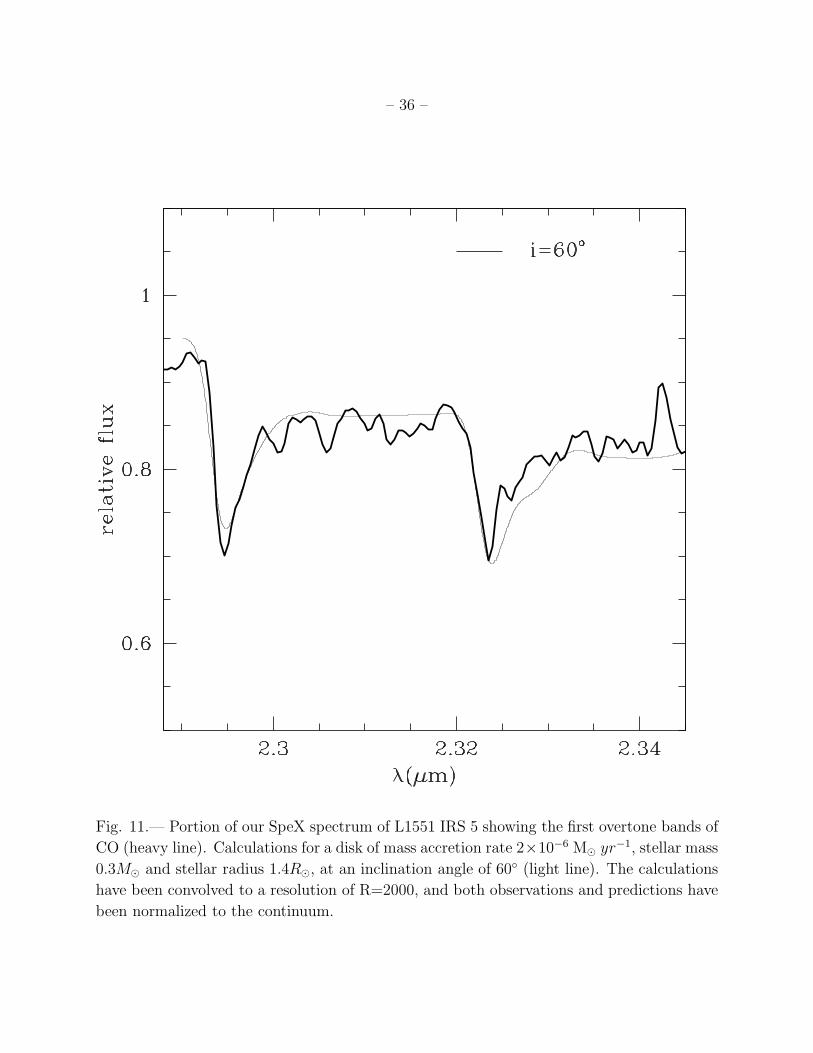
We have calculated the flux of the first overtone CO bands in the near infrared, formed
in a disk atmosphere whose density and temperature profiles are determined using the same
mass accretion rate and stellar parameters as each of the binary disks, following the pro-
cedures in Calvet et al. (1991). Figure 11 shows the result of these calculations for an
inclination angle ∼ 60◦, convolved with a resolution of R=2000. At this resolution, disk
spectra for inclinations less that ∼ 70◦ would be similar. Disk models with parameters that
reproduce the long wavelength, the near-infrared and total emission constraints predict very
well the observed strengths of the first two CO first overtone bands in our SpeX spectrum, as
shown in Figure 11, providing an additional confirmation of the disk structural parameters.
Since the inner disks are occulted, the flux at 2.3µm is actually radiation from the inner
disks scattered by dust at the edges of the disks and in the envelope (a similar conclusion
was reached by White et al. 2000). A contribution from thermal emission of the hot dust in
the innermost regions of the envelope should be added to the light scattered from the disk,
which would tend to decrease the strength of the absorption; as more material is located in
these hot regions, the stronger the veiling expected in the CO bands, as discussed in Calvet,
Hartmann, & Strom (1997). As shown in that paper, the veiling roughly scales with the
density at the dust destruction radius. With a mean density of ∼ 4 × 107cm−3 from our
envelope calculations, we obtain a veiling ∼ 0.3 scaling from their results. This is likely to
be an upper limit, since we expect more evacuation in the η models than in the TSC models
used in Calvet, Hartmann, & Strom (1997), which is consistent with the low veiling of the
– 15 –
CO bands indicated in Figure 11.
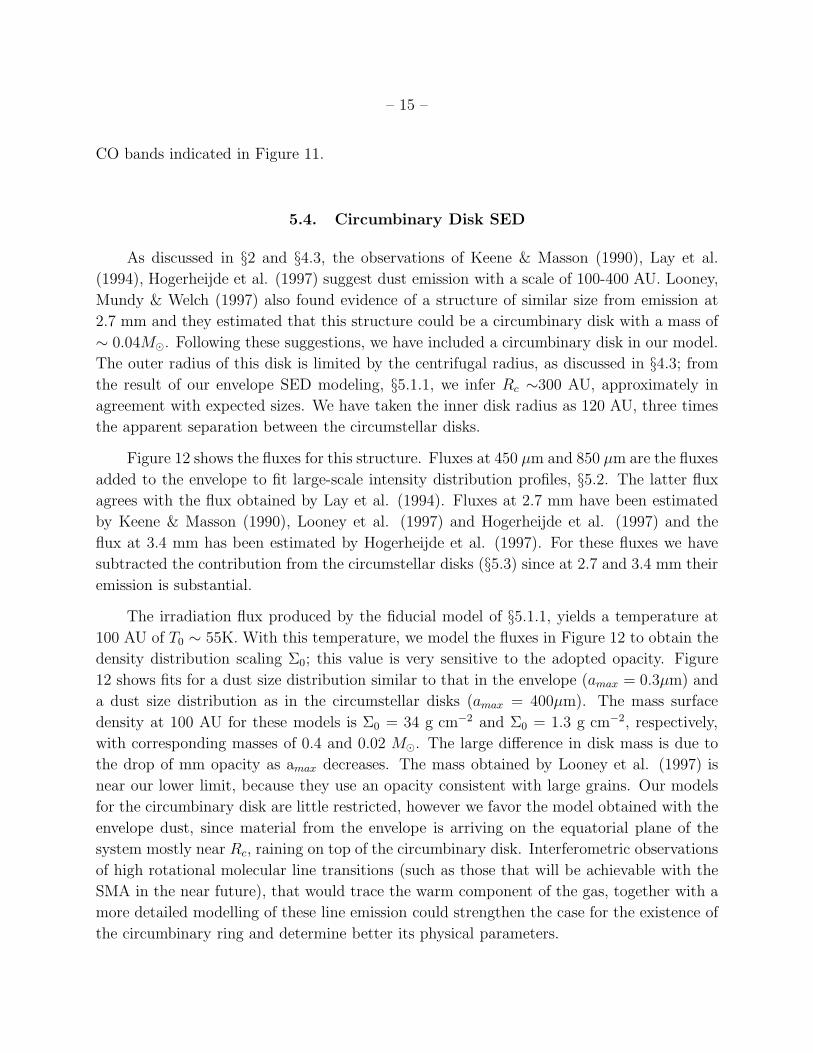
5.4. Circumbinary Disk SED
As discussed in §2 and §4.3, the observations of Keene & Masson (1990), Lay et al.
(1994), Hogerheijde et al. (1997) suggest dust emission with a scale of 100-400 AU. Looney,
Mundy & Welch (1997) also found evidence of a structure of similar size from emission at
2.7 mm and they estimated that this structure could be a circumbinary disk with a mass of
∼ 0.04M⊙. Following these suggestions, we have included a circumbinary disk in our model.
The outer radius of this disk is limited by the centrifugal radius, as discussed in §4.3; from
the result of our envelope SED modeling, §5.1.1, we infer Rc ∼300 AU, approximately in
agreement with expected sizes. We have taken the inner disk radius as 120 AU, three times
the apparent separation between the circumstellar disks.
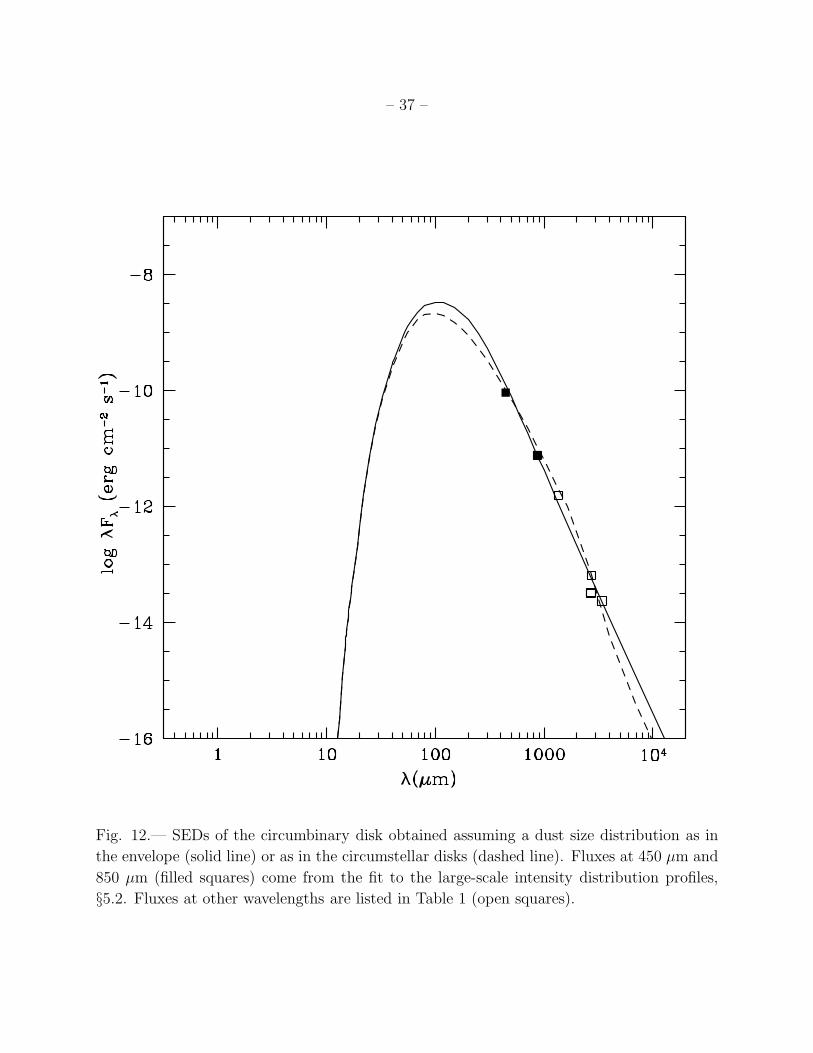
Figure 12 shows the fluxes for this structure. Fluxes at 450 µm and 850 µm are the fluxes
added to the envelope to fit large-scale intensity distribution profiles, §5.2. The latter flux
agrees with the flux obtained by Lay et al. (1994). Fluxes at 2.7 mm have been estimated
by Keene & Masson (1990), Looney et al. (1997) and Hogerheijde et al. (1997) and the
flux at 3.4 mm has been estimated by Hogerheijde et al. (1997). For these fluxes we have
subtracted the contribution from the circumstellar disks (§5.3) since at 2.7 and 3.4 mm their
emission is substantial.
The irradiation flux produced by the fiducial model of §5.1.1, yields a temperature at
100 AU of T0 ∼ 55K. With this temperature, we model the fluxes in Figure 12 to obtain the
density distribution scaling Σ0; this value is very sensitive to the adopted opacity. Figure
12 shows fits for a dust size distribution similar to that in the envelope (amax = 0.3µm) and
a dust size distribution as in the circumstellar disks (amax = 400µm). The mass surface
density at 100 AU for these models is Σ0 = 34 g cm−2 and Σ0 = 1.3 g cm−2, respectively,
with corresponding masses of 0.4 and 0.02 M⊙. The large difference in disk mass is due to
the drop of mm opacity as amax decreases. The mass obtained by Looney et al. (1997) is
near our lower limit, because they use an opacity consistent with large grains. Our models
for the circumbinary disk are little restricted, however we favor the model obtained with the
envelope dust, since material from the envelope is arriving on the equatorial plane of the
system mostly near Rc, raining on top of the circumbinary disk. Interferometric observations
of high rotational molecular line transitions (such as those that will be achievable with the
SMA in the near future), that would trace the warm component of the gas, together with a
more detailed modelling of these line emission could strengthen the case for the existence of
the circumbinary ring and determine better its physical parameters.
– 16 –
5.5. Summary of results
To summarize, the far-IR SED fluxes the density in the envelope, while the degree of
flattening, the centrifugal radius and the inclination are mostly determined by the near and
mid-IR fluxes. The submillimeter images also constrain the density of the envelope, at scales
of hundreds of AU, they require an additional contribution from the circumbinary disk. The
millimeter interferometric images and fluxes, as well as the total luminosity of the system,
the optical and near-IR spectra, and the near-IR images determine the properties of the
circumstellar disks. The circumstellar disks are the source of the luminosity that heats the
envelope; in turn, envelope irradiation is a key element in the heating of the disks in the
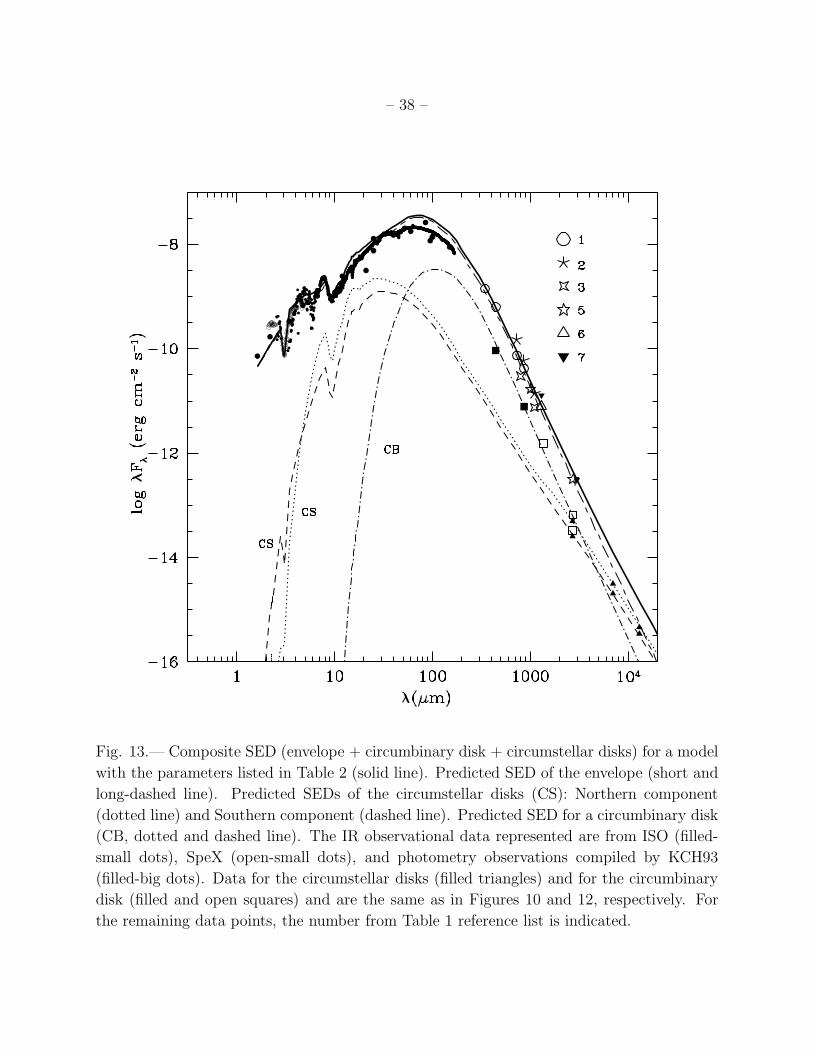
system. Figure 13 shows the overall fit to the data, indicating each component separately.
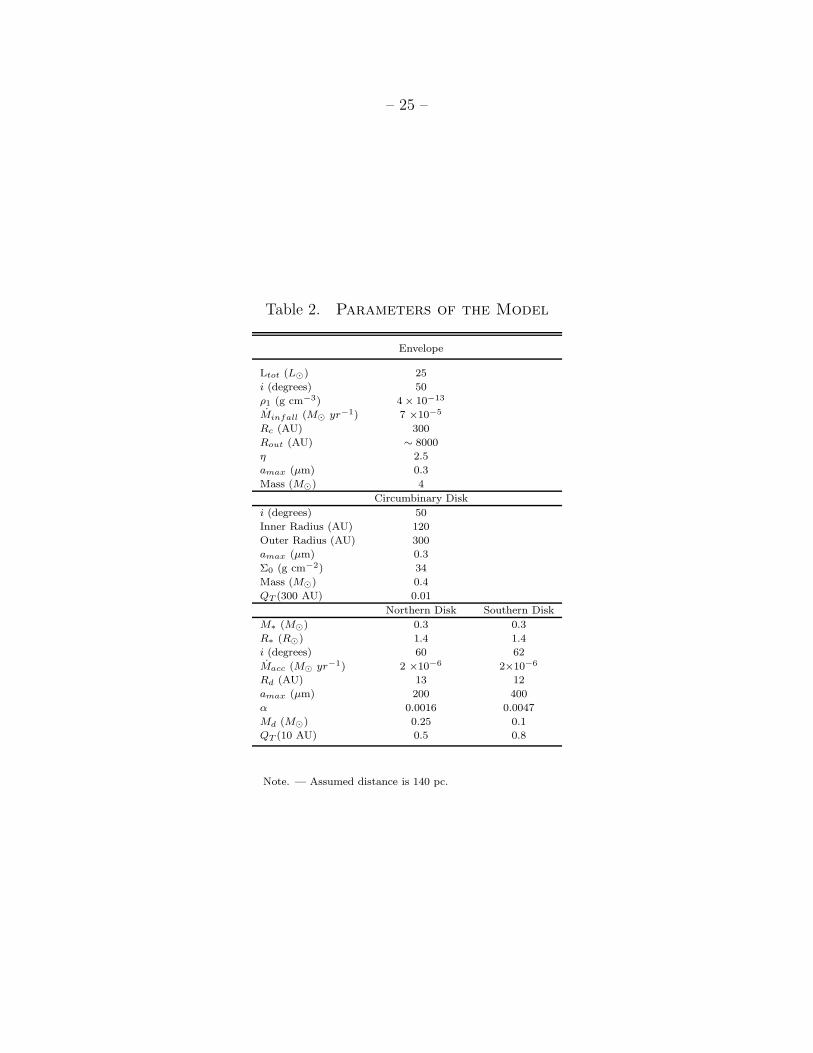
The parameters characterizing each component are given in Table 2.
6. DISCUSSION
One of the challenges to models posed by recent observations is the detection of giant
envelopes (as determined from observations by Chandler & Richer 2000 for L1551 IRS 5,
and by Shirley et al. 2000, Motte & Andre 2001, Larsson, Liseau & Men’shchikov 2002 in
other protostars) combined with a limited depth in the silicate absorption feature (White
et al. 2000). As discussed in §5, previous envelope models predict silicate features that are
too deep (Butner et al. 1991; KCH93) even with small envelopes; increasing the envelope
limits makes the problem worse. The flattened density distribution of the sheet collapse or
η model alleviates this problem by reducing the amount of extinction along the line of sight
to the central region. As observations suggest that the envelope of IRS 5 is indeed flattened,
this solution to the silicate feature problem seems reasonable.
The value of ice abundance (H2O/H . 4 × 10⁻⁵) require to fit the envelope SED, so
that the absorption to 3 microns is reproduced and that at the same time the absorption of
water ice at 12 microns does not appear, is a factor of two lower than determinations of P94
and Tielens et al. (1991). This latter author determined approximately the abundance in
L1551 IRS 5 from the optical depth of water ice, silicates features and assuming standard
dust-to-gas correlations. With our abundance we estimated a water ice column density of
∼ 1.5 × 1019 cm−2 at the radius where the sublimation temperature occurs ( ∼ 100 K, for
water ice cf. Sandford & Allamandola 1993 ) in our best fit to the envelope SED. However,
a determination of the column density deduced from the optical depth at 3.08 microns from
our spectrum using I = Ioe−τ and Ndust(H2O)= τ3.08∆ν1/2/A (Lacy et al. 1984; Sandford et
al. 1988), where A is the band strength and ∆ν is the full-width at half maximum intensity,
provides a lower value ( ∼ 3.8 × 1018 cm−2, consistent with that found by Tegler et al.

– 17 –
(1993), and within a factor of two of that determined by White et al. 2000, using the
same method). The discrepancy with our value inferred from the best fit might be caused
by determinations of the optical depth from I = Ioe−τ , where Io and I are the intensities
measured from the spectrum at continuum level and at the position of the ice absorption
respectively, can underestimate the optical depth and then the column density by ignoring
local emission in the radiative transfer. Thus, one must to take the value of the column
density inferred in this way only as a lower limit.
We also found that the P94 mixture with no graphite but organic grains was not able
to fit simultaneously the near-infrared and millimeter range of the spectrum. While we find
reasonable fits to the SED with the modified Draine & Lee opacities, we do not therefore con-
clude that graphite must necessarily be present, merely that the overall opacity curve must
resemble the results for this mixture. Other models, for example those of Li & Greenberg
(1977) with organic refractory mantles for silicate core grains, might also work well.
We require slightly different inclination angles for the accreting disks at the center of
the IRS 5 system in comparison with the inclination adopted for the envelope. However,
the difference is small, considering the assumptions and simplifications involved in our cal-
culations. It is also quite possible that the jets and therefore their originating disks are not
perfectly aligned (Rodrıguez et al. 1998). The circumstellar disks are quite massive (see
Table 2) compared to typical Classical T Tauri disks. The disk models are gravitationally
unstable against axisymmetric perturbations for R > 6 AU and R > 8 AU, for the northern
and southern disks respectively, and the Toomre parameter at Rd is QT (10AU) ∼ 0.5 and
0.8, for each disk. Also the interaction between both disks and them with the circumbinary
ring could strongly affect the disk structure and the pertinence of the α prescription can be
questioned.
In our model, the envelope material falls mostly near the centrifugal radius, which is
considerably outside the positions of the two disks. Using the value of ρ1 for the envelope,
the envelope infall rate is ∼ 7 × 10⁻⁵ (Msys/0.9M⊙)0.5 M⊙yr−1, where Msys is the mass
at the center, i.e., the sum of stellar and disk masses. Notice that the value of Msys in
our model is roughly consistent with the dynamical mass of the binary system recently
estimated by Rodrıguez et al. (2002). Thus, the mass infall rate of the envelope is an
order of magnitude or more larger than the total accretion rate through the two disks,
∼ 4×10⁻⁶M⊙yr−1. While these disk accretion rate estimates are somewhat model dependent,
they are consistent with the total system luminosity; if the disk accretion rates were really as
large as 7×10⁻⁵M⊙yr−1, the total system luminosity for the protostellar mass-radius relation
used above (roughly birthline values; Stahler 1988) would be roughly Lacc = GMM∗/R∗ ∼
440L⊙, an order of magnitude larger than observed. This suggests that material may be
– 18 –
piling up, for example in the circumbinary ring or disk suggested by the interferometric
observations at intermediate resolutions (§2, §5.4), and is not currently accreting in the
disks. KCH93 noted a similar “luminosity” problem for Taurus Class I sources; in general,
the infall rates estimated from the TSC models would produce accretion luminosities an
order of magnitude higher than observed if the infalling material accreted at the same rate
onto the central protostar. KCH93 also suggested that material is piling up onto outer disks
without immediately and continuously accreting inward. In the case of IRS 5, we have for the
first time additional confirmation of this suggestion, in that the disk accretion rate directly
estimated from the mm observations is much lower than the infall rate.
It is unreasonable to suppose that material can pile up indefinitely in an outer cir-
cumbinary disk, at least when that disk accumulates a mass comparable to that in the
central regions. Following the proposal of Kenyon & Hartmann (1991), KCH93 suggested
that FU Orionis outbursts occur when disk material that has accumulated in outer radii
becomes gravitationally unstable and catastrophically accretes in a burst. The FU Ori char-
acteristics seen in the optical and near-infrared spectra features (Carr et al.1987; Stocke et
al.1988) provide additional circumstantial evidence for this model. Circumbinary disk mass
estimates are strongly dependent upon the assumed opacities, for a M ∼ 0.02 − 0.4M⊙
given from our fits, the disk may be gravitationally unstable supporting the fact that a FU
Ori event is happening. The FU Ori outburst may be ending, with the circumbinary disk
already having been emptied out; the current IRS 5 accretion rates are several times smaller
than the typical FU Ori accretion rates at maximum, ∼ 10−4M⊙yr−1 (Hartmann & Kenyon
1996), consistent with a considerable decline from maximum accretion rate. In any event,
our results emphasize the need to consider protostellar evolution with variable accretion
rates, and the probable importance of differing disk accretion rates and envelope infall rates
for studying evolution and fragmentation in protostellar disks.
7. SUMMARY AND CONCLUSIONS
Our main results can be summarizes as follows:
1. The wealth of observational data available for L1551 IRS 5, in particular the observed
SED by ISO and the water ice feature at 3 microns by SpeX has enabled us to develop
detailed models for the circumstellar envelope, constraining its luminosity, geometry,
infall accretion rate, and opacity.
2. We find that flattened collapse models with an inclination along the line of sight ∼ 50◦,
a total luminosity of ∼ 25 L⊙, mass ∼ 4 M⊙, infall accretion rate ∼ 7×10⁻⁵ M⊙ yr−1
– 19 –
and a normal opacity laws, modified by changing the water ice abundance, enable
us to fit simultaneously the ISO, SpeX observations and single dish submillimeter and
millimeter fluxes that are mostly dominated by the emission of the large scale envelope.
3. We find that the a mixture as the proposed by Pollack et al. 1994 with no graphite
but organic grains was not able to fit simultaneously the near-infrared and millimeter
range of the spectrum. While we find reasonable fits to the envelope SED with the
modified Draine & Lee opacities, we do not conclude that graphite must necessarily
be present, merely that the overall opacity curve must resemble the results for this
mixture.
4. At smaller scales than 2000 AU, the millimeter spatial intensity profiles in the SCUBA
images suggest the presence of the circumbinary disk. We model this structure with
a grain size distribution similar to that in the extended envelope and that in the
circumstellar disks, as the two extreme possibilities for the state of the dust in this
disk. We find that the mass of the circumbinary disk goes from 0.02 to 0.4 M⊙ for
amax = 400 µm and amax = 0.3 µm, respectively.
5. The properties of the circumstellar disks are inferred from high angular millimeter
images and fluxes, optical spectra and near-IR image. We find that these disks are
optically thick in the mm wavelength range; and are inclined an angle (∼ 60◦), so that
their outer parts hide the emission from their inner parts. We also find that these disks
have larger mass accretion rates (∼ 2 × 10⁻⁶ M⊙ yr−1) than the typical Classical T
Tauri disks, usually optically thin at radio frequencies.
6. The millimeter emission of the circumstellar disks emerges from a depth close to the
midplane. As a consequence of this, the disk emission is characterized by a temperature
much higher than the disk photospheric temperature. This explains why the disks have
a brightness temperature higher than expected for the photosphere of a viscous disk,
even with a high mass accretion rate and illustrates the importance of constructing
detailed physical vertical structure models reflecting the actual temperature gradients,
and also the power of interferometric imaging in the mm range to probe the disk
interior.
7. The circumstellar disk models with parameters that reproduce the observational con-
straints, predict very well the observed strengths of the first two CO first overtone
bands detected in our SpeX spectrum, providing an additional confirmation of the
disk structural parameters.
8. In the case of L1551 IRS 5, we have for the first time the confirmation of the sugges-
tion, that material is piling up onto outer disks without immediately and continuously
– 20 –
accreting inward since the disk accretion rate directly estimated from the mm obser-
vations is much lower than the infall rate, probably resulting in the accumulation of
material in a circumbinary disk, possibly with occasional cascades of accretion into the
binary system to produce FU Orionis eruptions.
Acknowledgments
We thank Claire Chandler for providing us the original SCUBA data of L1551 IRS 5
and Mario van den Ancker for help with the ISO data. Thanks as well to Robert Estalella
and Maite Beltran for providing a program to convolve our results with the observing beam
of SCUBA camera. We also thank Guillem Anglada for useful discussions and helpful sug-
gestions. J.M. would like to thank Bobby Bus and John Rayner for support at IRTF. M. O.
acknowledges the fellowship from Conacyt, Mexico and the NASA Origins of Solar Systems
grant NAG5-9670. P. D. acknowledges the grant J27748E from Conacyt, Mexico. We thank
our referee for his/her thoughtful review of our manuscript and useful comments.
– 21 –
REFERENCES
Adams, F.C., Lada, C.J., & Shu, F.H. 1987, ApJ, 312, 788
Artymowicz, P., Clarke, C.J., Lubow, S.H., & Pringle, J.E. 1991, ApJ, 370, L35
Begemann, B., Dorschner, J., Henning, T., Mutschke, H., & Thamm, E. 1994, ApJ, 423, L
71
Bieging, J.H. & Cohen, M. 1985, ApJ, 289, L5
Butner, H.M., Evans, N.J. II, Lester, D.F., Levreault, R.M., & Strom, S.E., 1991, ApJ, 376,
636
Calvet, N., Hartmann, L., Kenyon, S.J., & Whitney, B.A. 1994, ApJ, 434, 330
Calvet, N., Patino, A., Magris, G.C., & D’Alessio, P. 1991, ApJ, 380, 617
Calvet, N., Hartmann, L., & Strom, S.E. 1997, ApJ, 481, 912
Carr, J.S., Harvey, P.M., & Lester, D.F. 1987, ApJ, 321, L71
Cassen, P. & Moosman, A. 1981, Icarus, 48, 353
Chandler, C.J., & Richer, J.S. 2000, ApJ, 530, 851 (CR00)
D’Alessio, P. 1996, Ph.D. thesis, Universidad Nacional Autonoma de Mexico, Mexico
D’Alessio, P., Calvet, N., & Hartmann, L. 1997, ApJ, 474, 397 (DCH97)
D’Alessio, P., Calvet, N., Hartmann, L., Lizano, S., Canto, J., 1999 ApJ, 527, 893
D’Alessio, P., Calvet, N., & Hartmann, L., 2001 ApJ, 553, 321 (DCH01)
Draine, B.T., & Lee, H.M. 1984, ApJ, 285, 89
Dutrey, A., Guilloteau, S., & Simon, M. 1994, A&A, 286, 149
Fridlund, C.V.M., Bergman, P., White, G.J., Pilbratt, G.L., & Tauber, J.A. 2002, A&A,
382, 573
Fridlund, C.V.M., & Liseau, R. 1998, ApJ, 499, L75
Hartmann, L., Boss, A., Calvet, N., & Whitney, B. 1994, ApJ, 430, L49
Hartmann, L., Calvet, N., & Boss, A. 1996, ApJ, 464, 387 (HCB96)
– 22 –
Hartmann, L., & Kenyon, S.J., 1996, ARA&A, 34, 207
Hartmann, L., Cassen, P., & Kenyon, S.J. 1997, ApJ, 475, 770
Hogerheijde, M.R., van Dishoeck, E.F., Blake, G.A. & van Langevelde, H. J., 1997, ApJ,
489, 293
Keene, J., & Masson, C.R., 1990, ApJ, 355, 635
Kenyon, S.J., Calvet, N. & Hartmann, L., 1993, ApJ, 414, 676 (KCH93)
Kenyon, S.J., Dobrzycka, D., & Hartmann, L. 1994, AJ, 108, 1872
Kenyon, S.J.& Hartmann, L.W. 1991, ApJ, 383, 664
Lacy, J.H., Baas, F., Allamandola, L.J., van de Bult, C.E.P., Persson, S.E., McGregor, P.J.,
Lonsdale, C.J., & Geballe, T.R. 1984, ApJ, 276, 533
Ladd, E.F., Fuller, G.A., Padman, R., Myers, P.C. & Adams, F.C., 1995, ApJ, 439, 771
Larsson, B., Liseau, R., & Men’shchikov, A.B. 2002, A&A, 386, 1055
Lay, O.P., Carlstrom, J.E., Hills, R.E., & Phillips, T.G., 1994, ApJ, 434, L75
Li, A. & Greenberg, J.M. 1997, A&A, 323, 566
Looney, L.W., Mundy, L.G., & Welch, W.J., 1997, ApJ, 484, L157
Lucas, P.W. & Roche, P.F. 1996, MNRAS, 280, 1219
Men’shchikov, A.B., & Henning, Th., 1997, A&A, 318, 879
Miyake, K. & Nakagawa, Y. 1993, Icarus, 106, 20
Momose, M., Ohashi, N., Kawabe, R., Nakano, T.& Hayashi, M., 1998, ApJ, 504, 314
Moriarty-Schieven, G.H., Wannier, P.G., Keene, J., & Tamura, M. 1994, ApJ, 436, 800
Motte, F., & Andre, P., 2001, A&A, 365, 440
Mundt, R., Stocke, J., Strom, S.E., Strom, K.M., & Anderson, E.R. 1985, ApJ, 297, L41
Osorio, M., Lizano, S., & D’Alessio, P., 1999, ApJ, 525, 808
Pollack, J.B., Hollenbach, D., Beckwith, S., Simonelli, D.P., Roush, T. & Fong, W. 1994,
ApJ, 421, 615 (P94)
– 23 –
Rayner, J.T., Toomey, D.W., Onaka, P.M., Denault, A.J., Stahlberger, W.E., Watanabe,
D.Y. and Wang, S.I. 1998, Infrared Astronomical Instrumentation, ed. A. M. Fowler,
Proc. SPIE 3354, 468
Rodrıguez, L.F. et al., 1998, Nature, 395, 355
Rodrıguez, L.F., Curiel, S., Canto, J., Loinard, L. & Torrelles, J.M., 2002, Astrophysical
Journal, in press
Saito, M., Kawabe, R., Kitamura, Y., & Sunada, K., 1996, ApJ, 473, 464
Sandford, S.A. & Allamandola, L.J. 1993, ApJ, 417, 815
Sandford, S.A., Allamandola, L.J., Tielens, A.G.G.M., & Valero, G.J. 1988, ApJ, 329, 498
Shakura, N.I. & Sunyaev, R.A. 1973, A&A, 24, 337
Shirley, Y.L., Evans, N.J. II, Rawlings, J.M.C., & Gregersen, E.M., 2000, ApJS, 131, 249
Snell, R.L., Loren, R.B., & Plambeck, R.L. 1980 ApJ, 239, L17
Stahler, S.W. 1988, ApJ, 332, 804
Stocke, J.T., Hartigan, P.M., Strom, S.E., Strom, K.M., Anderson, E.R., Hartmann, L.W.,
& Kenyon, S.J. 1988, ApJS, 68, 229
Strom, K.M., Strom, S.E., & Vrba, F.J. 1976, AJ, 81, 320
Terebey, S., Shu, F.H., & Cassen, P. 1984, ApJ, 286, 529
Tegler, S.C., Weintraub, D.A., Allamandola, L.J., Sandford, S.A., Rettig, T.W., & Campins,
H. 1993, ApJ, 411, 260
Tielens, A.G.G.M., Tokunaga, A.T., Geballe, T.R., & Baas, F. 1991, ApJ, 381, 181
Walker, C.K., Adams, F.C., & Lada, C.J. 1990, ApJ, 349, 515
Warren, S.G., 1984, Applied Optics, vol. 23, p. 1206
White, G.J., Liseau, R., Men’shchikov, A.B.,et al. 2000, A&A, 364, 741
Wiscombe, W.J., 1979, Mie scattering calculations: advances in technique and fast, vector-
speed computer codes, NCAR/TN-140 + STR, National Center for Atmospheric Re-
search, Boulder, Colo.
This preprint was prepared with the AAS LATEX macros v5.0.
– 24 –
Table 1. Compilation of submm and mm Observational Data
λ Angular Flux
Resolution Density Size
(µm) Instrument (′′) (Jy) (AU) Refs.
350 JCMT 12 164 ∼ 8000 1
450 JCMT 11 94 ∼ 8000 1
730 JCMT 16 37 ∼4200 2
730 JCMT 16 3 ∼1300 2
750 JCMT 14 18 ∼ 8000 1
800 JCMT 17 8 · · · 3
850 JCMT 15 12 ∼ 8000 1
850 JCMT 16 17 ∼4200 2
870 JCMT-CSO ∼1-4 2.24 ∼80 4
1000 Hale Telescope 55 5.7 · · · 5
1100 JCMT 19 5 ∼5600 2
1100 JCMT 18 2.8 · · · 3
1300 IRAM 11 3 ∼10000 6
1300 12 m NRAO ∼30 0.7 · · · 7
2700 OVRO 3 0.097 < 400 8
2700 BIMAa 0.3 0.045 < 25 9
2700 BIMAb 0.3 0.023 < 25 9
2730 OVRO 3 0.29 ∼2000 5
2730 OVRO 3 0.13 ∼ 50 5
3000 12 m NRAO ∼60 0.7 · · · 7
3400 OVRO 6 0.081 < 400 8
7000 VLAa 0.05 0.0074 ∼10 10
7000 VLAb 0.05 0.0048 ∼10 10
13000 VLAa∼ 0.1 0.0020 · · · 10
13000 VLAb ∼ 0.1 0.0015 · · · 10
aNorthern disk.
bSouthern disk.
References. — (1) Chandler & Richer 2000 (using SCUBA); (2) Ladd
et al. 1995 (using the UKT14 bolometer); (3) Moriarty-Schieven et al.
1994 (using the UKT14 bolometer); (4) Lay et al. 1994; (5) Keene &
Masson 1990; (6) Motte & Andre 2001; (7) Walker. et al. 1990; (8)
Hogerheijde et al. 1997; (9) Looney et al. 1997; (10) Rodrıguez et al.
1998 and references therein.
– 25 –
Table 2. Parameters of the Model
Envelope
Ltot (L⊙) 25
i (degrees) 50
ρ1 (g cm−3) 4 × 10⁻¹³
Minfall (M⊙ yr−1) 7 ×10⁻⁵
Rc (AU) 300
Rout (AU) ∼ 8000
η 2.5
amax (µm) 0.3
Mass (M⊙) 4
Circumbinary Disk
i (degrees) 50
Inner Radius (AU) 120
Outer Radius (AU) 300
amax (µm) 0.3
Σ0 (g cm−2) 34
Mass (M⊙) 0.4
QT (300 AU) 0.01
Northern Disk Southern Disk
M∗ (M⊙) 0.3 0.3
R∗ (R⊙) 1.4 1.4
i (degrees) 60 62
Macc (M⊙ yr−1) 2 ×10⁻⁶ 2×10⁻⁶
Rd (AU) 13 12
amax (µm) 200 400
α 0.0016 0.0047
Md (M⊙) 0.25 0.1
QT (10 AU) 0.5 0.8
Note. — Assumed distance is 140 pc.

– 26 –
Fig. 1.— Near-infrared spectrum of L1551 IRS 5 obtained with SpeX. The telluric absorption
lines have already removed. Spectral features mentioned in the text are marked.
– 27 –
����������������������������������������������������������������������������������������������������������������
����������������������������������������������������������������������������������������������������������������
���������������������������������������������������������������������������������������������������������������������������������������
���������������������������������������������������������������������������������������������������������������������������������������
������������������������������������������������������������������������������������������������������
������������������������������������������������������������������������������������������������������
������������������������������������������������������������������������������������������������������������������������������������������������
������������������������������������������������������������������������������������������������������������������������������������������������
JETS
ENVELOPE
(r ~ 8000 AU)
CIRCUMSTELLAR DISKS
( r ~ 12 AU )
CIRCUMBINARY DISK
( r ~ 300 AU)
Fig. 2.— Sketch of the geometry of the model for L1551 IRS 5
– 28 –
Fig. 3.— Grid of model SEDs for inclination angles 10◦, 50◦, 80◦ (columns) and η= 1.5, 2.5,
3.5 (rows). All the models have Rc =300 AU, ρ1 = 4.5 × 10⁻¹³ g cm−3, L = 25L⊙, D = 140
pc, and an opacity with the Modified Draine & Lee mixture (see §5.1.2). ISO (filled-small
dots), SpeX (open-small dots) observations and photometry compiled by KCH93 (filled-big
– 29 –
Fig. 4.— Temperature (upper panel) and angle-averaged density distribution (lower panel)
of the envelope fiducial model: i ∼ 50◦, η ∼ 2.5 and Rc=300 AU (see §5.1.1). Inside the
centrifugal radius the angular momentum of the infalling material causes departures from
the radial free fall.
– 30 –
Fig. 5.— Upper: SED of the model with L = 25L⊙, ρ1 = 4.5 × 10⁻¹³ g cm−3 and η = 2.5
for different centrifugal radii: 50 AU (long-dashed line), 300 AU (solid, the fiducial model)
and 500 AU (short-dashed line). Observations as in Figure 3. Lower: Comparison of model
SEDs for high η, low Rc (dotted) and low η, high Rc (dot-dashed line) at inclinations that
provide the best fit to the observations. The fiducial model (solid) is shown for reference.
– 31 –
Fig. 6.— Upper: SED of the fiducial model with different dust mixtures. P94 (dotted line),
P94M (dashed line), DL84M (solid line). Lower: total mass absorption coefficient from
P94M (thick dashed line), organics (light dashed line), total mass absorption coefficient
from DL84M (thick solid line), graphite (light solid line).
– 32 –
Fig. 7.— Spherically averaged spatial intensity profile at 450µm (upper panel) and 850µm
(lower panel). SCUBA observations of Chandler & Richer 2000 (filled dots with error bars);
predicted emission from the envelope (§5.1.1) plus circumstellar disks (CS, §5.3) (dotted
line); predicted emission from the envelope, circumstellar disks, and circumbinary disk (CB,
§5.4) (solid line). The predicted profile at 850µm along the minor axis (dot-dashed line) and
the major axis (long-short dashed line) are also shown. The shape of the SCUBA beam is
represented in each panel (long-dashed line).
– 33 –
Fig. 8.— Dependence of observables on irradiated accretion disk parameters. Left panel:
Flux vs maximum intensity at 7 mm as a function of inclination angle i (measured by µ =
cos i), viscosity parameter α (or ∼ disk mass) and disk radius Rd. Values plotted (increasing
as indicated by the arrows) are µ = 0.4, 0.45, 0.5, 0.55, 0.6 and 0.65; α = 0.0005, 0.001, 0.002,
and 0.003, corresponding to masses, Md =0.7, 0.4, 0.23 and 0.16 M⊙, respectively; Rd = 12,
13, 13.5 and 14 AU. Right panel: Flux at 2.7 mm vs mm slope between 2.7 and 7 mm, as
a function of inclination and amax. Values of µ are the same as in the left panel, and amax
= 10, 100, 200, 300, 400, 500, and 600 µm. The observation for the northern disk and its
errors (taken from Rodrıguez et al. 1998) are represented by a box.
– 34 –
Fig. 9.— Properties of the circumstellar disks as a function of amax. Upper panels. Vertical
optical depths as a function of radius for 2.7 mm (solid) and 7 mm (dotted). The value of
amax is indicated in the panels. Lower panels. Characteristic temperatures as a function
of radius: midplane temperature Tc (dashed line), photospheric temperature Tphot (circles).
The temperatures of the height where the optical depth at a given wavelength (for a pole-on
disk) becomes unity: 2.7 mm (solid) and 7 mm (dotted) are also shown. These correspond
approximately to the brightness temperatures at those wavelengths (§5.3). Structural pa-
rameters other than amax as in Table 2.
– 35 –
Fig. 10.— Left panel: SED for an irradiated disk model with parameters in Table 2, with
an inclination angle i = 0◦ (solid line) and i = 60◦ (dotted-dashed line), showing the effect
of self-occultation. Interferometric measurements of the northern disk (triangles; Rodrıguez
et al. 1998 and references therein) and the ISO data (dots) are also shown. Right panel:
Cosine of the critical angle, µc, as a function of disk radius for radiation characteristic of
the inner disk (T ∼ 4500 K). For µ < µc, the outer disk absorbs the radiation of the inner
disk. The dashed line is the purely viscous disk, the solid line is the disk irradiated by the
envelope (§5.3).
– 36 –
Fig. 11.— Portion of our SpeX spectrum of L1551 IRS 5 showing the first overtone bands of
CO (heavy line). Calculations for a disk of mass accretion rate 2×10⁻⁶ M⊙ yr−1, stellar mass
0.3M⊙ and stellar radius 1.4R⊙, at an inclination angle of 60◦ (light line). The calculations
have been convolved to a resolution of R=2000, and both observations and predictions have
been normalized to the continuum.
– 37 –
Fig. 12.— SEDs of the circumbinary disk obtained assuming a dust size distribution as in
the envelope (solid line) or as in the circumstellar disks (dashed line). Fluxes at 450 µm and
850 µm (filled squares) come from the fit to the large-scale intensity distribution profiles,
§5.2. Fluxes at other wavelengths are listed in Table 1 (open squares).
– 38 –
Fig. 13.— Composite SED (envelope + circumbinary disk + circumstellar disks) for a model
with the parameters listed in Table 2 (solid line). Predicted SED of the envelope (short and
long-dashed line). Predicted SEDs of the circumstellar disks (CS): Northern component
(dotted line) and Southern component (dashed line). Predicted SED for a circumbinary disk
(CB, dotted and dashed line). The IR observational data represented are from ISO (filled-
small dots), SpeX (open-small dots), and photometry observations compiled by KCH93
(filled-big dots). Data for the circumstellar disks (filled triangles) and for the circumbinary
disk (filled and open squares) and are the same as in Figures 10 and 12, respectively. For
the remaining data points, the number from Table 1 reference list is indicated.