Structure determination of the exopolysaccharide produced by Lactobacillus rhamnosus strains...
11
Biochem. J. (2002) 363, 7–17 (Printed in Great Britain) 7 Structure determination of the exopolysaccharide produced by Lactobacillus rhamnosus strains RW-9595M and R Marie-Rose VAN CALSTEREN 1 , Corinne PAU-ROBLOT 2 , Andre ! BE ; GIN and Denis ROY Centre de recherche et de de ! veloppement sur les aliments, Agriculture et Agroalimentaire Canada, 3600 boulevard Casavant Ouest, Saint-Hyacinthe, Que ! bec, Canada J2S 8E3 Exopolysaccharides (EPSs) were isolated and purified from Lactobacillus rhamnosus strains RW-9595M, which has been shown to possess cytokine-stimulating activity, and R grown under various fermentation conditions (carbon source, incu- bation temperature and duration). Identical "H NMR spectra were obtained in all cases. Molecular masses were determined by gel permeation chromatography. The primary structure was elucidated using chemical and spectroscopic techniques. Organic acid, monosaccharide and absolute configuration analyses gave the following composition : pyruvate, 1 ; -glucose, 2 ; -ga- lactose, 1 ; and -rhamnose, 4. Methylation analysis indicated the presence of three residues of 3-linked rhamnose, and one residue each of 2,3-linked rhamnose, 2-linked glucose, 3-linked glucose and 4,6-linked galactose. The EPS was submitted to periodate oxidation followed by borohydride reduction. Monosaccharide INTRODUCTION A variety of polysaccharides produced by plants (cellulose, pectin and starch), algae (agar, alginate and carrageenan) and bacteria (alginate, dextran, gellan, pullulan and xanthan gum) are commonly used as food additives for their gelling, stabilizing or thickening properties [1]. However, the use of polysaccharides excreted during the manufacture of food, such as yoghurt, might be attractive for the food industry and should constitute a new generation of food thickeners. To date, exopolysaccharides (EPSs) produced by lactic acid bacteria (LAB) have received increasing interest mainly because of their GRAS (generally regarded as safe) status [1] and their rheological properties in food to improve the texture of fermented products [2]. Some EPSs produced by LAB present potential health-beneficial properties, such as immune stimulation [3,4], and anti-ulcer [5] and cholesterol-lowering activities [6]. Microbial polysaccharides are characterized by a considerable diversity in their composition and structure. Most polysac- charides from microbial origin are heteropolysaccharides ; this means there is a wide range of possible structures and differences in the properties of EPSs due to the many possible linkages and configurations. Microbial polysaccharides which are capable of interacting with the immune system to up-regulate or down- regulate specific aspects of the host response can be classified as immunomodulators or biologic response modifiers [7]. The use Abbreviations used : 1-, 2- or 3-D, one-, two- or three-dimensional ; APT, attached proton test ; BMM, basal minimum medium ; CHORTLE, carbon–hydrogen correlations from one-dimensional polarization-transfer spectra by least-squares analysis ; CI, chemical ionization ; CID, collision- induced dissociation ; EI, electron impact ionization ; EPS, exopolysaccharide ; ES–MS, electrospray MS ; GPC, gel permeation chromatography ; HMBC, heteronuclear multiple-bond correlation ; HSQC, heteronuclear single-quantum coherence ; IFN-γ, gamma interferon ; LAB, lactic acid bacteria ; ROESY, rotating-frame nuclear Overhauser enhancement spectroscopy ; TFA, trifluoroacetic acid. 1 To whom correspondence should be addressed (e-mail vancalsteren!em.agr.ca). 2 Present address : Laboratoire de Ge ! nie Cellulaire, UMR-CNRS 6022, Faculte ! des Sciences, Universite ! de Picardie Jules Verne, 33 rue Saint-Leu, 80039 Amiens Cedex, France. analysis of the resulting polysaccharide gave the new com- position : rhamnose, 4 ; and glucose, 1. Methylation analysis confirmed the loss of the 2-linked glucose and 4,6-linked galactose residues. On the basis of one- and two-dimensional "H and "$C NMR data, the structure of the native EPS was consistent with the following heptasaccharide repeating unit : ²3Rhaα-3Glcβ- 3[Gal4,6(R)Pyα-2]Rhaα-3Rhaα-3Rhaα-2Glcα-· n where Rha cor- responds to rhamnose (6-deoxymannose) and Py corresponds to pyruvate acetal. Complete "H and "$C assignments are reported for the native and the corresponding pyruvate-hydrolysed poly- saccharide. Electrospray MS and MS}MS data are given for the oligosaccharide produced by Smith degradation. Key words : lactic acid bacteria, sequence, heptasaccharide repeating unit, pyruvate substituent, NMR. of polysaccharide immunomodulators as an alternative to classi- cal antibiotic treatment for enhancing host defence responses is very attractive. However, few polysaccharides of microbial origin, with specific activity for both T-cells and antigen-presenting cells, such as monocytes and macrophages, have been examined in detail for both structure–function and mechanism of action [7–12]. The knowledge of structure–function relationships be- tween polysaccharides and the regulation of cytokine networks should provide a foundation for the development of compounds with novel immunomodulating activities [7], in particular, stimu- lation of the specific cellular component of the immune system, the ‘ Th1 response ’. Th1 cytokines, interleukin-2 and gamma interferon (IFN-γ), for example, appear to have prominent roles in cellular immunity resulting in resistance against most infectious agents and reducing the manifestations of allergy [13]. Hence, in order to understand the relationship between rheological and immunomodulating properties and the three-dimensional (3-D) structure of a polysaccharide, knowledge of its primary structure is a prerequisite. The primary structure of the EPS produced by Lactobacillus rhamnosus strain C83 was the only one previously reported for this species of LAB [14]. In the present paper we report the structure determination of the EPS from two new strains of L. rhamnosus, which are of interest because they are among the highest EPS-producing strains of LAB [15]. Moreover their EPS possesses interesting rheological properties as a viscosifying agent # 2002 Biochemical Society
Transcript of Structure determination of the exopolysaccharide produced by Lactobacillus rhamnosus strains...
Biochem. J. (2002) 363, 7–17 (Printed in Great Britain) 7
Structure determination of the exopolysaccharide produced by Lactobacillusrhamnosus strains RW-9595M and RMarie-Rose VAN CALSTEREN1, Corinne PAU-ROBLOT2, Andre! BE; GIN and Denis ROYCentre de recherche et de de! veloppement sur les aliments, Agriculture et Agroalimentaire Canada, 3600 boulevard Casavant Ouest, Saint-Hyacinthe,Que! bec, Canada J2S 8E3
Exopolysaccharides (EPSs) were isolated and purified from
Lactobacillus rhamnosus strains RW-9595M, which has been
shown to possess cytokine-stimulating activity, and R grown
under various fermentation conditions (carbon source, incu-
bation temperature and duration). Identical "H NMR spectra
were obtained in all cases. Molecular masses were determined by
gel permeation chromatography. The primary structure was
elucidated using chemical and spectroscopic techniques. Organic
acid, monosaccharide and absolute configuration analyses gave
the following composition: pyruvate, 1 ; -glucose, 2 ; -ga-
lactose, 1 ; and -rhamnose, 4. Methylation analysis indicated the
presence of three residues of 3-linked rhamnose, and one residue
each of 2,3-linked rhamnose, 2-linked glucose, 3-linked glucose
and 4,6-linked galactose. The EPS was submitted to periodate
oxidation followed by borohydride reduction. Monosaccharide
INTRODUCTION
A variety of polysaccharides produced by plants (cellulose,
pectin and starch), algae (agar, alginate and carrageenan) and
bacteria (alginate, dextran, gellan, pullulan and xanthan gum)
are commonly used as food additives for their gelling, stabilizing
or thickening properties [1]. However, the use of polysaccharides
excreted during the manufacture of food, such as yoghurt, might
be attractive for the food industry and should constitute a new
generation of food thickeners. To date, exopolysaccharides
(EPSs) produced by lactic acid bacteria (LAB) have received
increasing interest mainly because of their GRAS (generally
regarded as safe) status [1] and their rheological properties in
food to improve the texture of fermented products [2]. Some
EPSs produced by LAB present potential health-beneficial
properties, such as immune stimulation [3,4], and anti-ulcer [5]
and cholesterol-lowering activities [6].
Microbial polysaccharides are characterized by a considerable
diversity in their composition and structure. Most polysac-
charides from microbial origin are heteropolysaccharides ; this
means there is a wide range of possible structures and differences
in the properties of EPSs due to the many possible linkages and
configurations. Microbial polysaccharides which are capable of
interacting with the immune system to up-regulate or down-
regulate specific aspects of the host response can be classified as
immunomodulators or biologic response modifiers [7]. The use
Abbreviations used: 1-, 2- or 3-D, one-, two- or three-dimensional ; APT, attached proton test ; BMM, basal minimum medium; CHORTLE,carbon–hydrogen correlations from one-dimensional polarization-transfer spectra by least-squares analysis ; CI, chemical ionization; CID, collision-induced dissociation ; EI, electron impact ionization; EPS, exopolysaccharide ; ES–MS, electrospray MS; GPC, gel permeation chromatography ; HMBC,heteronuclear multiple-bond correlation; HSQC, heteronuclear single-quantum coherence ; IFN-γ, gamma interferon; LAB, lactic acid bacteria ; ROESY,rotating-frame nuclear Overhauser enhancement spectroscopy ; TFA, trifluoroacetic acid.
1 To whom correspondence should be addressed (e-mail vancalsteren!em.agr.ca).2 Present address : Laboratoire de Ge! nie Cellulaire, UMR-CNRS 6022, Faculte! des Sciences, Universite! de Picardie Jules Verne, 33 rue Saint-Leu,
80039 Amiens Cedex, France.
analysis of the resulting polysaccharide gave the new com-
position: rhamnose, 4 ; and glucose, 1. Methylation analysis
confirmed the loss of the 2-linked glucose and 4,6-linked galactose
residues. On the basis of one- and two-dimensional "H and "$C
NMR data, the structure of the native EPS was consistent with
the following heptasaccharide repeating unit : ²3Rhaα-3Glcβ-
3[Gal4,6(R)Pyα-2]Rhaα-3Rhaα-3Rhaα-2Glcα-´nwhere Rha cor-
responds to rhamnose (6-deoxymannose) and Py corresponds to
pyruvate acetal. Complete "H and "$C assignments are reported
for the native and the corresponding pyruvate-hydrolysed poly-
saccharide. Electrospray MS and MS}MS data are given for the
oligosaccharide produced by Smith degradation.
Key words: lactic acid bacteria, sequence, heptasaccharide
repeating unit, pyruvate substituent, NMR.
of polysaccharide immunomodulators as an alternative to classi-
cal antibiotic treatment for enhancing host defence responses is
very attractive.However, fewpolysaccharides ofmicrobial origin,
with specific activity for both T-cells and antigen-presenting
cells, such as monocytes and macrophages, have been examined
in detail for both structure–function and mechanism of action
[7–12]. The knowledge of structure–function relationships be-
tween polysaccharides and the regulation of cytokine networks
should provide a foundation for the development of compounds
with novel immunomodulating activities [7], in particular, stimu-
lation of the specific cellular component of the immune system,
the ‘Th1 response’. Th1 cytokines, interleukin-2 and gamma
interferon (IFN-γ), for example, appear to have prominent roles
in cellular immunity resulting in resistance againstmost infectious
agents and reducing the manifestations of allergy [13]. Hence, in
order to understand the relationship between rheological and
immunomodulating properties and the three-dimensional (3-D)
structure of a polysaccharide, knowledge of its primary structure
is a prerequisite.
The primary structure of the EPS produced by Lactobacillus
rhamnosus strain C83 was the only one previously reported for
this species of LAB [14]. In the present paper we report the
structure determination of the EPS from two new strains of L.
rhamnosus, which are of interest because they are among the
highest EPS-producing strains of LAB [15]. Moreover their EPS
possesses interesting rheological properties as a viscosifying agent
# 2002 Biochemical Society

8 M.-R. Van Calsteren and others
[15] and health-promoting properties in the stimulation of the
pro-inflammatory cytokines [4].
EXPERIMENTAL
Bacterial strains and culture conditions
L. rhamnosus RW-9595M and R were obtained from the culture
collection of Dr D. Roy (Centre de recherche et de de! veloppement
sur les aliments, Saint-Hyacinthe, Que!bec, Canada). All strains
were subcultured in 20 ml of Lactobacilli MRS broth (Difco
Laboratories, Detroit, MI, U.S.A.) [16] and incubated anaero-
bically at 37 °C for 48 h. Stock cultures were stored at ®40 °C in
brain–heart infusion broth (Difco Laboratories) with 15% (v}v)
glycerol. Before experimental use, the cultures were propagated
twice in Lactobacilli MRS broth at 37 °C for 16 h.
Fermentation
Most fermentations were performed at 32 or 37 °C in 7 litre
Chemap fermenters (Chemapec, Woodbury, NY, U.S.A.) con-
taining 6 litres of basal minimum medium (BMM) as described
previously [17], with glucose or lactose (20 g}l) as the carbon
source. The pH was maintained at pH 6 with 7 M NH%OH. The
fermenters were agitated by constant stirring at 100 rev.}min and
no air was added. The culture medium was inoculated with 1%
(v}v) of a 16 h active culture and fermentation was allowed to
proceed for 24 or 72 h. Some fermentations with L. rhamnosus R
were performed at 37 °C in 19 litre fermenters (NLF-19, Bio-
engineering AG, Wald, Switzerland) containing 15 litres of
BMM with glucose or lactose (20 g}l) as the carbon source for
24, 30, 48, 72 or 96 h. When the carbon source was lactoserum,
fermentations were conducted at 32 °C for 48–56 h in 4 litres of
medium composed of 5% (w}v) whey permeate and 1% (w}v)
yeast nitrogen base with agitation at 100 rev.}min under aerobic
conditions. The pH was maintained at pH 6 with 3 M NH%OH.
Samples were cooled on ice immediately after removing them
from the fermenters.
EPS isolation and purification
EPSs were isolated and purified according to Cerning et al. [18].
The cultures were heated at 100 °C for 15 min to inactivate
enzymes potentially capable of polymer degradation and the cells
were removed by centrifugation at 12785 g for 30 min at 4 °C.
The EPS was precipitated with 3 vols. of chilled 95% ethanol.
After standing overnight at 4 °C, the resultant precipitate was
collected by centrifugation (11325 g for 20 min). The EPS
was dissolved in deionized water, dialysed against deionized water
at 4 °C for 24 h and freeze-dried. The freeze-dried powder was
dissolved in 10% (w}v) trichloroacetic acid to remove proteins.
The supernatant was dialysed at 4 °C against deionized water for
5 days and freeze-dried. These preparations were referred to as
purified EPSs and were stored at 4 °C.
Molecular mass determination
Molecular masses were determined by gel permeation chroma-
tography (GPC) on a Waters (Milford, MA, U.S.A.) HPLC
system at 26 °C. Three 8 mm¬300 mm Shodex OHpak columns
(Waters) were connected in series : KB-802.5, exclusion limit
8.5¬10$ Da; KB-805, exclusion limit 2¬10' Da; and KB-806M,
exclusion limit 1¬10( Da. The mobile phase was 0.1 M NaCl
and the flow rate was 0.4 ml}min. A volume of 50 µl was
injected, the total amount, depending on the molecular mass,
ranging from 5–83 µg for standards and 3–4 µg for purified
EPSs. Detection was performed with both a refractometer and
a fluorescence detector used as a right-angle light-scattering de-
tector at a wavelength of 300 nm for excitation and emission. A
calibration curve was constructed with dextran standards (Phar-
macia, Uppsala, Sweden) having molecular masses of 1¬10$,
5¬10$, 1¬10%, 4¬10%, 7¬10%, 5¬10& and 2¬10' Da.
Periodate oxidation, Smith degradation and electrospray MS(ES–MS)
To the purified EPS from L. rhamnosus RW-9595M grown on
glucose at 37 °C for 24 h (48–60 mg) dissolved in 10 ml of
0.2 M sodium acetate buffer (pH 3.9) was added sodium meta-
periodate to a final concentration of 0.05 M, and the solution was
kept in the dark for 7 days at 4 °C. Ethylene glycol (2 ml)
was added and the solution was agitated at 20–25 °C for 2 h to
destroy any excess reagent. The solution was dialysed against de-
ionized water for 48 h and freeze dried. The oxidized polysac-
charide was reduced with 5 ml of 0.5 M NaBH%in 2 M NH
%OH
at 60 °C for 4 h. Acetone (2.5 ml) was added and the solution was
evaporated to dryness at 40 °C under a stream of nitrogen. The
residue was dissolved in water, neutralized with Amberlite IR-120
(H+ form) ion-exchange resin, and boric acid was eliminated as
methyl borate by co-evaporating several times with methanol
under reduced pressure. The resulting polysaccharide was sub-
mitted to sugar and linkage analyses as described below.
The oxidized–reduced polysaccharide was further submitted
to Smith degradation. The mild acid hydrolysis was performed at
80 °C for 1 h in 0.1 M trifluoroacetic acid (TFA). After evap-
oration of the TFA under a stream of nitrogen, reduction was
repeated as above with NaBH%or NaB#H
%. The resulting product
was analysed by ES–MS.
Positive-ion ES–MS was carried out on a ThermoQuest LCQ
Classic spectrometer with a spray voltage of 4.5 kV, a capillary
voltage of 46 V, a capillary temperature of 200 °C and a tube lens
offset of 35 V. Samples dissolved in methanol were infused at
5 µl}min and single scans were acquired by scanning between
m}z 500 and 2000. Collision-induced dissociation (CID)-MS}MS
(30 V) spectra were obtained with a mass window of 2 atomic
mass units (a.m.u.).
Monosaccharide analysis
Samples were hydrolysed in 2 M TFA at 121 °C for 1 h [19]. The
sugar and organic acid compositions were determined by HPLC.
A Waters chromatography system was used with a 30 cm¬7.8 mm ION300 column (InterAction Chromatography, San
Jose, CA, U.S.A.), the mobile phase was 2.5 mM H#SO
%at
a flow rate of 0.4 ml}min and a temperature of 70 °C, with
refractive-index detection for sugars and UV detection at 210 nm
for organic acids. Sugars were also analysed after reduction with
NaBH%
and acetylation [19] by GLC on a Hewlett-Packard
model 5890 gas chromatograph equipped with a 30 m¬0.32 mm,
1.0 µm film DB-5 capillary column (J&W Scientific, Folsom,
CA, U.S.A.) using the temperature program: 150 °C for 5 min,
linear temperature gradient of 15 °C}min to 190 °C, hold for
20 min, ramp at 15 °C}min to 230 °C and hold for 20 min.
The temperatures of the injector and the flame ionization
detector were 225 and 250 °C respectively. Effective carbon
responses were used for quantification [20].
Determination of absolute configuration
The absolute configuration of the sugar residues was determined
after hydrolysis by polarimetry at 589 nm on an Autopol III
polarimeter (Rudolph Research, Flanders, NJ, U.S.A.). Alterna-
# 2002 Biochemical Society

9A new exopolysaccharide from Lactobacillus rhamnosus RW-9595M and R
tively it was determined on the hydrolysate after glycoside
formation with ()-2-octanol followed by peracetylation [21]
including an additional washing step [19], and analysed by GLC
as described above but with the temperature program: 150 °C for
5 min followed by a temperature gradient of 15 °C}min to
230 °C and maintained for 30 min.
Linkage analysis
Permethylation of the polysaccharides was performed according
to Harris et al. [19] modified as follows: an ultrasonic bath was
used for dissolution, 100 µl of DMSO and 100 µl of 1,1,3,3-
tetramethylurea [22] were used instead of 150 µl of DMSO to
improve solubility, and three preliminary methylations were
necessary for completemethylation. Hydrolysis, reduction, acety-
lation and GLC analysis were performed as described above for
sugar analysis. GLC–MS analyses were performed on a
30 m¬0.25 mm, 0.25 µm film J&W Scientific DB-5 capillary
column on a Finnigan Incos 50 mass spectrometer equipped with
a Varian 3400 gas chromatograph [inlet, 250 °C; transfer line,
225 °C; source, 180 °C; electron impact ionization (EI), 70 eV]
or a 30 m¬0.25 mm, 0.1 µm film J&W Scientific DB-5 column on
a Finnigan GCQ [inlet, 250 °C; transfer line, 275 °C; source,
110 °C; EI, 15 eV; isobutane chemical ionization (CI), 50 milli-
torr]. In the first case, GLC analyses were obtained using the
temperature program: 50 °C for 2 min, linear gradient at
10 °C}min to 125 °C, then at 5 °C}min to 250 °C, hold for 5 min,
followed by a linear gradient at 20 °C}min to 320 °C and hold
for 5 min. In the second case, the temperature program was:
40 °C for 5 min, ramp at 15 °C}min to 275 °C and hold for
10 min.
Mild acid hydrolysis
The purified EPS from L. rhamnosus RW-9595M grown on
glucose at 37 °C for 24 h (60 mg) was submitted to mild acid
hydrolysis in 4 ml of 0.1 M acetic acid for 4 days at 80 °C, and
the reaction mixture was neutralized with aqueous ammonia.
NMR spectroscopy
The polysaccharides were exchanged twice in #H#O (99.9 atom%
#H) with intermediate freeze-drying and dissolved at 1% (w}v)
in #H#O (99.96 atom% #H) for NMR experiments. A Chemag-
netics (Fort Collins, CO, U.S.A.) CMX Infinity 300 spectrometer
was used for all experiments using a Nalorac (Martinez, CA,
U.S.A.) 5 mm dual "$C}"H probe for "H (300 MHz) and homo-
nuclear spectra, and a Nalorac 10 mm broad-band probe for "$C
(75.5 MHz), $"P (121.5 MHz) and heteronuclear spectra. The
temperature was maintained at 80 °C in order to obtain a
reasonable line width in proton spectra. "H and "$C chemical
shifts (δ in p.p.m.) are both referenced with internal 2,2-dimethyl-
2-silapentane-5-sulphonate at δ 0 as recommended by Wishart et
al. [23]. The two-dimensionl (2-D) COSY spectra [24] were
acquired in magnitude mode. The 2-D magnitude COSY with
relay coherence transfer (42 ms transfer time) experiment was
performed according to Bax and Drobny [25]. The 2-D phase-
sensitive TOCSY spectra were recorded with an effective spin
lock time of 90–170 ms [26]. The 2-D phase-sensitive NOESY
[27] and rotating-frame nuclear Overhauser enhancement spec-
troscopy (ROESY) [28] experiments were performed with a
mixing time of 300 ms. The one-dimensional (1-D) "$C NMR
spectra were recorded with wideband alternating-phase low-
power technique for zero residue splitting (‘WALTZ’) proton
decoupling [29], and the 1-D attached proton test (APT) [30] with
a 7 ms evolution time. The 2-D phase-sensitive heteronuclear
single-quantum coherence (HSQC) [31] spectra were acquired
with the frequency switched decoupling pulse sequence MPF9
[32] or without carbon decoupling during acquisition. A bilinear
rotation decoupling (‘BIRD’) sandwich [33] was included at the
beginning of the sequence to suppress the signal from protons
bonded to "#C. The 2-D magnitude heteronuclear multiple-bond
correlation (HMBC) [34] was run with an evolution time of
72 ms without carbon decoupling. Most of the reported proton
chemical shifts were obtained from the carbon–hydrogen corre-
lations from one-dimensional polarization-transfer spectra by
least-squares analysis (CHORTLE) experiment [35] run with
four increments for cosine and sine subspectra : 0.4, 1.0, 2.4
and 3.2 ms.
RESULTS
Culture, isolation and purification
Under fermentation conditions at pH 6, L. rhamnosus RW-
9595M yielded between 931–1275 mg of purified EPS when
grown on glucose or lactose at 32 or 37 °C, whereas L. rhamnosus
R produced between 438–601 mg of purified EPS}l.
Molecular mass determination
The average molecular masses extrapolated from the dextran
calibration curves for the EPSs of strains RW-9595M and R
grownon glucose at 37 °C for 24 hwere 5.0¬10( and 2.1¬10( Da
respectively.
EPS composition
Elemental analysis (C, H, N and S) revealed the absence of
nitrogen and sulphur. GLC data of monosaccharide analysis
of EPSs are summarized in Table 1. Sugar and organic acid
analysis was also performed on the EPS from strain RW-9595M
grown on glucose at 37 °C for 24 h by HPLC, giving the follow-
ing relative composition (mean³S.D. for 15 determinations) :
pyruvate, 0.70³0.16; glucose, 2.10³0.14; galactose, 1 ; and
rhamnose, 3.87³0.13. For the EPS of both strains, the data are
consistent with a repeating unit of the following composition:
rhamnose, 4 ; glucose, 2 ; galactose, 1 ; and pyruvate, 1. Oxidation
of the EPS destroys one residue of glucose and one residue of
galactose, while new peaks for peracetylated threitol and glycerol
appear (Table 1). Quantification was not exact for the latter (and
for ethylene glycol which was not observed) due to the high
volatility of their peracetylated derivatives. Glucose and galactose
were found to be of the configuration, whereas rhamnose was
of the configuration.
Methylation analysis
GLC retention times [36], EI–MS fragmentation patterns [36,37]
and CI–MS molecular ion mass determination were used to
confirm linkage or substitution positions. Molecular pseudo-ions
[MH]+ were observed on CI spectra, but in all cases the base
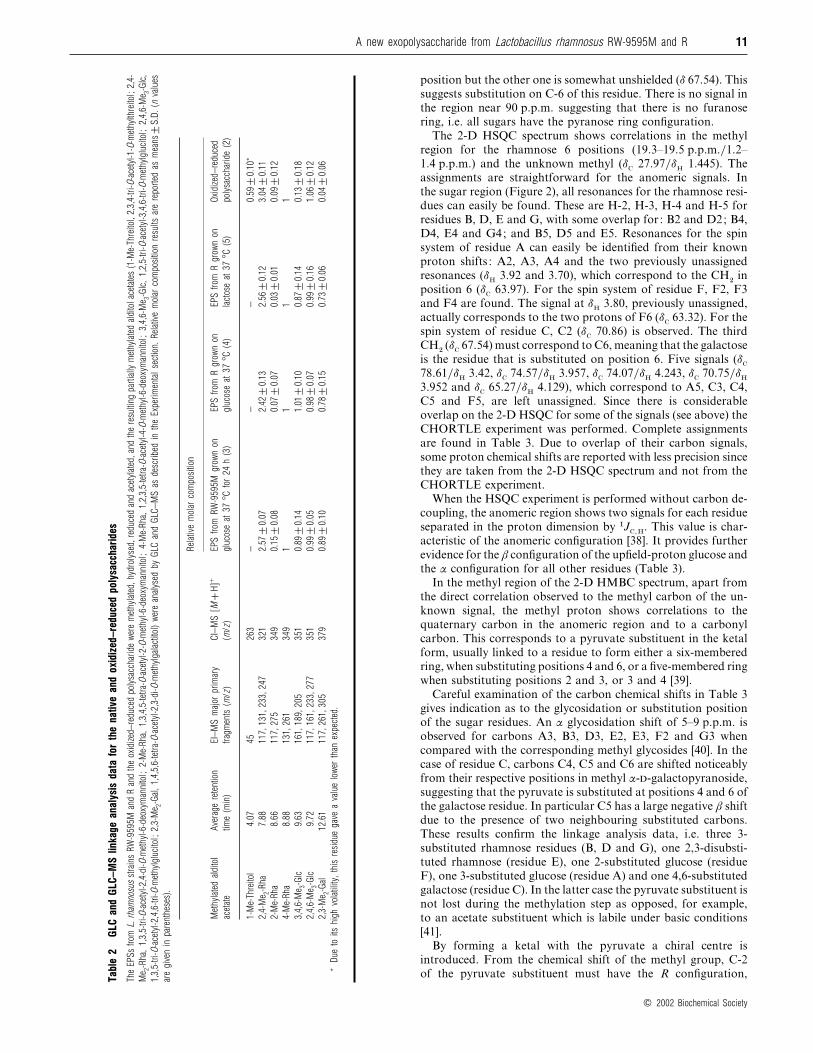
peak was [MH®CH$COOH]+. The results (Table 2) indicate
the presence of three residues of 3-linked rhamnose, and one
residue each of 2,3-linked rhamnose, 2-linked glucose, 3-linked
glucose and 4,6-linked galactose for the EPS of both strains. In
the oxidized–reduced polysaccharide, the 2-linked glucose and the
4,6-linked galactose were lost as expected. In addition, 2,3,4-tri-
O-acetyl-1-O-methylthreitol, resulting from the oxidation of the
galactose residue between C-2 and C-3, was observed. The other
decomposition products, i.e. glycerol and ethylene glycol deriva-
tives, were not detected due to their high volatility. A small
amount of 1,3,4,5-tetra-O-acetyl-2-O-methylrhamnitol was al-
# 2002 Biochemical Society

10 M.-R. Van Calsteren and others
Table 1 GLC monosaccharide analysis data for the native and oxidized–reduced polysaccharides
The EPSs from L. rhamnosus strains RW-9595M and R and the oxidized–reduced polysaccharide were hydrolysed, reduced and acetylated, and the resulting alditol acetates were analysed by
GLC as described in the Experimental section. Relative molar composition results are reported as means³S.D. (n values are given in parentheses). Rha, rhamnose.
Relative molar composition
Alditol acetate
Average retention
time (min)
EPS from RW-9595M
grown on glucose
at 37 °C for 24 h (8)
EPS from R grown
on glucose at 37 °C (4)
EPS from R grown
on lactose at 37 °C (5)
Oxidized–reduced
polysaccharide (2)
Glycerol 1.88 – – – 0.84³0.06*
Threitol 6.44 – – – 0.57³0.03*
Rha 9.65 3.66³0.14 3.62³0.13 3.63³0.06 3.85³0.11
Glc 16.99 2.00³0.09 1.92³0.07 2.01³0.10 1
Gal 17.34 1 1 1 0.04³0.05
* Due to their high volatility, these residues gave values lower than expected.
ways detected in the GLC chromatograms (Table 2) and was
much higher when tetramethylurea was not used and less than
three premethylations were performed, suggesting hindrance to
the alkylation of position 4 of the corresponding residue in the
EPS.
NMR spectroscopy
NMR experiments were performed on a 1% solution of EPS in#H
#O. When higher concentrations were used, precipitation
occurred with time at 80 °C.
Native EPS
Identical 1-D "H NMR spectra were obtained for the native
EPSs, irrespective of the culture conditions: carbon source,
incubation temperature and duration.
The 1-D proton spectrum (Figure 1) can be divided into three
regions: anomeric protons (4.6–5.2 p.p.m.), other sugar protons
(3.2–4.4 p.p.m.) and methyls (1.2–1.5 p.p.m.). The anomeric
region integrates for seven signals, which correspond to seven
sugar residues in the repeating unit. One signal is at higher field
(δ 4.636) with a large coupling constant (7.5 Hz), therefore
corresponding to a β configuration of glucose or galactose. A
broad signal (1.2–1.4 p.p.m.) corresponding to the H-6’s of the
rhamnose residues, which integrates for four methyls, is found in
the methyl region. Finally there is another unknown methyl
signal (δ 1.445), which integrates for one methyl per repeating
unit. To help in the analysis, the residues were labelled with A
through G with increasing chemical shift of their anomeric
proton.
From the 2-D COSY spectrum (Figure 1) correlations are
observed between the H-6’s (1.2–1.4 p.p.m.) of the rhamnose
residues and the corresponding H-5’s (3.8–4.1 p.p.m.). In all
cases the chemical shift is characteristic of an α anomeric
configuration, H-5 in a β-rhamnose residue would resonate at
approx. 0.5 p.p.m. to lower frequency [38]. Analysis of the sugar
region (Figure 1) allows the identification of some residues. The
β anomeric proton A1 (δ 4.636) is coupled to A2 (δ 3.257), which
is coupled to A3 (δ 3.582), in turn coupled to A4 (δ 3.406). All
cross-peaks show large couplings, meaning that residue A
corresponds to β-glucose. All other anomeric protons have a
small coupling and therefore have the α anomeric configuration,
since the rhamnose residues were already determined to be α.
Identification of four rhamnose residues (B, D, E and G) is
possible from their small J#,$
value (rhamnose has the manno
configuration, i.e. H-2 is equatorial) as observed from the cross-
peak. The other two residues (C and F) could only be galactose
or glucose because they have large J#,$
values. The spin system
for all rhamnose residues can be followed up to H-3 (residues B,
D and G) and H-4 (residue E). Table 3 reports chemical shift
data.
Adding a relay coherence transfer step to the 2-D COSY
experiment allows the assignment of new resonances : B4 (δ
3.612), D4 (δ 3.55), G4 (δ 3.601) and F3 (δ 3.933). The latter
shows a large J$,%
value, which indicates that the residue is α-
glucose. Residue C therefore corresponds to the galactose
detected by sugar analysis.
On the 2-D TOCSY spectrum with 90 ms mixing time correla-
tions are observed for E2}E5 (δ 4.30}δ 3.876) and F1}F4 (δ
5.141}δ 3.490), as well as two new signals for residue A (δ 4.636}δ
3.92 and δ 4.636}δ 3.70) and one for residue C (δ 5.054}δ 4.243),
detected by magnetization transfer from the corresponding
anomeric protons, left to be assigned. With 110 ms mixing time
one more correlation in the spin system of residue F (δ 5.141}δ
3.80) is observed. With 140 ms mixing time there is one more
correlation in the spin system of residue C (δ 5.054}δ 4.04). When
the mixing time is increased to 170 ms correlations are observed
between the anomeric and methyl protons of the rhamnose resi-
dues. It is then possible to assign the H-5’s of the rhamnose
residues (Table 3).
So far the number of residues, their identity and their anomeric
configuration are known, and most of the resonances have been
assigned. All rhamnose resonances are known. There is one
resonance missing in the spin system of residue A, probably due
to overlap, and two resonances (δ 3.92 and 3.70) are unassigned.
Only four resonances in the spin system of residue C have been
detected, of which two (δ 4.243 and 4.04) are unassigned. For
residue F five resonances have been observed, one of which is
unassigned (δ 3.80).
The 1-D carbon spectrum (Figure 2) shows peaks in four
different regions: carbonyl (weak), anomeric, other sugar carbons
and methyls. Integration of all but the carbonyl region gives 44
carbons, i.e. two more than the 42 expected for seven hexoses in
the repeating unit. One is in the anomeric region, the other one
is a methyl, probably corresponding to the unknown methyl seen
in the proton spectrum. The other methyl signals correspond to
the four rhamnose residues. One signal (δ 103.30), probably a
quaternary carbon, in the anomeric region was not present
on the APT spectrum. Three signals (δ 67.54, 63.97 and 63.32),
which are inverted in the APT spectrum, correspond to carbons
having two attached protons. These are C-6’s of the glucose and
galactose residues. Two of these signals are in the normal
# 2002 Biochemical Society
11A new exopolysaccharide from Lactobacillus rhamnosus RW-9595M and R
Table
2GL
Can
dGL
C–M
Slin
kage
analys
isda
tafo
rth
ena
tive
and
oxidized
–red
uced
polysa
ccha
rides
TheEP
Ssfrom
L.rh
amno
susstrainsRW-959
5Man
dR
and
theox
idized
–redu
ced
polysa
ccha
rideweremethy
lated,
hydrolys
ed,redu
ced
and
acetylated
,an
dtheresu
lting
partially
methy
lated
alditolac
etates
(1-M
e-Th
reito
l,2,3,4-tri-O
-ace
tyl-1
-O-m
ethy
lthreito
l;2,4-
Me 2-R
ha,1,3,5-tri-O
-ace
tyl-2
,4-di-O
-methy
l-6-deo
xyman
nitol;
2-M
e-Rha
,1,3,4,5-tetra-
O-ac
etyl-2-O
-methy
l-6-deo
xyman
nitol;
4-M
e-Rha
,1,2,3,5-tetra-
O-ac
etyl-4-O
-methy
l-6-deo
xyman
nitol;
3,4,6-M
e 3-G
lc,1,2,5-tri-O
-ace
tyl-3
,4,6-tr
i-O-m
ethy
lglucitol;
2,4,6-M
e 3-G
lc,
1,3,5-tri-O
-ace
tyl-2
,4,6-tr
i-O-m
ethy
lglucitol;
2,3-M
e 2-G
al,1,4,5,6-tetra-
O-ac
etyl-2,3-di-O
-methy
lgalac
titol)were
analys
edby
GLC
and
GLC
–M
Sas
desc
ribed
inthe
Expe
rimen
talse
ction.
Relative
molar
compo
sitio
nresu
ltsare
repo
rted
asmea
ns³
S.D
.(n
values
are
give
nin
parenthe
ses).
Relative
molar
compo
sitio
n
Methy
lated
alditol
acetate
Ave
rage
retention
time
(min)
EI–M
Smajor
prim
ary
frag
men
ts(m
/z)
CI–
MS
[M
H]+
(m/z
)
EPS
from
RW-959
5Mgrow
non
gluc
ose
at37
°Cfor24
h(3
)
EPS
from
Rgr
own
on
gluc
ose
at37
°C(4
)
EPS
from
Rgr
own
on
lactos
eat
37°C
(5)
Oxidize
d–redu
ced
polysa
ccha
ride
(2)
1-M
e-Th
reito
l4.07
4526
3–
––
0.59
³0.10
*
2,4-M
e 2-R
ha7.88
117,
131,
233,
247
321
2.57
³0.07
2.42
³0.13
2.56
³0.12
3.04
³0.11
2-M
e-Rha
8.66
117,
275
349
0.15
³0.08
0.07
³0.07
0.03
³0.01
0.09
³0.12
4-M
e-Rha
8.88
131,
261
349
11
11
3,4,6-M
e 3-G
lc9.63
161,
189,
205
351
0.89
³0.14
1.01
³0.10
0.87
³0.14
0.13
³0.18
2,4,6-M
e 3-G
lc9.72
117,
161,
233,
277
351
0.99
³0.05
0.98
³0.07
0.99
³0.16
1.06
³0.12
2,3-M
e 2-G
al12
.61
117,
261,
305
379
0.89
³0.10
0.78
³0.15
0.73
³0.06
0.04
³0.06
*Due
toits
high
volatility
,this
residu
ega
vea
value
lower
than
expe
cted
.
position but the other one is somewhat unshielded (δ 67.54). This
suggests substitution on C-6 of this residue. There is no signal in
the region near 90 p.p.m. suggesting that there is no furanose
ring, i.e. all sugars have the pyranose ring configuration.
The 2-D HSQC spectrum shows correlations in the methyl
region for the rhamnose 6 positions (19.3–19.5 p.p.m.}1.2–
1.4 p.p.m.) and the unknown methyl (δC
27.97}δH
1.445). The
assignments are straightforward for the anomeric signals. In
the sugar region (Figure 2), all resonances for the rhamnose resi-
dues can easily be found. These are H-2, H-3, H-4 and H-5 for
residues B, D, E and G, with some overlap for : B2 and D2; B4,
D4, E4 and G4; and B5, D5 and E5. Resonances for the spin
system of residue A can easily be identified from their known
proton shifts : A2, A3, A4 and the two previously unassigned
resonances (δH
3.92 and 3.70), which correspond to the CH#
in
position 6 (δC
63.97). For the spin system of residue F, F2, F3
and F4 are found. The signal at δH
3.80, previously unassigned,
actually corresponds to the two protons of F6 (δC63.32). For the
spin system of residue C, C2 (δC
70.86) is observed. The third
CH#(δ
C67.54) must correspond to C6, meaning that the galactose
is the residue that is substituted on position 6. Five signals (δC
78.61}δH
3.42, δC
74.57}δH
3.957, δC
74.07}δH
4.243, δC
70.75}δH
3.952 and δC
65.27}δH
4.129), which correspond to A5, C3, C4,
C5 and F5, are left unassigned. Since there is considerable
overlap on the 2-D HSQC for some of the signals (see above) the
CHORTLE experiment was performed. Complete assignments
are found in Table 3. Due to overlap of their carbon signals,
some proton chemical shifts are reported with less precision since
they are taken from the 2-D HSQC spectrum and not from the
CHORTLE experiment.
When the HSQC experiment is performed without carbon de-
coupling, the anomeric region shows two signals for each residue
separated in the proton dimension by "JC,H
. This value is char-
acteristic of the anomeric configuration [38]. It provides further
evidence for the β configuration of the upfield-proton glucose and
the α configuration for all other residues (Table 3).
In the methyl region of the 2-D HMBC spectrum, apart from
the direct correlation observed to the methyl carbon of the un-
known signal, the methyl proton shows correlations to the
quaternary carbon in the anomeric region and to a carbonyl
carbon. This corresponds to a pyruvate substituent in the ketal
form, usually linked to a residue to form either a six-membered
ring, when substituting positions 4 and 6, or a five-membered ring
when substituting positions 2 and 3, or 3 and 4 [39].
Careful examination of the carbon chemical shifts in Table 3
gives indication as to the glycosidation or substitution position
of the sugar residues. An α glycosidation shift of 5–9 p.p.m. is
observed for carbons A3, B3, D3, E2, E3, F2 and G3 when
compared with the corresponding methyl glycosides [40]. In the
case of residue C, carbons C4, C5 and C6 are shifted noticeably
from their respective positions in methyl α--galactopyranoside,
suggesting that the pyruvate is substituted at positions 4 and 6 of
the galactose residue. In particular C5 has a large negative β shift
due to the presence of two neighbouring substituted carbons.
These results confirm the linkage analysis data, i.e. three 3-
substituted rhamnose residues (B, D and G), one 2,3-disubsti-
tuted rhamnose (residue E), one 2-substituted glucose (residue
F), one 3-substituted glucose (residue A) and one 4,6-substituted
galactose (residue C). In the latter case the pyruvate substituent is
not lost during the methylation step as opposed, for example,
to an acetate substituent which is labile under basic conditions
[41].
By forming a ketal with the pyruvate a chiral centre is
introduced. From the chemical shift of the methyl group, C-2
of the pyruvate substituent must have the R configuration,
# 2002 Biochemical Society

12 M.-R. Van Calsteren and others
Figure 1 2-D 1H COSY spectrum
The 2-D spectrum of the EPS from L. rhamnosus RW-9595M grown on lactoserum at 32 °C for 48–56 h was obtained in 2H2O at 80 °C. Increments (512) of 1024 complex data points were
acquired in magnitude mode with a digital resolution of 1.9 Hz/point in the horizontal dimension and 3.8 Hz/point in the vertical dimension. The horizontal dimension was processed by multiplication
with an unshifted sinebell squared window function and complex Fourier transform, and the vertical dimension by linear prediction of 512 points, multiplication with an unshifted sinebell squared
window function, complex Fourier transform and magnitude calculation. The projection corresponds to the 1-D 1H spectrum of the EPS from L. rhamnosus R grown on lactose at 37 °C for 48 h
obtained in 2H2O at 80 °C. Complex data points (8192) were acquired with a digital resolution of 0.24 Hz/point and processed by exponential multiplication, complex Fourier transform, phase
correction and polynomial baseline correction. Rha, rhamnose.
because the corresponding carbon having the S configuration,
being axial, would resonate at approx. 9 p.p.m. to lower
frequency [39].
No signal was detected by $"P NMR spectroscopy, suggesting
the absence of a phosphate substituent. The latter, or any other
substituent, can also be ruled out since no carbon has an
unexplained substitution shift.
Sequence information is given from the 2-D NOESY spectrum
(Figure 3). The following interresidue correlations are observed:
A1}E3, B1}F2, C1}E2, D1}B3, E1}D3, F1}G3 and G1}A3. In
addition, a correlation between C1 and E1 is present. The data
are consistent with the following sequence:
The cross-peaks observed on the 2-D "H ROESY and "H}"$C
HMBC are consistent with this sequence (Table 4). In addition
to interresidue correlations, characteristic intraresidue connec-
tivities are present, in agreement with the type of sugar and its
anomeric configuration [42].
Modified polysaccharide
The NMR experiments were repeated with the polysaccharide
submitted to mild acid hydrolysis and the data were analysed in
a similar way. Table 3 reports both "H and "$C chemical shifts
# 2002 Biochemical Society
13A new exopolysaccharide from Lactobacillus rhamnosus RW-9595M and R
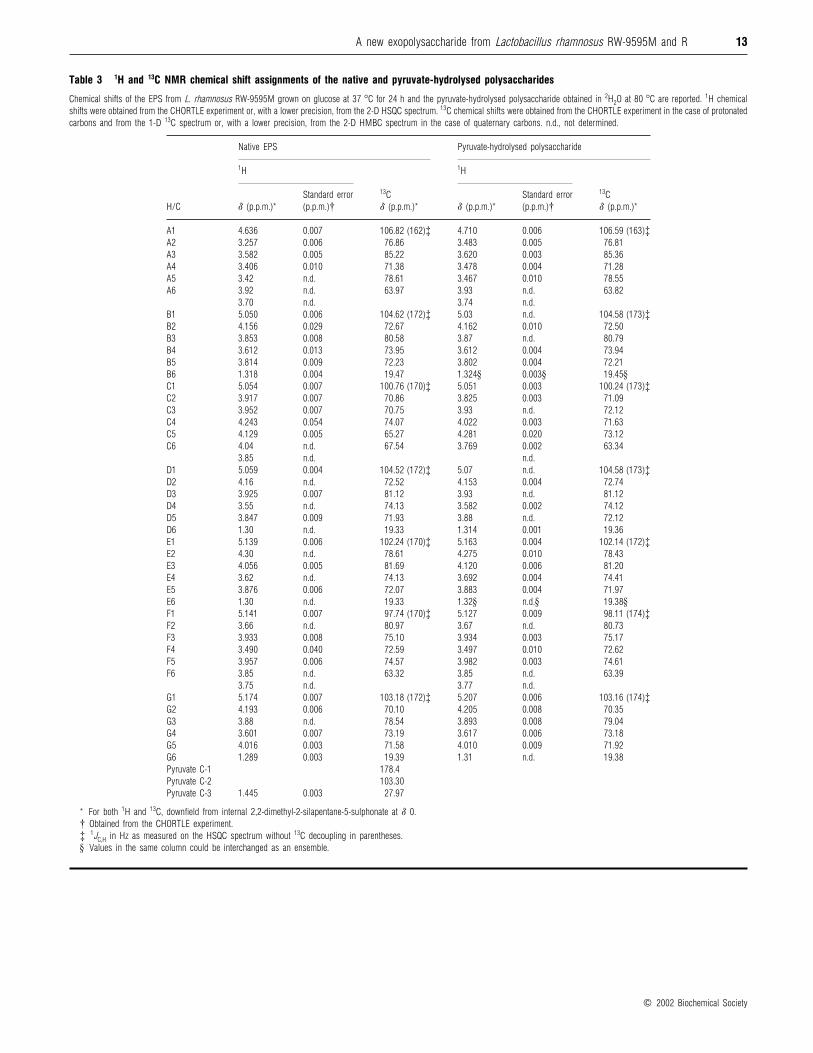
Table 3 1H and 13C NMR chemical shift assignments of the native and pyruvate-hydrolysed polysaccharides
Chemical shifts of the EPS from L. rhamnosus RW-9595M grown on glucose at 37 °C for 24 h and the pyruvate-hydrolysed polysaccharide obtained in 2H2O at 80 °C are reported. 1H chemical
shifts were obtained from the CHORTLE experiment or, with a lower precision, from the 2-D HSQC spectrum. 13C chemical shifts were obtained from the CHORTLE experiment in the case of protonated
carbons and from the 1-D 13C spectrum or, with a lower precision, from the 2-D HMBC spectrum in the case of quaternary carbons. n.d., not determined.
Native EPS Pyruvate-hydrolysed polysaccharide
1H 1H
H/C δ (p.p.m.)*
Standard error
(p.p.m.)†
13C
δ (p.p.m.)* δ (p.p.m.)*
Standard error
(p.p.m.)†
13C
δ (p.p.m.)*
A1 4.636 0.007 106.82 (162)‡ 4.710 0.006 106.59 (163)‡A2 3.257 0.006 76.86 3.483 0.005 76.81
A3 3.582 0.005 85.22 3.620 0.003 85.36
A4 3.406 0.010 71.38 3.478 0.004 71.28
A5 3.42 n.d. 78.61 3.467 0.010 78.55
A6 3.92 n.d. 63.97 3.93 n.d. 63.82
3.70 n.d. 3.74 n.d.
B1 5.050 0.006 104.62 (172)‡ 5.03 n.d. 104.58 (173)‡B2 4.156 0.029 72.67 4.162 0.010 72.50
B3 3.853 0.008 80.58 3.87 n.d. 80.79
B4 3.612 0.013 73.95 3.612 0.004 73.94
B5 3.814 0.009 72.23 3.802 0.004 72.21
B6 1.318 0.004 19.47 1.324§ 0.003§ 19.45§C1 5.054 0.007 100.76 (170)‡ 5.051 0.003 100.24 (173)‡C2 3.917 0.007 70.86 3.825 0.003 71.09
C3 3.952 0.007 70.75 3.93 n.d. 72.12
C4 4.243 0.054 74.07 4.022 0.003 71.63
C5 4.129 0.005 65.27 4.281 0.020 73.12
C6 4.04 n.d. 67.54 3.769 0.002 63.34
3.85 n.d. n.d.
D1 5.059 0.004 104.52 (172)‡ 5.07 n.d. 104.58 (173)‡D2 4.16 n.d. 72.52 4.153 0.004 72.74
D3 3.925 0.007 81.12 3.93 n.d. 81.12
D4 3.55 n.d. 74.13 3.582 0.002 74.12
D5 3.847 0.009 71.93 3.88 n.d. 72.12
D6 1.30 n.d. 19.33 1.314 0.001 19.36
E1 5.139 0.006 102.24 (170)‡ 5.163 0.004 102.14 (172)‡E2 4.30 n.d. 78.61 4.275 0.010 78.43
E3 4.056 0.005 81.69 4.120 0.006 81.20
E4 3.62 n.d. 74.13 3.692 0.004 74.41
E5 3.876 0.006 72.07 3.883 0.004 71.97
E6 1.30 n.d. 19.33 1.32§ n.d.§ 19.38§F1 5.141 0.007 97.74 (170)‡ 5.127 0.009 98.11 (174)‡F2 3.66 n.d. 80.97 3.67 n.d. 80.73
F3 3.933 0.008 75.10 3.934 0.003 75.17
F4 3.490 0.040 72.59 3.497 0.010 72.62
F5 3.957 0.006 74.57 3.982 0.003 74.61
F6 3.85 n.d. 63.32 3.85 n.d. 63.39
3.75 n.d. 3.77 n.d.
G1 5.174 0.007 103.18 (172)‡ 5.207 0.006 103.16 (174)‡G2 4.193 0.006 70.10 4.205 0.008 70.35
G3 3.88 n.d. 78.54 3.893 0.008 79.04
G4 3.601 0.007 73.19 3.617 0.006 73.18
G5 4.016 0.003 71.58 4.010 0.009 71.92
G6 1.289 0.003 19.39 1.31 n.d. 19.38
Pyruvate C-1 178.4
Pyruvate C-2 103.30
Pyruvate C-3 1.445 0.003 27.97
* For both 1H and 13C, downfield from internal 2,2-dimethyl-2-silapentane-5-sulphonate at δ 0.
† Obtained from the CHORTLE experiment.
‡ 1JC,H in Hz as measured on the HSQC spectrum without 13C decoupling in parentheses.
§ Values in the same column could be interchanged as an ensemble.
# 2002 Biochemical Society

14 M.-R. Van Calsteren and others
Figure 2 Sugar region of the 2-D 1H/13C HSQC spectrum
The 2-D spectrum of the EPS from L. rhamnosus RW-9595M grown on glucose at 37 °C for 24 h was obtained in 2H2O at 80 °C. Increments (256) of 1024 complex data points were acquired
in the hypercomplex mode with a digital resolution of 2.2 Hz/point in the proton dimension and 42 Hz/point in the carbon dimension. The proton dimension was processed by multiplication with
an exponential window function, complex Fourier transform and phase correction, and the carbon dimension by linear prediction of 256 points, multiplication with a Hanning window function, complex
Fourier transform and phase correction. The projection corresponds to the 1-D 13C spectrum of the EPS from L. rhamnosus RW-9595M grown on lactoserum at 32 °C for 48–56 h obtained in2H2O at 80 °C. Complex data points (8192) were acquired with a digital resolution of 2.0 Hz/point and processed by exponential multiplication, complex Fourier transform, phase correction and
polynomial baseline correction.
Figure 3 Part of the sugar region of the 2-D 1H NOESY spectrum
The spectrum of the EPS from L. rhamnosus RW-9595M grown on glucose at 32 °C for 72 h was obtained in 2H2O at 80 °C. Increments (512) of 1024 complex data points were acquired in
the hypercomplex mode with a mixing time of 300 ms and a digital resolution of 1.8 Hz/point in the horizontal dimension and 3.7 Hz/point in the vertical dimension. The horizontal dimension
was processed by multiplication with an exponential window function, complex Fourier transform and phase correction, and the vertical dimension by linear prediction of 512 points, multiplication
with a Hanning window function and complex Fourier transform.
# 2002 Biochemical Society

15A new exopolysaccharide from Lactobacillus rhamnosus RW-9595M and R
and one-bond CH coupling constants for the new compound.
The major changes in the carbon spectrum are noticed for C3,
C4, C5 and C6, which are shifted by 1.37, ®2.44, 7.85 and
®4.20 p.p.m. respectively. In the proton spectrum, important
shifts are observed for C4, C5 and one proton on C6 (®0.221,
0.152 and ®0.27 p.p.m. respectively), as well as for A2
(0.226 p.p.m.). Noticeable shifts are present for other protons
on residues C (C2 and the second proton on C6), A (A1 and A4)
and E (E3, E4 and E5), i.e. residues in close proximity to the
location of the missing substituent. The data are consistent with
the structure of the native EPS lacking the pyruvate substituent.
ES–MS of the Smith degradation product
The following compound is expected after Smith degradation of
the EPS:
α--Rhap-(1! 3)-β--Glcp-(1! 3)-α--Rhap-(1! 3)-α--Rhap-
(1! 3)-α--Rhap-(1! 2)-Gro
where Rha corresponds to rhamnose and Gro corresponds to
glycerol. The corresponding sodium-cationized species was ob-
served at m}z 861.7 on the ES–MS spectrum of the reaction
product, but the base peak was found at m}z 933.7. ES–CID-
MS}MS spectra of both compounds showed peaks at m}z 787.2,
769.2, 641.2, 623.2, 495.1 and 477.1, corresponding to sodium-
cationized C&, B
&, C
%, B
%, C
$and B
$fragments respectively,
according to the nomenclature proposed by Domon and Costello
[43]. In addition, a fragment at m}z 715.2, corresponding to the
sodium-cationized Y%
fragment was present on the spectrum of
the m}z 861.7 species. Cifragments were much less intense than
Biand Y
ifragments. When NaB#H
%was used instead of NaBH
%,
the reaction products had m}z values of 862.5 and 933.5,
indicating that the minor product underwent reduction but not
the major one. It is proposed that the major product :
is formedduringmild acid hydrolysis by acetal formation between
the glyceraldehyde and glycerol moieties derived from the
oxidation of residue F, by analogy to the formation of cyclic O-
2«-hydroxyethylidene acetals from polyalcohols of 4-O-linked
polysaccharides [44].
DISCUSSION
The primary sequence of the EPS produced by both strains of L.
rhamnosus RW-9595M and R was found to be identical by all
methods and is always the same, independent of the culture
conditions: carbon source, temperature and fermentation time.
The structure determined in the present work is complete,
including the number and type of residues, their absolute and
anomeric configuration, linkage type, sequence and substituent
information.
To our knowledge the present structure is unique among EPSs
produced by LAB in general (for a review of structures published
prior to 1998 refer to De Vuyst and Degeest [45] and Ricciardi
and Clementi [46]) and L. rhamnosus in particular. Glucose and
galactose are present, as commonly found. Novel features include
the high number of rhamnose residues, four as opposed to a
maximum of two in the literature [47–50], and the presence of
Table 4 Through-space (ROESY) and long-range (HMBC) correlations
The 2-D ROESY (300 ms mixing time) and HMBC spectra of the EPS from L. rhamnosus R
grown on glucose at 37 °C for 24 h were obtained in 2H2O at 80 °C. Correlations from or to
the anomeric protons observed on the ROESY spectrum and from the anomeric or substituent
carbons or to the anomeric protons observed on the HMBC spectrum are reported.
ROESY HMBC
Proton Intraresidue Interresidue Intraresidue Interresidue
A1 A3*, A5 E2, E3, E4* E3
A2 A1
A3 G1
B1 B2 F2, F3*, F4 B3*, B5 F2*
B3 D1
C1 C2* E1, E2 C3, C5 E2*
C6 Pyruvate
C-2
D1 D2 B3, B4 D3*, D5 B3*
D3 E1
E1 E2 D2, D3*, D4 E3*, E5 D3*
E3 A1
F1 F2 G3*, G4* F3*, F5* G3*
F2 B1
G1 G2 A2, A3*, A4 G3*, G5 A3
G3 F1
* Cross-peak superposition.
a pyruvate substituent but no acetate [49,51], phosphodiester
[52,53] or furanose ring configuration [14,49,50]. In addition, no
acetamido [54] or uronic acid sugar residues are found. The
previously known structure of an EPS from another strain of L.
rhamnosus is totally different from the one reported in the present
paper. The former had no rhamnose residue, possessed two
galactose residues with a furanose ring configuration and bore
no substituent [14].
Due to its acidic nature, the EPS of L. rhamnosus RW-9595M
or R could find applications where high-methoxyl pectin is
used in pasteurized and sterilized acidified milk products, such
as drinkable yoghurts, fruit juice-containing milks and fruit-
flavoured, protein-fortified drinks. In such products the free
carboxylic acid groups electrostatically interact with the net posi-
tively charged casein micelles, whereas the neutral sugars, which
do not interact with the charged flocculating ions, form a stabi-
lizing layer in solution [55]. To explain the superior stabilizing
effect of high- over low-methoxyl pectin, it has been proposed
[56] that high-methoxyl pectin, with fewer interactive sites,
has a larger portion of the chain free to interact with the solvent.
Therefore, because of its low charge density (one charge per seven
residues), the EPS of L. rhamnosus from strains RW-9595M or
R presents interesting properties to stabilize acidified milk
products.
The EPS from L. rhamnosus RW-9595M appears to elicit
bioactive IFN-γ in both C57Bl}6 and BALB}c splenocytes on
the murine RAW 264.7 macrophage-like cell line [4]. The
immunomodulating properties of microbial polysaccharides may
# 2002 Biochemical Society
16 M.-R. Van Calsteren and others
depend on branching pattern, molecular and higher-order struc-
ture. The structural basis for the activity of immunomodulator
polysaccharides may also lie in their 3-D conformation and
overall spatial charge organization [57]. Different polysaccharides
may assume similar 3-D structures, e.g. helices, which would
define a common scaffold for the presentation of charges. In this
respect, molecular modelling calculations of the 3-D structure of
the EPS are in progress.
We wish to thank Ms Isabelle Dupont, Mr Barthelemy Watters, Dr Maria GuadalupeMacedo and Dr Phuong Lan Pham for EPS production and purification, Ms ChristineLaverdure, Mr Daniel Goupil, Ms Sonia Rogacheva and Mr Jean Ledoux for chemicalmodifications and analyses, Mr Claude Danis for HPLC and GPC analyses, and MrBrian Stewart for MS analyses.
REFERENCES
1 Sutherland, I. W. (1998) Novel and established applications of microbial
polysaccharides. Trends Biotechnol. 16, 41–46
2 Cerning, J. (1990) Exocellular polysaccharides produced by lactic acid bacteria.
FEMS Microbiol. Rev. 87, 113–130
3 Oda, M., Hasegawa, H., Komatsu, S., Kambe, M. and Tsuchiya, F. (1983) Anti-tumor
polysaccharide from Lactobacillus sp. Agric. Biol. Chem. 47, 1623–1625
4 Chabot, S., Yu, H.-L., de Le! se! leuc, L., Cloutier, D., Van Calsteren, M.-R., Lessard, M.,
Roy, D., Lacroix, M. and Oth, D. (2001) Exopolysaccharides from Lactobacillusrhamnosus RW-9595M stimulate TNF, IL-6 and IL-12 in human and mouse cultured
immunocompetent cells, and IFN-γ in mouse splenocytes. Lait 81, 683–687
5 Nagaoka, M., Hashimito, S., Watanabe, T., Yokokura, T. and Mori, T. (1994) Anti-
ulcer effects of lactic acid bacteria and their cell wall polysaccharides. Biol. Pharm.
Bull. 17, 1012–1017
6 Nakajima, H., Suzuki, Y., Kaizu, H. and Hirota, T. (1992) Cholesterol lowering activity
of ropy fermented milk. J. Food Sci. 57, 1327–1329
7 Tzianabos, A. O. (2000) Polysaccharide immunomodulators as therapeutic agents :
structural aspects and biologic function. Clin. Microbiol. Rev. 13, 523–533
8 Kernodle, D. S., Gates, H. and Kaiser, A. B. (1998) Prophylactic anti-infective activity
of poly-[1-6]-β-D-glucopyranosyl-[1-3]-β-D-glucopyranose glucan in a guinea pig
model of staphylococcal wound infection. Antimicrob. Agents Chemother. 42,545–549
9 Soltys, J. and Quinn, M. T. (1999) Modulation of endotoxin- and enterotoxin-induced
cytokine release by in vivo treatment with β-(1,6)-branched β-(1,3)-glucan. Infect.
Immun. 67, 244–252
10 Tzianabos, A. O., Onderdonk, A. B., Rosner, B., Cisneros, R. L. and Kasper, D. L.
(1993) Structural features of polysaccharides that induce intra-abdominal abscesses.
Science (Washington, D.C.) 262, 416–419
11 Wang, Y., Li, S. P., Moser, S. A., Bost, K. L. and Domer, J. E. (1998) Cytokine
involvement in immunomodulatory activity affected by Candida albicans mannan.
Infect. Immun. 66, 1384–1391
12 Wang, Y., Kalka-Moll, W. M., Roehrl, M. H. and Kasper, D. L. (2000) Structural basis
of the abscess-modulating polysaccharide A2 from Bacteroides fragilis. Proc. Natl.
Acad. Sci. U.S.A. 97, 13478–13483
13 Knopf, P. M. (2000) Immunomodulation and allergy, Allergy Asthma Proc. 21,215–220
14 Vanhaverbeke, C., Bosso, C., Colin-Morel, P., Gey, C., Gamar-Nourani, L., Blondeau,
K., Simonet, J.-M. and Heyraud, A. (1998) Structure of an extracellular
polysaccharide produced by Lactobacillus rhamnosus strain C83. Carbohydr. Res.
314, 211–220
15 Dupont, I., Roy, D. and Lapointe, G. (2000) Comparison of exopolysaccharide
production by strains of Lactobacillus rhamnosus and Lactobacillus paracasei grown
in chemically defined medium and milk. J. Ind. Microbiol. Biotechnol. 24, 251–255
16 De Man, J. C., Rogosa, M. and Sharpe, M. E. (1960) A medium for the cultivation of
lactobacilli. J. Appl. Bacteriol. 23, 130–135
17 Morishita, T., Deguchi, Y., Yajima, M., Sakurai, T. and Yura, T. (1981) Multiple
nutritional requirements of lactobacilii : genetic lesions affecting amino acid
biosynthesis pathways. J. Bacteriol. 148, 64–71
18 Cerning, J., Renard, C. M. G. C., Thibault, J. F., Bouillanne, C., Landon, M.,
Desmazeaud, M. and Topisirovic, L. (1994) Carbon source requirements for
exopolysaccharide production by Lactobacillus casei CG11 and partial structure
analysis of the polymer. Appl. Environ. Microbiol. 60, 3914–3919
19 Harris, P. J., Henry, R. J., Blakeney, A. B. and Stone, B. A. (1984) An improved
procedure for the methylation analysis of oligosaccharides and polysaccharides.
Carbohydr. Res. 127, 59–73
20 Sweet, D. P., Shapiro, R. H. and Albersheim, P. (1975) Quantitative analysis by
various GLC response-factor theories for partially methylated and partially ethylated
alditol acetates. Carbohydr. Res. 40, 217–225
21 Leontein, K., Lindberg, B. and Lo$ nngren, J. (1978) Assignment of absolute
configuration of sugars by GLC of their acetylated glycosides formed from chiral
alcohols. Carbohydr. Res. 62, 359–362
22 Narui, T., Takahashi, K., Kobayashi, M. and Shibata, S. (1982) Permethylation of
polysaccharides by a modified Hakomori method. Carbohydr. Res. 103, 293–295
23 Wishart, D. S., Bigam, C. G., Yao, J., Abildgaard, F., Dyson, H. J., Oldfield, E.,
Markley, J. L. and Sykes, B. D. (1995) 1H, 13C and 15N chemical shift referencing in
biomolecular NMR. J. Biomol. NMR 6, 135–140
24 Aue, W. P., Bartholdi, E. and Ernst, R. R. (1976) Two-dimensional spectroscopy.
Application to nuclear magnetic resonance. J. Chem. Phys. 64, 2229–2246
25 Bax, A. and Drobny, G. (1985) Optimization of two-dimensional homonuclear relayed
coherence transfer NMR spectroscopy. J. Magn. Reson. 61, 306–320
26 Bax, A. and Davis, D. G. (1985) MLEV-17-based two-dimensional homonuclear
magnetization transfer spectroscopy. J. Magn. Reson. 65, 355–360
27 Bodenhausen, G., Kogler, H. and Ernst, R. R. (1984) Selection of coherence-transfer
pathways in NMR pulse experiments. J. Magn. Reson. 58, 370–388
28 Bax, A. and Davis, D. G. (1985) Practical aspects of two-dimensional transverse NOE
spectroscopy. J. Magn. Reson. 63, 207–213
29 Shaka, A. J., Keeler, J. and Freeman, R. (1983) Evaluation of a new broadband
decoupling sequence : WALTZ-16. J. Magn. Reson. 53, 313–340
30 Patt, S. L. and Shoolery, J. N. (1982) Attached proton test for carbon-13 NMR.
J. Magn. Reson. 46, 535–539
31 Bodenhausen, G. and Ruben, D. J. (1980) Natural abundance nitrogen-15 NMR by
enhanced heteronuclear spectroscopy. Chem. Phys. Lett. 69, 185–188
32 Fujiwara, T., Anai, T., Kurihara, N. and Nagayama, K. (1993) Frequency-switched
composite pulses for decoupling carbon-13 spins over ultrabroad bandwidths.
J. Magn. Reson., Ser. A 104, 103–105
33 Garbow, J. R., Weitekamp, D. P. and Pines, A. (1982) Bilinear rotation decoupling of
homonuclear scalar interactions. Chem. Phys. Lett. 93, 504–509
34 Bax, A. and Summers, M. F. (1986) 1H and 13C assignments from sensitivity-
enhanced detection of heteronuclear multiple-bond connectivity by 2-D multiple
quantum NMR. J. Am. Chem. Soc. 108, 2093–2094
35 Pearson, G. A. (1985) High-accuracy proton-carbon chemical-shift correlations from
one-dimensional polarization-transfer 13C NMR spectra. J. Magn. Reson. 64, 487–500
36 Carpita, N. C. and Shea, E. M. (1989) Linkage structure of carbohydrates by gas
chromatography-mass spectrometry (GC-MS) of partially methylated alditol acetates.
In Analysis of Carbohydrates by GLC and MS (Biermann, C. J. and McGinnis, G. D.,
eds.), pp. 157–216, CRC Press, Boca Raton
37 Jansson, P.-E., Kenne, L., Liedgren, H., Lindberg, B. and Lo$ nngren, J. (1976) A
practical guide to the methylation analysis of carbohydrates. Chem. Commun. Univ.
Stockholm 8, 1–75
38 Jansson, P.-E., Kenne, L. and Widmalm, G. (1989) Computer-assisted structural
analysis of polysaccharides with an extended version of CASPER using 1H- and13C-n.m.r. data. Carbohydr. Res. 188, 169–191
39 Garegg, P. J., Jansson, P.-E., Lindberg, B., Lindh, F., Lo$ nngren, J., Kvarnstro$ m, I.
and Nimmich, W. (1980) Configuration of the acetal carbon atom of pyruvic acid
acetals in some bacterial polysaccharides. Carbohydr. Res. 78, 127–132
40 Bock, K. and Pedersen, C. (1983) Carbon-13 nuclear magnetic resonance
spectroscopy of monosaccharides. In Advances in Carbohydrate Chemistry and
Biochemistry, Vol. 41 (Tipson, R. S. and Horton, D., eds.), pp. 27–66, Academic
Press, New York
41 Lindberg, B. (1972) Methylation analysis of polysaccharides. Methods Enzymol. 28,178–195
42 Abeygunawardana, C. and Bush, C. A. (1993) Determination of the chemical structure
of complex polysaccharides by heteronuclear NMR spectroscopy. In Advances in
Biophysical Chemistry, Vol. 3 (Bush, C. A., ed.), pp. 199–249, JAI Press, Stamford
43 Domon, B. and Costello, C. E. (1988) A systematic nomenclature for carbohydrate
fragmentations in FAB-MS/MS spectra of glycoconjugates. Glycoconjugate J. 5,397–409
44 Gorin, P. A. J. and Spencer, J. F. T. (1965) Formation of cyclic O -2«-hydroxyethylidene acetals from polyalcohols of 4-O -linked polysaccharides. Can. J.
Chem. 43, 2978–2984
45 De Vuyst, L. and Degeest, B. (1999) Heteropolysaccharides from lactic acid bacteria.
FEMS Microbiol. Rev. 23, 153–177
46 Ricciardi, A. and Clementi, F. (2000) Exopolysaccharides from lactic acid bacteria :
structure, production and technological applications. Ital. J. Food Sci. 12, 23–45
47 Faber, E. J., Zoon, P., Kamerling, J. P. and Vliegenthart, J. F. G. (1998) The
exopolysaccharides produced by Streptococcus thermophilus Rs and Sts have the
same repeating unit but differ in viscosity of their milk cultures. Carbohydr. Res.
310, 269–276
# 2002 Biochemical Society
17A new exopolysaccharide from Lactobacillus rhamnosus RW-9595M and R
48 van Casteren, W. H. M., Dijkema, C., Schols, H. A., Beldman, G. and Voragen,
A. G. J. (2000) Structural characterisation and enzymatic modification of the
exopolysaccharide produced by Lactococcus lactis subsp. cremoris B39. Carbohydr.
Res. 324, 170–181
49 Faber, E. J., van den Haak, M. J., Kamerling, J. P. and Vliegenthart, J. F. G. (2001)
Structure of the exopolysaccharide produced by Streptococcus thermophilus S3.
Carbohydr. Res. 331, 173–182
50 Marshall, V. M., Dunn, H., Elvin, M., McLay, N., Gu, Y. and Laws, A. P. (2001)
Structural characterisation of the exopolysaccharide produced by Streptococcusthermophilus EU20. Carbohydr. Res. 331, 413–422
51 van Casteren, W. H. M., de Waard, P., Dijkema, C., Schols, H. A. and Voragen,
A. G. J. (2000) Structural characterization and enzymic modification of the
exopolysaccharide produced by Lactococcus lactis subsp. cremoris B891. Carbohydr.
Res. 327, 411–422
52 van Casteren, W. H. M., Dijkema, C., Schols, H. A., Beldman, G. and Voragen,
A. G. J. (1998) Characterisation and modification of the exopolysaccharide produced
by Lactococcus lactis subsp. cremoris B40. Carbohydr. Polym. 37, 123–130
Received 17 July 2001/26 November 2001 ; accepted 10 January 2002
53 Yang, Z., Huttunen, E., Staaf, M., Widmalm, G. and Tenhu, H. (1999) Separation,
purification and characterisation of extracellular polysaccharides produced by slime-
forming Lactococcus lactis ssp. cremoris strains. Int. Dairy J. 9, 631–638
54 Stingele, F., Vincent, S. J. F., Faber, E. J., Newell, J. W., Kamerling, J. P. and Neeser,
J.-R. (1999) Introduction of the exopolysaccharide gene cluster Streptococcusthermophilus Sfi6 into Lactococcus lactis MG1363 : production and characterization of
an altered polysaccharide. Mol. Microbiol. 32, 1287–1295
55 Parker, A., Boulenguer, P. and Kravtchenko, T. P. (1994) Effect of the addition of
high methoxy pectin on the rheology and colloidal stability of acid milk drinks. In
Food Hydrocolloids : Structures, Properties, and Functions (Nishinari, K. and Doi, E.,
eds.), pp. 307–312, Plenum Press, New York
56 Pereyra, R., Schmidt, K. A. and Wicker, L. (1997) Interaction and stabilization of
acidified casein dispersions with low and high methoxyl pectins. J. Agric. Food
Chem. 45, 3448–3451
57 Falch, B. H., Espevik, T., Ryan, L. and Stokke, B. T. (2000) The cytokine stimulating
activity of (1! 3)-β-D-glucans is dependent on the triple helix conformation.
Carbohydr. Res. 329, 587–596
# 2002 Biochemical Society