Prediction of Thermohydric History of Whey Protein Concentrate Droplets during Spray Drying
Upload
independentCategory
view
2download
0
Growth phase-associated changes in the proteomeand transcriptome of Lactobacillus rhamnosus GG inindustrial-type whey mediummbt_275 746..766
Kati Laakso,1 Kerttu Koskenniemi,2
Johanna Koponen,3 Matti Kankainen,3 Anu Surakka,1
Tuomas Salusjärvi,1 Petri Auvinen,3 Kirsi Savijoki,4
Tuula A. Nyman,3 Nisse Kalkkinen,3
Soile Tynkkynen1 and Pekka Varmanen4*1Research and Development, Valio Ltd, Helsinki,Finland.2Department of Veterinary Biosciences, 3Institute ofBiotechnology and 4Department of Food andEnvironmental Sciences, University of Helsinki, Helsinki,Finland.
Summary
The growth phase during which probiotic bacteria areharvested and consumed can strongly influence theirperformance as health-promoting agents. In thisstudy, global transcriptomic and proteomic changeswere studied in the widely used probiotic Lactobacil-lus rhamnosus GG during growth in industrial-typewhey medium under strictly defined bioreactor con-ditions. The expression of 636 genes (P � 0.01) and116 proteins (P < 0.05) changed significantly overtime. Of the significantly differentially producedproteins, 61 were associated with alterations at thetranscript level. The most remarkable growth phase-dependent changes occurred during the transitionfrom the exponential to the stationary growth phaseand were associated with the shift from glucose fer-mentation to galactose utilization and the transitionfrom homolactic to mixed acid fermentation. Further-more, several genes encoding proteins proposed topromote the survival and persistence of L. rhamno-sus GG in the host and proteins that directly contrib-ute to human health showed temporal changes inexpression. Our results suggest that L. rhamnosusGG has a highly flexible and adaptable metabolismand that the growth stage during which bacterial cells
are harvested and consumed should be taken intoconsideration to gain the maximal benefit from probi-otic bacteria.
Introduction
Lactobacillus rhamnosus GG (ATCC 53103) is one of themost intensively studied probiotic strains worldwide. It hasmost of the characteristics generally desired for a goodprobiotic bacterium, including the ability to survivepassage through and to colonize the human gastrointes-tinal tract (GIT) (Goldin et al., 1992; Alander et al., 1997;1999). Adhesion capacity is a prerequisite for coloniza-tion, and L. rhamnosus GG has been shown to adhereefficiently to both intestinal mucus and epithelial cells(Jacobsen et al., 1999; Tuomola et al., 2000; Ouwehandet al., 2001). Consumption of L. rhamnosus GG promoteshuman health by reducing the risk of nosocomialrotavirus-related diarrhoea in infants (Szajewska et al.,2001) and shortening the duration of acute diarrhoea(Szajewska et al., 2007, recently reviewed by Guarinoet al., 2009). In addition to its influence on the GIT,L. rhamnosus GG have other beneficial effects, includingreducing upper respiratory tract infections among childrenin day care (Hatakka et al., 2001; Hojsak et al., 2010),decreasing the risk of developing atopic eczema (Kal-liomäki et al., 2001; 2003; 2007), alleviating the symp-toms of eczema (Majamaa and Isolauri, 1997; Isolauriet al., 2000) and decreasing the risk of dental caries inchildren (Näse et al., 2001). So far, the molecular mecha-nisms identified as being responsible for the health-promoting effects of lactobacilli mainly relate toimmunomodulation, intestinal epithelial barrier protectionand microbial balance maintenance (reviewed by Lebeeret al., 2008; 2010). The recently published genomesequence of L. rhamnosus GG (Kankainen et al., 2009)will boost mechanistic and functional genomic research ofthis well-known probiotic strain.
In industrial production, dairy strains, including probiot-ics, are commonly harvested during the late exponentialor stationary growth phase to ensure high cell numbers.However, the desired probiotic-associated factors are notnecessarily expressed at the highest levels during thestationary phase of growth. For example, cell surface
Received 2 March, 2011; revised 13 May, 2011; accepted 16 May,2011. *For correspondence. E-mail [email protected]; Tel.(+358) 9 19157057; Fax (+358) 9 19158460. Conflict of interest state-ment: K.L., A.S., T.S. and S.T. are employed by Valio Ltd, whichproduces and markets L. rhamnosus GG strain.
Microbial Biotechnology (2011) 4(6), 746–766 doi:10.1111/j.1751-7915.2011.00275.x
© 2011 The AuthorsMicrobial Biotechnology © 2011 Society for Applied Microbiology and Blackwell Publishing Ltd
properties of L. rhamnosus GG have been shown tochange during growth, influencing the strain’s ability toadhere to epithelial cells (Deepika et al., 2009). Further-more, consumption of another widely recognized probioticbacterium, Lactobacillus plantarum, at different growthphases (mid-exponential or stationary) induced differenttranscriptional responses in human duodenal mucosa(van Baarlen et al., 2009). Hence, when aiming to opti-mize the health-promoting properties of probiotic bacteriain large-scale industrial cultivations, it is essential to deter-mine the most favorable growth conditions and phase forcell harvesting.
Functional genomics and proteomics analyses areuseful tools for identifying the molecular mechanismsbehind the health-promoting features of probiotic lacticacid bacteria. Transcriptomics provides detailed informa-tion about global changes in gene expression underparticular conditions. Furthermore, microarrays enablereliable measurement of the expression of all genes onthe array, regardless of the subcellular location of theircorresponding proteins. However, only changes in mRNAlevel can be measured with this tool, while most biologicalphenomena result from protein function. In addition,changes occurring at the post-transcriptional level (due toproteolysis, charged modification, etc.) can be investi-gated only with proteomic tools. Therefore, it is advisableto use both transcriptomic and proteomic approacheswhen linking genomic sequences to potential biologicalfunctions. Transcript or protein level approaches havebeen used to investigate global changes in other probioticlactic acid bacteria during growth transitions (Cohen et al.,2006; Koistinen et al., 2007; Azcarate-Peril et al., 2009).For example, transcriptomic analysis of Lactobacillus aci-dophilus cultured in skim milk indicated temporal expres-sion changes in genes involved in the proteolytic system,carbohydrate utilization, adhesion and cellular responsesto stress (Azcarate-Peril et al., 2009). In L. plantarum,protein expression profiles demonstrated differences inseveral anabolic and stress response pathways duringdifferent growth phases (Cohen et al., 2006). A compari-son of the proteomes of two L. plantarum strains duringgrowth demonstrated the growth phase-dependentexpression of proteins associated with energy metabo-lism, such as glycolysis, the phosphoketolase pathwayand ribose metabolism (Koistinen et al., 2007).
The global omics-level analyses conducted on theprobiotic L. rhamnosus GG so far include two proteomicstudies (Koskenniemi et al., 2009; Sánchez et al., 2009)and a study combining both proteomic and transcrip-tomic approaches (Koskenniemi et al., 2011). Sánchezand colleagues (2009) tested different extractionmethods for surface-associated proteins, and couldidentify 18 different possibly surface-associated proteinsof L. rhamnosus GG. Comparison of the proteomes of
L. rhamnosus GG grown in an industrial-type wheymedium (the same as used in this study) and in a labo-ratory medium demonstrated fundamental effects ofculture conditions on the protein production of L. rham-nosus GG (Koskenniemi et al., 2009). In a recent study,transcript and protein level responses of L. rhamnosusGG towards bile were shown to include diverse and spe-cific changes in general stress responses as well asalterations in cell envelope-related functions (Koskenni-emi et al., 2011). The present study involves comple-mentary approaches, i.e. DNA microarray analysescombined with two-dimensional difference gel electro-phoresis (2-D DIGE), to assess global changes in thetranscriptome and proteome of probiotic L. rhamnosusGG during growth in industrial-type whey medium understrictly controlled bioreactor conditions. In particular, thisstudy aimed to determine whether potential probiotic-associated factors were affected in a growth phase-dependent fashion during fermentation in whey.
Results and discussion
Expression profile of L. rhamnosus GG during growth inindustrial-type whey medium
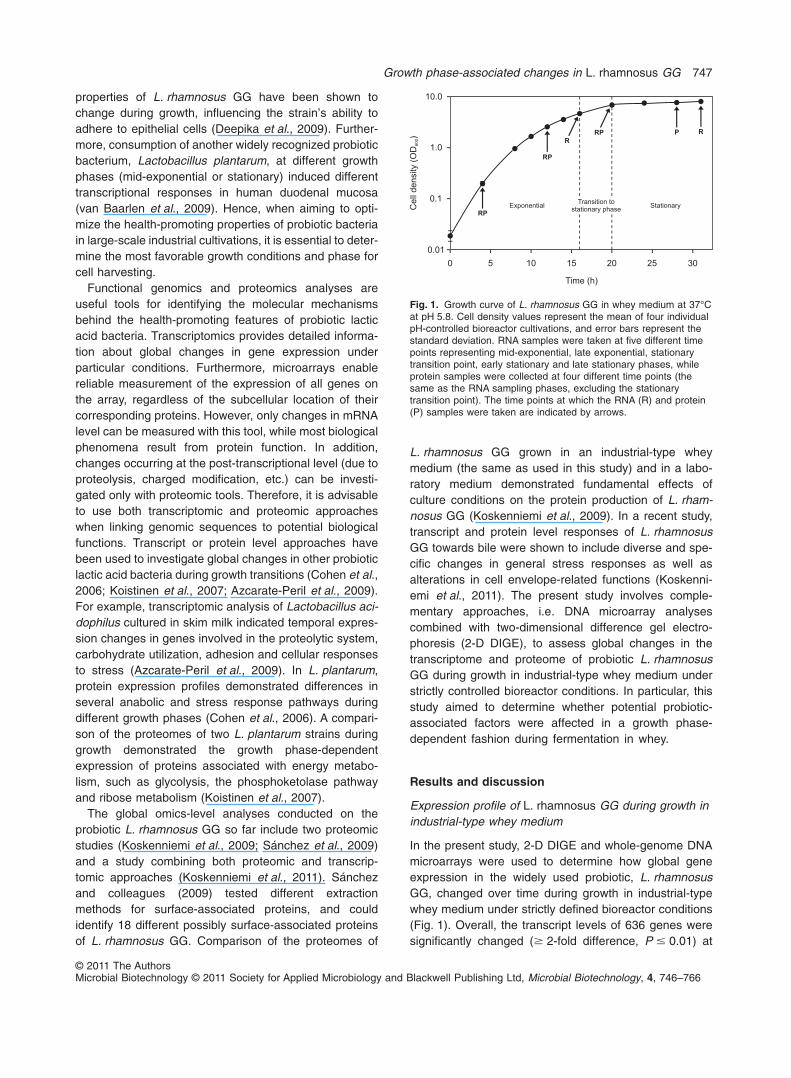
In the present study, 2-D DIGE and whole-genome DNAmicroarrays were used to determine how global geneexpression in the widely used probiotic, L. rhamnosusGG, changed over time during growth in industrial-typewhey medium under strictly defined bioreactor conditions(Fig. 1). Overall, the transcript levels of 636 genes weresignificantly changed (� 2-fold difference, P � 0.01) at
Fig. 1. Growth curve of L. rhamnosus GG in whey medium at 37°Cat pH 5.8. Cell density values represent the mean of four individualpH-controlled bioreactor cultivations, and error bars represent thestandard deviation. RNA samples were taken at five different timepoints representing mid-exponential, late exponential, stationarytransition point, early stationary and late stationary phases, whileprotein samples were collected at four different time points (thesame as the RNA sampling phases, excluding the stationarytransition point). The time points at which the RNA (R) and protein(P) samples were taken are indicated by arrows.
Growth phase-associated changes in L. rhamnosus GG 747
© 2011 The AuthorsMicrobial Biotechnology © 2011 Society for Applied Microbiology and Blackwell Publishing Ltd, Microbial Biotechnology, 4, 746–766

one or more time points, representing 22% of the com-plete genome of L. rhamnosus GG (Fig. 2). This is com-parable to results from a previous study, where 21% of theORFs of the L. acidophilus genome were differentiallyexpressed during shift from exponential to stationarygrowth phase in skim milk (Azcarate-Peril et al., 2009).Expression profiles of the 636 significantly differentiallyexpressed genes were clustered into 16 groups (Fig. S1,Table S1). A clear difference could be seen between thetranscription profiles of the mid-exponential (4 h) and sta-
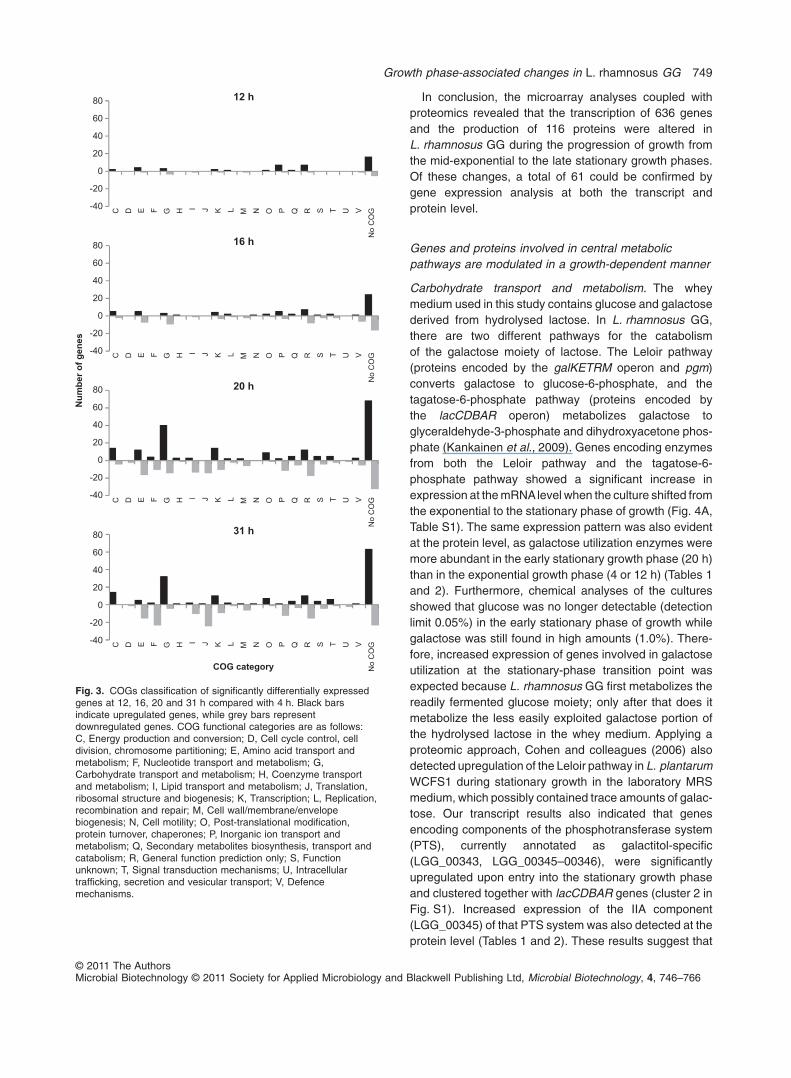
tionary growth phases (20 and 31 h), although only a fewgenes were down- (five genes) or upregulated (eightgenes) during the whole progression of growth (Fig. 2).Interestingly, clusters of orthologous groups (COGs) clas-sification of significantly differentially expressed genesshowed that the majority of genes regulated at time points12, 16, 20 and 31 h, compared with the 4 h time point,could not be included in any COG category (Fig. 3). At the20 h time point, Carbohydrate transport and metabolism(G), Energy production and conversion (C) and Transcrip-tion (K) seemed to be coordinately upregulated whencompared with 4 h, while most of the downregulatedgenes were involved in Amino acid transport and metabo-lism (E) or were categorized as ‘General function predic-tion only’ (R). At 31 h, most of the upregulated genes wereassigned to the G and C categories, and the majority ofdownregulated genes belonged to the Translation, riboso-mal structure and biogenesis (J) and Nucleotide transportand metabolism (F) categories.
Changes in protein production in L. rhamnosus GGduring growth were studied at 4, 12, 20 and 28 h. Usingthe 2-D DIGE technique, proteome composition at eachtime point was compared with the 20 h time point inthree separate DIGE experiments (Table S2). The 20 htime point was selected as the baseline because it wasassumed to involve the broadest selection of differentproteins. In total, 267 protein spots showing a statisti-cally significant difference (� 1.5-fold difference,P < 0.05) in abundance were detected and cut out fromthe gels, and 201 of these could be identified usingMALDI-TOF mass spectrometry and/or LC-MS/MS(Fig. S2, Tables 1–3 and Tables S3–S5). In seven cases,two proteins were identified from one spot. Conversely,30 proteins were differentially abundant and identified inmore than one experiment, and 26 proteins were foundto occur as different isoforms, i.e. they were identified intwo or more separate spots in the same experiment.Overall, the identified protein spots represented 116 dis-tinct gene products. The numbers of differentially abun-dant protein spots between the time points 4 versus20 h, 12 versus 20 h and 20 versus 28 h were 132, 46and 23 respectively. The most remarkable growth phase-dependent changes in protein abundance occurred inthe set of carbohydrate metabolism proteins (COG cat-egory G), consistent with the RNA results. The abun-dance of these proteins was continuously changingduring the fermentation process. For most other pro-teins, the differences were most obvious when compar-ing the mid-exponential and early stationary phases (4 hand 20 h). Altered abundances were detected amongothers in proteins from COG categories F (Nucleotidetransport and metabolism), E (Amino acid transport andmetabolism) and J (Translation, ribosomal structure andbiogenesis).
Fig. 2. Venn diagrams showing the numbers of significantlydifferentially transcribed genes (� 2-fold difference, P � 0.01)during growth in whey. Time points at 12 h, 16 h, 20 h and 31 hwere compared with the time point at 4 h (4 h, mid-exponential;12 h, late exponential; 16 h, stationary transition point; 20 h, earlystationary; and 31 h, late stationary phase).
748 K. Laakso et al.
© 2011 The AuthorsMicrobial Biotechnology © 2011 Society for Applied Microbiology and Blackwell Publishing Ltd, Microbial Biotechnology, 4, 746–766
In conclusion, the microarray analyses coupled withproteomics revealed that the transcription of 636 genesand the production of 116 proteins were altered inL. rhamnosus GG during the progression of growth fromthe mid-exponential to the late stationary growth phases.Of these changes, a total of 61 could be confirmed bygene expression analysis at both the transcript andprotein level.
Genes and proteins involved in central metabolicpathways are modulated in a growth-dependent manner
Carbohydrate transport and metabolism. The wheymedium used in this study contains glucose and galactosederived from hydrolysed lactose. In L. rhamnosus GG,there are two different pathways for the catabolismof the galactose moiety of lactose. The Leloir pathway(proteins encoded by the galKETRM operon and pgm)converts galactose to glucose-6-phosphate, and thetagatose-6-phosphate pathway (proteins encoded bythe lacCDBAR operon) metabolizes galactose toglyceraldehyde-3-phosphate and dihydroxyacetone phos-phate (Kankainen et al., 2009). Genes encoding enzymesfrom both the Leloir pathway and the tagatose-6-phosphate pathway showed a significant increase inexpression at the mRNAlevel when the culture shifted fromthe exponential to the stationary phase of growth (Fig. 4A,Table S1). The same expression pattern was also evidentat the protein level, as galactose utilization enzymes weremore abundant in the early stationary growth phase (20 h)than in the exponential growth phase (4 or 12 h) (Tables 1and 2). Furthermore, chemical analyses of the culturesshowed that glucose was no longer detectable (detectionlimit 0.05%) in the early stationary phase of growth whilegalactose was still found in high amounts (1.0%). There-fore, increased expression of genes involved in galactoseutilization at the stationary-phase transition point wasexpected because L. rhamnosus GG first metabolizes thereadily fermented glucose moiety; only after that does itmetabolize the less easily exploited galactose portion ofthe hydrolysed lactose in the whey medium. Applying aproteomic approach, Cohen and colleagues (2006) alsodetected upregulation of the Leloir pathway in L. plantarumWCFS1 during stationary growth in the laboratory MRSmedium, which possibly contained trace amounts of galac-tose. Our transcript results also indicated that genesencoding components of the phosphotransferase system(PTS), currently annotated as galactitol-specific(LGG_00343, LGG_00345–00346), were significantlyupregulated upon entry into the stationary growth phaseand clustered together with lacCDBAR genes (cluster 2 inFig. S1). Increased expression of the IIA component(LGG_00345) of that PTS system was also detected at theprotein level (Tables 1 and 2). These results suggest that
Fig. 3. COGs classification of significantly differentially expressedgenes at 12, 16, 20 and 31 h compared with 4 h. Black barsindicate upregulated genes, while grey bars representdownregulated genes. COG functional categories are as follows:C, Energy production and conversion; D, Cell cycle control, celldivision, chromosome partitioning; E, Amino acid transport andmetabolism; F, Nucleotide transport and metabolism; G,Carbohydrate transport and metabolism; H, Coenzyme transportand metabolism; I, Lipid transport and metabolism; J, Translation,ribosomal structure and biogenesis; K, Transcription; L, Replication,recombination and repair; M, Cell wall/membrane/envelopebiogenesis; N, Cell motility; O, Post-translational modification,protein turnover, chaperones; P, Inorganic ion transport andmetabolism; Q, Secondary metabolites biosynthesis, transport andcatabolism; R, General function prediction only; S, Functionunknown; T, Signal transduction mechanisms; U, Intracellulartrafficking, secretion and vesicular transport; V, Defencemechanisms.
Growth phase-associated changes in L. rhamnosus GG 749
© 2011 The AuthorsMicrobial Biotechnology © 2011 Society for Applied Microbiology and Blackwell Publishing Ltd, Microbial Biotechnology, 4, 746–766

Tab
le1.
Pro
tein
sw
ithdi
fferin
gab
unda
nce
betw
een
the
mid
-exp
onen
tial(
4h)
and
early
stat
iona
ry(2
0h)
grow
thph
ases
and
tran
scrip
tion
diffe
renc
esin
the
corr
espo
ndin
gge
nes.
Locu
sID
Gen
ena
me
Fun
ctio
n
Pro
teom
ic(f
old
chan
ge)
Tran
scrip
tom
ic(L
og2R
)20
h/4
hS
pot
No.
20h/
4h
Am
ino
acid
met
abol
ism
LGG
_005
68cy
sKC
yste
ine
synt
hase
11.
90.
518
LGG
_011
58pe
pDD
ipep
tidas
eA
2-2
–0.5
07LG
G_0
1201
sufS
Cys
tein
ede
sulfu
rase
31.
6–0
.281
LGG
_014
78pe
pOE
ndop
eptid
ase
O4
1.6
1.78
8LG
G_0
2639
–A
min
otra
nsfe
rase
51.
73.
741
LGG
_027
08se
lAP
yrid
oxal
phos
phat
e-de
pend
ent
enzy
me
6a2.
53.
039
Car
bohy
drat
em
etab
olis
mG
alac
tose
met
abol
ism
LGG
_003
41la
cCTa
gato
se-6
-pho
spha
teki
nase
73.
47.
214
LGG
_006
53ga
lKG
alac
toki
nase
82.
52.
755
LGG
_006
64la
cCTa
gato
se-6
-pho
spha
teki
nase
97.
96.
897
LGG
_006
65la
cDTa
gato
se1,
6-di
phos
phat
eal
dola
se10
4.4
6.91
0LG
G_0
0666
lacB
Gal
acto
se-6
-pho
spha
teis
omer
ase
subu
nit
B11
,12
23.9
6.92
3LG
G_0
0667
lacA
Gal
acto
se-6
-pho
spha
teis
omer
ase
subu
nitA
13,1
431
.96.
988
LGG
_006
68la
cRLa
ctos
eph
osph
otra
nsfe
rase
syst
emre
pres
sor
1515
7.05
5LG
G_0
1062
galU
UT
P-g
luco
se-1
-pho
spha
teur
idyl
yltr
ansf
eras
e16
,17
2.1
0.87
2LG
G_0
2575
lacD
Taga
tose
1,6-
diph
osph
ate
aldo
lase
184
-0.0
7G
lyco
lysi
s/gl
ucon
eoge
nesi
sLG
G_0
0524
fba
Fru
ctos
e-bi
spho
spha
teal
dola
se19
-1.5
-1.9
7LG
G_0
0921
pgm
Pho
spho
gluc
omut
ase
201.
51.
686
LGG
_009
33ga
pAG
lyce
rald
ehyd
e-3-
phos
phat
ede
hydr
ogen
ase
21–2
52.
90.
644
LGG
_009
33ga
pAG
lyce
rald
ehyd
e-3-
phos
phat
ede
hydr
ogen
ase
26,2
7-1
.80.
644
LGG
_009
34pg
kP
hosp
hogl
ycer
ate
kina
se28
,29,
30a
3.1
0.28
6LG
G_0
0935
tpiA
Trio
seph
osph
ate
isom
eras
e31
2.2
0.14
7LG
G_0
0935
tpiA
Trio
seph
osph
ate
isom
eras
e32
-1.9
0.14
7LG
G_0
0936
eno
Eno
lase
332
0.67
2LG
G_0
1375
pyk
Pyr
uvat
eki
nase
34–3
64.
2-2
.004
Oth
ers
LGG
_000
52ed
a2-
Deh
ydro
-3-d
eoxy
phos
phog
luco
nate
aldo
lase
/4-h
ydro
xy-2
-oxo
glut
arat
eal
dola
se37
-1.7
0.64
LGG
_003
21de
oCD
eoxy
ribos
e-ph
osph
ate
aldo
lase
381.
90.
859
LGG
_003
42sr
lDS
orbi
tol-6
-pho
spha
te2-
dehy
drog
enas
e39
,40
53.6
7.87
7LG
G_0
0757
adhE
Ald
ehyd
e-al
coho
ldeh
ydro
gena
se41
–44
185.
86LG
G_0
1322
pdhC
Pyr
uvat
ede
hydr
ogen
ase
com
plex
E2
com
pone
nt,
dihy
drol
ipoy
llysi
ne-r
esid
ueac
etyl
tran
sfer
ase
45-1
.60.
796
LGG
_013
60fr
uB1-
Pho
spho
fruc
toki
nase
46-3
-1.6
59LG
G_0
1421
pflB
For
mat
eac
etyl
tran
sfer
ase
47–4
94.
74.
288
LGG
_019
14ci
tFC
itrat
ely
ase,
alph
asu
buni
t,C
itrat
eC
oA-t
rans
fera
se50
2.8
-2.6
73LG
G_0
2025
glgD
Glu
cose
-1-p
hosp
hate
aden
ylyl
tran
sfer
ase
regu
lato
rysu
buni
t51
1.9
3.58
8
750 K. Laakso et al.
© 2011 The AuthorsMicrobial Biotechnology © 2011 Society for Applied Microbiology and Blackwell Publishing Ltd, Microbial Biotechnology, 4, 746–766

Tab
le1.
cont
.
Locu
sID
Gen
ena
me
Fun
ctio
n
Pro
teom
ic(f
old
chan
ge)
Tran
scrip
tom
ic(L
og2R
)20
h/4
hS
pot
No.
20h/
4h
Lipi
dm
etab
olis
mLG
G_0
0509
dhaK
Dih
ydro
xyac
eton
eki
nase
52,5
33.
41.
109
LGG
_021
13fa
bZ(3
R)-
hydr
oxym
yris
toyl
-[ac
yl-c
arrie
r-pr
otei
n]de
hydr
atas
e54
-5.7
-6.3
21LG
G_0
2115
fabF
3-O
xoac
yl-[
acyl
-car
rier-
prot
ein]
synt
hase
II55
,56
-2.8
-5.9
69LG
G_0
2118
fabK
Eno
yl-(
Acy
l-car
rier-
prot
ein)
redu
ctas
eII
57-1
.9-5
.285
Mem
bran
etr
ansp
ort
LGG
_003
45ga
tAP
TS
syst
em,
gala
ctito
l-spe
cific
IIAco
mpo
nent
585.
57.
069
LGG
_009
51m
alE
AB
Ctr
ansp
orte
r,su
gar
tran
spor
ter
perip
lasm
icco
mpo
nent
59a
1.9
-0.7
4LG
G_0
1940
oppF
AB
Ctr
ansp
orte
r,ol
igop
eptid
etr
ansp
orte
rA
TP
ase
com
pone
nt60
3.2
2.51
LGG
_019
41op
pDA
BC
tran
spor
ter,
olig
opep
tide
tran
spor
ter
AT
Pas
eco
mpo
nent
612.
32.
733
LGG
_028
38m
anA
PT
Ssy
stem
,m
anno
se-s
peci
ficIIA
Bco
mpo
nent
62,6
31.
81.
199
Met
abol
ism
ofco
fact
ors
and
vita
min
sLG
G_0
2764
entB
Isoc
horis
mat
ase
fam
ilypr
otei
n64
4.7
3.53
8LG
G_0
2765
pncB
Nic
otin
ate
phos
phor
ibos
yltr
ansf
eras
e65
4.7
3.70
7LG
G_0
1258
nifS
Am
inot
rans
fera
secl
ass
V66
-3.2
-0.5
46N
ucle
otid
em
etab
olis
mP
urin
em
etab
olis
mLG
G_0
0249
guaB
Inos
ine-
5′-m
onop
hosp
hate
dehy
drog
enas
e67
-2.1
-1.3
49LG
G_0
1803
purD
Pho
spho
ribos
ylam
ine-
glyc
ine
ligas
e30
a1.
7-1
.771
LGG
_018
05pu
rHB
ifunc
tiona
lpur
ine
bios
ynth
esis
prot
ein
purH
68,6
92.
3-1
.698
LGG
_018
07pu
rMP
hosp
horib
osyl
form
ylgl
ycin
amid
ine
cycl
o-lig
ase
70a
2-1
.574
LGG
_018
08pu
rFA
mid
opho
spho
ribos
yltr
ansf
eras
e71
,72
2.8
-1.6
25LG
G_0
1809
purL
Pho
spho
ribos
ylfo
rmyl
glyc
inam
idin
esy
ntha
seII
733.
8-1
.653
LGG
_018
12pu
rCP
hosp
horib
osyl
amin
oim
idaz
ole-
succ
inoc
arbo
xam
ide
synt
hase
742.
5-1
.466
LGG
_018
13pu
rKP
hosp
horib
osyl
amin
oim
idaz
ole
carb
oxyl
ase,
AT
Pas
esu
buni
t6a ,
75,7
62.
8-1
.539
LGG
_019
68gu
aAG
MP
synt
hase
771.
8-1
.916
LGG
_024
66ad
kA
deny
late
kina
se78
-1.7
-1.8
65P
yrim
idin
em
etab
olis
mLG
G_0
1175
upp
Ura
cilp
hosp
horib
osyl
tran
sfer
ase
79-1
.6-1
.009
LGG
_014
56ca
rBC
arba
moy
l-pho
spha
tesy
ntha
se,
larg
esu
buni
t80
,81
-2.3
-3.8
19LG
G_0
1458
pyrC
Dih
ydro
orot
ase
82-1
.9-3
.269
LGG
_014
59py
rBA
spar
tate
carb
amoy
ltran
sfer
ase
83-1
.6-3
.143
LGG
_014
61py
rRP
yrim
idin
eop
eron
regu
lato
rypr
otei
n,bi
func
tiona
lpro
tein
pyrR
84-2
.2-2
.752
LGG
_025
46py
rGC
TP
synt
hase
85-2
-0.9
64O
ther
sLG
G_0
1474
nrdE
Rib
onuc
leos
ide-
diph
osph
ate
redu
ctas
e,al
pha
subu
nit
86,8
7-2
.3-1
.339
Pep
tidog
lyca
nbi
osyn
thes
isLG
G_0
0254
dacA
D-a
lany
l-D-a
lani
neca
rbox
ypep
tidas
e59
a1.
90.
149
LGG
_006
62–
Bet
a-la
ctam
ase
clas
sC
-rel
ated
peni
cilli
n-bi
ndin
gpr
otei
n88
7.3
6.84
4LG
G_0
1282
mur
DU
DP
-N-a
cety
lmur
amoy
lala
nine
-D-g
luta
mat
elig
ase
89-1
.7-0
.545
LGG
_017
68m
urC
UD
P-N
-ace
tylm
uram
ate-
L-al
anin
elig
ase
90-1
.9-1
.239
Growth phase-associated changes in L. rhamnosus GG 751
© 2011 The AuthorsMicrobial Biotechnology © 2011 Society for Applied Microbiology and Blackwell Publishing Ltd, Microbial Biotechnology, 4, 746–766

Tab
le1.
cont
.
Locu
sID
Gen
ena
me
Fun
ctio
n
Pro
teom
ic(f
old
chan
ge)
Tran
scrip
tom
ic(L
og2R
)20
h/4
hS
pot
No.
20h/
4h
Pro
tein
synt
hesi
sLG
G_0
1628
rpsB
SS
U/3
0Srib
osom
alpr
otei
nS
2P70
a2
-1.4
08LG
G_0
1628
rpsB
SS
U/3
0Srib
osom
alpr
otei
nS
2P91
,92
-2.1
-1.4
08LG
G_0
1690
rplU
LSU
/50S
ribos
omal
prot
ein
L21P
93-2
.5-0
.991
LGG
_024
93fu
sAP
rote
intr
ansl
atio
nel
onga
tion
fact
orG
(EF
-G)
94-1
.7-1
.288
Str
ess LG
G_0
1367
clpB
AT
P-d
epen
dent
chap
eron
eC
lpB
951.
70.
783
LGG
_016
04dn
aKC
hape
rone
prot
ein
dnaK
96-1
.5-0
.027
LGG
_021
51us
pU
nive
rsal
stre
sspr
otei
n,U
spA
fam
ily97
5.6
-0.3
64LG
G_0
2239
groE
L60
kDa
chap
eron
inG
RO
EL
98,9
92.
30.
058
LGG
_024
99cl
pCA
TP
-dep
ende
ntC
lppr
otea
seA
TP
-bin
ding
subu
nit
100
4.5
0.25
LGG
_028
06ht
rAS
erin
epr
otea
se10
1-1
.6-0
.454
Tran
scrip
tion
LGG
_024
61rp
oAD
NA
-dire
cted
RN
Apo
lym
eras
e,su
buni
tal
pha
102
-1.8
-1.5
36LG
G_0
2498
rpoB
DN
A-d
irect
edR
NA
poly
mer
ase,
beta
chai
n10
3,10
4-2
.5-0
.533
Tran
slat
ion
LGG
_008
48le
uSLe
ucyl
-tR
NA
synt
heta
se10
5-2
.4-0
.541
LGG
_012
61va
lSV
alyl
-tR
NA
synt
heta
se10
6-2
.1-0
.427
LGG
_017
86ar
gSA
rgin
yl-t
RN
Asy
nthe
tase
107
-1.8
-0.8
27LG
G_0
2332
gltX
Glu
tam
yl-t
RN
Asy
nthe
tase
108
-1.6
-1.5
53LG
G_0
2584
met
GM
ethi
onyl
-tR
NA
synt
heta
se/p
rote
inse
cret
ion
chap
eron
in,
Csa
A10
9,11
0-2
-0.5
86M
isce
llane
ous
LGG
_002
26–
Pyr
idox
ine
5′-p
hosp
hate
oxid
ase
Vre
late
dfa
vin-
nucl
eotid
e-bi
ndin
gpr
otei
n11
1-3
.4-3
.048
LGG
_004
91–
NA
DH
pero
xida
se11
24.
1-0
.197
LGG
_006
15ye
aEA
ldo/
keto
redu
ctas
e11
32.
10.
153
LGG
_006
34–
Dyp
-typ
epe
roxi
dase
fam
ilypr
otei
n11
42.
52.
248
LGG
_006
63–
Con
serv
edpr
otei
n11
54.
96.
808
LGG
_007
40gp
hH
ydro
lase
,ha
loac
idde
halo
gena
se-li
kefa
mily
116
-1.8
-0.4
95LG
G_0
0744
dkgA
Ald
o/ke
tore
duct
ase
117
1.6
0.71
LGG
_008
99se
cAP
rote
intr
ansl
ocas
esu
buni
tse
cA11
8-2
.1-0
.076
LGG
_012
65m
reB
Rod
shap
e-de
term
inin
gpr
otei
nM
reB
119
1.6
-0.3
31LG
G_0
1311
ykqC
Met
allo
-bet
a-la
ctam
ase
supe
rfam
ilypr
otei
n12
0-2
0.49
3LG
G_0
1327
typA
GT
P-b
indi
ngpr
otei
nTy
pA12
1-1
.8-2
.590
LGG
_013
95–
Con
serv
edpr
otei
n12
23.
43.
504
LGG
_014
33–
Nitr
ored
ucta
se12
32.
31.
344
LGG
_014
65fh
sF
orm
ate-
tetr
ahyd
rofo
late
ligas
e12
41.
9-1
.209
LGG
_014
68–
Nitr
ored
ucta
sefa
mily
prot
ein
125,
126
-3.6
-3.8
52LG
G_0
1821
ptsH
Pho
spho
carr
ier
prot
ein
HP
r12
72.
20.
884
LGG
_018
37m
vaS
Hyd
roxy
met
hylg
luta
ryl-C
oAsy
ntha
se12
8-1
.50.
071
LGG
_020
50gl
fU
DP
-gal
acto
pyra
nose
mut
ase
129
-1.7
-1.7
11LG
G_0
2098
–C
onse
rved
prot
ein
130
2.4
-0.5
26LG
G_0
2415
cueO
Mul
ticop
per
oxid
ase
131
3.9
1.73
LGG
_026
30yg
hZA
ldo/
keto
redu
ctas
e(o
xido
redu
ctas
e)13
22.
61.
3
a.Tw
opr
otei
nsw
ere
iden
tified
from
thes
esp
ots.
Itre
mai
nsun
clea
rw
hich
ofth
ese
prot
eins
was
mor
eab
unda
nt.
752 K. Laakso et al.
© 2011 The AuthorsMicrobial Biotechnology © 2011 Society for Applied Microbiology and Blackwell Publishing Ltd, Microbial Biotechnology, 4, 746–766

this particular PTS is involved in the transportation ofgalactose, and revision of its present annotation could beconsidered. It is noteworthy that current annotations ofPTS transporters do not necessarily indicate their true rolein the metabolism of particular sugars because the speci-
ficities of many lactobacilli PTS transporters are incorrectlyannotated (Francl et al., 2010), and current computationalmethods are unreliable for the prediction of substratespecificity. Therefore, further experiments are needed tocharacterize the PTS transporter specificities of L. rham-
Table 2. Proteins with differing abundance between the late exponential (12 h) and early stationary (20 h) growth phases and transcriptiondifferences in the corresponding genes.
Locus IDGenename Function
Proteomic(fold change) Transcriptomic
(Log2R)20 h/12 hSpot No. 20 h/12 h
Carbohydrate metabolismGalactose metabolism
LGG_00653 galK Galactokinase 133,134 4 4.176LGG_00654 galE UDP-glucose 4-epimerase 135 3.1 3.817LGG_00655 galT Galactose-1-phosphate uridylyltransferase 136 3.7 3.831LGG_00664 lacC Tagatose-6-phosphate kinase 137 5.3 6.928LGG_00665 lacD Tagatose 1,6-diphosphate aldolase 138 2.3 6.461LGG_00666 lacB Galactose-6-phosphate isomerase subunit B 139,140 30.1 6.675LGG_00667 lacA Galactose-6-phosphate isomerase subunit A 141 26.8 6.561LGG_00668 lacR Lactose phosphotransferase system repressor 142 15.9 6.699LGG_02575 lacD Tagatose 1,6-diphosphate aldolase 143,144 2.1 -1.145
Glycolysis/gluconeogenesisLGG_00921 pgm Phosphoglucomutase 145 1.9 1.331LGG_00933 gapA Glyceraldehyde-3-phosphate dehydrogenase 146,147 1.6 0.239LGG_00933 gapA Glyceraldehyde-3-phosphate dehydrogenase 148 -2.9 0.239LGG_01375 pyk Pyruvate kinase 149,150 2 -2.596LGG_01375 pyk Pyruvate kinase 151 -1.8 -2.596
OthersLGG_00342 srlD Sorbitol-6-phosphate 2-dehydrogenase 152,153 26.1 6.56LGG_00373 rbsK Ribokinase 154 2.1 4.074LGG_00757 adhE Aldehyde-alcohol dehydrogenase 155–157 5.6 2.279LGG_01421 pflB Formate acetyltransferase 158 2.2 3.134LGG_02523 ldh L-lactate dehydrogenase 159a -1.6 -3.868
Membrane transportLGG_00345 gatA PTS system, galactitol-specific IIA component 160 13 6.286
Metabolism of cofactors and vitaminsLGG_02764 entB Isochorismatase family protein 161 2.6 1.32LGG_02765 pncB Nicotinate phosphoribosyltransferase 162,163 3.3 1.623
Nucleotide metabolismPurine metabolism
LGG_00249 guaB Inosine-5′-monophosphate dehydrogenase 164 -1.6 0.419LGG_01808 purF Amidophosphoribosyltransferase 165 1.7 -2.035
Peptidoglycan biosynthesisLGG_00662 – Beta-lactamase class C-related penicillin-binding
protein166 5.2 6.994
StressLGG_01823 clpE ATP-dependent clp protease ATP-binding subunit 167 1.8 0.722LGG_02151 usp Universal stress protein, UspA family 168 2.3 -2.413LGG_02499 clpC ATP-dependent Clp protease ATP-binding subunit 169 1.9 0.399
TranslationLGG_00767 alaS Alanyl-tRNA synthetase 170 -1.5 -0.758LGG_01019 gatA Aspartyl/glutamyl-tRNA(Asn/Gln)
amidotransferase subunit A171 -1.7 -0.603
MiscellaneousLGG_00226 – Pyridoxine 5′-phosphate oxidase V-related
favin-nucleotide-binding protein172 -2.1 -1.605
LGG_00491 – NADH peroxidase 173 1.9 -2.539LGG_00634 – Dyp-type peroxidase family protein 174 1.5 1.042LGG_00763 ytqI Phosphoesterase, DHH family protein 159a -1.6 -0.088LGG_01395 – Conserved protein 175 2.4 3.379LGG_01465 fhs Formate-tetrahydrofolate ligase 176 -1.5 -1.411LGG_01468 – Nitroreductase family protein 177 -1.6 -1.985LGG_02630 yghZ Aldo/keto reductase (oxidoreductase) 178 1.6 -0.024
a. Two proteins were identified from this spot. It remains unclear which of these proteins was more abundant.
Growth phase-associated changes in L. rhamnosus GG 753
© 2011 The AuthorsMicrobial Biotechnology © 2011 Society for Applied Microbiology and Blackwell Publishing Ltd, Microbial Biotechnology, 4, 746–766
nosus GG; for example, this could be done by studyingtranscript expression profiles in response to differentcarbohydrates.
The abundance of several glycolytic enzymes and thetranscription of the corresponding genes changed in agrowth phase-dependent fashion. Genes coding for6-phosphofructokinase (pfkA), fructose-bisphosphatealdolase (fba), phosphoglyceromutase (gpmA) and pyru-vate kinase (pyk) were significantly downregulated duringthe stationary-phase transition (Fig. 4A, Table S1). At theprotein level, Fba was more abundant in the mid-exponential growth phase than in the early stationaryphase, consistent with the mRNA results (Table 1). Noclear trend in the abundance changes of glycolytic proteinswas seen during growth, however. Many glycolytic proteins(GapA, Pgk, TpiA, Eno, Pyk) were detected in severalparallel protein spots (two to seven spots) on 2-D gels, andin some of these spot sets (GapA, TpiA, Pyk), both adecrease and an increase in abundance were detected(Tables 1 and 2). For instance, five glyceraldehyde-3-phosphate dehydrogenase (GapA) isoforms were more
abundant during the early stationary growth phase (com-pared with 4 h) while two other isoforms were more abun-dant during the mid-exponential growth phase (comparedwith 20 h). Post-translational protein modifications such asphosphorylation (Cozzone, 1998) and methionine formy-lation (Bandow et al., 2003) may alter the migration ofproteins in 2-D gels, which could also explain the appear-ance of parallel spots in this case. In Lactococcus lactis,glycolysis has been shown to be regulated at the transcrip-tional level only to a lesser degree, and post-translationalmodifications might be more important for regulation (dis-cussed in Soufi et al., 2008). In Lactococcus, Escherichiacoli and Bacillus, several glycolytic proteins have beenshown to be phosphorylated (Eymann et al., 2007; Maceket al., 2007; 2008; Soufi et al., 2008), and characterizationof the phosphoproteome suggests conservation of thistype of modification of glycolytic enzymes in L. rhamnosusGG (J. Koponen, K. Laakso, K. Koskenniemi, M. Kan-kainen, K. Savijoki, T.A. Nyman, S. Tynkkynen, N. Kalkki-nen and P. Varmanen, in preparation). Transcripts of genescoding for GapA, Pgk, TpiA and Eno were only slightly
Table 3. Proteins with differing abundance between the early stationary (20 h) and late stationary (28 h) growth phases and transcriptiondifferences in the corresponding genes.
Locus IDGenename Function
Proteomic(fold change) Transcriptomic
(Log2R)31 h/20 hSpot No. 28 h/20 h
Amino acid metabolismLGG_02639 – Aminotransferase 179 2.1 0.824
Carbohydrate metabolismGalactose metabolism
LGG_00341 lacC Tagatose-6-phosphate kinase 180 2.1 -1.548LGG_00664 lacC Tagatose-6-phosphate kinase 181 2.3 -2.407LGG_00665 lacD Tagatose 1,6-diphosphate aldolase 182 2 -2.313LGG_00666 lacB Galactose-6-phosphate isomerase subunit B 183,184 2.6 -2.027LGG_00667 lacA Galactose-6-phosphate isomerase subunit A 185,186 2 -2.163LGG_00668 lacR Lactose phosphotransferase system repressor 187 2.3 -2.18
Glycolysis/gluconeogenesisLGG_00921 pgm Phosphoglucomutase 188 1.6 1.085LGG_01375 pyk Pyruvate kinase 189 -1.5 -0.329
OthersLGG_00342 srlD Sorbitol-6-phosphate 2-dehydrogenase 190,191 2.4 -2.053LGG_00757 adhE Aldehyde-alcohol dehydrogenase 192,193 2.5 -0.466LGG_01421 pflB Formate acetyltransferase 194 1.5 0.176LGG_01876 pck Phosphoenolpyruvate carboxykinase (ATP) 195 1.8 0.693LGG_02693 xylB Alcohol dehydrogenase 196a 1.5 1.601
Membrane transportLGG_02421 mtsB ABC transporter, ATPase component 197a -1.5 -0.438
Peptidoglycan biosynthesisLGG_00662 – Beta-lactamase class C-related penicillin-binding protein 198 2.6 -2.265
Nucleotide metabolismPyrimidine metabolism
LGG_01625 pyrH Uridylate kinase 197a -1.5 0.296Miscellaneous
LGG_01016 ligA NAD-dependent DNA ligase 199 -1.6 -0.432LGG_01061 mvaK Phosphomevalonate kinase 200 1.6 -0.477LGG_01395 – Conserved protein 201 2.5 0.926LGG_02124 yqhD Iron-containing alcohol dehydrogenase 196a 1.5 0.64
a. Two proteins were identified from these spots. It remains unclear which of these proteins was more abundant.
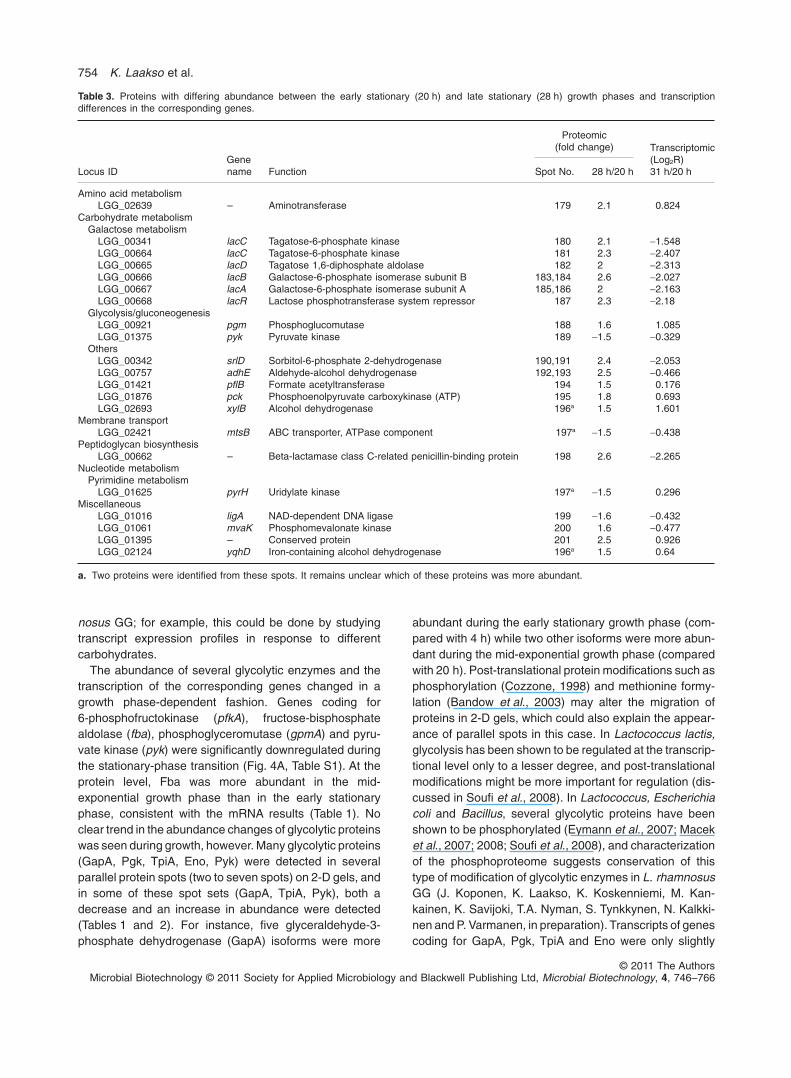
754 K. Laakso et al.
© 2011 The AuthorsMicrobial Biotechnology © 2011 Society for Applied Microbiology and Blackwell Publishing Ltd, Microbial Biotechnology, 4, 746–766
upregulated in the early stationary growth phase comparedwith the exponential growth phase in our study, suggestingthat they are constitutively expressed (Fig. 4A, Tables 1and 2).
Dihydroxyacetone kinase (DhaK), which catalyses thephosphorylation of dihydroxyacetone, was more abun-dant in early stationary-phase cells than in exponential-phase cells at both the transcript and protein levels(Fig. 4A, Table 1). Dihydroxyacetone phosphate ischannelled to glycolysis via the activity of triosephos-phate isomerase (TpiA), which catalyses the formationof glyceraldehyde-3-phosphate from dihydroxyacetonephosphate. Deoxyribose-phosphate aldolase (DeoC,LGG_00321), which converts deoxyribose-5-phosphateto glyceraldehyde-3-phosphate (a glycolytic intermedi-ate), and its concomitant gene were upregulated uponentry into the stationary phase of growth (Fig. 4A,Table 1). One of the most highly differentially expressed
proteins and genes was sorbitol-6-phosphate2-dehydrogenase (SrlD, LGG_00342), which channelssorbitol-6-phosphate to glycolysis via the conversion ofsorbitol-6-phosphate to fructose-6-phosphate (Fig. 4A,Tables 1–3). The expression of SrlD increased over time,especially when the culture shifted from the exponentialgrowth to the stationary phase. Transcription of the genesencoding the glucitol/sorbitol-PTS (LGG_02717–02719)was induced when the culture shifted from exponentialgrowth to stationary growth (Table S1). These resultssuggest that L. rhamnosus GG starts to use alternativeenergy sources other than the previously mentionedgalactose, namely sorbitol, dihydroxyacetone anddeoxyribose-5-phosphate, at the beginning of the station-ary phase after the exhaustion of glucose. In Lactobacilluscasei, the sorbitol operon is repressed by glucose (Alcán-tara et al., 2008), and this seems to also apply forL. rhamnosus GG because the upregulation of SrlD
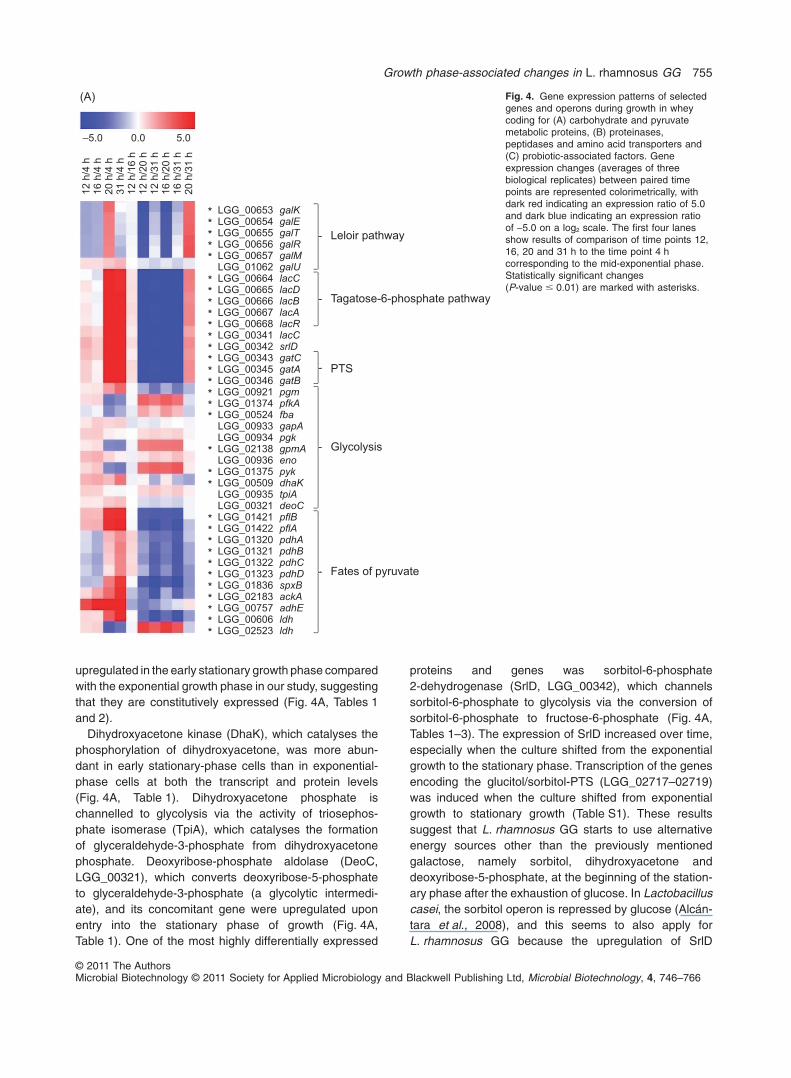
Fig. 4. Gene expression patterns of selectedgenes and operons during growth in wheycoding for (A) carbohydrate and pyruvatemetabolic proteins, (B) proteinases,peptidases and amino acid transporters and(C) probiotic-associated factors. Geneexpression changes (averages of threebiological replicates) between paired timepoints are represented colorimetrically, withdark red indicating an expression ratio of 5.0and dark blue indicating an expression ratioof -5.0 on a log2 scale. The first four lanesshow results of comparison of time points 12,16, 20 and 31 h to the time point 4 hcorresponding to the mid-exponential phase.Statistically significant changes(P-value � 0.01) are marked with asterisks.
Growth phase-associated changes in L. rhamnosus GG 755
© 2011 The AuthorsMicrobial Biotechnology © 2011 Society for Applied Microbiology and Blackwell Publishing Ltd, Microbial Biotechnology, 4, 746–766

occurs when glucose has been used up (according tochemical analyses, detection limit 0.05%).
In summary, during the transition to the stationarygrowth phase, the utilization of glucose as the maincarbon and energy source was replaced in L. rhamnosusGG by alternative pathways for carbohydrate metabolism,such as galactose utilization, using the tagatose-6-phosphate and the Leloir pathways.
Energy production and conversion (pyruvate metabo-lism). Under normal glucose fermentation conditions,lactic acid bacteria reduce pyruvate to lactate by aNAD+-dependent lactate dehydrogenase. In addition,lactic acid bacteria may have alternative means of uti-lizing pyruvate, including the pyruvate-formate lyasesystem, the pyruvate dehydrogenase pathway, thepyruvate oxidase pathway and the diacetyl/acetoinpathway (Axelsson, 2004). Genes encoding pyruvate-formate lyase (LGG_01421–01422), aldehyde-alcoholdehydrogenase (LGG_00757), pyruvate dehydrogenase(LGG_01320–01323) and enzymes of the pyruvateoxidase pathway (LGG_01836, pyruvate oxidase andLGG_02183, acetate kinase) were induced at the
stationary-phase transition point (Fig. 4A, Table S1). ThePflB subunit of pyruvate-formate lyase and aldehyde-alcohol dehydrogenase (AdhE) were also more abun-dant in stationary-phase cells than in exponential-phasecells at the protein level, supporting the transcript results(Table 1–3). However, proteomic analyses indicated thatpyruvate dehydrogenase (PdhC) was more abundant inthe exponential growth phase than in the stationarygrowth phase, in contrast with the transcript results(Table 1). A gene encoding lactate dehydrogenase(LGG_00606) clustered together with the pyruvate-formate lyase and acetate kinase genes, and its expres-sion was significantly increased over time (cluster 4 inFig. S1). Expression of another gene coding for a lactatedehydrogenase (LGG_02523) was, however, decreasedupon entry into the stationary growth phase, and thesame tendency was seen at the protein level (12 hversus 20 h) (Table 2). Thus, our results suggest thatL. rhamnosus GG changes from homolactic fermentationto a mixed acid fermentation when the culture reachesthe stationary phase, and the end-products formed, inaddition to lactate, are formate, acetate and ethanol.This is probably due to the shift detected from glucose
Fig. 4. cont.
756 K. Laakso et al.
© 2011 The AuthorsMicrobial Biotechnology © 2011 Society for Applied Microbiology and Blackwell Publishing Ltd, Microbial Biotechnology, 4, 746–766

to galactose utilization in L. rhamnosus GG at thestationary-phase transition point. The same trend hasbeen observed in Lactococcus strains, which shift fromhomolactic to mixed acid fermentation when glucose islimited or during galactose fermentation (reviewed byNeves et al., 2005). In L. plantarum cells, more lactatedehydrogenase was produced in the exponential than inthe stationary growth phase (Cohen et al., 2006), sup-porting our conclusions.
Nucleotide transport and metabolism. The abundance ofpyrimidine biosynthetic gene cluster (pyr) transcripts wasreduced upon entry into the stationary phase of growth,and the downregulation of the pyrimidine biosynthesispathway was also detected at the protein level (Table 1and Table S1). In addition, the expression of several othergenes and gene products involved in nucleotide metabo-lism were decreased over time in whey. This is probablydue to protracted growth and, thus, reduced requirementsfor pyrimidine nucleotides. However, in the purine biosyn-
thesis pathway, no clear downregulation was observed. Atthe mRNA level, the purine biosynthesis operon (purBCD-FHKLM and guaAB) was expressed at lower levels in thestationary growth phase than in the exponential growthphase, while the PurCDFHKLM and GuaA proteins weremore abundant at 20 h (early stationary) than at 4 h (mid-exponential) (Table 1 and Table S1). The whey mediumused here does not supply L. rhamnosus GG cells withpurines. It has previously been shown that in L. rhamno-sus GG cells grown in whey medium, during the stationaryphase, the abundance of Pur proteins is elevated com-pared with cells grown in medium rich in purines (Kosk-enniemi et al., 2009). Therefore, our results suggest thatunder the growth conditions described here, purine bio-synthesis in L. rhamnosus GG cells remains active duringthe switch from the exponential to the stationary phase.Furthermore, the identified growth phase-associatedchanges in Pur protein abundance were not associatedwith changes in the corresponding transcript levels, sug-gesting either the involvement of post-transcriptional
Fig. 4. cont.
Growth phase-associated changes in L. rhamnosus GG 757
© 2011 The AuthorsMicrobial Biotechnology © 2011 Society for Applied Microbiology and Blackwell Publishing Ltd, Microbial Biotechnology, 4, 746–766

regulation mechanisms or that these proteins have a longhalf-life.
Lipid transport and metabolism. Fatty acids are constitu-ents of phospholipids and glycolipids found in the cyto-plasmic membrane of bacteria. Our results revealed thatfatty acid biosynthetic genes (LGG_02110–02122) werestrongly repressed at the stationary-phase transition point(Table S1). Similarly, the abundance of the proteins,FabZ, FabF and FabK, which are involved in the biosyn-thesis of long-chain saturated fatty acids, were decreasedover time (Table 1). Furthermore, the level of transcriptsencoding cyclopropane-fatty-acyl-phospholipid synthase(cfa, LGG_02109), which participates in the cyclopropa-nation of fatty acids, was reduced upon entry into thestationary phase of growth (Table S1). Fatty acids areenergetically the most expensive membrane lipid compo-nents to produce, and their production is tightly regulatedto match the growth rate of bacterial cells (Zhang andRock, 2009). Therefore, our observations probably resultfrom the deceleration of the growth rate in the stationaryphase. Applying a proteome-level approach, Cohen andcolleagues (2006) observed similar downregulation ofseveral enzymes involved in lipid metabolism in L. plan-tarum during the shift from the exponential to the station-ary phase of growth.
Proteolytic systems, amino acid transportand metabolism
Lactobacillus rhamnosus GG has a limited capacity tosynthesize amino acids; therefore, it requires exogenousamino acids and peptides for growth (Kankainen et al.,2009). In this study, several components of the proteolyticsystem were identified as exhibiting growth phase-dependent induction at both the transcript and the proteinlevel, including proteinases, which degrade proteins intooligopeptides, peptide transporter systems involved in oli-gopeptide uptake, and peptidases, which degrade oli-gopeptides into shorter peptides and amino acids(reviewed by Savijoki et al., 2006). The whey mediumused in this study contains free amino acids and oligopep-tides derived from hydrolysed casein and whey proteinand probably also traces of non-hydrolysed proteins.During growth in whey medium, L. rhamnosus GG firstconsumes the accessible free amino acids and, after that,oligopeptides, which require only minimal processing toliberate the free amino acids. Expression of genes encod-ing cell-envelope proteinase PrtP, maturation protein PrtMand proteinase PrtR increased during growth of L. rham-nosus GG in whey medium until the early stationarygrowth phase, suggesting that the non-hydrolysed or par-tially hydrolysed proteins in whey medium may be utilizedafter the exhaustion of other amino acid sources (Fig. 4B,
Table S1). In protein gels, no differentially produced pro-teinases were detected. However, it is well known thathigh-molecular-weight proteins, hydrophobic proteins andproteins with extreme pI values are under-represented on2-D gels possibly explaining the lack of identification ofPrtP (206.6 kDa), PrtR (155.8 kDa) and PrtM (pI value10.3). It has previously been shown that whey-grownL. rhamnosus GG is unable to hydrolyse intact casein(Kankainen et al., 2009), and the role of the proteinases inthe utilization of intact or partially hydrolysed whey pro-teins remains to be elucidated. Consistent with our find-ings, in L. acidophilus cultivated in milk, the expression ofgenes encoding PrtP and PrtM was increased over time(Azcarate-Peril et al., 2009).
The genome of L. rhamnosus GG holds three completeoligopeptide ABC transporter operons (LGG_01652–01656, LGG_01940–01945 excluding LGG_01942, andLGG_02062–02066) (Kankainen et al., 2009). Each con-sists of five genes encoding oligopeptide-binding protein(OppA), two integral membrane proteins (OppB andOppC) and two ATP-binding proteins (OppD and OppF).Of these operons, LGG_01940–01945 was found to bedifferentially expressed at both the mRNA and proteinlevels. Expression of the whole operon at the mRNA levelwas increased until the early stationary growth phase(Fig. 4B, Table S1), and the ATPase components, OppDand OppF, were more abundant in the early stationarygrowth phase than in the mid-exponential growth phaseat the protein level, supporting the transcript results(Table 1). LGG_02062–02066 transcripts were moreabundant in the mid-exponential growth phase (4 h) thanat the 12, 16 and 31 h time points but less abundant at 4 hthan in the early stationary growth phase (20 h) (Fig. 4B,Table S1). Transcription of these genes was thereforetransient, with a short peak in the early stationary growthphase. Differential production of the corresponding pro-teins was not observed possibly because the foldchanges were below threshold value of 1.5. In addition tothe three oligopeptide-binding proteins (OppA) encodedwithin the complete Opp operons, four additional oppAgenes are present in the L. rhamnosus GG genome (Kan-kainen et al., 2009). Of these, three oppA genes weresignificantly differentially expressed in a growth phase-dependent manner (Fig. 4B, Table S1). Based on theseobservations, it could be speculated that different oli-gopeptide transport systems may have different specifici-ties, and while one Opp transporter system is active in theexponential growth phase, another might be active in thestationary phase of growth. Similar results were obtainedin a microarray study of L. acidophilus grown in milk,which showed that different Opp genes were expressed atdifferent growth stages (Azcarate-Peril et al., 2009).
At the mRNA level, the genes encoding tripeptidasePepT (LGG_00358), proline-specific aminopeptidase
758 K. Laakso et al.
© 2011 The AuthorsMicrobial Biotechnology © 2011 Society for Applied Microbiology and Blackwell Publishing Ltd, Microbial Biotechnology, 4, 746–766

PepX (LGG_01695), dipeptidase PepD (LGG_01972),aminopeptidases PepC2 (LGG_02346) and AmpS(LGG_01050) were significantly differentially expressed atdifferent growth phases (Fig. 4B, Table S1). The genecoding for PepT clustered together with the OppA-encoding gene (LGG_00359) and was maximallyexpressed in L. rhamnosus GG at the early stationaryphase of the growth curve (cluster 10 in Fig. S1). Thetranscript encoding PepX clustered together with theORFs LGG_02062–02066 (the Opp transporter system),and its expression was transiently elevated at 20 h (cluster6 in Fig. S1). The expression levels of pepD, pepC2 andampS, as well as genes involved in polyamine transport(potABCD, LGG_00969–00972), were decayed duringgrowth (Fig. 4B, Table S1). Proteomic results indicatedthat endopeptidase PepO (LGG_01478) was producedat higher levels in the early stationary cultures than inthe mid-exponential cultures while dipeptidase PepD(LGG_01158) was produced more in mid-exponential cellscompared with early stationary cells (Table 1). The samepattern was seen at the mRNA level, although it was notstatistically significant (Fig. 4B). These findings suggestthat different peptidases are utilized specifically in differentgrowth phases, probably depending on their specificitiesfor the particular peptides available at each stage.
General stress responses
Nutrient limitations activate a variety of bacterial stressresponses (reviewed by De Angelis and Gobbetti, 2004).Changes in environmental conditions also rapidly triggerstress-related proteolytic systems to cope with the accu-mulation of irreparably damaged proteins (Savijoki et al.,2006). Not surprisingly, the abundance of several stressproteins and the transcription of genes encoding stressresponsive proteins was elevated when the cells reachedthe stationary growth phase. At the mRNA level, tran-scripts encoding Clp protease subunits, ClpL and ClpE,endopeptidase subunits, HslV (ClpQ) and HslU (ClpY),and heat shock proteins, Hsp1 and Hsp3, were elevated inthe stationary phase of growth. However, genes encodinguniversal stress protein (usp) and 33 kDa chaperonin(hslO) showed their highest expression in the exponentialgrowth phase (Table S1). At the protein level, production ofthe universal stress protein, the chaperone protein GroELand the stress-inducible Clp protease complex subunitsClpC and ClpB was increased over time while the chap-erone protein DnaK and the stress-related serine proteaseHtrA were more abundant in the mid-exponential growthphase (4 h) than in the early stationary growth phase(20 h) (Table 1). The corresponding genes, groEL, clpC,clpB, dnaK and htrA, were not significantly differentiallyexpressed. As chaperone proteins are required for denovo protein folding, the expression of chaperones and
their corresponding genes in the exponential growthphase, when essential nutrients are still sufficiently avail-able, could be a response to the high protein synthesisrate. Because growth phase-associated changes in stressproteins were detectable at either the mRNA or proteinlevel, but not at both levels, it is tempting to speculate thatpost-transcriptional regulation mechanisms are involved inthe adaptation of L. rhamnosus GG to the stationarygrowth phase conditions. Recently, it has been demon-strated that most of the stress-related genes showedincreasing levels of expression in the stationary growthphase in L. acidophilus (Azcarate-Peril et al., 2009). Fur-thermore, in a proteomic study of L. plantarum WCFS1, ithas been observed that some stress proteins were highlyabundant in the late exponential and early stationarygrowth phases (ClpL and Hsp3, among others) while somewere highly abundant during the exponential growth phase(ClpP, among others) (Cohen et al., 2006). It should benoted that the earlier studies describe bacterial growthphase responses in flask culture conditions where gradualacidification of the cultures causes additional stress.These growth conditions were different from those of thepresent study where pH-controlled conditions were used.
Expression of genes mediating potential probiotic-associated traits changes over time in whey
Lactobacillus rhamnosus GG colonizes the human intes-tine and adheres efficiently to mucus and epithelial cells(Alander et al., 1997; 1999; Laparra and Sanz, 2009). Cellsurface factors, such as cell surface proteins, lipoteichoicacids (LTAs) and exopolysaccharides (EPSs), mediateadherence, biofilm formation and colonization by lactoba-cilli (reviewed by Lebeer et al., 2008). Recently, MabA(modulator of adhesion and biofilm) encoded byLGG_01865 was shown to contribute to the adhesion ofL. rhamnosus GG to the host cells (Vélez et al., 2010).Cell surface-exposed pilus, encoded by a gene clusterlocated in a genomic island unique to L. rhamnosusGG, was suggested to play a key role in the adhe-sion of L. rhamnosus GG to human intestinal mucus(Kankainen et al., 2009). Our transcriptomic resultsshowed that strain-specific pilus-encoding genes(spaCBA, LGG_00442–00444) were active in the expo-nential phase of growth, and their expression was clearlyreduced when the culture transitioned to the stationarygrowth phase (Fig. 4C, Table S1). In contrast, growthphase dependence in the expression pattern of mabAwas not observed. However, several other genes encod-ing proteins predicted to contain an adhesion domain,such as LGG_02337 (inlJ) and LGG_02274 (prtP), wereupregulated in L. rhamnosus GG cultures in the stationarygrowth phase compared with the exponential growthphase (Fig. 4C, Table S1). No changes in the correspond-
Growth phase-associated changes in L. rhamnosus GG 759
© 2011 The AuthorsMicrobial Biotechnology © 2011 Society for Applied Microbiology and Blackwell Publishing Ltd, Microbial Biotechnology, 4, 746–766

ing proteins were observed, which may be due to thehydrophobic nature or the low abundance of these pro-teins. Furthermore, pilus proteins may occur at het-eropolymeric high-molecular-weight complexes (Mandliket al., 2008) that are not detectable using 2-D DIGE. InL. lactis, cell wall-anchored PrtP has been shown to havepositive effect on cell adhesion to solid surfaces (Habi-mana et al., 2007); however, its effect on adhesion tohuman cells or mucus remains to be elucidated. Pili ofGram-positive pathogens have been extensively investi-gated and have been shown to promote bacterial adhe-sion to host cells, play a role in biofilm formation andevoke host immune responses (reviewed by Mandliket al., 2008). In L. rhamnosus GG, it has also been dem-onstrated that pili play an important role in adhesion toCaco-2 epithelial cells and in biofilm formation (Lebeeret al., 2011). In a virulent Streptococcus pneumoniaestrain, pilus genes were found to be expressed in a growthphase-dependent manner, and the regulation of pilusgenes was shown to be mediated by a two-componentsystem (Song et al., 2009). In our study, the expressionpattern of genes encoding a two-component system(LGG_02387–02388, cluster 14 in Fig. S1) was similar tothat of the pilus-encoding genes (cluster 13 in Fig. S1,Table S1), but further studies are needed to establishwhether this particular two-component system plays arole in the regulation of the pilus locus genes in L. rham-nosus GG or whether it is regulating one of the variousother functions altered during exponential growth.
The expression of genes involved in D-alanylation ofLTAs (dlt operon, LGG_00777–00780, clusters 13 and 16in Fig. S1) and most of the genes encoding enzymesrequired for EPS biosynthesis (LGG_02044–02047 andLGG_02049–02054, clusters 14 and 16 in Fig. S1) wasreduced over time in whey (Fig. 4C, Table S1). Consistentwith our findings, previous studies have demonstratedthat EPS production is growth rate-dependent (Welmanet al., 2003; 2006). In L. rhamnosus GG, EPS plays anegative role in adhesion and biofilm formation, possiblyby shielding adhesion factors such as pili (Lebeer et al.,2009). However, EPS appears to play an important rolein the protection against host defence mechanismsinvolving the innate immune system (Lebeer et al., 2010).Because the balance between adhesion properties andresistance against the host immune system seems to beof the utmost importance for the adaptation of L. rhamno-sus GG in the intestine, expression of pili and EPS bio-synthetic genes are likely to be regulated accordingly. Theproducts of the dlt operon are involved in the D-alanylationof secondary cell wall polymer LTA. D-alanyl ester substi-tutions for LTA add positive charges to otherwise nega-tively charged LTAs and, in this way, directly affect cellsurface charges (Neuhaus and Baddiley, 2003). Lebeerand colleagues (2007) have shown that D-alanyl-
substituted LTAs serve a modulatory function in the adhe-sion of L. rhamnosus GG to Caco-2 cells and in biofilmformation and activate immune responses in the host.Claes and colleagues (2010) recently showed that dele-tion of dltD resulted in a significant increase in the probi-otic efficacy of L. rhamnosus GG in a mouse model ofcolitis. Therefore, it is suggested that D-alanylation ofLTAs may play a role in the survival and persistence aswell as in the probiotic effects of L. rhamnosus GG in thehost, and our results indicate that the expression of thisprobiotic-associated factor is growth phase-dependent.
In addition to adhesion factors such as pili and InlJ,contact between L. rhamnosus GG and host cells canalso be mediated by secreted, small soluble proteins. Forinstance, secreted, low-molecular-weight proteins fromL. rhamnosus GG have been shown to promote in vitrointestinal epithelial cell homeostasis through certain sig-nalling pathways (Yan and Polk, 2002; Tao et al., 2006;Yan et al., 2007; Seth et al., 2008). Expression of a genecoding for the NLP/P60 family secreted protein, p40(LGG_00031), was reduced during growth (Fig. 4C,Table S1). In contrast, the genes LGG_00504 andLGG_00661, coding for secreted proteins of low molecu-lar mass (< 10 kDa), were strongly induced in stationary-phase cells (Fig. 4C, Table S1). Interestingly, a genelocated next to one of these small-sized soluble proteins(LGG_00503) and annotated as a myosin-cross-reactiveantigen orthologue was also highly expressed in the sta-tionary growth phase compared with the exponentialgrowth phase. None of these responses was detected atthe protein level, probably because cell surface-exposedand secreted proteins are usually hydrophobic and areprecipitated within the first dimension once they havemigrated to their isoelectric point.
Concluding remarks
Consumption of probiotic bacteria harvested at differentphases of growth has been shown to cause profoundlydifferent mucosal responses in human (van Baarlenet al., 2009). Accordingly, we assume that the expres-sion status of the genes during the industrial cultivationof a probiotic reflects its activity in the GIT. We investi-gated how gene expression, at both the transcript andprotein levels, in the probiotic bacterium, L. rhamnosusGG, changed over time during growth in industrial-typewhey medium under controlled bioreactor conditions. Inparticular, we aimed to determine whether any traits thatare associated with the probiotic activity of L. rhamnosusGG were affected during the fermentation of whey.Expression of 636 genes, many implicated in theprobiotic-linked actions of L. rhamnosus GG, and 116proteins were modulated in a growth-dependent mannerand half of the changes in protein abundance were
760 K. Laakso et al.
© 2011 The AuthorsMicrobial Biotechnology © 2011 Society for Applied Microbiology and Blackwell Publishing Ltd, Microbial Biotechnology, 4, 746–766

associated with changes in transcript levels. Most of theobserved growth phase-dependent changes at both themRNA and protein level appeared during the shift fromthe exponential growth phase to the stationary growthphase. In particular, genes and proteins involved in thegalactose utilization pathways were among the highestinduced upon entry into stationary phase. Many tran-scripts and proteins involved in central metabolic path-ways such as carbohydrate, nucleotide, lipid andpyruvate metabolism were differentially expressedduring growth in whey (Fig. 5). Differential expression ofdistinct carbohydrate utilization and energy productionpathways and several distinct PTS transportersobserved in response to changes in nutritional environ-ment (e.g. exhaustion of the preferred carbon source inthe medium) indicate that L. rhamnosus GG has a flex-ible and adaptable metabolism. This adaptability mightprovide a competitive advantage for L. rhamnosus GG inthe host’s GIT. Furthermore, expression of many genesencoding adhesion factors and secreted proteins withlow molecular masses were increased over time duringthe growth of L. rhamnosus GG in whey medium(Fig. 5), with the highest expression in the stationaryphase. The expression patterns of genes encodingmucus-binding pili and secreted protein p40 differedfrom this general pattern (Fig. 5), having the highestexpression values in the exponential phase. Like nutri-tional versatility, these adhesion and probiotic-
associated factors provide a competitive advantage forL. rhamnosus GG by promoting its survival and persis-tence in the GIT. At present, the number of probiotic-associated factors of L. rhamnosus GG that has beenidentified is still limited which makes it impossible todraw conclusions about the optimal harvesting phase forthis probiotic bacterium. However, as soon as the keymediators of probiotic traits have been identified, theresults presented here together with future studiesinvolving growth conditions mimicking those in the GITwill be instrumental for these purposes.
Experimental procedures
Growth conditions and chemical analyses
Lactobacillus rhamnosus GG (ATCC 53103) was maintainedin a laboratory culture collection as a glycerol stock at -70°Cand propagated at 37°C in MRS medium (Labema). Appro-priate dilutions of a culture grown for 17 h were plated onMRS agar and incubated anaerobically at 37°C for 3 days.Single colonies from these plates were resuspended in MRSmedium. One individual colony represented one biologicalreplicate. Cells were passaged through two sequential sub-cultures in MRS medium at 37°C for 12 h and one subculturein industrial-type whey medium containing 5% hydrolysedwhey, 0.6% casein hydrolysate and 0.0015% MnSO4·H2O at37°C for 17 h. Four Biostat Q fermentation vessels (B. BraunBiotech International) containing 750 ml of whey mediumwere inoculated at 2% (v/v) with four individual cultures of
Fig. 5. A model for physiological changes in L. rhamnosus GG during the progression of growth. Increased and decreased expression isindicated by plus symbol ‘+’ and minus symbol ‘-’ respectively.
Growth phase-associated changes in L. rhamnosus GG 761
© 2011 The AuthorsMicrobial Biotechnology © 2011 Society for Applied Microbiology and Blackwell Publishing Ltd, Microbial Biotechnology, 4, 746–766

L. rhamnosus GG. The cultures were grown at 37°C andstirred constantly (150 r.p.m. min-1). The pH was maintainedat 5.8 by automatic titration with 5% (v/v) ammonia. Tomonitor growth, samples were taken at regular intervals fromeach vessel, and their optical density at 600 nm was mea-sured. The amount of glucose, galactose and lactose in wheymedium during fermentation was determined by enzymaticmethods based on ISO 5765-1: 2002 (IDF 79-1: 2002) andISO 5765-2: 2002 (IDF 79-2: 2002) standards. Samples forRNA extraction were collected at the mid-exponential (4 h),late exponential (12 h), stationary transition point (16 h), earlystationary (20 h) and late stationary (31 h) phases (Fig. 1).Protein samples were collected at the mid-exponential (4 h),late exponential (12 h), early stationary (20 h) and late sta-tionary (28 h) phases (Fig. 1). Three parallel RNA samplesand four parallel protein samples from each sampling pointwere included in the analyses.
Transcriptomic methods
Experimental design, RNA methods, cDNA synthesis, labelingand hybridization. mRNA samples from three independentbiological replicates, i.e. from three fermentations, for eachtime point were hybridized, each sample independently, tomicroarrays according to an ANOVA design where all possibledirect pair-wise comparisons within biological replicates wereconducted. A total of 30 hybridizations were performed. Dye-swaps were carried out over biological replicate sets.
Depending on the growth stage, 1–4 ml of culture wasadded to 2–8 ml of RNAprotect Bacteria reagent (Qiagen),and the samples were processed according to the manufac-turer’s instructions. Cell pellets were stored at -70°C for laterRNA extraction. RNA was extracted and purified as describedpreviously (Koskenniemi et al., 2011).
For each sample, 5 mg of RNA was reverse transcribed tocDNA using the SuperScript Indirect cDNA Labelling System(Invitrogen) and fluorescently labelled with Cy3 or Cy5 mono-reactive dyes (Amersham Biosciences) according to previ-ously published protocols (Koskenniemi et al., 2011). Thelabelling efficiency was quantified using a NanoDropND-1000 spectrophotometer (NanoDrop Technologies), andlabelled cDNA samples were hybridized to microarraysaccording to Agilent’s procedure, ‘Two-Color Microarray-Based Gene Expression Analysis’ (http://www.agilent.com).
Scanning, image analysis and data analyses. Microarrayswere scanned at 5 mm resolution with a GenePix 4200 ALscanner (Axon Instruments). The fluorescence signal inten-sities of each feature were measured and addressed togenomic ORFs using GenePix® Pro 6.0 software (AxonInstruments/Molecular Devices Corp.) with default param-eters. The computational alignments were further improvedmanually, and features that could not be verified wereflagged.
This study was a part of a larger experiment, comprisinga total of 66 two-color microarrays, which were analysed asan entity. After pre-processing, samples involved in this par-ticular study were separated and analysed independentlyfrom the remaining data sets. All analyses were performedwith the Bioconductor package for statistical analysis usingthe R programming language (Gentleman et al., 2004). The
data were pre-processed with limma (Smyth and Speed,2003). The foreground and background median intensityestimates were corrected for the background using thenormexp-function (offset set to 50) (Ritchie et al., 2007),normalized within arrays using loess (100 iterations, suspi-cious spots and probe sequences matching multiple hits orborders of the coding regions were down weight to zero,and intergenic probe sequences were down weight to 0.1)(Smyth and Speed, 2003) and normalized between arraysusing quantile normalization (Yang and Thorne, 2003).Gene expression ratios were obtained by taking theaverage over the log2-transformed expression ratios of fea-tures describing the same gene and matching a singlegenetic coding locus. Expression ratios between conditionswere calculated using linear models implemented in limma(Smyth, 2004). Gene expression ratios were calculated for2798 genes out of the total 2944 genes predicted to beencoded by the genome (95% coverage). After pre-processing, samples involved in this study were separatedfrom the remaining samples, and the statistical significanceof the expression ratio of a gene between two conditionswas analysed using the paired t-test method implementedin CyberT (the Bayesian prior estimate of within-treatmentvariance was set to five, and the window size was set to101) (Baldi and Long, 2001). P-values were adjusted formultiple hypothesis correction using the Bonferroni methodand the number of performed t-tests in total (61 556). Sig-nificantly differentially expressed genes with at least atwofold change in expression ratio between paired timepoints were clustered in MeV version 4.3 (Saeed et al.,2006) by using the K-means clustering algorithm and aEuclidean distance metric. Data for the classification ofCOGs were obtained from Kankainen and colleagues(2009). The statistical significance of groups was assessedusing the hypergeometric distribution, and the results werecorrected with the Bonferroni method. Microarray platformand data details are available at the Gene ExpressionOmnibus (GEO platform GPL10580 and series GSE28903).
Proteomic methods
Protein extraction and CyDye labeling. Cells were harvestedfrom 1–5 ml of samples by centrifuging at +4°C and washedtwice with ice-cold 50 mM Tris-HCl pH 8 (Sigma-Aldrich).Bacterial cells were broken by bead beating (Koskenniemiet al., 2009). The protein samples were processed using aClean-up kit (GE Healthcare) and dissolved in 25–50 ml of abuffer containing 7 M urea (Sigma-Aldrich), 2 M thiourea(Sigma-Aldrich), 4% 3-[(3-Cholamidopropyl)dimethylam-monio]-1-propanesulfonate (Sigma-Aldrich) and 30 mM Tris(Bio-Rad). Protein concentrations in the samples were deter-mined using a 2-D Quant Kit (GE Healthcare).
Protein samples were adjusted to pH 8.5 by adding 2 MTris. The samples were then labelled using Cy2, Cy3 and Cy5dyes (CyDye DIGE Fluor minimal dyes; GE Healthcare),according to the Ettan™ 2-D DIGE protocol and Koskenniemiand colleagues (2009). The experiment was divided intothree parts; each time point (4 h, mid-exponential; 12 h, lateexponential; 28 h, late stationary growth state) was sepa-rately compared with the early stationary-phase (20 h) timepoint. Labelling was performed reciprocally so that both the
762 K. Laakso et al.
© 2011 The AuthorsMicrobial Biotechnology © 2011 Society for Applied Microbiology and Blackwell Publishing Ltd, Microbial Biotechnology, 4, 746–766
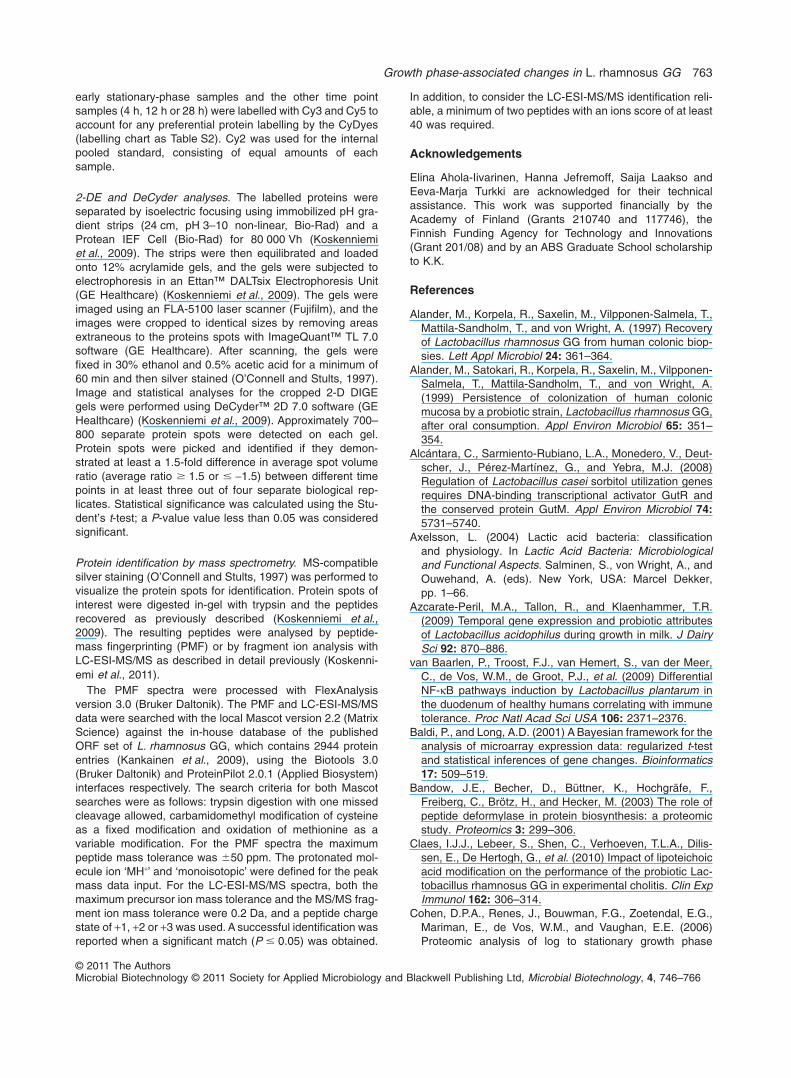
early stationary-phase samples and the other time pointsamples (4 h, 12 h or 28 h) were labelled with Cy3 and Cy5 toaccount for any preferential protein labelling by the CyDyes(labelling chart as Table S2). Cy2 was used for the internalpooled standard, consisting of equal amounts of eachsample.
2-DE and DeCyder analyses. The labelled proteins wereseparated by isoelectric focusing using immobilized pH gra-dient strips (24 cm, pH 3–10 non-linear, Bio-Rad) and aProtean IEF Cell (Bio-Rad) for 80 000 Vh (Koskenniemiet al., 2009). The strips were then equilibrated and loadedonto 12% acrylamide gels, and the gels were subjected toelectrophoresis in an Ettan™ DALTsix Electrophoresis Unit(GE Healthcare) (Koskenniemi et al., 2009). The gels wereimaged using an FLA-5100 laser scanner (Fujifilm), and theimages were cropped to identical sizes by removing areasextraneous to the proteins spots with ImageQuant™ TL 7.0software (GE Healthcare). After scanning, the gels werefixed in 30% ethanol and 0.5% acetic acid for a minimum of60 min and then silver stained (O’Connell and Stults, 1997).Image and statistical analyses for the cropped 2-D DIGEgels were performed using DeCyder™ 2D 7.0 software (GEHealthcare) (Koskenniemi et al., 2009). Approximately 700–800 separate protein spots were detected on each gel.Protein spots were picked and identified if they demon-strated at least a 1.5-fold difference in average spot volumeratio (average ratio � 1.5 or � -1.5) between different timepoints in at least three out of four separate biological rep-licates. Statistical significance was calculated using the Stu-dent’s t-test; a P-value value less than 0.05 was consideredsignificant.
Protein identification by mass spectrometry. MS-compatiblesilver staining (O’Connell and Stults, 1997) was performed tovisualize the protein spots for identification. Protein spots ofinterest were digested in-gel with trypsin and the peptidesrecovered as previously described (Koskenniemi et al.,2009). The resulting peptides were analysed by peptide-mass fingerprinting (PMF) or by fragment ion analysis withLC-ESI-MS/MS as described in detail previously (Koskenni-emi et al., 2011).
The PMF spectra were processed with FlexAnalysisversion 3.0 (Bruker Daltonik). The PMF and LC-ESI-MS/MSdata were searched with the local Mascot version 2.2 (MatrixScience) against the in-house database of the publishedORF set of L. rhamnosus GG, which contains 2944 proteinentries (Kankainen et al., 2009), using the Biotools 3.0(Bruker Daltonik) and ProteinPilot 2.0.1 (Applied Biosystem)interfaces respectively. The search criteria for both Mascotsearches were as follows: trypsin digestion with one missedcleavage allowed, carbamidomethyl modification of cysteineas a fixed modification and oxidation of methionine as avariable modification. For the PMF spectra the maximumpeptide mass tolerance was �50 ppm. The protonated mol-ecule ion ‘MH+’ and ‘monoisotopic’ were defined for the peakmass data input. For the LC-ESI-MS/MS spectra, both themaximum precursor ion mass tolerance and the MS/MS frag-ment ion mass tolerance were 0.2 Da, and a peptide chargestate of +1, +2 or +3 was used. A successful identification wasreported when a significant match (P � 0.05) was obtained.
In addition, to consider the LC-ESI-MS/MS identification reli-able, a minimum of two peptides with an ions score of at least40 was required.
Acknowledgements
Elina Ahola-Iivarinen, Hanna Jefremoff, Saija Laakso andEeva-Marja Turkki are acknowledged for their technicalassistance. This work was supported financially by theAcademy of Finland (Grants 210740 and 117746), theFinnish Funding Agency for Technology and Innovations(Grant 201/08) and by an ABS Graduate School scholarshipto K.K.
References
Alander, M., Korpela, R., Saxelin, M., Vilpponen-Salmela, T.,Mattila-Sandholm, T., and von Wright, A. (1997) Recoveryof Lactobacillus rhamnosus GG from human colonic biop-sies. Lett Appl Microbiol 24: 361–364.
Alander, M., Satokari, R., Korpela, R., Saxelin, M., Vilpponen-Salmela, T., Mattila-Sandholm, T., and von Wright, A.(1999) Persistence of colonization of human colonicmucosa by a probiotic strain, Lactobacillus rhamnosus GG,after oral consumption. Appl Environ Microbiol 65: 351–354.
Alcántara, C., Sarmiento-Rubiano, L.A., Monedero, V., Deut-scher, J., Pérez-Martínez, G., and Yebra, M.J. (2008)Regulation of Lactobacillus casei sorbitol utilization genesrequires DNA-binding transcriptional activator GutR andthe conserved protein GutM. Appl Environ Microbiol 74:5731–5740.
Axelsson, L. (2004) Lactic acid bacteria: classificationand physiology. In Lactic Acid Bacteria: Microbiologicaland Functional Aspects. Salminen, S., von Wright, A., andOuwehand, A. (eds). New York, USA: Marcel Dekker,pp. 1–66.
Azcarate-Peril, M.A., Tallon, R., and Klaenhammer, T.R.(2009) Temporal gene expression and probiotic attributesof Lactobacillus acidophilus during growth in milk. J DairySci 92: 870–886.
van Baarlen, P., Troost, F.J., van Hemert, S., van der Meer,C., de Vos, W.M., de Groot, P.J., et al. (2009) DifferentialNF-kB pathways induction by Lactobacillus plantarum inthe duodenum of healthy humans correlating with immunetolerance. Proc Natl Acad Sci USA 106: 2371–2376.
Baldi, P., and Long, A.D. (2001) A Bayesian framework for theanalysis of microarray expression data: regularized t-testand statistical inferences of gene changes. Bioinformatics17: 509–519.
Bandow, J.E., Becher, D., Büttner, K., Hochgräfe, F.,Freiberg, C., Brötz, H., and Hecker, M. (2003) The role ofpeptide deformylase in protein biosynthesis: a proteomicstudy. Proteomics 3: 299–306.
Claes, I.J.J., Lebeer, S., Shen, C., Verhoeven, T.L.A., Dilis-sen, E., De Hertogh, G., et al. (2010) Impact of lipoteichoicacid modification on the performance of the probiotic Lac-tobacillus rhamnosus GG in experimental cholitis. Clin ExpImmunol 162: 306–314.
Cohen, D.P.A., Renes, J., Bouwman, F.G., Zoetendal, E.G.,Mariman, E., de Vos, W.M., and Vaughan, E.E. (2006)Proteomic analysis of log to stationary growth phase
Growth phase-associated changes in L. rhamnosus GG 763
© 2011 The AuthorsMicrobial Biotechnology © 2011 Society for Applied Microbiology and Blackwell Publishing Ltd, Microbial Biotechnology, 4, 746–766

Lactobacillus plantarum cells and a 2-DE database. Pro-teomics 6: 6485–6493.
Cozzone, A.J. (1998) Post-translational modification ofproteins by reversible phosphorylation in prokaryotes.Biochimie 80: 43–48.
De Angelis, M., and Gobbetti, M. (2004) Environmental stressresponses in Lactobacillus: a review. Proteomics 4: 106–122.
Deepika, G., Green, R.J., Frazier, R.A., and Charalampopou-los, D. (2009) Effect of growth time on the surface andadhesion properties of Lactobacillus rhamnosus GG.J Appl Microbiol 107: 1230–1240.
Eymann, C., Becher, D., Bernhardt, J., Gronau, K., Klutzny,A., and Hecker, M. (2007) Dynamics of protein phospho-rylation on Ser/Thr/Tyr in Bacillus subtilis. Proteomics 7:3509–3526.
Francl, A.L., Thongaram, T., and Miller, M.J. (2010) The PTStransporters of Lactobacillus gasseri ATCC 33323. BMCMicrobiol 10: 77.
Gentleman, R.C., Carey, V.J., Bates, D.M., Bolstad, B., Det-tling, M., Dudoit, S., et al. (2004) Bioconductor: open soft-ware development for computational biology andbioinformatics. Genome Biol 5: R80.
Goldin, B.R., Gorbach, S.L., Saxelin, M., Barakat, S., Gualt-ieri, L., and Salminen, S. (1992) Survival of Lactobacillusspecies (strain GG) in human gastrointestinal tract. Dig DisSci 37: 121–128.
Guarino, A., Lo Vecchio, A., and Canani, R.B. (2009) Probi-otics as prevention and treatment for diarrhea. Curr OpinGastroenterol 25: 18–23.
Habimana, O., Le Goff, C., Juillard, V., Bellon-Fontaine,M.-N., Buist, G., Kulakauskas, S., and Briandet, R. (2007)Positive role of cell wall anchored proteinase PrtP in adhe-sion of lactococci. BMC Microbiol 7: 36.
Hatakka, K., Savilahti, E., Pönkä, A., Meurman, J.H., Poussa,T., Näse, L., et al. (2001) Effect of long term consumptionof probiotic milk on infections in children attending daycare centres: double blind, randomised trial. BMJ 322: 1–5.
Hojsak, I., Snovak, N., Abdovic, S., Szajewska, H., Mišak, Z.,and Kolacek, S. (2010) Lactobacillus GG in the preventionof gastrointestinal and respiratory tract infections in chil-dren who attend day care centers: a randomized, double-blind, placebo-controlled trial. Clin Nutr 29: 312–316.
Isolauri, E., Arvola, T., Sütas, Y., Moilanen, E., and Salminen,S. (2000) Probiotics in the management of atopic eczema.Clin Exp Allergy 30: 1604–1610.
Jacobsen, C.N., Rosenfeldt Nielsen, V., Hayford, A.E.,Møller, P.L., Michaelsen, K.F., Pærregaard, A., et al. (1999)Screening of probiotic activities of forty-seven strains ofLactobacillus spp. by in vitro techniques and evaluation ofthe colonization ability of five selected strains in humans.Appl Environ Microbiol 65: 4949–4956.
Kalliomäki, M., Salminen, S., Arvilommi, H., Kero, P., Koski-nen, P., and Isolauri, E. (2001) Probiotics in primary pre-vention of atopic disease: a randomised placebo-controlledtrial. Lancet 357: 1076–1079.
Kalliomäki, M., Salminen, S., Poussa, T., Arvilommi, H., andIsolauri, E. (2003) Probiotics and prevention of atopicdisease: 4-year follow-up of a randomised placebo-controlled trial. Lancet 361: 1869–1871.
Kalliomäki, M., Salminen, S., Poussa, T., and Isolauri, E.(2007) Probiotics during the first 7 years of life: acumulative risk reduction of eczema in a randomized,placebo-controlled trial. J Allergy Clin Immunol 119: 1019–1021.
Kankainen, M., Paulin, L., Tynkkynen, S., von Ossowski, I.,Reunanen, J., Partanen, P., et al. (2009) Comparativegenomic analysis of Lactobacillus rhamnosus GG revealspili containing a human-mucus binding protein. Proc NatlAcad Sci USA 106: 17193–17198.
Koistinen, K.M., Plumed-Ferrer, C., Lehesranta, S.J., Kären-lampi, S.O., and von Wright, A. (2007) Comparison ofgrowth-phase-dependent cytosolic proteomes of two Lac-tobacillus plantarum strains used in food and feed fermen-tations. FEMS Microbiol Lett 273: 12–21.
Koskenniemi, K., Koponen, J., Kankainen, M., Savijoki, K.,Tynkkynen, S., de Vos, W.M., et al. (2009) Proteome analy-sis of Lactobacillus rhamnosus GG using 2-D DIGE andmass spectrometry shows differential protein production inlaboratory and industrial-type growth media. J ProteomeRes 8: 4993–5007.
Koskenniemi, K., Laakso, K., Koponen, J., Kankainen, M.,Greco, D., Auvinen, P., et al. (2011) Proteomics and tran-scriptomics characterization of bile stress response in pro-biotic Lactobacillus rhamnosus GG. Mol Cell Proteomics10: M110.002741.
Laparra, J.M., and Sanz, Y. (2009) Comparison of in vitromodels to study bacterial adhesion to the intestinal epithe-lium. Lett Appl Microbiol 49: 695–701.
Lebeer, S., Verhoeven, T.L.A., Perea Vélez, M., Vanderley-den, J., and De Keersmaecker, S.C.J. (2007) Impact ofenvironmental and genetic factors on biofilm formation bythe probiotic strain Lactobacillus rhamnosus GG. ApplEnviron Microbiol 73: 6768–6775.
Lebeer, S., Vanderleyden, J., and De Keersmaecker, S.C.J.(2008) Genes and molecules of lactobacilli supporting pro-biotic action. Microbiol Mol Biol Rev 72: 728–764.
Lebeer, S., Verhoeven, T.L.A., Francius, G., Schoofs, G.,Lambrichts, I., Dufrêne, Y., et al. (2009) Identification of agene cluster for the biosynthesis of a long, galactose-richexopolysaccharide in Lactobacillus rhamnosus GG andfunctional analysis of the priming glycosyltransferase. ApplEnviron Microbiol 75: 3554–3563.
Lebeer, S., Vanderleyden, J., and De Keersmaecker, S.C.J.(2010) Host interactions of probiotic bacterial surface mol-ecules: comparison with commensals and pathogens. NatRev Microbiol 8: 171–184.
Lebeer, S., Claes, I.J.J., Verhoeven, T.L.A., Vanderleyden, J.,and De Keersmaecker, S.C.J. (2011) Exopolysaccharidesof Lactobacillus rhamnosus GG form a protective shieldagainst innate immune factors in the intestine. Microb Bio-technol 4: 368–374.
Macek, B., Mijakovic, I., Olsen, J.V., Gnad, F., Kumar, C.,Jensen, P.R., and Mann, M. (2007) The serine/threonine/tyrosine phosphoproteome of the model bacterium Bacillussubtilis. Mol Cell Proteomics 6: 697–707.
Macek, B., Gnad, F., Soufi, B., Kumar, C., Olsen, J.V., Mija-kovic, I., and Mann, M. (2008) Phosphoproteome analysisof E. coli reveals evolutionary conservation of bacterialSer/Thr/Tyr phosphorylation. Mol Cell Proteomics 7: 299–307.
764 K. Laakso et al.
© 2011 The AuthorsMicrobial Biotechnology © 2011 Society for Applied Microbiology and Blackwell Publishing Ltd, Microbial Biotechnology, 4, 746–766

Majamaa, H., and Isolauri, E. (1997) Probiotics: a novelapproach in the management of food allergy. J Allergy ClinImmunol 99: 179–185.
Mandlik, A., Swierczynski, A., Das, A., and Ton-That, H.(2008) Pili in Gram-positive bacteria: assembly, involve-ment in colonization and biofilm development. TrendsMicrobiol 16: 33–40.
Näse, L., Hatakka, K., Savilahti, E., Saxelin, M., Pönkä, A.,Poussa, T., et al. (2001) Effect of long-term consumption ofa probiotic bacterium, Lactobacillus rhamnosus GG, in milkon dental caries and caries risk in children. Caries Res 35:412–420.
Neuhaus, F.C., and Baddiley, J. (2003) A continuum ofanionic charge: structures and functions of D-alanyl-teichoic acids in gram-positive bacteria. Microbiol Mol BiolRev 67: 686–723.
Neves, A.R., Wietske, A.P., Kok, J., Kuipers, O.P., andSantos, H. (2005) Overview on sugar metabolism and itscontrol in Lactococcus lactis – the input from in vivo NMR.FEMS Microbiol Rev 29: 531–554.
O’Connell, K.L., and Stults, J.T. (1997) Identification ofmouse liver proteins on two-dimensional electrophoresisgels by matrix-assisted laser desorption/ionization massspectrometry of in situ enzymatic digests. Electrophoresis18: 349–359.
Ouwehand, A.C., Tuomola, E.M., Tölkkö, S., and Salminen,S. (2001) Assessment of adhesion properties of novel pro-biotic strains to human intestinal mucus. Int J Food Micro-biol 64: 119–126.
Ritchie, M.E., Silver, J., Oshlack, A., Holmes, M., Diyagama,D., Holloway, A., and Smyth, G.K. (2007) A comparison ofbackground correction methods for two-colour microar-rays. Bioinformatics 23: 2700–2707.
Saeed, A.I., Bhagabati, N.K., Braisted, J.C., Liang, W.,Sharov, V., Howe, E.A., et al. (2006) TM4 microarray soft-ware suite. Methods Enzymol 411: 134–193.
Sánchez, B., Bressollier, P., Chaignepain, S., Schmitter,J.-M., and Urdaci, M.C. (2009) Identification of surface-associated proteins in the probiotic bacterium Lactobacillusrhamnosus GG. Int Dairy J 19: 85–88.
Savijoki, K., Ingmer, H., and Varmanen, P. (2006) Proteolyticsystems of lactic acid bacteria. Appl Microbiol Biotechnol71: 394–406.
Seth, A., Yan, F., Polk, D.B., and Rao, R.K. (2008) Probioticsameliorate the hydrogen peroxide-induced epithelialbarrier disruption by a PKC- and MAP kinase-dependentmechanism. Am J Physiol Gastrointest Liver Physiol 294:G1060–G1069.
Smyth, G.K. (2004) Linear models and empirical bayesmethods for assessing differential expression inmicroarray experiments. Stat Appl Genet Mol Biol 3: Article3.
Smyth, G.K., and Speed, T. (2003) Normalization of cDNAmicroarray data. Methods 31: 265–273.
Song, X.-M., Connor, W., Hokamp, K., Babiuk, L.A., andPotter, A.A. (2009) The growth phase-dependent regula-tion of the pilus locus genes by two-component systemTCS08 in Streptococcus pneumoniae. Microb Pathog 46:28–35.
Soufi, B., Gnad, F., Jensen, P.R., Petranovic, D., Mann, M.,Mijakovic, I., and Macek, B. (2008) The Ser/Thr/Tyr
phosphoproteome of Lactococcus lactis IL1403 revealsmultiply phosphorylated proteins. Proteomics 8: 3486–3493.
Szajewska, H., Kotowska, M., Mrukowicz, J.Z., Armanska,M., and Mikolajczyk, W. (2001) Efficacy of LactobacillusGG in prevention of nosocomial diarrhea in infants.J Pediatr 138: 361–365.
Szajewska, H., Skórka, A., Ruszczynski, M., andGieruszczak-Białek, D. (2007) Meta-analysis: Lactobacil-lus rhamnosus GG for treating acute diarrhoea in children.Aliment Pharmacol Ther 25: 871–881.
Tao, Y., Drabik, K.A., Waypa, T.S., Musch, M.W., Alverdy,J.C., Schneewind, O., et al. (2006) Soluble factors fromLactobacillus GG activate MAPKs and induce cytoprotec-tive heat shock proteins in intestinal epithelial cells. Am JPhysiol Cell Physiol 290: C1018–C1030.
Tuomola, E.M., Ouwehand, A.C., and Salminen, S.J.(2000) Chemical, physical and enzymatic pre-treat-ments of probiotic lactobacilli alter their adhesion to humanintestinal mucus glycoproteins. Int J Food Microbiol 60:75–81.
Vélez, M.P., Petrova, M.I., Lebeer, S., Verhoeven, T.L., Claes,I., Lambrichts, I., et al. (2010) Characterization of MabA, amodulator of Lactobacillus rhamnosus GG adhesion andbiofilm formation. FEMS Immunol Med Microbiol 59: 386–398.
Welman, A., Maddox, I., and Archer, R. (2003) Exopolysac-charide and extracellular metabolite production by Lacto-bacillus delbrueckii subsp. bulgaricus, grown on lactose incontinuous culture. Biotechnol Lett 25: 1515–1520.
Welman, A.D., Maddox, I.S., and Archer, R.H. (2006)Metabolism associated with raised metabolic flux to sugarnucleotide precursors of exopolysaccharides in Lactobacil-lus delbrueckii subsp. bulgaricus. J Ind Microbiol Biotech-nol 33: 391–400.
Yan, F., and Polk, D.B. (2002) Probiotic bacterium preventscytokine-induced apoptosis in intestinal epithelial cells.J Biol Chem 277: 50959–50965.
Yan, F., Cao, H., Cover, T.L., Whitehead, R., Washington,M.K., and Polk, D.B. (2007) Soluble proteins produced byprobiotic bacteria regulate intestinal epithelial cell survivaland growth. Gastroenterology 132: 562–575.
Yang, Y.H., and Thorne, N.P. (2003) Normalization for two-color cDNA microarray data. In Science and Statistics: AFestschrift for Terry Speed. Goldstein, D.R. (ed.). Beach-wood, OH, USA: Institute of Mathematical Statistics,pp. 403–418.
Zhang, Y.-M., and Rock, C.O. (2009) Transcriptional regula-tion in bacterial membrane lipid synthesis. J Lipid Res 50:S115–S119.
Supporting information
Additional Supporting Information may be found in the onlineversion of this article:
Fig. S1. K-means clustering of transcriptomic expressionprofiles. Significant changes in gene expression are repre-sented as log2 intensity ratio values between paired timepoints. Genes were grouped into 16 clusters using a Euclid-ean distance metric, and the analysis included 636 genes in
Growth phase-associated changes in L. rhamnosus GG 765
© 2011 The AuthorsMicrobial Biotechnology © 2011 Society for Applied Microbiology and Blackwell Publishing Ltd, Microbial Biotechnology, 4, 746–766
total. The purple expression profile in each cluster representsthe cluster median.Fig. S2. Representative 2-D DIGE images of proteinsextracted from different growth phases: (A) 4 h and 20 h,(B) 12 h and 20 h and (C) 20 h and 28 h. The total amountof protein used for CyDye labelling was 105 mg. The num-bered protein spots were cut from silver-stained 2-D DIGEgels and subjected to MS or MS/MS identification. Proteinspots that were more abundant at time point 20 h areshown in red and those more abundant at time points 4 h,12 h or 28 h are shown in green. The protein spots with nodifference in abundance between the treatments areyellow.Table S1. Log2 ratio values of significantly (P � 0.01) differ-entially expressed genes with at least a twofold change in theexpression ratio between paired time points. Clusters refer toFig. S1.
Table S2. Set-up of the DIGE experiments. Letters A–D referto biological replicate samples. Gels 1–4, 5–8 and 9–12 eachform a separate DIGE experiment.Table S3. Proteins with differing abundance between themid-exponential (4 h) and early stationary (20 h) growthphases.Table S4. Proteins with differing abundance between the lateexponential (12 h) and early stationary (20 h) growth phases.Table S5. Proteins with differing abundance between theearly stationary (20 h) and late stationary (28 h) growthphases.
Please note: Wiley-Blackwell are not responsible for thecontent or functionality of any supporting materials suppliedby the authors. Any queries (other than missing material)should be directed to the corresponding author for thearticle.
766 K. Laakso et al.
© 2011 The AuthorsMicrobial Biotechnology © 2011 Society for Applied Microbiology and Blackwell Publishing Ltd, Microbial Biotechnology, 4, 746–766
Copyright © 2022 FDOKUMEN


![[ATR] Harmony In Turkana: A Case Of Faith Suffix gg Faith Root](https://static.fdokumen.com/doc/165x107/6325a4ed852a7313b70e9908/atr-harmony-in-turkana-a-case-of-faith-suffix-gg-faith-root.jpg)