Molecular Characterization of a Phage-Encoded Resistance System in Lactococcus lactis
Upload
independentCategory
view
0download
0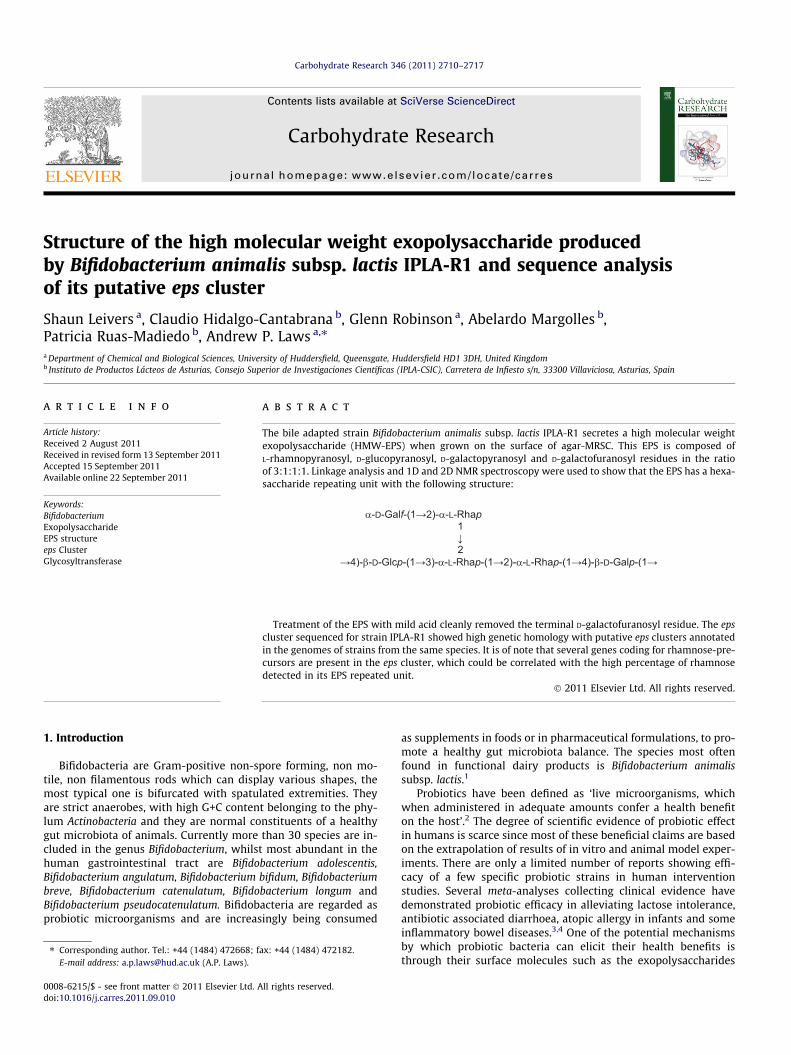
Carbohydrate Research 346 (2011) 2710–2717
Contents lists available at SciVerse ScienceDirect
Carbohydrate Research
journal homepage: www.elsevier .com/locate /carres
Structure of the high molecular weight exopolysaccharide producedby Bifidobacterium animalis subsp. lactis IPLA-R1 and sequence analysisof its putative eps cluster
Shaun Leivers a, Claudio Hidalgo-Cantabrana b, Glenn Robinson a, Abelardo Margolles b,Patricia Ruas-Madiedo b, Andrew P. Laws a,⇑a Department of Chemical and Biological Sciences, University of Huddersfield, Queensgate, Huddersfield HD1 3DH, United Kingdomb Instituto de Productos Lácteos de Asturias, Consejo Superior de Investigaciones Científicas (IPLA-CSIC), Carretera de Infiesto s/n, 33300 Villaviciosa, Asturias, Spain
a r t i c l e i n f o a b s t r a c t
Article history:Received 2 August 2011Received in revised form 13 September 2011Accepted 15 September 2011Available online 22 September 2011
Keywords:BifidobacteriumExopolysaccharideEPS structureeps ClusterGlycosyltransferase
0008-6215/$ - see front matter � 2011 Elsevier Ltd. Adoi:10.1016/j.carres.2011.09.010
⇑ Corresponding author. Tel.: +44 (1484) 472668; fE-mail address: [email protected] (A.P. Laws).
The bile adapted strain Bifidobacterium animalis subsp. lactis IPLA-R1 secretes a high molecular weightexopolysaccharide (HMW-EPS) when grown on the surface of agar-MRSC. This EPS is composed ofL-rhamnopyranosyl, D-glucopyranosyl, D-galactopyranosyl and D-galactofuranosyl residues in the ratioof 3:1:1:1. Linkage analysis and 1D and 2D NMR spectroscopy were used to show that the EPS has a hexa-saccharide repeating unit with the following structure:
Treatment of the EPS with mild acid cleanly removed the terminal D-galactofuranosyl residue. The epscluster sequenced for strain IPLA-R1 showed high genetic homology with putative eps clusters annotatedin the genomes of strains from the same species. It is of note that several genes coding for rhamnose-pre-cursors are present in the eps cluster, which could be correlated with the high percentage of rhamnosedetected in its EPS repeated unit.
� 2011 Elsevier Ltd. All rights reserved.
1. Introduction
Bifidobacteria are Gram-positive non-spore forming, non mo-tile, non filamentous rods which can display various shapes, themost typical one is bifurcated with spatulated extremities. Theyare strict anaerobes, with high G+C content belonging to the phy-lum Actinobacteria and they are normal constituents of a healthygut microbiota of animals. Currently more than 30 species are in-cluded in the genus Bifidobacterium, whilst most abundant in thehuman gastrointestinal tract are Bifidobacterium adolescentis,Bifidobacterium angulatum, Bifidobacterium bifidum, Bifidobacteriumbreve, Bifidobacterium catenulatum, Bifidobacterium longum andBifidobacterium pseudocatenulatum. Bifidobacteria are regarded asprobiotic microorganisms and are increasingly being consumed
ll rights reserved.
ax: +44 (1484) 472182.
as supplements in foods or in pharmaceutical formulations, to pro-mote a healthy gut microbiota balance. The species most oftenfound in functional dairy products is Bifidobacterium animalissubsp. lactis.1
Probiotics have been defined as ‘live microorganisms, whichwhen administered in adequate amounts confer a health benefiton the host’.2 The degree of scientific evidence of probiotic effectin humans is scarce since most of these beneficial claims are basedon the extrapolation of results of in vitro and animal model exper-iments. There are only a limited number of reports showing effi-cacy of a few specific probiotic strains in human interventionstudies. Several meta-analyses collecting clinical evidence havedemonstrated probiotic efficacy in alleviating lactose intolerance,antibiotic associated diarrhoea, atopic allergy in infants and someinflammatory bowel diseases.3,4 One of the potential mechanismsby which probiotic bacteria can elicit their health benefits isthrough their surface molecules such as the exopolysaccharides

S. Leivers et al. / Carbohydrate Research 346 (2011) 2710–2717 2711
(EPSs). These biopolymers are exocellular carbohydrates that canbe: covalently linked to bacterial surface forming a capsule; theycan be non-covalently associated with the surface or be totally se-creted. Using in vitro experiments, several health benefits havebeen attributed directly to EPS, such as cholesterol lowering capa-bility, prebiotic effect and modulation of the immune response.5
Bifidobacteria isolated from human intestinal origin are able tosynthesise EPS composed of more than one type of monosaccha-ride.6,7 Regarding the putative role of EPS produced by bifidobacte-ria in the gut environment, it has been reported that bile saltsinduce their synthesis in some strains of B. animalis subsp. animal-is.8 Thereby, it seems that these polymers could have a protectiverole for the producing bacteria. This property is interesting for or-ally delivered strains since it could help bifidobacteria to survivethe challenges, mainly acidic conditions and high concentrationof bile salts that they will encounter on their transit from themouth to the small intestine. In the large intestine, EPS-producingbifidobacteria will meet a complex ecosystem inhabited by a vastnumber of microorganisms. Salazar et al. have reported that anumber EPS isolated from bifididobacteria have an ability toin vitro modulate the composition of human intestinal microbiota.9
A similar effect has been recently shown in vivo using rats fed withthe EPS-producing strain B. animalis subsp. lactis IPLA-R1.10 Addi-tionally, the EPS produced by this strain was able to in vitro coun-teract the cytotoxic effect of bacterial toxins upon colonocyte-likeCaco-2 cells. This EPS-fraction was analysed by size exclusionchromatography coupled with multi-angle laser light scatteringdetection (SEC-MALLS) and it was found to be made up from adistribution of three molecular weight peaks.11
Whilst there are a number of reports of EPS producing bifido-bacteria, very little work has been undertaken to fully characterisethe EPS that they produce, as well as their genetic determinants.The structures of the EPS produced by B. bifidum BIM B-46512
and B. longum JBL0513 both of human origin, have recently been re-ported. To date only a limited number of studies have been under-taken describing the functional characterisation of genes coding for
Figure 1. 500 MHz 1H NMR spectrum of the HMW-EPS obtained after separation of crudat 70 �C. Inset shows an expanded plot of the anomeric region.
enzymes involved in EPS-synthesis in Bifidobacterium.14,15 A recentcomparative analysis of bifidobacterial genomes shows that thepresence of putative eps clusters seems to be a ubiquitous charac-ter in this genus.16 Thereby, the aim of this study was to analysethe structure of the EPS produced by B. animals subsp. lactis IPLA-R1, a promising strain with probiotic potential, and to analysethe sequence of the putative eps cluster coding for proteins in-volved in the synthesis of this polysaccharide.
2. Results and discussion
2.1. Structure of the HMW-EPS polymer synthesised by strainIPLA-R1
The crude-EPS sample purified from B. animals subsp. lactis IPLA-R1 had a protein content of 3.9% and the molecular weight distribu-tion was similar to that previously reported by SEC-MALLS11: a highmolecular weight fraction (HMW) with average molecular weightof 3.5 � 106 Da, a middle weight EPS (3.0 � 104 Da) and a lowmolecular weight EPS (4.9 � 103 Da). Dialysis of the crude-EPSsample against a 100 kDa cellulose acetate membrane separatedthe HWM-EPS, which was isolated in the retentate with reasonablepurity. By SEC-MALLS separation, the weight average molecularweight of the HMW-EPS in the retentate was measured as3.5 � 106 Da. The purity of the HMW-EPS was also determined byexamination of the anomeric region of the NMR spectra of theEPS after dialysis (Fig. 1), only a small amount of additional material(assumed to be middle weight EPS) was present. Six anomeric pro-tons appear in the anomeric region of the 1H NMR spectrum of theHMW-EPS suggesting that the repeating unit is a hexasaccharide;from this point forward, the anomeric signals of the individualmonomers are arbitrarily labelled as A to F, in decreasing order oftheir chemical shifts.
The results of monomer analysis and determination of theabsolute configuration of the monomers indicate that the polysac-charide is composed of L-rhamnose, D-galactose and D-glucose in
e-EPS by dialysis in a 100 kDa cellulose acetate membrane; spectra recorded in D2O

2712 S. Leivers et al. / Carbohydrate Research 346 (2011) 2710–2717
a molar ratio of 2.85:1.97:1. After performing linkage analysis,five unique methylated alditol acetates were obtained including:a 1,4,5-tri-O-acetyl-2,3,6-tri-O-methylglucitol (from 1,4-Glcp); a1,4,5-tri-O-acetyl-2,3,6-tri-O-methylgalactitol (from 1,4-Galp); a 1,2,5-tri-O-acety-3,4-di-O-methylrhamnitol (from 1,2-Rhap); a 1,2,3,5-tetra-O-acetyl-4-O-methylrhamnitol (from 1,2,3- Rhap); and a1,4-di-O-acetyl-2,3,5,6-tetra-O-methylgalactitol (from t-Galf).
The structure of the HMW-EPS was determined using the re-sults of the linkage analysis and by inspection of a range of 1Dand 2D NMR spectra including: 1H–1H COSY; 1H–1H TOCSY;1H–13C HMBC; 1H–13C HSQC (coupled and uncoupled) and1H–13C HSQC-TOCSY spectra. The first thing to note is the anomericconfiguration of each of the monomers, for monomers A to D thiswas determined by measurement of the magnitude of the 1JC–H
coupling constant for the anomeric signals determined using thecoupled HSQC spectrum; A (173 Hz), B (175 Hz), C (176 Hz) andD (175 Hz) these values are all greater than 170 Hz and identifieseach as having -linkages. The anomeric configuration of the tworemaining monomers (E and F) was determined by measurementof the 3JH1–H2 coupling constants which were both greater than8 Hz identifying that E and F residues have b-linkages.
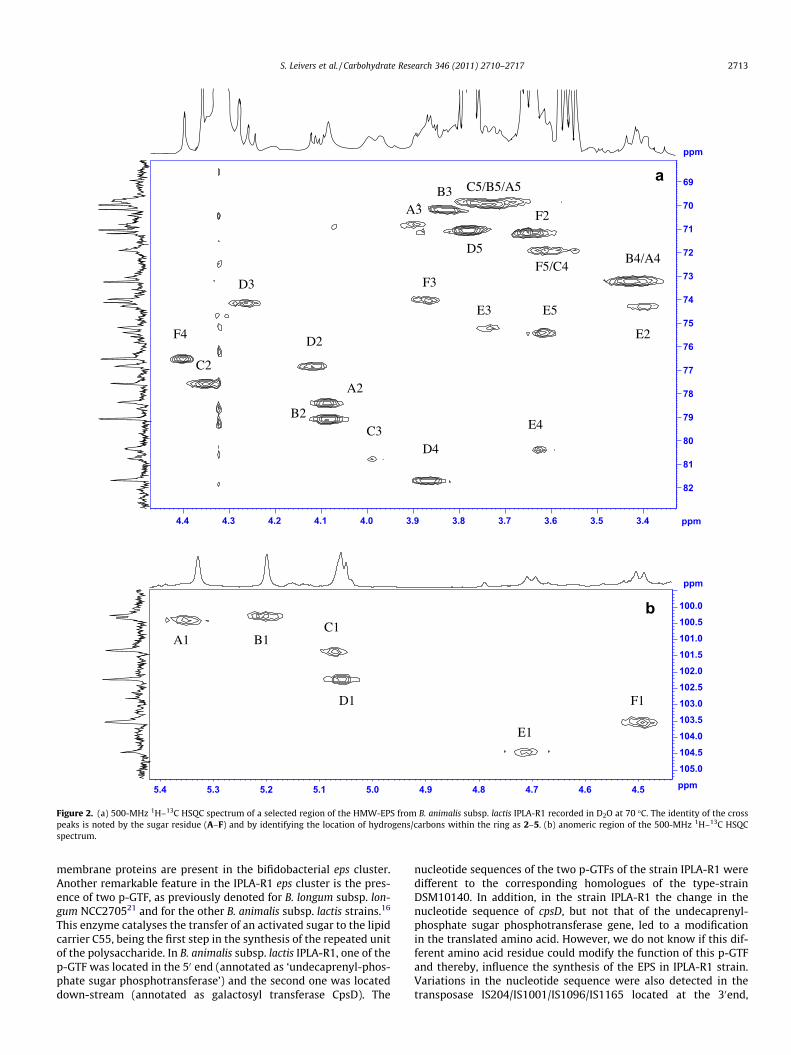
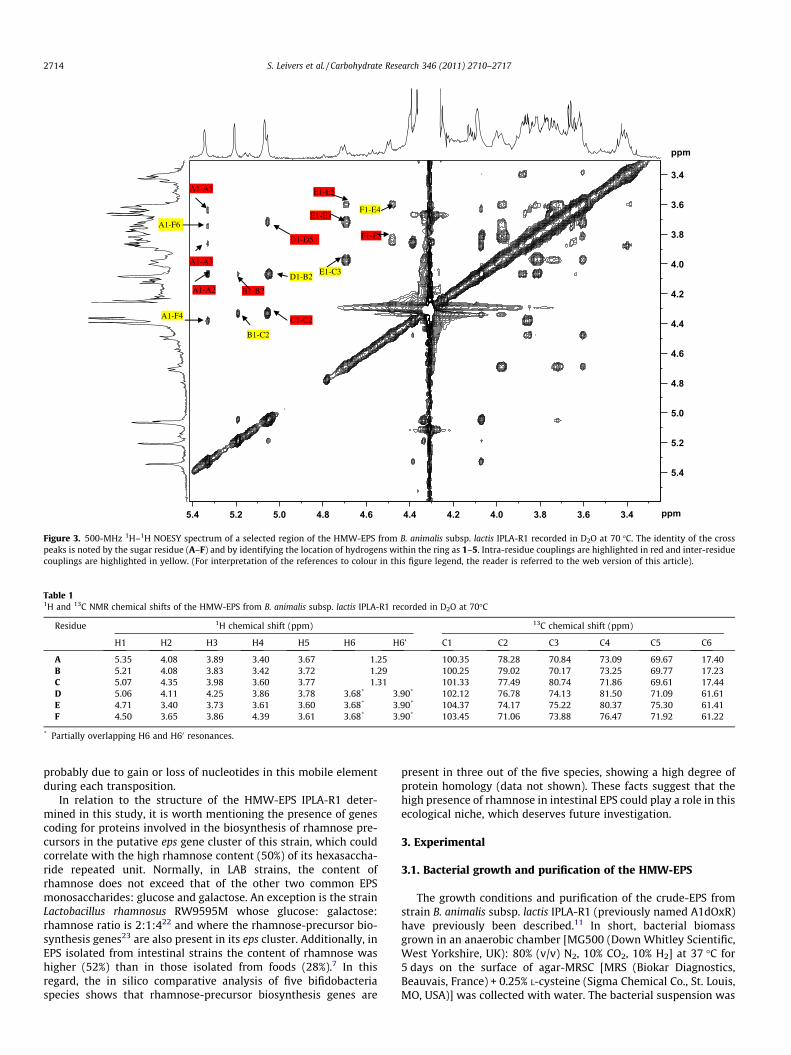
The position of the remaining proton resonances (H-2 to H-6)was determined using a combination of the COSY and TOCSY spec-tra. On the 1H–1H TOCSY spectrum (120 ms, data not shown) thereare cross peaks from the anomeric protons of residues A, B and C toH-4 and, in the methyl region, from H-6 to H-3, identifying A, B andC as the rhamnose monomers. For residues D, E and F cross peakson the COSY and TOCSY spectra identified the positions of H-1through to H-4. The exact positions of H-5 and H-6 were not easilydetermined as there is poor transmission of coupling beyond H-4.The position of the remaining resonances was obtained frominspection of a 13C Dept spectrum and from the HQSC spectrum.On the 13C Dept spectrum, the C-6 resonances are located togetherat approximately 60 ppm. Once all the cross-peaks on the HSQCspectrum for C1/H1 to C4/H4 and for C6/6 had been assigned(Fig. 2) the three remaining cross-peaks must be those belongingto C/H-5s. Finally, these were assigned to individual monomersby cross reference to a HSQC-TOCSY spectrum. As the structuredoes not have any glycosidic links involving the hydroxyls at C6,our failure to assign the individual H-6 residues to D, E and F hasno consequence for the characterisation of the EPS. For clarity,the resonance position for the 1H signals and 13C signals (H2 toH5 and C2 to C5) are indicated on the 1H–13C HSQC spectrum(Fig. 2a, anomeric signals appear on the inset Fig. 2b) the anomericproton resonances are also indicated on the 1H–1H NOESY spec-trum (Fig. 3) and the combined chemical shift data for the com-plete repeating unit are presented in Table 1.
The very low field chemical shift values for H-2 and H-3 reso-nances of residue D, combined with the loss of this residue undermildly acidic conditions (see discussion below), are evidence forresidue D being the terminal Galf. This would leave residues Eand F as the 1?4 linked hexoses. One way of differentiating be-tween galacto- and glucopyranoses is from inspection of the chem-ical shifts for their H-4 resonances: for a galactose H-4 is shiftedsubstantially to lower field than that of glucose, regardless of theanomeric configuration and linkage. Data collected from assign-ments for lactic acid bacteria (LAB) EPS structures show that theH-4 resonances for galactose lie in the range 4.30–3.85 d whilstthose for glucose lie in the range 3.45–3.75 d.17 The chemical shiftfor E H-4 (3.61) and that for F H-4 (4.39) implies that E is the glu-copyranose sugar and F is the galactopyranose; the chemical shiftfor F H-4 is high but consistent with F having a glycosidic link atposition 4 (see discussion below).
Information regarding the sequence of the sugar residues in therepeating unit was obtained from examination of the NOESY spec-trum (Fig. 3) and the anomeric region of the HMBC spectrum
(Fig. 4). On the NOESY spectrum there are strong inter-residueNOEs between: A H-1 and F H-4, B H-1 and C H-2, D H-1 and BH-2, E H-1 and C H-3, and F H-1 and E H-4; identifying A(1?4)F,B(1?2)C, D(1?2)B, E(1?3)C and F(1?4)E linkages. On the HMBCspectrum inter-residue couplings are observed between: A H-1 andF C-4, B H-1 and C C-2, and D H-1 and B C-2, matching the NOEsignals and, additionally, a weak cross peak is observed betweenC H-1 and A C-2 (Fig. 4).
Using a combination of the results for the linkage analysis andthe interpretation of the NMR identifies the structure for therepeating unit as:
This is a novel structure and differs from those of the EPS structuresthat have been reported for B. bifidum BIM B-46512 and B. longumJBL0513 and is also different to the EPSs that have been isolatedand characterised from LAB.17
2.2. Mild acid catalysed hydrolysis of the HMW EPS
It is well known that glycosidic links to Galf residues are hydro-lysed in acidic solution.18 Treatment of the HMW-EPS with a dilutesolution of trifluroacetic acid in an NMR tube caused the loss of theGalf residue which we were able to monitor over time (Fig. 5).Within a period of 8 h the anomeric signal, from residue D, reducedin intensity and ultimately merged with the spectral noise. Itseems that the EPS IPLA-R1 could have a protective role duringthe transit of the producing bacteria through the upper part ofthe intestinal tract.10 However, in the in vivo situation this Galf res-idue could be either partially or totally lost. Thereby, care will beneeded in attempting to correlate EPS structure with biologicalactivity measured in vitro, since the passage through the gastroin-testinal tract could modify its composition.
2.3. Putative eps cluster of B. animalis subps. lactis IPLA-R1
A fragment of 54,259 bp containing the putative eps cluster ofthe strain B. animalis subsp. lactis IPLA-R1 was sequenced and theputative function of coded proteins has been studied by homologycomparison with sequences held in the GenBank database. A highgenetic homology was detected among the putative eps cluster ofour strain IPLA-R1 and those of the five B. animalis subsp. lactiswhose genomes are currently available (data not shown). As ex-pected, the functional maps were almost identical among the sixstrains; this was not surprising since it has been shown that thereis a scarce inter-strain genetic variability within this Bifidobacte-rium species.19
The best characterised eps clusters, either by homology compar-ison or by functional studies, are those of LAB and, in fact, a func-tional structure has been found among these clusters.20 Taking intoaccount this functional structure, several proteins involved in thesynthesis of EPS have been found in the eps cluster of B. animalissubp. lactis IPLA-R1 (Fig. 6). This is the case of glycosyltransferases(GTF), priming-GTF (p-GTF), genes involved in export of repeatedunit, its polymerisation and chain length determination, as wellas mobile elements (transposase and insertion sequences (IS)).However, no gene regulators have been found although this func-tion could be played by proteins with unknown function within thecluster or others outside it. It is also surprising that a number of
a
b
ppm
3.43.53.63.73.83.94.04.14.24.34.4 ppm
69
70
71
72
73
74
75
76
77
78
79
80
81
82
ppm
4.54.64.74.84.95.05.15.25.35.4 ppm
100.0100.5101.0101.5102.0102.5103.0103.5104.0104.5105.0
F5/C4
C5/B5/A5
A2
D2
C3
E3
D4
B4/A4
B2
D3 F3
F4
C2
E4
E5
A3B3
E2
D5
F2
C1
D1
A1 B1
E1
F1
Figure 2. (a) 500-MHz 1H–13C HSQC spectrum of a selected region of the HMW-EPS from B. animalis subsp. lactis IPLA-R1 recorded in D2O at 70 �C. The identity of the crosspeaks is noted by the sugar residue (A–F) and by identifying the location of hydrogens/carbons within the ring as 2–5. (b) anomeric region of the 500-MHz 1H–13C HSQCspectrum.
S. Leivers et al. / Carbohydrate Research 346 (2011) 2710–2717 2713
membrane proteins are present in the bifidobacterial eps cluster.Another remarkable feature in the IPLA-R1 eps cluster is the pres-ence of two p-GTF, as previously denoted for B. longum subsp. lon-gum NCC270521 and for the other B. animalis subsp. lactis strains.16
This enzyme catalyses the transfer of an activated sugar to the lipidcarrier C55, being the first step in the synthesis of the repeated unitof the polysaccharide. In B. animalis subsp. lactis IPLA-R1, one of thep-GTF was located in the 50 end (annotated as ‘undecaprenyl-phos-phate sugar phosphotransferase’) and the second one was locateddown-stream (annotated as galactosyl transferase CpsD). The
nucleotide sequences of the two p-GTFs of the strain IPLA-R1 weredifferent to the corresponding homologues of the type-strainDSM10140. In addition, in the strain IPLA-R1 the change in thenucleotide sequence of cpsD, but not that of the undecaprenyl-phosphate sugar phosphotransferase gene, led to a modificationin the translated amino acid. However, we do not know if this dif-ferent amino acid residue could modify the function of this p-GTFand thereby, influence the synthesis of the EPS in IPLA-R1 strain.Variations in the nucleotide sequence were also detected in thetransposase IS204/IS1001/IS1096/IS1165 located at the 30end,
ppm
3.43.63.84.04.24.44.64.85.05.25.4 ppm
3.4
3.6
3.8
4.0
4.2
4.4
4.6
4.8
5.0
5.2
5.4
E1-C3
B1-C2
A1-F4
E1-E5
E1-E3
F1-F3
C1-C2
D1-B2
A1-A2 B1-B2
A1-A3
A1-A5
D1-D5
A1-F6
F1-E4
Figure 3. 500-MHz 1H–1H NOESY spectrum of a selected region of the HMW-EPS from B. animalis subsp. lactis IPLA-R1 recorded in D2O at 70 �C. The identity of the crosspeaks is noted by the sugar residue (A–F) and by identifying the location of hydrogens within the ring as 1–5. Intra-residue couplings are highlighted in red and inter-residuecouplings are highlighted in yellow. (For interpretation of the references to colour in this figure legend, the reader is referred to the web version of this article).
Table 11H and 13C NMR chemical shifts of the HMW-EPS from B. animalis subsp. lactis IPLA-R1 recorded in D2O at 70�C
Residue 1H chemical shift (ppm) 13C chemical shift (ppm)
H1 H2 H3 H4 H5 H6 H6’ C1 C2 C3 C4 C5 C6
A 5.35 4.08 3.89 3.40 3.67 1.25 100.35 78.28 70.84 73.09 69.67 17.40B 5.21 4.08 3.83 3.42 3.72 1.29 100.25 79.02 70.17 73.25 69.77 17.23C 5.07 4.35 3.98 3.60 3.77 1.31 101.33 77.49 80.74 71.86 69.61 17.44D 5.06 4.11 4.25 3.86 3.78 3.68* 3.90* 102.12 76.78 74.13 81.50 71.09 61.61E 4.71 3.40 3.73 3.61 3.60 3.68* 3.90* 104.37 74.17 75.22 80.37 75.30 61.41F 4.50 3.65 3.86 4.39 3.61 3.68* 3.90* 103.45 71.06 73.88 76.47 71.92 61.22
* Partially overlapping H6 and H60 resonances.
2714 S. Leivers et al. / Carbohydrate Research 346 (2011) 2710–2717
probably due to gain or loss of nucleotides in this mobile elementduring each transposition.
In relation to the structure of the HMW-EPS IPLA-R1 deter-mined in this study, it is worth mentioning the presence of genescoding for proteins involved in the biosynthesis of rhamnose pre-cursors in the putative eps gene cluster of this strain, which couldcorrelate with the high rhamnose content (50%) of its hexasaccha-ride repeated unit. Normally, in LAB strains, the content ofrhamnose does not exceed that of the other two common EPSmonosaccharides: glucose and galactose. An exception is the strainLactobacillus rhamnosus RW9595M whose glucose: galactose:rhamnose ratio is 2:1:422 and where the rhamnose-precursor bio-synthesis genes23 are also present in its eps cluster. Additionally, inEPS isolated from intestinal strains the content of rhamnose washigher (52%) than in those isolated from foods (28%).7 In thisregard, the in silico comparative analysis of five bifidobacteriaspecies shows that rhamnose-precursor biosynthesis genes are
present in three out of the five species, showing a high degree ofprotein homology (data not shown). These facts suggest that thehigh presence of rhamnose in intestinal EPS could play a role in thisecological niche, which deserves future investigation.
3. Experimental
3.1. Bacterial growth and purification of the HMW-EPS
The growth conditions and purification of the crude-EPS fromstrain B. animalis subsp. lactis IPLA-R1 (previously named A1dOxR)have previously been described.11 In short, bacterial biomassgrown in an anaerobic chamber [MG500 (Down Whitley Scientific,West Yorkshire, UK): 80% (v/v) N2, 10% CO2, 10% H2] at 37 �C for5 days on the surface of agar-MRSC [MRS (Biokar Diagnostics,Beauvais, France) + 0.25% L-cysteine (Sigma Chemical Co., St. Louis,MO, USA)] was collected with water. The bacterial suspension was

Figure 4. 500-MHz 1H–13C HMBC spectrum of a selected region of the HMW-EPS from B. animalis subsp. lactis IPLA-R1 recorded in D2O at 70 �C. The identity of the crosspeaks is noted by the sugar residue (A–D) and by identifying the location of hydrogens within the ring as 1–5. Intra-residue couplings are highlighted in red and inter-residuecouplings are highlighted in yellow. (For interpretation of the references to colour in this figure legend, the reader is referred to the web version of this article).
S. Leivers et al. / Carbohydrate Research 346 (2011) 2710–2717 2715
mixed with 1 volume of 2 M NaOH and the crude-EPS from thecell-free supernatant was precipitated with 2 volumes of chilled-absolute ethanol for 48 h at 4 �C. The precipitated fraction wasresuspended in ultra-pure water, dialysed in 12–14 kDa MWCOcellulose membranes (Sigma) against water for 3 days at 4 �C andfinally freeze-dried to obtain the EPS-crude fraction.
A pure sample of the high molecular weight (HMW)-EPS fromthe crude-EPS fraction isolated from B. animals subsp. lactis IPLA-R1 was obtained by dialysis as follows: a crude-EPS sample(25 mg) was dissolved in distilled water (10 mL) with gentle heat-ing (less than 50 �C) and the HMW material was isolated in theretentate (about 10 mL), after dialysis (Spectra/Por Float-A-Lyser100 kDa MWCO, Sigma) for 72 h at 4 �C against three changes ofdistilled water per day. The contents of the dialysis membranewere freeze dried to provide HMW-EPS.
The purity of the HMW-EPS was determined by SEC-MALLS andNMR analysis. For SEC-MALLS, solutions of EPS in deionised water(1 mg mL�1) were prepared and left for 24 h to completely dis-solve. Samples (100 ll) were injected onto an analytical SEC sys-tem comprising three columns Aquagel-OH 40, 50 and 60 (15 lmparticle size, 25 cm � 4 mm, Varian, Oxford, UK) connected in ser-ies. The neutral analytes were eluted with deionised water flowingat 1 mL min�1. The concentration of the EPS fractions eluting fromthe column were determined by a differential refractometer (Opti-lab rEX, Wyatt technology, Santa Barbara, USA, fitted with 16 pho-todetectors at different angles) and the weight average molecularweight was measured using a Dawn-EOS MALLS operating with a690 nm laser (Wyatt technology, Santa Barbara) The Astra softwarewas used to analyse the light scattering data using the Zimmmethod.
3.2. Monomer composition and linkages of the HMW-EPS
The monomer composition of the HMW-EPS was determinedafter acid hydrolysis. The HMW-EPS (1 mg mL�1) was treated with2 M TFA (120 �C for 2 h) and the identity of the released monomerswas determined using high performance anion exchange chroma-tography (HPAEC) on a Dionex BioLC system (Sunnyvale CA, USA)equipped with a CarboPac PA20 column (150 mm � 3 mm). Mono-mers were eluted using a 10 mM sodium hydroxide mobile phaseat a flow rate of 0.5 mL min�1 and detected using a pulsed amper-ometric detector (PAD) ED50 (Dionex) operating with a dual poten-tial waveform. The ratio of monomers was determined bycomparison of the detector response to calibration standards ofthe individual monomers (galactose, glucose and rhamnose, 5–100 ppm). The absolute configurations of monosaccharides weredetermined by conversion to their butyl glycosides using the pro-cedure described by Gerwig et al.24
For linkage analysis, the HMW-EPS was permethylated usingthe procedures described by Stellner et al.25 The methylated-polysaccharide was hydrolysed by treatment with 2 M TFA(120 �C for 2 h) and the methylated monosaccharides convertedto their corresponding methylated alditol acetates. The identityof the variously methylated alditol acetates was determined byGLC–MS and by analysis of the individual fragmentation patternsobserved in the MS. GLC–MS analyses were performed on anAgilent 7890A GC system (Santa Clara, CA, USA) coupled to anAgilent 5675c quadrupole MS. The samples were eluted from aHP-5 column (30 m � 0.25 mm-id, 0.25 lm film) using heliumas carrier (9 psi, flow rate 1 mL min�1) and using the followingtemperature programme: start temperature 155 �C, hold time

B
-1-h
-0-h
1-h
2-h
3-h
4-h
5-h
6-h
7-h
24-h
B’
A C/D E F
A’ C’Dα’ E’ F’Dβ’
8-h
Figure 5. 500 MHz 1H NMR spectra of the anomeric region following the acid catalysed hydrolysis of the HMW-EPS from B. animalis subsp. lactis IPLA-R1 as a function oftime; spectra were recorded in D2O at 70 �C and the sample was maintained at 70 �C for the full reaction period. Sugar residues in the native HMW-EPS are identified at thebottom (A–F), whereas those of the hydrolysed sample are identified at the top (A0–F0).
0 5,000 bp
GTFp-GTF p-GTFP-EMPRh-B
PhGTF GTF
GTF GTFP-EP-ChL PB
wzx wzx cpsD
T-ISScABPGTF
MPP-ChLMP MP
wzz
P-E
0 5,000 bp0 5,000 bp
GTFp-GTF p-GTFP-EMPRh-B
PhGTF GTF
GTF GTFP-EP-ChL PB
wzx wzx cpsD
GTFp-GTF p-GTFP-EMPRh-B
PhGTF GTF
GTF GTFP-EP-ChL PB
wzx wzx cpsD
T-ISScABPGTF
MPP-ChLMP MP
wzz
P-E T-ISScABPGTF
MPP-ChLMP MP
wzz
P-E
Figure 6. Physical map of the putative eps cluster (54,259 bp) of B. animalis subsp. lactis IPLA-R1. Predicted protein functions are categorised as follows: GTF,glycosyltransferase; p-GTF, priming-GTF/undecaprenyl-phosphate sugar phosphotransferase/galactosyltransferase (CpsD); Rh-B, rhamnose biosynthesis precursors; P-ChL,polymerisation (polymerase)-chain length determination; P-E, polymerisation-export (Wzx and Wzz flippases); PB, polysaccharide biosynthesis; AcS, acyl-synthetase; Ph,phosphorylase; MP, membrane protein; T-IS, transposase-IS mobile elements; White arrows without label indicate hypothetical proteins.
2716 S. Leivers et al. / Carbohydrate Research 346 (2011) 2710–2717
1 min, and a final column temperature of 195 �C reached via arising gradient of 0.75 �C min�1.
3.3. NMR structure of the HMW-EPS
NMR spectra were recorded for HWM-EPS samples that weredissolved (10 mg mL�1) directly in D2O (Goss Scientific Instru-ments Ltd, Essex, UK). NMR spectra were recorded at a probe tem-perature of 70 �C. The elevated temperature was initially chosen asit shifted the HOD signal to higher field, into a clear region of thespectrum. The higher temperature also increased spectral resolu-tion by reducing the sample viscosity. All of the NMR spectra wererecorded on a Bruker Avance 500.13 MHz 1H (125.75 MHz 13C)spectrometer (Bruker-biospin, Coventry, UK) operating with Z-fieldgradients where appropriate, and using Bruker’s pulse programs.
Chemical shifts are expressed in ppm relative to either internalor external acetone; d 2.225 for 1H and d 31.55 for 13C. The 2Dgs-DQF-COSY spectrum was recorded in magnitude mode at70 �C. TOCSY experiments were recorded with variable mixingtimes (60, 90, 120 ms). The 2D-heteronuclear 1H–13C HSQC, andphase sensitive HSQC-TOCSY were recorded using Bruker pulse se-quences and 256 experiments of 1024 data points. The NOESYspectrum was recorded using a Bruker pulse sequence and 256experiments of 1024 data points were recorded using a mixingtime of 200 ms. For the majority of spectra, time-domain data weremultiplied by phase-shifted (squared-) sine-bell functions. Afterapplying zero-filling and Fourier transformation, data sets of1024-1024 points were obtained.
A mild acid hydrolysis treatment of the HMW-EPS was carriedout as follows: a solution of EPS (10 mg mL�1) was mixed with

S. Leivers et al. / Carbohydrate Research 346 (2011) 2710–2717 2717
20 ll of TFA in an NMR tube and kept at 70 �C for 24 h. Hydrolysiswas monitored by 1H NMR, spectra were recorded every hour forfirst 8 h and then after 24 h.
3.4. Sequencing of the putative eps cluster of B. animalis subsp.lactis IPLA-R1
Strain B. animalis subsp. lactis IPLA-R1 was grown for 24 h in10 mL of MRSC broth to isolate DNA using the ‘GenElute BacterialGenomic DNA’ kit (Sigma) following the manufacturer instructions,but including a previous step of bacterial lysis with mutanolysinand lysozyme.8 For sequencing the putative eps cluster, 54 pairsof PCR primers were designed taking into account the sequence ofthe type strain B. animalis subsp. lactis DSM10140, whose genomeis publicly available (GenBank accession number CP001606).26
Primers, synthesised by Thermo-Fisher Scientific GmbH (Ulm, Ger-many), amplified regions of about 1000 bp. The PCR reaction mix-ture in a final volume of 50 ll was: 1 ll chromosomal DNA,0.20 lM of each primer, 200 lM dNTPs (Amersham Bioscience,Upsala, Sweden) and 2.5 U Taq DNA-polymerase (Eppendorf, Ham-burg, Germany). The PCR thermal conditions were an initial denat-uralisation cycle 95 �C for 5 min, 30 amplification cycles of: 95 �Cfor 1 min, 52 or 56 �C (variable according to the pair of primers)for 50 s and 68 �C for 2 min, and a final extension step of 68 �C for10 min. Amplification was done in a UnoCycler thermal cycler(VWR International Eurolab S.L., Barcelona, Spain). PCR amplifiedproducts were visualised under UV in 1% agarose gels, after stainingwith ethidium bromide. Purification and sequencing of each ampli-cons (both strands) was performed by Macrogen (Seoul, Korea). Se-quences obtained were processed with the free Chromas 1.45software (Technelysium Pty Ltd, Australia) and used for comparisonwith those held in the GenBank database (www.ncbi.nlm.nih.gov/genbank) using the BLASTn and BLASTp tools.
Acknowledgements
This work was funded by the Spanish ‘Plan Nacional I+D+I’ fromthe ‘Ministerio de Ciencia e Innovación’ (MICINN, FEDER fundsfrom European Union) through the project AGL2009-09445 andby the University of Huddersfield. C.H.-C. acknowledges his FPI fel-lowship to MICINN.
References
1. Margolles, A.; Mayo, B.; Ruas-Madiedo, P. Screening, Identification andCharacterization of Lactobacillus and Bifidobacterium Strains. In Handbook ofProbiotics and Prebiotics; Nomoto, K., Salmine, S., Lee, Y. K., Eds., 2nd ed.; JohnWilley & Sons: New Jersey, 2009; pp 4–43.
2. FAO/WHO. Probiotics in Foods. Health and Nutritional Properties andGuidelines for Evaluation. In Fao Food and Nutrition Paper No. 85, 2006, pp 1–50 (ISBN 92-5-105513-0).
3. Mayo, B.; Delgado, S., Rodríguez, J. M.; Gueimonde, M. CAB Rev., 2008, 1–17, No.055 (Online ISSN 1749-8848).
4. WGO. In World Gastroenterology Organisation Practice Guidelines: Probiotics andPrebiotics, 2008, pp 1–22. http://www.worldgastroenterology.org/assets/downloads/en/pdf/guidelines/19_probiotics_prebiotics.pdf.
5. Ruas-Madiedo, P.; Abraham, A.; Mozzi, F.; de los Reyes-Gavilán, C. G.Functionality of Exopolysaccharides Produced by Lactic Acid Bacteria. InMolecular Aspects of Lactic Acid Bacteria for Traditional and New Applications;Mayo, B., López, P., Pérez-Martínez, G., Eds.; Research Signpost: Kerala, India,2008; pp 137–166.
6. Ruas-Madiedo, P.; Moreno, J. A.; Salazar, N.; Delgado, S.; Mayo, B.; Margolles,A.; de los Reyes-Gavilán, C. G. Appl. Environ. Microbiol. 2007, 73, 4385–4388.
7. Salazar, N.; Prieto, A.; Leal, J. A.; Mayo, B.; Bada-Gancedo, J. C.; de los Reyes-Gavilán, C. G.; Ruas-Madiedo, P. J. Dairy Sci. 2009, 92, 4158–4168.
8. Ruas-Madiedo, P.; Gueimonde, M.; Arigoni, F.; de los Reyes-Gavilán, C. G.;Margolles, A. Appl. Environ. Microbiol. 2009, 75, 1204–1207.
9. Salazar, N.; Gueimonde, M.; Hernández-Barranco, A. M.; Ruas-Madiedo, P.; delos Reyes-Gavilán, C. G. Appl. Environ. Microbiol. 2008, 74, 4737–4745.
10. Salazar, N.; Binetti, A.; Gueimonde, M.; Alonso, A.; Garrido, P.; González delRey, C.; González, C.; Ruas-Madiedo, P.; de los Reyes-Gavilán, C. G. Int. J. FoodMicrobiol. 2011, 144, 342–351.
11. Ruas-Madiedo, P.; Medrano, M.; Salazar, N.; de los Reyes-Gavilán, C. G.; Pérez,P. F.; Abraham, A. J. Appl. Microbiol. 2010, 109, 2079–2086.
12. Zdorovenko, E. L.; Kachala, V. V.; Sidarenka, A. V.; Izhik, A. V.; Kisileva, E. P.;Shashkov, A. S.; Novik, G. I.; Knirel, Y. A. Carbohydr. Res. 2009, 344, 2417–2420.
13. Kohno, M.; Suzuki, S.; Kanaya, T.; Yoshino, T.; Matsuura, Y.; Asada, M.;Kitamura, S. Carbohydr. Polym. 2009, 77, 351–357.
14. Audy, J.; Labrie, S.; Roy, D.; LaPointe, G. Microbiology 2010, 156, 653–664.15. Delcenserie, V.; Lessard, M. H.; LaPointe, G.; Roy, D. FEMS Microbiol. Lett. 2008,
280, 50–56.16. Lee, J. H.; O’Sullivan, J. Microbiol. Mol. Biol. Rev. 2010, 74, 378–416.17. Harding, L. P.; Marshall, V. M.; Hernandez, Y.; Gu, Y. C.; Maqsood, M.; McLay,
N.; Laws, A. P. Carbohydr. Res. 2005, 340, 1107–1111.18. Carpita, N. C.; Shea, E. M. Linkage Structure of Carbohydrates by Gas-
Chromatography–Mass Spectrometry of Partially Methylated Alditol Acetates.In Analysis of Carbohydrates by GLC and MS; Bierman, C. J., McGinnis, G. D., Eds.;CRC Press: Florida, USA, 1988; pp 157–216.
19. Briczinski, E. P.; Loquasto, J. R.; Barrangou, R.; Dudley, E. G.; Roberts, A. M.;Roberts, R. F. Appl. Environ. Microbiol. 2009, 75, 7501–7508.
20. Ruas-Madiedo, P.; Salazar, N.; de los Reyes-Gavilán, C. G. Biosynthesis andchemical composition of exopolysaccharides produced by lactic acid bacteria.In Bacterial Polysaccharides: Current Innovations and Future Trends; Ullrich, M.,Ed.; Caister Academic Press: Norfolk, UK, 2009. pp 279–310.
21. Schell, M. A.; Karmirantzou, M.; Snell, B.; Vilanova, D.; Berger, B.; Pessim, G.;Zwahlen, M. C.; Desiere, F.; Bork, P.; Delley, M.; Pridmore, R. D.; Arigoni, F. PNAS2002, 99, 14422–14427.
22. van Calsteren, M. R.; Pau-Roblot, C.; Begin, A.; Roy, D. Biochem. J. 2002, 363, 7–17.
23. Péant, B.; LaPointe, G.; Gilbert, C.; Atlan, D.; Ward, P.; Roy, D. Microbiology2005, 151, 1839–1851.
24. Gerwig, G. J.; Kamerling, J. P.; Vliegenthart, J. F. G. Carbohydr. Res. 1978, 62,349–357.
25. Stellner, K.; Saito, H.; Hakomori, S. I. Arch. Biochem. Biophys. 1973, 155, 464–472.
26. Barrangou, R.; Briczinski, E. P.; Traeger, L. L.; Loquasto, J. R.; Richards, M.;Hovath, P.; Coûte-;Monvoisin, A. C.; Leyer, G.; Rendulic, S.; Steele, J. L.;Broadbent, J. R.; Oberg, T.; Dudley, E. G.; Schuster, S.; Romero, D. A.; Roberts, R.F. J. Bacteriol. 2009, 191, 4144–4151.
Copyright © 2022 FDOKUMEN