Mid to Late-Holocene pollen-based biome reconstructions for Colombia
Upload
independentCategory
view
2download
0
El-Semman et al. BMC Systems Biology 2014, 8:41http://www.biomedcentral.com/1752-0509/8/41
RESEARCH ARTICLE Open Access
Genome-scale metabolic reconstructions ofBifidobacterium adolescentis L2-32 andFaecalibacterium prausnitzii A2-165 and theirinteractionIbrahim E El-Semman1,2, Fredrik H Karlsson1, Saeed Shoaie1, Intawat Nookaew1, Taysir H Soliman3
and Jens Nielsen1*
Abstract
Background: The gut microbiota plays an important role in human health and disease by acting as a metabolic organ.Metagenomic sequencing has shown how dysbiosis in the gut microbiota is associated with human metabolic diseasessuch as obesity and diabetes. Modeling may assist to gain insight into the metabolic implication of an altered microbiota.Fast and accurate reconstruction of metabolic models for members of the gut microbiota, as well as methods to simulatea community of microorganisms, are therefore needed. The Integrated Microbial Genomes (IMG) database containsfunctional annotation for nearly 4,650 bacterial genomes. This tremendous new genomic information adds newopportunities for systems biology to reconstruct accurate genome scale metabolic models (GEMs).
Results: Here we assembled a reaction data set containing 2,340 reactions obtained from existing genome-scalemetabolic models, where each reaction is assigned with KEGG Orthology. The reaction data set was then used toreconstruct two genome scale metabolic models for gut microorganisms available in the IMG database Bifidobacteriumadolescentis L2-32, which produces acetate during fermentation, and Faecalibacterium prausnitzii A2-165, whichconsumes acetate and produces butyrate. F. prausnitzii is less abundant in patients with Crohn’s disease and has beensuggested to play an anti-inflammatory role in the gut ecosystem. The B. adolescentismodel, iBif452, comprises 699reactions and 611 unique metabolites. The F. prausnitzii model, iFap484, comprises 713 reactions and 621 uniquemetabolites. Each model was validated with in vivo data. We used OptCom and Flux Balance Analysis to simulate howboth organisms interact.
Conclusions: The consortium of iBif452 and iFap484 was applied to predict F. prausnitzii’s demand for acetate andproduction of butyrate which plays an essential role in colonic homeostasis and cancer prevention. The assembledreaction set is a useful tool to generate bacterial draft models from KEGG Orthology.
Keywords: Bifidobacterium adolescentis L2-32, Faecalibacterium prausnitzii A2-165, Genome-scale metabolic model,Metabolic modeling of gut microbiota
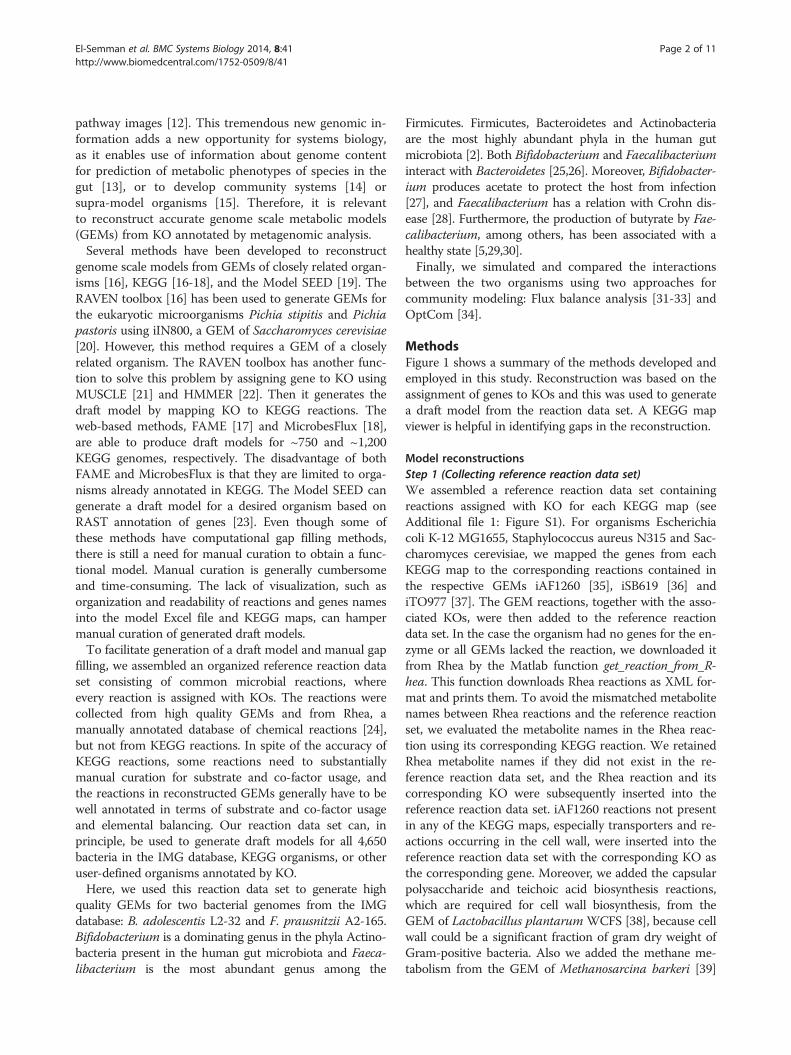
BackgroundMetagenomic sequencing facilitates the study of a largenumber of microorganisms in environmental samples[1]. This technique has been used to study the composi-tion of gut microbiota [2], its role in human metabolism[3,4] and its relation to diseases such as atherosclerosis
* Correspondence: [email protected] of Chemical and Biological Engineering, Chalmers University ofTechnology, Gothenburg, SwedenFull list of author information is available at the end of the article
© 2014 El-Semman et al.; licensee BioMed CenCreative Commons Attribution License (http:/distribution, and reproduction in any mediumDomain Dedication waiver (http://creativecomarticle, unless otherwise stated.
[5], obesity [6,7] and Crohn’s disease [8]. In functionalmetagenomic studies, it is common to use KEGGOrthology (KO) [9] to annotate gene functions [10]. KOcan be used to predict the composition ratio of micro-bial gene families and pathways from the human micro-biome project [11]. The functional annotation for a largenumber of sequenced bacteria, nearly 4,650 bacterial ge-nomes, is stored in the Integrated Microbial Genomes(IMG) database, and the genomes are mapped to KEGG
tral Ltd. This is an Open Access article distributed under the terms of the/creativecommons.org/licenses/by/2.0), which permits unrestricted use,, provided the original work is properly credited. The Creative Commons Publicmons.org/publicdomain/zero/1.0/) applies to the data made available in this
El-Semman et al. BMC Systems Biology 2014, 8:41 Page 2 of 11http://www.biomedcentral.com/1752-0509/8/41
pathway images [12]. This tremendous new genomic in-formation adds a new opportunity for systems biology,as it enables use of information about genome contentfor prediction of metabolic phenotypes of species in thegut [13], or to develop community systems [14] orsupra-model organisms [15]. Therefore, it is relevantto reconstruct accurate genome scale metabolic models(GEMs) from KO annotated by metagenomic analysis.Several methods have been developed to reconstruct
genome scale models from GEMs of closely related organ-isms [16], KEGG [16-18], and the Model SEED [19]. TheRAVEN toolbox [16] has been used to generate GEMs forthe eukaryotic microorganisms Pichia stipitis and Pichiapastoris using iIN800, a GEM of Saccharomyces cerevisiae[20]. However, this method requires a GEM of a closelyrelated organism. The RAVEN toolbox has another func-tion to solve this problem by assigning gene to KO usingMUSCLE [21] and HMMER [22]. Then it generates thedraft model by mapping KO to KEGG reactions. Theweb-based methods, FAME [17] and MicrobesFlux [18],are able to produce draft models for ~750 and ~1,200KEGG genomes, respectively. The disadvantage of bothFAME and MicrobesFlux is that they are limited to orga-nisms already annotated in KEGG. The Model SEED cangenerate a draft model for a desired organism based onRAST annotation of genes [23]. Even though some ofthese methods have computational gap filling methods,there is still a need for manual curation to obtain a func-tional model. Manual curation is generally cumbersomeand time-consuming. The lack of visualization, such asorganization and readability of reactions and genes namesinto the model Excel file and KEGG maps, can hampermanual curation of generated draft models.To facilitate generation of a draft model and manual gap
filling, we assembled an organized reference reaction dataset consisting of common microbial reactions, whereevery reaction is assigned with KOs. The reactions werecollected from high quality GEMs and from Rhea, amanually annotated database of chemical reactions [24],but not from KEGG reactions. In spite of the accuracy ofKEGG reactions, some reactions need to substantiallymanual curation for substrate and co-factor usage, andthe reactions in reconstructed GEMs generally have to bewell annotated in terms of substrate and co-factor usageand elemental balancing. Our reaction data set can, inprinciple, be used to generate draft models for all 4,650bacteria in the IMG database, KEGG organisms, or otheruser-defined organisms annotated by KO.Here, we used this reaction data set to generate high
quality GEMs for two bacterial genomes from the IMGdatabase: B. adolescentis L2-32 and F. prausnitzii A2-165.Bifidobacterium is a dominating genus in the phyla Actino-bacteria present in the human gut microbiota and Faeca-libacterium is the most abundant genus among the
Firmicutes. Firmicutes, Bacteroidetes and Actinobacteriaare the most highly abundant phyla in the human gutmicrobiota [2]. Both Bifidobacterium and Faecalibacteriuminteract with Bacteroidetes [25,26]. Moreover, Bifidobacter-ium produces acetate to protect the host from infection[27], and Faecalibacterium has a relation with Crohn dis-ease [28]. Furthermore, the production of butyrate by Fae-calibacterium, among others, has been associated with ahealthy state [5,29,30].Finally, we simulated and compared the interactions
between the two organisms using two approaches forcommunity modeling: Flux balance analysis [31-33] andOptCom [34].
MethodsFigure 1 shows a summary of the methods developed andemployed in this study. Reconstruction was based on theassignment of genes to KOs and this was used to generatea draft model from the reaction data set. A KEGG mapviewer is helpful in identifying gaps in the reconstruction.
Model reconstructionsStep 1 (Collecting reference reaction data set)We assembled a reference reaction data set containingreactions assigned with KO for each KEGG map (seeAdditional file 1: Figure S1). For organisms Escherichiacoli K-12 MG1655, Staphylococcus aureus N315 and Sac-charomyces cerevisiae, we mapped the genes from eachKEGG map to the corresponding reactions contained inthe respective GEMs iAF1260 [35], iSB619 [36] andiTO977 [37]. The GEM reactions, together with the asso-ciated KOs, were then added to the reference reactiondata set. In the case the organism had no genes for the en-zyme or all GEMs lacked the reaction, we downloaded itfrom Rhea by the Matlab function get_reaction_from_R-hea. This function downloads Rhea reactions as XML for-mat and prints them. To avoid the mismatched metabolitenames between Rhea reactions and the reference reactionset, we evaluated the metabolite names in the Rhea reac-tion using its corresponding KEGG reaction. We retainedRhea metabolite names if they did not exist in the re-ference reaction data set, and the Rhea reaction and itscorresponding KO were subsequently inserted into thereference reaction data set. iAF1260 reactions not presentin any of the KEGG maps, especially transporters and re-actions occurring in the cell wall, were inserted into thereference reaction data set with the corresponding KO asthe corresponding gene. Moreover, we added the capsularpolysaccharide and teichoic acid biosynthesis reactions,which are required for cell wall biosynthesis, from theGEM of Lactobacillus plantarum WCFS [38], because cellwall could be a significant fraction of gram dry weight ofGram-positive bacteria. Also we added the methane me-tabolism from the GEM of Methanosarcina barkeri [39]
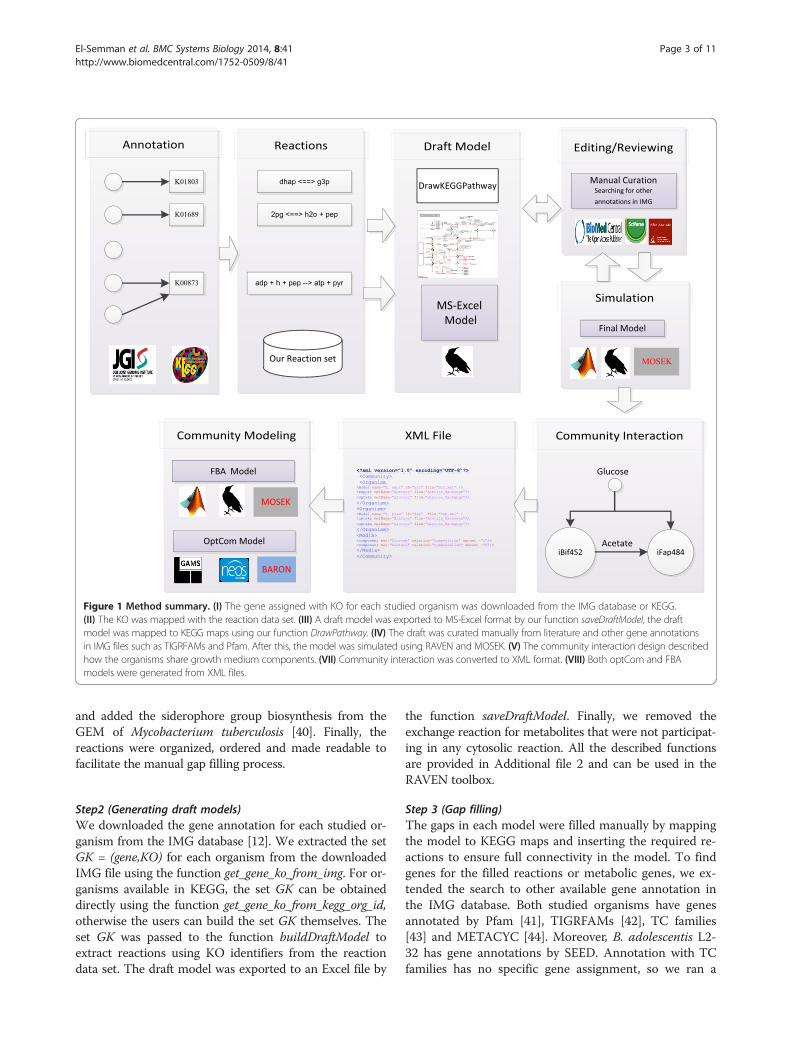
Figure 1 Method summary. (I) The gene assigned with KO for each studied organism was downloaded from the IMG database or KEGG.(II) The KO was mapped with the reaction data set. (III) A draft model was exported to MS-Excel format by our function saveDraftModel, the draftmodel was mapped to KEGG maps using our function DrawPathway. (IV) The draft was curated manually from literature and other gene annotationsin IMG files such as TIGRFAMs and Pfam. After this, the model was simulated using RAVEN and MOSEK. (V) The community interaction design describedhow the organisms share growth medium components. (VII) Community interaction was converted to XML format. (VIII) Both optCom and FBAmodels were generated from XML files.
El-Semman et al. BMC Systems Biology 2014, 8:41 Page 3 of 11http://www.biomedcentral.com/1752-0509/8/41
and added the siderophore group biosynthesis from theGEM of Mycobacterium tuberculosis [40]. Finally, thereactions were organized, ordered and made readable tofacilitate the manual gap filling process.
Step2 (Generating draft models)We downloaded the gene annotation for each studied or-ganism from the IMG database [12]. We extracted the setGK = (gene,KO) for each organism from the downloadedIMG file using the function get_gene_ko_from_img. For or-ganisms available in KEGG, the set GK can be obtaineddirectly using the function get_gene_ko_from_kegg_org_id,otherwise the users can build the set GK themselves. Theset GK was passed to the function buildDraftModel toextract reactions using KO identifiers from the reactiondata set. The draft model was exported to an Excel file by
the function saveDraftModel. Finally, we removed theexchange reaction for metabolites that were not participat-ing in any cytosolic reaction. All the described functionsare provided in Additional file 2 and can be used in theRAVEN toolbox.
Step 3 (Gap filling)The gaps in each model were filled manually by mappingthe model to KEGG maps and inserting the required re-actions to ensure full connectivity in the model. To findgenes for the filled reactions or metabolic genes, we ex-tended the search to other available gene annotation inthe IMG database. Both studied organisms have genesannotated by Pfam [41], TIGRFAMs [42], TC families[43] and METACYC [44]. Moreover, B. adolescentis L2-32 has gene annotations by SEED. Annotation with TCfamilies has no specific gene assignment, so we ran a
El-Semman et al. BMC Systems Biology 2014, 8:41 Page 4 of 11http://www.biomedcentral.com/1752-0509/8/41
bidirectional blast between the TC protein sequence andeach organism sequence. Also, we searched for theresidual filled reactions by their enzyme name or ECnumber in the Pfam database to get the correspondingPfam identifiers, and the corresponding genes weresearched in IMG file. Additional file 3: Table S1 containsthe results of this analysis.
Flux balance analysisFlux Balance Analysis (FBA) [45,46] was used to re-construct and validate both models using the RAVEN tool-box and MOSEK (MOSEK Inc.) as a linear programmingsolver under the Matlab programming environment (Math-work Inc.). Equation (1) describes the main formulation ofFBA, where S is a stoichiometric matrix, V is a vector offlux values for all reactions and C is a weight vector foreach flux in vector V. Typically all values in C are zero ex-cept the flux of the biomass reaction (Vbiomass) which isfixed to one. UB is the upper bound for the flux, and LB isthe lower bound for the flux. In FBA, we assumed that themodel grows in a growth medium (GM) which represents aset of metabolites d, such as a carbon source, ammonia,phosphate, sulfur. Certain exchange reactions, which carryflux from the medium to the model (Vd), were fixed to themodel uptake rate gd, for the metabolite d. For example1 mmol/gDW/h of glucose uptake rate is fixed to flux (Vglc)which carries glucose from the medium to the model.
Max Z ¼ CTVS:t:
S:V ¼ 0V ≤ UB−V ≤ −LBV d ¼ gd; ∀d ∈ GM
ð1Þ
Both B. adolescentis L2-32 and F. prausnitzii A2-165models grow anaerobically in rich media. We assumedthat each model consumed ammonia as a source ofnitrogen, phosphate, H2S or cysteine as a source of sul-fur, nicotinate and all amino acids having transporterreactions. In addition, The F. prausnitzii A2-165 modelconsumed folic acid from the medium. Xanthine, uraciland urea transporters were closed.The compositions of protein, RNA and DNA in the
biomass were estimated from Neidhardt et al. [47]. Thecompositions of peptidoglycan and capsular polysac-charide are the same as in the GEM of Lactobacillusplantarum WCFS [38].We used flux variability analysis [48] to evaluate the
predicted fluxes by the COBRA toolbox function flux-Variability [49] (see Additional file 4: Table S2). Todetermine if a studied organism is able to grow ondifferent carbon sources such as galactose, xylose or
fructose, the transporter flux was fixed to 1 mmol/gDW/h and the biomass formation was optimized.
Community modelingIn community studies each model was allowed to take upas much glucose as possible to maximize growth. In FBAsimulations, gd splits into two kinds of reactions with thefirst being a distribution of metabolite d to the differentmicroorganisms in the community and the second beingdifferent transport reactions, where each reaction re-presents transport of glucose to one organism [31]. InOptCom, gd became two variables: uptake variable forgrowth medium metabolite d, uvald
k , or/and export vari-able for growth media, evald
k , where k = bif or fap [34] andwhere bif is B. adolescentis L2-32 and fap is F. prausnitziiA2-165. Equation (2) gives the general OptCom problemformulation for this community. This problem has nonlin-ear constraint, so it cannot be solved using MOSEK. Wetherefore wrote a function generateOptComModel to con-vert RAVEN Matlab models to GAMS language (GAMSDevelopment Corporation) and used the BARON solverhosted on the NEOS servers [50], a free optimization ser-ver, to solve the optimization problem.
Max Z ¼ vbifbiomass þ vfapbiomasss:t:
Max Zbif ¼ vbifbiomass ;Max Zfap ¼ vfapbiomasss:t: s:t:
Sbif V bif ¼ 0 SfapV fap ¼ 0Vbif ≤ UBbif V fap ≤ UBfap
−Vbif ≤ −LBbif −V fap ≤ −LBfap
vbifglc ≤ uvalbifglc vfapglc ≤ uvalfapglc
vbifacetate ¼ evalbifacetate vfapacetate ≤ uvalfapacetate
uvalbifglc þ uvalfapglc ¼ totalglc
uvalfapacetate ¼ evalbifacetate
ð2Þ
Description of community using XMLWe described a community structure without details ofeach model as XML format (see Additional file 5), becauseLibSBML fails to read an SBML containing a user definedattribute or XML tag for community features [51]. BothiBif452 and iFap484 competed for glucose while iFap484consumed acetate produced by iBif452. The functions ge-nerateOptComModel and generateComModel used XMLfiles to generate OptCom and FBA models.
Results and discussionReconstruction of reference reaction data setGEMs elucidate how organisms consume nutrients, car-bon source, ammonia, phosphate and autotrophic me-tabolites to build their biomass precursors and producechemical byproducts [52]. The biochemical reactions in-cluded in a GEM are based on experimental or predictedfunction of enzymes contained by the studied organism[53]. Reconstructed GEMs share many components:
El-Semman et al. BMC Systems Biology 2014, 8:41 Page 5 of 11http://www.biomedcentral.com/1752-0509/8/41
exchange flux, transport, central metabolism, nucleotide,amino acids, cofactor biosynthesis, cell wall and lipid.Most GEMs use KEGG maps and literature to illustratethe content of each component, where it contains oneor more KEGG maps. Additional file 1: Figure S1(adapted from [54]) shows these components and theKEGG map name for each component and how flux dis-tributes to each component and builds the necessarybiomass precursors.To cover the reactions in Additional file 1: Figure S1, we
built a reference reaction data set from published GEMsand a manually curated reaction database Rhea. This re-action data set contained reactions for the central car-bon metabolism (glycolysis, PP pathway, TCA, pyruvate),amino acids and nucleotide biosynthesis, cell wall (pep-tidoglycan, capsular polysaccharide and teichoic acid bio-synthesis) and cofactors (folate, CoA and NAD+). Weadopted the fatty acids biosynthesis and glycerophospho-lipd metabolism in iAF1260. Then we included reactionsthat connect other carbon resources, such as galactoseand maltose to the main network.The reactions were organized to facilitate manual revi-
sion and editing of newly reconstructed GEMs. Each reac-tion was assigned with KOs obtained from KEGG maps.The reference reaction data set comprises 2,340 reactionsout of which 214 came from Rhea, 1256 unique meta-bolite and 2146 KOs (see Additional file 6: Table S3). Thereference reaction data set was used to generate a draftmodel with an input file containing a gene and its KO.Additional file 7: Figure S2 shows how the reaction setcovers KEGG maps.
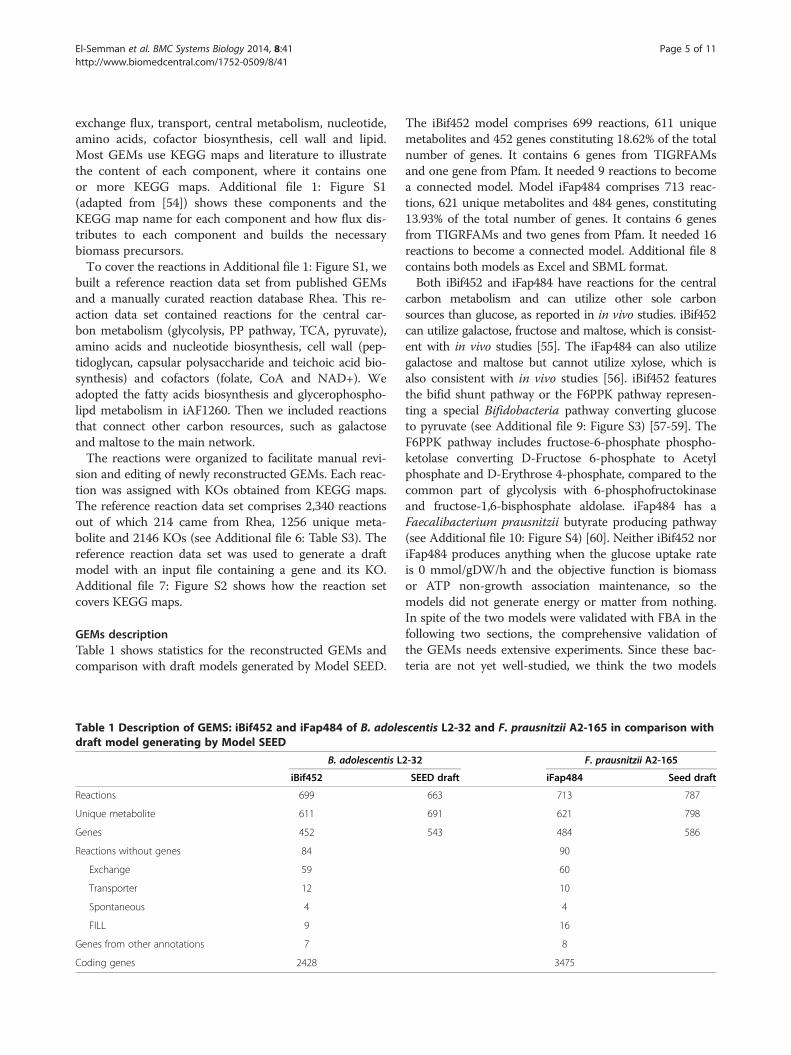
GEMs descriptionTable 1 shows statistics for the reconstructed GEMs andcomparison with draft models generated by Model SEED.
Table 1 Description of GEMS: iBif452 and iFap484 of B. adoledraft model generating by Model SEED
B. adolescentis L
iBif452
Reactions 699
Unique metabolite 611
Genes 452
Reactions without genes 84
Exchange 59
Transporter 12
Spontaneous 4
FILL 9
Genes from other annotations 7
Coding genes 2428
The iBif452 model comprises 699 reactions, 611 uniquemetabolites and 452 genes constituting 18.62% of the totalnumber of genes. It contains 6 genes from TIGRFAMsand one gene from Pfam. It needed 9 reactions to becomea connected model. Model iFap484 comprises 713 reac-tions, 621 unique metabolites and 484 genes, constituting13.93% of the total number of genes. It contains 6 genesfrom TIGRFAMs and two genes from Pfam. It needed 16reactions to become a connected model. Additional file 8contains both models as Excel and SBML format.Both iBif452 and iFap484 have reactions for the central
carbon metabolism and can utilize other sole carbonsources than glucose, as reported in in vivo studies. iBif452can utilize galactose, fructose and maltose, which is consist-ent with in vivo studies [55]. The iFap484 can also utilizegalactose and maltose but cannot utilize xylose, which isalso consistent with in vivo studies [56]. iBif452 featuresthe bifid shunt pathway or the F6PPK pathway represen-ting a special Bifidobacteria pathway converting glucoseto pyruvate (see Additional file 9: Figure S3) [57-59]. TheF6PPK pathway includes fructose-6-phosphate phospho-ketolase converting D-Fructose 6-phosphate to Acetylphosphate and D-Erythrose 4-phosphate, compared to thecommon part of glycolysis with 6-phosphofructokinaseand fructose-1,6-bisphosphate aldolase. iFap484 has aFaecalibacterium prausnitzii butyrate producing pathway(see Additional file 10: Figure S4) [60]. Neither iBif452 noriFap484 produces anything when the glucose uptake rateis 0 mmol/gDW/h and the objective function is biomassor ATP non-growth association maintenance, so themodels did not generate energy or matter from nothing.In spite of the two models were validated with FBA in thefollowing two sections, the comprehensive validation ofthe GEMs needs extensive experiments. Since these bac-teria are not yet well-studied, we think the two models
scentis L2-32 and F. prausnitzii A2-165 in comparison with
2-32 F. prausnitzii A2-165
SEED draft iFap484 Seed draft
663 713 787
691 621 798
543 484 586
90
60
10
4
16
8
3475
0 0.1 0.2 0.3 0.4 0.5 0.6 0.7 0.8 0.9 1 0 0.1 0.2 0.3 0.4 0.5 0.6 0.7 0.8 0.9 10.03
0.031
0.032
0.033
0.034
0.035
0.036
0.037
0.038
0.039
Lactate (mmol/gDW/h)
Bio
mas
s(1/
h)
0
0.2
0.4
0.6
0.8
1
1.2
1.4
1.6
1.8
Lactate (mmol/gDW/h)
Ace
tate
, For
mat
e an
d E
than
ol (
mm
ol/g
DW
/h)
A B
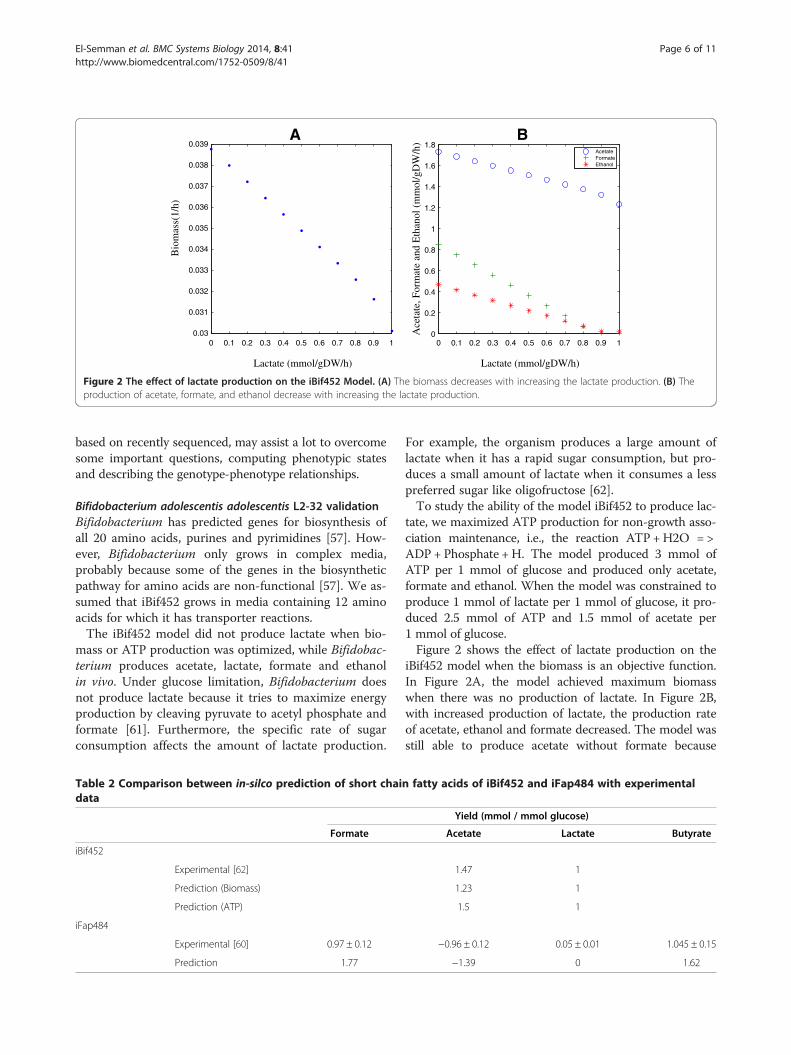
Figure 2 The effect of lactate production on the iBif452 Model. (A) The biomass decreases with increasing the lactate production. (B) Theproduction of acetate, formate, and ethanol decrease with increasing the lactate production.
El-Semman et al. BMC Systems Biology 2014, 8:41 Page 6 of 11http://www.biomedcentral.com/1752-0509/8/41
based on recently sequenced, may assist a lot to overcomesome important questions, computing phenotypic statesand describing the genotype-phenotype relationships.
Bifidobacterium adolescentis adolescentis L2-32 validationBifidobacterium has predicted genes for biosynthesis ofall 20 amino acids, purines and pyrimidines [57]. How-ever, Bifidobacterium only grows in complex media,probably because some of the genes in the biosyntheticpathway for amino acids are non-functional [57]. We as-sumed that iBif452 grows in media containing 12 aminoacids for which it has transporter reactions.The iBif452 model did not produce lactate when bio-
mass or ATP production was optimized, while Bifidobac-terium produces acetate, lactate, formate and ethanolin vivo. Under glucose limitation, Bifidobacterium doesnot produce lactate because it tries to maximize energyproduction by cleaving pyruvate to acetyl phosphate andformate [61]. Furthermore, the specific rate of sugarconsumption affects the amount of lactate production.
Table 2 Comparison between in-silco prediction of short chaidata
Formate
iBif452
Experimental [62]
Prediction (Biomass)
Prediction (ATP)
iFap484
Experimental [60] 0.97 ± 0.12
Prediction 1.77
For example, the organism produces a large amount oflactate when it has a rapid sugar consumption, but pro-duces a small amount of lactate when it consumes a lesspreferred sugar like oligofructose [62].To study the ability of the model iBif452 to produce lac-
tate, we maximized ATP production for non-growth asso-ciation maintenance, i.e., the reaction ATP +H2O = >ADP + Phosphate + H. The model produced 3 mmol ofATP per 1 mmol of glucose and produced only acetate,formate and ethanol. When the model was constrained toproduce 1 mmol of lactate per 1 mmol of glucose, it pro-duced 2.5 mmol of ATP and 1.5 mmol of acetate per1 mmol of glucose.Figure 2 shows the effect of lactate production on the
iBif452 model when the biomass is an objective function.In Figure 2A, the model achieved maximum biomasswhen there was no production of lactate. In Figure 2B,with increased production of lactate, the production rateof acetate, ethanol and formate decreased. The model wasstill able to produce acetate without formate because
n fatty acids of iBif452 and iFap484 with experimental
Yield (mmol / mmol glucose)
Acetate Lactate Butyrate
1.47 1
1.23 1
1.5 1
−0.96 ± 0.12 0.05 ± 0.01 1.045 ± 0.15
−1.39 0 1.62
0 0.1 0.2 0.3 0.4 0.5 0.6 0.7 0.8 0.9 1
00.1
0.20.3
0.40.5
0.60.7
0.80.9
10
0.005
0.01
0.015
0.02
0.025
0.03
Glucose (mmol/gDW/h)Acetate (mmol/gDW/h)
Bio
mas
s (1
/h)
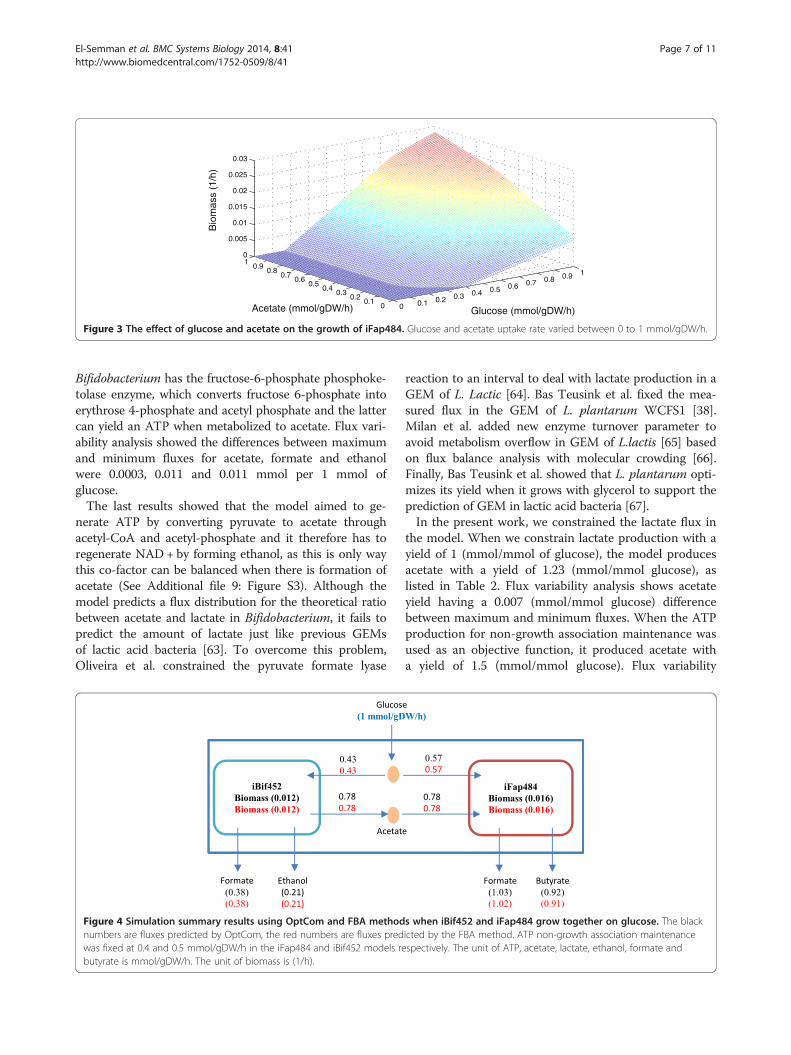
Figure 3 The effect of glucose and acetate on the growth of iFap484. Glucose and acetate uptake rate varied between 0 to 1 mmol/gDW/h.
El-Semman et al. BMC Systems Biology 2014, 8:41 Page 7 of 11http://www.biomedcentral.com/1752-0509/8/41
Bifidobacterium has the fructose-6-phosphate phosphoke-tolase enzyme, which converts fructose 6-phosphate intoerythrose 4-phosphate and acetyl phosphate and the lattercan yield an ATP when metabolized to acetate. Flux vari-ability analysis showed the differences between maximumand minimum fluxes for acetate, formate and ethanolwere 0.0003, 0.011 and 0.011 mmol per 1 mmol ofglucose.The last results showed that the model aimed to ge-
nerate ATP by converting pyruvate to acetate throughacetyl-CoA and acetyl-phosphate and it therefore has toregenerate NAD + by forming ethanol, as this is only waythis co-factor can be balanced when there is formation ofacetate (See Additional file 9: Figure S3). Although themodel predicts a flux distribution for the theoretical ratiobetween acetate and lactate in Bifidobacterium, it fails topredict the amount of lactate just like previous GEMsof lactic acid bacteria [63]. To overcome this problem,Oliveira et al. constrained the pyruvate formate lyase
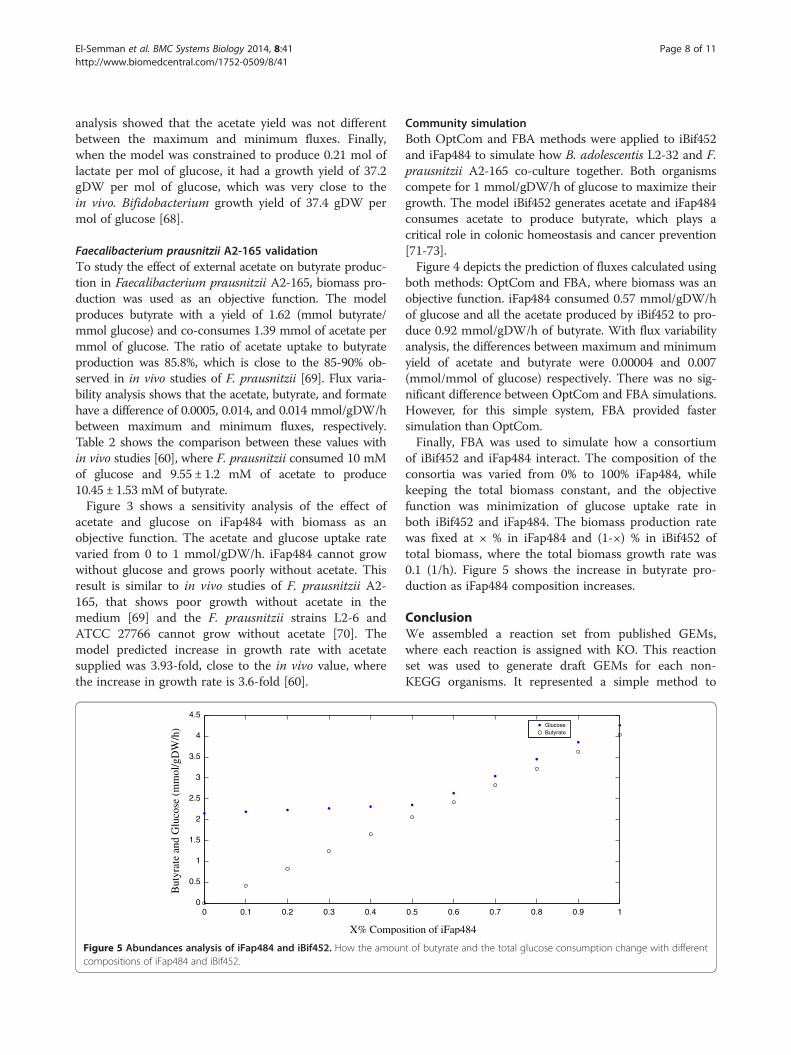
Figure 4 Simulation summary results using OptCom and FBA methodnumbers are fluxes predicted by OptCom, the red numbers are fluxes predwas fixed at 0.4 and 0.5 mmol/gDW/h in the iFap484 and iBif452 models rebutyrate is mmol/gDW/h. The unit of biomass is (1/h).
reaction to an interval to deal with lactate production in aGEM of L. Lactic [64]. Bas Teusink et al. fixed the mea-sured flux in the GEM of L. plantarum WCFS1 [38].Milan et al. added new enzyme turnover parameter toavoid metabolism overflow in GEM of L.lactis [65] basedon flux balance analysis with molecular crowding [66].Finally, Bas Teusink et al. showed that L. plantarum opti-mizes its yield when it grows with glycerol to support theprediction of GEM in lactic acid bacteria [67].In the present work, we constrained the lactate flux in
the model. When we constrain lactate production with ayield of 1 (mmol/mmol of glucose), the model producesacetate with a yield of 1.23 (mmol/mmol glucose), aslisted in Table 2. Flux variability analysis shows acetateyield having a 0.007 (mmol/mmol glucose) differencebetween maximum and minimum fluxes. When the ATPproduction for non-growth association maintenance wasused as an objective function, it produced acetate witha yield of 1.5 (mmol/mmol glucose). Flux variability
s when iBif452 and iFap484 grow together on glucose. The blackicted by the FBA method. ATP non-growth association maintenancespectively. The unit of ATP, acetate, lactate, ethanol, formate and
El-Semman et al. BMC Systems Biology 2014, 8:41 Page 8 of 11http://www.biomedcentral.com/1752-0509/8/41
analysis showed that the acetate yield was not differentbetween the maximum and minimum fluxes. Finally,when the model was constrained to produce 0.21 mol oflactate per mol of glucose, it had a growth yield of 37.2gDW per mol of glucose, which was very close to thein vivo. Bifidobacterium growth yield of 37.4 gDW permol of glucose [68].
Faecalibacterium prausnitzii A2-165 validationTo study the effect of external acetate on butyrate produc-tion in Faecalibacterium prausnitzii A2-165, biomass pro-duction was used as an objective function. The modelproduces butyrate with a yield of 1.62 (mmol butyrate/mmol glucose) and co-consumes 1.39 mmol of acetate permmol of glucose. The ratio of acetate uptake to butyrateproduction was 85.8%, which is close to the 85-90% ob-served in in vivo studies of F. prausnitzii [69]. Flux varia-bility analysis shows that the acetate, butyrate, and formatehave a difference of 0.0005, 0.014, and 0.014 mmol/gDW/hbetween maximum and minimum fluxes, respectively.Table 2 shows the comparison between these values within vivo studies [60], where F. prausnitzii consumed 10 mMof glucose and 9.55 ± 1.2 mM of acetate to produce10.45 ± 1.53 mM of butyrate.Figure 3 shows a sensitivity analysis of the effect of
acetate and glucose on iFap484 with biomass as anobjective function. The acetate and glucose uptake ratevaried from 0 to 1 mmol/gDW/h. iFap484 cannot growwithout glucose and grows poorly without acetate. Thisresult is similar to in vivo studies of F. prausnitzii A2-165, that shows poor growth without acetate in themedium [69] and the F. prausnitzii strains L2-6 andATCC 27766 cannot grow without acetate [70]. Themodel predicted increase in growth rate with acetatesupplied was 3.93-fold, close to the in vivo value, wherethe increase in growth rate is 3.6-fold [60].
0 0.1 0.2 0.3 0.40
0.5
1
1.5
2
2.5
3
3.5
4
4.5
X% Compo
But
yrat
e an
d G
luco
se (
mm
ol/g
DW
/h)
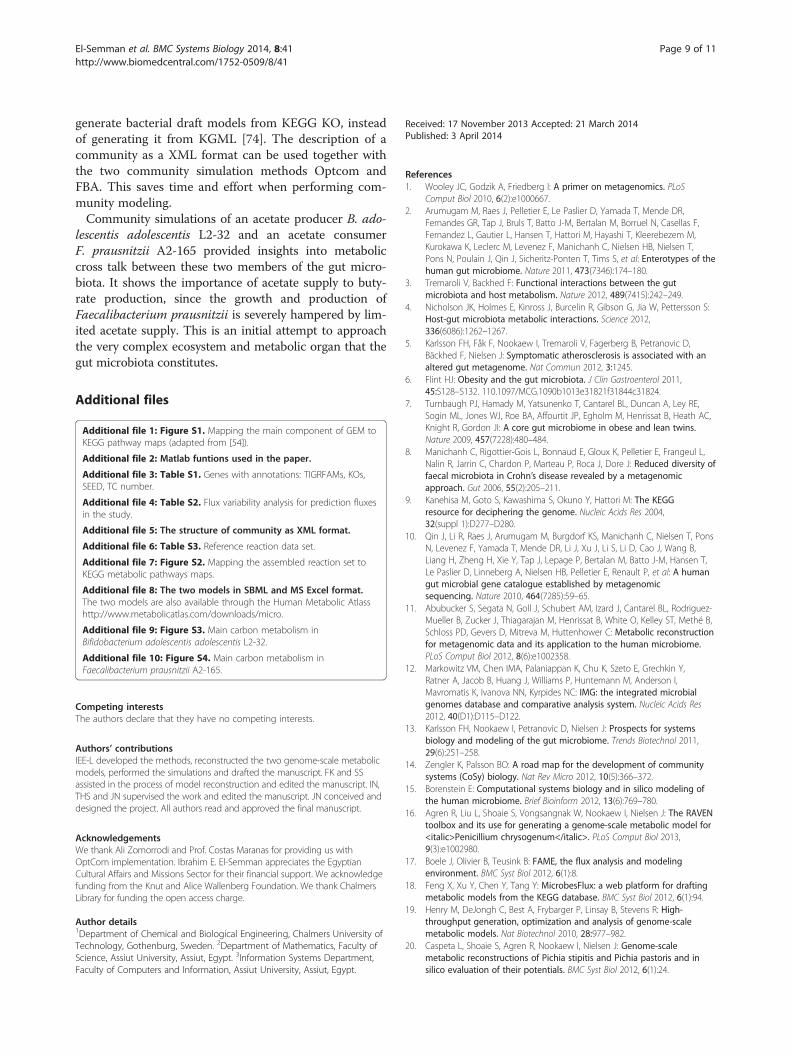
Figure 5 Abundances analysis of iFap484 and iBif452. How the amouncompositions of iFap484 and iBif452.
Community simulationBoth OptCom and FBA methods were applied to iBif452and iFap484 to simulate how B. adolescentis L2-32 and F.prausnitzii A2-165 co-culture together. Both organismscompete for 1 mmol/gDW/h of glucose to maximize theirgrowth. The model iBif452 generates acetate and iFap484consumes acetate to produce butyrate, which plays acritical role in colonic homeostasis and cancer prevention[71-73].Figure 4 depicts the prediction of fluxes calculated using
both methods: OptCom and FBA, where biomass was anobjective function. iFap484 consumed 0.57 mmol/gDW/hof glucose and all the acetate produced by iBif452 to pro-duce 0.92 mmol/gDW/h of butyrate. With flux variabilityanalysis, the differences between maximum and minimumyield of acetate and butyrate were 0.00004 and 0.007(mmol/mmol of glucose) respectively. There was no sig-nificant difference between OptCom and FBA simulations.However, for this simple system, FBA provided fastersimulation than OptCom.Finally, FBA was used to simulate how a consortium
of iBif452 and iFap484 interact. The composition of theconsortia was varied from 0% to 100% iFap484, whilekeeping the total biomass constant, and the objectivefunction was minimization of glucose uptake rate inboth iBif452 and iFap484. The biomass production ratewas fixed at × % in iFap484 and (1-×) % in iBif452 oftotal biomass, where the total biomass growth rate was0.1 (1/h). Figure 5 shows the increase in butyrate pro-duction as iFap484 composition increases.
ConclusionWe assembled a reaction set from published GEMs,where each reaction is assigned with KO. This reactionset was used to generate draft GEMs for each non-KEGG organisms. It represented a simple method to
0.5 0.6 0.7 0.8 0.9 1
sition of iFap484
GlucoseButyrate
t of butyrate and the total glucose consumption change with different
El-Semman et al. BMC Systems Biology 2014, 8:41 Page 9 of 11http://www.biomedcentral.com/1752-0509/8/41
generate bacterial draft models from KEGG KO, insteadof generating it from KGML [74]. The description of acommunity as a XML format can be used together withthe two community simulation methods Optcom andFBA. This saves time and effort when performing com-munity modeling.Community simulations of an acetate producer B. ado-
lescentis adolescentis L2-32 and an acetate consumerF. prausnitzii A2-165 provided insights into metaboliccross talk between these two members of the gut micro-biota. It shows the importance of acetate supply to buty-rate production, since the growth and production ofFaecalibacterium prausnitzii is severely hampered by lim-ited acetate supply. This is an initial attempt to approachthe very complex ecosystem and metabolic organ that thegut microbiota constitutes.
Additional files
Additional file 1: Figure S1. Mapping the main component of GEM toKEGG pathway maps (adapted from [54]).
Additional file 2: Matlab funtions used in the paper.
Additional file 3: Table S1. Genes with annotations: TIGRFAMs, KOs,SEED, TC number.
Additional file 4: Table S2. Flux variability analysis for prediction fluxesin the study.
Additional file 5: The structure of community as XML format.
Additional file 6: Table S3. Reference reaction data set.
Additional file 7: Figure S2. Mapping the assembled reaction set toKEGG metabolic pathways maps.
Additional file 8: The two models in SBML and MS Excel format.The two models are also available through the Human Metabolic Atlasshttp://www.metabolicatlas.com/downloads/micro.
Additional file 9: Figure S3. Main carbon metabolism inBifidobacterium adolescentis adolescentis L2-32.
Additional file 10: Figure S4. Main carbon metabolism inFaecalibacterium prausnitzii A2-165.
Competing interestsThe authors declare that they have no competing interests.
Authors’ contributionsIEE-L developed the methods, reconstructed the two genome-scale metabolicmodels, performed the simulations and drafted the manuscript. FK and SSassisted in the process of model reconstruction and edited the manuscript. IN,THS and JN supervised the work and edited the manuscript. JN conceived anddesigned the project. All authors read and approved the final manuscript.
AcknowledgementsWe thank Ali Zomorrodi and Prof. Costas Maranas for providing us withOptCom implementation. Ibrahim E. El-Semman appreciates the EgyptianCultural Affairs and Missions Sector for their financial support. We acknowledgefunding from the Knut and Alice Wallenberg Foundation. We thank ChalmersLibrary for funding the open access charge.
Author details1Department of Chemical and Biological Engineering, Chalmers University ofTechnology, Gothenburg, Sweden. 2Department of Mathematics, Faculty ofScience, Assiut University, Assiut, Egypt. 3Information Systems Department,Faculty of Computers and Information, Assiut University, Assiut, Egypt.
Received: 17 November 2013 Accepted: 21 March 2014Published: 3 April 2014
References1. Wooley JC, Godzik A, Friedberg I: A primer on metagenomics. PLoS
Comput Biol 2010, 6(2):e1000667.2. Arumugam M, Raes J, Pelletier E, Le Paslier D, Yamada T, Mende DR,
Fernandes GR, Tap J, Bruls T, Batto J-M, Bertalan M, Borruel N, Casellas F,Fernandez L, Gautier L, Hansen T, Hattori M, Hayashi T, Kleerebezem M,Kurokawa K, Leclerc M, Levenez F, Manichanh C, Nielsen HB, Nielsen T,Pons N, Poulain J, Qin J, Sicheritz-Ponten T, Tims S, et al: Enterotypes of thehuman gut microbiome. Nature 2011, 473(7346):174–180.
3. Tremaroli V, Backhed F: Functional interactions between the gutmicrobiota and host metabolism. Nature 2012, 489(7415):242–249.
4. Nicholson JK, Holmes E, Kinross J, Burcelin R, Gibson G, Jia W, Pettersson S:Host-gut microbiota metabolic interactions. Science 2012,336(6086):1262–1267.
5. Karlsson FH, Fåk F, Nookaew I, Tremaroli V, Fagerberg B, Petranovic D,Bäckhed F, Nielsen J: Symptomatic atherosclerosis is associated with analtered gut metagenome. Nat Commun 2012, 3:1245.
6. Flint HJ: Obesity and the gut microbiota. J Clin Gastroenterol 2011,45:S128–S132. 110.1097/MCG.1090b1013e31821f31844c31824.
7. Turnbaugh PJ, Hamady M, Yatsunenko T, Cantarel BL, Duncan A, Ley RE,Sogin ML, Jones WJ, Roe BA, Affourtit JP, Egholm M, Henrissat B, Heath AC,Knight R, Gordon JI: A core gut microbiome in obese and lean twins.Nature 2009, 457(7228):480–484.
8. Manichanh C, Rigottier-Gois L, Bonnaud E, Gloux K, Pelletier E, Frangeul L,Nalin R, Jarrin C, Chardon P, Marteau P, Roca J, Dore J: Reduced diversity offaecal microbiota in Crohn’s disease revealed by a metagenomicapproach. Gut 2006, 55(2):205–211.
9. Kanehisa M, Goto S, Kawashima S, Okuno Y, Hattori M: The KEGGresource for deciphering the genome. Nucleic Acids Res 2004,32(suppl 1):D277–D280.
10. Qin J, Li R, Raes J, Arumugam M, Burgdorf KS, Manichanh C, Nielsen T, PonsN, Levenez F, Yamada T, Mende DR, Li J, Xu J, Li S, Li D, Cao J, Wang B,Liang H, Zheng H, Xie Y, Tap J, Lepage P, Bertalan M, Batto J-M, Hansen T,Le Paslier D, Linneberg A, Nielsen HB, Pelletier E, Renault P, et al: A humangut microbial gene catalogue established by metagenomicsequencing. Nature 2010, 464(7285):59–65.
11. Abubucker S, Segata N, Goll J, Schubert AM, Izard J, Cantarel BL, Rodriguez-Mueller B, Zucker J, Thiagarajan M, Henrissat B, White O, Kelley ST, Methé B,Schloss PD, Gevers D, Mitreva M, Huttenhower C: Metabolic reconstructionfor metagenomic data and its application to the human microbiome.PLoS Comput Biol 2012, 8(6):e1002358.
12. Markowitz VM, Chen IMA, Palaniappan K, Chu K, Szeto E, Grechkin Y,Ratner A, Jacob B, Huang J, Williams P, Huntemann M, Anderson I,Mavromatis K, Ivanova NN, Kyrpides NC: IMG: the integrated microbialgenomes database and comparative analysis system. Nucleic Acids Res2012, 40(D1):D115–D122.
13. Karlsson FH, Nookaew I, Petranovic D, Nielsen J: Prospects for systemsbiology and modeling of the gut microbiome. Trends Biotechnol 2011,29(6):251–258.
14. Zengler K, Palsson BO: A road map for the development of communitysystems (CoSy) biology. Nat Rev Micro 2012, 10(5):366–372.
15. Borenstein E: Computational systems biology and in silico modeling ofthe human microbiome. Brief Bioinform 2012, 13(6):769–780.
16. Agren R, Liu L, Shoaie S, Vongsangnak W, Nookaew I, Nielsen J: The RAVENtoolbox and its use for generating a genome-scale metabolic model for<italic>Penicillium chrysogenum</italic>. PLoS Comput Biol 2013,9(3):e1002980.
17. Boele J, Olivier B, Teusink B: FAME, the flux analysis and modelingenvironment. BMC Syst Biol 2012, 6(1):8.
18. Feng X, Xu Y, Chen Y, Tang Y: MicrobesFlux: a web platform for draftingmetabolic models from the KEGG database. BMC Syst Biol 2012, 6(1):94.
19. Henry M, DeJongh C, Best A, Frybarger P, Linsay B, Stevens R: High-throughput generation, optimization and analysis of genome-scalemetabolic models. Nat Biotechnol 2010, 28:977–982.
20. Caspeta L, Shoaie S, Agren R, Nookaew I, Nielsen J: Genome-scalemetabolic reconstructions of Pichia stipitis and Pichia pastoris and insilico evaluation of their potentials. BMC Syst Biol 2012, 6(1):24.
El-Semman et al. BMC Systems Biology 2014, 8:41 Page 10 of 11http://www.biomedcentral.com/1752-0509/8/41
21. Edgar RC: MUSCLE: multiple sequence alignment with high accuracy andhigh throughput. Nucleic Acids Res 2004, 32(5):1792–1797.
22. Eddy SR: A new generation of homology search tools based onprobabilistic inference. Genome Inform 2009, 23(1):205–211.
23. Aziz R, Bartels D, Best A, DeJongh M, Disz T, Edwards R, Formsma K, GerdesS, Glass E, Kubal M, Meyer F, Olsen G, Olson R, Osterman A, Overbeek R,McNeil L, Paarmann D, Paczian T, Parrello B, Pusch G, Reich C, Stevens R,Vassieva O, Vonstein V, Wilke A, Zagnitko O: The RAST server: rapidannotations using subsystems technology. BMC Genomics 2008,9(1):75.
24. Alcántara R, Axelsen KB, Morgat A, Belda E, Coudert E, Bridge A, Cao H,de Matos P, Ennis M, Turner S, Owen G, Bougueleret L, Xenarios I, SteinbeckC: Rhea—a manually curated resource of biochemical reactions. NucleicAcids Res 2012, 40(D1):D754–D760.
25. Falony G, Calmeyn T, Leroy F, De Vuyst L: Coculture fermentations ofbifidobacterium species and bacteroides thetaiotaomicron reveal amechanistic insight into the prebiotic effect of inulin-type fructans.Appl Environ Microbiol 2009, 75(8):2312–2319.
26. Wrzosek L, Miquel S, Noordine M-L, Bouet S, Chevalier-Curt M, Robert V,Philippe C, Bridonneau C, Cherbuy C, Robbe-Masselot C, Langella P,Thomas M: Bacteroides thetaiotaomicron and Faecalibacteriumprausnitzii influence the production of mucus glycans and thedevelopment of goblet cells in the colonic epithelium of a gnotobioticmodel rodent. BMC Biol 2013, 11(1):61.
27. Fukuda S, Toh H, Hase K, Oshima K, Nakanishi Y, Yoshimura K, Tobe T,Clarke JM, Topping DL, Suzuki T, Taylor TD, Itoh K, Kikuchi J, Morita H,Hattori M, Ohno H: Bifidobacteria can protect from enteropathogenicinfection through production of acetate. Nature 2011, 469(7331):543–547.
28. Sokol H, Pigneur B, Watterlot L, Lakhdari O, Bermúdez-Humarán LG,Gratadoux J-J, Blugeon S, Bridonneau C, Furet J-P, Corthier G, Grangette C,Vasquez N, Pochart P, Trugnan G, Thomas G, Blottière HM, Doré J,Marteau P, Seksik P, Langella P: Faecalibacterium prausnitzii is an anti-inflammatory commensal bacterium identified by gut microbiotaanalysis of Crohn disease patients. Proc Natl Acad Sci 2008,105(43):16731–16736.
29. Claesson MJ, Jeffery IB, Conde S, Power SE, O/'Connor EM, Cusack S, HarrisHMB, Coakley M, Lakshminarayanan B, O/'Sullivan O, Fitzgerald GF, Deane J,O/'Connor M, Harnedy N, O/'Connor K, O/'Mahony D, van Sinderen D,Wallace M, Brennan L, Stanton C, Marchesi JR, Fitzgerald AP, Shanahan F,Hill C, Ross RP, O/'Toole PW: Gut microbiota composition correlates withdiet and health in the elderly. Nature 2012, 488(7410):178–184.
30. Qin J, Li Y, Cai Z, Li S, Zhu J, Zhang F, Liang S, Zhang W, Guan Y, Shen D,Peng Y, Zhang D, Jie Z, Wu W, Qin Y, Xue W, Li J, Han L, Lu D, Wu P, Dai Y,Sun X, Li Z, Tang A, Zhong S, Li X, Chen W, Xu R, Wang M, Feng Q, et al: Ametagenome-wide association study of gut microbiota in type 2diabetes. Nature 2012, 490(7418):55–60.
31. Klitgord N, Segrè D: Environments that induce synthetic microbialecosystems. PLoS Comput Biol 2010, 6(11):e1001002.
32. Stolyar S, Van Dien S, Hillesland KL, Pinel N, Lie TJ, Leigh JA, Stahl DA:Metabolic modeling of a mutualistic microbial community. Mol Syst Biol2007, 3:92.
33. Shoaie S, Karlsson F, Mardinoglu A, Nookaew I, Bordel S, Nielsen J:Understanding the interactions between bacteria in the human gutthrough metabolic modeling. Sci Rep 2013, 3:2532.
34. Zomorrodi AR, Maranas CD: OptCom: a multi-level optimization frame-work for the metabolic modeling and analysis of microbial communities.PLoS Comput Biol 2012, 8(2):e1002363.
35. Feist AM, Henry CS, Reed JL, Krummenacker M, Joyce AR, Karp PD,Broadbelt LJ, Hatzimanikatis V, Palsson BO: A genome-scale metabolicreconstruction for Escherichia coli K-12 MG1655 that accounts for 1260ORFs and thermodynamic information. Mol Syst Biol 2007, 3:121.
36. Becker S, Palsson B: Genome-scale reconstruction of the metabolicnetwork in Staphylococcus aureus N315: an initial draft to thetwo-dimensional annotation. BMC Microbiol 2005, 5(1):8.
37. Osterlund T, Nookaew I, Bordel S, Nielsen J: Mapping condition-dependentregulation of metabolism in yeast through genome-scale modeling.BMC Syst Biol 2013, 7(1):36.
38. Teusink B, Wiersma A, Molenaar D, Francke C, de Vos WM, Siezen RJ, SmidEJ: Analysis of growth of Lactobacillus plantarum WCFS1 on a complexmedium using a genome-scale metabolic model. J Biol Chem 2006,281(52):40041–40048.
39. Gonnerman MC, Benedict MN, Feist AM, Metcalf WW, Price ND:Genomically and biochemically accurate metabolic reconstruction ofMethanosarcina barkeri Fusaro, iMG746. Biotechnol J 2013, 8(9):1070–1079.
40. Jamshidi N, Palsson B: Investigating the metabolic capabilities ofMycobacterium tuberculosis H37Rv using the in silico strain iNJ661 andproposing alternative drug targets. BMC Syst Biol 2007, 1(1):26.
41. Punta M, Coggill PC, Eberhardt RY, Mistry J, Tate J, Boursnell C, Pang N,Forslund K, Ceric G, Clements J, Heger A, Holm L, Sonnhammer ELL, EddySR, Bateman A, Finn RD: The Pfam protein families database. Nucleic AcidsRes 2012, 40(D1):D290–D301.
42. Haft DH, Selengut JD, White O: The TIGRFAMs database of proteinfamilies. Nucleic Acids Res 2003, 31(1):371–373.
43. Saier MH, Yen MR, Noto K, Tamang DG, Elkan C: The transporterclassification database: recent advances. Nucleic Acids Res 2009,37(suppl 1):D274–D278.
44. Caspi R, Altman T, Dreher K, Fulcher CA, Subhraveti P, Keseler IM, Kothari A,Krummenacker M, Latendresse M, Mueller LA, Ong Q, Paley S, Pujar A,Shearer AG, Travers M, Weerasinghe D, Zhang P, Karp PD: The MetaCycdatabase of metabolic pathways and enzymes and the BioCyc collectionof pathway/genome databases. Nucleic Acids Res 2012, 40(D1):D742–D753.
45. Price ND, Papin JA, Schilling CH, Palsson BO: Genome-scale microbial insilico models: the constraints-based approach. Trends Biotechnol 2003,21(4):162–169.
46. Park JM, Kim TY, Lee SY: Constraints-based genome-scale metabolicsimulation for systems metabolic engineering. Biotechnol Adv 2009,27(6):979–988.
47. Neidhardt FC, Ingraham J, Schaechter M: Physiology of the Bacterial Cell: AMolecular Approach. Sunderland, MA: Sinauer Associates; 1990.
48. Mahadevan R, Schilling CH: The effects of alternate optimal solutions inconstraint-based genome-scale metabolic models. Metab Eng 2003,5(4):264–276.
49. Schellenberger J, Que R, Fleming R, Thiele I, Orth J, Feist A, Zielinski D,Bordbar A, Lewis N, Rahmanian S, Kang J, Hyduke D, Palsson B: Quantitativeprediction of cellular metabolism with constraint-based models: theCOBRA Toolbox v2.0. Nat Protoc 2011, 6:1290–1307.
50. Czyzyk J, Mesnier MP, More JJ: The NEOS Server. Computational Science &Engineering, IEEE 1998, 5(3):68–75.
51. Bornstein BJ, Keating SM, Jouraku A, Hucka M: LibSBML: an API Library forSBML. Bioinformatics 2008, 24(6):880–881.
52. Liu L, Agren R, Bordel S, Nielsen J: Use of genome-scale metabolicmodels for understanding microbial physiology. FEBS Lett 2010,584(12):2556–2564.
53. Thiele I, Palsson BO: A protocol for generating a high-quality genome-scale metabolic reconstruction. Nat Protocols 2010, 5(1):93–121.
54. Stephanopoulos GN, Aristidou AA, Nielsen J: Chapter 2 - Review of CellularMetabolism. In Metabolic Engineering. San Diego: Academic Press;1998:21–79.
55. Ze X, Duncan SH, Louis P, Flint HJ: Ruminococcus bromii is a keystonespecies for the degradation of resistant starch in the human colon.ISME J 2012, 6(8):1535–1543.
56. Lopez-Siles M, Khan TM, Duncan SH, Harmsen HJM, Garcia-Gil LJ, Flint HJ:Cultured representatives of two major phylogroups of human colonicfaecalibacterium prausnitzii can utilize pectin, uronic acids, and host-derived substrates for growth. Appl Environ Microbiol 2012, 78(2):420–428.
57. Lee J-H, O’Sullivan DJ: Genomic insights into bifidobacteria. Microbiol MolBiol Rev 2010, 74(3):378–416.
58. Price NP, Whitehead TR, Côté GL: Gas chromatography–massspectrometry (GC-MS) techniques for metabolic flux analysis of theBifido shunt pathway. Biocatal Biotransformation 2006, 24(1):95–98.
59. Fandi KG, Ghazali HM, Yazid AM, Raha AR: Purification and N-terminalamino acid sequence of fructose-6-phosphate phosphoketolase fromBifidobacterium longum BB536. Lett Appl Microbiol 2001, 32(4):235–239.
60. Duncan SH, Barcenilla A, Stewart CS, Pryde SE, Flint HJ: Acetate utilizationand butyryl coenzyme A (CoA):Acetate-CoA transferase in butyrate-producing bacteria from the human large intestine. Appl Environ Microbiol2002, 68(10):5186–5190.
61. Degnan B, Macfarlane G: Effect of dilution rate and carbon availability onbifidobacterium breve fermentation. Appl Microbiol Biotechnol 1994,40(6):800–805.
62. Van der Meulen R, Adriany T, Verbrugghe K, De Vuyst L: Kinetic analysis ofbifidobacterial metabolism reveals a minor role for succinic acid in the
El-Semman et al. BMC Systems Biology 2014, 8:41 Page 11 of 11http://www.biomedcentral.com/1752-0509/8/41
regeneration of NAD+ through its growth-associated production.Appl Environ Microbiol 2006, 72(8):5204–5210.
63. Teusink B, Bachmann H, Molenaar D: Systems biology of lactic acidbacteria: a critical review. Microb Cell Factories 2011, 10(Suppl 1):S11.
64. Oliveira A, Nielsen J, Forster J: Modeling lactococcus lactis using agenome-scale flux model. BMC Microbiol 2005, 5(1):39.
65. van Hoek M, Merks R: Redox balance is key to explaining full vs. partialswitching to low-yield metabolism. BMC Syst Biol 2012, 6(1):22.
66. Vazquez A, Beg Q, de Menezes M, Ernst J, Bar-Joseph Z, Barabasi A-L,Boros L, Oltvai Z: Impact of the solvent capacity constraint on E. colimetabolism. BMC Syst Biol 2008, 2(1):7.
67. Teusink B, Wiersma A, Jacobs L, Notebaart R, Smid E: Understanding theadaptive growth strategy of Lactobacillus plantarum by in silicooptimisation. PLoS Comput Biol 2009, 5:e1000410.
68. de Vries W, Stouthamer AH: Fermentation of glucose, lactose, galactose,mannitol, and xylose by bifidobacteria. J Bacteriol 1968, 96(2):472–478.
69. Duncan SH, Holtrop G, Lobley GE, Calder AG, Stewart CS, Flint HJ:Contribution of acetate to butyrate formation by human faecal bacteria.Br J Nutr 2004, 91(06):915–923.
70. Duncan SH, Hold GL, Harmsen HJM, Stewart CS, Flint HJ: Growthrequirements and fermentation products of Fusobacterium prausnitzii,and a proposal to reclassify it as Faecalibacterium prausnitzii gen. nov.,comb. nov. Int J Syst Evol Microbiol 2002, 52(6):2141–2146.
71. Sokol H, Seksik P, Furet JP, Firmesse O, Nion-Larmurier I, Beaugerie L,Cosnes J, Corthier G, Marteau P, Dore J: Low counts of Faecalibacteriumprausnitzii in colitis microbiota. Inflamm Bowel Dis 2009, 15(8):1183–1189.
72. Flint HJ, Scott KP, Louis P, Duncan SH: The role of the gut microbiota innutrition and health. Nat Rev Gastroenterol Hepatol 2012, 9(10):577–589.
73. Hamer HM, Jonkers D, Venema K, Vanhoutvin S, Troost FJ, Brummer RJ:Review article: the role of butyrate on colonic function. AlimentPharmacol Ther 2008, 27(2):104–119.
74. Wrzodek C, Buchel F, Ruff M, Drager A, Zell A: Precise generation ofsystems biology models from KEGG pathways. BMC Syst Biol 2013, 7(1):15.
doi:10.1186/1752-0509-8-41Cite this article as: El-Semman et al.: Genome-scale metabolicreconstructions of Bifidobacterium adolescentis L2-32 andFaecalibacterium prausnitzii A2-165 and their interaction. BMC SystemsBiology 2014 8:41.
Submit your next manuscript to BioMed Centraland take full advantage of:
• Convenient online submission
• Thorough peer review
• No space constraints or color figure charges
• Immediate publication on acceptance
• Inclusion in PubMed, CAS, Scopus and Google Scholar
• Research which is freely available for redistribution
Submit your manuscript at www.biomedcentral.com/submit
Copyright © 2022 FDOKUMEN