A cross-biome comparison of daily light use efficiency for gross primary production
Quaternary Science Reviews 20 (2001) 1289}1308
Mid- to Late-Holocene pollen-based biome reconstructionsfor Colombia
Robert Marchant��*, Hermann Behling�, Juan Carlos Berrio�, Antoine Cleef�,Joost Duivenvoorden�, Henry Hooghiemstra�, Peter Kuhry�, Bert Melief�, Bas Van Geel�,
Thomas Van der Hammen���, Guido Van Reenen�, Michael Wille��Hugo de Vries-Laboratory, Faculty of Biology, Institute of Biodiversity and Ecosystem Dynamics, University of Amsterdam,
Postbus 94062, 1090 GB Amsterdam, Netherlands�Centre for Tropical Marine Ecology, Fahrenheitstrasse. 1, D-28359 Bremen, Germany�Arctic Centre, University of Lapland, P.O. Box 122, FIN-96101 Rovaniemi, Finland�Fundacion Tropenbos Colombia, Carrera 21 � 39-35, Santafe de Bogota& , Colombia
Abstract
The assignment of Colombian pollen data to biomes allows the data to be synthesised at 10 &time windows' from the present-day to6000 radiocarbon years before present (BP). The modern reconstructed biomes are compared to a map of modern potential vegetationto check the applicability of the method and the a priori assignment of pollen taxa to plant functional types and ultimately biomes.The reconstructed modern biomes are successful in describing the composition and distribution of modern vegetation. In particular,altitudinal variations in vegetation within the northern Andean Cordilleras are well described. At 6000 BP the biomes are mainlycharacteristic of warmer environmental conditions relative to those of the present-day. This trend continues until between 4000 and3000 BP when there is a shift to more mesic vegetation that is thought to equate to an increase in precipitation levels. The periodbetween 2500 and 1000 BP represents little or no change in biome assignment and is interpreted as a period of environmental stability.The in#uence attributed to human-induced impact on the vegetation is recorded from 5000 BP, but is particularly important from2000 BP. The extent of this impact increases over the Late-Holocene period, and is recorded at increasingly high altitudes. Despitethese changes, a number of sites do not change their biome assignment throughout the analysis. This asynchronous vegetationresponse is discussed within the context of site location, non-linear response of vegetation to Late-Holocene environmental change,regionally di!erential signals, localised human impact and methodological artefacts. � 2001 Elsevier Science Ltd. All rightsreserved.
1. Introduction
Biome reconstructions from pollen data have beenproduced for most regions of the world at a continental(Prentice et al., 1996; Jolly et al., 1998b) or sub-continen-tal scale (Williams et al., 1998). These spatially extensivereconstructions have demonstrated the ability of thebiomisation technique to provide an objective recon-struction of vegetation using pollen data derived frommultiple sites. In addition to these large-scale reconstruc-tions, a focus on the Arctic region (Edwards et al., 2000),where the pollen data are of su$cient quality andquantity, has enabled a regional reconstruction that of-
*Corresponding author.E-mail address: [email protected] (R. Marchant).
fers greater ecological de"nition to the reconstructedvegetation than available at the scale of eastern NorthAmerica (Williams et al., 1998). The biome reconstruc-tion for Latin America (Marchant et al., in review)demonstrated the variable spatial distribution of pollen-based records in this region, with sites particularly beingconcentrated along the Andean spine. One country with-in Latin America that has an extensive coverage of fossilpollen data is Colombia (Fig. 1), and much of these pollendata are of a high quality with a number of localitieshaving multiple radiocarbon-dated cores. However, inkeeping with much of tropical palaeoecology, the initialresearch was focused on the abundant sedimentarybasins located at relatively high altitudes (Table 1) wherethe sites are relatively accessible and the climate temper-ate. Furthermore, the sedimentary basins within lowlandsituations are mostly associated with riverine migration.
0277-3791/01/$ - see front matter � 2001 Elsevier Science Ltd. All rights reserved.PII: S 0 2 7 7 - 3 7 9 1 ( 0 0 ) 0 0 1 8 2 - 7

Fig. 1. Map of potential Colombian vegetation today (after IGAC, 1998). Themain vegetation units are depicted as are the location of sites with pollendata used in our analysis. Each site is assigned a number that relates to the information on location, altitude and age range of the sediments presentedin Table 1. Vegetation changes over altitude are also indicated (insert).
Due to this association, the basins can be relativelytransient with resultant sedimentary records having com-plex age}depth relationships. This concentration has re-sulted in relatively few records existing from lowland
Colombia (Fig. 1). As lowland vegetation dynamics re-main relatively poorly resolved (Behling et al., 1999),there has recently been a focus on producing relativelylowland palaeoecological records (Behling and
1290 R. Marchant et al. / Quaternary Science Reviews 20 (2001) 1289}1308

Table 1Characteristics of the Colombia sites used in our analysis detailing location, altitude and the time windows encompassed by each of the sites. The tableis arranged in order of ascending altitude. The numerical code assigned to each site relates to locators in Fig. 1
Site Code Latitude Longitude Alt. (m) 6000 5000 4000 3000 2500 2000 1500 1000 500 Modern
Boca De Lopez 37 !75.44 10.80 0 # # # # # # # # # #
Piusb 1 !77.95 1.80 10 ! # # # # # # # # #
El Camito 2 !76.60 2.53 50 ! ! ! # # # # # # #
Sardinas 14 !69.45 4.95 80 # # # # # # # # # #
Monica-3 7 !72.50 !0.60 160 ! ! ! # # # # # # #
Marin� ame-II 15 !72.05 0.75 160 ! ! ! ! ! ! ! ! ! #
Carimagua 12 !74.14 4.04 180 # # # # # # ! ! ! !
El Pinal 11 !70.40 4.09 185 # # # # # # # # ! !
Angel 13 !70.58 4.45 205 # # ! # # ! ! ! # #
Agua Sucia 9 !73.52 3.66 300 # ! ! # # # # # # #
Loma Linda 8 !73.45 3.34 310 # # # # # # # # # #
Pitalito 3 !76.50 2.75 1300 # # # # # # # # # #
Piagua 5 !76.50 2.30 1700 ! ! ! ! ! # # # # #
Genagra 4 !76.35 2.50 1750 ! ! ! ! # # # # # #
Timbio 6 !76.50 2.50 1750 ! ! ! # # # # # # #
Libano 10 !75.50 4.50 1820 ! # # # # ! ! ! # #
Pedro Palo-III 16 !74.42 4.33 2000 # # # # # # # # # #
Ubaque 17 !73.95 4.50 2000 ! ! ! ! ! ! ! ! ! #
La Herrera 39 !74.00 4.65 2500 ! # # # # # # # # #
CUX 18 !74.18 4.70 2560 # # # # # # # # # #
El Abra-II 19 !73.96 5.00 2570 # # ! # # # # # # #
FuH quene-II 20 !73.87 5.67 2580 # # # # # # # # # #
Alsacia 22 !74.25 4.00 3100 # # ! # ! ! ! ! ! #
Cienaga del Visitador 23 !72.89 6.18 3100 # # # # # # # # # #
Agua Blanca 21 !74.04 5.00 3250 # # # # # # # # # #
La Guitarra 24 !74.67 4.00 3400 # # # # # # # # # #
Ciega-I 25 !72.33 6.67 3510 # # # # # # # ! ! #
La Primavera 26 !74.25 4.00 3525 # # # # # # # # # #
La AmeH rica 27 !74.00 4.33 3550 # # # # # # # # # #
Guasca 41 !74.15 3.95 3550 # ! ! ! # # # # # !
PalaH cio-PT1 28 !73.66 4.57 3550 # # # # ! # # # # #
Andabobos 29 !74.16 4.88 3570 # # # # # # # # ! #
Laguna Verde 36 !74.00 5.25 3625 ! ! ! # ! # ! ! # #
Pen� a Negra 30 !74.00 5.03 3625 # # # # # # # # # #
Los Bobos 35 !72.85 6.15 3800 ! # # ! # # ! # # #
El Gobernador 31 !74.23 4.00 3815 # # # # # # ! # # #
San Carlos 42 !75.30 4.50 3850 # ! ! ! ! ! ! ! ! !
Corralitos 38 !72.30 6.50 3860 ! ! ! ! ! ! ! ! ! #
Valle de Lagunillas-VL-V 32 !72.34 6.43 3880 # # # # # ! ! # ! #
La Rabona 33 !74.25 4.00 4000 # # # # # # # # # #
CorazoH n Partido 34 !74.25 4.00 4100 ! ! ! ! ! ! ! ! ! #
El Trinagulo 40 !74.25 4.00 4100 ! ! ! ! ! ! ! ! ! #
Hooghiemstra, 1999; Behling et al., 1999; Wille et al.,2000). Notwithstanding these caveats, the Colombianpalaeoecological archive of vegetation change representsa remarkable record for Latin America, and indeed thewider tropics. The Colombian pollen data allow an un-derstanding to be developed of regional environmentalchange, and its impact on tropical vegetation composi-tion and distribution. This reconstruction rivals the res-olution commonly available from more temperatelatitudes where Quaternary science research has a longerancestry and wider research base.The technique of interpreting pollen data in terms of
biomes was initially developed to test reconstructed bi-
omes that are based on output from climate models,results being portrayed via a vegetation model (Prenticeet al., 1992; Haxeltine and Prentice, 1996). However, thetechnique has a much wider utility, particularly wherethe pollen data are of su$cient quantity and quality.A particular use is to determine vegetation dynamics thatcombine a spatial and temporal perspective. The stan-dard treatment of primary pollen data from Colombiapresented here allows for an objective investigation ofvegetation response to climatic forcing and past hu-man}vegetation interactions from 6000 BP to present.The 6000 BP starting point was chosen as it was the focusof the Latin American reconstruction (Marchant et al., in
R. Marchant et al. / Quaternary Science Reviews 20 (2001) 1289}1308 1291
review) and is a period of much study (Prentice andWebb, 1998). We aim to determine the causal factors indriving vegetation change since 6000 yr ago be they cli-matic, edaphic or human-induced and, ultimately toplace the present composition and distribution ofColombian vegetation within a relatively long time-frame.
1.1. Modern climate and vegetation
Climate in Andean Colombia can be classi"ed as tropi-cal diurnal (Kuhry et al., 1983). At a given location,di!erences in monthly temperature are small ((33C)although daily #uctuations may be large (203C), espe-cially in dry seasons. Precipitation is highest('10,000mmyr��) in the ChocoH Paci"c region due tothe proximal location of the Paci"c-based moisturesource and the steeply rising ground of the WesternCordillera. Within Andean Colombia, precipitation ishighest on the eastern, Llanos Orientales-facing slopes ofthe Eastern Cordillera. The concave nature of the East-ern Cordillera is thought to act as a natural receptacle formoisture with origin from the Atlantic Ocean. Low rain-fall is recorded within rain shadow areas, such as on thelower slopes of the Magdalena Valley and the inter-andean plains (Kuhry et al., 1983). Three Cordilleras ofthe northern Andes, that are described by approximately7000m of altitudinal change (Fig. 1), dominate Colom-bia. Applying a lapse rate of 6.63C 1000m�� (Van derHammen and GonzaH lez, 1965), this altitudinal riseequates to a temperature change of nearly 303C, and assuch results in a signi"cant change in vegetation recordedover a relatively small area. For example, there aretransitions from cool high-altitude grasslands to &temper-ate' forests at mid-altitudes and some of the most diversetropical rainforests in the world present within the ChocoHPaci"c region. Humbolt carried out the "rst descriptionof the vegetation belts of the Eastern Cordillera ofColombia during 1845 and 1847. Cuatrecasas (1958) pro-vided a more systematic survey that determined vegeta-tion zones based mainly on altitude and aspect (Fig. 1)with the distribution and composition of the zonal veg-etation belts re#ecting the prevailing climatic conditions.Van der Hammen and GonzaH lez (1960), and Cleef andHooghiemstra (1984) provide reviews of the vegetationcharacteristics of Andean Colombia with lowland veg-etation reviewed by Cavelier et al. (1998), Duivenvoorden(1995) and Gentry (1986); these reviews form the basis forthe Colombian biomes presented here (Fig. 1). As such,these reviews are the basis for interpreting the relativeposition of these biomes in response to environmentalchange, although with some caveats, particularly withrespect to regional variation in their altitudinal positions(Marchant et al., in press). Fig. 1 presents diagrammati-cally the distribution of vegetation in Colombia and thelocation of sites (Table 1) used for this analysis.
2. Method
Prentice et al. (1996) and Marchant et al. (in press)have described the biomisation technique. The steps in-volved in the technique are depicted diagrammatically inFig. 2. At the centre of the biomisation technique is theallocation of pollen taxa to a range of plant functionaltypes (PFTs), and how these combine to form biomes. Asis the case with biomes we can identify within the bio-sphere today, the constituent vegetation is comprised ofa series of identi"able component parts * in our casea suite of PFTs. The intermediate step of allocating thepollen to PFTs, rather than directly to biomes, allows theinternal composition of the biomes to be determined.Before turning the Colombian pollen data into biomes, itwas necessary to de"ne a conceptual framework thatrepresents Colombian vegetation; this framework is de-signed to be compatible with that identi"ed for thebroader scale Latin American biome reconstruction(Marchant et al., in review). The framework originallydeveloped for Latin America is based on gradients ofmoisture (Priestly}Taylor co-e$cient of plant-availablemoisture), temperature (mean temperature of the coldestmonth) and seasonality (growing degree-days) derivedfrom the global climate data set of Leemans andCramer (1991). This framework was tailored to "t theColombian vegetation after investigating the ecology,growth form and environmental constraints for thetaxa represented by their pollen. For example, thetropical rain forest biome includes non-frost-tolerantvegetation growing in humid regions, where the meancoldest-month temperature is '15.53C, and annualaverage temperature is in the range of 25}273C. Thisbiome occurs only in wettest regions of tropical LatinAmerica where rainfall meets '95% of annual evapor-ative demand (Prentice et al., 1992). This biome is charac-terised by structurally tall closed forest, 10 to '30m,usually mixed tree species with dense understorey andlow trees, plus liana thickets and emergent canopy. ForColombia this biome includes Amazonian, ChocoH andgallery rain forest. In addition to biomes determined byenvironmental constraints to growth, an additional cat-egory of °raded vegetation' was included. The ration-ale behind this was that within the time frame underinvestigation it is likely that human impact on the vegeta-tion would be an important factor. By including a de-graded vegetation category, it is possible to separatelikely cultural impacts on the biota from other forcingmechanisms such as climatic change. The PFTs occur-ring in Colombia (Table 2) can be placed into "ve maingroups; these comprise tropical (non-frost-tolerant), co-niferous (needle-leafed), temperate (frost-tolerant),xerophytic (drought-tolerant), and frost- and drought-tolerant taxa. The relationship between the altitudinalvegetation zonation and the Colombian biomes is por-trayed in Fig. 1.
1292 R. Marchant et al. / Quaternary Science Reviews 20 (2001) 1289}1308

Fig. 2. Schematic representation of the biomisation technique. The process moves from raw pollen data depicted on the left of the "gure to biomeoutput on the right.
Depending on the modern ecological range of theparent taxa responsible for producing the pollen identi"-able within our data sets, a total of 296 Colombian pollentaxa were assigned to one or more PFTs. These assign-ments were made following reference to the known biol-ogy of plants from several #oras (Kahn and de Granville,1992; Gentry, 1993), botanical and palynologicalstudies (Beard, 1955; Van der Hammen, 1963, 1972;Wijmstra and Van der Hammen, 1966; Cleef andHooghiemstra, 1984; Hooghiemstra and Cleef, 1984;Prance, 1985; Duivenvoorden and Cleef, 1994; Witte,1994; Hooghiemstra and Van der Hammen, 1998) andpersonal communication with modern ecologists andpalaeoecologists working in Colombia. The resultantpollen taxa vs. PFT assignments are presented in Table 3.One of the di$culties encountered in constructing thePFT}pollen matrix for Latin America was that manytaxa were multiply assigned to a number of PFTs asa result of the high intra-generic diversity and the wideecological ranges of the parent taxa present within somegenera (the level of identi"cation commonly achievedduring pollen analysis). Within the Colombian zoom, it ispossible to make the PFTs more re"ned; however,a number of pollen taxa are still assigned to a number ofPFTs due to the relatively cosmopolitan growth forms ofthe parent taxa involved (Table 3).The result of these assignments is that each pollen
taxon will contribute numerically, via the PFTs, toa number of biomes. The overall contribution is quanti-"ed in terms of a$nity scores to a biome. A problem canarise, as was the case in Latin America, where multiple
samples encompass the temporal range of time windows($100 and $250 radiocarbon years) used here. As thetemporal boundaries are relatively narrow, only two orthree samples encompass a single time window. Never-theless, multiple samples from a single site may havemaximum a$nity to di!erent biomes. In previous ap-plications when this was the case, the most commonbiome is used for mapping (Marchant et al., in review).Unfortunately, this approach results in some palaeoeco-logical information being lost within the presentation ofresults. For example, of two sites recording the TropicalRain Forest biome as dominant at two time intervals,one site demonstrates a large increase in the TropicalDry Forest biome; although it is still sub-dominant,using the current protocols this shift is not portrayed. Weknow that Colombian vegetation communities oftenconstitute a complex that incorporates components froma number of di!erent biomes. This is also likely to havebeen so during the past. This situation is particularlylikely to arise for sites located in ecotonal position, suchas near the boundary between di!erent biomes (Fig. 1).Therefore, when the highest a$nity scores are withina value of &5' of each other, then the two highest scoringbiomes are used to describe the reconstructed vegetation.Regrettably this still results in lost information. This canonly be fully preserved when the number of sites underanalysis is relatively restricted or a speci"c hypothesis isunder investigation (Marchant et al., in press). Withinour analysis, this is only possible when we test the rela-tionship between modern vegetation (Fig. 1) and themodern pollen-based reconstruction (Table 4).
R. Marchant et al. / Quaternary Science Reviews 20 (2001) 1289}1308 1293

Table 2The range of plant functional types and biomes identi"ed for Colombiaencompassed by the pollen sites under investigation. The assignment ofPFTs to biomes is also detailed
Codes Plant functional types
g Grassman Mangrovetx Tree fernsTr
�Wet tropical raingreen trees
Tr�
Dry tropical raingreen treesTe
�Wet tropical evergreen trees
Te�
Dry tropical evergreen treesctc
�Cool temperate conifer
txts Tropical xerophytic trees and shrubstf Tropical forbs/herbstef Temperate forbs/herbssf Steppe forbs/herbsaf Alpine forbs/herbscp Cushion plantswte Warm temperate broadleafed evergreen trees and shrubswte
�Cool temperate broadleafed evergreen trees and shrubs
wte�
Cool temperate sclerophyll shrubsts Temperate summergreen treesaa Alpine dwarf shrubsRud Cultivars/ruderal taxa
Codes Biomes Plant functional types
TRFO Tropical Rain Forest man, Tr�, Te
�, tf
TSFO Tropical Seasonal Forest Tr�, Te
�, tf, wte
TDFO Tropical Dry Forest Tr�, Te
�, txts, sf, tef
WEFO Warm Evergreen Forest Te�, tf, wte
CEFO Cool Evergreen Forest tx, tef, wte�, ts
WAMF Warm Mixed Forest Tx, ctc�, tef, wte, ts
COMI Cool Mixed Forest Tx, ctc�, tef, wte
�, wte
�STEP Steppe g, Tr
�, sf
CGSH Cool Grasslands g, cp, afCGSS Cool Grassland shrub g, af, aa, wte
�DEGE Degraded vegetation Rud
Table 3The assignment of Colombian pollen taxa to the plant functional typesused for the biomisation process
PFT codes Pollen taxa
g Poaceae
man Acrostichum, Avicennia, Rhizophora
tx Alsophila, Cnemidaria, Cyathea, Dicksonia
Tr�
Acalypha, Aegiphila, Alchornea, Anthodiscus, Anthos-tomella fuegiana, Apocynaceae, Araliaceae, Arecaceae,Arcella, Bombacaceae, Croton, Crotalaria, Hieronima,Heliocarpus, Humiria, Inga, Lamanonia, Lecythidaceae,Leguminosae, Loranthaceae, Macrolobium, Mal-pighiaceae, Malvaceae, Mauritia, Moraceae, Myrtaceae,Ocotea-type, Oreopanax, Piper, Pisonia, Polygonaceae,Rhipsalis, Rubiaceae, Rutaceae, Tiliaceae, Urticaceae,Vismia
Table 3 (Continued)
PFT codes Pollen taxa
Tr�
Acalypha, Alibertia, Andira-type, Annona, Aspidosperma,Astronium, Bignoniaceae, Byrsonima, Casearia-type, Con-volvulaceae, Copaifera, Coprosoma, Cordia, Coriaria,Cuphea, Curatella, Erythrina, Hieronima, Hymenophyl-leace, Ipomoea, Leguminosae, Malvaceae, Mauritia,Melastomataceae, Meliaceae, Meliosma, Mimosa,Palicourea, Panopsis, Piper, Rosaceae, Schinus, Trema,Vallea, Warswiczia, Xylosma
Te�
Alchornea, Amanoa, Anacardiaceae, Anemia, Apeiba,Apocynaceae, Arecaceae, Astronium, Bombacaceae, Bru-nellia, Bromeliaceae, Cardiospermum, Cecropia, Celas-traceae, Celtis, Clethera, Combretaceae, Didymopanax,Euphorbiaceae, Euterpe, Fabaceae, Ficus, Guettarda,Hedyosmum, Humulus, Ilex, Iriartea, Lecythidaceae,Leguminosae, Mabea, Machaerium, Macrolobium,Macrocarpea, Malpighiaceae, Mauritia, Marcgraviaceae,Maripa, Maytenus, Meliaceae, Menispermaceae,Moraceae, Myrsine, Myrtaceae, Ocotea-type, Oreopanax,Palmae, Pseudobombax, Pseudopanax laetevirens,Psychotria, Rauvolxa, Rubiaceae, Salix, Sapium,Sapotaceae, Schizolobium, Siparuna, Sophora, Spirotheca,Strutanthus, Taperira, Tetrochidium, Tournefortia, Ur-ticaceae, Vismia
Te�
Bauhinia, Bignoniaceae, Boraginaceae, Bougainvillea,Bromeliaceae, Brosimum, Brunellia, Bulnesia, Bursera,Caryophyllaceae, Casearia-type, Cecropia, Celtis,Crotolaria, Didymopanax, Hippocrateaceae, Humiria, Hy-menophyllaceae, Inga, Leguminosae,Macrocarpea, Men-ispermaceae, Metopium, Sapium, Sapotaceae, Schinus,Strutanthus, Taperira, Ternstroemia, Vitis, Warszewiczia,Xylosma
ctc�
Podocarpus
txts Acalypha, Alternanthera, Anacardiaceae, Bauhinia, By-rsonima,Byttneria, Caryocar, Casearia,Clusia, Colignonia,Copaifera, Cuphea, Curatella, Dodonaea, Erythrina, Evol-vus, Ipomoea, Larrea, Pepermonia, Protium, Schinus, Si-paruna, Stryphnodendron
tf Acanthaceae, Apiaceae, Apium, Asteraceae, Begonia,Bromeliaceae, Calyceraceae, Caryophyllaceae, Cru-ciferae, Eriogonum, Geraniaceae, Genipa, Gomphorena,Gunnera, Hebenaria, Hippeastrum, Hydrocotyle, Jungia,Justicia, Malvaceae, Moraceae, Muehlenbeckia, Ranun-culaceae, Rubiaceae, Scrophulariaceae, Siparuna, Thalic-trum, Umbelliferae, Urticaceae, Verbenaceae, Viburnum,Xyris
tef Acanthaceae, Apiaceae, Apium, Asteraceae, Borreria, Bra-vaisia, Bromeliaceae, Euphorbia, Galium, Genipa, Gom-phrena, Gunnera, Halenia, Hebenaria, Iresine, Iridaceae,Jungia, Justicia, Malvaceae, Moraceae, Nertea, Stevia,Umbelliferae, Urticaceae, Xyris, Zornia
sf Amaranthaceae/Chenopodiaceae, Anarcardiaceae,Apiaceae, Borreria, Caryophyllaceae, Ephedra,Eriocaulon, Eriogonum, Euphorbiaceae, Gaimardia, Gilia,Gleichenia, Gomphrena, Halenia, Hebenaria, Lamiaceae,Mutisia, Polygala, Rhamanaceae, Xyris
1294 R. Marchant et al. / Quaternary Science Reviews 20 (2001) 1289}1308

Table 3 (Continued)
PFT codes Pollen taxa
af Arenaria, Asteraceae, Astragalus, Azorella, Bartsia-type,Borreria, Calceolaria, Caryophyllaceae, Cruciferae,Draba, Epilobium, Eriocaulon, Eriogonum, Galium, Ger-anium, Gompherena, Hebenaria, Heliocarpus, Hippeas-trum, Hydrocotyle, Iridaceae, Lupinus, Lysipomia, Montia,Moritzia-type, Muehlenbeckia, Nertea, Oxalis, Polygonum,Portulaccaceae,Puya, Ranunculaceae, Relbunium, Rumex,Scrophulariaceae, Scutellaria-type, Selaginella, Senecio,Thalictrum, Umbelliferae, Valeriana, Verbenaceae, Viola,Xyris
cp Azorella, Caryophyllaceae, Plantago
wte Acalypha, Aegiphila, Alchornea, Alibertia, Allophylus,Araliaceae, Brunellia, Calliandra, Clusia, Croton,Crotolaria, Cydista, Daphnopsis, Embothrium, Euterpe,Genipa, Gentiana, Griselinia, Hedyosmum, Heliocarpus,Hydrangea, Ilex, Labiatae, Lamiaceae, Ludwigia, Luehea,Melastomatacae,Metopium, Mimosa, Myrica, Myrtaceae,Panopsis, Passiyora, Proteaceae, Schinus, Sebastiana,Solanaceae, Trema, Vernonia, Weinmannia
wte�
Abiata, Acaena-Polylepis, Aegiphila, Alnus, Asplenium,Bocconia, Brunellia, Clethra, Croton, Crotolaria,Dodonaea, Drimys, Ericaceae, Fuchsia, Hedyosmum, Hy-drangea, Juglans, Labiatae, Lamanonia, Loranthaceae,Melastomatacae, Miconia, Mimosa, Mutsia, Myrtaceae,Myrica, Myrsine, Passiyora, Quercus, Proteaceae,Pseudopanax, Psychotria, Solanaceae, Viburnum, Vicia,Weinmannia
wte�
Abatia, Acaena/Polylepis, Asteraceae, Bocconia,Daphanopsis, Dodoneae, Drimys, Ericaceae, Escallonia,Eugenia, Halenia, Hesperomeles, Hypericum, Jamesonia,Mutisia, Myrica, Myrtaceae, Pepermonia
ts Alnus, Cayaponia, Juglans, Loranthaceae, Palicourea,Styloceras, Thymelaeaceae, Ulmaceae, Vallea
aa Amaryllidaceae, Aragoa, Arcytophyllum, Asteraceae, Bac-charis, Cassia, Clethera, Cruciferae, Draba, Ephedra,Ericaceae, Escallonia, Gaiadendron, Gentianaceae, Gut-tiferae, Hypericum, Orycthantus, Puya, Ribes, Rosaceae,Rumex, Satureja, Sisyrinchium, Solanaceae, Tetrochidium,Valeriana
Rud. Alium, Amaranthaceae/Chenopodiaceae, Ambrosia,Eucalyptus, Mauritia, Phaseolus, Phylanthus, Pinus,Rumex, Schinus, Zea mays
2.1. Data sources
The pollen data are derived from sites that extend overa 4000m altitudinal range. Locational information re-garding the speci"c sites and age ranges encompassed bythe sediments is provided within Table 1. All data usedfor this reconstruction are raw pollen counts; this allowsfor the allocation of all pollen taxa determined by theoriginal analyst to PFTs, rather than would be the case if
digitised data sets were used. For sites where multiplecores are available, the single core with the best age rangefor our analysis is used; for these sites the original corenotation has been used to specify which core is used.One hundred and eighteen samples derived from core
tops ((250 BP) taken from 40 sites comprise the mod-ern data set (Table 1, Fig. 1). Only 37 of these sites wereused for the Mid- to Late-Holocene analysis (Table 5)because only sites with secure radiocarbon-based chro-nologies can be used. For each site, the time windowapproach used involves analysing fossil samples withina narrow range of radiocarbon years either side of a cen-tral date. To determine which samples should undergobiomisation, on a site-by-site basis, a linear age}depthmodel was applied to the strati"ed pollen data. Sampleswere identi"ed as being temporally secure after checkingthe available dating control for any anomalies. Parti-cularly we checked which sites had sedimentary hiati,rapid changes in sediment type and dating problems(such as age reversals and large standard errors attachedto the uncallibrated radiocarbon data). The resolutionrequired to select samples at 500 yr intervals was onlycommon towards the tops of the sedimentary recordswhere reduced sediment compression has allowed fora higher temporal resolution to be achieved. Therefore,the period from the present to 3000 BP is represented bytime windows every 500 yr, each with a temporal range of$100 yr. Between 6000 and 3000 BP, 1000 yr intervalsbetween each time windows are employed with a tem-poral range of $250 BP.All samples that were within the age range for each
time window were compiled to produce a combined "lethat was then checked to standardise nomenclature(Fig. 2). For example, the combined "le contains manytaxa that contain synonyms such as Gramineae andPoaceae, Myrsine and Rapanea; these were combined toform a single taxon using the nomenclature after Kewen-sis (1997). All aquatic taxa were removed from the com-bined "le as these commonly respond to more localenvironmental conditions, particularly hydrology, ratherthan being re#ective of the wider environment. This re-moval includes Cyperaceae; although this pollen taxon isan important component of dryland savannahs, unfortu-nately it is also associated with the local swamp vegeta-tion. Inclusion of this taxon with the pollen vs. PFTmatrix would lead to many sites, which can be dominatedby Cyperaceae, recording the tropical dry forest biomeerroneously. It has been suggested that Poaceae pollencould similarly be excluded from our analysis (MarkBush, pers. comm.). However, as the distribution of thistaxon is more widespread throughout our range of veg-etation types, and as such would not add bias to a par-ticular biome, it is retained for the analysis. In total, 37sites had samples that could be included in our analysisat past time windows although not all the sites havesamples present at every time window (Table 1).
R. Marchant et al. / Quaternary Science Reviews 20 (2001) 1289}1308 1295
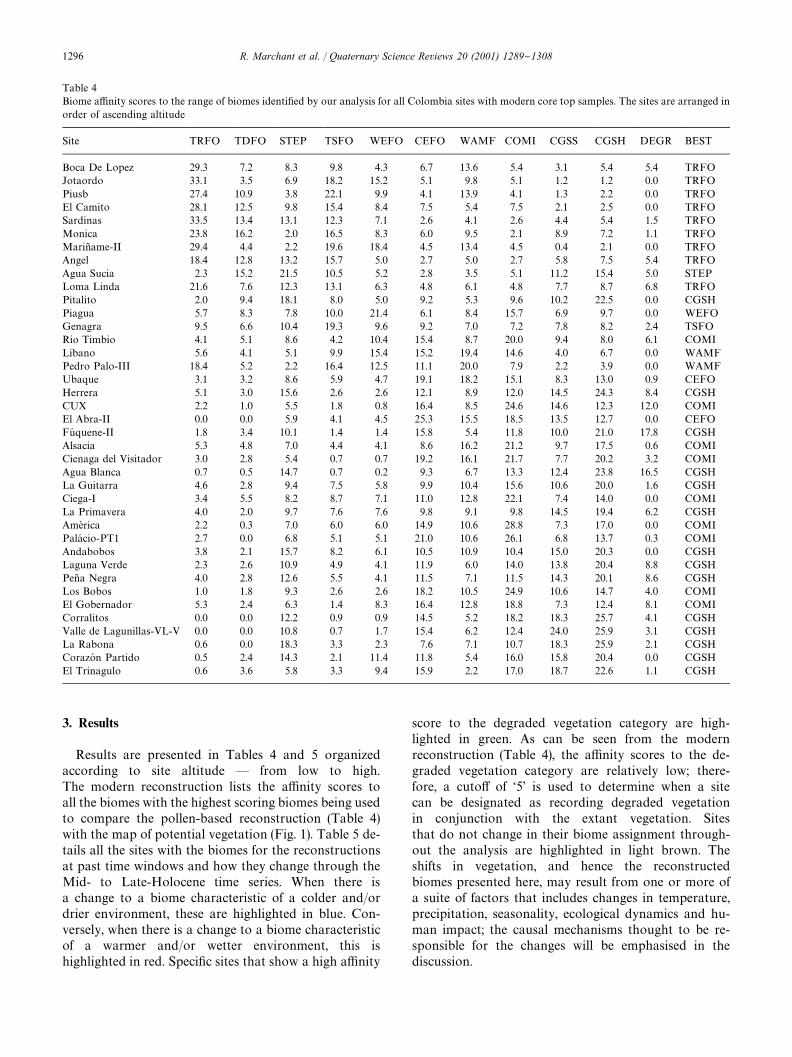
Table 4Biome a$nity scores to the range of biomes identi"ed by our analysis for all Colombia sites with modern core top samples. The sites are arranged inorder of ascending altitude
Site TRFO TDFO STEP TSFO WEFO CEFO WAMF COMI CGSS CGSH DEGR BEST
Boca De Lopez 29.3 7.2 8.3 9.8 4.3 6.7 13.6 5.4 3.1 5.4 5.4 TRFOJotaordo 33.1 3.5 6.9 18.2 15.2 5.1 9.8 5.1 1.2 1.2 0.0 TRFOPiusb 27.4 10.9 3.8 22.1 9.9 4.1 13.9 4.1 1.3 2.2 0.0 TRFOEl Camito 28.1 12.5 9.8 15.4 8.4 7.5 5.4 7.5 2.1 2.5 0.0 TRFOSardinas 33.5 13.4 13.1 12.3 7.1 2.6 4.1 2.6 4.4 5.4 1.5 TRFOMonica 23.8 16.2 2.0 16.5 8.3 6.0 9.5 2.1 8.9 7.2 1.1 TRFOMarin� ame-II 29.4 4.4 2.2 19.6 18.4 4.5 13.4 4.5 0.4 2.1 0.0 TRFOAngel 18.4 12.8 13.2 15.7 5.0 2.7 5.0 2.7 5.8 7.5 5.4 TRFOAgua Sucia 2.3 15.2 21.5 10.5 5.2 2.8 3.5 5.1 11.2 15.4 5.0 STEPLoma Linda 21.6 7.6 12.3 13.1 6.3 4.8 6.1 4.8 7.7 8.7 6.8 TRFOPitalito 2.0 9.4 18.1 8.0 5.0 9.2 5.3 9.6 10.2 22.5 0.0 CGSHPiagua 5.7 8.3 7.8 10.0 21.4 6.1 8.4 15.7 6.9 9.7 0.0 WEFOGenagra 9.5 6.6 10.4 19.3 9.6 9.2 7.0 7.2 7.8 8.2 2.4 TSFORio Timbio 4.1 5.1 8.6 4.2 10.4 15.4 8.7 20.0 9.4 8.0 6.1 COMILibano 5.6 4.1 5.1 9.9 15.4 15.2 19.4 14.6 4.0 6.7 0.0 WAMFPedro Palo-III 18.4 5.2 2.2 16.4 12.5 11.1 20.0 7.9 2.2 3.9 0.0 WAMFUbaque 3.1 3.2 8.6 5.9 4.7 19.1 18.2 15.1 8.3 13.0 0.9 CEFOHerrera 5.1 3.0 15.6 2.6 2.6 12.1 8.9 12.0 14.5 24.3 8.4 CGSHCUX 2.2 1.0 5.5 1.8 0.8 16.4 8.5 24.6 14.6 12.3 12.0 COMIEl Abra-II 0.0 0.0 5.9 4.1 4.5 25.3 15.5 18.5 13.5 12.7 0.0 CEFOFuH quene-II 1.8 3.4 10.1 1.4 1.4 15.8 5.4 11.8 10.0 21.0 17.8 CGSHAlsacia 5.3 4.8 7.0 4.4 4.1 8.6 16.2 21.2 9.7 17.5 0.6 COMICienaga del Visitador 3.0 2.8 5.4 0.7 0.7 19.2 16.1 21.7 7.7 20.2 3.2 COMIAgua Blanca 0.7 0.5 14.7 0.7 0.2 9.3 6.7 13.3 12.4 23.8 16.5 CGSHLa Guitarra 4.6 2.8 9.4 7.5 5.8 9.9 10.4 15.6 10.6 20.0 1.6 CGSHCiega-I 3.4 5.5 8.2 8.7 7.1 11.0 12.8 22.1 7.4 14.0 0.0 COMILa Primavera 4.0 2.0 9.7 7.6 7.6 9.8 9.1 9.8 14.5 19.4 6.2 CGSHAmeH rica 2.2 0.3 7.0 6.0 6.0 14.9 10.6 28.8 7.3 17.0 0.0 COMIPalaH cio-PT1 2.7 0.0 6.8 5.1 5.1 21.0 10.6 26.1 6.8 13.7 0.3 COMIAndabobos 3.8 2.1 15.7 8.2 6.1 10.5 10.9 10.4 15.0 20.3 0.0 CGSHLaguna Verde 2.3 2.6 10.9 4.9 4.1 11.9 6.0 14.0 13.8 20.4 8.8 CGSHPen� a Negra 4.0 2.8 12.6 5.5 4.1 11.5 7.1 11.5 14.3 20.1 8.6 CGSHLos Bobos 1.0 1.8 9.3 2.6 2.6 18.2 10.5 24.9 10.6 14.7 4.0 COMIEl Gobernador 5.3 2.4 6.3 1.4 8.3 16.4 12.8 18.8 7.3 12.4 8.1 COMICorralitos 0.0 0.0 12.2 0.9 0.9 14.5 5.2 18.2 18.3 25.7 4.1 CGSHValle de Lagunillas-VL-V 0.0 0.0 10.8 0.7 1.7 15.4 6.2 12.4 24.0 25.9 3.1 CGSHLa Rabona 0.6 0.0 18.3 3.3 2.3 7.6 7.1 10.7 18.3 25.9 2.1 CGSHCorazoH n Partido 0.5 2.4 14.3 2.1 11.4 11.8 5.4 16.0 15.8 20.4 0.0 CGSHEl Trinagulo 0.6 3.6 5.8 3.3 9.4 15.9 2.2 17.0 18.7 22.6 1.1 CGSH
3. Results
Results are presented in Tables 4 and 5 organizedaccording to site altitude * from low to high.The modern reconstruction lists the a$nity scores toall the biomes with the highest scoring biomes being usedto compare the pollen-based reconstruction (Table 4)with the map of potential vegetation (Fig. 1). Table 5 de-tails all the sites with the biomes for the reconstructionsat past time windows and how they change through theMid- to Late-Holocene time series. When there isa change to a biome characteristic of a colder and/ordrier environment, these are highlighted in blue. Con-versely, when there is a change to a biome characteristicof a warmer and/or wetter environment, this ishighlighted in red. Speci"c sites that show a high a$nity
score to the degraded vegetation category are high-lighted in green. As can be seen from the modernreconstruction (Table 4), the a$nity scores to the de-graded vegetation category are relatively low; there-fore, a cuto! of &5' is used to determine when a sitecan be designated as recording degraded vegetationin conjunction with the extant vegetation. Sitesthat do not change in their biome assignment through-out the analysis are highlighted in light brown. Theshifts in vegetation, and hence the reconstructedbiomes presented here, may result from one or more ofa suite of factors that includes changes in temperature,precipitation, seasonality, ecological dynamics and hu-man impact; the causal mechanisms thought to be re-sponsible for the changes will be emphasised in thediscussion.
1296 R. Marchant et al. / Quaternary Science Reviews 20 (2001) 1289}1308

Table5
Biomereconstructionatpasttimewindowsof6000,5000,4000,3000,2500,2000,1500,1000,500BPandpresent-day.W
herethebiomeschange
fromone
timewindowto
thenext,thisisclassi"ed
into
twodi!erentresponses:when
thereisashiftto
abiomeindicativeofawetterand/orwarmer
environm
entthisisindicated
byred;whenthereisashiftto
abiomeindicativeofadrier
and/orcooler
environmentthisisindicated
byblue.When
sitesdem
onstratean
a$nityto
thedegraded
vegetationcategory
(a$nity
score
'5)thisishighlighted
ingreen.Sites
that
donotchange
theirbiom
eassignmentthroughoutou
ranalysisarehighlighted
inlight
brow
n.
R. Marchant et al. / Quaternary Science Reviews 20 (2001) 1289}1308 1297

3.1. Modern biome reconstruction
A visual comparison of biomes reconstructed fromcore tops (Table 4) with a map of potential modernvegetation (Fig. 1) shows that for the majority of the sites,the biomes predicted from the modern core-top pollendata accurately re#ect the broad features seen in thevegetation map derived from the Atlas of Colombia(IGAC, 1998). Sites at low altitudes ((300m) are mainlyassigned to the Tropical Rain Forest biome (e.g. Boca DeLopez, El Caimito, JotaordoH , Angel, Loma Linda, Piusbi,Sardinas, Marin� ame-II and Monica-3). However, withinthese broad classi"cations there is signi"cant variation;Boca De Lopez, JotaordoH and Marin� ame-II are the only&true' Tropical Rain Forest sites as demonstrated by thea$nity scores to the other biomes being very low. Inter-estingly, JotaordoH , from the Paci"c ChocoH , has the lowesta$nity to biomes other than the Tropical Rain Forestassignment. These true Tropical Rain Forest sites are inmarked comparison to El Caimito, Angel, Loma Lindaand Piusbi; although registering Tropical Rain Forest asthe most dominant biome, they also have a high a$nityto the Tropical Dry Forest, Tropical Seasonal Forest andSteppe biomes, these assignments being indicative ofmore open vegetation. The other assignment recorded atlow altitudes is Steppe (e.g. Agua Sucia); this site also hasa high a$nity to the Cool Grassland Shrub biome.Sites located at mid-altitudes (1700}2600m) are de-
scribed by a number of di!erent biomes including Tropi-cal Seasonal Forest (Genagra), Warm Mixed Forest(Pedro Palo-III, Libano and Piagua), Cool Mixed Forest(CUX and Rio Timbio), Steppe (Genagra) and CoolEvergreen Forest (El Abra II) biomes. Within this widerange of biomes, Warm Evergreen Forest and TropicalSeasonal Forest are more commonly assigned at themore mesic lower elevations (Table 4). It is noteworthythat between Loma Linda (310m) and Pitalito (1300m)the a$nity scores to the Tropical Rain Forest biomedecrease signi"cantly. Sites within the altitudinal range of2600}3800m are most commonly characterised by theCoolMixed Forest biome (e.g. Cienaga del Vistador) andthe Cool Grassland Shrub biome (e.g. La Primevera), thelatter being more common towards the top of this al-titudinal range. A number of sites within this altitudinalrange (e.g. Agua Blanca, Andabobos and La Guitarra)demonstrate Cool Grassland Shrub as being the domi-nant biome although these sites also have high a$nityscores to the Cool Evergreen Forest and Cool MixedForest biomes. Many of the sites with a high a$nity tothe Cool Grassland Shrub biome also comprise degradedvegetation. Above 3800m the dominant biome is CoolGrassland Shrub with the a$nity to arboreal biomesbeing quite low, as recorded at CorazoH n Partido, LaRabona and Lagunillas. The latter site also comprisesa high a$nity to the Cool Grassland biome. Approxim-ately 25% of all the sites exhibit a high a$nity ('5) to
the degraded vegetation category, this being recordedthroughout the altitudinal range.
3.2. Past biome reconstructions
The biomes reconstructed for each time window arelisted in Table 5; these will be described for each timewindow with an emphasis placed on how the given re-construction has varied in relation to the previous recon-struction.
3.2.1. 6000$250 BPThe 6000$250 BP reconstruction (Table 5) shows an
increase in biomes characteristic of more xeric environ-ments in comparison to the present-day (Fig. 1). Forexample, the Tropical Rain Forest (TRFO) biome thatpresently dominates Boca De Lopez is co-dominant withTropical Seasonal Forest (TSFO) at this period. Sim-ilarly, Loma Linda has a more open reconstructed veg-etation with the Tropical Rain Forest and Steppe (STEP)biomes co-dominant, relative to the TRFO biome recon-struction of the present-day. One of the main changes atmid-altitudes is an increase in the number of Cool Ever-green Forest (CEFO) biome assignments, particularly atthe demise of the Cool Mixed Forest (COMI) biome.A common change at higher altitude sites is a shift fromthe Cool Grassland Shrub (CGSH) biome assignmentrecorded for the present-day to an increase in the CoolEvergreen Forest and Cool Mixed Forest biomes. Rela-tive to the present-day, no site records a relatively higha$nity to the degraded vegetation (DEGR) category.
3.2.2. 5000$250 BPThe 5000$250 BP reconstruction is characterised by
some sites, particularly those at lower altitudes, shiftingtowards more xeric biomes whereas the reverse shift isrecorded at higher altitudes (Table 5). For example, rela-tively low altitudinal sites indicate more open vegetationwith El Pin� al losing the co-dominance with the TropicalDry Forest biome component; the site being character-ised by the Steppe biome. Boca De Lopez and Largaboth exclude a co-dominant biome (Steppe and TropicalSeasonal Forests, respectively), becoming dominated bythe Tropical Rain Forest biome, the former site demon-strating co-dominance with the degraded vegetationcategory. An expansion in the number of the Cool Grass-land Shrub biomes is recorded at mid-altitudes; forexample, CUX exhibits a transition from Cool EvergreenForest to co-dominance of Cool Evergreen Forest andCool Grassland Shrub biomes (Table 5). This latter bi-ome also expands its range at higher altitudes, PedroPalo-III, La Primavera and Palacio all becoming domin-ated by this biome. The only site to exhibit a high a$nityto the degraded vegetation category (Boca De Lopez) issituated at a coastal location and quite northwards fromthe main concentration of sites (Fig. 1).
1298 R. Marchant et al. / Quaternary Science Reviews 20 (2001) 1289}1308

3.2.3. 4000$250 BPThe reconstruction at 4000$250 BP is largely similar
to the broad trends recorded at 5000$250 BP. At rela-tively low altitudes the majority of sites do not changebiome assignments although Carimague demonstratesan increase in the presence of the Steppe biome at thedemise of the Tropical Dry Forest biome. At mid-alti-tudes, there is a coherent increase in the amount of CoolEvergreen Forest, as recorded at CUX, FuH quene-II andHerrera. At higher altitudes, as in the previous period,there is an increase in the Cool Grassland Shrub biome,now being recorded at Agua Blanca, La Guitarra andCiega. The number of sites to exhibit a high a$nity to thedegraded vegetation category remains unchanged rela-tive to the previous time window although the a$nity tothis category at Boca De Lopez is reduced.
3.2.4. 3000$250 BPBetween the 4000$250 and 3000$250 BP time win-
dows all the sites that change are characterised by a shiftto biomes indicative of a warmer/wetter environment.Interestingly, the shifts are most commonly recorded atmid-altitude sites with the transition concentrated be-tween Libano (1820m) and Pena� Negra (3625m). Mostof the changes are characterised by an increase in theCool Evergreen Forest and Cool Mixed Forest biomesrelative to the previous period. Fewer sites from lowaltitudes change assignment relative to the previous timewindow. Carimague exhibits an increased a$nity to theTropical Rain Forest biome, Libano an increase in theTropical Seasonal Forest biome and El Pin� al exhibitsa high a$nity to the degraded vegetation category rela-tive to the previous time window.
3.2.5. 2500$100 BPThis time window records relatively few sites changing
their biome assignment relative to the previous period.However, a number of sites at mid-altitudes (AguaBlanca and Pedro Palo-III) shift toward more xeric bi-omes; for example, the former site excluding the grass-land component. Sites at high altitudes (Ciega I and ElGobernador) all show an inverse response, with an in-crease in the Cool Grassland Shrub component. Thenumber of sites with an a$nity to the degraded vegeta-tion category increases three-fold relative to the previoustime window; sites recording a relatively high a$nity tothis category remain to be recorded at low altitudes.
3.2.6. 2000$100 BPSimilar to the previous time window, the majority of
the sites do not change in their biome assignments, in-deed, only three low altitude sites change. El Caimito andMonica-3 demonstrate a transition from the TropicalRain Forest to the Tropical Seasonal Forest biome.Carimague demonstrates a transition from the TropicalSeasonal Forest to the Tropical Rain Forest biome.
Similar to the last time window, the number of sitesexhibiting an a$nity to the degraded vegetation categoryincreases. This increase remains to be recorded at therelatively low altitudes, now extending as high asGenagra (1750m).
3.2.7. 1500$100 BPSimilar to the previous time window, the
1500$100 yr BP reconstruction is characterised by rela-tively few sites ("ve) changing their assignments. Two ofthe sites (Agua Blanca and Palacio) are characterised byan increase in the Cool Mixed Forest biome: a transitionto a more mesic vegetation type. The reverse situation isapparent from Pena� Negra with an increase in the CoolGrassland Shrub biome. Pedro Palo-III is characterisedby a change to the Warm Mixed Forest biome. Relativeto the last time window, the total number of sites exhibi-ting an a$nity to the degraded vegetation category doesnot change, although the record from Herrera (2500m)exhibits vegetation disturbance whereas the record fromCarimagua is truncated at this point.
3.2.8. 1000$100 BPThis time window is characterised by broadly similar
biomes to the previous time window, although four highaltitude sites (Ciengra del Vistador, Guasca, Palacio andPena� Negra) show an increase in the Cool Mixed Forestand Cool Evergreen Forest biomes with a concomitantreduced a$nity to the Cool Grassland Shrub biome.Two mid-altitude sites (Herrera and Piagua) demon-strate an increase in the Cool Grassland Shrub biome.The main factor to change at this time window is anincrease in the number of sites recording a high a$nity tothe degraded vegetation category with two new sitesrecording this signal. Indeed, the majority of the sitesfrom 0m (Boca De Lopez) to 2580m (FuH quene-II) nowrecord a high a$nity to this category.
3.2.9. 500$100 BPRelative to the previous time window, this period is
dominated by an increase in mesic biomes, with 12 sitesout of 17 that change their biome assignment conformingto this trend. The dominant change is for sites, parti-cularly above 2500m, to exhibit an increase in the CoolGrassland Shrub biome. Sites located at lower altitudesare characterised by an increase in the Tropical SeasonalForest biome. Interestingly, three of the four sites thatdemonstrate a shift to more xeric biomes (Pedro Palo-III,Genagra and Piagua) are located within a narrow al-titudinal range (1700}2000m). As in the previous timewindow, one of the main factors to change at this timewindow is an increase in the number of sites recordinga high a$nity to the degraded vegetation category. Thissignal is now recorded by sites throughout the majorityof the altitudinal range considered here (0}3625m).
R. Marchant et al. / Quaternary Science Reviews 20 (2001) 1289}1308 1299

3.3. Transition to modern reconstruction
The transition from 500 BP to the modern reconstruc-tion is characterised by a relatively low amount of changein biome assignment in comparison to the previous peri-od. The changes in biome assignments, unlike the pre-vious time windows, are not coherent. The most notablechange is the increase in the number of sites recordinga high a$nity to the degraded vegetation category withthe majority of sites recording such a transition. Unlikeprevious periods this is now recorded at all but thehighest altitude sites.
3.4. Temporal biome development
In addition to recording how sites change over theMid- to Late-Holocene period, for each time window it isalso possible to describe how the vegetation has changedat a single site. The vegetation change at a particular sitecan be classi"ed into three categories: (1) sites whosepollen data record change in a broadly coherent patternthroughout the past 6000 yr and therefore are re#ectiveof broad-scale environmental changes; (2) sites that re-cord oscillations between di!erent biome assignmentsand may be located in an ecotonal position where thepollen-based reconstruction may &#icker' between twobiomes and (3) sites whose pollen data do not recordchange in their biome assignment throughout our analy-sis (Table 5). The "rst two categories have been describedwithin the individual time windows above; those siteswhose pollen data do not record change are the focushere. The sites to maintain the same overall biome are: LaRabona and Lagunillas that support the Cool Grasslandand Shrub biome, El Abra-II that continues to supportthe Cool Evergreen Forest biome, Angel, Puisbi andSardinas, that continue to support the Tropical RainForest biome and Agua Sucia that continues to supportthe Steppe biome. The reasons for the constancy of theseassignments will be discussed below.
4. Discussion
The discussion will focus on a number of synchronousresponses of the Colombian pollen data, as portrayed viathe biome reconstructions, to Mid- to Late-Holoceneenvironmental change (Table 5). Initially we focus on themodern reconstruction, particularly on how the pollen-based vegetation reconstruction concurs with the poten-tial vegetation (Fig. 1). We will then discuss how theColombia vegetation has responded to the Mid-Holo-cene period, a transition to mesic environmental condi-tions between 4000 and 3000 BP. This is followed bya period of relatively little change in overall biome re-sponse. We interpret the latter as a period of environ-mental stability prior to between 1000 and 500 BP when
there is a transition to more xeric biomes recorded ata range of altitudes. A particular focus will be on thespread of a$nity to the degraded vegetation category.This will be discussed in the light of archaeological evid-ence of cultural development and how this may haveimpacted on the vegetation and the resultant pollen re-cords. Throughout the discussion of these thematic areas,a particular emphasis will be placed on the location andaltitudinal position of vegetation response to environ-mental change.
4.1. Modern reconstruction
Two reassuring factors are noticeable from the modernreconstruction. Firstly, vegetation, via its pollen proxy, ishighly sensitive to the changing environmental gradientscharacteristic of the Andean Cordilleras and lowlandtransitions from Tropical Rain Forest to savannah eco-systems (Fig. 1). This is most apparent in the reconstruc-tions from high-altitude sites situated close to the forestlimit where the vegetation change is most sensitive toenvironmental thresholds (Marchant et al., in press). Sec-ondly, catchments that are known to exert an edaphicin#uence on the extant vegetation, e.g. the catchment ofAgua Sucia supporting Steppe, surrounded by tropicalrain forest, are assigned to the biomes correctly, eventhough our conceptual framework for the biomes isbased on the climatological tolerances of vegetation. Ourbiomes reconstructed from the pollen data are unable todi!erentiate between savannas that are a function ofedaphic, rather than climatic in#uences. Basing our inter-pretations within an understanding of site-speci"c envir-onmental conditions we can indicate the likely source orbu!er to paleoenvironmental change. For example, al-though there has been signi"cant climate change over theLate Quaternary, El Pin� al re#ects virtually unchangedpollen spectra due to strong edaphic in#uence (Behlingand Hooghiemstra, 1999). Furthermore, the frameworkis able to di!erentiate intra-biome di!erences when therange of a$nity scores is investigated. For example, ElCaimito, Angel, Piusbi and JotaordoH all record theTropical Rain Forest biome as dominant. JotaordoH islocated in the ChocoH Paci"c region, El Caimito andPiusbi are located farther to the south where the climateis drier (although still hyper-humid), whereas Angel islocated within a gallery forest situation and is associatedwith the highest a$nity scores to the Tropical Dry For-ests and Steppe biomes.Due to the #oristic and structural similarities between
warm and cool grasslands (Tarasov et al., 1998), grass-dominated biomes can be di$cult to distinguish fromone another. By careful assignment of the pollen taxa toPFTs (Table 3), di!erentiation is possible, although thereremains a high a$nity score for the Cool GrasslandShrub biome at low altitudes with the reverse for theSteppe biome at high altitudes. For example, Timbio and
1300 R. Marchant et al. / Quaternary Science Reviews 20 (2001) 1289}1308
Herrera, both mid-altitude sites, record Cool GrasslandShrub although it is likely this was a composite vegeta-tion association between our warm and cool grasslandbiomes. Nevertheless, using the biomisation method theColombian pollen data are shown to resemble large-scalevegetation patterns despite many pollen taxa havinga di!erent ecological interpretation under di!erent envir-onmental settings (Grabandt, 1980). Representation ofparent vegetation by pollen is likely to be subjected tointer-annual variability (Behling et al., 1997), and tropicalvegetation is di$cult to reconstruct through pollen as-semblages (Bush, 1991; Mancini, 1993; Bush and Rivera,1998; Marchant and Taylor, 2000). These factors demon-strate the importance of careful construction of the initialinput matrices for the biomisation process, and allowingthe multiple assignment of the pollen taxa to the PFTs.One of the possible problems in providing a reliable
modern calibration is the signal imparted by consider-able extent of human impact on the modern vegetation.However, within our analysis the &modern' samples arederived from sedimentary columns and hence they maystem from the last century and be re#ective of a periodprior to this intensive human-induced change. The largeincrease in the number of sites recording the Cool Grass-land Shrub biome, particularly at mid-altitude sites thatshould support Cool Mixed Forest and/or Cool Ever-green Forest, is thought to exhibit human impact withpollen spectra increasingly being dominated by Poaceaeand hence recording a shift to a more open vegetation.Within our analysis, Poaceae cannot be used as an indi-cator of vegetation disturbance because it is an importantcontributor to high- and low-altitudinal grass-dominatedbiomes, and this allocation would result in many siteserroneously recording anthropogenic impact. The num-ber of sites recording a$nity to the degraded vegetationcategory are quite numerous beyond the recent historicalperiod, thus vegetation disturbance in Colombia hasa greater longevity than the colonial period; this will bediscussed further. The lack of a coherent transition be-tween our 500 BP and modern reconstructions mayre#ect a period of "ne adjustment of the vegetation to thepervasive climatic regime, with sites &#ickering' betweenthe most dominant biomes. Notwithstanding these reser-vations, the generally correct biome assignments for thespeci"c sites, when compared to a map of potential veg-etation (Fig. 1), con"rm the robustness of our applicationof the biomisation method to the Colombian pollen data,and validate the design of our input matrices. Thus, ourreconstructions at past time windows can be carried outwith con"dence.
4.2. Mid-Holocene warm period and biome response
The records of dry environmental conditions vary con-siderably between sites * occurring broadly between6500 and 4500 BP (Behling et al., 1999). Our data indi-
cate that the cooling is recorded by higher altitude siteswhile there was continued warming at lower altitudes.Although, Bosman et al. (1994) suggested that relativelywarm conditions persisted within Colombia until 6500BP, the results presented here indicate that the trendtowards relatively drier climatic conditions continueduntil at least 5000 BP, and commonly is recorded at highaltitudes, where the forest limit lowered. Indeed, tree lineappears to have been at its lowest between 7000 and 5000BP (Kuhry, 1988) reaching 3100m between 6650 and5200 BP (Bosman et al., 1994). For example, within theFuH quene-II sediments, the Mid-Holocene hypsithermalis recorded by maximum levels of Quercus (Van Geel andVan der Hammen, 1973). Within our analysis, this max-imum increases the a$nity to the Cool Evergreen Forestbiome, whereas at lowland situations, for exampleCarimague, change is characterised by an increase in theSteppe/Tropical Dry Forest complex.Overall, our reconstruction starts with a range of bi-
omes re#ective of a warmer environment relative to thepresent-day. This environmental signal is recordedthroughout the majority of our sites and therefore islikely to represent a regional signal of environmentalchange. Indeed, a dry phase is recorded at many sites innorthwestern South America where savanna woodlandelements were replaced by deciduous forest elements(Markgraf, 1989). Farther south, the Holocene hypsither-mal period appears to have begun about 8900 BP innorthern Argentina with a particularly dry periodaround 6400 BP (Alcalde and Kulemeyer, 1999). A sim-ilar onset is also recorded in northern Chile, where desic-cation of the Puna ecosystem is recorded between 8000and 6500 BP (Baied and Wheeler, 1993). On the centralPeruvian Andes a dry warm climate is experienced be-tween 7000 and 4000 BP (Hansen et al., 1994). As withinour reconstruction, this warming is not just restricted tohigh-altitude sites; in lowland Chile, drier than presentconditions continued from the early Holocene until ap-proximately 5000 BP (Heusser, 1982). In contrast to therelatively equatorial sites of Colombia, the circum-Car-ribean area records a shift to dry conditions much later,where it occurs at approximately 2500 BP (Bradburyet al., 1981; Bush et al., 1992; Curtis et al., 1999). Thisrelative warm period is also recorded within a range ofdi!erent environmental systems other than a purely veg-etation response. For example, between 6000 and 3800BP the level of Lake Titicaca was approximately 100mbelow the present-day level with modern water levels notbeing reached until about 2100 BP (Cross et al., 2000).A similar response is recorded by Lake Valencia (Brad-bury et al., 1981). This regional picture of a warmerclimate is also apparent from the ���O record of an icecore taken from highland Peru that indicates Mid-Holo-cene climatic warming between 8200 and 5200 BP, withmaximum aridity between 6500 and 5200 BP (Thompsonet al., 1995).
R. Marchant et al. / Quaternary Science Reviews 20 (2001) 1289}1308 1301
Unlike the large temperature changes associated withfull glacial conditions, the temperature changes asso-ciated with the Holocene hypsithermal are thought to berelatively small, possibly about 13C warmer relative totoday. This shift is consistent with the Holocene recon-struction by COHMAP (1988). Although Servant et al.(1993) suggested that dry periods were more frequentduring the Mid-Holocene, the moisture #ux was likelyalso changed with the seasonally dry interval being moreprominent (Markgraf, 1989). One of the main mecha-nisms used to determine moisture shifts is #uctuations inthe Southern Oscillation and the migration of the Inter-Tropical Convergence Zone (ITCZ) (Martin et al., 1997).However, due to the topographical in#uence of theAndes and the convergence of westerly and easterlywinds, the ITCZ has a sinusoidal pro"le over northernSouth America. Therefore, to explain moisture changesin Colombia, we need to demonstrate the importance ofconvective moisture sources. According to Martin et al.(1993), El Nin� o conditions were numerous prior to our4000 BP reconstruction with polar frontal systems beingblocked due to an enhancement of the subtropical jetstream. This climatic scenario would lead to an aridityresponse of vegetation in Colombia due to decreasedsoutherly and westerly advective moisture following re-duced in#uence of polar advection within the tropicalzone. The winter period in particular would be drier(Servant et al., 1993). Alternatively, the asynchronoustiming of environmental changes across tropical Americamay suggest orbital control over climatic changes thatare analogous to the mechanism that drives the Afro-Asian monsoon (Cross et al., 2000). To determine thevalidity of this mechanism modelling studies are needed,such as those focused at a similar period on SaharanAfrica (Kutzbach et al., 1996). These link the observedenvironmental changes to increased monsoon activitydue to orbitally driven increase in northern hemisphereinsolation. Whatever the mechanism used to explain thevegetation changes, tropical palaeoecology is highly re-sponsive and able to describe global environmental cha-nges. For example, the Holocene record of decreasedmethane, detected within the GRIP ice cores, may bere#ective of Mid-Holocene drying of southern hemi-sphere wetlands. The tropical records seem to be more inphase with the observed changes than those from moretemperate latitudes (Cross et al., 2000).
4.3. Relatively rapid environmental change about 3500 BP
From our analysis, a Mid-Holocene period of vegeta-tion change in response to a wetter environment occursbetween our 4000 and 3000 BP time windows. Thissynchronous climatic signal to wetter climatic conditionsis thought to be centred between 3860 and 3590 BP(Behling et al., 1999). At many lowland sites thistransition is characterised by a marked increase in palms
(Mauritia and Mauritella) that began approximately 3800BP in response to a wetter climate, probably with a shortdry season and/or human in#uence (Behling andHooghiemstra, 1999). It appears that this period is char-acterised by a shift that ended the preceding dry periodwith some systems, such as rivers, lagging in response toa changed hydrological regime. For example, Van derHammen et al. (1992) suggested that reduced discharge ofthe CaquetaH River in Colombian Amazonia re#ects drierclimatic conditions for the period 4000}3000 yr BP.A dry period is suggested from lowland Ecuador between4200 and 3150 BP and Amazonia (Liu and Colinvaux,1985; Bush and Colinvaux, 1988) and the Chaco of north-ern Argentina between 3500 and 1000 BP (Iriondo andGarcia, 1993). Our analysis, however, shows an increasein moisture levels with a transition towards more mesicvegetation recorded throughout the altitudinal rangeconsidered here. Our interpretation is supported by anincrease in the amount of hydrophytic vegetation withinthe Lake Valencia catchment (Markgraf, 1989) and anincrease in the level of lake Titicaca between 3600 and3200 BP (Cross et al., 2000). More widely, this signal isrecorded throughout tropical South America (Martin etal., 1993). This would result in the northward expansionof polar frontal systems and consequent increase in wet-ter climates in northwestern South America, alterna-tively, greater southward migration of the ITCZ duringthe southern hemisphere summers (Francis Mayle, pers.comm.). Given the widespread occurrence of this signal,this time period is highly interesting and its characterisa-tion should be a target of future investigation as it ap-pears to be a period of rapid climatic change, to whichsome archives responded faster than others.
4.4. Period of vegetation in pace with the climate
For the period between 3000 and 1000 BP some sites#icker between biome assignments but few biome assign-ments change. A few sites do change within this periodwith these sites being situated at mid- to upper-altitudes.This may be indicative of relatively subtle environmentalchange that was speci"c to this altitudinal band. Thevegetation at this altitude was more responsive to a phaseof relatively low-magnitude environmental changeand/or this is re#ective of a maturation of the vegetationcomposition. Similarly, the water levels of Lake Titicacawere quite stable during this period (Cross et al., 2000), asis the environment reconstructed from the HuascaraH nice-cap, Peru (Thompson et al., 1995). Wider a"eld, thisperiod is relatively stable in reconstructed temperaturerecorded as derived from the GISP 2 and GRIP ice coresfrom Greenland (Willemse and ToK rnqvist, 1999). Thisperiod of stability may be attributed to a relatively stableSouthern Oscillation with La Nin� a events being infre-quent after 2800 BP (Martin et al., 1993).
1302 R. Marchant et al. / Quaternary Science Reviews 20 (2001) 1289}1308

4.5. Environmental drying at 800 BP
Between the 1000 and 500 yr BP reconstructions, thereis a period of environmental change characterised bya transition to more xeric vegetation. We interpret thisvegetation signal as a period of reduced plant-availablemoisture caused by a shift to drier climatic conditions.Crucially for this period, the observed changes are not allassociated with sites with high a$nities to the degradedvegetation category and therefore cannot solely be at-tributed to human impact but must also re#ect a climaticsignal. Farther to the south, palaeoclimatic records fromthe Quelccaya ice-cap in Peru indicate a dry period from540 to 610 AD that was also associated with a temper-ature decrease of between 0.5 and 13C (Thompson et al.,1985). Reduced precipitation would have a!ected theentire Central Andean areas and western South America(Binford et al., 1997), for example a dry period is recordedby a low stand at lake Titicaca (Binford et al., 1997).Palynological and geological evidences from the AmazonBasin, and other areas of tropical South America indicatea Holocene dry period extended between 750 and 500 BP(Piperno and Becker, 1996). It may be that this dry phasecoincided with markedly oscillating climates in the southand central Andes (Thompson et al., 1994). Farthernorth, this was one of the driest period recorded withinthe Yucatan Peninsula, coincident with the cultural col-lapse of the extensive Mayan civilisation (Hodell et al.,1995). Unfortunately, the resolution of many palaeoar-chives is not su$cient to fully characterise this period,and therefore infer causal mechanisms such as long-duration, low-phase Southern Oscillation. However, itdoes seem that coastal Peru was a!ected be a series ofdisastrous El Nin� o years around 1050 AD (Chepstow-Lusty et al., 1996) which would have produced relativelydry environmental conditions in Colombia. Farthernorth in California, an intense and rapid phase of coolingis detected within the Santa Barbara Basin sedimentaryrecord, possibly as a result of a period of volcanic activityand/or solar forcing (Schimmelmann et al., 1998), al-though the latter suggestion has been refuted (Van Geelet al., 1999). Whatever the forcing mechanism, it doesseems that the last 1000 yr has witnessed particularlystrong, brief climatic events that have been recorded,when the resolution has been su$cient, in Central andSouth America (Piperno and Becker, 1996).
4.6. Human impact on the Colombian biomes
One of the main changes to be detected from ouranalysis is the stepwise increase during the Mid- to Late-Holocene in the number of sites having an a$nity todegraded vegetation. This is particularly pertinent asalthough it is known that human in#uence on vegetationpatterns and soil development began to be signi"cantfrom the Late Holocene onwards (Thouret et al., 1997),
the timing and location of this is poorly understood. Theearliest signal of degradation comes from Boca De Lopezin the northeast of Colombia, with early disturbance alsorecorded at other tropical rain forest localities (Table 5).In spite of the suggestion that lowland tropical forestswere unable to support substantial human populationswith humid climates, poor soils and profusion of pests(Pringle, 1998), Holden (1998) suggested that farming inthe Americas may have begun within tropical forests.Within our analysis, a number of sites within the tropicalrain forest demonstrate vegetation disturbance that maybe attributed to early human activity. Archaeologicalinvestigations demonstrate that human occupation datesback to approximately 10,000 BP (Van der Hammen andCorreal-Urrego, 1978; Gnecco and Mohammed, 1994).Palaeoindians probably lived in the ChocoH Rain forestsince at least 3460 (Behling et al., 1998), while archae-ological records from Colombian Amazonia date back to9000 BP (Gnecco, 1999). Farther north, Zea mays andSquash, likely to be Curcurbita moschata, have been re-ported from Central Panama from the Mid-Holocene(Piperno et al., 1990). The a$nity scores to the degradedbiomes are relatively low throughout our analysis. Thiscan be partly explained because taxa that are indicativeof human activity, such as Zea mays, although beingpresent around sites, such as Piusbi during the last1710 yr (Behling et al., 1998) and Pitalito since 4700 BP(Wille, pers. comm.), are not numerically important with-in the pollen count and hence make a relatively minimalcontribution to the biome a$nity scores. Numerous re-cords of pre-Hispanic Zea mays have been recorded from5200 BP onwards; for example, Pena� Negra and AguaBlanca both have a long record of this food crop that ismost likely attributable to agricultural activity by pre-Hispanic populations on the eastern slopes of the Mag-dalene Valley (Kuhry, 1988). Also, no anemophilousweedy indicators of agriculture are present in northernSouth America such as Ambrosia in North America(Webb-III, pers. comm.).This relatively lowland concentration of degraded veg-
etation does not appear to extend to the higher altitudesuntil approximately 2000 BP. Rather than an increasefrom an agricultural base in the lowlands, this expansecan be attributed to pre-Incan Andean cultures, parti-cularly those based at Tiwanaku (Morris, 1999). How-ever, due to the maintenance of this impact throughoutour analysis (Table 5) we suggest that there was nosigni"cant collapse in the well-developed agriculturalsystems that have been widely documented for the Peru-vian cultures (Bray, 1990; Chepstow-Lusty et al., 1996)and the Maya (Hodell et al., 1995). Indeed, the substan-tial &decline' in regional agriculture after 2000 BP, thathas been attributed to a loss of soil fertility and/or cli-mate change (Chepstow-Lusty et al., 1996), is not appar-ent from our analysis. Thus, these well-documentedchanges may also have a strong cultural component that
R. Marchant et al. / Quaternary Science Reviews 20 (2001) 1289}1308 1303
was only recorded when large, centralised populationsdevelop. Alternatively, the impact of climate change onhuman and natural populations is most likely to impactin geographic locations where climate is a controllingfactor on the range of agricultural activity (Seltzer andHastorf, 1990).Charcoal dated before approximately 4000 BP within
the Rio Buritaca watershed (Herrera, 1985) provides di-rect evidence to support the suggestion that the savanisa-tion process in Colombia was initiated by Amerindiansby means of the frequent use of "re or clearing lands forthe cultivation of Zea mays. Cavelier et al. (1998) suggestthat this impact was able to transform moist forest eco-systems to forest ecosystems of secondary growth andeventually savanna. A link between the importance of "rein delimiting the distribution of lowland tropical savan-nahs is well documented, the incidence of "re increasinglybeing able to penetrate into moist gallery forests (Bid-dulph and Kellman, 1998). Within our analysis, a notablelowland site (El Pin� al) is situated within savannah settingwhere early vegetation disturbance is recorded. However,the impact is not so marked as to change the overallbiome assignment; these impacts appear relatively small,with the main #oristic characteristics, form and function-ing of the original ecosystem being maintained.The "rst Spanish conquests in Colombia date from
1528. By 1530 AD the Spanish began to colonise Colom-bia, taking advantage of agricultural lands (Cavelieret al., 1998). The in#ux resulted in a high mortality ofAmerindians, with agricultural "elds being abandonedand a concomitant migration of populations to higheraltitudes (Cavelier et al., 1998). The start of forest recov-ery at Timbio is thought to occur slightly before thearrival of the Spanish conquistadors (Wille, pers. comm.)when agricultural practice appears to have changed. Al-though Behling et al. (1998) suggested that some tropicallandscapes revert to forest following the arrival of theSpanish, our analysis does not show this to be the case.Indeed, relatively few sites diminish their a$nity to thedegraded vegetation following earlier human impact.What is apparent is that the rich and diversi"ed agricul-ture in much of Colombia today (Monasterio and Sar-miento, 1984) has a long history and originated in thelowlands.
4.7. Environmental stability at some sites within the LateHolocene
Our analysis shows that the ability for a site's pollenspectra to be re#ective of climatic and anthropogenicimpacts is very much determined by the location of thesite. For example, relatively passive sites may be locatedwithin the middle of a biome's &bioclimatic' space. Con-versely, those sites close to the transition between biomeswill be sensitive to environmental change, in some casesbeing too responsive with the result that they &#icker'
between biome assignments. For those sites that exhibitresilience to changing their biome assignment, some site-speci"c factor may be important in maintaining vegeta-tion stability. A good example is Angel, the Steppe biomeis reconstructed throughout due to the local importanceof edaphic factors imposed by a sandstone substratewithin the catchment (Behling and Hooghiemstra, 1999).The other sites that are resilient to change may alsoinvolve some site-speci"c phenomena, although for somesites it is a result of location, being positioned far fromthe boundaries of bioclimatic space. For example, LaRabona (4000m) and Lagunillas (3880m) are above theforest limit and are located some 300}400m of verticalaltitudinal change away from the in#uence of arborealcomponents to register in the pollen record. Given thattemperature is the main control on the position of theAndean Colombia upper forest limit (Hooghiemstra,1984), this equates to a temperature shift of approxim-ately 33C if the environmental lapse rate was 63C1000m�� (Van der Hammen and GonzaH lez, 1960) re-quired to change the biome assignment. This magnitudeof change was only recorded during the late glacial peri-od and not at any time during our analysis.
4.8. Areas for further study
The Late Quaternary vegetation history of the Neot-ropical phytogeographical realm remains relativelypoorly resolved despite the importance in model testing(Bush and Colinvaux, 1988), developing biogeographicaltheory (Tuomisto and Ruokolainen, 1997), and under-standing issues concerned with biodiversity and hu-man}environmental interactions. Understanding themodi"cation of biome distribution due to past environ-mental changes is increasingly important. It could beinvestigated by using vegetation models to depict outputfrom climate modelling studies (Claussen and Esh, 1994;IndermuK hle et al., 1999). Where the data are of su$cientquality and quantity, the model-based reconstructionshould be compared directly with the reconstructed bi-omes presented here. By applying one method to a selec-tion of well-distributed pollen data with robustchronologies, it is possible to determine temporal vegeta-tion dynamics at regional to continental scales. Environ-mental change is rarely spatially uniform and as suchnecessitates an even greater number of sites to determinemore precisely the complexity of vegetation response andthe environmental mechanisms driving this. Forexample, di!erent altitudinal bands appear to respond ina di!erent manner such that the blanket application oflapse rates to site-speci"c calculations of palaeoclimaticparameters must be treated with caution. Indeed, newsites, located in key areas, are required to re"ne ourunderstanding of the Neotropical response to Holoceneand millennial-scale climatic changes. The new data willalso show how this signal can be interpreted in the light
1304 R. Marchant et al. / Quaternary Science Reviews 20 (2001) 1289}1308

of comparable data from other areas and palaeoenviron-mental archives (Jolly et al., 1998a). In addition to thesedirect applications, the biomes and PFTs derived fromthe pollen data could be used to translate the output tospeci"c biogeochemical components, such as carbonbudgets, and thus provide a direct test for modellingstudies concerned with these components (Foley et al.,1996).
5. Conclusions
5.1. Late-Holocene vegetation dynamics
The Prentice et al. (1996) method for assigning biomesto pollen data provides an objective basis for determiningregional-scale vegetation dynamics and the environ-mental controls that a!ect them. Our analysis showedthat a factor complex must be invoked to explain therange of vegetation changes over the Mid- to Late-Holo-cene period that encompasses changes in temperature,moisture and moisture availability, human impact andecological dynamics. Although Behling et al. (1999) indi-cate that the present network of sites is insu$cient toevaluate whether climatic change in Colombia was a ma-jor factor in forcing Late-Holocene vegetation dynamics,our analysis of the data showed that there are somecommon forcing signals. Speci"cally, the vegetation ap-pears to respond to (1) the Mid-Holocene hypsithermalperiod, (2) a period of increased moisture centred onapproximately 3500 BP and (3) environmental ariditycentred on approximately 800 BP. The data presentedhere represent a high-resolution palaeoarchive suitablefor testing and re"nement of climate models.
5.2. Vegetation disturbance
We showed that the tailoring of the biomisation tech-nique to demonstrate disturbance of the vegetation, thatis likely to have its origin in human impact, is a usefuladdition to understanding an important control onLate-Holocene vegetation dynamics in Colombia. Afteran initial focus within lowland ecosystems, human settingthis disturbance expanded, in a stepwise manner, to highaltitudes, becoming present at the range of altitudes ana-lysed here. Unlike the close correlation between climatechange, vegetation response and cultural development,the relationship appears to be weaker than is apparentfor the large centralised cultures such as the Maya andthose associated with Tiwanaku.
Acknowledgements
The present research project is funded by the Nether-lands Organisation for Scienti"c Research (NWO) under
award 750:198:08 made to Henry Hooghiemstra. Numer-ous people have o!ered support and comment on theresearch at various stages of development of this researchnone more so than the people who have made theirpollen data available for the analysis. Without such con-tributions, this work would not have been possible. Inparticular, we thank Sandy Harrison and Colin Prenticefor discussions throughout the development of thebroader-scale assignment of biomes to Latin Americanpollen data. Particular thanks must go to Vera Markgrafand Eric Grimm for their energies in establishing, anddeveloping, the Latin American Pollen Database(LAPD). Francis Mayle and Tom Webb III are thankedfor comment on an earlier draft of this paper.
References
Alcalde, J.A., Kulemeyer, J.J., 1999. The Holocene in the south-easternregion of the province Jujuy, north-west Argentina. QuaternaryInternational 57, 113}116.
Baied, C.A., Wheeler, J.C., 1993. Evolution of high Andean Punaecosystems: environment, climate, and cultural change over the last12,000 years in the central Andes.Mountain Research and Develop-ment 13, 145}156.
Beard, J.S., 1955. The classi"cation of tropical American vegetation.Journal of Ecology 36, 89}100.
Biddulph, J., Kellman,M., 1998. Fuels and "re at savanna-gallery forestboundaries in south-eastern Venezuela. Journal of Tropical Ecol-ogy 14, 445}461.
Binford,M.W., Kolata, A.L., Brenner, M., Janusek, J.W., Seddon, M.T.,Abbott, M., Curtis, J.H., 1997. Climate variation and the rise andfall of an Andean civilisation. Quaternary Research 47, 235}248.
Bradbury, J.P., Leyden, B., Salgado-Labouriau, M.L., Lewis Jr., W.M.,Schubert, C., Binford, M.W., Schubert, C., Binford, M.W., Frey,D.G., Whitehead, D.R., Weibezahn, F.H., 1981. Late Quaternaryenvironmental history of Lake Valencia, Venezuela. Science 214,1299}1305.
Bray, W., 1990. Agricultural renascence in the high Andes. Nature 345,385.
Bush, M., 1991. Modern pollen-rain data from South and CentralAmerica: a test of the feasibility of "ne-resolution lowland tropicalpalynology. The Holocene 1, 162}167.
Bush, M., Colinvaux, P., 1988. A 7000-year pollen record from theAmazon lowlands, Ecuador. Vegetatio 76, 141}154.
Bush, M., Piperno, D.O., Colinvaux, P., Oliveria, P.E., Krissek, L.A.,Miller, M.C., Rowe, W.E., 1992. A 14,300-yr palaeoecological pro-"le of a lowland tropical lake in Panama. Ecological Monographs62, 251}275.
Bush, M., Rivera, M., 1998. Pollen dispersal and representation ina neotropical rain forest. Global Ecology and Biogeographic Let-ters 7, 379}392.
Cavelier, J., Aide, T.M., Santos, C., Eusse, A.M., Dupuy, J.M., 1998. Thesavannization of moist forests in the Sierra Nevada de Santa Marta,Colombia. Journal of Biogeography 25, 901}912.
Chepstow-Lusty, A.J., Bennett, K.D., Switsur, V.R., Kendall, A., 1996.4000 years of human impact and vegetation change in the centralPeruvian Andes * with events paralleling the Maya record. An-tiquity 70, 824}833.
Claussen, M., Esch, M., 1994. Biomes computed from simulated clima-tologies. Climate Dynamics 9, 235}243.
R. Marchant et al. / Quaternary Science Reviews 20 (2001) 1289}1308 1305
Cleef, A.M., Hooghiemstra, H., 1984. Present vegetation of the area ofthe high plain of BogotaH . In: Hooghiemstra, H. (Ed.), Vegetationaland Climatic History of the High Plain of BogotaH , Colombia:A Continuous Record of the last 3.5 million years, DissertationesBotanicae, Vol. 79. J. Cramer, Berlin, pp. 1}365.
COHMAP members, 1988. Climatic change of the last 18,000 years,observations and model simulations. Science 241, 1043}1053.
Cross, S.L., Baker, P.A., Seltzer, G.O., Fritz, S.C., Dunbar, R.B., 2000.A new estimate of the Holocene low-stand level of Lake Titicaca,central Andes, and implications for tropical palaeohydrology. TheHolocene 10, 21}32.
Cuatrecasas, J., 1958. Aspectos de las vegetacioH n natural de Colombia.Revista Academia Colombiana Exactas Fisicas y Naturales(BogotaH ) 10, 221}264.
Curtis, J.H., Brenner,M., Hodell, D.A., 1999. Climate change in the lakeValencia Basin, Venezuela, &12,600yr BP to present. The Holo-cene 9, 609}619.
Duivenvoorden, J.F., 1995. Tree species composition and rain forestenvironmental relationships in the middle CaquetaH area, Colombia,north-western Amazonia. Vegetatio 120, 91}113.
Duivenvoorden, J.F., Cleef, A.M., 1994. Amazonian savanna vegetationon the sandstone near Araracuara, Colombia. Phytocoensis 24,197}232.
Edwards, M.E., Anderson, P.M., Brubaker, L.B., Ager, T., Andreev,A.A., Bigelow, N.H., Cwynar, L.C., Eisner, W.R., Harrison, S.P., Hu,F.-S., Jolly, D., Lozhkin, A.V., McDonald, G.M., Mock, C.J.,Ritchie, J.C., Sher, A.V., Spear, R.W., Williams, J., Yu, G. Pollen-based biomes for Beringia 18,000, 6000 and 0 ��C yr B.P. Journal ofBiogeography 27, 521}554.
Foley, J.A., Prentice, I.C., Ramankutty, N., Levis, S., Pollard, D., Sitch,S., Haxeltine, A., 1996. An integrated biosphere model of landsurface processes, terrestrial carbon balance and vegetation dynam-ics. Global Biogeochemical Cycles 10, 603}628.
Gnecco, C., 1999. An archaeological perspective on the Pleis-tocene/Holocene boundary in northern South America. QuaternaryInternational 53, 3}9.
Gnecco, C., Mohammed, A., 1994. TecnologmHa de cazadores-recolec-tores subandinos: analisis functional y organizacioH n technologica.Revista Colombiana de AntropologmHa 31, 6}31.
Gentry, A.H., 1986. Species richness and #oristic composition of theChocoH pluvial forests plant communities. Caldasia 15, 71}91.
Gentry, A.H., 1993. A Field Guide to the Families and Genera ofWoody Plants of South America (Colombia, Ecuador, Peru). Con-servation International, Washington, DC.
Grabandt, R.J., 1980. Pollen rain in relation to arboreal vegetation inthe Colombian Cordillera Oriental. Review of Palaeobotany andPalynology 29, 65}147.
Hansen, B.C.S., Seltzer, G.O., Wright Jr., H.E., 1994. Late Quaternaryvegetational change in the central Peruvian Andes. Palaeogeogra-phy, Palaeoclimatology, Palaeoecology 109, 263}285.
Haxeltine, A., Prentice, I.C., 1996. BIOME3: an equilibrium terrestrialbiosphere model based on ecophysiological constraints, resourceavailability, and competition among plant functional types. GlobalBiogeochemical Cycles 10, 693}709.
Herrera, L.F., 1985. Agricultura arborigen y cambios de vegetacioH n enla Sierra Nevada de Santa Marta. FundacioH n de InvestigacionesArqueloH gicas Nacionales Banco de la RepuH blica, BogotaH , 258pp.
Heusser, C.J., 1982. Quaternary palynology of Chile. Quaternary ofSouth America and the Antarctic Peninsula 1, 5}22.
Hodell, D.A., Curtis, J.H., Brenner, M., 1995. Possible role of climate inthe collapse of Classic Maya civilisation. Nature 375, 391}394.
Holden, C., 1998. The slow birth of agriculture. Science 282,1446}1458.
Hooghiemstra, H., 1984. Vegetational and Climatic History of the HighPlain of BogotaH , Colombia: a Continuous Record of the last 3.5million years, Dissertationes Botanicae, Vol. 79. J. Cramer, Berlin,pp. 1}365.
Hooghiemstra, H., Cleef, A.M., 1984. Development of vegetational andclimatic sequence of the area of the high plain of BogotaH . In:Hooghiemstra, H. (Ed.), Vegetational and Climatic History of theHigh Plain of BogotaH , Colombia: A Continuous Record of the last3.5 million years, Dissertationes Botanicae, Vol. 79. J. Cramer,Berlin, pp. 1}365.
Hooghiemstra, H., Van der Hammen, T., 1998. Neogene and Quater-nary development of the neotropical rainforest: the forest refugiahypothesis, and a literature overview. Earth Science Reviews 44,147}183.
IGAC (El Instituto Geogra"co Agustin Codazzi Ministerio de Haci-enda y CreH dito PuH blico), 1998. Atlas de Colombia, versioH n multi-media. CD-ROM.
IndermuK hle, A., Stocker, T.F., Joos, F., Fischer, H., Smith, H.J., Wahlen,M., Deck, B., Mastroianni, D., Tschmi, J., Blunier, T., Meyer, R.,Stau!er, B., 1999. Holocene carbon cycle dynamics based on CO
�trapped in ice at Taylor Dome, Antarctica. Nature 398, 121}126.Iriondo, M.H., Garcia, N.O., 1993. Climatic variation in the Argentine
plains during the last 18,000 years. Palaeogeography, Palaeoc-limatology, Palaeoecology 101, 209}220.
Jolly, D., Harrison, S.P., Damnati, B., Bonne"lle, R., 1998a. Simulatedclimate and biomes of Africa during the Late Quaternary: compari-sons with pollen and lake status data. Quaternary Science Reviews17, 629}657.
Jolly, D., Prentice, I.C., Bonne"lle, R., Ballouche, A., Bengo,M., Brenac,P., Buchet, G., Burney, D., Cazet, J.-P., Cheddadi, R., Edorh, T.,Elenga, H., Elmoutaki, S., Guiot, J., Laarif, F., Lamb, H., Lezine,A.-M., Maley, J., Mbenza, M., Peryon, O., Reille, M., Reynaud-Farrera, I., Riollet, G., Ritchie, J.C., Roche, E., Scott, L., Ssem-manda, I., Straka, H., Umer, M., Van Campo, E., Vilimumbalo, S.,Vincens, A., Waller, M., 1998b. Biome reconstruction from pollenand plant macrofossil data for Africa and the Arabian peninsula at0 and 6 ka. Journal of Biogeography 25, 997}1005.
Kahn, F., de Granville, J.J., 1992. Palms in the Forest Ecosystems ofAmazonia. Springer, Berlin.
Kewensis, 1997. Index Kewensis Version 2.0. Developed by systemssimulations Ltd, Oxford University Press, Oxford.
Kutzbach, J., Bonan, G., Harrison, S., 1996. Vegetation and soil feed-backs on the response of the African monsoon to orbital forcing inthe middle Holocene. Nature 384, 623}626.
Leemans, R., Cramer, W.P., 1991. The IISA database for mean monthlyvalues of temperature, precipitation and cloudiness on a globalterrestrial grid. Rep IIASA Research RR-91-18, International Insti-tute for Applied Systems Analysis, Laxenburg, Austria.
Liu, K., Colinvaux, P., 1985. Forest changes in the Amazon basin at theLGM. Nature 318, 556}577.
Mancini, M.V., 1993. Recent pollen spectra from forest and steppe ofSouth Argentina: a comparison with vegetation and climate data.Review of Palaeobotany and Palynology 77, 129}142.
Marchant, R.A., Behling, H., Berrio, J.C., Cleef, A.M., Duivenvoorden,J., Hooghiemstra, H., Kuhry, P., Melief, A.B.M., Van Geel, B.,Van der Hammen, T., Van Reenen, G., Wille, M. Reconstruc-tion of biomes from Colombia from modern pollen data along analtitudinal gradient. Review of Palaeobotany and Palynology,in press.
Marchant, R.A., Behling, H., Hooghiemstra, H., Markgraf, V., Har-rison, S.P., Prentice, C., BjoK rck, S., Bush, M., Cleef, A., Colinvaux,P.A., De Oliveira, P.E., Graf, K., Hansen, B.C.S., Heusser, C., Horn,S.P., Ledru,M.-P., Leyden, B.W., Lozano-GarcmHa, M.S., Moar, N.T.,Moreno, P.I., Salgado-Labouriau, M.L., SchaK bitz, F., Watts, W.A.Pollen-based biome reconstructions for Latin America at 0, 6000and 18,000 radiocarbon years. Journal of Biogeography,in review.
Marchant, R.A., Taylor, D.M., 2000. Numerical analysis of modernpollen spectra and in situ montane forest * implications for theinterpretation of fossil pollen sequences from tropical Africa. TheNew Phytologist 146, 505}515.
1306 R. Marchant et al. / Quaternary Science Reviews 20 (2001) 1289}1308
Markgraf, V., 1989. Palaeoclimates in Central and South America since18,000 BP based on pollen and lake level records. QuaternaryScience Reviews 8, 1}24.
Martin, L., Bertaux, J., Correge, T., Ledru, M.-P., Mourguiart, P.,Sifeddine, A., Soubies, F., Wirrmann, D., Suguio, K., Turcq, B.,1997. Astronomical forcing of contrasting rainfall changes in tropi-cal South America between 12,400 and 8800 cal yr BP. QuaternaryResearch 47, 117}122.
Martin, L., Fournier, M., Mourguiart, P., Sifeddine, A., Turcq, B., 1993.Southern Oscillation signal in South American palaeoclimatic dataof the last 7000 years. Quaternary Research 39, 338}346.
Monasterio, M., Sarmiento, G., 1984. Ecological diversity and humansettlements in the tropical northern Andes. ErdwissenschaftlicheForschung 18, 295}306.
Morris, A., 1999. The agricultural base of the pre-Incan Andean civili-zations. The Geographic Journal 165, 286}295.
Piperno, D.R., Becker, P., 1996. Vegetational history of a site in theCentral Amazon basin derived from phytolith and charcoal recordsfrom natural soils. Quaternary Research 45, 202}209.
Piperno, D.R., Bush, M., Colinvaux, P., 1990. Palaeoenvironments andhuman occupation in Late Glacial Panama. Quaternary Research33, 108}116.
Prance, G.T., 1985. The changing forest. In: Prance, G.T., Lovejoy, T.(Eds.), Key Environments Amazonia. Pergamon Press, Oxford,422pp.
Prentice, I.C., Cramer, W., Harrison, S.P., Leemans, R., Monserud,R.A., Solomon, A.M., 1992. A global biome model based on plantphysiology and dominance, soil properties and climate. Journal ofBiogeography 19, 117}134.
Prentice, I.C., Guiot, J., Huntley, B., Jolly, D., Cheddadi, R., 1996.Reconstructing biomes from palaeoecological data: a generalmethod and its application to European pollen data at 0 and 6ka.Climate Dynamics 12, 185}194.
Prentice, I.C., Webb III, T., 1998. BIOME 6000: reconstructing globalMid-Holocene vegetation patterns from palaeoecological records.Journal of Biogeography 25, 997}1005.
Pringle, H., 1998. The slow birth of Agriculture. Science 282, 1446}1450.Schimmelmann, A., Zhao, M., Harvey, C.C., Lange, C.B., 1998. A Large
Californian #ood and correlative global climatic events 400 yearsago. Quaternary Research 49, 51}61.
Seltzer, G.O., Hastorf, C.A., 1990. Climatic changes and its e!ect onprehispanic agriculture in the Central Peruvian Andes. Journal ofField Archaeology 17, 397}414.
Servant, M., Maley, J., Turcq, B., Absy, M., Brenac, P., Furnier, M.,Ledru,M.-P., 1993. Tropical forest changes during the Late Quater-nary in African and South American lowlands. Global and Planet-ary Change 7, 25}40.
Tarasov, P.E., Cheddadi, R., Guiot, J., Bottema, S., Peyron, O., Be-lmonte, J., Ruiz-Sanchez, V., Saadi, F., Brewer, S., 1998. A methodto determine warm and cool steppe biomes from pollen data;application to the Mediterranean and Kazakhstan regions. Journalof Quaternary Science 13, 335}344.
Thompson, L.G., Davis, M.E., Mosely-Thompson, E., 1994. Glacialrecords of global climate: a 1500-year tropical ice core record ofclimate. Human Ecology 22, 83}95.
Thompson, L.G., Mosely-Thompson, E., Bolzan, J.F., Koci, B.R., 1985.A 1500-year record of tropical precipitation in ice cores from theQuelccaya ice cap, Peru. Science 229, 971}973.
Thompson, L.G., Mosely-Thompson, E., Davis, M.E., Lin, P.E., Hen-derson, K.A., Cole-Dai, B., Bolzan, J.F., Liu, K., 1995. Late glacialstage and Holocene tropical ice core records fromHuascaraH n, Peru.Science 269, 46}50.
Thouret, J., Van der Hammen, T., Salomons, B., Juvigne, E., 1997. LateQuaternary glacial studies in the Cordillera Central, Colombia,based on glacial geomorphology, tephra-soil stratigraphy, palynol-ogy and radiocarbon dating. Journal of Quaternary Science 12,347}369.
Tuomisto, H., Ruokolainen, K., 1997. The role of ecological knowledgein explaining biogeography, and biodiversity in Amazonia. Biodi-versity and Conservation 6, 347}357.
Van der Hammen, T., 1963. A palynological study on the Quaternary ofBritish Guyana. Leidse Geologische Mededelingen 29, 126}168.
Van der Hammen, T., 1972. Changes in vegetation and climate in theAmazon basin and surrounding areas during the Pleistocene.Geologie en Mijnbouw 51, 641}643.
Van der Hammen, T., Urrego, L.E., Espejo, N., Duivenvoorden, J.F.,Lips, J.M., 1992. Late-glacial and Holocene sedimentation and#uctuations of river water level in the CaquetaH area (ColombianAmazonia). Journal of Quaternary Science 7, 57}67.
Van Geel, B., Van der Plicht, J., Renssen, H., 1999. Comment on `ALarge Californian #ood and correlative global climatic events 400years agoa (Schimmelmann et al., 1998).. Quaternary Research 51,108}110.
Willemse, N.W., Tornqvist, T.E., 1999. Holocene century-scale temper-ature variability from West Greenland lake records. Geology 27,580}584.
Williams, J.W., Summer, R.S., Webb III, T., 1998. Applying plantfunctional types to construct biome maps from eastern NorthAmerican pollen data: comparisons with model results. QuaternaryScience Reviews 17, 607}627.
Witte, H.J.L., 1994. Present and past vegetation and climate in theNorth Andes (Cordillera Central, Colombia); a quantitative ap-proach. Ph.D. Thesis, University of Amsterdam, The Netherlands.
Papers from the sites
Behling, H., Berrio, J.C., Hooghiemstra, H., 1999. Late Quaternarypollen records from the middle CaquetaH river basin in centralColombian Amazon. Palaeogeography, Palaeoclimatology,Palaeoecology 145, 193}213.
Behling, H., Hooghiemstra, H., 1998. Late Quaternary palaeoecologyand palaeoclimatology from pollen records of the savannas of theLlano Orientales in Colombia. Palaeogeography, Palaeoclimatol-ogy, Palaeoecology 139, 251}267.
Behling, H., Hooghiemstra, H., 1999. Environmental history of theColombian savannas of the Llanos Orientales since the Last GlacialMaximum from lake records El Pin� al and Carimagua. Journal ofPalaeolimnology 21, 461}476.
Bosman, A.F., Hooghiemstra, H., Cleef, A., 1994. Holocene mire devel-opment and climatic change from a high Andean Plantago rigidacushion mire. The Holocene 4, 233}243.
Kuhry, P., 1988. Palaeobotanical}Palaeoecological Studies of the Tropi-cal High Andean Peatbog Sections Cordillera Oriental, Colombia,Dissertationes Botanicae, Vol. 116. J. Cramer, Berlin, pp. 1}241.
Kuhry, P., Salomons, J.B., Riezebos, P.A., Van der Hammen, T., 1983.PaleoecologiaH de los uH ltimos 6.000 anos en el area de la Laguna deOtun-El Bosque. In: Van der Hammen, T., Perez, P.A., Pinto, P.(Eds.), Studies on Tropical Andean Ecosystems, Vol. 1: La Cordill-era Central Colombiana transecto Parque Los Nevados. Cramer,Vaduz.
Van der Hammen, T., Correal Urrego, G., 1978. Prehistoric man on thesobono de BogotoH ; data for an ecological prehistory. Palaeogeogra-phy, Palaeoclimatology, Palaeoecology 25, 179}190.
Van der Hammen, T., GonzaH lez, E., 1960. Upper Pleistocene andHolocene climate and vegetation of the Sabana de BogotaH . LeidsGeologische Mededelingen 25, 261}315.
Van der Hammen, T., GonzaH lez, E., 1965. A Late glacial and Holocenepollen diagram from Cienaga del Vistador Dep. Boyaca, Colombia.Leids Geologische Mededelingen 32, 193}201.
Van Geel, B., Van der Hammen, T., 1973. Upper Quaternary vegeta-tional and climatic sequence of the FuH quene area Eastern Cordill-era, Colombia. Palaeogeography, Palaeoclimatology, Palaeo-ecology 14, 9}92.
R. Marchant et al. / Quaternary Science Reviews 20 (2001) 1289}1308 1307

Wijmstra, T.A., Van der Hammen, T., 1966. Palynological data on thehistory of tropical savannas in northern South America. LeidseGeologische Mededelingen 38, 71}90.
Wille, M., Negret, J.A., Hooghiemstra, H., 2000. Paleoenvironmentalhistory of the Popayan are since 2700yr BP at Timbio, SouthernColombia. Review of Paleobotany and Palynology 109, 45}63
Further reading.
Van der Hammen, T., Absy, M., 1994. Amazonia during the last glacial.Palaeogeography Palaeoclimatology Palaeoecology 109,247}261.
Wijmstra, T.A., 1971. The Palynology of the Guiana Coastal Basin.University of Amsterdam, 72pp. Amsterdam, The Netherlands.
Hooghiemstra, H., Van der Hammen, T., 1993. Late Quaternary veg-etation history and paleoecology of the Laguna Pedro Palo (sub-
andean forest belt, Eastern Cordillera, Colombia). Review ofPalaeobotany and Palynology 77, 235}262.
Melief, A.B.M., 1985. Late Quaternary Paleoecology of the ParqueNational los Nevados Cordillera Central, and Sumapaz Cordill-era Oriental areas, Colombia. Dissertation, University of Amster-dam, Amsterdam, The Netherlands.
Van der Hammen, T., 1974. The Pleistocene changes of vegetation andclimate in tropical South America. Journal of Biogeography 1,3}26.
Van der Hammen, T., 1962. PalinologmHa de la region de Laguna de losBobos. Hitoria de su clima, vegetacioH n y agricultura durante losuH ltimos 5000 an� os. Revista Academia Colombiana Ciencias Exac-tas Fisicas Naturales 11, 359}361.
Van der Hammen, T., Barelds, T.J., de Jong, H., de Veer, A.A., 1980.Glacial sequence and environmental history in the Sierra Nevadadel Cocuy Colombia. Palaeogeography, Palaeoclimatology,Palaeoecology 32, 247}340.
1308 R. Marchant et al. / Quaternary Science Reviews 20 (2001) 1289}1308
Copyright © 2022 FDOKUMEN