Multielement isotopic analysis of single presolar SiC grains
Upload
independentCategory
view
0download
0
Does climate affect pollen morphology? Optimal size and shapeof pollen grains under various desiccation intensity
MACIEJ JAN EJSMOND,1,� DOROTA WRONSKA-PILAREK,2 ANNA EJSMOND,3 DOMINIKA DRAGOSZ-KLUSKA,1
MONIKA KARPINSKA-KOŁACZEK,4 PIOTR KOŁACZEK,5 AND JAN KOZŁOWSKI1
1Institute of Environmental Sciences, Jagiellonian University, Gronostajowa 7, 30-387 Krakow, Poland2Department of Forestry Natural Foundations, Poznan University of Life Sciences, Wojska Polskiego 71 d, 60-625 Poznan, Poland
3Faculty of Biology and Earth Sciences, Jagiellonian Univeristy, Gronostajowa 7, 30-387 Krakow, Poland4Institute of Botany, Jagiellonian University, Lubicz 46, 31-512 Krakow, Poland
5Department of Biogeography and Palaeoecology, Faculty of Geographical and Geological Science, Adam Mickiewicz University,Dziegielowa 27, 61-680 Poznan, Poland
Citation: Ejsmond, M. J., D. Wronska-Pilarek, A. Ejsmond, D. Dragosz-Kluska, M. Karpinska-Kołaczek, P. Kołaczek, and
J. Kozłowski. 2011. Does climate affect pollen morphology? Optimal size and shape of pollen grains under various
desiccation intensity. Ecosphere 2(10):117. doi:10.1890/ES11-00147.1
Abstract. Seed production is likely constrained by pollen limitation and the viability of pollen grains
decreases rapidly in time due to water evaporation. Any decrease in the surface-to-volume ratio, through
increase in size or change in shape of a grain, reduces the rate of water loss. However, grain size trade-offs
with the number of grains that can be produced by a plant. Here, we tested the hypothesis that under
higher desiccation stress pollen grains become larger and more spherical. We analyzed data on the pollen
morphology of eight Rosaceae species and the desiccation intensity based on temperature, potential
evapotranspiration and altitude. To explain the mechanisms underlying our results, we present a model
that optimizes the size and shape of pollen grains under different conditions. We report that pollen grains
under more intense desiccation stress during flowering periods tend to be larger but do not change shape.
This conclusion is consistent with the results of a theoretical model presented here. Our report fills a gap in
our knowledge about a fundamental process in plant reproduction. We also discuss the significance of our
results in light of current palynological and ecological problems (e.g., global climate change).
Key words: desiccation; pollen limitation; pollen production; pollen morphology; pollen shape; pollen size;
temperature.
Received 18 May 2011; revised 6 August 2011; accepted 12 August 2011; final version received 7 October 2011;
published 31 October 2011. Corresponding Editor: D. P. C. Peters.
Copyright: � 2011 Ejsmond et al. This is an open-access article distributed under the terms of the Creative Commons
Attribution License, which permits restricted use, distribution, and reproduction in any medium, provided the original
author and sources are credited.
� E-mail: [email protected]
INTRODUCTION
The production and morphology of pollen
grains are key features of pollination biology. In
the last decade, pollen limitation, which is
influenced by many factors, has emerged as a
one of the major forces limiting the fitness of
plants and may affect plant life histories (Ash-
man et al. 2004, Knight et al. 2005). Most research
on pollen limitation has concentrated on plant-
pollinator interactions (Harder and Aizen 2010),
which is an interesting aspect of the pollination
story, but if analyzed separately from the context
of the abiotic environment has limited power to
predict effects of climatic change on pollination
processes. Although pollen production of pollen
may be strongly constrained by environmental
factors (for review see Delph et al. 1997), the
v www.esajournals.org 1 October 2011 v Volume 2(10) v Article 117

adaptive significance of the inter- and intraspe-cific variability in the size-number pollen tradeoffand pollen morphology has rarely been analyzedin this context.
The water content of a ripe pollen grain mayrepresent 5–50% of grain mass depending on thespecies. Higher water content generally corre-sponds to a higher rate of germination on thestigma and lower tolerance to desiccation duringdispersal (Pacini 2000, Pacini et al. 2006). Theviability of partially dehydrated pollen, incontrast to pollen with naturally low watercontent, usually decreases rapidly with waterloss (Nepi et al. 2001). It is reasonable tohypothesize that the size and shape of a pollengrain may affect its time to desiccation and, as aconsequence, the likelihood of successful polli-nation under specific environmental conditions.
Palynological books and journals have de-scribed significant inter- and intraspecific vari-ability of the size, shape and other morphologicalcharacteristics of pollen grains. Even a slightchange in grain size has considerable conse-quences on the number of grains produced if thesame amount of resources is used for pollenproduction.
In this study, we tested whether pollen sizeand morphology of eight Rosaceae species dependon desiccation intensity based on altitude andprimary climate variables, such as temperatureand potential evapotranspiration (PET) duringflowering periods. We hypothesize that underhigh desiccation stress, pollen grains becomelarger and more spherical in shape. Increasing insize and becoming more spherical may decreasethe surface-to-volume ratio of a grain andtherefore reduce the rate of water loss. To explainthe mechanisms underlying our results, wepresent a model that optimizes the size andshape of pollen grains under different conditions.We then discuss our empirical results in light ofour theoretical findings.
MATERIALS AND METHODS
Pollen dataTo test our hypothesis, we used pollen grain
morphology data for one species of bramble(Rubus gracilis, N ¼ the number of individualsfrom different locations ¼ 13) and five species ofroses (Rosa canina, N ¼ 17; R. gallica, N ¼ 15; R.
sherardii, N¼12; R. dumalis, N¼9; R. rubiginosa, N¼ 8) (Wronska-Pilarek and Boratynska 2005,Wronska-Pilarek et al. 2006, Wronska-Pilarekand Jagodzinski 2009; Wronska-Pilarek, unpub-lished data). All pollen samples were acetolysedaccording to the method described by Wronska-Pilarek (1998). Pollen trait measurements werebased on 50 grains for R. gallica, 20 grains for R.gracillis and 30 grains for other species. We alsoincluded data for two hawthorn species (Cratae-gus ambigua, N ¼ 6; C. monogyna, N ¼ 10), with30–50 grains being analyzed from each specimen(Oybak Donmez 2008).
We extracted data on the polar (P) andequatorial (E) axes of pollen grains from pub-lished papers or directly measured them (see rawdata in Supplement 1). For all studied species, weused these measurements to calculate meanpollen grain surface area (S ), volume (V ) andthe surface-to-volume ratio. We chose to use aspheroid (i.e., ellipsoid with two equal radii, 0.5P,0.5E, 0.5E) as a geometrical model of a pollengrain with S and V represented by the following:
V ¼ pPE2
6ð1Þ
for P . E: S ¼ pE2
2þ pEP
2zarcsinðzÞ where
z ¼
ffiffiffiffiffiffiffiffiffiffiffiffiffiffiffiffiffiffiffiffiffi1� E
P
� �2s
ð2aÞ
for P , E: S ¼ pE2
2þ pP2
2zlog
1þ z
1� z
� �where
z ¼
ffiffiffiffiffiffiffiffiffiffiffiffiffiffiffiffiffiffiffiffiffi1� P
E
� �2s
ð2bÞ
for P ¼ E: S ¼ pðPÞ2 ð2cÞ
( public communication; http://mathworld.wolfram.com/Spheroid.html).
Climate data and flowering dateTo correlate pollen morphology with climatic
conditions, we used data on the floweringperiods of the specimens and the altitude,monthly mean temperature and PET of thecollection sites (see raw data in Supplement 1).
All Rosa and Rubus species specimens were
v www.esajournals.org 2 October 2011 v Volume 2(10) v Article 117
EJSMOND ET AL.

collected in Poland (Appendix). We used coordi-nates provided by D. Wronska-Pilarek andtopographical maps of Poland and official PolishGovernment websites (e.g., http://www.geoportal.gov.pl/) to locate Rosa and R. gracilisspecimens. We were unable to find coordinates ofsites for a substantial number of Crataegusspecimens, and so we used only the altitudedata provided by E. Oybak Donmez for thisanalysis.
We applied elevation data from the ShuttleRadar Topography Mission 90-m Digital Eleva-tion Model (Jarvis et al. 2008) with the resolutionof the grid ca. 2503 250 m (latitude3 longitude).The mean monthly temperature (Hijmans et al.2005) and monthly PET data between the years1950 and 2000 (Trabucco and Zomer 2009) had aresolution of ca. 0.553 1 km. All geographic datawere processed in ArcGis 9.3 (EnvironmentalSystems Research Institute, Redlands, California,USA).
The flowering periods for R. gracilis weredetermined based on when flowering specimenswere collected. Because the available temperatureand PET data were monthly means and becausesome specimens were collected at different timesthroughout a particular month, we calculated theweighted mean temperature of a 31-day periodso that the day of collection was in the middle ofthis period. For example, if a plant was collectedon May 5, the temperature was calculated as (5þ15)/31 May temperature þ 11/31 April tempera-ture. Because we did not know the precisecollection dates for a substantial number of Rosaspecimens, the flowering periods were obtainedfrom the literature: May and June for R. caninaand R. dumalis; June and July for R. gallica and R.sherardii; and May, June and July for R. rubiginosa(Popek 2002).
Statistical analysisTo obtain the independent variables that best
describe pollen size and sensitivity to desiccation,we performed Principal Component Analysis(PCA) for five continuous pollen grain variables:P, E, log10(V ), log10(S ), surface-to-volume ratioand P/E ratio. Pollen volume and surface areawere log-transformed to assure linearity betweenvariables (Quinn and Keough 2002). We alsoperformed a PCA for three climate variables toobtain a variable that best described the joint
trends in evaporation rate, temperature andaltitude. To test the relationship between theprincipal components of pollen grain character-istics and components extracted from climaticvariables we used General Linear Model withspecies as a fixed factor.
The modelTo address how temperature affects the size,
shape and number of viable pollen grainsdelivered to stigmas, we modeled the optimalallocation of resources to the production ofpollen grains. In our model, a pollen grain is aspheroid characterized by the P and E axes andthe volume (V ) and surface area (S ) of the graincalculated according to Eqs. 1–2c. In the numer-ical examples, presented in the Model resultssection, the volume of a grain cannot be smallerthan one cubic unit. The size of pollen grains isoptimized by maximizing the fitness measure F:the expected number of pollen grains reachingthe ovule, taking into account the competitiveabilities at two pollination stages (pollen germi-nation and pollen tube growth rate). Theassumed fitness measure consists of three com-ponents. The first component is the expectednumber of grains (N ) produced by a plant and isrepresented by the following equation:
NðP;EÞ ¼ En
VðP;EÞ ð3Þ
where En is a constant pool of energy availablefor reproduction. In the numerical examples (seeResults: Model results) the amount of energyavailable for reproduction was set to 1010. TheEn value does not affect the optimization resultsbecause we are interested in relative fitness andnot the precise number of grains that successfullyfertilize ovules. Eq. 3 reflects a primary trade-off(i.e., grain size vs. grain number).
The second fitness component describes thelife expectancy of a grain as a function of size,shape and temperature transformed to thechances of reaching the stigma. We assume forsimplicity that the viability of a grain dependsonly on water content, which decreases due toevaporation.
We modeled the rate of water loss by adoptinga parameterized model of maize pollen dehy-dration (Aylor 2003, Aylor et al. 2005). Thedriving force for water loss in the model is the
v www.esajournals.org 3 October 2011 v Volume 2(10) v Article 117
EJSMOND ET AL.

vapor pressure difference between the evapora-tion surface of a pollen grain and the ambient airoutside the grain. The instantaneous rate of waterloss from a grain can be expressed as:
dW
dt¼ �kSðCc � CaÞ ð4Þ
where W is the mass of water in the pollen grainwhile Cc and Ca describe the concentrations ofwater vapor on the evaporation surface of thepollen grain and in the surrounding air, respec-tively. The conductance for water loss of thepollen wall and surrounding boundary layer ofair k was set to an arbitrary small value, equal to10�5 in the results presented below (see Results:Model results). Such a low value of k indicates thatour arbitrary time unit is very small. By applyingthe thermodynamic relationship between con-centration and vapor pressure and expressing thewater content relative to dry weight, h ¼ W/md,we obtain
dhdt¼ �kSMwp0ðTÞ
mdRðT þ 273:15Þ�
hrðhÞ � RH=100�
ð5Þ
(for detailed transformation see formulas 2–4 inAylor 2003). Eq. 5 describes the rate of water lossfrom a grain with dry weight md in temperatureT (8C) and at relative air humidity RH (%) whereMw and R are constants (molecular weight ofwater and gas constant, respectively), p0 is thesaturation vapor pressure at temperature T, andhr is the ‘effective’ relative humidity inside thewall of the pollen grain. The relative humidity hrcan be expressed by the following equation:
hr ¼ exp�ah�bDw
RðT þ 273:15Þ
� �ð6Þ
where Dw is the molar volume of water.Coefficients describing water potential at theevaporating surface, a and b, were taken fromAylor 2003 and are equal to 3.218 and 1.35,respectively (see methods in Aylor 2003 fordetails of the calculation of these coefficients).
Eq. 5 indicates that pollen loses water only aslong as hr . RH/100. The empirical data indicatethat at 23.58C, the equilibrium water content h formaize pollen at RH ¼ 20, 33, 54 and 75% wasequal to 4.4, 5.8, 8.9 and 15.7%, respectively(Aylor 2003). In order to parameterize thedehydration process in our model we assumedthat the dry weight of the grain is proportional to
its volume, md ¼ nV, where n is the scalingconstant. We then adjusted the value of n so as toobtain values of h close to the equilibrium watercontent (after a long finite time interval) formaize pollen at temperature and relative humid-ity reported by Aylor (2003).
In our model, the time scale is arbitrary and therate of water loss over time depends only on theconductance coefficient k and the water contentof pollen. The initial relative water content,defined as W/md, was set to h0 ¼ 0.5 which isapproximately equivalent to 30% of the totalmass of ripe pollen. Although pollen grainstolerate loss of water during transport, if theirwater content is low then the phospholipidstructure of their cell membranes changes froma lamellar or liquid crystalline form to a gel stateand is extremelly vulnerable to irreversiblechanges in membrane structure which are direct-ly responsible for pollen grain death (Taylor andHepler 1997). Thus pollen grain viability dra-matically decreases when the water contentdeclines to low values (see Fig. 3 in Aylor 2003).We assume, for simplicity, a critical relative watercontent hCrit¼0.06 for the results presented in theModel results section. Under this low value forwater content, the chances of germination for amaize pollen grain are negligible (ca. 0.005%relative to the germination chances of a fullyhydrated grain) (Aylor 2003, Aylor et al. 2005).We assumed such a conservative value of hCrit soas to assure the robustness of the results of themodel and to account for species-specific differ-ences in tolerance to dehydration stress (Nepi etal. 2010). The accepted threshold at which the celldies in our model is relatively low and corre-sponds to a considerable decrease in pollen grainviability even in species highly tolerant to pollendehydration stress, e.g., Petunia hybrida (Nepi etal. 2010).
Our model infers a scenario in which the actualair humidity is low enough to drive pollen graincells to desiccation and death. The empirical datasuggest that a considerable decrease in pollenviability may be expected for humidity levelseven up to 50% (Aylor 2003, Aylor et al. 2005,Nepi et al. 2010). Across this range of RH theselection pressure forced by water loss is stillstrong. RH therefore does not affect the qualita-tive results of our model for species tolerant topollen dehydration stress. Thus to keep our
v www.esajournals.org 4 October 2011 v Volume 2(10) v Article 117
EJSMOND ET AL.
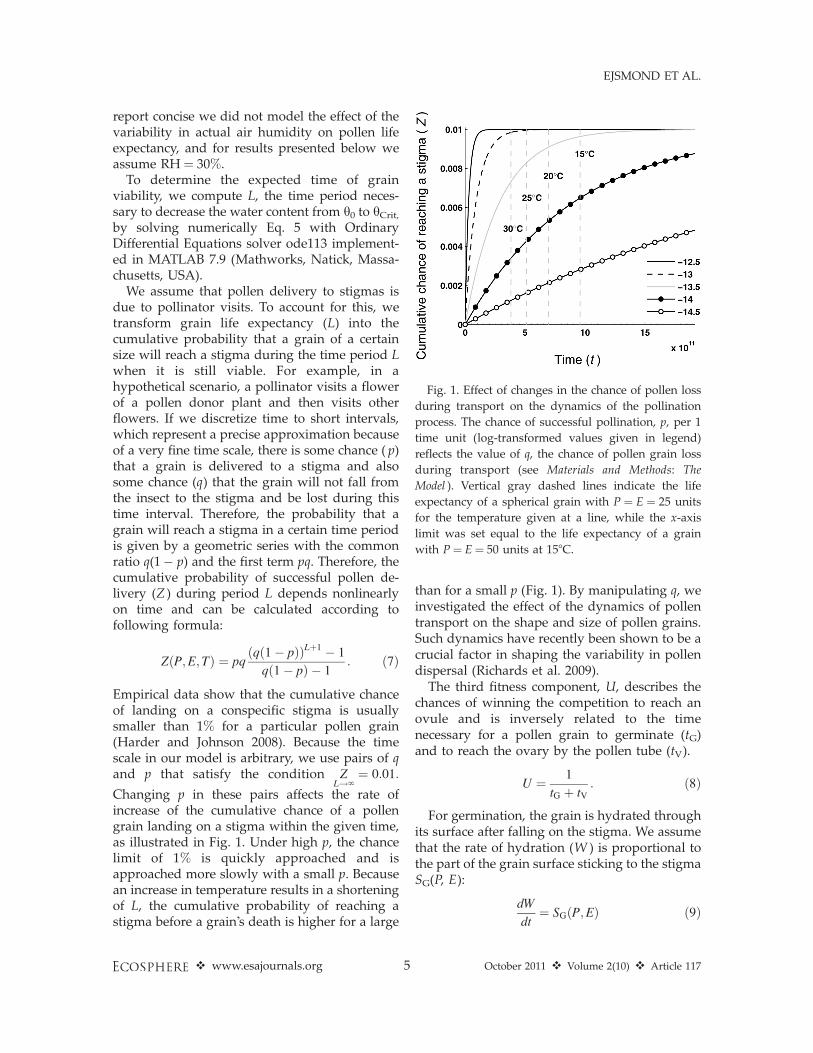
report concise we did not model the effect of thevariability in actual air humidity on pollen lifeexpectancy, and for results presented below weassume RH ¼ 30%.
To determine the expected time of grainviability, we compute L, the time period neces-sary to decrease the water content from h0 to hCrit,by solving numerically Eq. 5 with OrdinaryDifferential Equations solver ode113 implement-ed in MATLAB 7.9 (Mathworks, Natick, Massa-chusetts, USA).
We assume that pollen delivery to stigmas isdue to pollinator visits. To account for this, wetransform grain life expectancy (L) into thecumulative probability that a grain of a certainsize will reach a stigma during the time period Lwhen it is still viable. For example, in ahypothetical scenario, a pollinator visits a flowerof a pollen donor plant and then visits otherflowers. If we discretize time to short intervals,which represent a precise approximation becauseof a very fine time scale, there is some chance ( p)that a grain is delivered to a stigma and alsosome chance (q) that the grain will not fall fromthe insect to the stigma and be lost during thistime interval. Therefore, the probability that agrain will reach a stigma in a certain time periodis given by a geometric series with the commonratio q(1� p) and the first term pq. Therefore, thecumulative probability of successful pollen de-livery (Z ) during period L depends nonlinearlyon time and can be calculated according tofollowing formula:
ZðP;E; TÞ ¼ pqðqð1� pÞÞLþ1 � 1
qð1� pÞ � 1: ð7Þ
Empirical data show that the cumulative chanceof landing on a conspecific stigma is usuallysmaller than 1% for a particular pollen grain(Harder and Johnson 2008). Because the timescale in our model is arbitrary, we use pairs of qand p that satisfy the condition Z
L!‘¼ 0:01:
Changing p in these pairs affects the rate ofincrease of the cumulative chance of a pollengrain landing on a stigma within the given time,as illustrated in Fig. 1. Under high p, the chancelimit of 1% is quickly approached and isapproached more slowly with a small p. Becausean increase in temperature results in a shorteningof L, the cumulative probability of reaching astigma before a grain’s death is higher for a large
than for a small p (Fig. 1). By manipulating q, weinvestigated the effect of the dynamics of pollentransport on the shape and size of pollen grains.Such dynamics have recently been shown to be acrucial factor in shaping the variability in pollendispersal (Richards et al. 2009).
The third fitness component, U, describes thechances of winning the competition to reach anovule and is inversely related to the timenecessary for a pollen grain to germinate (tG)and to reach the ovary by the pollen tube (tV).
U ¼ 1
tG þ tV: ð8Þ
For germination, the grain is hydrated throughits surface after falling on the stigma. We assumethat the rate of hydration (W ) is proportional tothe part of the grain surface sticking to the stigmaSG(P, E):
dW
dt¼ SGðP;EÞ ð9Þ
Fig. 1. Effect of changes in the chance of pollen loss
during transport on the dynamics of the pollination
process. The chance of successful pollination, p, per 1
time unit (log-transformed values given in legend)
reflects the value of q, the chance of pollen grain loss
during transport (see Materials and Methods: The
Model ). Vertical gray dashed lines indicate the life
expectancy of a spherical grain with P ¼ E ¼ 25 units
for the temperature given at a line, while the x-axis
limit was set equal to the life expectancy of a grain
with P¼ E¼ 50 units at 158C.
v www.esajournals.org 5 October 2011 v Volume 2(10) v Article 117
EJSMOND ET AL.

where t is time in arbitrary units and SG denotesthe area of sticking surface. After solving Eq. 9,we obtain tG, the time period necessary toincrease in water content from the initial level,a1V, to the level a2V, which triggers pollengermination:
tG ¼a2VðP;EÞ � a1VðP;EÞ
SGðP;EÞ: ð10Þ
The initial and final water levels do not affect thequalitative results of the model and were set to a1¼ 0.3 (equivalent to h0 in Eqs. 5 and 6) and a2¼ 1for the results presented in the Model resultssection. We assume a conservative estimate of theexpected water content at germination equal tothe initial water content, a1, because changing thewater content at germination does not influencethe results of our model. To account for the factthat a spheroid with P/E 6¼ 1 sticks to the stigmawith a larger surface area than a sphere of thesame volume, we compute SG assuming that thesurface sticking to the stigma is limited by theplane intersecting the spheroid perpendicularlyto E (for a prolate spheroid) or P (for an oblatespheroid) and crossing 95% of the radius of P orE, respectively (Fig. 2). Because of the complicat-ed form of the analytic formula for the area, wecalculate SG using numerical methods imple-mented in MATLAB by J. Rosenberg ( publiccommunication; http://www-users.math.umd.edu/;jmr/241/surfint.html).
In our model, the rate of pollen tube growthdepends on grain volume, which is generallyempirically justified (Cruden 2009). The length ofthe pollen tube (M ) changes according to thefollowing formula:
dM
dt¼ a4Va: ð11Þ
Bigger grains usually have higher pollen tubegrowth rates, while a4 is a scaling constant andthe exponent a2h0, 1i allows us to model theallometric character of the relationship betweenpollen volume and tube growth rate. Aftersolving Eq. 11, we obtain tV, the time necessaryto reach the ovule by the pollen tube:
tV ¼h
a4Vað12Þ
where h is the distance between the stigmasurface and ovary. According to Eq. 8, U, the
third fitness component measuring the chance forsuccessful pollination, is inversely proportionalto the cumulative time of germination and pollentube growth. In our model, h was set to 1 and a4to 10�7. The values of the scaling constants h anda4 do not affect the qualitative results because allunits in the model are arbitrary. During thenatural pollination process, the time of germina-tion of a grain is usually much shorter than thetime of pollen tube growth, so tG is alwayssmaller than tV. Setting a4 to 10�7 results inrealistic values of the tG/tV ratio for optimalpollen.
The fitness measure in our model, Eq. 13, is aproduct of three components: (1) the number ofgrains that can be produced from a constantamount of resources, Eq. 3, (2) grain lifeexpectancy transformed to the chances of reach-ing a conspecific stigma, Eq. 7, and (3) thechances of winning the competition duringgermination and pollen tube growth, Eq. 8:
FðP;E; TÞ ¼ NðP;EÞZðP;E; TÞUðP;EÞ: ð13Þ
Because of the complexity of the fitness formula,we used numerical algorithms to find the valuesof P and E that maximize fitness at a giventemperature for prolate and oblate pollen grains(see Fig. 3A for example). We then compared theresults calculated for different temperatures (seeFig. 3B for example). All calculations wereperformed with MATLAB 7.9. The code for themodel is provided in the Supplement 2.
RESULTS
Empirical resultsThe PCA for pollen grain characteristics
displayed a pattern that was consistent for allstudied groups. Two components extracted bythe PCA explained over 99% of variance in allcases and had an eigenvalue .1. The pollenprincipal components for all analyzed species canbe easily interpreted in general terms of pollengrain morphology (Table 1). Higher pollen PC1(PC1poll) values suggest bigger pollen grains andsmaller surface-to-volume ratios with almost nochange in shape. As the pollen PC2 (PC2poll)value increases, there is a substantial change ingrain shape as defined by an increase in the P/Eratio. The change in shape is achieved mostly byan increase of the P axis with a slight change in
v www.esajournals.org 6 October 2011 v Volume 2(10) v Article 117
EJSMOND ET AL.

Fig. 2. Scheme for the calculation of the part of the ellipsoid sticking to the stigma, SG. Panels A–B and C–D
show schemes for prolate and oblate pollen grains landing on a stigma surface (gray plane). Panels B and D show
the intersection of ellipsoids by the plane (dashed line). The sticking surface, SG, is the part of surface of the
ellipsoids below the plane. The plane divides the polar (for oblate grains) or equatorial radius (for prolate grains)
in such a way that 5% of the radius length is below the plane.
Fig. 3. (A) An exemplary fitness landscape: black triangles mark the location of optimal pollen grain
dimensions at a temperature of 258C. (B) The effect of temperature on optimal pollen grain volume and shape.
The black solid line indicates the separation of prolate (below the line) and oblate (above the line) pollen grains.
Dashed isolines mark 6 exemplary P/E ratios. White lines connecting triangles show the location change of
optimal volume and shape in temperatures from 15 to 358C. Model parameters: p ¼ 10�14 and a ¼ 0.95.
v www.esajournals.org 7 October 2011 v Volume 2(10) v Article 117
EJSMOND ET AL.

the surface-to-volume ratio and no change inpollen volume. For the climatic variables ofaltitude, PET and temperature in the floweringperiod, the PCA extracts one PC with aneigenvalue .1. Climate PC1 (PC1clim) can beeasily interpreted in terms of desiccation stress(Table 2): a high PC1clim indicates high desicca-tion pressure. The species analyzed here havedifferent pollen grain shapes; Rosa and Rubushave prolate grains (P/E . 1; a high PC2pollcorresponds to a less spherical shape) whileCrataegus grains are oblate (P/E , 1; low PC2pollcorresponds to a more spherical shape).
Rubus gracilis.—Pollen size, in contrast toshape, is positively related to desiccation pres-sure (PC1poll(PC1clim): F1,11 ¼ 5.37, P ¼ 0.041;PC2poll(PC1clim): F1,11 ¼ 1.01, P ¼ 0.336).
Rosa.—We detected a positive relationshipbetween pollen size and desiccation pressure(PC1poll(PC1clim): F1,51 ¼ 9.70, P ¼ 0.003). Theanalyzed Rosa species differed with respect toPC1poll (F4,51¼ 2.69, P¼ 0.041), and R. gallica hassignificantly larger pollen grains than the otherspecies (P , 0.001, Duncan test). There is also aslight but non-significant difference in the re-sponses of PC1poll to PC1clim between species(species 3 PC1clim: F4,51¼ 2.34, P¼ 0.068). Pollen
shape is not correlated with climate (PC2poll(PC1-
clim): F4,51 ¼ 2.16, P ¼ 0.148) and does not differbetween species (F4,51 ¼ 0.89, P ¼ 0.477).
Crategus.—Crategus ambigua has bigger pollengrains than C. monogyna, and therefore PC1polldiffers between species (F1,12 ¼ 6.62; P ¼ 0.024).Pollen grain size decreases with altitude(PC1poll(altitude): F1,12 ¼ 5.11; P ¼ 0.043). Thereis no significant interaction between altitudeand species with respect to PC1poll (F1,12 ¼ 2.11;P ¼ 0.172), and grain shape (PC2poll) is notrelated to altitude (F1,12 ¼ 0.61; P ¼ 0.451).Species do not differ in PC2poll (F1,12¼ 0.46; P¼0.513).
In summary, empirical results show that pollengrains are larger when under intense desiccationstress for the three analyzed groups. There wasno change pollen grain shape with desiccationstress.
Model resultsUnder different dynamics of pollen transport
( p) and efficiencies of the conversion of grainvolume into the pollen tube growth rate (a), themaximal fitness on the polar-equatorial axisplane indicates pollen grains with an optimalsize and shape (Fig. 3A). The position of thefitness maxima for both prolate and oblate grainsdepends on temperature and the combination ofa and p. As shown in Fig. 3B, temperature mostlyaffects the size of the optimal pollen grain andonly slightly affects the shape (white lines in Fig.3B) for an exemplary combination of a and p;however, the shape is not spherical. The same istrue for a broad range of parameters as discussedbelow. To understand how the fundamentalgrain characteristics change within the parameterspace, we transformed the locations of the fitness
Table 1. Loadings of pollen grain traits on pollen principal components (PCs).
Trait
Rosa Rubus Crategus
PC1 PC2 PC1 PC2 PC1 PC2
P 0.893 0.450 0.896 0.442 0.959 0.280E 0.974 �0.217 0.973 �0.228 0.996 �0.067P/E �0.153 0.988 �0.154 0.988 �0.252 0.967Log10(V ) 1.000 �0.003 1.000 0.000 1.000 0.019Log10(S ) 1.000 0.024 1.000 0.026 1.000 0.007S/V �0.997 0.060 �0.999 0.047 �0.996 �0.016Eigenvalue 4.76 1.23 4.77 1.23 4.96 1.02VE (%) 79.39 20.49 79.50 20.45 82.75 16.99
Note: VE is the percentage of variance explained by PC.
Table 2. Loadings of climate variables on climate
principal component 1 (PC1).
Climate variableRosa RubusPC1 PC1
Altitude �0.761 �0.877Temperature 0.969 0.978PET in flowering period 0.942 0.897Eigenvalue 2.40 2.53VE (%) 80.11 84.32
Note: VE is the percentage of variance explained by PC.
v www.esajournals.org 8 October 2011 v Volume 2(10) v Article 117
EJSMOND ET AL.

maxima on the polar-equatorial axis plane intopollen volume and P/E ratio, which indicate thegrain size and shape, respectively.
Optimal pollen volume and shape under differenttransport dynamics (p) and the benefits of grain sizefor pollen tube growth (a).—The volume of a pollengrain with both axes being optimal increasesmonotonically with a decrease in p (Fig. 4A). Ifthe chances for landing on a conspecific stigmaincrease slowly with time, as for low p (Fig. 1), itis better to produce larger pollen grains that canstay alive long enough before critical desiccationto reach the stigma. Therefore, for a high p, theoptimal pollen size is relatively small (Fig. 4A),and it will have a high likelihood for successfulpollination (Fig. 4B).
The effect of a on optimal grain volumedepends on the level of p (Fig. 4A). For themajority of assumed values of p, the optimalpollen volume is achieved at an intermediatevalue of a. As indicated by dashed lines in Fig.4A the maximal pollen volume for a given pmoves toward lower values of a with a decreasein p. This is because under low p, the increase inpollination chance over time is slow (Fig. 1) andthe change in the pollination chance with adecrease in size is relatively small (compareFigs.4A and 4B). The number of grains producedis inversely related to grain volume, and underhigher efficiencies of the conversion of grainvolume into the growth rate of the pollen tube(high a), the better tactic is to produce smallerand more numerous grains than grains with alarge volume. Despite the smaller volume,optimal grains at high a have a shorter time ofpollen tube growth (tV) because of higherconversion efficiencies of grain volume intopollen tube growth rate (filled surface on Fig.4C).
Because the volume of a grain affects its lifeexpectancy, and optimal volume depends on a aswell as other factors, the second fitness compo-nent (Z ) indirectly depends on a, although a isnot an argument of Z. Similarly, the third fitnesscomponent (U) indirectly depends on p in twoways: first, the rate of increase in pollinationchance with time influences the volume of anoptimal grain and, because of this, also changesthe time of pollen tube growth (tV); and second,grains with a long life expectancy must be largeand may be constrained by the germination time
(tG) because of their size.The shape of an optimal grain depends on both
a and p. For a very steep increase in pollinationchance (high values of p) and low efficiency oftransformation of pollen volume to tube growthrate (low values of a ), optimal grains arespherical. For low values of p and high valuesof a, grains tend to be more prolate or oblate inshape. This does not seem intuitive because aprolate or oblate shape increases the desiccationrate, and we expect that such shapes should beselected against under conditions in whichpollination chance increases slowly over time.However, with a slow increase in pollinationchance, an efficient tactic in terms of avoidingdesiccation is to produce large grains. Enlargedpollen may be constrained by germination time(Fig. 4C), and this is why small optimal pollengrains tend to be more spherical in shape thanlarge grains in our model (compare Fig. 4A andD). Therefore, desiccation is a minor factoraffecting the optimal pollen shape because agrain with a high volume compared to one with asmall volume is more restricted by the surface-to-volume ratio during germination. For a steepincrease in pollination chance with time, the besttactic is to produce numerous grains that have arelatively short time of germination and arespherical and therefore less vulnerable to desic-cation.
The effect of temperature.—As depicted in Fig.4A, it is always a better strategy to producelarger grains as temperature increases. Because alarger size does not fully compensate forincreased desiccation rates at higher tempera-tures, grains have less of a chance for successfulpollination at higher temperature for all values ofp and a (Fig. 4A). The relative change in volume,shape and the length of the short and long axesas a response to temperature is presented in Fig.5. Temperature has the strongest effect on thesize and dimensions of optimal grains. In themiddle range of values of p over a broad range ofa values, the optimal pollen volume at 308C isalmost twice that of the volume of an optimalgrain at 158C, and the linear dimensions for bothprolate and oblate pollen are ca. 30% higher. Incontrast to the change in the volume and lengthof the axes of an optimal pollen grain as anadaptive response to increased temperature, theshape changes only slightly and for a limited
v www.esajournals.org 9 October 2011 v Volume 2(10) v Article 117
EJSMOND ET AL.

Fig. 4. The optimal volume, two fitness components, and shape of a pollen grain as a function of p and a. (A)
The optimal volume of a prolate pollen grain at two temperatures: 158C (filled) and 308C (transparent surface).
Note that grains are always larger at higher temperatures. (B) The chance of successful pollination for a prolate
pollen grain at 158C (dark gray) and 308C (light gray shaded surface). Note that the surface for higher
temperatures is always below the surface for lower temperatures over the entire parameter space. (C) Third
fitness component U of a prolate pollen grain at 158C decomposed to time of germination, tG (transparent
surface), and growth time of the pollen tube, tV (filled surface). For better visibility, both tG and tV were log10-
transformed and normalized to their maximal values. (A–C) Thick solid lines link maximal V, Z and tG of an
optimal grain calculated for a given temperature and p value across different a. The optimal volume and two
fitness components Z and U of oblate pollen grains show a very similar pattern. (D) The optimal shape of a pollen
grain at 158C as a function of p and a. The transparent surface corresponds to grains with prolate shape, while the
filled surface corresponds to oblate grains.
v www.esajournals.org 10 October 2011 v Volume 2(10) v Article 117
EJSMOND ET AL.

range of parameters. As temperature increases,
the optimal size increases and the shape tends to
be less spherical for both prolate and oblate
grains. It may not seem intuitive that the shape is
less spherical as desiccation pressure increases
because a sphere has the lowest surface-to-
volume ratio; however, under higher tempera-
tures, grains are larger, which decreases thesurface-to-volume ratio, and the change in shapetoward being less spherical, to some extent,offsets the increase of germination time charac-teristic for large grains (see Eq. 10).
Fig. 5. The change in dimensions, volume and shape of an optimal prolate pollen grain in response to
temperature. Isolines show the relative change for 4 pollen grain characteristics: polar axis (A), equatorial axis (B),
volume (C) and shape expressed as the ratio of the shorter to the longer axis (D). The pattern was similar for
oblate pollen grains. Surfaces where slightly smoothed with discrete cosine transform method (Garcia 2010) to
reduce numerical round-off errors.
v www.esajournals.org 11 October 2011 v Volume 2(10) v Article 117
EJSMOND ET AL.

DISCUSSION
Here, we present the first evidence that afundamental life history trait for plants, i.e.,pollen production, is closely connected to envi-ronmental temperature through the optimizationof the number and size of grains produced. Incontrast, temperature does not significantly affectpollen shape. Our theoretical model reveals apossible mechanism behind this relationship, andit also explains why pollen grains are usuallyprolate or oblate and not spherical and whytemperature affects pollen volume more thanpollen shape. The connection of temperaturewith pollen size and the number of pollen grainslinks aspects of pollen production with an easilymeasured environmental variable and fills a gapin our knowledge about a fundamental processin plant reproduction. The described relationshipis relatively simple in contrast to other aspects ofpollination biology that result from plant-polli-nator co-evolution. The simple character of thisrelationship may facilitate studies on the mech-anisms responsible for the shifts in plant speciesgeographical ranges due to global climate changeobserved in the last decade (Lenoir et al. 2008).
Consequences of the model’s assumptionsTo keep the model simple we assume that the
change in the probability of reaching a stigma isnot dependent on the temperature (see Fig. 1).However, classic empirical studies show that thevisitations to a flower by ectothermic pollinatorsare, to some extent, temperature dependent(Arroyo et al. 1985). Thus the effect on pollensize requires further studies.
In our model, a grain sticks to a stigma with asurface of SG during germination. We calculatethe sticking surface to account for the slightdeformation of the pollen grain and stigmasurface after pollen falls onto the stigma andthe synthesis of the pollen coat by the stigma(Edlund et al. 2004). When calculated in thismanner, the sticking surface (SG) is not simplyproportional to the pollen surface (S ). Under asimple mode of proportionality of the stickingsurface to the whole surface of an ellipsoid, onlya spherical shape would be optimal. Therefore, inour model, the optimality of grains that differ inshape from that of a sphere is related to theassumption that spheroidal grains germinate
faster than spherical grains of the same volume.The method to calculate SG used here does notinfluence the conclusion regarding the optimalincreases in pollen size with temperature.
Phenotypic plasticity or genetic polymorphism?The most basic question arising from our work,
which has primary importance in the context ofthe response of plant species to global climatechange, is whether the observed adaptive reac-tion of pollen size to desiccation pressure is aneffect of polymorphism in genes encoding pollengrain traits or phenotypic plasticity. Despite thelimitations of our empirical data, we found asignificant intraspecific relationship of pollen sizewith desiccation pressure. Therefore, we believethat phenotypic plasticity likely underlies theobserved relationship; nevertheless, further stud-ies are necessary to answer this question, andcommon garden experiments may be helpful forthis. It will also be worthwhile to check if anincrease in pollen grain volume corresponds withan increase in desiccation pressure at an inter-specific level.
Explaining the heteromorphism of pollen grainshape
In heteromorphic species, a single plant pro-duces pollen grains that differ in type. Forexample, species of Viola differ in aperturenumber within a single plant. Such heteromor-phism, as described by Dajoz et al. (1991), resultsin a trade-off between pollen grain pore numberand life expectancy: an increase in aperturenumber is linked to faster germination and alower life expectancy. Temperature-driven polli-nator activity positively correlates with the meanaperture number (Dajoz 1999), and the hetero-morphism was suggested to be an evolutionarilystable strategy when two or more species deliverpollen to flowers (Till-Bottraud et al. 1994, Till-Bottraud et al. 2001).
Many plant species produce pollen grains thatare variable in shape, ranging from slightlyoblate to slightly prolate. Such variability canalso be observed in grains produced by a singleplant, e.g., Sorbus aucuparia, Rubus rosaefolius andFragaria vesca (P. Kołaczek, personal observationbased on reference slides in the collection of theWładysław Szafer Institute of Botany, PolishAcademy of Science). For some combinations of
v www.esajournals.org 12 October 2011 v Volume 2(10) v Article 117
EJSMOND ET AL.

the model’s parameters, the optimal shape wasclose to sphere (Fig. 4D) for both prolate andoblate grains, suggesting that the fitness maximafor those two pollen types are relatively close toeach other on the polar-equatorial axis plane. Wecan easily imagine additional factors, such asdifferences in the efficiency of transport bydifferent insect species, that could lead to theevolutionary stability of such heteromorphism ofpollen grain shapes.
Using pollen size to reconstruct past climateconditions
This report provides a rationale to developpalynological methods that can be used todetermine spatial and temporal changes ofenvironmental temperature and aridity withrelatively high resolution. By measuring thedistribution of pollen grains of a given speciesdeposited in geological layers, we will be able toinfer changes in environmental conditions. Al-though the concept is simple, there are severalissues that must be addressed before such amethod can be implemented. Here, we discussonly a few examples of these problems tostimulate discussion on this subject. First, be-cause of methodological limitations, depositedgrains can be identified only at a relatively hightaxonomic level, so changes observed in the sizeof deposited grains may be caused by changes inthe relative frequency of species rather thanadaptive changes in the morphology of pollenproduced by a single species. Thus, studies mustfirst be conducted to show that the describedrelationships are true at an interspecific level.Second, sedimentary processes likely disturb theoriginal grain size distributions, so using suchinformation should be preceded by detailedevaluation of the influence of sedimentation onthe size of deposited pollen. Third, sedimentaryprocesses may reflect temporal variation in thepollen spectra caused by stochastic effects ofpollen deposition and can also be easily changedby the long-distance transport of pollen fromdifferent sites.
ConclusionsBased on our theoretical findings, we show
that avoiding desiccation by producing pollengrains of an optimal size and shape affects thenumber of grains produced. This leads to
complex results, which can be simply describedas a general trend of plants in environments withhigher temperatures and PET to produce lessnumerous and larger pollen grains and to exhibita slight change in grain shape, which may bemore difficult to detect. Further studies arenecessary to determine if knowing the size ofpollen grains can significantly improve ourpredictions on the impact of climate change onplant populations and to reconstruct past envi-ronmental conditions.
ACKNOWLEDGMENTS
This work was partly supported by the PolishMinistry of Science and Higher Education (grant NN304 044237) and Jagiellonian University funds (grantDS/WBiNoZ/INoS/757/08). We thank Marcin Czarno-łeski, Krzysztof Piatek and Paweł Koteja for commentson earlier versions of the manuscript and E. OybakDonmez for providing altitude data for the analyzedhawthorn species. A. Ejsmond and M.J. Ejsmond thankall people involved in taking care of their 1-year oldson during preparation of the manuscript.
LITERATURE CITED
Arroyo, M. T. K., J. J. Armesto, and R. B. Primack. 1985.Community studies in pollination ecology in thehigh temperate Andes of central Chile II. The effectof temperature on visitation rates and pollinationpossibilities. Plant Systematics and Evolution149:187–203.
Ashman, T. et al. 2004. Pollen limitation of plantreproduction: ecological and evolutionary causesand consequences. Ecology 85:2408–2421.
Aylor, D. E. 2003. Rate of dehydration of corn (Zeamays L.) pollen in the air. Journal of ExperimentalBotany 54:2307–2312.
Aylor, D. E., B. M. Baltazar, and J. G. Schoper. 2005.Some physical properties of teosinte (Zea mayssubsp. parviglumis) pollen. Journal of ExperimentalBotany 56:2401–2407.
Cruden, R. W. 2009. Pollen grain size, stigma depth,and style length: the relationship revisited. PlantSystematics and Evolution 278:223–238.
Dajoz, I., I. Till-Bottraud, and P. Gouyon. 1991.Evolution of pollen morphology. Science 253:66–68.
Dajoz, I. 1999. The distribution of pollen heteromor-phism in Viola: ecological and morphologicalcorrelates. Evolutionary Ecology Research 1:97–109.
Delph, L. F., M. H. Johannsson, and A. G. Stephenson.1997. How environmental factors affect pollenperformance: ecological and evolutionary perspec-
v www.esajournals.org 13 October 2011 v Volume 2(10) v Article 117
EJSMOND ET AL.

tives. Ecology 78:1632–1639.Edlund, A. F., R. Swanson, and D. Preuss. 2004. Pollen
and stigma structure and function: the role ofdiversity in pollination. The Plant Cell. 16:S84–S92.
Garcia, D. 2010. Robust smoothing of gridded data inone and higher dimensions with missing values.Computational Statistics and Data Analysis54:1167–1178.
Harder, L. D., and M. A. Aizen. 2010. Floral adaptationand diversification under pollen limitation. Philo-sophical Transactions of the Royal Society B365:529–543.
Harder, L. D., and S. D. Johnson. 2008. Function andevolution of aggregated pollen in angiosperms.International Journal of Plant Sciences 169:59–78.
Hijmans, R. J., J. L. Cameron, J. L. Parra, P. G. Jones,and A. Jarvis. 2005. Very high resolution interpo-lated climate surfaces for global land areas.International Journal of Climatology 25:1965–1978.
Jarvis, A., H. I. Reuter, A. Nelson, and E. Guevara.2008. Hole-filled seamless SRTM data V4, Interna-tional Centre for Tropical Agriculture (CIAT).http://srtm.csi.cgiar.org/
Knight, T. M., J. A. Steets, J. C. Vamosi, S. J. Mazer, M.Burd, D. R. Campbell, M. R. Dudash, M. O.Johnston, R. J. Mitchell, and T. Ashman. 2005.Pollen limitation of plant reproduction: pattern andprocess. Annual Review in Ecology, Evolution andSystematics 36:467–497.
Lenoir, J., J. C. Gegout, P. A. Marquet, P. DeRuffray,and H. Brisse. 2008. A significant upward shift inplant species optimum elevation during the 20thcentury. Science 320:1768–1771.
Nepi, M., G. C. Franchi, and E. Pacini. 2001. Pollenhydration status at dispersal: cytophysiologicalfeatures and strategies. Protoplsma 216:171–180.
Nepi, M., L. Cresti, M. Guarnieri, and E. Pacini. 2010.Effect of relative humidity on water content,viability and carbohydrate profile of Petunia hybridaand Cucurbita pepo pollen. Plant Systematic andEvolution 284:57–64.
Oybak Donmez, E. 2008. Pollen morphology in TurkishCrataegus (Rosaceae). Botanica Helvetica 118:59–70.
Pacini, E. 2000. From anther and pollen ripening topollen presentation. Plant Systematics and Evolu-tion 222:19–43.
Pacini, E., M. Guarnieri, and M. Nepi. 2006. Pollencarbohydrates and water content during develop-ment, presentation, and dispersal: a short review.Protoplasma 228:73–77.
Popek, R. 2002. Roze dziko rosnace Polski: klucz–atlas.Plantpress, Krakow, Poland. [In Polish.]
Quinn, G. P., and M. J. Keough. 2002. Experimentaldesign and data analysis for biologists. CambridgeUniversity Press, Cambridge, UK.
Richards, S. A., N. M. Williams, and L. D. Harder.2009. Variation in pollination: causes and conse-quences for plant reproduction. The AmericanNaturalist 174:382–398.
Taylor, L. P., and P. K. Hepler. 1997. Pollen germinationand tube growth. Annual Review of Plant Physi-ology and Plant Molecular Biology 48:461–491.
Trabucco, A., and R. J. Zomer. 2009. Global aridityindex (Global-Aridity) and global potential evapo-transpiration (Global-PET) geospatial database.CGIAR Consortium for Spatial Information.http://www.cgiar-csi.org/
Till-Bottraud, I., D. L. Venable, I. Dajoz, and P.Gouyon. 1994. Selection on pollen morphology: agame theory model. The American Naturalist144:395–411.
Till-Bottraud, I., P. Gouyon, D. L. Venable, and B.Godelle. 2001. The number of competitors provid-ing pollen on a stigma strongly influences intra-specific variation in number of pollen apertures.Evolutionary Ecology Research 3:231–253.
Wronska-Pilarek, D. 1998. Pollen morphology of thepolish species of the genus Ribes L. Acta SocietatisBotanicorum Poloniae 67:275–285.
Wronska-Pilarek, D., and K. Boratynska. 2005. Pollenmorphology of Rosa gallica L. (Rosaceae) fromsouthern Poland. Acta Societatis BotanicorumPoloniae 74:297–304.
Wronska-Pilarek, D., T. Malinski, and J. Lira. 2006.Pollen morphology of Polish species of genusRubus—Part I. Rubus gracilis. Dendrobiology56:69–77.
Wronska-Pilarek, D., and A. M. Jagodzinski. 2009.Pollen morphological variability of Polish nativespecies of Rosa L. (Rosaceae). Dendrobiology 62:71–82.
v www.esajournals.org 14 October 2011 v Volume 2(10) v Article 117
EJSMOND ET AL.

APPENDIX
SUPPLEMENT 1
The raw data on pollen morphology and climate variables of the collection sites used in the analysis(Ecological Archives C002-010-S1).
SUPPLEMENT 2
The MATLAB source code containing the optimization algorithm of pollen morphology used in thispaper, and a short description of the program (Ecological Archives C002-010-S2).
Fig. A1. Collection localities of Rubus gracilis and Rosa specimens used in the analysis.
v www.esajournals.org 15 October 2011 v Volume 2(10) v Article 117
EJSMOND ET AL.
Copyright © 2022 FDOKUMEN