Calculation Methods for Grains/Breads Servings in ... - CT.gov
Upload
independentCategory
view
4download
0
lable at ScienceDirect
ARTICLE IN PRESS
Journal of Cereal Science xxx (2009) 1–7
Contents lists avai
Journal of Cereal Science
journal homepage: www.elsevier .com/locate/ jcs
Storage product synthesis and accumulation in developing grains of wheat
Peter R. Shewry a,*, Claudia Underwood a, Yongfang Wan a, Alison Lovegrove a, Dhan Bhandari b,Geraldine Toole c, E.N. Clare Mills c, Kay Denyer d, Rowan A.C. Mitchell a
a Rothamsted Research, Harpenden, Hertfordshire AL5 2JQ, UKb Campden BRI, Chipping Campden, Gloucestershire GL55 6LD, UKc IFR, Norwich Business Park, Colney, Norwich NR4 7UA, UKd John Innes Centre, Norwich Research Park, Colney, Norwich NR4 7UH, UK
a r t i c l e i n f o
Article history:Received 9 December 2008Received in revised form19 February 2009Accepted 20 March 2009Available online xxx
Keywords:WheatGluten proteinsStarchDevelopment
* Corresponding author. Tel.: þ44 (0) 1582 763 133E-mail address: [email protected] (P.R. Sh
0733-5210/$ – see front matter � 2009 Elsevier Ltd.doi:10.1016/j.jcs.2009.03.009
Please cite this article in press as: Shewry,Cereal Science (2009), doi:10.1016/j.jcs.2009
a b s t r a c t
The time course of synthesis and accumulation of the major storage components in developing grain ofwheat cv Hereward has been determined. Gluten proteins were first detected at 10 dpa and accumulatedmost rapidly between 12 and 35 dpa, with little change after 42 dpa. Differences in the accumulationpatterns of two different types of u-gliadins were observed while the synthesis of the HMW subunitswas initiated about 2 days later than that of the other gluten proteins. Although protein accumulationhad essentially ceased by 42 dpa, grain desiccation was associated with a dramatic increase in theproportion of large glutenin polymers.The accumulation of starch essentially paralleled that of gluten proteins, reaching 55% of the grain dryweight at maturity. This was associated with an increase in the amylose content, from about 20 to 26% ofthe total starch. The expression patterns of transcripts encoding enzymes of the synthesis (ADP glucosepyrophosphorylase, starch synthases), branching and modification of starch were consistent with thepattern of starch accumulation and with the expression patterns reported for orthologous genes indeveloping rice grain, showing high conservation between species.
� 2009 Elsevier Ltd. All rights reserved.
1. Introduction
Wheat is one of the three major cereal crops that dominate worldagriculture, the others being maize and rice. It is particularly welladapted to temperate climates and about 600 million tonnes areharvested annually with yields exceeding 10 tonnes/ha in someagronomic systems (FAOSTAT, http://faostat.fao.org/default.aspx).Most of the wheat harvested is consumed by humans, after process-ing to give a range of breads, noodles and other products, or used tofeed livestock. However, recent years have seen an increasing interestin the use of wheat grain for non-food purposes, such as protein-based films, starch-based plastics (Colonna and Guilbert, 1999) and,more recently, the fermentation of wheat starch for biofuels.
The suitability of wheat for food, feed or industrial raw materialis largely determined by the major groups of storage products,starch and gluten proteins. In broad terms, starch accounts forabout 70–80% of the mature grain and protein for 8–14%. Further-more, the balance between these two groups of components islargely determined by the availability of nitrogen (which stimulates
; fax: þ44 (0) 1582 763 010.ewry).
All rights reserved.
P.R., et al., Storage product sy.03.009
protein synthesis), with limited genetic variation in protein content(about 1–2% on a dry weight basis) despite intensive breeding forcultivars with high protein for breadmaking or low protein for feed(Worland and Snape, 2001). It is therefore crucial to understand themechanisms which control the partitioning of carbon and nitrogeninto the major grain storage compounds as well as into cell wallsand other grain components if we wish to go beyond these currentgenetic limits and extend the range of variation in wheat graincomposition for specific end uses.
We have recently reported a detailed analysis of the tran-scriptome of developing wheat grains, using the Affymetric wheatGeneChip� for profiling (Wan et al., 2008). In the present study weuse data from this analysis to compare the expression patterns ofgenes involved in storage product synthesis with the patterns ofaccumulation of starch and gluten proteins, in order to identifypossible transcripts as targets for manipulation.
2. Materials and methods
2.1. Materials
The growth and harvesting of developing grain of winter wheatcv Hereward has been described by Wan et al. (2008). Main heads
nthesis and accumulation in developing grains of wheat, Journal of
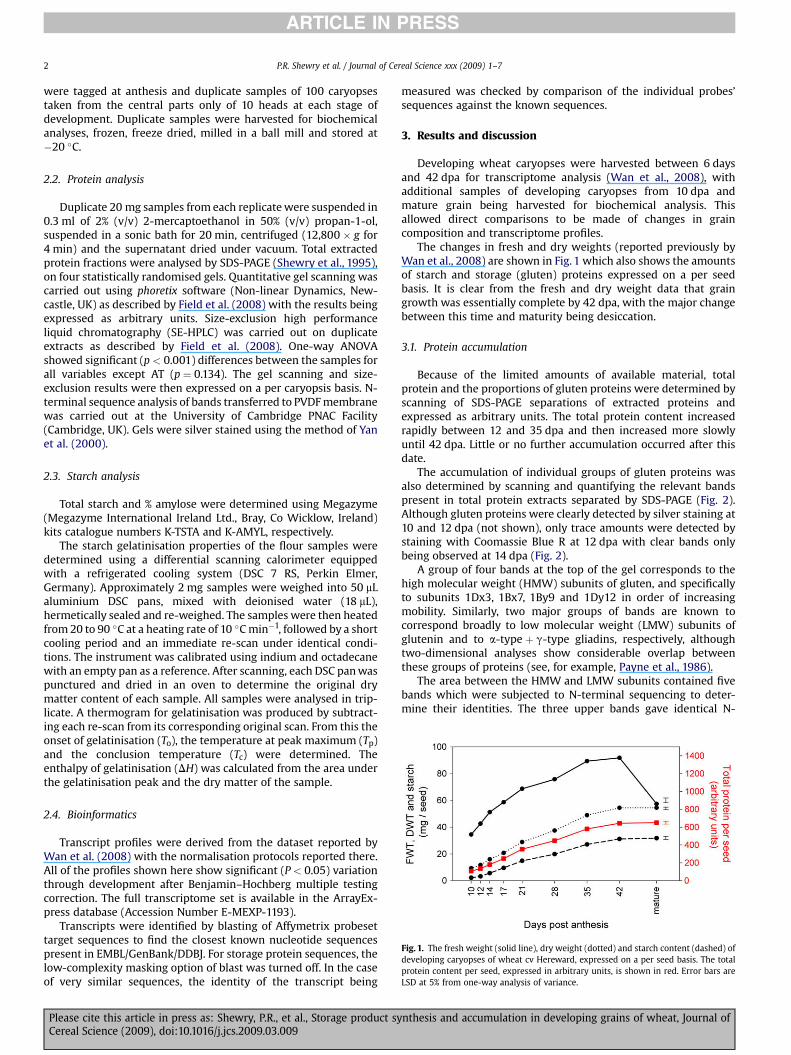
Fig. 1. The fresh weight (solid line), dry weight (dotted) and starch content (dashed) ofdeveloping caryopses of wheat cv Hereward, expressed on a per seed basis. The totalprotein content per seed, expressed in arbitrary units, is shown in red. Error bars areLSD at 5% from one-way analysis of variance.
P.R. Shewry et al. / Journal of Cereal Science xxx (2009) 1–72
ARTICLE IN PRESS
were tagged at anthesis and duplicate samples of 100 caryopsestaken from the central parts only of 10 heads at each stage ofdevelopment. Duplicate samples were harvested for biochemicalanalyses, frozen, freeze dried, milled in a ball mill and stored at�20 �C.
2.2. Protein analysis
Duplicate 20 mg samples from each replicate were suspended in0.3 ml of 2% (v/v) 2-mercaptoethanol in 50% (v/v) propan-1-ol,suspended in a sonic bath for 20 min, centrifuged (12,800 � g for4 min) and the supernatant dried under vacuum. Total extractedprotein fractions were analysed by SDS-PAGE (Shewry et al., 1995),on four statistically randomised gels. Quantitative gel scanning wascarried out using phoretix software (Non-linear Dynamics, New-castle, UK) as described by Field et al. (2008) with the results beingexpressed as arbitrary units. Size-exclusion high performanceliquid chromatography (SE-HPLC) was carried out on duplicateextracts as described by Field et al. (2008). One-way ANOVAshowed significant (p < 0.001) differences between the samples forall variables except AT (p ¼ 0.134). The gel scanning and size-exclusion results were then expressed on a per caryopsis basis. N-terminal sequence analysis of bands transferred to PVDF membranewas carried out at the University of Cambridge PNAC Facility(Cambridge, UK). Gels were silver stained using the method of Yanet al. (2000).
2.3. Starch analysis
Total starch and % amylose were determined using Megazyme(Megazyme International Ireland Ltd., Bray, Co Wicklow, Ireland)kits catalogue numbers K-TSTA and K-AMYL, respectively.
The starch gelatinisation properties of the flour samples weredetermined using a differential scanning calorimeter equippedwith a refrigerated cooling system (DSC 7 RS, Perkin Elmer,Germany). Approximately 2 mg samples were weighed into 50 mLaluminium DSC pans, mixed with deionised water (18 mL),hermetically sealed and re-weighed. The samples were then heatedfrom 20 to 90 �C at a heating rate of 10 �C min�1, followed by a shortcooling period and an immediate re-scan under identical condi-tions. The instrument was calibrated using indium and octadecanewith an empty pan as a reference. After scanning, each DSC pan waspunctured and dried in an oven to determine the original drymatter content of each sample. All samples were analysed in trip-licate. A thermogram for gelatinisation was produced by subtract-ing each re-scan from its corresponding original scan. From this theonset of gelatinisation (To), the temperature at peak maximum (Tp)and the conclusion temperature (Tc) were determined. Theenthalpy of gelatinisation (DH) was calculated from the area underthe gelatinisation peak and the dry matter of the sample.
2.4. Bioinformatics
Transcript profiles were derived from the dataset reported byWan et al. (2008) with the normalisation protocols reported there.All of the profiles shown here show significant (P < 0.05) variationthrough development after Benjamin–Hochberg multiple testingcorrection. The full transcriptome set is available in the ArrayEx-press database (Accession Number E-MEXP-1193).
Transcripts were identified by blasting of Affymetrix probesettarget sequences to find the closest known nucleotide sequencespresent in EMBL/GenBank/DDBJ. For storage protein sequences, thelow-complexity masking option of blast was turned off. In the caseof very similar sequences, the identity of the transcript being
Please cite this article in press as: Shewry, P.R., et al., Storage product syCereal Science (2009), doi:10.1016/j.jcs.2009.03.009
measured was checked by comparison of the individual probes’sequences against the known sequences.
3. Results and discussion
Developing wheat caryopses were harvested between 6 daysand 42 dpa for transcriptome analysis (Wan et al., 2008), withadditional samples of developing caryopses from 10 dpa andmature grain being harvested for biochemical analysis. Thisallowed direct comparisons to be made of changes in graincomposition and transcriptome profiles.
The changes in fresh and dry weights (reported previously byWan et al., 2008) are shown in Fig. 1 which also shows the amountsof starch and storage (gluten) proteins expressed on a per seedbasis. It is clear from the fresh and dry weight data that graingrowth was essentially complete by 42 dpa, with the major changebetween this time and maturity being desiccation.
3.1. Protein accumulation
Because of the limited amounts of available material, totalprotein and the proportions of gluten proteins were determined byscanning of SDS-PAGE separations of extracted proteins andexpressed as arbitrary units. The total protein content increasedrapidly between 12 and 35 dpa and then increased more slowlyuntil 42 dpa. Little or no further accumulation occurred after thisdate.
The accumulation of individual groups of gluten proteins wasalso determined by scanning and quantifying the relevant bandspresent in total protein extracts separated by SDS-PAGE (Fig. 2).Although gluten proteins were clearly detected by silver staining at10 and 12 dpa (not shown), only trace amounts were detected bystaining with Coomassie Blue R at 12 dpa with clear bands onlybeing observed at 14 dpa (Fig. 2).
A group of four bands at the top of the gel corresponds to thehigh molecular weight (HMW) subunits of gluten, and specificallyto subunits 1Dx3, 1Bx7, 1By9 and 1Dy12 in order of increasingmobility. Similarly, two major groups of bands are known tocorrespond broadly to low molecular weight (LMW) subunits ofglutenin and to a-type þ g-type gliadins, respectively, althoughtwo-dimensional analyses show considerable overlap betweenthese groups of proteins (see, for example, Payne et al., 1986).
The area between the HMW and LMW subunits contained fivebands which were subjected to N-terminal sequencing to deter-mine their identities. The three upper bands gave identical N-
nthesis and accumulation in developing grains of wheat, Journal of

Fig. 2. SDS-PAGE of total protein extracts from developing caryopses (10–42 dpa) andmature grain (M) of wheat cv Hereward. Duplicate samples were extracted, separatedin adjacent tracks and stained with Coomassie Blue. Molecular mass standards areshown in the left hand track: 1, 12,300; 2, 16,900, 3; 30,000; 4, 42,700; 5, 66,200; 6,78,000.
Fig. 3. Comparison of gluten protein content and transcript abundance. A: Error bars areabundance for a different probeset on the wheat Affymetrix chip, averaged over two replicaidentifiers corresponding to each line are given in Supplementary Table 1. C: Data from A expin B, expressed relative to the value at 42 dpa.
P.R. Shewry et al. / Journal of Cereal Science xxx (2009) 1–7 3
ARTICLE IN PRESS
Please cite this article in press as: Shewry, P.R., et al., Storage product syCereal Science (2009), doi:10.1016/j.jcs.2009.03.009
terminal sequences for five residues (SRLLS) which confirmed theiridentities as u-gliadins encoded by chromosome 1B (Tatham andShewry, 1985; Dupont et al., 2000). These proteins are also oftencalled u5-gliadins (see Kasarda et al., 1983). The two lower bandsboth gave mixtures of two N-terminal sequences, KELQSPQQS andARELNPSNK. These sequences were present in approximately equalamounts in the upper of these two bands whereas, in the lowerband, the KEL sequence was the major component and the AREsequence the minor one. These sequences again correspond tothose of u-gliadins, but in this case to components known to beencoded by chromosomes 1A and/or 1D (Kasarda et al., 1983;Dupont et al., 2004). These two groups of u-gliadins are thereforelabelled as u5-gliadins and u-gliadins in Figs. 2 and 3A.
The accumulation of the five groups of components was deter-mined by quantitative gel scanning with the results being pre-sented on a per seed basis in Fig. 3A and relative to the finalcontents in Fig. 3C. The five groups showed broadly similarpatterns, accumulating most rapidly between 14 and 35 dpa. Firstly,the B genome-encoded u5-gliadin components accumulated morerapidly early in development than did the A/D genome-encoded u-gliadin components, which overtook them in total amount after28 dpa. Secondly, the HMW subunits of glutenin differed in theirprofile from the other groups, accumulating more slowly during theearly and mid phases of development and in at least some casescontinuing to accumulate beyond 42 dpa (Figs. 3A,C).
LSD at 5% from one-way analysis of variance. B: Each line represents the transcripttes. The protein corresponding to each transcript is indicated in the keys. The probesetressed relative to the value at maturity. D: Mean values of transcript abundances shown
nthesis and accumulation in developing grains of wheat, Journal of

Fig. 4. A: Size-exclusion HPLC of protein fractions extracted from developing cary-opses at 14, 28 and 42 dap and mature grain of wheat cv Hereward by sonication with2% (v/v) SDS. B: Ratios of %F1/%F2 (in black, left hand axis) and (%F3 þ %F4)/%F1 (in red,right hand axis) determined by SE-HPC of extracts from developing caryopses andmature grain, as shown in part A.
P.R. Shewry et al. / Journal of Cereal Science xxx (2009) 1–74
ARTICLE IN PRESS
3.2. Expression of gluten protein transcripts
A number of probesets on the arrays are identifiable as corre-sponding to gluten protein transcripts, with all major groups beingrepresented except the u5-gliadins. The expression profiles ofindividual transcripts related to HMW subunits, LMW subunits andgliadins are therefore shown in Fig. 3B.
Six probesets are identifiable as corresponding to HMWsubunits. However, it should be noted that only one of thesecorresponds to a HMW subunit present in Hereward, subunit 1Bx7,and that this probeset showed the strongest hybridisation.However all the probesets are expected to show cross-hybridisationwith transcripts other than the closest match, as indicated by ‘‘_x_,_s_, _a_’’ in the probeset names (Supplementary Table 1). The lowerlevel of hybridisation to the probeset corresponding to 1Bx14presumably resulted from cross-hybridisation of the 1Bx7 tran-scripts. Similarly the signal from probesets for 1Dx5 and 1By16presumably resulted from cross-hybridisation to the transcripts forthe related subunits, 1Dx3 and 1By9 respectively, present inHereward. The 1Dy probeset is not identifiable as corresponding toa specific subunit but is most likely to correspond to subunit 1Dy10or 1Dy12 (present in Hereward), as these are the dominant 1Dysubunits in commercial cultivars (occurring in almost 96% of the52,613 lines surveyed by Bekes et al. (http://www.aaccnet.org/grainbin/pdfs/II_HMW_Subunits.pdf). A small signal was alsoobserved from a probeset for 1Ax2. Hereward does not expressa 1Ax subunit, having the null allele at the Glu-A1 locus, so the lowlevel of hybridisation to this probeset presumably resulted fromcross-hybridisation of the subunit 1Dx3 transcripts (the HMWsubunits encoded by the A and D genomes being more closelyrelated to each other than to those encoded by the B genome(Shewry et al., 2003)). Because most of the HMW subunit probesetson the array did not correspond to alleles present in Hereward, andalso because limited cross-hybridisation may occur betweenhomoeoalleles, the precise levels of expression measured using thearrays cannot be taken as reflecting those of the correspondinggenes. However, the developmental patterns should not be affectedby such considerations. In fact, broadly similar expression patternswere observed for all probesets, with transcripts first beingdetected in significant amounts at 8 dpa.
A number of probesets corresponded to LMW subunit productsof the Glu-A3 and Glu-D3 loci, with multiple probesets related to a/b-gliadins and g-gliadins. Again, many of these are expected tocross-hybridise with multiple transcripts because of the highdegree of sequence similarity. In contrast, only a single probesetcorresponding to an u-gliadin showed significant hybridisation,with the N-terminal sequence of the corresponding protein (ARE)indicating that it was derived from chromosome 1A or 1D (i.e. notan u5-gliadin encoded by chromosome 1B). The profiles showedthat rapid accumulation of transcripts encoding the LMW subunitsand gliadins occurred between 8 and 14 dpa, after which thetranscript levels tended to plateau. However, there are also differ-ences between the relative abundances and precise profiles oftranscripts within each group. The transcripts encoding HMWsubunits showed a clear time lag in accumulation compared tothose encoding the other groups of gluten proteins, by about 2 days,and continued to accumulate later in development. This is shownmore clearly in Fig. 3D in which the average abundances of all of thetranscripts corresponding to each protein group are expressedrelative to the values at 42 dpa (i.e. at physiological maturity),corresponding to the patterns of protein accumulation shown inFig. 3B.
This difference between the expression patterns of the HMWsubunit and LMW subunit/gliadin genes is consistent with the factthat the promoters of the LMW subunit and gliadin genes are
Please cite this article in press as: Shewry, P.R., et al., Storage product syCereal Science (2009), doi:10.1016/j.jcs.2009.03.009
known to be closely related in sequence while the sequences of theHMW subunit gene promoters differ (reviewed by Halford andShewry, 2007). However, previous studies based on analyses ofprotein profiles or mRNA populations (by RT-PCR or northernblotting) have failed to show any significant differences in theinitiation of synthesis of different families of gluten proteins duringgrain development (Mecham et al., 1981; Benetrix et al., 1994;Johansson et al., 1994; Grimwade et al., 1996; Gupta et al., 1996;Dupont et al., 1998; Altenbach et al., 2002; Dupont and Altenbach,2003).
3.3. Accumulation of glutenin polymers
The proportion of large glutenin polymers is an importantdeterminant of end use quality, as it relates directly to gluten anddough elasticity (strength) (Singh et al., 1990; Gupta et al., 1996;Popineau et al., 1994).
Size-exclusion (SE)-HPLC was therefore used to determinechanges in the glutenin polymer size distribution during graindevelopment. The method uses sonication in 2% (v/v) SDS solutionto render all of the glutenin polymers soluble and within the sizefractionation range for SE-HPLC. During the extraction, somecleavage of the polymers occurs and the size distribution observedis therefore not identical to that of the native polymers. However,the procedure is highly reproducible and good correlations
nthesis and accumulation in developing grains of wheat, Journal of

Fig. 5. Contents of starch (mg/seed) and amylose (% total starch) (part A) and abun-dance of transcripts associated with starch synthesis and modification in developingcaryopses of wheat cv Hereward. A: Error bars are LSD at 5% from one-way analysis ofvariance. B: Each line represents the transcript abundance for a different probeset onthe wheat Affymetrix chip, averaged over two replicates. The probeset identifierscorresponding to each line are given in Supplementary Table 1.
P.R. Shewry et al. / Journal of Cereal Science xxx (2009) 1–7 5
ARTICLE IN PRESS
between the polymer size distribution and functional propertiesare observed.
A typical size-exclusion profile (Fig. 4) shows four peaks corre-sponding to gluten protein fractions (called F1–F4 in Fig. 4) andfurther peaks which correspond to other components (F5 and F6 inFig. 4). Analysis of these fractions by SDS-PAGE has shown that F1comprises mainly high molecular mass polymers enriched in HMWsubunits of glutenin, F2 mainly low molecular mass gluteninpolymers, F3 mainly u-gliadins and F4 mainly a-type þ g-typegliadins (Morel et al., 2000). F5 comprises mainly non-glutenproteins and F6 low molecular mass components. The sums of F1–F5 and F1–F4 therefore provide estimates of total proteins and totalgluten proteins, respectively. The proportion of large polymers (F1)may correlate with dough strength but the ratios of %F1/%F2 and(%F3 þ %F4)/%F1 usually show stronger correlations (Millar, 2003).
The SE-HPLC charts for samples at 14, 28 and 42 dpa and maturegrain are shown in Fig. 4A while Fig. 4B plots the values for %F1/%F2and (%F3 þ %F4)/%F1 from 14 dpa to maturity.
There is clearly little change in either %F1 (not shown) or in thetwo area ratios (%F1/%F2,[%F3 þ %F4]/%F1) (Fig. 4B) during graindevelopment up to 42 dpa which can be regarded as physiologicalmaturity, but significant changes between 42 dpa and maturity (i.e.during the later stages of grain desiccation). Thus, during thisperiod the %F1 increased from 7.4 to 11.4, F1/F2 increased from 0.36to 0.52 and (%F3 þ %F4)/%F1 decreased from 6.32 to 3.84. Sinceprotein synthesis has essentially stopped by 42 dpa this changeindicates that the conversion of low Mr to high Mr polymers isoccurring as the grain dries.
Carceller and Aussenac (1999, 2001) and Daniel and Triboı(2002) showed a similar late increase in polymeric gluten proteins,the latter also showing that this occurred earlier under droughtconditions. In contrast, Benetrix et al. (1994) and Panozzo et al.(1996) showed more steady increases in polymeric glutenins indeveloping grain of durum and pasta wheats, respectively, withlittle difference between samples grown in dry and irrigated trialsin the latter study. We cannot account for the differences betweenthe results of these studies and those described here and reportedby Carceller and Aussenac (1999, 2001) and by Daniel and Triboı(2002).
The increase in polymeric glutenins during desiccation reportedby Carceller and Aussenac (1999, 2001) and the effects of droughton this process reported by Daniel and Triboı (2002) suggest thatgrain dehydration drives protein polymerisation. Although theimportance of disulphide bonds in stabilising glutenin polymers isgenerally accepted, the role of inter-chain hydrogen bonding maybe underestimated. Belton (1999) proposed a model in whichgluten elasticity was determined, at least in part, by an equilibriumbetween regions in which gluten proteins interacted by inter-chainhydrogen bonds (called trains) and regions in which hydrogenbonds were formed with water (loops). The train regions essentiallycorresponded to ‘‘glutamine zips’’ (Perutz, 1996) and their forma-tion would be favoured during dehydration (i.e. during desiccationor under drought conditions). This ‘‘zipping together’’ of the glutenproteins may facilitate the rearrangement of inter-chain disulphidebonds, leading to the increase in the F1 fraction separated by SE-HPLC.
3.4. Accumulation of starch
The accumulation of starch and the proportion of amylosewere determined using enzyme-based kits (Fig. 5A). A rapidincrease in the content of starch occurred between 12 and 35 dpa.The amount continued to increase until 42 dpa, reaching over30 mg/seed, but little change occurred after this time. The accu-mulation corresponded to an increase from about 20% of the dry
Please cite this article in press as: Shewry, P.R., et al., Storage product syCereal Science (2009), doi:10.1016/j.jcs.2009.03.009
weight at 10 dpa to about 50% at 21 dpa about 55% at maturity.During this period the percentage amylose also increased, fromabout 20 to 26%.
The increase in amylose content during grain development isconsistent with the early work of Banks et al. (1973) who showedan increase from 15.8% to 28.3% amylose between 9 and 48 dpa.However, this does not appear to be related to changes in starchgranule size distribution, with the small granules which accumu-late late in development containing similar or slightly lowercontents of amylose than the large granules (Evers et al., 1973;Meredith, 1981).
Starch gelatinisation temperatures at peak maximum (Tp) weredetermined on flours using differential scanning calorimetry. Theamounts of starch present at early stages of development (before17 dpa) were too low to give reproducible results while at laterstages (17 dpa to maturity), the values for Tp varied little, between61.35 � 0.30 (at maturity) and 63.21 � 0.33 (at 21 dpa). This indi-cates that very little change occurred in the amylopectin chain
nthesis and accumulation in developing grains of wheat, Journal of

P.R. Shewry et al. / Journal of Cereal Science xxx (2009) 1–76
ARTICLE IN PRESS
length distributions or in the degree of order of the crystallinitywithin the starch granules. This is in agreement with previous workon barley (Tester and Morrison,1993) which also showed no changein peak gelatinisation temperature during grain development.
The values for the gelatinisation enthalpy (DH in J g�1) (notshown) did not show statistically significant differences due tolarge errors. However, they appeared to increase slightly duringgrain development, which would suggest that the crystallitestructure within the starch became more stable. Starch granulesconsist of alternating layers of crystalline and amorphous regions,and the crystalline region consists mainly of amylopectin packed ina double helical manner (French, 1984). Because DH reflects the lossof double helical structure of the amylopectin molecule (Cooke andGidley, 1992), higher values of DH may reflect a more stable crys-talline structure, formed from longer helices with a higherproportion of longer branch chains of amylopectin. However,differences between samples may also be due to differences in theperfection of crystallinity rather than the amount.
3.5. Transcripts related to starch synthesis
The expression profiles of a range of transcripts related tostarch synthesis are shown in Fig. 5B. These are divided for ease ofdiscussion into four groups, corresponding to small and largesubunits of ADP glucose pyrophosphorylase (AGPase S and L,respectively), starch synthases (SSI, SSIIa, SSII, GBSSI, GBSSII),starch branching enzymes (SBEI, SBEIIB) and enzymes involved instarch modification: isoamylases (ISA1, ISA2) debranching enzyme(ISA3), limit dextrinase (LDEX) and disproportionating enzyme(DPE2).
Two forms of AGPase occur in cereal endosperm, a cytosolicand a plastidial form (Tomlinson and Denyer, 2003). The wheatAGPase transcripts shown in Fig. 5B are homologs of thoseencoding the plastidial LSU (rice LSU3, Akihiro et al., 2005) andcytosolic SSU (rice SSU1, Rosti and Denyer, 2007) in the riceendosperm. In wheat, the SSU transcripts were most abundant inearly endosperm development and then steadily declined inabundance whereas the abundance of LSU transcripts varied littlethrough development. The pattern of expression of the wheattranscripts differs from that of the homologs in rice (Ohdan et al.,2005). In rice, the transcript for the plastidial LSU was expressedat high levels early in endosperm development and then declinedabruptly while the transcript for the cytosolic SSU was expressedat lower levels than that for the LSU throughout development.However, as in wheat, the rice SSU transcript was most abundantearly in grain development. Wheat transcripts corresponding torice LSU1, which encodes the LSU expressed in leaves (Akihiroet al., 2005) and SSU2, which encodes the plastidial SSU expressedin developing grain (Rosti and Denyer, 2007) were also identifiedin this study but are not included in Fig. 5 because their expres-sion was low (less than 300). This contrasts with rice where bothof these transcripts were expressed at high levels; however thepattern is similar with the greatest expression being during earlygrain development.
Five classes of starch synthase occur in plants, GBSSI, SSI, SSII,SSIII and SSIV. In cereals, most of these isoforms are encoded bymore than one gene. For example, in rice there are 10 SS genes intotal (Hirose and Terao, 2004). The transcript abundances for four ofthe five types of isoforms in wheat are shown in Fig. 5. Of these, thetranscripts for GBSSI were the most abundant and GBSSII were theleast abundant. Similar patterns of expression were reported indeveloping rice grains, where GBSSI transcripts were also the mostabundant (Ohdan et al., 2005). In rice, GBSSII expression is greatestearly in grain development and is confined to the pericarp (Hiroseand Terao, 2004).
Please cite this article in press as: Shewry, P.R., et al., Storage product syCereal Science (2009), doi:10.1016/j.jcs.2009.03.009
Two main types of starch branching enzyme occur in plants,SBEI and SBEII, with two types of SBEII in cereals: SBEIIa which isexpressed mainly in the leaves and SBEIIb which is expressed in thegrains. Maize mutants lacking SBEIIb have altered amylopectinsynthesis, a phenotype known as amylose-extender. As in rice(Ohdan et al., 2005), the expression of SBEI was greater and wasmaintained for longer in the developing grain of wheat than theexpression of SBEIIb.
Of the starch modifying enzymes shown in Fig. 5, Isa1 and Isa2are known to be required for starch synthesis while Isa3 and DPE2are considered to be involved mainly or entirely in starch degra-dation and LDex may be involved in both of these processes. All ofthese enzymes were expressed at low levels in developing wheatgrain with Isa1 and LDex showing the highest levels of expressionwith patterns similar to that of SBEI. The expression patterns of Isa1and LDex were also similar to those reported for developing ricegrains (Ohdan et al., 2005).
The temporal patterns of expression of the different transcriptsare also broadly consistent with their roles in starch biosynthesis,with AGPase and starch synthases peaking before SBEI, ISA1 andLDex.
The patterns and relative levels of transcripts encoding starchmetabolising enzymes described here for developing wheat grainswere largely similar to the profiles reported by others in developingrice grains. This suggests that these genes may have similar roles indifferent cereal grains. This conclusion is consistent with that frommost studies of mutant and transgenic lines with altered amountsof these enzymes (Tomlinson and Denyer, 2003).
The one exception was the patterns of expression of subunitsof AGPase which, in wheat, appeared to be somewhat differentfrom those seen in rice. The basis for this difference is not yetknown and will require further investigation. The similarity inexpression profiles is remarkable considering the complexity ofthe wheat genome and the fact that the morphology of starchgranules in rice is very different from that in wheat. Rice endo-sperm contains compound starch granules, irregular granulescompressed together and resulting from a single wave of granuleinitiation, whereas wheat contains large (A) and small (B) gran-ules which are initiated separately during development (reviewedby Bechtel et al., 2009). It therefore seems likely that the genesstudied here are involved in the synthesis of starch polymers andthat other as yet unknown genes are involved in controllingpolymer assembly, the timing and number of granule initiationsand granule size and shape.
4. Conclusions
We have carried out a detailed study of the accumulation of thetwo major groups of storage polymers, starch and gluten proteins,in developing grains of wheat, combining data from biochemicaland transcriptome analyses. This provides a uniquely comprehen-sive picture of storage product synthesis and a reference dataset forfuture studies.
Acknowledgements
Rothamsted Research and IFR receive grant-aided support fromthe Biotechnology and Biological Sciences Research Council(BBSRC) of the UK. This work was supported by grants from theBBSRC: EGA17694 ‘‘a genomics approach to improving wheat grainquality for breadmaking’’ and D/10608 ‘‘The impact of wateravailability during development on the composition and functionalproperties of wheat grain.’’ We are grateful to Stephen Powers(Rothamsted) for assistance with statistical analyses.
nthesis and accumulation in developing grains of wheat, Journal of

P.R. Shewry et al. / Journal of Cereal Science xxx (2009) 1–7 7
ARTICLE IN PRESS
Appendix A. Supplemental material
Supplementary information for this manuscript can be down-loaded at doi: 10.1016/j.jcs.2009.03.009.
References
Akihiro, T., Mizuno, K., Fujimura, T., 2005. Gene expression of ADP-glucose pyro-phosphorylase and starch contents in rice cultured cells are cooperativelyregulated by sucrose and ABA. Plant Cell Physiology 46, 937–946.
Altenbach, S.B., Kothari, K.M., Lieu, D., 2002. Environmental conditions duringwheat grain development alter temporal regulation of major gluten proteingenes. Cereal Chemistry 79, 279–285.
Banks, W., Greenwood, C.T., Muir, D.D., 1973. Studies on the biosynthesis of starchgranules. Part 5: properties of the starch components of normal barley, andbarley with starch of high amylose-content, during growth. Starke 25, 153–156.
Bechtel, D., Abecassis, J., Shewry, P.R., Evers, T., 2009. The development, structureand mechanical properties of the wheat grain. In: Khan, K., Shewry, P.R. (Eds.),Wheat: Chemistry and Technology, fourth ed. AACC, St Paul, MN.
Belton, P.S., 1999. On the elasticity of wheat gluten. Journal of Cereal Science 29,103–107.
Benetrix, F., Kaan, F., Autran, J.-C., 1994. Crop quality and utilisation: changes inprotein complexes of durum wheat in developing seed. Crop Science 34,462–468.
Carceller, J.-L., Aussenac, T., 1999. Accumulation and changes in molecular sizedistribution of polymeric proteins in developing grains of hexaploid wheats:role of the desiccation phase. Australian Journal of Plant Physiology 26,301–310.
Carceller, J.-L., Aussenac, T., 2001. SDS-insoluble glutenin polymer formation indeveloping grains of hexaploid wheat: the role of the ratio of high to lowmolecular weight glutenin subunits and drying rate during ripening. AustralianJournal of Plant Physiology 28, 193–201.
Colonna, P., Guilbert, S., 1999. Biopolymer Science: Food and Non Food Applications.Montpellier, France, 28–30 September 1998. INRA, Paris.
Cooke, D., Gidley, M.J., 1992. Loss of crystalline and molecular order during starchgelatinization: origin of the enthalpic transition. Carbohydrate Research 227,103–112.
Daniel, C., Triboı, E., 2002. Changes in wheat protein aggregation during graindevelopment: effects of temperatures and water stress. European Journal ofAgronomy 16, 1–12.
Dupont, F.M., Altenbach, S.B., 2003. Molecular and biochemical impacts of envi-ronmental factors on wheat grain development and protein synthesis. Journalof Cereal Science 38, 133–146.
Dupont, F.M., Hurkman, W.J., Tanaka, C.K., Chan, R., 1998. BiP, HSP70, NDK and PDIin wheat endosperm. I. Accumulation of mRNA and protein during graindevelopment. Physologia Plantarum 103, 70–79.
Dupont, F.M., Vensel, W.H., Chan, R., Kasarda, D.D., 2000. Characterisation of the1B-type u-gliadins from Triticum aestivum cultivar Butte. Cereal Chemistry 77,607–614.
Dupont, F.M., Vensel, W.H., Chan, R., Kasarda, D.D., 2004. Similarities of omega-gliadins from Triticum urartu to those encoded on chromosome 1A of hexaploidwheat and evidence for their post-translational processing. Theoretical andApplied Genetics 108, 1299–1308.
Evers, A.D., Greenwood, C.T., Muir, D.D., Venables, C., 1973. Studies on the biosyn-thesis of starch granules. Part 8: a comparison of the properties of the small andthe large granules in mature cereal starches. Starke 25, 42–46.
Field, J.M., Bhandari, D., Bonet, A., Underwood, C., Darlington, H., Shewry, P.R., 2008.Introgression of transgenes into a commercial cultivar confirms differentialeffects of HMW subunits 1Ax1 and 1Dx5 on gluten properties. Journal of CerealScience 48, 457–463.
French, D., 1984. Organization of starch granules. In: Whistler, R.L., BeMiller, J.N.,Paschall, E.F. (Eds.), Starch: Chemistry and Technology. Academic Press,Orlando, FL.
Grimwade, B., Tatham, A.S., Freedman, R.B., Shewry, P.R., 1996. Comparison of theexpression patterns of genes coding for wheat gluten proteins and proteinsinvolved in the secretory pathway in developing caryopses of wheat. PlantMolecular Biology 30, 1067–1073.
Gupta, R.B., Masci, S., Lafiandra, D., Bariana, H.S., MacRitchie, F., 1996. Accumulationof protein subunits and their polymers in developing grains of hexaploidwheats. Journal of Experimental Botany 47, 1377–1385.
Please cite this article in press as: Shewry, P.R., et al., Storage product syCereal Science (2009), doi:10.1016/j.jcs.2009.03.009
Halford, N.G., Shewry, P.R., 2007. The structure and expression of cereal storageprotein genes. In: Hamaker, B. (Ed.), Technology of Functional Cereal Products.Woodhead Publishing, Cambridge.
Hirose, T., Terao, T., 2004. A comprehensive expression analysis of the starch syn-thase gene family in rice (Oryza sativa L. Planta 220, 9–16.
Johansson, E., Oscarson, P., Heneen, W.K., Lundborg, T., 1994. Differences in accu-mulation of storage proteins between wheat cultivars during development.Journal of the Science of Food and Agriculture 64, 305–313.
Kasarda, D.D., Autran, J.C., Lew, E.J.-L., Nimmo, C.C., Shewry, P.R., 1983. N-terminalamino acid sequences of u-gliadins and u-secalins: implications for theevolution of prolamin genes. Biochimica et Biophysica Acta 747, 138–150.
Mecham, D.K., Fullington, J.G., Greene, F.C., 1981. Gliadin proteins in the developingwheat seed. Journal of the Science of Food and Agriculture 32, 773–780.
Meredith, P., 1981. Large and small starch granules in wheat – are they reallydifferent? Starke 33, 40–44.
Millar, S.J., 2003. The Development of Near Infrared (NIR) Spectroscopy Cali-brations for the Prediction of Wheat and Flour Quality. Project Report No.310, HGCA, UK.
Morel, M.-H., Dehlon, P., Autran, J.C., Leygue, J.P., Bar-L’Helgouac’h, C., 2000.Effects of temperature, sonication time and power settings on size distri-bution and extractability of total wheat flour proteins as determined by size-exclusion high-performance liquid chromatography. Cereal Chemistry 77,685–691.
Ohdan, T., Fancisco, P.B., Sawada, T., Hirose, T., Terao, T., Satoh, H., Nakamura, Y.,2005. Expression profiling of genes involved in starch synthesis in sink andsource organs of rice. Journal of Experimental Botany 56, 3229–3244.
Panozzo, J.F., Eagles, H.A., Bekes, F., Wootton, M., 1996. Synthesis and polymerisationof glutenin in developing wheat endosperms. In: Wrigley, C.W. (Ed.), Gluten ’96.RACI, Austrialia.
Payne, P.I., Holt, L.M., Burgess, S.R., Shewry, P.R., 1986. Characterisation by two-dimensional gel electrophoresis of the protein components of protein bodies,isolated from the developing endosperm of wheat (Trititcum aestivum). Journalof Cereal Science 4, 217–223.
Perutz, M.F., 1996. Glutamine repeats and inherited neurodegenerative diseases:molecular aspects. Current Opinions in Structural Biology 6, 848–858.
Popineau, Y., Cornec, M., Lefebvre, J., Marchylo, B., 1994. Influence of high Mr glu-tenin subunits on glutenin polymers and rheological properties of gluten andgluten subfractions of near-isogenic lines of wheat Sicco. Journal of CerealScience 19, 231–241.
Rosti, S., Denyer, K., 2007. Two Paralogous Genes Encoding Small Subunits of ADP-glucose pyrophosphorylase in maize, Bt2 and L2, replace the single alterna-tively-spliced gene found in other cereal species. Journal of Molecular Evolution65, 316–327.
Shewry, P.R., Tatham, A.S., Fido, R.J., 1995. Separation of plant proteins by electro-phoresis. In: Jones, H. (Ed.), Methods of Molecular Biology – Plant Gene Transferand Expression Protocols, Vol. 49. Humana Press, USA, pp. 399–422.
Shewry, P.R., Halford, N.G., Tatham, A.S., 2003. The high molecular weight subunitsof wheat glutenin and their role in determining wheat processing properties.In: Taylor, S.L. (Ed.), Advances in Food and Nutrition Research, Vol. 45. AcademicPress, pp. 219–302.
Singh, N.K., Donovan, G.R., MacRitchie, F., 1990. Use of sonication and size-exclusionhigh-performance liquid chromatography in the study of wheat flour proteins.II. Relative quantity of glutenin as a measure of breadmaking quality. CerealChemistry 67, 161–170.
Tatham, A.S., Shewry, P.R., 1985. The conformation of wheat gluten proteins. Thesecondary structures and thermal stabilities of a-, b-, g- and u-gliadins. Journalof Cereal Science 3, 103–113.
Tester, R.F., Morrison, W.R., 1993. Swelling and gelatinization of cereal starches. VI.Starches from waxy hector and hector barleys at four stages of grain develop-ment. Journal of Cereal Science 17, 11–18.
Tomlinson, K., Denyer, K., 2003. Starch synthesis in cereal grains. Advances inBotanical Research 40, 1–61.
Wan, Y., Poole, R.L., Huttly, A.K., Toscano-Underwood, C., Feeney, K., Welham, S.,Gooding, M.J., Mills, E.N.C., Edwards, K.J., Shewry, P.R., Mitchell, R.A.C., 2008.Transcriptome analysis of grain development in hexaploid wheat. BMC Geno-mics 9, 121.
Worland, T., Snape, J.W., 2001. Genetic basis of worldwide wheat varietalimprovement. In: Bonjean, A.P., Angus, W.J. (Eds.), The World Wheat Book – AHistory of Wheat Breeding. Groupe Limagrain, Paris, pp. 59–100.
Yan, J.X., Wait, R., Berkelman, T., Harry, R.A., Westbrook, J.A., Wheeler, C.H.,Dunn, M.J., 2000. A modified silver staining protocol for visualization ofproteins compatible with matrix-assisted laser desorption/ionization andelectrospray ionization-mass spectrometry. Electrophoresis 21, 3666–3672.
nthesis and accumulation in developing grains of wheat, Journal of
Copyright © 2022 FDOKUMEN