A multi-scale approach of the mechanisms underlying exopolysaccharide auto-organization in the...
8
A multi-scale approach of the mechanisms underlying exopolysaccharide auto-organization in the Proteus mirabilis extracellular matrix† ´ Elodie Lahaye,‡ a Yun Qin,‡ a Fr ´ ed ´ eric Jamme,‡ bc Thierry Aubry‡ d and Olivier Sire‡ * a For decades, the origin of the concentric ring pattern of bacterial swarming colonies has puzzled microbiologists. It was hypothesized that a periodic water activity variation originates a phase transition within the extracellular matrix water H bond network, which switches on and off the exopolysaccharide auto-organization. Both rheological and infrared spectroscopy measurements respectively performed at a molecular scale and on a currently migrating colony, have given a physical insight into the mechanisms which underlie the switch between swarming and consolidation phases. Thanks to in situ and real time infrared microspectroscopy, and thanks to the brilliance of the infrared beam at SOLEIL synchrotron, here we demonstrate that Proteus mirabilis swarming is triggered by a periodic variation of water activity at the colony edge. A dynamic behavior emerges from the global properties of the multicellular entity which relies on the ability of the bacterial cells to tune exoproduct synthesis in order to undergo sharp transitions at a given water activity threshold. Introduction Bacterial colonies are excellent candidates for studying funda- mental problems of self-organization and pattern formation in complex biological systems. This is the reason why develop- mental biologists have paid attention to multicellularity 1 since such complex systems necessarily imply a high degree of signal integration leading to space and time correlations linking billions of individual cells. Hence, the interest of such studies is signicantly greater than that of bacterial colonies and bio- lms. In the case of Proteus mirabilis, it has been proposed that the periodicity of the swarming phenomenon 2–5 was linked to density-dependent thresholds in controlling the transitions between distinct phases. 3 Such correlations, oen observed in bacterial multicellular entities, usually rely on chemical triggers, which mediate the quorum sensing (QS) cell-to-cell exchanges. 6 More precisely, QS allows every cell to sense the population extent and, beyond a given density threshold, to activate the genes responsible for differentiation or virulence expression. Regarding this point, the P. mirabilis swarming constitutes a unique complex biological oscillator. The pop- ulation expanses through periodic and synchronous swarming phases which alternate with consolidation phases. If one excepts the very early stages of the colony formation, no chemical trigger like furanones or homoserine lactones are produced to warrant this unique synchronicity. 4 If the hDC operon has been identied as the main genetic determinant for the vegetative to swarmer cell differentiation process, 7 genetics failed to reveal which factor was responsible for the sudden operon's switch at a given moment. Consequently, chemical triggers were actively, but in vain, looked for 6 since they are good candidates to convey information between cells, allowing thereby the local promotion of population cohesion. 4 Since this direction is a dead end, we turned to investigate the global properties of the colony and paid attention to the biochemical and functional properties of the extracellular matrix (ECM) that constitutes the bacterial cell continuum. 8,9 The P. mirabilis ECM biochemical analysis revealed a binary mixture of exopoly- saccharides (EPS), a phenoglycolipid (PGL) and glycine betaine (GB), a well-known bacterial osmoprotectant. The presence of GB and a PGL strongly suggested that the bacterial colony is subjected to a permanent osmotic stress, which in turn indi- cates that the water content may constitute a constraint. Here we present a multi-scale approach of the mechanisms which underlie the periodic and synchronous swarming of a Laboratoire d’Ing´ enierie des Mat´ eriaux de Bretagne, Universit´ e Europ´ eenne de Bretagne, Campus de Tohannic, BP573, 56017 Vannes CEDEX, France. E-mail: [email protected]; Fax: +33 297 017 071; Tel: +33 297 017 148 b INRA - D´ epartement CEPIA, Rue de la G´ eraudi` ere, F-44316, Nantes CEDEX 3, BP 71627, France c Synchrotron SOLEIL, l'Orme des merisiers Saint-Aubin BP48, 91192 Gif-sur-Yvette CEDEX, France d Laboratoire d'Ing´ enierie des Mat´ eriaux de Bretagne, Universit´ e Europ´ eenne de Bretagne, UBO, UFR Sciences et Techniques, 6, Avenue Victor Le Gorgeu CS93837, 29238 Brest Cedex 3, France † Electronic supplementary information (ESI) available: 2D synchronous and asynchronous full color maps. See DOI: 10.1039/c4an00618f ‡ The manuscript was written through contributions of all authors. All authors have given approval to the nal version of the manuscript. These authors contributed equally. Cite this: DOI: 10.1039/c4an00618f Received 6th April 2014 Accepted 26th June 2014 DOI: 10.1039/c4an00618f www.rsc.org/analyst This journal is © The Royal Society of Chemistry 2014 Analyst Analyst PAPER Published on 27 June 2014. Downloaded by Université d'Orleans on 28/07/2014 14:37:46. View Article Online View Journal
-
Upload
independent -
Category
Documents
-
view
2 -
download
0
Transcript of A multi-scale approach of the mechanisms underlying exopolysaccharide auto-organization in the...
Analyst
PAPER
Publ
ishe
d on
27
June
201
4. D
ownl
oade
d by
Uni
vers
ité d
'Orl
eans
on
28/0
7/20
14 1
4:37
:46.
View Article OnlineView Journal
A multi-scale app
aLaboratoire d’Ingenierie des Materiaux
Bretagne, Campus de Tohannic, BP573,
[email protected]; Fax: +33 297 017 071; TbINRA - Departement CEPIA, Rue de la Ge
71627, FrancecSynchrotron SOLEIL, l'Orme des merisiers
CEDEX, FrancedLaboratoire d'Ingenierie des Materiaux
Bretagne, UBO, UFR Sciences et Technique
29238 Brest Cedex 3, France
† Electronic supplementary informationasynchronous full color maps. See DOI: 1
‡ The manuscript was written through cohave given approval to the nal versiocontributed equally.
Cite this: DOI: 10.1039/c4an00618f
Received 6th April 2014Accepted 26th June 2014
DOI: 10.1039/c4an00618f
www.rsc.org/analyst
This journal is © The Royal Society of
roach of the mechanismsunderlying exopolysaccharide auto-organization inthe Proteus mirabilis extracellular matrix†
Elodie Lahaye,‡a Yun Qin,‡a Frederic Jamme,‡bc Thierry Aubry‡d and Olivier Sire‡*a
For decades, the origin of the concentric ring pattern of bacterial swarming colonies has puzzled
microbiologists. It was hypothesized that a periodic water activity variation originates a phase transition
within the extracellular matrix water H bond network, which switches on and off the exopolysaccharide
auto-organization. Both rheological and infrared spectroscopy measurements respectively performed at
a molecular scale and on a currently migrating colony, have given a physical insight into the mechanisms
which underlie the switch between swarming and consolidation phases. Thanks to in situ and real time
infrared microspectroscopy, and thanks to the brilliance of the infrared beam at SOLEIL synchrotron,
here we demonstrate that Proteus mirabilis swarming is triggered by a periodic variation of water activity
at the colony edge. A dynamic behavior emerges from the global properties of the multicellular entity
which relies on the ability of the bacterial cells to tune exoproduct synthesis in order to undergo sharp
transitions at a given water activity threshold.
Introduction
Bacterial colonies are excellent candidates for studying funda-mental problems of self-organization and pattern formation incomplex biological systems. This is the reason why develop-mental biologists have paid attention to multicellularity1 sincesuch complex systems necessarily imply a high degree of signalintegration leading to space and time correlations linkingbillions of individual cells. Hence, the interest of such studies issignicantly greater than that of bacterial colonies and bio-lms. In the case of Proteus mirabilis, it has been proposed thatthe periodicity of the swarming phenomenon2–5 was linked todensity-dependent thresholds in controlling the transitionsbetween distinct phases.3 Such correlations, oen observed inbacterial multicellular entities, usually rely on chemical
de Bretagne, Universite Europeenne de
56017 Vannes CEDEX, France. E-mail:
el: +33 297 017 148
raudiere, F-44316, Nantes CEDEX 3, BP
Saint-Aubin BP48, 91192 Gif-sur-Yvette
de Bretagne, Universite Europeenne de
s, 6, Avenue Victor Le Gorgeu CS93837,
(ESI) available: 2D synchronous and0.1039/c4an00618f
ntributions of all authors. All authorsn of the manuscript. These authors
Chemistry 2014
triggers, which mediate the quorum sensing (QS) cell-to-cellexchanges.6 More precisely, QS allows every cell to sense thepopulation extent and, beyond a given density threshold, toactivate the genes responsible for differentiation or virulenceexpression. Regarding this point, the P. mirabilis swarmingconstitutes a unique complex biological oscillator. The pop-ulation expanses through periodic and synchronous swarmingphases which alternate with consolidation phases. If oneexcepts the very early stages of the colony formation, nochemical trigger like furanones or homoserine lactones areproduced to warrant this unique synchronicity.4 If the hDCoperon has been identied as the main genetic determinant forthe vegetative to swarmer cell differentiation process,7 geneticsfailed to reveal which factor was responsible for the suddenoperon's switch at a given moment. Consequently, chemicaltriggers were actively, but in vain, looked for6 since they aregood candidates to convey information between cells, allowingthereby the local promotion of population cohesion.4 Since thisdirection is a dead end, we turned to investigate the globalproperties of the colony and paid attention to the biochemicaland functional properties of the extracellular matrix (ECM) thatconstitutes the bacterial cell continuum.8,9 The P. mirabilis ECMbiochemical analysis revealed a binary mixture of exopoly-saccharides (EPS), a phenoglycolipid (PGL) and glycine betaine(GB), a well-known bacterial osmoprotectant. The presence ofGB and a PGL strongly suggested that the bacterial colony issubjected to a permanent osmotic stress, which in turn indi-cates that the water content may constitute a constraint.
Here we present a multi-scale approach of the mechanismswhich underlie the periodic and synchronous swarming of
Analyst

Analyst Paper
Publ
ishe
d on
27
June
201
4. D
ownl
oade
d by
Uni
vers
ité d
'Orl
eans
on
28/0
7/20
14 1
4:37
:46.
View Article Online
P. mirabilis. Previous studies8,9 have suggested that the ECM,due to its viscoelastic properties and its ability to form spher-ullites would behave as a semi-crystalline continuum. Thepresent paper aims at bringing evidence that such propertiesare deeply involved in a periodic variation of water activity (aw),which in turn is responsible for the morphotype switch betweenswarming and consolidation phases (see Fig. 10 in ref. 8). Todemonstrate that this switch between consolidation andswarming phases is controlled by an EPS phase transition inrelation to ECM water activity, experiments were performed tocharacterize more thoroughly the EPS viscoelastic propertiesand to monitor, in situ and in real-time, the EPS auto-organi-zation along with the water H bond network.
Experimental sectionStrain, media and culture conditions
The P. mirabilis wild-type strain WT19 corresponds to the clin-ical isolate U64507. WT19 was grown in LB medium at 37 �C. Toobtain homogeneous populations of swarmer bacteria, 200 mLof an overnight liquid culture was spread onto a LB agar (1.5%)plate, and the latter was incubated for 4 h at 37 �C. For studyingthe periodic swarming, a 3 mL inoculum was deposited at thecenter of a Petri dish and was allowed to grow for up to 8 hourson the same agar solid medium.
Experimental techniquesExopolysaccharide extraction and purication
EPS extraction and purication from actively swarming colonieshave essentially been performed as described in ref. 8. Aspreviously mentioned, the EPS fraction from a swarming colonyis essentially characterized by two compounds with differentmolecular weights, one with a low molecular weight of 1 kDaand the other with a much higher molecular of 400 kDa, in a20 : 1 ratio.
Polarized microscopy
Puried EPS solutions at different concentrations (wt%) havebeen prepared and allowed to age between a sealed slide andcoverslip. Observations are performed by using a BX-60 polar-izing microscope and a quarter wave plate.
Rheology
All rheological measurements were carried out in oscillatorysimple shear with a controlled strain rheometer (TA Instru-ments), equipped with a cone and plate geometry (cone angle:2�, diameter: 5 cm). The sample temperature was set at 20 �Cusing a thermostatic bath. For each sample tested, strain sweepviscoelastic tests were rst performed at a xed 1 Hz frequencyin order to determine the extent of the linear regime; then,frequency sweep experiments were carried out at a xed strainin the linear regime in order to determine the linear viscoelasticmoduli, that is the storagemodulus G0 and the loss modulus G00,of the samples. G0 characterizes the elastic energy stored in thesample structure and G0 0 the viscous dissipation within the
Analyst
sample. Puried EPS solutions at six different concentrations,4.8 wt%, 9 wt%, 13 wt%, 16.7 wt%, 23 wt%, and 28 wt%, havebeen characterized.
Infrared spectroscopy
Mid Infrared (MIR) spectroscopy has long been used to probemacromolecule structures and conformations and, hence, iswell suited to monitor EPS auto-organization12–14 which showsup in the 1200–900 cm�1 frequency domain.12,13 Water is also astrong absorbent in the MIR domain due to the O–H stretching(localized around 3400 cm�1) and the H–O–H bending (local-ized at 1640 cm�1) vibrations. Unfortunately, due to signicantspectral overlap, essentially with proteins, the colony watercontent cannot be straightforwardly derived from absorben-cies in these domains. This drawback may be bypassed bymonitoring instead the water librational band located ataround 615 cm�1.13�15 This band is rarely used since most ofthe optics and detectors of infrared spectrophotometers arenon-transparent and not sensitive enough, respectively, toyield a signal with sufficient SNR to be interpreted. Anothertechnical difficulty is that bacterial colonies exhibit highabsorbency and diffusivity in the infrared domain whichprevent them from collecting a high quality specular reectedsignal, the unique acquisition mode to get spectral informa-tion without any physical contact between the optics and acurrently migrating colony. As a consequence, a very brilliantIR source is required, which is available only at a synchrotronradiation facility. Hence, to simultaneously monitor the EPSauto-organization phenomena and aw variations during acomplete swarming phase, we used synchrotron infraredmicrospectroscopy (Continumm and NicPlan, Nicolet micro-scopes) allowing a satisfactory (15 mm) 2D spatial resolution,and two types of IR detectors: a MCT detector (Continmm) torstly assess in situ the occurrence of EPS auto-organization,and, secondly, a Si:B bolometer (NicPlan) which allows torecord IR spectra in the 2000–400 cm�1 wavenumber rangewhich encompasses both EPS and water librational absorptionbands. Spectra are the average of 126 scans and are collected ata 4 cm�1 spectral resolution during a complete swarming cycle(consolidation–swarming–consolidation). It must be notedthat no signicant baseline dris were observed nor artefactsgenerally arising from Mie scattering. Hence no Kramers–Kronig correction was applied to the collected spectra andintensities are expressed as log(1/R). This allows assessing thatthe observed spectral changes are not due to standing waveeffects as described by Filik.16
Results and discussion
Semi-crystallinity of the EPS puried fraction. In the presentstudy, the ECM is assumed to play a major role in the switchbetween consolidation and swarming phases of P. mirabiliscolonies. This hypothesis relies on the semi-crystalline prop-erties of this continuum. Previous SEM experiments haveshown that spherullite-like objects were observed in colonies,9
whereas spherullites and needle-like crystalline objects were
This journal is © The Royal Society of Chemistry 2014

Paper Analyst
Publ
ishe
d on
27
June
201
4. D
ownl
oade
d by
Uni
vers
ité d
'Orl
eans
on
28/0
7/20
14 1
4:37
:46.
View Article Online
observed in puried ECM fractions.8 Since aw variations withinthe colony are expected to drive reversible EPS auto-organiza-tion, we made attempts to study the behavior of EPS solutionsat various concentrations to highlight the relationshipbetween aw and the formation of semi-crystalline objects.Hence, observations of EPS solutions at different concentra-tions (wt%) were performed by using polarizing opticalmicroscopy.
Fig. 1 displays different objects observed at weight concen-trations ranging from 5 up to 28%. At low weight concentrations(<10%), the micrographs do not show any particular objects. Ata concentration of about 13 wt%, spherullite-like objectsappear, with a strongly birefringent signature due to local order;they exhibit diameters ranging from 100 up to 200 mm. If thewater activity is further decreased, radially ordered crystallineneedle-like objects are observed, which look very much likethose observed by SEM in a swarming colony (see Fig. 6 in ref.9). These needle-like objects exhibit an average length l of about100 mmand an average diameter D of about 17 mm, leading to anaverage aspect ratio l/D of about 6 (about 50 needles werecharacterized). These observations clearly show that, in aP. mirabilis colony, such semi-crystalline objects are derivedfrom EPS auto-organization and are independent of any effectdue to, or mediated by, the bacterial cells, since these objectsare observed in EPS puried solutions. Above 16 wt%, a newstructure, governed by auto-organization phenomena, appearsas suggested by the observation of crystalline needle-like objectsorganized in a branched network, which is expected to give anadditional contribution to the ECM rigidity. It was hencenecessary to further characterize the mechanical properties ofthe ECM, in the concentration range on both sides of theconcentration corresponding to the above-described structuralchange.
Mechanical properties of the EPS puried fraction. For allsamples tested, the limit of the linear viscoelastic regime, whereG0 and G00 are independent of strain amplitude, lies between0.1% and 1%. This result shows that a low strain is able toinduce a non-linear viscoelastic behavior, suggesting that thestructure of the EPS solutions, over the whole range ofconcentrations investigated, is rather fragile.
Fig. 2 shows the storagemodulus G0 and the loss modulus G0 0
as a function of frequency, at a strain chosen in the linearresponse regime, for a 4.8 wt% (Fig. 2A) and 16.7 wt% (Fig. 2B)EPS solution, respectively. At all EPS concentrations investi-gated in this work, the viscoelastic behavior of EPS solutions
Fig. 1 Crystalline objects observed by polarized microscopy at different
This journal is © The Royal Society of Chemistry 2014
has the same features: both viscoelastic moduli have low valuesand are weakly dependent on frequency, at least in thefrequency range investigated, and G0 [ G0 0. These results meanthat all EPS solutions investigated in this work behave like soviscoelastic solids, which suggests that their structure is that ofa weak gel,17 most likely due to the presence of numerous Hbonds which connect EPS molecules, forming a fragile three-dimensional polymeric network, as discussed in a previouspaper.8
The main difference between the low and high concentratedEPS solutions is the level of the moduli: the storage modulus ofa 16.7 wt% EPS solution is about 2 decades higher than that of a4.8 wt% EPS solution. In order to study the EPS concentrationdependence of the storage G0 at a xed frequency, we plottedFig. 3.
Fig. 3 clearly shows that there are two concentration regimes:at EPS concentrations below about 13 wt%, G0 has low valuesand exhibits a weak concentration dependence, whereas at EPSconcentrations higher that 15 wt%, G0 has much higher valuesand exhibits a much stronger concentration dependence. Onemay refer to Fig. 1 for the corresponding supramolecularorganization present at each concentration.
The existence of a concentration threshold at about 13 wt%,characterized by a drastic G0 increase, has to be linked with theconcentration induced modication of the state of organizationof the EPS macromolecules presented above. Indeed the pres-ence of anisometric needle-like crystalline entities (the so-calledspicules, see Fig. 1) in EPS solutions at concentrations higherthan 10 wt% could be responsible for the drastic enhancementof elastic properties.
Knowing the characteristic dimensions of crystalline nee-dles, and the percolation volume fraction of spheres, Fps �30%,18 the percolation volume fraction, Fp, of these objects canbe inferred from the assumption that the volume occupied bycylinders is equivalent to that of spheres with a radius equal tohalf the average length of the cylinders. Indeed, if the needlesare considered as cylinders, with diameter D and length L, then:
Fp
Fps
¼ 3
2
�D
L
�2
Knowing the average aspect ratio of the microcrystallinespicules L/D � 6, then Fp � 1.3%; thus only about 1 vol%spicules are needed to form a percolation network. We suggestthat the EPS concentration threshold at about 13 wt%
purified EPS weight fractions. The frame widths represent 700 mm.
Analyst

Fig. 2 Storage modulus G0 and loss modulus G0 0 as a function of frequency, at a fixed strain amplitude of 0.5%, for a 4.8 wt% (left) and 16.7 wt%(right) EPS solution.
Fig. 3 Storage modulus G0 as a function of EPS concentration, at afrequency of 1 Hz.
Fig. 4 Mean MIR spectrum (1800–900 cm�1) and difference spectra(inset) of a currently swarming colony. The figure displays the average(n ¼ 50) spectrum in the 1800–900 cm�1 frequency domain and theinset shows the dynamic spectra (from which the mean spectrum hasbeen subtracted). Proteins amide I and II bands show up at 1650 cm�1
(with a strong overlap of the water bending mode) and 1540–1580 cm�1, respectively whereas EPS show up in the 1200–900 cm�1
frequency domain.
Analyst Paper
Publ
ishe
d on
27
June
201
4. D
ownl
oade
d by
Uni
vers
ité d
'Orl
eans
on
28/0
7/20
14 1
4:37
:46.
View Article Online
corresponds to the percolation threshold of the microcrystallinespicules, and that, above this concentration threshold, thesignicantly enhanced elastic response of EPS solutions is dueto the superposition of the EPS transient polymeric network andthe spicule percolation network.
Rheological experiments performed on EPS solutions haverevealed a marked elastic behaviour with a sharp phase transi-tion driven by water activity. Such behaviour is the signature ofEPS auto-organization, which in turn depends on the physico-chemical modulation of polysaccharide H bond networks. Atlow aw, a percolation network is formed which is expected todrastically hinder swarm cell motility. Since an alteration of theexternal medium mechanical properties drives the initial celldifferentiation subsequent to the transfer of the strain from aliquid culture to an agar Petri dish,10 we have hypothesized thatthe periodicity and synchronicity of the swarming could beruled by aw variations at the edge of the colony. Both experi-mental observations and theoretical considerations9,11 convergeto suggest that, due to the colony spreading on the agar as a thin(15 mm) lm during a swarming phase, the resulting increasedS/V ratio would increase the net water transfer from the agar to
Analyst
the colony. The resulting increased aw within the biolm shouldconsequently induce disorganization of the percolation networkwhich is responsible for the high storage modulus of the EPSsolutions. It was then necessary to look for concomitant varia-tions of both EPS supramolecular organization and water Hbond network. These attempts have been performed throughinfrared microspectroscopy on a currently swarming colony.
Real time study of EPS auto-organization
We rstly attempt to assess in situ the occurrence of EPS auto-organization by monitoring, in a non-invasive way, the EPS MIRspectral domain through an entire swarming cycle, i.e. betweentwo consecutive consolidation phases. Every two minutes, aspectrum was collected at the colony's moving edge, which
This journal is © The Royal Society of Chemistry 2014

Fig. 6 Mean MIR spectrum (2000–400 cm�1) and difference spectra(inset) of a currently swarming colony. The figure displays the average(n ¼ 57) spectrum while the inset displays the corresponding dynamicspectra. The broad band located at 615 cm�1 features the waterlibrational mode; the dynamic spectra emphasize the variations ofabsorbance in this domain.
Paper Analyst
Publ
ishe
d on
27
June
201
4. D
ownl
oade
d by
Uni
vers
ité d
'Orl
eans
on
28/0
7/20
14 1
4:37
:46.
View Article Online
allows spatial mapping of the spectral information. Fig. 4 showsthe resulting MIR spectra.
The dataset was analysed by Principal Component Analysis(PCA), and the rst principal component featuring 45% of thetotal variability was plotted as a function of the colony expan-sion (Fig. 5A). The resulting data show that most of the spectralvariations can be safely assigned to EPS since the rst three PCs,reecting up to 90% of the total variability, are dominated byspectral features which correspond to the EPS absorptiondomain (Fig. 5B). It is noteworthy that the PC1 scores (Fig. 5A)undergo a reversible sharp transition just before the colonyedge switches between swarming and consolidation. Hence, itcan be assessed that the EPS auto-organization which has beenobserved on puried EPS solutions8,19 also occurs in situ at thetransition between consolidation and swarming phases.
In order to determine whether or not EPS auto-organizationis linked to aw variations within the colony, IR spectra werecollected on a lower spectral window encompassing both theEPS and water librational mode frequency domains. This wasmade possible by the use of a Si:B bolometer, which is muchmore sensitive in this low frequency domain than the MCTdetector.
Fig. 5 PCA of MIR spectra (1800–900 cm�1) collected during aswarming phase. (A) The migration (dots) scale is zeroed at thebeginning of the experiment and corresponds to an initial colonyradius of approximately 3 mm, the PC1 score is also plotted (solid line);(B) three first principal components.
This journal is © The Royal Society of Chemistry 2014
Fig. 6 shows the mean spectrum and the amplitude varia-tions of the dataset collected, as previously, during a fullswarming cycle. Besides variations in the EPS spectral domain,signicant variations are also observed in the spectral rangethat corresponds to the water librational mode, i.e. from 900 to400 cm�1. To correlate EPS auto-organization observablebetween 2000 and 900 cm�1 with aw variations observable fromthe 615 cm�1 water librational band, a rst PCA (Fig. 7A and B)was performed by using the whole spectral domain (2000–400cm�1) which again reects major changes in the EPS absorptiondomain as shown in Fig. 7B.
To emphasize spectral variations of the water librationalmode, a second PCA (Fig. 7C and D) was performed on the solewater absorption domain (900–400 cm�1) which demonstratesthat during active swarming (here from 11 h 30 min to 14 h 30min), IR spectra exhibit positive PC1 loadings which correspondto low absorbencies at the low frequency band tail, and hencelow aw. Indeed, the corresponding PC1 loadings (Fig. 7D) showthat during swarming, the water band loses intensity over itslower energy side. This spectral evolution has been reported(see Fig. 2C in ref. 15) to reect an increased crystallinity or, inother words, a larger H bond connectivity. The data shown arefrom one representative experiment which has been reproducedon three distinct colonies. One must note that the PC1 scorevariation in the 900–400 cm�1 domain is an order of magnitudeless than one observed in the 2000–400 cm�1 one.
To investigate the causality between the changes in EPS Hbond networks and water activity, a 2D correlation analysis wasperformed.20 The corresponding synchronous 2D correlationmap (Fig. 8A) indicates that the spectral envelope between 950and 1050 cm�1 decreases as the 500 to 800 cm�1 domainincreases. Indeed, in a 2D synchronous map, negative cross-peaks reect bands that evolve in an opposite manner duringthe process.20 Information about the time sequence of these
Analyst
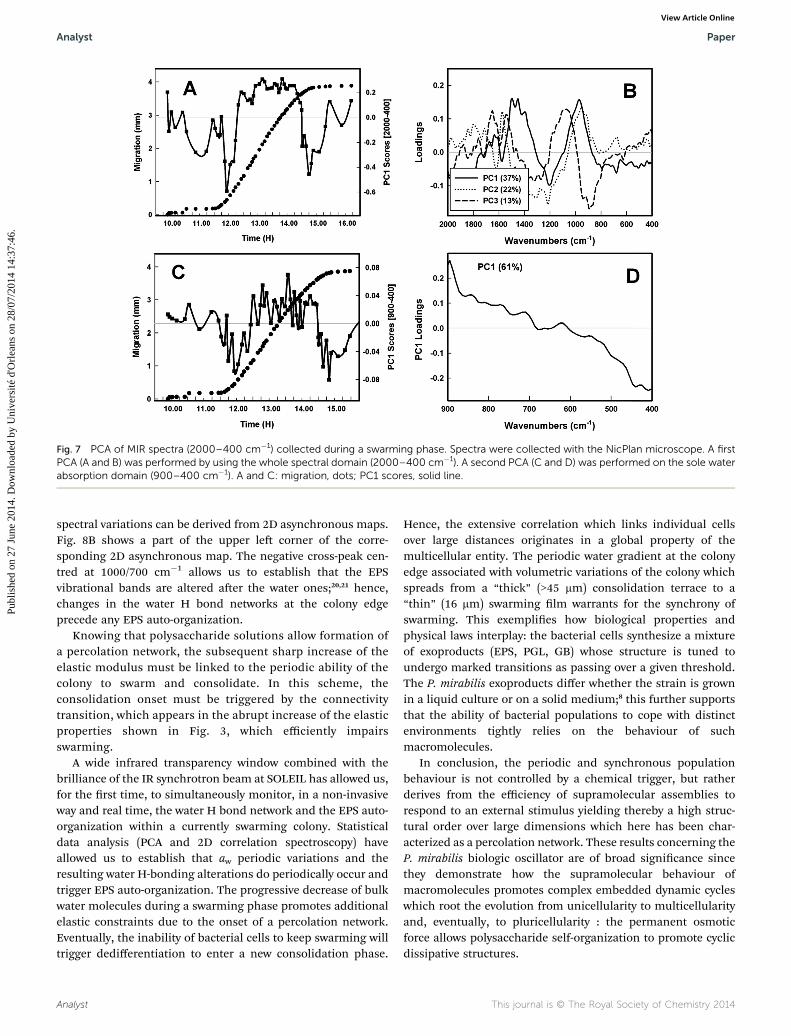
Fig. 7 PCA of MIR spectra (2000–400 cm�1) collected during a swarming phase. Spectra were collected with the NicPlan microscope. A firstPCA (A and B) was performed by using the whole spectral domain (2000–400 cm�1). A second PCA (C and D) was performed on the sole waterabsorption domain (900–400 cm�1). A and C: migration, dots; PC1 scores, solid line.
Analyst Paper
Publ
ishe
d on
27
June
201
4. D
ownl
oade
d by
Uni
vers
ité d
'Orl
eans
on
28/0
7/20
14 1
4:37
:46.
View Article Online
spectral variations can be derived from 2D asynchronous maps.Fig. 8B shows a part of the upper le corner of the corre-sponding 2D asynchronous map. The negative cross-peak cen-tred at 1000/700 cm�1 allows us to establish that the EPSvibrational bands are altered aer the water ones;20,21 hence,changes in the water H bond networks at the colony edgeprecede any EPS auto-organization.
Knowing that polysaccharide solutions allow formation ofa percolation network, the subsequent sharp increase of theelastic modulus must be linked to the periodic ability of thecolony to swarm and consolidate. In this scheme, theconsolidation onset must be triggered by the connectivitytransition, which appears in the abrupt increase of the elasticproperties shown in Fig. 3, which efficiently impairsswarming.
A wide infrared transparency window combined with thebrilliance of the IR synchrotron beam at SOLEIL has allowed us,for the rst time, to simultaneously monitor, in a non-invasiveway and real time, the water H bond network and the EPS auto-organization within a currently swarming colony. Statisticaldata analysis (PCA and 2D correlation spectroscopy) haveallowed us to establish that aw periodic variations and theresulting water H-bonding alterations do periodically occur andtrigger EPS auto-organization. The progressive decrease of bulkwater molecules during a swarming phase promotes additionalelastic constraints due to the onset of a percolation network.Eventually, the inability of bacterial cells to keep swarming willtrigger dedifferentiation to enter a new consolidation phase.
Analyst
Hence, the extensive correlation which links individual cellsover large distances originates in a global property of themulticellular entity. The periodic water gradient at the colonyedge associated with volumetric variations of the colony whichspreads from a “thick” (>45 mm) consolidation terrace to a“thin” (16 mm) swarming lm warrants for the synchrony ofswarming. This exemplies how biological properties andphysical laws interplay: the bacterial cells synthesize a mixtureof exoproducts (EPS, PGL, GB) whose structure is tuned toundergo marked transitions as passing over a given threshold.The P. mirabilis exoproducts differ whether the strain is grownin a liquid culture or on a solid medium;8 this further supportsthat the ability of bacterial populations to cope with distinctenvironments tightly relies on the behaviour of suchmacromolecules.
In conclusion, the periodic and synchronous populationbehaviour is not controlled by a chemical trigger, but ratherderives from the efficiency of supramolecular assemblies torespond to an external stimulus yielding thereby a high struc-tural order over large dimensions which here has been char-acterized as a percolation network. These results concerning theP. mirabilis biologic oscillator are of broad signicance sincethey demonstrate how the supramolecular behaviour ofmacromolecules promotes complex embedded dynamic cycleswhich root the evolution from unicellularity to multicellularityand, eventually, to pluricellularity : the permanent osmoticforce allows polysaccharide self-organization to promote cyclicdissipative structures.
This journal is © The Royal Society of Chemistry 2014
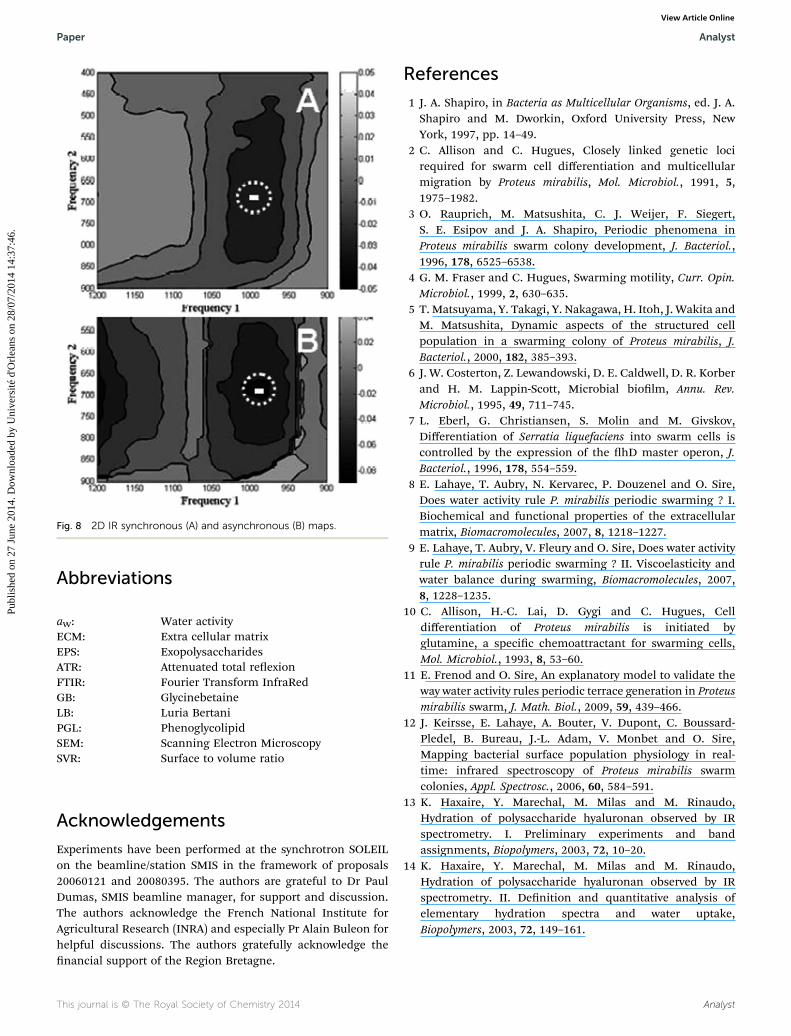
Fig. 8 2D IR synchronous (A) and asynchronous (B) maps.
Paper Analyst
Publ
ishe
d on
27
June
201
4. D
ownl
oade
d by
Uni
vers
ité d
'Orl
eans
on
28/0
7/20
14 1
4:37
:46.
View Article Online
Abbreviations
aW:
This journal is © The R
Water activity
ECM: Extra cellular matrix EPS: Exopolysaccharides ATR: Attenuated total reexion FTIR: Fourier Transform InfraRed GB: Glycinebetaine LB: Luria Bertani PGL: Phenoglycolipid SEM: Scanning Electron Microscopy SVR: Surface to volume ratioAcknowledgements
Experiments have been performed at the synchrotron SOLEILon the beamline/station SMIS in the framework of proposals20060121 and 20080395. The authors are grateful to Dr PaulDumas, SMIS beamline manager, for support and discussion.The authors acknowledge the French National Institute forAgricultural Research (INRA) and especially Pr Alain Buleon forhelpful discussions. The authors gratefully acknowledge thenancial support of the Region Bretagne.
oyal Society of Chemistry 2014
References
1 J. A. Shapiro, in Bacteria as Multicellular Organisms, ed. J. A.Shapiro and M. Dworkin, Oxford University Press, NewYork, 1997, pp. 14–49.
2 C. Allison and C. Hugues, Closely linked genetic locirequired for swarm cell differentiation and multicellularmigration by Proteus mirabilis, Mol. Microbiol., 1991, 5,1975–1982.
3 O. Rauprich, M. Matsushita, C. J. Weijer, F. Siegert,S. E. Esipov and J. A. Shapiro, Periodic phenomena inProteus mirabilis swarm colony development, J. Bacteriol.,1996, 178, 6525–6538.
4 G. M. Fraser and C. Hugues, Swarming motility, Curr. Opin.Microbiol., 1999, 2, 630–635.
5 T. Matsuyama, Y. Takagi, Y. Nakagawa, H. Itoh, J. Wakita andM. Matsushita, Dynamic aspects of the structured cellpopulation in a swarming colony of Proteus mirabilis, J.Bacteriol., 2000, 182, 385–393.
6 J. W. Costerton, Z. Lewandowski, D. E. Caldwell, D. R. Korberand H. M. Lappin-Scott, Microbial biolm, Annu. Rev.Microbiol., 1995, 49, 711–745.
7 L. Eberl, G. Christiansen, S. Molin and M. Givskov,Differentiation of Serratia liquefaciens into swarm cells iscontrolled by the expression of the hD master operon, J.Bacteriol., 1996, 178, 554–559.
8 E. Lahaye, T. Aubry, N. Kervarec, P. Douzenel and O. Sire,Does water activity rule P. mirabilis periodic swarming ? I.Biochemical and functional properties of the extracellularmatrix, Biomacromolecules, 2007, 8, 1218–1227.
9 E. Lahaye, T. Aubry, V. Fleury and O. Sire, Does water activityrule P. mirabilis periodic swarming ? II. Viscoelasticity andwater balance during swarming, Biomacromolecules, 2007,8, 1228–1235.
10 C. Allison, H.-C. Lai, D. Gygi and C. Hugues, Celldifferentiation of Proteus mirabilis is initiated byglutamine, a specic chemoattractant for swarming cells,Mol. Microbiol., 1993, 8, 53–60.
11 E. Frenod and O. Sire, An explanatory model to validate theway water activity rules periodic terrace generation in Proteusmirabilis swarm, J. Math. Biol., 2009, 59, 439–466.
12 J. Keirsse, E. Lahaye, A. Bouter, V. Dupont, C. Boussard-Pledel, B. Bureau, J.-L. Adam, V. Monbet and O. Sire,Mapping bacterial surface population physiology in real-time: infrared spectroscopy of Proteus mirabilis swarmcolonies, Appl. Spectrosc., 2006, 60, 584–591.
13 K. Haxaire, Y. Marechal, M. Milas and M. Rinaudo,Hydration of polysaccharide hyaluronan observed by IRspectrometry. I. Preliminary experiments and bandassignments, Biopolymers, 2003, 72, 10–20.
14 K. Haxaire, Y. Marechal, M. Milas and M. Rinaudo,Hydration of polysaccharide hyaluronan observed by IRspectrometry. II. Denition and quantitative analysis ofelementary hydration spectra and water uptake,Biopolymers, 2003, 72, 149–161.
Analyst
Analyst Paper
Publ
ishe
d on
27
June
201
4. D
ownl
oade
d by
Uni
vers
ité d
'Orl
eans
on
28/0
7/20
14 1
4:37
:46.
View Article Online
15 J.-B. Brubach, A. Mermet, A. Filabozzi, A. Gerschel andP. Roy, Signatures of the hydrogen bonding in the infraredbands of water, J. Chem. Phys., 2005, 122, 184509.
16 J. Filik, M. D. Frogley, J. Pijanka, K. Wehbe and G. Cinque,Optical standing-waves artifacts in reection–absorptionFTIR microscopy of biological materials, J. Phys.: Conf. Ser.,2012, 359, 012006.
17 R. G. Larson, in The Structure and Rheology of Complex Fluids,Oxford University Press, New York, 1999.
18 R. Consiglio, D. R. Baker, G. Paul and H. E. Stanley,Continuum percolation thresholds for mixtures of spheresof different sizes, Physica, 2003, 319, 49–55.
Analyst
19 M. Gue, V. Dupont, A. Dufour and O. Sire, Bacterialswarming: a biochemical time-resolved FTIR-ATR study ofProteus mirabilis swarm-cell differentiation, Biochemistry,2001, 4, 11938–11945.
20 I. Noda, Advances in two-dimensional correlationspectroscopy, Vib. Spectrosc., 2004, 36, 143–165.
21 B. Czarnik-Matusewicz, S. Pilorz, L. Ashton andE. W. Blanch, Potential pitfalls concerning visualization ofthe 2D results, J. Mol. Struct., 2006, 799, 253–258.
This journal is © The Royal Society of Chemistry 2014