THE MERCOSUR RICE ECONOMY
65
THE MERCOSUR RICE ECONOMY Ralph Bierlen, Eric J. Wailes and Gail L. Cramer INTRODUCTION here has been growing interest among nations in the western hemi- sphere in preferential trading arrangements (Taylor et al., 1995; Schuh and Junguita, 1993). Since 1990, 33 regional agreements have been regis- tered with the World Trade Organization — the supranational organization that sets the rules for international trade (Blandford, 1995). One of the most important of these trading arrangements is the Mercado Comun del Sur (Common Market of the South), commonly referred to by its acronym, the MERCOSUR. (See Table 1 for a definition of acronyms and technical terms.) The MERCOSUR is a customs union whose member nations are Argentina, Brazil, Paraguay and Uruguay and whose economies account for over half of Latin America’s gross domestic product (GDP) 1 . Chile joined as an associate member on October 1, 1996, and Bolivia is expected to become an associate member in 1997 2 . Since 1991 regional integration and bilateral economic reforms have had major impacts on MERCOSUR rice markets. Brazil, the largest rice consuming nation T 1 Forms of economic integration include free-trade areas, customs unions, common markets and economic unions. Free-trade members lower or eliminate tariffs and perhaps other trade barriers among themselves, but each maintains its own trade policy toward non-members. A customs union is a trading arrangement in which internal tariffs are lowered or removed and a common trade policy is maintained toward non-members. A common market is a customs union in which factor markets such as labor, capital and enterprise are also integrated. An economic union pushes integration substantially beyond that of a common market. Factor markets and product markets are closely integrated as well as fiscal, monetary, taxation and social policies. As nations move from free-trade areas to economic unions, national demarcations among members become increasingly blurred. 2 The most important impediments to Chile becoming a full MERCOSUR member were tariffs that were typically lower than those of the MERCOSUR and its preferential trading arrangements with other nations. Under its agreement with the MERCOSUR, Chile will retain its external tariff of 11% on imports from non-members and will immediately place zero tariffs on 700 import categories from members. Gradual elimination of other tariffs will take place over an 18-year period. An important aspect of the agreement is the physical integration protocol, which will give the other MERCOSUR nations access to Chilean Pacific ports.
-
Upload
independent -
Category
Documents
-
view
0 -
download
0
Transcript of THE MERCOSUR RICE ECONOMY
THE MERCOSUR RICE ECONOMY
Ralph Bierlen, Eric J. Wailes and Gail L. Cramer
INTRODUCTION
here has been growing interest among nations in the western hemi-sphere in preferential trading arrangements (Taylor et al., 1995; Schuhand Junguita, 1993). Since 1990, 33 regional agreements have been regis-
tered with the World Trade Organization — the supranational organization that setsthe rules for international trade (Blandford, 1995). One of the most important ofthese trading arrangements is the Mercado Comun del Sur (Common Market of theSouth), commonly referred to by its acronym, the MERCOSUR. (See Table 1 for adefinition of acronyms and technical terms.) The MERCOSUR is a customs unionwhose member nations are Argentina, Brazil, Paraguay and Uruguay and whoseeconomies account for over half of Latin America’s gross domestic product (GDP)1.Chile joined as an associate member on October 1, 1996, and Bolivia is expected tobecome an associate member in 19972.
Since 1991 regional integration and bilateral economic reforms have had majorimpacts on MERCOSUR rice markets. Brazil, the largest rice consuming nation
T
1Forms of economic integration include free-trade areas, customs unions, common markets and economicunions. Free-trade members lower or eliminate tariffs and perhaps other trade barriers among themselves, buteach maintains its own trade policy toward non-members. A customs union is a trading arrangement in whichinternal tariffs are lowered or removed and a common trade policy is maintained toward non-members. Acommon market is a customs union in which factor markets such as labor, capital and enterprise are alsointegrated. An economic union pushes integration substantially beyond that of a common market. Factormarkets and product markets are closely integrated as well as fiscal, monetary, taxation and social policies. Asnations move from free-trade areas to economic unions, national demarcations among members becomeincreasingly blurred.
2The most important impediments to Chile becoming a full MERCOSUR member were tariffs that were typicallylower than those of the MERCOSUR and its preferential trading arrangements with other nations. Under itsagreement with the MERCOSUR, Chile will retain its external tariff of 11% on imports from non-members andwill immediately place zero tariffs on 700 import categories from members. Gradual elimination of other tariffswill take place over an 18-year period. An important aspect of the agreement is the physical integrationprotocol, which will give the other MERCOSUR nations access to Chilean Pacific ports.

ARKANSAS EXPERIMENT STATION BULLETIN 954
2
Table 1. Definitions.Name DefinitionAsociación Cultivadores de Arroz Uruguayan Rice Growers Association. Represents the
interests of rice producers.Amazon Basin Large upland production area in Brazil located west of
the Cerrado.Banco de la Republica Uruguayan gov’t bank that lends to the private sector at
market intererst rates.Blue Belle A U.S. high-quality long-grain indica rice variety. This and
similar varieties planted in Argentina and Uruguay.Cerrado Large upland rice production area in Brazil that runs
north to south between the Amazon basin and theAtlantic ocean.
CFP Brazil’s Commission of Production Finance. In charge ofgov’t credit to agriculture from 1943 to 1990.
Chui City in eastern Uruguay on Brazilian border. Majorcrossing point for Uruguayan rice.
CIAT Center for International Tropical Agriculture located inCali, Columbia. Channels new rice varieties from IRRI tonational rice research programs in the MERCOSUR.
Comision Sectorial de Arroz Uruguayan Sectorial Rice Commission. Group composedof growers, millers and gov’t that sets the nationalseasonal average producer price.
CONAB The National Supply Company of Brazil. Manages theprice support program for rice, which includes substantialstorage.
Corrientes Several largest Argentinean rice-producing provincesbetween the Paraná and Uruguayan rivers. Secondlargest rice producer.
Double Carolina A double-width indica rice variety primarily grown andconsumed in Argentina. Has low yields and is slow tomature.
EMBRAPA The Brazilian Institute for Agriculture Research. Federalagency in charge of basic agricultural research.
Entre Rios Largest Argentinean rice-producing province between theParaná and Uruguay rivers.
Gremial de Molinos Arroceros Uruguay Rice Millers Association. Represents theinterest of millers.
Hidrovia The Paraná-Uruguay river system. Seen as backbone ofMERCOSUR transportation system.
INTA National Institute of Agricultural Technology. Primaryagricultural research arm of Argentinean government.
IRGA The Rio Grande do Sul Rice Institute. State institutionthat is largest research institution for irrigated rice inBrazil.
IRRI The International Rice Research Institute. Located in thePhillipines, it is responsible for developing new ricecultivars.
Junta de Granos The National Grain Board of Argentina. Prior to 1990sregulated internal rice prices and exports.
MERCOSUR Customs union consisting of Argentina, Brazil, Chile,Paraguay and Uruguay.
NAFTA A free trade area consisting of Canada, Mexico and theUnited States.
continued

THE MERCOSUR RICE ECONOMY
3
Table 1. continued.Name DefinitionPLE A 60-month running average wholesale trigger price for
Brazilian rice. If exceeded, stocks released.Proarroz Commission for the Improvement of Rice Cultivation. A
non-profit mixed commission representing theArgentinean rice industry.
Real Plan 1995 Brazilian economic plan that introduced a newcurrency and reduced government expenditure.
Rio de la Plata An estuary on the Atlantic ocean between Argentina andUruguay formed by the Paraná and Uruguay rivers.
Rio Grande do Sul Southernmost state in Brazil that is the largest producerof irrigated rice.
Saõ Paulo Largest city and deficit market for rice in Brazil.Tipo 1 Brazilian grade of milled rice with 10% or less brokens.
Used as standard throughout MERCOSUR.Tropical indica varieties High-yielding rice varieties planted throughout
MERCOSUR and primarily consumed in Brazil. Origi-nated with IRRI.
Uruguayana City in southeastern Corrientes, Argentina, on Brazilianborder. Point through which bulk of rice crosses intoBrazil.
outside of Asia, was self-sufficient in rice until the early 1990s. In the 1990s, Brazilhas imported about 1 million metric tons (MT) annually3. In response to Brazilianimport demand, Argentina and Uruguay have doubled their production since 1990,and they have the potential to produce substantially more.
Although intra-MERCOSUR trade has increased to 600,000 MT (about 4% ofworld trade), little attention has been given to the emergence of MERCOSUR ricemarkets because no import substitution has taken place. MERCOSUR exports out ofthe region remain relatively unimportant when compared to the total world quantitytraded, and until the 1990s the region did not import substantial quantities of rice ona regular basis. There are indications, however, that events in MERCOSUR ricemarkets will have repercussions on international markets in 1996 and beyond. Be-cause of drought and a reduction in area planted, Brazil imported 2 million MT in1996. Estimates at planting indicate that Brazilian production will fall 8% in 1997 andimports will be greater than those of 1996. Currently, Argentina and Uruguay areable to supply less than half of Brazil’s import needs. This has opened up substantialexport opportunities to other suppliers that are likely to extend to at least 1998. Inaddition, Argentina and Uruguay are desirous of diversifying their export marketsaway from Brazil, and there are a number of factors that indicate that they will havesome degree of success in accomplishing this goal in the future.4
3Except where noted, imports and exports are on a milled basis. Production and yields are on a rough or unmilledbasis.
4See Bierlen et al. (1996b) for an extended discussion of this topic.

ARKANSAS EXPERIMENT STATION BULLETIN 954
4
In order for the United States and other exporters to successfully compete in theBrazilian rice import market, and in non-MERCOSUR markets contested by Argen-tina and Uruguay, they need a thorough understanding of the MERCOSUR riceeconomy. Changes in the MERCOSUR rice economy are particularly relevant to U.S.rice firms that export substantial quantities to Latin American markets, markets inwhich Argentina and Uruguay are expected to increase their market shares. Currentinformation on the MERCOSUR rice economy is limited and typically not written inEnglish. This bulletin combines secondary data with information gathered from avail-able Spanish and Portuguese language publications and personal interviews by theauthors in the region in May and June 1995 to create a unique, comprehensiveinformation source.
The purpose of the bulletin is to describe and analyze the current production,marketing and policy structure of the MERCOSUR rice economy. Emphasis is placedon the dynamics created by regional integration and unilateral national economicreforms. The study begins with a brief background of national economic reforms andregional integration. The following sections discuss MERCOSUR rice production,marketing, trade, policy and research.
REGIONAL INTEGRATION AND NATIONAL ECONOMIC REFORMS
Regional Integration
The MERCOSUR is the largest trade block in the western hemisphere afterNAFTA. Its development is viewed as a key step in the economic integration of thewestern hemisphere, which is expected to be fully implemented early next century.The MERCOSUR was created by the Treaty of Asunción in March 1991 with theobjective of establishing a customs union by January 1, 1995. Internal tariffs werereduced to zero in a series of seven steps from December 31, 1991, to December31, 1994. Common external tariffs were put into place on January 1, 1995. Cur-rently, the average common external tariff is about 20% with zero tariffs on mostimports from MERCOSUR members. Zero tariffs will be phased in on about 1600protected items, which account for 15% of intra-MERCOSUR trade.
Regional integration has three rationales: 1) development of a national strategy toimprove economies of scale and to make national industries more competitive in theinternational market place, 2) increased regional security and consolidated democracyand 3) increased bargaining power of individual nations in broader trade liberalizationnegotiations (Manzetti, 1993; Taylor et al., 1995). More immediate rationales forjoining the MERCOSUR include: 1) Brazil’s expected ability to increase exports ofcapital and consumer goods, 2) the expected ability of the other four nations toimmediately increase exports of agricultural products to Brazil and 3) the hope of thenon-Brazilian nations to strengthen their industrial sectors in order to compete with

THE MERCOSUR RICE ECONOMY
5
Brazilian goods in the future. Uruguay, in a key geographical position with goodnatural harbors on the Rio de la Plata, hopes to develop itself as the regionaltransportation and service center. Since Paraguay is the poorest MERCOSUR nation,leaders feel that membership can only improve current economic conditions. Chile,with the only Pacific Ocean ports in the region, is a key link in the MERCOSURtransportation system. The success of MERCOSUR hinges on real economic growthin Brazil. Also, because neither Argentina not Brazil has a strong currency, consider-able exporting will have to be done outside of the region in order to obtain hardcurrency.
The MERCOSUR (not including Chile) has a land area of 4.5 million square miles(about 123% of that of the United States) and a population of 203 million (about 77%of that of the United States) (Table 2). Argentina accounts for 23% of the area and17% of the population while Brazil accounts for 72% of the area and 80% of thepopulation. The other two nations account for 5% of the area and 3% of thepopulation. Over three-quarters of MERCOSUR citizens are urban dwellers, and
Table 2. Summary of MERCOSUR population and economic statistics.Characteristic Argentina Brazil Paraguay Uruguay MERCOSURa ChileLand Areab 1056.6 3265.1 153.4 67.5 4542.7 289.1Populationc 34.7 160.5 5.0 3.2 203.4 14.5Densityd 33 49 32 47 42 50Population Growthe 1.2 1.7 2.8 0.8 1.6g 1.6Urban Populatione 87 76 50 90 78g 85Life expectancyf 72 66 69 73 68g 72
GDPh 279.5 540.9 8.8 11.0 840.3 65.6GDP/Capitai 8054 3370 1753 3450 4131 4525Exportsj 21.0 46.5 0.8 1.9 70.2 16.0Imports,cifj 20.1 53.8 2.4 2.6 78.9 15.9Exchange Ratek 1.000 1.013 2082.8 7.940 - 410.7Annual Inflationl -2.0 162 10.2 26.3 10.1m 8.0aIncludes Argentina, Brazil, Paraguay and Uruguay.bThousands of square milescMillions (1996)dPersons per square mile (1996)ePercentage (1996)fYears at birth (1996)gCalculated by using the population of each country to total MERCOSUR population as weights (1996)hGDP = Gross Domestic Product (a measure of national output) = Billions of U.S.$ (1995)iU.S.$ (1995)jBillions of U.S.$ (1995)kLocal currency per U.S.$ (August 1996)lPercentage (second quarter 1996)mCalculated by using the GNP of each country to total MERCOSUR GNP as weights (1995)
Source: Population Reference Bureau and International Monetary Fund.

ARKANSAS EXPERIMENT STATION BULLETIN 954
6
population growth rate in the region averages 1.9% annually. Gross Domestic Product(GDP) in the region was $840.3 billion in 1995, about 12% of that of the UnitedStates. Brazil accounts for 64% and Argentina 33% of the region’s GDP, whileParaguay and Uruguay each account for around 1%. In 1995, per capita income washighest in Argentina ($8,054), followed by Uruguay ($3,450), Brazil ($3,370) andParaguay ($1,753). In 1995, exports were valued at $70.2 billion and imports at$78.9 billion. Only Argentina ran a small trade surplus, while Brazil, Paraguay andUruguay ran deficits. Over the past five years, intra-MERCOSUR trade has tripled andin 1995 was $25 billion (imports and exports). Second-quarter 1996 inflation ran atan annual rate of 10.1% in the region. Inflation ranged from -2% in Argentina to26.3% in Uruguay.
National Economic Reforms
Unilateral national economic reforms, most prominently by Argentina and Brazil,have paralleled regional integration. Due to a policy of economic reforms, begun bythe Menem administration in 1991, the business environment in Argentina is optimis-tic for the first time in more than a generation. Specific reform measures include fiscalresponsibility, tariff reduction, privatization and deregulation. The Law of Convertibil-ity has closely tied the peso to the dollar, thus limiting the growth in the moneysupply and making budget deficits virtually impossible. Currently, inflation is down toa single digit, and privatization is largely complete at the federal level and has begunat the provincial level. Although having run a trade deficit in recent years, Argentinahad a merchandise trade surplus of $844 million in 1995 fueled by strong agriculturalexport sales.
Although lagging Argentina’s reforms, Brazil’s economic reforms have recentlyovershadowed those of Argentina due to its large economy (the largest in LatinAmerica and the tenth largest in the world). Brazil’s reforms date from July 1, 1994,when the then-finance-minister and current president, Fernando Henrique Cardoso,implemented the Real Plan. Important features of the Real Plan were a sharpreduction in government expenditures and the introduction of a new currency, thereal, which was closely tied to the dollar. A new currency was necessary due to thetriple-digit inflation of the early 1990s. An immediate effect of the Real Plan was asharp reduction in inflation, which was running at 40% a month in the first twoquarters of 1994 and dropped to 0.91% a month in the fourth quarter of 1995.Other effects of the Real Plan were increased income or economic growth to 5%, amore than doubling of foreign investment from $1.5 billion in 1994 to $3.5 billion in1995 and real wage increases. Strong economic growth and an overvalued real,however, resulted in a trade deficit of $7.3 billion in 1995. In order to cool down anoverheated economy, the central bank increased reserve requirements early in 1995.In spite of fears that Brazil was headed for a recession similar to that of Mexico andArgentina in 1995, optimism is strong that rapid growth will continue into the nextcentury and that Brazil will fulfill its role as the MERCOSUR’s engine of growth.

THE MERCOSUR RICE ECONOMY
7
Uruguay has generally avoided the economic crises and the resulting austereeconomic plans of Argentina and Brazil. Over the past decade, it has graduallyprivatized and reduced inflation, tariffs and budget deficit levels. Inflation has steadilydeclined from 112% in 1990 to a 23.5% annual rate in the first half of 1996.Although there has been some success in reducing the budget deficit, trade balanceshave been negative since 1990. In 1993 the trade deficit was $680 million and grewto $873 million in 1994. This fell slightly to $750 million in 1995. In 1994 about 8%and in 1995 about 10.5% of the government budget was debt-financed. Budgetdeficits are related to a liberal social security system that accounts for 37% of govern-ment expenditures. In 1995, however, the Uruguayan Congress passed legislation toreduce social security transfer payments to future beneficiaries. Although recent ad-ministrations have tried to reduce the government’s role in the economy, a December1992 referendum rejected large-scale privatization. In spite of the outcome of thereferendum, economic liberalization continues to be a long-term government goal.
RICE PRODUCTION SECTOR
Brazil is the ninth largest rice producer in the world and the second largestimporter after Japan. Argentina is the 25th largest producer and the ninth largestexporter. Uruguay is the 26th largest producer and the eighth largest exporter. TheMERCOSUR produces substantial quantities of both irrigated and upland rice.5 Irri-gated production is located in a contiguous area between 30 and 35 degrees south,which includes the southernmost states of Rio Grande do Sul and Santa Catarina inBrazil, an area north and northwest of Buenos Aires in Argentina, primarily in theprovinces of Entre Rios and Corrientes, and the eastern and northern departments(akin to states) of Uruguay (see Fig. 1). Upland rice (non-irrigated) is grown in moststates of Brazil except for Rio Grande do Sul, the northeast and parts of the Amazonbasin. There is no upland rice production in either Argentina or Uruguay. Brazilianupland production is located in two major regions: the deficient rainfall region (Cerrado)and the adequate rainfall region (Amazon basin). The Cerrado is an extensive areathat runs north to south between the Amazon Basin and the Atlantic coastal plain andincludes all or parts of the states of Bahia, Tocantis, Piaui, Maranhão, Minas Gerais,Saõ Paulo, Goias, Mato Grosso and Mato Grosso do Sul. The Amazon basin islocated west of the Cerrado and includes all or parts of the states of Mato Grosso,Rondonia, Maranhão, Para, Amapa, Rondonia, Amazonas and Acre.
5Paraguay and Chile are not included in the discussion. Paraguay and Chile are small producers relative to theother three nations (100,000 MT), and their international trade in rice is relatively unimportant.

ARKANSAS EXPERIMENT STATION BULLETIN 954
8
Fig. 1. 1994/95 MERCOSUR rice production by country and state (in metric tons).(Source: Sparks American del Sur, Comision Sectorial del Arroz, IBGE, 1995)
Irrigated Production Sector
Irrigated rice production uses modern inputs and cultural methods. Averageyields are in excess of 5 MT/ha. Farm size varies, but the majority of rice is producedon farms with more than 200 ha of rice. Large operations tend to be verticallyintegrated with milling. There are over 12,000 irrigated rice producers in Brazil, over800 in Argentina and 730 in Uruguay. Land is well suited to rice production becauseit is flat and relatively impermeable and has a good supply of surface water. Livestock

THE MERCOSUR RICE ECONOMY
9
grazing is generally the only competing enterprise. Rice is typically produced for twoyears followed by four years of livestock grazing. Recently, however, producers haveattempted to intensify the production of rice within this rotation. Santa Catarina andnorthern Rio Grande do Sul are the only areas where two crops of rice can beproduced per crop year.
The first step in preparing for planting is construction of an internal drainagesystem in the late fall and winter months (May through September).6 This is followedby discing and leveling. Plowing is performed as needed in order to break up thehardpan created by continual flooding. Seedbeds are prepared just prior to planting,which is performed on the ground by broadcasting or by planting in rows in October,November and early December. Currently, pre-germinated seed is the newest techno-logical innovation being adopted. Shortly after planting, in preparation for flooding,the internal levee system is constructed. Herbicide is applied (generally just once) 20to 25 days after seeding and urea 40 days after seeding (during tillering) by air. Thefield is flushed once or twice after the urea application in order to aid the young plantin recovering from the herbicide application and to break the soil crust. The field isflooded to a depth of 10 to 15 cm 45 days after emergence; about 10 million liters ofwater/ha are needed. Urea is applied a second time to fields with low fertility levels60 to 70 days after seeding. Fields are drained about 20 to 30 days before harvest.Harvest begins in the northern interior zones of Brazil and Argentina in late Januaryor early February and finishes in eastern Uruguay and southern Argentina in May.
Typically, there are 100 days of the year with measurable precipitation, withthose days concentrated in the fall and spring. Excessive rain in the spring can delayplanting and cause flowering to occur in periods of cooler temperatures, resulting inlower yields and higher incidences of blanking. Cool flowering days are particularly aproblem in eastern Uruguay, southern Entre Rios and southeastern Rio Grande doSul. In order to speed up planting and avoid cooler temperatures, no-till planting hasbeen increasingly adopted. Another advantage of the no-till method is that levees donot have to be rebuilt each year.
Seed variety selection is another method of reducing problems related to coolflowering temperatures. Blue Belle and similar varieties, which previously accountedfor the bulk of production and are still important in Argentina and Uruguay, performwell in cool flowering temperatures. As a result, Blue Belle production dominates insouthern Entre Rios and eastern Uruguay. Currently, Blue Belle comprises 42% ofacres planted in Uruguay and 30% in Argentina. Blue Belle production is unimportantin Brazil. Although Blue Belle is better tasting and has higher milling yields, producers
6The reader should keep in mind that the four seasons in the southern hemisphere are just the opposite of thosein the northern hemisphere.

ARKANSAS EXPERIMENT STATION BULLETIN 954
10
prefer domestically bred tropical varieties because they are higher yielding and BlueBelle price premiums typically do not compensate for their lower yields. Becausetropical indica varieties grow numerous tillers, yields tend to be high, even when plantpopulations are relatively sparse. Because of the tradeoff between production yieldson the one hand and quality and milling yield on the other, current varietal improve-ment research in Argentina and Uruguay is focused on increasing the yields ofvarieties similar to Blue Belle.
Except for small quantities of medium- and short-grain rice produced for theBrazilian-Asian community, long-grain rice dominates irrigated production. About one-fifth of Argentinean production is double-long-grain rice (double Carolina or Risotto),which is referred to locally as Fortuna or Yeruá, and is preferred by high-incomedomestic consumers. Previous to their integration into the European Union (EU),Argentina exported double-long-grain rice to Spain, Portugal and Italy. In 1994/95,about 2% of Uruguayan area was planted to a double-long-grain known as EEA-404,which is largely marketed in Sao Paulõ. Double-long-grain plants are taller than finelong-grain plants, are more blast susceptible, have yields 1 to 2 MT/ha lower thanfine long-grain and need 30 additional growing days.
The irrigated zone has abundant supplies of surface water. Major sources ofsurface water include the Paraná and Uruguay rivers in Argentina; the Uruguay, RioNegro and Cuareim rivers and Laguna Marin in Uruguay; and the Uruguay river andLaguna de Los Patos in Brazil. Except for deep-well pumping in the southern two-thirds of Entre Rios, irrigation water is predominantly taken from surface sources andis sustainable in the long run. Uruguay is the only nation with large irrigation systems,usually owned by one or more mills, that provide water to multiple production units.Uruguayan mills control about 60% of the surface water rights in rice productionareas. In order to purchase water from these mill-controlled irrigation systems, pro-ducers must agree to market their rice to them. Although somewhat inefficient due tooverlapping systems in some areas, milled-controlled irrigation is the dominant systemin the eastern region of the country. There are several examples in which Uruguayanmills jointly own and operate irrigation systems under a separate corporate entity. InBrazil, Argentina and northern Uruguay, irrigation systems are decentralized and farmspecific.
In Entre Rios, a typical deep well irrigates 60 ha and the pumping rate is 60 to80 liters/second. The diesel fuel (550 liters/ha) consumed by pump engines is asignificant production cost. Due to increased pumping, the water table is estimated tohave dropped 9 m in recent years. In the long run, surface water, the availability ofwhich is ample, will likely replace subsurface water in southern Entre Rios. In RioGrande do Sul, about 32% of the land is irrigated with the use of diesel-poweredpumps, 25% with electric-powered pumps and 43% by gravity flow. About 60% of

THE MERCOSUR RICE ECONOMY
11
Uruguayan irrigation water is taken from rivers and lakes and 40% from reservoirs.About 45% of the water is extracted by gravity, and 55% is extracted with the aid ofpumps.
Currently, rice production in Corrientes and northern Entre Rios, where rice areais expanding, is located where surface water can be readily accessed, i.e., near theUruguay and Paraná rivers. Large farms tend to be concentrated along the Paranáand Uruguay rivers, from which they obtain their irrigation water, while smaller farmsuse lagoons and streams as their source of irrigation water. Additional investment inirrigation infrastructure is needed before planted area can be significantly increased inthese areas.
Land leasing and/or purchasing water is pervasive. Payment is typically in theform of rough rice. In Rio Grande do Sul 65% of operators lease land. In 1993, landrent averaged about 16.5 bags (50 kg each) of rough rice (15.3% of production)/ha.Per-hectare water costs were similar to those for land. When both land and waterwere provided, costs were 26.5 bags (25.5% of production)/ha. In Corrientes, about80% of producers lease land, paying from 12 to 16% of their production. Leases inCorrientes tend to be three-year verbal agreements. About 70% of producers leaseland in Entre Rios where typical rent is 16 bags/ha. In Uruguay, where 70% ofoperators lease, land rent is 8 to 10 bags/ha. The water necessary to irrigate 1 hasells for 12 to 20 bags, with prices varying according to field accessibility.
Farm size varies. In Rio Grande do Sul, 80% of farms operate less than 100 ha,and only 3% operate in excess of 400 ha, with the average farm operating 145 ha.However, the 20% of farms operating more than 100 ha account for 70% of produc-tion, and the 3% of farms operating in excess of 400 ha account for 27% ofproduction. Rio Grande do Sul tenants tend to have larger operations than owner-operators. Tenant operations account for only 44% of farms with less than 100 habut 64% of those with more than 100 ha. Leasing in the state is becoming increas-ingly dominant.
In Entre Rios 58% of production is from farms operating less than 100 ha, 34%from farms operating between 100 and 200 ha and 8% from farms operating morethan 200 ha. Farm size tends to be larger in northern Entre Rios and Corrientes. InCorrientes, approximately 40% of farms operate less than 200 ha, 32% between 200and 400 ha and 28% over 400 ha. Farm size and tenancy are related; 50% of tenantsoperate less than 200 ha and 85% less than 400 ha, while 80% of owner-operatorsoperate more than 400 ha. The average farm size in Uruguay is 166 ha with sizevarying by department. Farms in the eastern departments of Treinta y Tres and CerroLargo have average farm sizes of 316 ha, while those in the other departmentsaverage between 91 and 144 ha.
ARKANSAS EXPERIMENT STATION BULLETIN 954
12
Brazilian Upland Production
Upland rice is totally rainfall dependent and is produced by farmers who typicallyoperate fewer hectares, use more traditional inputs and cultivation methods and aremore diversified than their irrigated counterparts. Important crops that compete withupland rice include wheat, soybeans, corn and sorghum.
Prior to the mid-1980s, upland rice grew in importance due to its use as a goodinitial crop on the agricultural frontier and government incentives to increase plantedarea. Because yields decline in the frontier areas after one to three years of produc-tion, rice is typically followed by the production of livestock or other crops. Thedevelopment of a soybean variety that has been successful as an initial crop andrecent government programs that have emphasized efficiency and markets over plantedarea have reduced the importance of rice in the agricultural frontier regions.
Upland rice varieties are generally taller than irrigated varieties and, therefore,are more susceptible to lodging. If there is insufficient moisture at emergence, theplant will weaken and lodge. Upland rice is also highly susceptible to blast due to highhumidity levels. In the Amazon basin the probability of adequate rainfall is greaterthan 70% while in the Cerrado it is less than 70%. The probability of receivingadequate rainfall generally increases from east to west. Because of these problems,average yields, at just above 1.5 MT/ha, are less than one-third of irrigated yields andare highly variable from year to year. Production could be doubled or tripled withadequate and timely rainfall and the proper use of fertilizer, pesticides, plant spacingand improved seeds. With pivot irrigation, upland rice has had yields as high as 5MT/ha.
The Cerrado production area is flat to smoothly undulating, ideal for mechanizedagriculture. Soils range from sand to heavy clay with medium to heavy clay soilspredominating. Soils are normally well-drained with naturally low fertility. The climateis tropical, with a temperature range between 0 and 40o C and an average tempera-ture of 22o C. Rainfall averages 1200 mm annually with a dry season between Apriland September. Summer droughts, which are frequent, are intensified due to the lowabsorption qualities of soils. As in the Amazon basin, rice plays the role of a goodinitial crop in the agricultural frontier zones. The Cerrado has a number of advantagesover the Amazon Basin: 1) a number of population centers in Brasilia, Goiania andCampo Grande, 2) closer proximity to major consumption points in the Southeastand 3) a better transportation system.
In the Cerrado, rice is typically produced for three years before rotating to othercrops or grazing cattle. In Mato Grosso rice has begun to be rotated with corn andsoybeans, and in Goias rice is intercropped with pasture. Rainfall variability, particu-larly its distribution in critical growth periods, is the principal production risk. Inad-equate moisture, however, can be minimized with the application of technologies thatseek to increase the availability of water, e.g., reducing unnecessary compaction and
THE MERCOSUR RICE ECONOMY
13
avoiding the overlapping of critical growth periods and low rainfall. Generally, mecha-nization levels are high, but producers have poor managerial skills and technicalknowledge. Drying is typically performed in the field on small farms and mechanicallyon large farms. The use of fertilizer, weed control and phytosanitary measures aregenerally deficient. Access to credit, however, is generally adequate. The highesttechnological levels are found in Mato Grosso and Maranhão. Farms that operatemore than 100 ha are common, and farms that operate more than 1000 ha predomi-nate in Mato Grosso and Mato Grosso do Sul. Leasing is pervasive throughout theregion.
The Amazon basin production region has a tropical climate with a one- to three-month dry period. The land ranges from flat to gently rolling hills with diversified soiltypes. Current yields are low, but when input levels are increased, yields do respond.There are three production systems in the Amazon basin: intercropping, mechanizedand manual. Under the first system, which is largely practiced on 600,000 ha in thenorthern state of Maranhão, rice is intercropped with corn and manioc on smallsubsistence plots of around 2 ha. Rice is produced for a couple of years and thenabandoned for five to six years before being replanted. Rice is manually harvested andfield dried.
The mechanized upland production system is located in the states of Rondonia,Maranhão and northern Mato Grosso where farmers typically operate more than 20ha, have access to production loans and have good management skills and mechani-zation levels. Plowing is the initial step in land preparation, and soil conservationmethods are generally ignored. Planting is performed at the beginning of the rainyseason. The use of purchased seed is low, but the use of recommended seed is high.Fertilization is performed at less than optimal levels, weeds are controlled by herbi-cides, and the treatment of seeds with insecticide is common. Harvesting and dryingare mechanically performed.
A shifting rice production system is practiced in the states of Rondonia, Acre andMato Grosso (along the border with Peru and Bolivia). Although farms typicallyoperate less than 4 ha, they are market oriented. Planting, hoeing and harvesting aremanually performed. There is no use of fertilizer or phytosanitary measures. Harvest-ing includes cutting, shocking, thrashing, cooling and bagging.
Area Trends
It is estimated that 4.2 million ha of rice will be planted in the 1996/97 cropyear in the MERCOSUR: 1.1 million irrigated and 3.1 million upland (MERCOARROZ,October 17 and November 4, 1996).7 In 1993/94, Brazilian irrigated area peaked at1.1 million ha, up from less than 400,000 ha in 1960/61 (see Fig. 2). Brazilian
7For area, yield and production by state and department, see Table 3. This is the most recent year for whichthe data is available.

ARKANSAS EXPERIMENT STATION BULLETIN 954
14
Table 3. MERCOSUR rice area, yield and production, 1994/95.Harvested area Yield Production
Country/State (000’s ha) (kg/ha) (000’s MT)Brazil 4300(-520)a 2235(416) 9612(847)North Region 519(229) 1598(226) 829(432)Rondonia 12(2) 2020(406) 24(8)Amazonas 4(1) 1160(160) 5(2)Amapa 1(0) 900(-213) 1(0)Para 114(16) 1250(-71) 143(13)Acre 26(3) 1500(301) 39(12)Rondonia 112(-43) 1680(257) 188(-32)Tocantis 250(N.A.)b 1720(N.A.) 430(N.A.)Northeast Region 1275(311) 1439(307) 1835(729)Maranhão 825(183) 1330(388) 1097(492)Piaui 232(24) 1520(275) 353(94)Ceara 61(36) 2250(-65) 137(51)Rio Grande del Norte 8(0) 1410(275) 11(2)Paraiba 14(5) 1630(41) 23(8)Pernambuco 10(4) 3680(225) 37(17)Alagoas 10(4) 3320(492) 33(15)Sergipe 10(0) 3380(630) 34(6)Bahia 105(55) 1050(270) 110(44)Southeast Region 636(-301) 1853(-241) 1179(-332)Minas Gerais 395(-169) 1700(250) 672(-146)Espiritu Santo 35(0) 3080(377) 108(13)Rio de Janeiro 11(-21) 3500(301) 39(-64)Saõ Paulo 195(-111) 1850(232) 361(-134)West Central Region 840(-707) 1526(288) 1282(-632)Mato Grosso 340(-97) 1450(290) 493(-14)Mato Grosso do Sul 120(-122) 1800(498) 216(-99)Goias 375(-486) 1510(251) (-518)Federal District 5(-2) 1330(118) 7(-1)Southern Region 1030(-39) 4356(767) 4486(649)Paraná 155(-45) 1725(285) 267(-21)Santa Catarina 130(-14) 3800(786) 494(60)Rio Grande do Sul 745(20) 5200(703) 3874(610)Argentina 181(72) 5113(1573) 942(493)Corrientes 61(7) 4900(1719) 297(130)Entre Rios 99(58) 5473(911) 541(356)Formosa 9(6) 5200(2277) 46(38)Santa Fe 10(1) 4354(1254) 42(14)Uruguay 146(61) 5500(434) 804(374)Artigas 12 5809 67Cerro Largo 24 5460 130Lavalleja 4 5247 21Rivera 6 5219 29Rocha 20 4675 93Tacuarembo 6 6372 36Treinta y Tres 38 5869 222aNumber in parentheses is the change in production from 1984/85bN.A. Data for the state of Tocantis was not available until 1987/88 production year
Source: Sparks America del Sur (May 1995), MERCOARROZ (August 28,1995) and Comision Sectorial deArroz, 1995.

THE MERCOSUR RICE ECONOMY
15
irrigated area has steadily fallen from the 1.1 million ha peak to an estimated 760,000ha in 1996/97. Changes in Brazilian irrigated area have been fueled by changes inproduction cost, population growth, consumer tastes, credit availability and pricesupport levels. Rio Grande do Sul has about 53,000 km2 of potential rice area, onlyabout 15% or 750,000 ha of which is currently planted in rice. The limiting factor toincreasing rice area is water and credit availability, low market prices (high costsrelative to Argentina and Uruguay), disease problems and diseconomies of scale.Another limiting factor, and one that is common to Argentina and Uruguay as well, isa rotation practice in which rice is produced in only one out of three years. Currently,this is felt to be necessary due to the disease and pests associated with continuous riceproduction.
Argentinean planted area has gone from less than 50,000 ha in 1960/61 to anestimated 224,000 ha in 1996/97. Historically, area expansion has been dependenton a slowly growing domestic population. Recently, however, Argentinean area hasgrown significantly due to preferential access to the large Brazilian import market andthe discontinuance of export taxes. Factors limiting Argentinean production are flood-ing problems in Corrientes and inadequate irrigation infrastructure. A major impedi-ment to investment in irrigation is an inadequate supply of credit. If these problemsare corrected, Argentina could plant more than 500,000 ha. Uruguayan area hasgrown from less than 50,000 ha in 1960/61 to an estimated 155,000 in 1996/97.
Fig. 2. MERCOSUR planted rice area (000’s ha, 1960/61-1996/97). Source: See Fig. 3.

ARKANSAS EXPERIMENT STATION BULLETIN 954
16
Like Argentina, the past two years have seen a record number of hectares planted.The limiting factor to increasing area is inadequate supplies of irrigation water. Withsufficient irrigation water, Uruguay could increase production another 50,000 to200,000 ha. Additional water could be taken from the Laguna Marin if the necessaryinfrastructure were available.
Brazilian upland area began at just under 3 million ha in 1960/61. It peaked atjust over 6 million ha in the mid-1980s and in 1996/97 is expected to fall to 3.1million ha. Most of the decline in area has occurred in the West Central states(Cerrado) of Goias, Mato Grosso and Mato Grosso do Sul due to 1) lower govern-ment (the main buyer in the area) support levels, 2) a shift in policy, which hasemphasized higher-yielding (over area-intensive) production systems, 3) declining ac-ceptance of upland rice (low quality) in urban areas, 4) a disappearing agriculturalfrontier and 5) increasing competition from corn, wheat and soybeans. While uplandrice production has declined, corn production has grown 75% and soybean produc-tion 88% over the past ten years.
Trends in Yield
Irrigated and upland yields have had distinct histories. Not surprisingly, irrigatedyields in the three countries have followed one another closely over the past 35 years(see Fig. 3). With technology adoption, irrigated yields have steadily increased fromabout 3 MT/ha in 1960/61 to over 5 MT/ha in 1995/96. The latter is just belowcurrent U.S. long-grain yields of about 6 MT/ha. While Brazil had an annual com-pound yield growth rate over the period of 1.90%, rates for Argentina and Uruguaywere lower at 1.04% and 1.15%, respectively. Some production units in Argentinaclaimed yields of up to 8 MT/ha in 1994/95 and of up to 10 MT/ha in Uruguay in1995/96. Upland yields, with an annual compound yield growth rate of only 0.33%,have increased only marginally since 1960/61 (being just about 1.7 MT /ha in 1995/96) due to 1) lack of appropriate technology, 2) inadequate financing, 3) a weakproducer co-operative movement, 4) diseconomies of scale and 5) inability to solvelodging problems.
The 1995/96 production year began with low levels of available irrigation waterin Entre Rios and southern Corrientes. However, favorable rainfall in the last weeks ofOctober, rising prices and producer knowledge of low planting levels in Rio Grandedo Sul boosted planting levels. By December the water situation became grave again,and many producers were unable to flood their previously planted fields. By the endof December, there was a 300-mm precipitation deficit, and dams held only 50 to70% of their normal levels. December and January rains helped to save the situationto some extent. Due to the drought, 26,870 ha, or about 13% of planted area, wasnot harvested (MERCOARROZ, May 30, 1996). While yields on harvested area were5.1 MT/ha, they were 4.6 MT/planted ha. Lack of precipitation in November andDecember in Rio Grande do Sul reduced potential production levels 18%. In RioGrande do Sul, precipitation levels were only 40% of normal in April to November

THE MERCOSUR RICE ECONOMY
17
and only 25% in December. January rainfalls helped to alleviate the situation, how-ever. Rio do Grande do Sul 1996 yields were expected to be down only 150 kg/haover 1995.
In Uruguay the drought affected only a few producers in Artigas who had lowinitial water levels in their dams. The January rains saved most producers with initiallow water levels. Generally, it was an excellent crop year in Uruguay with lots ofsunlight and few low-temperature days. Average yields were close to 6.0 MT, a 500-kg/ha increase over 1994/95.
Higher-than-normal precipitation levels have been forecast for October to De-cember 1996 in Rio Grande do Sul. While this will aid in filling reservoirs, it will alsodelay and possibly prevent planting in some areas (MERCOARROZ, October 17,1996). In Argentina, normal precipitation and above-normal temperatures have beenforecast during planting. In October needed rain fell in Corrientes, but another 100mm are needed in Entre Rios. Due to lack of rain and high temperatures in EntreRios, many producers began irrigating early. On October 25, 53% of Argentineanarea was planted, with 34% in Corrientes and 68% in Entre Rios. As of earlyNovember 1996, reservoir levels in Uruguay were adequate to irrigate the 155,000ha that are expected to be planted.
Fig. 3. MERCOSUR rough rice yields (kg/ha), 1960/61 - 1996/97.(Source: Comision Sectorial del Arroz, Bolsa de Cereales, SAPyA, IBGE, 1995)

ARKANSAS EXPERIMENT STATION BULLETIN 954
18
Production Trends
Irrigated and upland rice production trends are derived from the joint area andyield trends (see Fig. 4). Since 1960/61 irrigated rice production has increased by afactor of about four, currently being around 4 million MT in Brazil, 900,000 MT inUruguay and over 1 million MT in Argentina (assuming normal yields). This growthhas been relatively smooth. However, due to a decline in area, Brazilian irrigatedproduction has fallen in each of the past two crop years (94/95 and 95/96) and isexpected to fall again in 1996/97. Upland production levels have fallen sharply in the1990s to less than 6 million MT. Upland production peaked in the late 1970s atabout 7.8 million MT. The rate of growth in upland production is expected tocontinue to be negative due to declining area.
In 1995/96 both Argentina and Uruguay planted record high areas, expectingrecord production levels. Due to almost ideal growing conditions, Uruguay achievedthis goal with an increase of about 158,000 MT over the 1994/95 production recordof 808,000 MT. With a planted area of 208,000 ha, Argentina was expected tobreak the 1 million MT barrier. Lack of rainfall, particularly in Corrientes, reducedyields and caused some fields to be abandoned altogether. In spite of average yields of4.6 MT/ha, Argentinean production exceeded the 1994/95 record by 99,000 MT.Due to a combination of both lower planted area and inadequate rainfall, Rio Grandedo Sul irrigated production fell over 900 thousand MT to about 4.1 million MT in1995/96.
Fig. 4. MERCOSUR rough rice production(000’s MT, 1960/61 - 1996/97). Source: See Fig. 3
THE MERCOSUR RICE ECONOMY
19
Sparks America Del Sur expects Argentina to produce another record rice cropin 1997, which they estimate at 1.08 million MT (MERCOARROZ, November 4,1996). This is based on an additional 11,000 ha planted and more normal precipita-tion. Although planted area in Uruguay will hold steady or slightly increase, it isunlikely that the almost ideal growing conditions in 1995/96 will be repeated in1996/97. Thus production is expected to fall from 966,000 MT to 891,000 MT.Production in Brazil is expected to fall 8% over 1995/96 to 9.3 million MT due to asimilar decline in area.
Producer Prices and Costs
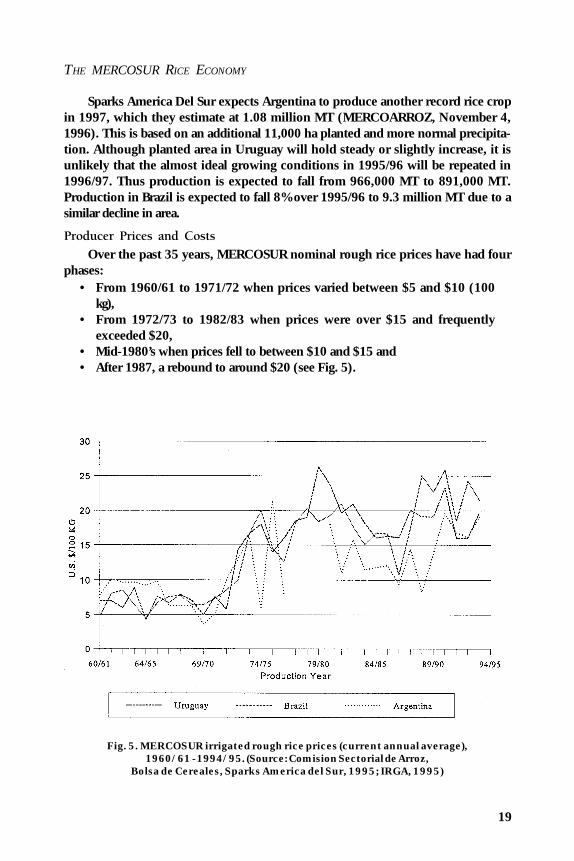
Over the past 35 years, MERCOSUR nominal rough rice prices have had fourphases:
• From 1960/61 to 1971/72 when prices varied between $5 and $10 (100kg),
• From 1972/73 to 1982/83 when prices were over $15 and frequentlyexceeded $20,
• Mid-1980’s when prices fell to between $10 and $15 and• After 1987, a rebound to around $20 (see Fig. 5).
Fig. 5. MERCOSUR irrigated rough rice prices (current annual average),1960/61 - 1994/95. (Source: Comision Sectorial de Arroz,
Bolsa de Cereales, Sparks America del Sur, 1995; IRGA, 1995)
ARKANSAS EXPERIMENT STATION BULLETIN 954
20
As of November 1996, prices for rough rice (10% or less brokens) was in the$21 to $23 range. In Argentina, Double Carolina rice commands a 20-30% premium,while in Brazil, upland rice receives a 30% discount. These premiums/discounts arelargely due to perceived quality differences among consumers. When rough rice pricesare converted into constant 1995 U.S. dollars, the scenario given by that of Fig. 5changes substantially. Real rice prices were the highest in the 1970s ($30 to $45/100 kg). Prices since 1981/82 have been their lowest in real terms since the late1960s, around $15 to $25.
The law of one price (LOP) was tested for MERCOSUR irrigated rough ricemarkets (Argentina and Rio Grande do Sul) and between the MERCOSUR and theUnited States using monthly 1981 to 1995 price data (Bierlen et al., 1996a). TheLOP is the notion that efficient trade and arbitrage activities will ensure that prices inspatially separated markets, adjusted for exchange rates and transportation costs, willbe equalized. In its extreme form, the LOP implies that there is a single representativeprice that is common to all markets. Using Johansen’s multivariate cointegrationmethod, weak support was found for the LOP for MERCOSUR rice markets for thefull sample 1981 to 1995 period, no support for the LOP for the 1981 to 1990 pre-MERCOSUR period and strong support in the 1991 to 1995 MERCOSUR periodboth within the MERCOSUR and between the MERCOSUR and the United States.Support for the LOP during the MERCOSUR trade regime is expected because of theflow of rough rice from Argentina and Uruguay to Rio Grande do Sul and the closeproximity of the three production areas, insuring that arbitrage can readily be per-formed. The results support the notion that lower trade barriers, greater reliance onmarket forces and a greater volume of trade led to the existence of a single referenceprice.
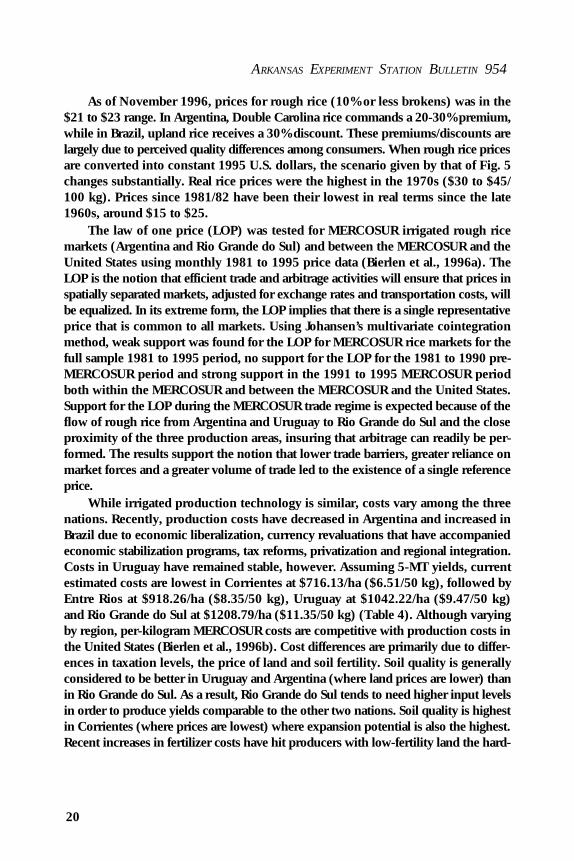
While irrigated production technology is similar, costs vary among the threenations. Recently, production costs have decreased in Argentina and increased inBrazil due to economic liberalization, currency revaluations that have accompaniedeconomic stabilization programs, tax reforms, privatization and regional integration.Costs in Uruguay have remained stable, however. Assuming 5-MT yields, currentestimated costs are lowest in Corrientes at $716.13/ha ($6.51/50 kg), followed byEntre Rios at $918.26/ha ($8.35/50 kg), Uruguay at $1042.22/ha ($9.47/50 kg)and Rio Grande do Sul at $1208.79/ha ($11.35/50 kg) (Table 4). Although varyingby region, per-kilogram MERCOSUR costs are competitive with production costs inthe United States (Bierlen et al., 1996b). Cost differences are primarily due to differ-ences in taxation levels, the price of land and soil fertility. Soil quality is generallyconsidered to be better in Uruguay and Argentina (where land prices are lower) thanin Rio Grande do Sul. As a result, Rio Grande do Sul tends to need higher input levelsin order to produce yields comparable to the other two nations. Soil quality is highestin Corrientes (where prices are lowest) where expansion potential is also the highest.Recent increases in fertilizer costs have hit producers with low-fertility land the hard-
THE MERCOSUR RICE ECONOMY
21
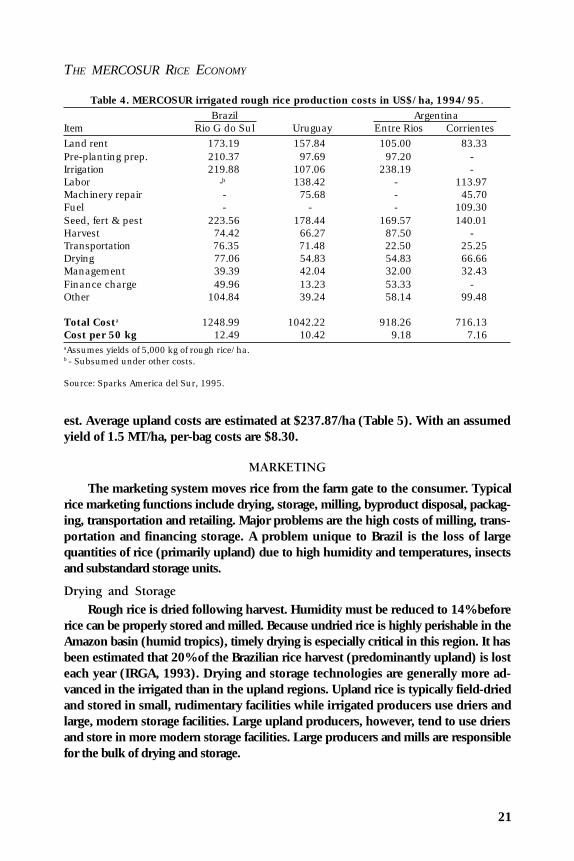
est. Average upland costs are estimated at $237.87/ha (Table 5). With an assumedyield of 1.5 MT/ha, per-bag costs are $8.30.
MARKETING
The marketing system moves rice from the farm gate to the consumer. Typicalrice marketing functions include drying, storage, milling, byproduct disposal, packag-ing, transportation and retailing. Major problems are the high costs of milling, trans-portation and financing storage. A problem unique to Brazil is the loss of largequantities of rice (primarily upland) due to high humidity and temperatures, insectsand substandard storage units.
Drying and Storage
Rough rice is dried following harvest. Humidity must be reduced to 14% beforerice can be properly stored and milled. Because undried rice is highly perishable in theAmazon basin (humid tropics), timely drying is especially critical in this region. It hasbeen estimated that 20% of the Brazilian rice harvest (predominantly upland) is losteach year (IRGA, 1993). Drying and storage technologies are generally more ad-vanced in the irrigated than in the upland regions. Upland rice is typically field-driedand stored in small, rudimentary facilities while irrigated producers use driers andlarge, modern storage facilities. Large upland producers, however, tend to use driersand store in more modern storage facilities. Large producers and mills are responsiblefor the bulk of drying and storage.
Table 4. MERCOSUR irrigated rough rice production costs in US$/ha, 1994/95.Brazil Argentina
Item Rio G do Sul Uruguay Entre Rios CorrientesLand rent 173.19 157.84 105.00 83.33Pre-planting prep. 210.37 97.69 97.20 -Irrigation 219.88 107.06 238.19 -Labor -b 138.42 - 113.97Machinery repair - 75.68 - 45.70Fuel - - - 109.30Seed, fert & pest 223.56 178.44 169.57 140.01Harvest 74.42 66.27 87.50 -Transportation 76.35 71.48 22.50 25.25Drying 77.06 54.83 54.83 66.66Management 39.39 42.04 32.00 32.43Finance charge 49.96 13.23 53.33 -Other 104.84 39.24 58.14 99.48
Total Costa 1248.99 1042.22 918.26 716.13Cost per 50 kg 12.49 10.42 9.18 7.16aAssumes yields of 5,000 kg of rough rice/ha.b - Subsumed under other costs.
Source: Sparks America del Sur, 1995.

ARKANSAS EXPERIMENT STATION BULLETIN 954
22
In Rio Grande do Sul there are about 1600 driers with a daily drying capacity of132,000 MT, and 2.1 million MT of conventional and 3.7 million MT of modern silostorage capacity (see Table 6). The bulk of storage is located on the western border(with Argentina) with 1.2 million MT of capacity and the north Atlantic coast with 2.3million MT of capacity. Storage is adequate to handle state production as well asArgentinean and Uruguayan imports. Large farms tend to perform their own dryingand storage while small farms hire the services of co-operatives.
There is excess storage capacity in Argentina due to the presence of numerousmills that operate at suboptimal levels. Total storage capacity consists of 750,000 MTof farm-level storage, 1.3 million MT of mill-level storage and 38,000 MT of port-levelstorage. Large producers are more likely to own storage and drying facilities thansmall producers. Most producers, however, are unable to store more than 100 MT.There is a higher percentage of on-farm drying and storage in Corrientes, where largeproducers dominate, than in Entre Rios. In Uruguay, mills dry and store 80 to 85% ofrough rice. The remainder of drying and storage is performed by large producers.
Table 5. Brazilian upland rough rice production costs in U.S.$/ha, 1994/95.Item Unit Quantity Price/Unit % of Cost Total CostInputs 54.69 149.77Seed kg 55.0 0.97 53.23Furadan lt 0.8 17.76 14.22Fertilizer(04-30-10) kg 200.0 0.23 45.16Zinc Sulfate kg 20.0 0.71 14.19Mirex kg 0.2 4.82 0.97Casumin lt 1.0 12.33 12.2350 kilo bags bag 30.0 0.32 9.67Machinery 38.28 104.84Pre-incorporation(18 discs) machinery hr 1.2 16.13 19.35Plowing (3 bottoms) machinery hr 2.7 16.13 43.55Leveling(36 discs) machinery hr 0.5 16.13 8.07Planting/Fertilizing(10 row) machinery hr 0.6 16.13 9.68Pulverizing machinery hr 0.5 16.13 8.07Harvester machinery hr 1.0 16.13 16.13Services 4.12 11.29Seed treatment dh 0.1 7.53 0.75Planting dh 0.3 7.53 2.26Formicide application dh 0.1 7.53 1.53Harvest dh 1.0 7.53 7.73
Administrative Charge(3%) 2.91 7.97
Total Cost 273.87Cost per 50 kga 9.13aAssumes a yield per hectare of 1,500 kg.
Source: Central Nacional de Pesquisa de Arroz e Feijao, 1995.

THE MERCOSUR RICE ECONOMY
23
In Argentina and Uruguay, on-farm drying and storage facilities give producersgreater marketing flexibility, in particular, the ability to sell rough rice directly to RioGrande do Sul mills. This practice is most common in the northern production areasof Uruguay and in Corrientes. This is facilitated by the high concentration of Brazilianproducers (who have operations in Argentina and Uruguay) in these areas and weakerties between mills and producers in northern Uruguay than in eastern Uruguay.
Milling and Byproducts
Milling firms range from small, single-mill, family-run firms to large, multi-millcorporations. Private mills dominate, but co-operatives are important in Argentinaand Rio Grande do Sul. Large mills typically operate at full capacity, have hightechnical levels and hire specialized labor. Small- and medium-sized mills operateabout 8 and 16 hours a day (often on a seasonal basis), respectively. Compared to thelarger mills, small- and medium-sized mills have less modern milling equipment andhire non-specialized labor. Equipment (including parboiling equipment) is predomi-nantly Brazilian, but some mills are outfitted with Japanese, German and U.S. equip-ment.
The Brazilian milling sector is characterized by excess capacity, a profusion ofretail labels, a disregard for economies of scale and, with the liberalization of theBrazilian rice market, declining profit margins. Idle capacity is worse in the uplandzones due to a significant contraction in production. Declining profit margins haveplaced pressure on mills to increase volume or capacity utilization, which has resultedin significant downsizing, a trend that began in the 1980’s and has accelerated in the1990’s.
There are approximately 745 mills operating in Rio Grande do Sul, the bulk ofwhich are located in the five principal production areas (Table 6). Currently, about180 mills process at least 250 MT/month (commercial size). Commercial mills oper-ate closer to full capacity, while non-commercial mills are closing or have no growth.Many non-commercial mills continue to operate by performing contract milling. About50% of Rio Grande do Sul rice is milled by private firms, 35% is milled by co-ops, and15% is used for seed or milled in other states. The three largest firms account for 30%
Table 6. Number, milling and storage capacity of rice mills in Rio Grande do Sul.Number of Milling Non-Modern Silo Storage
Region Mills Capacity Storage Capacity Capacity
MT/hour MT MTCampanha (Plains) 103 178 303,225 352,830Western border 153 426 463,870 772,384South coast 106 354 590,301 352,781North coast 194 275 345,216 1,911,137Central Depression 169 223 407,578 313,443Total 725 1456 2,110,190 3,702,575Source: IRGA, 1993.
ARKANSAS EXPERIMENT STATION BULLETIN 954
24
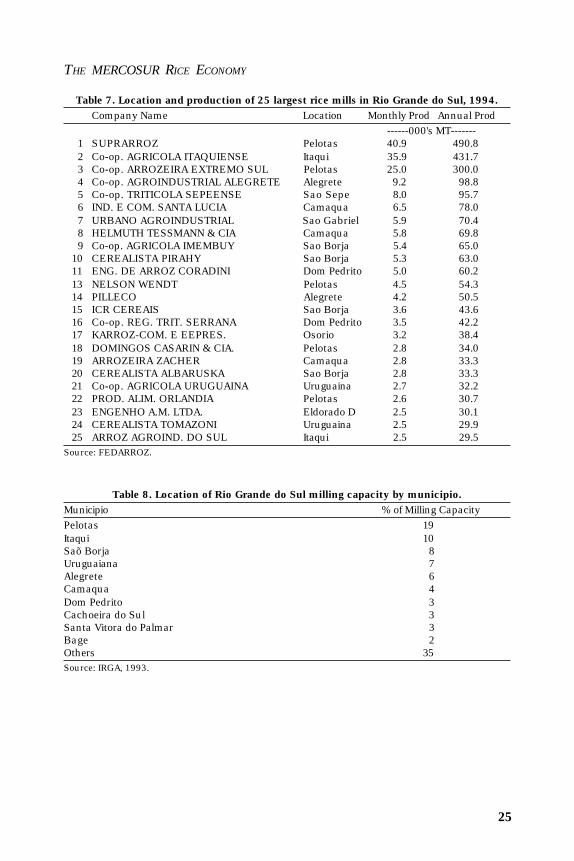
of total milling, the 11 largest 47%, the 50 largest 71%, and commercial mills 95%(see Table 7 for the 25 largest mills and Table 8 for percentage of total millingcapacity by municipio [county]). The five largest mills are vertically integrated inproduction, milling and marketing. Several large mills are located close to productionareas in Argentina and Uruguay, which gives them greater flexibility in rough riceprocurement. There is no reliable information on the number, size, technology, etc.,of Brazilian mills outside of Rio Grande do Sul. However, mills in upland regions tendto be smaller, less technically advanced and more numerous than in irrigated areas.
There are 41 rice co-ops in Rio Grande do Sul with 58 active mills, 30 of whichoperate on a commercial level. About 10,000 of the state’s 12,000 producers are co-operative members. Co-ops include four of the five and seven of the 25 largest millingfirms (see Table 7). The four largest co-ops each mill more than 5000 MT/month.The three largest co-ops mill 21% of the rice in the state, the five largest 24%, and the16 largest 30%. Shares of total co-op rice milled in the state for these co-ops are61%, 70% and 87%, respectively. Recent co-op growth has been slow or negativeamong large and small co-ops, while medium-sized co-ops have grown significantly.
Most Argentinean mills are small, family-owned, vertically integrated, into produc-tion and have relatively low technical levels. The largest technical problem is a lack ofphysical integration from storage to the loading dock, resulting in the excess use ofunskilled labor. Like drying and storage facilities, mills are often purchased by produc-ers during highly profitable years with the idea that “procesando duplicamos lacosecha” (by milling we double the harvest) but frequently without regard to cost andmarketing considerations. Brazilian-made mills can be purchased for as little as $80,000.Small mills operate only three or four months out of the year, milling as little as 1500MT annually. They pay higher prices for their rough rice and are unable to securerough rice by guaranteeing production loans. Few mills are well situated with respectto ports on the Paraná and Uruguay rivers and railheads. With continued downsizingthis is likely to change because more mills will have the necessary volume to utilize railand water transport.
The Argentinean milling industry is also downsizing with the exit of primarilysmaller mills. In 1995, 104 mills were operating, down from 150 in 1990. Factorsthat indicate that small mills will continue to exit the industry are 1) the demise ofsmall Brazilian mills that are the principal buyers of their milled rice, 2) the inability toproduce large minimum quantities needed to receive transportation discounts and toenter export markets and 3) the increasing need to be cost competitive. Only 12 millshave a milling capacity in excess of 4 MT/hour. About 16 firms do 70% of themilling. On the national level, 51% of milling capacity is located in Entre Rios, 33% inCorrientes and 16% in other provinces.
THE MERCOSUR RICE ECONOMY
25
Table 7. Location and production of 25 largest rice mills in Rio Grande do Sul, 1994.Company Name Location Monthly Prod Annual Prod
------000's MT-------1 SUPRARROZ Pelotas 40.9 490.82 Co-op. AGRICOLA ITAQUIENSE Itaqui 35.9 431.73 Co-op. ARROZEIRA EXTREMO SUL Pelotas 25.0 300.04 Co-op. AGROINDUSTRIAL ALEGRETE Alegrete 9.2 98.85 Co-op. TRITICOLA SEPEENSE Sao Sepe 8.0 95.76 IND. E COM. SANTA LUCIA Camaqua 6.5 78.07 URBANO AGROINDUSTRIAL Sao Gabriel 5.9 70.48 HELMUTH TESSMANN & CIA Camaqua 5.8 69.89 Co-op. AGRICOLA IMEMBUY Sao Borja 5.4 65.0
10 CEREALISTA PIRAHY Sao Borja 5.3 63.011 ENG. DE ARROZ CORADINI Dom Pedrito 5.0 60.213 NELSON WENDT Pelotas 4.5 54.314 PILLECO Alegrete 4.2 50.515 ICR CEREAIS Sao Borja 3.6 43.616 Co-op. REG. TRIT. SERRANA Dom Pedrito 3.5 42.217 KARROZ-COM. E EEPRES. Osorio 3.2 38.418 DOMINGOS CASARIN & CIA. Pelotas 2.8 34.019 ARROZEIRA ZACHER Camaqua 2.8 33.320 CEREALISTA ALBARUSKA Sao Borja 2.8 33.321 Co-op. AGRICOLA URUGUAINA Uruguaina 2.7 32.222 PROD. ALIM. ORLANDIA Pelotas 2.6 30.723 ENGENHO A.M. LTDA. Eldorado D 2.5 30.124 CEREALISTA TOMAZONI Uruguaina 2.5 29.925 ARROZ AGROIND. DO SUL Itaqui 2.5 29.5
Source: FEDARROZ.
Table 8. Location of Rio Grande do Sul milling capacity by municipio.Municipio % of Milling CapacityPelotas 19Itaqui 10Saõ Borja 8Uruguaiana 7Alegrete 6Camaqua 4Dom Pedrito 3Cachoeira do Sul 3Santa Vitora do Palmar 3Bage 2Others 35Source: IRGA, 1993.
ARKANSAS EXPERIMENT STATION BULLETIN 954
26
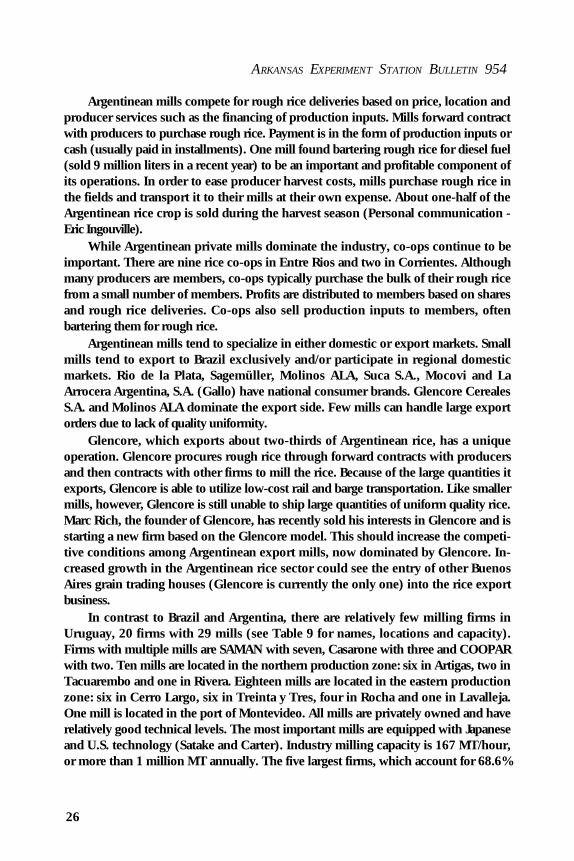
Argentinean mills compete for rough rice deliveries based on price, location andproducer services such as the financing of production inputs. Mills forward contractwith producers to purchase rough rice. Payment is in the form of production inputs orcash (usually paid in installments). One mill found bartering rough rice for diesel fuel(sold 9 million liters in a recent year) to be an important and profitable component ofits operations. In order to ease producer harvest costs, mills purchase rough rice inthe fields and transport it to their mills at their own expense. About one-half of theArgentinean rice crop is sold during the harvest season (Personal communication -Eric Ingouville).
While Argentinean private mills dominate the industry, co-ops continue to beimportant. There are nine rice co-ops in Entre Rios and two in Corrientes. Althoughmany producers are members, co-ops typically purchase the bulk of their rough ricefrom a small number of members. Profits are distributed to members based on sharesand rough rice deliveries. Co-ops also sell production inputs to members, oftenbartering them for rough rice.
Argentinean mills tend to specialize in either domestic or export markets. Smallmills tend to export to Brazil exclusively and/or participate in regional domesticmarkets. Rio de la Plata, Sagemüller, Molinos ALA, Suca S.A., Mocovi and LaArrocera Argentina, S.A. (Gallo) have national consumer brands. Glencore CerealesS.A. and Molinos ALA dominate the export side. Few mills can handle large exportorders due to lack of quality uniformity.
Glencore, which exports about two-thirds of Argentinean rice, has a uniqueoperation. Glencore procures rough rice through forward contracts with producersand then contracts with other firms to mill the rice. Because of the large quantities itexports, Glencore is able to utilize low-cost rail and barge transportation. Like smallermills, however, Glencore is still unable to ship large quantities of uniform quality rice.Marc Rich, the founder of Glencore, has recently sold his interests in Glencore and isstarting a new firm based on the Glencore model. This should increase the competi-tive conditions among Argentinean export mills, now dominated by Glencore. In-creased growth in the Argentinean rice sector could see the entry of other BuenosAires grain trading houses (Glencore is currently the only one) into the rice exportbusiness.
In contrast to Brazil and Argentina, there are relatively few milling firms inUruguay, 20 firms with 29 mills (see Table 9 for names, locations and capacity).Firms with multiple mills are SAMAN with seven, Casarone with three and COOPARwith two. Ten mills are located in the northern production zone: six in Artigas, two inTacuarembo and one in Rivera. Eighteen mills are located in the eastern productionzone: six in Cerro Largo, six in Treinta y Tres, four in Rocha and one in Lavalleja.One mill is located in the port of Montevideo. All mills are privately owned and haverelatively good technical levels. The most important mills are equipped with Japaneseand U.S. technology (Satake and Carter). Industry milling capacity is 167 MT/hour,or more than 1 million MT annually. The five largest firms, which account for 68.6%
THE MERCOSUR RICE ECONOMY
27
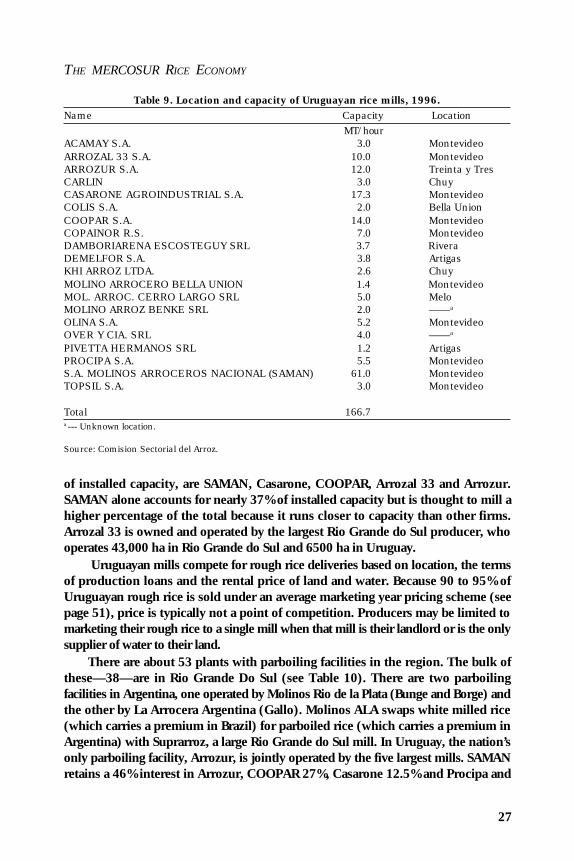
Table 9. Location and capacity of Uruguayan rice mills, 1996.Name Capacity Location
MT/hourACAMAY S.A. 3.0 MontevideoARROZAL 33 S.A. 10.0 MontevideoARROZUR S.A. 12.0 Treinta y TresCARLIN 3.0 ChuyCASARONE AGROINDUSTRIAL S.A. 17.3 MontevideoCOLIS S.A. 2.0 Bella UnionCOOPAR S.A. 14.0 MontevideoCOPAINOR R.S. 7.0 MontevideoDAMBORIARENA ESCOSTEGUY SRL 3.7 RiveraDEMELFOR S.A. 3.8 ArtigasKHI ARROZ LTDA. 2.6 ChuyMOLINO ARROCERO BELLA UNION 1.4 MontevideoMOL. ARROC. CERRO LARGO SRL 5.0 MeloMOLINO ARROZ BENKE SRL 2.0 ——a
OLINA S.A. 5.2 MontevideoOVER Y CIA. SRL 4.0 ——a
PIVETTA HERMANOS SRL 1.2 ArtigasPROCIPA S.A. 5.5 MontevideoS.A. MOLINOS ARROCEROS NACIONAL (SAMAN) 61.0 MontevideoTOPSIL S.A. 3.0 Montevideo
Total 166.7a --- Unknown location.
Source: Comision Sectorial del Arroz.
of installed capacity, are SAMAN, Casarone, COOPAR, Arrozal 33 and Arrozur.SAMAN alone accounts for nearly 37% of installed capacity but is thought to mill ahigher percentage of the total because it runs closer to capacity than other firms.Arrozal 33 is owned and operated by the largest Rio Grande do Sul producer, whooperates 43,000 ha in Rio Grande do Sul and 6500 ha in Uruguay.
Uruguayan mills compete for rough rice deliveries based on location, the termsof production loans and the rental price of land and water. Because 90 to 95% ofUruguayan rough rice is sold under an average marketing year pricing scheme (seepage 51), price is typically not a point of competition. Producers may be limited tomarketing their rough rice to a single mill when that mill is their landlord or is the onlysupplier of water to their land.
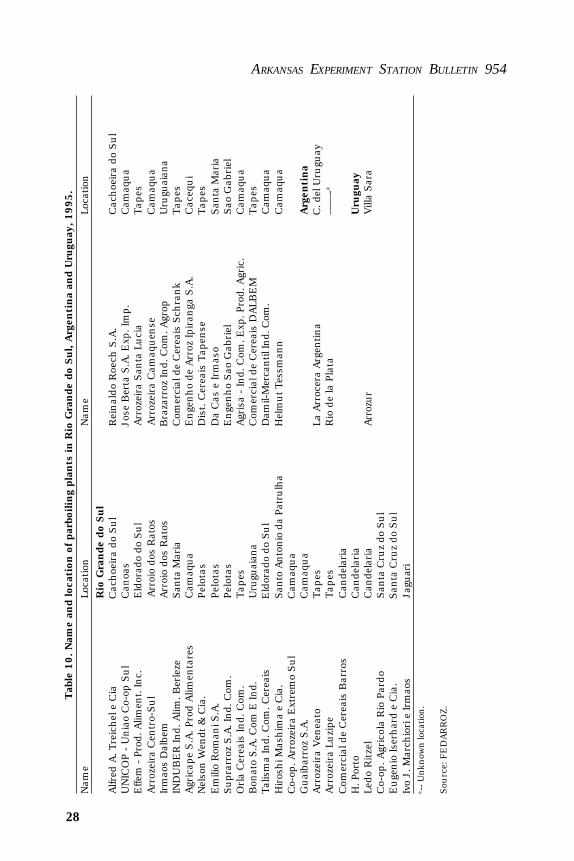
There are about 53 plants with parboiling facilities in the region. The bulk ofthese—38—are in Rio Grande Do Sul (see Table 10). There are two parboilingfacilities in Argentina, one operated by Molinos Rio de la Plata (Bunge and Borge) andthe other by La Arrocera Argentina (Gallo). Molinos ALA swaps white milled rice(which carries a premium in Brazil) for parboiled rice (which carries a premium inArgentina) with Suprarroz, a large Rio Grande do Sul mill. In Uruguay, the nation’sonly parboiling facility, Arrozur, is jointly operated by the five largest mills. SAMANretains a 46% interest in Arrozur, COOPAR 27%, Casarone 12.5% and Procipa and
ARKANSAS EXPERIMENT STATION BULLETIN 954
28
Tab
le 1
0. N
ame
and
loca
tion
of pa
rboi
ling
plan
ts in R
io G
rande
do
Sul,
Arg
enti
na
and
Uru
guay
, 1995.
Nam
eLo
catio
nN
ame
Loca
tion
Rio
Gra
nde
do
Sul
Alfr
ed A
. Tre
ichel
e C
iaC
achoe
ira
do S
ul
Rei
nal
do
Roe
ch S
.A.
Cac
hoe
ira
do S
ul
UN
ICO
P - U
nia
o C
o-op
Sul
Can
oas
Jose
Ber
ta S
.A. E
xp. I
mp.
Cam
aqua
Effe
m - P
rod.
Alim
ent. In
c.E
ldor
ado
do S
ul
Arr
ozei
ra S
anta
Luci
aTap
esArr
ozei
ra C
entr
o-Sul
Arr
oio
dos
Rat
osArr
ozei
ra C
amaq
uen
seC
amaq
ua
Irm
aos
Dal
bem
Arr
oio
dos
Rat
osB
raza
rroz
Ind.
Com
. Agr
opU
rugu
aian
aIN
DU
BE
R In
d. A
lim. B
erle
zeSan
ta M
aria
Com
erci
al d
e C
erea
is S
chra
nk
Tap
esAgr
icap
e S.A
. Pro
d A
limen
tare
sC
amaq
ua
Enge
nho
de A
rroz
Ipir
anga
S.A
.C
aceq
ui
Nel
son W
endt
& C
ia.
Pel
otas
Dis
t. C
erea
is T
apen
seTap
esE
mili
o R
oman
i S.A
.Pel
otas
Da
Cas
e Ir
mas
oSan
ta M
aria
Supr
arro
z S.A
. Ind.
Com
.Pel
otas
Enge
nho
Sao
Gab
riel
Sao
Gab
riel
Orl
a C
erea
is In
d. C
om.
Tap
esAgr
isa
- In
d. C
om. E
xp. P
rod.
Agr
ic.
Cam
aqua
Bon
ato
S.A
. Com
E In
d.U
rugu
aian
aC
omer
cial
de
Cer
eais
DALB
EM
Tap
esTa
lism
a In
d. C
om. C
erea
isE
ldor
ado
do S
ul
Dam
il-M
erca
ntil
Ind.
Com
.C
amaq
ua
Hiros
hi M
ashim
a e
Cia
.San
to A
nto
nio
da
Patr
ulh
aH
elm
ut Te
ssm
ann
Cam
aqua
Co-
op. A
rroz
eira
Ext
rem
o Sul
Cam
aqua
Guai
barr
oz S
.A.
Cam
aqua
Arg
enti
na
Arr
ozei
ra V
enea
toTap
esLa
Arr
ocer
a Arg
entin
aC
. del
Uru
guay
Arr
ozei
ra L
uzi
peTap
esR
io d
e la
Pla
ta—
—-a
Com
erci
al d
e C
erea
is B
arro
sC
ande
laria
H. P
orto
Can
dela
ria
Uru
guay
Ledo
Ritze
lC
ande
laria
Arr
ozur
Vill
a Sar
aC
o-op
. Agr
icol
a R
io P
ardo
San
ta C
ruz
do S
ul
Euge
nio
Iser
har
d e
Cia
.San
ta C
ruz
do S
ul
Ivo
J. M
arch
iori e
Irm
aos
Jagu
ari
a--
Unkn
own lo
catio
n.
Sou
rce:
FE
DA
RR
OZ.
THE MERCOSUR RICE ECONOMY
29
Arrozal 33 the remaining 14.5%. The annual 70,000-MT capacity of the U.S. tech-nology plant is divided among the partners according to their number of shares. Theparboiling service is performed at cost to each partner. The parboiled rice is marketedunder each partner’s individual brand name. Although there was a substantial pre-mium for parboiled rice at the time of construction (early 1980’s), the facility currentlyhas a low profitability level due to weakened demand for parboiled rice. Like Argen-tina, however, the plant gives the Uruguayan rice industry the ability to enter par-boiled export markets. Tropical varieties, not Blue Belle or similar varieties, aretypically used for parboiling.
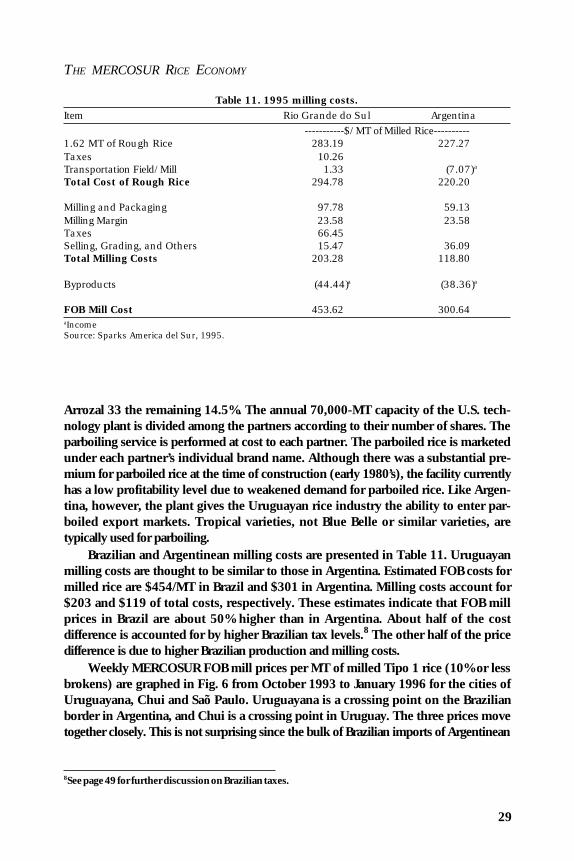
Brazilian and Argentinean milling costs are presented in Table 11. Uruguayanmilling costs are thought to be similar to those in Argentina. Estimated FOB costs formilled rice are $454/MT in Brazil and $301 in Argentina. Milling costs account for$203 and $119 of total costs, respectively. These estimates indicate that FOB millprices in Brazil are about 50% higher than in Argentina. About half of the costdifference is accounted for by higher Brazilian tax levels.8 The other half of the pricedifference is due to higher Brazilian production and milling costs.
Weekly MERCOSUR FOB mill prices per MT of milled Tipo 1 rice (10% or lessbrokens) are graphed in Fig. 6 from October 1993 to January 1996 for the cities ofUruguayana, Chui and Saõ Paulo. Uruguayana is a crossing point on the Brazilianborder in Argentina, and Chui is a crossing point in Uruguay. The three prices movetogether closely. This is not surprising since the bulk of Brazilian imports of Argentinean
Table 11. 1995 milling costs.Item Rio Grande do Sul Argentina
-----------$/MT of Milled Rice----------1.62 MT of Rough Rice 283.19 227.27Taxes 10.26Transportation Field/Mill 1.33 (7.07)a
Total Cost of Rough Rice 294.78 220.20
Milling and Packaging 97.78 59.13Milling Margin 23.58 23.58Taxes 66.45Selling, Grading, and Others 15.47 36.09Total Milling Costs 203.28 118.80
Byproducts (44.44)a (38.36)a
FOB Mill Cost 453.62 300.64aIncomeSource: Sparks America del Sur, 1995.
8See page 49 for further discussion on Brazilian taxes.

ARKANSAS EXPERIMENT STATION BULLETIN 954
30
and Uruguayan rice crosses the border at Uruguayana and Chui, respectively, andSaõ Paulo is the largest deficit market in Brazil, located less than 1000 miles away.As expected, Saõ Paulo carries a constant premium over the price of its exportingneighbors, and Uruguayan rice carries a slight premium over Argentinean rice, whichis consistent with quality perceptions.
The milling process typically produces 65 to 75% polished rice (head rice andbrokens), 19 to 23% husks, 8 to 12% bran and 3 to 5% impurities. Income frombyproducts (broken rice, husks and bran) has a major impact on a mill’s profitability.Large mills are generally able to dispose of byproducts in a more profitable mannerthan small mills. Byproducts have diverse uses. In Rio Grande do Sul, the husks areused as fuel for drying and parboiling and as litter in the large domestic poultryindustry. Bran is used as an animal feed and further processed into edible rice oilusing domestic technology. Two Rio Grande do Sul firms produce rice oil. Suprarroz,the largest milling firm, markets a rice oil under its brand name, Tio João. The beerand animal feed industries purchase most of the broken rice.
The recent upswing in production has created a byproduct disposal problem inArgentina and Uruguay, which may intensify with time unless new uses are found. InArgentina, husks are utilized as livestock feed, fuel for drying rough rice and litter forthe southern Entre Rios poultry industry. The use of husks for electrical generationhas been discussed among San Salvador (Entre Rios) millers. Bran is sold as alivestock feed, but currently no bran oil extraction or refining is performed in thecountry.
Fig. 6. MERCOSUR Tippo 1 prices. Source: MERCOARROZ, various issues.
THE MERCOSUR RICE ECONOMY
31
Major byproduct uses in Uruguay are husks and bran for animal feed, husks forlitter and fuel to parboil and dry rough rice. In addition to parboiling, Arrozur alsoextracts and refines bran oil. The five mills who own Arrozur sell stabilized bran to thefirm. The spent bran is returned to the five mills where it is sold as animal feed. Therefined oil is sold under the Arrozur name in Brazil. Arrozur also exports crude oil andbran to Brazil.
Grading
There are currently no uniform MERCOSUR quality and inspection standards.There is, however, a desire by the industry to have uniform milled rice gradingstandards, and the five countries are currently working together toward that end. It isthought that uniform MERCOSUR milled rice grades will closely follow the currentBrazilian grading system as it is the dominant consumer. The percentage of brokensappears to be the most important milled rice grading characteristic in the region.
Brazilian mills tend to set their own internal rough rice grades, but there areindustry-wide milled rice grades known as Tipo 1, Tipo 2 ..... and Tipo 5. Tipo 1 ricehas 10% or less brokens and Tipo 2 has 20% or less brokens. Irrigated rice falls intogrades Tipo 1 and Tipo 2, with the bulk in the Tipo 2 classification. Upland rice fallsinto Tipo 2 and lower quality grades. Brazilian imports from Argentina and Uruguayare 25% or less brokens; most would be classified as Tipo 2.
Argentina has three domestic milled rice grades, which are also used at the retaillevel: quintuple zero (00000) with 15% or less brokens, quadruple zero (0000) with25% or less brokens and second grades with 38% or less brokens. Second grade issold to low-income households or as pet food. Argentinean and Uruguayan exports toBrazil are classified under the Brazilian grading system. Rough rice grades are set atthe state level in Argentina. Discounts and premiums on rough rice are a percentageof the market price (see Table 12 for an example). In accordance with Argentineanlaw, sample testing by mills is carefully performed in order to readily resolve producer-miller quality disputes. Uruguay does not have official grades for either rough ormilled rice. However, discounts and premiums are given for deviations from industrynorms for rough rice. In Uruguay, both mills and the Asociacion de Cultivadores deArroz (Rice Producers Association) take test samples. The two groups work togetherto resolve quality disputes.
Transportation
MERCOSUR transportation is inadequate and costly by world standards. Thishas been exacerbated by the recent increase in economic activity due to domesticreforms and regional integration. Due to security reasons and government policies,which promoted self-sufficiency, transportation links among the five nations havetraditionally been poor. Even though expensive and insufficient in number, the bulk ofMERCOSUR rice is transported by truck. The region’s rail system is inadequate andlacks integration and gauge uniformity.

ARKANSAS EXPERIMENT STATION BULLETIN 954
32
Tab
le 1
2. G
radi
ng
syst
em for
Arg
enti
nea
n r
ough
ric
e.M
inim
um
Whol
e-G
rain
Per
centa
geTyp
eB
ase
%M
in. %
Prem
ium
Dis
count u
p to
45%
Dis
count be
low
45%
Dou
ble
long
5442
1% p
rice
incr
ease
for
each
1%
pri
ce d
ecre
ase
for
each
1.5
% p
rice
dec
reas
e fo
r ea
chper
centa
ge in
crea
se a
bov
e th
eper
centa
ge b
elow
the
bas
eper
centa
ge b
elow
45%
bas
eFin
e lo
ng
5642
1% p
rice
incr
ease
for
each
1%
pri
ce d
ecre
ase
for
each
1.5
% p
rice
dec
reas
e fo
r ea
chper
centa
ge in
crea
se a
bov
e th
eper
centa
ge b
elow
the
bas
eper
centa
ge b
elow
45%
bas
eM
ediu
m54
421%
pri
ce in
crea
se fo
r ea
ch1%
pri
ce d
ecre
ase
for
each
1.5
% p
rice
dec
reas
e fo
r ea
chper
centa
ge in
crea
se a
bov
e th
eper
centa
ge b
elow
the
bas
eper
centa
ge b
elow
45%
bas
eShor
t59
451%
pri
ce in
crea
se fo
r ea
ch1%
pri
ce d
ecre
ase
for
each
1.5
% p
rice
dec
reas
e fo
r ea
chper
centa
ge in
crea
se a
bov
e th
eper
centa
ge b
elow
the
bas
eper
centa
ge b
elow
48*
bas
e
Oth
er C
har
acte
rist
ics
Typ
eB
ase
Max
. %D
isco
unt
For
eign
mat
ter
-3.
0U
p to
3%
will
low
er p
rice
by
1% o
f eac
h p
erce
nta
ge. W
ill lo
wer
pri
ce b
y 1.
5% fo
rea
ch p
erce
nta
ge o
ver
3%
.Pan
za b
lanca
1.00
5.00
For
val
ues
bet
wee
n 1
and 5
% d
ecre
ase
pri
ce b
y 1%
.For
eign
mat
ter
-3.
0U
p to
3%
will
low
er p
rice
by
1% o
f eac
h p
erce
nta
ge. W
ill lo
wer
pri
ce b
y 1.
5% fo
rea
ch p
erce
nta
ge o
ver
3%
.Pan
za b
lanca
1.00
5.00
For
val
ues
bet
wee
n 1
and 5
% d
ecre
ase
pri
ce b
y 1%
.Spo
tted
and/
or red
gra
ins
0.25
0.50
For
val
ues
bet
wee
n 0
.25
and
0.50
% d
ecre
ase
pric
e by
1%
.C
hal
ky o
r de
ad g
rain
s0.
251.
00For
val
ues
bet
wee
n 0
.25 a
nd 1
.00%
dec
reas
e pri
ce b
y 1%
. For
val
ues
bet
wee
n1.
00 a
nd
2.00
% lo
wer
price
by
1.5%
.R
ed g
rain
and/
or g
rain
with
red
stre
aks
-2.
50U
p until 2
.5%
will
dec
reas
e pr
ice
by 2
%M
oist
ure
14W
hen
hum
idity
exc
eeds
14%
cos
ts d
ue
to d
ryin
g an
d pr
oduct
loss
will
be
dis-
counte
d ac
cord
ing
to the
esta
blis
hed
tab
les
of the
Nat
ional
Gra
in C
ounci
lLi
ana
and
poro
tillo
see
ds1 s
eed
Dec
reas
e by
0.5
0%
for
each
see
d that
exc
eeds
the
max
imum
leve
l
No
Live
Inse
cts
Per
mit
ted
Sou
rce:
Com
isio
n A
rbitra
l de
Entr
e R
ios.
THE MERCOSUR RICE ECONOMY
33
Although currently underutilized, the Paraná-Uruguay river transportation systemholds the most promise for reducing transportation costs for bulk commodities suchas rice. Currently, however, most mills lack the volume to use this transportationmode. Because the two rivers straddle the Argentinean production area (Corrientesand Entre Rios), Argentina should be in the best position to take advantage of animproved river system in shipping to Brazil. The Uruguay river, however, has a damwithout a lock; the river, in effect, is navigable only from just north of Condordia(northern Entre Rios) to Buenos Aires, and shipping is limited to 5000 MT. Anyserious improvement of the system will have to rectify this. Currently the river system,known as the hidrovia in Brazil, is being expanded and improved. The hidrovia willharness the Paraná and the Paraguay rivers, which drain the continent’s largest riverbasin (after the Amazon) to the needs of modern trade. From Caceres in Brazil, it willstretch 3,450 km to Buenos Aires. Developers see this as the Mississippi River ofSouth America, carrying goods on barges up and down the river. Some have pro-claimed it the backbone of the MERCOSUR. Increased use of the hidrovia shouldreduce rice transportation costs dramatically. Minor improvements estimated at $100million should cut the time it takes to travel from Caceres to Buenos Aires in half andincrease barge sizes to 2000 MT on the lower river and to 500 MT on the upperreaches. There is currently a rail link from the Paraná to the city of Saõ Paulo. Thiswill be supplemented with a barge canal, which is being financed by the state of SaõPaulo.
The Brazilian road system, the backbone of the nation’s transportation systemand by which the bulk of rice is transported, is in a general state of disrepair due to alack of maintenance and damage from overloaded trucks. Historically, little impor-tance has been placed on rail and river transportation networks. Railroads are unreli-able and frequently delayed. Only 8% of Rio Grande do Sul’s rough rice and 0.5% ofmilled rice are shipped by rail. South to north shipments frequently use intracoastalshipping. Traditionally, intra-coastal shipping has been closed to non-Brazilian ship-ping. Recently, however, the Brazilian government has allowed non-Brazilian ships tocompete in that trade. One of the biggest problems in importing rice into Brazil byocean transport, and actually considered by many to be a significant non-tariff barrier,is ocean port costs. Due to a strong longshoreman’s union, which uses 50-year-oldlabor efficiency standards to determine wage rates, unloading costs run $17 to $18/MT. Due to this, the government has allowed three or four private firms to developport facilities with non-union longshoremen. High port costs are an advantage toArgentina and Uruguay, who ship the bulk of their rice into Brazil by truck and rail.
The Rio Grande do Sul government has made recent efforts to improve thestate’s transportation infrastructure. This has included rebuilding and improved main-tenance of the current road system, adding more paved roads and improving connec-tions with the highway systems of Argentina and Uruguay. There is also an interest in

ARKANSAS EXPERIMENT STATION BULLETIN 954
34
extending the current rail and river transportation systems and better integrating themwith other modes of transportation.
The predominant transportation problem in Argentina for the rice industry is thelogistics of shipping rice to Brazil. Most rice moves into Brazil at a single crossingpoint at Uruguayana by truck and, to a lesser degree, by rail. Due to inadequateinfrastructure, three-week delays are not unknown. Argentina’s fleet of trucks is oldand inadequate. There is a large back order for new trucks. Although less costly, therail system has limited capacity, and small mills lack the volume to utilize it. Rice mustcompete with wheat, corn and soybeans, which have much larger volumes, for limitedrail capacity. Railroad rates in Argentina are about 12% higher than those in theUnited States and 11% higher than in Europe.
Due to the large volumes it markets, Glencore has been the most innovative riceexporter in utilizing available transportation. It has shipped rice across Uruguay toBrazil using Uruguayan rail. Second, it has shipped rice up the Paraná river fromCorrientes to Corumba, Mato Grosso do Sul, where it is shipped by train to SaõPaulo. Finally, Glencore has contracted with the Ferrocarril de Mesopotamia (the localrailroad) to ship 150,000 MT of rice to Brazil via Uruguayana. This has been possibledue to the large volumes that Glencore ships.
Uruguay is considered to have the best surface transportation system in theregion because of substantial investment (responsible for much of its external debt) bythe former military government. Transportation costs, however, are high, because fueltaxes are among the highest in Latin America. To its advantage, production zones arelocated within a short drive to one of six border crossing points with Rio Grande doSul (four have rail connections) and to Montevideo, the nation’s major port.
Retailing and Retail Prices
The structure of the MERCOSUR retail food sector is mixed. Large supermarketsand hypermarts predominate in large urban centers such as Sao Paulõ, Rio deJaneiro and Belo Horizonte in Brazil; Buenos Aires in Argentina; and Montevideo andPunta del Este in Uruguay. Small supermarkets and mom-and-pop stores dominate insmall cities and rural areas. In large urban centers, food selection is good andinternational in scope, and speciality departments such as delis, prepared food andbakeries are present in supermarkets. However, MERCOSUR supermarkets generallylack the variety of selection within each food group, including rice, that would bepresent in U.S. supermarkets.
Millers’ brand name white and parboiled rice are the most important rice prod-ucts. Processed, brown and mixes are present but are less important. In urban areasof Brazil, private label rice has an important presence. Private label rice is unimpor-tant in Argentina, and Uruguay and is not a widely used marketing concept.
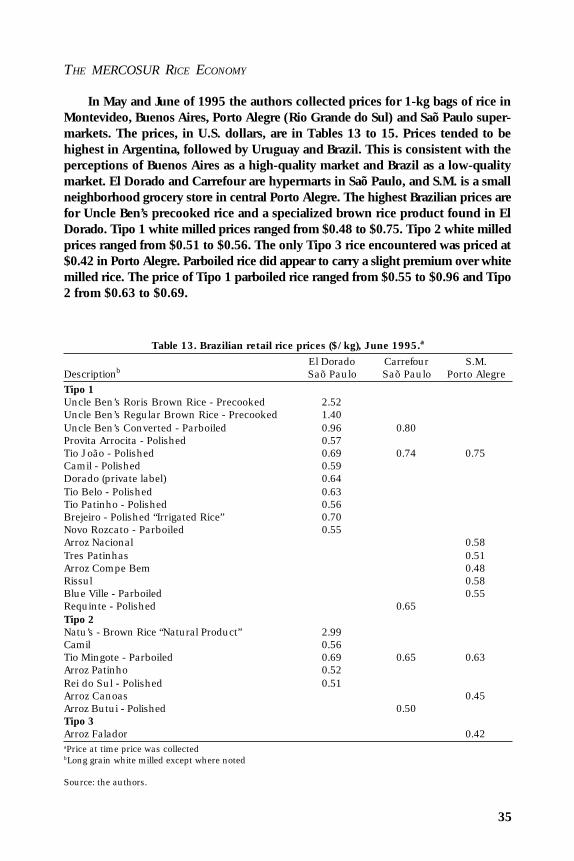
THE MERCOSUR RICE ECONOMY
35
In May and June of 1995 the authors collected prices for 1-kg bags of rice inMontevideo, Buenos Aires, Porto Alegre (Rio Grande do Sul) and Saõ Paulo super-markets. The prices, in U.S. dollars, are in Tables 13 to 15. Prices tended to behighest in Argentina, followed by Uruguay and Brazil. This is consistent with theperceptions of Buenos Aires as a high-quality market and Brazil as a low-qualitymarket. El Dorado and Carrefour are hypermarts in Saõ Paulo, and S.M. is a smallneighborhood grocery store in central Porto Alegre. The highest Brazilian prices arefor Uncle Ben’s precooked rice and a specialized brown rice product found in ElDorado. Tipo 1 white milled prices ranged from $0.48 to $0.75. Tipo 2 white milledprices ranged from $0.51 to $0.56. The only Tipo 3 rice encountered was priced at$0.42 in Porto Alegre. Parboiled rice did appear to carry a slight premium over whitemilled rice. The price of Tipo 1 parboiled rice ranged from $0.55 to $0.96 and Tipo2 from $0.63 to $0.69.
Table 13. Brazilian retail rice prices ($/kg), June 1995.a
El Dorado Carrefour S.M.Descriptionb Saõ Paulo Saõ Paulo Porto AlegreTipo 1Uncle Ben’s Roris Brown Rice - Precooked 2.52Uncle Ben’s Regular Brown Rice - Precooked 1.40Uncle Ben’s Converted - Parboiled 0.96 0.80Provita Arrocita - Polished 0.57Tio João - Polished 0.69 0.74 0.75Camil - Polished 0.59Dorado (private label) 0.64Tio Belo - Polished 0.63Tio Patinho - Polished 0.56Brejeiro - Polished “Irrigated Rice” 0.70Novo Rozcato - Parboiled 0.55Arroz Nacional 0.58Tres Patinhas 0.51Arroz Compe Bem 0.48Rissul 0.58Blue Ville - Parboiled 0.55Requinte - Polished 0.65Tipo 2Natu’s - Brown Rice “Natural Product” 2.99Camil 0.56Tio Mingote - Parboiled 0.69 0.65 0.63Arroz Patinho 0.52Rei do Sul - Polished 0.51Arroz Canoas 0.45Arroz Butui - Polished 0.50Tipo 3Arroz Falador 0.42aPrice at time price was collectedbLong grain white milled except where noted
Source: the authors.

ARKANSAS EXPERIMENT STATION BULLETIN 954
36
Table 14. Argentinean retail rice prices ($/kg), June 1995.a
Carrefour Tia ExpressDescriptionb Buenos Aires Buenos Aires00000Arroz Barbara - Parboiled (Sagemuller) 1.39 1.65Arroz Barbara (Sagemuller) 1.17 1.05Arroz Barbara - Double Carolina (Sagemuller) 1.15 1.59Arroz Barbara - Brown Rice (Sagemuller) 1.37ALA Dorado - Parboiled 1.39Blue Bell (ALA) 1.18ALA Doble - Double Carolina 1.57Arroz Maxima - Parboiled (Molinos Rio de la Plata) 1.55 1.85Arroz Maxima - Brown Parboiled (Molinos Rio de la Plata) 2.77Arroz Maxima Doble Blanco - Double Carolina (MolinosRio de la Plata) 1.99 2.25Condor Double - Double Carolina (Molinos Rio de la Plata 1.62Arroz Condor (Molinos Rio de la Plata) 1.25Arroz Gallo Oro - Parboiled (La Arrocera Argentina) 1.82 1.95Gallo - Brown Rice (La Arrocera Argentina) 2.69 2.88Arroz Doble Gallo - Double Carolina (La Arrocera Argentina) 2.49 2.10Arroz Gallo (LaArrocera Argentina) 1.99 1.39Gallo - Boiling-Bags 2.49Dos Hermanos “Blue Bonnet” 1.69
0000Arroz 53 ‘Blue Bonnet’ 0.81Nutri Max 0.72aPrice at time price was collectedbLong grain white milled except where noted
Source: the authors.
In Buenos Aires, prices were collected in Carrefour, a hypermart like its sisterstore in Sao Paulõ, and Tia Express, a small center-city supermarket. Not surprisingly,prices in Tia Express were generally found to be higher than those in Carrefour. Mostprices were over $1 and ranged up to $2.88 for Gallo brown rice in Tia Express. Themajority of brands fall under 00000, the highest retail grade. White milled 00000ranged in price from $1.05 to $1.99. Arroz Gallo, the nation’s largest seller, sold for$1.39 in Tia Express and $1.99 in Carrefour. Double Carolina carried a premiumover white milled with prices ranging from $1.15 to $2.49. Lower grade 0000 whitemilled sold for $0.75. Brown rice was the most expensive, up to $2.88 in TiaExpress.
In Montevideo prices were collected from Disco, the largest chain of supermar-kets in Uruguay, and Tienda Inglesa, an upscale chain store. Uruguayan rice is equalto or superior to Argentinean rice in quality but lacks the sophisticated packaging andhigh prices. There is less brand name selection than in Argentina and Brazil. Variousrices from SAMAN and COOPAR accounted for virtually all of the shelf space. Whitemilled rice prices ranged from $0.82 to $0.95. The largest seller, COOPAR’s Blue
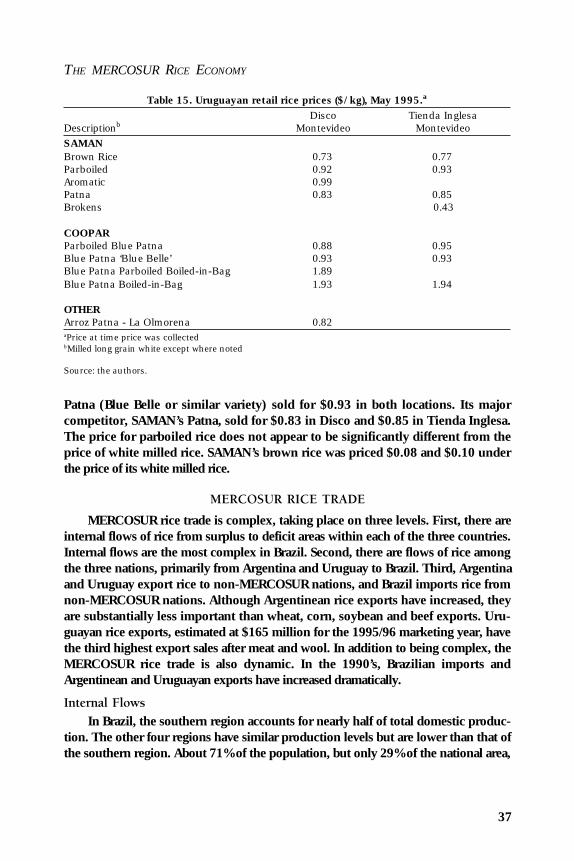
THE MERCOSUR RICE ECONOMY
37
Patna (Blue Belle or similar variety) sold for $0.93 in both locations. Its majorcompetitor, SAMAN’s Patna, sold for $0.83 in Disco and $0.85 in Tienda Inglesa.The price for parboiled rice does not appear to be significantly different from theprice of white milled rice. SAMAN’s brown rice was priced $0.08 and $0.10 underthe price of its white milled rice.
MERCOSUR RICE TRADE
MERCOSUR rice trade is complex, taking place on three levels. First, there areinternal flows of rice from surplus to deficit areas within each of the three countries.Internal flows are the most complex in Brazil. Second, there are flows of rice amongthe three nations, primarily from Argentina and Uruguay to Brazil. Third, Argentinaand Uruguay export rice to non-MERCOSUR nations, and Brazil imports rice fromnon-MERCOSUR nations. Although Argentinean rice exports have increased, theyare substantially less important than wheat, corn, soybean and beef exports. Uru-guayan rice exports, estimated at $165 million for the 1995/96 marketing year, havethe third highest export sales after meat and wool. In addition to being complex, theMERCOSUR rice trade is also dynamic. In the 1990’s, Brazilian imports andArgentinean and Uruguayan exports have increased dramatically.
Internal Flows
In Brazil, the southern region accounts for nearly half of total domestic produc-tion. The other four regions have similar production levels but are lower than that ofthe southern region. About 71% of the population, but only 29% of the national area,
Table 15. Uruguayan retail rice prices ($/kg), May 1995.a
Disco Tienda InglesaDescriptionb Montevideo MontevideoSAMANBrown Rice 0.73 0.77Parboiled 0.92 0.93Aromatic 0.99Patna 0.83 0.85Brokens 0.43
COOPARParboiled Blue Patna 0.88 0.95Blue Patna ‘Blue Belle’ 0.93 0.93Blue Patna Parboiled Boiled-in-Bag 1.89Blue Patna Boiled-in-Bag 1.93 1.94
OTHERArroz Patna - La Olmorena 0.82aPrice at time price was collectedbMilled long grain white except where noted
Source: the authors.
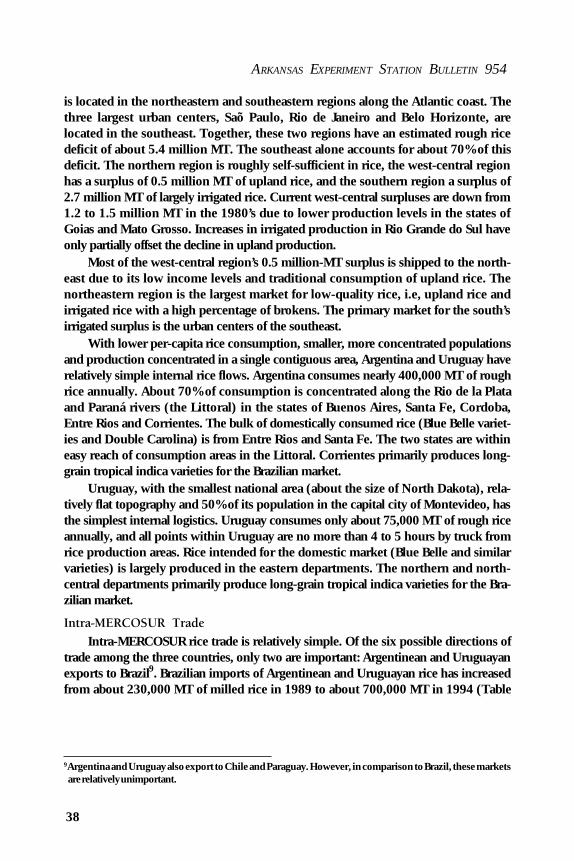
ARKANSAS EXPERIMENT STATION BULLETIN 954
38
is located in the northeastern and southeastern regions along the Atlantic coast. Thethree largest urban centers, Saõ Paulo, Rio de Janeiro and Belo Horizonte, arelocated in the southeast. Together, these two regions have an estimated rough ricedeficit of about 5.4 million MT. The southeast alone accounts for about 70% of thisdeficit. The northern region is roughly self-sufficient in rice, the west-central regionhas a surplus of 0.5 million MT of upland rice, and the southern region a surplus of2.7 million MT of largely irrigated rice. Current west-central surpluses are down from1.2 to 1.5 million MT in the 1980’s due to lower production levels in the states ofGoias and Mato Grosso. Increases in irrigated production in Rio Grande do Sul haveonly partially offset the decline in upland production.
Most of the west-central region’s 0.5 million-MT surplus is shipped to the north-east due to its low income levels and traditional consumption of upland rice. Thenortheastern region is the largest market for low-quality rice, i.e, upland rice andirrigated rice with a high percentage of brokens. The primary market for the south’sirrigated surplus is the urban centers of the southeast.
With lower per-capita rice consumption, smaller, more concentrated populationsand production concentrated in a single contiguous area, Argentina and Uruguay haverelatively simple internal rice flows. Argentina consumes nearly 400,000 MT of roughrice annually. About 70% of consumption is concentrated along the Rio de la Plataand Paraná rivers (the Littoral) in the states of Buenos Aires, Santa Fe, Cordoba,Entre Rios and Corrientes. The bulk of domestically consumed rice (Blue Belle variet-ies and Double Carolina) is from Entre Rios and Santa Fe. The two states are withineasy reach of consumption areas in the Littoral. Corrientes primarily produces long-grain tropical indica varieties for the Brazilian market.
Uruguay, with the smallest national area (about the size of North Dakota), rela-tively flat topography and 50% of its population in the capital city of Montevideo, hasthe simplest internal logistics. Uruguay consumes only about 75,000 MT of rough riceannually, and all points within Uruguay are no more than 4 to 5 hours by truck fromrice production areas. Rice intended for the domestic market (Blue Belle and similarvarieties) is largely produced in the eastern departments. The northern and north-central departments primarily produce long-grain tropical indica varieties for the Bra-zilian market.
Intra-MERCOSUR Trade
Intra-MERCOSUR rice trade is relatively simple. Of the six possible directions oftrade among the three countries, only two are important: Argentinean and Uruguayanexports to Brazil9. Brazilian imports of Argentinean and Uruguayan rice has increasedfrom about 230,000 MT of milled rice in 1989 to about 700,000 MT in 1994 (Table
9Argentina and Uruguay also export to Chile and Paraguay. However, in comparison to Brazil, these marketsare relatively unimportant.
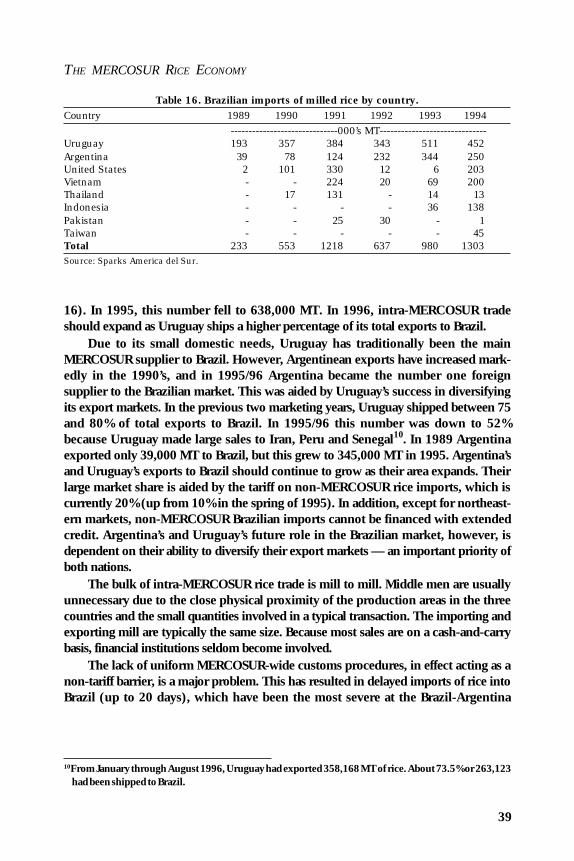
THE MERCOSUR RICE ECONOMY
39
16). In 1995, this number fell to 638,000 MT. In 1996, intra-MERCOSUR tradeshould expand as Uruguay ships a higher percentage of its total exports to Brazil.
Due to its small domestic needs, Uruguay has traditionally been the mainMERCOSUR supplier to Brazil. However, Argentinean exports have increased mark-edly in the 1990’s, and in 1995/96 Argentina became the number one foreignsupplier to the Brazilian market. This was aided by Uruguay’s success in diversifyingits export markets. In the previous two marketing years, Uruguay shipped between 75and 80% of total exports to Brazil. In 1995/96 this number was down to 52%because Uruguay made large sales to Iran, Peru and Senegal10. In 1989 Argentinaexported only 39,000 MT to Brazil, but this grew to 345,000 MT in 1995. Argentina’sand Uruguay’s exports to Brazil should continue to grow as their area expands. Theirlarge market share is aided by the tariff on non-MERCOSUR rice imports, which iscurrently 20% (up from 10% in the spring of 1995). In addition, except for northeast-ern markets, non-MERCOSUR Brazilian imports cannot be financed with extendedcredit. Argentina’s and Uruguay’s future role in the Brazilian market, however, isdependent on their ability to diversify their export markets — an important priority ofboth nations.
The bulk of intra-MERCOSUR rice trade is mill to mill. Middle men are usuallyunnecessary due to the close physical proximity of the production areas in the threecountries and the small quantities involved in a typical transaction. The importing andexporting mill are typically the same size. Because most sales are on a cash-and-carrybasis, financial institutions seldom become involved.
The lack of uniform MERCOSUR-wide customs procedures, in effect acting as anon-tariff barrier, is a major problem. This has resulted in delayed imports of rice intoBrazil (up to 20 days), which have been the most severe at the Brazil-Argentina
Table 16. Brazilian imports of milled rice by country.Country 1989 1990 1991 1992 1993 1994
------------------------------000’s MT------------------------------Uruguay 193 357 384 343 511 452Argentina 39 78 124 232 344 250United States 2 101 330 12 6 203Vietnam - - 224 20 69 200Thailand - 17 131 - 14 13Indonesia - - - - 36 138Pakistan - - 25 30 - 1Taiwan - - - - - 45Total 233 553 1218 637 980 1303Source: Sparks America del Sur.
10From January through August 1996, Uruguay had exported 358,168 MT of rice. About 73.5% or 263,123had been shipped to Brazil.

ARKANSAS EXPERIMENT STATION BULLETIN 954
40
border in Uruguayana. While the Argentinean rice industry claims that these delaysare due to pressure from the Brazilian rice industry, the Brazilians attribute the delaysto transportation problems. The Argentineans have conceded that this problem isslowly improving. Both sides agree that uniform customs procedures should substan-tially reduce this problem.
Traditionally, Argentinean and Uruguayan mills have not tried to distribute con-sumer-packaged rice under their own brand names in Brazil. Recently, however, moreArgentinean and Uruguayan consumer-packaged brand-name rice has reached Brazil-ian consumers through joint ventures and exclusive distribution rights. SAMAN, anUruguayan mill, sells rice under its brand name in Brazil and has set up a distributionsystem to facilitate this. This is aided by Uruguay’s regional reputation for high-qualityrice.
External MERCOSUR Trade
External MERCOSUR rice trade consists of Brazilian imports from, and Argentineanand Uruguayan exports to, non-MERCOSUR nations. Brazilian imports from non-MERCOSUR nations have been growing but are highly variable (Table 16). TheUnited States and Vietnam are the principal non-MERCOSUR suppliers. The consis-tency of Argentinean and Uruguayan exports and the variability of non-MERCOSURimports would appear to indicate that non-MERCOSUR exporters are Brazil’s residualsuppliers, supplying what Argentina and Uruguay are unable to supply.
Although Brazil is the primary export market, an important goal of both Argen-tina and Uruguay is market diversification. Based on data in Tables 17 and 18, non-Brazilian markets account for only about 20% of their exports. Uruguay has a longerhistory of exporting to non-Brazilian markets and in this area is more sophisticatedthan Argentina. As noted earlier, Uruguay was successful in reducing exports to Brazilfrom 80% of the total in 1994 to only 52% in 1995. However, it is expected that thisnumber will increase in 1996. There is no indication that Argentina is diversifyingaway from the Brazilian market. Uniformity of quality still hinders the ability ofArgentina to make large sales in high-quality non-Brazilian markets.
Several factors indicate that the 1996/97 and 1997/98 marketing years shouldsee strong sales to Brazil from both MERCOSUR and non-MERCOSUR exporters.Due to reduced production (see page 16) Brazil is expected to have a 2 million-MT(milled basis) shortfall in the 1996/97 marketing year. In 1996, Argentina is expectedto supply only slightly more than the 345,000 MT that it supplied in 1995. IfUruguay increases its shipments to Brazil as expected, then total MERCOSUR ship-ments to Brazil for 1996/97 should be about 730,000 MT — less than one-third ofBrazil’s import needs. This would indicate that non-MERCOSUR imports at about1.35 million MT will account for the bulk of imports. Under normal growing condi-tions, Brazil’s imports for 1997/98 should exceed 1996/97 imports. High Brazilianimport needs may result in a reduction in the MERCOSUR tariff from 20 to 10% and
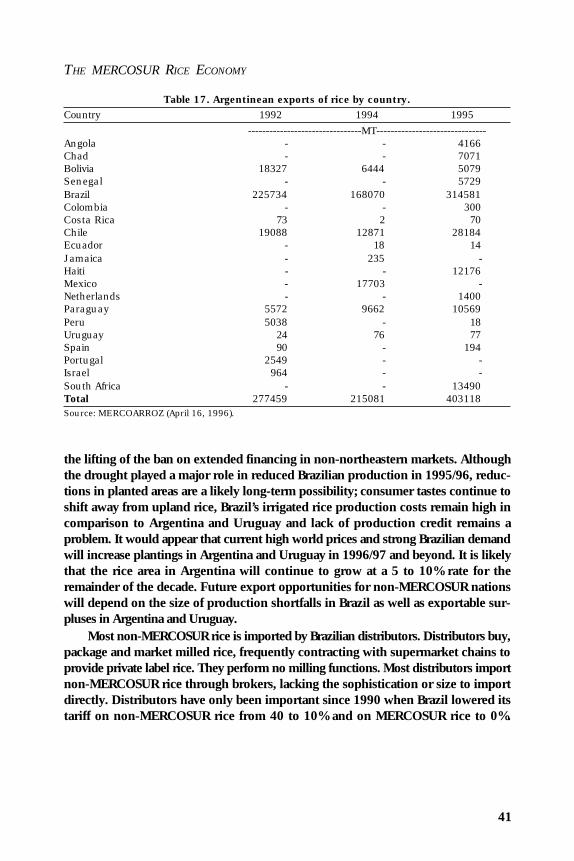
THE MERCOSUR RICE ECONOMY
41
Table 17. Argentinean exports of rice by country.Country 1992 1994 1995
--------------------------------MT-------------------------------Angola - - 4166Chad - - 7071Bolivia 18327 6444 5079Senegal - - 5729Brazil 225734 168070 314581Colombia - - 300Costa Rica 73 2 70Chile 19088 12871 28184Ecuador - 18 14Jamaica - 235 -Haiti - - 12176Mexico - 17703 -Netherlands - - 1400Paraguay 5572 9662 10569Peru 5038 - 18Uruguay 24 76 77Spain 90 - 194Portugal 2549 - -Israel 964 - -South Africa - - 13490Total 277459 215081 403118Source: MERCOARROZ (April 16, 1996).
the lifting of the ban on extended financing in non-northeastern markets. Althoughthe drought played a major role in reduced Brazilian production in 1995/96, reduc-tions in planted areas are a likely long-term possibility; consumer tastes continue toshift away from upland rice, Brazil’s irrigated rice production costs remain high incomparison to Argentina and Uruguay and lack of production credit remains aproblem. It would appear that current high world prices and strong Brazilian demandwill increase plantings in Argentina and Uruguay in 1996/97 and beyond. It is likelythat the rice area in Argentina will continue to grow at a 5 to 10% rate for theremainder of the decade. Future export opportunities for non-MERCOSUR nationswill depend on the size of production shortfalls in Brazil as well as exportable sur-pluses in Argentina and Uruguay.
Most non-MERCOSUR rice is imported by Brazilian distributors. Distributors buy,package and market milled rice, frequently contracting with supermarket chains toprovide private label rice. They perform no milling functions. Most distributors importnon-MERCOSUR rice through brokers, lacking the sophistication or size to importdirectly. Distributors have only been important since 1990 when Brazil lowered itstariff on non-MERCOSUR rice from 40 to 10% and on MERCOSUR rice to 0%.

ARKANSAS EXPERIMENT STATION BULLETIN 954
42
Distributors are primarily located in the large urban centers of the southeast. One ofthe strengths of distributors, and for which they have been criticized by millers, is theirflexibility in procuring rice. Distributors may purchase milled rice from domestic millsor import from a number of sources. Imported rice is desirable because it avoids highBrazilian milling costs. Another option is to import rough rice and have it custommilled. Distributors have been criticized for blending any number of combinations ofupland, domestic irrigated and imported rice. As a rule, an upland/irrigated blend cancontain no more than 25% of upland rice before its taste becomes apparent. Oneproblem with blending, of course, is that cooking times may vary among the compo-nent rices. Distributors and their allies, the supermarket chains, want to import ricefreely in order to take advantage of subsidies and the favorable credit terms offered bynon-MERCOSUR suppliers.
There are tradeoffs in the sourcing of Brazilian imports. MERCOSUR rice pro-ducers are the main beneficiaries when a high rice tariff prevails through the tradecreation effect of a custom union. The MERCOSUR rice industry claims that theyneed a 35% external tariff to protect themselves from “subsidized” imports. A private
Table 18. Uruguayan exports of milled rice by country by marketing year (MT).a
Country 1990/91 1991/92 1992/93 1993/94 1994/95 1995/96Angola - - - - - 1127Argentina - - - - - 3120Bahamas - - 86 280 322 -Brazil 234540 253801 294339 360424 321116 343080Chile 4007 5437 12648 11973 15266 10734Cyprus 1017 948 1349 1116 1010 1247Spain - 378 634 236 237 1696Haiti - - - 5157 10370 -Netherlands 6223 - 4074 - - -Iran - - 24945 - - 39562Canary Is. 473 1044 1727 1569 1586 228Kuwait 300 200 300 213 380 40Malta - - 108 112 22 108Mexico 520 - 9700 15265 24156 3350Paraguay - - - 8 - 36Peru - - 40131 67997 10828 73228Greece - - - - - 194Portugal 599 - 43 11736 323 258South Africa 638Senegal - - - - 12079 50898Slovenia - - - - - 215Sweden 400 37 65 43 65 -Japan 51Others 1525 5842 1404 3881 5622 866Total 249604 267687 391553 480010 403472 528944aMarketing year is April 1 through March 31.
Source: Comision Sectorial del Arroz.
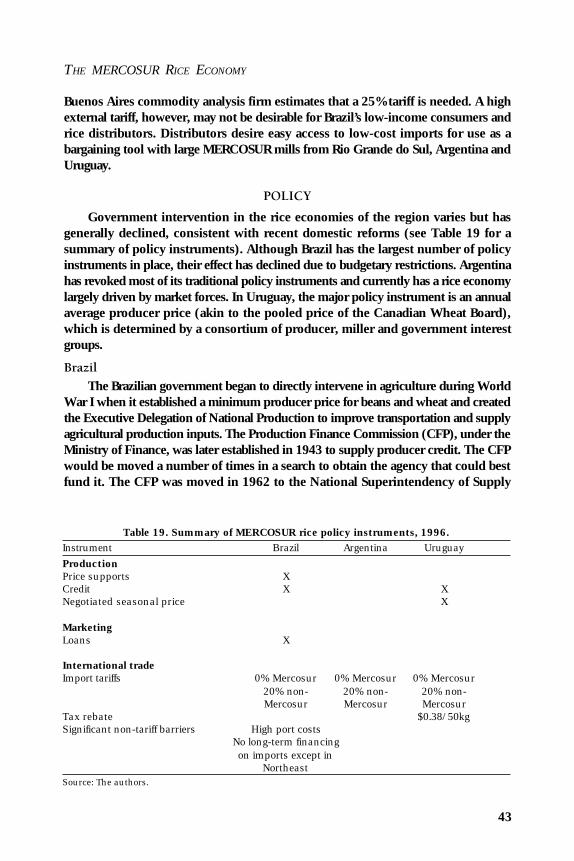
THE MERCOSUR RICE ECONOMY
43
Buenos Aires commodity analysis firm estimates that a 25% tariff is needed. A highexternal tariff, however, may not be desirable for Brazil’s low-income consumers andrice distributors. Distributors desire easy access to low-cost imports for use as abargaining tool with large MERCOSUR mills from Rio Grande do Sul, Argentina andUruguay.
POLICY
Government intervention in the rice economies of the region varies but hasgenerally declined, consistent with recent domestic reforms (see Table 19 for asummary of policy instruments). Although Brazil has the largest number of policyinstruments in place, their effect has declined due to budgetary restrictions. Argentinahas revoked most of its traditional policy instruments and currently has a rice economylargely driven by market forces. In Uruguay, the major policy instrument is an annualaverage producer price (akin to the pooled price of the Canadian Wheat Board),which is determined by a consortium of producer, miller and government interestgroups.
Brazil
The Brazilian government began to directly intervene in agriculture during WorldWar I when it established a minimum producer price for beans and wheat and createdthe Executive Delegation of National Production to improve transportation and supplyagricultural production inputs. The Production Finance Commission (CFP), under theMinistry of Finance, was later established in 1943 to supply producer credit. The CFPwould be moved a number of times in a search to obtain the agency that could bestfund it. The CFP was moved in 1962 to the National Superintendency of Supply
Table 19. Summary of MERCOSUR rice policy instruments, 1996.Instrument Brazil Argentina Uruguay
ProductionPrice supports XCredit X XNegotiated seasonal price X
MarketingLoans X
International tradeImport tariffs 0% Mercosur 0% Mercosur 0% Mercosur
20% non- 20% non- 20% non-Mercosur Mercosur Mercosur
Tax rebate $0.38/50kgSignificant non-tariff barriers High port costs
No long-term financingon imports except in
NortheastSource: The authors.

ARKANSAS EXPERIMENT STATION BULLETIN 954
44
(SUNAB), whose mission was to administer agricultural prices, because of an agricul-tural supply crisis. From 1967 to 1990, the CFP was under the direct control of theMinistry of Agriculture. In 1990, the CFP was placed under the direction of the CNA,or what a short time later would become CONAB (Companhia Nacional deAbasticimento or The National Supply Company), which administers the agriculturalprice support program. In 1991 CONAB was placed under the control of the Ministryof Agriculture.
The first producer price support program was established in July 1945 for rice,beans, peanuts and sunflower seeds. The program was financed by the Banco doBrasil and administered by the CFP. Minimum prices were to be based on “effective”costs plus a 30% markup and the expected tendency of the market. Although thepurpose of the program was to support producer prices, until the 1980’s the pro-gram was largely dedicated to estimating production costs, which were used as themain criteria in establishing credit levels. Under the CFP loan program, a producercould obtain financing of up to 80% of expected income based on the minimum price.The minimum price was fixed three months before planting, although this provisionwas frequently violated. CFP loans could be repaid in kind at the minimum price.Product accumulated under the program was placed in a strategic reserve. Accumula-tion in excess of the strategic reserve was exported. The minimum price was initiallyoffered only to producers, especially small producers who traditionally relied on localmoneylenders for production loans. However, after much lobbying, millers and othermarketers obtained the right to receive the minimum price, provided that they coulddemonstrate that the producer of the rice had received the minimum price.
By 1979, the rural credit and subsidized input paradigm was exhausted andhighly criticized by those outside of agriculture. In 1980 greater emphasis was placedon the price support program. Under the price support program, market prices weresupported by purchasing rice when the Saõ Paulo wholesale price dipped below theminimum price for 10 consecutive days. When the Saõ Paulo wholesale price ex-ceeded a 60-month running average trigger price (PLE), stocks were released. Later, asystem based on regional wholesale prices was implemented. The PLE program alsocalled for imports when domestic supplies were low, prices were accelerating or salesof government-held stocks could not dampen prices.
The goal of the price support program was to stabilize the market price. Govern-ment rationale for the program was 1) to maintain price parity between the agricul-tural and non-agricultural sectors, 2) to cover increasing production costs, 3) to set astable long-run equilibrium price and 4) to provide a subsidy in order to increaseproduction. Stocks accumulated under the price support program went to strategicreserves (which were designed to hold 1/12 of annual consumption) and to regulatethe market. Due to Brazil’s inflationary problems, the support and trigger prices and

THE MERCOSUR RICE ECONOMY
45
interest on CFP loans were indexed. The support price, however, was not indexed.Only after several poor harvests was the support price indexed.
In reality, support price levels were usually set well below market prices due tobudgetary constraints, so that in effect, the program had little influence on marketprices. Support levels did not cover total costs and seldom gave the producer a 30%markup over cash costs.
CFP credit, about 25% of which went to rice producers, declined throughout the1980s. By the early 1990s, CFP’s budget for loans had fallen to 25% of its 1979 highof nearly $28 billion (see Fig. 7). Similar to credit, real support levels for irrigated ricedeclined sharply from 1987 to 1994 (Fig. 8). Average support prices (in constant1994 reals) were 16.11 reals (one real is equal to one dollar) per 50-kg bag of roughrice from 1975 to 1986, but fell sharply to 8.04 reals (in 1994 constant reals) from1987 to 1994. Similarly, Fig. 9 shows sharp drops in the per-hectare estimatedproduction costs upon which the minimum price is based. In spite of falling supportlevels, government purchases became significant in the second half of the 1980s evenin consumption-deficit states such as Saõ Paulo (see Table 20). It has been estimatedthat price supports increased rice prices 12% above the free market price in thisperiod (Auxiliadora). The program was most effective in the central-west agriculturalfrontier where the government was typically the only buyer.
Fig. 7. Brazilian government credit to agriculture. Source: FEDARROZ.

ARKANSAS EXPERIMENT STATION BULLETIN 954
46
Fig. 8. Support prices for Brazilian irrigated rought rice. (Source: FEDARROZ)
Fig. 9. Estimated government production costs on which loans are based (assumes 4.2to 5.0 MT/ha yields). (Source: FEDARROZ)
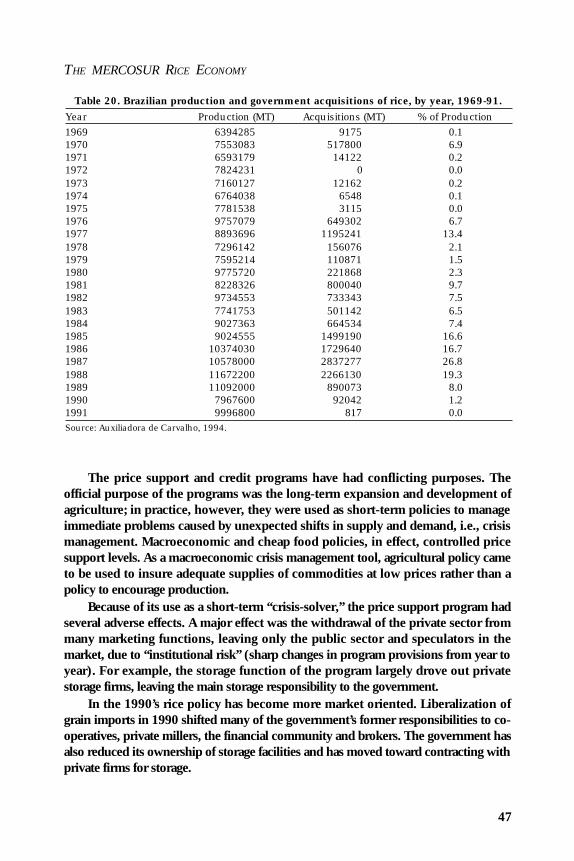
THE MERCOSUR RICE ECONOMY
47
The price support and credit programs have had conflicting purposes. Theofficial purpose of the programs was the long-term expansion and development ofagriculture; in practice, however, they were used as short-term policies to manageimmediate problems caused by unexpected shifts in supply and demand, i.e., crisismanagement. Macroeconomic and cheap food policies, in effect, controlled pricesupport levels. As a macroeconomic crisis management tool, agricultural policy cameto be used to insure adequate supplies of commodities at low prices rather than apolicy to encourage production.
Because of its use as a short-term “crisis-solver,” the price support program hadseveral adverse effects. A major effect was the withdrawal of the private sector frommany marketing functions, leaving only the public sector and speculators in themarket, due to “institutional risk” (sharp changes in program provisions from year toyear). For example, the storage function of the program largely drove out privatestorage firms, leaving the main storage responsibility to the government.
In the 1990’s rice policy has become more market oriented. Liberalization ofgrain imports in 1990 shifted many of the government’s former responsibilities to co-operatives, private millers, the financial community and brokers. The government hasalso reduced its ownership of storage facilities and has moved toward contracting withprivate firms for storage.
Table 20. Brazilian production and government acquisitions of rice, by year, 1969-91.
Year Production (MT) Acquisitions (MT) % of Production1969 6394285 9175 0.11970 7553083 517800 6.91971 6593179 14122 0.21972 7824231 0 0.01973 7160127 12162 0.21974 6764038 6548 0.11975 7781538 3115 0.01976 9757079 649302 6.71977 8893696 1195241 13.41978 7296142 156076 2.11979 7595214 110871 1.51980 9775720 221868 2.31981 8228326 800040 9.71982 9734553 733343 7.51983 7741753 501142 6.51984 9027363 664534 7.41985 9024555 1499190 16.61986 10374030 1729640 16.71987 10578000 2837277 26.81988 11672200 2266130 19.31989 11092000 890073 8.01990 7967600 92042 1.21991 9996800 817 0.0Source: Auxiliadora de Carvalho, 1994.

ARKANSAS EXPERIMENT STATION BULLETIN 954
48
Currently, Brazil has minimum guaranteed producer prices (MGP) for rice and sixother commodities that are based on the cost of production. Agricultural programsare announced in August for the summer crops and in March for the winter crops(seasons inverted in southern hemisphere). The government has mostly switched fromdirect purchase to marketing loans, so it now uses the MGP more as a loan rate andless as a purchase price. There are two types of marketing loan contracts: 1) con-tracts in which the government agrees to purchase the product at the minimumsupport price (EGF/SOV) and 2), due to budget constraints, contracts in which thegovernment has the option to purchase the commodity at the minimum support priceor to sell the product at the market price (EGF/COV). The majority of marketingloans are of the EGF/COV type. Before July 1, 1994, the support price was adjustedevery 15 days beginning at harvest. Since July 1, 1994, however, the support pricefor irrigated rice has been frozen at $11.93/50 kg. The current support price forupland rice is $10.54/60 kg in the south, southeast, central-south and central-west;$10.17 in Tocantins and Mato Grosso; and $9.60 in the north.
Certain components of the credit programs vary from year to year, but loanterms are generally differentiated by farm size, crop, yield and region. In 1994/95,production and marketing loans for the winter crops (wheat, barley, canola and oats)and the summer crops (rice, corn, cotton, soybeans, etc.) totaled $6.5 billion, a 12%increase from the previous year but well below the record of $28 billion of 1979/80.Direct government production loans to producers are declining, as are the loan limitsper farm. In the past, interest rates were indexed to the rate of inflation. During the1995/96 crop year, the interest rate is a fixed 16%.
Because of the farm crisis of 1995/96, the government and the producersrenegotiated some $7 billion of farm debt that will have to be repaid in the next 7-10years with a one or two-year grace period at a 3% annual interest rate.
Farmers can also obtain private sector loans through the use of commoditycertificates (CM-G) and bonds (CPR). There are two kinds of CM-G. The CMDG isused when the product is delivered and paid for in cash (a cash or spot transaction).The CMFG is used for a futures contract. Both are guaranteed by a bank. The CM-G’s are freely negotiable in the market based on the quantity, quality, place and dateof delivery. The certificates are issued by the producer, the lender, or a co-operativeand are administered by the Center of Registrations S.A. The CPR’s (bonds) areissued by the farms and co-operatives when the farms sell their agricultural productsin advance to finance production. The CPR’s are administered by a network of officesauthorized by the Banco do Brasil.
Due to ongoing programs, the government is still the largest holder of ricestocks. In May 1996 CONAB estimated that 2 million MT of rice were in governmentcontract storage facilities (MERCOARROZ, May 30, 1996). Maintaining the quality ofrice in government storage is a major problem. In 1993 and 1994, rice worth severalmillion dollars was ruined due to inadequate storage facilities. As a result of this, the

THE MERCOSUR RICE ECONOMY
49
government instituted mandatory measures to monitor government stocks stored inprivate facilities.
Tax policies have perhaps had the largest impact on the Brazilian rice economy.Brazilian taxes are high and regressive and lack uniformity across states and economicsectors. There are over 60 separate taxes. A major goal of the Cardoso administra-tion is to simplify the current tax code. Agriculture pays a disproportionately higherlevel of taxes than manufacturing. About one-third of the value of the market basketof basic foods is composed of taxes. Fochezatto and Mattuella (1995) have estimatedthat 42% of the retail price of rice is composed of taxes (see Tables 21 and 22). As aresult, many business decisions are based on their tax consequences, e.g., millers shiprough rice out of Rio Grande do Sul to mill in other states in order to avoid high statemilling taxes.
Brazil has several policies that primarily affect non-MERCOSUR rice imports.After February 28, 1995, all rice imports to Brazil were payable in cash only. Importsto the northeast were excluded from this policy. This measure was intended toexclude imported rice, which is viewed as having an unfair advantage by theMERCOSUR rice industry, which cannot offer liberal payment terms. Another policythat restricts non-MERCOSUR imports is the application of a 25% Merchant Marinetax on the freight rates of all imports outside the MERCOSUR. Brazil also has anti-subsidy policies that can be used to counter the effects of subsidized imports.
Argentina
From the end of World War II until the early 1990’s, Argentina followed asystematic anti-rural policy in which rural infrastructure was neglected and agriculturalexports were taxed in order to support macroeconomic and industrial import-substitu-tion policies. Export taxes on agricultural commodities were as high as 25% of theworld price and accounted for as much as 20% of government revenues. The agricul-tural sector was further taxed through a perpetually overvalued peso. The governmentregulated internal rice prices and exports through the Junta de Granos (NationalGrain Board). This forced the agricultural sector, which is highly export dependent, tobecome highly competitive by keeping capital investment and variable costs to aminimum.
Since the early 1990’s, the Junta de Granos has been privatized, export taxeshave been rescinded, the peso has been closely tied to the dollar, and both federaland provincial concessionary credit is no longer available. Tax levels, although muchlower than in Brazil, are still relatively high and include fuel taxes, public utility servicetaxes and value added taxes, as well as taxes on other forms of consumption. In 1992the government began a tax rebate program on exported rice, which is the onlygovernment program that is a direct subsidy to the rice industry. This amounted toabout 2.5% of FOB value. On March 1, 1995, however, this program was discontin-ued.
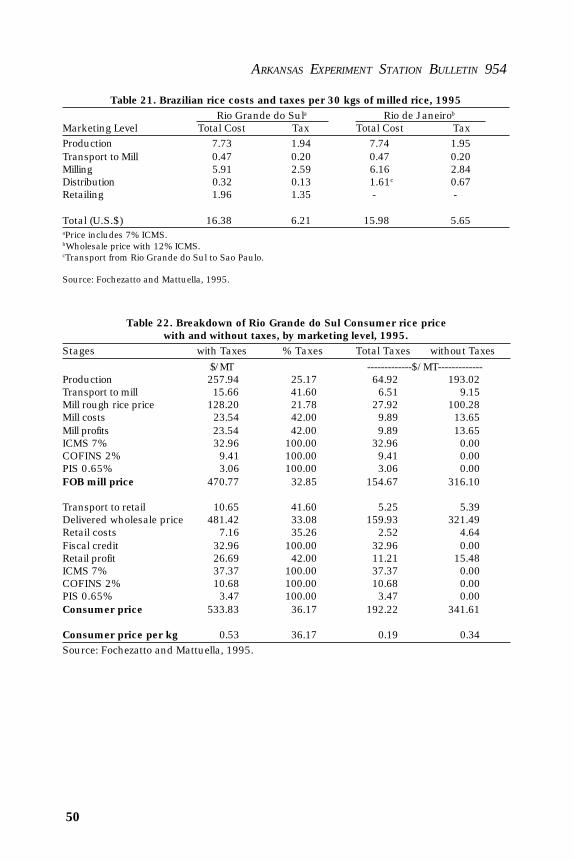
ARKANSAS EXPERIMENT STATION BULLETIN 954
50
Table 21. Brazilian rice costs and taxes per 30 kgs of milled rice, 1995Rio Grande do Sula Rio de Janeirob
Marketing Level Total Cost Tax Total Cost TaxProduction 7.73 1.94 7.74 1.95Transport to Mill 0.47 0.20 0.47 0.20Milling 5.91 2.59 6.16 2.84Distribution 0.32 0.13 1.61c 0.67Retailing 1.96 1.35 - -
Total (U.S.$) 16.38 6.21 15.98 5.65aPrice includes 7% ICMS.bWholesale price with 12% ICMS.cTransport from Rio Grande do Sul to Sao Paulo.
Source: Fochezatto and Mattuella, 1995.
Table 22. Breakdown of Rio Grande do Sul Consumer rice pricewith and without taxes, by marketing level, 1995.
Stages with Taxes % Taxes Total Taxes without Taxes
$/MT -------------$/MT-------------Production 257.94 25.17 64.92 193.02Transport to mill 15.66 41.60 6.51 9.15Mill rough rice price 128.20 21.78 27.92 100.28Mill costs 23.54 42.00 9.89 13.65Mill profits 23.54 42.00 9.89 13.65ICMS 7% 32.96 100.00 32.96 0.00COFINS 2% 9.41 100.00 9.41 0.00PIS 0.65% 3.06 100.00 3.06 0.00FOB mill price 470.77 32.85 154.67 316.10
Transport to retail 10.65 41.60 5.25 5.39Delivered wholesale price 481.42 33.08 159.93 321.49Retail costs 7.16 35.26 2.52 4.64Fiscal credit 32.96 100.00 32.96 0.00Retail profit 26.69 42.00 11.21 15.48ICMS 7% 37.37 100.00 37.37 0.00COFINS 2% 10.68 100.00 10.68 0.00PIS 0.65% 3.47 100.00 3.47 0.00Consumer price 533.83 36.17 192.22 341.61
Consumer price per kg 0.53 36.17 0.19 0.34Source: Fochezatto and Mattuella, 1995.
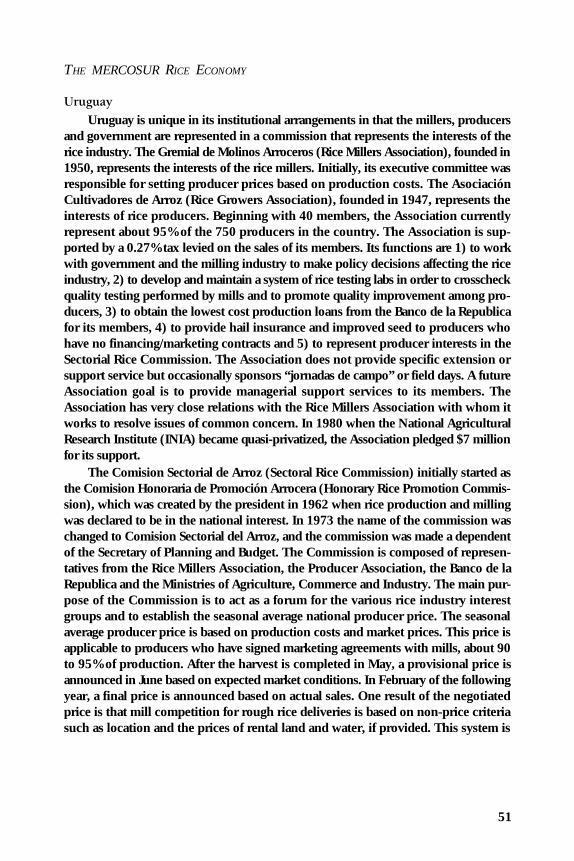
THE MERCOSUR RICE ECONOMY
51
Uruguay
Uruguay is unique in its institutional arrangements in that the millers, producersand government are represented in a commission that represents the interests of therice industry. The Gremial de Molinos Arroceros (Rice Millers Association), founded in1950, represents the interests of the rice millers. Initially, its executive committee wasresponsible for setting producer prices based on production costs. The AsociaciónCultivadores de Arroz (Rice Growers Association), founded in 1947, represents theinterests of rice producers. Beginning with 40 members, the Association currentlyrepresent about 95% of the 750 producers in the country. The Association is sup-ported by a 0.27% tax levied on the sales of its members. Its functions are 1) to workwith government and the milling industry to make policy decisions affecting the riceindustry, 2) to develop and maintain a system of rice testing labs in order to crosscheckquality testing performed by mills and to promote quality improvement among pro-ducers, 3) to obtain the lowest cost production loans from the Banco de la Republicafor its members, 4) to provide hail insurance and improved seed to producers whohave no financing/marketing contracts and 5) to represent producer interests in theSectorial Rice Commission. The Association does not provide specific extension orsupport service but occasionally sponsors “jornadas de campo” or field days. A futureAssociation goal is to provide managerial support services to its members. TheAssociation has very close relations with the Rice Millers Association with whom itworks to resolve issues of common concern. In 1980 when the National AgriculturalResearch Institute (INIA) became quasi-privatized, the Association pledged $7 millionfor its support.
The Comision Sectorial de Arroz (Sectoral Rice Commission) initially started asthe Comision Honoraria de Promoción Arrocera (Honorary Rice Promotion Commis-sion), which was created by the president in 1962 when rice production and millingwas declared to be in the national interest. In 1973 the name of the commission waschanged to Comision Sectorial del Arroz, and the commission was made a dependentof the Secretary of Planning and Budget. The Commission is composed of represen-tatives from the Rice Millers Association, the Producer Association, the Banco de laRepublica and the Ministries of Agriculture, Commerce and Industry. The main pur-pose of the Commission is to act as a forum for the various rice industry interestgroups and to establish the seasonal average national producer price. The seasonalaverage producer price is based on production costs and market prices. This price isapplicable to producers who have signed marketing agreements with mills, about 90to 95% of production. After the harvest is completed in May, a provisional price isannounced in June based on expected market conditions. In February of the followingyear, a final price is announced based on actual sales. One result of the negotiatedprice is that mill competition for rough rice deliveries is based on non-price criteriasuch as location and the prices of rental land and water, if provided. This system is

ARKANSAS EXPERIMENT STATION BULLETIN 954
52
most dominant in the eastern production zone. Producers in the north and north-central production areas (many of them Brazilian) are less likely to be a part of thissystem.
In addition to the average seasonal price, the marketing contract between millersand producers typically stipulates that the mill is to provide the producer with a 180-day production loan. Financing is provided by the Banco de la Republica but isguaranteed by the mill. The Banco de la Republica is a government bank that lends atmarket interest rates to the private sector. After harvest the account is closed, and themill pays the loan and debits the producer’s account.
Since 1980, Uruguay has had a tax rebate program on rice exports. In 1994 therebate was set at $0.38/50 kg of milled rice. The rebate has been as high as $1.44.Rebate levels are set according to political and market conditions and budgetaryconsiderations.
RESEARCH
Brazil, Argentina and Uruguay have sophisticated national rice research pro-grams. In Brazil, the state of Rio Grande do Sul is responsible for much of theirrigated rice research. Currently, the research programs in Uruguay and Rio Grandedo Sul are largely producer supported. Historically, the role of these programs was toincrease yields and lower costs and to adapt seed and production practices to localsoil types and climatic conditions. Seed stocks have come from the United States andCGIAR (Consultative Group on International Agricultural Research) Institutions.
Brazil
Brazilian rice research is primarily conducted by two public institutions, EmpresaBrasileira de Pesquisa Agropecuaria (Brazilian Institute for Agricultural Research) orEMBRAPA and the Instituto Rio Grandense do Arroz (The Rio Grande do Sul RiceInstitute) or IRGA. EMBRAPA, an arm of the Ministry of Agriculture, is responsiblefor coordinating the co-operative agricultural research system, which employs 2100research scientists in 40 field units and administers an annual budget of approximately$200 million. EMBRAPA is wholly funded by the federal government. The main goalof EMBRAPA is to generate and promote scientifically and technologically basedproduction with an emphasis on sustainability, the well-being of Brazilian society, therational use of national resources and environmental protection (EMBRAPA, un-dated). EMBRAPA tests technology from other parts of the world for its appropriate-ness in Brazil and transfers generated technology to other developing nations, espe-cially to Latin America and Africa.
EMBRAPA’s upland rice research is conducted by the Centro Nacional de Pesquisade Arroz e Feijao (National Center for Rice and Bean Research) in the west-centralstate of Goias, and its irrigated rice research is conducted by the Centro de Pesquisa

THE MERCOSUR RICE ECONOMY
53
Agropecuaria de Clima Temperado (Temperate Climate Agricultural Research Center)in Pelotas, Rio Grande do Sul.
IRGA is the rice research arm of the state of Rio Grande do Sul and was the firstinstitution to offer technical assistance to the industry. IRGA has 36 extension teamsdistributed throughout the rice production areas, covering 106 municipalities. Re-search is conducted in its five regional research centers. IRGA is supported byproducers through a checkoff system in which 0.12% of producer receipts go toIRGA. The main goals of IRGA are to develop appropriate technologies for thestate’s irrigated rice industry, to provide technical assistance and extension, to gener-ate rice situation and outlook reports and to store CONAB stocks. Specific researchgoals are to increase production efficiency, modernize production systems, train tech-nical personnel, develop a production data base, conduct joint studies with the co-operative sector, produce 500 MT of improved rice seed, improve soil analysiscapabilities and the technological levels of their research equipment and developimproved irrigation and drainage systems. Current research projects include develop-ing cultivars that have a shorter growing period, are resistant to cold and disease,need less water, are shorter in stature and have better milling characteristics. Much ofIRGA’s research has been focused on releasing high-yielding tropical cultivars appro-priate for the temperate climate of Rio Grande do Sul. Plant material for thesevarieties originated in the International Center for Tropical Agriculture (CIAT) via theInternational Rice Research Institute (IRRI).
Argentina
Rice research is primarily performed by the Instituto Nacional de TecnologiaAgropecuaria (National Institute of Agricultural Technology), or INTA, which wascreated in 1956, and a recently formed industry promotion group, the Comision Pro-Mejoramiento del Cultivo de Arroz (Commission for the Improvement of Rice Cultiva-tion), or Proarroz. INTA is the autonomous experiment station system of the Secre-tary of Agriculture, Fisheries and Food (SAPyA). The INTA system consists of 42experiment stations, 200 extension units and 13 research institutes. Research andextension are integrated at the experiment station level. The experiment stations aregrouped into 15 regions. Experiment stations focus their research on agriculturalactivities that have a major economic impact in their region. Prior to 1993 INTA wassupported by agricultural exports taxes. Currently, the system is supported by importtaxes.
INTA’s research and extension is intended: 1) to expand agricultural productionso as to improve both internal and external market supplies without detriment tonatural resources, 2) to diversify both domestic production and export markets geo-graphically, 3) to place more emphasis on value-added products, 4) to promotesustainable production systems, 5) to assure that the benefits of technological changeare accessible to all, particularly low-income sectors and 6) to improve the quality ofrural life (INTA, 1994).

ARKANSAS EXPERIMENT STATION BULLETIN 954
54
Rice research and extension in Argentina takes place at regional centers in EntreRios and Corrientes but is primarily conducted at the experiment station in Concepcióndel Uruguay, Entre Rios. Research is directed toward seed improvement, improvedmanagement practices, pest and disease control and screening rice varieties sent fromCIAT via IRRI for appropriateness in Argentinean production areas. INTA has re-cently developed a higher-yielding American-type cultivar known as H144 or DonJuan, which will be ready for commercial production for the 1995/96 crop year. Therationale for Don Juan is to make American-type varieties higher yielding and thusmore competitive with tropical varieties. This should increase the supply of American-type rice available for high quality markets, which is part of industry strategy todiversify away from the Brazilian market.
Proarroz is a non-profit commission dedicated to serving the rice industry. The38 members of Proarroz include representatives from private industry, co-operatives,producer associations and the provincial government of Entre Rios. The mission ofProarroz is 1) to conduct agronomic and economic research, 2) to disseminate infor-mation to the rice industry, 3) to lobby on behalf of the rice industry, 4) to solve riceindustry problems and 5) to promote rice consumption (Proarroz, December, 1994).Proarroz participates in agronomic research primarily by channeling funds to INTAfor specific projects of interest. Proarroz recently donated $50,000 to INTA toperform research oriented toward genetic improvement; weed, insect and diseasecontrol; crop rotation practices; and no-till planting.
Uruguay
The Instituto Nacional de Investigación Agropecuaria (INIA) is the primary agri-cultural research institution and is composed of five national research stations. Riceresearch began in the eastern research station, located in the eastern rice productionregion (department of Treinta y Tres) in 1970 and continues today to be the primaryrice research institution. The eastern rice research station is staffed by 14 full-timeprofessionals. In addition, rice research is conducted at one other research station and15 experimental sites scattered throughout the east, north and north-central produc-tion regions. INIA’s funding comes from a 0.4% tax levied on producer sales, amatching amount from the government and internal institutional revenues. INIA isdirected by a board composed of two members appointed by the Ministry of Agricul-ture and two producer representatives. INIA research goals include 1) improving theefficient use of seeds and seeding density and the use of fertilizers and other inputs inthe three distinct production zones, 2) evaluating new seeding methods — directseeding or with reduced labor input and 3) estimating the costs of various productionsystems.
Rice research is conducted under the Programa Nacional de Investigación enArroz (National Rice Research Program). The rice breeding program began in 1974.

THE MERCOSUR RICE ECONOMY
55
In addition to its research, INIA disseminates information to producers through itsjornadas de campo. A major goal of the program is to create new American-typecultivars that are pest resistant, surpass Blue Belle in yields and can be planted latewithout detriment to yields (short-cycle). INIA has recently bred two American-typecultivars, Yerbal and Tacuari, which are already in commercial production. In the1995/96 crop year these were planted on 15% of area and in 1996/97 are expectedto be planted on 30% of area. Yerbal and Tacuari are better tasting that IRGAvarieties but have higher yields than traditional Blue Belle varieties. It is anticipatedthat these newer varieties will be planted in the eastern production areas, which aremore susceptible to cold. Tacuari seed is distributed by a consortium of nine seedcompanies who control 90% of the market. Although these firms have exclusive rightsto the seed, they must provide the seed to all producers who want it. Royaltiesreceived by INIA are plowed back into the rice program. Japonica cultivars that havegood production potential and can be marketed in alternative markets are also beingbred. Uruguay has been certified by the Japanese government to export to Japan.
Prior to field trials, all genetic improvement research is conducted in Treinta yTres. Field trials are conducted in the eastern, northern and north-central productionzones. INIA’s genetic base is obtained from the United States and CIAT. The mostpromising genetic materials are planted in larger fields at the regional level by produc-ers. The development of Yerbal and Tacuari has the same rationale as that for INTA’sDon Juan: diversification of export markets.
SUMMARY
Due to recent reforms in domestic policies and regional integration, intra-regionaland extra-regional MERCOSUR rice trade has expanded rapidly in the 1990’s. Spe-cifically, a decline in government support to the Brazilian rice sector has causedimport demand to grow to 1.4 million MT in 1995, 2 million MT in 1996 and morethan 2 million MT in 1997. The increase in Brazilian import demand, zero intra-MERCOSUR tariffs and more favorable domestic agricultural policies have causedproduction in Argentina and Uruguay to double since 1990. Argentina and Uruguayhave also increased their exports to non-MERCOSUR Latin America, Africa and theMiddle East. Argentina and Uruguay are expected to increasingly compete in high-quality long-grain import markets currently dominated by the United States.
The above scenario has significantly impacted production to the detriment ofBrazil and to the benefit of Argentina and Uruguay. Changing consumer tastes, lowersupport prices and credit levels and increasing competition from alternative cropshave caused Brazilian upland rice production to steadily decline since the mid-1980s.Increasing Brazilian irrigated rice production, primarily in the state of Rio Grande doSul, made up for declines in the upland sector until recently. However, high producer

ARKANSAS EXPERIMENT STATION BULLETIN 954
56
debt levels in the industry and high production costs relative to contiguous productionareas in Argentina and Uruguay have caused a sharp decline in irrigated planted areain 1995 and 1996. Numerous Rio Grande do Sul producers have ceased productionin Brazil and begun producing rice in lower cost areas of Argentina and Uruguay as aresult. Argentina has a large supply of low-cost, high-quality rice land, primarily in thestate of Corrientes. Industry members have estimated that Argentina could easilytriple its current area of 224,000 ha with proper irrigation infrastructure. In compari-son to Argentina, Uruguay’s future increase in planted area will be more modest.
Currently, Argentina and Uruguay ship over 70% of their rice exports to Brazil,although export diversification is a major goal of both nations. Most exports are in theform of milled rice, although large farms, which are more likely to own dryingfacilities, are exporting rough rice in an effort to expand the potential number ofbuyers and increase revenues. Export sales are typically on a mill-to-mill basis, e.g., anUruguayan mill exports generic milled rice to an importing mill in Rio Grande do Sul.The milling industry in both Argentina and Brazil has excess capacity and is undergo-ing a downsizing trend. This should result in a smaller number of larger mills, whichshould make Argentinean rice more competitive in non-MERCOSUR markets in thefuture. Uruguay has only about 30 mills (in comparison to 105 in Argentina), whichtypically operate at higher capacity levels than Argentinean and Brazilian mills.
Upland rice, which is produced only in Brazil, is locally consumed or else shippedto the low-income areas of northeast Brazil. Upland rice is increasingly viewed asinferior to irrigated rice by middle- and upper-income groups. High-yielding tropicallong-grain indica rice is the most important irrigated variety produced in the region.Blue Belle and similar high-quality varieties are still produced in substantial quantitiesin Argentina and Uruguay. Blue Belle price premiums, however, have not generallycompensated for their lower yields. There is also an important market for DoubleCarolina in Argentina among high-income consumers.
Brazil is a high-volume, generally low-quality market. Although there are manyregional and local brands, large mills and distributors dominate urban markets. Dis-tributors blend rice from both MERCOSUR and non-MERCOSUR suppliers, forresale to retailers. The smaller Argentinean and Uruguayan retail markets are domi-nated by a small number of domestic brands. Blue Belle and similar varieties dominateUruguay and Argentina retail sales. Argentinean consumers, especially in BuenosAires, are the most demanding with respect to quality. As a result, Argentinean retailrice carries the highest prices, is more heavily advertised and has the most sophisti-cated packaging.
A major marketing problem in the region is generally poor transportation. This isdue to lack of investment and maintenance at the national level and historically poorintegration between the transportation systems of the MERCOSUR nations. As aresult of under-utilized inland water transportation systems and lack of gauge unifor-

THE MERCOSUR RICE ECONOMY
57
mity and integration in the railroad system, most rice moves by truck. Improvement ofthe transportation system is an important regional goal. In improving the MERCOSURtransportation system, major emphasis will be placed on improving the Paraná-Uruguay inland barge system, which should be a key factor in lowering the cost ofmoving bulk commodities.
Brazil continues to support producers with minimum price and subsidized creditprograms; however, these programs lack effectiveness due to substantially reducedbudgets. Brazil also prohibits extended credit on rice imports on non-MERCOSURimports to all regions except the northeast. This credit policy is seen as an aid to theMERCOSUR rice industry, which operates on a cash and carry basis due to highfinancial costs. Argentina has no specific rice programs. Uruguay has a partial taxrebate program, but the most important policy instrument is an average seasonalproducer price that is similar to the pooled price of the Canadian Wheat Board. Acommission composed of miller, producer and government representatives sets theprice. Possibly the most important regional policy is the external tariff on rice imports,now set at 20%.
Existing rice research institutions are sophisticated and well-funded. Althoughnational governments continue to privatize, which has strong political backing in theregion, agricultural research continues to receive government funding. In Brazil andUruguay money from producer checkoff systems is an important source of funds forrice research. An important component of Argentinean and Uruguayan rice researchprograms is the development of higher-yielding Blue Belle varieties, which can matchtropical varieties in yield. Greater production of high-yielding Blue Belle varieties isseen as a key to diversifying away from the Brazilian export market.
Argentinean and Uruguayan rice production and exports should continue toexpand rapidly over the next decade because of high international rice prices, produc-tion cost arbitrage (which causes Brazilian producers to cease production in RioGrande do Sul and begin producing in Argentina and Uruguay) and declining millingand transportation costs in relation to its major competitor for import markets, theUnited States. Brazilian production, however, is likely to continue to contract in theshort-run as producer debt remains a problem, competition from competing cropsremain strong and Brazil continues to back away from producer support programs.
LITERATURE CITED
Auxiliadora de Carvalho, Maria. 1994. Estabilizacão dos Precos Agricolas no Brasil: A Politicade Garantia de Precos Minimos. Instituo de Economia Agricola. Colecão Estudos Agrícolas.Saõ Paulo.
Bierlen, Ralph, Eric J. Wailes and Gail L. Cramer. 1996a. The Law of One Price andMERCOSUR Rice Markets. Dept. Of Agric. Econ. and Rural Soc., Univ. of Arkansas,Fayetteville, Arkansas.
ARKANSAS EXPERIMENT STATION BULLETIN 954
58
Bierlen, Ralph, Eric J. Wailes and Gail L. Cramer. 1996b. Domestic Reforms and RegionalIntegration: Can Argentina and Uruguay Increase Non-MERCOSUR Rice Imports.Agribusiness: An International Journal. 12(September/October, 1996):473-484.
Blandford, David. 1995. Regionalism versus Multilateralism: The World Trading System. Paperpresented at the Symposium on Economic Integration in the Western Hemisphere, SanJose, Costa Rica.
Bolsa de Cereales. 1993. Numbero Estadistico 1992/93. Buenos Aires.
Central Nacional de Pesquisa de Arroz e Feijeo. 1995. Panhilha de Custo de Producão deArroz. Goiana, Goias, mimeo.
Comision Arbitral de Entre Rios, Base de Comercialización para el Arroz Cascara. Undated.Paraná, Entre Rios, mimeo.
Comision Sectorial del Arroz. 1995. Arroz en el Uruguay: Cuadros Retospectivos y Evolucióndel Sector. Montevideo, mimeo.
Empresa Brasileira de Pesquisa Agropecuaria (EMBRAPA). Undated. EMBRAPA: Pesquisapara o Desenvolvimento Sustentado. Ministério do Agricultura e Reforms Agraria, Brasilia.
Federacão das Co-operativas de Arroz do Rio Grande do Sul Ltda (FEDARROZ). 1995.Relatorio de 1995. Porto Alegre, Rio Grande do Sul.
Fochezatto, Adelar, and Juviar Luiz Mattuella. 1995. Analise da Carta Tributaria IncidenteSobre as Cadeias Agroindustriais do Arroz e Soja.” Departamento de Economia Rural.Universidade Federal do Rio Grande do Sul, mimeo.
International Monetary Fund. 1996. International Financial Statistics. Washington, D.C.
Instituto Brasileiro de Geografia e Estatistica (IBGE), Rio de Janeiro, various production statistics.
Instituto Nacional de Technologia Agropecuaria (INTA). 1994. La Argentina su Agro y el.INTA. 76 Serie Documentos Institucionales. Buenos Aires, Argentina.
Instituto Rio Grandense do Arroz. 1995. Banco do Datos. Porto Alegre, Rio Grande do Sul.
Instituto Rio Grandense do Arroz. 1993. Diagnostico do Complexo Arroz dos Estados do RioGrande do Sul, Santa Catarina e Mato Grosso do Sul no Ambito do Mercosul. PortoAlegre, Rio Grande do Sul, mimeo.
Manzetti, Luigi. 1993. The Political Economy of MERCOSUR. Journal of InterAmerican Studiesand World Affairs 35:101-141.
Population Reference Bureau. 1996. World Population Data Sheet. Washington, D.C.
Proarroz. December, 1994. Actividades de Proarroz. Vol. II, No. 3., Concordia, Entre Rios,Argentina.
Secretaria de Agricultura, Pesca y Alimentos (SAPyA). 1993. El Mercado de Arroz: SituaciónActual y Perspectivas. Buenos Aires.
Schuh, G.E. and R. Junguita. 1993. Trade and Agricultural Development in the 1980s and theChallenges for the 1990s: Latin America. Agricultural Economics 8:377-400.
Sparks America del Sur. 1995. Esudio Sobre la Competitividad del Arroz en el MERCOSUR.Buenos Aires, mimeo.
Sparks America del Sur, MERCOARROZ. Buenos Aires, various issues.
Taylor, Timothy G., Martha Melendez, and Gary F. Fairchild. 1995. Preferential TradingArrangements in the Western Hemisphere. Journal of Food Distribution 15:9-19.

THE MERCOSUR RICE ECONOMY
59


The MERCOSUR Rice Economy
Ralph Bierlen Eric J. WailesResearch Associate Professor
Agri. Econ. and Rural Soc. Agri. Econ. and Rural Soc.University of Arkansas University of Arkansas
Gail L. CramerL.C. Carter Chair ProfessorAgri. Econ. and Rural Soc.
University of Arkansas
Agricultural Experiment StationFayetteville, Arkansas 72701

CONTENTS
INTRODUCTION ................................................................................................... 1
REGIONAL INTEGRATION AND NATIONAL ECONOMIC REFORMS ................. 4Regional Integration ......................................................................................... 4National Economic Reforms ............................................................................. 6
RICE PRODUCTION SECTOR .............................................................................. 7Irrigated Production Sector .............................................................................. 8Brazilian Upland Production .......................................................................... 12Area Trends ................................................................................................... 13Trends in Yield ............................................................................................... 16Production Trends ......................................................................................... 18Producer Prices and Costs ............................................................................. 19
MARKETING ....................................................................................................... 21Drying and Storage ........................................................................................ 21Milling and Byproducts .................................................................................. 23Grading ......................................................................................................... 31Transportation ............................................................................................... 31Retailing and Retail Prices .............................................................................. 34
MERCOSUR RICE TRADE .................................................................................. 37Internal Flows ................................................................................................ 37Intra-MERCOSUR Trade ................................................................................ 38External MERCOSUR Trade .......................................................................... 40
POLICY ............................................................................................................... 43Brazil ............................................................................................................. 43Argentina ...................................................................................................... 49Uruguay ........................................................................................................ 51
RESEARCH ......................................................................................................... 52Brazil ............................................................................................................. 52Argentina ...................................................................................................... 53Uruguay ........................................................................................................ 54
SUMMARY .......................................................................................................... 55
LITERATURE CITED ........................................................................................... 57

ARKANSAS EXPERIMENT STATION BULLETIN 954
64

THE MERCOSUR RICE ECONOMY
65