Rice-Based Biosystems Journal
114
-
Upload
khangminh22 -
Category
Documents
-
view
8 -
download
0
Transcript of Rice-Based Biosystems Journal


ABOUT THE COVERAs rice production is complex, all possible means to raise its productivity are needed to help ensure development in the rice sector. Rice technologies are being improved through research on drought, high-temperature, and lodging resistance; land leveling; organic nutrient sources; weed interference, and organic molluscicides. Alternative staples to rice are also studied for consumers to have healthier options on carbohydrate sources.
Instructions on manuscript submission can be found on page 102-105 of this issue. For more information, please visit www.philrice.gov.ph/grants/call-publication/.

Rice-Based Biosystems Journal
Published by:
VOLUME 6 • FEBRUARY 2020

EDITORIAL TEAM
JOHN C. DE LEON Chair, Plant Breeder and Executive Director, PhilRice
VETHAIYA T. BALASUBRAMANIAN Agronomist and Soil Scientist, Tami Nadu, India
CALIXTO M. PROTACIO Professor, Institute of Crop Science,
College of Agriculture and Food Science, UPLB
EUFEMIO T. RASCO Jr. Academician, National Academy of Science and Technology (NAST)
RODOLFO C. UNDAN Professor of Agricultural Engineering and former President,
Central Luzon State University (CLSU)
LUIS REY I. VELASCO Professor of Entomology, UPLB
RUBEN L. VILLAREAL Academician, NAST
MARILOU J. ANG-LOPEZ Assistant Professor VII, School of Technology, University of the
Philippines Visayas (UPV)
ROLANDO T. CRUZ Agronomist, Los Baños, Laguna. Philippines
EVELYN F. DELFIN Agronomist, Los Baños, Laguna. Philippines
JOSE E. HERNANDEZ Professor, Institute of Crop Science, College of Agriculture and Food
Science, UPLB
YOICHIRO KATO Assistant Professor Faculty of Agriculture, The University of Tokyo, Tokyo, Japan
TANGUY LAFARGE Crop Physiologist, Centre De Cooperation Internationale En Recherche Agronomique Pour Le Developpement (CIRAD), Montpellier, France
FELINO P. LANSIGAN Professor of Statistics and Dean, College of Arts and Sciences, UPLB
CEZAR P. MAMARIL Soil Scientist and Rice Farmer
MILAGROS R. MARTINEZ-GOSS Professor Emeritus, Institute of Biological Sciences, UPLB
TEODORO C. MENDOZA Professor, Institute of Crop Science, Scientist II, Retired College of Agriculture and Food Science, UPLB
AGNES C. ROLA Academician, NAST and Professor, College of Public Affairs, UPLB
GENARO O. SAN VALENTIN Soil Scientist and Senior Consultant, PhilRice
POMPE C. STA CRUZ Professor, Institute of Crop Science, College of Agriculture and Food Science, UPLB
BERNARDO D. TADEO President and CEO, Full Advantage Phils. International, Inc.
EMMANUEL R. TIONGCO Plant Pathologist and Senior Consultant, PhilRice
EDITOR-IN-CHIEFNORVIE L. MANIGBAS
Scientist I and Chief Science Research Specialist, [email protected] • [email protected]
EDITORIAL BOARD CHARISMA LOVE B. GADO-GONZALES
Editor, PhilRice
CONSORCIA E. REAÑO Statistical Editor, University of the Philippines – Los Baños (UPLB)
PRODUCTION TEAM GLADYS C. DINGLASANEditorial Assistant, PhilRice
CARLO G. DACUMOSLayout and Design, PhilRice
ADVISORY BOARD
ROEL R. SURALTAScientist II, Chief Science Research Specialist and Head,
Crop Biotechnology Center, PhilRice
NENITA V. DASAMEROChief Science Research Specialist, PhilRice
JONATHAN M. NIONESScientist I and Supervising Science Research Specialist, PhilRice
MANUEL JOSE C. REGALADOScientist I and Chief Science Research Specialist, PhilRice
INVITED REVIEWERS QUIRINO D. DELA CRUZProfessor, Central Luzon State University, Retired
DINDO KING M. DONAYREScientist I and Senior Science Research Specialist, PhilRice
EDWIN C. MARTINScientist I and Supervising Science Research Specialist, PhilRice
RICARDO F. ORGEScientist II and Chief Science Research Specialist, PhilRice

FULL PAPERENHANCING PHENOTYPIC AND GENETIC VARIABILITY IN DROUGHT TOLERANT 1 TRADITIONAL RICE VARIETY SALUMPIKIT THROUGH IN VITRO MUTAGENESISChristopher C. Cabusora, Rj D. Buluran, Jonathan. S. Concepcion, Gelyn D. Valida, John Oliver V. Orpilla, and Nenita V. Desamero
POTENTIAL OF Euphorbia hirta ETHANOLIC EXTRACT AS MOLLUSCICIDE 13 AGAINST Pomacea canaliculataChloe Nicole F. Sison, Uriel Grace F. Magtibay, Seth M. Zosa, Princess Jelian S. Fuertes, Aira M. Buenaventura, Erickson F. Del Mundo, and Angelo G. Cabic
INTERDEPENDENT TRAIT SELECTION AMONG RICE (Oryza sativa L.) 21 GENOTYPES FOR LODGING TOLERANCE UNDER DIRECT-SEEDED CONDITION THROUGH SEQUENTIAL MULTIVARIATE METHODOLOGIESPaul Nathaniel M. Marcelo, Rosemarie T. Tapic, Via Ann C. Marcelo, and Oliver E. Manangkil
POLLEN FERTILITY AND YIELD PARAMETERS OF RICE (Oryza sativa L.) 37 UNDER HIGH TEMPERATURE ENVIRONMENTSLowel V. Guittap, Pompe C. Sta. Cruz, Jose E. Hernandez, Edna A. Aguilar, and Norvie L. Manigbas
INTERFERENCE OF Commelina diffusa Burm. F. ON RICE GROWTH AND YIELD 49Maria Niña S. Cabiao, Jaime R. Quilantang, Ronaldo T. Alberto, and Dindo King M. Donayre
QUALITY CHARACTERISTICS AND CONSUMER ACCEPTABILITY OF RICE: ADLAI BLEND 57Henry F. Mamucod, Rosaly V. Manaois, Amelia V. Morales, Princess R. Belgica, and Marissa V. Romero
RICE FARMERS’ VULNERABILITY TO DROUGHT HAZARDS AND THEIR AUTONOMOUS 65 ADAPTATION STRATEGIES IN CENTRAL LUZON, PHILIPPINES Asa Jose U. Sajise, Alice B. Mataia, Digna O. Manzanilla, Leo Angelo L. Ocampo, and Christian P. Umali
LEARNING BY DOING: CHALLENGES AND OPPORTUNITIES 81 OF UNDERGRADUATE AGRICULTURE STUDENTS IN PHILRICE Leonilo V. Gramaje, Joanne D. Caguiat, Oliver E. Manangkil, Emily C. Arocena, Norvie L. Manigbas, Jayson C. Berto, Anna Marie F. Bautista, and Xavier Greg I. Caguiat
IMPACT OF LASER LAND LEVELING IN RAINFED LOWLAND AREAS IN ILOILO 87Elmer G. Bautista, Lea S. Caguiat, Rachelle Marie S. Martin, Virsus L. Galdonez, Joseph M. Sandro, and Jessel Jane R. Gabisay
RESEARCH NOTEEVALUATION OF ORGANIC NITROGEN SOURCES TO FURTHER INCREASE YIELD 95 IN AN ORGANIC-BASED NUTRIENT MANAGEMENT IN IRRIGATED PADDY SOILS Evelyn F. Javier, Corazon A. Santin, Annie E. Espiritu, and Xarin Xara G. Sto. Domingo
CONTENTS
Rice-Based Biosystems JournalVOLUME 6, FEBRUARY 2020


RICE-BASED BIOSYSTEMS JOURNAL (2020) 6: 1-11 1
Received: August 09, 2019 • Accepted: January 30, 2020
IntroductionTraditional rice varieties (TRVs) possess a wide
and diverse gene pools for traits useful in enhancing crop’s tolerance to drought, flooding, and salinity. Salumpikit is one of the most promising Philippine TRVs possessing a variety of tolerance to abiotic stresses. It is known for its high tolerance to drought stress and has been used as tolerant check for drought evaluations since 1970s (Datta and Seshu, 1982). However, this cultivar lacks desirable agronomic and grain traits acceptable to farmers for cultivation. Like other TRVs, it is late maturing and low yielding. It has open culm, short and non-dense panicle, and short-bold grains. Despite of its robust survival under drought, its undesirable traits make it less appealing and acceptable to farmers.
Induced mutation techniques in the past years have been used to improve crops, causing chromosomal or point mutations; changing the genetic and phenotypic composition of an organism (Sharma et al., 2013). Effects of physical mutagens is mostly breakage of the DNA double-strands, which increases in the potential of showing improved plant architecture and physiology (Fukai and Cooper, 1995). In vitro mutagenesis (IVM)
is a combined method of irradiation and tissue culture to improve the qualitative and quantitative traits in plants against various biotic and abiotic stresses (Xu et al., 2012). Technique is widely used because of its advantages including high mutation frequency of almost eight times higher than any other mutation techniques, uniformity of treatment, and disease-free plants. It also requires less space to handle populations (Nagatomi and Degi, 2009). Plants generated from IVM can express both recessive and dominant mutations and fixation is rapid (Xu et al., 2012). Tissue culture in combination with physical or chemical mutagens is also extensively utilized to hasten generation and development of improved lines with desirable genotypes (Maluszynski et al., 1995).
This study utilized in vitro mutagenesis to enhance the phenotypic and genetic variability of Salumpikit to generate and develop improved breeding lines for drought stress tolerance with farmer and consumer acceptable agronomic traits.
Materials and MethodsMature seeds of the rice cultivar Salumpikit were
used to produce callus pieces for gamma irradiation
ENHANCING PHENOTYPIC AND GENETIC VARIABILITY IN DROUGHT TOLERANT
TRADITIONAL RICE VARIETY SALUMPIKIT THROUGH IN VITRO MUTAGENESIS
Christopher C. Cabusora*, Rj D. Buluran, Jonathan. S. Concepcion, Gelyn D. Valida, John Oliver V. Orpilla, and Nenita V. Desamero
Philippine Rice Research Institute (PhilRice), Science City of Muñoz, 3119 Nueva Ecija, Philippines*Corresponding Author: [email protected]
AbstractSalumpikit, an upland traditional rice variety originating from the Philippines, has high tolerance to drought
but has poor phenotype. In vitro mutagenesis (IVM), a technique of combining tissue culture and gamma irradiation, was used for this cultivar to induce genetic variability and to develop breeding lines with improved phenotypic acceptability in 2011 wet season. The activity resulted in enhanced genetic variability, which led to the identification of mutant lines with significant improvement in phenotypic agro-morphological traits exhibited during the crop’s vegetative, reproductive, and maturity stages. Of the 484 mutant lines generated from IVM activity, 53 (11%) improved plants were selected in reference to the wildtype. Genotypic variability assessment of the mutant population using simple sequence repeat (SSR) markers showed distinctness of the genetic composition of the mutants from the wildtype. The variability assessment of the mutants proved the efficacy of IVM in inducing variability and generating improved breeding lines from drought-tolerant Salumpikit, that can be used as novel gene donors in breeding rice adapted to rainfed-drought prone environments.
Keywords: In Vitro Mutagenesis, Wildtype, Mutants, Variation, Drought Tolerant, Genetic Diversity Index.
FULL PAPER

Enhancing Phenotypic and Genetic Variability
2 RICE-BASED BIOSYSTEMS JOURNAL (2020) 6: 1-11
in 2011 wet season. The phenotypic traits of the traditional variety, generation advance, and evaluation of the mutant population derived from Salumpikit is presented in the schematic diagram (Figure 1a-e). Selection of lines was based on the improved phenotypic acceptability including maturity, plant height, and panicle and grain traits.
Seed Preparation, Sterilization, and Callus Induction
Rough rice grains were dehulled using Satake rice tester (JLGJ2.5, SATAKE-Japan) and cleaned manually; removing broken, immature, and mix grains to maintain the purity of the genotype. Brown rice grains were sterilized with 50% (v/v) sodium hypochlorite (98% active ingredient), with agitation at 200 rpm for 30 minutes using Thermo Scientific MaxQ2000 orbital shaker (Thermo Scientific, Waltham, Massachusetts, USA). Seeds were then rinsed three times with sterilized distilled water. The procedure was repeated for another 30 min before blot dried in sterile petri plates inside the laminar
flow hood. The dried seeds were cultured in callus induction medium (CIM) containing Murashige and Skoog (MS) basal salts (Murashige and Skoog, 1975) supplemented with 1 mgml-1 each of naphthalene acetic acid, 2,4-dichlorophenoxyacetic acid, and 6-benzylaminopurine hormones; and hardened with 3 gL-1 agar (Pronadisa, Belman Laboratories, Quezon City, Philippines) and 2 gL-1 Phytagel (Sigma, Chemline Scientific, Quezon City, Philippines). A 30 ml culture media were dispensed in Gerber bottles and were sterilized in TOMY SX-7000 autoclave (Tomy Tech USA, California, USA) at 115 psi for 15 min at 115°C. The cultures were incubated in the dark at 25˚C±2˚C for two weeks until friable callus tissues were formed.
Callus Excision, Irradiation, and Regeneration
Callus produced from the scutellar tissues of the cultured seeds were excised aseptically under a pre-sterilized laminar flow hood (Hitachi, PCV Clean Bench) using sterile forceps and scalpel and were inoculated into petri dishes containing 20 ml of half
(d)(c)(b)(a)
Figure 1. Agro-morphological, panicle and grain traits of Salumpikit (A-D) and the generation advance and evaluation of the mutant lines (E): A. Tall and late maturing; B. Open culm angle; C. short-intermediate grains; D. Sparse unbranched panicles. Note: WS wet season, DS dry season.
(e)

Enhancing Phenotypic and Genetic Variability
RICE-BASED BIOSYSTEMS JOURNAL (2020) 6: 1-11 3
strength MS medium. The cultures were irradiated with 30 Gy dose of 60Co gamma rays at the Philippine Nuclear Research Institute, Quezon City. The irradiated callus tissues were sub-cultured in MS regeneration medium (RM) within 24 h after irradiation, contained MS basal salts, and supplemented with NAA (0.5 mgml-1) and Kinetin (2 mgml-1). The cultures were incubated under light condition with 27˚C±2˚C temperature and 16 day/8-night h photo period for 4-6 weeks until shoots and roots were fully regenerated and developed. Plantlets were hardened for 3-5 days under laboratory condition and for 7 days under gradual sunlight exposure duration. Plantlets were then transplanted in the screen house for growing to maturity. The matured plants (IVM1) produced the seeds, which were harvested and comprised the IVM2 plant population and subjected to evaluation and selection.
Variability Evaluation of IVM2 Plant Population for Agro-morphological Traits
The IVM2 seeds harvested from each IVM1 plants were established panicle-to-a-row under field condition for agro-morphological trait variability evaluation. Each plant was characterized at vegetative and reproductive stage based on the characteristics published in the Descriptors for Rice (Bioversity, 2007). Descriptive statistics including frequency distribution, histograms, skewness and kurtosis (De Carlo, 1997), diversity index by Shannon-Weaver Index (Shannon and Weaver, 1949; Hutcheson, 1970; Redfern et al., 2012), and cluster analysis were used to describe phenotypic variations. Plants with improved agro-morphological traits compared with the wildtype were selected and evaluated for uniformity and stability up to IVM4 generation.
n Diversity = ∑ Pi log (Pi) i=1
where*: D = diversity index
Pi = fraction of the entire population made up of variation i (proportion of variant i relative to total population size)
n = population size
Evaluation for Grain Size and Shape
To assess the diversity of the selected mutant lines for grain size and shape, a sample of 10 milled rice grains were measured lengthwise from tip to base to determine the grain length (GL) and crosswise to determine the grain width (GW). Measurements were taken using the C3 digital caliper (Chicago Brand, Fremont, California). Grain shape (GS) was determined by getting the ratio of GL and GW.
Classification of grain size and shape were based on the NCT Manual (2000).
Genetic Diversity Analysis of Selected Lines Using SSR Markers
Leaf samples were collected for DNA extraction at seedling stage. The extraction of DNA was conducted using the established extraction method of Philippine Rice Research Institute (2007). There were 93 polymorphic SSR markers used to assess the diversity of the selected mutants in comparison with the wildtype. These SSR markers were randomly selected across the 12 chromosomes of the rice genome in a given genomic interval of 5 Mb.
Statistical Analysis
Descriptive statistics and cluster analysis on phenotypic traits were used for each trait evaluated using Statistical Tool for Agriculture (STAR) version 2.0.1 (2013, IRRI, Philippines). Histograms of quantitative traits were generated using the IBM SPSS Statistics 20 (IBM, New York, USA). Clusters were analyzed by simple matching coefficient using NTSYS version 2.0 (Exeter Software, New Delhi, India).
Results and DiscussionIn Vitro Culture Response in Callus Induction and Regeneration Medium (Figure 2)
Of the 120 dehulled rice grains cultured in callus induction medium in 2011 wet season, 53 (44.2%) seeds produced callus (Table 1) of which 34 (64%) callus pieces were irradiated with 30 Gy gamma rays. Regeneration efficiency of 41.2% (14 calli) were obtained and each of the calli regenerated at most two plantlets. Twenty-one IVM1 plants were regenerated with 10 (48%) plants surviving maturity under greenhouse condition. From the 10 IVM1 plants regenerated and survived to maturity, 484 IVM2 plants were generated.
Figure 2. A. Callused seeds, 2 weeks in CIM; B. Friable-embryogenic callus; C. Regenerated plantlets.

Enhancing Phenotypic and Genetic Variability
4 RICE-BASED BIOSYSTEMS JOURNAL (2020) 6: 1-11
Table 2. Frequency distribution and diversity index of the IVM2 population for 6 morphological traits at vegetative and reproductive stages, 2012 wet season, PhilRice.
No. Traits Classes WT IVM2 plants, N=484
SWI Evenness Diversity*
no. %Vegetative stage
1 Blade angleErect 107 22.1
2.98 0.48 moderateDroopy √ 377 77.9Horizontal 0 0.0
Reproductive stage
2 Culm angle
Erect 123 25.4
2.68 0.43 moderateIntermediate 54 11.2Open √ 132 27.3Spreading 4 0.8
3 Flag leaf angle
Erect 53 11.0
4.09 0.67 highIntermediate 414 85.5Horizontal 9 1.9Descending √ 3 0.6Mixture 5 1.0
4 Secondary branching
Absent √ 409 84.5
3.94 0.64 moderateLight 4 0.8Heavy 56 11.6Clustered 15 3.1
5 Panicle exsertion
Well √ 140 28.9
4.43 0.72 highModerately 336 69.4Just 1 0.2Partly 1 0.2Enclosed 6 1.2
6 Panicle axisStraight 14 2.9
1.14 0.18 lowDroopy √ 470 97.1
WT – wild type SWI Shannon-Weaver Diversity Index*Perere et al, 2012
Table 1. Seed culture response of Salumpikit in CIM and RM, 2011 WS, PhilRice.
Response Percent/No.
No. of seed cultured (SC) 120No. of callused explant (CE) 53% CF (CE/SC) 44.2No. of Irradiated Calli (IC) 34
Callus with regenerationNo. 14%/CE 26.4%/IC 11.7
No. of plants regenerated 21No. of regenerant/callus 2IVM1 plants survived to maturity
No. 10%/PR 47.6
No. IVM2 plants 484
Variability Evaluation of IVM2 Plant Population for Agro-morphological Traits
The 484 IVM2 plants were generated and evaluated for variability in 12 morphological traits at vegetative and reproductive stages (Table 2). At vegetative stage, the mutants were variable in comparison with the wildtype, in which 78% had droopy blade angle. The mutants and the wildtype were similar in 5 other
traits: leaf blade pubescence, leaf blade color, basal leaf sheath color, ligule color, and collar color. At reproductive stage, variation was observed in 6 (50%) traits; culm angle, flag leaf angle, panicle secondary branching, exsertion, and axis. Majority (27%) of the mutant plants had open culm angle similar with the wildtype. Majority (86%) of the IVM2 plants had intermediate flag leaf compared with the descending angle of the wildtype, and the remaining 14% had either erect, horizontal, or mixed flag leaf angle. Majority (85%) of the mutants had panicle with secondary branching compared with the non-branching panicle of the wildtype. Fifteen percent of the IVM2 plants had either light, heavy, or clustered panicle secondary branching (Figure 3). More variations were observed in panicle exsertion of the mutants. From the well-exserted panicles of the wildtype, four other variations were observed. Moreover, 97% of the mutants had droopy panicle axis, similar to the wildtype, while 3% had straight panicle axis. The mutants and the wildtype had compact panicle type.
In general, the derived mutants were variable in 7/12 (58%) morphological traits evaluated. High diversity was observed for flag leaf angle and panicle exsertion with a diversity index of 0.67 and 0.72,

Enhancing Phenotypic and Genetic Variability
RICE-BASED BIOSYSTEMS JOURNAL (2020) 6: 1-11 5
respectively. Moderate diversity was observed from leaf blade angle, culm angle and panicle secondary branching, and low diversity in panicle axis.
Variability Evaluation for Agronomic Traits
Mutant population was evaluated for variability in 5 agronomic traits: number of tillers at maximum tillering, days to heading, plant height at maturity, culm length, panicle length, and number of productive tillers (Table 3). Majority (96%) of the mutants was early maturing, while 4% was comparable with the wildtype. Comparable plant height with the wildtype was observed in 39% of the mutant population, while 18% had shorter plant height. Majority (41%) of the mutant plants had culm length comparable with the wildtype. Majority (67%) of the mutant plants had panicles shorter than the wildtype, while the remaining 33% had either comparable or longer panicles. Less tiller production was observed in the majority (66%) of the mutant plants, while the remaining 34% had either comparable or more tiller production.
A positive skewness (1.080) value was obtained from days to heading (Figure 4a) indicating that most of the mutants matured earlier in reference with the population mean (100 DAS). A bimodal histogram was obtained for plant height (Figure 4b) and culm length (Figure 4c) indicating that these traits have two distinct modes (most frequent occurring value): 95 cm and 151 cm for height and 75 cm and 125 cm for culm length. Histogram of panicle length (Figure 4d) and productive tiller (Figure 4e) were skewed to the left (negative skewness value) indicating that most (49% and 82%, respectively) of the mutants are higher than the population mean. Negative kurtosis was observed for days to heading (-0.581) indicating a platykurtic (more flat) distribution, which shows that no extreme values for heading days was observed and that the values are spread around the mean. Leptokurtic kurtosis was also observed for panicle length (1.897) and productive tiller (3.547) indicating that heading day values are concentrated near the population mean (Figure 4a-e). Variance Statistics of the mutant
Figure 3. Variation in panicle secondary branching of the mutant lines in comparison with the wildtype.
Table 3. Frequency distribution of the IVM2 population for the five agronomic traits, 2012 wet season, PhilRice.
No. Agronomic Trait WT Distribution of IVM2 Plants, N=484
Class* no. %
1
Days to heading (DAS)
130
Earlier 465 96.1Comparable 19 3.9Later 0 0.0
2
Plant height at maturity (cm)
151
Smaller 206 42.6Comparable 192 39.7Taller 86 17.8
3
Culm length (cm)
121
Shorter 171 35.3Comparable 197 40.7Longer 116 24.0
4
Panicle length (cm)
30
Shorter 326 67.4Comparable 115 23.8Longer 44 9.1
5
Productive tiller (no.)
8
Lesser 320 66.1Comparable 44 9.1Higher 120 24.8
*Comparable = ±5% relative advantage in reference with the wildtype (WT)DAS – days after seeding
1mm 1mm 1mm 1mm

Enhancing Phenotypic and Genetic Variability
6 RICE-BASED BIOSYSTEMS JOURNAL (2020) 6: 1-11
Figure 4. A. Frequency distribution of the IVM2 mutant population for days to heading; B. Plant height; C. Culm length; D. Panicle length; E. Productive. F. Variation in plant height and maturity of the mutants in comparison with the wildtype, 2012 wet season, PhilRice, CES.
SalumpikitIVM2 Mutants
(a) (b)
(c) (d)
(e) (f)
population for the five agronomic traits, in comparison with the wildtype is presented in Table 4.
Cluster Analysis of the IVM2 Population Based on Agro-Morphological Traits
Cluster analysis by genetic distance using agronomic and morphological traits to determine the relationship of the mutants to the wildtype resulted in the generation of a Dendrogram with 12 major clusters (Figure 5). Cluster 1 consists of the wildtype,
Salumpikit, which was completely separated from the entire mutant population because of its distinct traits including spreading culm angle, droopy flag leaf, open panicle type, and no secondary branching. The cluster analysis indicated that the mutants were different from the wildtype in terms of agro-morphological characteristics. The remaining clusters were composed of the mutants that were further subdivided into several small clusters indicating which of the mutants were similar or different from one another. Of the 484

Enhancing Phenotypic and Genetic Variability
RICE-BASED BIOSYSTEMS JOURNAL (2020) 6: 1-11 7
Table 4. Variance statistics of the mutant population for the five agronomic traits.
Trait Mutant Lines (IVM2), N=484
Min-Max Range Mean StdDev CV Skwn Kurt
Heading days (DAS) 78-130 52 100 17 16.9 1.080 -0.581
Plant height (cm) 79-176 97 139 23 16.5 -1.074 -0.099
Panicle length (cm) 8-41 33 27 4 14.3 -0.366 1.897
Culm length (cm) 53-145 92 112 21 19.0 -1.203 0.236
Productive tillers (no.) 2-37 35 11 6 50.0 1.526 3.547Note: Min – minimum, Max – Maximum, StdDev – standard deviation, CV – coefficient of variation, Skwn – skewness, Kurt - kurtosis
Cluster 1 SalumpikitCluster 2 8 IVMCluster 3 22 IVM Cluster 4 2 IVM Cluster 5 6 IVM Cluster 6 3 IVMCluster 7 36 IVMCluster 8 4 IVMCluster 9 10 IVM Cluster 10 338 IVM Cluster 11 48 IVM Cluster 12 2 IVM
Figure 5. Dendrogram of the 484 IVM2 plants showing the genetic relationship with the wildtype based on morphological and agronomic traits, 2012 wet season.

Enhancing Phenotypic and Genetic Variability
8 RICE-BASED BIOSYSTEMS JOURNAL (2020) 6: 1-11
Mutant
Figure 6. Selected plants with improved phenotypic acceptability compared with the wildtype.
MutantSalumpikit
Table 5. Variance statistics of the uniformity and stability assessment (for two seasons) of the mutant population for agronomic traits.
Agronomic TraitMin-Max
Range Mean StDev CV
13DS 13WS 13DS 13WS 13DS 13WS 13DS 13WS 13DS 13WS
IVM2 IVM3 IVM2 IVM3 IVM2 IVM3 IVM2 IVM3 IVM2 IVM3Days to Heading (DAS) 80-96 80-93 16 13 87 87 4.4 4.3 5.0 5.0
Plant height (cm) 86-101 87-101 15 14 94 94 3.0 3.1 3.2 3.3
Culm length (cm) 66-81 67-81 15 14 74 74 3.0 3.1 4.0 4.2DS dry season, WS wet season Min minimum, Max maximum, StDev standard deviation, CV coefficient of variance
plants evaluated, 54 (11%) plants were improved in 11/12 (78%) agro-morphological traits evaluated.
Based on the agronomic and morphological traits, 53 (11%) plants were selected with improved traits and good phenotypic acceptability compared with the wildtype (Figure 6).
The selected lines were planted in 2013 dry season (IVM3 generation) and 2013 wet season (IVM4 generation) for uniformity and stability assessment. Results showed that lines were already uniform and stable (Table 5). Uniformity evaluation resulted in the selection of 39 lines based on phenotypic acceptability.
Evaluation for Grain Size and Shape
Thirty-nine mutant lines were evaluated on grain size and shape. Reduced grain length by 13% (0.8 mm) to 20% (1.3 mm) was observed among 69% (27 lines) of the population shifting the grain classification from medium to short-sized grains (Figure 7a). The remaining lines had either retained the medium grain length or had increased, shifting the classification to long grains. In general, the grain shape (Figure 7b)
of the selected mutants was improved from short to intermediate and slender, which is attributed to the increased in grain width (Figure 7c). Two (5%) lines had the acceptable grain size and shape of long and slender.
Genetic Diversity Assessment of the IVM Lines in Reference to the Wildtype
Leaf samples of 53 promising lines were collected for DNA extraction to assess their genetic variability in comparison with the wildtype. Genetic diversity of the IVM lines was evaluated in 2018 dry season using 93 simple sequence repeat (SSR) markers. Of these markers, 46 (52%) were polymorphic, 30 (32%) monomorphic, and 15 (16%) had no amplification.
There were 148 alleles amplified using polymorphic markers. The number of alleles per marker varied from two to five alleles, averaging to three alleles per locus. The Polymorphism Information Content (PIC) values ranged from 0.0357 to 0.4889. Genetic diversity index (GDI) based on the SSR markers ranged from 0.0357 to 0.5679 (Figure 8).

Enhancing Phenotypic and Genetic Variability
RICE-BASED BIOSYSTEMS JOURNAL (2020) 6: 1-11 9
Figure 7. Grain length (a), width (b), and shape (c) of the selected mutant lines in comparison with the wildtype.
Salumpkit
IVM-21
IVM-45
IVM-8
(a) (b)
(c)

Enhancing Phenotypic and Genetic Variability
10 RICE-BASED BIOSYSTEMS JOURNAL (2020) 6: 1-11
Figure 8. Polymorphism pattern obtained from the 46 SSR markers.
Figure 9. Cluster analysis by simple matching coefficient of the IVM-derived lines in reference with the wildtype, 2015.
Cluster analysis using Simple Matching Coefficient of 46 polymorphic SSR markers separated the mutant lines from the wild type; generating two major clusters with a similarity of 50%. Cluster 1 was composed of 4 mutant lines and the wildtype, indicating a 61% similarity. Cluster 2 was composed of the remaining 49 mutants with a 52% variability in reference with the wildtype. Seven (13%) mutant lines separated into individual sub-clusters, indicating that these lines are molecularly unique from the rest of the mutant lines. Of the 39 surviving lines, 3 (8%) lines clustered with the wildtype, and 36 (92%) were clustered separately (Figure 9).
Summary and DiscussionIn vitro mutagenesis of drought-tolerant traditional
rice variety, Salumpikit had induced mutations in 11 agro-morphological traits resulting in improved mutants with various combinations of desirable traits, which are important in rice crop improvement. Morphological traits of 39 (16%) mutant lines were observed during vegetative, reproductive, and maturity stage. These traits include leaf angle, culm angle, flag leaf angle, and panicle secondary branching. The mutants were also improved in terms of days to flowering, plant height, and number of

Enhancing Phenotypic and Genetic Variability
RICE-BASED BIOSYSTEMS JOURNAL (2020) 6: 1-11 11
yielding tillers. Phenotypic variability assessment also showed distinct diversity between the mutants and the wildtype. Furthermore, genotypic diversity assessment using SSR markers showed that the 39 selected IVM lines were distinctly different in reference with the wildtype. The result of this induced mutation strategy proved the efficiency of combining in vitro culture and gamma irradiation in inducing genetic variability leading to multiple mutations; thereby, improving phenotypic traits. The selected improved lines, once conferred to have retained the high drought tolerance as with the wildtype, can be used as gene donors for breeding rice genotypes adapted to rainfed-drought prone ecosystem.
AcknowledgmentThe authors wish to acknowledge the Philippine
Rice Research Institute (PhilRice) for funding the research. Credits are also given to Mr. Danilo J. Lalican of Crop Genetics and Plant Breeding Division, Crop Science Cluster, University of the Philippines Los Baños for introducing the cultivar to the Rainfed-Adverse Breeding Team of PhilRice. Acknowledgment is also due to the Philippine Nuclear Research Institute.
Literature CitedBioversity International (2007) Descriptors for wild and cultivated
rice (Oryza spp.)
De Datta S. K. Seshu, D.K (1982) Evaluating rices for drought tolerance using field screening and multilocation testing. Drought Resistance in Crops with Emphasis on Rice, IRRI Book.
De Carlo LT (1997) On the meaning and use of kurtosis. Psychological Methods 2(3): 292-307
Fukai S and Cooper M (1995) Development of drought-resistant cultivars using physio-morphological traits in rice. Field Crops Res 40: 67-86
Hutcheson, K (1970) A test for comparing diversities based on the Shannon formula. Journal of Theoretical Biology, 29: 151-154
International Research Institute, Standard Evaluation System for Rice, 5th edition
Maluszynski M, Szarenko I, and Sigurbjörnsson B (1995). Haploidyand mutation techniques. In Jain SM, Sopory SK & Veilleux RE (Eds.). In Vitro Haploid Production in Higher Plants 1: 67-930. Kluwer Academic Publishers, Dordrecht.
Murashige T and Skoog F (1962.) A revised medium for rapid growth and bio assays with tobacco tissue culture. Physiologia Plantarium 15: 473-497
Nagatomi S and Degi, K (2009). Mutation breeding of chrysanthemum by gamma field irradiation and in vitro culture. In Shu QY (Ed.). Induced Plant Mutations in the Genomics Era, Food and Agriculture Organization of the United Nations, Rome, pp 258-26
Perera AH, Drew CA, Johnson CJ (2012) Expert knowledge and its application in landscape ecology. Springer New York Dordrecht Heidelberg, London. ISBN 978-4614-1033-1, DOI 10.10007/978-1-4614-1034-8
Redfern SK, Azzu N, Binamira JS (2012) Rice in Southeast Asia: Facing risks and vulnerabilities to respond to climate change. Paper presented in FAO Workshop on Building Resilience for Adaptation to Climate Change in the Agriculture Sector, April 8, 2012
Sharma A, Singh SK, Sharma A, Singh SK (2013) Induced mutation- a tool for creation of genetic variability in rice (Oryza sativa L.). Journal of Crop and Weed, 9(1):132-138.2013. Induced mutation- a tool for creation of genetic variability in rice (Oryza sativa L.). Journal of Crop and Weed, 9(1):132-138
Shannon CE and Weaver W (1949) The Mathematical Theory of Communication. Urbana: University of Illinois Press
Xu L, Najeeb U, Naeem MS, Wan GL, Jin ZL, Khan F and Zhou WJ (2012). In Vitro Mutagenesis and Genetic Improvement, Technological Innovations in Major World Oil Crops, Vol. 2, DOI 10.1007/97-1-4614-0827-7_6, Springer Science+Business Media, LLC 2012


RICE-BASED BIOSYSTEMS JOURNAL (2020) 6: 13-20 13
POTENTIAL OF EUPHORBIA HIRTA ETHANOLIC EXTRACT AS MOLLUSCICIDE
AGAINST POMACEA CANALICULATAChloe Nicole F. Sison, Uriel Grace F. Magtibay, Seth M. Zosa, Princess Jelian S. Fuertes,
Aira M. Buenaventura, Erickson F. Del Mundo,* and Angelo G. Cabic Caloocan City Science High School, P. Sevilla Street, 10th Avenue Grace Park, Caloocan City, Metro Manila, Philippines
*Corresponding Author: [email protected]
Abstract Pomacea canaliculata (Golden apple snail) is one of the dominant rice pests in the Philippines due to the
huge losses in the annual rice production as these snails consume rice seedlings. Synthetic molluscicides are used to control Pomacea canaliculata, however, these molluscicides have negative impact in the environment. In this study, the potential of ethanolic extracts of tawa-tawa (Euphorbia hirta) as molluscicide against Pomacea canaliculata was evaluated. Euphorbia hirta leaves were extracted with 95% ethanol for 48 h under normal room temperature. Extracted material was then evaporated through rotary evaporator in 38±5oC and diluted to 2.8 ppm, 5.6 ppm, and 8.3 ppm concentrations. Golden apple snail was subjected to acclimatization for 10 days. Five set-ups were made: Experimental (T1, T2, and T3) and Controls (Positive and Negative). Twenty snails were allocated per set-up, which was then subjected to three trials at different time frames for precise results. Results showed that there is a high significant difference across treatments and controls. However, statistical analysis showed that concentrations 5.6 ppm and 8.3 ppm had p-value of 0.359 indicating that there is no significant difference between the two concentrations. Lethal dosages at 50% and 90% were calculated through Probit Analysis. Lethal dosage at 50% mortality of the snail population was found at 10.9 ppm concentration, while lethal dosage at 90% was recorded at 53.4 ppm. Euphorbia hirta possesses molluscicidal activity against Pomacea canaliculata. Higher concentrations of the solution leads to higher snail mortality.
Keywords: Pomacea canaliculata, Euphorbia hirta, Niclosamide, Molluscicidal Activity.
IntroductionGolden apple snail (Pomacea canaliculata or
GAS) is a dominant aquatic gastropod (Brito and Joshi, 2016) that originated from South America particularly in Argentina and Uruguay. From South America, it was introduced to other parts of the globe through aquarium trade in 1979 (Mochida, 1991; Halwart, 1994; Cowie, 2002; Joshi & Sebastian, 2006). It was introduced in Southeast Asian countries like Taiwan and Philippines as a potential food source for farmers in 1980s (Naylor, 1996). P. canaliculata can spread rapidly from agricultural areas to other areas through irrigation canals, flooding, and other natural water pathways where it may lead to serious ecosystem impact. Carlsson, Brönmark, and Hansson (2004) stated that “survey of natural wetlands in Thailand showed that high densities of the snail were associated with almost complete absence of aquatic plants, high nutrient concentrations, and high phytoplankton biomass, that is, a complete shift in both ecosystem state and function.”
The study of dela Cruz et al. (2001) showed that the most destructive stage is when the length of the shell is from 10 mm to 40 mm. Pomacea canaliculata
can live with or without water; burying in mud fields for up to six months then emerging when water is back in the fields. Furthermore, Pomacea canaliculata can cause a huge loss in rice production annually due to the amount of rice seedlings it can consume per day (Prabhakaran et al., 2017). According to the International Rice Research Institute (2012), Pomacea canaliculata can cause 1m2 of field loss overnight—destroying almost 50% of farmers’ yield, if control is not undertaken. Aside from being a major rice pest, Pomacea canaliculata is a vector of parasite, Angiostrongyulus cantonensis, which is linked to the cause of human eosinophilic meningitis and rat lungworm (Ranamukhaarachchi & Wickramasinghe, 2006). Thus, golden apple snail is potentially harmful to humans and biodiversity despite its nature as a biological weed control.
GAS remains as one of the dominant rice pests in the Philippines (Joshi et al., 2001), especially in the provinces of Samar, Ifugao, and Cagayan causing 1% to 40% of area loss (dela Cruz et al., 2000). Through the decades, Filipino researchers have been studying its possible solutions. To address the problems, different control methods are being practiced but not yet fully established as an effective means in eradicating
Received: August 01, 2019 • Accepted: February 14, 2020
FULL PAPER
Potential of Euphorbia Hirta as Molluscicide
14 RICE-BASED BIOSYSTEMS JOURNAL (2020) 6: 13-20
the snail. Management options such as cultural/mechanical control, biological control, and chemical controls have already been used by farmers although the reports on curative management of snails’ invasion are still considered to be limited (Salleh et al., 2012). The use of synthetic “instant kill” molluscicides remains to be the most common snail control. Regardless of effectiveness, these molluscicides cause negative effects to the environment. Despite human intervention through different approaches, a solution that is affordable and practical on a wider scale is yet to be identified.
At present, Niclosamide is the only chemical molluscicide acceptable for operational use in snail control programs. Due to its high price, niclosamide is used on few local control programs. This was supported by the study of Klumpp and Chu (1987) in Iran, Egypt, and Ghana who stated that area-wide mollusciciding is relatively expensive, ineffective, and ecologically unsound. United States Environmental Protection Agency (1999) stated that niclosamide has a minimal acute dermal toxicity resulting in slight skin irritation and eye irritation. Although it has low toxicity to humans, it still causes ecological impacts. As niclosamide is applied to freshwater tributaries, it is expected to have impacts on the environment (WHO, 1997). Niclosamide’s ecological effect to aquatic plants is toxic (0.04 to > 1,450 mg L-1), while it is highly to very highly toxic on fish. McCullough (1992) supported this claim that niclosamide may lead to problems of toxicity; resulting in unsafety margins to other non-target flora and fauna. As such, plant-derived molluscicides are highly considered as better option for control because they contain saponins, flavonoid, steroids, tannins, and other secondary metabolites; similar active ingredients that could be used and synthesized as potential biodegradable molluscicide (Valverde et al., 2010).
In search of plant-derived molluscicides for biocontrol, several studies have used plants against Pomacea canaliculata. Picardal et al. (2018) utilized extract from garlic (Allium sativum) bulbs and found that 10 ppm and 8.75 ppm concentrations of the extract have comparable molluscicidal effect similar with niclosamide. Furthermore, Probit analysis showed that lethal dosage (LD) resulting in 50% and 90% snail mortality was recorded at 4.007 ppm and 7.602 ppm concentrations, respectively. In another study, “Molluscicidal activity of the aqueous extracts from Solanum mammosum L., Sapindus saponaria L. and Jatropha curcas L. against Pomacea canaliculata,” it was found that the 100% concentration of S. saponaria aqueous extract had LD50 value of 24.04 ppm, while the 50%-50% mixture of S. mammosum and S. saponaria showed highest mortality with LD50 value of 17.78 ppm (Quijano et al., 2014). In the study
of Taguiling (2015), combined extracts of Sandoricum vidalii fruit, Harpulia arborea, and Parkia sp. barks showed 100% mortality of Pomacea canalicutata in laboratory and field testing. The studies found that the plants’ bioactive components such as alkaloids and saponins caused the mortality.
Tawa-tawa (Euphorbia hirta), an ornamental shrub in the Philippines, is traditionally used as an alternative for pharmaceutical drugs due to its healing property, which is induced by the milky juice that is produced when the leaves are being broken down. With its bioactive components, it is known for its contributions as an herbal medicine on numerous diseases such as asthma and dengue. According to Kumar et al. (2010), tawa-tawa possesses antibacterial, anthelmintic, anti-asthmatic, sedative, anti-spasmodic, anti-fertility, anti-fungal, and anti-malarial properties. Aside from that, it is positive in saponins, terpenoids, flavonoids, cardiac glycoside, phenolic compounds, steroids and alkaloids. These properties indicate that Euphorbia hirta may possess molluscicidal activity on Pomacea canaliculate. Thus, this study evaluated Euphorbia hirta as a potential molluscicide against Pomacea canaliculata. This paper also proposed a cost-efficient botanical molluscicide beneficial to the Filipino farmers.
Materials and MethodsResearch Design
The researchers conducted an experimental quantitative research on the potential of Euphorbia hirta ethanolic extract as a molluscicide against Pomacea canaliculata. Figure 1 represents the Randomized Block Experimental Design employed in this study. With 15 trials, 20 snails were allotted in each trial to avoid crowdedness in the environment; producing 300 snails in the experimentation process.
Collection and Extraction of Tawa-tawa (Euphorbia hirta)
Tawa-tawa was collected from Marilao, Bulacan and was brought to the Bureau of Plant Industry (BPI) for authentication. Euphorbia hirta was subjected to air drying for 14 days under the sun. Dried leaves were isolated from the other parts of the plant. Isolated parts were then crushed into fine powder using mortar and pestle. Euphorbia hirta leaves were grounded into powdered form and stored at room temperature. Its ethanol extract was obtained through maceration or by soaking 700 g of the powdered leaves in a 95% ethanol (100g of powder 500 ml-1 of EtOH) solution for 48 h. Extracts were filtered and concentrated to dryness under reduced pressure using rotary evaporator at a temperature of 38±5oC.

Potential of Euphorbia Hirta as Molluscicide
RICE-BASED BIOSYSTEMS JOURNAL (2020) 6: 13-20 15
Formulation of Treatment and Controls
The crude extracts of tawa-tawa (2.5 ml, 5ml, and 7.5 ml) were collected and mixed with distilled water to make a 900 ml solution yielding concentrations of 2.8 ppm, 5.6 ppm, and 8.3 ppm, respectively. The 900 ml solution in each concentration was divided into three and assigned as trial 1, trial 2, and trial 3. Bioassay procedure included negative and positive control. Distilled water served as the negative control for the snails while Niclosamide served as the positive control. The commercial snail control Niclosamide 70WP was utilized and prepared for its recommended dosage of 2.19g L-1.
Collection of Golden Apple Snail
Golden apple snails were handpicked from a rice field in Paniqui, Tarlac. Snail samples were then brought to the Bureau of Fisheries and Aquatic Resources (BFAR) in Region III for authentication and verification. Four hundred snails collected from the province were subjected to acclimatization. Before the acclimatization process, snails were weighed using mini electronic digital scale. Smallest weight value was 8.5 g while the largest weight value was 18 g. Shell height was measured from the apex to the lower margin of aperture (Joshi et al., 2005). The snails were washed several times before being maintained in a container filled with dechlorinated water under diurnal lighting. Sexually active adult snails with a height ranging 3-5 cm and weigh 10-15 g were acclimatized following the acclimatization conditions prescribed by Joshi et al. (2005). The snails were fed with pechay leaves every day during the 10-day acclimatization period. Snails that remained active after the acclimatization were selected for the bioassay.
Bioassay Procedure
Standard procedures by WHO (1983) and Joshi et al. (2005) were followed. Each treatment including the two controls were conducted in 3 trials in different days to ensure validity. Snails were submerged in a rectangular container with a length of 20 cm, width of 16.2 cm, and depth of 9 cm containing 300 ml of the solution (T1, T2, T3, Niclosamide, and Distilled Water). Trial 1 started at the first 24 h; Trial 2, after 48 h; while Trial 3 after 72 h. The snails had recovery time for 1 h away from the solutions every 24 h. Qualitative observation was done through noting the pre and post mortem behavior of the snails in the 96-h observation duration. This included the changes in their physical characteristics (e.g., shell, operculum, and internal organs). Quantitative observation was done through tallying the number of dead snails during the experiment. Using needles, snails that did not exhibit any muscular contractions were considered dead. Samples were further analyzed after 96 h.
Statistical Analysis
Qualitative and quantitative data were gathered. Qualitative data included hyperactivity, presence of white sticky mucous, internal deterioration, and unusual changes in the operculum and their physical characteristics. Quantitative data included the mortality rate of snails. One-Way Anova was used to evaluate the significant difference among the treatments and controls. To determine whether which group is statistically significant or insignificant to another, the researchers used Post-hoc (Tukey’s Honestly Significant Test) at 0.05 level of significance. Probit Analysis was used to determine the relationship between concentrations and percent mortality as well as lethal dosages.
Figure 1. Complete Randomized Design of each treatment with equal number of trials.
Potential of Euphorbia Hirta as Molluscicide
16 RICE-BASED BIOSYSTEMS JOURNAL (2020) 6: 13-20
Results and DiscussionData were gathered from the three trials of each
treatment conducted within 96 h observation. Each trial per treatment contained 20 viable snails to avoid crowdedness in the environment that may affect mortality rate.
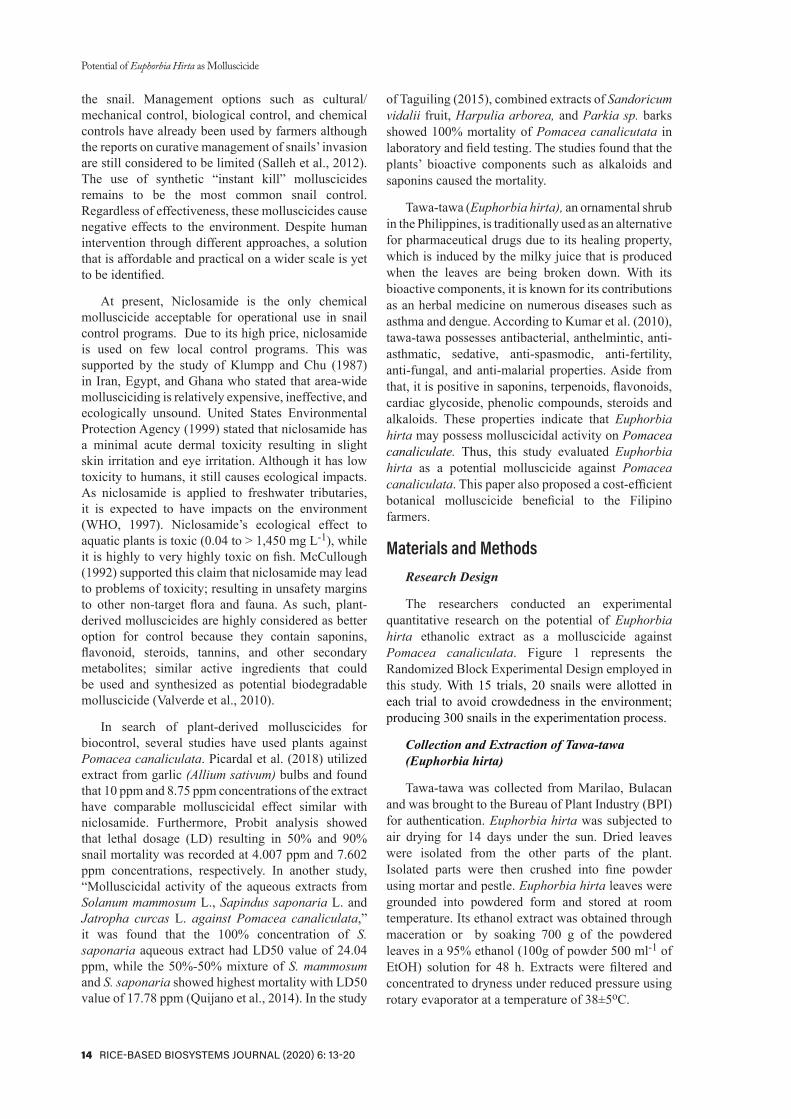
Figure 2 shows the average mortality rate of Pomacea canaliculata subjected to varying concentrations of Euphorbia hirta and controls after three trials during 96-h observation period. Among the three experimental groups, the solution with 8.3 ppm concentration exhibited the highest number of dead snails with a mortality rate of 45%. On the other hand, least number of dead snails is seen on 2.8 ppm concentration with a mortality rate of 15%.
Physical and behavioral changes occurred after the 24-h exposure of snails to Euphorbia hirta solutions. Snails were active during night days prior to the experiment, but after exposure to the solution, their hyperactivity decreased. Snails were inactive during the experiment; hiding in their shell, which is a normal mechanism for snails put under threatening environment. Some snails showed signs of itching
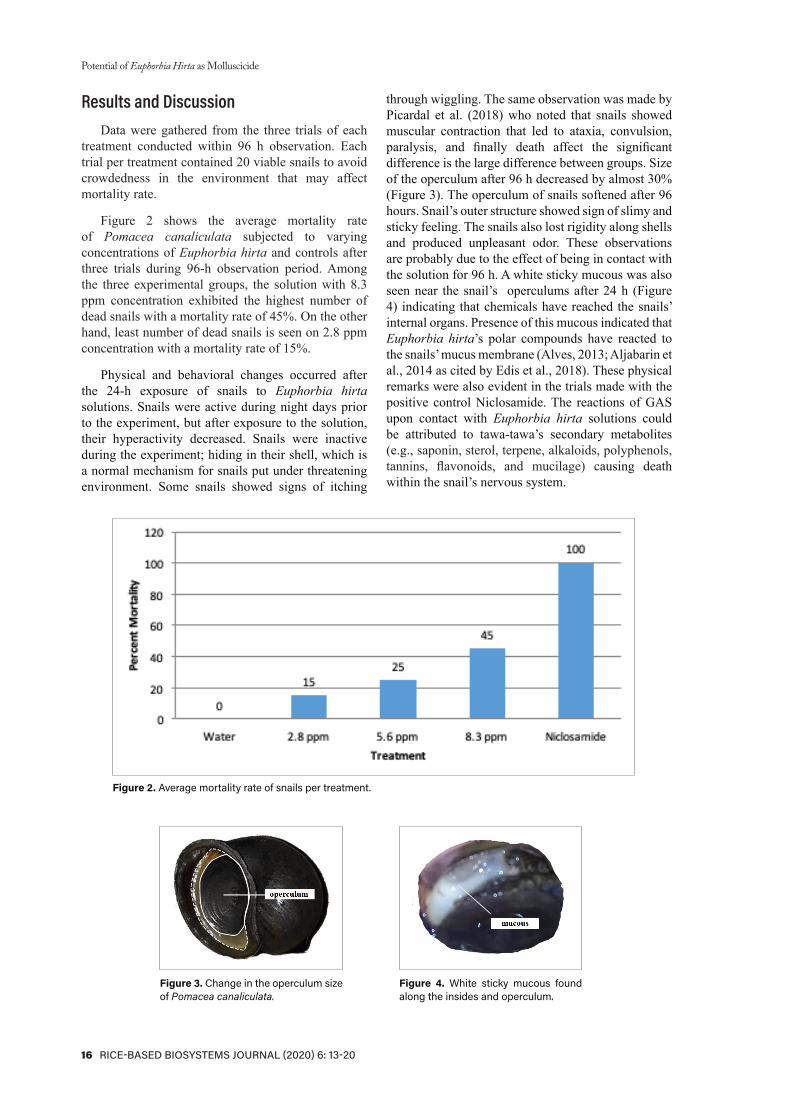
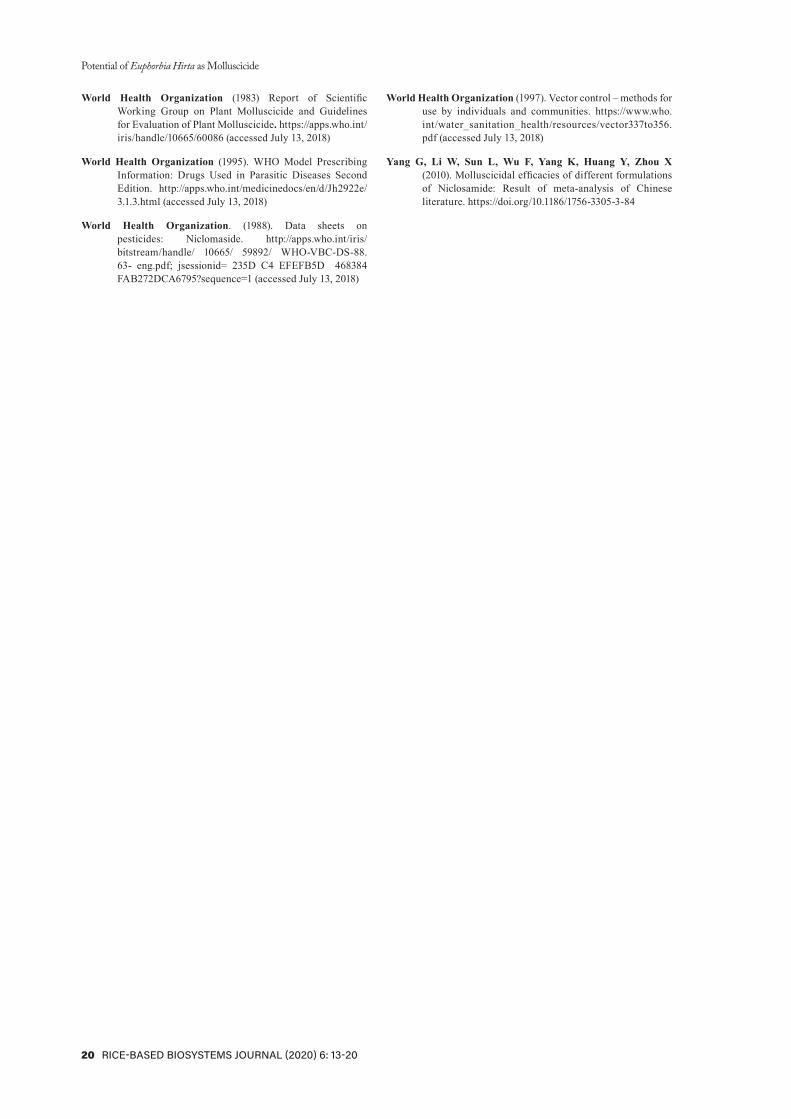
through wiggling. The same observation was made by Picardal et al. (2018) who noted that snails showed muscular contraction that led to ataxia, convulsion, paralysis, and finally death affect the significant difference is the large difference between groups. Size of the operculum after 96 h decreased by almost 30% (Figure 3). The operculum of snails softened after 96 hours. Snail’s outer structure showed sign of slimy and sticky feeling. The snails also lost rigidity along shells and produced unpleasant odor. These observations are probably due to the effect of being in contact with the solution for 96 h. A white sticky mucous was also seen near the snail’s operculums after 24 h (Figure 4) indicating that chemicals have reached the snails’ internal organs. Presence of this mucous indicated that Euphorbia hirta’s polar compounds have reacted to the snails’ mucus membrane (Alves, 2013; Aljabarin et al., 2014 as cited by Edis et al., 2018). These physical remarks were also evident in the trials made with the positive control Niclosamide. The reactions of GAS upon contact with Euphorbia hirta solutions could be attributed to tawa-tawa’s secondary metabolites (e.g., saponin, sterol, terpene, alkaloids, polyphenols, tannins, flavonoids, and mucilage) causing death within the snail’s nervous system.
Figure 2. Average mortality rate of snails per treatment.
Figure 3. Change in the operculum size of Pomacea canaliculata.
Figure 4. White sticky mucous found along the insides and operculum.

Potential of Euphorbia Hirta as Molluscicide
RICE-BASED BIOSYSTEMS JOURNAL (2020) 6: 13-20 17
Significant difference across groups were found through One-way Analysis of Variance or ANOVA. Using SPSS at confidence level of 95%, p-value was calculated at 0.00 (3.1519-11). High significant differences among treatment groups were noted at p-value less than 0.05. This means that the treatments (experimental groups and controls) are distinct and caused different mortality rates to Pomacea canaliculata. The null hypothesis, there is no difference in the mortality rates across groups, is rejected at 0.05 level of significance. One factor affecting the significant difference was the large difference between groups especially that the negative control (distilled water) resulted in a mortality rate of 0% compared to the positive control, which has 100% mortality rate.
Table 1 shows the pairwise comparison across groups using Post Hoc (Tukey’s Honestly Significant Test). There is a significant difference between Treatment C (2.8 ppm) and Treatment D (5.6 ppm) as well as between Treatment C (2.8 ppm) and Treatment E (8.3 ppm). This implies that the effectiveness of the Euphorbia hirta as a molluscicide against Pomacea canaliculata increases as the concentration of the treatment increases. However, Treatment D (5.6 ppm) and Treatment E (8.3 ppm) showed a p-value of 0.359, which is greater than the 0.05 p-value, indicating that the concentrations 5.6 ppm and 8.3 ppm are not significant with each other. This means that the effectiveness of 5.6 ppm and 8.3 ppm concentrations as molluscicide against Pomacea canaliculata are comparable with each other.
Table 2 and Figure 5 present the results of regression analysis between the various concentrations of Euphorbia hirta and percent mortality of Pomacea canaliculata. The regression equation is = 1.8562X + 3.0712 with concentration of Euphorbia hirta as X variable and percent mortality of Pomacea canaliculata as Y variable. This indicates that with increase of one unit of concentration (X), the mortality of the Pomacea canaliculata increases by a unit of 3.0712. The extent to which concentration (X) predicts the mortality of the Pomacea canaliculata (Y) was found at 92.657% coefficient of determination. Furthermore, the r coefficient value is 0.963, which can be interpreted as “very high positive linear correlation”. With this, it can be deduced that snail mortality is correlated and has a direct relationship with the concentration of solution. Increase in concentration will yield an increase in mortality rate.
This leads to the prediction of the minimum concentration that will yield 50% mortality (LC50) and 90% mortality (LC90). Regression analysis predicted that it is predicted that LD50 would be at 10.90 ppm while LD90 would be at 53.44 ppm. This suggests that 10.9 ppm concentration can kill 50% of the snail population, while 90% mortality can be achieved with 53.4 ppm concentration. The regression analysis also implies that snail mortality is dose dependent.
This study supports Picardal et al. (2018) who found a positive correlation between the increasing amount of concentration and the snail mortality
Table 1. Comparison across groups using Tukey’s Honesty Significant Test.
ANegative Control
BPositive Control
C2.8 ppm
D5.6 ppm
E8.3 ppm
A = negative control - 0.00 0.001 0.00 0.000
B = positive control - 0.000 0.000 0.000
C = 2.8 ppm - 0.000 0.001D = 5.6 ppm - 0.359*E = 8.3 ppm -*not significant at p-value of ≤ 0.05
Table 2. Calculated lethal dosage 50 and lethal dosage 90 for the Euphorbia hirta molluscicide.
Lethal Doses of Tawa-tawa Molluscicide (ppm)
R2 Chi-square Value Slope Value
LD50 LD90 0.92657 1.00 1.857
10.90 ppm 53.44 ppm
*95% LCL=10.57 ppm *95% LCL=49.92 ppm
*95% UCL=11.25 ppm *95% UCL=57.51 ppm

Potential of Euphorbia Hirta as Molluscicide
18 RICE-BASED BIOSYSTEMS JOURNAL (2020) 6: 13-20
rate. This depicts that snail mortality depends of dosage; higher dose will yield higher mortality rate. Further observation found that after being exposed to the active plant extract, snails showed behavioral responses such as retraction inside their shell and crawling towards other snails. Changes in physical characteristics were also evident after 24 h exposure to the treatment. Snails’ operculum also decreased in size and structure. Secretion of sticky substance (mucus) was also observed around the operculum indicating contact with Euphorbia hirta’s chemical constituents. This kind of behavior was similar to the snails exposed in the positive control Niclosamide.
ConclusionBased on research findings, Euphorbia hirta
possesses molluscicidal activity against Pomacea canaliculata. It can be used as a possible biological application, which is environmentally safe for controlling the infestation of Pomacea canaliculata. Small concentrations were used to comply with WHO’s standard for molluscicides (concentration up to 20 ppm). Although concentrations used in the study had small mortality rate, treatments affected the snails in their physical aspects. Lethal dosages of 10.90 ppm (LD50) and 53.94 ppm (LD90) are the recommended concentration to kill 50% and 90% snail population.
For future research, it is recommended to use higher dosages such as 10.90 ppm and 53.95 ppm of Euphorbia hirta extract and test whether these concentrations can negatively affect the environment. Further exploration on the different parts of Euphorbia hirta such as stem, roots, and bud is also recommended. Use of different solvents in the preparation of extracts and effect of treatments to non-target organisms can also be explored. It is also recommended to explore more species from the family Euphorbiaceae and assess whether they possess molluscicidal activity against golden apple snail and to other snail species.
AcknowledgmentThe following individuals are recognized for their
contribution and assistance during the study: Dr. Ravindra C. Joshi; Jay P. Picardal for the guidance on the experimental set-up; Dr. Lydia Leonardo, our consultant; and Kathleen Sy for the encouragement. Flora T. Teope, school principal; Kristine Joy Bautista, language editor; Reginald C. Ongleo, statistician; Angelo G. Cabic and Suzzeth Untalan-Dizon, research teachers; Erickson Del Mundo, research adviser; are also acknowledged.
Literature CitedBrito F, Joshi R (2016). The golden apple snail, Pomacea
canaliculata: A review on invasion, dispersion and control. Outlooks on Pest Management, 27(4), 157-163. Retrieved from https://www.researchgate.net/publication/ 307440179_The_ golden _apple_snai l_ pomacea _canaliculata_A_review_on_invasion_dispersion_and_control (accessed July 13, 2018)
Cantanhede SPD, Marques Adriana DM, Silva-Souza N, Valverde L (2010). Atividade moluscicida de plantas: uma alternativa profilática. Revista Brasileira de Farmacognosia, 20(2), 282-288. https://doi.org/10.1590/S0102-695X2010000200024
Carlsson NOL, Brönmark C, Hansson LA (2004). Invading herbivory: The golden apple snail alters ecosystem functioning in Asian wetlands. Ecology, 85(6): 1575-1580. http://www.esajournals.org/perlserv/?request=get-document&doi=10.1890%2F03-3146
Carlsson NOL, Brönmark C (2006). Size-dependent effects of an invasive herbivorous snail (Pomacea canaliculata) on macrophytes and periphyton in Asian wetlands. Freshwater Biology, 51(4): 695-704. http://www.blackwell-synergy.com/servlet/useragent?func=sho wIssues&code=fwb
Cowie RH (2002) Apple snails (Ampullariidae) as agricultural pests: their biology, impacts and management. In: Barker, G.M. (Ed.), Molluscs as Crop Pests. CABI. International, Wallingford, UK, pp 145-189
Carvalho Augusto R and Mello Silva CC (2018). Phytochemical Molluscicides and Schistosomiasis: What We Know and
Figure 5. Graph of lethal dosage using Probit Analysis.

Potential of Euphorbia Hirta as Molluscicide
RICE-BASED BIOSYSTEMS JOURNAL (2020) 6: 13-20 19
What We Still Need to Learn. Veterinary sciences, 5(4), 94. https://doi.org/10.3390/vetsci5040094
Dela Cruz, MS, Joshi R (2001) Re-evaluation of the bioefficiency of commercial molluscicide formulations on the golden apple snail Pomacea canaliculata. Philipp. Agric. 84(1): 0-1
Dela Cruz, MS, Joshi R, Martin AR (2000) Potential effects of commercial molluscicides used in controlling golden apple snails on the native snail Vivipara costata (Quoy and Gaimard). Philipp. Ent. 14(2): 149-157
Edis KJC, Basay FS, Castillo VLT, Alegado DR, Alicante A, Alon JM, Picardal JP (2018). In vitro evaluation of the molluscicidal activity of Euphorbia tirucalli latex extract against the mollusk rice pest Pomacea canaliculata. Journal of Biodiversity and Environmental Sciences, 12(2), 237–245. https://www.researchgate.net/publication/327388247_In_vitro_evaluation_of_the_molluscicidal_activity_of_Euphorbia_tirucalli_latex_extract_against_the_mollusk_rice_ pest_Pomacea_canaliculata_Caenogastropoda_Ampullariidae (accessed July 13, 2018)
Halwart M (1994) The golden apple snail Pomacea canaliculata in Asian rice farming systems: present impact and future threat. International Journal of Pest Management. 40(2), 199-206
Huang L, Chen S, Yang M (2012). Euphorbia hirta (Feiyangcao): A review on its ethnopharmacology, phytochemistry and pharmacology. Journal of Medicinal Plants Research 6(39), 5176-5185. 10.5897/JMPR12.206
Joshi RC, Delacruz MS, Martin EC, Cabigat JC, Bahatan RG, Bahatan AD, Cayong AB (2001). Current Status of the Golden Apple Snail in the Ifugao Rice Terraces, Philippines. Journal of Sustainable Agriculture, 18(2-3), 71–90. 10.1300/j064v18n02_07
Joshi RC, Meepagala KM, Sturtz G, Cagauan AG, Mendoza CO, Dayan FE, Duke SO (2005). Molluscicidal activity of Vulgarone B from Artemisia douglasiana (Besser) against the invasive, alien, mollusc pest, Pomacea canaliculate (Lamarck). International Journal of Pest Management, 51(3), 175-180. 10.1080/09670870500183161
Joshi RC and Sebastian LC (2006) Global Advances in Ecology and Management of Golden Apple Snails. Muñoz, Nueva Ecija, Philippines: Philippine Rice Research Institute, 588 pp.
King CH and Bertsch D (2015). Historical perspective: Snail control to prevent schistosomiasis. PLoS Neglected Tropical Diseases. 10.1371/journal.pntd.0003657
Klumpp RK and Chu KY (1987). Focal mollusciciding: An effective way to augment chemothersphy of schistosomiasis. https://doi.org/10.1016/0169-4758(87) 90162-1
Kumar S, Malhotra R, Kumar D (2010). Euphorbia hirta: Its chemistry, traditional and medicinal uses, and pharmacological activities. Pharmacognosy reviews, 4(7), 58-61
McCullough FS (1992). The role of mollusciciding in schistosomiasis control. Geneve, World Health Organization (1988). http:/www.who.int/iris/handle/ 10665/62265
Mochida O, Guevarra HT, Litsinger JA and Basilio RP (1991) Golden apple snail Pomacea canaliculata: An introduced Pest of Rice. p. 86-89, In: Vol. 1 Proc. 11th International Congress of Plant Protection: Focus on the Developing World, October 5-7, 1987, Manila, Philippines. C34
Naylor R (1996). Invasions in Agriculture: Assessing the Cost of the Golden Apple Snail in Asia. Ambio., 25(7), 443-448
Pereira Filho AA, França CR, Oliveira D, Mendes RJ, Gonçalves J, Rosa IG (2014). Evaluation of the molluscicidal potential of hydroalcoholic extracts of Jatropha gossypiifolia Linnaeus, 1753 on Biomphalaria glabrata (Say, 1818). Revista do Instituto de Medicina Tropical de Sao Paulo. 56(6), 505-510. https://doi.org/10.1590/s0036-46652014000600009
Picardal MT, Panlaan KT, Castaño PML, Peña LG, Abella KT, Picardal JP (2018). Molluscicidal activity of the aqueous extract of garlic (Allium sativum L.) bulb against golden apple snail (Pomacea canaliculata L.). 13. 75-87
Prabhakaran G, Bhore SJ, Ravichandran M (2017). Development and evaluation of poly herbal molluscicidal extracts for control of apple snail (Pomacea maculata). Agriculture, 7(3), 22
Ranamukhaarachchi S, Wickramasinghe S (2006). Golden apple snails in the world: Introduction, impact, and control measures. Global advances in ecology and management of golden apple snails. 133-152. Philippine Rice Research Institute, Los Baños, Philippines
Salleh NHM, Arbain D, Daud MZM, Pilus N, Nawi R. (2012). Distribution and management of Pomacea canaliculata in the northern region of Malaysia: Mini review. APCBEE Procedia. Retrieved from https://www.sciencedirect.com/science/article/pii/S2212670812000954 (accessed July 13, 2018)
Singh G, Kumar P (2013) Phytochemical and Antibacterial Studies of Different Parts of Euphorbia hirta L., Journal of Herbs, Spices & Medicinal Plants, 19(1), 11-21.10.1080/10496475.2012.734549
Singh G, Kaiser P, Youssouf M, Singh S, Khajuria A, Koul A, Bani S, Kapahi B, Satti N, Suri K and Johri R (2006). Inhibition of early and late phase allergic reactions by Euphorbia hirta L. Phytotherapy research : https://doi.org/10.1002/ptr.1844
Singh S, Yadav RP, Singh A (2013). Molluscicidal activity of different organic solvent latex extracts of some common Euphorbiales against freshwater harmful snails. J. Sci. Islamic Repub. Iran. 15(1): 59-63
Quijano M, Rieraruiz C, Barragan A, Miranda M, Orellana T, Manzano P (2014). Molluscicidal activity of the aqueous extracts from Solanum mammosum L., Sapindus saponaria L. and Jatropha curcas L. against Pomacea canaliculata. Emirates Journal of Food and Agriculture, 26(10), 871. 10.9755/ejfa.v26i10.18804
Taguiling NK (2015) Effect of combined plant extracts on golden apple snail (Pomacea canaliculata) and Giant Earthworm (Pheretima sp). International Journal of Agriculture and Crop Sciences, 8(1), 55-60
Potential of Euphorbia Hirta as Molluscicide
20 RICE-BASED BIOSYSTEMS JOURNAL (2020) 6: 13-20
World Health Organization (1983) Report of Scientific Working Group on Plant Molluscicide and Guidelines for Evaluation of Plant Molluscicide. https://apps.who.int/iris/handle/10665/60086 (accessed July 13, 2018)
World Health Organization (1995). WHO Model Prescribing Information: Drugs Used in Parasitic Diseases Second Edition. http://apps.who.int/medicinedocs/en/d/Jh2922e/ 3.1.3.html (accessed July 13, 2018)
World Health Organization. (1988). Data sheets on pesticides: Niclomaside. http://apps.who.int/iris/bitstream/handle/ 10665/ 59892/ WHO-VBC-DS-88. 63- eng.pdf; jsessionid= 235D C4 EFEFB5D 468384 FAB272DCA6795?sequence=1 (accessed July 13, 2018)
World Health Organization (1997). Vector control – methods for use by individuals and communities. https://www.who.int/water_sanitation_health/resources/vector337to356.pdf (accessed July 13, 2018)
Yang G, Li W, Sun L, Wu F, Yang K, Huang Y, Zhou X (2010). Molluscicidal efficacies of different formulations of Niclosamide: Result of meta-analysis of Chinese literature. https://doi.org/10.1186/1756-3305-3-84

RICE-BASED BIOSYSTEMS JOURNAL (2020) 6: 21-36 21
INTERDEPENDENT TRAIT SELECTION AMONG RICE (ORYZA SATIVA L.) GENOTYPES FOR LODGING
TOLERANCE UNDER DIRECT-SEEDED CONDITION THROUGH SEQUENTIAL MULTIVARIATE
METHODOLOGIESPaul Nathaniel M. Marcelo1, Rosemarie T. Tapic2, Via Ann C. Marcelo1,
and Oliver E. Manangkil1*
1 Plant Breeding and Biotechnology Division, Philippine Rice Research Institute, Science City of Muñoz, Nueva Ecija, 3119, Philippines 2 Department of Crop Science, College of Agriculture, Central Luzon State University,
Science City of Muñoz, Nueva Ecija, 3120, Philippines*Corresponding Author: [email protected]
Abstract Lodging is the bending over of rice culm caused by weak root anchorage, poor stem support, and unpredictable
weather factors that reduce grain yield and seed quality. Push-resistance is a direct representation of rice lodging, which measures the plants’ resistive force in the culm. This study categorized levels of push-resistance among 41 rice genotypes and identify lodging-tolerant (Lt) genotypes through subsequent multivariate analyses of phenotypic and anatomic traits. Seventy-two percent of genotypes screened and subjected to push-resistance had significantly comparable culm strength (0.83 – 1.08 kg cm2) to the Lt check, NSIC Rc 240 (1.01 kg cm2). Only five genotypes had stronger culm (1.01 – 1.08 kg cm2) than the lodging-susceptible (Ls) check, PSB Rc4 (0.77 kg cm2). Bivariate analysis showed a significant association of push-resistance to 17 agro-morphological and three anatomic traits. Moreover, sequential use of multivariate procedure delineated NSIC Rc 300, Rc 360, Rc 396, and PR45299-14-3-2-B as Lt genotypes. Direct-seeded rice with high level of push-resistance is crucial in sustaining increases in potential yield and lessening yield reduction caused by lodging.
Keywords: Lodging-Tolerance, Direct-Seeded Rice, Stem Anatomy, Bivariate Analysis, Multivariate Analysis.
IntroductionLodging is crop’s permanent displacement from
its upright position (Van Delden et. al., 2010) and manifested from sporadic to extensive coverage in farmers’ field. In rice, it is mainly caused by the inherently weak phenotype of jointed, hollow culm, and dense grain-bearing panicle in the uppermost internode during the ripening phase. The occurrence of lodging in the Philippines is prevalent throughout the wet season (June-December) when lodging coincides with high rainfall intensity and tropical cyclones. Rainfall during this season covers 61-86% of the mean annual rainfall from 1991 to 2012 in Nueva Ecija, Philippines (PHILFSIS, 2019). Based on PAGASA (2014), the country experiences 19 tropical cyclones every year and no storm-free months (Corporal-Lodangco and Leslie, 2014). Wind speed during cyclone ranges from 30 to 220 kph (PAGASA, 2019), which is considerably stronger than the rate at which rice plant lodges. In general, first culm breaking started at 25 kph, while full culm breakdown occurred at 54-57 kph (Hitaka, 1968). High wind speed
interrupts grain filling by bending and breaking culms, while rainfall specifically affects grain quality, which are all aftermaths of lodging.
Rice physiological processes are much affected by damages in culm morphology. The destruction of foliage structure leads to lower net photosynthetic rate, slower cellular growth (Setter et al., 1997), and lower dry matter production (Kobayashi and Hitaka, 1968). In broken culms, it completely inhibits the transport of water and nutrients through the vascular bundles, resulting in a reduction of assimilates for grain filling (Kashiwagi et. al., 2005). Furthermore, increased plant and grain moisture retention encourage fungal growth, and pest and disease occurrence highly injurious to the plant.
Lodging is common in transplanted and direct-seeded systems, in which a high degree of manifestation is recurrent in the direct seeding. Among morphological traits, plant height limits the occurrence of lodging and increase yield potential; however, susceptibility to lodging differs among
Received: May 09, 2019 • Accepted: January 30, 2020
FULL PAPER

Interdependent Trait Selection Among Rice Genotypes
22 RICE-BASED BIOSYSTEMS JOURNAL (2020) 6: 21-36
cultivars with similar height (Ookawa and Ishihara, 1992; Easson et. al., 1993). Furthermore, thorough investigation of lodging in a direct-seeded system is crucial in sustaining the increasing farmer adaptation of transplanted to direct seeding practice for its low production cost (Manangkil et. al., 2013) and increase water-saving capability (Tabbal et. al., 2002).
Mechanical strength of the plant is mostly dependent on chemical and biochemical components of the cell wall (Kong et al., 2014). Sclerenchyma tissue, which functions as mechanical strength, surrounds vascular bundles and cell walls of vascular plants. Lignin also provides rigidity to the cell wall that improves mechanical stability of plants and tolerance to biotic and abiotic stresses (Frei, 2013).
Currently, percent lodging incidence and culm strength are the conventional screening techniques for rice lodging (IRRI, 2014). Data gathering in these classifiers is fast and easy but inadequate in providing applied and corresponding resistive force. Push-resistance, an index of lodging-tolerance can measure physical strength of basal culm using a force-gauge meter (Kashiwagi and Ishimaru, 2004), may be used as alternate technology for measuring resistive force.
Identifying traits related to lodging-tolerance through its morphology, anatomy, and push-resistance is necessary. Grain yield losses due to lodging can be as high as 57.5% (Alias et. al., 1989). These yield reductions when converted to price decline were estimated at $0.0075-$0.0119 per kg of rough rice market price in the USA (Salassi et. al., 2013) or about PhP0.60 per kg milled rice or PhP30 price reduction per 50 kg cavan in the Philippines. Mean annual losses reached PhP3.1 trillion worth of revenues from 2000 to 2012 in rice due to floods and tropical cyclones in the Philippines (PHILFSIS, 2019). In terms of quality, lodging a day earlier in the grain-filling stage can cause 0.15% decline of milled rice rate, an increase of 0.27% of chalky grain rate, and 0.02% protein content, which subsequently lower eating quality and market price of milled rice (Lang et. al., 2012). Lodging also causes difficulties in harvest operations, increases demand for grain drying, and consequently results in increased production cost (Hoshikawa and Wang, 1990).
In this study, 43 rice genotypes for push-resistance, agro-morphologic, and anatomic traits under direct-seeded condition were characterized. Traits in the plants’ morphology and anatomy significant to lodging were determined and push-resistance of 41 rice genotypes to Lt and Ls checks were compared. Morphologic and anatomic traits contributing to push-resistance were also modified. Genotypes with lodging-tolerance were selected based on identified significant traits in plants’ morphology and anatomy.
Materials and MethodsSite Description
The experiment was carried out in Philippine Rice Research Institute-Central Experiment Station (PhilRice-CES), Science City of Muñoz, Nueva Ecija (15°40’15” N, 120°53’37” E, 99.9 m altitude) during the main rice-growing season from January to early May in 2017. The site is naturally plain with a tropical monsoon Type-1 climate having two pronounced seasons; dry from November to April and wet during the rest of the year (PAGASA, 2017). The soil is a type of lowland soils classified as Maligaya series and texture of deep heavy clay, compact, sticky, and plastic (BSWM, 2017). The area has a mean temperature of 26.87 °C and a mean rainfall of 2.09 mm during the trial period (PhilRice, 2017).
Rice Materials
Forty-three rice genotypes from six rice ecosystem comprised the set of treatments. This set-up was composed of 12 newly-bred lines for the direct-seeded environment, 20 irrigated lowland varieties, nine varieties for an adverse ecosystem, one Lt check NSIC Rc 240, and one Ls check PSB Rc4 (Table 1). Plant Breeding and Biotechnology Division of PhilRice-CES owns the seeds.
Experimental Design
The field experiment followed a randomized complete block design (RCBD) with three replications. Treatments were laid-out in a systematic arrangement of plots from left to right. Entire experimental area is 1,133 m2 divided into three blocks with each block measuring 44 m long and 8.25 m wide. Block comprised 43 plots separated further in two columns with dimension of 2 m x 4 m. Furrows were made using pull type 20 pins wooden rake with each plot having eight 4-linear m furrows and 0.25 m distance between furrows.
Direct Seeding
Thirty-two grams of pre-germinated seeds were distributed evenly in an eight-row 4-linear m furrow after 24-h incubation. Before seeding, plot labels with proper identification mark in the leftmost corner of a hill on all treatments. The percent seedling emergence at 14 days after sowing determines the frequency of replanting.
Push-Resistance Method
The push-resistance of the culm assessed using a force-gauge meter (HF50-100061, Handy, Taiwan) determined the strength of the basal part of the stem. Force-gauge meter was set perpendicularly to the plant 20 cm above soil surface based on the method

Interdependent Trait Selection Among Rice Genotypes
RICE-BASED BIOSYSTEMS JOURNAL (2020) 6: 21-36 23
Table 1. List of genotype name, code, and type of rice growing environment.
GenotypeEcosystem
GenotypeEcosystem
Code Name Code Name
G1 PR39142-10-3-2-1-1-B DSR G23 NSIC Rc 238 IL
G2 PR39149-33-1-3-3-1-B DSR G24 NSIC Rc 290 SAL
G3 PR39628-17-2-1-1-B DSR G25 NSIC Rc 300 IL
G4 PR40334-61-1-1-B DSR G26 NSIC Rc 302 IL
G5 PR40432-10-1-1-1-B-B DSR G27 NSIC Rc 308 IL
G6 PR40432-14-2-1-B DSR G28 NSIC Rc 324 SAL
G7 PR40432-17-3-1-2-B-B DSR G29 NSIC Rc 352 IL
G8 PR43405-10-2-3-3-B DSR G30 NSIC Rc 354 IL
G9 PR434325-25-2-1-1-1-B DSR G31 NSIC Rc 356 IL
G10 PR43426-13-2-3-2-B-B DSR G32 NSIC Rc 358 IL
G11 PR43433-21-2-1-1-1-B DSR G33 NSIC Rc 360 IL
G12 PR45299-14-3-2-B DSR G34 NSIC Rc 390 SAL
G13 NSIC Rc 11 UPL G35 NSIC Rc 392 SAL
G14 NSIC Rc 25 UPL G36 NSIC Rc 396 IL
G15 NSIC Rc 29 UPL G37 NSIC Rc 402 IL
G16 NSIC Rc 194 SUB G38 PSB Rc82 IL
G17 NSIC Rc 214 IL G39 NSIC Rc 160 IL
G18 NSIC Rc 216 IL G40 NSIC Rc 240Lt IL
G19 NSIC Rc 218 IL G41 NSIC Rc 298 IL
G20 NSIC Rc 222 IL G42 PSB Rc4Ls IL
G21 NSIC Rc 224 IL G43 PSB Rc14 RL
G22 NSIC Rc 226 ILG Genotype, DSR Direct-seeded rice, IL Irrigated lowland, RL Rainfed lowland, SAL Saline, SUB Submergence, UPL Upland, Lt Lodging-tolerant check, Ls Lodging-susceptible check
reported by Kashiwagi and Ishimaru (2004) at 20 days after full heading. Wood board measuring 0.40 m length x 0.40 m height x 0.05 m wide served as guideboard in data collection. Push-resistance of five representative plants were measured until the test plant had inclined vertical 45° angle. The value was expressed in kilogram-force per square centimeter (kg cm2), which indicated sturdiness of the basal stem and root anchorage (Fig. 1).
Phenotypic Evaluation
The 43 rice genotypes exhibited 19 Qualitative (Ql) agro-morphologic characters (Table 2). These characters include: auricle color, basal leaf sheath color, collar color, culm habit, early and late flag leaf attitude, leaf blade anthocyanin coloration, leaf blade attitude, leaf blade intensity of green color, leaf blade pubescence, leaf sheath anthocyanin coloration,
Figure 1. Push-resistance measurement of the lower stem: A. Handy force-gauge HF50-100061 can measure resistive force of up to 50 kg; B. Wooden board with a dimension of 0.30 m x 0.50 m x 0.05 m used to guide the force-gauge in data collection; C. Force-gauge and guide board at starting point in push resistance data collection; D. Data on push resistance collected at 45 degrees angle pushed for 5 sec. Resistive force of five plants per treatment were measured.

Interdependent Trait Selection Among Rice Genotypes
24 RICE-BASED BIOSYSTEMS JOURNAL (2020) 6: 21-36
Table 2. Level of the diversity of seven categorical characters compared with NSIC Rc 240 (Lt check).
Qualitative Trait NSIC Rc 240 Observed Phenotypic Class
Class H’ Level of Diversity*No %
Leaf blade intensity of green color Dark No green color visible 0 0 0.32 LowLight 30 69.8Medium 11 25.5Dark 2 4.7
Ligule color Whitish Absent 0 0 0.16 LowWhitish 38 88.4Yellowish green 5 11.6Purple 0 0Light purple 0 0Purple lines 0 0
Flag leaf attitude Semi-erect Erect 9 20.9 0.22 LowSemi-erect 34 79.1Horizontal 0 0Descending 0 0
Culm habit Semi-erect Erect 10 23.3 0.24 LowSemi-erect 33 76.7Open 0 0Spreading 0 0Procumbent 0 0
Panicle main axis attitude Strongly drooping
Upright 0 0 0.27 LowSemi-upright 0 0Slightly drooping 30 69.8Strongly drooping 13 30.2
Panicle secondary branching Dense Absent 0 0 0.16 LowSparse 32 74.4Dense 11 25.6Clustered 0 0
Panicle exsertion Moderately well exserted
Enclosed 0 0 0.20 LowPartly exserted 1 2.4Just exserted 5 11.6Moderately well exserted 37 86.0Well exserted 0 0
* Source: Jamago and Cortes 2012
ligule color, ligule shape, panicle branches attitude, panicle exsertion, panicle main axis attitude, panicle secondary branching, panicle shattering, and panicle threshability.
The genotype’s 23 Quantitative (Qn) agro-morphologic measurements are presented in Table 3: culm length, culm number per linear meter, diameters of 1st to 5th internodes, leaf blade width and length, length of 1st to 5th internodes, ligule length, flag leaf width and length, heading, maturity, panicle length of main axis, panicle number per linear meter, plant height at maturity, and seedling height conforming to descriptions in the Bioversity International Descriptors for Wild and Cultivated Rice 2007 at vegetative, reproductive, and ripening stages.
Anatomical Analysis
Radial segments of approximately 20 µm cell thick from the 5th internode of the main culm excluding leaf sheath were collected 10 days after 100% flowering, stained with 0.2 ml (1% Safranin-O; 30% EOH) solution, air-dried for 45 min in ambient temperature (Johansen 1940), and examined under a light microscope (CX41, Olympus, Japan). Captured images were in Tagged Image File Format (TIFF), which is better in preserving detailed images and uncompressed data. Olympus DP2-BSW application measures the number and area of abaxial, median, and adaxial vascular bundles using low dimension images, while the thickness of sclerenchyma ring and culm wall gauge were captured in high dimension

Interdependent Trait Selection Among Rice Genotypes
RICE-BASED BIOSYSTEMS JOURNAL (2020) 6: 21-36 25
Tabl
e 3.
Dat
a of
the
43
rice
geno
type
s at
rip
enin
g ph
ase
unde
r di
rect
see
ded
cond
ition
(se
edlin
g he
ight
, lea
f cha
ract
eris
tics,
ste
m le
ngth
and
dia
met
er, p
anic
le n
umbe
r an
d le
ngth
, gra
in le
ngth
, an
d gr
ain
wid
th).
Trt
No
Varie
ty N
ame
/ Li
ne
Des
igna
tion
SHT
(cm
)
Leaf
Bla
de
(cm
)Li
gule
Le
ngth
(m
m)
Flag
Lea
f (cm
)In
tern
ode
Dia
met
er (m
m)
Inte
rnod
e Le
ngth
(cm
)Pa
nicl
eG
rain
(mm
)
LBL
LBW
FLL
FLW
D1 I
ND
2 IN
D3
IND
4 IN
D5
INL1
IN
L2 I
NL3
INL4
INL5
INPN
LMPA
NL
(cm
)G
LG
W1
PR39
142-
10-3
-2-1
-1-B
3345
.41.4
17.6
428
.21.6
5.14
4.49
3.88
3.29
2.19
3.6
6.4
12.6
20.8
36.3
9623
8.21
2.17
2PR
3914
9-33
-1-3
-3-1
-B33
34.9
1.214
.48
20.8
1.44.
504.
123.
583.
222.
034.
06.
910
.315
.732
.010
121
8.89
2.13
3PR
3962
8-17
-2-1
-1-B
3840
.81.3
17.4
027
.11.5
4.64
4.02
3.59
3.36
2.06
3.0
6.2
10.4
16.3
29.9
110
249.
832.
184
PR40
334-
61-1
-1-B
2938
.01.2
15.4
928
.01.4
4.12
3.85
3.60
3.08
1.79
2.7
5.6
8.0
14.6
29.7
7122
8.65
2.12
5PR
4043
2-10
-1-1
-1-B
-B31
40.5
1.416
.79
31.0
1.54.
834.
343.
923.
581.8
14.
26.
48.
016
.830
.290
239.
352.
156
PR40
432-
14-2
-1-B
4039
.51.5
12.8
726
.21.6
4.44
4.19
3.62
3.27
2.00
6.4
9.6
10.7
15.8
31.4
8023
9.83
2.74
7PR
4043
2-17
-3-1
-2-B
-B29
33.5
1.212
.09
23.9
1.23.
903.
463.
023.
021.7
14.
26.
37.8
14.9
26.2
109
219.
222.
128
PR43
405-
10-2
-3-3
-B35
42.0
1.516
.80
29.2
1.65.
545.
024.
534.
172.
593.
37.7
10.4
17.2
35.8
7423
8.83
2.19
9PR
4342
5-25
-2-1
-1-1
-B35
37.7
1.422
.64
27.1
1.44.
333.
813.
473.
211.5
43.
67.2
9.116
.328
.997
2410
.172.
1810
PR43
426-
13-2
-3-2
-B-B
3742
.11.5
16.2
626
.01.7
6.12
5.64
4.90
4.16
2.20
3.4
7.912
.317
.132
.988
249.
252.
0911
PR43
433-
21-2
-1-1
-1-B
3646
.71.7
18.9
627
.62.
04.
914.
903.
963.
842.
303.
46.
710
.817
.427
.980
199.
312.
2012
PR45
299-
14-3
-2-B
3436
.51.8
12.9
324
.81.9
5.98
5.05
4.33
3.81
2.33
7.812
.814
.719
.631
.292
218.
912.
1413
NSI
C R
c 11
3338
.11.3
14.5
423
.61.5
4.56
3.94
3.57
3.24
1.82
4.8
8.1
11.6
18.1
31.7
8624
9.44
2.24
14N
SIC
Rc
2532
36.6
1.213
.1726
.21.5
4.22
3.48
3.21
3.04
2.08
2.5
6.0
12.7
23.4
33.7
122
238.
542.
1315
NSI
C R
c 29
3141
.11.2
17.2
329
.21.4
4.40
3.82
3.59
3.14
2.09
3.2
5.3
9.8
18.6
33.0
8925
9.33
2.14
16N
SIC
Rc
194
3032
.91.1
15.8
523
.11.2
4.34
3.99
3.58
3.12
1.75
2.5
5.1
10.2
15.3
29.6
9021
9.52
2.21
17N
SIC
Rc
214
2839
.41.1
18.11
33.3
1.34.
494.
173.
883.
402.
352.
13.
97.5
18.1
32.0
100
259.
232.
1118
NSI
C R
c 21
630
38.9
1.217
.44
29.1
1.34.
473.
943.
603.
141.8
74.
06.
39.
016
.533
.987
259.
412.
2319
NSI
C R
c 21
833
41.8
1.420
.86
25.2
1.55.
454.
784.
373.
842.
184.
08.
011
.218
.031
.268
239.
632.
2020
NSI
C R
c 22
230
41.3
1.215
.71
29.2
1.35.
044.
313.
773.
371.9
93.
46.
010
.216
.937
.478
259.
222.
1521
NSI
C R
c 22
432
44.5
1.321
.34
36.4
1.54.
474.
323.
983.
512.
123.
06.
49.
014
.433
.180
299.
262.
1222
NSI
C R
c 22
632
35.2
1.314
.01
25.1
1.44.
604.
083.
733.
392.
217.0
10.7
12.7
17.2
33.6
8725
9.12
2.66
23N
SIC
Rc
238
3042
.41.2
17.0
322
.11.2
5.19
4.96
4.27
3.71
2.32
4.1
8.2
11.8
17.2
32.9
9825
8.86
2.22
24N
SIC
Rc
290
2834
.41.2
14.9
424
.01.3
4.74
4.18
3.96
3.08
2.27
3.5
7.710
.615
.430
.896
238.
572.
1125
NSI
C R
c 30
031
49.6
1.326
.27
36.0
1.64.
964.
924.
694.
081.9
52.
14.
67.7
16.6
37.6
7626
9.09
2.18
26N
SIC
Rc
302
3040
.91.2
17.19
24.7
1.34.
213.
853.
733.
211.8
82.
65.
88.
615
.733
.687
249.
722.
2927
NSI
C R
c 30
832
34.6
1.212
.32
24.8
1.43.
863.
212.
802.
361.4
73.
96.
97.9
15.2
27.5
108
229.
092.
1528
NSI
C R
c 32
433
45.2
1.318
.83
30.3
1.54.
874.
044.
143.
511.6
95.
29.
312
.320
.834
.182
269.
962.
1629
NSI
C R
c 35
231
34.5
1.112
.75
19.7
1.24.
013.
483.
012.
761.3
53.
36.
511
.617
.131
.110
222
9.48
2.12
30N
SIC
Rc
354
3247
.71.3
16.6
031
.31.6
4.32
3.84
3.52
3.05
1.81
2.7
6.3
10.5
17.0
33.8
8523
9.01
2.19
31N
SIC
Rc
356
2835
.61.0
16.0
827
.41.1
4.08
3.56
3.28
3.28
1.64
3.2
5.9
8.8
16.3
30.5
108
239.
202.
1232
NSI
C R
c 35
831
36.1
1.216
.1425
.91.2
4.43
4.06
3.71
3.14
2.03
3.6
5.4
8.0
16.6
30.0
7124
8.79
2.07
33N
SIC
Rc
360
3044
.01.3
22.3
534
.01.6
4.95
4.51
4.08
3.26
2.11
3.4
6.8
10.5
17.1
34.4
5728
9.44
2.19
34N
SIC
Rc
390
3233
.91.2
16.6
123
.51.4
4.27
3.75
3.24
2.76
1.56
3.5
7.412
.619
.229
.311
924
9.25
2.18
35N
SIC
Rc
392
3038
.01.2
19.9
526
.21.3
4.12
3.93
3.48
3.16
1.82
1.94.
47.7
16.3
31.0
9224
9.51
2.17
36N
SIC
Rc
396
2943
.31.3
16.8
432
.51.5
5.15
4.74
4.23
3.44
2.21
2.2
5.1
8.1
16.0
31.1
8224
8.55
2.20
37N
SIC
Rc
402
3444
.71.3
22.10
30.4
1.45.
124.
663.
993.
382.
072.
44.
410
.118
.231
.869
278.
942.
1738
PSB
Rc82
3136
.71.0
13.9
024
.51.1
4.30
3.56
2.98
3.01
1.70
3.2
6.1
11.8
16.1
29.5
120
218.
842.
1739
NSI
C R
c 16
030
44.8
1.421
.06
31.5
1.63.
843.
883.
413.
061.7
22.
35.
29.
718
.433
.491
249.
592.
1740
NSI
C R
c 24
032
42.4
1.419
.28
35.7
1.75.
044.
744.
303.
892.
442.
55.
110
.718
.235
.373
268.
722.
3041
NSI
C R
c 29
829
38.0
1.215
.49
26.2
1.35.
264.
534.
243.
772.
203.
86.
99.
016
.433
.511
023
9.30
2.18
42PS
B Rc
429
43.9
1.015
.78
33.0
1.23.
813.
593.
162.
972.
112.
55.
110
.816
.931
.475
239.1
72.
3043
PSB
Rc14
2835
.11.1
16.9
222
.81.2
3.66
2.93
2.69
2.64
1.36
3.0
4.8
7.213
.828
.513
218
8.99
2.10
Sht s
eedl
ing
heig
ht; lbl
leaf
bla
de le
ngth
; lbw
leaf
bla
de w
idth
; fll
flag
leaf
leng
th; flw
flag
leaf
wid
th; d
1in d
iam
eter
of 1
st in
tern
ode;
d2in
diam
eter
of 2
nd in
tern
ode;
d3in
diam
eter
of 3
rd in
tern
ode;
d4in
diam
eter
of 4
th in
tern
ode;
d5in
diam
eter
of 5
th in
tern
ode;
l1in
leng
th o
f 1st
inte
rnod
e; l2
in le
ngth
of 2
nd in
tern
ode;
l3in
leng
th o
f 3rd
inte
rnod
e; l4
in le
ngth
of 4
th in
tern
ode;
l5in
leng
th o
f 5th
inte
rnod
e; pnlm
pan
icle
num
ber p
er li
near
met
er; p
anl p
anic
le le
ngth
; gl g
rain
leng
th; g
w g
rain
wid
th.

Interdependent Trait Selection Among Rice Genotypes
26 RICE-BASED BIOSYSTEMS JOURNAL (2020) 6: 21-36
Figure 2. Anatomic evaluation: A. In5 sample collected ten days after anthesis; B. Four 20 µm thick sections stained with 0.2 ml Safranin-O solution; C. Stained sections viewed under low and high magnification; D. Arrangement of vascular bundles; E. High Power Objective image used in measuring thickness and area of cells.
Figure 3. Determination of percent lignin content using image color summarizer: A. Microscope generated image in TIFF; B. TIFF image converted to PNG; C. Pixels of colors were grouped by k-means clustering through five major groups with corresponding percent number of pixels; D. Color cluster with red-pinkish brown pixels.
image (Fig. 2). Image Color Summarizer v.0.76 (Krzywinski, 2017) processed and analyzed levels of lignin via pixels of colors ensuing k-means clustering of five major color groups with its corresponding percent number of pixels (Fig. 3).
Statistical Analysis
Nominal (Ql) and ratio (Qn) are two data types entirety of the analysis. Ql observations follow descriptions in the Bioversity International Descriptors for Wild and Cultivated Rice (2007) and describe through Shannon-Weaver Diversity Index (H’) to recognize variations among Ql traits in contrary with the lodging-tolerant check NSIC Rc 240. Arbitrary scale adapted from Jamago and Cortes (2012) categorizes computed indices into maximum (H’ = 1.00), high (H’ = 0.76-0.99), moderate (H’ = 0.46-0.75), low diversity (H’ = 0.01-0.45) and no diversity or non-variable (H’ = 0.00), and then computed based on phenotypic frequency using H’ formula (Shannon, 1948):
where H’ = the Shannon-weaver diversity index; s = total number of species in the community; i – ith species; pi = the proportion of species i relative to the total number of species; logpi = logarithm of this proportion; the result is added across species and multiplied by -1 (Beals et al., 2000). Furthermore, Multiple Correspondence Analysis determines the diversity of the 19 Ql traits (Greenacre and Blasius, 2006; Abdi and Valentin, 2007).
Qn data were arranged accordingly in General Linear Model (GLM) while Two-way Analysis of Variance (ANOVA) determined the interaction of several independent and dependent variables. Duncan’s Multiple Range Test (DMRT) at 0.05 level of significance group mean differences

Interdependent Trait Selection Among Rice Genotypes
RICE-BASED BIOSYSTEMS JOURNAL (2020) 6: 21-36 27
among treatments. Dunnett’s t-tests compared the performance of treatments against Lt (NSIC Rc 240) and Ls (PSB Rc4) control (R Core Team, 2018). The bivariate analysis was predicted through Pearson correlation (r), while multivariate analyses identified relationships among traits directly in Principal Component (PCA) and cluster analyses. Rotation in PCA revolves obliquely in the form of Promax with Kaizer normalization. Furthermore, cluster analysis in Ward’s method in Euclidian Distance distinguished Lt and Ls genotypes based on correlated traits. XLSTAT (2017) was used for bivariate and multivariate analyses.
ResultsPush-resistance at the Lower Stem of Rice
Push-resistance of lodging tolerant check was measured at 1.02 kg cm2 while the susceptible check was 0.77 kg cm2 with a mean of 0.89 kg cm2 across all test genotypes. Push-resistance varies among the 43 rice genotypes in which NSIC Rc 240 Lt check can withstand an average resistance of 1.02 kg cm2, significantly higher than the Ls check PSB Rc4 with 0.77 kg cm2 push resistance (Table 4). Thirty-one (72%) of 43 genotypes have push-resistance (0.83 – 1.08 kg cm2) comparable with NSIC Rc 240 while six genotypes (1.01 – 1.08 kg cm2) had significantly better culm strength than the susceptible check, PSB Rc4 (Fig. 4). It was observed that resistance to lodging was high during plant maturity.
Phenotypic Traits
Relationships of 19 Ql Agro-morphologic Characters to Lodging
Table 2 shows that eleven (58%) of 19 Ql traits exhibited no diversity among 43 genotypes. All test
genotypes including lodging checks showed green basal leaf sheath color, no leaf blade anthocyanin, erect leaf blade, intermediate pubescence, yellow-green auricle, light green collar, 2-cleft ligule, semi-erect panicle branches, moderate shattering, and intermediate panicle threshability. Similarities among these traits showed that line selection schemes across various environments do not significantly different indicating that preferences to certain traits among rice breeders during progeny selection were comparable.
In terms of leaf descriptors, majority (70%) have light green leaf blade while eleven (25%) genotypes have medium intensity. NSIC Rc 396 and Rc 240 showed dark intensity. Almost all (89%) of test genotypes have yellow-green ligule while five (11%) genotypes displayed white ligule. Leaf blade color intensity and ligule colors have H’ of 0.32 and 0.16 indicating low levels of diversity. Twenty-one percent of 43 rice genotypes showed erect flag leaf while 34 (79%) rice genotypes exhibited semi-erect type, similar with the resistant check, NSIC Rc 240. However, at maturity, PR39149-33-1-3-3-1-B, PR39628-17-2-1-1-B, PR43433-21-2-1-1-1-B and PR45299-14-3-2-B, NSIC Rc 194, Rc 218, Rc 226, Rc 290, and susceptible variety (PSB Rc4) were observed to change from erect to semi-erect flag leaf due to wind force and pressure. Furthermore, diversity remains to be poor at 0.22 H’. Ten (23%) of 43 rice genotypes displayed erect culm habit: PR39149-33-1-3-3-1-B, PR39628-17-2-1-1-B, PR43433-21-2-1-1-1-B, PR45299-14-3-2-B, NSIC Rc 194, Rc 218, Rc 226, Rc 290, PSB Rc82, and PSB Rc4, while the remaining 33 rice genotypes have semi-erect culm habit. Culm habit showed H’ of 0.24. Poor panicle diversity was manifested in the main axis attitude (H’ 0.27), in which 68% of test genotypes were slightly droopingwhile 32% had a strongly drooping type.
Figure 4. Phenotypes of the six highly Lt genotypes: A. PR43426-13-2-3-2-B; B. NSIC Rc 396, C. PR39142-10-3-2-1-1-B; D. NSIC Rc 29; E. NSIC Rc 240; F. PR45299-14-3-2-B; G. Proportions of intermediately Lt; H. Ls genotypes out of the 43 rice genotypes evaluated for push-resistance under direct-seeded condition.

Interdependent Trait Selection Among Rice Genotypes
28 RICE-BASED BIOSYSTEMS JOURNAL (2020) 6: 21-36
Furthermore, 73% of rice genotypes had sparse secondary branching while 27% of genotypes demonstrated dense branching (H’ 0.16). PR43433-21-2-1-1-1-B had partly exserted panicle while 11% of test genotypes had just exserted. Majority (84%) of genotypes had moderately well-exserted panicle with H’ of 0.20 (Table 2).
Relationship of 23 Qn Agro-morphologic Measurements to Lodging
In the direct-seeded condition, all Qn traits showed significant variations. Out of these 23 characters, 15 significant rice descriptors presented a noticeable relationship to lodging. Systematic reduction of internode girth was clear from the basal (1st) to terminal (5th) internodes. PR43426-13-2-3-2-B-B exhibited the widest 1st, 2nd, and 4th internodes at 6.12, 5.64, and 4.16 mm respectively, and 14% wider than NSIC Rc 240 (5.04-3.89 mm) and 35% thicker than PSB Rc4 (3.81-2.97 mm). Internode length delineated a similar trend reduction in size like in internode diameter, in which lengths tend to go higher from the basal to terminal internodes. The 1st-3rd internode were closer in length while the 4th internode was closer in length to the 1st three internodes than the 5th internode. Length of 5th internode started at 26 cm regardless of internode length. Majority of the modern-
bred rice varieties are semi-dwarf except for NSIC Rc 324, which is intermediate. NSIC Rc 392, Rc 214, Rc 300, and Rc 396 showed the shortest basal internode of 1.9, 2.1, 2.1, and 2.2 cm, respectively. NSIC Rc 300 registered in the shortest 1st to 3rd internode while having the longest 5th internode of 37.6 cm (Fig. 5). NSIC Rc 224 recorded the most extended panicle of 29 cm followed by Rc 360 (28 cm), Rc 402 (27 cm), and Rc 300 (26cm).
Culm length ranged from 60 to 92 cm while plant height was at 78-118 cm. Test genotypes were relatively short with mean culm length and plant height of 72 cm and 95 cm, respectively.
All genotypes were intermediate in leaf blade length with NSIC Rc 300 exhibiting the most extended leaf blade of 49.6 cm while PhilRice-bred lines PR45299-14-3-2-B had the widest leaf blade width of 1.8 cm. For the flag leaf length and width, NSIC Rc 224 showed the longest flag leaf of 36.4 cm while PR43433-21-2-1-1-1-B obtained the widest flag leaf at 2.0 cm. NSIC Rc 300 recorded the longest ligule of 26.27 mm while PR40432-17-3-1-2-B-B had the shortest ligule of 12.09 mm. PSB Rc14 exhibited the highest number of culms at 149 tillers while NSIC Rc 240 and Rc 402 had the lowest number of tillers (78).
Table 4. Push resistance of 43 rice genotypes against resistant check, NSIC Rc 240.
Treatment No.
Variety Name /Line Designation
Push Resistance (kgf)
Treament No. Variety Name
Push Resistance (kgf)
1 PR39142-10-3-2-1-1-B 1.05 23 NSIC Rc 238 0.832 PR39149-33-1-3-3-1-B 0.86 24 NSIC Rc 290 0.853 PR39628-17-2-1-1-B 0.89 25 NSIC Rc 300 0.914 PR40334-61-1-1-B 0.78# 26 NSIC Rc 302 0.82#
5 PR40432-10-1-1-1-B-B 0.98 27 NSIC Rc 308 0.81#
6 PR40432-14-2-1-B 0.81# 28 NSIC Rc 324 0.837 PR40432-17-3-1-2-B-B 0.82# 29 NSIC Rc 352 0.82#
8 PR43405-10-2-3-3-B 0.93 30 NSIC Rc 354 0.989 PR43425-25-2-1-1-1-B 0.94 31 NSIC Rc 356 0.8810 PR43426-13-2-3-2-B-B 1.08 32 NSIC Rc 358 0.82#
11 PR43433-21-2-1-1-1-B 0.85 33 NSIC Rc 360 0.93
12 PR45299-14-3-2-B 1.01 34 NSIC Rc 390 0.81#
13 NSIC Rc 11 0.86 35 NSIC Rc 392 0.8514 NSIC Rc 25 0.85 36 NSIC Rc 396 1.0615 NSIC Rc 29 1.03 37 NSIC Rc 402 0.9116 NSIC Rc 194 0.86 38 PSB Rc 82 0.74#
17 NSIC Rc 214 0.91 39 NSIC Rc 160 0.98
18 NSIC Rc 216 0.87 40 NSIC Rc 240 (check) 1.02
19 NSIC Rc 218 SR 0.91 41 NSIC Rc 298 0.8320 NSIC Rc 222 0.89 42 PSB Rc 4 0.77#
21 NSIC Rc 224 0.94 43 PSB Rc 14 0.78#
22 NSIC Rc 226 0.92gmean (0.89 kgf); pvalue (<.0001); r2 (0.62); cv (8.50); MSD 5% (0.20)# Rice selections significantly lower than NSIC Rc 240 at 0.05 probability levels

Interdependent Trait Selection Among Rice Genotypes
RICE-BASED BIOSYSTEMS JOURNAL (2020) 6: 21-36 29
Grain yield across genotypes ranged from 1.69 to 7.34 t/ha, with a mean yield of 5.08 t/ha. NSIC Rc 160 (7.34 t/ha), NSIC Rc 222 (7.16 t/ha), and PR40432-17-3-1-2-B-B (6.79 t/ha) were the highest-yielding test genotypes and with a significantly higher yield than the resistant check, NSIC Rc 240 (5.85 t/ha).
Characteristics of Anatomic Traits in the 5th Internode
The main deviation in the structure of rice stems rest on the proportion and spatial arrangement of vascular and ground tissues. In the internal regions of the ground tissue, Number of Adaxial (NAD) vascular bundles of 43 rice genotypes ranged from 9 to 17 with NSIC Rc 224 registering the highest frequency and Rc 194 with the least NAD. Moreover, the Area of Adaxial (AAD) span from 27.2 to 47.0 x 103 µm2 with five rice genotypes: NSIC Rc 308 (47.0 x 103 µm2), Rc 396 (44.0 x 103 µm2), Rc 224 (42.8 x 103 µm2), Rc 29 (42.5 x 103 µm2) and Rc 302 (42.1 x 103 µm2) had significantly comparable AAD with NSIC Rc 240 (45.0 x 103 µm2). From the ground tissue to the dermal tissue embed low (2-5) Number of Median (NME) vascular bundles present in most rice genotypes, while high (8-9) NME exist in NSIC Rc 214, Rc 300, Rc 396, Rc 402, and PR40432-17-3-1-2-B-B, which is noticeably higher than NSIC Rc 240 (6). Moreover, the size of the median-vascular bundle ranged from 18.3 to 30.3 x 103 µm2. Protruding in the dermal tissue of the stem set the smallest vascular bundles, the abaxial. High (17-27) Number of Abaxial (NAB) was detected in all genotypes. Only NSIC Rc 29 significantly outnumbered the lodging-tolerant
check NSIC Rc 240 (22) by 7 NAB. Moreover, NSIC Rc 214, Rc 224, Rc 360, and Rc 390 displayed NAB comparable with Rc 240. Area of Abaxial (AAB) range from 3.82 to 9.80 x 103 µm2 with NSIC Rc 29 (9.80 x 103 µm2) registering the largest AAB comparable with NSIC Rc 240 (9.17 x 103 µm2). Figure 6 elucidates the perceptible phenotypes of a highly Lt, intermediate Lt, and Ls genotypes.
Culm wall thickness (CWT) surrounds and regulates the distributions of anatomical characters whereas Thickness of Sclerenchymatous ring (TSR) protects plant organs from stretching, bending, weight and pressure, without excessive damage to the thin-walled softer cells (Esau, 1965). Significant variations among the 43 genotypes’ include CWT ranging from 398.28 to 741.20 µm, with PR43433-21-2-1-1-1-B outstandingly showed profuse CWT and provided 35% wider cellular space than the Lt check, NSIC Rc 240 (479.50 µm). TSR ranged from 24.50 to 49.80 µm, in which PR39149-33-1-3-3-1-B and NSIC Rc 390 had the thickest TSR. They also showed 46% added wall protection than Rc 240 (26.70 µm) (Fig. 7).
Lignified tissues in the 5th internode appear bright red when Safranin O (basic dye, positively charge) stains lignin-rich (acidic, negatively charge) cell walls (Kutscha and Gray 1972; Bond et al. 2008). Twenty-three of the 43 genotypes showed significantly high lignin than the Lt check NSIC Rc 240 (16.29%) and average percent lignin of 19.83. NSIC Rc 396 (24.03%) outperformed all genotypes in the content of lignin (Figure 8).
Figure 5. Internode diameter and length of the 43 rice genotypes: A. systematic reduction of thickness from the basal to the terminal internode; B. internode length tends to increase from the basal towards the terminal internode.

Interdependent Trait Selection Among Rice Genotypes
30 RICE-BASED BIOSYSTEMS JOURNAL (2020) 6: 21-36
Figure 6. Light micrographs of vascular bundles in the middle part of the 5th internode. Transverse sections of A. highly Lt (PR43426-13-2-3-2-B-B), B. intermediate Lt (NSIC Rc 222), and C. Ls (PSB Rc4) genotypes at 10 days after 100% flowering. Scale bar, 100µm.
Figure 7. Light micrographs of the thickness of the culm wall and sclerenchymatous ring in the middle part of the 5th internode. Transverse sections in a high dimension of A. PR43433-21-2-1-1-1-B with the widest CWT, B. NSIC Rc 240, Lt check, and C. PSB Rc4, Ls check. Scale bar, 200 µm.
Figure 8. Lignified portion of the micrographs captured in the middle portion of the 5th internode. Accumulation of lignin in the lignified-rich vascular bundles, culm wall, and sclerenchymatous ring. Transverse section A. Lt test genotype (NSIC Rc 396), B. Lt check (NSIC Rc 240), and C. Ls check (PSB Rc4) in approximately 20 µm thick cell.
image color summarizer 0.76 © 2006-2019 Martin Krzywinski | mkweb.bcgsc.ca
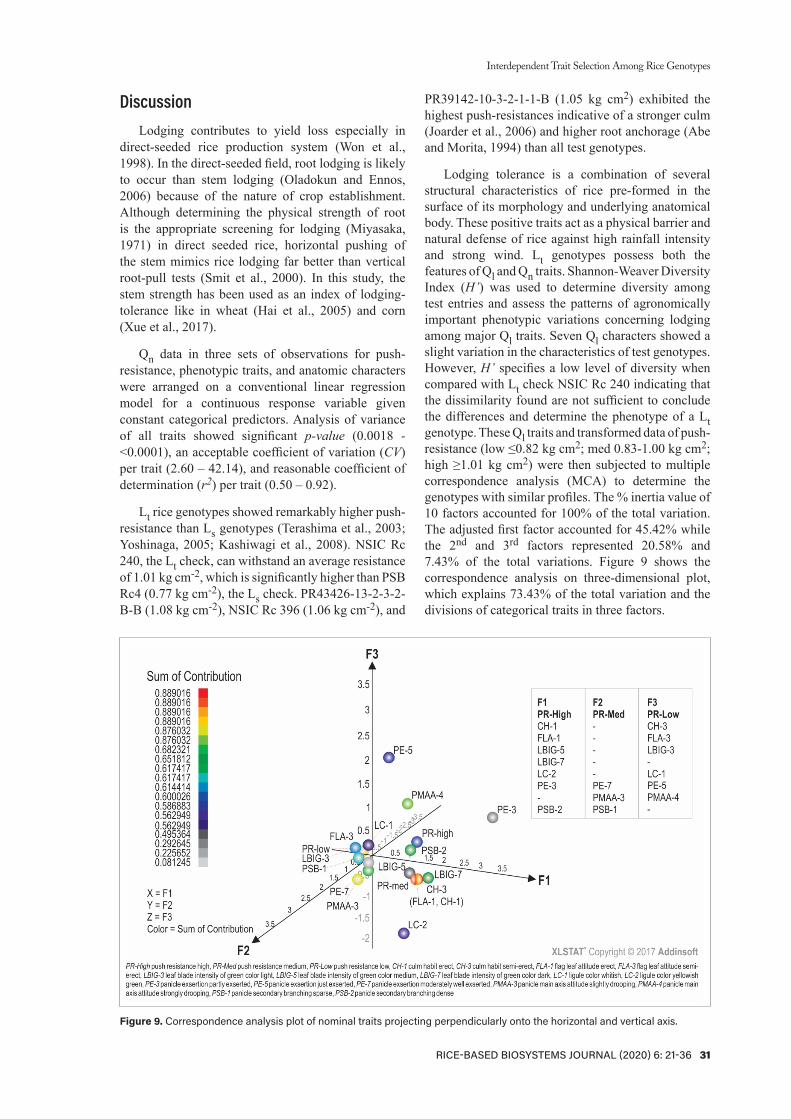
Interdependent Trait Selection Among Rice Genotypes
RICE-BASED BIOSYSTEMS JOURNAL (2020) 6: 21-36 31
DiscussionLodging contributes to yield loss especially in
direct-seeded rice production system (Won et al., 1998). In the direct-seeded field, root lodging is likely to occur than stem lodging (Oladokun and Ennos, 2006) because of the nature of crop establishment. Although determining the physical strength of root is the appropriate screening for lodging (Miyasaka, 1971) in direct seeded rice, horizontal pushing of the stem mimics rice lodging far better than vertical root-pull tests (Smit et al., 2000). In this study, the stem strength has been used as an index of lodging-tolerance like in wheat (Hai et al., 2005) and corn (Xue et al., 2017).
Qn data in three sets of observations for push-resistance, phenotypic traits, and anatomic characters were arranged on a conventional linear regression model for a continuous response variable given constant categorical predictors. Analysis of variance of all traits showed significant p-value (0.0018 - <0.0001), an acceptable coefficient of variation (CV) per trait (2.60 – 42.14), and reasonable coefficient of determination (r2) per trait (0.50 – 0.92).
Lt rice genotypes showed remarkably higher push-resistance than Ls genotypes (Terashima et al., 2003; Yoshinaga, 2005; Kashiwagi et al., 2008). NSIC Rc 240, the Lt check, can withstand an average resistance of 1.01 kg cm-2, which is significantly higher than PSB Rc4 (0.77 kg cm-2), the Ls check. PR43426-13-2-3-2-B-B (1.08 kg cm-2), NSIC Rc 396 (1.06 kg cm-2), and
PR39142-10-3-2-1-1-B (1.05 kg cm2) exhibited the highest push-resistances indicative of a stronger culm (Joarder et al., 2006) and higher root anchorage (Abe and Morita, 1994) than all test genotypes.
Lodging tolerance is a combination of several structural characteristics of rice pre-formed in the surface of its morphology and underlying anatomical body. These positive traits act as a physical barrier and natural defense of rice against high rainfall intensity and strong wind. Lt genotypes possess both the features of Ql and Qn traits. Shannon-Weaver Diversity Index (H’) was used to determine diversity among test entries and assess the patterns of agronomically important phenotypic variations concerning lodging among major Ql traits. Seven Ql characters showed a slight variation in the characteristics of test genotypes. However, H’ specifies a low level of diversity when compared with Lt check NSIC Rc 240 indicating that the dissimilarity found are not sufficient to conclude the differences and determine the phenotype of a Lt genotype. These Ql traits and transformed data of push-resistance (low ≤0.82 kg cm2; med 0.83-1.00 kg cm2; high ≥1.01 kg cm2) were then subjected to multiple correspondence analysis (MCA) to determine the genotypes with similar profiles. The % inertia value of 10 factors accounted for 100% of the total variation. The adjusted first factor accounted for 45.42% while the 2nd and 3rd factors represented 20.58% and 7.43% of the total variations. Figure 9 shows the correspondence analysis on three-dimensional plot, which explains 73.43% of the total variation and the divisions of categorical traits in three factors.
Figure 9. Correspondence analysis plot of nominal traits projecting perpendicularly onto the horizontal and vertical axis.

Interdependent Trait Selection Among Rice Genotypes
32 RICE-BASED BIOSYSTEMS JOURNAL (2020) 6: 21-36
In Multiple Correspondence Analysis, all variables have the same status. Therefore, it can be seen as an overall dimension toward lodging-tolerance with a relatively high push-resistance and relatively low push-resistance. The seven agronomic traits in terms of its quality were distributed according to its principal coordinates. Squared cosine explains the contribution of a component to the squared distance of the observation origin. It corresponds to the angle of the squared cosine from the right triangle made with the origin, observation, and projection on the component (Abdi and Williams, 2010). The 1st dimension represents the seven codes of Ql traits associated with high push-resistance: erect culm habit, erect flag leaf attitude, medium to dark leaf blade intensity of green color, yellowish-green ligule color, partly-exserted panicle exsertion, and dense panicle secondary branching. The 2nd dimension epitomizes medium push-resistance define in three codes of Ql traits: the moderately well-exserted panicle exsertion, the slightly drooping panicle main axis attitude, and the sparse panicle secondary branching. The 3rd dimension provides the undesirable Ql traits related with low push-resistance per se express in six codes of Ql traits: the semi-erect culm habit and flag leaf attitude, the light leaf blade intensity of green color, the whitish ligule color, the just exserted panicle exsertion, and the strongly drooping panicle main axis attitude.
Correlation (r) is useful in determining the overall linear association between any two independent variables. Selection based on the detailed knowledge of magnitude and direction of the association between traits of interest and its attributes is critical in identifying the principal characters, which can be exploited for crop improvement through a suitable breeding program (Rabindra Babu et al., 2012). Strong positive r existed in push-resistance to the diameter of 2nd internode (r 0.58), diameter of 1st internode (r 0.57), diameter of 3rd internode (r 0.57), flag leaf width (r 0.57), and leaf blade width (r 0.54). Medium positive associations were present in push resistance and diameter of 4th internode (r 0.49), flag leaf length (r 0.45), culm wall thickness (r 0.44), diameter of 5th internode (r 0.44), leaf blade length (r 0.44), length of 5th internode (r 0.42), number of abaxial vascular bundles (r 0.38), plant height (r 0.35), panicle length (r 0.34), ligule length (r 0.33), number of adaxial vascular bundles (r 0.31), length of 4th internode (r 0.30), and culm length (r 0.30). Medium negative r was accounted between push-resistance and culm number per linear meter (r -0.37) and panicle number per linear meter (r -0.31). A significant r does not indicate causality but a common linkage in a sequence
of events. The coefficient of determination (r2) is more useful than r as it gives a more plausible statistical explanation of the relationship between push-resistance and phenotypic traits. In r analysis, strong r occurs on push-resistance and the diameter of 2nd internode, however, r2 is equal only to 0.33 signifying 33% of the variability linked the relationship of the two factors. The remaining 67% is the contribution of other factors that influence push-resistance but not measured in the analysis, which is one of the limitations of Bivariate techniques (Goodwin and Leech, 2006).
Morphologic, agronomic, and anatomic traits with significant r to push-resistance continue through Principal Component Analysis (PCA) following Promax rotation (Abdi, 2003) for better visualization and identification of hidden categories in multiple independent variables (Smith, 2002). PCA is a method for reducing the dimensionality of datasets (Devarajan, 2016); improving interpretability while at the same time minimizing information loss (Jolliffe and Cadima, 2016). It is a multivariate technique that allows summarizing the systematic patterns of variations in the data (Sanchez, 2012). Rotation of eigenvectors (factors) is essential to achieve a simple structure (Bryant and Yarnold, 1995), in which correlated traits to push-resistance follow the oblique rotation. Majority of the factor correlations exceed 0.32, which warrants greater than 10% overlap in variance among factors, enough variance to warrant oblique rotation (Tabachnick and Fiddell, 2013). The resulting factor loadings after Promax rotation satisfied the five requirements set by Thurstone (1947) to achieve a simple structure. The analysis resulted in 22 factors with a cumulative variance of 100%, in which six factors were retained based on the proportion of variance or eigenvalues greater than 1 to retain positive variability (Kaiser, 1960). The first six principal components accounted for 84.68% of the total variation among genotypes. The 1st factor had factor loading of 0.80-0.89 and set of the diameter of 1st to 5th internodes. The 2nd factor with a factor loading of 0.42-0.92 linked the length of 4th and 5th internode, culm length, and plant height. The 3rd factor associated panicle length, culm wall thickness, and number of adaxial and abaxial vascular bundles with factor loadings of 0.42-0.87. The 4th factor (0.45-0.74) connected push-resistance, leaf blade width, flag leaf width, and culm wall thickness. In the 5th factor, culm and panicle number per linear meter had factor loadings from -0.85 to -0.91, while in the 6th factor (0.71-0.89) leaf blade length, ligule length, and flag leaf length were integrated (Fig. 10).

Interdependent Trait Selection Among Rice Genotypes
RICE-BASED BIOSYSTEMS JOURNAL (2020) 6: 21-36 33
Through PCA, the contributions of the diameter of internodes from the basal (1st internode) to the terminal (5th internode) in a lodging-tolerance trait were highlighted. The ideal plant height and the distributions of its length in the culm, 4th internode, and 5th internode were expressed in lodging-tolerance. The compress data identified the closeness of panicle length to anatomic traits in the culm wall thickness, and number of abaxial and adaxial vascular bundles, which are related to the lodging-tolerance trait.
It is essential to identify levels of similarity and the dissimilarity of rice genotypes and determine its levels of tolerance to lodging. Cluster analysis method allows assembling similar items belonging to the same class (XLSTAT, 2017) and partitions the data sets into subsets according to its Euclidian distance (Lee et al., 2012; Madhulatha, 2012). Push-resistance and correlated traits data were centered, reduced, and truncated to avoid group scaling effects and show entropy based homogenous groups. Forty-three rice genotypes were grouped using Ward’s method in Euclidian distance (0.33), which divided the genotypes into four clusters: 1st cluster consisted of 9 genotypes, 2nd cluster with 13 test entries, 3rd
cluster with four accessions, and 4th cluster with 17 cultivars (Fig. 11). Cluster III obtained highest mean values of push-resistance, leaf blade length and width, ligule length, flag leaf length and width, diameter of 1st to 5th internode, length of 4th and 5th internode, panicle and culm length, plant height, number of adaxial and abaxial vascular bundles and culm wall thickness with he lowest in terms of the number of culm and panicle per linear meter. Thus, cluster III became the Lt cluster, followed by clusters IV and II, while cluster I is the most Ls cluster. Cluster III was composed of NSIC Rc 360 (genotype 33), NSIC Rc 396 (G36), PR45299-14-3-2-B (G12), and NSIC Rc 300 (G25) with average push-resistance of 0.98 kg cm2.
Moreover, cluster IV with category of intermediate tolerance to lodging had mean push-resistance of 0.93 kg cm2, which included NSIC Rc 218 (G19), Rc 402 (G37), Rc 240 (G40), PR43405-10-2-3-3-B (G8), Rc 354 (G30), Rc 160 (G39), Rc 11 (G13), PR39142-10-3-2-1-1-B (G1), PR43426-13-2-3-2-B-B (G5), Rc 29 (G15), Rc 194 (G16), Rc 302 (G26), Rc 224 (G21), Rc 222 (G20), Rc 358 (G32), PR40432-14-2-1-B (G6), and PR43426-13-2-3-2-B-B (G10).
Figure 10. PCA Biplot of push-resistance and 21 correlated traits showing six groups after PROMAX rotation: A. Distribution of factors in dimension 1 and 2; B. Projection of factors in dimensions 3 and 4; C. Dissimilarity of factors in dimensions 5 and 6.
Figure 11. The distribution of 43 rice genotypes into four types of cluster based on push-resistance and correlated traits using Ward’s method in Euclidian Distance.

Interdependent Trait Selection Among Rice Genotypes
34 RICE-BASED BIOSYSTEMS JOURNAL (2020) 6: 21-36
In cluster IV, rice genotypes 6, 26, and 32 had low push-resistances of 0.81-0.82 kg cm2 but was still included in this series. It is assumed that other unmeasured factors hindered its push-resistance expression. Cluster II (intermediate susceptibility, mean push-resistance of 0.85 kg cm2) genotypes was composed of PR39149-33-1-3-3-1-B (G2), NSIC Rc 308 (G27), Rc 216 (G18), PR43425-25-2-1-1-1-B (G9), NSIC Rc 290 (G24), Rc 214 (G17), Rc 226 (G22), Rc 392 (G35), PR43433-21-2-1-1-1-B (G11), NSIC Rc 238 (G23), PR40334-61-1-1-B (G4), PSB Rc4 (G42), and NSIC Rc 324 (G28). PR434325-25-2-1-1-1-B (G9) had high push-resistance of 0.94 kg cm2. However, G9 was considered an outlier as other rice traits excluded in the study could be possibly contributing to its lodging-tolerance; thus, warrantingfurther investigation. Cluster I (susceptible, mean push-resistance of 0.82 kg cm2) included PR40432-17-3-1-2-B-B (G7), NSIC Rc 390 (G34), Rc 25 (G14), Rc 352 (G29), Rc 298 (G41), PR39628-17-2-1-1-B (G3), NSIC Rc 356 (G31), PSB Rc 82 (G38), and Rc 14 (G43), which had lower push-resistance than the Ls check, PSB Rc4 (G42). The dendrogram showed maximum Euclidian distance is present between cluster III and cluster I indicating two groups of rice genotypes with different levels of tolerance to lodging. Cluster analysis presents a complete view of the variation present among 43 rice genotypes and provides rice breeders a more consistent approach in improving genetic diversity and combination.
Furthermore, NSIC Rc 300, Rc 360, Rc 396, and PR45299-14-3-2-B were identified as Lt genotypes with high mean values of push-resistance (1.0 kg cm2), leaf blade length (43.4 cm), leaf blade width (1.4 cm), ligule length (19.6 mm), flag leaf length (31.8 cm), flag leaf width (1.7 cm), diameter of 1st internode (5.3 mm), diameter of 2nd internode (4.8 mm), diameter of 3rd internode (4.3 mm), diameter of 4th internode (3.7 mm), diameter of 5th internode (2.2 mm), length of 5th internode (33.6 cm), number of abaxial vascular bundle (24), culm wall thickness (608.5 µm), average values of length of 4th internode (17.3 cm), panicle length (24.8 cm), culm length (73 cm), plant height (97.8 cm), and number of adaxial vascular bundle (13).
ConclusionPreliminary investigation on the relationship of
push-resistance, phenotypic traits, and anatomical characteristics showed information in increasing tolerance to lodging and improving screening techniques in the direct-seeded system. Based on results of the study, genotypes with a resistive force of 1.01-1.08 kg cm2 had push-resistance comparable with NSIC Rc 240 and had better culm strength than PSB Rc4; indicating high tolerance to lodging during maturity. Rice genotypes with high lodging tolerance
are supported by simultaneous increases in the leaf area (leaf blade, ligule, flag leaf), diameter of the stem (diameter of the 1st to 5th internodes), extension of the upper internodes (length of 4th to 5th internode, culm length, plant height and panicle length), and anatomical structures (number of abaxial and adaxial vascular bundles, culm wall thickness). It was noted that the increase in the number of culm has a negative effect on strength and elasticity of the stem as the number increases above 100 tillers per linear meter. Rice genotype with upright culm habit flag leaf, medium to dark green leaf blade, yellowish-green ligule color, partly-exserted panicle exsertion, and dense panicle secondary branching is a phenotype of a highly Lt plant.
Studies to further support lodging should focus on the interaction of culm, leaf sheath, panicle weight, and root. A multi-environment testing sites should be conducted to assess the effect of environment to these traits, which can provide additionl information in breeding activites for the direct-seeded rice. Identification of these fundamental traits will hasten the development of lodging tolerant cultivars through conventional breeding for highly heritable desirable traits and even marker-assisted breeding.
Acknowledgments The researchers are grateful to N.V. Tamayo and
R.T. Alberto for their guidance and advice; C.C. Abon and A.S. Latonio for sharing their expertise in rice physiology and statistics; and the Plant Breeding and Biotechnology Division particularly to the direct seeded rice breeding group for providing seeds and assistance.
Literature CitedAbe J, Morita S (1994) Growth direction of nodal roots in rice: its
variation and contribution to root system formation. Plant and Soil 165(2): 333-337. doi: https://link.springer.com/article/10.1007/BF00008078
Abdi H, Valentin D (2007) Multiple correspondence analysis. In Salkind N (Ed). Encyclopedia of Measurement and Statistics. The University of Texas, Dallas, USA, pp 651-557
Abdi H, Williams LJ (2010) Principal component analysis. Wiley Interdisciplinary Reviews: Computational Statistics 2(4): 433-459. doi: https://doi.org/10.1002/wics.101
Abdi H (2003) Factor rotations in factor analyses. Encyclopedia for Research Methods for the Social Sciences 792-795. doi: https://www.utdallas.edu/~herve/Abdi-rotations-pretty.pdf
Alias I, A’aini AR, Abd Salim H (1989) Penilaian awal ke atas kesan rebah terhadap hasil dan mutu padi (in English abstract). Teknol. Padi, MARDI 5: 51-5. doi: http://www.lib.upm.edu.my/
Babu VR, Shreya K, Dangi KS, Usharani G, Shankar AS (2012) Correlation and path analysis studies in popular rice hybrids of India. International Journal of Scientific and

Interdependent Trait Selection Among Rice Genotypes
RICE-BASED BIOSYSTEMS JOURNAL (2020) 6: 21-36 35
Research Publications 2(3): 156-158. doi: http://citeseerx.ist.psu.edu/viewdoc/download?doi=10.1.1.307.6810&rep =rep1&type=pdf
Beals M, Gross L, Harrell S (2000) Diversity indices: Shannon’s H and E. The Institute for Environmental Modelling (TIEM), University of Tennessee, USA
Bioversity International, IRRI, WARDA (2007) Descriptors for wild and cultivated rice (Oryza spp.). Bioversity International, Rome, Italy; International Rice Research Institute, Los Baños, Philippines; WARDA, Africa Rice Center, Cotonou, Benin
Bond J, Donaldson L, Hill S, Hitchcock K (2008) Safranine fluorescent staining of wood cell walls. Biotechnic and Histochemistry 83(3-4): 161-171. doi: https://doi.org/10.1080/10520290802373354
Bryant FB, Yarnold PR (1995) Principal components analysis and exploratory and confirmatory factor analysis. In Grimm LG and Yarnold PR (Eds.). Reading and Understanding Multivariate Statistics. American Psychological Association, Washington DC, pp 99-136
BSWM (2017) Soils of the country, lowland soils of the Philippines. Bureau of Soils and Water Management. http://www.bswm.da.gov.ph/PhilippinesSoils/LowlandSoils (accessed January 30, 2017)
Corporal-Lodangco IL, Leslie LM (2014) Climatology of Philippine tropical cyclone activity: 1945-2011. International Journal of Climatology 37(9): 3525-3539. doi: https://opus.lib.uts.edu.au/bitstream/ 10453/123743/ 4/OCC-115423_AM.pdf
Devarajan K (2016) The antsy social network: determinants of nest structure and arrangement in Asian weaver ants. PLOS ONE 11(6). doi: https://doi.org/10.1371/journal.pone.0156681
Easson DL, White EM, Pickles SJ (1993) The effects of weather, seed rate and cultivar on lodging and yield in winter wheat. The Journal of Agricultural Science 121(2): 145 156. doi: https://doi.org/10.1017/S0021859600077005
Esau K (1965) Sclerenchyma. In Esau K (ed) Plant Anatomy, 2nd edn. John Wiley & Sons, Inc. New York, pp 203-225
Frei M (2013) Lignin: Characterization of a multifaceted crop component. The Scientific World Journal. doi: http://dx.doi.org/10.1155/2013/436517
Goodwin LD, Leech NL (2006) Understanding correlation: Factors that affect the size of r. The Journal of Experimental Education 74(3): 251-266. doi: https://pdfs.semanticscholar.org/b6cf/001cbab0375a96 c370585462 dd3c163669af.pdf
Greenacre M, Blasius J (2006) Multiple correspondence analysis and related methods. doi: 10.1201/9781420011319.ch1
Hai L, Guo H, Xiao S, Jiang G, Zhang X, Yan C, Xin Z, Jia J (2005) Quantitative trait loci of stem strength and related traits in a doubled-haploid population of wheat (Triticum aestivum L.). Euphytica 141: 1-9. doi: https://doi.org/10.1007/s10681-005-4713-2
Hitaka N (1968) Studies on the lodging of rice plants. National Institute of Agricultural Sciences Series A-15: 1-175. doi: https://eurekamag.com/pdf/002/002887222.pdf
Hoshikawa K, Wang SB (1990) Studies on lodging in rice plants. A general observation on lodged rice culms. Japan Journal of Crop Science 59: 809-814. doi: https://doi.org/10.1626/jcs.59.809
IRRI (2014) Standard evaluation system for rice (SES), 5th edition. International Rice Research Institute Los Baños Philippines
Jamago JM, Cortes RV (2012) Seed diversity and utilization of the upland rice landraces and traditional varieties from selected areas in Bukidnon, Philippines. IAMURE International Journal Ecology and Conservation 4: 112-130. doi: http://dx.doi.org/10.7718/ijec.v4i1.366
Joarder N, Gupta UK, Sima SN (2006) Culm traits and its relation with lodging in rice (Oryza sativa L.). Bangladesh Journal of Genetics and Biotechnology 7(1): 29-32. doi: https://www.banglajol.info/index.php /BJGB/article/view/2358
Johansen DA (1940) Plant microtechnique, Chapter VI Stains, 1st edn. McGraw-Hill Book Company, Inc. New York and London, pp 49-94
Jolliffe IT, Cadima J (2016) Principal component analysis: A review and recent developments. Philosophical Transactions of the Royal Society: Mathematical, Physical and Engineering Sciences 374 (2065). doi: http://dx.doi.org/10.1098/rsta.2015.0202
Kaiser HF (1960) The application of electronic computers to factor analysis. Educational and Psychological Measurement 20(1): 141-151. doi: https://doi.org/10.1177%2F001316446002000116
Kashiwagi T, Ishimaru K (2004) Identification and functional analysis of a locus for improvement of lodging resistance in rice. Plant Physiology 134(2): 676-683. doi: https://doi.org/10.1104/pp.103.029355
Kashiwagi T, Sasaki H, Ishimaru K (2005) Factors responsible for decreasing sturdiness of the lower part in lodging of rice (Oryza sativa L.). Plant Production Science 8(2): 166-172. doi: https://doi.org/10.1626/pps.8. 166
Kashiwagi T, Togawa E, Hirotsu N, Ishimaru K (2008) Improvement of lodging resistance with QTLs for stem diameter in rice (Oryza Sativa L.). Theoretical and Applied Genetics 117(5): 749-57. doi: 10.1007/s00122-008-0816-1
Kobayashi H, Hitaka N (1968) Studies on the lodging of rice plant (7) on the photosynthetic ability in lodged rice plant. Journal of Agricultural Meteorology 24(2): 67-74. doi: https://doi.org/10.2480/agrmet.24.67
Kong L, Sun M, Wang F, Liu J, Feng B, Si J, Zhang B, Li S, Li H (2014) Effects of high NH4+ on K+ uptake, culm mechanical strength and grain filling in wheat. Frontiers in Plant Science 5(703): 1-10. https://doi:10.3389/fpls.2014. 00703
Krzywinski M (2017) Image color summarizer 0.76. http://mkweb.bcgsc.ca/color-summarizer (accessed January 30, 2017)
Kutscha N, Gray JR (1972) TB53: The suitability of certain stains for studying lignification in balsam fir, Abies balsamea (L.) Mill. doi: https://digitalcommons.library.umaine.edu/cgi/viewcontent.cgi?article= 1148&context=aes_techbulletin
Lang YZ, Yang XD, Wang ME, Zhu QS (2012) Effects of lodging at different filling stages on rice yield and grain quality. Rice Science 19(4): 315-319. doi: https://doi.org/10.1016/S1672-6308(12)60056-0
Interdependent Trait Selection Among Rice Genotypes
36 RICE-BASED BIOSYSTEMS JOURNAL (2020) 6: 21-36
Lee I, We GJ, Kim DE, Cho YS, Yoon MR, Shin M, Ko S (2012) Classification of rice cultivars based on cluster analysis of hydration and pasting properties of their starches. LWT-Food Science and Technology 48(2): 164-168. doi: https://doi.org/10.1016/j.lwt.2012.03.002
Madhulatha, TS (2012) An overview on clustering methods. IOSR Journal of Engineering 2(4): 719-725. doi: https://arxiv.org/ftp/arxiv/papers/1205/1205.1117.pdf
Manangkil OE, Vu HTT, Mori N, Yoshida S, Nakamura C (2013) Mapping of quantitative trait loci controlling seedling vigor in rice (Oryza sativa L.) under submergence. Euphytica 192: 63-75. doi: https://doi.org/10.1007/s10681-012-0857-z
Miyasaka A (1971) Cultural significance of physical strength of rice root. JARQ 6(1): 20-24. doi: https://www.jircas.go.jp/ja/file/7196/download?token=wdTufrRZ
Oladokun M, Ennos A (2006) Structural development and stability of rice Oryza sativa L. var. Nerica 1. Journal of Experimental Botany 57(12): 3123-3130. doi: https://academic. oup.com/jxb/article/57/12/3123/446927
Ookawa T, Ishihara K (1992) Varietal difference of physical characteristics of the culm related to lodging resistance in paddy rice. Japanese Journal of Crop Science 61(3): 419-425. doi: https://doi.org/10.1626/jcs.61.419
PAGASA (2014) Exogenous factors, tropical cyclone frequency, by item and year. Philippine Food Security Information System. http://philfsis.psa.gov.ph/index.php/id/15/matrix/ J30FSTII (accessed January 30, 2017)
PAGASA (2017) Climate of the Philippines, climate types. Philippine Atmospheric, Geophysical and Astronomical Services Administration. https://www1.pagasa.dost. gov.ph/index.php/climate-of-the-Philippines (accessed January 30, 2017)
PAGASA (2019) Public storm warning signal system. Philippine Atmospheric, Geophysical and Astronomical Services Administration. http://bagong.pagasa.dost.gov.ph/learning- tools/public-storm-warning-signal (accessed January 30, 2017)
PHILFSIS (2019) Exogenous factors, monthly rainfall, by station, year and month. Philippine Food Security Information System. http://philfsis.psa.gov.ph/index.php/id/15/matrix/COMFSMRI3O9019M220190130 1605 (accessed January 30, 2019)
PhilRice (2017) Meteorological data from January to May. Climate Change Center Agrometeorological Observatory, Philippine Rice Research Institute, Maligaya, Science City of Muñoz, Nueva Ecija
R Core Team (2018) R: A language and environment for statistical computing. R Foundation for Statistical Computing, Vienna, Austria. doi: https://www.r-project.org/
Salassi ME, Deliberto MA, Linscombe SD, Wilson Jr CE, Walker TW, Mccauley GN, Blouin DC (2013) Impact of harvest lodging on rough rice milling yield and market price. Agronomy Journal 105(6): 1860-1867. doi: https://dl.sciencesocieties.org/publications/aj/abstracts/ 105/6/1860
Sanchez G (2012) Five Functions to do Principal Components Analysis in R. Visually Enforced http://www.gastonsanchez.com/visually-enforced/how-to/2012/06/17/PCA-in-R/
Setter T, Laureles E, Mazaredo A (1997) Lodging reduces yield of rice by self-shading and reductions in canopy photosynthesis. Field Crops Research 49: 95-106. doi: https://eurekamag.com/pdf/002/002887222.pdf
Shannon CE (1948) A mathematical theory of communication. The Bell System Technical Journal 27: 379-423,623-656. doi: http://math.harvard.edu/~ctm/home/text/others/shannon /entropy/entropy.pdf
Smit AL, Bengough AG, Engels C, Van Noordwijk M, Pellerin S, Van De Geijn SC (2000) Plant anchorage, horizontal pushing or pulling tests. In Smit AL et al. (Eds.). Root Methods: A Handbook. Springer Science & Business Media, pp 559-562
Smith LI (2002) A tutorial on principal components analysis. University of Otago, New Zealand
Tabachnick BG, Fidell LS (2013) A guide to statistical techniques: using the book. In Tabachnick BG (Eds.). Using Multivariate Statistics, 2nd edn. HarperCollins Publishers, California State University, Northridge, pp 20-28
Tabbal DF, Bouman BAM, Bhuiyan SI, Sibayan EB (2002) Improving lodging resistance of direct wet-seeded rice. Philippine Journal of Crop Science 27(2): 53-62. doi: https://www.cabi.org/gara/FullTextPDF/2009/200930192 76.pdf
Terashima K, Taniguchi T, Ogiwara H, Umemoto T (2003) Effect of field drainage on root lodging tolerance in direct-sown rice in flooded paddy field. Plant Production Science 6(4): 255-261. doi: https://doi.org/10.1007/s00122-008-0816-1
Thurstone LL (1947) Uniqueness of simple structure in a given correlation matrix. In Thurstone LL (Ed.). Multiple Factor Analysis: A Development and Expansion of Vectors of the Mind. University of Chicago Press, pp 354-356
Van Delden S, Vos A, Ennos A, Stomph T (2010) Analysing lodging of the panicle bearing cereal teff (Eragrostis tef). New Phytologist 186: 696-707. doi: https://doi.org/10.1111/j.1469-8137.2010.03224.x
Won JG, Hirahara Y, Yoshida T, Imabayashi S (1998) Selection of rice lines using SPGP seedling method for direct seeding. Plant Production Science 1(4): 280-285. doi: https://www.tandfonline.com/action/showCitFormats?doi=10.1626/pps.1.280
XLSTAT (2017) Agglomerative hierarchical clustering. XLSTAT Your Data Analysis Solution. https://www.xlstat.com/en/solutions/features/agglomerative-hierarchical-clustering-ahc (accessed October 25, 2017)
XLSTAT (2017) Data analysis and statistical solution for Microsoft Excel. XLSTAT Free Trial and Free Version. Addinsoft, Paris, France. https://www.xlstat.com/en/
Xue J, Xie R, Zhang W, Wang K, Hou P, Ming B, Gou L, Li S (2017) Research progress on reduced lodging of high-yield and -density maize. Journal of Integrative Agriculture 16(12): 2717-2725. doi: 10.1016/S2095-3119(17)61785-4
Yoshinaga S (2005) Improved lodging resistance in rice (Oryza sativa L.) cultivated by submerged direct seeding using a newly developed hill seeder. Japan Agricultural Research 39(3): 147-152. doi: https://www.jircas.go.jp/en/publication/jarq/39/3/147

RICE-BASED BIOSYSTEMS JOURNAL (2020) 6: 37-47 37
POLLEN FERTILITY AND YIELD PARAMETERS OF RICE (ORYZA SATIVA L.) UNDER HIGH
TEMPERATURE ENVIRONMENTSLowel V. Guittap1, Pompe C. Sta. Cruz2, Jose E. Hernandez2,
Edna A. Aguilar2, and Norvie L. Manigbas1
1Philippine Rice Research Institute, Philippines 2 Crop Science Cluster, College of Agriculture, University of the Philippines, Los Baños, Laguna 4031, Philippines
*Corresponding Author:[email protected]
AbtractDevelopment of new varieties with high temperature tolerance combined with desirable traits is important
in addressing climate change impact in rice production. Progeny derived from crossing high-yielding varieties with heat-tolerant donors were evaluated to determine the effect of high temperature on pollen fertility, yield, and yield components. The study was conducted in two locations with varying temperature regimes, Los Baños (LB) and Nueva Ecija. The experiment in Nueva Ecija was established in the field (NE-F) and glasshouse (NE-GH). Maximum temperatures ranged 35.43-38.40oC that generally reduced pollen fertility by as much as 40% in susceptible entries. Genotypes with 80% pollen fertility beyond 38°C were identified. Genotypes with stable pollen fertility were: PR44505A12-1-3, PR42222-3-1, and PR42222-20-3. The genotypes exhibited high percent pollen fertility (PPF) of more than 80% similar to the tolerant check variety N22. PR44500B17-3-3 and PR44505A19-27-1 had high (>80%) PPF in LB and NE-F. In terms of grain yield, 12 genotypes were consistent high yielders across locations. The number of panicles m-2 was reduced under maximum temperatures of 33oC and higher during vegetative stage. Other yield components such as spikelets panicle-1, percent grain filling, and 1000-seed weight were not affected by high temperature although some genotypes were identified to perform under high temperature of more than 35oC; thus, they were included in the selection. Three more genotypes, PR44505A14-15-2, PR42222-3-2, and PR44505A26-5-3, were selected as potential heat-tolerant materials for evaluation and improvement.
Keywords: High Temperature, Pollen Fertility, Yield, Yield Component.
IntroductionClimate change brought about by gradual global
warming is currently one of the major concerns in agricultural production. The earth’s temperature is predicted to increase by an average of 2-4oC by the end of the 21st century (IPCC, 2007) due to both anthropogenic and natural factors (Eitzinger et al., 2010). In the Philippines, records at International Rice Research Institute (IRRI) showed that annual mean maximum and minimum temperatures have increased by 0.35°C and 1.13°C, respectively, in 1979-2003 (Peng et al., 2004). The major contributing factor to this increase in temperature is the emission of greenhouse gases (GHG) such as: carbon dioxide (CO2), methane (CH4), and nitrous oxide (N2O) (Maraseni et al., 2009; Smith and Olesen, 2010).
The temperature increase due to global warming could enhance agriculture production in some temperate countries, while reduction would probably be felt in most Asian countries (Rosenzweig and Parry, 1994) including the Philippines where current temperature is close to optimum for rice productivity
(Zhang et al., 2013; Aghamolki et al., 2014), and further increase in the temperature would be detrimental to yield. Future rice will be grown in much warmer environments (Battisti and Taylor, 2009) with a greater likelihood of high temperatures coinciding with heat-sensitive processes during the reproductive stage. Nearly half of the world’s population depends on rice, and an increase in rice production by 0.6-0.9% annually until 2050 is needed to meet the demand (Carriger and Vallee, 2007). One of the most effective ways of mitigating the effect of climate change is the deployment of high temperature-tolerant cultivars (Manigbas and Sebastian, 2007). In breeding stress tolerant crops, information on the effect of temperature to rice growth and development is necessary (Wahid et al., 2007). At organismic level, it is important to study the effect of temperature on rice yield through its pollen behavior and response of yield parameters.
Several researchers have reported detailed information on the effect of high temperature during vegetative (Yoshida 1978; Yoshida 1981), reproductive, and anthesis stage (Jagadish et al., 2007; Jagadish et al., 2010) and grain formation
Received: May 24, 2019 • Accepted:February 14, 2020
FULL PAPER

Pollen Fertility and Yield Parameters of Rice
38 RICE-BASED BIOSYSTEMS JOURNAL (2020) 6: 37-47
(Morita, 2004) of rice. Previous studies reported the development of heat tolerant lines using N22 as donor parent, which is one of the most heat tolerant genotypes in chamber and field experiments (Jagadish et al., 2010; Ye et al., 2012; Poli et al., 2013; Manigbas et al., 2014). Breeding for heat tolerance in rice at the Philippine Rice Research Institute (PhilRice) started in 2010 in collaboration with other countries in Southeast Asia. This partnership aimed to develop heat-tolerant rice, establish a protocol for screening heat-tolerant genotypes, and identify location specific varieties that can adapt and tolerate heat stress (Manigbas et al., 2014). Despite these efforts, heat-tolerant varieties are yet to be released in the Philippines.
This study was conducted to quantify the pollen fertility and yield formation of backcross inbred lines (BILs) generated from the cross combination between popular Philippine and Korean cultivars (recurrent parents) and heat tolerant donors in response to high temperature. It is hypothesized that high amount of pollen grains dehisced to stigma determines the capability of the rice plant to tolerate high temperatures during flowering. Information generated in this area will be helpful in understanding the mechanism of high temperature tolerance and identification of key traits to select in breeding programs lines. Additionally, identified lines from the cross between a widely-grown, high-yielding varieties and heat tolerant donors will be used as an important genetic source in developing heat tolerant varieties for Philippine condition.
Materials and MethodsTime and Place of Study
The study was conducted from January to May 2014 in two locations representing two temperature regimes: Science City of Muñoz, Nueva Ecija and Los Baños, Laguna. The experiment in Nueva Ecija was established in two separate set-ups: in the field
(NE-F) and glasshouse (NE-GH). The entries were grouped based on their number of days to flowering stage and were seeded to coincide with the occurrence of high temperatures. Grospe et al. (2016) conducted similar study on screening QTL for high-temperature tolerance in rice.
Genotypes Tested in the Experiment
Progenies of three populations derived from the method described in Figure 1 were tested. The progenies were generated by crossing a local popular rice variety NSIC Rc 160 and introduced South Korean varieties Hanareumbyeo and Gayabyeo as recurrent parents with heat-tolerant varieties N22 and Dular as donors’ parents for heat tolerance. NSIC Rc 160 is a widely grown indica variety in the Philippines while Hanareumbyeo and Gayabyeo are Tongil type (92% indica and 8% japonica background) varieties from South Korea. The recurrent parents were identified as susceptible to high temperature particularly at reproductive stage. Tolerant (N22 and Dular), intermediate (IR64 and Milyang 23), and susceptible (IR52) genotypes to high temperature were used as check varieties including the parents of each population. The progeny designation of each individual line is presented in Table 1.
Field Experiments
Field experiments in Nueva Ecija (NE-F) and Los Baños (LB) were established in 2014 dry season (DS). Fifteen plants per entry were transplanted using one seedling per hill at 20 cm x 20 cm spacing. The experiment was laid out in randomized complete block design (RCBD) with four replications. The temperature and relative humidity in Nueva Ecija were measured at 1 m above the canopy and within-canopy layer every 2 min for 24 h daily and 7 days a week using an automated Micrometeorological Instrument for Near Canopy Environment of Rice (MINCER). Data on temperature and relative
Figure 1. Composition of the pedigree nursery of the backcross inbred lines (BILs) tested in the study. (POP1-NSIC Rc160/Dular; POP2-Hanareumbyeo/N22; POP3-Gayabyeo/N22). (Manigbas et al., 2014).

Pollen Fertility and Yield Parameters of Rice
RICE-BASED BIOSYSTEMS JOURNAL (2020) 6: 37-47 39
humidity in Los Baños were collected from the PAGASA Agro-meteorological Station located at Pili Drive, UPLB Campus, Los Baños, Laguna. Standard land preparation operations for lowland irrigated rice were conducted. Recommended fertilizer application rates for Nueva Ecija (120N, 60P2O5, 60K2O) and Los Baños (140N, 40P2O5, 40K2O) per hectare bases were used. Optimum control on pests and diseases were implemented.
Glasshouse Experiment
The glasshouse experiment in Nueva Ecija (NE-GH) was laid out in RCBD with four replications with 10 plants per entry planted at one plant per hill using 20 cm x 20 cm spacing. The temperature and relative humidity were measured using MINCER. In glasshouse experiment, wooden plant boxes measuring 267 cm x 77 cm were prepared and filled
with soil. Water depth of 3-5 cm was maintained until the hard dough stage. Optimum control on pests and diseases were implemented.
Pollen Microscopic Observation
PPF was determined using the protocol as described in the Standard Evaluation System (SES). Five plants were randomly selected from each entry. Main tiller spikelets were collected and fixed in 70% ethyl alcohol. Pollen grains were stained with 1% iodine potassium iodide (I2KI) solution. Stained pollens were considered as fertile while the unstained were recorded as sterile.
Yield and Agronomic Parameters
Five plants per entry were randomly selected for the measurement of yield components such as the number of panicles per hill, number of filled and unfilled spikelets per panicle, and 1000-seed weight (g). Grain yield per plant (g m-2) was determined by weighing the dried grains from 5 randomly selected plants from each entry and adjusted to 14% moisture content. Yield component parameters were taken from the following: (1) number of panicles per hill, (2) number of spikelets per panicle, (3) percent filled spikelets, and (4) 1000-seed weight (g). Grain yield per plant (g m-2) was estimated by sampling five hills from each entry adjusted to 14% moisture content. Data were analyzed using the Statistical Tool for Agricultural Research version 2.0.1. Treatment means were compared using Tukey’s Honest Significant Difference at 5% level. Analysis was done using Pearson correlation.
ResultsTemperature During Flowering
The temperature (minimum, maximum, and mean) during flowering in different locations is presented in Table 2. Each site exhibited varying maximum temperatures ranging from 35.4 ± 0.64 to 38.4 ± 1.10°C. The maximum temperature under LB condition was lower (35.4oC) than NE-F (36.5). The maximum temperature in NE-GH was 38.4oC.Overall, the variation in maximum temperature during flowering was around 1°C.
Table 1. Progeny designation of the lines tested in the experiment.
POP1NSIC Rc 160/ Dular
POP2Hanareumbyeo/ N22
POP3Gayabyeo/ N22
1 PR44500A21-5-2 PR44505A12-1-3 PR42222-2-12 PR44500A21-6-2 PR44505A12-4-1 PR42222-2-23 PR44500A21-6-3 PR44505A12-8-1 PR42222-2-34 PR44500A21-7-1 PR44505A14-11-1 PR42222-3-15 PR44500A6-2-1 PR44505 PR42222-3-26 PR44500A6-4-3 PR44505A14-15-1 PR42222-7-17 PR44500A6-5-2 PR44505A14-15-2 PR42222-7-28 PR44500A6-5-3 PR44505 PR42222-33-39 PR44500A8-2-1 PR44505A16-14-1 PR42222-18-310 PR44500A8-3-3 PR44505A16-14-2 PR42222-20-111 PR44500B13-10-2 PR44505A16-5-2 PR42222-20-212 PR44500B13-10-3 PR44505A16-7-2 PR42222-20-313 PR44500B15-5-1 PR44505A19-21-1 PR42222-21-114 PR44500B17-2-1 PR44505A19-22-2 PR42222-21-215 PR44500B17-3-3 PR44505A19-24-1 PR42222-21-316 PR44500B17-5-2 PR44505A19-25-2 PR42222-25-117 PR44500B4-10-2 PR44505A19-27-1 PR42222-25-218 PR44500B4-3-1 PR44505A26-5-2 PR42222-33-119 PR44500B4-6-1 PR44505A26-5-3 PR42222-33-220 PR44500B9-2-2 PR44505-B738(5) PR42222-33-3
Table 2. Minimum, maximum, and mean temperature in different experimental sites during flowering. 2014 dry season.
Location Temperature (°C)
Minimum Maximum Mean
Los Banos - Field (LB)* 24.19 ± 0.94 35.43 ± 0.64 29.84 ± 0.70
Nueva Ecija - Field (NE-F)** 24.09 ± 1.00 36.53 ± 0.84 29.43 ± 0.68
Nueva Ecija - Glasshouse (NE-GH)** 24.79 ± 0.56 38.40 ± 0.90 29.69 ± 0.89*PAGASA Agro-meteorological Station Los Baños, Laguna **MINCER 1 m above canopy Muñoz, Nueva Ecija

Pollen Fertility and Yield Parameters of Rice
40 RICE-BASED BIOSYSTEMS JOURNAL (2020) 6: 37-47
Relationship of Pollen Fertility and Temperature
PPF of the progeny derived from different populations in response to maximum, minimum, and mean temperatures during flowering was quantified. The relationship between PPF with maximum temperature and minimum temperatures was negative and significant (Table 3). On the other hand, PPF had no significant relationship with the mean temperature.
Table 3. The relationship between temperature (minimum, maximum, and mean) and pollen fertility.
Parameter Pollen Fertility
Pollen fertility -Minimum temperature -0.248*
Maximum temperature -0.590**
Mean temperature -0.072ns
The maximum temperature during the reproductive stage under the field (LB and NE-F) and screen house (NE-GH) was plotted against the PPF in each of the breeding lines (Figure 2). The results generally showed a negative response of PPF to increasing maximum temperatures at a temperature range 34-39°C. Some lines had 80% pollen fertility at maximum temperature greater than 38°C indicating high temperature
tolerance. The lines showed PPF reduction by 37% in NE-GH relative to LB. This reduction was attributed to an increase of more than 2°C in the maximum temperature in NE-GH. About 5% decrease in PPF was also observed in NE-GH relative to NE-F when the difference in maximum temperatures increased to 1.8oC (Table 4). Progenies of the cross between Hanareumbyeo/N22 had the highest mean pollen fertility (54.6%) among populations under NE-GH. In LB and NE-F, progenies of Gayabyeo/N22 had the highest PPF at 75.1 and 80.2%, respectively.
Performance of Checks and Genotypes with Stable PPF under High Temperature
In general, high PPF was observed in tolerant and intermediate check varieties (i.e., source of genes for high temperature tolerance); N22, Dular, IR64, and Milyang 23 under different maximum temperature in LB, NE-F, and NE-GH. The susceptible check, IR52, showed intolerant to high temperature under three environments (Table 4).
Several genotypes from each population were identified to have a stable PPF across locations with different maximum temperature regimes (Table 5). These lines were PR44505A-12-1, PR42222-3-1, and PR42222-20-3, which showed high PPF ranging 80-
Table 4. The percent pollen fertility of three BILs populations under different maximum temperature regimes.
Genotype Cross/Parent LB NE-F NE-GH
POP1 NSIC Rc 160*4/Dular 72.4 ± 9.6de 67.5 ± 11.7bc 41.7 ± 16.2d
POP2 Hanareumbyeo*4/N22 76.5 ± 6.5bcd 68.0 ± 8.9bc 54.6 ± 16.8bc
POP3 Gayabyeo*2/N22 80.5 ± 5.6abc 75.5 ± 7.8ab 48.9 ± 15.6cd
NSIC Rc 160 Parent 84.0abc 85.0a 41.0d
Hanareumbyeo Parent 75.0cd 75.0ab 62.0bGayabyeo Parent 85.0ab 80.3a 26.8e
N22 (03911) Tolerant 87.5a 80.0a 83.0a
Dular Tolerant 79.8abcd 79.0a 77.8a
IR64 Intermediate 77.8bcd 77.2ab 78.3aMilyang 23 Intermediate 76.8bcd 74.8ab 57.7bIR52 Susceptible 64.8e 60.0c 45.3d
Figure 2. The relationship between pollen fertility (%) and maximum temperature dynamics during the reproductive stage.

Pollen Fertility and Yield Parameters of Rice
RICE-BASED BIOSYSTEMS JOURNAL (2020) 6: 37-47 41
84% and within same PPF level of the most tolerant check variety, N22, under field and glasshouse conditions. Other lines, which showed high PPF at high maximum temperatures were PR44500B17-3-3 and PR44505A19-27-1 both for LB and NE-F. Most of the genotypes that showed high PPF across locations were derived from the cross of Hanareumbyeo/N22, Gayabyeo/N22, and NSIC Rc 160/Dular.
Selection Based on Grain Yield
The mean plant grain yield (g m-2) taken from five plants of each population is summarized in Table 6. Progenies from each population with the highest yield from each location were selected based on the mean performance of the genotypes at each site. The site with the highest average yield was the field set-up at NE-F (641 m m-2) followed by LB (491 g m-2) and NE-GH (292 g m-2). Based on the means, yield level of genotypes selected were set at 600 g m-2 for NE-F, 500 g m-2 for LB, and 300 g m-2 for NE-GH. Only the genotypes listed as top yielders across three locations were considered, and corresponding pollen fertility of each selected line is summarized. Twelve lines were selected from the 60 evaluated genotypes. The selected materials were consistently the top performers across locations with yields ranging 505.5-642.2 g m-2 in LB, 602.1-777.9 g m-2 in NE-F, and 301.6- 392.2 g m-2 in NE-GH. It was observed that among the top yielders in LB and NE-F, only five entries from each location had a pollen fertility of greater than 80%, only one entry was identified to have pollen fertility of 80% in NE-GH. Under field conditions of Los Baños and Nueva Ecija, Pollen Fertility (PF) ranged 64-81%, while the tested genotypes/lines inside the glasshouse
had PF as low as 27%. Only PR42222-20-3 had more than 80% PF across locations.
Table 6. Mean plant grain yield (g m-2) of breeding populations, parents and check varieties across location. 2014 dry season.
Genotype Plant Grain Yield (g m-2)
LB NE-F NE-GH
POP1 437.2 619.5 373.9POP2 479.6 655.7 274.5POP3 557.5 650.6 228.6Mean 491.0 641.0 292.0NSIC Rc 160 387.0 605.9 217.0Hanareumbyeo 545.1 696.2 217.2Gayabyeo 537.2 609.3 261.3N22 (03911) 322.4 424.6 291.2Dular 270.6 451.0 198.6IR64 483.0 580.0 233.8Milyang 23 257.7 280.2 227.5IR52 116.6 244.9 146.4
Relationship Between Plant Grain Yield and Pollen Fertility
There was a positive correlation between pollen fertility (%) and plant grain yield (g m-2) of the selected lines (Figure 3). It was noted that entries with the highest pollen fertility were not necessarily the top yielders although PR42222-3-1 performed consistently across location in terms of pollen fertility and yield. Many of the selected lines, which exhibited 80% pollen fertility had grain yield of more than 500 g m-2. Lines with less than 60% fertility generally yielded around 300 g m-2.
Table 5. List of genotypes identified to show stable percent pollen fertility across locations. 2014 dry season.
Genotype Cross/Parent Pollen Fertility (%)*
LB NE-F NE-GH
PR44500B15-5-1 NSIC Rc 160/Dular 72.3 k-r 72.0 g-k 74.0 dePR44505A12-1-3 Hanareumbyeo/N22 84.8 a-f 82.0 bc 82.0 abPR44505A19-24-1 Hanareumbyeo/N22 75.4 i-o 72.0 g-k 70.2 efPR42222-3-1 Gayabyeo/N22 81.0 c-j 81.0 b-e 79.7 a-dPR42222-20-3 Gayabyeo/N22 81.5 c-j 81.0 b-e 81.0 a-cPR44500B17-3-3 NSIC Rc 160/Dular 83.8 a-f 83.0 bc 75.7 c-ePR44505A12-4-1 Hanareumbyeo/N22 70.0 n-s 64.0 n-q 65.2 fgPR44505A14-15-2 Hanareumbyeo/N22 70.0 n-s 69.0 i-n 64.7 f-hPR44505A19-27-1 Hanareumbyeo/N22 91.3 a 83.0 bc 77.0 b-dNSIC Rc 160 Parent 84.0 a-f 75.0 e-i 41.0 v-zHanareumbyeo Parent 75.0 h-o 80.0 b-f 62.0 g-iGayabyeo Parent 85.0 a-f 80.0 b-f 26.7 g-iN22 Tolerant 87.5 a-d 85.0 b 83.0 aDular Tolerant 79.8 d-k 79.0 b-f 77.7 a-dIR64 Intermediate 77.8 f-n 77.0 c-g 78.2 a-dMilyang 23 Intermediate 76.8 g-n 75.0 f-j 57.7 j-lIR52 Susceptible 64.8 r-t 60.0 q-s 45.2 r-w
*In a column, means followed by the same letter/s are not significantly different at 5% level by HSD.

Pollen Fertility and Yield Parameters of Rice
42 RICE-BASED BIOSYSTEMS JOURNAL (2020) 6: 37-47
Yield Components as Affected by Temperature
Temperatures during the critical stage affecting specific yield component were recorded. The selection parameters below were made for each yield component based on the response of the genotypes to maximum temperature. The selection of the genotypes based on panicle m-2 was done at maximum temperature ranging 31-33oC and 33-35oC. For the other yield components such as spikelets panicle-1, percent grain filling, and 1000-seed weight, selection was done under maximum temperature range of 35-38oC and 38-39oC.
Number of Panicles m-2. The number of panicles per m-2 decreased at maximum temperature 31-34oC (Figure 4). From 31_33oC, some genotypes had more than 500 panicles m-2 while most of the entries had 300-400 panicles m-2. Temperature beyond 33oC greatly reduced the number of panicles to 100-200. Yoshida (1981) reported that the threshold temperature during tillering is 32oC and reduction of tillers can be observed beyond this point. Most of the lines had 250-500 panicles per m-2 at temperatures between 26_27oC. The same trend of response from the mean and maximum temperatures was observed.
Genotypes (Figure 4) having at least 500 panicles m-2 (boxed) under temperatures 31-33oC were selected. Most of the selected genotypes were progenies of Gayabyeo/N22. Among the selected 14 genotypes, PR42222-33-2 had the highest number of panicles m-2 (699), which was relatively higher than the tolerant check varieties. PR44505A-14-15-2 and PR44505A-11-1, progenies of Hanareumbyeo/N22, had around 550 panicles m-2. All of the selected lines were under NE-F condition. Genotypes with more than 150 panicles m-2 were also selected under temperatures 33-35oC (encircled in Figure 4). Half of the 18 selected genotypes were progenies of the cross Hanareumbyeo/N22. PR44500A21-5-2 and PR42222-3-2 showed the highest number of panicles m-2 under this condition. The selected genotypes had
higher number of panicles m-2 than the check tolerant varieties. The selected genotypes were all under glasshouse condition.
Spikelets Panicle-1. The number of spikelets per panicle reduced as temperature increased by 34_39oC (Figure 5). Several genotypes were identified to have more than 250 spikelets per panicle at maximum temperatures ranging from 35 to 38oC (boxed in Figure 5). Beyond 38oC, the number of spikelets per panicle was reduced to <200. Genotypes that can produce >150 spikelets per panicle beyond 38oC may have tolerance to high temperature.
In Figure 5, genotypes with at least 250 spikelets per panicle at maximum temperature 35-38oC were selected. Relative to the tolerant check N22, three genotypes (PR44505A14-15-1, PR42222-33-3, and PR44500B-17-5-2) had higher spikelet number per panicle. Most of the genotypes selected were under NE-F condition. Under maximum temperatures of more than 38oC (encircled in Figure 5), genotypes with >150 spikelets per panicle were selected. PR42222-25-1 and PR42222-3-2 had the highest number of spikelets per panicle even they were exposed to temperature of >39oC. The selections under this condition had a relatively higher number of spikelets per panicle than the tolerant check. It was noted that check varieties such as Hanareumbyeo and IR64 had very low number of spikelets per panicle.
Percent Grain Filling. Generally, period of grain filling is shortened by high temperature, which negatively affects this yield component (Yoshida, 1981). Percent grain filling generally shows a negative trend in relation to mean and maximum temperature. Several lines had 85-90% grain filling at maximum temperature of 35-38oC. Several lines were also identified to have grain filling of more than 75% beyond 38oC. Genotypes with more than 85% grain filling were selected at 35-38oC (boxed in Figure 5). Selected genotypes were exposed to up to 38oC under the different locations. More than 20 genotypes,
Figure 3. Relationship between pollen fertility and plant grain yield obtained from selected rice genotypes that flowered under maximum temperature of 35-39°C.

Pollen Fertility and Yield Parameters of Rice
RICE-BASED BIOSYSTEMS JOURNAL (2020) 6: 37-47 43
composed of progenies with N22 were selected. PR44500A7-5-3 from NSIC Rc 160/Dular cross had the highest grain filling at 91.4% among the selections even at 36.4oC (under LB condition). It was observed that this genotype had more than 85% grain filling under field and glasshouse conditions. Two genotypes, PR44505A14-15-2 from Hanareumbyeo/N22 cross and PR42222-3-1 (Gayabyeo/N22), also showed high percentage of grain filling in different locations, while other genotypes had high grain filling in only one site. These lines have the potential to exhibit high percent grain filling under different high temperature environments.
Grain filling decreased by 75% at maximum temperatures >38oC. Even at high temperature, grain filling of PR42222-25-1 was 92%, relatively higher than N22 and Dular under NE-GH condition. Grain filling of the susceptible check was 85.4%. Other genotypes, PR44500B4-10-2, PR44505A19-22-2, PR44505A19-24-1, and PR44505A16-5-2 had grain filling of more than 80%, which is comparable with
Figure 4. The number of panicles as affected by mean and maximum temperature during vegetative stage.
the tolerant checks, even at 39oC. Intermediate checks had a grain filling percentage of more than 75% under NE-F and NE-GH condition including the parent check Hanareumbyeo.
1000-seed Weight Generally. 1000-seed weight is a very stable varietal trait. The influence of mean temperature is more noticeable than maximum temperature. Some genotypes had 1000-seed weight of more than 25 g at 35-38oC. A downward trend was observed after 38oC, but some genotypes were found to have at least 21 g of 1000 seed weight up to nearly 39oC. Around 25 genotypes had more than 25 g 1000 seed weight with almost half of the selected entries progenies of Hanareumbyeo/N22. Most of the selected entries were under NE-F while 7 entries were considered under LB. Only PR44505A26-5-2 was chosen under NE-GH condition. PR44505A8-3-3 (NSIC Rc 160/Dular) and PR42222-21-1 (Gayabyeo/N22) had the highest grain weight at 28.4 and 28.1 g, respectively.
Figure 5. Spikelets panicle-1 as affected mean and maximum temperature during the reproductive stage.

Pollen Fertility and Yield Parameters of Rice
44 RICE-BASED BIOSYSTEMS JOURNAL (2020) 6: 37-47
Genotypes selected under 38oC (encircled in Figure 6) were identified. The 1000-seed weight was reduced from 25-21 g under this condition. Most of the genotypes selected were derived from the cross Hanareumbyeo/N22 under NE-GH experiment. PR44505A19-27-1 (Hanareumbyeo/N22) had the highest 1000 grain weight under this condition (24.1 g). PR44500B4-10-2 (NSIC Rc 160/Dular) and PR42222-20-1 (Gayabyeo/N22) had 1000-seed weight of 23.5 and 23.0 g, respectively. The rest of the selections had less than 22 g 1000-seed weight. Among the check varieties, Hanareumbyeo recorded the highest number of 1000-seed weight at 25.4 g, which was relatively higher than all of the entries selected under the defined condition. Although PR44505A19-24-1 and PR44505A19-22-2 recorded only 1000-seed weight of 21.9 and 20.6 g, respectively, these lines were subjected to more than 39oC.
DiscussionMaximum temperature during flowering in
different locations varied by 1°C with the lowest recorded at LB condition with 35.43oC. The highest maximum temperatures were recorded at NE-GH with 38.40oC.The minimum and mean temperature was almost similar in all locations. Maximum temperature highly influenced the pollen fertility of the rice lines. Minimum temperature to some extent has negative effect on PPF, while the mean temperature has no significant effect on the evaluated parameter. A negative response of the rice lines to increasing maximum temperatures was observed from 34 to 39oC. Some lines had 80% pollen fertility beyond 38°C, which have the potential to withstand high maximum temperatures. PPF reduction by 37% from LB to NE-GH were observed that can be attributed to an increase of more than 2°C in the
maximum temperature. Under NE-GH, progenies of the cross between Hanareumbyeo/N22 had the highest mean pollen fertility among populations. Under field conditions, LB and NE-F lines derived from Gayabyeo/N22 had the highest PPF. Jagadish et al. (2007; 2010) reported that pollen was negatively affected when exposed to at least 35oC.
Genotypes identified at high PPF with 70-85% across locations under field conditions were PR44500B15-5-1, PR44505A-12-1-3, PR44505A19-24-1, PR42222-3-1, and PR42222-20-3. The parent checks had high PPF under LB condition but low at 18% under NE-GH condition. IR64, an intermediate check, had high PPF across locations. Most of the identified genotypes that showed high PPF across locations were derived from Hanareumbyeo/N22. Dular, also a heat-tolerant check, had same performance with N22 in terms of PPF.
Most of the selections with more than 80% pollen fertility were from the progenies of Gayabyeo/N22. N22 was reported to have greater tolerance to high temperature (Redona et al., 2007). PR42222-20-3 and PR42222-3-1 had high pollen fertility similar with N22 at temperature higher than 35oC. The population with N22 as heat tolerant parent had relative advantage over the population with Dular as another tolerant parent. PR44505A12-1-3 and PR42222-20-3 had more than 80% pollen fertility under glasshouse condition. Jagadish et al. (2007; 2010) reported that pollen was negatively affected when exposed to at least 35oC. However, this study focused only on the response of rice lines to maximum temperature. Other temperature conditions such as the minimum and mean temperatures were not considered. Although some studies reported that spikelet sterility increases in response to daily maximum temperature (Matthews
Figure 6. Percent grain filling as affected by mean and maximum temperature during maturity.

Pollen Fertility and Yield Parameters of Rice
RICE-BASED BIOSYSTEMS JOURNAL (2020) 6: 37-47 45
et al., 1995; Horie et al., 1996; Nakagawa et al., 2002), it is important to further investigate if the measured pollen fertility can be translated to crop productivity by analyzing yield and yield components.
The site with highest average yield was NE-F with 641 g m-2 followed by LB with 491 g m-2 and NE-GH with 292 g m-2. Based on the means, yield level of genotypes selected was set at 600 g m-2 for NE-F, 500 g m-2 for LB, and 300 g m-2 for NE-GH. Only genotypes listed as top yielders across three locations were considered. Twelve lines were selected from 60 genotypes. The selections were consistently the top performers across locations with yields ranging 505.5-642.2 g m-2 in LB, 602.1-777.9 g m-2 in NE-F, and 301.6- 392.2 g m-2 in NE-GH condition. It was observed that among the top yielders at LB and NE-F, only five entries from each location had a pollen fertility of greater than 80%. One entry recorded a pollen fertility of 80% in NE-GH. Under field condition in Los Baños and Nueva Ecija, PF ranged 64-81%, while the genotypes inside the glasshouse had 27% PF. Only PR42222-20-3 had more than 80% PF across locations.
The relationship between PPF and grain yield (g m-2) of the selected genotypes is generally positive. It was observed that entries with high pollen fertility were not necessarily top yielders except PR42222-3-1, which consistently showed high pollen fertility and yield across locations. Most of the selections with pollen fertility of at least 60% had grain yield of more than 500 g m-2. Genotypes with less than 60% fertility generally yielded 300 g m-2.
Temperatures during the critical stage at flowering, which affects yield were automatically recorded. Selection parameters were made for each yield component based on the response of the
genotypes to maximum temperature. The selection of the genotypes based on panicle m-2 was done at maximum temperature of 31-33oC and 33-35oC. For yield components such as spikelets panicle-1, percent grain filling, and 1000-seed weight, selection was conducted under maximum temperature of 35-38oC and 38-39C.
The number of panicles per m-2 decreased at temperatures 31-34oC. From 31_33oC, some genotypes had more than 500 panicles m-2 at maximum temperature, while most of the entries clustered at 300-400 panicles m-2. Maximum temperature beyond 33oC greatly reduced the number of panicles to 100-200. Yoshida (1981) reported that the threshold temperature during tillering is 32oC and reduction of tillers can be observed beyond this point.
A downward trend on the number of spikelets per panicle was observed from maximum temperatures of 34_39oC. Several genotypes were identified to have more than 250 spikelets per panicle at maximum temperatures ranging 35-38oC. Beyond 38oC, the number of spikelets per panicle was reduced to less than 200. Genotypes, which can produce more than 150 spikelets per panicle beyond 38oC, may have tolerance to high temperature.
Generally, the period of grain filling is shortened by high temperature, which negatively affects this yield component (Yoshida, 1981). Percent grain filling generally shows a negative trend in relation to mean and maximum temperature. Several lines had 85-90% grain filling at maximum temperatures 35-38oC. Several lines were also identified to have grain filling of more than 75% beyond 38oC. Genotypes with more than 85% grain filling were selected at 35-38oC. Grain filling decreased by 75% at temperatures beyond 38oC. Even at high temperature, grain filling
Figure 7. 1000-seed weight as affected by mean and maximum temperature during grain filling.

Pollen Fertility and Yield Parameters of Rice
46 RICE-BASED BIOSYSTEMS JOURNAL (2020) 6: 37-47
of PR42222-25-1 was 92%, relatively higher than N22 and Dular under NE-GH condition. It was observed that the grain filling of the susceptible check was 85.4%.
Seed weight is generally a very stable varietal trait. The influence of mean temperature is more noticeable than maximum temperature on seed weight. Some genotypes had 1000-seed weight of more than 25 g at maximum temperature from 35-38oC. A downward trend was observed after 38oC, but some genotypes were found to have at least 21 g of 1000 seed weight at 39oC. Genotypes selected at 38oC were identified. The 1000-seed weight was reduced from 25 g to 21 g under this condition. Most of the genotypes selected were derived from Hanareumbyeo/N22 under NE-GH experiment. PR44505A19-27-1 (Hanareumbyeo/N22) had the highest 1000 grain weight under this condition with 24.1g. PR44500B4-10-2 (NSIC Rc 160/Dular) and PR42222-20-1 (Gayabyeo/N22) had 1000-seed weight of 23.5 g and 23. g, respectively.
Based on selection parameters (Table 7), PR44505A14-15-2 was the best genotype among the progenies in the three populations. It has the highest yield at NE-F and one of the best yielders in LB and NE-GH conditions. The number of panicles m-2, percent grain filling, and 1000 seed weight were high. PR42222-3-2 was next in rank. This genotype, coming from Gayabyeo/N22 cross had 764 g m-2 grain yield at NE-F with 500 and 300 g m-2 yield in LB and NE-GH, respectively. The number of panicle m-2, spikelet panicle-1, and percent grain filling of this genotype were also high.
ConclusionThe effects of high temperature on yield and
yield component of genotypes were determined. Pollen fertility was reduced at temperatures between 35.4-38.4°C. Some genotypes however, exhibited 80% pollen fertility beyond 38°C indicating tolerance to tolerate high temperatures. Genotypes with stable pollen fertility were: PR44500B15-5-1, PR44505A12-1-3, PR44505A19-24-1, PR42222-3-1, and PR42222-20-3. These genotypes exhibited high percent pollen fertility from 72 to 85%, similar to the tolerant check varieties N22 and Dular. Other selections, which showed potential to maintain high PPF at high temperatures were PR44500B17-3-3, PR44505A12-4-1, PR44505A14-15-2, and PR44505A19-27-1. The parent checks, on the other hand, had high PPF under LB condition at 88%, but dropped to as low as 18% under high temperature NE-GH condition. IR64, the intermediate check, showed high PPF across locations. Twelve genotypes were found to be consistent high yielders. There was a decrease in the number of panicles m-2 during the vegetative stage at temperatures 33-35oC.
Five genotypes were identified based on percent pollen fertility, yield, and yield components PR44505A14-15-2, PR42222-3-2, PR42222-3-1, PR42222-20-3, and PR44505A26-5-3, which are potential heat-tolerant breeding lines for further evaluation and improvement. These genotypes had higher pollen fertility and yield under high temperature conditions.
Table 7. List of selected genotypes based on pollen fertility, yield, and yield components.
Genotype Pollen Fertility (%) Grain Yield M-2 (g)
Panicle M-2
Spikelet Panicle-1
Grain Filling (%)
1000-Seed Weight (g)
LB CES GH LBa CESb GHc
HT12757 68.4 65.0 56.0 517.9 687.5 326.4 HT13222 70.0 64.0 65.2 539.2 695.6 376.9 +HT13255 71.0 67.0 51.5 506.3 728.8 332.0 +HT13256 70.0 69.0 64.7 561.4 777.9 356.3 + + +HT13410 81.3 69.0 52.0 642.2 743.1 376.5 +HT13879 79.3 80.0 27.7 583.5 602.1 323.2 HT13882 81.3 81.0 79.7 616.1 610.9 392.2 + +HT13883 79.5 62.0 56.0 505.5 764.3 301.6 + + +HT13905 81.5 81.0 81.0 608.8 678.8 306.3 + +HT13909 79.3 70.0 39.2 599.2 665.3 330.5 + +HT13910 85.3 81.0 44.2 615.3 695.0 335.9 HT13914 82.5 82.0 46.5 536.2 611.2 309.4 +Selection basis a>500 g m-2
b>600 g m-2c>300 g m-2
>500 panicles m-2
at maximum temperature between 31-33oC
>200 spikelets panicles-1 at maximum temperature between 35-38oC
>85% at maximum
temperature between 35-38oC
>25 g at maximum
temperature between 35-38oC
Notes: Genotypes selected are the top yielders across locations with corresponding pollen fertility (+) – Genotype attained the value of yield component specified in the last row Genotypes were ranked based on yield performance across location and relative performance in terms of yield Ranking – 1-highest-10-lowest

Pollen Fertility and Yield Parameters of Rice
RICE-BASED BIOSYSTEMS JOURNAL (2020) 6: 37-47 47
Literature CitedAghamolki MTK, Yusop MK, Oad FC, Zakikhani H, Jaafar
HZ, Kharidah S, Hanafi SMMM (2014) Response of yield and morphological characteristic of rice cultivars to heat stress at different growth stages. International Journal of Biological, Food, Veterinary and Agricultural Engineering 8(2): 94-96.
Battisti DS, Naylor RL (2009) Historical warnings of future food insecurity with unprecedented seasonal heat. Science 323: 240–244
Carriger S, Vallee D (2007) More crop per drop. Rice Today 6: 10-13
Eitzinger J, Orlandini S, Stefanski R, Naylor REL (2010) Climate change and agriculture: introductory editorial. J of Agri Sci 148: 499-500.
Grospe JL, Abella EA, Manigbas NL (2016) Quantitative trait loci for high-temperature tolerance in rice (Oryza sativa L.). Philipp Agric Scientist 99(1): 7-18
Horie T, Matsui T, Nakagawa H, Omasa K (1996) Effect of elevated CO2 and global climate change on rice yield in Japan. In Omasa K, Kai K, Taoda H, Uchijima Z and Yoshino M (Eds) Climate Change and Plants in East Asia. Tokyo: Springer. pp 39-56
[IPCC] Intergovernmental Panel on Climate Change (2007) Climate change and its impacts in the near and long term under different scenarios. In Pauchiri RK and Reisinginer A (Eds.), Climate Change 2007: Synthesis Report. Geneva, Switzerland: IPCC. pp 43-54
Jagadish SVK, Cairns J, Lafitte R, Wheeler TR, Price AH, Craufurd PQ (2010) Genetic analysis of heat tolerance at anthesis in rice. Crop Sci 50: 1633-1641
Jagadish SVK, Craufurd P, Wheeler T (2007) High temperature stress and spikelet fertility in rice (Oryza sativa L.). J Exp Bot 58:1627-1635
Manigbas NL, Sebastian LS (2007) Breeding rice for high temperature tolerance in the Philippines. Paper presented during the International Workshop on Cool Rice for a Warmer World. March 26-30, 2007. Wuhan, Hubei, China
Manigbas NL, Lambio LAF, Madrid LB, Cardenas CC (2014) Germplasm innovation of heat tolerance in rice for irrigated lowland conditions in the Philippines. Rice Sci 21(3): 162-169
Maraseni TN, Mushtaq S, Maroulis J (2009) Greenhouse gas emissions from rice farming inputs: A cross-country assessment. J Agric Sci. 147: 117-126
Matthews RB, Kropff MJ, Bachelet D, Van Laar HH (1995) Executive summary. In Modelling the impact of climate change on rice production in Asia. CABI in association with IRRI Wallingford. p13
Morita S, Shiratsuchi H, Takanashi J, Fujita K (2004) Effect of high temperature on grain ripening in rice plants: Analysis of the effects of high night and high day temperatures applied to the panicle and other parts of the plant. Jpn J Crop Sci. 73: 77-83.
Nakagawa H, Horie T, Matsui T (2002) Effects of climate change on rice production and adaptive technologies. In Mew TW, Brar DS, Peng S, Dawe D, Hardy B (Eds.). Rice science: Innovations and Impact for Livelihood. China: International Rice Research Institute. pp 635-657
Peng S, Huang J, Sheehy JE, Laza RC, Visperas RM, Zhong X, Centeno GS, Khush S, Cassman KG (2004) Rice yields decline with higher night temperature from global warming. Proc Natl Acad Sci. 101: 971-9975
Poli Y, Basa VA RK, Panigrahy M, Vinukonda VP, Dokula NR, Voleti SR, Desiraju S, Neelamraju S (2013) Characterization of a Nagina22 rice mutant for heat tolerance and mapping of yield traits. Rice 6(36): 1-9
Redoña ED, Laza MA, Manigbas NL (2007) Breeding rice for adaptation and tolerance to high temperatures. Paper presented during the International Workshop on Cool Rice for a Warmer World. March 26-30, 2007. Wuhan, Hubei, China
Rosenzweig C, Parry ML (1994) Potential impact of climate change on world food supply. Nature 367: 133-138
Smith P, Olesen JE (2010) Synergies between the mitigation and adaptation to climate change in agriculture. J Agr Sci. 148(5): 543-552
Wahid A, Gelani S, Ashraf M, Foolad MR (2007) Heat tolerance in plants: an overview. Enviro Exp Bot. 61: 199-223
Ye C, Argayoso MA, Redoña ED, Sierra SN, Laza MA, Dilla CJ (2012) Mapping QTL for heat tolerance at flowering stage in rice using SNP markers. Plant Breed. 131: 33-41
Yoshia S (1978) Tropical climate and its influence on rice. IRRI Research Paper Series 20. Los Baños, Laguna, IRRI
Yoshida S (1981) Fundamentals of Rice Crop Science. Los Baños, Laguna: IRRI
Zhang Y, Tang Q, Peng S, Zou Y, Chen S, Shi W, Qin J, Laza MR (2013) Effect of high night temperature on yield and agronomic traits of irrigated rice under field chamber system condition. Aus J Crop Sci. 7(1): 7-13


RICE-BASED BIOSYSTEMS JOURNAL (2020) 6: 49-55 49
INTERFERENCE OF COMMELINA DIFFUSA BURM. F. ON RICE GROWTH AND YIELD
Maria Niña S. Cabiao 1, Jaime R. Quilantang 1, Ronaldo T. Alberto 1, and Dindo King M. Donayre2*
1 Central Luzon State University, Science City of Muñoz, Nueva Ecija, Philippines2 Philippine Rice Research Institute, Maligaya, Science City of Muñoz, Nueva Ecija, Philippines
Corresponding Author: [email protected]
AbstractAn experiment was conducted from August to December 2018 at Central Luzon State University in Nueva
Ecija, Philippines to determine the effects of C. diffusa (COMDI) interference on rice growth and yield under saturated condition. Plastic pots with transplanted rice (TPR) or direct-seeded rice (DSR) were cultivated with COMDI at 0, 1, 3, 5, and 7 densities. Each pot was replicated five times and arranged in RCBD. Agronomic, yield components, and grain yield (GY) of rice were recorded. All the data were subjected to ANOVA while treatments means were compared through LSD and TTEST at 5% level of significance. Correlation and simple linear regression were also used to relate and create predictive models for GY. COMDI significantly affected the agronomic, yield components, and GY of TPR and DSR. GY reductions at 1, 3, 5, and 7 COMDI densities were 5.4, 8.4, 17.2, and 22.4% for TPR, while 9.8, 18.6, 26.5, and 34% for DSR. Density and biomass of COMDI were strongly-negatively correlated to GY. The final predictive models were GYTPR = -0.8769 (COMDI density) + 27.866 and GYTPR = -0.0381 (COMDI shoot dry weight) + 28.394 for TPR; GYDSR = -1.2985 (COMDI density) + 27.248 and GYDSR = -0.0573 (COMDI shoot dry weight) + 28.1 for DSR. Results suggest that COMDI can reduce rice yield under saturated condition.
Keywords: Commelina diffusa, COMDI, Commelinaceae, Interference, NSIC Rc 222, Rice-Weed Competition, Spreading Dayflower.
and ascending stems, and rooting at the nodes. Its characteristics have been differentiated from its close relative (C. benghalensis L.) through its blue, funnel-shaped flowers; inflorescence that is contained by a folded leaf-like bract; and lanceolate or oblong-lanceolate leaves with stem clasping sheaths (Pancho and Obien, 1995). It propagates either by seeds (1000 seeds plant-1) or through stem fragments with ready roots at the nodes (Galinato et al., 1999).
C. diffusa, known to many farmers as alikbangon, gatilang, or kulasi, is one of the common weeds of rice in the Philippines particularly in rainfed and upland areas (Donayre et al., 2018; Fried et al., 2017; Rao et al., 2017; Galinato et al., 1999; Moody, 1989; Pablico and Moody, 1987). It is also a weed in fields planted with corn, banana, onion, and other vegetables (Donayre et al., 2019; Fabro and Barcial, 2015; Magsino, 2015; Baltazar et al., 1999). A study in United States showed that C. diffusa, allowed to grow for season-long period at a density of 22 plants m-2, reduced rough rice yield of drill-seeded paddy rice by 18% (Smith, 1984). In separate study conducted in Brazil, presence of C. diffusa on two bean grain (Phaseolus vulgaris L.) varieties significantly reduced the number of leaves and chlorophyll contents in the leaves as well as the nitrogen, phosphorus, and iron contents of the grains (Oliveira et al., 2017).
IntroductionPests are one of the important factors to consider
when growing rice. Occurring at high population and inflicting significant damages or injuries, pests can significantly reduce the quantity and quality of harvested grains if not properly managed (Kumar et al., 2017; Mataia and Francisco, 2008; Adalla and Magsino, 2006; Raymundo, 2006; Savary et al., 2000; Ampong-Nyarko and De Datta, 1991). Weeds are one of the major groups of pests that farmers always consider in selecting and implementing appropriate pest management strategies and techniques (Beltran et al., 2016; Donayre et al., 2014; Moody et al., 1997). In fact, this group of pests ranked fourth as the most considered pests of rice farmers of 10 Asian countries (Heong and Escalada, 1997). Topping the weeds in the rank are lepidopterous leaf feeders, stemborers, and brown plant hoppers. When growth is uncontrollable, potential yield is reduced by 48-55% in irrigated lowland, 51-74% in rainfed lowland, and 96% in the upland (Ampong-Nyarko and De Datta, 1991).
Commelina diffusa Burm. f. is an annual or perennial plant belonging to Family Commelinaceae. It is commonly called “spreading dayflower” in English literature with COMDI as the official code (EPPO, 2019; Caton et al., 2010). Moody et al. (2014) described it as a plant with smooth, fleshy, creeping,
Received: October 17, 2019 • Accepted: February 14, 2020
FULL PAPER

Interference of Commelina Diffusa Burm. F. on Rice Growth and Yield
50 RICE-BASED BIOSYSTEMS JOURNAL (2020) 6: 49-55
Knowledge on the competitive ability of a weed against a certain crop is one of the requirements of successful and effective weed management. This is because it helps farmers and extension workers to decide whether a weed is to be controlled (Swanton et al., 2015). Having enough knowledge on this weed’s ability also helps select appropriate management techniques in case the weed, at defined critical density, needs to be controlled.
Proof on the impact of C. diffusa interference on yields of major crops is very limited and its effect on rice growth and yield in the Philippine condition is still unknown. This paper hypothesized that (a) C. diffusa, when allowed to grow at certain density until maturity, will reduce growth and yield of both transplanted and direct-seeded rice under saturated condition, and (b) there will be difference on yield reductions between transplanted and direct-seeded rice.
Materials and MethodsLocation and Materials
The research was conducted at the experiment area of the Crop Protection Department, College of Agriculture, Central Luzon State University, Science City of Muñoz, Nueva Ecija in the Philippines from August to December 2018. NSIC Rc 222 (registered class), obtained from the Philippine Rice Research Institute (PhilRice), was used as test rice variety for this experiment because it is widely planted in irrigated and rainfed-lowland areas. Preparation of planting materials of NSIC Rc 222 for transplanting and direct-seeding was conducted following the standard procedure of PhilRice (2007). Healthy stolons of C. diffusa and composite soil (Maligaya soil series) were collected from the department’s nearby rice fields.
Experimental Design
The experimental unit of this study was a plastic pot (25 cm diameter wide and 20 cm deep) filled with 5 kg sterilized, moist soil. Each pot was planted with either one 21-day old transplanted rice or three-day old pre-germinated rice seed of NSIC Rc 222. Cut healthy stolons of C. diffusa (5 cm length stolon-1) were simultaneously planted in pots at 0, 1, 3, 5, and 7 densities. Rice and C. diffusa were grown until maturity. All plants were nourished with synthetic fertilizers based on recommended rates. Water was also supplied in each pot and maintained at saturation level whenever necessary. An additive design was utilized in this experiment to determine the outcome of C. diffusa - rice competition (Swanton et al., 2015). In this design, the density of rice was held constant while the density of C. diffusa was continuously increased.
Data Collected
Height of rice plant was measured using a meter stick while number of tillers and leaves plant-1 were manually counted at 60 days after transplanting/direct-seeding. Shoot-dry weights of rice and C. diffusa plant-1 were determined by drying the fresh weights inside an oven for 48 h at 70°C and weighing the dried biomasses on the digital weighing balance. Yield components (number of panicles plant-1, number of grains panicle-1, percentage filled spikelets plant-1, and 1000-grain weight) were manually counted and measured after harvest. Grain yield plant-1 was calculated from yield components (Yoshida, 1981). Percentage reductions on agronomic, yield components, and grain yield (GY) of rice were calculated using the equation YL (%) = [(GY0 – GY1)/GY0]*100, where, GY0 as the mean values at 0 weed density and GY1 as the mean values at 1, 3, 5, and 7 weed densities.
Statistical Analysis
Data were subjected to analysis of variance (ANOVA) using STAR 201. Fishers’ LSD was used to compare the treatments means of agronomic characteristics, yield components, and grain yields of both transplanted and direct-seeded rice at 5% level of significance (Gomez and Gomez, 1984). Likewise, t-test was utilized to compare the grain yield reductions between transplanted and direct-seeded rice at different C. diffusa densities (Steinberg, 2008). A Pearson-product moment correlation coefficient was also computed to determine the strength and direction of relationship between C. diffusa variables (density and shoot dry weight) and grain yield of rice. A simple linear model (Y = bx + a), on the other hand, was fitted to C. diffusa variables and grain yields of rice to create prediction models.
Results and DiscussionTransplanted Rice
No significant differences were observed on height, number of tillers, number of leaves, number of panicles, and 1000-grain weight of transplanted rice (TPR) grown at different densities of C. diffusa (Table 1). Significant differences, on the other hand, were observed on shoot dry weight, number of grains panicle-1, percentage of filled spikelets, and grain yield. Shoot dry weight of TPR was 107.1 g plant-1 when C. diffusa was at 0 density pot-1 while 91.6, 77.6, 66.3, and 47.2 g plant-1 when the weed was at 1, 3, 5, and 7 densities pot-1, respectively. There were significant differences on shoot dry weight between densities. More number of grains panicle-1 were also observed when the weed was at 0 density

Interference of Commelina Diffusa Burm. F. on Rice Growth and Yield
RICE-BASED BIOSYSTEMS JOURNAL (2020) 6: 49-55 51
pot-1. However, number of grains panicle-1 were not significantly different between 0 and 1 density pot-1 (130.2 and 125.9 grains panicle-1); and between 1, 3, 5, and 7 densities pot-1 (26.5, 25.7, 23.2, and 21.8 grains panicle-1). No significant differences were observed on filled spikelets between 0 and 1 density pot-1 (99.1 and 98.0%) and between 1, 3, 5, and 7 densities pot-1 (98.0, 96.1, 93.2, and 89.3%). Grain yield (GY) of transplanted rice was also highest (28.1 g plant-1) when the weed was at 0 density pot-1. However, there were no significant differences between 0, 1, and 3 densities pot-1 (28.1, 26.5, and 25.7 g plant-1); and between 3, 5, and 7 densities pot-1 (25.7, 23.2, and 21.8 g plant-1).
Direct-Seeded Rice
C. diffusa significantly affected all the growth, yield components, and grain yield of direct-seeded rice (DSR) except for the number of panicles plant-1. All values were highest at 0 density pot-1 while lowest when the weed was at 7 densities pot-1. Height of rice was 73.2cm at 0 density pot-1 while 68.4, 68, and 67.6cm when the weed was present at 1, 3, 5, and 7 densities pot-1, respectively. No significant differences on height of rice when the weed was present. No significant differences on number of tillers between 0 and 1 density pot-1 (14.2 and 13.2 tillers plant-1); and between 3 and 4 densities pot-1 (11.4 and 10.6 tillers plant-1). Least number of tillers (7.0 tillers plant-1) was observed when the weed was present at 7 densities pot-1. Most number of leaves was recorded at 0 densities pot-1 (12.4 leaves plant-1). No significant differences on number of leaves between 1, 3, and 5
densities pot-1 (10.6, 9.8, and 9.6 leaves plant-1); and between 3, 5, and 7 densities pot-1. Least number of leaves was at 7 densities pot-1 (9.4 leaves plant-1). There were significant differences on shoot dry weight between weed density. Most number of panicles was produced at 0 density pot-1 (8.2 panicles plant-1) followed by 1 density pot-1 (7.2 panicles plant-1). No significant differences on number of panicles between 3 and 5 densities pot-1 (6.0 and 5.4 panicles plant-1). Rice with C. diffusa at 7 densities pot-1 produced the least number of panicles (3.6 panicles plant-1). No significant differences on number of filled spikelets between 0 and 1 density pot-1 (99.2 and 97.0% filled spikelets). There were significant differences on filled spikelets between 1, 3, 5, and 7 densities pot-1 (97, 92.3, 97.9, and 78.1% filled spikelets). One-thousand grain weight was lowest at 0 density pot-1 while highest at 7 densities pot-1. No significant differences on 1000-grain weight between 0 and 1 density pot-1 (26.5 and 27.1 g-1000 seeds) and between 3 and 5 densities pot-1 (32.1 and 33.9 g-1000 seeds). Although, GY was highest at 0 density pot-1 (28.1 g plant-1), its values had no significant difference at 1 density pot-1 (25.3 g plant-1). No significant differences were also observed on GY between 1 and 3 densities pot-1, between 3 and 5 densities pot-1, and between 5 and 7 densities pot-1. Lowest GY of DSR was at 7 densities pot-1.
Yield Reduction
Except for 1000-grain weight, reduction on agronomic, yield components, and yield parameters of rice due to competition by C. diffusa were generally
Table 1. Agronomic characteristics, yield components, and grain yields of rice as affected by different densities of Commelina diffusa L.
COMDI(density
pot-1)
Height (cm plant-1)
No. of Tillers plant-1
No. of Leaves plant-1
Shoot Dry Weight
(g plant-1)
No. of Panicles plant-1
No. of Grains
panicle-1
Filled Spikelets
(%)
1000 Grain Weight
(g)
Grain Yield
Plant-1
Transplanted rice
0 90.4 a 14.2 a 18.0 a 107.1 a 8.2 a 130.2 a 99.1 a 26.4 a 28.1 a
1 88.8 a 13.8 a 16.0 a 91.6 b 7.8 a 125.9 ab 98.0 a 27.4 a 26.5 ab
3 87.4 a 13.6 a 17.0 a 77.6 c 7.6 a 124.0 b 96.1 b 28.1 a 25.7 abc
5 86.2 a 13.4 a 15.8 a 66.3 d 7.4 a 121.5 b 93.2 c 27.6 a 23.2 bc
7 87.2 a 12.8 a 15.2 a 47.2 e 6.8 a 122.5 b 89.3 d 29.4 a 21.8 c
P .051 ns .960 ns .595 ns .000** .960 ns .019* .000** .423 ns .036*
Direct-seeded rice
0 73.2 a 14.2 a 12.4 a 117.2 a 8.2 a 129.5 a 99.2 a 26.5 c 28.1 a
1 68.4 b 13.2 a 10.6 b 83.4 b 7.2 b 133.1 a 97.0 a 27.1 c 25.3 ab
3 68.0 b 11.4 b 9.8 bc 66.1 c 6.0 c 128.1 a 92.3 b 32.1 b 22.9 bc
5 68.0 b 10.6 b 9.6 bc 56.0 d 5.4 c 127.3 a 87.9 c 33.9 b 20.7 cd
7 67.6 b 7.0 c 9.4 c 35.6 e 3.6 d 134.4 a 78.1 d 49.9 a 18.5 d
P .000** .000** .000** .000** .000** .594 ns .000** .000** .001**COMDI – C. diffusa; *P <.05, **P <.005, P <.0005, ns- not significant; means with the same letters are not significantly different at .05 level of significance using Fischer’s LSD

Interference of Commelina Diffusa Burm. F. on Rice Growth and Yield
52 RICE-BASED BIOSYSTEMS JOURNAL (2020) 6: 49-55
lowest at 1 density pot-1 while highest at 7 densities pot-1 (Table 2). High percentages of reduction were observed on shoot dry-weight of TPR (14.5-55.9%) while number of tillers (7-50.7%), shoot dry-weight (28.7- 69.6%), and number of panicles (12.2-56.1%) were recorded for DSR. Reductions on grain yield ranged from 5.4 to 22.4% for TPR while 9.8-34% for DSR. Although reductions on TPR were lower than in DSR, TTEST showed that grain yield of TPR had no significant difference with DSR at 1, 3, and 5 densities pot-1 except at 7 densities pot-1 (Table 3). Interference of other weed species and their effects on growths and yields of rice were also reported by other researchers in the country. For example, Donayre and Endino-Tayson (2015) reported that Hydrolea zelanica (L.) Vahl. at 1:1, 1:3, 1:5, 1:7, 1:10, and 1:20 crop:weed ratios significantly reduced the yields of transplanted rice by 18.99, 24.68, 23.80, 35.46, 51.72, and 55.90%. Chauhan (2013), in a study on the effects of two weedy rice variants on the growth and yield of two rice cultivars, also reported that grain yield was
reduced by 30 and 47%, and 66 and 81%, when rice had to compete with weedy rice variants’ 1 and 2 at population densities of 4 and 8 weedy rice pot-1. De Grano (2008) also reported that season competition of Limnnocharis fava (L.) Buch. at 10, 20, 25, and 30 densities m-2 reduced the yield of transplanted rice by 18.4, 22.5, 30.2, and 48%. At 50-60 densities, yield reduction was 63.4% under natural infestation in the field. Rao and Moody (1992) in their study on competition between Echinochloa glabrescens Munro ex Hook. f. and transplanted rice reported 11.9 and 12.8% reductions on height, 60.5 and 62.5% reductions on number of tillers, and 59.1 and 51.5% reductions on maximum leaf area index. Reductions were also registered at 77 and 81% on total dry weight and 90 and 94% on yield when all rice plants had 100% infestation of the weed. Lubigan and Moody (1990) also reported that Ischaemum rugosum Salisb at densities of 5 and 10 plants m-2 were enough to cause significant yield reduction in transplanted rice in both seasons.
Table 2. Reductions (%) on agronomic, yield components, and grain yield parameters of rice as affected by different densities of Commelina diffusa L.
Rice:COMDIRatio
Height No. of Tillers Plant-1
No. of Leaves Plant-1
Shoot Dry
Weight
No. of Panicles Plant-1
No. of Grains
Panicle-1
Filled Spikelets
1000 Grain Weight
Grain Yield
Plant-1
Transplanted rice0 0 0 0 0 0 0 0 0 01 1.8 2.8 11.1 14.5 4.9 3.2 1.1 -3.7 5.43 3.3 4.2 5.6 27.6 7.3 4.7 3.0 -6.5 8.45 4.6 5.6 12.2 38.1 9.8 6.7 6.0 -4.6 17.27 3.5 9.9 15.6 55.9 17.1 5.9 9.9 -11.3 22.4
Direct-seeded rice0 0 0 0 0 0 0 0 0 01 6.6 7.0 14.5 28.7 12.2 -2.7 2.2 -2.3 9.83 7.1 19.7 21.0 43.6 26.8 1.1 6.9 -20.8 18.65 7.1 25.4 22.6 52.2 34.1 1.7 11.3 -27.9 26.57 7.7 50.7 24.2 69.6 56.1 -3.7 21.2 -88.0 34.0
Table 3. P-values as results of comparison between grain yield reductions of transplanted and direct-seeded rice.
COMDI Density Direct-Seeded
1 3 5 7
Transplanted1 0.737ns
3 0.484 ns
5 0.406 ns
7 0.027*
Comparison of means were computed through TTEST; *P< .05, ns – not significant at 5% level of significance

Interference of Commelina Diffusa Burm. F. on Rice Growth and Yield
RICE-BASED BIOSYSTEMS JOURNAL (2020) 6: 49-55 53
Grain yield reduction in transplanted rice was generally lower than in direct-seeded rice. Ampong-Nyarko and De Datta (1991) explained that transplanted rice has low potential to yield loss due to its head start over the weeds. Meanwhile, direct-seeded rice has high potential to yield losses because its germinating seeds grow together with weeds (Casimero, 2004). The absence of early flooding to suppress weeds during the initial growth phase, absence of seedling size to compete with weeds, and the uneven stand that provides space weeds to grow further aggravate the vulnerability of direct-seeded rice to weed competition and yield losses (Kumar et al., 2017; Chauhan, 2012).
Correlation and Regression
Density and shoot dry weight of C. diffusa were strongly, negatively correlated to grain yields of TPR (r = -0.990, -0.987) and DSR (r = -0.987, -0.965). Simple linear regression analysis also indicated that 98.02 and 97.49% grain yield of TPR and 97.41 and 99.64% grain yield of DSR were influenced by the density and shoot dry weight of C. diffusa (Figure 1). Further analysis showed that the density and shoot dry weight of C. diffusa were significant predictors and contributors to the grain yield of rice at 5% level of significance (density: p = .0012 TPR, p = .0018 DSR) (shoot dry weight: p = .0017 TPR, p = .0078 DSR). The final predictive models for TPR were GY = -0.8769 (C. diffusa density pot-1) + 27.866 and GY = -0.0381 (C. diffusa shoot dry weight in g plant-1) + 28.394. For the direct-seeded, GY = -1.2985 (C. diffusa density pot-1) + 27.248 and GY = -0.0573 (C. diffusa shoot dry weight in g plant-1) + 28.1.
Knowledge on the weed’s competitive ability helps decide whether control has to be implemented to suppress its growth. In this study, C. diffusa significantly reduced the growth and grain yield of rice under saturated condition implying that control
must be implemented whenever it grows with rice at minimum of 5 densities. In controlling C. diffusa and other perennial weeds of rainfed rice, practicing field sanitation, thorough land preparation, handweeding, and chemical control were regarded as best options by Donayre et al. (2018) and PhilRice (2001, 2007). They emphasized that practicing field sanitation such as keeping the seedling nurseries, irrigation canals, and field bunds clean and weed-free help prevent entries of volunteer weed seeds and asexual propagules. Furthermore, thorough land preparation and practicing stale-seedbed technique bury weeds under the soil, separate shoots from roots, encourage germination of dormant seeds, desiccate shoots, and exhaust carbohydrate reserves of perennial weeds. In addition, manual weeding and herbicide application are very effective and efficient in removing and eradicating weeds that grow within rows and hills of rice.
Conclusion and RecommendationC. diffusa at 1, 3, 5, and 7 densities, interfered
the growth and yield of rice. When grown until crop’s maturity, it significantly reduced the grain by 5.4-22.4% for transplanted and 9.8-34% for direct-seeded rice. The results indicate that C. diffusa is truly a weed of rice under saturated condition. There are several options on how to manage the weed. However, careful selection, planning, and implementation must be done to achieve effective, economical, and environmentally-sound weed management. To grasp more knowledge on ecology, further researches are recommended particularly on its interference ability under different times of irrigation (early and late flooding), fertilizer rates (nitrogen), and rice varieties (short and tall or early and late maturing). Predictive models under field conditions and the different weed management techniques through a holistic approach must be evaluated.
GyTPR = -0.0381x + 28.394R² = 0.9749
GyDSR = -0.0573x + 28.1R² = 0.9964
0
5
10
15
20
25
30
35
40
0 50 100 150 200
Grai
n Yi
eld
(g p
lant
-1)
Weed Shoot Dry Weight (g plant-1)
GyTPR = -0.8769x + 27.866R² = 0.9802
GyDSR= -1.2985x + 27.248R² = 0.9741
0
5
10
15
20
25
30
35
40
0 2 4 6 8
Grai
n Yi
eld
(g p
lant
-1)
Weed Density (plants pot-1)
Figure 1. Correlation and simple linear regression between density and weight of Commelina diffusa and grain yields of rice (transplanted rice - black circles, direct-seeded rice - white circles).

Interference of Commelina Diffusa Burm. F. on Rice Growth and Yield
54 RICE-BASED BIOSYSTEMS JOURNAL (2020) 6: 49-55
Literature CitedAdalla CB, Magsino EA (2006) Understanding the golden apple
snail (Pomacea canaliculata): Biology and early initiative to control the pest in the Philippines. RC Joshi, LS Sebastian (Eds.). In Global Advances in Ecology and Management of Golden Apple Snail. Philippine Rice Research Institute, Los Baños, Laguna, Philippines, pp 199-213
Ampong-Nyarko K, De Datta SK (1991) A Handbook for Weed Control in Rice. IRRI, Los Baños, Laguna, Philippines
Baltazar AM, Martin EC, Casimero MC, Bariuan FV, Obien SR, De Datta SK (1999) Major weeds and dominance patterns in rainfed rice-onion cropping system. Philippine Agricultural Scientist 82(2): 166-177
Beltran JC, Bordey FH, Launio CC, Litonjua AC, Manalili RG, Mataia AB, Relado RZ, Moya PF (2016) Pesticide use and practices. In Bordey FH, PF Moya, JC Beltran, DC Dawe (Eds.). Competitiveness of Philippine Rice in Asia. Philippine Rice Research Institute, Maligaya, Science City of Muñoz, Nueva Ecija, Philippines, pp 75-86
Casimero MC (2004) Managing weeds in rice. In Redoña ED, Castro AP, Llanto GP (Eds). Rice Integrated Crop Management: Towards a Rice Check System in the Philippines. Philippine Rice Research Institute, Maligaya, Science City of Muñoz, Nueva Ecija, Philippines, pp 107-119
Caton BP, Mortimer M, Hill JE, Johnson DE (2010) A Practical Guide to Weeds of Rice in Asia (2nd Ed). International Rice Research Institute, Los Baños, Laguna, Philippines
Chauhan BS (2012) Weed Management in Direct-Seeded Rice Systems. International Rice Research Institute, Los Baños, Laguna, Philippines. http://books.irri.org/9789712202940_content.pdf (accessed July 5, 2013)
Chauhan BS (2013) Effect of weedy rice variants and weedy rice density on the growth and yield of two rice cultivars in the Philippines. Canadian Journal of Plant Protection 1(1): 28-34. http://goo.gl/svRf6O (accessed April 27, 2014)
Donayre DKM, Endino-Tayson CA (2015) Competitive ability, critical period of competition, and density level of Hydrolea zeylanica (L.) Vahl against transplanted-irrigated lowland rice. IAMURE International Journal of Ecology and Conservation 14: 191-214
Donayre DKM, Endino CA, Seville CU, Ciocon IMG (2014) Major weeds and farmers’ weed management practices in rainfed ricefields of Negros, Philippines. Asia Life Sciences 23(1): 137-148
Donayre DKM, Martin EC, Santiago SE, Lee JT (2018) Weeds in Irrigated and Rainfed Lowland Ricefields in the Philippines (2nd Ed). Philippine Rice Research Institute, Maligaya, Science City of Muñoz, Nueva Ecija, Philippines
Donayre DKM, Santiago SE, Martin EC, Lee JT, Corales RG, Kumar V, Janiya J (2019) Weeds of Vegetables and Other Cash Crops in the Philippines. Philippine Rice Research Institute, Maligaya, Science City of Muñoz, Nueva Ecija
[EPPO] European Plant Protection Organization (2019) EPPO Global Database. https://gd.eppo.int
Fabro LE, Barcial PM (2015) Weeds of vegetables. In Dela Cueva FM, Pascual CB, Bajet CM, Dalisay TU (Eds.). Pests and Diseases of Economically Important Crops in the Philippines. Pest Management Council of the Philippines, Inc. c/o Crop Protection Cluster, University of the Philippines Los Banos, College, Laguna, Philippines, pp 554-580
Fried O, Kuhn I, Schrader I, Sihn NV, Bermeier E (2017) Plant diversity and community composition of rice agroecosystems in Vietnam and the Philippines. Phytocoenologia 47 (1): 49 – 66. https://www.schweizerbart.de/papers/phyto/detail/47/87476/Plant_diversity_and_community_composition_of_rice_agroecosystems_in_Vietnam_and_the_Philippines (accessed March 16, 2018)
Galinato MI, Moody K, Piggin CM (1999) Upland Rice Weeds of South and Southeast Asia. International Rice Research Institute, College, Laguna, Philippines
Gomez KA, Gomez AA (1984) Statistical Procedures for Agricultural Research (2nd Ed). John Wiley and Sons, USA
Heong KL, Escalada MM (1997) A comparative analysis of pest management practices of rice farmers in Asia. In Heong KL, Escalada MM (Eds) Pest Management of Rice Farmers in Asia. International Rice Research Institute, College, Laguna, Philippines
Kumar V, Opeña J, Valencia K, Thi HL, Son NH, Donayre DKM, Janiya J, Johnson DE (2017) Rice weed management in Southeast Asia. In Rao AN and H Matsumoto (Eds.) Weed Management in Rice in the Asian-Pacific Region. Asian Pacific Weed Science Society; The Weed Science Society of Japan; and Indian Society of Weed Science, India, pp 282-307
Lubigan RT, Moody K (1990) Competition between transplanted rice and Ischaemum rugosum. Journal of Plant Protection in the Tropics 7(3): 147-153. http://goo.gl/U2ZGtP (accessed June 21, 2014).
Magsino G (2015) Weeds of banana and corn. In Dela Cueva FM, Pascual CB, Bajet CM, Dalisay TU (Eds). Pests and Diseases of Economically Important Crops in the Philippines. Pest Management Council of the Philippines, Inc. Crop Protection Cluster, University of the Philippines Los Banos, College, Laguna, Philippines pp 519-553
Mataia AB, Francisco SR (2008) Crop loss assessment and economic impact of tungro disease in the Philippines. In Tiongco ER, Angeles ER, Sebastian LS. The Rice Tungro Virus Disease: A Paradigm in Disease Management. Philippine Rice Research Institute, Maligaya, Science City of Muñoz, Nueva Ecija, pp 15-29
Moody K, Escalada MM, Heong KL (1997) Weed management practices of rice farmers in Iloilo, Philippines. In Heong KL, Escalada MM (Eds.). Pest Management of Rice Farmers in Asia. International Rice Research Institute, College, Laguna, Philippines, pp 143-160
Moody K, Munroe CE, Lubigan RT, Paller Jr EC, Barcial PM, Fabro LE, Janiya JD, Magsino GL (2014) Major Weeds of the Philippines (2nd Ed). University of the Philippines Los Baños, Philippines

Interference of Commelina Diffusa Burm. F. on Rice Growth and Yield
RICE-BASED BIOSYSTEMS JOURNAL (2020) 6: 49-55 55
Oliveira LSG, Dalvi LP, Altoé SC, Rocha LJFN, Oliveira FL (2017). Competition with spreading dayflower (Commelina diffusa L.) can affect the agronomic characteristics and mineral content of common bean grains. Cien. Inv. Agr. 44(2): 121-126 https://scielo.conicyt.cl/pdf/ciagr/v44n2/0304-5609-ciagr-44-02-0121.pdf (accessed November 13, 2017)
Pablico PP, Moody K (1987) A survey of weeds inn transplanted and wet-seeded rice under rainfed and irrigated conditions. International Rice Research Newsletter 12(1): 23
Pancho JV, Obien SR (1995) Manual of Ricefield Weeds in the Philippines. Philippine Rice Research Institute, Maligaya, Science City of Muñoz, Nueva Ecija, Philippines
[PhilRice] Philippine Rice Research Institute (2007) Integrated Pest Management in Rice-Vegetable Cropping Systems. Philippine Rice Research Institute, Science City of Muñoz, Nueva Ecija
[PhilRice] Philippine Rice Research Institute (2001) Management Options for Ricefield Weeds. Philippine Rice Research Institute, Science City of Muñoz, Nueva Ecija
[PhilRice] Philippine Rice Research Institute (2007) Philippine Rice Production Training Manual. Philippine Rice Research Institute, Science City of Muñoz, Nueva Ecija
Rao AN, Chandrasena N, Matsumoto H (2017) Rice weed management in Asian-Pacific Region: An overview. In Rao AN, Matsumoto H (Eds.). Weed Management in Rice in the Asian-Pacific Region. Asian Pacific Weed Science Society; The Weed Science Society of Japan; and Indian Society of Weed Science, India, pp 1-41
Rao AN, Moody K (1992) Competition between Echinochloa glabrescens and rice (Oryza sativa). Tropical Pest Management 38(1): 25-29. http://goo.gl/0CHq1C (accessed January 5, 2014)
Raymundo AD (2006) Lost Harvest: Quantifying the Effect of Plant Diseases on Major Crops in the Philippines. University of the Philippines Los Banos, College, Laguna
Savary S, Willocquet L, Elazegui FA, Castilla NP, Teng PS (2000) Rice pest constraints in tropical Asia: Quantification of yield losses due to rice pests in a range of production situations. Plant Disease 84: 357-369
Smith R (1984) Competition of spreading dayflower (Commelina diffusa) with rice (Oryza sativa). Weed Science 32(1): 116-119. https://www.cambridge.org/core/journals/weed-science/article/competition-of-spreading-dayflower-commelina-diffusa-with-rice-oryza-sativa/66787DAF0C422AA3D8DD08AE0558C1E6 (accessed March 03, 2017)
Steinberg WJ (2008) Statistics Alive. SAGE Publications, Los Angeles, USA
Swanton CJ, Nkoa R, Blackshaw RE (2015) Experimental methods for crop–weed competition studies. Weed Science Special Issue: 2-11
Yoshida S (1981) Fundamentals of Rice Crop Science. International Rice Research Institute, College, Laguna, Philippines. http:// books.irri.org/9711040522_content.pdf (accessed July 4, 2013)


Quality and Acceptability of Rice: Adlai Blend
RICE-BASED BIOSYSTEMS JOURNAL (2020) 6: 57-64 57
QUALITY CHARACTERISTICS AND CONSUMER ACCEPTABILITY OF RICE: ADLAI BLEND
Henry F. Mamucod*, Rosaly V. Manaois, Amelia V. Morales, Princess R. Belgica, and Marissa V. Romero
Rice Chemistry and Food Science Division, Philippine Rice Research InstituteMaligaya, Science City of Muñoz, 3119 Nueva Ecija, Philippines
*Corresponding Author: [email protected]
AbstractAdlai (Coixlacryma-jobi L.) was recently promoted by the government as alternative to rice. This study
evaluated the cooking and eating quality and consumer acceptability of rice:adlai blends. Three adlai varieties, namely Ginampay, Gulian, and Tapol, were substituted to NSIC Rc 160, a popular rice variety, at different ratios (100:0, 75:25, 50:50, 25:75, and 0:100 rice:adlai). Higher gelatinization property of adlai, regardless of variety, resulted in longer cooking time by 1.69-6.73 min compared with pure rice. Laboratory sensory evaluation showed that pure Ginampay and all its blend forms had overall likings comparable with rice. Gulian and Tapol gave overall likings comparable with rice at 25:75 and 50:50 ratios, respectively. In terms of consumer acceptability, the 50:50 rice: Ginampay blend was preferred over the other two blends. It received the same rating and rank scores as of pure rice. The blends were preferred in the following order: pure rice ≥ rice:Ginampay ≥ rice:Tapol ≥ rice:Gulian. Meanwhile, blending rice with adlai, regardless of variety, resulted in significant increase in protein content (11.19 - 11.52%) and fat (1.02 - 1.22%) of the blends. This study showed that Ginampay can be substituted to rice at 50:50 ratio as source of carbohydrates, providing consumer the same eating satisfaction with higher amount of protein and fats.
Keywords: Adlai, Consumer Acceptability, Proximate Composition, Rice Blend, Sensory Evaluation.
Chinese pearl barley, has been grown and consumed mostly in Southern Philippines, although it is more popular in neighboring Asian countries, particularly in India and China, where cultivation of the crop was believed to have started since the ancient times (Lim, 2013). In the Philippines, four varieties are being cultivated: Gulian (white), Tapol (purple), Ginampay (brown), and Pulot (white-glutinous) (Adlai, n.d.). However, adlai is still relatively unknown to many Filipinos. Availability of information on its nutritional and potential health advantages would therefore encourage more consumption and utilization of adlai, which is championed by the DA through the Bureau of Agricultural Research (BAR).
Nutritional value of adlai was reported to be comparable, or even better, than rice. Analysis of the Food and Nutrition Research Institute (FNRI) (Adlai, n.d.) showed that adlai provides almost the same amount of energy as milled rice (Juliano, 2003) at 356 kcal 100 g-1, but its protein and total fat content are higher (Adlai n.d.; Dechkunchon and Thongngam, 2007). Protein is an important component of staple crops because this serves as a primary source of nutrient particularly to underprivileged populations.
To be an effective substitute to rice, grain quality of adlai must also satisfy consumer requirements. For rice, cooked grains that are cohesive and soft even
IntroductionAmong the agricultural commodities, rice remains
to be the major source of calories among Filipinos. The seemingly dependence of Filipinos to rice requires reliable supply. However, the continuous growth of population has been identified as one of the factors contributing to rice shortage. In 2017, rice contributed 1,156.59 g of calories per day per individual. Meanwhile, the country’s average per capita consumption of rice is about 110 kg per year (PSA, 2018). One way of ensuring that Filipinos obtain enough calories without depending on rice is through the consumption of other food crops that can provide at least some of the caloric and other nutritional requirements of the population.
Crops such as corn, cassava, sweet potato, and adlai are now being advocated as alternative staples to rice. Through its Food Staples Self-Sufficiency Program, the Philippine’s Department of Agriculture (DA) regards the consumption of these staple alternatives as a measure to reduce rice intake and consequently, address food security.
Among the alternative staple food crops being campaigned by the government, adlai is currently the least known in the country. Adlai or katigbi (Coix lacryma-jobi L.), also called “Job’s tears” and
Received: September 06, 2019 • Accepted: February 14, 2020
FULL PAPER

Quality and Acceptability of Rice: Adlai Blend
58 RICE-BASED BIOSYSTEMS JOURNAL (2020) 6: 57-64
on cooling are favored by most Filipino consumers. These are affected by the intrinsic physicochemical characteristics of rice, specifically its starch fractions, and also by cooking conditions. Hence, the cooking quality of different local adlai varieties must be established and proximate property and consumer acceptability determined.
In view of the scarce information on the varieties of adlai locally grown in the country, investigation of the quality profile of Philippine adlai varieties is therefore imperative. In addition, validation of the nutritive quality of local adlai varieties would help intensify current efforts in promoting adlai as alternative caloric source. This study aimed to establish the cooking parameters of three adlai varieties, identify the best adlai variety and its ratio to rice by sensory evaluation, and characterize the nutritional value of the rice:adlai blends.
Materials and MethodsSource of Rice and Adlai
NSIC Rc 160, a popular low-amylose rice variety in the Philippines, was sourced from the Philippine Rice Research Institute (PhilRice) in Science City of Muñoz, Nueva Ecija. Meanwhile, the three varieties of adlai, namely Ginampay, Gulian, and Tapol were obtained from the Department of Agriculture - Cagayan Valley Integrated Agricultural Research Center (DA-CVIARC) in Ilagan City, Isabela, Philippines (Figure 1).
Table 1. Treatments used in the experiments.
Ratio of rice to adlai
Rice (NSIC Rc 160) Adlai*
100 0
75 25
50 50
25 75
0 100 *Ginampay, Gulian, or Tapol
Determination of Amylose Content, Cooking Quality, and Gelatinization Property
Amylose content of raw NSIC Rc 160 and the three adlai varieties and the cooking qualities (optimum cooking water, weight increase, height increase, and cooking time) of rice:adlai blend forms were determined based on the National Cooperative Testing (NCT) Manual for Rice (NCT, 1997).
Gelatinization property of the samples was determined based on the modified method of Manaois (2007) using a differential scanning calorimeter (DSC) (TA Q100, TA Instruments, Newcastle, DE). Floured forms of the sample (10 mg) were weighed into a steel DSC pan, added with 20 µL of distilled water, sealed, and equilibrated at room temperature for at least 1 h. Heating was carried out from 35°C to 140°C at a rate of 5°C min-1. Gelatinization temperature was calculated using the Universal Analysis 2000 Software (version 4.5A, TA Instruments-Waters LLC, New Castle, DE). DSC runs were done in duplicate.
Sensory Evaluation
Laboratory. Eleven panelists from the Rice Chemistry and Food Science Division of PhilRice were invited to participate in the laboratory-panel sensory evaluation. Three separate sessions were conducted, one adlai variety per session. Cooked samples were coded randomly and presented to the panelist to be evaluated using hedonic scale sensory score card for rice (NCT 1997). As the objective of this study was to directly compare adlai to rice, the following attributes commonly used for rice were gathered: aroma, off-odor, color, gloss, cohesiveness, tenderness, smoothness, taste, off-taste, and overall liking.
Consumer. Sixty PhilRice employees (18-54 years old) were randomly recruited as consumer panelists. They were presented with coded samples and asked to rate the products based on their preference and acceptability.
Figure 1. Three varieties of adlai and NSIC Rc 160.
Experimental Treatments
Table 1 shows the different rice to adlai ratios used in the experiment. Prior to cooking, Ginampay, Gulian, and Tapol, and their blend forms were soaked in water for 30 min to increase water penetration and absorption.

Quality and Acceptability of Rice: Adlai Blend
RICE-BASED BIOSYSTEMS JOURNAL (2020) 6: 57-64 59
Determination of Proximate Composition
Crude protein, crude ash, crude fat, dietary fiber, and carbohydrates of the cooked samples were determined based on standard methods (AOAC, 2000). The total carbohydrate content was determined by difference.
Statistical Analysis
All analyses were done in duplicate. Analysis of variance and mean comparison analysis using Tukey’s HSD test were analyzed using SPSS for Windows version 20 statistical software package (IBM SPSS Statistics, Armonk, NY). The level of significance used was p=0.05.
Results and DiscussionAmylose content, gelatinization property, and
cooking quality of rice and adlai varieties were evaluated. Amylose content and gelatinization property are the major factors affecting the cooking and eating qualities of rice. Based on amylose content, rice can either be classified as waxy (0-2.0%), very low (2.1-10.0%), low (10.1-17.0%), intermediate (17.1-22.0%), or high (22.1% and above). Rice with high amylose content tends to cook hard and dry, while low-amylose rices have softer and stickier cooked grains. Waxy rice, which has little or no amylose, is also referred to as glutinous rice. In the Philippines, rice varieties with low-intermediate amylose content are generally preferred. Table 2 shows the amylose content and classification of rice and adlai samples. Consistent with NCT data, NSIC Rc 160 had amylose content of 13.50% equivalent to low. On the other hand, the three adlai varieties were classified as very low amylose types (5.08-7.89%) (Table 2). The amylose content of three adlai varieties were lower than the values reported by Li and Corke (1999) for job’s tears, which ranged from 15.9 to 25.8%.
Table 2. Amylose content of rice and adlai varieties.
Sample Amylose Content (%)
Amylose Classification*
NSIC Rc 160 13.50 Low
Ginampay 7.27 Very low
Gulian 7.89 Very low
Tapol 5.08 Very low *low (10.1 – 17.0%); very low (2.1 – 10.0%)
Meanwhile, gelatinization temperature of starch granules provides index of the cooking time of rice. Rice with low or intermediate gelatinization temperature cooks faster. Meanwhile, varieties with high gelatinization temperature require more water and time for cooking and become excessively soft when overcooked and elongate less. The three
adlai samples had gelatinization temperature (74.49- 75.92°C), which is significantly higher than NSIC Rc 160 (71.71°C). A positive correlation was observed between gelatinization temperature and cooking time of samples. Samples high in gelatinization temperature had a longer cooking time (Table 3).
Table 3. Gelatinization property and cooking time of rice and adlai varieties.
Sample Gelatinization temperature (°C)
Cooking time (min)
NSIC Rc 160 71.71c 14.84b
Ginampay 74.92b 20.49a
Gulian 74.49b 21.39a
Tapol 75.54a 20.42a
The higher gelatinization property of adlai resulted in longer cooking time of rice blended with 75% Ginampay and Tapol as compared with pure rice. For rice:Gulian, blending rice with only 25% Gulian already produced significantly longer cooking time. In terms of weight and height increase, blending rice with lower Ginampay ratio (25%) resulted in significant increase in height (66%) compared with pure rice. All blend forms were significantly heavier than pure rice by 31- 32%. Meanwhile, blending rice with either Gulian or Tapol at any ratio did not give additional increase in height but significantly produced heavier meals (Table 4, 5, and 6). Despite longer cooking time, rice:Ginampay could provide more food due to the synergistic effect of increased height and weight on the volume of the blend.
Table 4. Cooking quality of rice:Ginampay blends.
Rice: Ginampay
Ratio
Cooking Time (min)
Height Increase
(%)
Weight Increase
(%)
100:0 14.84b 158.65cd 101.34b
75:25 16.32b 262.73a 133.48a
50:50 17.68b 206.63bc 131.46a
25:75 19.82a 214.85ab 132.33a
0:100 20.49a 154.44d 124.63a
Mean values with the same letter within a column are not significantly different at p=0.05.
Table 5. Cooking quality of rice:Gulian blends.
Rice:Gulian Ratio
Cooking Time (min)
Height Increase (%)
Weight Increase (%)
100:0 14.84c 158.65ab 101.34b
75:25 17.67b 166.67a 144.71a
50:50 17.89b 112.15ab 139.67a
25:75 18.25b 101.61b 135.06a
0:100 21.39a 98.18b 132.81a
Mean values with the same letter within a column are not significantly different at p=0.05.

Quality and Acceptability of Rice: Adlai Blend
60 RICE-BASED BIOSYSTEMS JOURNAL (2020) 6: 57-64
Table 6. Cooking quality of rice:Tapol blends.
Rice:Tapol Ratio
Cooking Time (min)
Height Increase (%)
Weight Increase (%)
100:0 14.84b 158.65a 101.34c
75:25 18.16ab 131.51a 142.59a
50:50 19.27ab 120.00a 138.73a
25:75 22.07a 138.15a 131.82ab
0:100 20.42a 97.31a 119.17b
Mean values with the same letter within a column are not significantly different at p=0.05.
Sensory Properties
Laboratory. The sensory properties of pure rice, adlai, and their blend forms were evaluated by 11 participants. In Table 7, all the rice:Ginampay blends received comparable scores for aroma, color, gloss,
texture (cohesiveness, tenderness, and smoothness), and taste with pure rice. Even the pure Ginampay had generally the same sensory properties as of the pure rice. No off-odor and off-taste were perceived among the samples. Pure Ginampay and all its blend forms received overall liking comparable with the pure rice.
The rice:Gulian blends also garnered score for aroma, gloss, texture, and taste comparable with pure rice. However, blend with 75% Gulian produced grayish meal but remained comparable with pure rice in terms of overall likings. No off-odor and off-taste were detected among the samples (Table 8).
In Table 9, all the rice:Tapol blends received comparable scores with rice for aroma, gloss, texture, and taste. Blend with 75% Tapol had grayish appearance compared with pure rice and other
Table 7. Mean laboratory sensory scores of cooked rice:Ginampay blend.
Sensory Attributes1 Rice:Ginampay Ratio
100:00 75:25 50:50 25:75 00:100
Aroma 1.45±0.66a 1.55±0.50a 1.55±0.66a 1.64±0.77a 1.64±0.77a
Off-odor 1.00±0.00a 1.00±0.00a 1.00±0.00a 1.09±0.29a 1.09±0.29a
Color 2.36±0.48ab 2.55±0.50a 2.00±0.60ab 1.91±0.67ab 1.73±0.62b
Gloss 2.64±0.48a 2.82±0.57a 2.36±0.64a 2.27±0.62a 2.09±0.79a
Cohesiveness 2.82±0.57a 3.00±0.43a 2.73±0.62a 2.45±0.66ab 1.82±0.57b
Tenderness 3.09±0.51a 3.00±0.60a 3.09±0.51a 3.09±0.29a 2.73±0.62a
Smoothness 2.82±0.57a 3.09±0.67a 2.91±0.51a 2.82±0.57a 2.55±0.50a
Taste 2.09±0.67a 2.27±0.96a 2.00±0.74a 2.09±0.79a 1.91±0.67a
Off-taste 1.00±0.00a 1.00±0.00a 1.00±0.00a 1.09±0.29a 1.18±0.39a
Overall liking 3.45±0.50ab 4.09±0.67a 3.55±0.66ab 3.36±0.48ab 2.73±0.86b
Mean values with the same letter within a row are not significantly different at p=0.05 (n=11)1aroma (1=none, 5=extremely aromatic), off-odor and off-taste (1=none, 5=extremely perceptible),color (1=gray/cream, 5=extremely white), gloss (1=dull, 5=extremely glossy), cohesiveness (1=separated, 5=extremely cohesive), tenderness (1=hard, 5= extremely tender), smoothness (1=rough, 5=extremely smooth), taste (1=bland, 5=extremely tasty), and over-all liking (1=dislike very much, 5=like very much).
Table 8. Mean laboratory sensory scores of cooked rice:Gulian blend.
Sensory Attributes1 Rice:Gulian Ratio
100:00 75:25 50:50 25:75 00:100
Aroma 1.45±0.66a 1.45±0.66a 1.55±0.50a 1.36±0.48a 1.27±0.45a
Off-odor 1.00±0.00a 1.00±0.00a 1.00±0.00a 1.09±0.29a 1.18±0.39a
Color 2.45±0.50a 2.18±0.57ab 2.00±0.60ab 1.64±0.48b 1.64±0.48b
Gloss 2.91±0.51a 3.00±0.43a 2.73±0.62a 2.73±0.62a 2.36±0.77a
Cohesiveness 3.18±0.39a 3.09±0.29a 3.00±0.43a 2.73±0.62ab 2.27±0.86b
Tenderness 3.18±0.39a 3.09±0.51a 3.00±0.43a 2.91±0.67a 2.73±0.86a
Smoothness 2.82±0.39a 3.09±0.51a 2.91±0.51a 2.82±0.57a 2.64±0.77a
Taste 1.91±0.79a 2.00±0.85a 2.18±0.72a 1.91±0.67a 1.82±0.57a
Off-taste 1.00±0.00a 1.14±0.31a 1.18±0.39a 1.23±0.39a 1.27±0.45a
Overall liking 3.45±0.66a 3.27±0.45a 3.36±0.64a 2.82±0.57ab 2.45±0.78b
Mean values with the same letter within a row are not significantly different at p=0.05 (n=11)1aroma (1=none, 5=extremely aromatic), off-odor and off-taste (1=none, 5=extremely perceptible),color (1=gray/cream, 5=extremely white), gloss (1=dull, 5=extremely glossy), cohesiveness (1=separated, 5=extremely cohesive), tenderness (1=hard, 5= extremely tender), smoothness (1=rough, 5=extremely smooth), taste (1=bland, 5=extremely tasty), and over-all liking (1=dislike very much, 5=like very much).

Quality and Acceptability of Rice: Adlai Blend
RICE-BASED BIOSYSTEMS JOURNAL (2020) 6: 57-64 61
blend forms. Off-odor and off-taste were also not perceived among the samples. Meals with 25-50% Tapol obtained comparable score for overall liking with pure rice. Higher Tapol proportion resulted in lower score.
In general, it can be observed that the low-amylose NSIC Rc 160 received higher scores for tenderness and smoothness than the three adlai varieties, despite the latter having an amylose content equivalent to very low. It can be deduced that the amylose property of adlai could be different from rice. Sensory evaluation also showed that Ginampay can be substituted to rice at any ratio but any of the three varieties can be blended with rice at 50% substitution.
Consumer. To determine the preference of the consumers and acceptability of the samples, the three rice:adlai blends at 50:50 ratio were subjected to consumer test (Figure 2). Sixty rice consumer representing 18-54 years old and composed of 32% male and 68% female evaluated the samples. Table 10 summarizes the results of the preference and consumer acceptance tests. Percentage acceptability of the control and rice:adlai blends ranged 71.67-85%. Among the adlai samples, 50:50 rice: Ginampay blend was preferred over rice:Gulian and rice:Tapol blends. It received ratings and rank score comparable with the pure rice. In terms of ranking, the blends were preferred in the following order: pure rice ≥ rice: Ginampay ≥ rice: Tapol ≥ rice: Gulian.
Table 9. Mean laboratory sensory scores of cooked rice:Tapol blend.
Sensory Attributes1 Rice:Tapol Ratio
100:00 75:25 50:50 25:75 00:100
Aroma 1.64±0.64a 1.55±0.66a 1.27±0.45a 1.27±0.45a 1.18±0.39a
Off-odor 1.00±0.00a 1.09±0.29a 1.00±0.00a 1.23±0.39a 1.18±0.39a
Color 2.73±0.62a 2.45±0.66ab 2.27±0.45ab 1.91±0.67b 1.73±0.62b
Gloss 3.00±0.43a 2.82±0.57a 2.91±0.51a 2.64±0.48a 2.36±0.88a
Cohesiveness 2.91±0.37a 2.91±0.51a 2.82±0.39a 2.55±0.50ab 2.18±0.72b
Tenderness 2.91±0.51a 2.91±0.29a 2.82±0.57a 2.64±0.88a 2.27±0.75a
Smoothness 2.82±0.57a 2.73±0.45a 2.91±0.67a 2.64±0.64a 2.27±0.62a
Taste 1.82±0.83a 1.91±0.67a 1.82±0.57a 1.55±0.50a 1.45±0.50a
Off-taste 1.00±0.00a 1.18±0.39a 1.18±0.39a 1.45±0.66a 1.64±0.77a
Overall liking 3.82±0.57a 3.55±0.66a 3.27±0.45ab 2.73±0.62b 2.55±0.66b
Mean values with the same letter within a row are not significantly different at p=0.05 (n=11)1aroma (1=none, 5=extremely aromatic), off-odor and off-taste (1=none, 5=extremely perceptible),color (1=gray/cream, 5=extremely white), gloss (1=dull, 5=extremely glossy), cohesiveness (1=separated, 5=extremely cohesive), tenderness (1=hard, 5= extremely tender), smoothness (1=rough, 5=extremely smooth), taste (1=bland, 5=extremely tasty), and over-all liking (1=dislike very much, 5=like very much).
Figure 2. Cooked rice:adlai blends at 50:50 ratio.

Quality and Acceptability of Rice: Adlai Blend
62 RICE-BASED BIOSYSTEMS JOURNAL (2020) 6: 57-64
Proximate Composition
Proximate composition is an estimation of the relative nutritional value of a particular food which includes protein, ash, fat, and dietary fiber. Polished rice usually has 5.8-7.1% crude protein while adlai contains 13.1% (Juliano 2010; FNRI, 1997). In addition to its nutritional value, protein contributes to the textural property of rice. Meanwhile, ash represents the total mineral content in foods. Ash content in rice usually ranges from 0.3 to 0.8%. Adlai, on the other hand, contains 0.9% ash. Fats and oils are concentrated sources of energy and transport fat-soluble in vitamins in the blood. Adlai has higher amount of fat (2.5%) than polished rice (0.3-0.6%). Dietary fiber in rice usually ranges from 0.7 to 2.3% dietary fiber, which is considerably lower than adlai (3.7%).
Table 11 presents the proximate composition of all the rice:adlai blends at 50:50 ratio. The three adlai varieties had significantly higher protein content (12.15-12.91%) than pure rice (8.97%). The values are consistent with data published by the FNRI (1997) in the Philippine Food Composition Table. The higher protein content of adlai caused a significant increase in the protein content of all the rice:adlai blends. In terms
of ash content, only Tapol and its blend form produced comparable amount (0.63 and 0.67%, respectively) with pure rice (0.95%). Both Ginampay and Gulian and their blend forms had lower ash content than the reported values (0.9%). Meanwhile, blending rice with adlai, regardless of the variety, significantly increased the fat content of the blend samples by 1.02-1.22%. Dietary fiber content of the blends (1.60-2.10%) was generally comparable with pure rice (1.95%). Pure adlai samples had considerably lower amount of carbohydrates compared with rice. However, when rice was blended with Ginampay, the carbohydrate content was compensated. Some of the proximate properties of the pure adlai varieties were similar with the Thai’s white adlai as reported by Dechkunchon and Thongngam (2007).
ConclusionFactors like gelatinization temperature and ratio
of adlai to rice affect the cooking and eating quality of rice:adlai blends. The high gelatinization property adlai was positively correlated with longer cooking time of the rice:adlai blends, but the effect depends on the variety and ratio of adlai. All the three adlai varieties produced heavier meal when blended with rice at any ratio, but the rice:Ginampay blend gave
Table 10. Preference score and consumer acceptance of rice:adlai blends.
ItemMean Sensory Scores
50:50 rice:Ginampay
50:50 rice:Gulian
50:50 rice:Tapol
pure NSIC Rc 160 (Control)
Adults (18-54 yr, n=60)
% Acceptabilitya 85.00a 71.67a 73.33a 83.33a
Ratingb 3.22ab 2.97a 2.93a 3.48b
Rank Scorec 2.23b 2.87a 2.85a 2.03b
Rankingc 2 4 3 1aBased on percentage of positive responsesb1= poor, 2=fair, 3=good, 4=very good, 5=excellentc1= highest, 4= lowest
Table 11. Proximate composition (%) of rice, adlai, and rice:adlai (50:50) blends.
Sample Crude Protein
Crude Ash
CrudeFat
Dietary Fiber Carbohydrates
Rice1 8.97±0.01d 0.95±0.02a 0.32±0.00c 1.95±0.21bc 82.67±0.07a
Rice:Ginampay 11.52±0.15bc 0.52±0.01b 1.02±0.01b 1.60±0.14c 81.67±0.03a
Ginampay 12.15±0.35ab 0.49±0.02b 1.89±0.05a 2.35±0.21ab 74.05±0.46d
Rice:Gulian 11.19±0.08c 0.47±0.01b 1.22±0.10b 1.75±0.07bc 76.75±0.21c
Gulian 12.38±0.06a 0.45±0.01b 1.96±0.21a 2.20±0.14bc 73.83±0.28d
Rice:Tapol 11.46±0.20bc 0.67±0.26ab 1.10±0.36b 2.10±0.14bc 78.41±0.38b
Tapol 12.91±0.30a 0.63±0.05ab 1.99±0.04a 2.95±0.21a 73.50±0.29d
Mean values with the same letter within a column are not significantly different at p=0.05 (n=2)1 NSIC Rc 160

Quality and Acceptability of Rice: Adlai Blend
RICE-BASED BIOSYSTEMS JOURNAL (2020) 6: 57-64 63
an additional volume that could be translated to more food. Ginampay and all its blend forms also produced similar sensory property with pure rice. Consumer acceptability showed that the 50:50 rice:Ginampay blend was the most preferred and accepted by the consumers than the Gulian and Tapol blends. This study showed that Ginampay can be substituted to rice at 50:50 ratio as source of carbohydrates, providing the consumer the same eating satisfaction and higher amount of protein and fats. Further studies on the shelf-life of raw and cooked adlai are recommended.
Literature CitedAdlai (Coix lacryma-jobi L.) [Brochure] n.d. Lipa City:
Department of Agriculture Regional Field Unit 4-A
[AOAC] Association of Official Analytical Chemists (2000) Official Methods of Analysis. 17th ed. Arlington, VA, USA: Association of Official Analytical Chemists, Inc. Vol. 2. p 20-34.
Dechkunchon M, Thongnam M (2007) Chemical and physicochemical properties of adlay flours and starches. 45th Kasetsart University Annual Conference. January 30-February 2, 2007, pp 618-624
[FNRI] Food and Nutrition Research Institute (1997) The Philippine Food Composition Tables. Department of Science and Technology. Metro Manila, Philippines
Juliano BO (2003) Rice Chemistry and Quality. Manila. Philippine Rice Research Institute, Los Baños, Laguna
Li L, Corke H (1999) Physicochemical properties of normal and waxy Job’s tears (Coix lachryma-jobi) starch. Cereal Chemistry 76:413-416
Lim TK (2013) Edible Medicinal and Non-Medicinal Plants: Vol. 5, Fruits. Springer Science+Business Media Dordrecht, pp 243-244
Manaois, RV (2007) Modification of rice starch properties by addition of amino acids at various pH levels (Unpublished M.S. Thesis). Louisiana State University, Baton Rouge, LA, USA
[NCT] National Cooperative Testing Manual for Rice (1997) Guidelines and Policies. Quezon City, Philippines: Rice Technical Working Group, National Seed Industry Council, Department of Agriculture, Philippines
[PSA] Philippine Statistics Authority (2018) Volume and Area of Palay Production. http://countrystat.psa.gov.ph/ (accessed October 10, 2019)


RICE-BASED BIOSYSTEMS JOURNAL (2020) 6: 65-80 65
IntroductionClimatic variability is one of the major sources of
risks and uncertainties in agriculture. Drought is one of the hazards associated with climate change, which has unfavorable impact on households. Typified as limited rainfall that is substantially below the established “normal” value in an area, its occurrence can lead to adverse consequences on human welfare. Over the years, the global extent of drought has significantly widened with climate change identified as a key factor. Serious occurrences of drought affect a large percentage of the world’s land area, which more than doubled from the 1970s to the early 2000s (Isendahl and Schmidt, 2006; NCAR and UCAR, 2005). Based on climate models, future projections of drought point to a very significant proportion of the global land surface being affected by extreme levels of the hazard. Consequently, this effect will have substantial impact and will pose adaptation challenges (Burke et al., 2006). In crop production, drought is one of the most important yield-limiting factors (Passioura, 2007). Many agricultural pests are likely to progress and farmers are forced to produce crops under a scenario of reduced fresh water supply due to drought
RICE FARMERS’ VULNERABILITY TO DROUGHT HAZARDS AND THEIR AUTONOMOUS
ADAPTATION STRATEGIES IN CENTRAL LUZON, PHILIPPINESAsa Jose U. Sajise1*, Alice B. Mataia2, Digna O. Manzanilla3,
Leo Angelo L. Ocampo3, and Christian P. Umali31University of the Philippines Los Baños (UPLB), Laguna, Philippines 2Philippine Rice Research Institute (PhilRice),
Muñoz, Nueva Ecija, Philippines 3International Rice Research Institute (IRRI), Los Baños, Laguna, Philippines*Corresponding Author: [email protected]
AbstractThis paper provides empirical analysis on the question: does agriculture-based adaptation strategies
improve the resilience of rice farming households? This was answered through a survey of 109 rice farmers in Central Luzon, Philippines. The study used the concept of vulnerability to expected poverty (VEP) to assess farmers’ level of vulnerability and employed econometric models to analyze the survey data. Econometric results showed that autonomous adaptation strategies reduce farmers vulnerability to expected poverty not to drought events, but rather to flooding events. Drought events may not have long term consequences on households’ vulnerability due to their infrequent occurrences. This also shows that agriculture-based adaptation strategies make households resilient against multiple hazards. Results also indicate the potential role of varietal improvement programs particularly the development of stress tolerant varieties, as a viable, effective, and equitable planned adaptation strategy. The study also emphasizes the need to capacitate extension agents so they can perform an expanded role in advising farmers not only on increasing production but also on improving resiliency against climate hazards. Gender should also be considered in future planned adaptation strategies as it plays a factor in vulnerability assessment and adaptation strategy choice analysis.
Keywords: Autonomous Agriculture-Based Adaptation, Drought, Stress-Tolerant Rice Varieties, Vulnerability to Expected Poverty, Women Empowerment Index, Gender and Adaptation Strategies, Multiple Climate Hazards.
(Grayson, 2013).
Drought is extensive throughout Southeast Asia with highest frequencies of occurrences in Laos, Philippines, Indonesia, and Thailand. The Philippines, in general, is vulnerable to drought spells with high probability (0.41), but still lower than Indonesia (0.46) and Thailand (0.45) (Pandey et al., 2007). A large extent of the country’s area has been affected by sporadic drought, the most extensive and most severe of which occurred in 1997-1998, affecting almost 70% of the country. Unlike typhoons and flooding that occur frequently and in distinct areas, drought occurs with a less discernible pattern both in time and space (Department of Agriculture et al., 2010). Thus, it is quite hard to predict when and where the effects of drought would be most destructive. Drought has higher degree of uncertainty than other climate-related hazards such as flooding. The most affected and damaged sector is usually agriculture, in particular, the rice and corn industries. Estimates for three drought episodes (1982-1983, 1991-1992, and 1997-1998) revealed total production losses for both crops amounting to about PhP18.2 billion (US$ 445 million) (Department of Agriculture et al., 2010).
Received: August 06, 2019 • Accepted: January 30, 2020
FULL PAPER

Rice Farmers’ Vulnerability to Drought Hazards
66 RICE-BASED BIOSYSTEMS JOURNAL (2020) 6: 65-80
probability of using agriculture-based adaptation strategies were estimated from a probit regression on the decision to implement farm-based adaptation strategies against demographic, farm characteristics, and institutional (i.e., visits of extension agents) variables. The institutional variable was also used as an overidentifying or instrumental variable to identify the effects of adaptation, along with other key determinants, on the Vulnerability Index of rice farming households. A Tobit regression was used to establish association between these variables and the Vulnerability to Expected Poverty Index.
MethodsSurvey Details and Survey Sites
The study covered sites in two provinces (Tarlac and Pangasinan) in Central Luzon, Philippines. These were selected based on information provided by the local government units (LGUs) in drought-prone areas and project sites of the Consortium for Unfavorable Rice Environments - International Rice Research Institute (CURE-IRRI). The sites in Tarlac included three villages from two municipalities while those in Pangasinan included two villages from one municipality with a large proportion of drought-prone areas. Sample size was proportional to the number of drought-affected rice farmers in the project site. For each site, a target of 20% of the total rice farmers in drought-prone areas was set. Each farmer was selected using simple random sampling. There were 109 farmer-respondents: 67 from Tarlac and 42 from Pangasinan.
Heads of households were mostly male only 10% of households had female household heads, a reflection of the dominant patriarchal structure of Philippine households. On average, household heads had 10 years of education; thus, they have at least completed the primary level of schooling with some years spent in the secondary level. Average farming experience was 22 years and average age of household heads was 52, implying that household heads have been farming for about half of their lives. This is consistent with the finding that work is mostly found inside the village with 76% of household members working within the village and few household members employed abroad.
Households in the study areas, on average, earned an annual income of PhP277,616 (US$6,532) a year before the survey. Respondent household in Tarlac earned more (PhP323,082 or US$7,602) than those in Pangasinan (PhP205,089 or US$4,826); however, the difference was not statistically significant. Data on gender-related decision-making activities in the households were also gathered. Husbands mainly decide on agriculture-related activities while women decide largely on non-agricultural matters such as
Another study estimated the damage to rice farming to reach an average of PhP2.4M (US$59.9 million) per year from 2007 to 2010 (Israel, 2012).
While there have been studies that looked at the impact of drought and the coping mechanisms associated with it in other Southeast Asian countries (Pandey et al., 2007), only a few had analyzed cases in the Philippines, in particular its implications to the Filipino rice farmers. Studying specific cases is important as results from site-specific assessments can yield effective policies. As Grayson (2013) pointed out, “no universal answer is applicable”; although climate change hazards are global in origin and nature, the most effective responses are context-specific.
This study provides local information through a specific case study of how drought episodes affect Filipino rice farmers and how they respond to this hazard autonomously. In particular, this study answers, “Does agriculture-based autonomous adaptation strategies improve the resilience of rice farming households particularly in two provinces in the Philippines?” Auxiliary to this, are the following research questions: a. How does drought events fare against other weather (i.e., flooding) and non-weather-related farm shocks (i.e., rodent/insect, weeds, and other pests) in affecting the vulnerability of rice farming households?; b. What factors affect rice farming households’ vulnerability to expected poverty?; and c. What factors encourage/discourage these households to implement agriculture-based adaptation strategies against drought? It is hoped that the results would provide clear answers to these questions and basis for crafting planned agro-technology interventions that can reduce and manage risks associated with drought in the rice farming communities.
The three main analyses involved in the study were hazard and impact analysis, vulnerability assessment, and analysis of adaptation strategies. Hazard or risk analysis was qualitative in nature. In particular, reduction in rice yield and other damages identified by the farmers from the worst and latest cases of drought were deduced from farmers’ perceptions.
For vulnerability assessment, the interest is largely on the impact of drought using a measure that is related to household poverty level and on farmers’ adaptation strategies. Thus, analysis is framed on the vulnerability to expected poverty (VEP) concept. The estimated VEP or probability was used as a measure of the household’s vulnerability brought about by drought events. This computed VEP measures were then regressed with other variables such as gender, income, and on the estimated probability of using agriculture-based adaptation strategies. This way, associations between some critical variables and household vulnerability were explored. The

Rice Farmers’ Vulnerability to Drought Hazards
RICE-BASED BIOSYSTEMS JOURNAL (2020) 6: 65-80 67
income allocation and spending on child education. The result on agriculture-related decision-making, however, seems unrepresentative of the whole country as FAO (1996) has noted that women also participate in farming decisions to a great extent. These include decisions on seed selection, harvesting, and threshing.
Irrigation is available for most of the cultivated plots with an average of irrigated 0.97 ha. Considering that the mean parcel size is 1.75 ha, then 55% of cultivated land on average has access to irrigation facilities. Farms in Pangasinan are 460 m away from the irrigation source while farms in Tarlac are only 3 m away. Majority of the farmers were not aware of the existence of drought-tolerant varieties. However, when asked whether they want to try these varieties in the future, 85% of the respondents answered positively. This means that there is a high willingness among farmers to try and grow these varieties.
Net income from rice cultivation accounted, on average, for 34% of total household income. As shown in Table 1, there were more respondents from Tarlac, although marginally, they are more dependent on rice farming (36%) than rice farmer-respondents in Pangasinan (32%). Wet season rice income was significantly higher (at 1%) than dry season income. This pattern was also observed at the provincial level. There was no observed difference in wet season rice income between the respondents from the two provinces. However, mean rice income during the dry season for Tarlac households were significantly higher (at 1%) than Pangasinan households.
Table 1. Rice income profile, by study site and season
Province
Pangasinan(n=42)
Tarlac(n=67)
Whole Sample (n=109)
Wet Season (PhP) 36,874 40,008 38,874
Dry Season (PhP) 7,988 30,634 22,443
Total (PhP) 37,7238 63,339 53,282
% of Total Income 34 40 40
Table 2 shows that rice-rice is the most common cropping pattern in Tarlac as reported by 44% of the farmers, followed by rice-fallow (32%), rice-rice-mongo (14%), rice-camote (3%), rice-peanut (3%), and rice-vegetables (2%). This means that in dry season, some farmers practiced land fallowing while some planted non-rice crops that are tolerant to drought. This is to avoid significant losses during possible drought events. In contrast, there are only three cropping patterns practiced in Pangasinan with 42% are rice-corn, 33% rice-rice and 26% rice-fallow. Corn is considered the second most important crop in Pangasinan with 42% of the farm households planting in the dry season. This is logical as corn requires less
water than rice. This can also partly account for the significantly lower net returns from dry season rice farming for these farming households. Alternative crops such as maize, vegetables, and other dry-season crops are usually cultivated in late August (Mitin, 2009).
Table 2. Cropping calendar and cropping pattern, by study site.
Tarlac(n=67)
Pangasinan(n=42)
Whole Sample(n=109)
Cropping pattern (%) Rice-Rice 44 33 39 Rice-Fallow 32 26 29 Rice-Corn 3 42 18 Rice-Rice-Monggo 14 - 8 Rice-Camote 3 - 2 Rice-Peanut 3 - 2 Rice-Vegetables 2 - 1
Rice Cropping calendar Wet Season Jul-Oct Jul-Oct Jul-Oct Dry Season Nov-Feb Dec-Mar Dec-Mar
Approach to Estimating Household Vulnerability and Assessing Adaptation Strategies
As discussed earlier, the study used VEP to measure vulnerability. Aside, from its appeal from being directly related to poverty, this approach was adopted and selected from among the different econometric approaches in measuring vulnerability [e.g., vulnerability as low expected utility (VEU) and vulnerability as uninsured exposure to risk (VER)] because it fits the cross-section data collected for the study. Further, VEP was chosen over index-based approaches because VEU and VER are often very sensitive to changes in arbitrary weights assigned to different categorization of variables.
The expected poverty approach defines vulnerability as the probability that a household will fall into poverty given certain shocks. Poverty is a situation where the consumption of a household falls below a minimum threshold level. To compute for the VEP per household, the method by Chaudhuri et al. (2002) was liberally adopted. Estimation of VEP starts with estimating a consumption determination function. In estimating for this function, characteristics of the household, household head, and farm cultivated were considered as regressors. Gender-related components such as women empowerment index (WEI) (Paris et al., 2010; Hossain and Bose, 2004) were also considered. The WEI is a survey-based index developed to assess the decision-making authority of the wife in relation to the husband in agriculture and non-agriculture activities. An index value closer to 5 indicates that women are empowered; that closer to 1 reflects male dominance in decision-making (Hossain and Bose, 2004).

Rice Farmers’ Vulnerability to Drought Hazards
68 RICE-BASED BIOSYSTEMS JOURNAL (2020) 6: 65-80
The consumption determination function is of the following form:
(1)
where
ln C is the logarithm of consumption expenditure,X is a matrix of regressors, andε is an error term.
The usual assumption on the error term is e~iid N (0,s). Estimation of the consumption determination function1 would either be through feasible generalized least square (FGLS) ─ a common estimation procedure to correct for heteroscedasticity, which is observed in consumption data, or robust regression. The expected or estimated consumption level is then computed. The probability of the estimated consumption falling below a critical level will be computed using the following formula under the normal distribution assumption
(2)
where
Vh is the vulnerability index/measure,
ln z is the critical or minimum household consumption,
is the estimated consumption from the FGLS or robust regression estimation, and
is the cumulative normal function.
Note that the denominator (which is the standard deviation of the consumption determination function) for the cumulative normal function is already corrected for potential heteroscedasticity ─ that is, the variance is estimated to be also a function of a set of variables.
The estimated probability was used as a measure of the household’s vulnerability due to drought events. The computed probability can be interpreted as the probability of consumption falling below a critical level due to shocks.
Probit regression was used in modeling the determinants of household decision to adapt to drought. Households would, in all likelihood, employ a combination of strategies or choose joint adaptation strategies. One econometric model that reflects joint choices and that was initially planned for use in this study is the multivariate probit regression. However, because there were only a few households that chose to employ adaptation strategies, further disaggregation
1 For brevity, discussion of the results was not included in this paper. It is available upon request from the authors.
of the data did not yield robust results. Thus, simple probit regression was used.
Household Vulnerability and Use of Adaptation Strategies: A Tobit Regression
To determine whether agriculture-based adaptation strategies do affect household vulnerability (or resilience), regression of vulnerability measure (Vh) against the use of agriculture-based adaptation strategies and other control variables was generated. There are econometric issues in this regression. First, the dependent variable Vh is constrained to be between 0 and 1. Ordinary least squares may yield predictions for the dependent variable beyond this range. Second, adaptation is potentially endogenous and maybe correlated with the error term. To address these issues, Tobit regression using the predicted probability of adaptation which we obtain from the previously discussed probit regression of the determinants of use of agriculture-based adaptation strategies was employed. Visits of extension agents as an overidentifying variable was counted because it affects the probability of adaptation but not the Vulnerability to Expected Poverty measure. Predicted probability was measured with the variables representing drought, flooding, and other agricultural hazards. These interacted variables are of primary interest because they capture the mitigating effect of adaptation strategies. Finally, bootstrapped standard errors for the estimated coefficients was employed.
Results and DiscussionFarmers’ reported occurrences of drought in their
area were largely based on their recall and perception. At the time of the survey, the latest drought occurrence recalled by respondents seemed to have occurred quite recently in 2008, 2010, and 2011. On the other hand, respondents remember worst drought events to have occurred in 2008, 2004, 2003, and 2002. Recall of drought events, however, did not seem to coincide with government recorded drought events. In 2007 and 2010, both provinces had reported drought occurrences but very few respondents were able to recall drought events during these years. Of the 35 respondents who recall the exact year of the drought events, only 2 (6%) cited 2007 as a drought year while only 7 (20%) recalled drought happening in 2010. Five or 14% of these respondents reported drought occurring in 2008. However, no drought affecting the two provinces was officially reported in 2008 (Israel, 2012). The dry spell that hit Pangasinan in 2007 lasted from June to August (Mitin, 2009).

Rice Farmers’ Vulnerability to Drought Hazards
RICE-BASED BIOSYSTEMS JOURNAL (2020) 6: 65-80 69
Hazard and Impact Analysis
Respondents were mostly affected by drought events in the study sites. Table 3 shows that 52% of the respondents said their crops or farms were affected by drought while only 38% (41 households) indicated that they were affected by flooding and other non-weather-related shocks. In Tarlac, both flooding (34 households or 51%) and drought (32 or 48%) events caused crop problems for rice farming households. In contrast, respondents from Pangasinan felt affected more by drought (25 or 60%) than flooding (7 or 17%) and non-weather-related farm shocks such as weed and pest (insects and rodents) infestations.
Table 3. Proportion of households experiencing drought, flooding, and non-weather-related farm shocks, by study site.
StressProvince Whole
Sample(n=109)
Pangasinan (n=42)
Tarlac(n=67)
Drought 25 (60%) 32 (48%) 57 (52%)Flooding 7 (17%) 34 (51%) 41 (38%)Non-weather farm shocks (e.g., rodent/pest and weeds)
14 (33%) 27 (40%) 41 (38%)
Based on farmers’ answers, the highest probability of drought occurs around February-March. Rainfall is generally low during dry months (February-April) in the country and drought may occur in some areas (Lansigan et al., 2000). In Tarlac and Pangasinan, 43% and 30% of households, respectively, reported that drought often occurs during these months. Drought was also recorded to have occurred in the country from July to November but not in the study sites.
Respondents were also asked regarding their perception and experience on the severity, length, and frequency of drought episodes during the last 20 years and their perceived projections for the next 20 years. During the past 20 years, less than half of the farmer- respondents perceived that severity (43%), length (49%), and frequency (38%) of drought events have been increasing. Thus, the more dominant perception was that drought spells are getting longer during the past 20 years rather than being more severe and more frequent. Farmers in Pangasinan seemed to be more optimistic about drought events because only a handful of respondents felt that drought spells have become more frequent (28%), longer (33%), and more damaging (19%) in the last two decades. Farmers also shared their perception about future drought episodes. Contrary to their perceived history of drought events, respondents indicated that future events of droughts would be more frequent (62%), longer (51%), and would have more deleterious impact (57%). Thus, farmers’ perceptions point to a greater threat from drought in the future, more on frequency rather than on duration or degree of damage. However, only 10-15% of the respondents said their assessment with certainty as climate is quite erratic.
The responses on the impacts of drought are presented in Table 4. The analysis was focused on agricultural impacts, in particular, on yield and total production. There was a 31% reduction in production during the recent cases of drought and 48% reduction during the perceived worst drought occurrence. On the other hand, yield declined by 33% and 41% for the latest and worst occurrence of drought, respectively. A larger relative decline in both yield and total production occurred in Pangasinan, which can be
Table 4. Impacts of drought, by study site.
Province Whole
Sample (n=109)Pangasinan
(n=42) Tarlac(n=67)
Area planted during normal times 0.54 0.43 0.47Area planted during latest drought 0.49 0.43 0.45Area planted during worst drought 0.22 0.33 0.29Area harvested during normal times 0.54 0.39 0.44Area harvested during latest drought 0.46 0.38 0.41Area harvested during worst drought 0.19 0.28 0.25Total production during normal times 476.56 606.98 560.09Total production during latest drought 138.28 524.72 385.78Total production during worst drought 63.59 420.26 292.02Yield during normal times 477.66 264.25 340.98Yield during latest drought 175.94 256.96 227.83Yield during worst drought 150.63 228.93 200.78Value of loss in livestock during the latest drought 670.33 - 670.33Value of loss in livestock during the worst drought 669.67 - 669.67

Rice Farmers’ Vulnerability to Drought Hazards
70 RICE-BASED BIOSYSTEMS JOURNAL (2020) 6: 65-80
explained by the differences in severity of drought occurrence between the two provinces.
Another possible impact of drought is the unavailability of rice. This is especially true if farmers are net buyers or rice consumers. Very few farmers reported to have experienced rice shortages. Only 16 farmers or 15% of the total sample reported having experienced rice shortages. Furthermore, the number of months with rice shortages during normal and drought years was statistically the same for these farmers. Thus, drought, at least for these areas, does not seem to affect household consumption of rice.
Vulnerability Assessment
The vulnerability assessment using VEP relies on the predicted value of consumption falling below a minimum threshold level. The predicted consumption was obtained through robust regression. The results of this estimation are available upon request from the authors.
Estimated Vulnerability Index
The vulnerability of households to expected poverty due to various shocks is captured through the computed or estimated vulnerability index (VI). For the whole sample, there was a 78% mean probability that rice-farming households will fall below the minimum daily per capita consumption of US$1.25. The mean VEP for Pangasinan respondents was estimated to be at 81% while 75% for the Tarlac respondents. Although the mean VIs for the two provinces were numerically different, a simple t-test proved that the difference was not statistically significant.
The distribution of mean VIs was further analyzed across varying degrees of vulnerability and study sites. Degrees of vulnerability were based on terciles of the data, i.e., the first tercile (0- 0.73) represents low vulnerability, second tercile (0.731-0.97) moderate vulnerability, and the third tercile (> 0.971) as highly vulnerable. Based on this degree classification, most of the respondents in Tarlac were classified under low vulnerability, while for majority of Pangasinan respondents were classified as moderately vulnerable. A crucial question here is whether the VEP measure is somewhat related to drought events or whether what is being captured is simply the existing poverty situation of the farmers, even without the impact of drought and other stresses. This means that the probability of farming households to be poor in general may not be necessarily associated with drought episodes.
To answer this question, the mean VIs of households that experienced drought and those that did not were compared for both provinces and the whole sample (Table 6). For farmer-respondents from Pangasinan, association between drought and the mean VI were not statistically significant. Thus, for this subsample, there was a very weak association between drought and expected poverty. These data captured the vulnerability of households to expected poverty (i.e., their innate susceptibility to being poor apart from whether they have been affected by drought). Note that the earlier discussion on household characteristics also showed that Pangasinan respondents have a lower level of annual household income. Thus, this corroborates the observation that they may be innately poor regardless of the degree of hazard.
Table 5. Distribution of vulnerability index, by degree of vulnerability and study site.
Degree of VulnerabilityProvince
Whole Sample (n=109)Pangasinan
(n=42)Tarlac (n=67)
Low vulnerability (0<VI≤0.73) 11 (26%) 26 (39%) 37 (34%)
Moderately vulnerable (0.73<VI I≤0.97) 16 (38%) 20 (30%) 36 (33%)Highly vulnerable (VI>0.97) 15 (35%) 21 (31%) 36 (33%)
Total 42 67 109
Table 6. Mean vulnerability index, by drought experience and study site.
ProvinceAll
Pangasinan Tarlac
Did not experience drought 0.76 0.67** 0.70***(n=17) (n=35) (n=52)
Experienced drought 0.84 0.84** 0.84***(n=25) (n=21) (n=57)
Whole sample 0.81 0.75 0.78 (n=42) (n=67) (N=109)

Rice Farmers’ Vulnerability to Drought Hazards
RICE-BASED BIOSYSTEMS JOURNAL (2020) 6: 65-80 71
The situation of Tarlac households was different. There was a significant difference in the probability of falling into poverty between the two types of households. VEP increased by 17 percentage points when households were affected by drought events. Thus, Tarlac households are indeed susceptible to drought. The same can be said for the whole sample. The statistically significant difference is noticeable in mean VI between households affected by drought events and those that were not affected. On average, for the whole sample, households who experienced the effects of drought were 14% points more likely to fall into expected poverty.
Vulnerability, Farm Size, and Income Categories
This section looks at the qualitative relationship between the estimated mean VI and key farming and socioeconomic characteristics of the households. In particular, association between farm size, income categories, and the degree of vulnerability were studied to have a deeper understanding of the agrarian and socioeconomic nature of the most vulnerable groups. This analysis considered only the 57 households affected by drought episodes.
Farmers with large landholdings are often better-off and are thus in a better position to cope with the deleterious impacts of drought. However, from Table 7, most households affected by drought were highly vulnerable, regardless of farm size. Across the three farm sizes, it is observed that the highest proportion of drought-affected households are in the
highly vulnerable category (i.e., 53% for marginal sized farms, 43% for medium sized farms, and 58% for large farms). Within each vulnerability degree category, the highest proportion of drought-affected households fall within the large farm category. For drought-affected households with low vulnerability to expected poverty, 32% are classified as large farm owners. Similarly, 58% of highly vulnerable sampled households were large farm owners. On the other hand, the farm size distribution seems to be different for moderately vulnerable households. For households in this vulnerability degree category, majority of rice farmers were considered as medium farm size owners.
A more direct correlate of the household’s capacity to bear shocks is income. Patterns were analyzed between income quartiles and the degree of VEP due to drought and other farm related shocks. For the whole sample, drought-affected households were somewhat equally distributed across the income quartiles. Differences in VEP distribution is more evident within the vulnerability degree categories. Majority of highly-vulnerable respondents fall in the mid quartiles, i.e., quartiles 2 (56%) and 3 (60%). Households classified under low vulnerability to expected poverty, were mostly in the 4th quartile (42%). Finally, moderately vulnerable drought-affected rice farmers were concentrated in the 1st quartile (43%). Like the previous discussion, no clear discernable pattern is seen between the relationship in income quartiles and vulnerability degrees; thus, quantitative Tobit regression supplements the qualitative discussion.
Table 7. Degrees of vulnerability for drought-affected households, by farm size category.
Farm SizeDegree of Vulnerability
TotalLow Vulnerability Moderately Vulnerable Highly Vulnerable
Marginal (< 1 ha) 4 (24%) 4 (24%) 9 (53%) 17
Medium (1 to 2 ha) 4 (19%) 8 (38%) 9 (43%) 21
Large (> 2 ha) 6 (32%) 2 (11%) 11 (58%) 19
Total 14 (24%) 14 (24%) 29 (51%) 57
Table 8. Degrees of vulnerability for drought affected households, by income quantile.
Income Quantile (PhP)Degree of Vulnerability
TotalLow Vulnerability
Moderately Vulnerable
Highly Vulnerable
Quantile 1 (≤54,000) 2 (14%) 6 (43%) 6 (43%) 14
Quantile 2 (54,001 - 126,613) 4 (25%) 3 (19%) 9 (56%) 16
Quantile 3 (126,61 - 230,092) 3 (20%) 3 (20%) 9 (60%) 15
Quantile 4 (>230,092) 5 (42%) 2 (17%) 5 (42%) 12
Whole sample 14 (25%) 14 (25%) 29 (51%) 57

Rice Farmers’ Vulnerability to Drought Hazards
72 RICE-BASED BIOSYSTEMS JOURNAL (2020) 6: 65-80
Households’ Choice of Agriculture-Based Adaptation Strategies Against Drought
Only 29 (51%) of drought-affected households used some form of agriculture-based adaptation strategy to drought. Farmer respondents did not adapt for a variety of reasons. Forty percent (40%) of the respondents indicated lack of information about the appropriate adaptation options as their primary reason. The second most common reason for non-adaptation is the lack of information regarding long-term climate change (38%). This corroborates the earlier finding that farmers are not very certain about future trends of drought episodes.
Table 9 shows the common agriculture-based adaptation strategies employed by rice farming households in the two study sites. Top three most commonly employed adaptation strategy can generally be categorized as either adjustments in cultivation practices or installation of farm infrastructure. For all drought-affected households, the most common strategy is the shifting of planting dates. This was done by 19% of all drought affected households. Planting rice is often delayed because seedlings are short and small due to limited water (Mitin, 2009).
Adoption of new rice variety was also a common practice as 14% of all drought-affected farmers employed this strategy. This shows the potential of rice varietal improvements to be part of a broader planned adaptation strategy against drought. Respondents indicated their willingness to grow drought-tolerant varieties. This is not surprising as the impact of
drought is primarily reduced yield. Furthermore, literature points to the importance of drought-tolerant varieties or technologies in general in crafting plausible solutions to ease the effects of drought.
In eastern India, a higher social return was seen on drought-tolerant rice research and dissemination (Gautam, 2009). Technologies focusing on stress tolerance are central to improving the plight of farmers in unfavorable environments as these technologies help stabilize rice yield and reduce farmers’ vulnerability to shocks and stresses (Pandey and Bhandari, 2009; Pandey et al., 2012). The choice of cultivating modern varieties over traditional ones resulted in a very convincing increase in yield (Pandey et al., 2012). It was found that the use of drought-tolerant varieties can increase yield and result in lower rice prices under varying climate scenarios generated from a climate model. This, in turn, could translate into improved food security and better nutritional outcome for households in the future (Mottaleb et al., 2012).
Specific adaptation practices also differed across study sites. Farmer-respondents in Pangasinan modified their cultivation practices through shifting of planting dates (16%), diversification of crops (12%) and farming activities (16%), and increase used of chemical inputs and fertilizers (12%). Infrastructure improvements were done through construction of water storing facilities (20%). These types of infrastructures were the most widely used adaptation strategy against drought in this study area.
Table 9. Distribution of agriculture specific adaptation practices among drought affected households, by province.
Agriculture Specific Adaptation Practice Pangasinan (n=25)
Tarlac (n=32)
Whole Sample (n=57)
1. Crop diversification (mixed/multi-cropping) 12% 22% 18%2. Crop rotation 4% 22% 14%3. Shift/different planting dates 16% 22% 19%4. Water storage (i.e., construction of wells, dams,
impoundments, and rainwater harvesting) 20% 9% 14%5. Improve irrigation systems (i.e., water-saving
irrigation systems) 4% 19% 12%6. Adoption of water-saving technologies
(i.e., alternate wetting and drying irrigation) 4% 6% 5%7. Shift from single to double cropping 4% 0% 2%8. Change amount of land under cultivation
(i.e., increase land area) 4% 6% 5%9. Adoption of new rice varieties 12% 16% 14%10. Implement soil conservation techniques (terracing
to conserve soil and moisture) 0% 0% 0%11. Integrate other farming activities (i.e., cattle raising
and vegetable planting) 16% 6% 11%12. Buy insurance 0% 3% 2%13. Increase fertilizer and chemical inputs (i.e., pesticides) 12% 25% 19%

Rice Farmers’ Vulnerability to Drought Hazards
RICE-BASED BIOSYSTEMS JOURNAL (2020) 6: 65-80 73
In contrast, Tarlac farmer-respondents opted to improve their irrigation systems (19%). Irrigation, aside from the adoption of high-quality seeds, is a primary factor that helped raise the level of rice yields in the Philippines throughout the years across regional, seasonal, or ecosystem boundaries (Mataia et al., 2011). Modification in cultivation practices came in the form of crop diversification (22%), crop rotation (22%), shifting of planting dates (22%), and increased used of inputs (25%). Unlike respondents in Pangasinan, it was more common among Tarlac rice farmers to increase input use in response to droughts than improve farm infrastructures. For the whole sample, the distribution of adaptation strategies are similar with the Pangasinan farmers. However, the proportions are different. It was more common to modify cultivation practices through shifting of rice planting dates (19%) than water storage improvements (14%).
To better understand the choice of agriculture-based adaptation strategies of the households, the sample was further disaggregated by degree of vulnerability, farm size categories, and female dominance in agricultural and non-agricultural decision making. Table 10 shows the results for the degree of vulnerability disaggregation. For the whole sample, it seems that the distribution of agriculture-based adaptation practices is more dispersed for highly vulnerable drought-affected households relative to those that had low vulnerability. Low-vulnerable farmers tend to use only a few agriculture related adaptation strategies. Furthermore, it can be seen that highly-vulnerable farmers favor more modifications in their farming or cultivation practices. This is in contrast to mildly-vulnerable farmers who favor farm infrastructure improvements like building water storage (36%). The differences in the range of adaptation practices across vulnerability categories are more evident at the provincial level. For both provinces, low-vulnerable households tend to use only a few adaptation practices.
Table 11 shows the distribution of agriculture-based adaptation strategies as it relates to gender dominance in agricultural and non-agricultural decision making. For drought-affected households, the husband dominates in both agricultural and non-agricultural decision-making. In 42 households (or 74% of drought-affected households), the husband decides on non-agricultural matters. Agricultural related decisions were mostly by husbands in 56 (98%) households. Thus, male dominance is noted in both decision-making spheres. Table 11 also shows that husbands prefer to modify crop planting dates as an adaptation strategy against drought. This strategy is also chosen in 24% and 20% of households in which husbands dominate non-agricultural and agricultural decision making, respectively. In contrast, wife chose
crop diversification (20%) and establishment of water storage (100%) as adaptation strategies against drought.
The choice of adaptation strategies was also related to the size of landholdings of drought-affected households. Drought-affected households with large landholdings generally employed more adaptation strategies than households with marginal and medium sized landholdings. While this is maybe evident for the whole sample, this observation is more pronounced at the provincial level, in particular for drought-affected rice farmers in Pangasinan. Commonly used adaptation strategy includes modification of planting dates for both marginal (24%) and large (26%) landed farmers. For farmers with large holdings, increase in input usage and crop diversification was also equally widely practiced. At the provincial level, the adoption of new rice varieties was identified as a common adaptation strategy. Twenty percent of farmers with marginal landholdings and 23% of farmers with medium landholdings practiced this strategy in Pangasinan and Tarlac, respectively.
Determinants of Choice of Adaptation Strategies
The choice to employ agriculture-based adaptation strategies against drought can be influenced by numerous factors. Knowing these factors is of interest from policy and methodological perspective. As discussed earlier, predicted probability of adaptation is used as determinant of vulnerability of rice farming households. The probit regression on possible determinants of adaptation against drought are presented in Table 13. One of the drivers of autonomous adaptation is the drought event itself. Rice farmers are more likely to employ adaptation strategies if they have been affected by drought. This simply means that farmers are rational and do respond to threats autonomously. The marginal effects for this variable showed that the households experiencing the impacts of drought are 50 percentage points more likely to adapt than households that have not experienced drought. Among the variables, experience has the largest significant marginal effect, implying that this is, ceteris paribus, the strongest factor determining the choice whether to adapt. Likewise, the proportion of female household members also increases the likelihood of employing a number of agriculture-based adaptation strategies. A 1% increase in the number of female household members results into a 39% point increase in the likelihood of practicing agriculture-based adaptation practices. Visits by extension worker (i.e., the overidentifying variable), however, is associated with lower probability of use of agriculture-based adaptation strategies against drought. Calculated marginal effects show that the likelihood of employing adaptation strategies is lower

Rice Farmers’ Vulnerability to Drought Hazards
74 RICE-BASED BIOSYSTEMS JOURNAL (2020) 6: 65-80
Tabl
e 10
. Dis
trib
utio
n of
agr
icul
ture
spe
cific
ada
ptat
ion
prac
tices
am
ong
drou
ght-
affec
ted
hous
ehol
ds, b
y pr
ovin
ce a
nd d
egre
e of
vul
nera
bilit
y.
Adap
tion
Prac
tice
Pang
asin
anTa
rlac
Who
le S
ampl
e
Low
Vu
lner
abili
ty
(n=6
)
Mild
Vu
lner
abili
ty
(n=7
)
High
Vu
lner
abili
ty
(n=1
2)
Low
Vu
lner
abili
ty
(n=8
)
Mild
Vu
lner
abili
ty
(n=7
)
High
Vu
lner
abili
ty
(n=1
7)
Low
Vu
lner
abili
ty
(n=1
4%)
Mild
Vu
lner
abili
ty
(n=1
4)
High
Vu
lner
abili
ty
(n=2
9)
1. Cro
p di
vers
ificat
ion (m
ixed/
mul
ti cr
oppi
ng)
33%
14%
0%13
%14
%29
%21
%14
%17
%
2. Cr
op ro
tatio
n0%
14%
0%13
%43
%18
%7%
29%
10%
3. Sh
ift/d
iffere
nt p
lantin
g da
tes
17%
29%
8%0%
29%
29%
7%29
%21
%
4. W
ater
stor
age (
i.e. c
onstr
uctio
n of
well
s, da
ms,
impo
undm
ents
, and
rain
-wat
er ha
rves
ting)
0%57
%8%
0%14
%12
%0%
36%
10%
5. im
prov
e irri
gatio
n sy
stem
s (i.e
. wat
er sa
ving
irriga
tion
syste
ms)
0%14
%0%
25%
14%
18%
14%
14%
10%
6. Ad
optio
n of
wat
er-s
avin
g te
chno
logies
(i.e.
, alt
erna
te w
ettin
g an
d dr
ying
irriga
tion)
0%14
%0%
0%14
%6%
0%14
%3%
7. Shi
ft fro
m si
ngle
to d
oubl
e cro
ppin
g0%
14%
0%0%
0%0%
0%7%
0%
8. Ch
ange
amou
nt of
land
unde
r cul
tivat
ion (i
.e.
incr
ease
land
area
)17
%0%
0%13
%0%
6%14
%0%
3%
9. Ad
optio
n of
new
rice
verit
ies0%
29%
8%0%
29%
18%
0%29
%14
%
10. Im
plem
ent s
oil co
nser
vatio
n te
chni
ques
(te
rracin
g to
cons
erve
soil a
nd m
oistu
re)
0%0%
0%0%
0%0%
0%0%
0%
11. In
tegr
ate o
ther
farm
ing
activ
ities
(i.e.
, cat
tle
raisi
ng an
d ve
geta
ble p
lantin
g)17
%29
%8%
0%0%
12%
7%14
%10
%
12. B
uy in
sura
nce
0%0%
0%0%
0%6%
0%0%
3%
13. In
crea
se fe
rtiliz
er an
d ch
emica
l inpu
ts (i.e
., pe
sticid
es)
0%29
%8%
0%29
%35
%0%
29%
24%

Rice Farmers’ Vulnerability to Drought Hazards
RICE-BASED BIOSYSTEMS JOURNAL (2020) 6: 65-80 75
Table 11. Distribution of agriculture specific adaptation practices among drought affected households, by province and husband/wife dominance in agriculture and non-agriculture decision-making.
Adaptation Practice
Husband Dominant in Non-Agriculture Decision-Making
(n=42)
Wife Dominant in Non-Agriculture Decision-Making
(n=15)
Husband Dominant in Agriculture
Decision-Making (n=56)
Wife Dominant in Agriculture
Decision-Making (n=1)
1. Crop diversification (mixed/multi cropping) 17% 20% 18% 0%2. Crop rotation 17% 7% 14% 0%3. Shift/different planting dates 24% 7% 20% 0%4. Water storage (i.e., construction of wells, dams,
impoundments and rain water harvesting) 14% 13% 13% 100%5. Improve irrigation systems (i.e., water-saving
irrigation systems) 12% 13% 13% 0%6. Adoption of water-saving technologies
(i.e., alternate wetting and drying irrigation) 5% 7% 5% 0%7. Shift from single to double cropping 2% 0% 2% 0%8. Change amount of land under cultivation
(i.e., increase land area) 7% 0% 5% 0%9. Adoption of new rice varieties 17% 7% 14% 0%10. Implement soil conservation techniques (terracing to
conserve soil and moisture) 0% 0% 0% 0%11. Integrate other farming activities (i.e., cattle raising
and vegetable planting) 10% 13% 9% 100%12. Buy insurance 2% 0% 2% 0%13. Increase fertilizer and chemical inputs
(i.e., pesticides) 24% 7% 20% 0%
Table 12. Distribution of agriculture specific adaptation practices among drought affected households, by province and farm size.
Adaption PracticePangasinan Tarlac Whole Sample
Marginal (n=10)
Medium (n=28)
Large (n=7)
Marginal (n=7)
Medium (n=13)
Large (n=12)
Marginal (n=17)
Medium (n=21)
Large (n=19)
1. Crop diversification (mixed/multi cropping) 0% 13% 29% 14% 23% 25% 6% 19% 26%2. Crop rotation 0% 0% 14% 14% 31% 17% 6% 19% 16%3. Shift/different planting dates 20% 13% 14% 29% 8% 33% 24% 10% 26%4. Water storage (i.e., construction of wells,
dams, impoundments, rain water harvesting) 20% 25% 14% 14% 8% 8% 18% 14% 11%
5. Improve irrigation systems (i.e., water-saving irrigation systems) 0% 0% 14% 29% 23% 8% 12% 14% 11%
6. Adoption of water saving technologies (i.e., alternate wetting and drying irigation) 0% 0% 14% 0% 15% 0% 0% 10% 5%
7. Shift from single to double cropping 0% 0% 14% 0% 0% 0% 0% 0% 5%8. Change amount of land under cultivation
(i.e., increase land area) 0% 0% 14% 0% 8% 8% 0% 5% 11%9. Adoption of new rice varities 20% 0% 14% 0% 23% 17% 12% 14% 16%10. Implement soil conservation techniques
(terracing to conserve soil and moisture) 0% 0% 0% 0% 0% 0% 0% 0% 0%11. Integrate other farming activities
(i.e., cattle raising and vegetable planting) 10% 13% 29% 0% 0% 17% 6% 5% 21%12. Buy insurance 0% 0% 0% 0% 0% 8% 0% 0% 5%13. Increase fertilizer and chemical inputs
(i.e., pesticides) 20% 0% 14% 14% 23% 33% 18% 14% 26%
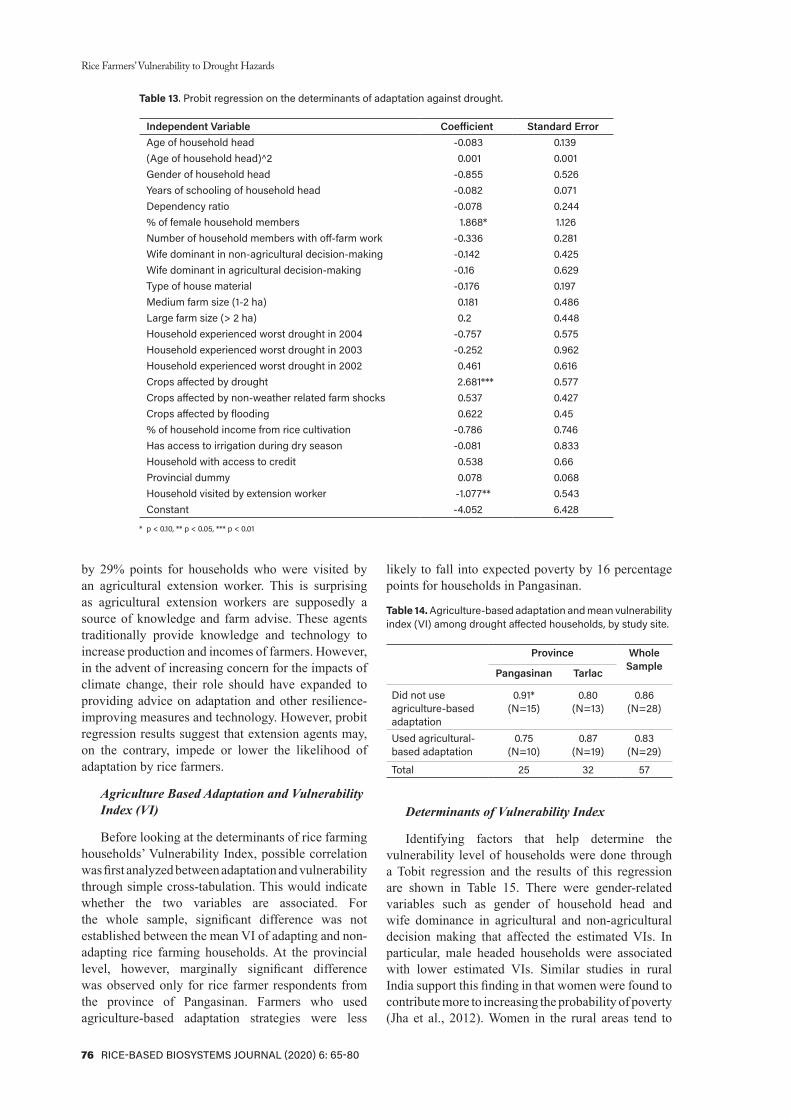
Rice Farmers’ Vulnerability to Drought Hazards
76 RICE-BASED BIOSYSTEMS JOURNAL (2020) 6: 65-80
by 29% points for households who were visited by an agricultural extension worker. This is surprising as agricultural extension workers are supposedly a source of knowledge and farm advise. These agents traditionally provide knowledge and technology to increase production and incomes of farmers. However, in the advent of increasing concern for the impacts of climate change, their role should have expanded to providing advice on adaptation and other resilience-improving measures and technology. However, probit regression results suggest that extension agents may, on the contrary, impede or lower the likelihood of adaptation by rice farmers.
Agriculture Based Adaptation and Vulnerability Index (VI)
Before looking at the determinants of rice farming households’ Vulnerability Index, possible correlation was first analyzed between adaptation and vulnerability through simple cross-tabulation. This would indicate whether the two variables are associated. For the whole sample, significant difference was not established between the mean VI of adapting and non-adapting rice farming households. At the provincial level, however, marginally significant difference was observed only for rice farmer respondents from the province of Pangasinan. Farmers who used agriculture-based adaptation strategies were less
likely to fall into expected poverty by 16 percentage points for households in Pangasinan.
Table 14. Agriculture-based adaptation and mean vulnerability index (VI) among drought affected households, by study site.
Province Whole Sample
Pangasinan Tarlac
Did not use agriculture-based adaptation
0.91* (N=15)
0.80 (N=13)
0.86 (N=28)
Used agricultural-based adaptation
0.75 (N=10)
0.87 (N=19)
0.83 (N=29)
Total 25 32 57
Determinants of Vulnerability Index
Identifying factors that help determine the vulnerability level of households were done through a Tobit regression and the results of this regression are shown in Table 15. There were gender-related variables such as gender of household head and wife dominance in agricultural and non-agricultural decision making that affected the estimated VIs. In particular, male headed households were associated with lower estimated VIs. Similar studies in rural India support this finding in that women were found to contribute more to increasing the probability of poverty (Jha et al., 2012). Women in the rural areas tend to
Table 13. Probit regression on the determinants of adaptation against drought.
Independent Variable Coefficient Standard ErrorAge of household head -0.083 0.139(Age of household head)^2 0.001 0.001Gender of household head -0.855 0.526Years of schooling of household head -0.082 0.071Dependency ratio -0.078 0.244% of female household members 1.868* 1.126Number of household members with off-farm work -0.336 0.281Wife dominant in non-agricultural decision-making -0.142 0.425Wife dominant in agricultural decision-making -0.16 0.629Type of house material -0.176 0.197Medium farm size (1-2 ha) 0.181 0.486Large farm size (> 2 ha) 0.2 0.448Household experienced worst drought in 2004 -0.757 0.575Household experienced worst drought in 2003 -0.252 0.962Household experienced worst drought in 2002 0.461 0.616Crops affected by drought 2.681*** 0.577Crops affected by non-weather related farm shocks 0.537 0.427Crops affected by flooding 0.622 0.45% of household income from rice cultivation -0.786 0.746Has access to irrigation during dry season -0.081 0.833Household with access to credit 0.538 0.66Provincial dummy 0.078 0.068Household visited by extension worker -1.077** 0.543Constant -4.052 6.428
* p < 0.10, ** p < 0.05, *** p < 0.01

Rice Farmers’ Vulnerability to Drought Hazards
RICE-BASED BIOSYSTEMS JOURNAL (2020) 6: 65-80 77
concentrate on household chores and oftentimes, labor market opportunities for women in the countryside are limited as work and farming are traditionally reserved for men. The World Bank (2009) also reported that women are generally less resilient in coping with shocks because they have relatively limited access to credit, inputs, and extension services. In India, gender disparity in employment is evident as women receive lower wages than men in casual labor (Holmes et al., 2010). On the other hand, wife dominance in both agricultural and non-agricultural decision-making spheres are correlated with lower vulnerability to expected poverty.
Also seen from the Tobit results is that the dependency ratio has a positive and significant coefficient. This means that vulnerability increases as more household members are in the 0-14 and above 65 age groups. Thus, households with more unemployed members are more vulnerable to expected poverty. In general, a larger family size, even with family members not categorized as dependents, is found to be strongly associated with high vulnerability to poverty (Orbeta, 2005). The finding that “the larger the dependency ratio of a household is, the more vulnerable the household is to poverty” agrees with
results from similar studies in areas such as Central Asia, India, Timor-Leste, and rural southwest Nigeria (Jha and Dang, 2008; Jha and Dang, 2009; Jha et al., 2012; Adepoju and Yusuf, 2012).
The number of members with off-farm work also has a positive and significant coefficient. Calculated marginal effects showed that an additional household member working off-farm increases vulnerability by 15 percentage points. Off-farm work are usually part of the income diversification strategies of households. However, regression results showed that, at least for the sampled households, this strategy is not a very effective insurance mechanism. This is maybe because these rice farming households have little skill other than rice farming; thus, ending up with very menial jobs that does not gain high income.
Households with houses built with more permanent materials were also found to have lower vulnerability indices. Marginal effects showed that they are less likely to fall below the poverty threshold by 12 percentage points than farmers with dwellings built with temporary and weak materials. Housing materials is often a proxy for both wealth and adaptive capacity of households. Hence, it is as expected associated with
Table 15. Results of Tobit regression of the determinants of VI.
Independent Variable Coefficient Standard ErrorAge of household head -0.002 0.009(Age of household head)^2 0.000 0.000Gender of household head -0.185*** 0.056Years of schooling of household head -0.001 0.005Dependency ratio 0.061*** 0.015% of female household members 0.072 0.060Number of household members with off-farm work 0.154*** 0.017Wife dominant in non-Ag decision-making -0.190*** 0.024Wife Dominant in Ag decision-,aking -0.409*** 0.054Type of house material -0.122*** 0.011Medium farm size (1-2 ha) -0.001 0.028Large farm size (> 2 ha) -0.105*** 0.03Household experienced worst drought in 2004 -0.083* 0.043Household experienced worst drought in 2003 -0.003 0.051Household experienced worst drought in 2002 -0.160*** 0.042Crops affected by drought 0.041 0.051Estimated probability of adaptation -0.463 0.806Estimated probability of adaptation x crops affected by drought 0.571 0.749Crops affected by non-weather related farm shocks -0.026 0.031Estimated probability of adaptation x crops affected by non-weather-related shocks -0.069 0.076Crops Affected by Flooding 0.157*** 0.034Estimated probability of adaptation x crops affected by flooding -0.161** 0.067% of household income coming from rice cultivation 0.286*** 0.039Has access to irrigation during dry season -0.031 0.036Household with access to credit -0.026 0.036Provincial dummy -0.012*** 0.004Constant 2.078*** 0.367

Rice Farmers’ Vulnerability to Drought Hazards
78 RICE-BASED BIOSYSTEMS JOURNAL (2020) 6: 65-80
a household’s lower vulnerability to expected poverty. Similar logic applies to landholdings. Households with larger landholdings are often also wealthier and in a better capacity to self-insure against idiosyncratic and systemic shocks. Thus, they can smoothen their consumption better. Households owning farms around 2 ha or larger are less likely to fall into expected poverty by around 12 percentage points relative to households with marginal farm sizes.
Coefficients of dummy variables representing drought episodes in 2004 and in 2002 were also found to be significant and negative. This may mean that from farmers’ perception, these drought episodes were less severe compared in 2008, which is the base drought event. Thus, they lead to lower vulnerability relative to drought occurrence in 2008. Drought impacts on crops, however, was found to be an insignificant determinant of the household’s Vulnerability Index. Consequently, the interaction term between crop impacts and the estimated probability of adaptation was also not associated with the household’s Vulnerability to Expected Poverty. These results may be related to the nature of drought as a climate change- related hazard. Specifically, droughts are extreme but often sparsely recurring events. Therefore, it is possible that the farmers can recover gradually from its impact, i.e., there is no sustained or lasting effect on the vulnerability level of rice farming households.
In contrast, frequently recurring climate change-related hazards like flooding have a significant positive association with the Vulnerability Index. The VI of flood-affected farmers were higher by 15% points. Thus, compared with drought events, flooding events is associated more with increased vulnerability to expected poverty. The frequent recurrence of floods might make it harder for households to recover from its negative crop impacts. Note, however, that the Tobit results also show that adaptation against drought is also effective against flooding. The interaction term between crops being affected by flood and the estimated probability of adaptation has a negative and significant coefficient. Marginal effects for this variable show that VI is reduced by 16% points. Therefore, the net effect of increased probability of adaptation is a decline in the probability of falling into poverty by 1% points. This shows that adaptation strategies of rice farming households can potentially manage risk from multiple climate change related hazards. Thus, agro-technological strategies must be adaptive to multiple types of climate-related hazards.
Table 15 also shows that households with income largely from rice cultivation are more likely to fall into expected poverty. This can be related to the earlier finding that the main impact of drought is on reduced yield. Thus, households that are highly dependent on
rice farming (i.e., those that derive a majority of total income from rice farming) are also more vulnerable.
Vulnerability to expected poverty was also found to be dependent on the provincial dummy. In particular, Tarlac respondents had a lower likelihood of falling into expected poverty by 1% points than those from Pangasinan. This result is consistent with earlier discussion pertaining to Tarlac respondents having higher annual rice income and were mostly classified as having low vulnerability to expected poverty. Thus, there are intrinsic provincial differences in the likelihood of being susceptible to poverty apart from the impact of extreme events.
Conclusion and RecommendationsThis study sought to answer, “Does agriculture-
based autonomous adaptation strategies improve the resilience of rice farming households in Pangasinan and Tarlac, Philippines?” The discussion presented in this paper highlights the implications of the study’s key results on crafting programs and policies that can increase rice farmers resiliency against climate-related hazards. Policy directions that could be identified from the synthesis can pave the way for a more targeted development and dissemination of agro-based adaptation strategies.
One of the limitations of the study includes the small sample size. Future similar studies may consider bigger samples for wider assessment of vulnerability to hazards and poverty. Despite this limitation, the study has shown significant results within the acceptable sampling frame and methodological design that can provide insights into policy and program reforms.
This study focused on agriculture-based adaptation strategies. The household survey showed that the most common response to drought among the surveyed rice farmers was shifting of planting dates and crop diversification. Notably, adoption of new rice varieties was also a preferred strategy against drought. Households who were highly vulnerable to expected poverty were also found to employ more adaptation strategies against drought. This observation, along with the fact that experiencing drought is the primary determinant of using agriculture-based adaptation strategies, point to a high degree of rationality among farmers in their decision to self-insure against drought.
Choice of adaptation strategy also varied by size of landholdings and gender dominance in household decision making. Adoption of new rice varieties as an adaptation strategy were more common among medium and marginal landed rice farmers. Therefore, varietal improvement programs must consider resiliency and social equity. Introduction of stress-tolerant modern rice varieties can be effective,

Rice Farmers’ Vulnerability to Drought Hazards
RICE-BASED BIOSYSTEMS JOURNAL (2020) 6: 65-80 79
acceptable, and equitable planned adaptation strategy to reduce vulnerability against drought. The literature further supports the importance of drought-tolerant varieties or technologies, in general, to ease the effects of the hazard.
Dominance in household decision-making was also seen to be related to the choice of adaptation strategy. Qualitative analysis showed that if the husband is the dominant decision maker in both the agricultural and non-agricultural decision-making spheres, shifting of planting dates was the preferred adaptation strategy. On the other hand, wife dominance in household decision-making would prefer crop diversification and establishment of water storage facilities as adaptation strategy. The differences in preferred strategies imply the need to consider women’s preferences in designing adaptation strategies for them to be acceptable. Enhancing the role of women and ensuring their participation in agricultural decision-making and programs can also be part of complementary support schemes to increase resilience of households.
Use of agriculture-based adaptation strategies were found to be constrained mostly by information. The often-cited reason by respondents for non-adaptation was the lack of information on adaptation strategies and on the long-term climate conditions. The probit regression results showed that visits of extension agents reduce the likelihood of employing agriculture-based adaptation strategies. It can be surmised that extension agents’ orientation is still anchored on the traditional objective of enhancing farm production. There is a need to reorient and equip extension agents so they can perform a wider role in increasing farmer resiliency amidst climate change. Better access to short- and long-term weather and climate information can be an important starting point. Building capacity of extension agents to interpret and identify weather and climate knowledge products that are available is also essential. As the preferred adaptation strategies of rice farmers are shifting of planting dates and crop diversification, processing these weather and climate information into adaptive crop calendars and cropping patterns would also improve the advising capacity of extension agents.
Vulnerability assessment through the use of the Vulnerability to Expected Poverty (VEP) was also conducted in this study. While the qualitative analysis on adaptation choices yielded distinct trends, the trends in VEP and its association with different driving factors were less discernible. Hence, deeper insights were more readily obtained through the Tobit regression on the determinants of the VEP or the Vulnerability Index. Improvements in the VI were found to be associated with the household’s
wealth level as proxied or captured by the size of his landholdings and the type of housing materials. In particular, farmers with larger landholdings and with houses built with more permanent materials had lower VI levels.
Similar to the adaptation choice analysis, wife’s dominance in both the agricultural and non-agricultural decision-making reduced households VI. However, households headed by females were associated with higher VI or are more vulnerable to expected poverty. This may be due to conditions that women in the study sites had no access to work outside of the farm and the house. While greater participation of women inside the household reduces the household’s vulnerability to expected poverty, however, limited economic opportunities outside of the household may reducing their participation. Enhancing the role of women in income diversification and making agricultural decisions can therefore enhance the resiliency of households. They should be offered equal opportunities to attend agricultural training and to have access to livelihood projects that can contribute to household income diversification.
The impact of climate-related hazards and the effectiveness of agriculture-based adaptation strategies are related to the nature of the hazards. Study results showed that drought, because of its intermittent or infrequent but extreme nature, had no effect on the vulnerability of the households to expected poverty. Households have time to recover in between these infrequent drought events. On the other hand, results showed that flooding, which affects crop production, increases the vulnerability of households to expected poverty. In contrast to drought, floods are frequent extreme events. Therefore, rice farming households are more prone to poverty brought about by floods. Surprisingly, adaptation strategies aimed at mitigating the impacts of drought also mitigated the impacts of floods. Thus, agriculture-based adaptation strategies increase resiliency of households in the two study areas, but not for drought events. Furthermore, these adaptation strategies make rice farmers resilient to multiple climate-related hazards.
AcknowledgmentThe authors wish to acknowledge the support
provided by the local government units that allowed the team to conduct the study in selected municipalities and villages in Tarlac and Pangasinan. This study was also supported by the Consortium for Unfavorable Rice Environments (CURE) project with funding from the International Fund for Agricultural Development (IFAD).

Rice Farmers’ Vulnerability to Drought Hazards
80 RICE-BASED BIOSYSTEMS JOURNAL (2020) 6: 65-80
Literature CitedAdepoju AO, Yusuf SA (2012) Poverty and vulnerability in rural
South-West Nigeria. ARPN (Asian Research Publishing Network) J. Agric. Biol. Sci. 7(6): 430-437
Burke EJ, Brown SJ, Christidis N (2006) Modeling the recent evolution of global drought and projections for the twenty-first century with the Hadley Centre Climate Model. J. Hydrometeorol. 7: 1113-1125
Chaudhuri S, Jalan J, Suryahadi A (2002) Assessing household vulnerability to poverty: methodology estimates for Indonesia. Columbia University Department of Economics Discussion Paper No. 0102_52. Columbia University, New York, USA
Department of Agriculture Bureau of Soils and Water Management, Department of Agrarian Reform, Department of Environment and Natural Resources, and Department of Science and Technology (2010) The updated Philippine National Action Plan to combat desertification, land degradation, and drought. Government of the Philippines, Manila, Philippines
FAO (Food and Agriculture Organization) (1996) Fact sheet: women, agriculture and rural development, Philippines. SDDimensions. http://www.fao.org/sd/wpdirectWPre0009. htm (accessed October 20, 2013
Gautam A (2009) Impact evaluation of drought-tolerant rice technologies through participatory approaches in Eastern India (Unpublished M.S. Thesis). New Brunswick, Rutgers State University of New Jersey, USA
Grayson M (2013) Editorial. Nature Outlook Agriculture and Drought. 501(7468)
Holmes R, Sadaha N, Rath S (2010) Gendered risks, poverty and vulnerability in India. Case study of India’s Mahatma Gandhi National Rural Employment Guarantee Act (Madhya Pradesh). Overseas Development Institute and Indian Institute of Dalit Studies, London, UK
Hossain M, Bose ML (2004) Nature and impact of women’s participation in economic activities in rural Bangladesh: insights from household surveys. Occasional Paper Series 41. Centre for Policy Dialogue, Dhaka, Bangladesh
IFAD (International Fund for Agricultural Development) (2012) Land tenure security and poverty reduction www.ifad.org/pub/factsheet/land/e.pdf (accessed October 20, 2013)
Isendahl N, Schmidt G (2006) Drought in the Mediterranean-WWF policy proposals. WWF Report, Madrid
Israel DC (2012) Typhoons, floods, and droughts: regional occurrence and value of damages to rice farming in the Philippines. Policy Note No. 2012-15. Philippine Institute for Development Studies, NEDA, Makati City, Philippines
Jha R, Dang T (2008) Vulnerability and poverty in Timor-Leste. Working Papers in Trade and Development No. 11. The Arndt-Corden Division of Economics, Research School of Pacific and Asian Studies. College of Asia and the Pacific. The Australian National University http://rspas.anu.edu.au/economics/publications.php (accessed October 20, 2013)
Jha R, Dang T (2009) Vulnerability to poverty in select Central Asian countries. Eur. J. Comparative Econ. 6(1):17-50
Jha R, Kang W, Nagarajan HK, Pradhan KC (2012) Vulnerability as expected poverty in rural India. ASARC Working Paper. Australian National University, Australia
Lansigan FP, de los Santos WL, Coladilla JO (2000) Agronomic impacts of climate variability on rice production in the Philippines. Agric. Ecosyst. Environ. 82: 129-137
Mataia A, Jamora N, Moya P, Francisco S, Dawe D (2011) Sources of decade rice yield growth in the Philippines. Philipp. J. Crop Sci. 36(2): 20-29
Mitin A (2009) Documentation of selected adaptation strategies to climate change in rice cultivation. East Asia Rice Working Group, Action for Economic Reform Quezon City, Philippines
Mottaleb KA, Rejesus RM, Mohanty S, Murty MVR, Li T, Valera HG, Gumma MK (2012) Ex-ante impact assessment of a drought-tolerant rice variety in the presence of climate change. Paper presented at the Agricultural and Applied Economics Association’s 2012 Annual Meeting, August 12-14, 2012, Seattle, Washington, USA
NCAR and UCAR (National Center for Atmospheric Research and University Corporation for Atmospheric Research) (2005) Drought’s growing reach: NCAR study points to global warming as key factor. http://www.ucar.edu/news/releases/2005/drought_research.shtml (accessed March 24, 2014)
Orbeta Jr. AC (2005) Poverty, vulnerability and family size: evidence from the Philippines. Asian Development Bank Institute Discussion Paper No. 29. ADBI, Manila, Philippines
Pandey S, Bhandari H, Hardy B (2007) Economic costs of drought and rice farmers’ coping mechanisms: a cross-country comparative analysis. International Rice Research Institute, Los Baños, Philippines
Pandey S, Bhandari H (2009) Drought, coping mechanisms and poverty. Insights from rainfed rice farming in Asia. Occasional Paper. International Fund for Agricultural Development
Pandey S, Gauchan D, Malabayabas M, Emerick MB, Hardy B, editors (2012) Patterns of adoption of improved rice varieties and farm-level impacts in stress-prone rainfed areas in South Asia. International Rice Research Institute, Los Baños, Philippines
Paris T, Rola-Rubzen MF, Luis J, Truong T, Wongsamun C, Villanueva D (2010) Interrelationships between labour outmigration, livelihoods, rice productivity and gender roles. Occasional Papers 11
Passioura JB (2007) The drought environment: physical, biological and agricultural perspectives. J. Exp. Bot. 58(2): 113-117
World Bank (2009) Gender in agriculture source book. World Bank, Washington, D.C., USA

RICE-BASED BIOSYSTEMS JOURNAL (2020) 6: 81-86 81
LEARNING BY DOING: CHALLENGES AND OPPORTUNITIES OF UNDERGRADUATE STUDENTS
IN AGRICULTURE AT PHILRICELeonilo V. Gramaje1*, JD Caguiat1, Oliver E. Manangkil1, Emily C. Arocena1,
Norvie L. Manigbas1, Jayson C. Berto2, Anna Marie F. Bautista2, and Xavier Greg I. Caguiat3
1Plant Breeding and Biotechnology Division2 Development Communication Division 3Genetic Resources Division, Maligaya, Science City of Muñoz, Nueva Ecija, Philippines
*Corresponding Author: [email protected]
AbstractLearning does not only happen within the four corners of the classroom. This study evaluated the contributions
of internship programs of local and international higher education institutions (HEI) implemented in the Plant Breeding and Biotechnology Division (PBBD) of Philippine Rice Research Institute (PhilRice). Specifically, this study evaluated the students’ capacity of engagement in field work, contributions to the hybrid rice breeding program, and learnings from linking with HEI using active feedback mechanisms, key informant analysis, and tracer methods. From 2012 to 2017, PBBD accommodated 40 agriculture students from Nueva Ecija University of Science and Technology (NEUST), Don Mariano Marcos Memorial State University (DMMMSU), Central Luzon State University (CLSU), Mindoro State College of Agriculture (MINSCAT), and Khon Kaen University (KKU-Thailand) in the conduct of their thesis, major practice, and data analyses on hybrid rice breeding and seed production. The students were provided tasks relevant to their specialization. Majority of the students rated their experience as excellent and relevant to their studies and future career (60%) and most of the appreciative students are currently practicing agriculturist in private and government service. The learning-by-doing approach enabled them to practice and grasped processes involved in their tasks. Strong partnership between research agencies and HEI could provide important support to the future professionals of this country.
Keywords: Engagement, Internship, Linkages, Research Institutions, State Universities and Colleges (SUCs).
Introduction It has long been established that experiential
education helps provide young professionals with balanced learning of theories and their application. Acquiring new knowledge and bringing out the students’ creativity through internships, major practices, on the job trainings, thesis, and conducting special problems enable students to be more equipped and confident to pursue their chosen career. Service-learning or outside-the-classroom approach is an informal way of learning that cuts across a variety of disciplines, with or without direct connection to formal education. Outside-the-classroom approach that has direct connection to formal education involves formal and structured teaching design and corresponds to the students’ specialization (Furco, 2008).
The concept of experiential learning dates back to the early periods of Medieval Europe. It was developed as vocational training through apprenticeships for 5-7 years of service. The apprenticeships were used as a pathway for students to get into a trade guild, which is an association of specialists in a specific field of work. While vocational apprenticeships and “journeyman” programs are still offered in fields in which this style
of instruction originated, college students today participate in internship, on-the-job training (OJT), or practicum, related to their chosen curriculum.
In the late 1970s and 1980s, there was a surge of college faculty members establishing internship programs after hearing about success stories of these teaching styles from other institutions. Universities took the lead in making internships more appealing to and productive for students by giving course credit. Most early university internship programs were established in business and medicine. After the increase in new interest in these curricula, most universities established internship programs in psychology and social work. These early programs served as a way for students to try out possible future careers without the commitment of having to work a full-time job (Jackel et al., 2011).
There are few publications on the nature of the academically structured practicum, on-the-job-training (OJT) or internship. Most students felt their OJT was a great experience that prepared them for a career (Dieffenbach et al., 2011). Apart from a requirement for graduation, taking theory into practice is also advantageous for future employers as
Received: October 28, 2019 • Accepted: February 11, 2020
FULL PAPER

Learning by Doing: Challenges and Opportunities
82 RICE-BASED BIOSYSTEMS JOURNAL (2020) 6: 81-86
it involves less training time for their prospective new staff (Dieffenbach et al., 2011; Furco, 2008).
The Philippines has many internship programs in private and public institutions. However, there are few publications discussing the influence of internship experience on students’ career selection. A paper described tourism and hospitality industry (Salatan, 2016) while the other on pharmacy (Carrido et al, 2015). This paper tackles the agriculture sector highlighting partnership between Philippine Rice Research Institute (PhilRice) and State University and Colleges (SUCs) as a case study. This is the first formal study on the impact of internship in the students’ career path and as a model in forming the next generation of agriculture research, development, and extension workers in the country and in the world.
PhilRice is a government corporate entity (Classification E) under the Department of Agriculture. It was created through Executive Order 1061 on November 5, 1985 (as amended) to help develop high-yielding and cost-reducing technologies so farmers can produce enough rice for the Filipinos. With the vision “Rice-Secure Philippines,” PhilRice adheres to equip the Filipino rice farmers and the Philippine rice industry to be competitive through research for development. PhilRice fully coordinates its research work to its seven branch stations, satellite stations, and networks comprising 60 members nationwide. PhilRice is certified on ISO 9001:2015 (Quality Management), ISO 14001:2015 (Environmental Management), and OHSAS 18001:2007 (Occupational Health and Safety Assessment Series).
PhilRice Plant Breeding and Biotechnology Division (PBBD) accommodates students under major practice, thesis, internship, and OJT on cultural management of crops for breeding inbred and hybrid rice, seed production technologies, special problems, and data gathering and analysis. Active in engaging interns, PhilRice PBBD needs to document students’
and teachers’ learnings and career after graduation, and identify obstacles and best practices. This paper also evaluated the contributions of internship programs in the agriculture sector.
Objectives of the StudyThis study aimed to (1) document the students’
preferred ways of field engagement; (2) identify the contributions of the students and the internship program to the hybrid rice breeding program; (3) trace students after the internship program; and (4) determine the learnings, challenges, and opportunities in collaborating with HEIs for internship programs.
MethodologyA descriptive, correlational research design was
employed using survey, key-informant interviews, tracer method, and participant observation as methods of data collection. Online survey was conducted for students who underwent internship programs in PhilRice PBBD from 2012 to 2018. Advisers and instructors who were assigned to oversee the students served as the participants of the key-informant interviews. PhilRice researchers conducted participants’ observations and schedules during their internship, including students’ exit presentations. A simple tracer method was also conducted to know the whereabouts of the students who underwent internship.
Respondents consisted of three teachers and 40 graduate students from universities in Thailand and Philippines. Four of them were interns from Khon Kaen University (KKU), 18 major practice and thesis students from Central Luzon State University (CLSU), and 18 OJT students from Nueva Ecija University of Science and Technology (NEUST), Mindoro State College of Agriculture and Technology (MinSCAT), and Don Mariano Marcos Memorial State University (DMMMSU). Students were categorized as follows:
Framework

Learning by Doing: Challenges and Opportunities
RICE-BASED BIOSYSTEMS JOURNAL (2020) 6: 81-86 83
Internship. Khon Kaen University, Thailand, dispatched their students to a four month or a season-long involvement in hybrid rice breeding and seed production.
Major practice. A season-long involvement of students with specific study related to the normal operation of the hybrid rice breeding and seed production group.
Thesis. A season-long involvement of the student conducting applied or basic research related to hybrid rice breeding and seed production.
On the job training. A 30-working days given to students involving series of lectures and hands-on training on growth stages of rice.
Data Analysis
Data were collected and encoded in Microsoft Office Excel 2007© for statistical analysis. Each school was given a code for confidentiality. IBM Statistical Package for Social Sciences© Statistics version 21 was used for correlation and descriptive analysis. Descriptive statistical analysis, frequency, mean, and standard deviation, were employed to evaluate the different variables in the study. Pearson’s Correlation Coefficient was used to investigate the relationship among independent and dependent variables.
Results and DiscussionStudents’ Methods of Field Engagement
Most of the students (83%) preferred hands-on activities over lectures. Meanwhile, majority of the students (70%) found it more relevant if they would engage in the entire farming operation process rather than handling one specific activity. This activity limited the students’ exposure because they only stayed for 30 working days.
a. Conduct of student programs
As part of their orientation, students were informed of the division’s breeding program in rice ecosystems including rainfed, upland, cool elevated, drought, saline, submergence, high temperature, and irrigated lowland for inbred and hybrid rice. They were also toured around the facilities and experimental areas. Students were also briefed on the impact and importance of developing rice varieties of our country. The division head or senior breeder of the division usually led the orientation. Students were then introduced to the assigned researchers, and the interrelatedness of processes were explained. Series of lectures and actual application were provided, and students were encouraged to ask questions. After lectures, students were turned over to the hybrid rice breeding group for their specific studies.
b. Internships, major practice, thesis, and on the job training
The four Thai intern students from Khon Kaen University were immersed to the core activities of the hybrid breeding project such as nucleus seed multiplication, evaluation of paired crosses, breeder and foundation seed production, and flowering synchronization. The students were also taught on gathering and analyzing data. Progress of their studies were monitored regularly.
The topics of nine major practice students from CLSU were based on the routine activities of the breeders, specifically in producing F1 hybrid seed or the A x R seed production. This was done to engage them in actual field work in producing hybrid rice seeds. The students were required to be in the field with core workers from sowing until harvesting. They participated in activities conducted in critical stages of the crop during fertilizer application, primordial sampling, boot collection, gathering initial heading and flowering, leaf clipping, GA3 application, pollination, and data gathering. The written report was monitored monthly or whenever there are suggestions and clarifications.
Topics of CLSU thesis students were conceptualized by their school and PhilRice adviser through focused group discussion conducted before implementation. The nine students were required to visit their set-up at least three days every week from sowing to harvesting. The students were also taught how to gather data and interpret results.
The 18 OJT students from different universities participated in lecture and field work. However, they were not immersed in all stages of the rice crop as their training duration was only 30 working days. OJT students were also given a special problem for them to appreciate research work, which results they presented before they culminate the training.
Based on the results, 83% of the students noted that the most relevant part of the training was their engagement in actual field operations. Jayson, a major practice student of CLSU said,
“The most relevant part of major practice is to be engaged in field activities and communicat-ing with other researchers and laborers about the techniques and strategies in hybrid seed pro-duction.”
Meanwhile, Sylvia of CLSU said,
“For me, hands-on was the most relevant part of the training. It tells me whether I can pursue research work or not.”

Learning by Doing: Challenges and Opportunities
84 RICE-BASED BIOSYSTEMS JOURNAL (2020) 6: 81-86
These statements showed that learning-by-doing approach is an effective tool for the students conducting studies at PBBD. These findings support Sides et al. (2017) who concluded that internships provide an opportunity to “learn the process of self-generating skill.”
All students agreed that internship, OJT, thesis, and major practice in PBBD were very helpful. Alpha of MinSCAT noted,
“Yes, OJT was helpful because it enhanced my understanding and capabilities that I could use in my work. It also equipped me with the crucial skills and knowledge. It also provided me the venue to learn from some of the best professionals in agriculture industry.”
Contribution of Students on Hybrid Rice Breeding Program
According to PBBD’s study leaders who handled the students, division projects had benefitted from the study programs. As part of the team, students assisted the researchers in their day-to-day activities in field and laboratories, including slide preparations, pollen evaluations, pair crossing, rouging, leaf clipping, supplemental pollination, bagging of panicles, data gathering, and conducting post-harvest activities. Thus, projects saved resources as they complemented the needed human resources during the peak of breeding work. As discussed by Divine et al. (2006), employers benefit from internship because it provides them with risk-free-trial access to potential future employees, while schools strengthen their connections to the community. Students also helped in the promotion of the public hybrids and in adoption of the varieties in their schools and communities.
Tracer Method
Among the 40 students involved in the study coming from the four schools, 70% of them were females and 30% were males (Figure 1). This could state some gender imbalance for students taking up agriculture as dominantly female.
Figure 1. Gender of former students who attended the PBBD internships over the past year.
Majority of the students came from CLSU (52%) which is about 20 km away from PhilRice; followed by NEUST (15%), DMMMSU (13%), and MinSCAT and KKU (10%) (Figure 2).
Figure 2. Student distribution among the four universities in the study.
Ninety percent of the students are already employed (Figure 3) with 75% of them joining the agriculture sector (Figure 4). They all agreed that conducting studies at PhilRice helped them gain employment and that the program was useful in their work. The students said that skills such as land preparation, DNA extraction, data analyses, post-harvest operation, and writing and communication skills, which they learned from the internship program, had helped them land a job in government and private companies. For the unemployed, 5% continued their academic studies, while the remaining 5% are still job searching (Figure 3).
Figure 3. Employment status of the former students involved in this study.
MALE
FEMALE
CLSU
MinSCAT
KKU
DMMSU
NEUST
EMPLOYED
UNEMPLOYED
Figure 4. Percentage of former students who landed jobs in agriculture and non-agriculture sector.
AGRICULTURE
NON-AGRICULTURE
UNEMPLOYED
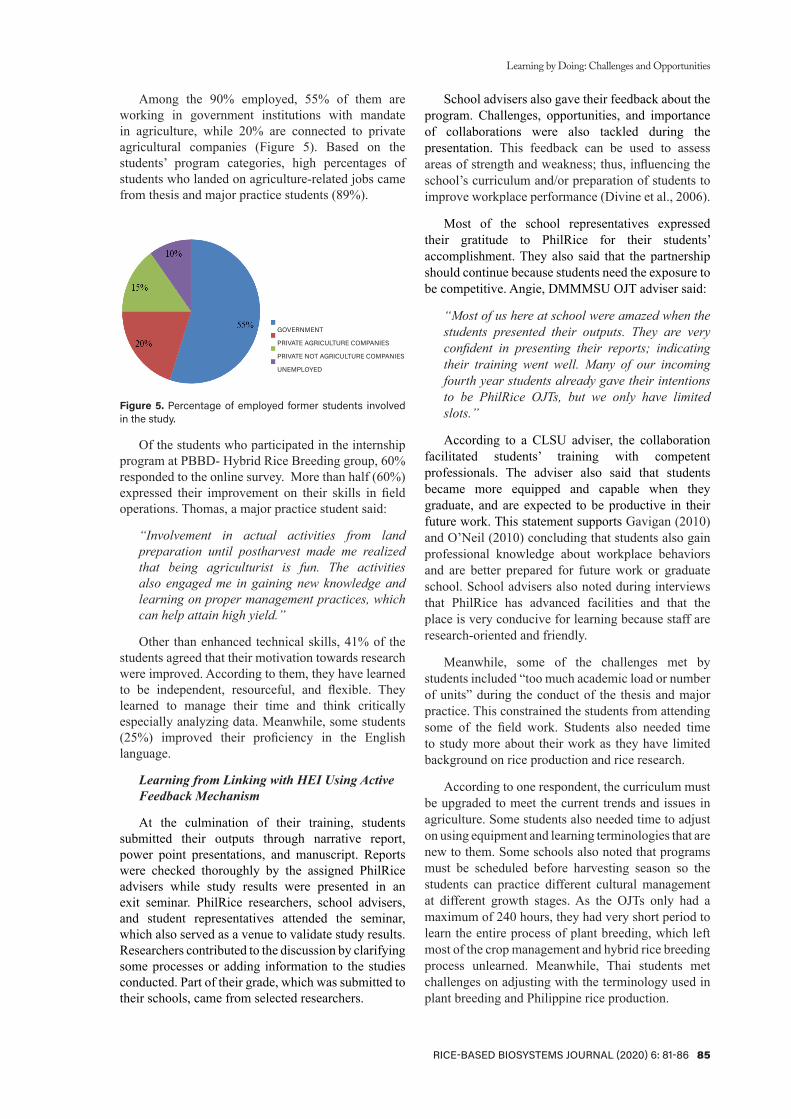
Learning by Doing: Challenges and Opportunities
RICE-BASED BIOSYSTEMS JOURNAL (2020) 6: 81-86 85
Among the 90% employed, 55% of them are working in government institutions with mandate in agriculture, while 20% are connected to private agricultural companies (Figure 5). Based on the students’ program categories, high percentages of students who landed on agriculture-related jobs came from thesis and major practice students (89%).
Figure 5. Percentage of employed former students involved in the study.
Of the students who participated in the internship program at PBBD- Hybrid Rice Breeding group, 60% responded to the online survey. More than half (60%) expressed their improvement on their skills in field operations. Thomas, a major practice student said:
“Involvement in actual activities from land preparation until postharvest made me realized that being agriculturist is fun. The activities also engaged me in gaining new knowledge and learning on proper management practices, which can help attain high yield.”
Other than enhanced technical skills, 41% of the students agreed that their motivation towards research were improved. According to them, they have learned to be independent, resourceful, and flexible. They learned to manage their time and think critically especially analyzing data. Meanwhile, some students (25%) improved their proficiency in the English language.
Learning from Linking with HEI Using Active Feedback Mechanism
At the culmination of their training, students submitted their outputs through narrative report, power point presentations, and manuscript. Reports were checked thoroughly by the assigned PhilRice advisers while study results were presented in an exit seminar. PhilRice researchers, school advisers, and student representatives attended the seminar, which also served as a venue to validate study results. Researchers contributed to the discussion by clarifying some processes or adding information to the studies conducted. Part of their grade, which was submitted to their schools, came from selected researchers.
School advisers also gave their feedback about the program. Challenges, opportunities, and importance of collaborations were also tackled during the presentation. This feedback can be used to assess areas of strength and weakness; thus, influencing the school’s curriculum and/or preparation of students to improve workplace performance (Divine et al., 2006).
Most of the school representatives expressed their gratitude to PhilRice for their students’ accomplishment. They also said that the partnership should continue because students need the exposure to be competitive. Angie, DMMMSU OJT adviser said:
“Most of us here at school were amazed when the students presented their outputs. They are very confident in presenting their reports; indicating their training went well. Many of our incoming fourth year students already gave their intentions to be PhilRice OJTs, but we only have limited slots.”
According to a CLSU adviser, the collaboration facilitated students’ training with competent professionals. The adviser also said that students became more equipped and capable when they graduate, and are expected to be productive in their future work. This statement supports Gavigan (2010) and O’Neil (2010) concluding that students also gain professional knowledge about workplace behaviors and are better prepared for future work or graduate school. School advisers also noted during interviews that PhilRice has advanced facilities and that the place is very conducive for learning because staff are research-oriented and friendly.
Meanwhile, some of the challenges met by students included “too much academic load or number of units” during the conduct of the thesis and major practice. This constrained the students from attending some of the field work. Students also needed time to study more about their work as they have limited background on rice production and rice research.
According to one respondent, the curriculum must be upgraded to meet the current trends and issues in agriculture. Some students also needed time to adjust on using equipment and learning terminologies that are new to them. Some schools also noted that programs must be scheduled before harvesting season so the students can practice different cultural management at different growth stages. As the OJTs only had a maximum of 240 hours, they had very short period to learn the entire process of plant breeding, which left most of the crop management and hybrid rice breeding process unlearned. Meanwhile, Thai students met challenges on adjusting with the terminology used in plant breeding and Philippine rice production.
GOVERNMENT
PRIVATE AGRICULTURE COMPANIES
PRIVATE NOT AGRICULTURE COMPANIES
UNEMPLOYED

Learning by Doing: Challenges and Opportunities
86 RICE-BASED BIOSYSTEMS JOURNAL (2020) 6: 81-86
Opportunities also came out during the interview with the advisers. According to Joy, one of the CLSU thesis adviser said:
“Creating a strong research network that taps the young minds to come up with relevant and timely technologies can benefit the farmers and the nation. We need research institutions like PhilRice as a partner to fill the gaps that academe cannot provide to the students.”
As result of the training, two students presented their thesis results to the Crop Science Society of the Philippines (CSSP) scientific conference in Legazpi City, Albay in 2008. This is a good encouragement for students to continue conducting research not only in the local level but in international forum. These experiences also motivate students to pursue their career in agriculture.
Summary and ConclusionsMost of the students preferred hands-on exercises
because they can easily understand the topics when complemented with experiential learning. This supports the learning-by-doing approach as an effective strategy for interns, OJTs, thesis, and major practice students.
Most of the students noted that engagement in actual field operations was the most relevant part of the OJT, internship, major practice, and thesis because they are immersed the entire process of hybrid rice breeding and seed production.
Students’ engagement in Hybrid Rice Program helped researchers gather and process data easier and faster and saved on resources. However, further study must be conducted to establish greater impact and contribution of internship, thesis, OJT, and major practice programs.
Too much academic load for the major practice and thesis students, and lack of exposure to some
stages of rice were among the challenges noted during the program.
Creating new linkages and having advantage on being employed were among the opportunities for the HEI and students who conducted their research at PhilRice.
Literature CitedCarrido DI, Lorenzo CA, Macaldo ACL, Loquias MM (2015)
Assessment of Knowledge, Skills, and Attitude among Pharmacy Students toward Hospital Pharmacy Internship in the Philippines. International Journal of Pharmacy Teaching & Practices 6(2): 2093-2099
Divine, R., Miller, R., & Wilson, JH (2006) Analysis of student performance in an internship program in a US university. Analysis 6(01)
Dieffenbach KD, Murray M, Zakrajsek RA. (2011). The Coach Education Internship Experience: An Exploratory Study. International Journal of Coaching Science 5:1
Furco A. 2008. Charity and social change: The impact of individual preferences on service-learning (with Barbara Moely and Julia Reed). Michigan Journal of Community Service-Learning 15(1): 37-48
Gavigan, L. (2010). Connecting the classroom with real-world experiences through summer internships. Peer Review, 12(4): 15-19
Jackel, D. (2011) Evaluating the Effectiveness of an Internship Program. Masters Theses and Specialist Projects. Paper 1117. http://digitalcommons.wku.edu/theses/1117 (accessed: October 5, 2018)
O’Neil, N. (2010). Internships as a high-impact practice: Some reflections on quality. Peer Review 12(4), 4-8
Salatan, J. 2016. The Influence of Internship Experience on Students’ Career Selection in the Tourism and Hospitality Industry. 10.13140/RG.2.1.2715.4963 (accessed: September 4, 2018)
Sides C, Mrvica A (2017). Internships: Theory and practice. Routledge Taylor and Francis Group. 176 pages. https://doi.org/10.4324/9781315224305

Laser Land Levelling Technology Impacts
RICE-BASED BIOSYSTEMS JOURNAL (2020) 6: 87-94 87
IMPACT OF LASER LAND LEVELING IN RAINFED LOWLAND AREAS IN ILOILO
Elmer G. Bautista1*, Lea S. Caguiat, Rachelle Marie S. Martin, Virsus L. Galdonez, Joseph M. Sandro,2 and Jessel Jane R. Gabisay3
1*Rice Engineering and Mechanization Division, Philippine Rice Research Institute, Science City of Muñoz, Nueva Ecija, 2International Rice Research Institute, Los Baños, Laguna
3Philippine Rice Research Institute-Negros, Cansilayan,Murcia, Negros OccidentalCorresponding author: [email protected]
Abstract The study was conducted in three different farmers’ fields in rainfed lowland areas of Calaboa Este, Sta.
Barbara, Iloilo. The fields were leveled using a laser attached to a four-wheel tractor and manual leveling for farmers’ practices. Average soil depth cut ranged 2-8 cm for the three sites. Different plots were established to determine the separate effects of laser leveling on nutrient and weed management where a leveled field with farmer’s practice was treated as control. The trials also evaluated the effect of laser land leveling, nutrient management, and weed management on rice grain yield. The plots for the two treatments measured 4 x 5 m and were replicated four times. The standard deviations (SD) of elevation were computed to evaluate field levels through accomplished topographic survey on laser leveled and non-laser leveled field. The SD of elevation on unleveled fields were 2.61, 9.36, and 6.54 cm while that of leveled field were 1.95, 2.01, and 1.61 cm. Average rice yield in the laser leveled plot was higher by 15.7% than non-laser leveled plots when combined with good nutrient management. Laser leveled plot had also Higher average grain yield by 11.7% was also recorded when complemented with good weed management.
Keywords: Laser Land Leveling Technology, Nutrient Management, Rainfed Lowland, Weed Management.
IntroductionLand leveling was proven to bring about uniform
crop growth, better weed and golden apple snail control, and increased nutrient and water efficiency. Uneven soil surface topography widely affects rice crop production essentially because a well-leveled field is a prerequisite to good water and crop management. On the other hand, non-leveled fields result in uneven water distribution, which means that more water is needed to fill the entire field for land preparation and crop establishment. This could also lead to poor drainage that can affect rice grain yields. Field that is not efficiently leveled has uneven crop stands, increased weed burdens, and uneven maturing of crops (IRRI, 2013).
In the Philippines, most rice fields are have uneven elevations of plots, which limit the application of controlled irrigation and stable irrigation water flow. Uses of farm machinery are not also efficient in fragmented rice fields because small plots consume more operating time due to frequent headland turning.
Through land leveling, several plots are combined together to create a favorable environment for rice production. Field plots are fragmented and irregularly shaped because there is no available equipment for efficient leveling. Farmers level their fields using handtractor and carabaos. Land leveling through laser-
guided leveling technology has numerous advantages in improving agricultural production. Laser leveling of agricultural land is a resource conservation technology that improves water use efficiency (Goswami and Nishad, 2015) and fertilizer and agrochemicals applications (Qurat et al., 2015). It also enhances environmental quality and crop yields (Jat et al., 2006). Jat et al. found that laser leveled field had reduced irrigation input to 5-8% for flooded rice (100-150mm) compared with traditional leveling in northwest India and Pakistan (Jat et al., 2006, Kahlown et al. 2006). Rickman (2002) and Jat (2004) also reported a 5-7% increase in cropped area due to precise land leveling. On-farm evaluation of laser leveling resulted in a 5.5% gain in rice productivity in the first year. Rickman (2002) observed up to a 24% increase in yield due to precise leveling.
Laser leveling moves the soil from the higher points of the field to the lower points with higher accuracy in a very effective way compared with manual leveling. This kind of land leveling involves a topographic survey of the field before and after the operations to record the high and low spots for systematic route analysis. The field diagram and the mean height of the field are used to determine the effective movement of soil from the high to low areas for better performance of the laser-controlled bucket connected to a tractor or laser leveling system (CSISA, 2014).
Received: September 29, 2019 • Accepted: February 14, 2020
FULL PAPER

Laser Land Levelling Technology Impacts
88 RICE-BASED BIOSYSTEMS JOURNAL (2020) 6: 87-94
Rainfed lowland rice is characterized as transplanted rice grown in well leveled, bunded fields that are usually flooded with rainwater. Precipitation water in these areas needs to be stored and utilized efficiently to take advantage of its availability and unpredicted occurrences. In the Philippines, rainfed lowland rice accounts for almost 40% of the riceland (Mackfill et al., 1996). In Region 6, where this study was conducted, rainfed areas comprised about 51.77% of the region’s total paddy rice production (PSA, 2017). Rainfed areas contributed 27% increase in rice production in 2000-2010 (PhilRice, 2015). Hence, increasing yield in the rainfed areas will result in more abundant Philippine rice production.
Experiments conducted in different localities in south-east Asia established that in rainfed environments, every 1 cm variation in rice field levelness reduces yield by 260 kg of grain (Rickman, 2002). This implies that level of the rice field has direct effect on the use of irrigation water and efficiency of agrochemicals and fertilizers.
This study compared the effect of laser and traditional manual leveling on rice grain yield. Leveling practices were combined with good nutrient and weed management. Verifying previous results in the Philippine condition, this study was conducted in Iloilo rice farms where fields are uneven and fragmented. As such, concerns on water flow and weed control are widely experienced in these areas.
Materials and MethodsSite Description
Trials were established in farmers’ fields located in three locations in Calaboa Este, Sta. Barbara, Iloilo, which represent the toposequence of the rainfed lowlands in the village (Figure 1). Sites were leveled using the laser guided land leveler (Figure 2). A manually-leveled field, with the same size as the field trials, was used as control. Location of field trials were as follows:
Site 1: Farmer 1 (lower toposequence) – Located in the lower part (9.66m above sea level; 10º48’44” N 122 º 35’12” E) of the village. It has a good water source for supplemental irrigation during the wet season and in summer. The soil is light clay; thus, water in the paddy does not drain easily. The total area of the laser field was 2463 m2.
Site 2: Famer 2 (middle toposequence) – Located in the middle toposequence (10.3m above sea level; 10º 48’48” N 122 º 35’11” E) of the village. It has supplemental irrigation from a shallow tube well. The soil is heavy clay loam, which can retain irrigation water for a few days. The total area of the laser field was 2838 m2.
Site 3: Farmer 3 (upper toposequence) – Located in the upper area (43.8m above sea level; 10º
Figure 1. Study sites.
Laser Leveling Research TrialsCalaboa Este, Sta. Barbara, Iloilo

Laser Land Levelling Technology Impacts
RICE-BASED BIOSYSTEMS JOURNAL (2020) 6: 87-94 89
Plowing the Field
The area was plowed and pulverized using disc plow and rotavator to soften the soil surface and residues to make easier soil movement in and out of the drag bucket. Another round of plowing was needed when previously plowed soil on the higher surface was fully scraped during laser leveling.
Laser Leveling Components
Laser leveling system has components such as four wheel tractor and plow, drag bucket, laser transmitter, laser receiver, control box, and hydraulic control system (Figure 3). The laser- controlled bucket was positioned at the determined mean field height of the
49’08” N 122 º 34’40” E) of the village. The field has limited water access and dries up quickly as the soil is sandy loam. This field is far from the creek where farmers access water for irrigation. The total area of the laser field was 2440 m2.
Topographic Survey
Before the fields were plowed, topographic survey was done to record the high and low areas in the field. Readings were obtained from 10x10 m grid. The mean height of the field was determined by taking the sum of all the readings and dividing by the number of readings taken. Moving soil from the high and low spots was determined through an accomplished field diagram and the computed mean height.
Figure 2. Laser land leveling operation system.
Figure 3. Components of a Laser land leveling system.
Control
Tractor Hydraulic controlvalve
Drag
Lasertransmitter
Hydraulic
Laser receiver
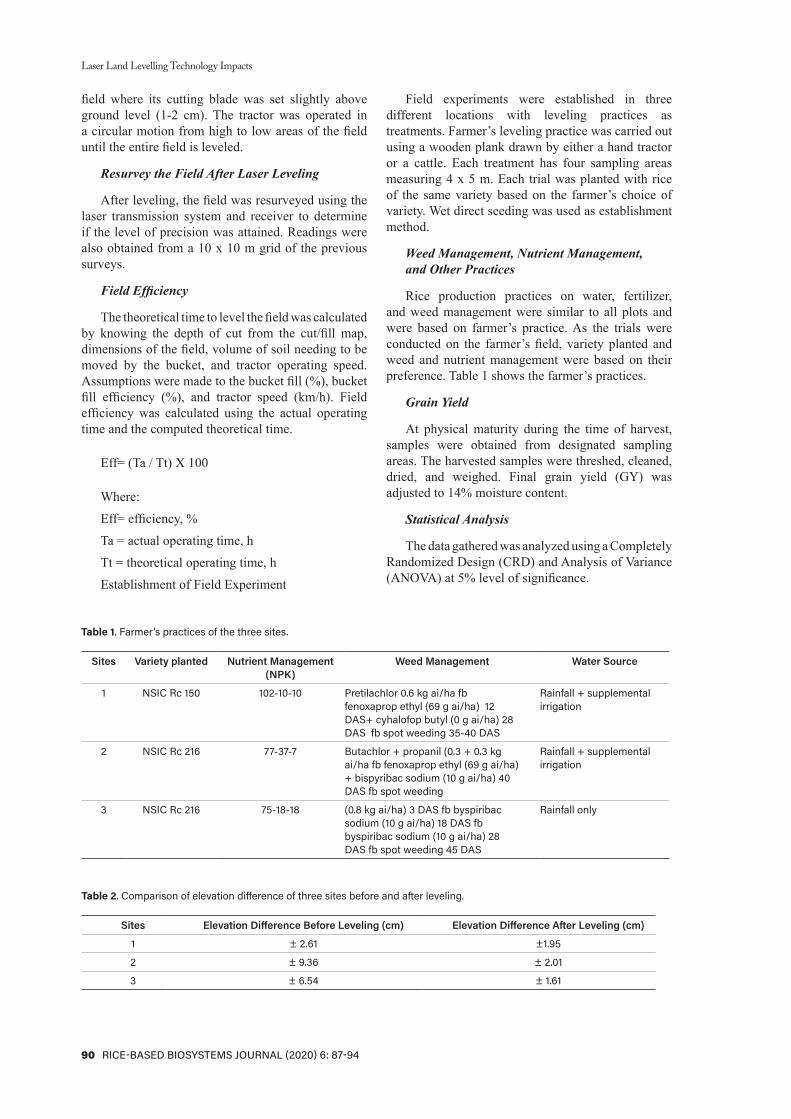
Laser Land Levelling Technology Impacts
90 RICE-BASED BIOSYSTEMS JOURNAL (2020) 6: 87-94
Table 1. Farmer’s practices of the three sites.
Sites Variety planted Nutrient Management (NPK)
Weed Management Water Source
1 NSIC Rc 150 102-10-10 Pretilachlor 0.6 kg ai/ha fb fenoxaprop ethyl (69 g ai/ha) 12 DAS+ cyhalofop butyl (0 g ai/ha) 28 DAS fb spot weeding 35-40 DAS
Rainfall + supplemental irrigation
2 NSIC Rc 216 77-37-7 Butachlor + propanil (0.3 + 0.3 kg ai/ha fb fenoxaprop ethyl (69 g ai/ha) + bispyribac sodium (10 g ai/ha) 40 DAS fb spot weeding
Rainfall + supplemental irrigation
3 NSIC Rc 216 75-18-18 (0.8 kg ai/ha) 3 DAS fb byspiribac sodium (10 g ai/ha) 18 DAS fb byspiribac sodium (10 g ai/ha) 28 DAS fb spot weeding 45 DAS
Rainfall only
Table 2. Comparison of elevation difference of three sites before and after leveling.
Sites Elevation Difference Before Leveling (cm) Elevation Difference After Leveling (cm)
1 ± 2.61 ±1.95
2 ± 9.36 ± 2.01
3 ± 6.54 ± 1.61
field where its cutting blade was set slightly above ground level (1-2 cm). The tractor was operated in a circular motion from high to low areas of the field until the entire field is leveled.
Resurvey the Field After Laser Leveling
After leveling, the field was resurveyed using the laser transmission system and receiver to determine if the level of precision was attained. Readings were also obtained from a 10 x 10 m grid of the previous surveys.
Field Efficiency
The theoretical time to level the field was calculated by knowing the depth of cut from the cut/fill map, dimensions of the field, volume of soil needing to be moved by the bucket, and tractor operating speed. Assumptions were made to the bucket fill (%), bucket fill efficiency (%), and tractor speed (km/h). Field efficiency was calculated using the actual operating time and the computed theoretical time.
Eff= (Ta / Tt) X 100
Where:
Eff= efficiency, %
Ta = actual operating time, h
Tt = theoretical operating time, h
Establishment of Field Experiment
Field experiments were established in three different locations with leveling practices as treatments. Farmer’s leveling practice was carried out using a wooden plank drawn by either a hand tractor or a cattle. Each treatment has four sampling areas measuring 4 x 5 m. Each trial was planted with rice of the same variety based on the farmer’s choice of variety. Wet direct seeding was used as establishment method.
Weed Management, Nutrient Management, and Other Practices
Rice production practices on water, fertilizer, and weed management were similar to all plots and were based on farmer’s practice. As the trials were conducted on the farmer’s field, variety planted and weed and nutrient management were based on their preference. Table 1 shows the farmer’s practices.
Grain Yield
At physical maturity during the time of harvest, samples were obtained from designated sampling areas. The harvested samples were threshed, cleaned, dried, and weighed. Final grain yield (GY) was adjusted to 14% moisture content.
Statistical Analysis
The data gathered was analyzed using a Completely Randomized Design (CRD) and Analysis of Variance (ANOVA) at 5% level of significance.

Laser Land Levelling Technology Impacts
RICE-BASED BIOSYSTEMS JOURNAL (2020) 6: 87-94 91
ResultsTopographic Survey
Before and After Leveling
All field trials were originally composed of two plots but were converted into one plot after laser leveling. Before leveling, the three site’s elevation differences were 2.61 cm, 9.36 cm, and 6.54 cm (Table 2). After leveling, all trials reached the ± 2 cm level of precision, which is the acceptable field level requirement under Palaycheck rice production system. Figures 1-3 shows the elevation of the sites computed
through topographic survey for Sites 1-3, respectively. Figure 4 shows the condition of the three sites before and after leveling.
Field Efficiency
The computed field efficiency ranged 41-51% as shown in Table 3. It was observed that the biggest area, though it also had the highest depth of soil to be cut, attained the highest field efficiency. This maybe because machine field efficiency tends to be higher in larger plots because of lesser headland turnings compared to smaller plots.
Figure 4. Comparison of mean elevation (cm) in Site 1 before and after land laser leveling.
Figure 5. Comparison of mean elevation (cm) in Site 2 before and after land laser leveling.
Figure 6. Comparison of mean elevation (cm) in Site 3 before and after land laser leveling.

Laser Land Levelling Technology Impacts
92 RICE-BASED BIOSYSTEMS JOURNAL (2020) 6: 87-94
Table 3. Field efficiency computations.
Variable Calculations/Assumptions Site 1 Site 2 Site 3
Area, A(m2) None 2462.70 2837.92 2440.48
Depth of soil to be cut, D (m) Calculated average 0.026 0.094 0.065
Bucket dimensions, BD (LxWxH) none 3 x1 x1m 3 x1 x1m 3 x1 x1m
Bucket fill, BF & BF eff.,BFE (%) assume 50% 50% 50% 50%
Tractor speed, S (kph) assume 7 kph 7 kph 7 kph 7 kph
Vol. of soil to be moved, Vm (m3) A/2 x D (m) 32.20 132.82 79.86
Vol. soil in bucket, Vb (m3) BD x BF x BFE 0.75 0.75 0.75
Number of trips required (NT) (Vm/Vb) /2 86 354 213
Average trip length, L (m) 50% of the length field 37.61 28.02 31.85
Total distance traveled, D (m) NT x L 3229.31 9922.34 6782.97
Theoretical time, Tt (h) D/S 0.46 1.42 0.97
Actual time, Ta (h) none 1.13 2.78 2.08
Field efficiency (%) T1 / T2 40.71 50.93 46.51
Effect of Laser Leveling and Nutrient Management
Higher grain yield was recorded in the all laser leveled field than in farmer’s leveled field. Yield difference ranged from 5.6% to 25.7% or 0.4-0.76 t ha-1. The results showed that more efficient fertilizers were utilized by rice plants at laser leveled fields making it more productive and evenly grown plants within the field plots. On the other hand, a not well leveled fields resulted in uneven effect of fertilizers throughout the plots leading to lower yield.
Table 4. Grain yield (t ha-1) of laser leveled field with nutrient management relative to farmer’s leveled field.
Site Laser Farmer’s Yield Leveled Leveled Difference
1 (77-37-7) 8.14 7.58 0.57 (7.52%)2 (102-10-10) 7.50 7.10 0.40 (5.60%)3 (75-18-18) 3.71 2.95 0.76 (25.7%)
Effect of Laser Leveling and Weed Management
Higher grain yield were harvested from all laser leveled fields than in farmer’s leveled field. Yield difference ranged from 0.63 to 22.71% or 0.04-0.57 t ha-1. Field plots that were laser leveled had higher yields because of lesser weed occurrences, which resulted in lesser nutrient competitions and better plant growth.
Table 5. Grain yield (t/ha) of laser leveled field with weed management relative to farmer’s leveled field.
Site Laser Farmer’s Yield Leveled Leveled Difference
Site 1 7.05 6.90 0.15 (2.17%)Site 2 6.38 6.34 0.04 (0.63%)Site 3 3.07 2.51 0.57 (22.71%)
DiscussionTopographic Survey
With the use of a laser-guided land leveler, smaller plots with varying elevations can be combined to form a plot with relatively uniform elevation, which could prove to be beneficial to plant growth and higher machine efficiency. A study of Shuhao (2005) showed that larger farm size reduces labor, seed, and herbicide and pesticide costs, but not those of fertilizers, oxen, and tractors.
Field Efficiency
The elevation difference of laser leveled field were lower than farmer’s leveled field (using wooden plank) and it attained the ±2 cm level of precision requirements of the Key Check 2 PalayCheck System©. The field efficiency of laser guided leveler used in less than 3000 m2 ranged 41-51% and though the largest field had also the highest depth of soil to be cut it attained the highest field efficiency. This is because machine field efficiency tends to be higher in larger plots. Wadud and White (2000) as cited by Shuhao (2005) mentioned that on average farmers with greater plot size or less land fragmentation operates at a higher level of technical efficiency.
Effect of Laser Leveling Complemented with Nutrient and Weed Management
Laser leveling complemented with nutrient management or weed management showed desirable effects on grain yield. Laser land leveling combined with good nutrient management increased yield by at most 25% (0.76 t/ha) in all farmer’s fields. On the other hand, laser land leveling performed with good weed management increased yield by at most 22.71% (0.57 t/ha) in the three farmer’s fields. Though there is

Laser Land Levelling Technology Impacts
RICE-BASED BIOSYSTEMS JOURNAL (2020) 6: 87-94 93
yield increase, analysis of variance (Appendix Tables 1 & 2) showed that the variation among treatments is not statistically different. Therefore, it can be assumed that laser-guided leveling does not directly affect the yield.
ConclusionThe study was conducted in three rainfed sites
in Iloilo to compare grain yield gathered from plots that were levelled through laser and manual means. The practices were combined with good nutrient and weed management. Results showed that there is no significant variation among grain yields. Though laser-guided land leveling did not directly affect the yield, study showed that it can address land fragmentation.
RecommendationThe laser-guided land leveling is claimed in other
countries like India to enhance water application efficiency. It saves water by 25% and is a gateway for mechanization. It is therefore recommended that future studies should consider gathering water data and field efficiency of rice production machineries such as mechanical transplanter. Laser-guided land leveler technology is still in the initial stages of adaption in the country; therefore, it is recommended to further conduct studies to prove its potential and adaptability to the specific conditions of the country.
AcknowledgmentsThe Rice Engineering and Mechanization Division
(REMD) of the Philippine Rice Research Institute and the Water-efficient and Risk Mitigation Technologies for Enhancing Rice Production in Irrigated and Rainfed Environments (WateRice) Project are recognized for the conduct of this study. The Rice Program of the Department of Agriculture (DA) thru the DA-Bureau of Agricultural Research.
Literature CitedCereal Systems Initiative for South Asia (CSISA) (2014) Laser
Land Leveling. http://csisa.org/wp-content/uploads/sites/2/2014/06/LLL-English.pdf (accessed September 8, 2017)
Goswami P and Nishad S (2015) Virtual water trade and time scales for loss of water sustainability: A comparative regional analysis. Scientific Reports 5, 9306. https://doi.org/10.1038/srep09306
International Rice Research Institute (2013) Laser Leveling Training Manual. http://www.knowledgebank.irri.org/ images/docs/training-manual-laser-leveling.pdf (accessed September 7, 2017)
Jat ML, Chandna P (2004) Precision Land Leveling-Laser Land Leveling System. Rice Wheat Information Sheet 48: 3
Jat ML, Chandna P, Gupta R, Sharma SK, Gill MA (2006) Laser Land Leveling: A Precursor Technology for Resource Conservation. http://www.knowledgebank.irri.org/images/docs/training-manual-laser-leveling.pdf (accessed September 13, 2017)
Kahlown MA, Azam M, Kemper WD (2006) Soil management strategies for rice-wheat rotations in Pakistan’s Punjab. J. Soil Water Cons. 61: 40-44
Mackill DJ, Coffman WR, Garrity DP (1996) Rainfed Lowland Rice Improvement. International Rice Research Institute, Los Baños, Laguna. http://books.irri.org/971220071X_content.pdf (accessed April 2, 2019)
Philippine Statistics Authority (2017) Palay and Corn Situation. http://rsso06.psa.gov.ph/sites/default/files/content/Palay%20and%20CornQ117.pdf (accessed March 25, 2019)
Philippine Rice Research Institute (2015) https://www.philrice.gov.ph/wp-content/uploads/2015/05/Rice-for-all_FINALlowres.pdf (accessed March 25, 2019)
Qurat UAM, Shaoib AW, Tufail AW, Irfan HM, Zohaib AW (2015) Comparative economic analysis of laser land leveling and conventional land leveling on wheat crop in Sindh, Pakistan. Research on Humanities and Social Sciences 5(15): 21-25
Rickman JF (2002). Manual for Laser Land Leveling. Rice-Wheat Consortium Technical Bulletin Series 5. New Delhi-12, India
Shuhao T (2005) Land fragmentation and rice production: A Case study of small farms in Jiangxi Province, P. R. China. (Unpublished dissertation). Wageningen University, Netherlands
Wadud MA, White B (2000) Farm household efficiency in Bangladesh: A comparison of Stochastic frontier and DEA methods. Applied Economics 32: 1665-1673

Laser Land Levelling Technology Impacts
94 RICE-BASED BIOSYSTEMS JOURNAL (2020) 6: 87-94
Appendix Tables
Appendix Table 1. ANOVA on the effect of leveling practice on nutrient management.
Source of Variation SS df MS F P-value F crit
Between groups 0.49307 1 0.49307 0.08073 ns 0.79041 7.70865
Within groups 24.42947 4 6.10737
Total 24.92253 5
ns – not statistically significant at 5% level of significance.
Appendix Table 2. ANOVA on the effect of leveling practice on weed management.
Source of Variation SS df MS F P-value F crit
Between groups 0.09375 1 0.09375 0.01829 ns 0.898947 7.708647
Within groups 20.5 4 5.125
Total 20.59375 5
ns – not statistically significant at 5% level of significance.

RICE-BASED BIOSYSTEMS JOURNAL (2020) 6: 95-101 95
EVALUATION OF ORGANIC NITROGEN SOURCES TO FURTHER INCREASE YIELD IN AN ORGANIC-
BASED NUTRIENT MANAGEMENT IN IRRIGATED PADDY SOILS
Evelyn F. Javier*, Corazon A. Santin, Annie E. Espiritu, and Xarin Xara G. Sto. Domingo
Philippine Rice Research Institute, Science City of Muñoz 3119, Nueva Ecija, Philippines.*Corresponding Author: [email protected] or [email protected]
AbstractBasic studies show that there is no standard nitrogen requirement for rice crop under organic-based
nutrient management (OBNM) as application depends on the sources of organic materials. Thus, technology packages were observed in five rice cropping seasons in two phases to determine the most suitable alternative nitrogen source in attaining the optimum yield in an organic-based farming system. Rice straw compost with chicken manure and rice straw compost alone were previously studied and compared as basal fertilizer to provide the initial nutrient needed by the rice crop. Results showed that no organic source was enough to give the required nitrogen up to booting stage. Urea, green manure (wild sunflower), organic foliar fertilizer (OFF), and inorganic foliar fertilizer (IFF) were used as top-dress fertilizer treatments. In 2012 dry season, urea (7.4 t ha-1) is significantly different from other top-dress but in 2012 wet season, green manure (5.8 t ha-1) is not significantly different from urea (5.9 t ha-1). Green manure recorded the highest grain yield (7.3 t ha-1 and 5.6 t ha-1) among the topdress in 2013 for both dry and wet season while OFF and IFF had comparable yield. Thus, green manure showed potential as an alternative nitrogen source in an organic-based nutrient management in the paddy.
Keywords: Chicken Manure, Foliar Fertilizer, Green Manure, Leaf Color Chart, Organic, Wild Sunflower.
Introduction
Organic agriculture had grown popular, yet its current status is still far from its full potential because of the meager formal support to its supply chain including input supply, production, research and development on seeds, and nutrient and pest management (Maghirang, 2011). The need for more research from the scientific community in improving the agricultural technologies was also highlighted in papers discussing the sustainability of organic agriculture. However, research and development is just one of the holistic approaches that can contribute to the success of organic agriculture. This research aimed to package an optimized organic-based nutrient management with farm wastes as nutrient sources.
In the previous 10 year-trial of this research, the mineralization of different organic materials was done in fully-flooded soils; hence, the basis of the proper application time of basal organic fertilizer (Javier and Tabien, 2003). The dynamics of nutrient availability was also monitored, and showed that nitrogen (N) decreased at the maximum tillering or at early panicle initiation – the most critical growth of rice plants that directly dictates the grain yield.
Thus, nitrogen topdressing is needed to boost yield. From the same organic fertilizer trial, results showed that organic material with lower C/N ratio (wild sunflower) released nitrogen faster than those with higher C/N ratio (rice straw and commercial organic fertilizers). Nitrogen releases were observed 1-2 days after soil incorporation of green manure. From this result, another study was established to determine the best possible organic topdress fertilizer for the organically-basal fertilized plots. Results showed that green manure (Azolla, Sesbania, Aeschynomene, Indigo, mungbean) and urea had similar potential for yield increase.
The leaf color chart (LCC) was developed for effective nitrogen management for rice. This tool is already packaged in the PalayCheck® system being disseminated by Philippine Rice Research Institute (PhilRice) and in the Site-Specific Nutrient Management (SSNM) by International Rice Research Institute. Essentially, LCC offers substantial opportunities for farmers to estimate plant nitrogen demand in real time for more efficient fertilizer use and higher rice yield. The existing LCC was developed under irrigated rice ecosystem and was calibrated as part of a judicious use of chemical fertilizers.
Received: June 6, 2019 • Accepted: February 10, 2020
RESEARCH NOTE
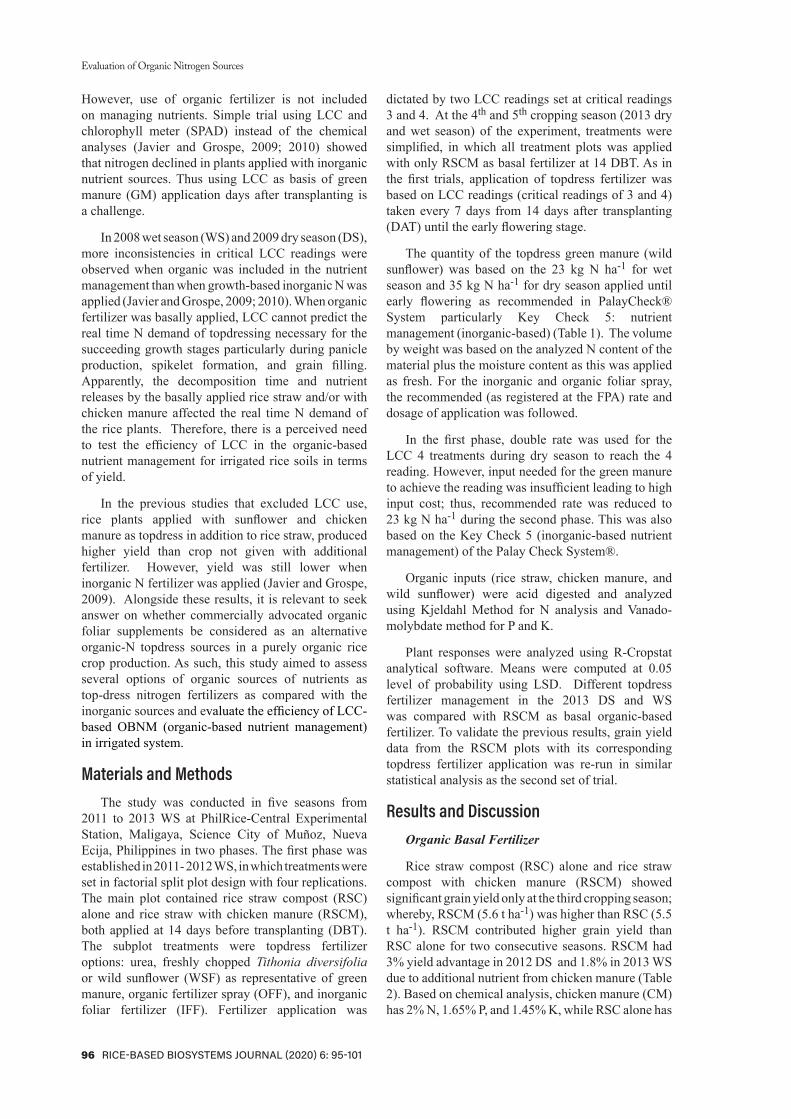
Evaluation of Organic Nitrogen Sources
96 RICE-BASED BIOSYSTEMS JOURNAL (2020) 6: 95-101
However, use of organic fertilizer is not included on managing nutrients. Simple trial using LCC and chlorophyll meter (SPAD) instead of the chemical analyses (Javier and Grospe, 2009; 2010) showed that nitrogen declined in plants applied with inorganic nutrient sources. Thus using LCC as basis of green manure (GM) application days after transplanting is a challenge.
In 2008 wet season (WS) and 2009 dry season (DS), more inconsistencies in critical LCC readings were observed when organic was included in the nutrient management than when growth-based inorganic N was applied (Javier and Grospe, 2009; 2010). When organic fertilizer was basally applied, LCC cannot predict the real time N demand of topdressing necessary for the succeeding growth stages particularly during panicle production, spikelet formation, and grain filling. Apparently, the decomposition time and nutrient releases by the basally applied rice straw and/or with chicken manure affected the real time N demand of the rice plants. Therefore, there is a perceived need to test the efficiency of LCC in the organic-based nutrient management for irrigated rice soils in terms of yield.
In the previous studies that excluded LCC use, rice plants applied with sunflower and chicken manure as topdress in addition to rice straw, produced higher yield than crop not given with additional fertilizer. However, yield was still lower when inorganic N fertilizer was applied (Javier and Grospe, 2009). Alongside these results, it is relevant to seek answer on whether commercially advocated organic foliar supplements be considered as an alternative organic-N topdress sources in a purely organic rice crop production. As such, this study aimed to assess several options of organic sources of nutrients as top-dress nitrogen fertilizers as compared with the inorganic sources and evaluate the efficiency of LCC-based OBNM (organic-based nutrient management) in irrigated system.
Materials and MethodsThe study was conducted in five seasons from
2011 to 2013 WS at PhilRice-Central Experimental Station, Maligaya, Science City of Muñoz, Nueva Ecija, Philippines in two phases. The first phase was established in 2011- 2012 WS, in which treatments were set in factorial split plot design with four replications. The main plot contained rice straw compost (RSC) alone and rice straw with chicken manure (RSCM), both applied at 14 days before transplanting (DBT). The subplot treatments were topdress fertilizer options: urea, freshly chopped Tithonia diversifolia or wild sunflower (WSF) as representative of green manure, organic fertilizer spray (OFF), and inorganic foliar fertilizer (IFF). Fertilizer application was
dictated by two LCC readings set at critical readings 3 and 4. At the 4th and 5th cropping season (2013 dry and wet season) of the experiment, treatments were simplified, in which all treatment plots was applied with only RSCM as basal fertilizer at 14 DBT. As in the first trials, application of topdress fertilizer was based on LCC readings (critical readings of 3 and 4) taken every 7 days from 14 days after transplanting (DAT) until the early flowering stage.
The quantity of the topdress green manure (wild sunflower) was based on the 23 kg N ha-1 for wet season and 35 kg N ha-1 for dry season applied until early flowering as recommended in PalayCheck® System particularly Key Check 5: nutrient management (inorganic-based) (Table 1). The volume by weight was based on the analyzed N content of the material plus the moisture content as this was applied as fresh. For the inorganic and organic foliar spray, the recommended (as registered at the FPA) rate and dosage of application was followed.
In the first phase, double rate was used for the LCC 4 treatments during dry season to reach the 4 reading. However, input needed for the green manure to achieve the reading was insufficient leading to high input cost; thus, recommended rate was reduced to 23 kg N ha-1 during the second phase. This was also based on the Key Check 5 (inorganic-based nutrient management) of the Palay Check System®.
Organic inputs (rice straw, chicken manure, and wild sunflower) were acid digested and analyzed using Kjeldahl Method for N analysis and Vanado-molybdate method for P and K.
Plant responses were analyzed using R-Cropstat analytical software. Means were computed at 0.05 level of probability using LSD. Different topdress fertilizer management in the 2013 DS and WS was compared with RSCM as basal organic-based fertilizer. To validate the previous results, grain yield data from the RSCM plots with its corresponding topdress fertilizer application was re-run in similar statistical analysis as the second set of trial.
Results and DiscussionOrganic Basal Fertilizer
Rice straw compost (RSC) alone and rice straw compost with chicken manure (RSCM) showed significant grain yield only at the third cropping season; whereby, RSCM (5.6 t ha-1) was higher than RSC (5.5 t ha-1). RSCM contributed higher grain yield than RSC alone for two consecutive seasons. RSCM had 3% yield advantage in 2012 DS and 1.8% in 2013 WS due to additional nutrient from chicken manure (Table 2). Based on chemical analysis, chicken manure (CM) has 2% N, 1.65% P, and 1.45% K, while RSC alone has

Evaluation of Organic Nitrogen Sources
RICE-BASED BIOSYSTEMS JOURNAL (2020) 6: 95-101 97
Tabl
e 1.
Tota
l top
-dre
ss fe
rtili
zer a
pplie
d ba
sed
on L
CC
read
ing.
1st p
hase
2nd
phas
e
Wet
Sea
son
2011
Dry
Sea
son
2012
*W
et S
easo
n 20
12D
ry S
easo
n 20
13W
et S
easo
n 20
13
Trea
tmen
tsFe
rtili
zer
Gra
de (%
N
-P-K
)
Tota
l vo
lum
e ap
plie
d ha
-1
Estim
ated
N
kg a
pplie
d ha
-1
Tota
l vol
ume
appl
ied
ha-1
Estim
ated
N
kg a
pplie
d ha
-1
Tota
l Vo
lum
e ap
plie
d ha
-1
Estim
ated
N
kg a
pplie
d ha
-1
Tota
l vo
lum
e ap
plie
d ha
-1
Estim
ated
N
kg a
pplie
d ha
-1
Tota
l vo
lum
e ap
plie
d ha
-1
Estim
ated
N
kg a
pplie
d ha
-1
LCC
3-U
rea
46-0
-0
1 bag
23.0
05.
25 b
ags
120.
803
bags
69.0
03
bags
69.0
03
bags
69.0
0
LCC
4-U
rea
4 ba
gs92
.00
12.5
0bag
s28
7.50
4.50
bag
s10
3.50
10.5
bag
s24
1.50
7 ba
gs16
1.00
LCC
3-W
SF
3.8-
0.2-
2.3
3 t
95.10
27.3
8 t
867.9
09
t28
5.30
18 t
570.
6012
t38
0.40
LCC
4-W
SF12
t38
0.40
44.8
4 t
1421
.1418
t57
0.60
21 t
665.
7021
t66
5.70
LCC
3-O
FF1 b
ottle
0.01
17 b
ottle
s 0.1
73
bottl
es0.
037
bottl
es0.
076
bottl
es0.
06
LCC
4-O
FF4
bottl
es0.
0418
bot
tles
0.18
6 bo
ttles
0.06
8 bo
ttles
0.08
8 bo
ttles
0.08
LCC
3-IF
F
19-1
9-19
1 pac
k0.1
918
pac
ks3.
423
pack
s0.
576
pack
s1.0
96
pack
s1.0
9
LCC
4-IF
F4
pack
s0.
7619
pac
ks3.
616
pack
s1.1
47
pack
s1.2
87
pack
s1.2
8

Evaluation of Organic Nitrogen Sources
98 RICE-BASED BIOSYSTEMS JOURNAL (2020) 6: 95-101
0.75% N, 0.28% P, and 0.12% K. Same results were found by IRRI as published in Rice Knowledge Bank. IRRI researchers gathered that manure consisting of 1.5-3% N, 1.15-2.25% P, and 1-1.4% K had higher essential nutrient than the compost alone (0.5-2.0 %N, 0.44-0.88% P, and 0.4-1.5% K). Applying organic fertilizer increases phosphorus mobilization and soil microbial activity that improves crop root system and nutrition (Ibrahim et al., 2008).
With the preliminary results, RSCM was used as the basal fertilizer during the 2nd phase to provide the initial nutrients needed by the rice crop and to further focus on the topdress nutrient management for a high-yielding rice varieties.
Topdress Fertilizer
The grain yield attained from LCC 3 and LCC 4 were comparable regardless of the basal and top-dress fertilizer treatments used (Table 2). But generally, LCC 4 produced higher average grain yield than LCC 3 due to the frequent application of topdress fertilizer, which increased the amount of fertilizer applied (Table 1). Before harvesting, 100% lodging was observed in LCC 4 from grain filling until maturity when urea was incorporated; consequently, decreasing yield. In Japan, rice yield decreased up to 50% due to lodging (Rajkumara, 2008). Lodging may occur due to absence of potassium resulting in poor root
Figure 1. Average grain yield (t ha-1) of rice plants applied with RSCM as basal fertilizers and with the different topdress fertilizers based on LCC reading. 2011 WS-2013 WS. Maligaya soil series. PhilRice Experimental Station, Science City of Muñoz, Nueva Ecija.
Table 2. Average grain yield (t ha-1) of rice plants applied with RSC and RSCM as basal fertilizers and with the different topdress fertilizers based on LCC reading. 2011 WS, 2012 DS, and 2012 WS. Maligaya soil series. PhilRice Experimental Station, Science City of Muñoz, Nueva Ecija.
Treatment
Grain Yield (t ha-1)
Wet Season
2011
Dry Season
2012
Wet Season
2012
Main Plot
RSC 3.7 6.1 5.5
RSCM 3.6 6.3 5.6
ns ns *
Sub Plots
LCC3 Urea 3.64 abc 7.75 a 5.85 a
LCC3 WSF 3.62 abc 6.69 b 5.59 ab
LCC3 OFF 3.30 bc 5.17 c 5.22 b
LCC3 IFF 3.45 bc 5.37 c 5.11 b
LCC4 Urea 4.12 a 6.98 ab 6.03 a
LCC4 WSF 3.89 ab 7.16 ab 6.06 b
LCC4 OFF 3.70 abc 5.16 c 5.17 b
LCC4 IFF 3.25 c 5.35 c 5.09 b
** *** ***
MP x SP ns ns
Means of the same letter are not significantly (ns) different at 5% level of significance using the CropStat software program. LCC 3= critical reading of 3 by the leaf color chart, LCC 4 = critical reading of 4 by the leaf color chart. WSF = wild sunflower, OFF= organic foliar fertilizer, IFF = inorganic foliar fertilizer
Average seasonal grain yield of PSB Rc 82
Adj
uste
d yi
eld,
t ha
-1
Wet season2011
Dry season2012
Wet season2012
Dry season2013
Wet season2013
LCC3 OFF
LCC4 WSF
LCC3 WSFLCC4 UreaLCC4 IFF
LCC3 UreaLCC3 IFFLCC4 OFF

Evaluation of Organic Nitrogen Sources
RICE-BASED BIOSYSTEMS JOURNAL (2020) 6: 95-101 99
growth and reduced plant vigor (Bhiah et al., 2010); and excessive nitrogen application that reduced stem diameter and stem wall width, which also affects the strength of stem base and its anchorage system (Hobbs et al.1998; Rajkumara, 2008). These explain why lodging occurred in LCC 4-urea treatment.
Topdress fertilizers showed significant differences during the 1st phase of the experiment especially in 2012 DS, in which LCC 3-urea, LCC 4-urea, and LCC 4-WSF produced comparable yield, but higher than LCC 3-WSF. In the 2012 WS, however, yield was not significantly different from either urea or WSF based on either LCC 3 or LCC 4 (Table 2). Given the equivalent nitrogen rate as the urea, WSF applied at 23 kg N ha-1 in the WS and 35 kg for the DS almost doubled the total N applied per hectare when LCC 4 was used as the basis. The frequency of organic-based N supplement by the LCC 4 was also doubled for the other treatment or the foliar fertilizers. However, grain yield was not much of significant different from LCC 3 and LCC 4 as basis for topdressing and between the use of WSF and urea. On the other hand, the use of urea and WSF gave generally higher yield (average of 5.6 t ha-1) than foliar supplements (4.6 t ha-1), whether inorganic or organic source.
Different topdress fertilizer management in the 2013 DS and WS was compared with RSCM as the basal organic-based fertilizer. To validate the previous results, grain yield data from the RSCM plots with its corresponding topdress fertilizer application were re-run in similar statistical analysis as the second set of trial. The general yield was observed to have increased only during the wet seasons while yield in the two dry seasons was sustained (Figure 1). Consistently, urea gave the highest yield among the topdress fertilizers in all trial seasons. WSF, given the same nitrogen rate per hectare in every LCC critical readings, showed potential as an organic-based topdress N fertilizer
(Table 3). Taking the averages of grain yield, it showed that the yield was comparable between the two LCC readings as basis of topdressing fertilizer (average 5.42 t ha-1). The same was observed between organic and inorganic foliar (average 4.96 t ha-1) and between urea and WSF (average 5.88 t ha-1).
Despite application of organic-based basal fertilizers or supplement, there has been no significant differences between the use of LCC 3 and LCC 4. Urea application based on LCC 3 was not consistently better than LCC 4. Considering the volume and number of times of application of either WSF or urea to get high yield and the projected cost of input relative to the attained yield in an organic-based nutrient management, the use of LCC3-based OBNM is a better option.
Similarly, as there had been no significant differences in yield between urea and WSF, and between OFF and IFF, the choice of the fertilizer to apply will depend on farmers’ budget. Generally, the results showed that it is still better to use the solid/granular fertilizers than the spray/foliar fertilizers. As observed, the solid/granular fertilizers gave an average of 920 kg ha-1 higher grain yield than organic/inorganic foliar fertilizers (Figure 2). This is regardless of LCC readings as basis of topdressing application time.
Results show that inorganic fertilizers produced higher yield than organic fertilizers but do not usually produce micronutrients, which can be provided by manures and other organic sources (IRRI, 2014). These micronutrients are important in chemical processes and plant activities such as photosynthesis, respiration, chlorophyll formation, and enzymatic reactions. They are also needed in nitrogen fixation, root growth, growth hormone production, seed development, and processes within the plant involving nitrogen
Figure 2. Average yield of PSB Rc 82 as affected by the application of solid topdress fertilizers and foliar topdress supplement to basally-applied plants with rice straw+chicken manure. WS 2011-2013.
Average grain yield of PSB Rc 82
Wet season2011
Dry season2012
Wet season2012
Dry season2013
Wet season2013
Solid topdress
Foliar topdress
Solid topdress
Foliar topdress

Evaluation of Organic Nitrogen Sources
100 RICE-BASED BIOSYSTEMS JOURNAL (2020) 6: 95-101
(University of Hawaii, 2015). However, inorganic chemical fertilizer is essential for crop nutrition to maximize productivity. Hence, the use of organic manures and composted organic materials along with chemical fertilizers may be effective to further increase crop yield (Ibrahim et al., 2008). Applying green manure may improve economic viability of rice production while reducing environmental impacts of agriculture. However, such approaches are complex because they depend on interactions among green manure, environment, and management (Cherr et al., 2006). Tithonia diversifolia (wild sunflower, WSF) is a high-quality organic source in terms of nutrient release and supplying capacity (Nziguheba, et al., 1998; Olabode et al., 2007). Considering though the habitat of wild sunflower, the Azolla spp, an aquatic plant, can be a better option as it can grow simultaneously with rice.
Summary and ConclusionThis study used rice straw as the main organic-
based basal fertilizers to develop holistic organic-based management. Rice straw is the main farm waste in a rice-rice cropping system. Because of its high carbon:nitrogen ration, there is a need to hasten its decomposition through inoculant. Chicken manure was also used in this study.
The use of urea, wild sunflower, organic foliar, and inorganic foliar as topdress fertilizers based on LCC readings of 3 and 4 were assessed to determine if they can help attain higher yield. Results showed that applying nitrogen as topdress fertilizer based on LCC readings did not produce significant differences in increasing yield of PSB Rc 82, a high yielding variety under an organic-based basal nutrient management.
Apparently, the synchronization between the net N mineralization and plant N uptake can explain the ineffectiveness of using the LCC in an organic-based nutrient management for rice. The laboratory result of Korsaeth and others (2002) showed that the incorporation of a mixture of N-rich white clover and N-poor barley straw created a transient accumulation of clover derived inorganic N during the first period. Thereafter, microbial N demand during the straw C utilization resulted in net immobilization of most of the clover derived inorganic N.
Among the topdress fertilizers, urea produced the highest yield. Considering the volume and number of times of WSF application and the projected input cost in an organic-based nutrient management, the use of LCC can be further studied. Topdressing of green manure can be better based on critical growth stages of the rice plants.
Generally, results showed that it is still better to use the solid/granular fertilizers than spray/foliar fertilizers either in organic or inorganic origin. As observed, the solid/granular fertilizers gave an average of 920 kg ha-1 higher grain yield than use of organic/inorganic foliar fertilizers.
For pure and to-be-certified organic rice production management, WSF has potential to be used as an alternative topdress nutrient source for rice in an organic based nutrient management based on LCC 4 as critical value in determining the application time. However, with the issue on the synchrony of N release and N uptake from the organic N source, the use of LCC 4 may require more and frequent topdress application, thus higher input cost should be considered.
Table 3. Average grain yield (t ha-1) of rice plants applied with RSCM as basal fertilizers and with the different topdress fertilizers based on LCC reading. 2011 WS-2013 DS. Maligaya soil series. PhilRice Experimental Station, Science City of Muñoz, Nueva Ecija.
Grain Yield (t ha-1)
Treatments Wet Season 2011 Dry Season 2012 Wet Season 2012 Dry Season 2013 Wet Season 2013
LCC3 Urea 3.5 cd 7.9 a 5.8 ab 7.3 ab 6.0 a
LCC3 WSF 3.6 bc 6.7 bc 5.7 abc 7.2 b 5.3 bc
LCC3 OFF 3.3 d 5.4 d 5.2 cd 5.7 d 5.1 c
LCC3 IFF 3.5 cd 5.5 d 5.0 d 5.7 d 4.9 cd
LCC4 Urea 3.8 ab 7.0 b 6.1 a 6.6 bc 4.8 cd
LCC4 WSF 3.9 a 6.9 b 6.1 a 7.5 a 5.9 b
LCC4 OFF 3.7 abc 5.5 d 5.4 bcd 5.9 cd 4.4 d
LCC4 IFF 3.4 cd 5.9 cd 5.1 d 5.7 d 4.9 cd
SE 0.009 0.314 0.186 0.258 0.02
cv (%) 5.0 9.9 6.7 8.0 7.8
Means with similar letter are not significantly different at 5% level using the CropStat statistical software program. LCC 3= critical reading of 3 by the leaf color chart, LCC 4 = critical reading of 4 by the leaf color chart. WSF = wild sunflower, OFF= organic foliar fertilizer, IFF = inorganic foliar fertilizer

Evaluation of Organic Nitrogen Sources
RICE-BASED BIOSYSTEMS JOURNAL (2020) 6: 95-101 101
Literature CitedBhiah KM, Guppy C, Lockwood P, Jessop R (2010) Effect of
potassium on rice lodging under high nitrogen nutrition. Proceedings. 19th World Congress of Soil Science, Solutions for a Changing World. August 1-6, 2010. Brisbane, Australia. pp 136-139
Cherr CM, Scholberg JMS, McSorley R (2006) Green Manure Approaches to Crop Production: A Synthesis. Agronomy Journal. 98: 302-319
Hobbs PR, Sayre KD, Ortiz-Monasterio JI (1998) Increasing wheat yields sustainably through Agronomic means. In Najarajan, S. Singh, G, and Tyagi BS. (Eds.). Wheat. Research Needs Beyond 2000 AD. Narosa Publishing House, New Delhi
Ibrahim M, Anwar-Ul-Hassan MI, Valeem EE (2008) Responses of wheat growth and yield to various levels of compost and organic manure. Pak. J. Bot. 40(5): 2135-2141
IRRI. Using organic materials and manures. (n.d) www.knowledgebank.irri.org/training/fact-sheets/nutrient-management/item/using-organic-materials-and-manures (accessed October 13, 2014)
Javier EF, Santin CA, Grospe FS, Rivera JM, Torreña PS, Boholano IV, Liboon, S (2007) Long term organic fertilizer use in irrigated lowland rice soil. Philippine Rice R&D Highlights 2006, Philippine Rice Research Institute, Nueva Ecija, Philippines
Javier EF, Grospe, FS (2009) Long term organic fertilizer use in irrigated paddy soil. Philippine Rice R&D Highlights 2008
Javier EF, Grospe, FS (2010) Long-term use of organic fertilizer in paddy soils. Philippine Rice R&D Highlights 2009, Philippine Rice Research Institute, Nueva Ecija, Philippines
Javier EF, Tabien RE (2003) Nitrogen dynamics in soils amended with different organic fertilizers. Phil Journal Crop Sci. 28(3): 49-60
Korsaeth A, Henriksen TM, Bakken LR (2002) Temporal changes in mineralization and immobilization of N during degradation of plant material: implications for the plant N supply and nitrogen losses. Soil Biol. Biochem. 34: 789-799
Maghirang RG, De La Cruz R, Villareal RL (2011) How sustainable is organic agriculture in the Philippines. Trans Nat Acad Sci & Tec (Philippines) 33(2): 289-321
Nziguheba, G, Palm, CA, Buresh, RJ, Smithson PC (1998). Soil phosphorus fractions and adsorption as affected by organic and inorganic sources. Plant and Soil 198:159–168. https://doi.org/10.1023/A:1004389704235
Olabode OS, Ogunyemi Sola WB, Akanbi GO, Adesina, Babajide PA (2007) World Journal of Agricultural Sciences 3(4): 503-507
Rajkumara S (2008). Lodging in Cereals – A Review. Agric. Rev. 29(1): 55-60
University of Hawaii. (2015) Soil Nutrient Management for Maui County. https://www.ctahr.hawaii.edu/mauisoil/manage.aspx (accessed: September 14, 2015)

102 RICE-BASED BIOSYSTEMS JOURNAL (2020) 6
CALL FOR PUBLICATIONRice-Based Biosystems Journal
SCOPE
The Rice-Based Biosystems Journal encourages publication of original research and review articles that have impact on applied and integrated rice and rice-based cropping systems in a particular ecosystem. The Journal provides information on rice-based researches on soil and crop management, crop protection, crop improvement, grain quality, farm machinery, resource use efficiency, plant biology, nutraceuticals, food value-adding systems, biofertilizers, biopesticides, biomaterials, and system analysis and simulation. It also covers the economics, social, and communication systems that influence the landscape of rice and rice-based cropping systems.
AUTHOR’S GUIDELINES
1. Submission and Acceptance of Manuscripts
Manuscripts are submitted to Rice-Based Biosystems Journal: [email protected]. Manuscripts should be formatted as described in the Rice-Based Biosystems Journal Author Guidelines and follow the PhilRice style guide. When preparing your file, please use Times New Roman as font type, and 12 as font size for the text. Please do not use Japanese or other Asian fonts. Do not use automated or manual hyphenation. With your submission, you will have to complete, sign, and send the Copyright Transfer Agreement. Authors may provide names of potential reviewers for their manuscript. Authors must inform the editorial assistant of any possible conflict of interest capable of influencing their judgement, and if necessary, a disclaimer will be included. Revised manuscripts must be submitted two weeks after the authors are notified of conditional acceptance pending satisfactory revision. Authors resubmitting manuscripts should follow the same procedures as for submission of new manuscripts. If accepted, papers become the copyright of the journal. Photos and tables must be high resolution scans (JPEG at 300 dpi).
2. Requirements for Manuscripts
2.1. Language
The language of publication is English.
2.2. Format
The first page should contain the name and address of the institute where the work has been done, the title of the paper, name(s) and initial(s) of the author(s), the e-mail address of the corresponding author, and the number of figures and tables.
The main text shall be preceded by an abstract, which is always in English and contains the background for the research undertaken, reference to the material and methods used, as well as main results and conclusions. It should not exceed 220 words. Up to seven ‘keywords’ should be added. A short version of the title (running title) should also be given.
The main text should be divided into the following sections: Introduction, Materials and Methods, Results, Discussion, Conclusion, Acknowledgment, and Literature Cited. Facts explained by tables or figures need no lengthy explanation in the text. Numerical material should be submitted only after statistical processing.
The manuscript comprises a printout of the text and a list of all figures and tables with their captions

RICE-BASED BIOSYSTEMS JOURNAL (2020) 6 103
and titles on a separate piece of paper. In anticipation of the online edition, we ask that you convey the essential information within the first 60 characters of the captions. Each figure, table, and bibliographic entry must have a reference in the text. The preferred position for the insertion of figures and tables should be marked on the margin of the text of the manuscript. Any corrections requested by the reviewer should already be integrated into the file. The text should be prepared using standard software (Microsoft Word). Please do not include footnotes.
2.3. Length
The manuscript should be typed double spaced with a 4 cm left margin. Manuscripts, including figures and tables, should not exceed 25 printed pages. The publication of shorter papers may be given priority.
2.4. Units, Abbreviations, and Nomenclature
All units and measures must conform to the international standard-system (SI). Botanical genus and species names should be set in italics.
2.5. Illustrations and Tables
The number of tables and figures should be kept to the minimum necessary, and have a maximum of 13 cm in height and 17 cm in width. All figures should include reproducible copies marked with the author’s name, short title, and figure number. Figures submitted as electronic file should be saved in PNG instead of JPEG for better quality. Powerpoint and Word graphics are unsuitable for reproduction.
Submit high-contrast photographic materials suitable for reproduction. Images should be of high quality with respect to detail, contrast, and fineness of grain to withstand the inevitable loss of contrast and detail during the printing process.
Scanned figures (usually in JPEG format) should have a resolution of 300 dpi (halftone) or 600 to 1200 dpi (line drawings) in relation to the reproduction size. You may submit figures in color or black and white. Graphs with an x and y axis should not be enclosed in frames; only 2-dimensional representations. Place labels and units.
Captions for the figures should give a precise description of the content and should not be repeated within the figure. Tables should be created with the table function of a word processing program. Spreadsheets are not acceptable.
2.6. References
The literature cited should be arranged alphabetically and contain: the author’s surname, first name and middle initial, year of publication, title of paper, name of journal, volume number, and first and last page number of the publication.
Bibliographic references to books or other established publications should contain: author’s surname, first name and middle initial, year of publication, and edition, publishing house and place of publication. The name of the author and the date of publication should be included within the text. If more than one publication of the same author appeared in one year, these should be marked by small letters after the year, e.g., 2015a; 2015b. References to publications by more than two authors should be cited as follows: Luna et al. (2015) or (Luna et al., 2015).

104 RICE-BASED BIOSYSTEMS JOURNAL (2020) 6
3. Copyright
If your paper is accepted, the author identified as the formal corresponding author for the paper will receive an email.
4. Proof Corrections and Offprints
The corresponding author will receive an e-mail with the laid out publication. A working e-mail address must therefore be provided for the corresponding author. Further instructions will be sent with the proof. We will charge for excessive changes made by the author in the proofs, excluding typesetting errors.
5. Submission and Acceptance of Research Notes
A research note is a short discussion on key research findings and advances on a particular theory, study, or methodology that does not sum up to a full research article. The format and guidelines of a research note resembles that of a full-length manuscript except for the number of words, figures and/or tables. A 3000 to 4000-word paper with an abstract and a maximum of 2 figures and/or 2 tables may be submitted as a research note.
6. Submission of Invited Papers
The Editorial Team can invite a member of the Advisory Board and Editorial Board of the Rice-Based Biosystems Journal or an expert to submit a paper in line with the theme of the volume to be published. Invited papers may be in the form of a full paper, research note or a review article. A review article gives information on a particular field of study, recent major advances and discoveries, significant gap in the research, current debates, and ideas or recommendations for future advances.
At least one expert on the subject matter will review the invited paper. Instructions for submitting a full paper and research note are in numbers 1-5 of the author guidelines.
6.1 Format
The Abstract consists of 220 words or less that summarizes the topic of the review. The current challenges and perspective on the topic are addressed, with significant conclusion and recommendations.
The Introduction states the purpose of the review. It presents a short background of the nature of the problem and its aspects of being resolved. The limitations of current solution or studies are included.
The Body presents the current studies and major advances or discoveries and impact on the present situation of the problem. Evaluation of studies such as applicability and availability of the methods used to certain areas and situation or statistical significance are elaborated.
The Conclusion summarizes the overall or major impacts and main points of the current studies. Recommendations for future advances of the research on the subject matter are presented.
The Literature Cited follows the instructions in number 2.6 of the author guidelines.

RICE-BASED BIOSYSTEMS JOURNAL (2020) 6 105
EDITORIAL POLICYAuthors should:
• designate a corresponding author who will be responsible in coordinating issues related to submission and review, including ensuring that all authorship disagreements are resolved appropriately;
• submit original work that has been honestly carried out according to rigorous experimental standards;
• give credit to the work and ideas of others that led to their work or influenced it in some way;
• declare all sources of research funding and support;
• submit manuscripts that are within the scope of the journal by ensuring that they abide by the journal’s policies and follow its presentation and submission requirements;
• explain in a cover letter if there are special circumstances when the manuscript deviates in any way from a journal’s requirements or if anything is missing and ensure that the manuscripts do not contain plagiarized material or anything that is libelous, defamatory, indecent, obscene or otherwise unlawful, and that nothing infringes the rights of others;
• ensure they have permission from others to cite personal communications and that the extent, content, and context have been approved;
• provide details of related manuscripts they have submitted or have in press elsewhere; and
• check the references cited to ensure that the details are correct.
Authors should not:
• submit the same or a very similar manuscript to more than one journal at the same time, present their work, or use language, in a way that detracts from the work or ideas of others;
• be influenced by the sponsors of their research regarding the analysis and interpretation of their data or in their decision on what to, or not to publish and when to publish;
• divide up the papers inappropriately into smaller ones in an attempt to increase their list of publications;
• be involved in ‘ghost’ or ‘gift’ authorship;
• use information privately obtained without direct permission from the individuals from whom it was obtained;
• make exaggerated claims about the novelty or significance of their findings;
• misrepresent or inappropriately enhance their results by any means;
• make significant changes to their manuscript after acceptance without the approval of the editor or journal editorial office; and
• submit a manuscript that has been rejected by one journal to another journal without considering the reviewers’ comments, revising the manuscript, and correcting presentational errors.

We are a government corporate entity (Classification E) under the Department of Agriculture. We were created through Executive Order 1061 on 5 November 1985 (as amended) to help develop high-yielding and cost-reducing technologies so farmers can produce enough rice for all Filipinos.
With our “Rice-Secure Philippines” vision, we want the Filipino rice farmers and the Philippine rice industry to be competitive through research for development work in our central and seven branch stations, coordinating with a network that comprises 59 agencies strategically located nationwide.
We have the following certifications: ISO 9001:2008 (Quality Management), ISO 14001:2004 (Environmental Management), and OHSAS 18001:2007 (Occupational Health and Safety Assessment Series).
PHILRICE CENTRAL EXPERIMENT STATION Maligaya, Science City of Muñoz, 3119 Nueva Ecija Tel: (44) 456 -0277 • Direct line/Telefax: (44) 456-0354
BRANCH STATIONS:PhilRice Batac, MMSU Campus, Batac City, 2906 Ilocos Norte
Telefax: (77) 772-0654; 670-1867; Tel: 677-1508 Email: [email protected] phPhilRice Isabela, Malasin, San Mateo, 3318 Isabela
Mobile: 0908-875-7955; 0927-437-7769; Email: [email protected] Los Baños, UPLB Campus, College, 4030 Laguna
Tel: (49) 536-8620; 501-1917; Mobile: 0920-911-1420; Email: [email protected] Bicol, Batang, Ligao City, 4504 Albay
Tel: (52) 284-4860; Mobile: 0918-946-7439; Email: [email protected] Negros, Cansilayan, Murcia, 6129 Negros Occidental
Mobile: 0949-194-2307; 0927-462-4026; Email: negros.station@philrice. gov.phPhilRice Agusan, Basilisa, RTRomualdez, 8611 Agusan del Norte
Telefax: (85) 343-0768; Tel: 343-0534; 343-0778; Email: [email protected] Midsayap, Bual Norte, Midsayap, 9410 North Cotabato
Telefax: (64) 229-8178; 229-7241 to 43 Email: [email protected]
PhilRice Field Office, CMU Campus, Maramag, 8714 Bukidnon; Mobile: 0916-367-6086; 0909-822-9813Liaison Office, 3rd Flor. ATI Bldg, Elliptical Road, Diliman, Quezon City; Tel/Fax: (02) 920-5129
SATELLITE STATIONS:Mindoro Satellite Station, Alacaak, Sta. Cruz, 5105 Occidental Mindoro • Mobile: 0917-714-9366; 0948-655-7778Samar Satellite Station, UEP Campus, Catarman, 6400 Northern Samar • Mobile: 0948-754-5994; 0929-188-5438Zamboanga Satellite Station, WMSU Campus, San Ramon, 7000 Zamboanga City • Mobile: 0975-526-0306; 0910-645-9323
CALL FOR PAPERSThe Rice-Based Biosystems Journal is a peer-reviewed online and an open-accessed journal in The
University Library of University of the Philippines Diliman, it is managed by the Philippine Rice Research Institute (PhilRice) through a competent editorial team, reputable advisory and editorial boards, and invited referees. The journal encourages publication of original research and review articles that have impact on and are interconnected with rice and rice-based crops. It publishes rice and rice-based research studies on soil and crop management, crop protection, crop improvement, grain quality, farm machinery, resource use efficiency, plant biology, nutraceuticals, food value-adding systems, biofertilizers, biopesticides, biomaterials, and systems analysis and stimulation. It also covers the economics, social, and communication systems that may influence the landscape of rice and rice-based production. For your submission, you can email your manuscript to [email protected] with subject and file format as: RBBJ_Title_Surname.doc. For more information about the journal, please visit www.philrice.gov.ph/grants/call-publication/.
0917-111-7423

RICE-BASED BIOSYSTEMS JOURNAL (2020) 6 107