Physical deterioration of Egyptian limestone affected by saline water
Upload
independentCategory
view
0download
0
ARTICLE
Equivalent cropping area and whole farm water balanceapproaches to reduce net recharge to shallow saline groundwaterfrom rice based cropping systems
Shahbaz Khan
Received: 11 December 2006 / Accepted: 23 April 2007 / Published online: 5 June 2007
� Springer-Verlag 2007
Abstract Sustainability of irrigated agriculture in the
semi-arid regions such as the rice growing regions of the
southern Australia could be under serious threat due to
recharge to saline groundwater leading to secondary sa-
linisation. This paper presents two approaches to reduce net
recharge to shallow saline groundwater from ponded rice
cropping systems using a soil, water and groundwater
management model–SWAGMAN model. First approach
applies the concept of growing deep-rooted crop (crop
consuming water from soil and shallow water table) over
an area equivalent to recharge from a unit area of rice crop
to maintain the total water balance. The second approach
involves achieving whole farm water balance for average
and wet climatic conditions to find out optimum cropping
pattern to minimise recharge from rice based system. Re-
sults of both approaches are sensitive to water table depth
and regional groundwater outflow rates. The first approach
was applied to determine an optimal mix of rice/lucerne
crop to keep water tables and average soil salinity changes
less than 0 m/year and 0.015 dS/m, respectively. The area
of lucerne required to match the net groundwater rise
caused by 1 ha of rice is 1.27, 2.45 and 3.55 ha for 1, 0.5
and 0.2 ML/ha regional groundwater outflow capacity.
Results from second approach revealed that it is possible to
control net recharge under above average rainfall using a
suitable whole farm cropping mix e.g. 50 ha rice–wheat
rotation, 19 ha rice, 25 ha of lucerne and 136 ha of fallow.
Keywords Groundwater recharge � Salinity � Shallow
water table � Rice based system � Optimum cropping mix �Equivalent cropping area � SWAGMAN
Introduction
Sustainability of irrigated agriculture in the rice growing
regions of the Murray Darling Basin (MDB) Australia fa-
ces secondary salinisation challenges due to high recharge
levels under current irrigation practices, water trading out
of the area and hydraulic loading not being maintained at
sufficient levels to keep root zone free of salts (Khan et al.
2006). For the rice growing regions in the MDB ponded
rice contributes 40–50% of the accessions to the ground-
water, and the other major sources are other irrigated crops
and pastures, channel leakage and rainfall (Leslie 1992).
Rice production in rotation with winter and summer
crops and annual subterranean clover pastures is the major
land use in the Coleamablly Irrigation Area (CIA) located
in the MDB (Fig. 1). Prior to irrigation, water table levels
under the CIA were 15–20 m deep. During 1960s 333
farms were allocated 79,000 ha of land and irrigation be-
gan in the CIA. In a good water allocation year the total
area under rice in the CIA can be over 20,000 ha using
between 12 and 16 ML/ha (1,200–1,600 mm) of irrigation
water.
In the CIA the rice fields are ponded with water between
120 and 180 days, therefore, the potential for excessive deep
drainage/groundwater recharge is higher than intermittently
irrigated crops or pastures. Rice growers have been under
considerable pressure to increase the water use productivity
(t/ML) and to reduce the water use of rice-based systems
to fulfill environmental and socio-economic require-
ments. One way to increase rice water use productivity is to
S. Khan (&)
CSIRO Land and Water and Charles Sturt University,
Locked Bag 588, Wagga Wagga, Australia
e-mail: [email protected]
123
Paddy Water Environ (2007) 5:143–152
DOI 10.1007/s10333-007-0078-6

reduce annual deep drainage or recharge below rice fields
(Humphreys et al. 2006). Leslie (1992) recommended
adoption of a rice industry target recharge of 1 ML/ha
(100 mm). The target for upper limit of deep drainage is
currently 200 mm however in many rice fields signifi-
cantly higher deep drainage than this target occurs
(Beecher 2005).
A number of options have been investigated by various
researchers of on-farm rice growing restrictions to mini-
mise groundwater recharge (Humphreys et al. 1994). These
restrictions include soil-based criteria, paddock rice water
use limits, exclusion of land from rice growing and limits
on the intensity of rice growing. Rice cultivation is con-
fined to soils with at least 2–3 m of continuous medium to
heavy clay (i.e. >45% clay) in the top 3.5 m based on one
soil profile analysis per 4 ha (i.e. a 200 m grid). Irrigation
water use must not exceed a target set at the end of each
rice season based on actual net evaporative demand. (Rice
water use target = ETo – rainfall + 400 mm) (ETo refer-
ence crop evapo-transpiration). This criteria is usually as-
sessed at the end of the rice season. In addition, the total
area of rice that can be grown each year is restricted, and
rice area and water use are closely monitored by the water
delivery authorities. The ‘‘rice environmental policy’’ is
defined and implemented by the water delivery authorities
as part of their overall community led Land and Water
Management Plans and is reported on annual basis through
the mandatory environmental report of the irrigation area.
There is considerable variation in percolation rates across
soil types and within fields (van der Lelij and Talsma 1978;
Beecher et al. 2002) and small highly permeable areas can
make a large impact on total percolation losses also re-
ferred to as shallow groundwater recharge.
As an alternative to current rice water use and soil
restriction policy in the CIA this paper aims to achieve
whole farm water balance through an appropriate mix of
recharging and discharging land uses which can limit re-
charge to the groundwater outflow capacity of the under-
lying aquifer systems. Such an approach can provide
cropping flexibility to rice growers as well as manage the
water table and salinity problems of the irrigation area by
restricting net recharge to zero.
Case study area
This paper deals with the issue of rising levels of water
table and salinity as a result of rice growing with particular
reference to Coleambally Irrigation Area (CIA). The CIA is
located to the south of the Murrumbidgee River. The irri-
gation area was developed during the 1960s to make use of
water diverted westward as a result of the Snowy Moun-
tains Hydro-Electric Scheme. Irrigation water is used for
crops such as rice, wheat, barley, oats, canola, soybeans,
maize, sunflowers, lucernes, grapes, prunes and pastures
for sheep and cattle.
The historic groundwater rise trends in CIA are shown
in Fig. 2. The trends show rapid rises in the 1970s and the
early 1980s after the introduction of irrigation in the early
1960s.The groundwater levels and salinity for September
2002 in the CIA is given in Figs. 3 and 4, respectively.
There has been an overall water table decline (1.0–3.0 m)
since 2002–2003 season due to low water allocations and a
relatively dry climate. The spatial distribution of total
groundwater outflow in the CIA is given in Fig. 5 based on
groundwater flow analysis by Khan (2005) which proposed
that CIA can be divided into five sub-regions for better
recharge management. These groundwater outflow rates
were computed using aquifer lithology and piezometric
levels. Around 15GL (1 GL = 1 Million Cubic Meter) is
discharged through capillary upflow in shallow water table
areas e.g. in the southern Coleambally Irrigation Area. The
low groundwater outflow rates, shallow water tables and
high groundwater salinity especially in the Southern CIA
may result in salinisation of land and pose a risk to the
Fig. 2 History of groundwater changes in CIA
Aust r aliaMurray Darling Ba s i nPrincipal rive r s
N
EW
S
Brisbane
S y dne yC I A
Me l b o urn e
Ad e laide
P e r t h
Darwin
H o bar t
Mur r a y R
Darling
R
Fig. 1 Location of the Coleambally irrigation area, Australia
144 Paddy Water Environ (2007) 5:143–152
123

agricultural productivity and environmental sustainability.
There is a need for the implementation of on-farm and/or
regional groundwater recharge management in this area.
Taking into account farmer preferences; modelling and
practical approaches are needed to identify combinations of
on-farm and regional options to achieve desired environ-
mental objectives, and to evaluate the tradeoffs between
environmental and economic objectives. As rice is only one
of many irrigation activities with potential to influence
water tables at the farm and regional scale, solutions for
controlling water tables therefore need to be derived from
the consideration of a complex mix of biophysical and
socioeconomic factors, over shorter and longer time
frames.
This paper aims at finding out appropriate mix of
recharging and discharging land uses which can limit re-
charge to the regional groundwater outflow capacity of the
underlying aquifer systems.
Data analysis
Decile method groups monthly precipitation occurrences
into deciles and provides an accurate statistical measure-
ment of precipitation and drought. Decile analysis of long-
term monthly rainfall data for CIA is shown in Table 1 and
its qualitative interpretation (Gibbs and Maher 1967) is
given in Table 2.
The total rainfall for the seventh decile is 462 mm
whereas the median (fifth decile) rainfall is 368 mm which
means the above average rainfall is 94 mm greater than the
median.
The long-term average reference evapo-transpiration is
around 1,160 mm over the rice-growing season (October–
February). The rainfall over the same period varies from
less than 100 mm to over 300 mm. The reported rice water
use ranges between less than 1,000 mm and over
1,600 mm indicating significant recharge for high water
use farms.
Methodology
A range of approaches ranging from the identification of
leaky paddocks or sites with excessive recharge to
achieving a whole farm water balance through a better mix
Fig. 3 Depth to piezometric level for CIA, September 2002
Fig. 4 Groundwater salinity for the CIA (all piezometers), Septem-
ber 2002
370000 380000 390000 400000 410000 420000 430000
6120000
6130000
6140000
6150000
6160000
6170000
0
0.25
0.5
0.75
1
ML/haML/ha
Fig. 5 Groundwater outflow rates in the Coleambally irrigation area
(yellow spots are areas with limited data or points closest to a
pumping bore)
Paddy Water Environ (2007) 5:143–152 145
123

of recharging and discharging crop mixes, can be used to
reduce accessions from rice based systems.
Crop/rice ratios to maintain total water balance
In this approach economic viability of the farming system
is maintained by allowing same area of rice to be grown if
the farmer is willing to put the discharging crops to miti-
gate net recharge.
Under most hydro-geological conditions the ponded rice
fields cause saturation of underlying soils and recharge to
the water table whereas crops such as lucerne can tap
shallow groundwater to meet major proportion of their crop
water requirements (causing net groundwater discharge
from the water table). If crops grown across the entire farm
or area are considered on the basis of their recharge to and
discharge from the shallow water tables, an optimal mix of
recharging and equivalent discharging crops can be deter-
mined to keep water tables and soil salinity at desired
levels while maintaining economic viability. The dis-
charging crops such as lucerne which is a deep rooted
perennial crop can also be used to provide a dewatering
buffer around the rice area as well as balance total recharge
through discharge (Fig. 6). In this approach the water table
rise is dissipated through lateral flow from under the rice
crop to the adjoining land.
Figure 7 shows a water balance framework of approach
for determining optimum mix of crops utilising ground-
water from water table and the rice. In this framework
SWAGMAN Farm model (Khan et al. 2003) is used to
determine the equivalent discharging crop areas to balance
recharge from a unit area of rice.
Whole farm water balance approach
In the second approach, ten cropping pattern scenarios
were undertaken for a single farm with an area of 230 ha in
order to analyse water table and salinity impacts of dif-
ferent rice based irrigation systems. These scenarios in-
cluded single crops grown in individual paddocks as well
as rotations such as rice/wheat and corn/wheat in the same
paddock over a given year. For these scenarios fifth and
seventh deciles of rainfall were considered (Tables 5 and
6). These scenarios included crop mixes given in Table 3.
Table 1 Rainfall analysis using decile method on the Coleambally rainfall data (1920–2003)
Decile January February March April May June July August September October November December Total
First 22.86 22.35 20.32 33.78 10.92 4.06 11.43 101.09 0 0 14.48 2.54 243.83
Second 0 5.84 53.59 10.16 29.97 10.92 20.07 5.59 31.5 72.64 34.04 3.05 277.37
Third 17 12 25.4 58.9 14.4 23.5 36.9 44.5 12.6 26.6 5.3 46.3 323.4
Fourth 0.1 45.2 0 14.1 17.9 20.9 63.4 53.3 11.6 58.9 30.4 34.5 350.3
Fifth 0 0.76 9.65 27.94 26.42 22.61 44.7 33.02 8.64 68.58 10.92 114.3 367.54
Sixth 13.72 0 1.27 1.52 31.5 148.59 88.65 19.05 9.91 20.07 7.37 76.96 418.61
Seventh 54.3 58.6 5.8 75.4 66 21.4 61.3 44.9 38.4 25.3 3.7 6.8 461.9
Eighth 152.65 14.22 20.07 12.45 84.84 3.3 37.85 27.43 80.77 5.33 31.75 26.92 497.58
Ninth 4.4 5.1 32.7 44.3 33.6 19.2 12.8 60.5 42.7 121.2 65.5 123.9 565.9
Tenth 74.68 0.76 123.7 46.23 115.32 64.01 81.03 19.56 47.5 154.69 14.99 9.4 751.87
Table 2 Definition of decile rainfall bands
Decile range Interpretation
1 Very much below ‘‘average’’
2 Much below ‘‘average’’
3 Below ‘‘average’’
4 Slightly below ‘‘average’’
5 and 6 ‘‘Average’’
7 Slightly above ‘‘average’’
8 Above ‘‘average’’
9 Much above ‘‘average’’
10 Very much above ‘‘average’’
Gibbs and Maher (1967) Fig. 6 Rice–lucerne crop mix to control water table
146 Paddy Water Environ (2007) 5:143–152
123
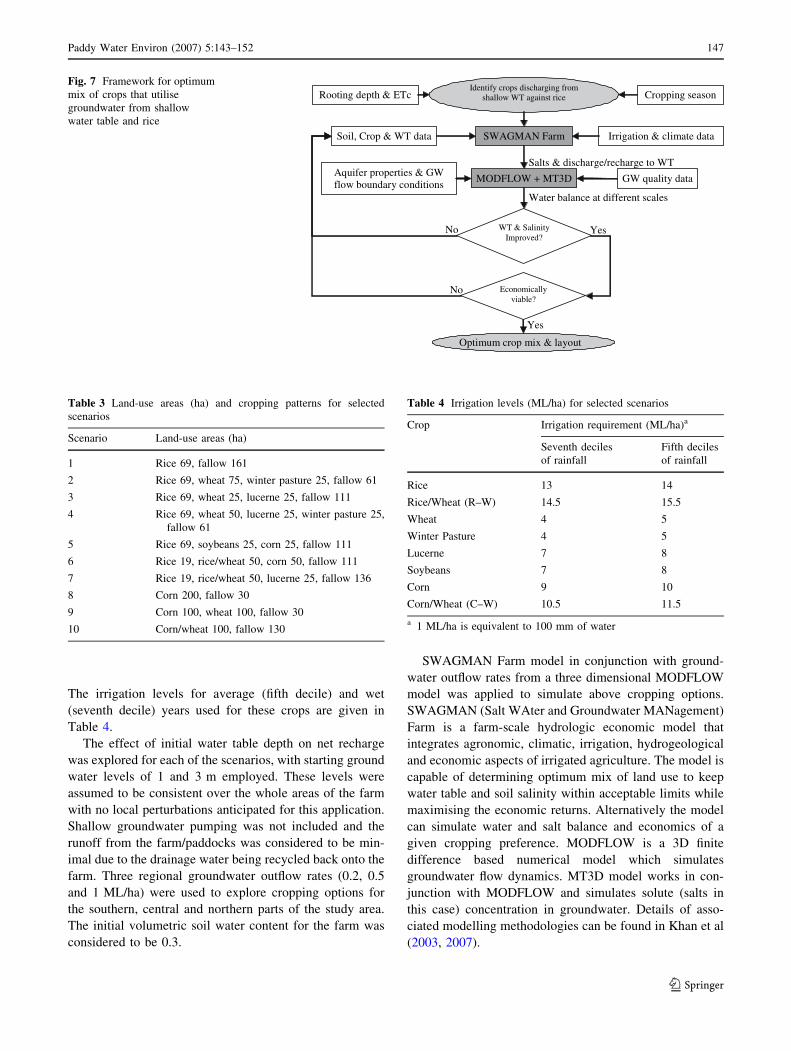
The irrigation levels for average (fifth decile) and wet
(seventh decile) years used for these crops are given in
Table 4.
The effect of initial water table depth on net recharge
was explored for each of the scenarios, with starting ground
water levels of 1 and 3 m employed. These levels were
assumed to be consistent over the whole areas of the farm
with no local perturbations anticipated for this application.
Shallow groundwater pumping was not included and the
runoff from the farm/paddocks was considered to be min-
imal due to the drainage water being recycled back onto the
farm. Three regional groundwater outflow rates (0.2, 0.5
and 1 ML/ha) were used to explore cropping options for
the southern, central and northern parts of the study area.
The initial volumetric soil water content for the farm was
considered to be 0.3.
SWAGMAN Farm model in conjunction with ground-
water outflow rates from a three dimensional MODFLOW
model was applied to simulate above cropping options.
SWAGMAN (Salt WAter and Groundwater MANagement)
Farm is a farm-scale hydrologic economic model that
integrates agronomic, climatic, irrigation, hydrogeological
and economic aspects of irrigated agriculture. The model is
capable of determining optimum mix of land use to keep
water table and soil salinity within acceptable limits while
maximising the economic returns. Alternatively the model
can simulate water and salt balance and economics of a
given cropping preference. MODFLOW is a 3D finite
difference based numerical model which simulates
groundwater flow dynamics. MT3D model works in con-
junction with MODFLOW and simulates solute (salts in
this case) concentration in groundwater. Details of asso-
ciated modelling methodologies can be found in Khan et al
(2003, 2007).
No
Yes
Rooting depth & ETc Cropping season
SWAGMAN Farm
Salts & discharge/recharge to WT
Soil, Crop & WT data Irrigation & climate data
MODFLOW + MT3D GW quality data Aquifer properties & GW flow boundary conditions
Water balance at different scales
YesNo
Optimum crop mix & layout
Identify crops discharging from shallow WT against rice
WT & Salinity Improved?
Economically viable?
Fig. 7 Framework for optimum
mix of crops that utilise
groundwater from shallow
water table and rice
Table 3 Land-use areas (ha) and cropping patterns for selected
scenarios
Scenario Land-use areas (ha)
1 Rice 69, fallow 161
2 Rice 69, wheat 75, winter pasture 25, fallow 61
3 Rice 69, wheat 25, lucerne 25, fallow 111
4 Rice 69, wheat 50, lucerne 25, winter pasture 25,
fallow 61
5 Rice 69, soybeans 25, corn 25, fallow 111
6 Rice 19, rice/wheat 50, corn 50, fallow 111
7 Rice 19, rice/wheat 50, lucerne 25, fallow 136
8 Corn 200, fallow 30
9 Corn 100, wheat 100, fallow 30
10 Corn/wheat 100, fallow 130
Table 4 Irrigation levels (ML/ha) for selected scenarios
Crop Irrigation requirement (ML/ha)a
Seventh deciles
of rainfall
Fifth deciles
of rainfall
Rice 13 14
Rice/Wheat (R–W) 14.5 15.5
Wheat 4 5
Winter Pasture 4 5
Lucerne 7 8
Soybeans 7 8
Corn 9 10
Corn/Wheat (C–W) 10.5 11.5
a 1 ML/ha is equivalent to 100 mm of water
Paddy Water Environ (2007) 5:143–152 147
123

Results and discussion
Crop/rice ratios to maintain total water balance
Rice with lucerne
Using median rainfall and evapo-transpiration values in the
CIA, average starting volumetric soil water content of 0.3
for the self mulching clays and three groundwater outflow
rates of the underlying aquifers (0.2, 0.5 and 1.0 ML/ha)
ratios of an optimal mix of rice and lucerne crops were
determined to keep water tables and average soil salinity
changes less than 0 m/year and 0.015 dS/m, respectively.
The groundwater salinity was assumed as 4 dS/m. For
these scenarios irrigation levels of 14 ML/ha for rice and
8 ML/ha for lucerne was assumed.
Figure 8 shows that the optimum cropping ratio is
affected by the depth to water table and groundwater out-
flow rates. For a given groundwater outflow rate the lu-
cerne/rice ratio increases from 2 to 3 m depth and then it
decreases from 3 to 5 m. This is due to higher capillary
upflow by lucerne for depths less than 3 m and greater soil
storage capacity below 3 m depth. For lower regional
groundwater outflow rates higher lucerne/rice area ratios
are required e.g. for a 3 m depth to the water table, area of
lucerne required to match the net groundwater rise caused
by 1 ha of rice is 1.27, 2.45 and 3.55 ha for 1, 0.5 and
0.2 ML/ha groundwater outflow, respectively.
Rice with wheat
An optimal mix of rice and wheat crops were also deter-
mined to keep water tables and average soil salinity changes
less than 0 m/year and 0.015 dS/m, respectively using same
conditions as that of rice with lucerne. The irrigation levels
of 14 and 3 ML/ha were, respectively assumed for rice and
wheat. Figure 9 shows that the optimum cropping ratio is
affected by the depth to water table and regional ground-
water outflow rates in a similar fashion as for rice with
lucerne. For example, for a 2 m depth to the water table,
area of wheat required to match the net groundwater change
caused by 1 ha of rice is 2.6 ha, and 5.2 ha for 0.5 and
0.2 ML/ha groundwater outflow, respectively.
Whole farm water balance approach
The proposed cropping scenarios were modelled for two
soil types (self mulching clays and transitional red brown
earths), two rainfall patterns (fifth and seventh decile
bands), two groundwater depths (1 and 3 m) and three
groundwater outflow rates (0.2, 0.5 and 1 ML/ha)
(10 · 2 · 2 · 2 · 3 = 240 model runs) to explore effect of
different factors on net recharge and salinity changes. This
analysis is based on irrigation water use provided in Ta-
ble 4.
Overall similar net recharge and salinity trends were
observed for both soil types with higher net recharge values
for the transitional red brown earths. The results for these
scenarios for fifth decile are given in Tables 5 and 6 and
summarized below for three groundwater outflow based
zones of CIA.
Implications for Southern CIA
For 0.2 ML/ha groundwater outflow (typical for the
Southern CIA) all scenarios result in a net positive recharge
except Scenario 7 with 50 ha rice–wheat rotation, 19 ha
rice, 25 ha of lucerne and 136 ha of fallow land. The first
five scenarios with 69 ha of rice crops without a crop after
rice result in the higher rates of groundwater recharge. For
1 m depth to water table there is a net accumulation of salt
resulting in 0.4–0.7 dS/m increase in groundwater salinity.
For the deeper groundwater depths the net recharge is able
to keep the root zone free of salts. Scenarios 8, 9 and 10
show Corn–Wheat rotation is a better option in terms of
relatively less recharge (still the recharge is around 1 ML/
ha) however, there is a greater risk of salinisation if the
water table is at 1 m depth from the ground surface.
0
1
2
3
4
5
6
0 0.5 1 1.5 2 2.5 3 3.5 4
Lucerne/Rice Ratio D
epth
to
Wat
erta
ble
(m)
1 ML/ha0.5 ML/ha0.2 ML/ha
Fig. 8 Lucerne/rice ratio at different depths to water table
0
0.5
1
1.5
2
2.5
3
3.5
4
4.5
0 2 4 6 8 10
Wheat/Rice Ratio
Dep
th t
o W
ater
tab
le (
m)
0.5 ML/ha0.2 ML/ha
Fig. 9 Wheat/rice ratio at different depths to water table
148 Paddy Water Environ (2007) 5:143–152
123

Ta
ble
5W
ater
tab
lean
dsa
lin
ity
imp
acts
of
dif
fere
nt
rice
gro
win
gsc
enar
ios
for
tran
siti
on
alre
db
row
nE
arth
soil
su
sin
gfi
fth
dec
ile
ban
dfo
rra
infa
lld
ata
Sce
nar
io(T
ota
l
farm
area
:2
30
ha)
Dep
tho
f
wat
erta
ble
(m)
Net
rech
arg
e/d
isch
arg
e
du
rin
gth
ecr
op
pin
gse
aso
n
(ML
)
Net
rech
arg
ed
uri
ng
the
fall
ow
seas
on
(ML
/ha)
Sal
tb
rou
gh
tin
fro
m
irri
gat
ion
(to
ns)
Net
salt
accu
mu
lati
on
into
roo
tzo
ne
(to
ns)
Av
eW
Tch
ang
e
un
der
Lan
du
se(m
)
Av
esa
lin
ity
con
cch
ang
e
un
der
lan
du
se(d
S/m
)
Lea
kag
e@
Lea
kag
e@
0.2
(ML
/
ha)
0.5
(ML
/
ha)
@1
.0
(ML
/ha)
0.2
(ML
/
ha)
0.5
(ML
/
ha)
1.0
(ML
/
ha)
11
17
6.6
10
8–
70
.80
.50
.01
06
.04
86
.2–
1.0
0.8
32
59
.81
91
76
1.1
0.8
0.3
10
6.0
4.8
0.6
0.0
21
35
5.1
28
61
71
1.5
1.2
0.7
16
3.6
18
4.2
0.2
0.3
32
62
.21
93
78
1.1
0.8
0.3
16
3.6
44
.80
.90
.0
31
12
1.0
52
–6
30
.50
.2–
0.3
13
2.4
66
1.9
–1
.21
.1
32
69
.82
01
86
1.2
0.9
0.4
13
2.4
30
.40
.60
.0
41
22
3.8
15
54
01
0.7
0.2
16
1.2
51
0.4
–0
.60
.8
32
62
.21
93
78
1.1
0.8
0.3
16
1.2
43
.20
.90
.0
51
32
1.5
25
31
38
1.4
1.1
0.6
14
9.2
33
5.2
–0
.40
.5
33
23
.82
55
14
01
.41
.10
.61
49
.28
.51
.10
.0
61
93
.82
5–
90
0.4
0.1
–0
.41
68
.43
35
.2–
0.4
0.5
31
70
.01
01
–1
40
.70
.4–
0.1
16
8.4
3.3
1.4
0.0
71
–2
25
.1–
29
4–
40
9–
1.0
–1
.3–
1.8
13
2.4
73
7.4
–1
.51
.2
34
2.0
–2
7–
14
20
.2–
0.1
–0
.61
32
.41
6.8
0.6
0.0
81
58
7.3
51
84
03
2.6
2.3
1.8
19
2.0
90
.60
.60
.1
34
66
.03
97
28
22
.01
.71
.21
92
.00
.92
.60
.0
91
28
7.6
21
91
04
1.3
1.0
0.5
15
3.6
90
.60
.60
.1
32
10
.01
41
26
0.9
0.6
0.1
15
3.6
58
.21
.10
.0
10
1–
14
.0–
83
–1
98
–0
.1–
0.4
–0
.91
24
.83
91
.7–
0.6
0.6
3–
13
.8–
83
–1
98
–0
.1–
0.4
–0
.91
24
.83
.84
0.7
0.0
Neg
ativ
ew
ater
tab
lech
ang
es(d
raw
do
wn
)re
flec
tw
ater
tab
lech
ang
esd
ue
toca
pil
lary
up
flo
wre
spo
nse
s.W
hen
the
wat
erta
ble
sar
ew
ith
in1
mfr
om
the
surf
ace
they
wil
lfl
uct
uat
eb
etw
een
1an
d2
m
Paddy Water Environ (2007) 5:143–152 149
123

Ta
ble
6W
ater
tab
lean
dsa
lin
ity
imp
acts
of
dif
fere
nt
rice
gro
win
gsc
enar
ios
for
self
mu
lch
ing
clay
soil
su
sin
gfi
fth
dec
ile
ban
dfo
rra
infa
lld
ata
Sce
nar
io(t
ota
l
farm
:2
30
ha)
Dep
tho
fW
ater
Tab
le(m
)
Net
rech
arg
e/d
isch
arg
e
un
der
the
cro
pp
ing
seas
on
(ML
)
Net
rech
arg
eu
nd
erfa
llo
w
seas
on
(ML
/ha)
Sal
tfr
om
irri
gat
ion
(to
ns)
Net
salt
into
roo
t
zon
e(t
on
s)
Av
eW
Tch
ang
eu
nd
er
lan
du
se(m
)
Av
esa
ltco
nc
chan
ge
un
der
lan
du
se(d
S/m
)
Lea
kag
e@
Lea
kag
e
0.2
(ML
/ha)
0.5
(ML
/
ha)
1.0
(ML
/
ha)
0.2
(ML
/
ha)
0.5
(ML
/
ha)
1.0
(ML
/
ha)
11
29
4.1
22
51
10
1.3
1.0
0.5
10
6.0
48
5.2
–1
.00
.8
33
42
.72
74
15
91
.51
.20
.71
06
.03
.80
.60
.0
21
38
8.3
30
21
87
1.6
1.3
0.8
14
2.0
25
9.1
–0
.20
.5
33
75
.02
89
17
41
.61
.30
.81
42
.02
4.8
0.9
0.0
31
22
1.1
15
23
71
.00
.70
.21
25
.25
25
.7–
0.8
0.9
33
42
.72
74
15
91
.51
.20
.71
25
.22
3.0
0.8
0.0
41
40
0.7
33
22
17
1.7
1.4
0.9
16
1.2
51
0.4
–0
.50
.8
33
88
.83
20
20
51
.71
.40
.91
61
.24
4.0
0.7
0.0
51
44
8.9
38
02
65
2.0
1.7
1.2
14
9.2
35
4.8
–0
.40
.6
34
51
.83
83
26
82
.01
.71
.21
49
.22
2.4
1.0
0.0
61
18
8.5
12
05
0.8
0.5
0.0
16
8.4
33
4.5
–0
.40
.5
32
52
.81
84
69
1.1
0.8
0.3
16
8.4
2.6
1.4
0.0
71
–1
23
.9–
19
3–
30
8–
0.5
–0
.8–
1.3
13
2.4
73
6.4
–1
.51
.2
36
4.8
–4
–1
19
0.3
0.0
–0
.51
32
.41
5.8
0.6
0.0
81
71
8.7
65
05
35
3.1
2.8
2.3
19
2.0
90
.40
.60
.1
37
06
.06
37
52
23
.12
.82
.31
92
.00
.72
.60
.0
91
45
2.8
38
42
69
2.0
1.7
1.2
15
3.6
90
.40
.60
.1
33
57
.62
89
17
41
.61
.30
.81
53
.66
0.7
1.1
0.0
10
11
27
.05
8–
57
0.6
0.3
–0
.21
24
.83
91
.8–
1.5
0.6
31
06
.23
7–
78
0.5
0.2
–0
.31
24
.86
7.9
–0
.10
.0
Neg
ativ
ew
ater
tab
lech
ang
es(d
raw
do
wn
)re
flec
tw
ater
tab
lech
ang
esd
ue
toca
pil
lary
up
flo
wre
spo
nse
s.W
hen
the
wat
erta
ble
sar
ew
ith
in1
mfr
om
the
surf
ace
they
wil
lfl
uct
uat
eb
etw
een
1an
d2
m
150 Paddy Water Environ (2007) 5:143–152
123

Implications for central and western CIA
The 0.5 ML/ha regional groundwater outflow rate is quite
typical for the central and western parts of the CIA. The
best cropping option to control groundwater recharge ap-
pears to be Scenario 7 with 3 m depth to water table with
the lowest net recharge and net increase in salinity. Other
options such as scenario 10 with a corn–wheat rotation
again gives lower net recharge (0.4–0.6 ML/ha). All other
options result in net recharge greater than 0.7 ML/ha.
Implications for Northern CIA
The regional groundwater outflow rates of 1 ML/ha and
water table depth of 3 m roughly represent the groundwater
conditions in the Northern CIA. For these conditions
cropping scenarios 7 and 10 result in lowest net recharge
(–0.3 and 0.1 ML/ha). In this region if rice–wheat rotation
with some area under lucerne or a corn–wheat rotation is
practiced the net recharge can be reduced to below or very
close to the target levels.
The above scenarios were repeated using the same
parameters for crop mix, irrigation requirements and soil
properties for above average rainfall scenario (seventh
decile) and average irrigation levels provided in Table 4.
The results (not shown here) reveal that if the actual irri-
gation levels can be decreased (e.g. rice water use to
around 12 ML/ha or corn to 8 ML/ha) many of the studied
scenarios will achieve a net recharge balance under above
average rainfall years.
Conclusions
The ponded rice fields cause saturation of underlying soils
and recharge to the water table. The equivalent cropping
area concept involves recharge mitigation through the use
of discharging crops such as lucerne, which is a deep-
rooted perennial crop, to provide a dewatering buffer
around the rice growing areas. The modelling results show
that it is possible to determine optimal mix of rice/lucerne
and rice/wheat crops to keep water tables and average soil
salinity changes less than 0 m/year and 0.015 dS/m,
respectively using median rainfall and evapo-transpiration
values. Initial water table depth and the regional ground-
water outflow capacity are the key factors determining area
of deep rooted vegetation required to mitigate groundwater
recharge from 1 ha of rice. For lower regional groundwater
outflow rates higher lucerne/rice area ratios are required
e.g. for a 3 m depth to the water table, area of lucerne
required to match the net groundwater change caused by
1 ha of rice is 1.27, 2.45 and 3.55 ha for 1, 0.5 and 0.2 ML/
ha groundwater outflow, respectively. Similarly for lower
regional groundwater outflow rates higher wheat/rice area
ratios are required e.g. for a 2 m depth to the water table,
area of wheat required to match the net groundwater
change caused by 1 ha of rice is 2.6 ha, and 5.2 ha for 0.5
and 0.2 ML/ha groundwater outflow, respectively.
An alternative to the equivalent crop area approach is to
achieve whole farm water balance. In this paper ten crop-
ping scenarios were modelled for two soil types (self
mulching clays and transitional red brown earths), two
rainfall patterns (fifth and seventh decile bands), two
groundwater depths and three groundwater flow rates to
explore effect of different factors on net recharge and
salinity changes. Comparative analysis of these scenarios
suggests it is possible to control net recharge under average
rainfall and water allocation years using a suitable cropping
mix e.g. 50 ha of rice–wheat rotation, 19 ha rice, 25 ha of
lucerne.
Acknowledgments Project funding from the Coleambally Irrigation
Cooperative Limited is acknowledged. Inputs from the Coleambally
Irrigation Cooperative Limited Environmental Committee provided
useful sensibility checks for this work.
References
Beecher HG (2005) Better prediction of groundwater recharge from
rice growing, Research Report No. P1102FR09-05 Cooperative
Research Centre for Sustainable Rice Production. Yanco Agri-
cultural Institute, Yanco, ISBN 1876903440
Beecher HG, Hume IH, Dunn BW (2002) Improved method for
assessing rice soil suitability to restrict recharge. Aust J Exp
Agric 42:297–307
Gibbs WJ, Maher JV (1967), Rainfall deciles as drought indicators.
Commonwealth of Australia, Bureau of Meteorology, Mel-
bourne, Bulletin No. 48
Humphreys E, Van der Lelij A, Muirhead WA, Hoey D (1994) The
development of environmental restrictions for rice growing in
New South Wales. Aust J Soil Water Conserv 7(2):11–20
Humphreys E, Lewin LG, Khan S, Beecher HG, Lacy JM, Thompson
JA, Batten GD, Brown A, Russell CA, Christen EW, Dunn BW
(2006) Integration of approaches to increasing water use
efficiency in rice-based systems in southeast Australia. Field
Crops Res 97:19–33
Khan S (2005) Rethinking Rational Solutions for Irrigation Salinity.
Aust J Water Resour Special Issue on Salinity Eng 9(2):129–140
Khan S, Xevi E, Meyer WS (2003) Salt, water and groundwater
management models to determine sustainable cropping patterns
in shallow saline groundwater regions—special volume of the
journal of crop production titled crop production in saline
environments. Co-published simultaneously In: Goyal SS, Shar-
ma SK, Williams D (eds) Crop production in saline environ-
ments, global and integrative perspectives, Haworth Press, pp
325–340
Khan S, Rana T, Yuanli C, Blackwell J (2006) Can irrigation be
sustainable? Agric Water Manage 80:87–99
Khan S, O’Connell N, Rana T, Xevi E (2007) Hydrologic-economic
model for managing irrigation intensity in irrigation areas for
water table and soil salinity targets. Environ Model Assess.
Paddy Water Environ (2007) 5:143–152 151
123

doi: 10.1007/s10666-006-9081-3. http://www.dx.doi.org/
10.1007/s10666-006-9081-3
Leslie D (1992) Rice 2000: environmental policy paper, Dwyer Leslie
Pty Ltd, Canberra
Van der Lelij A, Talsma T (1978) Infiltration and water movement in
Riverina plain soils used for ricegrowing. In: Storrier RR, Kelly ID
(eds) Hydrogeology of the Riverina Plain of south-east. Australian
Society of Soil Science Inc., Riverina Branch, pp 89–98
152 Paddy Water Environ (2007) 5:143–152
123
Copyright © 2022 FDOKUMEN