Naida District (9 Blocks) - Central Ground Water Board (CGWB)
Upload
khangminh22Category
view
1download
0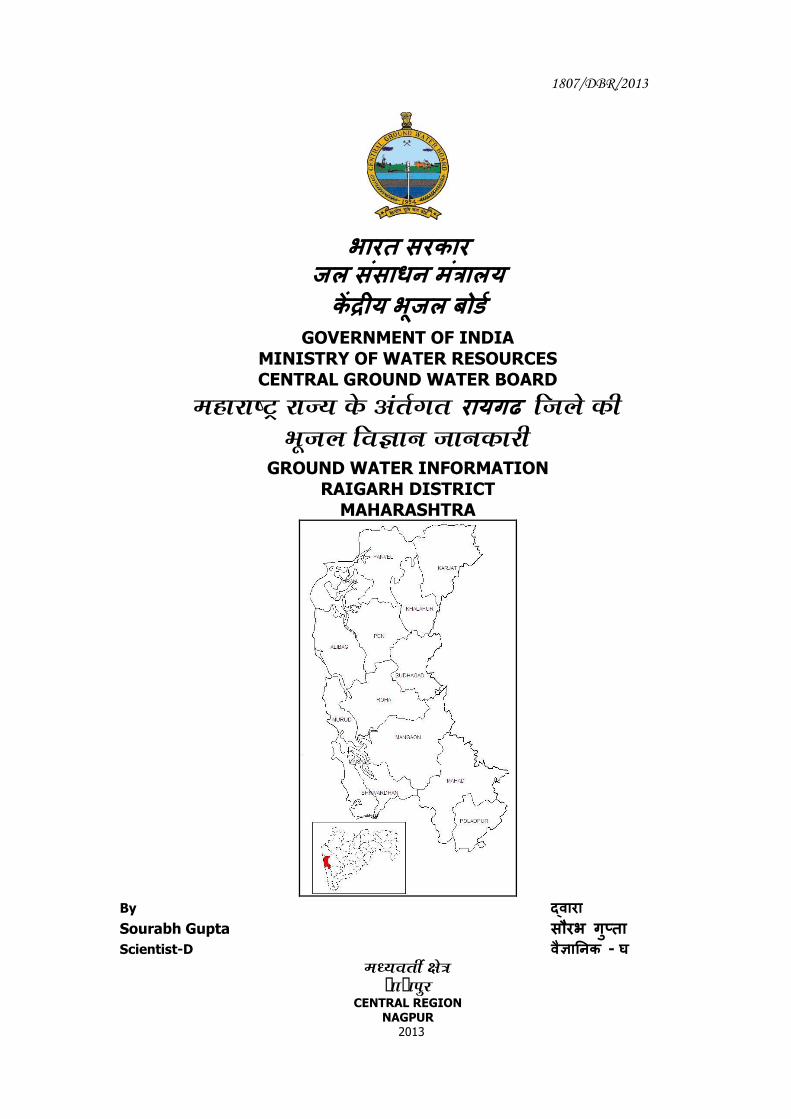
1807/DBR/2013
भारत सरकार
जल संसाधन मंत्रालय
कें द्रीय भूजल बोर्ड GOVERNMENT OF INDIA
MINISTRY OF WATER RESOURCES
CENTRAL GROUND WATER BOARD
´ÖÆüÖ¸üÖ™Òü ¸üÖ•µÖ �êú †ÓŸÖÔ�ÖŸÖ रायगढ וֻÖê �úß
³Öæ•Ö»Ö ×¾Ö–ÖÖÖ •ÖÖÖ�úÖ¸üß GROUND WATER INFORMATION
RAIGARH DISTRICT MAHARASHTRA
By द्वारा Sourabh Gupta सौरभ गुप्ता
Scientist-D वजै्ञाननक - घ
´Ö¬µÖ¾ÖŸÖá �Öê¡Ö
ÖÖ•Ö¯Öã ü̧ CENTRAL REGION
NAGPUR 2013
i
RAIGARH DISTRICT AT A GLANCE 1. GENERAL INFORMATION Geographical Area : 7152 sq. km Administrative Divisions
(As on 31/03/2007) Taluka – 15; Alibagh, Panvel, Uran,
Karjat, Khalapur, Pen, Sudhagad, Mahad, Roha, Mangaon, Poladpur, Mhasala, Shriwardhan, Murud and Tala
Villages : 1919 Population : 22,07,929 Normal Annual Rainfall : 2200 mm to 5000 mm 2. GEOMORPHOLOGY Major Physiographic unit : 3; Eastern Sahayadri Hilly zone, Central
low lying fertile zone, Coastal zone. Major Drainage : 4; Ulhas, Patalganga, Kundalika and
Savitri 3. LAND USE (2000-01) Forest Area : 1486 sq. km Net Area Sown : 1356 sq. km Cultivable Area : 3286 sq. km 4. SOIL TYPE Medium Black and Deep Black soil. 5. PRINCIPAL CROPS (2000-01) Rice : 1350 sq. km. Pulses : 134 sq. km. Mango : 131 sq. km. Oil Seeds : 40 sq. km. 6. IRRIGATION BY DIFFERENT SOURCES (2006-07) – Nos. / Potential Created (ha) No of Dugwells (irrigation) : 4606 / 5278 No of Tubewells / Borewells : 427 / 826 Surface Flow Schemes : 288 / 1522 Surface Lift Irrigation Schemes : 1104 / 4705 Total Irrigation Potential Created : 12331 ha 7. GROUND WATER MONITORING WELLS (As on 31/05/2007) Dugwells : 28 8. GEOLOGY Pleistocene – Recent : Alluvium Upper Cretaceous-Lower Eocene : Basalt (Deccan Traps) 9. HYDROGEOLOGY Water Bearing Formation : Basalt- weathered/fractured/ jointed
vesicular/massive, under phreatic condition and semi-confined to confined conditions. Alluvium- Sand and Gravel, under phreatic condition.
Premonsoon Depth to Water Level (May-2011)
: 0.95to 7.70 m bgl
Postmonsoon Depth to Water Level (Nov.-2011)
: 1.10 to 4.05 m bgl
Premonsoon Water Level Trend (2001-2010)
: Rise : Negligible to 0.27 m/year Fall : Negligible to 0.25 m/year
ii
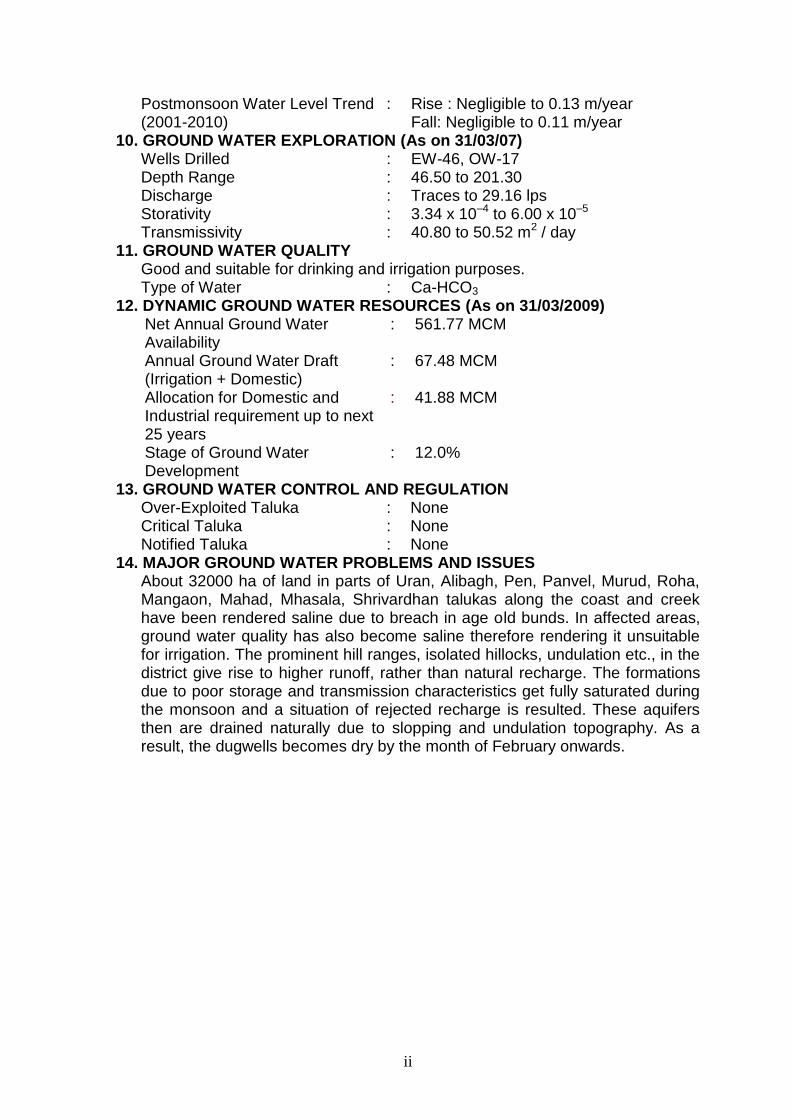
Postmonsoon Water Level Trend (2001-2010)
: Rise : Negligible to 0.13 m/year Fall: Negligible to 0.11 m/year
10. GROUND WATER EXPLORATION (As on 31/03/07) Wells Drilled : EW-46, OW-17 Depth Range : 46.50 to 201.30 Discharge : Traces to 29.16 lps Storativity : 3.34 x 10⁻⁴ to 6.00 x 10⁻⁵ Transmissivity : 40.80 to 50.52 m2 / day 11. GROUND WATER QUALITY Good and suitable for drinking and irrigation purposes. Type of Water : Ca-HCO3 12. DYNAMIC GROUND WATER RESOURCES (As on 31/03/2009) Net Annual Ground Water
Availability : 561.77 MCM
Annual Ground Water Draft (Irrigation + Domestic)
: 67.48 MCM
Allocation for Domestic and Industrial requirement up to next 25 years
: 41.88 MCM
Stage of Ground Water Development
: 12.0%
13. GROUND WATER CONTROL AND REGULATION Over-Exploited Taluka : None Critical Taluka : None Notified Taluka : None 14. MAJOR GROUND WATER PROBLEMS AND ISSUES About 32000 ha of land in parts of Uran, Alibagh, Pen, Panvel, Murud, Roha,
Mangaon, Mahad, Mhasala, Shrivardhan talukas along the coast and creek have been rendered saline due to breach in age old bunds. In affected areas, ground water quality has also become saline therefore rendering it unsuitable for irrigation. The prominent hill ranges, isolated hillocks, undulation etc., in the district give rise to higher runoff, rather than natural recharge. The formations due to poor storage and transmission characteristics get fully saturated during the monsoon and a situation of rejected recharge is resulted. These aquifers then are drained naturally due to slopping and undulation topography. As a result, the dugwells becomes dry by the month of February onwards.
Ground Water Information Raigarh District
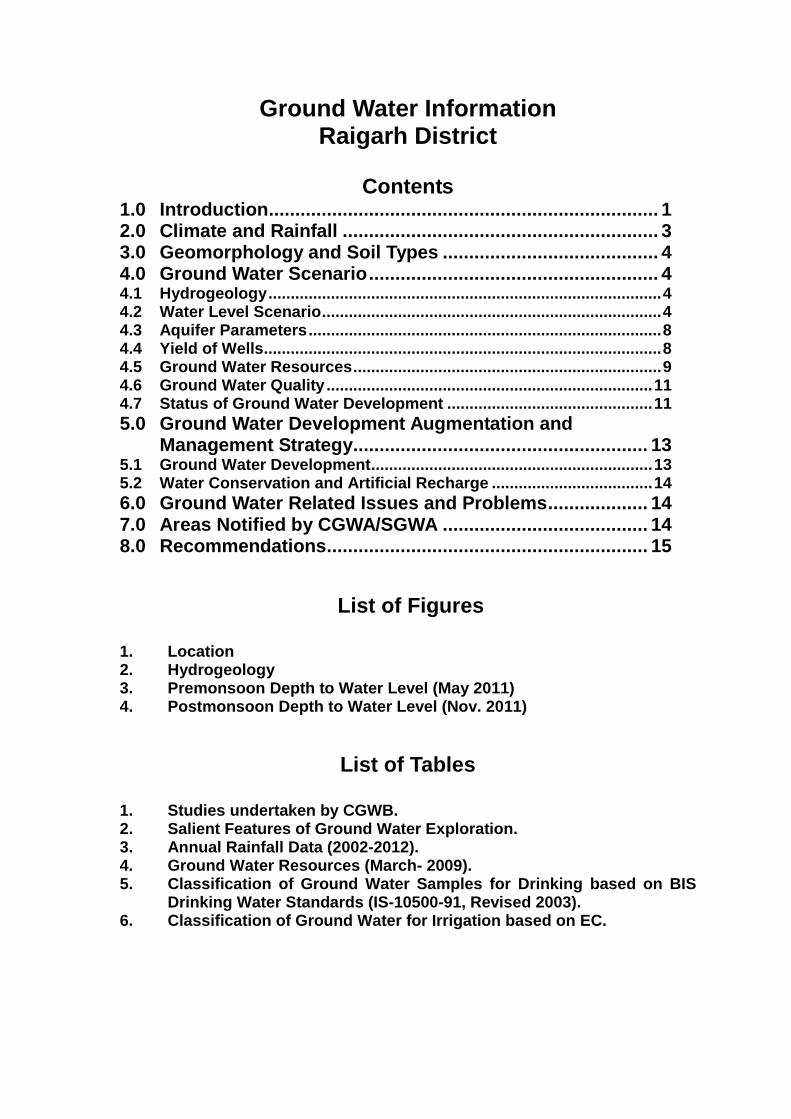
Contents
1.0 Introduction .......................................................................... 1
2.0 Climate and Rainfall ............................................................ 3
3.0 Geomorphology and Soil Types ......................................... 4
4.0 Ground Water Scenario ....................................................... 4
4.1 Hydrogeology ........................................................................................ 4 4.2 Water Level Scenario ............................................................................ 4 4.3 Aquifer Parameters ............................................................................... 8 4.4 Yield of Wells ......................................................................................... 8 4.5 Ground Water Resources ..................................................................... 9 4.6 Ground Water Quality ......................................................................... 11 4.7 Status of Ground Water Development .............................................. 11
5.0 Ground Water Development Augmentation and Management Strategy ........................................................ 13
5.1 Ground Water Development ............................................................... 13 5.2 Water Conservation and Artificial Recharge .................................... 14
6.0 Ground Water Related Issues and Problems ................... 14
7.0 Areas Notified by CGWA/SGWA ....................................... 14
8.0 Recommendations ............................................................. 15
List of Figures
1. Location 2. Hydrogeology 3. Premonsoon Depth to Water Level (May 2011) 4. Postmonsoon Depth to Water Level (Nov. 2011)
List of Tables
1. Studies undertaken by CGWB. 2. Salient Features of Ground Water Exploration. 3. Annual Rainfall Data (2002-2012). 4. Ground Water Resources (March- 2009). 5. Classification of Ground Water Samples for Drinking based on BIS
Drinking Water Standards (IS-10500-91, Revised 2003). 6. Classification of Ground Water for Irrigation based on EC.
1
Ground Water Information
Raigarh District
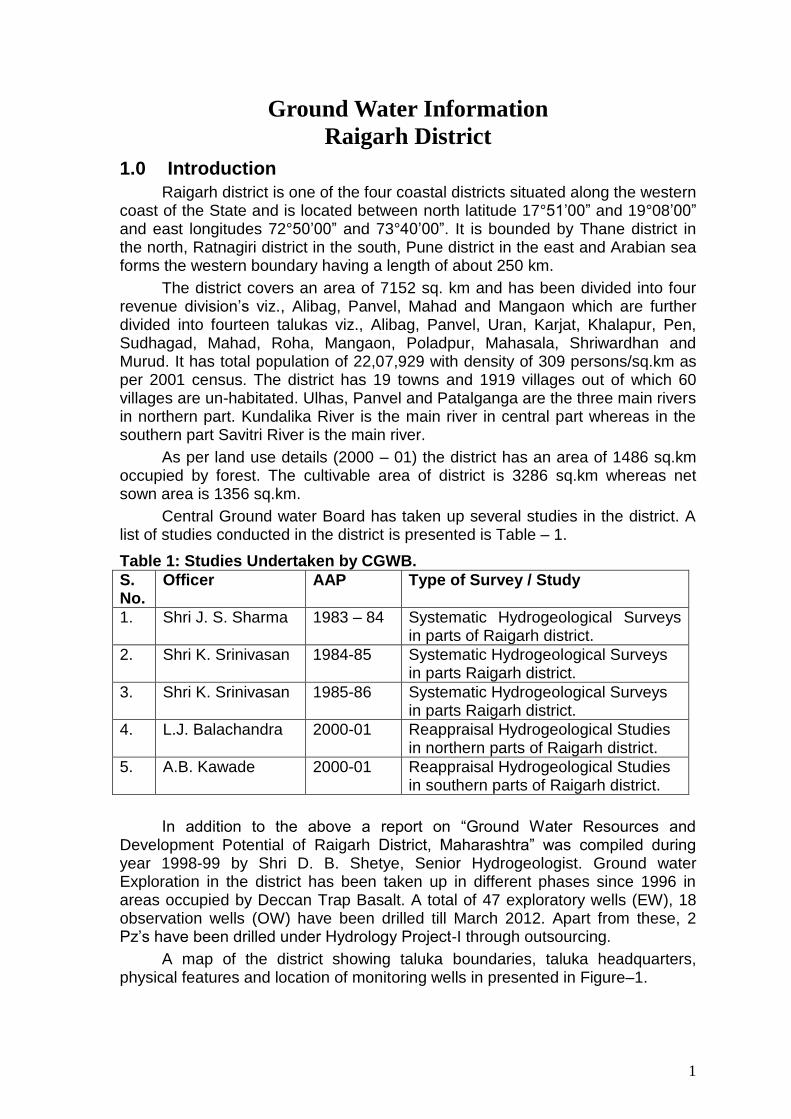
1.0 Introduction
Raigarh district is one of the four coastal districts situated along the western coast of the State and is located between north latitude 17°51’00” and 19°08’00” and east longitudes 72°50’00” and 73°40’00”. It is bounded by Thane district in the north, Ratnagiri district in the south, Pune district in the east and Arabian sea forms the western boundary having a length of about 250 km.
The district covers an area of 7152 sq. km and has been divided into four revenue division’s viz., Alibag, Panvel, Mahad and Mangaon which are further divided into fourteen talukas viz., Alibag, Panvel, Uran, Karjat, Khalapur, Pen, Sudhagad, Mahad, Roha, Mangaon, Poladpur, Mahasala, Shriwardhan and Murud. It has total population of 22,07,929 with density of 309 persons/sq.km as per 2001 census. The district has 19 towns and 1919 villages out of which 60 villages are un-habitated. Ulhas, Panvel and Patalganga are the three main rivers in northern part. Kundalika River is the main river in central part whereas in the southern part Savitri River is the main river.
As per land use details (2000 – 01) the district has an area of 1486 sq.km occupied by forest. The cultivable area of district is 3286 sq.km whereas net sown area is 1356 sq.km.
Central Ground water Board has taken up several studies in the district. A list of studies conducted in the district is presented is Table – 1.
Table 1: Studies Undertaken by CGWB.
S. No.
Officer AAP Type of Survey / Study
1. Shri J. S. Sharma 1983 – 84 Systematic Hydrogeological Surveys in parts of Raigarh district.
2. Shri K. Srinivasan 1984-85 Systematic Hydrogeological Surveys in parts Raigarh district.
3. Shri K. Srinivasan 1985-86 Systematic Hydrogeological Surveys in parts Raigarh district.
4. L.J. Balachandra 2000-01 Reappraisal Hydrogeological Studies in northern parts of Raigarh district.
5. A.B. Kawade 2000-01 Reappraisal Hydrogeological Studies in southern parts of Raigarh district.
In addition to the above a report on “Ground Water Resources and Development Potential of Raigarh District, Maharashtra” was compiled during year 1998-99 by Shri D. B. Shetye, Senior Hydrogeologist. Ground water Exploration in the district has been taken up in different phases since 1996 in areas occupied by Deccan Trap Basalt. A total of 47 exploratory wells (EW), 18 observation wells (OW) have been drilled till March 2012. Apart from these, 2 Pz’s have been drilled under Hydrology Project-I through outsourcing.
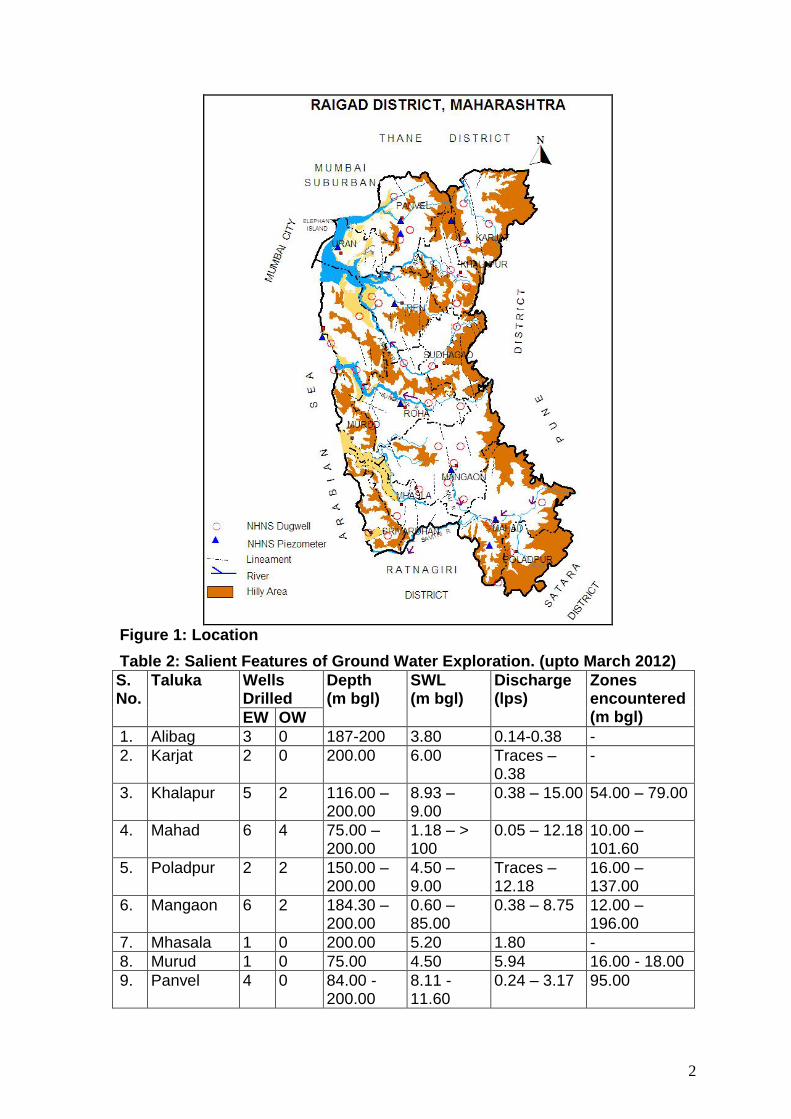
A map of the district showing taluka boundaries, taluka headquarters, physical features and location of monitoring wells in presented in Figure–1.
2
Figure 1: Location
Table 2: Salient Features of Ground Water Exploration. (upto March 2012)
S. No.
Taluka Wells Drilled
Depth (m bgl)
SWL (m bgl)
Discharge (lps)
Zones encountered (m bgl) EW OW
1. Alibag 3 0 187-200 3.80 0.14-0.38 -
2. Karjat 2 0 200.00 6.00 Traces – 0.38
-
3. Khalapur 5 2 116.00 – 200.00
8.93 – 9.00
0.38 – 15.00 54.00 – 79.00
4. Mahad 6 4 75.00 – 200.00
1.18 – > 100
0.05 – 12.18 10.00 – 101.60
5. Poladpur 2 2 150.00 – 200.00
4.50 – 9.00
Traces – 12.18
16.00 – 137.00
6. Mangaon 6 2 184.30 – 200.00
0.60 –85.00
0.38 – 8.75 12.00 – 196.00
7. Mhasala 1 0 200.00 5.20 1.80 -
8. Murud 1 0 75.00 4.50 5.94 16.00 - 18.00
9. Panvel 4 0 84.00 -200.00
8.11 -11.60
0.24 – 3.17 95.00
3
10. Pen 4 3 93.00 – 175.00
2.69 – 16.69
0.14 – 29.16 79.00 – 172.00
11. Poladpur 2 2 150.00 – 200.00
4.50 – 9.00
3.77 – 12.18 16.00 – 137.00
12. Roha 7 2 140.60 – 201.30
1.00 – > 50.00
Traces – 12.18
7.00 – 184.00
13. Sudhagarh (Pali)
2 1 46.50 – 145.50
2.35 – 4.92
0.38 – 7.76 17.00 – 139.00
14. Tala 2 0 193.30 – 200.00
6.20 – 6.32
0.78 – 2.16 10 - 150
Total 47 18 46.50-201.30
0.60 - >85.00
Traces to 29.16
12.00 – 196.00
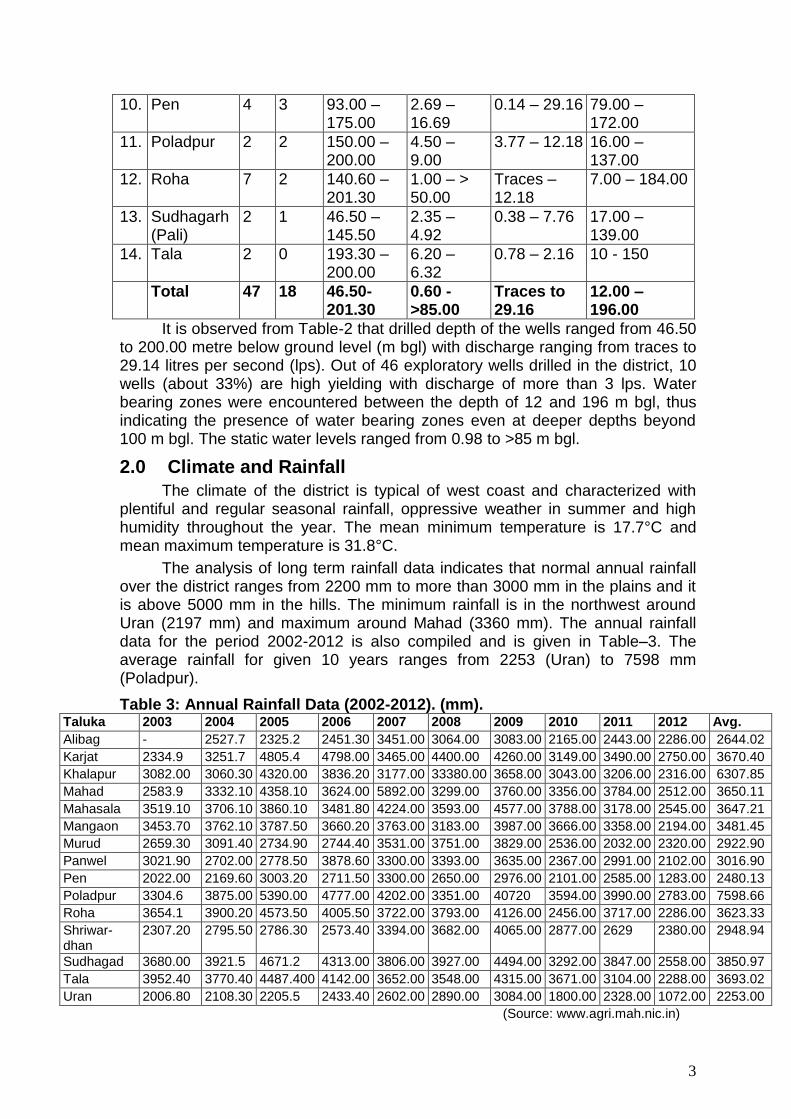
It is observed from Table-2 that drilled depth of the wells ranged from 46.50 to 200.00 metre below ground level (m bgl) with discharge ranging from traces to 29.14 litres per second (lps). Out of 46 exploratory wells drilled in the district, 10 wells (about 33%) are high yielding with discharge of more than 3 lps. Water bearing zones were encountered between the depth of 12 and 196 m bgl, thus indicating the presence of water bearing zones even at deeper depths beyond 100 m bgl. The static water levels ranged from 0.98 to >85 m bgl.
2.0 Climate and Rainfall
The climate of the district is typical of west coast and characterized with plentiful and regular seasonal rainfall, oppressive weather in summer and high humidity throughout the year. The mean minimum temperature is 17.7°C and mean maximum temperature is 31.8°C.
The analysis of long term rainfall data indicates that normal annual rainfall over the district ranges from 2200 mm to more than 3000 mm in the plains and it is above 5000 mm in the hills. The minimum rainfall is in the northwest around Uran (2197 mm) and maximum around Mahad (3360 mm). The annual rainfall data for the period 2002-2012 is also compiled and is given in Table–3. The average rainfall for given 10 years ranges from 2253 (Uran) to 7598 mm (Poladpur).
Table 3: Annual Rainfall Data (2002-2012). (mm). Taluka 2003 2004 2005 2006 2007 2008 2009 2010 2011 2012 Avg.
Alibag - 2527.7 2325.2 2451.30 3451.00 3064.00 3083.00 2165.00 2443.00 2286.00 2644.02
Karjat 2334.9 3251.7 4805.4 4798.00 3465.00 4400.00 4260.00 3149.00 3490.00 2750.00 3670.40
Khalapur 3082.00 3060.30 4320.00 3836.20 3177.00 33380.00 3658.00 3043.00 3206.00 2316.00 6307.85
Mahad 2583.9 3332.10 4358.10 3624.00 5892.00 3299.00 3760.00 3356.00 3784.00 2512.00 3650.11
Mahasala 3519.10 3706.10 3860.10 3481.80 4224.00 3593.00 4577.00 3788.00 3178.00 2545.00 3647.21
Mangaon 3453.70 3762.10 3787.50 3660.20 3763.00 3183.00 3987.00 3666.00 3358.00 2194.00 3481.45
Murud 2659.30 3091.40 2734.90 2744.40 3531.00 3751.00 3829.00 2536.00 2032.00 2320.00 2922.90
Panwel 3021.90 2702.00 2778.50 3878.60 3300.00 3393.00 3635.00 2367.00 2991.00 2102.00 3016.90
Pen 2022.00 2169.60 3003.20 2711.50 3300.00 2650.00 2976.00 2101.00 2585.00 1283.00 2480.13
Poladpur 3304.6 3875.00 5390.00 4777.00 4202.00 3351.00 40720 3594.00 3990.00 2783.00 7598.66
Roha 3654.1 3900.20 4573.50 4005.50 3722.00 3793.00 4126.00 2456.00 3717.00 2286.00 3623.33
Shriwar-dhan
2307.20 2795.50 2786.30 2573.40 3394.00 3682.00 4065.00 2877.00 2629 2380.00 2948.94
Sudhagad 3680.00 3921.5 4671.2 4313.00 3806.00 3927.00 4494.00 3292.00 3847.00 2558.00 3850.97
Tala 3952.40 3770.40 4487.400 4142.00 3652.00 3548.00 4315.00 3671.00 3104.00 2288.00 3693.02
Uran 2006.80 2108.30 2205.5 2433.40 2602.00 2890.00 3084.00 1800.00 2328.00 1072.00 2253.00
(Source: www.agri.mah.nic.in)
4
3.0 Geomorphology and Soil Types
The district has three physiographic divisions i.e. (i) Coastal zone in west covers about 20% percent of the district (ii) Central zone covers about 1/3 rd of the district, consisting of fertile land in low lying area (iii) Hilly zone in the eastern part highly uneven in altitude and covered with forest. This hill range is characterized by ruggedness and uneven topography, with crestline of peaks and saddles forming the eastern horizon. Ulhas, Panvel and Patalganga are the three main rivers in northern part. Kundalika River is the main river in central part whereas in the southern part Savitri River is the main river.
The soils in the district are formed from the Deccan Trap which is predominating rock formation with small out crops of Laterite at a few places in the Poladpur taluka and Matheran hill. The soils are grouped as Forest, Varkas, Rice, Khar or Saline, Coastal Alluvium and Laterite as per the location and topographical situation.
4.0 Ground Water Scenario
4.1 Hydrogeology
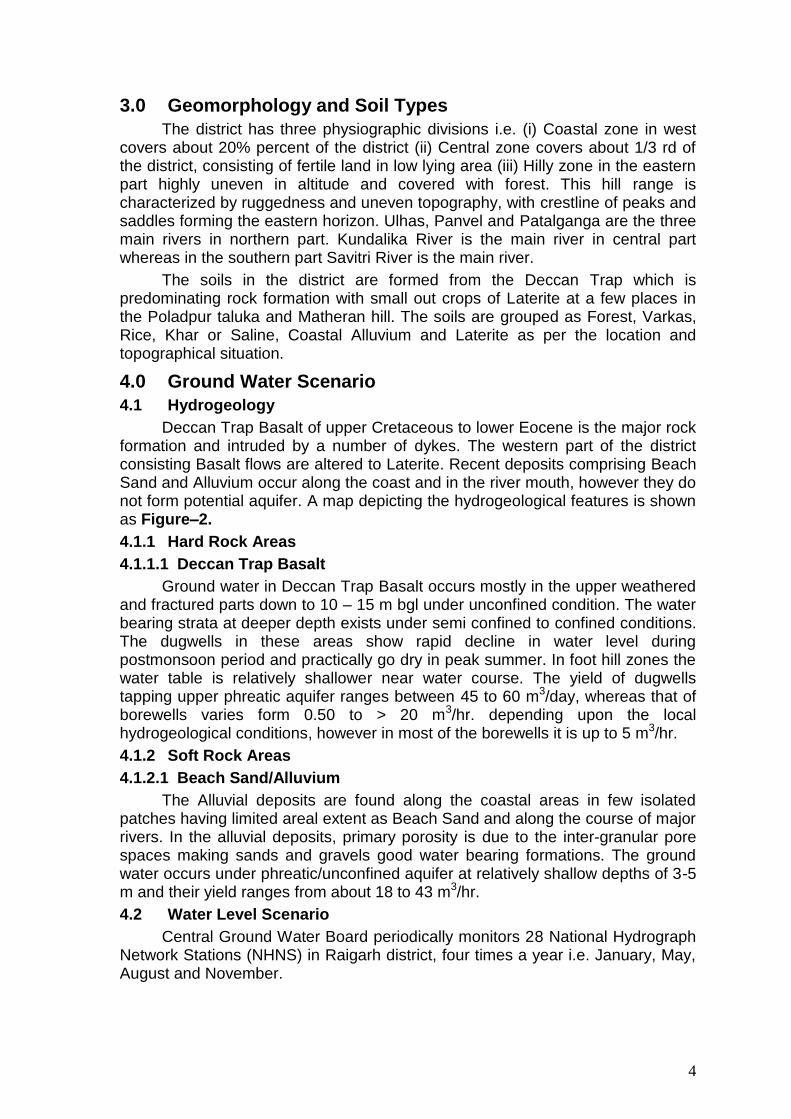
Deccan Trap Basalt of upper Cretaceous to lower Eocene is the major rock formation and intruded by a number of dykes. The western part of the district consisting Basalt flows are altered to Laterite. Recent deposits comprising Beach Sand and Alluvium occur along the coast and in the river mouth, however they do not form potential aquifer. A map depicting the hydrogeological features is shown as Figure–2.
4.1.1 Hard Rock Areas
4.1.1.1 Deccan Trap Basalt
Ground water in Deccan Trap Basalt occurs mostly in the upper weathered and fractured parts down to 10 – 15 m bgl under unconfined condition. The water bearing strata at deeper depth exists under semi confined to confined conditions. The dugwells in these areas show rapid decline in water level during postmonsoon period and practically go dry in peak summer. In foot hill zones the water table is relatively shallower near water course. The yield of dugwells tapping upper phreatic aquifer ranges between 45 to 60 m3/day, whereas that of borewells varies form 0.50 to > 20 m3/hr. depending upon the local hydrogeological conditions, however in most of the borewells it is up to 5 m3/hr.
4.1.2 Soft Rock Areas
4.1.2.1 Beach Sand/Alluvium
The Alluvial deposits are found along the coastal areas in few isolated patches having limited areal extent as Beach Sand and along the course of major rivers. In the alluvial deposits, primary porosity is due to the inter-granular pore spaces making sands and gravels good water bearing formations. The ground water occurs under phreatic/unconfined aquifer at relatively shallow depths of 3-5 m and their yield ranges from about 18 to 43 m3/hr.
4.2 Water Level Scenario
Central Ground Water Board periodically monitors 28 National Hydrograph Network Stations (NHNS) in Raigarh district, four times a year i.e. January, May, August and November.
5
Figure 2: Hydrogeology
4.2.1 Depth to Water Level – Premonsoon (May – 2011)
The depth to water levels in major parts of the district during May 2011 ranges between 0.95 m bgl (Jite) and 7.70 m bgl (Chinchwad). Depth to water levels during premonsoon (May 2007) has been depicted in Figure–3. The water level in major part of the district ranges from 2-5 mbgl. The water level ranging from 5 to 10 mbgl are observed in northern and in southern part of the district i.e around Poladpur, Chandore and Temple also as scattered patches across the district. Shallow water level of less than 2 mbgl are also found across the district as isolated patches.
4.2.2 Depth to Water Level – Postmonsoon (Nov. – 2011)
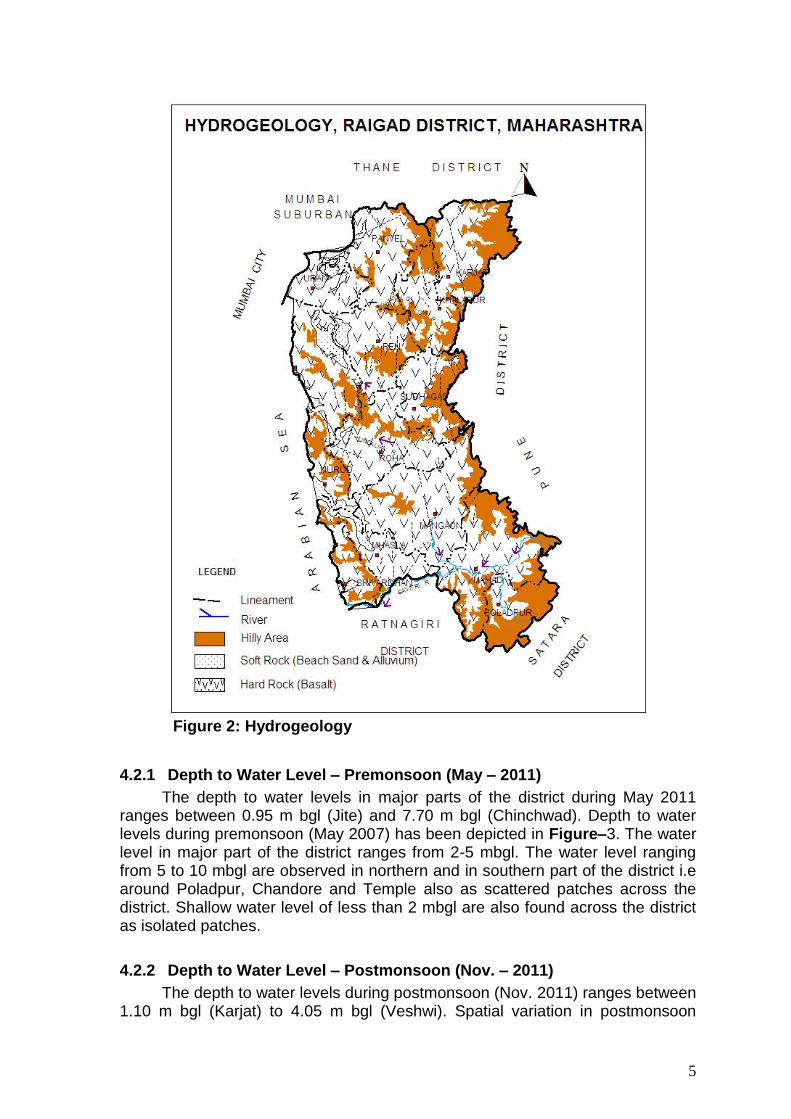
The depth to water levels during postmonsoon (Nov. 2011) ranges between 1.10 m bgl (Karjat) to 4.05 m bgl (Veshwi). Spatial variation in postmonsoon

6
depth to water levels is shown in Figure–4. Water Level of 2-5 metre are seen in major part of the district where shallow water level of less than 2 mbgl are seen in as patches all around the district. Water Level in the range of 10-20 mbgl are seen as patches in central and southern part of the district.
Figure-3: Premonsoon Depth to Water Level (May 2011).
7
Figure-4: Postmonsoon Depth to Water Level (May 2011)
8
4.2.3 Seasonal Water Level Fluctuation (May – Nov. 2011)
The fluctuation between May and Nov, 2011 water levels in the district range from 0.01 (Bijli) to 5.50 m (Chinchwad). In the major part of the district the fluctuation range is less than 2.0 m. The higher fluctuation of more than 2 m is observed in southern part i.e. around Temple, Poladpur and as scattered patches around. Karjat, Chinchwad, and Veswi. The negative fluctuation i.e., fall in postmonsoon period has been observed in the range of 0.12m (Paynod) probably due to supplement well irrigation to paddy crop.
4.2.4 Water Level Trend (2001-2010)
Trend of water levels for premonsoon and postmonsoon periods for last ten year (2002-2011) have been computed for 26 NHNS. Analysis of trend indicated that during pre-monsoon period, rise in water level has been recorded at 5 stations and it ranges between negligible (Kargaon) and 0.27 m/year (Sochinde). Fall in water levels has been observed at 21 stations and it ranges between negligible (Saigaon) and 0.25 m/year (Nagaon). During postmonsoon period, rise in water levels is observed at 11 stations and it ranges from negligible (Dapoli) to 0.13 m/year (Khutal), whereas the fall is observed at 15 stations and it ranges from negligible (Kargaon) to 0.11 m/year (Saigaon, Golwadi). Thus in major parts of the district decline in water levels both during premonsoon and postmonsoon is observed.
4.3 Aquifer Parameters
Based on the exploratory drilling in the district aquifer parameters like transmissivity and storativity of the deeper aquifer in basaltic terrain varies from 40.80 to 50.52 m2/day and storativity varies from 3.34x10⁻⁴ to 5.934x10⁻⁵. The pumping tests on dugwells were conducted which are tapping alluvium, laterite and vesicular basalt, fractured basalt and weathered massive basalt. The specific capacity, transmissivity and storativity values as analysed by Ground Water Survey and Development Agency (GSDA) are found to be ranging in Alluvium from 27.18 to 670.54 lpm/m of drawdown, 9.96 to 88.54 m2/day and 0.013 – 0.053 respectively. In vesicular basalt the values range from 14.53 – 150.36 lpm/m of drawdown, 5.04 – 22.11 m2/day and 0.017 – 0.030 respectively, whereas in fractured basalt they range from 16.74 – 158.00 lpm/m of drawdown, 3.97 – 39.45 m2/day and 0.020 – 0.050 respectively. In moderate to highly weathered massive basalt the values of specific capacity, transmissivity and storativity range from 6.38 – 285.93 lpm/m of drawdown, 2.02 – 94.84 m2/day and 0.0095 – 0.057 respectively.
4.4 Yield of Wells
The yields of the wells are the functions of the permeability and transmissivity of aquifer encountered. This varies with location, diameter and depth of wells. There are mainly two types of ground water structures in the district i.e., dugwells and borewells. Yield of dugwells in Basalt varies according to the nature of formations tapped. The yield of dugwells in phreatic aquifer ranges from 45 to 60 m3/day and pumping rarely exceeds 2 to 3 hours. As per the exploration data of CGWB, the discharge of the exploratory wells was found in the range of traces to 29.14 lps. Borewells drilled by GSDA down to the depth of
9
90 m tapping weathered and vesicular basalt are found to yield 0.5 to > 20 m3/hr, however most of the borewells yield upto 5 m3/hr. In the Alluvial area of coastal tract dugwells are capable of yielding 18 to 43 m3/hr. for 2 to 5 m drawdown for two to four hours/day.
4.5 Ground Water Resources
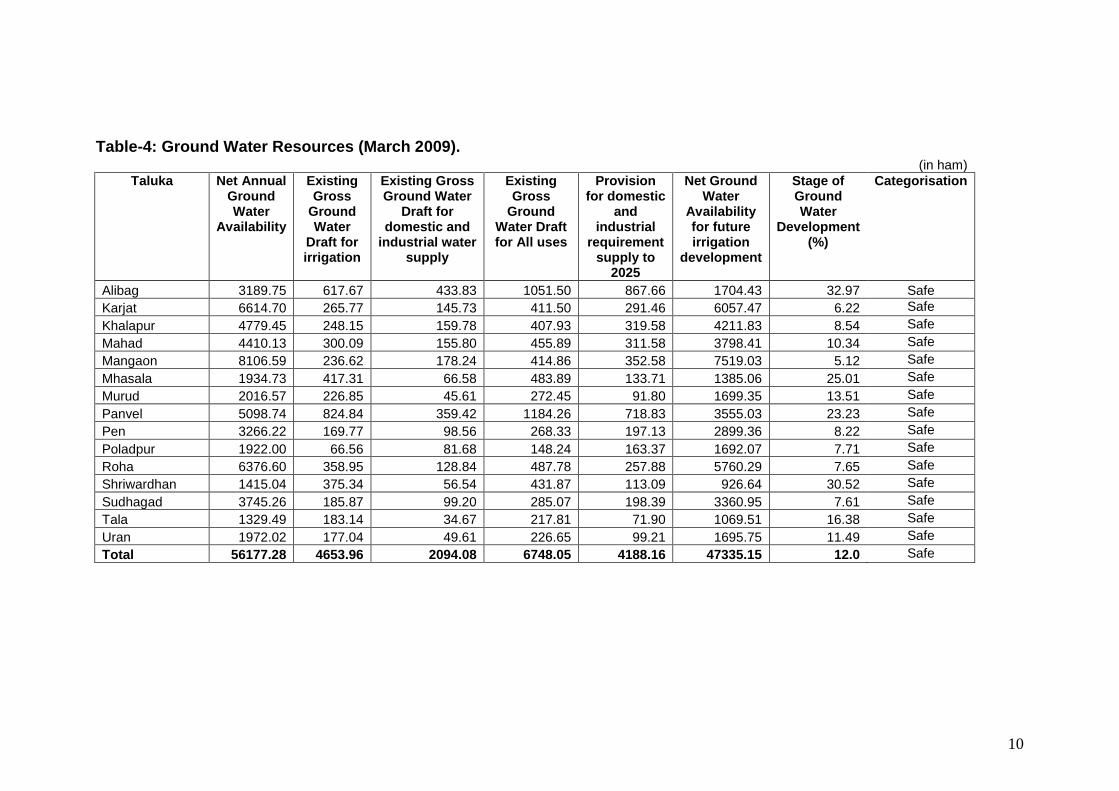
Central Ground Water Board and Ground Water Survey and Development Agency (GSDA) have jointly estimated the ground water resources of Raigarh district based on GEC–97 methodology. The same is presented in Table-4.
Ground water assessment is done for an area of 3747 sq. km of which 152.94 sq. km area is under command and 3594.65 sq. km area is under non–command. As per the estimation the total annual ground water recharge is 591.65 MCM with the natural discharge of 29.87 MCM, thus the net annual ground water availability comes to be 561.77 MCM. The gross draft for all uses is estimated of 67.48 MCM with irrigation sector being the major consumer having a draft of 46.53 MCM, whereas the domestic and industrial draft is to the tune of 20.94 MCM. The net ground water availability for future irrigation is estimated to be 473.35 MCM, whereas the allocation for domestic and industrial supply up to next 25 years is 41.88 MCM. Stage of ground water development varies from 6.22% (Karajat) to 32.97% (Alibaga). The overall stage of ground water development for the district is 12%. All the talukas and watersheds of the district fall in “Safe” category.
10
Table-4: Ground Water Resources (March 2009). (in ham)
Taluka Net Annual Ground Water
Availability
Existing Gross
Ground Water
Draft for irrigation
Existing Gross Ground Water
Draft for domestic and
industrial water supply
Existing Gross
Ground Water Draft for All uses
Provision for domestic
and industrial
requirement supply to
2025
Net Ground Water
Availability for future irrigation
development
Stage of Ground Water
Development (%)
Categorisation
Alibag 3189.75 617.67 433.83 1051.50 867.66 1704.43 32.97 Safe
Karjat 6614.70 265.77 145.73 411.50 291.46 6057.47 6.22 Safe
Khalapur 4779.45 248.15 159.78 407.93 319.58 4211.83 8.54 Safe
Mahad 4410.13 300.09 155.80 455.89 311.58 3798.41 10.34 Safe
Mangaon 8106.59 236.62 178.24 414.86 352.58 7519.03 5.12 Safe
Mhasala 1934.73 417.31 66.58 483.89 133.71 1385.06 25.01 Safe
Murud 2016.57 226.85 45.61 272.45 91.80 1699.35 13.51 Safe
Panvel 5098.74 824.84 359.42 1184.26 718.83 3555.03 23.23 Safe
Pen 3266.22 169.77 98.56 268.33 197.13 2899.36 8.22 Safe
Poladpur 1922.00 66.56 81.68 148.24 163.37 1692.07 7.71 Safe
Roha 6376.60 358.95 128.84 487.78 257.88 5760.29 7.65 Safe
Shriwardhan 1415.04 375.34 56.54 431.87 113.09 926.64 30.52 Safe
Sudhagad 3745.26 185.87 99.20 285.07 198.39 3360.95 7.61 Safe
Tala 1329.49 183.14 34.67 217.81 71.90 1069.51 16.38 Safe
Uran 1972.02 177.04 49.61 226.65 99.21 1695.75 11.49 Safe
Total 56177.28 4653.96 2094.08 6748.05 4188.16 47335.15 12.0 Safe
11
4.6 Ground Water Quality
CGWB is monitoring the ground water quality of the Raigad district since the last four decades through its established monitoring wells. The objectives behind the monitoring are to develop an overall picture of the ground water quality of the district. During the year 2011, the Board has carried out the ground water quality monitoring of 20 monitoring wells. These wells mainly consist of the dug wells representing the shallow aquifer. The sampling of ground water from these wells was carried out in the month of May 2011 (pre-monsoon period). The water samples after collection were immediately subjected to the analysis of various parameters in the Regional Chemical Laboratory of the Board at Nagpur. The parameters analyzed, include pH, Electrical Conductivity (EC), Total Alkalinity (TA), Total Hardness (TH), Nitrate (NO3) and Fluoride (F). The sample collection, preservation, storage, transportation and analysis were carried out as per the standard methods given in the manual of American Public Health Association for the Examination of Water and Wastewater (APHA, 1998). The ground water quality data thus generated was first checked for completeness and then the validation of data was carried out using standard checks. Subsequently, the interpretation of data was carried out to develop the overall picture of ground water quality in the district in the year 2011.
Suitability of Ground Water for Drinking Purpose
The suitability of ground water for drinking purpose is determined keeping in view the effects of various chemical constituents in water on the biological system of human being. Though many ions are very essential for the growth of human, but when present in excess, have an adverse effect on human body. The standards proposed by the Bureau of Indian Standards (BIS) for drinking water (IS-10500-91, Revised 2003) were used to decide the suitability of ground water. The classification of ground water samples was carried out based on the desirable and maximum permissible limits for the parameters viz., TH, NO3 and F prescribed in the standards and is given in Table-5.
Table-5: Classification of Ground Water Samples for Drinking based on BIS Drinking Water Standards (IS-10500-91, Revised 2003)
Parameters DL MPL Samples with conc. < DL
Samples with conc. in DL-MPL
Samples with conc. >MPL
TH (mg/L) 300 600 19 Nil 1
NO3 (mg/L) 45 No relaxation
19 - 1
F (mg/L) 1.0 1.5 20 Nil Nil
(Here, DL- Desirable Limit, MPL- Maximum Permissible Limit) The perusal of Table-5 shows that the concentrations of most of the
parameters are within desirable limit of the BIS standards. It is also seen from the Table-5 that the potability of ground water in the wells is good. Overall, it can be concluded that the ground water quality in the wells monitored in the district is not much affected.
Suitability of Ground Water for Irrigation Purpose
The water used for irrigation is an important factor in productivity of crop, its yield and quality of irrigated crops. The quality of irrigation water depends
12
primarily on the presence of dissolved salts and their concentrations. Electrical Conductivity (EC) and Residual Sodium Carbonate (RSC) are the most important quality criteria, which influence the water quality and its suitability for irrigation.
Electrical Conductivity (EC)
The amount of dissolved ions in the water is best represented by the parameter electrical conductivity. The classification of water for irrigation based on the EC values is as follows.
Low Salinity Water (EC: 100-250 µS/cm): This water can be used for irrigation with most crops on most soils with little likelihood that salinity will develop.
Medium Salinity Water (EC: 250 – 750 µS/cm): This water can be used if moderate amount of leaching occurs. Plants with moderate salt tolerance can be grown in most cases without special practices for salinity control.
High Salinity Water (EC: 750 – 2250 µS/cm): This water cannot be used on soils with restricted drainage. Even with adequate drainage, special management for salinity control may be required and plants with good salt tolerance should be selected.
Very High Salinity Water (EC: >2250 µS/cm): This water is not suitable for irrigation under ordinary condition. The soils must be permeable, drainage must be adequate, irrigation water must be applied in excess to provide considerable leaching and very salt tolerant crops should be selected.
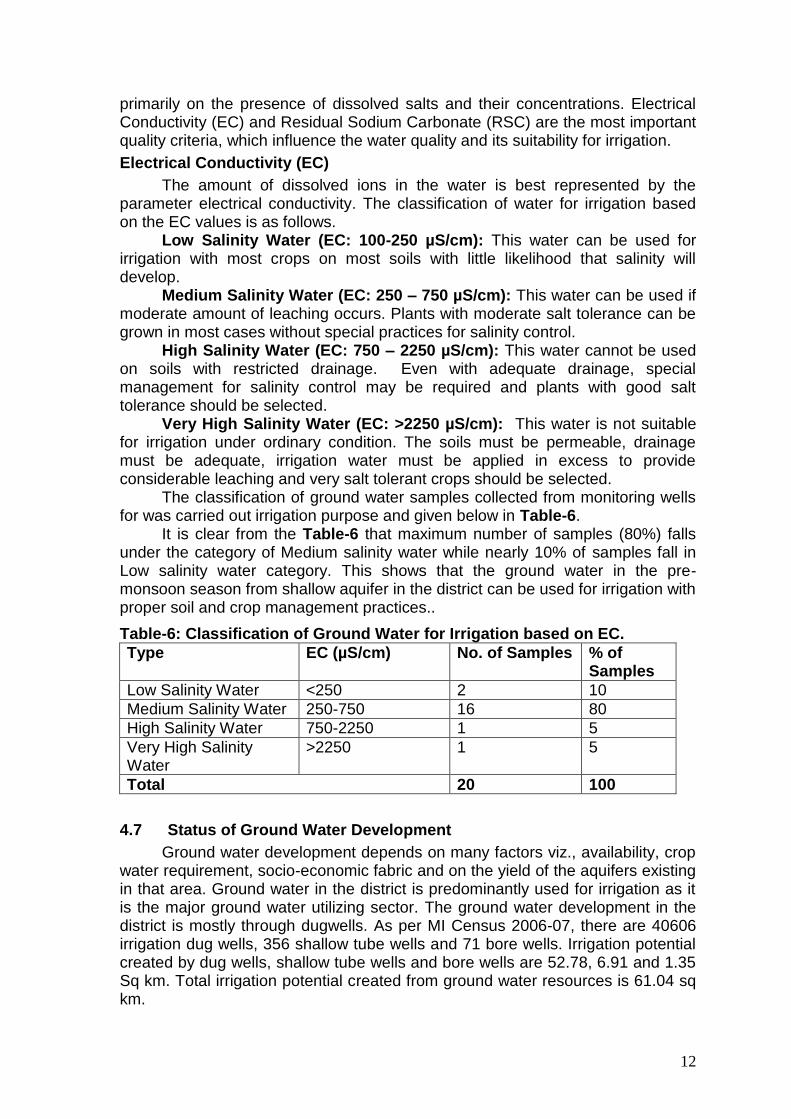
The classification of ground water samples collected from monitoring wells for was carried out irrigation purpose and given below in Table-6.
It is clear from the Table-6 that maximum number of samples (80%) falls under the category of Medium salinity water while nearly 10% of samples fall in Low salinity water category. This shows that the ground water in the pre-monsoon season from shallow aquifer in the district can be used for irrigation with proper soil and crop management practices..
Table-6: Classification of Ground Water for Irrigation based on EC.
Type EC (µS/cm) No. of Samples % of Samples
Low Salinity Water <250 2 10
Medium Salinity Water 250-750 16 80
High Salinity Water 750-2250 1 5
Very High Salinity Water
>2250 1 5
Total 20 100
4.7 Status of Ground Water Development
Ground water development depends on many factors viz., availability, crop water requirement, socio-economic fabric and on the yield of the aquifers existing in that area. Ground water in the district is predominantly used for irrigation as it is the major ground water utilizing sector. The ground water development in the district is mostly through dugwells. As per MI Census 2006-07, there are 40606 irrigation dug wells, 356 shallow tube wells and 71 bore wells. Irrigation potential created by dug wells, shallow tube wells and bore wells are 52.78, 6.91 and 1.35 Sq km. Total irrigation potential created from ground water resources is 61.04 sq km.
13
There are 288 surface flow schemes, 1104 lift irrigation schemes in the district which have created irrigation potential of 15.22 and 47.05 sq km respectively totalling to 62.27 sq km.
Stage of ground water development is only 12%, all the talukas are under safe category and ground water availability for future irrigation is 473.35 ham. Thus, there is ample scope for ground water development in the district.
5.0 Ground Water Development Augmentation and Management Strategy
Agricultural development in the district mainly depends on rainfall. The ground water development in almost entire district is on the lower side mainly due to the presence of hilly areas in major part of the district. However, the district also faces water scarcity during summer months in spite of heavy rainfall. There is thus a need to adopt an integrated approach of development of ground water resources dovetailed with ground water augmentation and rainwater conservation to provide sustainability to ground water development.
5.1 Ground Water Development
Physiography, geology and rainfall of the district plays a major role in the ground water resource availability and sustainability. The high, steep hill ranges, isolated hillocks, undulation etc give rise to high run off. The predominance of hard rock formation in the form of basaltic lava flows facilities the run off rather than natural recharge due to the poor ground water storage and transmission capabilities. The formation due to poor storage and transmission characteristics gets fully saturated during monsoon and a situation of rejected recharge is resulted. These aquifers then are drained naturally due to slopping and undulation topography.
The district despite of high rainfall of (2200 – 5000 mm) faces water scarcity situation following January or February month. Development of ground water has taken place on a limited scale in Deccan Trap Basalt area. However, ground water development for irrigation purpose has taken place on a good scale in the Alluvial area of coastal tract. The irrigation wells are capable of yielding 5 to 12 lps for 2 to 5 m draw down in two to four hours a day.
The dugwells used for drinking and for irrigation are shallow in depth (4–8 m bgl). The yield as well as sustenance of these wells can be increased by deepening of wells by 4 to 6 m, if porous and permeable formation is likely to occur at depth.
Ground water resource estimation has indicated scope for further development in all the talukas. The net ground water availability for irrigation is about 473.35 ham. In the eastern part of the district, which is occupied by hilly area with rugged topography, steep slope sand rock exposure is not suitable for ground water development. The coastal zone is already developed with more than 70% of existing irrigation wells in Murud, Alibagh and Shriwardhan talukas. Any further development in this zone may cause saline water ingress. The central part consisting of valley and plain is most suitable for ground water development and additional wells can be constructed in favourable areas. To develop the ground water resources in these parts dugwells are most feasible structures for
14
ground water development. The borewells should normally be avoided as they generally tap deeper fractures, which may not be sustainable. Besides, the borewells should only be used for drinking water supply and not for irrigation. The sites for borewells also needs to be selected only after proper scientific investigation so as to minimise the rate of failure.
5.2 Water Conservation and Artificial Recharge
In Basaltic area, the artificial recharge structures feasible are check dams, gully plugs, percolation tanks, nalla bunds, etc. The structures like gully plugs, contour bunds are most favourable in the hilly areas. In the highland area and wide lateritic plateau areas, contour trenching should be carried out to arrest the surface runoff and ensure recharge of rainfall runoff into the ground water reservoir. Existing dugwells can also be used for artificial recharge, however, the source water should be properly filtered before being put in the wells. These sites need to be located where the hydrogeological conditions are favourable, i.e., where sufficient thickness of unsaturated/de-saturated aquifer exists and water levels are deeper than 5 m. Occurrence of such areas are very limited in the district as seen from postmonsoon water level map.
Rainwater harvesting through village ponds, Roof top and individual tank storage are also appropriate and can render as supplementary source of water. Conservation of ground water source through sub-surface trench and regulating the flow of spring discharge can be effective in hilly area.
6.0 Ground Water Related Issues and Problems
About 32,000 ha of land in parts of Uran, Alibagh, Pen, Panvel Murud, Roha, Mangaon, Mahad, Mahasala and Shriwardhan talukas along the coast and creek have been rendered saline due to breaches in age old bunds. In affected areas, ground water quality has deteriorated which has rendered it unsuitable for irrigation. Rain-fed agriculture along with artificial recharge practices at feasible location should be initiated to improve the quality of ground water.
Physiography, geology and rainfall of the district play a major role in ground water availability. The prominent hill ranges, isolated hillocks, undulation etc., in the district give rise to higher runoff, rather than natural recharge. The formations due to poor storage and transmission characteristics get fully saturated during the monsoon and a situation of rejected recharge is resulted. These aquifers then are drained naturally due to slopping and undulation topography. As a result, the dugwells becomes dry by the month of February onwards. Therefore, it is recommended to conserve the water through storage in tanks, ponds and masonry structures.
7.0 Areas Notified by CGWA/SGWA
As per ground water resource estimation all the talukas fall under “Safe” category, hence no area has not been notified either by CGWA or SGWA.
15
8.0 Recommendations
1. Major part of the district is underlain by Deccan Trap Basalt where dugwells are most feasible structures. The dugwells may be constructed down to the depth of 15 m, so as to tap the weathered, vesicular / fractured and jointed basalt, normally available down to the depth of 15 m bgl.
2. In coastal area, the number of dugwells is sufficiently high. The draft of the wells should be maintained under control to keep the aquifer safe from sea water ingress.
3. The sites for borewell need to be selected only after proper scientific investigation. Borewells generally tap deeper fractures, which may not be sustainable. Besides, the borewells should only be used for drinking water supply and not for irrigation.
4. In the district, hilly part give rise to higher runoff. The basaltic formation has poor storage and transmission capabilities. The water levels are less than 2.0 m bgl during postmonsoon. Under such situation the potential of artificial recharge is quite limited. It is therefore, recommended to conserve the water through storage in tanks, ponds and masonry structures.
5. Conservation of ground water flow is also recommended by constructing sub-surface trench down the slope of major water supply structure.
6. To enhance the ground water resources and for sustainable development, mass awareness programmes should be organized in large scale by district administration. Such programmes are necessary so as to educate the user regarding yielding capacity of aquifer and declining trend of water levels in the district. Similarly farmer should also be encouraged to adopt appropriate crop planning and irrigation practices.
Copyright © 2022 FDOKUMEN