photoacid generators for catalytic decomposition ... - SMARTech
137
PHOTOACID GENERATORS FOR CATALYTIC DECOMPOSITION OF POLYCARBONATE A Thesis Presented to The Academic Faculty by Mark Glenn Cupta In Partial Fulfillment of the Requirements for the Degree Master of Science in the School of Chemical & Biomolecular Engineering Georgia Institute of Technology May 2006
-
Upload
khangminh22 -
Category
Documents
-
view
1 -
download
0
Transcript of photoacid generators for catalytic decomposition ... - SMARTech

PHOTOACID GENERATORS FOR CATALYTIC DECOMPOSITION OF POLYCARBONATE
A Thesis Presented to
The Academic Faculty
by
Mark Glenn Cupta
In Partial Fulfillment of the Requirements for the Degree
Master of Science in the School of Chemical & Biomolecular Engineering
Georgia Institute of Technology May 2006

PHOTOACID GENERATORS FOR CATALYTIC DECOMPOSITION OF POLYCARBONATE
Approved by:
Dr. Paul A. Kohl School of Chemical & Biomolecular Engineering
Georgia Institute of Technology Dr. Sue Ann Bidstrup Allen School of Chemical & Biomolecular Engineering Georgia Institute of Technology Dr. Dennis W. Hess School of Chemical & Biomolecular Engineering Georgia Institute of Technology Date Approved: January 12, 2006

ACKNOWLEDGEMENTS
I would like to express a considerable amount of gratitude towards my academic
advisor, Dr. Paul A. Kohl, who was unswerving in his support for my research and
personal academic development. His great intelligence and drive towards innovation is
balanced by a consistent jovial attitude, which made my experience in his research group
a joyful one. Furthermore, I’d like to show appreciation towards Dr. Paul Jayachandran
Joseph, who’s vast experience I drew on time and time again. I’d also like to thank Todd
Spencer, a group member of mine, for being an outstanding research partner. Together
we were able to solve numerous problems that would have been difficult alone. Jason
Harry, an undergraduate research student, poured a considerable amount of time and
effort into assisting my research and enabled me to place a greater focus on the more
inventive aspects of this work. Jassem Abdallah was an excellent experimental resource
and provided me with literature that would have taken a significant amount of time to
collect. Dr. Dhananja Bhusari was integral in the X-ray Photoelectron Spectroscopy
experimentation and analysis. Additionally I’d like to thank Promerus LLC for providing
our research group with the necessary polymer and also for the general support and ideas
they imparted to me. Dr. William M. Lamanna of the 3M Corporation graciously
provided me with samples of the novel photoacid generators he and his team had
developed. Finally, I’m grateful for having been part of such a wonderful research group.
I wish each person the best of luck in their future endeavors.
iii

TABLE OF CONTENTS
ACKNOWLEDGEMENTS...................................................................................... iii LIST OF TABLES.................................................................................................... v LIST OF FIGURES................................................................................................... vi NOMENCLATURE.................................................................................................. xii SUMMARY.............................................................................................................. xv CHAPTER 1: INTRODUCTION............................................................................. 1 CHAPTER 2: EXPERIMENTAL............................................................................ 11 2.1 Materials................................................................................................. 11 2.2 Equipment............................................................................................... 12 2.3 Procedures............................................................................................... 12 CHAPTER 3: PHOTOACID GENERATOR ANION STUDY............................... 14 3.1 Introduction and Selection of Experimental Variables........................... 14 3.2 Results and Discussion............................................................................ 19 3.3 Conclusions.............................................................................................. 32 CHAPTER 4: CATION AND NON-IONIC PAG STUDY...................................... 34 CHAPTER 5: ENVIROMENTAL INFLUENCE STUDY....................................... 42 5.1 Introduction and Experimental Setup...................................................... 42 5.2 Results and Discussion............................................................................ 49 5.3 Conclusions.............................................................................................. 58 CHAPTER 6: RATE OF DECOMPOSITION STUDY........................................... 60 6.1 Introduction and Experimental Setup...................................................... 60 6.2 Results and Discussion............................................................................ 62 6.3 Conclusions.............................................................................................. 78 CHAPTER 7: COMBINATION PAG STUDY........................................................ 79 CHAPTER 8: RESIDUE ANALYSIS...................................................................... 87 APPENDIX A: PAG STRUCTURES....................................................................... 110 APPENDIX B: COMPLETE SET OF CATION STUDY DATA............................ 116 REFERENCES.......................................................................................................... 121
iv

LIST OF TABLES
Table 2.1 PAG material list.............................................................................. 11 Table 3.1 PAGs used in the anion study........................................................... 18 Table 4.1 Sulfonate (non-fluorinated) acid PAG group................................... 35 Table 4.2 Triflic acid PAG group..................................................................... 36 Table 4.3 Nonaflic acid PAG group................................................................. 38 Table 4.4 FABA acid PAG group.................................................................... 40 Table 6.1 Summary of all film thickness change phenomena......................... 69 Table 8.1 Weight percent residue analysis for the methide and FABA PAGs................................................................................................ 108
v

LIST OF FIGURES
Figure 1.1 Proposed mechanisms for the acid catalyzed decomposition of PPC............................................................................................... 2 Figure 1.2 Proposed mechanism for the generation of acid by the decomposition of a PAG................................................................... 3 Figure 1.3 Sample TGA for a photoactive PPC system with a ramp rate of 10ºC/min (Courtesy of Paul Jayachandran Joseph)..................... 4 Figure 1.4 Process flow sheet for the formation of air-gaps using sacrificial PPC [2]............................................................................. 5 Figure 1.5 Example SEM images of PPC patterning and air-gap formation..... 5 Figure 1.6 Schematic of a micro-strip configuration with air-isolation for a predicted 50% reduction in capacitance (Design courtesy of Tae Hong Kim, Georgia Institute of Technology)............................ 6 Figure 1.7 SEM of the electrical isolation air-gap device prior to PPC decomposition (Courtesy of Todd Spencer and Paul Jayachandran Joseph, Georgia Institute of Technology)......................................... 7 Figure 1.8 SEM of the electrical isolation air-gap device after the PPC decomposition (Courtesy of Todd Spencer and Paul Jayachandran Joseph, Georgia Institute of Technology)......................................... 8 Figure 1.9 Chemical structure of the Rhodorsil-FABA PAG............................ 9 Figure 3.1 Solution thickness curves for the PPC / GBL solutions................... 17 Figure 3.2 BTBPI-PTS PAG decomposition levels........................................... 20 Figure 3.3 DPI-DMOS PAG decomposition levels........................................... 21 Figure 3.4 BTBPI-TF PAG decomposition levels............................................. 22 Figure 3.5 DPI-NF PAG decomposition levels................................................. 23 Figure 3.6 BTBPI-HDF PAG decomposition levels......................................... 25 Figure 3.7 BTBPI-TMM PAG decomposition levels....................................... 26
vi

Figure 3.8 X-ray photoelectron spectroscopy (XPS) of BTBPI-TMM residue for the 120ºC sample........................................................... 27 Figure 3.9 Rhodorsil-FABA PAG decomposition levels.................................. 29 Figure 3.10 X-ray photoelectron spectroscopy (XPS) of Rhodorsil-FABA residue for the 120ºC sample........................................................... 30 Figure 3.11 BTBPI-BBI PAG decomposition levels.......................................... 31 Figure 4.1 Film decomposition study at 120ºC for all sulfonate PAGs............ 35 Figure 4.2 Film decomposition study at 120ºC for all triflic acid PAGs.......... 37 Figure 4.3 Film decomposition study at 120ºC for all nonaflic acid PAGs...... 39 Figure 4.4 Film decomposition study at 120ºC for all FABA acid PAGs........ 40 Figure 5.1 Proposed mechanism for the poisoning of PAG hydrogen extraction by the presence of oxygen (Courtesy of Paul Jayachandran Joseph)...................................................................... 43 Figure 5.2 Nitrogen tube furnace setup with humidity control capabilities....................................................................................... 45 Figure 5.3 Standard psychrometric chart (Courtesy of Nautica Dehumidifiers Inc.).......................................................................... 46 Figure 5.4 Hotplate ramping rate for the temperature measured on the bare hotplate’s surface............................................................................. 47 Figure 5.5 Hotplate ramping rate for the temperature measured for the aluminum block’s surface................................................................ 48 Figure 5.6 BTBPI-TF film decomposition levels at 120ºC for all environmental and ramping studies................................................. 50 Figure 5.7 DPI-NF film decomposition levels at 120ºC for all environmental and ramping studies.......................................................................... 52 Figure 5.8 Substrate comparisons for the hotplate PEB of a DPI-NF film........ 54 Figure 5.9 Rhodorsil-FABA film decomposition levels at 120ºC for the reduced environmental study............................................................ 55
vii

viii
Figure 5.10 BTBPI-TMM film decomposition levels at 120٥C for the reduced environmental study............................................................ 57 Figure 6.1 Rhodorsil-FABA thickness versus time data at 120ºC PEB for a 36um film......................................................................................... 63 Figure 6.2 BTBPI-TMM thickness versus time data at 120ºC PEB for a 47um film......................................................................................... 64 Figure 6.3 TBMODS-TF thickness versus time data at 120ºC PEB for a 42.5um film...................................................................................... 66 Figure 6.4 DPI-NF thickness versus time data at 120ºC PEB for a 44um film................................................................................................... 67 Figure 6.5 DPI-NF thickness versus time data at 120ºC PEB for a 22.5um film................................................................................................... 68 Figure 6.6 Average calculated acid diffusion coefficients for inert polymer systems (Data points provided by Stewart et.al.)............................. 73 Figure 6.7 Concentration profile model for nonaflic acid in a 10um film over 30 minutes................................................................................ 75 Figure 6.8 Concentration profile model for nonaflic acid for both 10um and 50um films at 30 minutes.......................................................... 77 Figure 7.1 Rhodorsil-FABA rate of decomposition experiment with 1% PAG loading..................................................................................... 80 Figure 7.2 Combination PAG rate of decomposition experiment with a 45um initial film.......................................................................................... 82 Figure 7.3 XPS analysis of the Combination PAG residue for a PEB at 120ºC............................................................................................. 83 Figure 7.4 Combination PAG rate of decomposition experiment with a 23um initial film.......................................................................................... 84 Figure 7.5 Combination PAG rate of decomposition experiment with a
10.5um initial film............................................................................. 85 Figure 8.1 Chemical Structure of the BTBPI-TMM PAG.................................. 88 Figure 8.2 X-ray photoelectron spectroscopy of BTBPI-TTM residue.............. 89

Figure 8.3 XPS analysis of BTBPI-TMM focusing on the carbon bonding data.................................................................................................... 90 Figure 8.4 XPS analysis of BTBPI-TMM focusing on the oxygen bonding data.................................................................................................... 92 Figure 8.5 XPS analysis of BTBPI-TMM focusing on the sulfur bonding data.................................................................................................... 93 Figure 8.6 XPS analysis of BTBPI-TMM focusing on the fluorine bonding data.................................................................................................... 94 Figure 8.7 Chemical structure of the Rhodorsil-FABA PAG............................ 95 Figure 8.8 X-ray photoelectron spectroscopy of the Rhodorsil-FABA residue............................................................................................... 96 Figure 8.9 XPS analysis of Rhodorsil-FABA focusing on the carbon bonding data..................................................................................... 98 Figure 8.10 XPS analysis of Rhodorsil-FABA focusing on the oxygen bonding data...................................................................................... 99 Figure 8.11 XPS analysis of Rhodorsil-FABA focusing on the fluorine bonding data...................................................................................... 100 Figure 8.12 Structure of the Combination PAG with 1% Rhodorsil-FABA and 3% DPI-NF................................................................................. 102 Figure 8.13 X-ray photoelectron spectroscopy of the Combination PAG
residue................................................................................................ 103 Figure 8.14 XPS analysis of the Combination PAG focusing on the carbon bonding data...................................................................................... 104 Figure 8.15 XPS analysis of the Combination PAG focusing on the oxygen bonding data...................................................................................... 106
Figure A.1 Rhodorsil-FABA Structure, (tetrakis-(pentafluorophenyl)borate-4-
methylphenyl[4-(1-methylethyl)phenyl]iodonium).......................... 110 Figure A.2 TTBPS-FABA, (tris(4-tert-butylphenyl)sulfonium tetrakis-
(pentafluorophenyl)borate)............................................................... 110 Figure A.3 TPS-FABA, (triphenylsulfonium tetrakis-
(pentafluorophenyl)borate)............................................................... 111
ix

Figure A.4 BTBPI-TF, (Bis(4-tert-butylphenyl)iodonium triflate).................... 111 Figure A.5 TBOMDS-TF, (tert-(butoxycarbonylmethoxynaphthyl)-
diphenylsulfonium triflate)............................................................... 111 Figure A.6 NHN-TF, (N-hydroxynaphthalimide triflate)................................... 112 Figure A.7 DPI-NF, (Diphenyliodonium perfluoro-1-butanesulfonate)............. 112 Figure A.8 TTBPS-NF, (Tris(4-tert-butylphenyl)sulfonium perfluoro-1-
butanesulfonate)................................................................................ 112 Figure A.9 NHN-NF, (N-hydroxynaphthalimide perfluoro-1-
butanesulfonate)................................................................................ 113 Figure A.10 NHNDC-NF, (N-hydroxy-5-norbornene-2,3-dicarboximide
perfluoro-1-butanesulfonate)............................................................ 113 Figure A.11 BTBPI-TMM, (Bis(4-tert-butylphenyl)iodonium
tris(perfluoromethanesulfonyl)methide)........................................... 113 Figure A.12 BTBPI-BBI, (Bis(4-tert-butylphenyl)iodonium
bis(perfluorobutanesulfonyl)imide).................................................. 114 Figure A.13 DPI-DMOS, (Diphenyliodomium 9,10-dimethoxyanthracene-
2-sulfonate)....................................................................................... 114 Figure A.14 BTBPI-PTS, (Bis(4-tert-butylphenyl)iodonium
para-toluenesulfonate)....................................................................... 114 Figure A.15 Ciba 263 Non-ionic PAG.................................................................. 115 Figure A.16 BTBPI-HDF (Bis(4-tert-butylphenyl)iodonium perfluoro-1-
octanesulfonate)................................................................................ 115 Figure B.1 TBOMDS-TF decomposition levels................................................. 116 Figure B.2 NHN-TF decomposition levels......................................................... 117 Figure B.3 TTBPS-NF decomposition levels..................................................... 117 Figure B.4 NHNDC-NF decomposition levels................................................... 118 Figure B.5 NHN-NF decomposition levels......................................................... 118 Figure B.6 TTBPS-FABA decomposition levels................................................ 119
x

Figure B.7 TPS-FABA decomposition levels..................................................... 119 Figure B.8 Ciba 263 decomposition levels......................................................... 120
xi

xii
NOMENCLATURE
A Arrhenius pre-exponential factor APEX A positive tone, deep UV, chemically amplified photoresist BTBPI-BBI Bis(4-tert-butylphenyl)iodonium bis(perfluorobutanesulfonyl)
imide BTBPI-TF Bis(4-tert-butylphenyl)iodonium triflate BTBPI-PTS Bis(4-tert-butylphenyl)iodonium para-toluenesulfonate BTBPI-TMM Bis(4-tert-butylphenyl)iodonium tris(perfluoromethanesulfonyl)
methide C concentration of the acid Ciba-263 Non-ionic n-propane sulfonic acid based PAG CP
gP concentration of the acid on the surface of the film in the gaseous
state CP
infP concentration of the acid at the edge of the boundary layer and
surrounding gas CP
oP initial acid concentration
CP
sP concentration of the acid on the surface of the film in the solid
D overall diffusion coefficient DPI-DMOS Diphenyliodomium 9,10-dimethoxyanthracene-2-sulfonate DPI-NF Diphenyliodonium perfluoro-1-butanesulfonate EBaB activation energy g weight percent of PAG desired GBL γ-butyrolactone IPOCST poly(4-isopropyloxycarbonyloxystyrene)

k reaction rate constant K concentration partition coefficient kc mass transfer coefficient KRS-XE A positive tone, e-beam, chemically amplified photoresist l polymer film thickness MEMS microelectricalmechanical systems n order of reaction NHNDC-NF N-hydroxy-5-norbornene-2,3-dicarboximide perfluoro-1-
butanesulfonate NHN-NF N-hydroxynaphthalimide perfluoro-1-butanesulfonate NHN-TF N-hydroxynaphthalimide triflate NPOCST poly(4-neopentyloxycarbonyloxystyrene) p mass of polymer PAG photoacid generator PEB post exposure bake PPC poly(propylene carbonate) r fluid viscosity correction factor R universal gas constant R2 proportion of explained variation Rhordosil-FABA tetrakis-(pentafluorophenyl)borate-4-methylphenyl[4-(1-
methylethyl)phenyl] iodonium s mass of solvent t time T temperature
xiii

xiv
tBOC poly(t-butoxycarbonylstyrene) TBOMDS-TF tert-(butoxycarbonylmethoxynaphthyl)-diphenylsulfonium triflate TGA thermogravimetric analysis TPS-FABA triphenylsulfonium tetrakis-(pentafluorophenyl)borate TTBPS-FABA tris(4-tert-butylphenyl)sulfonium tetrakis-pentafluorophenyl)borate TTBPS-NF tris(4-tert-butylphenyl)sulfonium perfluoro-1-butanesulfonate TBg B glass transition temperature UV6 A positive tone, deep UV, chemically amplified photoresist W weight percent of polymer desired x linear regression variable representing time XPS X-ray photoelectron spectroscopy y linear regression variable representing film thickness z axis of diffusion α dimensionless mass fraction θ dimensionless concentration, unaccomplished fraction ω angular velocity

SUMMARY
It is the goal of this body of work to research an assortment of different photoacid
generators (PAGs) and quantify their ability to perform the decomposition of
poly(propylene carbonate) (PPC). Adding PAGs to PPC allows for a decreased polymer
decomposition temperature, which can in turn be used as a sacrificial polymer for the
fabrication of various microelectromechanical and microfluidic devices. A focus will be
placed on relating the properties of the PAG such as acid strength, acid volatility, and
PAG activation to processing issues like percentage of total film decomposition, amount
and composition of film residue, decomposition rate, decomposition temperature, and
environmental dependencies. This research discovered that the use of superacid triflic
and nonaflic based PAGs were not adequate for the decomposition of PPC due to the
high vapor pressure of the acid. Furthermore, the non-fluorinated sulfonic acid based
PAGs do not posses the super-acid level acidity needed to sufficiently decompose PPC.
Conversely, a perfluorinated methide and a tetrakis(pentafluoropheyl)borate based PAG
both demonstrated the capability for high level PPC decomposition. Building on the
knowledge gained through experimentation with these individual PAGs, the creation of a
novel “Combination PAG” was accomplished. The Combination PAG uses acid groups
with different physical properties collectively working to achieve what neither could
complete individually.
xv

CHAPTER 1
INTRODUCTION Sacrificial polymer systems with low decomposition temperatures can be used in
the fabrication of a variety of microelectromechanical (MEMS) and microfluidic devices
[1-3, 9-10]. For example, these polymers can be used in the packaging of MEMS devices
like gyroscopes and resonators. Additionally, they are used to form systems of
microchannels to can deliver fluidic cooling to microprocessors, or even to create
advanced air-gaps that will provide low dialectic environments for high performance
electrical devises [1-3]. One such polymer that has the desired thermal properties for the
fabrication of these devices is poly(propylene-carbonate) (PPC). Complete thermal
decomposition of PPC occurs at 200ºC to 250ºC; however, this decomposition can be
catalyzed in the presence of strong acids, effectively lowering the decomposition
temperature into the range of 100ºC to 180ºC. A mechanism for the acid catalyzed
decomposition of PPC was proposed by Jayachandran et.al. and is shown in Figure 1.1.
1

Figure 1.1: Proposed mechanisms for the acid catalyzed decomposition of PPC [2]
The electron donating carbonyl group of the polycarbonate is attacked by the hydrogen
ion triggering the catalytic cycle seen in Figure 1.1. This mechanism is considered
catalytic because a hydrogen ion is regenerated with each subsequent decomposition
reaction. Path 1 is the dominant path, which makes acetone and carbon dioxide the main
decomposition products [2]. Paths 2a and 2b both lead to a less prevalent epoxy side
product. Both acetone and carbon dioxide are volatile gases at these decomposition
temperatures, so during the thermal processing of the PPC, these products evaporate from
the film.
2

Besides a low decomposition temperature, the fabrication of these devices also
desires a polymer with photolithographic properties, much like a standard chemically
amplified photoresist. In order to make a PPC that can be photo-patterned, the polymer
can be combined with a photoacid generator (PAG). Upon irradiation with UV light, a
PAG will produce an acid by the following simplified reaction mechanism proposed by
Paul Jayachandran Joseph of the Georgia Institute of Technology.
Figure 1.2: Proposed mechanism for the generation of acid by the decomposition of a PAG The PAG decomposition mechanism seen in Figure 1.2 begins with a diphenyliodonium
(DPI) based cation and an anion that could be any conjugate base of a strong acid.
Through a combination of heat and/or light, the cation dissociates into two radical
species, both stabilized by the presence of benzyl groups. Upon reaction with residual
solvent or polymer, there is a release of a hydrogen ion that associates with the conjugate
base to form a strong acid. This is the strong acid which catalyzes the decomposition of
the PPC. The reaction proceeds at different temperatures depending on the cation
activation method, heat or light. Figure 1.3 displays a thermogravimetric analysis (TGA)
of a typical PAG, tetrakis(pentafluorophenyl)borate-4-methylphenyl[4-(1-
3

methylethyl)phenyl]iodonium (Rhodorsil-FABA), combined with PPC. The structure of
this PAG can be found in Appendix A.
Poly(propylene carbonate)
0102030405060708090
100
0 50 100 150 200 250 300 350 400 450
Temp (C)
% W
eigh
t
PAG, No UV
PAG, 800 mJ/cm2
NO PAG
Figure 1.3: Sample TGA for a photoactive PPC system with a temperature ramp rate of 10ºC/min (Courtesy of Paul Jayachandran Joseph) Figure 1.3 shows that in the absence of a PAG, the decomposition of the PPC occurs
between 200ºC and 300ºC. When a PAG is added to the polymer matrix and irradiated
with 800 mJ/cm2 of energy, the acid catalyzes the PPC decomposition so that it now
decomposes at 100ºC. However, when the UV irradiation is omitted, the PAG undergoes
thermal activation and begins to decompose the polymer at 150ºC. These temperature
differences allow a PPC / PAG film to be patterned with typical lithography methods.
Figure 1.4 presents a typical PPC sacrificial process flow diagram for the formation of
air-gaps.
4

Figure 1.4: Process flow sheet for the formation of air-gaps using sacrificial PPC [2]
The overcoat material described in step four of Figure 1.4 can be any number of materials
so long it is thermally stable at and above 170ºC – 180ºC, structurally sound at those
temperatures, and permeable to the decomposition products of PPC. Figure 1.5 shows
two SEM images taken at steps 4 and 6 in the above process flow sheet, when the
overcoat was a high temperature polyimide [1].
Figure 1.5: Example SEM images of PPC patterning (step 4) and air-gap formation (step 6) [1]
5
The two images in Figure 1.5 show the effective patterning and formation of simple air-
gap structures that mimic the shape of the sacrificial polymer. Similarly, these same air-
gap structures can also be used as microchannels for the transportation of fluids. In
addition to the simple air-gap and fluid channel designs, more complex designs, like
structures that use air-gaps for electrical isolation, as in the diagram in Figure 1.6.
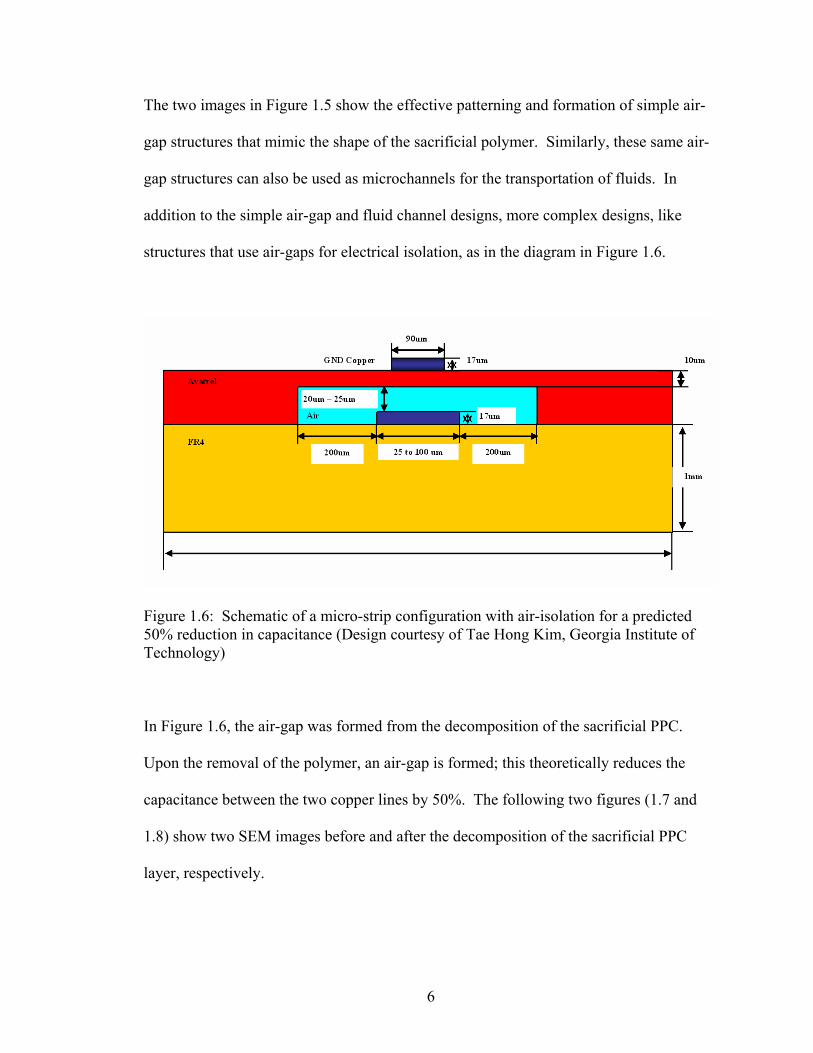
Figure 1.6: Schematic of a micro-strip configuration with air-isolation for a predicted 50% reduction in capacitance (Design courtesy of Tae Hong Kim, Georgia Institute of Technology) In Figure 1.6, the air-gap was formed from the decomposition of the sacrificial PPC.
Upon the removal of the polymer, an air-gap is formed; this theoretically reduces the
capacitance between the two copper lines by 50%. The following two figures (1.7 and
1.8) show two SEM images before and after the decomposition of the sacrificial PPC
layer, respectively.
6

Figure 1.7: SEM of the electrical isolation air-gap device prior to PPC decomposition (Courtesy of Todd Spencer and Paul Jayachandran Joseph, Georgia Institute of Technology) There are a few points of note in Figure 1.7. First, the copper signal line, which is 44um
tall and 204um wide is completely encapsulated in PPC. The copper ground line is above
the signal line and is 22um tall and 100um wide. Finally, the overcoat polymer is 37 um
tall, on which the ground line rests.
7

Figure 1.8: SEM of the electrical isolation air-gap device after the PPC decomposition (Courtesy of Todd Spencer and Paul Jayachandran Joseph, Georgia Institute of Technology) After the decomposition, the structure is the same (dimensions are different because it is
a different sample), except for the presence of an air-gap (black region) where the
sacrificial polycarbonate used to be.
All of the aforementioned examples of using the PPC for the fabrication of micro-
devices share similar processing issues. One of those issues regards the presence of
residual matter that is present after the decomposition of PPC. This residual matter can
be a result of numerous issues with the polymer system. For example, the polymer is not
a 100% pure polycarbonate. During the polymerization process, polyether compounds
form with the PPC in low percentages. Acid initiated decomposition of PPC is a catalytic
8

process; however, when a hydrogen ion attacks an ether group, the ether group forms an
alcohol, consuming the acid, effectively acting as a catalyst poison. These polyether
groups may be responsible for the post decomposition residue issues. Another possible
source is the PAG itself. The PAG used in all of the above examples is Rhodorsil-FABA,
shown in Figure 1.9.
Figure 1.9: Chemical structure of the Rhodorsil-FABA PAG
The above PAG shown in Figure 1.9 has been the dominant active agent for PPC
decomposition [1-3]. It is hypothesized that the FABA acid may be responsible for some
of the residual issues observed after decomposition [14]. It is the goal of this body of
work to not only examine the Rhordosil-FABA PAG, but research an assortment of
different PAGs and quantify their ability to perform the decomposition of PPC. A focus
will be placed on relating the properties of the PAG like acid strength, acid volatility, and
PAG activation to processing issues like percentage of total film decomposition, amount
9

and composition of film residue, decomposition rate, decomposition temperature, and
environmental dependencies.
10

11
CHAPTER 2
EXPERIMENTAL
2.1 Materials
The PPC used for all experimentation was obtained from Promerus LLC. The γ-
butyrolactone (GBL) solvent was 99+% pure and purchased through Sigma-Aldrich.
Also purchased from Sigma-Aldrich was the isopropyl alcohol. The NI PP300
pressurized 99+% pure nitrogen tanks were supplied by Airgas. Silicon wafers were
purchased from Polishing Corp of America. The wafers were type P, with one polished
surface, 100 mm in diameter, and had a 100 orientation. The glass slides were purchased
from Fisher-Scientific. The following table summarizes all of the PAGs used in this
study and where they were obtained.
Table 2.1: PAG material list PAG Chemical Name Supplier
(tert-butoxycarbonylmethoxynaphthyl)-diphenylsulfonium triflate Sigma-Aldrich Bis(4-tert-butylphenyl)iodonium triflate Sigma-Aldrich
N-hydroxynaphthalimide triflate Sigma-Aldrich Diphenyliodonium perfluoro-1-butanesulfonate Sigma-Aldrich
N-hydroxy-5-norbornene-2,3-dicarboximide perfluoro-1-butanesulfonate Sigma-Aldrich Tris(4-tert-butylphenyl)sulfonium perfluoro-1-butanesulfonate Sigma-Aldrich
N-hydroxynaphthalimide perfluoro-1-butanesulfonate Midori Kagaku Co. 4-methylphenyl[4-(1-methylethyl)phenyl] iodonium
tetrakis(pentafluorophenyl)borate Rhodia tris(4-tert-butylphenyl)sulfonium tetrakis-(pentafluorophenyl)borate Rhodia
triphenylsulfonium tetrakis-(pentafluorophenyl)borate Rhodia Bis(4-tert-butylphenyl)iodonium p-toluenesulfonate Sigma-Aldrich
Diphenyliodomium 9,10-dimethoxyanthracene-2-sulfonate Sigma-Aldrich
Ciba Non-ionic Photoacid Generator (Ciba 263) Ciba Specialty
Chemicals Bis(4-tert-butylphenyl)iodonium perfluoro-1-octanesulfonate Midori Kagaku Co.
Bis(4-tert-butylphenyl)iodonium tris(perfluoromethanesulfonyl)methide 3M Corporation Bis(4-tert-butylphenyl)iodonium bis(perfluorobutanesulfonyl)imide 3M Corporation

All materials were used unaltered as purchased from the supplier.
2.2 Equipment
All PPC films were deposited and baked using a spin coater / hotplate
combination apparatus purchased from Cost Effective Equipment (Division of Brewer
Science, Model #2031050). The UV exposure equipment (3 parts) was all manufactured
by ThermoOrion Instruments. The lamp was Model #92521-1000. The controller was
Model #68945. The power supply was Model #69920. The tube furnace and controller
are Lindburg equipment, Model #55322-3 and #58114-P, respectively. The profiling tool
was a Sloan Dektak 3. For weight measurements the scale was a Mettler AE 200.
2.3 Procedures
For casting thin (~10um) PPC films, a 30 second final spin with a speed of
4000rpm and a ramp rate of 500rpm/s was used. For the medium (~25um) films, a 30
second final spin with a speed of 1900rpm and a 300rpm/s ramp rate was used. For the
thick (~50um) films, a 30 second final spin with a speed of 950rpm and a 250rpm/s ramp
rate was used. In all cases, the polymer was dynamically applied to the substrate during
an initial 500rpm rotation for 10 seconds. Furthermore, all of the aforementioned spin
recipes are based on a 30wt% polymer solution with GBL as the solvent. Creation of the
photoacid polymer solutions is described in detail in Chapter 3. The solvent removal
(soft bake) procedure was film thickness dependent. For thin films, 10 minutes at 120ºC
was used. For medium films, 12 minutes at 120ºC was used. For thick films, 15 minutes
12

at 120ºC was used. All UV exposures were with 248nm light for a period of 3 minutes
and 56 seconds, which yields 4000mJ/cm2 of dosage based on lamp intensity
calculations. The tube furnace sample processing was performed under a flow of 2 L/min
of nitrogen after a 30 minute system purge and a 3ºC to 7ºC temperature ramp to the
desired set point. The individual processing times and temperatures for both the hotplate
and furnace testing vary and are described in the relevant sections of this report. Sample
thickness profiling was performed at three different locations on the surface of the film.
A razor blade was used to remove a square portion of the film at each of these locations
for a base thickness. Each measurement involved averaging the film thickness over a
length of 2 mm to 3 mm. The location for the measurements was the same for the initial
and final profiling. To ensure accurate and reproducible results, at least two samples
were processed at each condition, yielding a total of 6 measurements (approximately 15
mm of profiled film thickness). The surface chemical composition was determined by X-
ray photoelectron spectroscopy (XPS), taking the integrated area under the photoelectron
peak of each element weighted with their individual sensitivity factors (photoelectron
emission cross section).
13

CHAPTER 3
PHOTOACID GENERATOR ANION STUDY
3.1 Introduction and Selection of Experimental Variables
Ionic photoacid generators are composed of two individual elements. The cation
portion is responsible for the photo-activation of the PAG through the absorption of
radiant energy. Its counter ion, the anion portion, is the conjugate base of a strong acid,
which upon proper activation, extracts a hydrogen ion from the cation in order to form
the acid. It was shown in Chapter 1 how the acid catalyzes the polymer decomposition
reaction. The carbonyl moiety of the polycarbonate is an electron pair donator (i.e. base)
and reacts with the photo-generated acid. Studying the physical properties of the acid
formed from anion activation is essential to understanding the PAG’s ability to catalyze
the decomposition of the poly(propylene carbonate) matrix. This chapter will examine
several different acid families and investigate the PAG properties (such as vapor
pressure, acid strength, solubility) on the acid activation process.
In order to isolate and understand the anionic effects, very similar PAG cations
were used. This will eliminate issues regarding specific cation / anion interaction and
possible incompatibilities, while insuring a consistent light energy absorption curve
associated with each cation. The selection of iodonium based cations was made due to its
absorption at deep UV (248nm) irradiation, which has been used in other PPC patterning
applications [1-3].
Second, the experiment will consider decomposition time. Previous studies have
outlined PPC patterning recipes that use decomposition time periods ranging from 10 to
14
30 minutes [1-3]; however, different acids may have different decomposition reaction
rates. Therefore, a time period of two hours was selected in the screening experiments as
the designated decomposition time. This should provide the PAG system with ample
time to be activated and achieve maximum polymer decomposition. In Chapter 6 of this
report, the validity of the two hour time period selection for PPC decomposition will be
analyzed and supported.
Third, the issue of quantum efficiency of the acid activation in the PPC matrix has
been addressed. In keeping with the theme of performance optimization, this study has
attempted to maximize the level of activated PAG by using an elevated exposure dosage.
Using a 248-nm based chemically activated photoresist as a reference; previous studies
have shown that a dosage of 4000 mJ/cm2 will be more than enough energy to
confidently say all of the PAG will be activated. In fact, experimentation shows that 200
mJ/cm2 of energy is necessary for 100% PAG activation [8]. Erring on the side of
caution, a dosage of 4000 mJ/cm2 of 248-nm light was chosen as the energy infusion
amount for all analysis completed in this study. Through experimentation with the
Rhodorsil-FABA PAG, it was found that 1000 mJ/cm2 was adequate for complete
activation; however, a number four times as large was chosen to be confident.
Furthermore, sample patterning was avoided in favor of complete sample exposure, in
order to eliminate difficulties associated with acid diffusion and feature stability
commonly observed with PPC polymers and their low glass transition temperature
(~40ºC) [1-3, 9-10].
Fourth, there is the issue of selecting decomposition temperatures. The TGA in
the introduction (Figure 1.3) is specific to Rhodorsil-FABA and different acids may have
15
16
alternate decomposition temperatures. A lower decomposition temperature is of interest
for patterning the PPC. Therefore, initial screening temperatures of 60ºC, 90ºC, and
120ºC were chosen for this screening experiment. This should allow for the examination
of the system’s behavior in a suitable temperature range, while keeping the number of
experiments for each PAG at a manageable level.
Fifth, this study examines different decomposition conditions and environments.
Two of the common methods employ the use of a controlled environment tube furnace
and an open-atmosphere hotplate. Both methods have their advantages and
disadvantages. With a furnace, it is easier to isolate the sample from the environment and
use a controlled temperature ramping scheme; however overall experiment setup and run
times can be quite long and tedious. Conversely, using a constant temperature controlled
hotplate is a quick and simple method, but may have environmental control issues. For
the sake of completeness, both methods have been examined in this study.
Lastly, the parameters for the base polymer were selected to correspond to spin-
coating thickness of interest. A series of PPC solutions without PAG were mixed ranging
from 20 wt% to 35 wt%. The solvent used to dissolve the PPC was γ-butyrolactone
(GBL). The formula that shows the calculations used to generate these solutions is
pgsppW
*++= , (Equation 3.1)
where W is the weight percent of polymer desired, p is the mass of polymer, s is the mass
of solvent, and g is the weight percent of PAG desired (based on polymer mass not total
mass). The higher weight percent of PPC in solution resulted in higher viscosity. In turn,

17
the solution’s viscosity affects the range of possible uniform film thickness that can be
created by standard spincoating methods. The following equation shows the relationship
between sample film thickness and the angular velocity of the spincoating apparatus:
rlω1
= , (Equation 3.2)
where l is the film thickness, ω is the angular velocity, and r is a correction factor based
on the properties of the fluid (i.e. viscosity). To properly choose a polymer loading
weight, a set of samples were made with each solution using several different spincoating
angular velocities. Figure 3.1 shows the result of this analysis.
2 512
22
614
31
62
16
36
79
159
0
20
40
60
80
100
120
140
160
180
20 wt% 25 wt% 30 wt% 35 wt%
wt% of PPC
Film
Thi
ckne
ss (u
m)
Thin Film (4000rpm) Medium Film (1500rpm) Thick Film (600rpm)
Figure 3.1: Solution thickness curves for the PPC / GBL solutions

The 30wt% PPC loading solution was chosen as the basis for all of the experiments. The
second solution parameter is the amount of PAG loading. Since different PAGs will have
different molecular weights, selecting an overall molar basis rather than a weight basis is
the appropriate way to set this parameter. Seeing as the Rhodorsil-FABA PAG has had
prior success with patterning PPC films, it was chosen as the standard. Furthermore, it
has also been shown that 3 to 5 wt% Rhodorsil-FABA PAG loading based solely on the
polymer’s mass is adequate for complete decomposition [1-3]. The midpoint value of 4
wt% Rhodorsil-FABA PAG was chosen as the basis, and all other PAG loadings will be
made equivalent through a molecular weight ratio. Each polymer solution was mixed for
a minimum of seven days using a standard ball mill roller. The following table displays
all of the PAGs used in this experiment along with their molecular weights, acronyms,
and acid types.
Table 3.1: PAGs used in the anion study
PAG Chemical Name Acronym Generic Acid Family Name
Molecular Weight (g/mol)
Bis(4-tert-butylphenyl)iodonium triflate BTBPI-TF Triflate 542 Bis(4-tert-butylphenyl)iodonium p-
toluenesulfonate BTBPI-PTS Sulfonate 565 Diphenyliodonium perfluoro-1-butanesulfonate DPI-NF Nonaflate 580 Diphenyliodomium 9,10-dimethoxyanthracene-
2-sulfonate DPI-DMOS Sulfonate 598 Bis(4-tert-butylphenyl)iodonium perfluoro-1-
octanesulfonate BTBPI-
HDF Heptadecaflate 892 4-methylphenyl[4-(1-methylethyl)phenyl]
iodonium tetrakis(pentafluorophenyl)borate Rhodorsil-
FABA FABA 1016 Bis(4-tert-butylphenyl)iodonium
tris(perfluoromethanesulfonyl)methide BTBPI-TMM Methide 805
Bis(4-tert-butylphenyl)iodonium bis(perfluorobutanesulfonyl)imide BTBPI-BBI Imide 974
18

19
Chemical structures of the PAGs listed in Table 3.1 can be found in Appendix A. Using
the 30wt% PPC with 4wt% equivalent PAG solutions, films targeted at 10 µm were
spuncoat onto glass substrates. A glass substrate was selected so that the experimenter
could easily see any sample color change or deformation. The samples were soft baked
at 120ºC for 10 minutes to remove any solvent. An initial film thickness was profiled in
multiple places on the sample, and then the entire film was exposed to 248-nm light for a
period of 3 minutes and 56 seconds (4000 mJ/cmP
2P). Six samples were made in this
fashion for each PAG. The samples were then subjected to a post exposure bake (PEB)
at 60ºC, 90ºC, and 120ºC both in a tube furnace and on an open-atmosphere hotplate for a
period of two hours. After the PEB, the samples were once again profiled at the same
points to determine film thickness. The percentage of film decomposed was then
calculated for each situation and PAG. For the purposes of this analysis, the percentage
decomposition will define the samples performance. A sample with a small percentage
of decomposition will be considered poor, while a sample with 100% decomposition will
be considered perfect.
3.2 Results and Discussion
With the establishment of a procedure for measuring the decomposition of
different PPC / PAG systems that focuses on the photo-acid while eliminating
confounding variables, the next step is to perform experimentation with specific PAGs.
Beginning with the BTBPI-PTS sulfonate based PAG; Figure 3.2 shows the results of the
experiment outlined in the previous paragraph.

0
1
2
3
4
5
6
7
8
9
60ºC Furnace 90ºC Furnace 120ºC Furnace 60ºC Hotplate 90ºC Hotplate 120ºC Hotplate
Sample Name
Film
Thi
ckne
ss (u
m)
Initial Thickness Final Thickness
4% 2% 5% 2% 1% 10%
Figure 3.2: BTBPI-PTS PAG decomposition levels
Figure 3.2 relates the film thickness before and after PEB for each set of conditions. The
percentages on top of each bar graph show the percent decomposition for that sample.
With the best performance at 10% decomposition, BTBPI-PTS is a poor choice for the
PPC system. The small decomposition can be explained in two ways. One, the acid
formed from this PAG is p-toluene sulfonic acid, which has a pKa value of -4 [15].
Whereas this is acidic, it is not in the super-acid range (pKa < -12) where previous PPC
decomposition experimentation showed success [1-3]. Furthermore, the p-toluene
sulfonic acid is not a bulky acid, and it has significant vapor pressure at the temperatures
involved in the experiment. Therefore, the acid will be evaporating out of the film during
decomposition, which will cause a reduction in the acid’s concentration. This
20

combination leads to the poor performance seen is Figure 3.2. Another sulfonate based
PAG is DPI-DMOS and its performance is displayed in Figure 3.3.
0
1
2
3
4
5
6
7
8
9
60ºC Furnace 90ºC Furnace 120ºC Furnace 60ºC Hotplate 90ºC Hotplate 120ºC Hotplate
Sample Name
Film
Thi
ckne
ss (u
m)
Initial Thickness Final Thickness
13% 7% 6% 3% 2% 7%
Figure 3.3: DPI-DMOS PAG decomposition levels
As with the BTBPI-PTS, this sulfonate PAG also shows a very poor performance, with a
maximum decomposition at 13%. The 9,10-dimethoxyanthracene-2-sulfonic acid is
slightly more acidic than p-toluene sulfonic acid because it contains more electron
withdrawing groups; however, it still has too low of an acidity function.
The next PAG examined, BTBPI-TF, is in the triflic acid family. Its performance
can be observed in Figure 3.4.
21

0
1
2
3
4
5
6
7
8
9
60ºC Furnace 90ºC Furnace 120ºC Furnace 60ºC Hotplate 90ºC Hotplate 120ºC Hotplate
Sample Name
Film
Thi
ckne
ss (u
m)
Initial Thickness Final Thickness
13% 20% 20% 1% 4% 11%
Figure 3.4: BTBPI-TF PAG decomposition levels
There are multiple points of note in Figure 3.4. First, the best performance of this PAG
was measured to be at 20% decomposition, which is approximately twice the
decomposition of the sulfonic acid PAGs previously mentioned. The performance
increase can be accredited to the acidity of triflic acid formed in this system. With a pKa
of around -14 to -15, triflic acid meets the criterion of a super-acid [15]. Triflic acid has a
relatively high vapor pressure which appears to be responsible for its lower PPC
decomposition since it does not remain in a polymer for a sufficient amount of time. The
vapor pressure is 200 torr at 120ºC [12]. Another effect of the high vapor pressure can be
seen in the difference between tube furnace and hotplate PEB processing. As seen in
Figure 3.4, the hotplate samples reach a maximum performance of only 11%
decomposition, which is poor when compared to the furnace samples. Several
22

explanations of this phenomenon like environmental effects and conductive sample
heating are explored in Chapter 5. In summary, even with its high acidity, triflic acid
PAGs do not appear to be sufficient for PPC film decomposition because of the vapor
pressure effect.
The next experimental data set is based on a similar acid, perfluorobutane sulfonic
acid (nonaflic acid). Like triflic acid, it has a single perfluorinated carbon chain bonded
to a sulfonate group. Nonaflic acid has super-acid level strength; however, its increased
molecular weight will lead to a decreased vapor pressure of the acid. Figure 3.5 displays
the result of the experimentation.
0
1
2
3
4
5
6
7
8
60ºC Furnace 90ºC Furnace 120ºC Furnace 60ºC Hotplate 90ºC Hotplate 120ºC Hotplate
Sample Name
Film
Thi
ckne
ss (u
m)
Initial Thickness Final Thickness
8% 31% 34% 5% 22% 25%
Figure 3.5: DPI-NF PAG decomposition levels
23

The DPI-NF PAG with an anion based on nonaflic acid performed a higher level of PPC
film decomposition when compared to a triflic acid based PAG. Unfortunately, the
maximum achievable decomposition peaked at 34%, which is still unacceptable. It
appears that nonaflic acid, with a vapor pressure of 30 to 40 torr at 120ºC, is still too
volatile for the dry PEB techniques used in the PPC development [12]. Another
interesting point seen in Figure 3.5 is the continued trend of reduced performance for
hotplate processed samples; however, the effect seems to be less severe for nonaflic acid
when compared to triflic acid.
The next perfluorinated sulfonic PAG tested was BTBPI-HDF, with an anion in
the heptadecaflate (perfluoro-octane sulfonic acid) family. This acid has an eight carbon
chain, which results in a vapor pressure around 5 to 10 torr at 120ºC [12]. The
experimental results can be found in Figure 3.6.
24

0
2
4
6
8
10
12
14
16
60ºC Furnace 90ºC Furnace 120ºC Furnace 60ºC Hotplate 90ºC Hotplate 120ºC Hotplate
Sample Name
Film
Thi
ckne
ss (u
m)
Initial Thickness Final Thickness
26% 40% 38% 21% 29% 39%
Figure 3.6: BTBPI-HDF PAG decomposition levels
As with the transition from triflic acid to nonaflic acid, the switch to the perfluoro-octane
sulfonic acid resulted in a decomposition performance increase; however, the increase
was smaller than expected at only 6%. The perfluoro-octane sulfonic acid PAG has the
high acidity levels and very low vapor pressure qualities desired for complete PPC
decomposition. Unfortunately, the PAG was found unable to fully incorporate within the
PPC matrix. The solubility issue was caused by the long perfluorinated carbon chain
present on the anion of the PAG. The presence of this fluorophilic chain resulted in the
phase separation of the PAG in the PPC film after the soft bake step. The phase
separation was visible to the naked eye in the form of white crystals throughout the film.
Furthermore, the typically smooth surface of the film becomes rough when profiled also
indicating the presence of a crystalline second phase. Since the majority of the PAG is
25

unable to contact the PPC, the decomposition is restricted from reaching its maximum
value. For this reason, perfluoro-octane sulfonic acids do not appear to be good
candidates for PPC decomposition.
After the poor performance of the BTBPI-HDF PAG, it is concluded that any
length perfluroalkyl chain sulfonic acids is inadequate for these systems. In recent years,
a set of new perfluorinated anions have been created by William M. Lamanna, et.al. at
the 3M corporation [5, 11-13]. One of these novel PAGs is a perfluorinated methide,
BTBPI-TMM. The methide anion contains three triflic acid-like groups, and
experimentation with photo-acid reactivity and epoxy curing have shown this anion to be
comparable to salts based on one of the most reactive and acidic (pKa ~ -18) anions,
SbF6- [12]. The results of using BTBPI-TMM with PPC can be found in Figure 3.7.
0
2
4
6
8
10
12
60ºC Furnace 90ºC Furnace 120ºC Furnace 60ºC Hotplate 90ºC Hotplate 120ºC Hotplate
Sample Name
Film
Thi
ckne
ss (u
m)
Initial Thickness Final Thickness
27% 96% 98% 4% 97% 97%
Figure 3.7: BTBPI-TMM decomposition levels
26

Despite a high vapor pressure of 75 to 80 torr at 120ºC, the BTBPI-TMM PAG reaches
decomposition levels of 98%. The remaining 2% on the glass substrate was a light brown,
oily residue that does not resemble the initial PPC film. This residue was a product of
side reactions taking place within the PPC matrix as well as some PAG remains as seen
in the X-ray photoelectron spectroscopy of the residue’s surface shown in Figure 3.8.
Figure 3.8: X-ray photoelectron spectroscopy (XPS) of BTBPI-TMM residue for the 120ºC sample
27

The XPS surface analysis shows that there is the presence of carbon, fluorine, oxygen,
and sulfur in the residue. This indicates the presence of both PAG and polymer residue.
A complete examination of the XPS residue data and its composition can be found in
Chapter 8. These results show that the PAG components contribute to the residue even if
its vapor pressure is high. It also shows that the contribution to the residue is complex
issue because the methide acid has a higher vapor pressure than the nonaflic acid. It is
important to remember that the acid vapor pressure is only one property that affects the
performance of the PAG, and since the reactivity and acidity of the methide PAG is so
high, the decomposition reaction may take place before the acid escapes the system.
Support for this explanation can be found in Chapter 6.
The performance of BTBPI-TMM rivals the typical PAG used in these PPC
systems, Rhodorsil-FABA PAG. The following figure shows the decomposition
performance of the Rhodorsil PAG.
28

0
1
2
3
4
5
6
7
8
9
60ºC Furnace 90ºC Furnace 120ºC Furnace 60ºC Hotplate 90ºC Hotplate 120ºC Hotplate
Sample Name
Film
Thi
ckne
ss (u
m)
Initial Thickness Final Thickness
51% 98% 99% 19% 99% 98%
Figure 3.9: Rhodorsil-FABA PAG decomposition levels
Figure 3.9 shows why Rhodorsil-FABA has been the standard for PPC processing with
decomposition levels at 99% for both hotplate and furnace PEB. With four fluorinated
benzene groups, the FABA acid is bulky and has negligible vapor pressure at these
temperatures; however, during activation and decomposition, some of the acid does break
down into smaller, more volatile products. Also, the FABA group is considered to be a
strong super-acid, unfortunately, a pKa value could not be obtained from a literature
search. A knowledgeable estimation would place the pKa value at about -15 to -16. The
remaining 1% film residue was analyzed by XPS, and Figure 3.10 shows the results.
29

Figure 3.10: X-ray photoelectron spectroscopy (XPS) of Rhodorsil-FABA residue for the 120ºC sample
The FABA XPS data contains carbon, fluorine, oxygen, iodine, and boron (1% to 2% -
not shown on graph). There is a significant amount of fluorine in the analysis indicating
a high level of PAG based residue, as expected. Also this residue is a dark brown, hard
film that is different in appearance from the residue found on the methide samples. The
residue appears to be caused by the non-volatile Rhodorsil-FABA salts and side products
30

of the PPC decomposition. A more complete analysis of the XPS residue data can be
found in Chapter 8.
With the success of the methide based PAG when compared to FABA, additional
experiments with a perfluorinated imide based PAG (another novel PAG created by
Lamanna et.al.) were performed. The PAG selected was BTBPI-BBI, which contains
two nonaflic acid like groups bonded to nitrogen. The selection was made based on
vapor pressure considerations. BTBPI-BBI has a vapor pressure of around 10 torr at
120ºC, which is essentially identical to the BTBPI-HDF PAG seen earlier in this chapter
[12]. The results of processing the BTBPI-BBI PAG can be found in the Figure 3.11.
0
2
4
6
8
10
12
14
60ºC Furnace 90ºC Furnace 120ºC Furnace 60ºC Hotplate 90ºC Hotplate 120ºC Hotplate
Sample Name
Film
Thi
ckne
ss (u
m)
Initial Thickness Final Thickness
22% 17% 15% 21% 12% 10%
Figure 3.11: BTBPI-BBI PAG decomposition levels
31

The decomposition performance of the imide based PAG is quite poor as shown in Figure
3.11. The maximum decomposition was 22%. The explanation of these results is similar
to the BTBPI-HDF PAG, since there was a phase separation of the PPC and PAG after
the solvent removal processing step. The conclusion can be drawn that the presence of
multiple long chain perfluorinated carbons is responsible for the separation and
ultimately the poor performance. This PAG is not suitable for PPC decomposition.
3.3 Conclusions
Overall, this chapter provides a comprehensive look at a variety of PAG anions
and the physical properties that result in the successful decomposition of PPC. An
efficient experiment was designed that isolated the PAG anion’s performance from that
of the cation, quantum acid yield, PEB environment, PEB temperature, PEB time, and
PAG loading. The conclusion was drawn that non-fluorinated sulfonic acids do not have
the acid strength to catalyze the complete decomposition process. Also, perfluorinated
sulfonates like triflic and nonaflic acid have super-acid level pKa’s; however, due to their
volatility, the acid is unable to remain in the PPC matrix to fully decompose the film.
The longest chain perfluorinated sulfonic acid, perfluoro-octane has a very low vapor
pressure; however, due to its bulky fluorine chain, it phase separates from the PPC matrix
upon removal of the solvent. Thus, its decomposition ability suffered. Similarly, this
phase separation phenomenon was present in the long chain perfluorinated imide, which
consequently hindered performance. The only two successful anions were the
perfluorinated methide and FABA. Despite the methide’s moderate vapor pressure, its
high reactivity and super-acid strength has been shown to offset this negative effect.
32

Finally, as expected from surveying literature, the bulky, strong FABA acid completed
the decomposition, but left a brown, tar-like residue that requires further examination
(See Chapter 8).
33

CHAPTER 4
CATION AND NON-IONIC PAG STUDY
In Chapter 3, only aromatic based iodonium compounds were used as the energy
absorbing cation portion of the PAG. Here, in Chapter 4, an examination of several
different cations will be paired with each anion group to determine whether or not the
cation portion of the PAG has a significant effect on PPC decomposition performance.
Also, this experiment will observe some non-ionic PAGs that covalently bond the
“cation” portion to the “anion” portion. For ease of discussion, the energy absorbing
portion of non-ionic PAGs will still be referred to as the cation. The majority of the
PAGs selected will have significant absorption in the deep UV range, which corresponds
to 248 nm wavelength irradiation [16-18]. These PAGs should be fully activated after
exposure yielding the highest possible activation and protenation of the anion. PAGs that
do not have high absorptions in the 248 nm range may experience performance
retardation due to lack of acid activation. Beside absorption and activation, choice of the
cation has a large effect on the thermal stability and solvent solubility of the PAG. All of
the PAGs found in Chapter 4 are fully soluble in GBL in the necessary concentrations
and thermally stable up to at least 120ºC. Therefore, these issues should not present a
problem during experimentation. For the sake of consistency and proper comparison, the
experimental method for the cation study will be identical to that of the anion study found
in Chapter 3.
The first sample set contains non-fluorinated sulfonate acids. The following table
summarizes the chemical names and given acronyms of each PAG. PAG structures can
be found in Appendix A.
34

Table 4.1: Sulfonate (non-fluorinated) Acid PAG Group
PAG Chemical Name Acronyms Molecular
Weight (g/mol) Bis(4-tert-butylphenyl)iodonium p-toluenesulfonate BTBPI-PTS 565
Diphenyliodomium 9,10-dimethoxyanthracene-2-sulfonate DPI-DMOS 598 Ciba Photoacid Generator (1-propane sulfonic acid) CGI 263 663
The first two PAGs listed in Table 4.1 were studied in Chapter 3, but the third PAG
obtained from Ciba Specialty Chemicals is new. The CGI-263 PAG is non-ionic, and it
contains two 1-propane sulfonic acid groups per molecule. Figure 4.1 shows the
experimental results for the sulfonic acid PAGs.
0%
10%
20%
30%
40%
50%
60%
70%
80%
90%
100%
BTBPI-PTS DPI-DMOS CGI 263
PAG
% F
ilm D
ecom
posi
tion
Nitrogen Furnace Open Air Hotplate
Figure 4.1: Film decomposition study at 120ºC for all sulfonate PAGs
35

The above figure compares the percentage of PPC film decomposed for each PAG in the
nitrogen furnace and open atmosphere environments. Just as in Chapter 3, the higher
percentage of decomposition indicates improved performance. To remove graphical
clutter, only the 120ºC decomposition data is presented. For trend discussion purposes,
the 120ºC data is adequately representative of the entire temperature range. Examining
Figure 4.1, the non-fluorinated sulfonate acids show poor decomposition performance,
which was also the case in Chapter 3. The newest acid in this group, CGI 263, is no
exception. Even though the CGI 263 PAG forms two acid groups for each activated
molecule, the acid that it forms is not in the super-acid range (pKa ~ -2 to -4), and for that
reason the performance is still low [15].
The next set of PAGs examined is the triflic acid group as shown in Table 4.2
below.
Table 4.2: Triflic Acid PAG Group
PAG Chemical Name Acronym Molecular
Weight (tert-butoxycarbonylmethoxynaphthyl)-diphenylsulfonium triflate TBOMDS-TF 593
Bis(4-tert-butylphenyl)iodonium triflate BTBPI-TF 542 N-hydroxynaphthalimide triflate NHN-TF 345
The iodonium based cation PAG, BTBPI-TF was also used in Chapter 3, but the
sulfonate based cation PAG, TBOMDS-TF, and the non-ionic PAG, NHN-TF, have not
yet been discussed in this body of work. Figure 4.2 displays the results of the triflic acid
group experimentation.
36

0%
10%
20%
30%
40%
50%
60%
70%
80%
90%
100%
TBOMDS-TF BTBPI-TF NHN-TFPAG
% F
ilm D
ecom
posi
tion
Nitrogen Furnace Open Air Hotplate
Figure 4.2: Film decomposition study at 120ºC for all triflic acid PAGs
Figure 4.2 above shows that all three triflic acid based PAGs have similar film
decomposition levels, with approximately 20% furnace and 5% to 10% hotplate
decomposition at 120ºC. The sulfonate cation PAG, TBOMDS-TF, demonstrated the
highest performance, if only by a couple percent in both environments. Comparing the
hotplate with the furnace environment, there is a trend of decreasing performance with
the hotplate samples in all three PAGs. This phenomenon was also mentioned in Chapter
3, and the discussion of possible causes is undertaken in the environmental studies of
Chapter 5.
The next group of acids assessed is the nonaflates, and the following table briefly
describes the PAGs used.
37

Table 4.3: Nonaflic Acid PAG Group
PAG Chemical Name Acronym Molecular
Weight Diphenyliodonium perfluoro-1-butanesulfonate DPI-NF 580
N-hydroxy-5-norbornene-2,3-dicarboximide perfluoro-1-butanesulfonate NHNDC-NF 459
Tris(4-tert-butylphenyl)sulfonium perfluoro-1-butanesulfonate TTBPS-NF 731 N-hydroxynaphthalimide perfluoro-1-butanesulfonate NHN-NF 495
The nonaflate PAG, DPI-NF, was utilized in the anion study; however the sulfonium
PAG and two other non-ionic PAGs are being introduced here. One of the non-ionic
PAGs, NHN-NF, has the exact same energy absorption group as the non-ionic triflic acid
PAG. The NHNDC-NF PAG is different from others explored in this study because it
has its maximum UV light absorption range at 193-nm rather than 248-nm, where it is
only slightly absorbent. The decomposition results of NHNDC-NF and all other
nonaflate PAGs can be found in Figure 4.3.
38

0%
10%
20%
30%
40%
50%
60%
70%
80%
90%
100%
DPI-NF NHNDC-NF TTBPS-NF NHN-NF
PAG
% F
ilm D
ecom
posi
tion
Nitrogen Furnace Open Air Hotplate
Figure 4.3: Film decomposition study at 120ºC for all nonaflic acid PAGs
Figure 4.3 shows three out of the four PAGs performed the decomposition at similar
levels, with the one exception being the NHNDC-NF PAG. With an absorption spectrum
not tailored for 248-nm irradiation, it is no surprise that the NHNDC-NF non-ionic PAG
performed at extremely low levels. This result illustrates the importance of choosing a
cation, or in this case a non-ionic absorption group, that is properly configured for the
UV exposure range used in the experiment. When the proper cation is selected, as in the
other three nonaflate PAGs, the performance of the acid can consistently reach its
pinnacle. In this case the peak performance corresponds to approximately 30% - 35%
decomposition in the furnace and 20% - 25% decomposition on the hotplate. As seen in
the triflic acid samples, the furnace reliably outperforms the hotplate samples, but the
39

percentage difference between environments is not as drastic with the triflic acids.
Further discussion of this topic will occur in Chapter 5.
The final set of PAG samples are all based on the FABA acid group, and their
names and results are displayed in Table 4.4 and Figure 4.4 respectively.
Table 4.4: FABA Acid PAG Group
PAG Chemical Name Nickname Molecular
Weight 4-methylphenyl[4-(1-methylethyl)phenyl] iodonium
tetrakis(pentafluorophenyl)borate Rhodorsil-FABA 1016 tris(4-tert-butylphenyl)sulfonium tetrakis-
(pentafluorophenyl)borate TTBPS-FABA 1111 triphenylsulfonium tetrakis-(pentafluorophenyl)borate TPS-FABA 943
0%
10%
20%
30%
40%
50%
60%
70%
80%
90%
100%
Rhodorsil-FABA TTBPS-FABA TPS-FABA
PAG
% F
ilm D
ecom
posi
tion
Nitrogen Furnace Open Air Hotplate
Figure 4.4: Film decomposition study at 120ºC for all FABA acid PAGs
40

Figure 4.4 exhibits the superior performance of the FABA acid based PAGs when
compared to standard non-fluorinated sulfonates, triflates, and nonaflates. All
decompositions are 90% and above with the iodonium based PAG, Rhodorsil-FABA,
showing the highest level of performance at 98% and above. After decomposition, all
three samples exhibited a brownish residue on the substrate. While the sulfonate based
PAGs performed quite well, they left slightly thicker residues on the substrate. One
possible explanation is the bulky nature of the sulfonium cations causes the increased
residue. Another reason may be an improved acid activation of the iodonium based
Rhodorsil-FABA that allows for such high levels of decomposition. Never the less,
Rhodorsil-FABA has once again shown itself to be an excellent candidate for PPC
decomposition.
In summary, the “cation” portion of the PAG whether ionically or covalently
bonded (non-ionic) to the “anion” portion is responsible for the energy absorption, acid
activation, solvent solubility, and thermal stability of the molecule. From the results in
this section, the conclusion can be drawn that cationic manipulation will not result in
significant increases in PPC decomposition performance. It was consistently shown that
for a given PEB recipe, PAGs with the same acid group and different cation groups
performed at or near statistical equivalence. The differences were minor, on the order of a
couple percentage points. On the other hand, an exception occurs when the improper
selection of a cation is made based on the qualities listed above, and the result is a severe
performance hindrance. For that reason, a well-chosen cation is important to ensure the
maximum level of performance of the PAG.
41

CHAPTER 5
ENVIRONMENTAL INFLUENCE STUDY
5.1 Introduction and Experimental Setup
Some mention has already been made in the previous chapters regarding the effect
of the PEB environment on the decomposition performance of the PPC matrix. This
chapter will attempt to expand the discussion of the aforementioned environmental
effects and arrive at conclusions through further experimentation. The environmental
effect on the decomposition first arose while observing the results of the triflic and
nonaflic acid experimentation. There was a clear disparity between samples processed in
a nitrogen controlled tube furnace environment and an open-atmosphere hotplate. At
each processing temperature, the nitrogen furnace outperformed the hotplate samples,
sometimes showing vast improvements as significant as twice film decomposition.
What identifiable circumstances could cause such consistent contrast? One possible
explanation is in the atmosphere surrounding the sample. Whereas the furnace is
essentially a pure nitrogen environment, the open-atmosphere hotplate is surrounded by
not only nitrogen but oxygen carbon dioxide, and a host of additional gases as well. In a
body of work by Paul Jayachandran Joseph, a mechanism was proposed where the
presence of oxygen interferes with the extraction of a hydrogen ion from the activated
cation by reacting with a radical iodine (or sulfur) after the PAG decomposition (see
Chapter 1, Figure 1.2). The mechanism is shown in Figure 5.1.
42

IO2
I O O
Figure 5.1: Proposed mechanism for the poisoning of PAG hydrogen extraction by the presence of oxygen (Courtesy of Paul Jayachandran Joseph)
Further work needs to be performed in order to verify this mechanism. Besides oxygen, a
second gas of interest is water vapor. The incorporation of water into the PPC matrix
may have a detrimental effect on the acid catalyzing the polymer decomposition. In the
presence of water, the strongest acid that can be formed is the hydronium ion, which will
prevent the pH of the system from reaching super-acid levels. Similar ideas were
presented in a work by Burns et.al., where the behavior of chemically amplified
photoresists in a changing relative humidity environment was undertaken. The results
showed that this pH leveling effect was photoresist dependent. Whereas increasing the
relative humidity of the PEB environment had a negative effect on the deprotection
kinetics of poly(t-butoxycarbonylstyrene) (tBOC) photoresist, it had a positive effect on
the reaction rate of KRS-XE photoresist. Moreover, the presence of water in the
environment had no effect on APEX or UV6 photoresists [4]. A single unifying
conclusion can not be made about the presence of water on the reaction rates in
polymeric films, so it is essential to examine the effects specifically on PPC. Since PPC
decomposition is highly dependent on acid strength, the hypothesis is that environments
saturated with water will have a negative effect of overall decomposition performance.
The second possible cause of the hotplate versus furnace PEB disparity is the
heating method. The tube furnace has a programmable controller that allows for a
43

controlled temperature ramp (~5ºC/min) to the desired set point. For the hotplate
experiments, the surface was brought to a desired stable temperature before introducing
the sample because of the lack of a programmable controller. Therefore, the temperature
ramping of these hotplate samples was high and limited by the thermal conductivity of
the substrate, in this case glass. Linked to the ramping effects, the sample processing
time might also influence the decomposition performance. This statement does not refer
to the two hour time period spent at the temperature set point. Rather, it refers to the
approximate half hour the furnace samples get to spend ramping at lower temperatures.
Lastly, the method of heat transfer is different for the furnace and hotplate. The hotplate
uses pure conduction of heat through the substrate to the film as the heat transfer
mechanism while the surrounding air has a cooling effect; however, the furnace samples
use convective heating (slight conduction from the sample holder in the furnace), which
encapsulates the sample in hot gas until an equilibrium is reached. This difference is
inherent to the individual PEB method and cannot be well compensated for. On the other
hand, the ramping and increased time at lower temperature effects are examined in this
chapter.
Sample preparation for the environmental studies will be identical to the anion
and cation studies of Chapter 3 and 4. The necessary experimental changes will be made
on the setup of the PEB equipment. For the humidity experimentation, the capability of
the furnace will be expanded for it to accept an input from two gas streams. The diagram
of the alternate furnace testing setup can be seen in Figure 5.2.
44

Figure 5.2: Nitrogen tube furnace setup with humidity control capabilities
Looking at Figure 5.2, one of the dry pressurized nitrogen tanks is fed into a hot water
bubbler in order to fully saturate the feed before entering the flowmeter. The water
temperature in the bubbler is maintained at 60ºC to 65ºC, which is more than adequate to
fully saturate the feed as seen in the psychrometric chart below.
45

Figure 5.3: Standard psychrometric chart (Courtesy of Nautica Dehumidifiers Inc.)
In fact, the humid nitrogen was supersaturated as it left the hot bubbler environment. To
collect the condensate, an excess water trap consisting of plastic tubing coiled in a room
temperature water bath needed to be installed prior to the flowmeter. This prevented
water droplets from affecting the flowmeter or entering the furnace. The second dry
pressurized nitrogen tank was fed directly into the flowmeter. By carefully rationing the
two gas streams, the humidity content of the combined stream can be accurately
maintained from 0% to 100% saturation at room temperature. All of the relative
humidity and water saturation figures presented here are based on room temperature air.
When the gas enters the elevated temperatures of the furnace, the relative humidity
changes since hot air can hold significantly more water vapor. With the current lab
46

equipment, there is no way to create a 100% saturated gas environment inside the
furnace; however, the setup shown here should be fully capable of providing interesting
scenarios that will provide high-quality information.
The second equipment alteration involves the hotplate setup. The temperature
ramp rate was measured from ambient conditions to the desired PEB temperature by
turning the hotplate setting from off directly to the set-point and measuring the surface
temperature. Figure 5.4 shows the plot of hotplate surface temperature versus time for a
120ºC set-point.
0
20
40
60
80
100
120
140
160
0 2 4 6 8 10 12 14 1
Time (min)
Tem
pera
ture
(ºC
)
6
Figure 5.4: Hotplate ramping rate for the temperature measured on the bare hotplate’s surface
47

Observing the above graph, two major issues arrive. First, the set-point temperature of
120ºC is overshot by almost 30ºC. The anion study in Chapter 3 has shown the strong
dependence the PAG has with temperature and ultimately PPC decomposition.
Therefore, the confidence one can place in a sample processed under these conditions is
low. Second, the ramp rate of apparatus in the first three minutes averages almost 40ºC
per minute. Since one of the goals of the ramping style hotplate experiment is to simulate
the smooth temperature increase of the furnace, this procedure once again falls short of
expectations. In order to restrict the rapid heating of the equipment, a solid, 1” thick
aluminum block was placed upon the hotplate’s surface. Once again the temperature was
measured as the hotplate was taken from ambient conditions directly to the desired set-
point. Figure 5.5 illustrates the temperature versus time behavior on the surface of the
aluminum block.
0
20
40
60
80
100
120
140
0 5 10 15 20 25 30 35 40 45 50
Time (min)
Tem
pera
ture
(ºC
)
Figure 5.5: Hotplate ramping rate for the temperature measured for the aluminum block’s surface
48

Figure 5.5 shows a more controlled temperature increase over time. Averaged over the
first 30 minutes of heating, the ramp rate of the aluminum block was calculated to be 3ºC
to 4ºC per minute. This rate is very close to the targeted 5ºC per minute used in the
furnace testing. Since a sample processed in this manner would receive a similar amount
of time at temperatures below its targeted set-point, another confounding issue is solved.
Finally, once the set-point is reached, the targeted temperature is consistently maintained
within an acceptable range of a few degrees centigrade.
Before presenting the experimental data, now is an appropriate time to discuss the
issue with the complexity of these systems. Each scenario created here attempts to
provide a simple, yet fully valid solution to a more complicated overall problem
statement involving the complete understanding of the PPC / PAG relationship. Each
situation has the possibility for further exploration; however, it is the intent of this author
for this report to be a strong starting point for these explorations in future works.
Therefore, some discussions may fall short of fully describing specific correlations
observed in these results, but this is done to avoid forcing a straightforward conclusion to
a very complex system.
Section 5.2: Results and Discussion
The first PAG to be analyzed using the aforementioned PEB equipment
modifications is the triflic acid based PAG BTBPI-TF. Recalling the conclusions from
Chapter 3, BTBPI-TF is a PAG that is composed of a highly volatile but very strong acid
group. At a decomposition temperature of 120ºC, BTBPI-TF showed a very large
disparity between experimental PEB environments. Figure 5.6 once again displays the
49

BTBPI-TF data from the Chapter 3 anion experiment; however, it also includes
decomposition data from a range of humidity and the hotplate ramping experiment.
19.2%
10.5%11.1%11.5%
13.6%13.7%
0
2
4
6
8
10
12
Dry N2 Furnace ~33% Wet N2Furnace
~66% Wet N2Furnace
100% Wet N2Furnace
Slow Ramp Hot Plate Standard Hot Plate
Processing Description
Film
Thi
ckne
ss (u
m)
0%
5%
10%
15%
20%
25%
Perc
enta
ge D
ecom
posi
tion
Initial Thickness Final Thickness Percent Decompostion
Figure 5.6: BTBPI-TF film decomposition levels at 120ºC for all environmental and ramping studies There are two pieces of information in this figure. The bar graphs show the average
measurements of the initial and final film thicknesses, and they correspond to the y-axis
on the left. The line graph with the numerical labels displays the calculated percentage of
decomposition, and they correspond to the y-axis on the right. The four leftmost bar
graphs in the above figure correspond to the complete range of humidity experimentation.
Specifically, these graph shows the BTBPI-TF loaded PPC that was decomposed in a
furnace with dry nitrogen, 33% saturated nitrogen, 66% saturated nitrogen, and 100%
50

saturated nitrogen furnace gas streams (based on room temperature air). No matter what
the ratio of wet to dry nitrogen, the total flow rate of gas was held constant at 2 L/min to
ensure consistency. The performance of the PAG in the completely saturated nitrogen
environment is 40% lower than that of the sample processed in dry nitrogen conditions.
Also, the performance of the two samples with both wet and dry nitrogen flows was
appropriately found in the middle of both extremes. These results show that the presence
of humidity in the surrounding environment has a negative impact on PPC films
decomposed with a triflic acid based PAG.
Unfortunately, humidity alone cannot explain the large disparity between hotplate
and furnace processed samples. The lab’s air conditioned environment keeps the air at
around 30% to 40% relative humidity, which would place decomposition around 14%
using a linear extrapolation with the furnace data. However, as seen in Chapter 3 and
Figure 5.6, the standard hotplate processing results in a decomposition of 10% to 11%.
Even the hotplate experiment with the aluminum assisted controlled ramping rate did not
make a difference in the decomposition percentage (11%). Therefore, slow ramping and
extended time spent at lower temperatures were not found to have an impact on triflic
acid based PAG in PPC. The remaining justification for reduced hotplate performance is
the inherent heating mechanism of the different PEB equipment. On an open-air
hotplate, there will be a temperature gradient through the sample because of the
surrounding ambient atmosphere. Therefore the film will not be at a uniform temperature
like in a furnace environment. Chapter 3 has shown that lower temperatures hinder the
decomposition of PPC, which will be based on the Arrhenius kinetic relationship (see
Chapter 6, Equation 6.1). On the other hand, lower temperatures also decrease the vapor
pressure of the acid [14]. These effects will counteract one another; however, with the
51

high vapor pressure of triflic acid, the rate of reaction decrease should be a more
significant factor. Further work needs to be done in this area to make a more definitive
conclusion. Yet, recalling the specific temperature dependence data, BTBPI-TF did show
13% decomposition in a 60ºC furnace and 20% decomposition in a 120ºC furnace.
Consequently, the cooler surface of the film will have a reduced rate of decomposition
when compared to the film that is contacting the substrate. This rate reduction will
ultimately allow time for more vaporization of the highly volatile triflic acid, thus,
lowering the overall decomposition of the sample.
To further solidify the conclusions drawn from the BTBPI-TF PAG, the same set
of humidity and ramping experiments were completed with a nonaflic acid PAG, DPI-
NF. The results are shown in the figure below.
34.5%
25.4%
24.1%20.9%
28.4%
30.6%
0
2
4
6
8
10
12
Dry N2 Furnace ~33% Wet N2Furnace
~66% Wet N2Furnace
100% Wet N2Furnace
Slow Ramp Hot Plate Standard Hot Plate
Processing Description
Film
Thi
ckne
ss (u
m)
0%
5%
10%
15%
20%
25%
30%
35%
40%
Perc
enta
ge D
ecom
posi
tion
Initial Thickness Final Thickness Percent Decompostion
Figure 5.7: DPI-NF film decomposition levels at 120ºC for all environmental and ramping studies
52

As with the triflic acid environmental study, this graph presents data gathered from two
separate experiments. The DPI-NF humidity experiments (four bar graphs from the left)
show a decreasing decomposition performance with an increasing level of saturated
nitrogen. Specifically, the sample processed with the fully saturated nitrogen stream
showed a 40% reduction in performance when compared to the dry nitrogen
environment. This information closely supports the results gathered from the BTBPI-TF
humidity study, and the conclusion can be made that the introduction of water vapor into
the PEB environment will reduce decomposition performance for this system. Moreover,
the hotplate ramping study (two bar graphs from the right) once more proves to be
ineffective in improving decomposition, again supporting the results found from
experimentation with BTBPI-TF. Finally, Figure 5.7 demonstrates that the standard
hotplate experiment has inferior performance when compared to nitrogen gas streams
saturated at intermediate levels. Thus, this data corroborates the claim that the
temperature gradient created in the film during hotplate PEB processing results in
reduced decomposition rates and lower performance. One possible way to examine the
temperature gradient as a root cause is to use a silicon substrate that will provide more
heat flux into the film, reducing the temperature gradient effect. Figure 5.8 shows the
decomposition data collected from a DPI-NF sample processed using the standard
hotplate methods except the PPC film was deposited on silicon rather than glass.
53

25.4%
33.1%
0%
5%
10%
15%
20%
25%
30%
35%
Silicon Substrate Hotplate Glass Substrate Hotplate (Standard)
Sample Name
Perc
enta
ge D
ecom
posi
tion
Figure 5.8: Substrate comparisons for the hotplate PEB of a DPI-NF film
Figure 5.8 shows a dramatic increase in hotplate decomposition performance when
silicon is used. The 33% decomposition still does not equal the furnace decomposition,
but that is to be expected since the open-atmosphere contains water vapor. This result
strongly supports the theory that the hotplate samples are strongly tied to the conductive
effects.
The effect of environmental influence has been shown for highly volatile and
mediocre performing PAGs based on triflic and nonaflic acid. This next section will
compare these results with the Rhodorsil-FABA PAG, which has a negligible vapor
pressure, high acidity, and a 98-99% decomposition performance. The following figure
shows the environmental experimentation results for the Rhodorsil-FABA system.
54
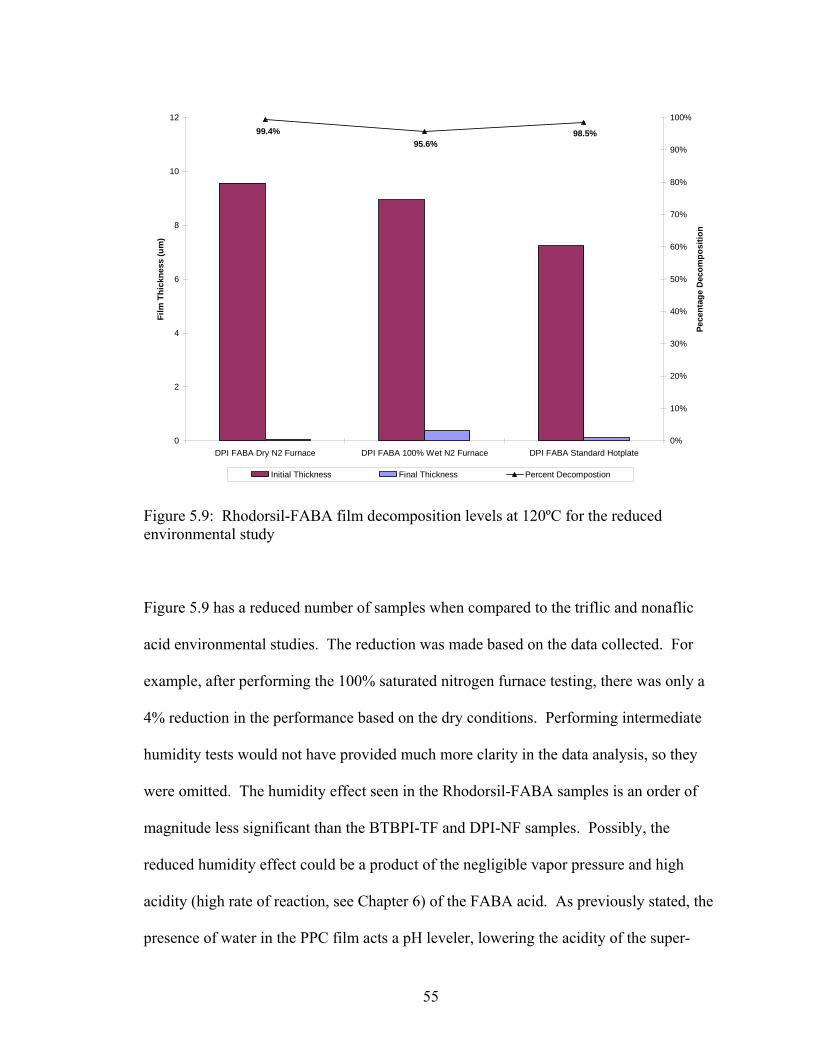
98.5%95.6%
99.4%
0
2
4
6
8
10
12
DPI FABA Dry N2 Furnace DPI FABA 100% Wet N2 Furnace DPI FABA Standard Hotplate
Film
Thi
ckne
ss (u
m)
0%
10%
20%
30%
40%
50%
60%
70%
80%
90%
100%
Pece
ntag
e D
ecom
posi
tion
Initial Thickness Final Thickness Percent Decompostion
Figure 5.9: Rhodorsil-FABA film decomposition levels at 120ºC for the reduced environmental study Figure 5.9 has a reduced number of samples when compared to the triflic and nonaflic
acid environmental studies. The reduction was made based on the data collected. For
example, after performing the 100% saturated nitrogen furnace testing, there was only a
4% reduction in the performance based on the dry conditions. Performing intermediate
humidity tests would not have provided much more clarity in the data analysis, so they
were omitted. The humidity effect seen in the Rhodorsil-FABA samples is an order of
magnitude less significant than the BTBPI-TF and DPI-NF samples. Possibly, the
reduced humidity effect could be a product of the negligible vapor pressure and high
acidity (high rate of reaction, see Chapter 6) of the FABA acid. As previously stated, the
presence of water in the PPC film acts a pH leveler, lowering the acidity of the super-
55

acids. In turn, this lowers the overall reaction rate of the acid; however, on explanation is
that the reactivity of the FABA acid is so high and fast that the majority of the acid is still
able to effectively decompose. The remaining 4% to 5% of unreacted film was the
portion affected by the reaction quenching presence of high water concentrations.
Clearly, this is a complicated problem, and this solution only provides one possible
explanation based on knowledge about the FABA acid. Future work would be required
to provide further clarity to this phenomenon.
The other environmental experiment that was omitted for the Rhodorsil-FABA
PAG is the hotplate ramping study. Besides the fact that past hotplate ramping
experimentation showed little difference with standard hotplate procedures, the FABA
hotplate sample performed at near equivalent decompositions compared to the dry
furnace PEB. For this reason, the experiment was not necessary.
The equivalent decomposition performance of the FABA acid raises an interesting
question about whether it is the negligible vapor pressure of the acid, the fast reaction
rate, or both that negates the heating mechanism effect. This question may be answered
by experimenting with the methide PAG, BTBPI-TMM. Recalling descriptions in
Chapter 3, the methide acid has extremely high acidity (pKa ~ -18), and a vapor pressure
slightly higher than nonaflic acid. Figure 5.10 shows the results from the shortened listed
of environmental experiments.
56

97%98%98%
0
2
4
6
8
10
12
Dry N2 Furnace 100% Wet N2 Furnace Standard Hot Plate
Film
Thi
ckne
ss (u
m)
0%
10%
20%
30%
40%
50%
60%
70%
80%
90%
100%
Pece
ntag
e D
ecom
posi
tion
Initial Thickness Final Thickness Percent Decompostion
Figure 5.10: BTBPI-TMM film decomposition levels at 120ºC for the reduced environmental study The data in the above figure is strikingly similar to the aforementioned Rhodorsil-FABA
data. For example, both sample sets show very high decomposition percentages (98%
and above). Also like the Rhodorsil-FABA, the hotplate processed sample is only 1%
less effective than the sample processed in the dry nitrogen tube furnace. Therefore, it
seems that the high reactivity of the acid; especially at lower temperatures due to the
temperature profile (see Chapter 3 for complete temperature decomposition data set) that
dictates similar hotplate and furnace performances. This reactivity at lower temperatures
overcomes the temperature profile created by the slow conduction through the glass
substrate.
57

Nevertheless, there is one major difference between the FABA and methide sample sets.
The methide based PAG does not appear to be affected by the presence of water. The
two furnace samples performed at equivalent levels, specifically, 98% film
decomposition. At first, this result may appear to be troubling. It has already been
shown that the very volatile triflic and nonaflic acids are affected by the presence of
water in the atmosphere. The methide acid has a vapor pressure that falls in between
those two acids, so there must be another acid property that is masking the volatility.
That property may be the acid strength and resulting high rate of reaction. It will be
proven in Chapter 6 that the methide PAG is the fastest reacting PAG tested in this entire
report. This demonstrates that the reaction rate of the photoacid is just as, if not more
important, than the vapor pressure for samples hindered by environmental effects.
5.3 Conclusions
Overall, a series of experiment were carried out that were able to provide basic
explanations to how PAGs are affected by their environment. It was found that humidity
and the presence of water vapor does hinder the ability of some PAGs to decompose PPC
films. The level of hindrance showed a positive correlation with the PAG’s rate of
reaction. Basically, the BTBPI-TMM was least affected by the presence of water and
also has the fastest reaction rate. On the other hand, BTBPI-TF and DPI-NF have the
slowest reaction rates and were also the most affected by the increased relative humidity.
Furthermore, it was found that the slow conduction of heat through the glass substrate
was one of the principle causes for the poor hotplate performance seen in some of the
58

PAGs. These simple explanations only begin to explain the behavior of these systems,
and further testing that probes deeper into each phenomenon would be beneficial.
59

CHAPTER 6
RATE OF DECOMPOSITION STUDY
6.1 Introduction and Experimental Setup
The previous three Chapters concentrated on the decomposition performance of
the individual PAGs in the polymer matrix. Total decomposition is only one piece of
information in the attempt to understand and characterize these sacrificial polymer
systems. Designing experimentation in order to observe the rate of film decomposition is
equally as important. Previous discussion has introduced the issues associated with the
low glass transition temperature of PPC (30ºC to 40ºC). In order to maintain feature
integrity for device fabrication, it is desirable to either decompose the PPC at a lower
temperature much closer its glass transition or lessen the time required to complete the
decomposition. This report has already shown the difficulties of low temperature (60ºC)
PEB processing. Therefore, locating a PAG that has the ability to quickly (rate of
reaction) and efficiently (total decomposition) process PPC is vital.
Describing the PPC decomposition reaction system is a difficult and complicated
task. First of all, each reaction of the catalytic acid with the carbonate group initiates a
fissure of the polymer chain through the mechanism described in the introduction. A
single cleavage of the polymer chain will not result in the creation of the volatile
decomposition products, mostly acetone and carbon dioxide [2]. The number of fissures
needed for complete volatilization is function of the molecular weight of the PPC.
Therefore, it is difficult to predict actual reaction parameters as a function of film
60

61
thickness or weight change, since reactions are occurring that do not alter those
measurements.
Building on the concept of reaction rate parameters, it is also complicated to
construct a model for PPC decomposition with a PAG. A classic Arrhenius based model
for the decomposition of a polymer is expressed as
nan
RTE
Akdtd )1(exp)1( ααα
−⎟⎠⎞
⎜⎝⎛−=−= , (Equation 6.1)
where α is a dimensionless mass fraction, k is the rate constant, n is the order of reaction,
A is the Arrhenius pre-exponential factor, EBa B is the activation energy, R is the universal
gas constant, t is the time, and T is the temperature [6]. A common simplification of this
equation is to assume a constant reaction rate for the entirety of the decomposition. This
would be a poor assumption since the concentration of acid is always changing for three
main reasons. One, the acid may be escaping the system through vaporization. Although
this is not true for all PAGs (FABA acids), it is true for the majority of photoacids
examined in this body of work. Two, the catalytic regeneration of the acid is being
quenched by the presence of polyether impurities in the PPC. At this time, the creation of
a 100% pure polycarbonate has not been possible. In fact, test has shown that up to 5%
of the polymer purchased from the suppliers is polyether. Whereas the reaction of a
hydrogen ion with a carbonate group results in the generation of another hydrogen ion,
the reaction of the same hydrogen ion with an ether group results in the creation of an
alcohol. This side reaction removes acid from the system lowering the overall
concentration. Three, the decomposition reaction changes its environment. As volatile

decomposition products are generated, the mass and thickness of the film are lowered,
further concentrating the remaining acid. These three reasons show why the assumption
of a constant reaction rate and acid concentration is a poor one.
Despite all of the complications with the system kinetics and reaction rate, an
effective method of describing the decomposition rate can still be created. If the change
in film thickness is thought of as an etch rate, one can collect film thickness data versus
time through similar experimentation as seen in Chapters 3 – 5. A rate experiment was
created with similar sample processing steps as prior studies with a few exceptions. First,
the PPC film was deposited on a silicon wafer. The wafer can then be diced into as many
pieces as desired, and importantly, each wafer piece will have the same initial thickness
of film, which will be measured and recorded. The second change has to do with the
PEB time. Each wafer division will have a different PEB time from 1 minute to 30
minutes. The only PEB method used is the hotplate at 120ºC. By measuring the
remaining film thickness of each sample, the desired plot of the thickness change versus
time can be realized. Furthermore, fitting a curve to this plot and taking its derivative
will result in an overall decomposition rate for the system. Lastly, the targeted initial
thickness will increase from 10 microns to 40-50 microns in order to closer simulate the
need for thick PPC films in the fabrication of devices such as micro-fluidic channels.
6.2 Results and Discussion
Using the methods described in Section 6.1, the decomposition rate was
calculated for the Rhodorsil-FABA PAG as seen in the figure below.
62

63
0
5
10
15
20
25
30
35
40
0 5 10 15 20 25 30
Time (min)
Am
ount
of D
ecom
pose
d Fi
lm (u
m)
Calculated Development Rate = 2.5 um/min
Initial Film Thickness = 36um
Overall Decomposition = 96%
Figure 6.1: Rhodorsil-FABA thickness versus time data at 120ºC PEB for a 36um film
An overall decomposition of 96% was achieved in only 15 minutes. Using linear
regression over the first 15 minutes of development time generates an equation in which
the slope is the decomposition rate. The following equations show an example of this
calculation:
49.2
979.049.2
2
=
=
=
dxdyR
xy, (Equations 6.2 – 6.4)

64
where y represents the thickness of the film, RP
2P is the proportion of explained variation
(calculated by Microsoft Excel), and x represents time. For the Rhodorsil-FABA the
development rate was calculated to be approximately 2.5 µm per minute.
This rate calculation is nice for prediction PEB times based on film thickness;
however, the greater value lies in comparison with other PAGs. In previous chapters, it
has been discussed that the decomposition rate of the perfluorinated methide based PAG,
BTBPI-TMM, is quite high. Figure 6.2 shows the decomposition rate analysis for this
PAG.
0
5
10
15
20
25
30
35
40
45
50
55
0 5 10 15 20 25 30
Time (min)
Am
ount
of D
ecom
pose
d Fi
lm (u
m)
Overall Decomposition = 99%Calculated Development Rate = 4.5 um/min
Initial Film Thickness = 47 um
Figure 6.2: BTBPI-TMM thickness versus time data at 120ºC PEB for a 47um film
Figure 6.2 shows that the film was decomposed to approximately 99% of its value in 10
minutes. The 99% decomposition value can only be considered an estimate because of

the residue properties. The residue is extremely oily, and the needle of the profilometer
had a difficult time measuring the thickness because the needle cut through rather than
traversed over the film. For a better head to head comparison of the FABA and methide
residues based on weight percentages, please see Chapter 8. Another important piece of
data that can be obtained from Figure 6.5 is the calculated development rate of 4.5
microns per minute. That value for the decomposition rate places the BTBPI-TMM PAG
at 80% faster than the FABA based PAG, confirming the claims made in previous
chapters and supporting results found by Lamanna et.al.
This study would not be complete without examining the perfluorinated sulfonic
acid PAGs, triflate and nonaflate. First, a thick film sample of TBMODS-TF (top
performing triflic acid PAG) was decomposed using the same rate determining method.
Figure 6.3 presents this data below.
65
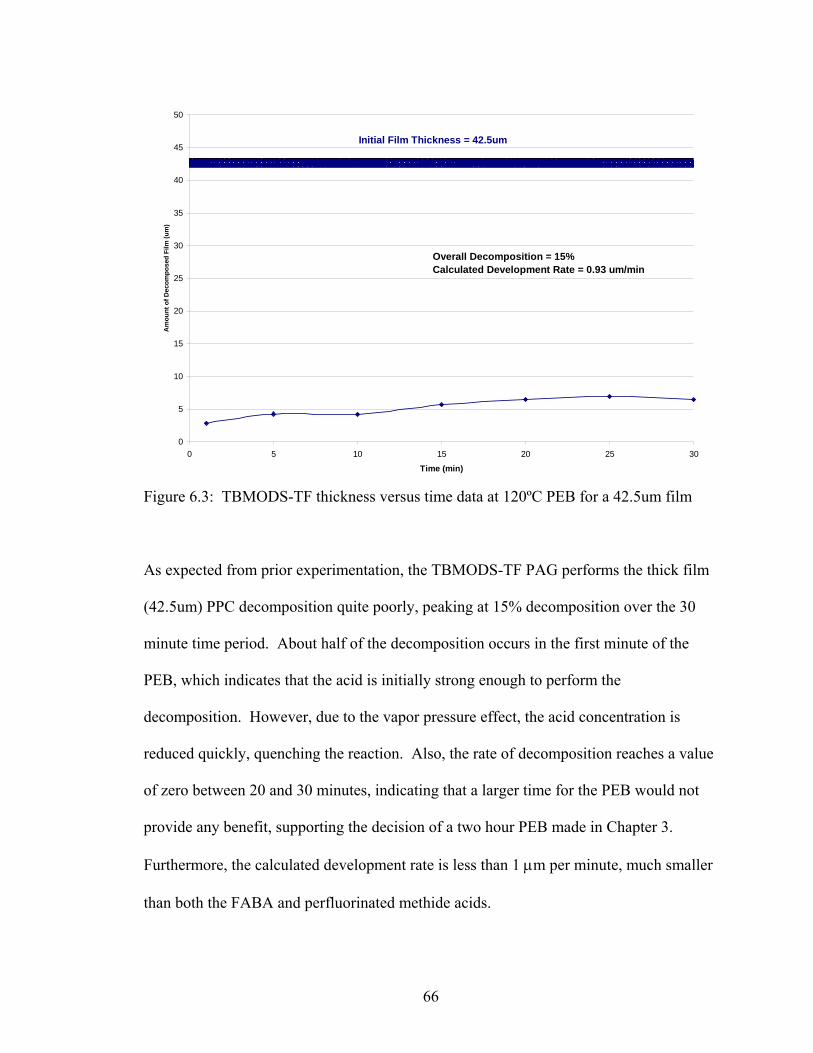
66
0
5
10
15
20
25
30
35
40
45
50
0 5 10 15 20 25 30
Time (min)
Am
ount
of D
ecom
pose
d Fi
lm (u
m)
Overall Decomposition = 15%Calculated Development Rate = 0.93 um/min
Initial Film Thickness = 42.5um
Figure 6.3: TBMODS-TF thickness versus time data at 120ºC PEB for a 42.5um film
As expected from prior experimentation, the TBMODS-TF PAG performs the thick film
(42.5um) PPC decomposition quite poorly, peaking at 15% decomposition over the 30
minute time period. About half of the decomposition occurs in the first minute of the
PEB, which indicates that the acid is initially strong enough to perform the
decomposition. However, due to the vapor pressure effect, the acid concentration is
reduced quickly, quenching the reaction. Also, the rate of decomposition reaches a value
of zero between 20 and 30 minutes, indicating that a larger time for the PEB would not
provide any benefit, supporting the decision of a two hour PEB made in Chapter 3.
Furthermore, the calculated development rate is less than 1 µm per minute, much smaller
than both the FABA and perfluorinated methide acids.

Moving onto the nonaflic acid PAG, DPI-NF, one might expect similar results to
the triflic acid PAG. Figure 6.4 below shows that this is not the case.
0
5
10
15
20
25
30
35
40
45
50
0 5 10 15 20 25 30 35 40 45
Time (min)
Am
ount
of D
ecom
pose
d Fi
lm (u
m)
Overall Decomposition = 86%Calculated Development Rate = 1.5 um/min
Initial Film Thickness = 44um
Figure 6.4: DPI-NF thickness versus time data at 120ºC PEB for a 44um film
Contrary to prior experimentation with thinner (~10um) PPC films, this thicker (~44um)
PPC film was decomposed at a significantly high value of 86%. Recalling data from
Chapter 5, the DPI-NF was only able to achieve 33% decomposition on a 120ºC hotplate
with silicon as the substrate. Also seen in Chapter 3 and 5, in the furnace environments,
the performance of the DPI-NF similarly reached a decomposition value of
approximately 35%. These results suggest that this dramatic performance increase may
be a function of the increased film thickness. If the thickness of the PPC film is an
important factor, a film with a thickness in between 10um and 44um would result in
67

decomposition between 33% and 86%. Figure 6.5 demonstrates that the previous
statement is in fact true.
0
5
10
15
20
25
0 5 10 15 20 25 30 35 40 45
Time (min)
Am
ount
of D
ecom
pose
d Fi
lm (u
m)
Overall Decomposition = 63%Calculated Development Rate = 0.88 um/min
Initial Film Thickness = 22.5 um
Figure 6.5: DPI-NF thickness versus time data at 120ºC PEB for a 22.5um film
With an overall decomposition performance of 63%, the 22.5 micron film supports the
aforementioned hypothesis. Another noteworthy fact derived from the comparison
between Figure 6.4 and 6.5 comes from the decrease in the calculated development rate
for a thinner film. However, this result is not surprising since the decrease in overall
decomposition performance of the thinner films suggests the absence of adequate acid
concentrations at a short time into the PEB, thus, slower rates. Both the decomposition
rate and percentage as a function of film thickness phenomenon are summarized in the
table below.
68

Table 6.1: Summary of all film thickness change phenomena Total Decomposition Percentages Thin Film (~10um) Medium Film (~25um) Thick Film (~50um) Rhodorsil-FABA 98% - 96%
BTBPI-TMM 97% - 99% TBMODS-TF 11% - 15%
DPI-NF 33% 63% 86% Calculated Decomposition Rates (um/min) Thin Film (~10um) Medium Film (~25um) Thick Film (~50um)
DPI-NF 0.34 0.88 1.5
Table 6.1 shows for a second time that the fast decomposition rates of FABA and
perfluorinated methide based PAGs do not show a strong correlation of overall
decomposition with film thickness. Moreover, the triflic acid PAG shows a modest 36%
increase (11% to 15%) in performance with the thicker films; however that figure pales in
comparison to the 160% increase observed with the nonaflic acid PAG. As mentioned in
the previous chapters, this system is quite complex, and simple reasoning may fall short
of capturing the complete explanation. Yet, some insight and clarification can be made.
The high vapor pressure of the triflic acid combined with the relatively small size of the
acid molecule would tend to counteract the effect of a thickness increase. Vaporization
and evaporation can only occur at the surface of the film. However, diffusion and
reaction can occur throughout the entirety of the film. Therefore, as the thickness of the
film increases, the volume where the reaction occurs can increase, where as the two-
dimensional surface for vaporization remains constant. As a volatile acid diffuses
through the film on a path toward the surface, it continues to participate in decomposition
reactions. A longer diffusional path will yield an increased number of reactions and a
greater overall decomposition. As previously mentioned, the high vapor pressure of the
69

70
triflic acid still causes it to evacuate the system without much more decomposition, but
the mediocre (relative to other PAG acids used) vapor pressure of nonaflic acid performs
quite differently. These PAG / PPC systems can be approximately modeled by a one-
dimensional transient diffusional differential equation. If the reaction effects are
neglected, the partial differential equation simplifies to the following:
tC
zCD
∂∂
=∂∂
2
2
, (Equation 6.5)
where D is the overall diffusion coefficient for the acid in PPC, C is the concentration of
the acid , z is the axis of diffusion, and t is the time. It is understood that neglecting the
reaction term may be a poor assumption; however, it is necessary to generate a useful
model. If a reaction is allowed to proceed, not only will it add an additional term to the
PDE, but it will also make the thickness of the film a function of time. These
complications are not desired for this basic analysis. To proceed with solving the
simplified equation, one initial condition and two boundary conditions are required. The
initial condition is simply that the concentration of acid in the PPC is uniform at time
zero, shown by the following relationship:
oCC = for all z, at t = 0, (Equation 6.6)
where CP
oP is the initial acid concentration. The boundary condition at the base of the film
is straightforward since the flux of acid as the surface of the silicon/glass substrate is
zero, shown by Equation 6.7,

71
0=dzdC for all t > 0, at z = 0, (Equation 6.7)
Unfortunately, the same cannot be said for the boundary condition at the surface of the
film. There will be two concentration profiles in this system, one throughout the film
itself and one occurring in the boundary layer formed just above the film from the
convective flow of the fume hood. If both these concentration profiles are considered,
then the following boundary condition arises assuming a linear concentration profile in
the boundary layer:
)( infCCkdzdcD g
c −=− for all t > 0, at z = l, (Equation 6.8)
where kBcB is the mass transfer coefficient, CP
gP is the concentration of the acid on the surface
of the film in the gaseous state, CP
infP is the concentration of the gas at the edge of the
boundary layer and the surrounding gas, and l is equal to the thickness of the film. The
assumption of a linear profile is appropriate for systems with low concentrations. Also,
since the fumehood is cycling in fresh gas, the value of CP
infP is assumed to be zero.
Furthermore, for these low concentrations, the following relationship between the surface
of the film and the gas is relevant:
gs CKC ⋅= , (Equation 6.9)

72
where CP
sP is the concentration of the acid on the surface of the film in the solid and K is
the partition coefficient relating the two concentrations, basically an equilibrium or
Henry’s Law type constant. This results in the following equation:
sc CKD
kdzdc
⎟⎠⎞
⎜⎝⎛
⋅−= for all t > 0, at z = l. (Equation 6.10)
A literature search yielded no accurate information on the partition coefficient for these
systems, so using this boundary condition to create a model would be difficult. However,
if another assumption is made that if the mass transfer in the boundary layer of the system
is fast, the equation becomes solely diffusion limited and the external boundary layer can
be neglected. This assumption simplifies the second boundary condition to the following
equation:
0=C for all t > 0, at z = l. (Equation 6.11)
Now, only the overall diffusion coefficient remains as a system parameter. Locating an
accurate value for this variable is also a difficult task. A body of work published by
Stewart et.al., performed experimentation with nonaflic acid in unreactive photoresist
analogues in order to arrive at an overall diffusional coefficient free of reaction based
confounds. In order to compare their work on poly(4-isopropyloxycarbonyloxystyrene)
(IPOCST) and poly(4-neopentyloxycarbonyloxystyrene) (NPOCST) with the PPC
polymer used in this study, a basis of comparison must be created. Common practice for
comparing similar polymers is to use their glass transition temperatures (TBg B) as a

benchmark of equivalence. Basically, PPC will be a similar diffusional environment to
IPOCST and NPOCST when heated to their individual Tg’s. The Tg’s of IPOCST and
NPOCST are 88ºC and 82ºC respectively [7]. A conservative estimate of the Tg of PPC
is about 40ºC. The following figure is an estimation of the average nonaflic acid
diffusivity of the IPOCST and NPOCST polymers as calculated by Stewart et.al.
y = 4.67E-15x2 - 9.45E-13x + 4.77E-11R2 = 9.95E-01
0.00E+00
5.00E-13
1.00E-12
1.50E-12
2.00E-12
2.50E-12
3.00E-12
100 105 110 115 120 125 130
Temperature (ºC)
D (c
m^2
/s)
Figure 6.6: Average calculated acid diffusion coefficients for inert polymer systems (Data points provided by Stewart et.al.) Included in the above figure is a second order polynomial regression equation, which
accurately represents the collected data. Since the average Tg of the polymers used by
Stewart et.al. is 85ºC, the above data must be extrapolated to 165ºC in order to represent
a PPC system at 120ºC. Using the regression equation displayed in Figure 6.6 with a
73
temperature (x) of 165ºC results in an estimated diffusion coefficient (y) of 1.89x10⁻¹¹
cm2/s.
Now, by using the estimated value for the diffusion coefficient and the simplified
boundary and initial conditions in Equations 6.6, 6.7, and 6.11, the PDE in Equation 6.5
can be solved. Using the computer program, FEMLAB, a numerical solution can be
created for a variety of different situations using the nonaflic acid PAG. The following
series of curves simulate the diffusion of nonaflic acid out of a 10um film at 120ºC over a
time period of 1800 seconds (30 minutes). For ease of analysis, an actual value for
concentration as been replaced by a dimensionless term, theta, the unaccomplished
fraction. A value of one for theta means 100% of the acid remains in the system.
74

Figure 6.7: Concentration profile model for nonaflic acid in a 10um film over 30 minutes
75

The concentration curves for 1, 15 and 30 minutes in Figure 6.7 do not show as much
acid removal as may be expected from the experimental data collected that shows only
33% decomposition for a 10um thick film. However, this underestimation of the acid
diffusion was also found to be true in the work performed by Stewart et.al. It appears
that there may be a significant amount of reaction enhanced diffusion taking place in
these systems. Specifically for PPC, as the reaction proceeds and volatile products are
generated, enhanced diffusional pathways will be created by the increasing amount of gas
escaping the film. A more valuable comparison can be seen in Figure 6.8.
76

Figure 6.8: Concentration profile model for nonaflic acid for both 10um (top) and 50um (bottom) films at 30 minutes
The curve on the top is the same 10um concentration model as seen in the last curve of
Figure 6.7; however, the curve on the bottom is the model for a 50 micron film using the
same conditions. Clearly, the 50 um model curve shows the majority of the acid in the
film is at its original concentration, which is not the case in the 10 um model. Pulling all
this information together, solving the simplified diffusional based PDE resulted in
supporting evidence for the correlation between film thickness and overall decomposition
percentage for nonaflic acid based PAGs.
77

6.3 Conclusions
Summarizing important conclusions made in this chapter, first, it was discovered
that the perfluorinated methide based PAG did in fact have the fastest decomposition rate
at 4.5 um/min for a thick film (~50 um). The FABA based PAG was second with a rate
of 2.5um/min. The nonaflate and triflate were the slowest at 1.5 and 0.93 um/min
respectively. This result supports conclusions explaining the performance of the BTBPI-
TMM PAG despite its high vapor pressure. Furthermore, the decomposition versus time
curves also continued to support the hypothesis that the vapor pressure is the limiting
factor for PPC decomposition with triflic and nonaflic acid PAGs. Finally, the nonaflic
PAG was found to strongly correlate its performance with the thickness of the PPC film.
As the film becomes ever thicker (10 um to 50 um), the performance of the DPI-NF PAG
increased 160%. A simple diffusional model was generated in order to support the theory
that it is the relationship between the two-dimensional surface vaporization versus the
three-dimensional reaction occurring in the film that causes this result. Future work
improving upon the diffusional based model by accounting for the reaction term,
measuring the partition coefficient, K, and expanding this analysis to other acids would
improve the level of understanding of these systems.
78

CHAPTER 7
COMBINATION PAG STUDY
A significant amount of knowledge has been gained from the experimentation in
the previous four chapters. This chapter describes an attempt to use that knowledge in
creating a new photo-active PPC system using multiple PAGs with different desirable
properties. The PAGs selected for this analysis are Rhodorsil-FABA and DPI-NF. It has
been demonstrated on multiple occasions that the FABA acid has very high
decomposition figures, mostly 96% and above. The problematic issue with the FABA
acid is the molecular bulkiness. At 120ºC, the majority of the acid does not decompose
into more volatile species leaving behind a PAG based residue (see Chapter 8 for the
complete residue analysis). The other PAG, DPI-NF, with a mediocre acid vapor
pressure has been shown to have moderate levels of decomposition from approximately
35% to 85% based on film thickness (see Chapter 4 and 6). The problematic issue with
this PAG is that the acid vaporizes out of the film prior to the completion of the film’s
decomposition. Looking at the benefits and drawbacks of these two PAGs, one can
imagine a situation where their combination would produce a viable decomposition
system. By adding a small amount of Rhodorsil-FABA to DPI-NF, the hypothesis is that
the nonaflic acid would complete the majority of the decomposition at the beginning of
the PEB. As the DPI-NF is reducing the thickness of the film, two things are happening.
One, the nonaflic acid is vaporizing from the system, reducing its effectiveness. Two, the
small amount of non-volatile Rhodorsil-FABA is becoming more concentrated. As the
FABA acid concentrates, it eventually takes over as the major source of catalytic acid and
79

completes the decomposition. Theoretically, since the sample was initially loaded with a
smaller amount of Rhodorsil-FABA, the amount of residue remaining on the sample will
decrease when compared to a sample with 100% FABA loading.
For this experiment to have meaning, the amount of Rhodorsil-FABA added to
the polymer solution should not be enough to complete the decomposition alone. Only a
small amount of FABA acid should be required to decompose the PPC film; however, it
has been mentioned both in the Introduction and Chapter 3 that the presence of polyether
groups in the polycarbonate poisons the catalytic cycle. Therefore, an excess of PAG is
needed to fully complete the decomposition. Using the rate of decomposition
experimental method described in Chapter 6, a thick film (~50um) PPC sample set was
created with only 1% Rhodorsil-FABA loading and processed on a hotplate at 120ºC.
Figure 7.1 shows the result of this experiment.
0
10
20
30
40
50
60
0 5 10 15 20 25 30
Time (min)
Am
ount
of D
ecom
pose
d Fi
lm (u
m)
Initial Measured Film Thickness = 54um
Overall Decomposition = 8%Calculated Development Rate = 0.15 um/min
Figure 7.1: Rhodorsil-FABA rate of decomposition experiment with 1% PAG loading
80

81
The above figure clearly demonstrates that 30 minutes of PEB at 120ºC with 1%
Rhodorsil-FABA loading is inadequate for PPC decomposition. The total decomposition
is only 8% and the rate is extremely slow at 0.15 µm per minute.
For a proper comparison, the total PAG loading for this combination PAG study
needs to remain at 4% Rhodorsil-FABA molecular weight equivalent (see Chapter 3).
Therefore, if the solution is to contain 1% actual Rhodorsil-FABA, it can only contain
3% molar equivalent DPI-NF. Since, 4% DPI-NF loading has been shown on multiple
occasions to be inadequate for PPC decomposition, by way of reason, 3% would also be
inadequate. By combining the 1% Rhodorsil-FABA and 3% molar equivalent DPI-NF, a
system has been created with each individual component lacking the ability to fully
decompose a PPC film; however, the hypothesis of the combination PAG states that the
sum is greater than its parts, and the two acids working together will be successful. A
thick film (~50 um) rate of decomposition study was performed using this solution, and
the results are displayed in Figure 7.2.

0
5
10
15
20
25
30
35
40
45
50
0 5 10 15 20 25 30
Time (min)
Am
ount
of D
ecom
pose
d Fi
lm (u
m)
Overall Decomposition = 98%Calculated Development Rate = 2.5 um/min
Initial Film Thickness = 45um
Figure 7.2: Combination PAG rate of decomposition experiment with a 45um initial film
The experiment proved to be a success with an overall decomposition percentage of 98%
and a calculated rate of 2.5 um/min, which is 1 um/min better than nonaflic acid alone.
The remaining residue on the film was mostly clear, not the dark brown associated with
the Rhodorsil-FABA. An XPS performed on the surface of the residue is shown in the
following figure.
82

Figure 7.3: XPS analysis of the Combination PAG residue for a PEB at 120ºC
The XPS above shows only the presence of carbon, oxygen and fluorine and no boron,
sulfur, or iodine. It is possible that the majority of the residue is composed of unreacted
PPC and polyether, masking the small amount of the other elements besides the abundant
fluorine. For a more in depth discussion of this residue and the pure FABA and
perfluorinated methide PAGs can be found in Chapter 8.
83

The ability of Combination PAG to perform decomposition of thick PPC films
was just presented; however, from Chapter 6, it is evident that the nonaflate based PAG
would perform its best under the thick film conditions. To understand whether or not the
Combination PAG shared the same positive correlation between performance and film
thickness as the DPI-NF PAG, the rate of decomposition experiments were run with both
the medium (~25 um) and thin (~10 um) films. The results are shown in the following
two figures.
0
5
10
15
20
25
0 5 10 15 20 25 30
Time (min)
Am
ount
of D
ecom
pose
d Fi
lm (u
m)
Overall Decomposition = 98%Calculated Development Rate = 2.0 um/min
Initial Film Thickness = 23um
Figure 7.4: Combination PAG rate of decomposition experiment with a 23um initial film
84

0
2
4
6
8
10
12
0 5 10 15 20 25 30
Time (min)
Am
ount
of D
ecom
pose
d Fi
lm (u
m)
Overall Decomposition = 98%Calculated Development Rate = 0.61 um/min
Initial Film Thickness = 10.5um
Figure 7.5: Combination PAG rate of decomposition experiment with a 10.5um initial film In both Figures 7.4 and 7.5, the combination PAG is able to decompose 98% of the film,
which counteracts the typical behavior of the DPI-NF. As the film thickness decreases,
the calculated development rate also decreases; however, this is a common result seen in
all of the PAGs in this body of work, so that result is not alarming.
In summary, the Combination PAG experiment was a success. At a variety of
thicknesses it was able to decompose the 98% of the PPC film. Perhaps more
significantly, a hypothesis that was generated and upheld based on critical properties of
the PAG (i.e. vapor pressure of the acid) identified by this report. It appears that the film
remaining on the substrate may contain a majority of unreacted polymer compared to
residual PAG, which seems to be contrary to the FABA and methide residues. A full
85

analysis of the XPS data will take place in the next chapter. Finally, the
accomplishments in this chapter warrant further studies with Combination PAGs. Some
possible experiments could include altering the PAG percentage loading, using different
PAGs (i.e. DPI-NF and BTBPI-TMM), and attempting to combine three PAGs by
including triflic acid in the system.
86
CHAPTER 8
RESIDUE ANALYSIS
Up to this point in the report, despite the numerous polymer solutions created and
different types of experimental conditions, a 100% clean decomposition of a PPC film
has not yet been achieved. Part of the problem lies in the polyether impurities created
during the polymerization of the polycarbonate. The polyether groups not only poison
the catalytic cycle of decomposition as described in Chapter 6 and the Introduction, they
also do not volatize in the same manner as the polycarbonate groups, thus, leaving a
residue behind. The other main contributor to the residue problem is the PAG. During
the PEB, not all of the larger cation or anionic groups break apart into smaller more
volatile component, also leaving behind a residue. By using a detailed X-ray
photoelectron spectroscopy surface analysis, it is possible to determine the elements
present in the residue as well as the nature of the bonding between the elements. XPS
data was collected on the residue of all the PAGs that completed at least 95% of the film
decomposition, which included the perfluorinated methide, FABA, and Combination acid
based PAGs. By understanding the compositions of the residues, steps can be taken to
help limit their presence, which would be important in the fabrication of microelectronic
devices as described in the Introduction.
The first residue that will be examined comes from the BTBPI-TMM (methide
based) PAG. For ease of reference, the structure of the PAG is found below.
87

I+
C-
S
S
S
OO
O
OO
O
F3C
CF3
F3C
Figure 8.1: Chemical structure of the BTBPI-TMM PAG
The elements (besides hydrogen) found in BTBPI-TMM, as listed in order of decreasing
abundance are carbon, fluorine, oxygen, sulfur, and iodine, An XPS of the residue
should include these elements as well as additional carbon and oxygen from the
polycarbonate and polyether groups. The XPS data below was first presented in Chapter
3; however, to facilitate the discussion, it is displayed again in Figure 8.2.
88

Figure 8.2: X-ray photoelectron spectroscopy (XPS) of BTBPI-TMM residue
All of the elements found in the BTBPI-TMM and the polymer are shown in the XPS
data above except iodine. Being the least abundant element on a cation with low thermal
stability, the absence of iodine is not surprising. Looking at the percentages of each
element in Figure 8.2, they reflect expectations with elemental carbon and oxygen
making up a large portion of the residue due to their presence in both the PAG and
polymer. The content of fluorine and sulfur is quite small suggesting a low presence of
PAG residue, as anticipated from the substantial vapor pressure of the methide acid.
89

Also, there is three times more fluorine than sulfur, which is expected from looking at the
molecular structure in Figure 8.1. Continuing to observe stoichiometric relationships, the
oxygen content coming from the PAG would then be 6%, about half of the total amount.
The remaining 5% - 6% would come from the polymer groups. The above discussion is
important, but just as significant is the analysis of each elemental curve to determine their
bonding states. The carbon analysis for BTBPI-TMM is shown below.
Figure 8.3: XPS analysis of BTBPI-TMM focusing on the carbon bonding data
90

Over 80% of the carbon in the residue is bonded to other carbon molecules. Since there
are no carbon-carbon bonds in the anion of BTBPI-TMM, they must come from either
the cation portion of the PAG or the polymer. The cation portion of the PAG dissociates
into smaller, more volatile components when releasing a hydrogen molecule; however,
the presence of the tert-butyl groups on the benzene rings add molecular bulk and may be
the reason for the high carbon-carbon bonding content. Other than the bulky cation,
residual polyether or unreacted polycarbonate would also add to the carbon-carbon
bonding level. Moreover, the polymer groups are the only source carbon-oxygen bonds,
which compose about 6% of the residue. Therefore, the presence of carbon-oxygen
bonds has a positive correlation with the amount of residual polymer. On the other hand,
the only source of carbon-sulfur and carbon-fluorine bonds can be the anion portion of
the PAG. With a peak at 292.5eV, the carbon-fluorine bond was correctly analyzed as a
CF3 group, which is the only type of fluorine group in the methide acid. Furthermore,
there are three sulfur atoms each bonded to two carbons and three CF3 groups per anion.
Therefore it makes sense that the carbon-sulfur and carbon-fluorine would be similar in
percentage with carbon-sulfur being slightly higher. The low percentages of both these
bonding groups imply a small amount of residual acid. Moving on to the oxygen
analysis, the XPS data is presented in Figure 8.4.
91

Figure 8.4: XPS analysis of BTBPI-TMM focusing on the oxygen bonding data
The above curve suggests that 100% of the oxygen is bonded to carbon. From the
already discovered presence of sulfur and the slight asymmetry of the curve suggests this
may not be the case. The hypothesis is that there is also oxygen-sulfur bonds present in
the residue, as the structure of the methide acid indicates. To gain more insight into this
inquiry, a sulfur bonding analysis was performed and can be found in Figure 8.5.
92

Figure 8.5: XPS analysis of BTBPI-TMM focusing on the sulfur bonding data
With a binding energy at 169.5 eV, Figure 8.5 illustrates that the sulfur bonds are
indicative of a sulfate group. The oxidized sulfur groups observed in the structure of the
BTBPI-TMM PAG support this data. Progressing to the final elemental analysis, the
fluorine data is shown in Figure 8.6.
93

Figure 8.6: XPS analysis of BTBPI-TMM focusing on the fluorine bonding data
As expected, the above symmetrical curve shows 100% of the fluorine bonds are bonded
in the form of CF3. The presence of other carbon-fluorine bonds would suggest the anion
was decomposing or there are fluorinated impurities. Conveniently, none were found.
Overall, the XPS analysis is supportive of prior conclusions formed about the
perfluorinated methide based PAG. The elements present were found to be
stiochiometrically viable, and the bonding groups were accurate based on the structure of
94
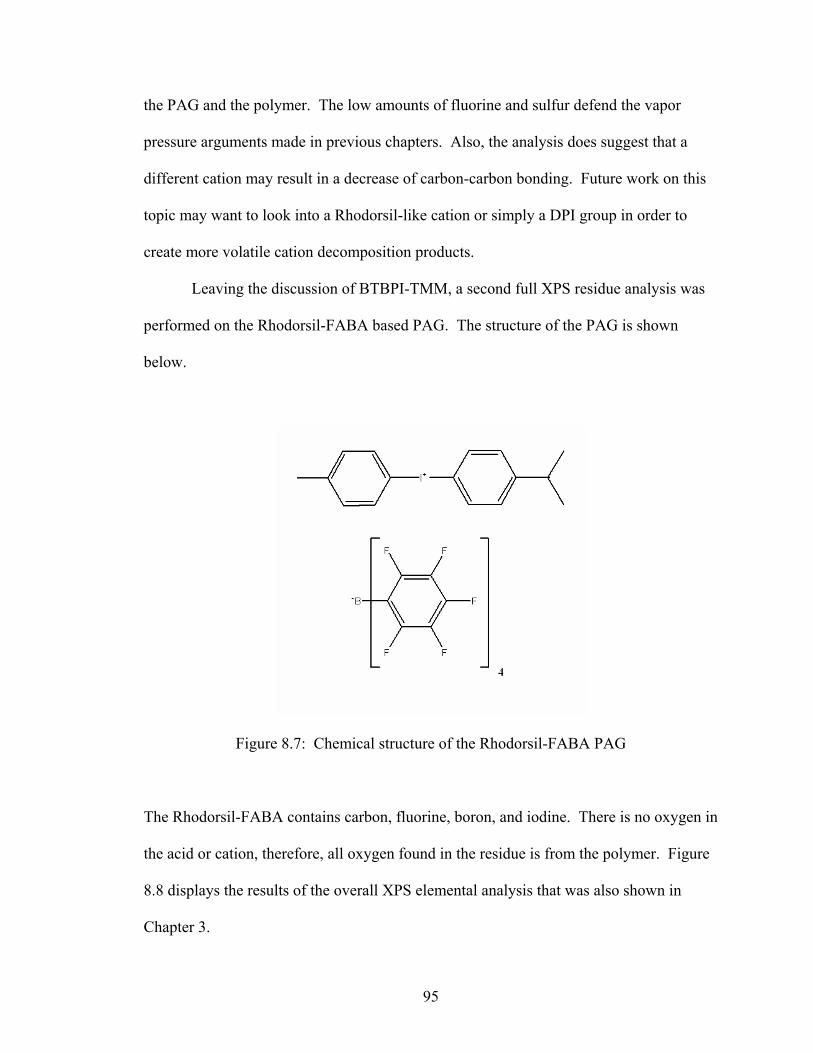
the PAG and the polymer. The low amounts of fluorine and sulfur defend the vapor
pressure arguments made in previous chapters. Also, the analysis does suggest that a
different cation may result in a decrease of carbon-carbon bonding. Future work on this
topic may want to look into a Rhodorsil-like cation or simply a DPI group in order to
create more volatile cation decomposition products.
Leaving the discussion of BTBPI-TMM, a second full XPS residue analysis was
performed on the Rhodorsil-FABA based PAG. The structure of the PAG is shown
below.
Figure 8.7: Chemical structure of the Rhodorsil-FABA PAG
The Rhodorsil-FABA contains carbon, fluorine, boron, and iodine. There is no oxygen in
the acid or cation, therefore, all oxygen found in the residue is from the polymer. Figure
8.8 displays the results of the overall XPS elemental analysis that was also shown in
Chapter 3.
95

Figure 8.8: X-ray photoelectron spectroscopy (XPS) of the Rhodorsil-FABA residue
As predicted, the elements present are carbon, fluorine, oxygen, boron, and iodine, listed
in order of abundance. Elemental carbon was found to consist of about 66% of the
residue, with fluorine also quite high at 31%. In the FABA acid the carbon and fluorine
content has a stoichiometric relationship of 6:5, which indicates that half of the carbon
found is from the acid. The remaining carbon would be from the cation and polymer
residues. Such high levels of fluorine signify large residual contributions from the acid
96
group, as expected from FABA’s negligible vapor pressure. With its only contribution
coming from the residual polymer, the oxygen content is fairly low at 2.5%. This result
points toward a high level of polymer decomposition. In addition, the boron percentage,
not shown in Figure 8.8, is approximately 1% - 2%. With 24 carbon atoms and 20
fluorine atoms associated with each boron atom, this result also agrees with the acid
structure. Finally, there is a trace amount of iodine in the system from the incomplete
decomposition and vaporization of the cation portion of the PAG.
Now examining each element and its bonding groups, the XPS data for carbon in
the Rhodorsil-FABA residue is shown below.
97

Figure 8.9: XPS analysis of Rhodorsil-FABA focusing on the carbon bonding data
The carbon analysis in Figure 8.9 shows very similar ratios to the overall elemental
analysis. The carbon-fluorine bonds make up about 30% of all the residual carbon, which
implies that about one third of the residual carbon is from the FABA acid. Since the
original acid loading was only 4%, this result shows that the acid is not leaving the
system causing it to concentrate during the decomposition. Putting aside acid
contributions leaves approximately 30% of the carbon-carbon bonds as a result of the
98

cation and polymer. Also a result of the residual polymer is the carbon-oxygen bonds,
which make up about 8% of the elemental carbon. Being the lowest percentage of all the
carbon bonds suggests that the polymer is contributing the least amount to the overall
residue. Since the only source of oxygen is in the polymer residue, the XPS bonding data
for oxygen is one symmetrical curve, shown below.
Figure 8.10: XPS analysis of Rhodorsil-FABA focusing on the oxygen bonding data
99

The single oxygen-carbon symmetrical bonding curve provides little insight into the
overall composition of the residue, but it does support the molecular structures of the
PAG components and indicate that no major side reactions involving oxygen occur. The
final elemental bonding analysis is with fluorine and can be found below.
Figure 8.11: XPS analysis of Rhodorsil-FABA focusing on the fluorine bonding data
100

The XPS curve for fluorine in Figure 8.11 is slightly asymmetrical, which indicates that
fluorine has two different bonding groups. As shown, the majority of the fluorine has a
single bond with carbon. The remaining 12% is a result of the bonding environment that
causes a data shift in the XPS. This shift is due to the benzene ring that the fluorine
atoms are bonded. Any other groups, like CF2 or CF3 would not be consistent with the
structure of the FABA acid, so the XPS results are satisfactory.
Due to the small amounts of iodine and boron detected by the XPS instrument,
performing a bonding analysis may have lead to accurate conclusions. For this reason,
those figures were omitted from this report; however, it can be said with strong
confidence that based on the PAG’s structure, both iodine and boron would show
bonding only with carbon.
Taken as a whole, the XPS of the FABA acid PAG proceeded as expected. The
elements identified along with their stoichiometric percentages and bonding associations
were supported by the structure of the PAG. It was found that the acid made up a large
majority, about 30%, of residue on the substrate. This result defends the low to
negligible vapor pressure argument for the FABA acid. Also, the low carbon-oxygen
content suggests a fairly complete decomposition of the polymer film with residuals
caused mostly by the presence of polyether impurities.
Moving to the final XPS analysis, the residue from the Combination PAG sample
will now be discussed. As a point of reference, the structure of both PAGs used to create
this unique polymer solution are shown in Figure 8.12.
101

Figure 8.12: Structure of the Combination PAG with 1% Rhodorsil-FABA (left) and 3% DPI-NF (right) With this PAG combination, there is a possibility for the presence of six different
elements: carbon, oxygen, fluorine, sulfur, iodine, and boron. However, the overall XPS
analysis only shows three, as shown in Figure 8.13.
102

Figure 8.13: X-ray photoelectron spectroscopy (XPS) of the Combination PAG residue
The Combination PAG XPS only shows the presence of carbon, oxygen, and fluorine. It
would seem that the trace amounts of iodine, boron, and sulfur have been masked by the
more prevalent elements. Recalling Chapter 7, the statement was made that the residue
from the Combination PAG appeared to resemble the PPC film, and it did not show many
of the brown tar or oily residue characteristics of the FABA and methide PAGs. If the
data in Figure 8.13 is in fact valid, then it supports the claim that the majority of the
103

residue in the Combination PAG samples is from the polymer. Further supporting this
claim are the high levels of carbon and oxygen at 73% and 16% respectively. The
fluorine content is the lowest at 11%, and the bonding analysis will be able to tell how
much fluorine is coming from the FABA and nonaflic acids. Figure 8.14 shows the
bonding analysis for carbon.
Figure 8.14: XPS analysis of Combination PAG focusing on the carbon bonding data
104

The largest curve in Figure 8.14 is the carbon-carbon curve at 68%, which has been
typical of these analyses. More importantly is the high carbon-oxygen content at almost
18%. This indicates that a large portion of the residue is from unreacted polycarbonate or
and residual polyether. The high carbon-oxygen levels support the statement that the
presence of significant levels of polymer is masking the trace elements not found on the
overall XPS. It also supports the visual observations made of the residue after PEB.
Also quite important is the analysis of the carbon-fluorine bonds, of which there are two
different types. The CF bond is associated with the FABA acid, and it is four times as
prevalent as the CF2 bond associated with the nonaflic acid (also includes CF3). This is a
very exciting result. Recall that the initial polymer solution contained only 1%
Rhodorsil-FABA and 3% DPI-NF (molar equivalent). In order for the acid ratio to
switch so dramatically from the initial solution to the residue, the nonaflic acid would
have had to evacuate the system through vaporization, leaving behind the FABA acid in a
more concentrated state. This analysis mirrors the hypothesis generated for the creation
of the Combination PAG back in Chapter 7. Once again, the photo-acid vapor pressure
theory has been supported.
For the sake of completeness, Figure 8.15 displays the oxygen bonding curve for
the Combination PAG.
105

Figure 8.15: XPS analysis of Combination PAG focusing on the oxygen bonding data
The curve shows 100% bonding between oxygen and carbon and none between oxygen
and sulfur. The curve appears to be quite symmetrical, so it is believable that this result
is valid. Furthermore, the single curve supports the overall XPS analysis and its absence
of any sulfur compounds do to the vaporization of the nonaflic acid.
Looking back at all three of the XPS residue analyses, some overall conclusions
can be drawn. First, the FABA and methide based PAGs contain less residual polymer
106

when compared to the Combination PAG using the carbon-oxygen bonding percentage as
the benchmark. Second, vapor pressure based conclusions were upheld in each PAG.
The volatile perfluorinated methide PAG had smaller contributions from CF3 compounds,
which resulted in the largest observed carbon-carbon bond residue contribution observed
in any of the PAGs. The non-volatile FABA acid PAG had large fluorine residue
contributions from the very bulky acid. The mixed acid groups of the combination PAG
had a residue in which the volatile nonaflic acid left the system while concentrating the
FABA acid. Third, the visual observation that each residue appeared to be different was
supported with different atomic composition in each XPS. The oily methide residue was
attributed to low molecular weight hydrocarbons, the dark brown FABA residue was
attributed to the remaining acid group, and the Combination PAG residue was attributed
to unreacted polymer. The result of the Combination PAG suggests that further tuning of
the PAG levels or the PAGs themselves needs to be done in future work. Finally, XPS
was found to be a great tool for analyzing decomposition residues. In each case,
stoichiometric and bonding relationships were valid based on the structure of the polymer
and PAG.
One final residue analysis needs to be completed in order answer some questions
about the methide based PAG residue generated in Chapter 6. Call to mind Figure 6.2,
which displayed the rate of decomposition data for the BTBPI-TMM PAG. The residue
for this thick film (~50um) decomposition was difficult to measure with the profilometer
at and after 10 minutes due to its oily nature. The data collected from profiling the
sample illustrated that the amount of residue from the methide PAG might be lower than
that can be achieved from the FABA PAG. By performing a residual weight analysis
107

rather than a film thickness analysis, one should be able to avoid the pitfalls of an
improper measurement, while still collecting valid data. To perform this test, equivalent
sized pieces of silicon wafer were diced and weighed. Each wafer was spuncoat with a
polymer film targeted between 45 um and 50 um. The thickness of trial samples were
measured to unsure the spin recipe produced equivalent film thicknesses for both the
methide and FABA based solutions. The samples were soft baked and exposed by the
standards established in this report and weighed a second time. Special care was taken
while moving and weighing the samples to ensure that no additional mass was added or
subtracted due to errant particles or through poor/excessive handling. The samples were
then decomposed at 120ºC for 30 minutes on a hotplate and weighed one final time. By
subtracting the initial mass of the silicon wafer, the weight percent residue can easily be
calculated. The results of this experiment are shown in Table 8.1.
Table 8.1: Weight percent residue analysis for the methide and FABA PAGs
Bare wafer
PPC on Wafer
Residue on Wafer
Residue Alone
Residue Remaining
(g) (%) DPI-FABA 1.3837 1.4641 1.3882 0.0045 5.60% BTBPI-TMM 1.3961 1.4915 1.3997 0.0036 3.77%
The most important column in Table 8.1 is the final column which shows the weight
percent of the remaining residue after decomposition. This analysis shows that the
methide PAG is indeed more efficient at decomposing the thick PPC films than the
FABA based PAG. As a point of note, it would not be valid to compare the weight
residue percentages with the residue thickness percentages presented in the other chapters
of this report. A confident recommendation can now be made to pursue fabricating
108

microelectronic devices using sacrificial PPC activated by a perfluorinated methide based
PAG.
109

APPENDIX A
PAG STRUCTURES
Figure A.1: Rhodorsil-FABA Structure, (tetrakis-(pentafluorophenyl)borate-4-
methylphenyl[4-(1-methylethyl)phenyl]iodonium)
Figure A.2: TTBPS-FABA, (tris(4-tert-butylphenyl)sulfonium tetrakis-
(pentafluorophenyl)borate)
110

Figure A.3: TPS-FABA, (triphenylsulfonium tetrakis-(pentafluorophenyl)borate)
Figure A.4: BTBPI-TF, (Bis(4-tert-butylphenyl)iodonium triflate)
Figure A.5: TBOMDS-TF, (tert-(butoxycarbonylmethoxynaphthyl)-diphenylsulfonium
triflate)
111
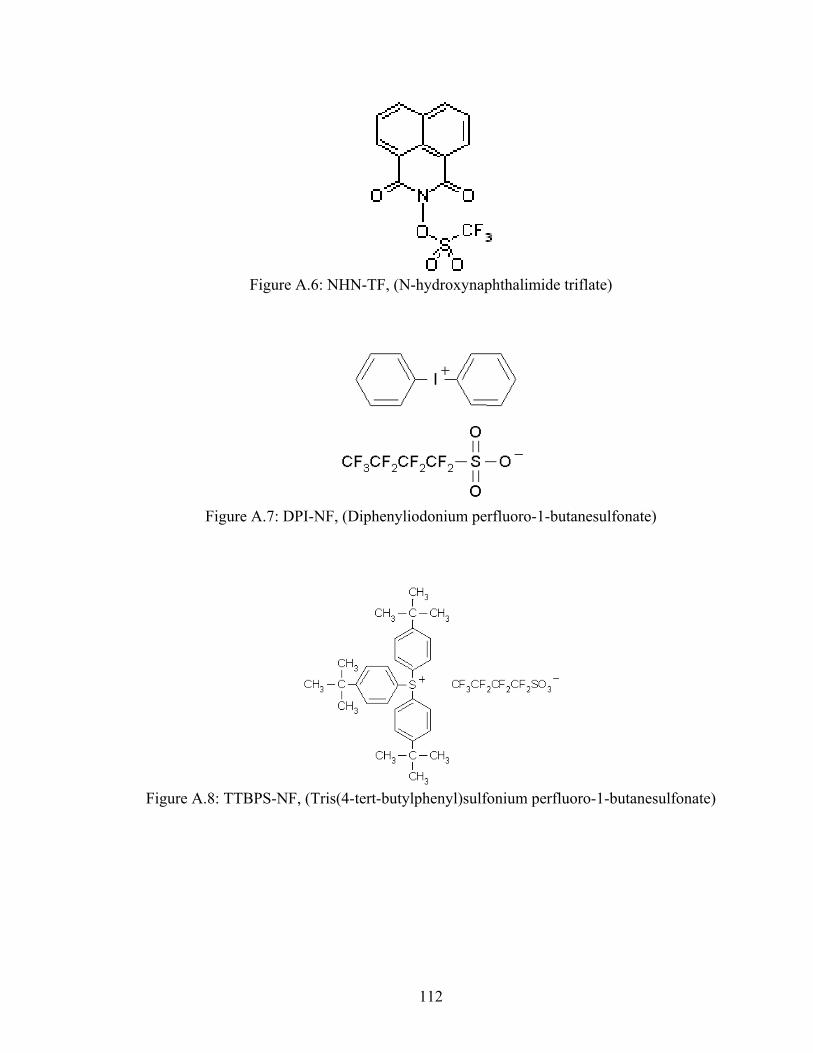
Figure A.6: NHN-TF, (N-hydroxynaphthalimide triflate)
Figure A.7: DPI-NF, (Diphenyliodonium perfluoro-1-butanesulfonate)
Figure A.8: TTBPS-NF, (Tris(4-tert-butylphenyl)sulfonium perfluoro-1-butanesulfonate)
112

Figure A.9: NHN-NF, (N-hydroxynaphthalimide perfluoro-1-butanesulfonate)
Figure A.10: NHNDC-NF, (N-hydroxy-5-norbornene-2,3-dicarboximide perfluoro-1-
butanesulfonate)
Figure A.11: BTBPI-TMM, (Bis(4-tert-butylphenyl)iodonium
tris(perfluoromethanesulfonyl)methide)
113

Figure A.12: BTBPI-BBI, (Bis(4-tert-butylphenyl)iodonium
bis(perfluorobutanesulfonyl)imide)
Figure A.13: DPI-DMOS, (Diphenyliodomium 9,10-dimethoxyanthracene-2-sulfonate)
Figure A.14: BTBPI-PTS, (Bis(4-tert-butylphenyl)iodonium p-toluenesulfonate)
114

Figure A.15: Ciba 263 Non-ionic PAG
Figure A.16: BTBPI-HDF (Bis(4-tert-butylphenyl)iodonium perfluoro-1-
octanesulfonate)
115

APPENDIX B
COMPLETE SET OF CATION STUDY DATA
This appendix contains the complete decomposition experimental data for PAGs
listed in Chapter 4 (Cation and Non-ionic PAG Study) that were not already displayed in
Chapter 3 (Photoacid Generator Anion Study).
0
1
2
3
4
5
6
7
8
9
60ºC Furnace 90ºC Furnace 120ºC Furnace 60ºC Hotplate 90ºC Hotplate 120ºC Hotplate
Sample Name
Film
Thi
ckne
ss (u
m)
Initial Thickness Final Thickness
15% 27% 24% 0% 7% 11%
Figure B.1: TBOMDS-TF PAG decomposition levels
116

0
1
2
3
4
5
6
7
8
60ºC Furnace 90ºC Furnace 120ºC Furnace 60ºC Hotplate 90ºC Hotplate 120ºC Hotplate
Sample Name
Film
Thi
ckne
ss (u
m)
Initial Thickness Final Thickness
7% 16% 19% 3% 9% 6%
Figure B.2: NHN-TF decomposition levels
0
1
2
3
4
5
6
7
8
9
60ºC Furnace 90ºC Furnace 120ºC Furnace 60ºC Hotplate 90ºC Hotplate 120ºC Hotplate
Sample Name
Film
Thi
ckne
ss (u
m)
Initial Thickness Final Thickness
17% 29% 33% 0% 13% 32%
Figure B.3: TTBPS-NF decomposition levels
117
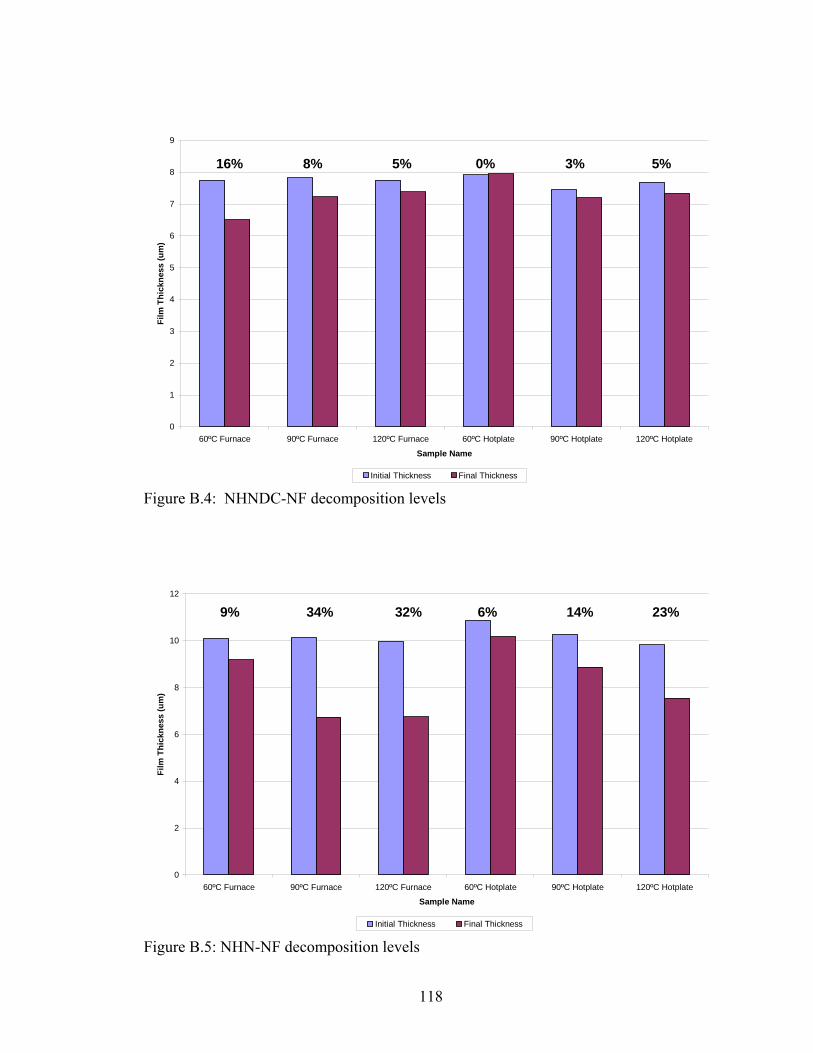
0
1
2
3
4
5
6
7
8
9
60ºC Furnace 90ºC Furnace 120ºC Furnace 60ºC Hotplate 90ºC Hotplate 120ºC Hotplate
Sample Name
Film
Thi
ckne
ss (u
m)
Initial Thickness Final Thickness
16% 8% 5% 0% 3% 5%
Figure B.4: NHNDC-NF decomposition levels
0
2
4
6
8
10
12
60ºC Furnace 90ºC Furnace 120ºC Furnace 60ºC Hotplate 90ºC Hotplate 120ºC Hotplate
Sample Name
Film
Thi
ckne
ss (u
m)
Initial Thickness Final Thickness
9% 34% 32% 6% 14% 23%
Figure B.5: NHN-NF decomposition levels
118

0
1
2
3
4
5
6
7
8
9
60ºC Furnace 90ºC Furnace 120ºC Furnace 60ºC Hotplate 90ºC Hotplate 120ºC Hotplate
Sample Name
Film
Thi
ckne
ss (u
m)
Initial Thickness Final Thickness
6% 91%85%2%94%89%
Figure B.6: TTBPS-FABA decomposition levels
0
1
2
3
4
5
6
7
8
9
60ºC Furnace 90ºC Furnace 120ºC Furnace 60ºC Hotplate 90ºC Hotplate 120ºC Hotplate
Sample Name
Film
Thi
ckne
ss (u
m)
Initial Thickness Final Thickness
96%94%63%97%88%30%
Figure B.7: TPS-FABA decomposition levels
119

0
1
2
3
4
5
6
7
8
60ºC Furnace 90ºC Furnace 120ºC Furnace 60ºC Hotplate 90ºC Hotplate 120ºC Hotplate
Sample Name
Film
Thi
ckne
ss (u
m)
Initial Thickness Final Thickness
8% 11% 10% 4% 1% 11%
Figure B.8: Ciba-263 decomposition levels
120

REFERENCES
[1] P. J. Joseph, H. A. Kelleher, S. A. B. Allen, P. A. Kohl; Journal of Micromechanics and Microengineering. 15, 35, 2005.
[2] J. P. Jayachandran, H. A. Reed, H. Zhen, L. F. Rhodes, C. L. Henderson, S. A. B.
Allen, and P. A. Kohl; Journal of Microelectromechanical Systems. 12(2), 147, 2003.
[3] H. A. Reed, C. E. White, V. Rao, S. A. B. Allen, C. L. Henderson, P. A. Kohl;
Journal of Micromechanics and Microengineering. 11, 733, 2001. [4] S. D. Burns, D. R. Medeiros, H. F. Johnson, G. M. Wallraff, W. D. Hinsberg, C.
G. Willison; Advances in Resist Technology and Processing XIX. 4690, 321, 2002.
[5] M. Padmanaban, R. Dammel, S. Lee, W. Kim, T. Kudo, D. Mckenzie, D.
Rahman; Advances in Resist Technology and Processing XX. 5039, 743, 2003. [6] X. Wu, H. A. Reed, Y. Wang, L. F. Rhodes, E. Elce, R. Ravikiran, R. A. Shick,
C. L. Henderson, S. A. B. Allen, P. A. Kohl; Journal of The Electrochemical Society. 150(9), H205, 2003.
[7] M. D. Stewart, D. J. Becker, T. B. Stachowiak, G. M. Schmid, T. B. Michaelson,
H. V. Tran, C. G. Willison; Advances in Resist Technology and Processing XIX. 4690, 943, 2002.
[8] T. H. Fedynyshyn, R. F. Sinta, W. A. Mowers, A. Cabral; Advances in Resist
Technology and Processing XX, 5039, 310, 2003. [9] C. E. White, C. L. Henderson; Advances in Resist Technology and Processing
XXI. 5376, 850, 2004. [10] C. E. White, C. L. Henderson; Advances in Resist Technology and Processing
XIX. 4690, 242, 2002. [11] D. Lee, X. Ma, W. M. Lamanna, G. Pawlowski; Advances in Resist Technology
and Processing XIX. 4690, 169, 2002. [12] W. M. Lamanna, C. R. Kessel, P. M. Savu, Y. Cheburkov, S. Brinduse, T. A.
Kestner, G. J. Lillquist, M. J. Parent, K. S. Moorhouse, Y. Zhang, G. Birznieks, T. Kruger, M. C. Pallazzotto; Advances in Resist Technology and Processing XIX. 4690, 817, 2002.
121

[13] G. M. Wallraff, C. E. Larson, N. Fender, B. Davis, D. Medeiros, J. Meute, W. M. Lamanna, M. J. Parent, T. Robeledo, G. Young; Advances in Resist Technology and Processing XIX. 4690, 160, 2002.
[14] J. Salas, P. J. Joseph, H. A. Kelleher, S. Park, S. A. B. Allen,
and P. A. Kohl; Journal of Vacuum Science and Technology. B22 (3), 953, 2004. [15] Rhodia global solutions for acid catalytic systems. (n.d). Retrieved November,
2005, from http://www.rhodia-ppa.com/media/PPA/push/Product/Acilys/acilysbrochure_final.pdf
[16] Ciba Specialty Chemicals, Photoacid Generators for Microlithography. (January
2003). Retrieved June, 2005, from http://www.cibasc.com/rz_photoacid_generators1.pdf
[17] Sigma-Aldrich Electronic Catalog on Photoacid Generators. Retrieved March,
2005, Sigma-Aldrich United States Web Site: http://www.sigmaaldrich.com/Area_of_Interest/The_Americas/United_States.htm
[18] Midori Kagaku Co., Ltd. Electronic Catalog on Photoacid Generators. Retrieved
May 2005, Midori Kagaku Co. English Web Site: http://www.midori-kagaku.co.jp/m000908/e_index.htm
122