SONG-DISSERTATION-2019.pdf - SMARTech - Georgia Tech
239
TOWARDS AUTOMATED GUIDANCE FOR HELPING NOVICES DESIGN FOR SUSTAINABLE ADDITIVE MANUFACTURING AND CNC MACHINING A Dissertation Presented to The Academic Faculty by Ruoyu Song In Partial Fulfillment of the Requirements for the Degree Doctor of Philosophy in the George W. Woodruff School of Mechanical Engineering Georgia Institute of Technology August 2019 COPYRIGHT © 2019 BY RUOYU SONG
-
Upload
khangminh22 -
Category
Documents
-
view
2 -
download
0
Transcript of SONG-DISSERTATION-2019.pdf - SMARTech - Georgia Tech

TOWARDS AUTOMATED GUIDANCE FOR HELPING NOVICES
DESIGN FOR SUSTAINABLE ADDITIVE MANUFACTURING AND
CNC MACHINING
A Dissertation
Presented to
The Academic Faculty
by
Ruoyu Song
In Partial Fulfillment
of the Requirements for the Degree
Doctor of Philosophy in the
George W. Woodruff School of Mechanical Engineering
Georgia Institute of Technology
August 2019
COPYRIGHT © 2019 BY RUOYU SONG

TOWARDS AUTOMATED GUIDANCE FOR HELPING NOVICES
DESIGN FOR SUSTAINABLE ADDITIVE MANUFACTURING AND
CNC MACHINING
Approved by:
Dr. Cassandra Telenko, Advisor
School of Mechanical Engineering
Georgia Institute of Technology
Dr. Christopher Saldana
School of Mechanical Engineering
Georgia Institute of Technology
Dr. Frank Durso
School of Psychology
Georgia Institute of Technology
Dr. Yan Wang
School of Mechanical Engineering
Georgia Institute of Technology
Dr. Thomas Kurfess
School of Mechanical Engineering
Georgia Institute of Technology
Date Approved: May 16, 2019

To my husband, family and friends

iv
ACKNOWLEDGEMENTS
I would first like to express my great appreciation to Dr. Cassandra Telenko for
her continuous support and valuable guidance during my Ph.D studies. Dr. Telenko
always provided me with insightful and constructive suggestions when I encountered
research problems. Without her help, I would not have been able to finish this work.
Besides my advisor, I would like to thank my dissertation committee members,
Dr. Thomas Kurfess, Dr. Christopher Saldana, Dr. Yan Wang and Dr. Frank Durso, for
their insights and input in the development of this dissertation. My sincere thanks goes to
Dr. Katherine Fu for her generous help and support on reviewing this dissertation.
I would also like to thank my previous and current lab members, William Martin,
Nicholas Bezoni, Ricardo Bonilla-Alicea, Bryan Watson, and Tiffany Chau for their help
with my research and all of the good times I had with them. Special thanks is also given
to the staff in the Invention Studio and Montgomery Machining Mall, who assisted me
with my research.
Finally, I would not be where I am today without the love and support of my
family and friends. I would like to especially thank my parents, sister, and husband for
providing me with unfailing support and continuous encouragement.
This work has been funded by the National Science Foundation, under the
following award: IIP 1631803.

v
TABLE OF CONTENTS
ACKNOWLEDGEMENTS iv
LIST OF TABLES viii
LIST OF FIGURES x
LIST OF SYMBOLS AND ABBREVIATIONS xii
SUMMARY xiv
CHAPTER 1. Introduction 1
1.1 Research Motivation 1 1.2 Research Hypothesis 5 1.3 Research Scope 6
1.3.1 RQ1: What feedback content should be provided? 7
1.3.2 RQ2: What feedback strategies should be used? 8 1.3.3 Research Tasks 10
1.4 Organization 11
CHAPTER 2. Literature Review 13 2.1 Environmental impacts of CAM processes 14
2.2 Fabrication Failures of CAM processes 16 2.3 DFM Guidelines 18
2.4 Communication between Designers and Manufacturers 22 2.5 Automated DFM Approaches and Methodologies 25
2.6 Expertise Level of Designers 28 2.7 Summary 34
CHAPTER 3. Environmental Impacts of Fabrication Failures of FDM 36
3.1 Overview 36 3.2 Methodology 39
3.2.1 Theoretical Framework 39 3.2.2 Material Waste Data Collection 42 3.2.3 Energy Consumption Data Collection 49
3.2.4 Site Consistency 51 3.3 Results and Discussion 51
3.3.1 Material Waste Results 52 3.3.2 Energy Consumption Results 58
3.3.3 Monte Carlo Life Cycle Inventory Results 62 3.3.4 Discussion of Broader Impacts 65
3.4 Summary 66
CHAPTER 4. Causes for Failures in Desktop FDM 68 4.1 Overview 68 4.2 Methodology 69

vi
4.3 Results 73
4.3.1 Impacts of User’s Experience Level 76
4.3.2 Impacts of Printing Settings 79 4.4 Discussion 81 4.5 Summary 82
CHAPTER 5. Communications between Designers and Machinists for CNC
Machining 84
5.1 Overview 84 5.2 Methodology 85
5.2.1 Observations in the Machine Shop 85 5.2.2 Interviews with Designers and Machinists 86
5.3 Results 86
5.3.1 Observation Results 86 5.3.2 Interview Results 93
5.4 Discussions 99 5.5 Summary 100
CHAPTER 6. Design for Manufacturing Prototype Development 102 6.1 Overview 102 6.2 System Framework 103
6.3 Feedback Content and Strategies 104 6.4 Pilot Studies 108
6.5 Developed Novice DFM Prototype 115 6.6 Summary 119
CHAPTER 7. Validation with prototype testing 121 7.1 Overview 121
7.2 Methodology 121 7.2.1 Test Procedures 121 7.2.2 System Usability Survey 125
7.2.3 Sample Size Estimation 128 7.3 Results 129
7.3.1 Performance of Participants 129
7.3.2 Usability Results 142 7.4 Discussion 143
7.4.1 Example Parts 143 7.4.2 Limitations of the Novice DFM Prototype 147
7.5 Summary 148
CHAPTER 8. Conclusions 150 8.1 Overview 150
8.2 Contributions 150 8.3 Limitations 153 8.4 Future Work 154
APPENDIX A. Quotes from Observations and Interviews 157

vii
A.1 Observation Quotes 157
A.1.1 Job submission and pick-up process 157
A.1.2 Part features/dimensions clarification 160 A1.3 Material 162 A.1.4 Lead time 165 A.1.5 Explaining manufacturing processes 167 A.1.6 Assembly/Mating pieces 169
A.1.7 Process/Machine/Tool Selection 171 A.1.8 Manufacturability 173 A.1.9 Redesign/Part modification 175 A.1.10 Quantities of parts 177 A.1.11 Tolerance 177
A.1.12 Hole 178
A.1.13 Fixture 179 A.1.14 Scale 179
A.1.15 Clearance 180
A.1.16 Unit system 180 A.1.17 Surface finish 180
A.2 Interview Quotes 181
A.2.1 Tolerances 181 A.2.2 Dimensions 182
A.2.3 Hole callouts 183 A.2.4 Surface finish 184 A.2.5 Pin fits 184
A.2.6 Communication and feedback system between designers and machinists 185
A.2.7 Drawings 186 A.2.8 Need for designers to know manufacturing capabilities and for machinists to
know why design decisions were made. 188
A.2.9 Experience of designers 190 A.2.10 Design revisions 191
A.2.11 Additional quotes and information about interviews 191
APPENDIX B. DFM Guidelines 193 B.1 DFM Guidelines for Machining 193
B.1.1 General guidelines for machining 193 B.1.2 Guidelines for drilling 197 B.1.3 Guidelines for milling 199
B.1.4 Guidelines for reaming 201
B.1.5 Guidelines for boring 202
B.1.6 Guidelines for planing, shaping and slotting 203 B.2 DFM Guidelines for FDM 204
REFERENCES 209
viii
LIST OF TABLES
Table 1 - Example Images and Descriptions of Each Type of Failure 44
Table 2 - Causes for Failure Types 47
Table 3 - Site 1 Waste Summary 53
Table 4 - Site 2 Waste Summary 54
Table 5 - Material Waste Rate Regression Results 56
Table 6 - Summary of Cohen’s Kappa 58
Table 7 - Energy Consumption Characterization Data 60
Table 8 - Energy Intensity Regression Results 61
Table 9 - Statistical Parameters and Results for the Monte Carlo Simulation 63
Table 10 - Failure Causes and Number of Prints 74
Table 11 - Summary of User’s Experience Level vs. Failure Rates 77
Table 12 - Topics Mentioned during the Communication 90
Table 13 - Artifacts Used for Communications 91
Table 14 - Topics mentioned in the interviews 98
Table 15 - Curved Grading Scale for the SUS 127
Table 16 - Average Number of Problem and Time Spent to Identify and Fix
Problems
131
Table 17 - Number of Problems Identified vs. Manufacturing Experience 132
Table 18 - Number of Problems Fixed vs. Manufacturing Experience 133
Table 19 - Time Spent to Identify Problems vs. Manufacturing Experience-
Time Spent to Identify Problems vs. Manufacturing Experience
134
Table 20 - Time Spent to Fix Problems vs. Manufacturing Experience 135
Table 21 - Number of Problems Identified vs. Design Experience Type 136

ix
Table 22 - Number of Problems Fixed vs. Design Experience Type 137
Table 23 - Time Spent to Identify Problems vs. Design Experience Type 138
Table 24 - Time Spent to Fix Problems vs. Design Experience Type 139
Table 25 - Summary of Usability Survey Results 142
x
LIST OF FIGURES
Figure 1 - Research Roadmap 11
Figure 2 - CAD/CAM/CAPP systems can account for cognitive
differences across product development actors
24
Figure 3 - Material Flow Diagram 40
Figure 4 Global Level 3D-Printer Activities 43
Figure 5 - Task Level 3D-Printer Activities 43
Figure 6 - Waste Fraction by Type of Failure for Site 1 53
Figure 7 - Waste Fraction by Type of Failure for Site 2 55
Figure 8 - Waste Rate Fit Line (Assumed Gaussian) and Data 56
Figure 9 - Operation Power of Printers at Site 1 and Site 2 Using PLA 59
Figure 10 - Energy Intensity Fit Line (Assumed Gaussian) and Data 62
Figure 11 - Frequency Distribution of the Monte Carlo Simulation Results 64
Figure 12 - User Interface of Ultimaker Cura 72
Figure 13 - Failure Rates vs. Printing Parameters 80
Figure 14 - Prototype Algorithm 104
Figure 15 - User Interface of DFMXpress 106
Figure 16 - User Interface of Xometry 107
Figure 17 - Pawn Piece 109
Figure 18 - Doorstop Piece 110
Figure 19 - Problematic Feature in the Pawn Piece 110
Figure 20 - Problematic Features in the Doorstop Piece 111
Figure 21 - Illustration for Functionality of the Doorstop Piece 112
Figure 22 - Example Feedback for the Prototype on Paper 113
xi
Figure 23 - Four Types of Visualization Feedback 114
Figure 24 - General Tolerance Input Page 116
Figure 25 - Specific Tolerance Input Page 117
Figure 26 - SolidWorks Plug-In Demo 118
Figure 27 - Tolerance Input for the SolidWorks Plug-In 119
Figure 28 - Example Paper Provided to Modify the Part 122
Figure 29 - System Usability Scale Survey 126
Figure 30 - Example Part for Non-Standard Hole Size 144
Figure 31 - Two Sets of Example Part for Inaccessible Features 145

xii
LIST OF SYMBOLS AND ABBREVIATIONS
CAD computer-aided design
CAM computer-aided manufacturing
CAPP computer-aided process planning
AM additive manufacturing
SM subtractive manufacturing
DFM design for manufacturing
FDM fused deposition modeling
CNC computer numerical control
SLS selective laser sintering
LCI life cycle inventory
𝑃 number of users
𝑇 environmental cost of manufacturing technology
I overall environment impact
𝐴 affluence, the average consumption of each person in the population
𝑌 dependent variable
𝑏𝑖 coefficients
𝑋𝑖 Independent variables
𝑚𝑤𝑎𝑠𝑡𝑒 wasted mass
𝑚𝑖𝑛𝑣i initial filament inventory
𝑚𝑖𝑛𝑣𝑓 ending filament inventory
𝑚𝑜𝑟𝑑𝑒𝑟 ordered filament
𝑚𝑢𝑠𝑎𝑔𝑒 used filament

xiii
𝑚𝑝𝑟𝑖𝑛𝑡𝑒𝑑 mass removed from makerspace
𝑅𝑤𝑎𝑠𝑡𝑒 rate of material waste
𝑅𝑢𝑠𝑎𝑔𝑒 rate of material usage
𝑟𝑠𝑐𝑟𝑎𝑝 scrap ratio per collection period
𝑟𝑎𝑣𝑔𝑐𝑟𝑎𝑝 overall average scrap ratio
𝑑𝑠𝑎𝑚𝑝𝑙𝑒 length of collection period
𝑑𝑠𝑢𝑝𝑝𝑙𝑦 days in each inventory check period
𝐸𝐼𝑝𝑟𝑖𝑛𝑡 printing energy intensity
𝐸𝐼𝑢𝑠𝑒 overall use energy intensity
𝑃𝑝𝑟𝑖𝑛𝑡 average printing power
𝑃𝑖𝑑𝑙𝑒 average idle power
𝑃𝑝𝑟𝑒ℎ𝑒𝑎𝑡 average preheating power
𝑡𝑝𝑟𝑖𝑛𝑡 printing time per print
𝑡𝑝𝑟𝑒ℎ𝑒𝑎𝑡 preheating time per print
𝑡𝑖𝑑𝑙𝑒 average idle time per print

xiv
SUMMARY
Thanks to computer-aided design (CAD) and computer-aided manufacturing
(CAM) software, novice engineering designers can engage in product design and
production more easily, increasing opportunities for innovation. Despite this increase in
computer support, novice designers still make improper design decisions which
unnecessarily increase the fabrication failures that lead to higher environmental impacts.
For fused deposition modeling, the baseline waste rate for material consumption was 35-
45% which increased the energy usage by 45%. Therefore, this research aims to discover
what feedback content should be provided to novice designers, and what strategies best
communicate the content. The feedback content and strategies were developed from
existing databases, benchmarking studies, interviews and observation studies in a
university machining mall. The feedback content identified includes the design for
manufacturing guidelines and design suggestions to inform novice designers about how
to make changes to fix problems with their designs. The effective strategies identified
include visualization of problematic features by highlighting the features and providing
example pictures to show high and low manufacturability features. A novice DFM
prototype was developed and tested. From the test, the prototype was able to assist novice
designers better than the benchmarking software, in terms of average number of problems
identified and fixed, and average time spent. For the pawn piece used for the testing, the
novice prototype could assist the participants to identify 0.97 ± 0.05 problems, and fix
0.94 ± 0.06 problems. When using the benchmarking software, the participants only
identified 0.78 ± 0.12 problems, and fixed 0.70 ± 0.13 problems.

1
CHAPTER 1. INTRODUCTION
1.1 Research Motivation
Thanks to computer-aided design (CAD) and computer-aided manufacturing
(CAM) software, novice engineering designers can engage in product design and
production more easily, increasing opportunities for innovation. The designers can easily
create models in CAD software and produced it using rapid prototyping tools such as 3D
printers. However, there is no developed system which can automate the entire process
from design to manufacturing. Designers need to use different software tools for each
stage of the product development process and make decisions without guidance, which
could increase the failure risks for the product development. Therefore, fully automated
CAD-CAM software system will be developed to enable individuals at different expertise
level to engage in product design and production. This system will provide feedback on
geometries, tolerances, material selections to designers to assist the designers to develop
parts with minimum risk of fabrication failures. With created parts from designers, this
system will be able to generate manufacturing process planning automatically.
In order to develop this software system, advanced methodologies such as
machine learning will be adopted in order to handle complex geometries, provide
feedback and generate the manufacturing plans. In addition, this software system will
consider the barriers between designers and manufacturers. Human factor research will
be conducted to identify the cognitive and knowledge differences between the designers
and manufacturers. By implementing the findings, the system is expected to account the
differences and adjust output between designers and manufacturers.

2
The definitions of a novice vary greatly [1]. This study focuses in mechanical
design. Novice engineering designers are usually at an early stage of mechanical design
training. They have started to explore mechanical design activities using CAD and CAM
software and have intentions to design and fabricate mechanical parts or systems.
However, they do not have significant domain knowledge in mechanical design and
manufacturing. Their knowledge is organized in casual networks [2]. These novice
designers are inexperienced in design and are poised to accumulate expertise experience
and knowledge [3]. When solving design problems, they tend to focus on the surface-
level features when starting the design process [4–7], and the process is slow and error-
prone [2].
Knowledge gaps existing prevents the development of the CAD-CAM software
system. Firstly, there is no developed comprehensive algorithm to provide feedback for
important parameters such as tolerance values, material selection, etc. Existing software
tools can only provide feedback for part geometries, monetary cost and estimated lead
time [8,9]. Secondly, the manufacturing process selection is not automated. Current
manufacturing analysis systems are restricted to single manufacturing process [10].
Lastly, current software tools are not designed for novice designers. Novice designers and
DFM experts are different in cognition, knowledge level and communication experiences.
For example, novice designers do not understand manufacturing processes as experts do.
Therefore, they may encounter difficulties in understanding the terminologies used in
feedback. Experts usually operate faster and more efficiently than novices [4,11,12]. In
addition, the rate of cognitive activity in novices tends to start at a peak and then decrease
continuously; the rate of experts increases throughout the whole design process [13].

3
This study focuses on the last knowledge gap to provide feedback to novice
designers. Despite the increase in computational support, novice designers still make
improper design decisions. Novices use trial-and-error in design, due to their limited
experience and evaluation ability [4,12,14]. Failures may be useful in education since
they can help novices to better understand the structures and constraints of problems [15].
However, beginners in engineering design can experience failures in making as
demoralizing [16]. Therefore, beginning practitioners and students could become hesitant
to participate in design activities, which decreases the opportunity for innovation.
In addition, novice designers’ improper design decisions can unnecessarily
increase manufacturing costs and fabrication failures that lead to higher environmental
impacts. For example, the material waste rates of additive manufacturing (AM) in
university makerspaces range from 35% to 45%, which increase the life cycle energy
costs by 50% or more [17,18]. The number of users, 𝑃, is increasing; as such, mistakes
by these additional novice users also increase, leading to greater environmental cost of
manufacturing technology, 𝑇. These two factors contribute to the overall environment
impact, I, represented conceptually in the IPAT equation [19], shown in Equation 1.
𝐼 = 𝑃 × 𝐴 × 𝑇 (1)
Even if 𝐴 , which represents the average consumption of each person in the
population, is assumed to be constant, the environmental impacts increase for CAM. The
most viable way to reduce impacts is by addressing the technological impacts, T. The
goal of this research is to develop a new CAD-CAM software system to decrease
technological impacts of CAM technologies by helping novice engineers minimize

4
material waste and energy loss in automated manufacturing processes. This system
should be able to provide design feedback to novices in design for manufacturing to assist
in design of mechanical parts or systems.
In order to provide feedback automatically for novices, feedback content and
strategies are identified from this work. The feedback content is the information provided
to the users, with the feedback strategy is the way to provide the information. There are
two sources of feedback content: lists of design for manufacturing (DFM) guidelines and
freeform design suggestions given by manufacturers. Novice engineering designers
ignore constraints [20], and consider fewer criteria during the design process than
designers with more expertise [21]. Therefore, their designed parts may not be realizable
[20]. Novice designers tend to follow guidelines that are decomposed into context-free
features by experts [22]. Design guidelines impact how designers perceive and frame the
design task, evaluate ideas and complete their projects [23]. However, novices may apply
rules without evaluating the applicability to the design problem critically [24]. Hence,
novices often need to solicit help from external sources to apply guidelines and perform
design activities effectively. Guidelines are general rules and principles for the design of
all parts. DFM guidelines for conventional manufacturing processes have been well
developed [25–29], and can be provided by software analyzing parts automatically. To
provide the feedback, manufacturability of the part needs to be analyzed.
For feedback strategies, manufacturers could provide feedback to novice
designers to assist them in making design decisions, but often lack the time required to
bridge the knowledge gap between them (the manufacturer) and the novice designer.
Novices tend to treat design as a linear order set of strategies instead of an iterative

5
process [1]. Novices are unable to evaluate designs before testing them due to their
limited experience and ability [4,12,14]. In addition, novices tend to be hesitant to ask for
recommendations and help from other people [12]. Therefore, a feedback system could
be developed to assist designers and improve the product manufacturability before
engaging manufacturers [30].
From the identified feedback content and strategies, an automated DFM software
tool will be developed to assist novice designers make design decisions with minimized
fabrication failure risks. This automated DFM software tool will be a fundamental part
for the overall CAD-CAM software system.
1.2 Research Hypothesis
Feedback content, including DFM guidelines and design suggestions, and
feedback strategies, including visualizations and strategies used by human
experts, can effectively decrease the fabrication failures of CAM technologies by
assisting novice engineering designers to make better design decisions.
This hypothesis addresses two primary goals of this research. The first goal is to
identify the feedback content for novice engineering designers. This research proposes to
provide feedback content, including DFM guidelines and design suggestions, to assist
novice designers to make better design decisions using automated software. The feedback
content was extracted from existing databases and combined with new guidelines and
design suggestions found through interview and observation studies of novice designers
and manufacturers. The second goal is to identify effective feedback strategies to provide
feedback to novices on their designs. The feedback strategy was developed from

6
benchmarking studies and observations of communications between machinists and
designers in a university machine shop.
The long-term goal of this work is to develop new CAD-CAM software systems
that reduce the load on human experts and decrease environmental impacts of CAM
technologies used by novice designers. The developed feedback content and strategies
will be used to develop an automated software tool to reduce burden on human experts.
Human experts can provide feedback to novice designers to assist them to make design
decisions more effectively, but often do not because of knowledge gap and time required.
Therefore, this automated DFM software tool could reduce burden on the human experts
and provide feedback effectively.
1.3 Research Scope
This research investigates CAM technologies including additive manufacturing
(AM) and subtractive manufacturing (SM). AM and SM could be integrated in the future,
since they share characteristics and can take digital CAD models as inputs [31]; both
manufacturing processes and process planning of AM and SM could be automated [32].
For AM, fused deposition modeling (FDM) was investigated. For SM, computer numeric
control (CNC) machining was investigated. Both FDM and CNC machining use 3D CAD
files as input. With the assistance of CAM software systems, a printing path or tool path
can be generated for FDM and CNC machining, respectively. By using these CAM
technologies, prototyping and fabrication becomes easier and more accessible for novice
engineering designers. Hybrid CNC machines that integrate AM and SM have been

7
developed [33]. Therefore, the findings from either FDM or CNC machining could be
easily applied to the other.
This dissertation encompasses two main research questions, addressing the goals
of this study.
RQ1. What feedback content should be provided to assist novice engineering
designers to make design decisions to decrease environmental impacts of
CAM technologies?
RQ2. What feedback strategies should be used to provide the feedback content?
1.3.1 RQ1: What feedback content should be provided?
Feedback content should be provided to novices to assist them in making design
decisions in order to decrease fabrication failures. Manufacturing feedback can provide
redesign opportunities to designers in order to reduce the number of design iterations
[34]. This research question addresses the need to identify what feedback content can
assist novices effectively and efficiently.
DFM guidelines are the most common type of manufacturability feedback.
Novice designers prefer to follow rules developed by experts [22]. The existing software,
such as DFMXpress and Xometry, provides DFM guidelines for identified problematic
features. DFM guidelines are well developed for conventional manufacturing, such as
SM. However, DFM guidelines for AM are still under development. Many studies have
developed guidelines for specific AM process. However, these guidelines are not well
integrated like SM. Therefore, existing guidelines should be well combined into a

8
comprehensive design guide. In addition, most existing guidelines involve terminologies
that novice designers are not familiar with. Therefore, novices may be hesitant to use
these guidelines. Hence, current DFM guidelines should be modified to match the
knowledge space of novice designers.
In addition, Kim identified that existing guidelines are at different levels, such as
“preferred” vs. “should not be violated” or “normal” vs. “tight” for the same
manufacturing process and geometric parameters [35]. He stated that it is important to
identify and improve the features with more serious problems that at higher risk of failure
in order to avoid further alterations. Therefore, it is essential to figure out what guidelines
are most serious and important for novice designers. To identify the most serious and
important guidelines, common failure reasons for parts designed by novices should be
identified.
In addition to DFM guidelines, other feedback content that has potential value to
novice designers should be identified and evaluated. Current systems, such as Xometry,
provide feedback on estimated monetary cost and lead time on designed parts. However,
studies should be done to evaluate how effectively these types of feedback can help
designers. In addition, feedback content that is not implemented in existing software
systems should be evaluated. For example, Binnard and Cutkosky developed a primitive-
based approach to provide feedback on the manufacturing process for designers [36].
1.3.2 RQ2: What feedback strategies should be used?
Research question 2 addresses the need to identify and implement effective
feedback strategies used by human experts and existing computer software.

9
Implementing a part visualization can assist the designers, since it can enhance
the user’s perception of shapes and structures of products [37]. It can also display design
alternatives and assist designers more effectively in early design stage [38–40].
Visualization of features delivers information in higher detail and more effectively than
text descriptions [41]. Therefore, using visualization techniques, such as drawings and
CAD models, is good strategy to provide feedback.
The primary forms of communication between a designer and a manufacturer is
drawings and CAD models. However, the drawings and models may be misinterpreted
because of the different perspectives of different viewers [42–44]. Face-to-face
communication using gestures and oral communication could be used to supplement the
drawings and model [45]. However, it is difficult and costly due to the increasingly
global nature of production. Therefore, automated systems should be developed to
replace the face-to-face communication. Existing systems did not consider the limitations
of human cognition and expertise differences across product development [46–48].
Therefore, the computer system needs to provide easy-to-understand information to
novice designers by matching the cognition and expertise space of novices.
Effective strategies to adjust the DFM experts’ knowledge for novice designers
could be identified by observing the communication between novice designers and
manufacturers who are experts in assisting novices. The manufacturers observed were
machinists in a university machine shop. They review manufacturing requests submitted
by students from different majors in the university, provide design feedback based on the
submitted drawings or CAD models, and manufacture these parts for students. Their
expertise in assisting novices has been developed through experience [49,50]. The

10
experts are able to recognize underlying principles easily when solving a design problem
[4–7,51], and develop “rules of thumb” to simplify solutions [52]. Therefore, observing
this group of machinists can identify the effective approaches they use to assist novices.
In addition, the usability of the system should be considered when implementing
feedback strategies. If a feedback strategy tends to decrease the usability of the system, it
should be carefully considered before implementing into the computational support
system.
1.3.3 Research Tasks
Three main tasks were completed to answer these two research questions. Figure
1 shows the research roadmap.
Research Task 1: Collect data related to feedback for CAM technologies from
literature review, benchmarking studies, observations and
interviews of designers and machinists in university makerspaces.
Research Task 2: Process collected data to identify feedback content and strategies
for novices.
Research Task 3: Evaluate the findings by developing and testing a software
prototype.

11
Figure 1 - Research Roadmap
1.4 Organization
This dissertation presents three main components of research: (1) motivating
studies to develop automated guidance for novice engineering designers to make design
decisions, (2) studies to identify failure reasons and communication problems for CAM
technologies, (3) validating the findings by building and testing the prototype.
Chapter 2 presents background information and literature review regarding
environmental impacts of CAM processes, fabrication failures of CAM process, DFM
guidelines, automated DFM approaches and methodologies, and experience/expertise
level of designers. Chapter 3 presents detailed analysis of environmental impacts of

12
fabrication failures of FDM1. Chapters 2 and 3 highlight the importance of studying
fabrication failures of CAM processes and the demand for DFM software for novices.
Chapter 4 presents the causes for failures in desktop FDM to reduce fabrication
failures of desktop FDM. Chapter 5 presents the causes for failures in CNC machining
and communication problems between machinist and designers. These two chapters
identify failure reasons and communication problems for CAM technologies.
Chapter 6 combines the findings in previous chapters to build the DFM prototype
for novices. It summarizes the limitations of existing systems and develops improved
feedback content and strategies. Finally, Chapter 7 presents the test results of the
prototype. Chapter 8 concludes the dissertation with a summary of contributions,
limitations and future work.
1 Chapter 3 has been published as [17,18]

13
CHAPTER 2. LITERATURE REVIEW
This chapter reviews the studies of environmental impacts, fabrication failures,
current DFM guidelines, and automated feedback strategies for both additive
manufacturing (AM) and subtractive manufacturing (SM), communication between
designers and manufacturers, and the effects of expertise level of designers on their
cognition and design outcomes.
The literature review shows that fabrication failures could have significant
influences on the total environmental impacts. However, only a few studies focus on
fabrication failures. In order to decrease fabrication failures, DFM guidelines should be
used for CAM processes. DFM guidelines are well developed for conventional
manufacturing. However, design for AM guidelines are still in development. In addition,
software systems should also be developed to assist the decision-making process for
design. Automated DFM approaches and methods are developed mostly for conventional
manufacturing processes. Few studies consider the improvement of manufacturability for
AM.
Moreover, existing literature discusses designers’ expertise levels. However, few
studies have been done to evaluate expertise differences of DFM novices and experts, and
how to accommodate these differences to assist them to communicate in a more effective
and efficient way.

14
2.1 Environmental impacts of CAM processes
Manufacturing activities significantly influence the environment. In 2006, the
manufacturing sector accounted for 12.3% of industry gross domestic product, but were
attributed with 36% of carbon dioxide emissions within the industrial sector in US [53].
Manufacturing output was also responsible for 84% of energy related carbon dioxide
emissions and 90% of the energy consumption in the industrial sector [54]. Making
design decisions that facilitate sustainable manufacturing is highly desirable [55].
Achieving manufacturing sustainability requires a holistic view for planning the entire
product life cycle, including manufacturing [56].
For subtractive manufacturing (SM), such as milling and turning processes, the
energy consumption results over 99% of the environmental impact of the machine [57].
Li and Kara developed an empirical model to predict energy consumption of turning
process. This energy consumption estimation model was based on manufacturing process
factors, such as the tool condition, workpiece material, cutting parameters and cutting
fluids.
The energy consumption sources of mechanical processes are divided into two
parts: energy of auxiliary machine movements and intrinsic process movements.
Considering data sources, there are two kinds of data acquisition methods: acquiring data
from a database or acquiring data from CAM files [58]. Overcash et al. produced an
engineering rule-of-practice-based analysis of separate unit manufacturing process. This
unit process life cycle inventory methodology was built on the principle that a
manufacturing line for any given parts was as a set of unit processes to convert the inputs

15
to the output products. This report presented the models and approaches for the unit
process life cycle inventory methodology and used drilling unit operation as a case study.
It calculated the time, power and energy per hole of drilling [59]. Seow and Rahimifard
developed an embodied product energy framework to estimate the energy consumption of
a unit product, which could provide the energy consumption in kJ for each part based on
the design [60].
When evaluating the environmental impacts of AM, most studies focused on
energy use [61–64]. Telenko and Seepersad estimated the energy consumption of
selective laser sintering (SLS) from life cycle inventories (LCIs) and compared it to
injection molding [64]. The results indicated that manufacturers could reduce energy
consumption by using SLS for small production volumes. Kreiger and Pearce did a
cradle-to-grave life cycle analysis of 3D printers, showed that 3D printers require less
cumulative energy when products made from PLA and ABS decrease the fill percentage
to below 0.79 [62]. Baumers et al. developed a tool for the estimation of process energy
flows and costs occurring in the AM technology variant of direct metal laser sintering
[65]. Mognol et al. studied the influence of the various parameters for several rapid
prototyping systems [63]. Song et al. developed a new manufacturing energy
consumption estimation approach using machine learning [66]. This framework provided
a convenient approach for designers to estimate the manufacturing energy consumption
during the design phase. CAD models are the major inputs for prediction of
environmental impact.
The printing time is the most important parameter; the electrical energy
consumption is directly dependent on the duration of the job. In addition, minimizing the

16
volume of support material could also minimize the energy consumption for FDM. Faludi
et al. found that the sustainability of AM depends primarily on the utilization, and then on
the specific machines [67]. Their study also showed that the best way to optimize
ecological impact per job is by maximizing printer usage, and the best strategy for
sustainable prototyping is to share printers, to have the fewest number of machines
running the most jobs they can.
2.2 Fabrication Failures of CAM processes
Fabrication failures can have significant impacts of the total building costs. The
breakdown of a single CNC lathe may halt the entire production process leading to
expensive repairs as a result of breakdown [68]. From Keller et al.’s study, the ready to
use time of CNC machines studied is in the range of 82% to 85% of the total studied
time. About two thirds of the total system down time is due to non-active repair times.
Wang et al. listed the failure mode of the machining process with a histogram by
collecting field failure data [69]. According to You and Pham, about 70% of the total
failures occurred in the CNC system hardware and the other 30% occurred in the CNC
system software and machine tools themselves. Their research also showed the CNC
system failure position proportion and fault model proportion [70].
For AM, few studies have looked at the potential material consumption and build
failures under consumer operating conditions. Most studies only consider the material
and energy costs under ideal conditions. However, consumer usage could have large
material impact for some products. For example, the scrap production in conventional
machining ranges from 10% to 60% [71]. Therefore, the actual material waste is

17
dependent on operating conditions and consumer usage. Under ideal conditions, Xu et al.
considered two quantities of material consumed by FDM: the amount of material used to
build the part and the amount of material used to build the support. Failed parts were not
considered [72]. Telenko and Seepersad mentioned failed builds as part of the material
waste, but did not measure waste material [64]. Song et al. investigated the energy and
material consumption considering fabrication failures of desktop FDM in university
makerspaces, which shows that the baseline waste rate is 35-45% [17]. For the energy
consumption, the energy intensity range is 127.27-288.41 MJ/kg for 95% confidence, if
considering fabrication failures. The details of this research are shown in Chapter 3.
Some studies investigate the influence of processing parameters on AM.
Alafaghani et al. investigated the independent effect of each processing parameter on the
mechanical properties and dimensional accuracy repeatability of FDM parts [73]. The
study shows that the dimensional accuracy is affected by build orientation, extrusion
temperature, and layer height more than infill percentage, infill pattern, and printing
speed. Mechanical properties of parts are influenced significantly building orientation,
extrusion temperature, and layer height; and less significantly on infill patterns and
printing speed.
Onwubolu and Rayegani investigated the effects of five important process
parameters on the tensile strength of test specimen: layer thickness, part orientation,
raster angle, raster width, and air gap, using design of experiments [74]. Minimum layer
thickness improves tensile strength, but increases the material usage. Negative air gap,
minimum raster width and increased raster angle improve the tensile strength. Maximum

18
tensile strength can be obtained when the part orientation coincides with the direction of
tensile loading.
The relationships between design parameters and 3D print build failures are being
explored by a few researchers. Seepersad et al. created a designer’s guide for
dimensioning and tolerancing selective laser sintering (SLS) parts [75]. Several online
user guides discuss common problems and solutions for commercial FDM printers [76–
78]. All3dp.com detailed 34 of the most common FDM problems with a series of
recommended solutions [76]. Print Quality Troubleshooting Guide compiled an extensive
list of the common 3D printing issues with a large collection of real-world images [77].
RepRap.org provided a print troubleshooting pictorial guide to identify and resolve issues
for RepRap 3D printers [78]. These resources illustrate the numerous and frequent errors
that occur in AM, but the frequency of such errors and various user and machine
interactions leading to such errors have not been studied.
The actual material waste of 3D printing is larger than that predicted by studies
using ideal operating conditions without human or printer error [18]. Baumers and
Holweg studied the cost impact of the risk of build failure in laser sintering and found
that the expected cost impact of build failures was responsible for up to 38% of total cost
[79].
2.3 DFM Guidelines
DFM guidelines should be used to decrease the environmental impacts and
fabrication failures of CAM processes. For conventional manufacturing including

19
machining, DFM guidelines are well developed [26–29]. However, design for AM
guidelines are still in development.
AM provides design freedoms in four categories: shape complexity, hierarchical
complexity, material complexity, and functional complexity [80]. AM can reduce the
number of parts and eliminate fasteners, which can reduce assembly time, cost and
difficulties in assembly [81]. Hopkinson et al. found that AM can reduce the
environmental burden and disassembly cost using part redesign without applying any
design rules [82].
Mansour and Hague investigated the impact of rapid manufacturing techniques on
the design process and the product development cycle, and concluded that rapid
manufacturing processes can accommodate all the established DFM guidelines easily
[83]. However, conventional DFM fails to match the advantages provided by AM [81].
Many studies have been done to develop design for AM guidelines for general and
specific AM processes [75,84–89]. Rosen discussed the past, present and future
directions of DfAM, and stated the objective that DfAM should be used to maximize
product performance through the synthesis of shapes, sizes, hierarchical structures, and
material compositions, subject to the capabilities of AM technologies [90]. Becker et al.
introduced some general principles for the design of rapidly manufactured parts [84].
Some of the important design rules are:
• “Do not build the same parts as other processes. Take the time to rethink the
whole assembly, reduce it to the functionality and then go straight forward to the
integrated freeform design.”

20
• “Reduce the number of parts in the assemblies by intelligent integration of
functions.”
• “Feel free to use freeform designs; they are no longer difficult to produce.”
• “Optimize your design towards highest strength and lowest weight.”
Atzeni et al. identified the redesign guidelines and cost model from an extended
literature review [85]. For DfAM, many studies have evaluated the influence of part
printing orientation and how to optimize it. Part orientation can affect the amount of
support material, printing time, part accuracy and surface roughness of the print [91,92].
An optimal orientation should be able to improve part accuracy, reduce the production
time, minimize the supports needed for building the model, minimize the “poor” features,
and maximize the “good” features [91].
Many studies have been done to determine the optimal orientation of AM parts
[72,91,93–95]. The amount of material needed to build the support can be influenced by
the part orientation [96,97]. The scrap weight can be reduced dramatically with a change
in printing orientation. From the study by Alexander et al., the scrap weight of optimal
orientations are only 10% and 22% of the weight of worst orientations for two different
parts [96]. Reducing the amount of scrap during manufacturing saves money on material
costs and waste disposal [98].
For FDM, Lieneke et al. derived dimensional tolerances of FDM through
experimental investigation [40]. The results show that the average deviations range
between +0.03 mm and +0.50 mm in the x alignment, between +0.06 mm to -0.30 mm in
the y alignment, and between +0.12 mm and +0.47 mm in the z alignment.

21
Guidelines for specific AM processes have been developed. Thomas developed
the design rules for selective laser melting using experimental methods. The part
orientation, fundamental geometries and compound design features were studies to
generate the rules [86]. Seepersad et al. determined the limiting feature sizes of various
types of features including slits, holes, letters, mating gears and shafts for SLS through a
series of experiments [75]. Adam and Zimmer studied design rules for laser sintering,
laser melting and DFM, which totally focused on geometry. However, the developed
design rules are only valid for the considered boundary conditions [87]. Lieneke et al.
derived dimensional tolerances of FDM through experimental investigation [88].
However, these DFM guidelines require designers to understand the
manufacturing processes [81]. Increasing numbers of novice engineering designers can
access AM. However, they do not have knowledge of AM processes and DfAM. Booth et
al. found that useful DfAM guidelines were proposed, but few of them were written in a
way that is accessible to novice users [89]. Their research provided a visual DfAM
worksheet for novice and intermittent users. It considers the complexity, functionality,
material removal, and unsupported features that the model in question has. The worksheet
allows the user to better identify potential failure points by adding up features on a point
scale that tells them whether they should 'consider redesign'.
Besides the DFM guidelines, design for environment (DFE) guidelines have been
developed for sustainable manufacturing. DFE guidelines have been developed from a
number of studies [99–106]. For manufacturing, these guidelines are primarily used to
assist material selection, process selection and process parameter optimization. However,
22
the complexities of real production systems and DFE guidelines are disconnected, which
creates challenges in implementing the guidelines in practice [107].
2.4 Communication between Designers and Manufacturers
Manufacturers can provide feedback, including DFM guidelines, to assist
designers in making design decisions. Therefore, the communication between designers
and manufacturers should be studied.
Drawings and CAD models are primary forms of communication between a
designer and a manufacturer. Product development benefits from concurrent
communication between designers and manufacturers to identify costly decisions, but
models passed or shared between designers and manufacturers may be misinterpreted due
to the differing perspectives of these viewers [42–44]. Additional layers, such as
notations, are added to the drawings to communicate key information, and these notations
vary from formal Geometric Dimensioning and Tolerancing (GD&T) to informal
rationale and records [108].
Gestures and oral communication are also used to supplement drawings and
notations [45]. These additional forms of communication, however, can be costly or
difficult due to the increasingly global nature of production. To aid the process of
communication through these artifacts and to develop the next generation of collaborative
design tools [48], it would be helpful to understand how a common representation is
interpreted differently by designers and manufacturers. Differences in interpretation can
result in mistakes or miscommunication in the design or processing stages of
development.

23
The next generation of CAD systems aim to increase sharing of part models by
designers and manufacturers so that both can contribute to the design of the shape. If
manufacturers and designers work together earlier in the process, they can significantly
reduce costs and improve quality [109,110]. Real-time collaboration is achieved by
sharing a single representation across multiple users and integrating CAD with computer
aided process planning (CAPP) and CAM systems. Next-generation integrated
CAD/CAPP/CAM systems and cloud based design and manufacturing systems promise
to improve data and information flows within and across enterprises, but developers have
yet to consider the limitations of human cognition and expertise across product
development [46–48].
In this future of collaborative work, the 3D CAD models can be treated as a
“boundary object”, an object that has constant characteristics but may be interpreted or
used differently by various parties due to their expertise or aims [111]. Eckert and Boujut
stress that compatible (not identical) interpretations of boundary objects, such as part
drawings, are necessary for effective design communication [112]. A CAD/CAM/CAPP
system becomes incompatible when it does not match how each party works and thinks
[113]. Many of these systems do not fully account for how a single 3D CAD model can
be utilized in different functional settings and acts of sensemaking [114]. The
manufacturer does not always need to understand the function, and the designer does not
always need to understand the manufacturing process. However, they must establish a
common ground to collaborate. Lang, Dickinson and Buchal found that more integration
of human factors and cognitive theory is needed to understand how different parties
understand design intent, history, and rationale [115]. Current efforts to address

24
interpretation rely on incorporating annotation capabilities in models [116]. These
annotations and information-based approaches, however, rely on predicting what might
be misinterpreted or needed by viewers later in the product development process.
Figure 2 - CAD/CAM/CAPP systems can account for cognitive differences across
product development actors
In order to support collaborative work, the CAD/CAM/CAPP system will likely
need to make assumptions about how each party thinks that are more accurate than
current systems. According to Nickerson's theory of communication, illustrated for the
case of CAD/CAPP/CAM in Figure 2 [117], each party (i.e. manufacturers and
designers) begins with a model of his or her own knowledge and translates that to fit a
model of what they perceive another party's knowledge to be. Similarly, the
CAD/CAM/CAPP systems impute knowledge from one party and then adjust that
knowledge using its own models of the two parties [117]. Therefore, the computer system
needs to have more accurate models of designer and manufacturing knowledge and adjust
output between the two.

25
2.5 Automated DFM Approaches and Methodologies
Software systems should be developed to assist the decision-making process.
Denkena et al. presents an overview of the CAPP filed, which highlighted the knowledge
and collaboration gap between designers and manufacturers, and the lack of appropriate
software tools to support this collaboration [118].
A systematic feedback system could improve the product manufacturability [30].
A systematic and structured complementary feedback process has been implemented by
Molcho et al. to close the knowledge gap between manufacturer and designer [30]. This
structured organizational learning, in the form of structured digital forms and interviews,
enables maximum knowledge capture and capitalization, and is required to close the
knowledge loop.
Hoque et al. developed a system that provided an intelligent interface between
design and manufacturing data by developing a library of features [119]. The library
linked with commercial CAD/CAM software package through a toolkit. Ferrer et al.
proposed an DFM approach which combines DFM techniques and principles of
Axiomatic Design [120]. They concluded that software support can improve the design
process and help the designer make decisions. Wu et al. did a review of cloud-based
digital design and manufacturing software and services, which provided a technology
guide for decision makers to select suitable software and services as alternatives to
existing in-house resources [121].
The use of annotated models is a valuable approach to improve design intent
communication. Graphic user interfaces that are customized to expertise increase the

26
accessibility of information [116]. Part visualization can enhance the user’s perception of
shapes and structures of products [37]. It can also present design alternatives and assist
designers more effectively in the early design stage [38–40]. Visualization of features
delivers information in more detail and more effectively than text descriptions [41].
Visual analytic tools are also used to support the decision-making process in
manufacturing [122]. Visual analytics is defined as the science of analytical reasoning
facilitated by interactive visual interfaces [123]. These tools are mostly developed for
production management and supply chain decision making. Tiscsoft can optimize
transportation infrastructure in supply chain networks [124]. ViSER implements two
mutually coordinated panes to represent a product architecture graph and a supply chain
tree [125]. ViDX can assist users to identify disruption, such as significant energy
consumption of processes in a production facility [126]. However, these visual analytics
tools rarely support decision-making through the entire life cycle [122]. Therefore,
Ramanujan et al. proposed a visual analytics framework to generate contextual design for
environment principles in sustainable manufacturing [122].
For automated DfAM methodologies, most of the systems rely on CAD models.
Rosen proposed a comprehensive DfAM system considering part and specification
modeling, process planning and manufacturing simulation [127]. Kumke et al. classified
DfAM research into “DfAM in the strict sense” and “DfAM in the broad sense”, and
developed a new DfAM framework that can provide designers with structured guidelines
to fully exploit AM potential [128]. Maidin et al. developed a digital design feature
database to aid designers towards to design of laser sintering parts [129]. However,
Ponche et al. proposed a new global approach to obtain appropriate design for AM

27
processes, which starts directly from both functional specifications and AM process
characteristics at the early design stage without an initial CAD model [130].
Klahn et al. provided two design strategies to use AM’s benefits, which are a
manufacturing driven design strategy and a functional drive design strategy [131]. A
manufacturing driven design strategy enables a substitution of manufacturing processes at
a later stage of the product life cycle, while a function driven design strategy increases
the performance of a product. Reddy K. et al. used topology optimization along with
DfAM rules to study the tradeoffs between the weight of the part, support requirements,
manufacturing costs, and performance [132].
Yang and Zhao summarized there are two categories of DfAM research, which
are the structure optimization design method and DfAM methodologies [81]. They
concluded that DfAM research rarely considered manufacturability improvement. Most
research focuses on optimizing the existing model designed by conventional design
methods. Recently, Kim et al. presents a DfAM knowledge base containing a wide range
of information including design features, manufacturing features and parameters which is
formalized by web ontology and language [133]. This DfAM ontology facilitates the
analyze of manufacturability of design features according to AM processes. However,
more studies should be done considering manufacturability improvement for AM.
In addition, with the rapid development of information, computer and internet
technologies, smart design and manufacturing systems is emerging with production
integration with utilization of Internet of Things, clouding computing, big data, mobile
internet and cyber-physical systems [134,135]. Zheng et al. discussed the conceptual

28
framework, scenarios, and future perspectives for smart manufacturing systems [136].
Their proposed conceptual framework covers many relevant topics including design,
manufacturing, monitoring, control and scheduling. Studies have been done to investigate
the usage of different technologies in smart design and manufacturing, Wang et al.
presents a comprehensive survey of commonly used deep learning algorithms and their
applications in smart manufacturing [137]. From this survey, computational methods
based on deep learning has potential to improve system performance and provide new
visibility to decision-makers into their operation. Urbina Coronado et. al developed and
implemented a manufacturing execution system with to track consumable usage, operator
activity and production output powered by Android devices and cloud computing tools
[138]. Tao et al. proposed a new data-driven framework to integrate product design,
manufacturing and services in order to make the process more efficient, smart and
sustainable [139]. However, these recent studies still did not consider the cognitive
differences and communication problems between designer and manufacturers who are
evolved in the product development process.
2.6 Expertise Level of Designers
This dissertation research focuses on novice engineering designers. Therefore,
literature review is done on defining the expertise level of designers. Expertise is
primarily a result of experience and a deliberate effort to improve [49,50]. To reach the
stage of expert, it is largely agreed that certain amount of time and effort are required [4].
A minimum ten years (approximately 10,000 hours) of continued effort is a commonly
accepted rule for an individual to become an expert, despite that time varies between
individuals [49,50,140]. The primary mechanism to create expert-level performance in a

29
domain is deliberate practice [49]. According to Ericsson and Charness, individuals
cannot improve their performance and reach an expert level through automatic
consequence of more experience with an activity, but through deliberate practice [141].
Deliberate practice is an effortful activity motivated by the goal of improving
performance. It should be done by engaging in special exercises designed to improve
performance in the skill with close guidance and timely, accurate feedback on
performance. According to Gelder, the skills in a specific domain cannot be learnt from
studying other subjects, it must be studied and practiced in its own way [142].
Several models have been developed to explain the levels of expertise and how
they are reached. Laxton developed a three-stage model of design learning based on a
metaphor of a hydro-electric plant [3]. First, the individual needs to accumulate expertise
experience and knowledge (reservoir). Upon having the reservoir filled, the individual
needs to establish the ability to generate ideas (generator) from the reservoir of
knowledge. Third, the individual needs to develop the skills to evaluate and discriminate
the ideas and interpret (transformer) them in new contexts.
Reimann describes a three-stage model of expertise development [2]. The novice
state is characterized by knowledge representations. Problem solving is slow, search-
based and error-prone at this stage. In the second stage, the knowledge structures are re-
organized and adapted to specific tasks and constraints with growing experience. Problem
solving is not so much based on searches and starts to become more automatic. In the last
stage, an expert’s knowledge has been developed by experience from specific cases.
Problem solving is based almost exclusively in experience.

30
Patel and Groen identifies four different levels within the development of
expertise, which are novice, intermediate, sub-expert and expert [143]. The knowledge of
a novice is organized within causal and proportional networks. At the intermediate stage,
these structures are compiled into a simplified network. The expertise of sub-experts is
characterized by developing domain-specific scripts. As an expert, these structures
become completely case-based scripts.
Dreyfus and Dreyfus describe a five-stage model of skill acquisition of expertise:
novice, advanced novice, competence, proficiency and expertise [22]. A novice follows
context-free rules created by designers with more expertise. An advanced novice uses
rules and begins to note and cope with real situations. To achieve competence, the
individual learns to devise a plan and choose a perspective. To achieve proficiency, the
individual begins to see what needs to be done to solve problems intuitively instead of
using reasoned responses, however, still uses reasoned responses to decide how to solve
the problem. The expert decides both what needs to be done and how to do it intuitively.
An expert can make more subtle and refined discriminations than the proficient
performer.
Based on this five-stage model, Lawson describes the steps to achieve them [52].
First, an individual must develop a set of schemata. Then, a designer can begin to acquire
experiential and episodic knowledge from precedents. When some experience has been
gained, the designer begins to develop guidance principles to assist him/her to direct
knowledge. Then, the designer starts to develop the skills to recognize the features of
problems. Finally, the expert develops “rules of thumb” to simplify problems and
solutions.
31
Also based on the Dreyfus model, Lawson and Dorst describe a seven-stage
model by adding two more stages [144]. Beyond expert, a master performer develops an
increased recognition of context and perception of subtle clues in design problems.
Finally, a visionary can create new methods of performing design.
Three stages of expertise levels are usually investigated in studies: novices,
advanced novices and experts. Novices are usually in the early stage of their training in
one domain. Experts are people with a minimum ten years of experience. Advanced
novices are somewhere between the novices and the experts, and are also called “expert-
like novice”, “novice experts”, or “informed designers” [1,22,145].
The novices are individuals with little domain knowledge, experience and formal
training. In this study, novices do not only include students but also include practitioners
with certain characteristics. The characteristics of novice designers are summarized by
several studies. Novices are inexperienced in design and are at the phase to accumulate
expertise knowledge and experience [3]. When approaching design problems, novices
often do it deductively and reason backward [12]. Novice designers tend to consider a
single solution before considering alternative solutions when solving problems [146]. In
addition, novices use trial-and-error in design due to their limited experience and
evaluation ability [4,12,14]. At the beginning of the design process, novices usually focus
on the surface-level features of a design problem [4–7]. They tend to oversimplify
problems and start their work by providing solutions almost immediately [147]. Novices
ignore constraints [20], and produce ideas that emphasize superficial aspects of potential
solutions [1]. Therefore, their problem solving process is slow and error-prone [2].
Novices designers prefer to follow rules that are decomposed into context-free features

32
by experts [22]. However, they may apply rules without evaluating the applicability to
the design problem critically [24]. In addition, novices focus on defining the problem and
spend a lot of design time on it [21]. During the design process, novices tend not to do
reframing [144]. Their limited experience and capability make them unable to evaluate
designs before testing them [4,12,14].
Advanced novices possess some experience and formal training in design [1].
Comparing advanced novices and novices, advanced novices are able to gain more
information than novices and transition more frequently between different types of design
activities [4,21,148]. They can also better prioritize gathered information [149]. Novices
treat design problems as well-defined, end-of-chapter textbook problems [150,151].
However, advanced novices see design tasks as “ill-structured” [152]. Advanced novices
consider more alternative solutions during the design process [149]. However, advanced
novices are more prone to become fixated on a specific design solution [6]. Advanced
novices also consider more criteria during the design process and may take a longer time
to solve problems than novices [21]. When working on drawings, advanced novices
prefer to use symbolic references. However, novices prefer to use formal geometric
descriptions [144,153].
The characteristics of experts are also explored by a number of studies. Experts
are open-ended, spontaneous, flexible and open to new experiences [144]. They are
exposed to a great amount of example problems and solutions and have a significant
amount of domain knowledge. Experts have the ability to recognize underlying principles
easily when solving a design problem [4–7,51]. They tend to use a systematic approach
when solving design problems [4,154], and they tend to use case-based reasoning [155].

33
Experts are capable of recognizing situations related to the specific problem [144,153]. In
addition, experts can make preliminary evaluations of design plans before implementing
and testing them [4,7,12,14,144]. When examining products, experts tend to see them in
general as designs instead of just completed objects. Expert designers have eight basic
core features of design ability [156]:
1. Produce novel and unexpected solutions
2. Tolerate uncertainty, working with incomplete information
3. Apply imagination and constructive forethought to practical problems
4. Use drawings and other modeling media as means of problem solving
5. Resolve ill-defined problems
6. Adopt solution-focusing strategies,
7. Employ abductive, productive and appositional thinking
8. Use non-verbal, graphic and spatial modeling media.
By comparing experts and novices, experts seem to require more information
when approaching design problems [157]. They also gather more information during the
design process than novices [157,158]. When making design decisions, experts aim to
understand the challenge [151], and avoid making any early design decisions [1].
However, novices, tend to make design decisions prematurely [1]. When approaching
design problems, novices often reason backward; however, experts tend to reason
forwards and sometimes alternate between forward and backward reasoning when
approaching more complex problems [12]. Novices tend to solve design problems in a
linear order [1]; however, experts tend to solve problems in an iterative process
[144,148], and they tend to seek out more sources of inspiration and information [155].

34
Novices are more reluctant to ask for recommendations and help than experts [12].
However, experts are more likely to become fixated on a single design [159]. For the
cognitive differences between novices and experts, experts operate at a faster speed and
more efficiently [4,11]. Experts also have better spatial memory and organizational
structure [12,13,160,161]. When doing sketching, experts show more cognitive activity
than novices [14]. By comparing advanced novices and experts, advanced novices’
pattern-matching skills tend to be less reliable, and their ability in retrieving and using
learned ideas is less flexible [1].
In this literature review, the characteristics of novices, advanced novices and
experts are summarized. Novices tend to follow rules developed by experts. However, no
studies have been done to evaluate the expertise level of individuals in the specific area
of DFM. Therefore, this knowledge gap should be filled by studying the differences of
DFM novices and experts, and how to accommodate these differences to assist them to
communicate in a more effective and efficient way. The expertise model for designers
could be adjusted to explain the expertise level in DFM. In this research, DFM novices
are in the stage of accumulating DFM expertise experience and knowledge. The DFM
experts have developed skills to evaluate ideas and interpret them in new contexts.
2.7 Summary
This literature review presents an overview of environmental impacts, fabrication
failures, current DFM guidelines, automated feedback strategies for both AM and SM,
communication between designers and manufacturers and the expertise level of

35
designers. From this literature review, it is evident that there are knowledge gaps existing,
and studies should be done to fill these gaps.
Fabrication failures could have significant impacts of the total building costs and
environmental impacts. However, only a few studies focus on fabrication failures. The
environmental impact influenced by fabrication failures is an important aspect to explore.
Then, DFM guidelines should be used to decrease the environmental impacts and
fabrication failures of CAM processes. DFM guidelines are well developed for
conventional manufacturing. However, design for AM guidelines are still in
development. Manufacturers can assist novice designers to apply DFM guidelines.
However, differences in interpretation can result in mistakes or miscommunication in the
design or processing stages of development. Therefore, software systems should be
developed to assist the decision-making process. An overview of existing automated
DFM approaches and methods is presented. Finally, this research focuses on novice
engineering designers. Existing literature discussed designer’s expertise level in detail.
However, few studies have been done to evaluate the expertise differences of DFM
novices and experts, and how to accommodate these differences to assist them to
communicate in a more effective and efficient way. In conclusion, an automated DFM
software tool should be developed for novice designers to reduce burden on human
experts and provide feedback effectively in order to decrease the fabrication failures.

36
CHAPTER 3. ENVIRONMENTAL IMPACTS OF FABRICATION
FAILURES OF FDM
3.1 Overview
Fused deposition modeling (FDM) is one of the most widespread AM techniques
[162], particularly in university makerspaces. Barrett et al. found that desktop FDM
machines, such as MakerBots, are the most common piece of equipment by studying 40
makerspaces that were identified from 127 top undergraduate institutions in the United
States [163]. In FDM, a part is produced by extruding molten material to form layers as
the material hardens. Desktop-grade FDM printers are popular because of their compact
sizes, affordable prices (<$5000), and low maintenance costs.
Many desktop FDM printers are used in novice environments, and a knowledge
gap exists regarding workflow and environmental impacts under these conditions. The
desktop FDM printers are comparably easy to operate; free open-source slicer software
tools, such as Cura and Slic3r, make it so that a user may simply upload STL files and hit
print. As a result, FDM printers are expected to make AM a tool for everyday household
life with high scrap rates [164]. Because the users of such printers are often
inexperienced in operation and design methodologies for 3D printing, the actual
environmental impacts could be larger than that under controlled experiments without
human or printer errors.
Failure could increase both the material and energy consumption, which
undermines the environmental benefits of FDM. Failed prints might be produced for

37
various reasons, such as insufficient preheating time, inappropriate geometry of parts or
printer malfunctions. When evaluating the material waste from FDM, most studies only
consider the support material generation, in other words, the production under ideal
conditions without failures. To address this gap, this study reports results of a printing
failure study in two open shops with daily users of various levels of expertise.
Estimating the energy impact, however, is difficult, as a variety of FDM brands
and machines exist with little data on their performance, resulting in high uncertainty.
Kellens et al. summarized the currently available data on the average energy intensity of
a variety of AM processes, and report a range of 83 MJ/kg to 1247 MJ/kg for commercial
FDM machines [165]. This wide range describes professional machines and controlled
testing; wider ranges might be found in uncontrolled environments for desktop grade
machines. Therefore, there is a need for more data on the variability of manufacturing
processes in general.
As such, this study provides a first estimate of parameter and scenario
uncertainties in estimating desktop FDM machine energy and material consumption. The
handling of variability and uncertainty is a common challenge in conducting a life cycle
assessment (LCA) [166–168], and often requires both qualitative [169] and quantitative
[170] methods to assess. Life Cycle Inventory (LCI) databases often lack variability
information, which produces great uncertainty in the results of LCAs employing them.
For example, even though the EcoInvent database allows probability distribution metrics,
often they are unavailable and subjective default values are used instead [171].

38
Uncertainty is categorized into three types: (1) scenario uncertainty, (2) model
uncertainty, and (3) parameter uncertainty [172].
1) Scenario uncertainty refers to the considered event and selection of data sources.
Early attempts to incorporate an assessment of scenario uncertainty promoted a
qualitative rating on the data source [169,173].
2) Model uncertainty arises from the researcher’s structure of variable relationships
or selection of mathematical models [174–176]. Analytical differential error
propagation may be used to account for the error within a given model, but not
across differing models.
3) Parameter uncertainty describes the random variation associated with individual
variables in a model. Stemming from the early work on scenario uncertainty,
parameter uncertainty has received a significant amount of attention through
statistical measurement and simulation [177]. A common method for life cycle
inventories (LCIs) and LCAs that include a variability or uncertainty component
is a Monte Carlo simulation [178–180].
This study provides data and evidence for addressing scenario and parameter
uncertainty in energy and material balances for FDM printers in user facilities. Parameter
uncertainty is addressed directly through primary data collection and statistical
descriptors; scenario uncertainty is included through duplication at multiple sites and
machines. This study was conducted in two user facilities where a broad range of users
with varying experience and expertise have access. These two open shops are
representative of the numerous maker spaces and shops appearing in businesses, homes,

39
colleges, communities, and schools around the world [163]. The results of each scenario
are useful individually and collectively. Model uncertainty is not directly addressed in
this work.
3.2 Methodology
This study focuses on desktop grade FDM printers using plastic in maker and
engineering spaces. The framework and consideration of scrap production is more
broadly relevant to many future applications of high embodied energy materials, as might
be used in FDM manufactured cars or buildings. The functional unit is 1 kg of final
product, and the energy and scrap production are examined. Operating factors such as
machine utilization, material type (PLA/ABS), and specific machine are also considered.
The theoretical framework is discussed first. Then, the material waste collection and
energy consumption data collection at both sites are described. Finally, the data
integration and comparison of these two sites are discussed.
3.2.1 Theoretical Framework
Two scenarios were considered and the parameters for energy and material
variability were calculated from sample data. Scenario A is an open makerspace located
at Georgia Institute of Technology (Site 1: GT), and scenario B is a user-limited
makerspace located at University of California (Site 2: UC) at Berkeley. For both
scenarios, two types of raw material were observed: ABS and PLA. In scenario A (GT),
three different types of printers were tracked: Afinia H480, UP! mini, and UP! Mini 2. In
scenario B (UC), only Type A Series 1 Pro printers were tracked. The material flow
diagram of both sites is shown in Figure 3.

40
Figure 3 - Material Flow Diagram
Uncertainty in the study is reported by comparison across different scenarios and
variance in the parameters of those scenarios using a single consistent model. A
regression of the collected data provides coefficients for the scenarios considered,
indicating predictive parameters, as in Equation 2,
𝑌 = 𝑏0 + 𝑏1𝑋1 + 𝑏2𝑋2 + ⋯ + 𝑏𝑛𝑋𝑛 (2)
where 𝑌 is the dependent variable, 𝑏𝑖 ’s are coefficients, and 𝑋𝑖 ’s are independent
variables. The variance in data collected within and across sites provides an estimate of
the parameter uncertainty. Mass and energy measurement uncertainty is calculated using
measurement device accuracy and standard statistical methods. The mass measurement
devices and data loggers could introduce error into measured data due to the sensor and
other electronics performance, such as the analog-digital converter. The accuracy of the
mass balances used are 2 g. The measurement accuracies of the power data loggers range
from 0.5% to 1.13%. Several parameters are defined for Equations 3 - 9 of this study.
Each 𝑚 denotes the mass [grams] of material collected per collection period. Each 𝑃
denotes a power demand [Watts], 𝑡 denotes time [seconds], 𝑅 denotes a mass rate
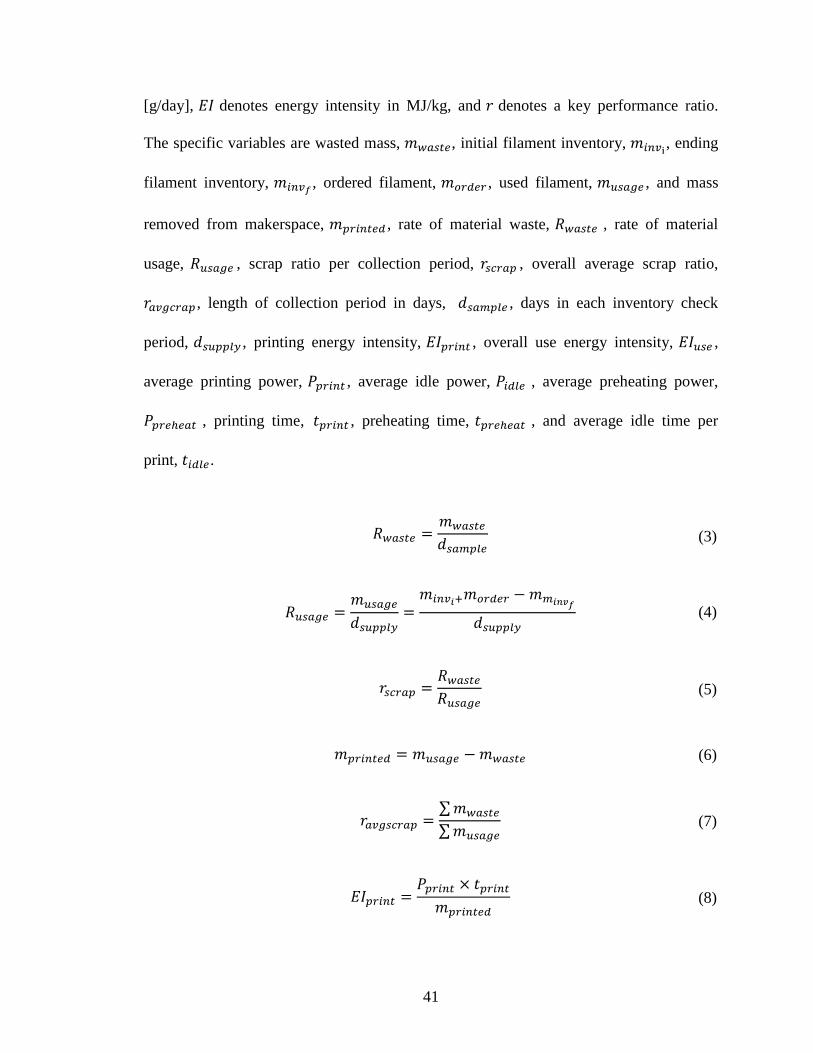
41
[g/day], 𝐸𝐼 denotes energy intensity in MJ/kg, and 𝑟 denotes a key performance ratio.
The specific variables are wasted mass, 𝑚𝑤𝑎𝑠𝑡𝑒, initial filament inventory, 𝑚𝑖𝑛𝑣i, ending
filament inventory, 𝑚𝑖𝑛𝑣𝑓, ordered filament, 𝑚𝑜𝑟𝑑𝑒𝑟 , used filament, 𝑚𝑢𝑠𝑎𝑔𝑒 , and mass
removed from makerspace, 𝑚𝑝𝑟𝑖𝑛𝑡𝑒𝑑 , rate of material waste, 𝑅𝑤𝑎𝑠𝑡𝑒 , rate of material
usage, 𝑅𝑢𝑠𝑎𝑔𝑒 , scrap ratio per collection period, 𝑟𝑠𝑐𝑟𝑎𝑝 , overall average scrap ratio,
𝑟𝑎𝑣𝑔𝑐𝑟𝑎𝑝 , length of collection period in days, 𝑑𝑠𝑎𝑚𝑝𝑙𝑒 , days in each inventory check
period, 𝑑𝑠𝑢𝑝𝑝𝑙𝑦 , printing energy intensity, 𝐸𝐼𝑝𝑟𝑖𝑛𝑡 , overall use energy intensity, 𝐸𝐼𝑢𝑠𝑒 ,
average printing power, 𝑃𝑝𝑟𝑖𝑛𝑡 , average idle power, 𝑃𝑖𝑑𝑙𝑒 , average preheating power,
𝑃𝑝𝑟𝑒ℎ𝑒𝑎𝑡 , printing time, 𝑡𝑝𝑟𝑖𝑛𝑡 , preheating time, 𝑡𝑝𝑟𝑒ℎ𝑒𝑎𝑡 , and average idle time per
print, 𝑡𝑖𝑑𝑙𝑒.
𝑅𝑤𝑎𝑠𝑡𝑒 =𝑚𝑤𝑎𝑠𝑡𝑒
𝑑𝑠𝑎𝑚𝑝𝑙𝑒 (3)
𝑅𝑢𝑠𝑎𝑔𝑒 =
𝑚𝑢𝑠𝑎𝑔𝑒
𝑑𝑠𝑢𝑝𝑝𝑙𝑦=
𝑚𝑖𝑛𝑣𝑖+𝑚𝑜𝑟𝑑𝑒𝑟 − 𝑚𝑚𝑖𝑛𝑣𝑓
𝑑𝑠𝑢𝑝𝑝𝑙𝑦 (4)
𝑟𝑠𝑐𝑟𝑎𝑝 =
𝑅𝑤𝑎𝑠𝑡𝑒
𝑅𝑢𝑠𝑎𝑔𝑒 (5)
𝑚𝑝𝑟𝑖𝑛𝑡𝑒𝑑 = 𝑚𝑢𝑠𝑎𝑔𝑒 − 𝑚𝑤𝑎𝑠𝑡𝑒 (6)
𝑟𝑎𝑣𝑔𝑠𝑐𝑟𝑎𝑝 =
∑ 𝑚𝑤𝑎𝑠𝑡𝑒
∑ 𝑚𝑢𝑠𝑎𝑔𝑒 (7)
𝐸𝐼𝑝𝑟𝑖𝑛𝑡 =
𝑃𝑝𝑟𝑖𝑛𝑡 × 𝑡𝑝𝑟𝑖𝑛𝑡
𝑚𝑝𝑟𝑖𝑛𝑡𝑒𝑑 (8)

42
𝐸𝐼𝑢𝑠𝑒 =
𝑃𝑝𝑟𝑖𝑛𝑡 × 𝑡𝑝𝑟𝑖𝑛𝑡 + 𝑃𝑖𝑑𝑙𝑒 × 𝑡𝑖𝑑𝑙𝑒 + 𝑃𝑝𝑟𝑒ℎ𝑒𝑎𝑡 × 𝑡𝑝𝑟𝑒ℎ𝑒𝑎𝑡
𝑚𝑝𝑟𝑖𝑛𝑡𝑒𝑑 (9)
Structured linear regressions were computed separately for the waste rate and
energy intensity as dependent variables using Equation 2. For the waste rate, the
independent variables were material usage rate 𝑅𝑢𝑠𝑎𝑔𝑒, site, and material type. Material
usage rate was included to identify whether waste was dependent on material throughput.
The mass of successful parts 𝑚𝑝𝑟𝑖𝑛𝑡𝑒𝑑 is assumed to be the mass that leaves the facility
and is calculated as the difference between 𝑚𝑢𝑠𝑎𝑔𝑒 and 𝑚𝑤𝑎𝑠𝑡𝑒 . It is assumed that an
insignificant quantity of waste was disposed of elsewhere. Since the waste collection bins
were clearly labeled and next to the printers, it seems unlikely users would take failed
prints or support material out of the room. For the energy intensity, the independent
variables were machine type, material type, and site. The offset, 𝑏0 , represents the
baseline waste generation rate (or energy intensity) for the reference parameter set.
Regressions and Monte Carlo simulations are normalized by the number of printers at the
respective sites; waste is aggregated by site.
3.2.2 Material Waste Data Collection
Failed print and support material bins were provided at each site. Bin contents
were collected and recorded periodically. Although the collection bins were labeled,
some users incorrectly deposited material. Therefore, all the collected waste was
evaluated manually for any sorting error. Specifically, failed prints that were discovered
in the support bin were re-sorted into the failed bin, and vice versa.

43
Figure 4 - Global Level 3D-Printer Activities
Figure 5 - Task Level 3D-Printer Activities
After each sample was collected and weighed, the parts were sorted by failure
type to determine if failures were caused by human or machine error. Failure types were
derived from available FDM printer troubleshooting guides [76–78], staff expertise, and
activities of printer use. Activity diagrams [181,182] aided in determining which failure
types had human intervention. The global level activity diagram, shown in Figure 4,
involves aspects of the printer’s useful life such as purchase, installation, maintenance
and end-of-life activities. It is independent of single printing jobs. The task level activity

44
diagram, shown in Figure 5, sequences the activities involved in the unit use of a printer.
In total, 9 types of failed prints were identified. The example images and descriptions for
each type of failure are shown in Table 1. These nine types of failure can be caused by
user (machine operator) error, machine error, designer error, or any combination of these
three types of error. Table 2 summarizes the causes for each failure type.
Table 1 - Example Images and Descriptions of Each Type of Failure
Type Images Descriptions
Unused
Filament
Unused filament could be disposed
if part of it distorts or tangles due to
printer or user errors. An example is
nozzle clogging. Also, if there is not
enough material for the next print,
the remaining filament could be
discarded to ensure seamless
operation.
Platform
Heating
If the platform is not preheated or
the temperature is not high enough,
warping or cracking could happen.
If the first layer of heated plastic
cools down too fast, it may contract.
Then, the edges of the print will
bend upward until it no longer
adheres to the print platform.
Cracks in tall objects may also
happen due to platform heating
problems. The material cools down
faster in higher layers than in lower
layers, because the heat from the
heated bed cannot reach that high.
Therefore, adhesion in the upper
layers is worse.

45
Type Images Descriptions
Part Shape
The prints may fail if the
specification of the printer cannot
support the part shape.
Layer
Shift
Layer shift is caused by mechanical
malfunctions with the printer; the
extruder head does not move
smoothly on the x- or y-axis, or the
rods are not aligned correctly.
Support
Material
Removing
Process
After the printer finishes a job, parts
may be damaged during manual
removal of the support material.
Some of the support material may
be difficult to remove because of
the shape of the part.

46
Type Images Descriptions
Printer
Stops
Printer may stop automatically
when it or an operator detects any
error. Also, the printer may run out
of raw material.
Tight
Calibration
The nozzle and printing platform
are calibrated too closely to each
other. Therefore, the nozzle cannot
extrude material properly. The first
several layers may be compressed.
Loose
Calibration
The nozzle and printing platform
are calibrated too far from each
other. Therefore, the first layer
cannot adhere to the platform, and
the sequential layers cannot adhere
to each other properly.
Skip
Layers
There are gaps in the model because
some layers have been skipped in
part or completely due to a printer
error. The printer fails to provide
the amount of plastic required for
printing the skipped layers. There
may have been a problem with the
filament (e.g. the diameter varies),
the filament spool, the feeder wheel
or a clogged nozzle.
Non-
physical
defect
The part has no physical defect, which means it was not disposed because
of printing errors but design or other issues.

47
Table 2 - Causes for Failure Types
Type User Error Machine Error Designer Error
Unused Filament X X
Platform Heating X X
Part Shape X X
Layer Shift X X
Support Material Removing X X
Printer Stops X X X
Calibration X X
Skip Layers X
Non-Physical Defect X
Each sample was weighed separately on a scale, accurate to 2 g. All scales were
calibrated using M2 class weights before and periodically throughout data collection. In
the event multiple failure categories were represented in one sample, the failure that
occurred first during printing was used for categorization. For example, if the part warped
off of the bed and caused the upper layers to become entangled or malformed, the sample
was categorized as a “platform heating” failure.
Material inventory was tracked periodically by counting the rolls of unopened
filament and order quantities at each site. The mass of each new filament roll was
recorded per supplier specifications and tolerances as .500, .750, or 1.000 kg. Rolls of
material installed on machines were not removed for measure. The filament remaining on
installed rolls was estimated at 25%, 50%, 75% or 100% of a new roll. The difference in
remaining material was measured using a ruler from the outer edge of the roll for
comparison with a new roll.

48
Filament diameter for all machines is 1.75 mm. All machines are capable of
printing ABS and PLA.
Site 1: Georgia Institute of Technology (GT) Material Data Collection
Two labeled collecting bins were placed next to post-processing tables in the
Invention Studio at Georgia Tech. This 3D printing room contained 12 Afinia
H480 printers and 25 PP3DP UP! mini Generation 1 printers in which ABS
filament was used. Approximately 25 printers were running at any time. For PLA
filament, there were 10 Afinia H480 printers and 14 PP3DP UP! mini Generation
1 printers and 7 PP3DP UP! mini Generation 2 printers. Around 16 printers were
running at any time.
The build volume of the Afinia printers is 140 x 140 x 135 mm. The vertical
resolution is 0.15-0.40 mm. The build volumes of UP! mini 1 and UP! mini 2 are
both 120 x 120 x 120 mm, with a vertical resolution of 0.20-0.35 mm. Extrusion
rates for these printers are estimated to be 20-50 mm/sec.
Site 2: University of California (UC) Material Data Collection
A labeled cardboard waste bin was placed among the 9 Type A Series 1 Pro
printers in the Jacobs Institute for Design Innovation makerspace. The build
volume of each is 305 x 305 x 305 mm. The recommended vertical resolution is
0.05-0.30 mm. The feed-rate is 15-120 mm/s while extruding, 30-250 mm/s while
traveling. These printers only use PLA during normal operation. This bin
collected all unwanted and failed prints, as well as residual filament and support

49
material. The contents of bin were collected periodically and sorted into 10
categories: the 9 failure modes and 1 final category for residual support material.
3.2.3 Energy Consumption Data Collection
Energy consumption data were collected at two sites on four different printers
using 2 different machines. Power monitoring tests were conducted at both sites to
establish equivalent comparisons between ABS and PLA, and among 4 different printers.
These comparison tests specified printing a cup-shape design in three different
orientations as test sets in both materials on each machine. For each test set, the printer
preheated the printing platform for the required time. Then the printer started to print the
cup-shape part in one orientation. Once the part was finished, it was removed from the
platform. After the platform was cooled down to room temperature, printing of the cup-
shape part in another orientation started, following the same procedure. Default material
settings (heating levels) were used per manufacturer recommendations. Power monitoring
equipment with sampling rate ranges from 0.1 Hz to 10 Hz were installed on each printer
when printing the cup-shape parts. These parts were qualitatively examined for adequate
and comparable quality. The mass of each printed part was also measured in order to
calculate the printing energy intensities in MJ/kg.
In addition, the power consumption was tracked for the machines’ preheating,
idle, and production time during daily production at the different sites. The idle time for
each part is calculated by averaging all idle time between two separate printings during
the entire monitoring time.

50
Site 1: Energy Data Collection
ABS Filament: To study the energy consumption of the Afinia H480 printer using
ABS filament, an EXTECH 380803 Power Analyzer was connected to one printer
to collect and record the power data. The power analyzer recorded the current
power in Watts every 10 seconds (0.1 Hz). The sampling rate is relatively low,
since the power analyzer can only store 1012 sets of data. Power data could be
viewed from the software at 1 Hz, but not be stored. The energy consumption
shown in the software was manually monitored, recorded, and compared to the
0.1 Hz data. The differences were negligible. One test set was done for the Afinia
H480 printer using ABS filament. Additional long-term power data for daily
production was monitored using the EXTECH with sampling rate of 0.007 Hz.
PLA Filament: To study the energy consumption of the FDM printers when using
PLA filament, HOBO UX120-018 Plug Load Data Loggers were connected to 3
different printers in the open shop, which were the Afinia H480, UP! Mini 1 and
UP! Mini 2. The power analyzer recorded the power in Watts at a sampling rate of
1 Hz. Three controlled test sets were recorded. The daily production using PLA
filament was monitored using HOBO with sampling rate of 0.1 Hz.
Site 2: Energy Data Collection
Site 2 used a single Type A Series 1 Pro machine for test printing. A Yokogawa
CW240 Energy monitor was connected to the printer to collect power and time
data at a sample rate of 10 Hz. One test set was done using ABS filament, and one

51
test set was done using PLA filament. The daily production was monitored using
Yokogawa with a sampling rate of 10 Hz.
3.2.4 Site Consistency
The sites for data collection vary in population, access controls, machine type,
primary material used, and researchers classifying waste. Site 1 is open access to all
students and has more affordable machines running primarily ABS plastic. Site 2 is a
paid access space (free material) with higher-end machines running exclusively PLA
plastic. These differences suggest that site 1 might expect a higher waste production rate
than site 2.
Equivalence tests between the two sites were conducted. First, machines at the
respective sites swapped material types and printed the same design to provide equivalent
power consumption rates. This test identifies machine specific power requirements,
independent of material choice. Second, waste collected from each site was sent to the
other and re-categorized in a blind test by researchers at each site. This inter-rater
agreement test uses Cohen’s kappa to evaluate the level of agreement between site
specific researchers.
3.3 Results and Discussion
This section will report the results from the material waste collection, energy
consumption data collection, and the uncertainty and variability analysis, including
regression and cross-validation.
52
3.3.1 Material Waste Results
Daily averages of waste for Site 1 were computed by weighting each collection
total by the number of days since the previous collection and the number of machines in
the facility. For ABS, a total of 36.6 kg of waste was collected for Site 1. The mean daily
waste generation rate for an open shop was 402 g/day. For PLA, a total of 18.1 kg of
waste was collected. The mean daily waste generation rate was 393 g/day. The summary
of the waste in Site 1 is shown in Table 3.
From the data, the total material waste of PLA per day is less than the total waste
of ABS. However, the mass of support material for PLA is larger than ABS; the mass of
PLA failed parts is less than ABS. Based on the results, changing from ABS to PLA
filament is likely to reduce the mass of failed prints. The glass transition temperature is
105 ℃ for ABS and 60 ℃ for PLA. The melting of PLA is 173 ℃. Therefore, PLA needs
less pre-heating of the printing platform. PLA is also less like to warp, and calibration
problems with PLA decreased compared to ABS. The failure caused by layer shift and
printer stop increased, however, since the printers at Site 1 had exceeded their useful life
expectancy. Around 67.6% of printers operated normally when using ABS in the first
semester of study. However, only 51.6% of printers operated normally when using PLA
in the later semesters. Therefore, the increased age of printers likely influenced the scrap
ratio. Figure 6 shows the waste fraction by type of failure for Site 1.

53
Table 3 - Site 1 Waste Summary
Category
Weighted Daily
Average PLA
(g/day)
Total PLA
Collected
Weighted Daily
Average ABS
(g/day)
Total ABS
Collected (g)
Support
Material 274 12605 181 16490
Platform
heating 3 155 48 4330
Layer shift 26 1212 11 1028
Removal
breakage 7 300 19 1684
Printer stops 38 1733 29 2668
Calibration 25 1144 76 6928
Skip layers 1 26 2 174
Filament 1 47 10 862
Deformed
shape 14 643 20 1802
Non-physical 5 246 7 633
Cumulative 394 18111 403 36599
Figure 6 - Waste Fraction by Type of Failure for Site 1

54
For Site 2, waste generated in a student makerspace with paid access and free
material was collected from both the fall and spring semesters in the 2016-2017 academic
year. Collection occurred 8 times with varying duration between dates. Waste
accumulated over the winter break was not included as it was generated solely by
professional staff for research purposes. A total of 43.2 kg of waste was collected. The
mean daily waste generation rate was 244 g/day. The summary of waste from Site 2 is
shown in Table 4. Figure 7 shows the waste fraction by type of failure for Site 2.
Table 4 - Site 2 Waste Summary
Category Weighted Daily Average
(g/day) Total PLA Collected
Support Material 87 15712
Platform heating 28 4834
Layer shift 30 5033
Removal breakage 10 1910
Printer stops 23 3978
Calibration 38 6780
Skip layers 9 1575
Filament 3 510
Deformed shape 13 2445
Non-physical 3 440
Cumulative 244 43217

55
Figure 7 - Waste Fraction by Type of Failure for Site 2
It is assumed that the no significant quantity of waste was disposed of elsewhere,
and the relatively high amount of waste supports this assumption. If the users wanted to
study a failed part or had significant intellectual property concerns, they might take the
failed parts out of the facility. Recording the variability week to week helps characterize
the effects of such uncertainties.
3.3.1.1 Material Consumption Uncertainty and Variability
The waste rate (g/day) could be affected by site, material types, and material
usage rate. Equation 10 shows the regression equation for waste rate, denoted by 𝑅𝑤𝑎𝑠𝑡𝑒.
𝑅𝑤𝑎𝑠𝑡𝑒 = 𝑏0 + 𝑏1 × 𝑆𝑖𝑡𝑒 + 𝑏2 × 𝑀𝑎𝑡𝑒𝑟𝑖𝑎𝑙 + 𝑏3 × 𝑅𝑢𝑠𝑎𝑔𝑒 (10)
Table 5 shows the regression analysis results, which are based on Site 2 using
PLA. The plot of the waste rate fit line is shown in Figure 8.

56
Table 5 - Material Waste Rate Regression Results
(g/day) Estimate STD Error t value P(>|t|)
Intercept (b0) 246.3 44.55 5.529 9.73e-5(***)
SiteGT (b1) 151.1 83.15 1.817 0.0923(.)
ABS (b2) 23.85 86.72 0.275 0.7876
Material Usage Rate (b3) -0.00205 0.00387 -0.529 0.6055
*** means >=99.9 confidence; (.) means >=.9 confidence
Figure 8 - Waste Rate Fit Line (Assumed Gaussian) and Data
The waste rate (g/day) regression indicates: ABS is associated with a higher scrap
ratio; the base waste rate across sites was roughly 246 g/day; Site 1 had a higher waste

57
generation rate; and material usage rate (proxy for production) is not a strong predictor of
waste rates. This regression was weighted by the number of machines available at each
site and the number of days between sample points.
The average scrap ratio for Site 1 using ABS is 0.35 and PLA is 0.40. The
average scrap ratio for Site 2 using PLA is 0.23. Site 1 is an open space with lower
barrier-to-entry machines (lower cost). Unlike Site 2, Site 1 does not require any training
before using the printers. These differences could explain the higher rate of disposal, as
the users may be more prone to errors and the machines more likely to cause an error. For
Site 1, data were collected for a period during which only trained staff had access to the
printers. The scrap ratio of this period is 0.26. It is similar to the average scrap ratio of
Site 2. Therefore, the average scrap ratio of Site 2 might better represent printers used by
trained users. The average scrap ratio of Site 1 can show the data for printers used by a
mix of users. The baseline waste rate across both sites indicates what could amount to a
significant addition to the municipal waste stream as more office users purchase
machines.
Uncertainty in sorting among different sites was measured using Cohen’s Kappa
for an inter-rater agreement test. Waste collected from each site was sent to the other and
re-categorized in a blind test by researchers at each site. Table 6 shows the interrater
agreement measures and interpretation. Landis and Koch characterized values < 0 as
indicating no agreement, 0–0.20 as slight, 0.21–0.40 as fair, 0.41–0.60 as moderate, 0.61–
0.80 as substantial, and 0.81–1 as almost perfect agreement [183]. The Cohen’s kappa
ranges from 0.45-0.62, which is a moderate to substantial agreement between the two
raters.

58
Table 6 - Summary of Cohen’s Kappa
Output Site 1 Site 2 Overall
Observed Agreement 0.68 0.55 0.63
Random Agreement 0.15 0.18 0.16
Cohen’s kappa 0.62 0.45 0.55
Kappa Error 0.045 0.058 0.036
Interpretation Substantial Moderate Moderate
3.3.2 Energy Consumption Results
Figure 9 shows the operation power at Site 1 and Site 2 using PLA.

59
Figure 9 - Operation Power of Printers at Site 1 and Site 2 Using PLA
Table 7 shows the average of the preheat time and power for each stage. For Site
1, 53.7% of the time was in idle for the Afinia using ABS, 74.3% for the Afinia using
PLA, 70.6% for the UP! Mini 1 using PLA, and 65.4% for the UP! Mini 2 using PLA.
The makerspace at Site 1 opens 10 am to 6 pm for workdays. For 76.2% of the time, the
makerspace is not open to public. However, the printers are not turned off after-hours.
This could justify the relatively high idle time of the printers. Table 7 shows that the idle
power is relatively high. Therefore, low operating time can increase the energy intensity
significantly. 30.5% of the energy was consumed during the idle mode for Afinia using
ABS, 37.5% for Afinia using PLA, 60.9% for UP! Mini 1 and 48.3% for UP! Mini 2.
Hence, increasing the operating time of the printers can decrease the energy intensity and

60
increase the efficiency of the printers. Moreover, the printers can be turned off when not
in use to save energy. The makerspace at Site 2 was open 12 hours a day for workdays,
and 6 hours on Saturdays, with an average idle time of 68%. Idle operation consumed
14.7% of the energy for ABS and 13.0% for PLA. The fraction of idle energy
consumption at Site 2 was lower than Site 1 since the idle power is relatively small
compared to the print and preheat power for TypeAPro1.
Table 7 - Energy Consumption Characterization Data
Printer Material Preheat time
(s)
Preheat power
(W)
Print power
(W)
Idle Power
(W)
Afinia H480 ABS 450 74.2 82.6 31
Afinia H480 PLA 98.5 100.8 52.7 30
UP! Mini 1 PLA 71.5 71.6 49.3 25
UP! Mini 2 PLA 55.4 90.8 49.2 24
TypeAPro1 ABS 487.6 245 245 19.9
TypeAPro1 PLA 110 299 299 21.1
The print power for PLA is less than that for ABS, likely due to lower platform
and nozzle temperatures. In addition, the printers using PLA required shorter preheating
time (usually less than 1.5 minutes) compared to the printers using ABS. Thus, the
preheat energy consumption using PLA is less than that of ABS.

61
3.3.2.1 Energy Consumption Uncertainty and Variability
Equation 11 shows the regression equation for the energy intensity, EI. The unit
of the energy intensity is MJ/kg.
𝐸𝐼 = 𝑐0 + 𝑐1 × 𝑀𝑎𝑐ℎ𝑖𝑛𝑒 + 𝑐2 × 𝑀𝑎𝑡𝑒𝑟𝑖𝑎𝑙 + 𝑐3 × 𝑆𝑖𝑡𝑒 (11)
The print energy intensity (MJ/kg) could be affected by machines and material
types. Table 8 shows the regression analysis results, which is based on the Afinia H480
printers using ABS. The plot of the energy intensity fit line is shown in Figure 10.
Table 8 - Energy Intensity Regression Results
MJ/kg Estimate STD Error t value P(>|t|)
Intercept (c0) 26.27 2.682 9.797 2.09e-8(***)
UP1 (c1) 1.776 4.143 0.429 0.673
UP2 (c1) 3.715 3.973 0.935 0.363
TypeAPro (c1) 21.368 2.894 7.383 1.07e-6(***)
PLA (c2) -18.147 2.847 -6.374 6.93e-6(***)

62
Figure 10 - Energy Intensity Fit Line (Assumed Gaussian) and Data
The energy intensity regression indicates that: PLA is less energy intensive than
ABS; the Afinia is the least energy intensive machine to use for a given amount of
material; the choice of material and machine may play a significant role in determining
the energy intensity; and the TypeAPro is the most energy intensive machine. TypeAPro
has larger building envelop than the Afinia, UP! Mini 1 and UP! Mini 2, which could
explain the much larger energy intensity. This regression was weighted by the amount of
time for each test in collecting the energy intensity quantities.
3.3.3 Monte Carlo Life Cycle Inventory Results
The data collected provide statistical parameters that can be used for Monte Carlo
simulations of FDM LCIs. The life cycle of FDM includes four major stages, which are
(1) the primary production including the polymerization and granulate formulation, (2)
the filament making, (3) FDM including preheating and printing, and (4) end of life. Four

63
different simulations of LCIs were done using 10,000 samples: (1) LCI without setting
material type or location and assuming no failure, (2) LCI with failure variability but not
defining material type or location, (3) the LCI of Site 1 using ABS filament considering
failure, and (4) the LCI of Site 2 using PLA filament considering failure. For the LCIs
that did not define the material type or location, the material types and location were
considered equally probable. The Site 1 ABS and Site 2 PLA were selected as the two
materials and location possibilities because these data are the most reliable, and Site 2
does not use ABS.
Table 9 - Statistical Parameters and Results for the Monte Carlo Simulation
Parameter
ABS PLA Site 1 ABS Site 2 PLA
Mean STD Mean STD Mean STD Mean STD
Primary Production
(MJ/kg) 95.20 N/A 51.70 N/A 95.20 N/A 51.70 N/A
Extrusion to filament
(MJ/kg) 6.08 N/A 5.94 N/A 6.08 N/A 5.94 N/A
Centralized Recycling
(MJ/kg) 9.99 N/A 17.55 N/A 9.99 N/A 17.55 N/A
Preheating (MJ/kg) 1.55 0.79 0.38 0.40 1.87 0.24 0.96 0.22
Printing (MJ/kg) 39.80 16.34 16.65 7.71 20.74 1.39 25.76 5.15
Idle (MJ/kg) 7.04 - 7.35 - 9.50 - 4.01 -
Avg Scrap Ratio (%) 27.15 18.66 29.58 4.02 29.58 4.02 14.76 6.01
Total Energy Intensity
(MJ/kg) - - - - 204.29 12.07 125.01 10.79

64
For the overall LCI, it is assumed the PLA and ABS are equally likely to be used.
Therefore, the energy data for the overall simulation are the average of the energy data
for PLA and ABS. Table 9 shows the mean and standard deviation (STD) of the
parameters used in the simulations. The probabilities were assumed to be normally
distributed. The energy data for primary production, extrusion to filament and centralized
recycling are from CES Edupack 2016 [184].
Figure 11 shows the frequency distribution of the Monte Carlo simulation results
for the overall energy intensity with and without failure, and the frequency distribution of
the overall energy intensity with failure, Site 2 PLA and Site 1 ABS results. The 95%
confidence interval of the energy intensity for the overall energy intensity without failure
is 112.39-147.38 MJ/kg, for the overall energy intensity with failure is 127.27-288.41
MJ/kg, for Site 1 using ABS is 182.50-229.89 MJ/kg, for Site 2 using PLA is 105.80-
147.96 MJ/kg. Therefore, if printing failure is considered, the energy intensity range is
127.27-288.41 MJ/kg for 95% confidence without setting material type or location.
Figure 11 - Frequency Distribution of the Monte Carlo Simulation Results

65
Generally, the PLA material uses less energy than ABS. The printing failure could
increase the energy usage by 45.1% for the mean value. From the large standard
deviation of the overall LCI with failure results, the printing failure increases the
uncertainty of the LCI significantly, from a standard deviation of about 9 to 40.
The assumption that the two sites provide equally likely representations of
printing behavior requires more investigation. The two sites have different characteristics,
and Site 1 ABS has a much larger scrap ratio than Site 2 PLA. Material differences,
printer differences and operator differences are all possible causes – with operator
difference being a likely distinguishing factor. Site 1 is an open shop with lower barrier-
to-entry machines (lower cost). Student volunteers operate the facilities, rather than
dedicated personnel. The machines at Site 1 experience heavier loads and are generally
older than the Site 2. Although there were some limitations, the simulation results,
especially the confidence intervals, show the range of LCI of energy intensity for the
desktop-grade FDM.
3.3.4 Discussion of Broader Impacts
Regression analysis indicates that the rate of material usage is not a strong
predictor of waste rates. The amount of waste generated across both sites indicates that
more ubiquitous access to 3D printing may add considerably to the waste stream. If one
machine similar to those in this study is provided for every 100 K-12 students, or 2-5
classrooms, in the United States (~55 million students), our data estimates roughly 110
TJ (30 GWh) of energy consumed and 160 MT (176 short tons) of waste generated per
year alone.

66
3.4 Summary
This chapter quantifies the environmental impacts of desktop FDM printers in two
different makerspaces. For the material consumption, the baseline waste rate across both
sites average 35-45%, and may indicate a significant plastic waste increase as more
personal and school users purchase machines. For the energy consumption, the energy
intensity range is 127.27-288.41 MJ/kg for 95% confidence, if considering fabrication
failures. If desktop FDM printer adoption nears that of inkjet and laser printers, FDM
printers will consume large amounts of energy and material. For inkjet and laser printers,
Kawamoto et al. (2002) estimated that the stock of laser printers was 28 million and the
stock of inkjet printers was 74 million at the end of 1999, consuming 6.23 TWh/year and
2.88 TWh/year, respectively.
This chapter also reported the uncertainty and variability in energy and material
consumption of desktop FDM. The material usage rate was not a strong predictor of
waste rate. The TypeAPro was the most energy intensive machine among those studied.
More failures were observed with ABS than PLA. Overall performance may change with
application, however. Site 1 had a higher waste generation rate. Because Site 1 is an open
space with lower barrier-to-entry machines, the users may be less vigilant. The machines
were also more error prone. Categorization uncertainty was measured in a blind test re-
categorization of inter-site waste by researchers at each site. The inter-rater agreement
analysis of this blind test indicates the sorting instructions are reliable but may not be
comprehensive.

67
Based on the observations, user experience level may influence scrap ratio and
energy consumption. Cerdas et al. found that experienced users could better select
printing parameters that minimized waste [185]. In addition, the part geometries and
printing parameters could also influence the scrap ratio. As such, next, Chapter 4
examines the impacts of user experience level, part geometry and printing settings on
fabrication failures in order to determine the causes for failures in desktop FDM.
This framework can be applied to a broader set of processes, machines, materials,
and impact considerations, such as CNC machining. The investigation of environmental
impacts of CNC machining within novice environments was not performed in this study.
However, this framework could be applied to CNC machining with minor adjustments in
the operating phases considered for energy consumption and failures modes. The failure
sorting instructions should also be modified for the CNC machining process.

68
CHAPTER 4. CAUSES FOR FAILURES IN DESKTOP FDM
4.1 Overview
Chapter 3 showed that the environmental impacts of AM could increase
dramatically due to inexperienced users and malfunctions of inexpensive machines.
Novice users, the major users of desktop FDM printers, are often inexperienced in design
and operation, and can make improper decisions leading to fabrication failures. In
addition, the inexpensive desktop FDM printers are more prone to malfunctions, which
can also result into fabrication failures.
Such failures may be useful in education because they can help students to better
understand the structures and constraints of problems [15]. Embracing failure has also
been identified as one of the three guiding principles for an educational makerspace
[186]. However, youth can experience the failures of making as demoralizing [16]. In
addition, since there are always a limited number of printers in a makerspace, failures can
result in inefficiency of the makerspace operation.
Many of the printing failures could be caused by user behaviors. User behaviors
could result into uncertainty and variability when estimating environmental impacts of
FDM printers. For example, a makerspace that does not require any training before using
the printers could lead to higher environmental impacts [17]. Investigating user behaviors
to reduce environmental impacts of FDM printers is especially important because FDM is
expected to make AM a tool for everyday household life [187]. According to Wohlers

69
Report [188], more than 278,000 desktop 3D printers were sold worldwide in 2015. The
market of desktop 3D printers further grew by 49.4% worldwide in 2016 [189].
Few studies have investigated the causes of fabrication failures in makerspaces.
User experience and expertise level may influence the possibility of fabrication failures.
This chapter aims to investigate how failure rates change with user experience and
expertise level in university makerspaces. The printing failures and daily users of various
levels of experience were studied in an open-access university makerspace. Specifically,
user experience level, computer-aided design (CAD) models, printing parameters and
results were tracked and analyzed.
4.2 Methodology
For this research, one hypothesis was tested: failure rates decrease if users have
more experience and higher education level. The type and number of FDM failures and
user demographics in a free-access university makerspace (the Invention Studio at the
Georgia Institute of Technology) were studied. The makerspace is run by trained
volunteers who are undergraduate and graduate students. All students can use the printers
without training requirements. This study was approved under protocol H17008 by
Georgia Tech IRB.
The Invention Studio has a 3D printing makerspace with 9 Ultimaker 2+ printers
in Fall 2017 semester, and 10 Ultimaker 2+ printers in Summer 2018 semester. The
Ultimaker 2+ printer is a FDM printer with build volume of 223 x 223 x 305 mm and
resolution of 0.02 to 0.60 mm. The printers used PLA as the raw material.

70
From our previous research in this makerspace [18], the failure rates were
collected every two weeks in one semester and found that the failure rate for one time
period was significantly lower than other time periods. That time period was spring
break, during which the makerspace was closed to public and only trained staff could
access it and use the printers. In addition, the makerspace that requires training before
using the printers led to lower failure rates than the makerspace that does not require any
training, based on prior observation. Therefore, it is hypothesized that user experience
level may influence failure rates.
To test the hypothesis, the CAD files, failed parts and energy consumption within
the makerspace were collected and analyzed. For each CAD file, the source of the part
was recorded, if it was created by the user or downloaded from online websites such as
GrabCAD.com and Thingiverse.com. Additionally, individual students using the printers
and the decisions that they made were observed. Users’ experience information including
education level and number of times using CAD software and 3D printers was collected
in order to test the relationship between failure rates and users’ design experience level,
operation experience level and education level. The following multiple-choice questions
were used in the survey:
1. For how many projects have you used CAD software?
a. <3
b. 3-5
c. 6-10

71
d. >10
2. How many different parts have you printed on a 3D printer?
a. This is the first time
b. <5
c. 6-10
d. More than 10
3. How often do you use 3D printers in the Invention Studio?
a. <4 times/semester
b. 1-3 times/month
c. 1-3 times/week
d. >3 times/week
4. Which year of study are you in?
a. Freshman
b. Sophomore
c. Junior
d. Senior
e. Masters

72
f. MS/PhD
g. PhD
The printing parameters set in the slicer software were recorded, including layer
height, infill density, print speed and support material settings. The slicer software used
in the makerspace is Ultimaker Cura. The user interface of Ultimaker Cura is shown in
Figure 12. In addition, the users were not allowed to alter the temperature of the extruder
nor the printing bed.
Figure 12 - User Interface of Ultimaker Cura
For each printing job, the printing result of a success or a failure was recorded.
The users were asked if they considered the print a success or a failure and checked for
physical defects. If the print failed, the failure cause was recorded.

73
To measure the energy consumed by failed prints, HOBO UX120-018 Plug Load
Data Loggers were connected to 6 Ultimaker 2+ printers in the makerspace. The data
logger recorded the power in Watts at a sampling rate of 0.1 Hz. The data from the
loggers were exported and saved regularly. Based on the collected information, the
energy consumption data for failed prints were extracted and recorded. The mass of the
failed prints was measured using a scale, accurate to 2g.
The collected data were analyzed to show the causes of failures. Three sets of
analysis of variance (ANOVA) were done for the user’s experience level, the source of
the part, and the printing settings.
4.3 Results
In total, 95 sets of individual observations were recorded with 39 failed prints.
The overall failure rate was 41.1%. The average energy consumption per part was 3.0
MJ. The average mass of the failed parts was 28 g. The printing energy intensity is 107.1
MJ/kg. Table 10 summarizes the failure category, primary cause, detailed cause and
number of failed prints with respect to each failure cause.

74
Table 10 - Failure Causes and Number of Prints
Category Primary Cause Detailed Cause # of Prints
Designer
Support Material Support cannot be removed 2
9 Feature Size
Complex features 3
Cannot assemble 2
Wrong part size 1
Wrong hole size 1
Operator
Printing Settings Did not generate support 2
16
Printed out of area 1
Printer Operation
Loose calibration 8
Platform was moved 1
Printed wrong file 1
Out of filament 2
Filament tangled 1
Machine Machine Malfunction
Skip layers 1
14 Nozzle clogged 10
Layer shift 3
Among the 39 failures, nine failures were caused by designer errors. Two prints
failed because the designers did not consider the support material removing process.
Therefore, the support material could not be removed and ruined the surface finish. Since
support material is not needed for traditional manufacturing processes, the novice
designers may not consider it. Nine prints failed because of improper feature sizes. If the
designers did not consider the resolutions of the FDM printers, they may design too
complex and/or too small of features, which cannot be printed. If the designers did not
consider the tolerances of the FDM printers, the mating parts could not be assembled. In
addition, two parts failed because the designers specified wrong feature sizes for printing.

75
Sixteen failures were caused by operator errors, including improper printing
settings and operations. Three prints failed because the operators did not choose to
generate support material for parts with overhang structures. From the observations, the
operators did not click the option to generate support material in the slicer software
because they did not know what the function of support material was. One part failed
because the operator placed the part outside of the printable area of the printer in the
slicer software. Eight prints failed because the printers were not calibrated properly.
Therefore, the prints could not adhere to the printing platform and warped; the layers of
the prints could not adhere to each other either. One print failed because the printing
platforms were moved accidentally during the printing process. One print failed because
the operator uploaded or selected a wrong file to print. Three parts failed because the
operators did not check the status of the filaments before printing. Among these three
failures, two prints failed because the remaining filament was not enough for the parts.
One print failed because the printer was not able to extrude the tangled filament.
Fourteen failures were caused by machine errors. The primary cause was nozzle
clogging (71.4% of machine failures). Nozzle clogging could be caused by incorrect
temperature for extruding, poor quality filament, tight calibration and printer aging. To
decrease the environmental impacts of failures caused by nozzle clogging, the printer
should be stopped and repaired soon after the clog occurs. From the observations,
sometimes the printers ran without extruding any material to the end of the programmed
printing process, which wasted a large amount of energy.
The impacts of user’s experience level and printing settings on fabrication failures
of FDM were analyzed.

76
4.3.1 Impacts of User’s Experience Level
It is expected that a user with a higher experience level is less likely to make
failed prints. Therefore, data were analyzed to show the relationship between user’s
experience level and failure rates. Table 11 shows the summary of the collected data,
which includes the failure rates caused by designer error, operator error, overall failure
rates and number of users for each experience level respectively.
For designer errors, failures rates decreased as more CAD projects had been done.
The failure rates of designer errors also decreased as more parts had been printed. Higher
print frequency increased the failures rates of designer errors. For the year of study, the
failure rate of juniors (3rd year undergraduates) were four times as much as that of senior
(4th year undergraduates) and higher. Therefore, design experiences gained in CAD
projects, previous printed parts and knowledge learned from class could decrease the
fabrication failures caused by designer errors. Without such experience and knowledge,
higher print frequency does not benefit designers.

77
Table 11 - Summary of User’s Experience Level vs. Failure Rates
Category Experience
Level
Failure Rates (%) # of
Users Designer Error Operator Error Overall
Number of
CAD
Projects
<3 9.5 23.8 52.4 21
3-5 9.1 13.6 36.4 22
6-10 27.3 9.1 45.5 11
>10 4.9 17.1 36.6 41
Number of
Parts Printed
0 10.0 0 30.0 10
<5 14.3 14.3 32.1 28
6-10 5.9 11.8 41.2 17
>10 7.5 25.0 50.0 40
Frequency
<4/semester 6.4 10.8 27.0 37
1-3/month 12.5 31.3 68.8 16
1-3/week 4.5 9.1 18.2 22
>3/week 15.0 25.0 70.0 20
Year of
Study
Freshman 50.0 50.0 100 2
Sophomore 0 25.0 50.0 4
Junior 43.5 21.7 34.8 23
Senior and
higher 10.6 13.6 40.9 66
Not all parts printed were created by students themselves. Some users
downloaded parts designed by experts from websites such as GrabCAD.com and
Thingiverse.com. It was expected that failure rates for parts designed by experts would be
lower than parts designed by novice designers. Among the 95 prints, 26 parts were CAD
files downloaded from the internet. The other 69 parts were created by students
themselves. The students were considered to be novice designers, as they do not have a

78
large amount of design experience. From calculation, the failure rate for novice parts was
44.9%, and for expert parts was 26.9%. Therefore, parts created by users with higher
level of design experience are less likely to fail. An ANOVA was done for the source of
part. However, the p-value is 0.22, which shows no statistical significance.
Improper part geometries could lead to fabrication failures. When designing the
parts, the designers should have ideas of the printer specifications, including resolutions
and tolerances. If the designed feature sizes are too small based on the given printer
resolutions, the features cannot be printed. If the designers do not consider the tolerances
of the printers, they may create mating parts with same size and have risks that the parts
cannot be assembled. In addition, the design should avoid large, flat areas since they tend
to warp. From the observations, there were four failures caused by loose calibration, but
these could also have resulted from part geometry issues, since all four parts had large
and flat areas.
To reduce the fabrication failures caused by part geometry issues, designers
should know the printer specifications. If possible, test parts with different geometries
and feature sizes could be printed in order to have a deeper understanding of the printer’s
capacities.
For operator errors, the failure rates did not change significantly with the number
of CAD projects done. The number of CAD projects relates to users’ design experience,
which should not impact the operator experience. The failure rates decreased as the year
of study increased. In addition, the failure rates increased with more parts printed. The

79
failure rates did not change significantly with higher print frequency. These two
observations were misaligned with our expectations.
An ANOVA was done for the statistical analysis of the experience variables
impacting the failures rates. However, no statistical significance was shown for the
results. The p-value for CAD experience is 0.20, for parts printed is 0.10, for printing
frequency is 0.28. The result for year of study is not a full rank (rank deficiency), which
means the right observations to fit the model are not in the data.
4.3.2 Impacts of Printing Settings
A set of optimal printing settings is expected to be determined when using
Ultimaker 2+, which can minimize the failure rate. To figure out the optimal settings, the
layer height, infill density, infill pattern, print speed, support material settings and build
plate adherence type were investigated.
Figure 13 shows the failure rates versus four different printing parameters: layer
height, infill density, print speed and support overhang angle. The support overhang
angle is the maximum angle of overhang structure for which support material is added.
The smaller the angle is, the more the support material is added. From the diagram, the
failure rates increased with larger layer height. The infill density did not show an obvious
relationship with the failure rates. When the print speed was at 50 mm/s, the failure rates
were at the lowest point. The failure rates increased with higher support overhang angle.
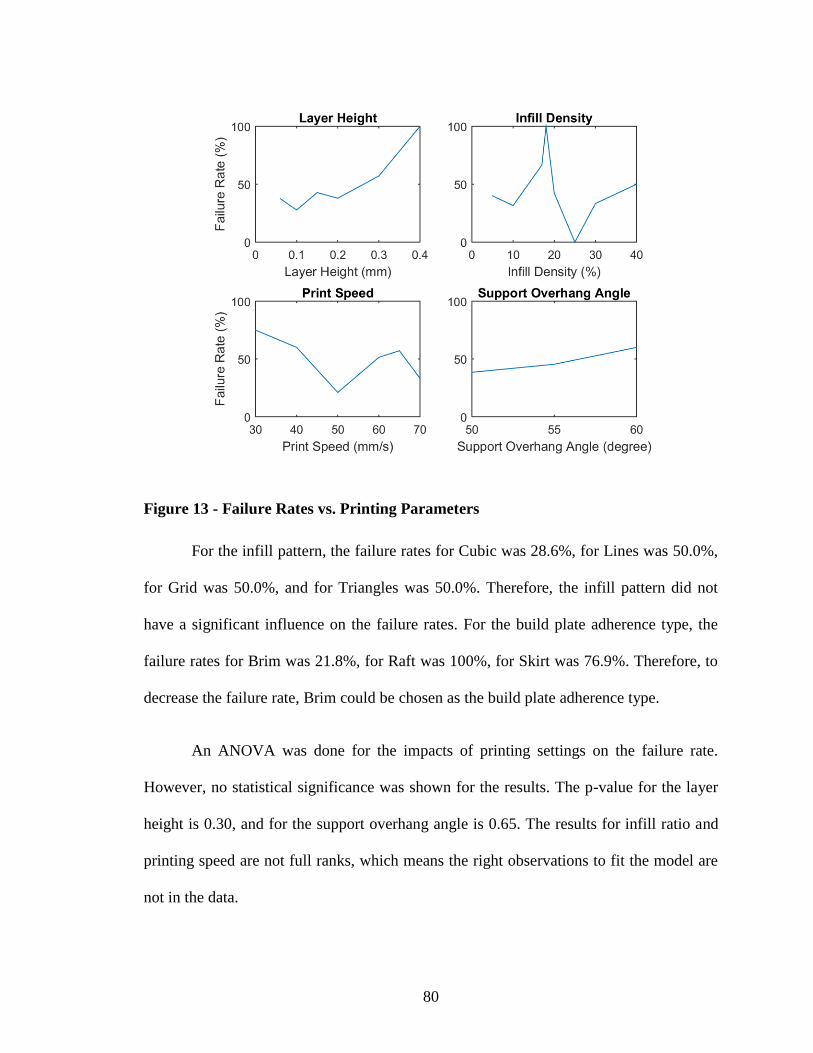
80
Figure 13 - Failure Rates vs. Printing Parameters
For the infill pattern, the failure rates for Cubic was 28.6%, for Lines was 50.0%,
for Grid was 50.0%, and for Triangles was 50.0%. Therefore, the infill pattern did not
have a significant influence on the failure rates. For the build plate adherence type, the
failure rates for Brim was 21.8%, for Raft was 100%, for Skirt was 76.9%. Therefore, to
decrease the failure rate, Brim could be chosen as the build plate adherence type.
An ANOVA was done for the impacts of printing settings on the failure rate.
However, no statistical significance was shown for the results. The p-value for the layer
height is 0.30, and for the support overhang angle is 0.65. The results for infill ratio and
printing speed are not full ranks, which means the right observations to fit the model are
not in the data.
>

81
4.4 Discussion
From the three sets of ANOVA, no statistical significances were shown. The
hypothesis that failure rates decrease if users’ amount of experience increases was tested.
Based on the analysis, it does not seem that experience results in effective expertise; thus
alternative hypotheses are:
• Increased affordances in shops can reduce failures.
• Dedicated training for operating FDM can reduce failures.
• Design for FDM education can reduce failures.
To test the hypotheses, the deliberate practices which is a special type of
experience should be measured in order to evaluate the expertise level of users. In
addition, the skills in a specific domain cannot be learnt from studying other subjects, it
must be studied and practiced in its own way [142]. Therefore, the skills in design for
manufacturing cannot be learnt from design activities or manufacturing activities.
Individuals should put deliberate effort in practicing design for manufacturing activities.
Based on the observations in the makerspaces, users with less operation
experience tended to seek assistance from trained staff. On the contrary, users with more
printing experiences tended to work independently. The assistance provided by staff is a
type of noise to the measurement. In the future, the assistance should be measured in
order to quantify its impact on the failure rate.
82
Although the results do not show any statistical significance when analyzing the
experience and printing factors influencing failure rates, the results do show that human
behaviors can affect the environmental impacts of FDM. The fabrication failures caused
by human errors accounted for 26.3% of the total number of prints, which increased the
environmental impacts by around 35%. The calculation methodology for the
environmental impact is presented in our previous work [18]. Therefore, solutions should
be provided to decrease the failures caused by human errors. Education, training and
assistance provided by software tools could be solutions [190].
4.5 Summary
This study investigated three types of failure causes for FDM, which are the
designer error, operator error and machine error. Ninety-five data points were collected,
with a failure rate of 41.1% observed. For the 39 failed prints, nine were caused by
designer errors, sixteen were caused by operator errors, and fourteen were caused by
machine errors. The detailed failure causes are reported.
The impacts of users’ experience levels and printing settings on fabrication
failures were investigated. Parts created by users with a higher level of design experience
had lower rates of failure, but were not statistically significant or statistically different
from the general population’s failure rate. Therefore, there is a need to distinguish
between experience and expertise. Students can gain design expertise through CAD
projects, designed parts and knowledge learned in class, but must increase their skill
deliberately and with adequate supporting information. For operators without training, the
failure rates did not decrease with quantity of printing experiences. For the printing

83
settings of Ultimaker 2+ printers, a small layer height, a small support overhang angle
and a print speed at 50 mm/s should be adopted to reduce failure rates.
ANOVAs were done to test the influence of users’ experience levels and printing
parameters on failures rates of FDM. However, no statistical significances were found
from the results. The types of experience measured are not sufficient to explain the
failure rates. Therefore, more work should be done to understand actual variables
affecting the failures rates of FDM and human behaviors. Nevertheless, the results still
demonstrate that accounting for human behaviors is critical when estimating the
environmental impact of products.
Chapters 3 and 4 show that novices can make improper decisions. Therefore, they
need instruction to reduce fabrication failures. In addition, significant amounts of
fabrication failures are caused by machine errors in AM. AM is a CAM process, which is
similar to CNC machining. In the future, AM and SM could be combined. Unlike AM,
almost all failures are caused by design errors for CNC machining. Chapters 5-7 discuss
the failures for CNC machining in order to develop automated guidance software to assist
novice engineering designers in making design decisions. This guidance framework
could also be applied to AM.

84
CHAPTER 5. COMMUNICATIONS BETWEEN DESIGNERS
AND MACHINISTS FOR CNC MACHINING
5.1 Overview
Novice engineering designers may make improper decisions that unnecessarily
increase manufacturing costs and fabrication failures, leading to higher environmental
impacts. Manufacturers could provide feedback to novice designers to assist them to
modify their parts in order to increase the manufacturability of the parts.
However, differences in interpretation between designers and manufacturers can
result in mistakes or miscommunication in the design or processing stages of
development. Therefore, it is necessary to identify the possible points of communication
failure between manufacturers and designers. To identify the communication problems,
observations of communication processes between designers and manufacturers, and
interviews that asked them to explain their experiences in communication failures were
conducted.
In addition, the effective feedback strategies used by the manufacturers should be
identified. The manufacturers observed were machinists in a university machine shop
who are experts in assisting novices. The manufacturers review manufacturing requests
submitted by students from different majors in the university, provide design feedback
based on the submitted drawings or CAD models, and manufacture these parts for
students. Therefore, observing the manufacturers can help researchers identify the
effective approaches they use to assist novices.

85
The designers and manufacturers observed and interviewed are primarily working
on conventional manufacturing processes, which is mostly machining. Therefore, this
chapter focuses on communication problems and effective feedback strategies for
machining processes.
5.2 Methodology
5.2.1 Observations in the Machine Shop
Observations were done in a free-access university machine shop to collect data
for CNC machining. The free-access machine shop is run by professional machinists. The
machine shop is open to all students in the university and does not charge for labor. The
designers need to provide raw material to the machine shop. If the manufacturing
processes need any special tooling such as drill bits, the designer also needs to purchase
these and provide them to the machine shop.
The observations and data collection were conducted during normal operation
time, which is 7 am to 4:30 pm on weekdays. Novice engineering designers
communicating with machinists were observed and recorded using a camcorder and
observation notes. The two machinists observed were experts in assisting novice
engineering designers. The novice designers observed were undergraduate and graduate
students from different majors in the university. Interviews of designers were done after
the communication in order to determine the designers’ expertise and experience level
and to figure out the effective communication strategies perceived by the designers. After
the observation and interview were done, the topics and issues mentioned in the

86
communication were coded. In addition, the artifacts used were coded for each
communication.
5.2.2 Interviews with Designers and Machinists
To further collect data for CNC machining, interviews were conducted with
designers and machinists who need to fabricate parts using CNC machines. The interview
subjects were novice designers and machinists working with novices. The interviews
were designed as non-directive/unstructured. The interviewees were asked if they faced
any communication problems before, and if so, to describe them. The interviews were
audio recorded. In addition, quotes from the interview related to fabrication failures and
feedback were extracted and coded into topics. All data collected during observations and
interviews was done so with informed consent through an IRB approved protocol. The
participation was voluntary and without compensation.
5.3 Results
5.3.1 Observation Results
Thirteen sets of observations were conducted for the pilot study. For the pilot
study, only observation notes were recorded for each communication. For the formal
study, 16 sets of observations were conducted in the university machine shop. From these
16 observations, ten novice designers were in mechanical engineering major. Six novice
designers were undergraduate students with one freshman, one junior and four senior
students. Ten novice designers were graduate students. For manufacturing experience,
three designers had no experience and had not taken any courses in manufacturing.

87
Eleven designers had prior experience in machining. For design experience, three
designers had not taken any courses in design. All 16 designers had some prior design
experience.
For the general communication processes, the designer came to the machine shop
and talked to the machinists to get feedback on their designed parts. The machinists
reviewed the documents, such as sketches/drawings/CAD models. If the machinists had
any confusion about the features or dimensions, they asked the students for clarification.
The machinists also provided feedback on how to select tolerances, problematic
dimensions and features, design revision suggestions and lead time.
Preliminary interviews were done with the two observed machinists. They were
asked to identify the most important information they need to check for in the submitted
jobs. Both machinists said that they need to check the geometries of the part, the
tolerance values and material type, in order to determine if the part is at risk for failures
during manufacturing.
Table 12 shows the topics mentioned during the communication observations.
The quotes from the communications are shown in Appendix A.1. These topics were
mentioned since the machinists identified some problems when reviewing the
manufacturing requests; or the designers asked the questions for feedback. Therefore, this
table also represents the failure reasons and problematic features the machinists identified
when working with novices.
The most important topic that appeared in the observations was the part
features/dimensions clarification. The most common issue was that the drawings or

88
sketches did not have notations of all dimensions for the parts. Therefore, the machinists
needed to ask the designers for clarification. In addition, the machinist would confirm the
drawing scale, unit system and surface finish with the designers if the information was
not provided.
Material is another important topic. When the novice designers approached the
machinists for design feedback, most of them had material selected. Therefore, the
machinists needed to confirm the material selection with the designers. When the
machinists were not familiar with the provided material, they asked the designers about
the properties of the material. Sometimes, they also tested the material to learn its
properties. In one observation, the designer wanted the machinist to cut a piece of “glassy
carbon” using wired EDM. In order to learn about the conductivity of the material, the
machinist tested it with a multimeter. The result showed that the material was conductive.
Then, the machinist told the designer they could use wired EDM for it. Sometimes, the
novice designers did not have material selected and asked the machinists for suggestions.
In order to provide feedback, the machinist asked the designers about the functionalities
of the parts. Then, the machinists suggested material selection while considering
manufacturability, corrosion resistance, mechanical properties and cost of that type of
material.
For tolerances, only three observations mentioned this topic directly; however,
four out of the remaining 13 observations mentioned the assembly and mating pieces,
which is related to tolerance determination. From the observations, the novice designers
usually did not know how to determine the appropriate tolerances. The machinist usually
determines the tolerance values based on the number of decimal places for dimensions

89
annotated on the drawings. If the machinist finds any tight tolerance such as dimensions
with three decimal places, they would ask the designers “I need to know why you [need
precision to] three decimal places here.” or “what is the tolerance?” For all three
observations that mentioned tolerances, the designers answered “I don’t know” for the
questions. Therefore, the machinist needed to explain the meaning of different tolerance
values to the novice designers. For other cases, the machinists determined the tolerance
requirements by asking the novice designers for more information about mating parts. If
the novice designers had the mating parts with them, the machinist would ask the
designer to leave the mating parts with them in order to make sure the parts could be
assembled.
In addition, the machinists often explained the manufacturing processes and
manufacturability of part features, and provided redesign suggestions to the novice
designers. From the interview data, it was ascertained that the novice designers could
understand what the best manufacturing process is to make the parts, what the machinists
can and cannot do, and how to make parts more practically for manufacturing by
knowing these types of information.
The last important type of feedback is the job submission, pick-up process, and
lead time. The machinists need to explain how to submit job requests and confirm the
lead time with the novice designers in order to avoid any delays for the job.

90
Table 12 - Topics Mentioned during the Communication
Topics/Participants 1 2 3 4 5 6 7 8 9 10 11 12 13 14 15 16 # Pilot # Total #
Job submission/pick-up process x x x x x x x x x x x 11 4 15
Features/dimensions clarification x x x x x x x x x x x 11 5 16
Material x x x x x x x x x x 10 2 12
Lead time x x x x x x x x x 9 5 14
Manufacturing processes x x x x x x x 7 8 15
Assembly/mating pieces x x x x x 5 5 10
Process/Machine/tool selection x x x x x 5 2 7
Manufacturability x x x x x 5 1 6
Redesign/part modification x x x x 4 2 6
Quantities of parts x x x x 4 1 5
Tolerance x x x 3 6 9
Hole x x x 3 5 8
Fixture x x 2 0 2
Drawing scale x 1 0 1
Clearance x 1 0 1
Unit system x 1 1 2
Surface finish x 1 1 2
Feature function x x x x x x x x 8 2 10

91
Table 13 - Artifacts Used for Communications
Artifact/Participants 1 2 3 4 5 6 7 8 9 10 11 12 13 14 15 16 # Pilot # Total #
Physical parts/blanks x x x x x x x x x x x 11 6 17
Drawings x x x x x x x x 8 7 15
Online portal x x x x x x x 7 6 13
Sketches x x x x 4 4 8
CAD model x 1 4 5
Ask for CAD model x x x x x x 6 1 7

92
Table 13 shows the artifacts used by the novice designers and machinists for the
communication. During the communication between the novice designers and the
machinists, 11 out of 16 communications (17 out of 29 total communications) used
physical parts or blanks. From the feedback provided from the interviews, three novice
designers mentioned the most valuable feedback strategies during the communications
were communicating using physical parts.
Eight out of 16 observations, and seven out of 13 pilot observations used
drawings during the communication, which shows that drawings are still the primary
form of communication between the novice designer and the machinist. For these
observations, the novice designers brought their drawings to the machinists for feedback,
mostly because they thought it would be the best form to communicate their design.
However, the machinists thought the CAD model was more important than 2-D drawings.
The machinists asked for CAD model files in six observations. According to the
machinists, they need the CAD models, since if the dimensions are not specified in the
drawings, they could check the CAD models to obtain the values. If the designers did not
bring any drawings or CAD models for simple parts, the machinists would help them to
make sketches to deliver their design intents.
This machine shop used an online portal to manage the job requests. By using this
online portal, the machinists are able to collect the information of the designers such as
their education level, major and contact information. The designers can also specify the
quantity of parts, material type and work description using this online portal. By using the

93
online portal, the machinists could manage the requested jobs more effectively and
collect information that cannot be shown in the drawings and CAD models.
5.3.2 Interview Results
Four interviews were conducted, three with machinists and one with a novice
designer. Interviewee 1 (Designer) was a design engineer who worked with
manufacturers a lot. He described his process during the design phase and some of the
challenges that he faces. One of the first points he made was that he does not really care
about the manufacturing process chosen by the machinists and tries not to interfere, as
long as dimensions and tolerances are met, and the functionality of the part is maintained.
However, he also mentioned that it is beneficial if manufacturers know the application of
the part, as this helps them understand what the constraints are for.
The designer also emphasized that the choice of manufacturers plays an important
role during the design and manufacture process, as some manufacturers actively ask for
more information if things are ambiguous while others do not. He gave an example of a
round orifice plate he had designed, where he did not explicitly mention that the hole in
the plate was concentric with the plate. The manufacturer chose to interpret this as the
freedom to put the hole anywhere on the surface of the plate, which reduced the
functionality of the plate. He also mentioned that some machinists do not care about
standards, and certified people are required to build certain parts because of these
standards.
The designer described his process when he has to make design changes. He
mentioned that through his experience, he has learned what manufacturers are looking

94
for. He points out important features to them and takes images of various views. This
designer uses phone calls and emails primarily to communicate with manufacturers, but
sometimes does need to physically meet with them.
For drawings, he mentioned that his “mind can drift off while making engineering
drawings” because it is not a stimulating process for him, and it takes a lot of time.
However, he mentioned that making drawings is also an important process for him, as he
might think of redesign ideas when making the drawings.
The key takeaway from this interview was the need to eliminate ambiguity.
Ambiguities can arise regarding material choice, surface finishes and from incomplete
dimensioning.
Interviewee 2 (Machinist 1) was an experienced machinist, who spoke about his
experiences during interactions with designers and the challenges he faces. He
highlighted that most of the problems he faces with CAD models and engineering
drawings are due to a lack of experience on the designer’s side. He also mentioned that it
is difficult to solve communication problems without having all the information about
how parts go together.
According to Machinist 1, machinists may or may not “proactively reach out with
questions”, depending on their relationship with designers, since this process is time
consuming. He also brought up another issue regarding measurement units used by
designers. Designers tend to make CAD models/drawings in metric, but then ask
machinists to convert dimensions to imperial units and manufacture parts. This sounds

95
reasonable in theory; however it might not be so in reality as it could lead to problems
with ordering non-standard pieces of material or require special tooling.
Machinist 1 also mentioned that he has had problems with incorrect or incomplete
geometric tolerances, which has led to flatness issues in parts. He also said that some
designers “do not have the concept of lead time,” as novice designers do not understand
the fact that there is a time lag wherein raw material needs to be ordered and received.
Interviewee 3 (Machinist 2) was another experienced machinist who provided
further insight into the manufacturing process and the challenges he faces. One of the key
points he made was that a lot of machining processes (like CNC, waterjet) are done
through CAD models directly. However, 2D drawings are also necessary to “put in the
hands of the machinist”, so that they know additional information, like tolerances and pin
fits, and do not need to measure these from the CAD model. Drawings are also important
for inspection checks.
Machinist 2 also mentioned that “machinists do not want to be in a liability
situation”, so they try to stay “ahead of the curve” and “figure out the application” of the
part. He extended this further to his unwillingness to handle expensive pieces of material,
if he is unsure of his process capability to support the project. He emphasized that he
would rather “lose business than damage this expensive piece of material”.
Some of the communication problems faced by Machinist 2 are due to “language”
barriers. He mentioned that he sometimes has to “draw things to ask questions”. This
indicates that he has to resort to visual prompts to get his point across to some designers.

96
He asks questions about CAD models feature-by-feature. However, some features could
get overlooked, due to time constraints.
Machinist 2 also spoke about the importance of standards. He highlighted that
different vendors have their own different standards, based on their capabilities. He
mentioned that some designers do not follow standards set by the manufacturer. As a
result, he has to make changes to drawings to match these standards, which is time
consuming.
Interviewee 4 (Machinist 3) was an experienced machinist working with college
students. The machinist in the university machine shop wanted CAD files, since if there
are any dimensions missing in the drawings, they can measure the CAD model to get the
dimensions. However, not all students know how to create CAD models, especially
students not in ME/AE. It is a struggle for some students to model or specify threads,
especially if they flip back and forth between metric and imperial systems. Machinist 4
also mentioned the tolerances. The students may specify tight tolerances or even omit
tolerance information completely on the drawings.
For the communication process, when a student brings in a part, the machinist
will first ask about the materials. The machinist will provide suggestions based on the
functionality of the part. Then, he will look at the geometry to ask the students if they
need some specific low-manufacturability features. A documentation system is needed to
record the comments. Otherwise, it could lead to something that does not work.
Based on the above four interviews, there are a few reasons for gaps or loss of
information between the design phase and the manufacturing phase.

97
1. The inexperience of the designers themselves: novice designers may not be
able to communicate their ideas effectively to machinists. They are not well versed in
how to dimension drawings, which could lead to missing dimensions or dimensioning
critical features off unimportant sides or edges, ultimately resulting in parts not meshing
together. They are also not mindful of tolerances, maybe due to a lack of understanding
of the application of the part, sometimes imposing three or four decimal place tolerances
when they are not required. Such tight tolerances increase the cost and manufacturing
time of parts.
2. Proactivity of manufacturers to gather additional information: Efforts taken by
machinists to understand the application of a part and to help novice designers with
revisions contribute to reducing ambiguity and maintaining functionality of parts.
Table 14 shows the topics mentioned in the interviews. The exact quotes extracted
are shown in Appendix A.2. The most common topics leading to fabrication problems are
tolerances, dimensions, and hole callouts. The interviewees mentioned that designers do
need to have manufacturing knowledge to do better design.

98
Table 14 - Topics mentioned in the interviews
Topics/Interviewee Designer Machinist 1 Machinist 2 Machinist 3
Tolerances x x x x
Dimensions x x x x
Hole callouts x x x x
Surface finish x x
Pin fits x x x
Feedback system x x x x
Drawings x x x x
Designers need to have
manufacturing knowledge x x x x
Experience of designers x x x x
Design revisions x x x
Material cost x x
Processing cost x x x
For the tolerance, all three machinists mentioned they faced situations in which
designers put tight tolerances but did not really mean to do so. For example, Machinist 3
mentioned that a student came to him and said he wanted the tolerance of 0.0005 mm. He
said he did not have a machine that can do this many decimal places. Then, the student
checked with his advisor who said they did not need the 0.0005 mm tolerance. For
another case, the machinist found that the drawings had four decimal places. He asked the
student why it needed to a four decimal points. The student did not understand why he
asked that question. The student put the four decimal points because they had it default to
that level of precision in SolidWorks.

99
From the interviews, the hole callout is another factor that contributed to failures.
The common failure is that designers are confused about threaded holes and clearance
holes. The threaded hole is a hole with threads. The clearance hole is a hole that is big
enough for a threaded screw to pass through. Machinist 3 also mentioned that he needed
to explain to the students that he cannot do a square hole with a round tool.
5.4 Discussions
From the observations and the interviews, the most common failures during
communication are identified, which are missing information, unclear information, tight
tolerances and low manufacturability features (i.e., features that cannot be made from
conventional machining, such as square holes and holes with flat bottoms).
From the observations in the machine shop, effective strategies used by the
machinists can be identified. For missing information and unclear information, the
machinists could identify the problems and ask the designers to clarify the information. If
the designers have problems providing the information, the machinists could assist them
to identify the information by understanding the functions of the parts.
For determining the required tolerance values, the machinists often pointed to
some features they identified to be critical (such as holes) and asked if the dimensions
and tolerances of the features were critical for the parts’ function, in order to avoid too
tight or loose tolerances. They also asked for the mating parts to ensure the parts can be
assembled.

100
For the low manufacturability features, the machinists often pointed to the
features and explained why the features could not be made by sketching the
manufacturing processes. In addition, if the machinists identified complex part
geometries, they asked if the features were necessary for the design in order to avoid over
design issues. These data demonstrate that visualization is important for communication.
In addition, although experienced designers like the one interviewed here may
only communicate with machinists through phone calls or emails, novice designers think
the face-to-face communication is better for them. Three novice designers said the most
valuable feedback strategies the machinist used is communicating with real parts. One
novice designer mentioned that he had conversations with the machinist over emails;
however, face-to-face communication with both parties looking at the same parts was
more effective. In addition, the machinist was able to point to the identified problematic
features during the communications.
5.5 Summary
This chapter identified the common fabrication failures of machining from
interviews and observations of machinists and designers. The most common failures are
missing information, unclear information, tight tolerances, and low manufacturability
features. Missing information and unclear information, such as dimensions and
annotations, could lead to parts manufactured not as the designer intended. Unnecessarily
tight tolerances could increase the production time significantly and increase the
possibility for failures. Low manufacturability features cannot be made from

101
conventional machining processes and will require special tooling, which also increases
the production time, cost, and failure possibilities.
Effective strategies have been identified from the observations in order to
decrease failures. Novice designers may not be able to communicate their ideas
effectively to machinists. Therefore, efforts taken by machinists to understand the
application of a part and to help novice designers with revisions contribute towards
reducing ambiguity and maintaining functionality of parts. Visualizations used to point
out problematic features and explain the manufacturing processes could assist the novice
designers in redesigning the parts. Face-to-face communications using real parts could
also assist the novice designers in understanding how to improve the manufacturability of
the parts.
These findings are used to develop the novice DFM prototype in Chapter 6.

102
CHAPTER 6. DESIGN FOR MANUFACTURING PROTOTYPE
DEVELOPMENT
6.1 Overview
Chapters 5 identified the common failure points in machining and the effective
communication strategies used by machinists who are experts in assisting novices to
make design decisions. Based on the identified feedback content and strategies, a DFM
prototype for novices was built to provide feedback to designers on paper for machining
process, including turning and milling. This prototype can simulate how to assist novice
designers to change design decisions to increase manufacturability and decrease
fabrication failures.
Firstly, the system framework was developed based on the communication
processes used by the communication experts. With the identified system framework, the
feedback contents and feedback strategies were identified based on literature,
benchmarking studies, interviews, and observation results. In order to develop the novice
DFM prototype for testing described in Chapter 7, a pilot study was done. In the pilot
study, the participants were asked to test and evaluate different types of feedback content
and strategies.
For the novice DFM prototype, SolidWorks is used as the CAD software. Objects
are chosen as study cases representing common design issues identified. A SolidWorks
plug-in demo was developed to show the general functions of the prototype. For the
prototype testing, a paper version of the system was developed.

103
6.2 System Framework
Figure 14 shows the general framework for the system. The first step in the
system is to ask the user to import or create the CAD model in using CAD software, such
as SolidWorks. With the CAD model, the system analyzes the design, and outputs the
DFM feedback for the users. If the user is satisfied with the feedback that no problematic
feature exists, or he/she considers the problems in the feedback as not critical, the user
can proceed to the next step. Otherwise, the user could modify the parts based on the
feedback provided by the system, and then analyze the part again. This process iterates
until the user is satisfied with the designed part.
The next part of the system asks the user to input the design parameters for the
parts, such as tolerances and material type. For the tolerance values, the user can input the
general tolerances for the whole part, and also the specific tolerances for features that
need to have looser or tighter tolerances than the general tolerances. With the input
values, the system can evaluate the design and provide feedback to the user. If the user
specified too tight of tolerances, the system will explain to the user the meanings of using
tight tolerances and confirm with the users that this value is what the user wants. Based
on the feedback provided, the user can choose to adjust the tolerance values and evaluate
again, or proceed to the next step. For the material type, the user can specify the material
selection for the design. The system is able to provide feedback, such as the mass of the
part based on the selected material. The system should also explain the manufacturability
and mechanical properties of the part. If the user specifies materials that are very difficult
to machine, the system will notify the user and make sure the user does need this type of
material for the design.

104
Start
Input
CAD
Model
User
Satisfied?
Input
Design
Parameters
Analyze CAD
Model
Output
DFM
Feedback
Modify CAD
Model
No
Yes
Evaluate Design
Parameters
Output
Parameter
Feedback
User
Satisfied?
Modify
Design
Parameters
Input Notes
for
Manufacturers
No
Yes
Submit Job to
Manufacturers
End
Figure 14 - Prototype Algorithm
After the user decides that he/she is satisfied with the input design parameters, the
user can input additional notes for manufacturers, such as surface finish, quantities of
parts, and any other special instructions. Then, the CAD model with input parameters and
notes is submitted to the manufacturers. With the submitted information, the
manufacturers are able to make the parts for the designers.
6.3 Feedback Content and Strategies
With the general framework, effective feedback content and strategies should be
identified. Benchmarking of DFMXpress and Xometry have been done to identify

105
effective feedback content and strategies. DFMXpress is a SolidWorks’ own analysis tool
that identifies areas that might cause fabrication problems. Figure 15 shows the user
interface of DFMXpress. The functionality of DFMXpress is limited to four
manufacturing processes: mill/drill only, turn with mill/drill, sheet metal, and injection
molding. For the feedback, DFMXpress can show the DFM rules failed and passed. For
the rules failed, pop-up dialogue explains the failure reasons to the designers when the
designers put the mouse on each rule. In addition, the problematic features are
highlighted when the designer clicks the “+” next to the failed rules and selects the failed
instance. If the designers click the “Help” button, SolidWorks will launch the user
manual for using DFMXpress, which describe the DFM rules with example pictures
showing high-manufacturability and low-manufacturability features for each rule. This
user manual also explains how to configure the parameters of the design rules such as the
hole depth to diameter ratios should be less than 2.75. However, the users still need to set
the rule parameters by themselves, which makes failure of CAD parts subjective and also
requires expertise from the users to use it. DFMXpress does not take material properties
and tolerances into account when performing the analysis.

106
Figure 15 - User Interface of DFMXpress
Xometry is a third-party SolidWorks plug-in that provides instant feedback on
design errors, pricing, and lead time. Xometry can manufacture the parts for the designers
if designers are satisfied with the quote provided by the system. The user interface of
Xometry is shown in Figure 16. Xometry can highlight the problematic features in the
CAD model without extra clicks, unlike DFMXpress. Unlike the DFMXPress, Xometry
also shows the DFM rules failed. In addition, Xometry allows users to select different
material and surface finishes, and input quantities of parts required. After changing the
design parameters of the part, Xometry can update price and lead time. However,
Xometry does not provide warnings if unnecessarily tight tolerances are set. In addition,
the extensive range of materials and manufacturing processes could be overwhelming for

107
novice engineering designers. Moreover, Xometry does not check drawings, which is be
a crucial consideration for manufacturing processes.
Figure 16 - User Interface of Xometry
From the benchmarking studies, both DFMXpress and Xometry can show the
DFM rules failed by the part as designed. From the literature review, DFM guidelines are
part of the important feedback content. Existing DFM guidelines for both machining and
FDM are summarized from literature. The DFM guidelines for machining are shown in
Appendix B.1, and those for FDM are shown in Appendix B.2.

108
In addition to the DFM guidelines, DFMXpress explains the manufacturing
processes with regard to each failed rule. The machinists also explain the manufacturing
processes to the designers. In addition, the machinists sometimes also sketch the
manufacturing processes when explaining. Therefore, explanations and visualizations of
the manufacturing processes could be potentially effective feedback content.
Both DFMXpress and Xometry highlight the problematic features of the CAD
model. Highlighting the problematic features is similar to the machinists pointing out the
features, assisting the designers to both locate and identify the problems, which may be
an effective strategy for the novice DFM prototype. Without such a strategy, the novice
designer may not be able to locate the problematic features successfully.
In addition, DFMXpress provides pictures in the help manual to show parts with
high and low manufacturability features. Similar to DFMXpress, the machinist used
sketching to explain problematic features during the observations. With example parts,
the designers are able to not only identify the problems, but also understand how to fix
the problems. Therefore, pictures showing examples could be used to assist the designers
to make changes.
6.4 Pilot Studies
Explanations and visualizations of manufacturing processes and example parts are
potentially effective feedback content and strategies. It is necessary to figure out what
type of visualization feedback can assist the designers more effectively. Four types of
visualization were suggested, which are manufactured parts from current CAD files,
example pictures to show features of high-manufacturability and low-manufacturability,

109
pictures or videos to show the manufacturing processes, and pictures with suggested
changes. In order to test which type of visualization can assist the designers more
effectively, a pilot study was conducted.
Two parts were selected for the pilot study. The first part is a pawn piece, which
should be made using a turning process, shown in Figure 17. The overall dimensions of
this part are 15 x 27 x 15 mm. The second part is a mounting piece for a kick-down
stopper, which should be made using a milling process, shown in Figure 18. This part is
used to mount the stopper piece to a door. The overall dimensions of this part are 75 x 50
x 35 mm. The hole diameter for the four small holes are 5.13 mm. The hole diameter for
the two large holes is 10 mm. These two pieces were selected since they both have low
manufacturability features and are pieces with functionality. The manufacturability
problems existing in these two parts were common failures identified from the interviews
and observations.
Figure 17 - Pawn Piece

110
Figure 18 - Doorstop Piece
For the pawn piece, the problematic feature is shown in Figure 19. This overhang
feature cannot be made from one turning path due to the angle of the tooling on the CNC
machine. Two turning paths are required to make this part. In order to decrease the
manufacturing cost and time, a fillet or chamfer should be added.
Figure 19 - Problematic Feature in the Pawn Piece

111
For the doorstop piece, three manufacturability problems exist, which are shown
in Figure 20. The first problem is the non-standard hole sizes. The diameter of the four
small holes is 5.13 mm, which is not a standard hole size, requiring a special drill
grinding. The second problem is the inaccessible features; the two blind holes cannot be
easily accessible using conventional machining process. In order to avoid special tooling,
features should be easily accessible, and undercuts should be avoided. The third problem
is the sharp internal corners, which is also called square hole problem according to the
machinists. Sharp internal corners cannot be made using round tooling. In order to avoid
special tooling, fillets should be added to the corners.
Figure 20 - Problematic Features in the Doorstop Piece
For the pilot study, the participants were asked to modify these two parts based on
the provided feedback. They are required to maintain the functionality of the parts. In
order to show the functionality of the doorstop piece, Figure 21 was provided to the
participants. The covered part is the part they were asked to modify.

112
Figure 21 - Illustration for Functionality of the Doorstop Piece
For the pilot study, a paper prototype was provided to the participants. Figure 22
shows an example feedback page for the prototype. Each page consists of three parts,
which are the feedback context explaining the DFM guideline, original CAD model with
the problematic feature highlighted, and the visual feedback. For the DFM guidelines, the
terminology or “jargons” used by machinists was minimized, since the novice designers
may not understand them, based on the observations.

113
Figure 22 - Example Feedback for the Prototype on Paper
In the pilot study, four types of the visualization feedback were tested. Figure 23
shows the four types of the visualization feedback for the overhang feature of the pawn
piece. The manufactured part with tooling path in the left corner was generated using
SculptPrint, which is a commercial software application that allows for a high degree of
automation in the production of G-code for CNC machines [191]. The example part
feedback shows one low-manufacturability feature with no fillet or chamfer for the
overhang feature, and one high-manufacturability feature with a fillet. The manufacturing
process feedback shows the cutting tool and tool motion direction for the part, which
illustrates that the overhang feature cannot be made from one turning path. The suggested
changes picture shows the suggested changes for the part. Similar visualization feedback

114
contents were created for the doorstop piece. For the visualization of the example parts,
the pictures were adapted from the DFMXpress user manual.
Figure 23 - Four Types of Visualization Feedback

115
Four sets of pilot studies were done. The participants were undergraduate students
who had taken the basic CAD modeling class. Based on the pilot study, the visualization
showing example pictures of features with high-manufacturability and low-
manufacturability were found to be the most effective method.
From the participants’ feedback, the two types of visualization related to
manufacturing processes require the designers to have knowledge of manufacturing.
From this type of visualization, users can identify the problems; however, they did not
know how to solve the problems.
Visualization showing suggested changes is effective for designers who want to
have manufacturable parts quickly. However, this type of feedback is prone to mistakes,
especially for complex parts.
6.5 Developed Novice DFM Prototype
The novice DFM prototype consists of two major parts: the DFM feedback and
the tolerance input. The DFM feedback consists of the DFM guidelines, the CAD model
with highlighted problematic features, and the pictures of example parts. An example
page is shown in Figure 22.
The tolerance input is included in the prototype because the machinists mentioned
during the interviews that significant number of novice designers do not specify the
tolerance values for their designed parts. However, tolerance values are important to the
manufacturing process, and tight tolerances specified could increase the fabrication
failure risk significantly. However, novice designers may not be able to specify

116
appropriate tolerance values due to lack of expertise. Therefore, the machinists usually
suggest tolerance values to the designers based on the functions of the parts. To
implement this strategy, the users were asked to input the tolerance values using the
prototype. The prototype provides recommended tolerance values to the designers. This
recommended tolerance value was determined by manufacturing experts. Figure 24
shows the general tolerance input page in the novice DFM prototype. To assist the
designers to determine the tolerance values, the overall dimension of the part is also
provided.
Figure 24 - General Tolerance Input Page
In addition, the machinists usually ask designers if features are critical and require
tighter tolerances. To implement this strategy, the novice prototype also asked the same
question to the designers. If the designers think any of the features need tighter

117
tolerances, they can highlight the feature and specify different tolerance values. Figure 25
shows the specific tolerance input page for the novice prototype.
Figure 25 - Specific Tolerance Input Page
A demo of the SolidWorks plug-in for the novice DFM prototype was also
developed. The user interface is shown in Figure 26. This demo shows the four parts of
the novice DFM prototype, which are material selection, design tolerances input and
evaluation, manufacturability evaluation, and additional notes/input for the
manufacturers. After specifying the material, this plug-in is able to calculate the mass of
the manufactured parts.

118
Figure 26 - SolidWorks Plug-In Demo
For the tolerance input, it asks the designer to input the overall tolerance for the
part. In addition, the prototype can go through each feature and ask if the designer needs
a specific tolerance for the feature. Figure 27 demonstrates the tolerance input using the
plug-in.

119
Figure 27 - Tolerance Input for the SolidWorks Plug-In
To check the manufacturability of the parts, the designer needs to click the
“Check for Manufacturability” button. Then, the plug-in analyzes the part and shows the
feedback to the designer. The feedback consists of a list of failed rules and highlighted
problematic features in the CAD model. By clicking each failed rule, the plug-in will
show the DFM guidelines and picture of example parts.
After the designer is done with all the modifications and input, the designer will
click the “Submit Final Design” button to submit the CAD model and material selection,
tolerance values and additional notes to the machinists.
6.6 Summary
Based on the findings from the literature review, benchmarking studies,
observations and interviews of the machinists and designers, the novice DFM prototype
was developed. The developed DFM prototype can provide manufacturability feedback,

120
including DFM guidelines, CAD model with highlighted features, and example pictures
showing high and low manufacturability features. The prototype also requires designers
to input overall tolerance values for the part, and any specific tolerances for critical
features. To assist the designers to input the tolerances, recommended values are
provided to the designers. In addition to the paper prototype, a demo of the SolidWorks
plug-in was developed to illustrate the user interface and basic functions of the prototype.
The developed novice DFM prototype on paper was tested. The testing results are
shown in Chapter 7.

121
CHAPTER 7. VALIDATION WITH PROTOTYPE TESTING
7.1 Overview
The novice DFM prototype development was described in Chapter 6. This chapter
illustrates the methodology to test the developed prototype. The participants were asked
to modify the pawn piece and the doorstop piece using the novice DFM prototype and the
benchmarking software DFMXpress. To compare the performance of participants
modifying the parts using the two systems, the number of problems identified and solved,
and time spent on identifying and solving each problem were evaluated. The patterns of
using each system to identify and solve problematic features were studied. In addition,
the usability of each system was evaluated using a usability survey and interviews. The
advantages and limitations of the novice DFM prototype were identified. Since this DFM
system was designed for novices, performances of participants with different experience
levels were evaluated.
7.2 Methodology
7.2.1 Test Procedures
The benchmark software chosen for the test was DFMXpress, since the workflow
is similar to the novice DFM prototype (novice prototype). Both the novice prototype and
DFMXpress provide DFM guidelines to users one by one. When using DFMXpress,
users need to click the problem one by one to read the feedback. When using the novice
prototype, the users need to read slides one by one to read the feedback. Therefore, it is
easy to record the time spent on each problem, and make the workflow controlled.

122
However, there are differences between the DFMXpress and the novice prototype. First,
DFMXpress allows users to change manufacturing processes; the novice prototype
requires users to use pre-specified machining processes (turning (lathe) and milling). To
accommodate this difference, users are told to use these same machining processes at the
beginning when testing DFMXpress. Second, DFMXpress can provide feedback to users
iteratively after modifying the parts. However, the novice prototype could only provide
one round of feedback based on the original parts. To accommodate this difference, the
results of using the novice prototype and first round analysis of DFMXpress were
compared. The users are required to modify the parts on paper first before doing so in
SolidWorks. Figure 28 shows the example paper provided to the participants to modify
the parts.
Figure 28 - Example Paper Provided to Modify the Part
The participants were recruited from related classes and posters. They are
required to be able to perform basic operations in SolidWorks. The participants were

123
randomly assigned into one of the two groups: 1. modifying given parts using the novice
prototype, then using DFMXpress, or 2. modifying given parts using DFMXpress, then
using the novice prototype.
At the beginning of the test, the researcher gave the participant the parts and
explained the functionality requirements of the given parts. The participant was told to
modify the parts based on the feedback provided by the novice prototype/DFMXpress;
however, they needed to maintain the functionality of the parts. The participant was
asked to modify both parts on paper first. After it was done, the participant was asked to
notify the researcher. The researcher then gave the participant the usability survey to
gather feedback on using the system to identify and fix the manufacturability problems.
Then, the participant was asked to modify the parts in SolidWorks based on the feedback
provided by the system they tested. If the participant was using DFMXpress, he/she was
allowed to check the parts iteratively after modifying the parts in order to figure out if the
problems were solved. When the participant finished modifying the parts in SolidWorks,
he/she was given the usability survey again to provide feedback on using the system to
modify parts in SolidWorks. Then, this process was repeated for the other system. The
participants were asked to modify the same two parts in the other system. When testing
the second system, the participant was asked to try his/her best to forget the feedback
provided by the previous system. Then, follow-up questions were asked to collect the
participant’s feedback, comparing the two systems and his/her experience/expertise level
in design and manufacturing. The whole testing process was recoded using a camcorder.
After the test was done, the video was reviewed to record the time the participant spent to
identify and fix each problem. The resolution of the recorded time is 1 second. In order to
124
verify the precision of the measured time, time spent for one problem identification
performed by one participant was measured 10 times and averaged, which shows a
standard deviation of 0.6 seconds. Informed consent was obtained for all participants,
adhering to an IRB approved experimental protocol. Participants were compensated with
$10 per hour.
To collect the participants’ experience level, the following questions were asked:
1. What is your major?
2. What year are you?
3. What design courses have you taken? Have you designed parts before? If yes,
what were the purposes for the parts?
4. What manufacturing courses have you taken? Have you manufactured parts
before? If yes, what were the manufacturing processes?
5. Do you have co-op or internship experience related to design or
manufacturing?
Then, the following questions were asked to collect the participants’ feedback
comparing the two systems.
1. Comparing the novice DFM prototype and DFMXpress, which one do you
prefer to use? Why?
2. If only provided text or only provided pictures, which one do you think will
help you identify and fix the problems better? Why?
3. Did you encounter any confusion when using the two systems? (If yes, what
were the confusions?)

125
4. The DFMXpress explains the manufacturing processes; to what extent do you
think this information helped you to identify and fix the problems?
7.2.2 System Usability Survey
The usability survey used for this test is the System Usability Scale [192]. It is a
fast but reliable tool to measure the usability. It consists of a 10-question survey with five
response options for each question. The survey is shown in Figure 29. The ten questions
are rated on a Likert Scale from 1 to 5. To calculate the usability score, for each of the
odd numbered questions, subtract one from the rated value; for each of the even
numbered questions, subtract the value from five. These new values are added up and
multiplied by 2.5 to get the usability score out of 100. However, this calculated score is
not a percentage.

126
Figure 29 - System Usability Scale Survey [192]
Studies have been done to convert the usability score to adjective ratings and
percentile range. According to Bangor et al., the usability score of 100 represents “best
imaginable, above 85.58 represents “excellent”, above 72.75 represents “good”, and
above 52.01 represents “ok” [193]. Based on this work, Lewis and Sauro created a curved

127
grading scale for the SUS [194], which is shown in Table 15. This curved grading scale
was used in this study.
Table 15 - Curved Grading Scale for the SUS
Grade SUS Percentile Range
A+ 84.1-100 96-100
A 80.8-84.0 90-95
A- 78.9-80.7 85-89
B+ 77.2-78.8 80-84
B 74.1-77.1 70-79
B- 72.6-74.0 65-69
C+ 71.1-72.5 60-64
C 65.0-71.0 41-59
C- 62.7-64.9 35-40
D 51.7-62.6 15-34
F 0-51.6 0-14
In addition to the SUS, four questions were asked to gather participants’
feedback:
1. What did you like about the software?
2. What didn’t you like about the software?

128
3. In what circumstances could you see yourself using this software in the
future?
4. What was one difficulty you had using the software?
7.2.3 Sample Size Estimation
For this usability test, determining sample size is essential. For comparative
studies, Landauer (1988) and Nielsen and Landauer (1993) found that statistically
significant findings are unlikely to be produced by a study group of less than eight
participants. Therefore, a minimum group size should be eight participants. Macefield
(2009) showed that a study utilizing 25 participants per group was quite likely to produce
statistically significant findings. Spyridakis and Fisher (1992) found that a study group
size of 10-12 participants will often produce statistically significant finding, which also is
in accordance with the advice of Rubin (1994) and Faulkner (2003). However, these
estimations are general and not based on the settings of the experiment. To estimate the
needed sample size for this study, the method development by Sauro and Lewis [195]
were used. According to Sauro and Lewis, there are two types of usability studies:
summative and formative. The goal of a summative study is to measure the
accomplishment of global task goals; the goal of a formative study is to detect and
eliminate usability problems. This test is a summative study, since it is aimed to figure
out how effectively and efficiently the novice DFM prototype could assist users to
identify and fix manufacturability problems.
The method to estimate the sample size is based on a t-test, which assumes
normal distribution and with no estimation of variability.

129
𝑒 =
𝑑
𝑠 (12)
𝑑 = 𝑒(𝑠) (13)
𝑛 =
𝑧2𝑠2
𝑑2 (14)
where 𝑒 is the effect size, 𝑠 is the standard deviation, and 𝑑 is the critical difference (i.e.,
the smallest difference between the observed and true value). Since there are four
manufacturability problems with the tested parts, the smallest difference for the percent
of problems solved is 25%. Therefore, critical difference 𝑑 is 0.25 𝑠 . A confidence
difference of 90% is assumed here in order to determine a fairly small effect, so the initial
value of 𝑧 is 1.282. By using Equation 12-14, the initial sample size estimation is 26.3
which rounds up to 27. The results of the first iteration, replacing 1.282 with 𝑡 for 26
degrees of freedom and 90% confidence (1.315), results in a sample size estimation of
27.7, which rounds up to 28. Thus, the appropriate sample size is somewhere between 27
and 28. The next iteration confirms a final estimate of 28. Therefore, at least 28
participants should be recruited to test the prototype.
7.3 Results
7.3.1 Performance of Participants
Thirty-four participants performed prototype testing. Among these 34
participants, 27 of them were in mechanical engineering, 4 in aerospace engineering, 2 in

130
electrical engineering and 2 in biomedical engineering. Twenty-five participants were
undergraduate students, and 9 participants were graduate students.
To measure the participants’ performance in using both systems, the number of
problems identified, problems fixed, and time spent to identify and fix each problem were
analyzed. The summary of the results is shown in Table 16. The standard deviation
(STD) and 90% of confidence interval for the results were also calculated. From the
results, the novice prototype can assist users to identify the overhang problem in pawn
piece more effectively than DFMXpress. For the doorstop piece, the DFM novice
prototype and DFMXpress show similar performance.
Comparing the time spent to identify and fix each problem, the novice prototype
can assist users more efficiently than DFMXpress in general. The average total time spent
on the pawn piece by using DFMXpress was 129 seconds, and by using the novice
prototype was 92 seconds. The average total time spent on the doorstop piece by using
DFMXpress was 205 seconds, and by using the novice prototype was 166 seconds. For
time spent on each problem, the only problem for which the novice prototype did not
assist the users more efficiently was the non-standard hole size problem. ANOVA tests
were done for comparing the means.

131
Table 16 - Average Number of Problem and Time Spent to Identify and Fix Problems
DFMXpress Prototype
P-Value Mean STD
90%
Confidence
Interval
Mean STD
90%
Confidence
Interval
Number of Pawn Problem Identified (#) 0.78 0.41 ± 0.12 0.97 0.17 ± 0.05 0.02
Number of Pawn Problem Fixed (#) 0.70 0.46 ± 0.13 0.94 0.24 ± 0.06 0.02
Number of Doorstop Problem Identified (#) 2.85 0.44 ± 0.12 2.85 0.55 ± 0.15 0.06
Number of Doorstop Problem Fixed (#) 2.67 0.72 ± 0.21 2.68 0.53 ± 0.15 0.09
Time Spent on Pawn
(s)
Pawn Problem Identified 54 67 ± 19 30 19 ± 5 0.047
Pawn Problem Fixed 75 89 ± 28 62 59 ± 17 0.051
Time Spent on
Doorstop (s)
Non-Standard Hole Identified 16 13 ± 4 20 18 ± 5 0.35
Non-Standard Hole Fixed 44 69 ± 19 43 77 ± 23 0.96
Inaccessible Feature Identified 36 43 ± 12 28 24 ± 7 0.36
Inaccessible Feature Fixed 51 81 ± 24 31 32 ± 10 0.23
Sharp Internal Corner Identified 18 17 ± 5 8 7 ± 2 0.004
Sharp Internal Corner Fixed 40 55 ± 16 36 38 ± 11 0.78

132
Table 17 - Number of Problems Identified vs. Manufacturing Experience
Number of
Participants
(#)
Number of Pawn Problem Identified (#) Number of Doorstop Problem Identified (#)
Novice Prototype DFMXpress Novice Prototype DFMXpress
Mean
90%
Confidence
Interval
P-
Value Mean
90%
Confidence
Interval
P-
Value Mean
90%
Confidence
Interval
P-
Value Mean
90%
Confidence
Interval
P-
Value
With lathe 25 0.96 ± 0.06 0.58
0.72 ± 0.15 0.10
2.84 ± 0.19 0.73
2.84 ± 0.15 0.85
Without lathe 8 1.00 ± 0 1.00 ± 0 2.88 ± 0.19 2.88 ± 0.19
With mill 24 0.96 ± 0.07 0.55
0.71 ± 0.15 0.07
2.83 ± 0.17 0.23
2.83 ± 0.16 0.75
Without mill 9 1.00 ± 0 1.00 ± 0 2.89 ± 0.26 2.89 ± 0.17
With both 22 0.95 ± 0.07 0.61
0.68 ± 0.16 0.12
2.82 ± 0.19 0.67
2.82 ± 0.17 0.95
With neither 6 1.00 ± 0 1.00 ± 0 2.83 ± 0.25 2.83 ± 0.25

133
Table 18 - Number of Problems Fixed vs. Manufacturing Experience
Number of
Participants
(#)
Number of Pawn Problem Fixed (#) Number of Doorstop Problem Fixed (#)
Novice Prototype DFMXpress Novice Prototype DFMXpress
Mean
90%
Confidence
Interval
P-
Value Mean
90%
Confidence
Interval
P-
Value Mean
90%
Confidence
Interval
P-
Value Mean
90%
Confidence
Interval
P-
Value
With lathe 25 0.96 ± 0.06 0.58
0.60 ± 0.16 0.03
2.72 ± 0.17 0.23
2.60 ± 0.26 0.72
Without lathe 8 1.00 ± 0 1.00 ± 0 2.63 ± 0.28 2.88 ± 0.19
With mill 24 0.96 ± 0.07 0.55
0.58 ± 0.17 0.02
2.75 ± 0.17 0.36
2.63 ± 0.27 0.60
Without mill 9 1.00 ± 0 1.00 ± 0 2.56 ± 0.27 2.78 ± 0.23
With both 22 0.95 ± 0.07 0.61
0.55 ± 0.17 0.04
2.73 ± 0.19 0.38
2.59 ± 0.29 0.51
With neither 6 0.96 ± 0.06 0.63 ± 0.15 2.74 ± 0.16 2.63 ± 0.25

134
Table 19 - Time Spent to Identify Problems vs. Manufacturing Experience
Number of
Participants
(#)
Time Spent to Identify Pawn Problem (s) Time Spent to Identify Doorstop Problem (s)
Novice Prototype DFMXpress Novice Prototype DFMXpress
Mean
90%
Confidence
Interval
P-
Value Mean
90%
Confidence
Interval
P-
Value Mean
90%
Confidence
Interval
P-
Value Mean
90%
Confidence
Interval
P-
Value
With lathe 25 30 ± 7 0.97
55 ± 25 0.92
56 ± 12 0.87
65 ± 18 0.33
Without lathe 8 30 ± 7 51 ± 13 58 ± 20 88 ± 36
With mill 24 28 ± 6 0.48
60 ± 26 0.68
58 ± 13 0.47
63 ± 18 0.21
Without mill 9 34 ± 11 40 ± 12 52 ± 16 91 ± 32
With both 22 28 ± 7 0.91
59 ± 28 0.88
57 ± 13 0.67
62 ± 20 0.28
With neither 6 30 ± 6 57 ± 23 57 ± 11 65 ± 16

135
Table 20 - Time Spent to Fix Problems vs. Manufacturing Experience
Number of
Participants
(#)
Time Spent to Fix Pawn Problem (s) Time Spent to Fix Doorstop Problem (s)
Novice Prototype DFMXpress Novice Prototype DFMXpress
Mean
90%
Confidence
Interval
P-
Value Mean
90%
Confidence
Interval
P-
Value Mean
90%
Confidence
Interval
P-
Value Mean
90%
Confidence
Interval
P-
Value
With lathe 25 67 ± 21 0.43
77 ± 31 0.84
98 ± 33 0.90
114 ± 40 0.52
Without lathe 8 47 ± 16 69 ± 42 103 ± 38 155 ± 110
With mill 24 72 ± 22 0.12
65 ± 17 0.42
104 ± 34 0.69
127 ± 53 0.93
Without mill 9 36 ± 8 95 ± 73 88 ± 35 122 ± 62
With both 22 71 ± 24 0.22
60 ± 18 0.94
93 ± 35 0.59
99 ± 38 0.76
With neither 6 68 ± 20 80 ± 29 107 ± 32 137 ± 51

136
Table 21 - Number of Problems Identified vs. Design Experience Type
Number of Participants (#)
Number of Problem Identified (#)
Novice Prototype DFMXpress
Mean 90% Confidence Interval P-Value Mean 90% Confidence Interval P-Value
With Class 26 3.77 ± 0.16 0.80
3.54 ± 0.20 0.07
Without Class 7 3.71 ± 0.28 4.00 ± 0
With Project 19 3.63 ± 0.22 0.09
3.63 ± 0.22 0.96
Without Project 14 3.93 ± 0.11 3.64 ± 0.27
With Research 10 3.70 ± 0.33 0.24
3.60 0.35 0.40
Without Research 23 3.78 ± 0.14 3.65 ± 0.19
With Intern 9 3.56 ± 0.38 0.16
3.67 ± 0.37 0.86
Without Intern 24 3.83 ± 0.13 3.63 ± 0.19

137
Table 22 - Number of Problems Fixed vs. Design Experience Type
Number of Participants (#)
Number of Problem Fixed (#)
Novice Prototype DFMXpress
Mean 90% Confidence Interval P-Value Mean 90% Confidence Interval P-Value
With Class 26 3.69 ± 0.17 0.61
3.31 ± 0.29 0.50
Without Class 7 3.57 ± 0.31 3.57 ± 0.45
With Project 19 3.53 ± 0.22 0.08
3.21 ± 0.38 0.26
Without Project 14 3.86 ± 0.15 3.57 ± 0.27
With Research 10 3.60 ± 0.35 0.25
3.50 ± 0.35 0.88
Without Research 23 3.70 ± 0.16 3.30 ± 0.33
With Intern 9 3.56 ± 0.38 0.48
3.33 ± 0.45 0.91
Without Intern 24 3.71 ± 0.15 3.38 ± 0.30

138
Table 23 - Time Spent to Identify Problems vs. Design Experience Type
Number of Participants (#)
Time Spent to Identify Problem (s)
Novice Prototype DFMXpress
Mean 90% Confidence Interval P-Value Mean 90% Confidence Interval P-Value
With Class 26 84 ± 14 0.74
120 ± 36 0.64
Without Class 7 91 ± 29 142 ± 44
With Project 19 85 ± 18 0.93
103 ± 23 0.15
Without Project 14 86 ± 18 158 ± 63
With Research 10 87 ± 23 0.90
105 ± 19 0.48
Without Research 23 85 ± 16 134 ± 42
With Intern 9 79 ± 15 0.62
73 ± 21 0.09
Without Intern 24 88 ± 17 145 ± 39

139
Table 24 - Time Spent to Fix Problems vs. Design Experience Type
Number of Participants (#)
Time Spent to Fix Problem (s)
Novice Prototype DFMXpress
Mean 90% Confidence Interval P-Value Mean 90% Confidence Interval P-Value
With Class 26 171 ± 49 0.60
199 ± 61 0.80
Without Class 7 131 ± 55 225 ± 160
With Project 19 130 ± 32 0.22
151 ± 47 0.15
Without Project 14 199 ± 80 274 ± 116
With Research 10 175 ± 50 0.80
246 ± 123 0.56
Without Research 23 159 ± 55 189 ± 66
With Intern 9 221 ± 137 0.28
79 ± 20 0.06
Without Intern 24 147 ± 29 254 ± 76
140
The performances of participants with different experience levels were also
evaluated. Two categories of experience were studied: the manufacturing experience and
design experience in class, research, personal projects and internships.
For the manufacturing experiences, the participants experienced in milling and
turning were studied since the pawn piece should be made using a turning process and the
doorstop piece should be made using a milling process. The manufacturing experiences
were classified into seven categories: with lathe experience, without lathe experience,
with mill experience, without mill experience, with experience in both processes, with
experience in either process and with experience in neither process.
Table 17 shows the average number of problems identified and Table 18 shows
the average number of problems fixed by participants with different manufacturing
experiences. For the pawn piece, the results show that participants without lathe
experience could identify and fix the overhang feature problem more effectively than
participants with lathe experience using both systems. For the doorstop piece, the results
show that participants with mill experience could identify problems more effectively than
participant without mill experience. In addition, participants with no experience with the
lathe and mill could identify the problems more effectively than participants with
experience in both lathe and mill. In general, users without experiences in the related
manufacturing processes can identify the problems more effectively than users with
experiences.
Table 19 shows the average time spent on identifying and Table 20 shows the
average time spent on fixing the problems by participants with different manufacturing

141
experiences. From the results, participants with experiences could identify problems
faster than participants without experience; however, they did not always fix the
problems faster.
Table 21 shows the number of problems identified and Table 22 shows the
number of problems fixed by participants with different design experiences. When using
the novice prototype, participants who have taken design classes performed better than
participants who had not taken design classes. However, participants without experience
in personal projects, research or internships performed better than those with the
experiences. When using the DFMXpress, participants without experiences also tended to
perform better than participants with experiences. In addition, Table 23 shows the time
spent on identifying problems and Table 24 shows the time spent on fixing problems by
participants with different design experiences. The novice prototype could assist users
without experiences to fix problems more efficiently; however, it did not assist users
without experiences to identify problems faster. DFMXpress could not assist users
without experience to identify and fix problems more efficiently.
Therefore, participants without experience in manufacturing or design tend to
perform better than participants with experience. One possible explanation is the
experience measured in the current study did not represent the DFM expertise level. The
skills in design for manufacturing cannot be learnt from design activities or
manufacturing activities. Another potential explanation from the literature is that
designers with more experience tend to consider more alternative solutions; however,
they also are easier to become fixated on one specific solution. When designers become

142
fixated on one solution, they tend to not to follow the suggestions given by the feedback
system.
7.3.2 Usability Results
For the usability survey, 33 participants completed the survey for the novice
prototype, and 30 participants completed the survey for DFMXpress. The usability scales
for using each system to identify problems and then mark changes on paper, and modify
the parts in SolidWorks were calculated and converted into percentiles and letter grades
using the curved grading scale shown in Table 15. The summary of the usability results is
shown in Table 25.
Table 25 - Summary of Usability Survey Results
SUS
Percentile Grade Mean STD
Novice on Paper 71.21 16.49 60.32 C+
DFMXpress on Paper 72.17 18.39 63.05 C+
Novice in SolidWorks 77.31 15.89 80.27 B+
DFMXpress in SolidWorks 71.25 19.49 60.43 C+
Comparing the usability of using the novice prototype and DFMXpress to identify
and fix problems on paper, both systems got C+. The percentile score of DFMXpress is
higher than the novice prototype. In order to determine which features increase and
decrease the usability of each system, the feedback from the participants was
investigated. For the novice prototype, 11 participants answered that visualization with
example pictures was what they liked about the system. Twenty participants answered
that input tolerance was what they did not like about the system. For the DFMXpress, 7

143
participants answered that clicking one button to show the feedback quickly was what
they like about the system. Eleven participants answered that lack of understanding of the
terminology was what they did not like about the system.
Comparing the usability of both systems to modify parts in SolidWorks, the
novice prototype got a higher average score than the DFMXpress. An ANOVA test was
performed, resulting in p-value of 0.20, which shows that the means are not statistically
significantly different. A potential explanation for the higher average score could be that
when using the novice prototype to modify parts in SolidWorks, the participants only
needed to apply the changes. Therefore, when they were rating the usability, they actually
rated the usability of SolidWorks primarily. Since SolidWorks is a well-developed CAD
software, it should receive a higher score. When the participants were using the
DFMXpress to modify the parts, they were allowed to check the part whenever they
made changes if they wanted to make sure they fixed the problems. During this process,
if the participants already identified the problem but did not know how to fix it, the
participants may have felt frustrated after many unsuccessful attempts, which could
decrease the usability of DFMXpress.
7.4 Discussion
7.4.1 Example Parts
Visualizations with example parts should be able to assist novice designers better
than only text. When the participants were asked to compare only text and only pictures,
19 out of 29 participants said only pictures could better assist them to modify the parts,
since the pictures are more straightforward.

144
From the results, the novice prototype could not assist the designers to identify
and fix the non-standard hole size faster than using DFMXpress. For the doorstop piece
the participants needed to modify, the hole size is 5.13 mm. Regarding this problem,
DFMXpress provided instruction that “the nearest standard hole size is 5.1 mm and
5.2mm.” From the pilot study, the participants were asked to compare using this text as
guideline or a standard drill size table. The participants chose the text provided by
DFMXpress, since it is more applicable to this case. Therefore, this text was used for the
formal testing. The novice prototype also provided the picture shown in Figure 30 for
visualization. This picture only shows different numbers for the hole size that .187238 is
“bad”, and .20 is “good”, which is not directly applicable to the doorstop piece.
Therefore, the designers did not acquire additional information from the visualization, but
did spent more time to read the feedback.
Figure 30 - Example Part for Non-Standard Hole Size
In addition, some participants could not understand the example parts provided
for the inaccessible feature problem. Therefore, another set of example parts were
provided to the participants later. The two sets of pictures are shown in Figure 31.
Among the 34 sets of tests, 17 sets of tests only used the original example parts as
feedback, and the other 17 sets of tests used both sets of parts as feedback.

145
Figure 31 - Two Sets of Example Part for Inaccessible Features
For doorstop piece, the average number of problems identified increased from
2.69 to 2.88, and the average number of problems fixed increased from 2.56 to 2.83 after
adding the second set of example pictures. The average time spent to identify the
inaccessible feature problem decreased from 40 s to 16 s. The average time spent to fix
the problem decreased from 43 s to 21 s. When only using the first set of example
pictures, four out of 17 participants could not fix the inaccessible feature problem. When
using both sets of pictures, all participants could identify and fix the inaccessible feature
problem.
After the new set of pictures was added, the participants were asked to identify
which set of pictures could better assist them to identify and fix the problems. Fourteen
participants said the new one, two said the old one, and one said both worked the same.
The participants that preferred the new set of example parts said, “they are similar to the
doorstop piece” or, “they are more applicable to this case”. The participants that preferred

146
the original set of example parts expressed that it showed more detailed information than
the new set.
Since the main purpose of this testing is to compare the participants’ performance
using the novice DFM prototype and DFMXpress, changing the example pictures during
the tests could impact the comparison results. From the results shown in Table 16, the
average number of problems identified was 2.85, fixed was 2.68 using the novice
prototype; the average number of problems identified was 2.85, fixed was 2.67 using the
DFMXpress. Participants spent less time to identify and fix the inaccessible feature
problem using the novice prototype than using the DFMXpress, even with including the
data generated using just the first set of example pictures. Therefore, the novice prototype
may not necessarily increase the number of problems identified or fixed, but could
increase the efficiency of identification and fixing of problems, when compared to
DFMXpress. The change of pictures did not influence this conclusion. In addition,
looking at a confusing picture could be frustrating and influence the subsequent design
performance. The problem after the inaccessible feature problem was the sharp internal
corner problem. After adding the second set of example pictures for inaccessible feature,
the time spent to identify the sharp internal corner problem decreased from 10 s to 7 s,
and the problem fixing time decreased from 45 s to 28 s. This decreasing trend was not
observed for the non-standard hole problem, which was presented to the participants
before the inaccessible feature problem. Therefore, providing confusing pictures could
decrease the performance of designers on other later tasks, beyond that including the
confusing pictures.

147
From these two cases, information provided more applicable to the designed parts
could better assist the novice designers to identify and fix the manufacturability
problems. If the visualization with example parts could not provide additional
information to the designers, it could increase the time the designers spent.
7.4.2 Limitations of the Novice DFM Prototype
The limitations of the novice DFM prototype stem from the limited functionality.
The current prototype could not automatically analyze and provide feedback. Therefore,
it could not provide synchronous feedback to novice designers. To construct an
automated system, an automated geometric recognition and analysis method that
recognizes parts’ features and geometries is required. In addition, the tolerance input is a
major issue. From the interviews and observations, the machinists identified the tolerance
as an important factor to determine the failure risk of the parts. When the user did not
know how to determine the tolerance values, the machinists could help them by using
their experience and expertise. The novice prototype only provides the suggested value
for the overall tolerance, but does not provide recommendations for critical parts like the
machinists can. Therefore, the novice designers are not able to determine the specific
tolerance values due to the lack of knowledge. In order to increase the usability of the
novice DFM system, an automatic tolerance suggestion function should be implemented.
In addition, the current novice DFM prototype cannot provide feedback on
manufacturing costs of the parts. In addition, an effective strategy to provide the
manufacturing cost was not able to be identified from the observations, since the machine
shop does not charge for labor. Without the manufacturing cost feedback, the designers

148
cannot evaluate their designed parts from monetary and sustainable perspectives. A
manufacturing energy consumption estimation framework using a machine learning
approach was developed by the author and the co-authors [66]. To improve the usability
of the novice DFM prototype, this framework should be implemented.
7.5 Summary
This chapter shows the testing results of the developed prototype. Based on the
testing results, the novice DFM prototype can assist novice designers better than the
benchmarking software DFMXpress. For the pawn piece used for the testing, the novice
prototype could assist the participants to identify 0.97 ± 0.05 problems, and fix 0.94 ±
0.06 problems. When using the benchmarking software, the participants only identified
0.78 ± 0.12 problems, and fixed 0.70 ± 0.13 problems. In addition, the novice prototype
can assist designers without experience in manufacturing and design better than assisting
designers with experience. One possible explanation is the experience measured in the
current study did not represent the DFM expertise level. The skills in design for
manufacturing cannot be learnt from design activities or manufacturing activities.
Another possible explanation for this result is that more experienced designers tend be
become fixated on one design solution.
From the testing, visualization with example parts could assist the designer to
better modify the parts compared to only providing text. In addition, information that is
more applicable to the designed parts tend to assist the designers to identify and fix the
manufacturability problems better. If the visualization with example parts does not

149
provide additional information to the designers, it could increase the time the designers
spend.
In addition, the limitations of the current prototype are identified. Future work
should be done to improve the prototype. The future work needed is discussed in Chapter
8.

150
CHAPTER 8. CONCLUSIONS
8.1 Overview
For additive manufacturing, such as FDM used by novice designers, the baseline
waste rate for material consumption was 35-45% which increased the energy usage by
45%. This result motivated the development of a guidance system to assist the novices to
decrease their fabrication failures. Based on these motivating factors, this dissertation
addresses these opportunities through the design and development of such a system.
The feedback content and strategy for the software system were identified based
on the research findings in this dissertation. Using the identified feedback content and
strategies, a novice DFM prototype was developed and tested. Comparing the mean
values, the novice prototype could assist participants to identify and fix more problems in
shorter time than DFMXpress. From statistically significant results, the novice prototype
could assist the participants to identify and fix more problems than DFMXpress for the
pawn piece since the visualization using example parts could assist the novices to make
better design decisions. For the pawn piece used for the testing, the novice prototype
could assist the participants to identify 0.97 ± 0.05 problems, and fix 0.94 ± 0.06
problems. When using the benchmarking software, the participants only identified 0.78 ±
0.12 problems, and fixed 0.70 ± 0.13 problems.
8.2 Contributions
The first contribution of this work is showing that experience is different from
expertise. From literature, expertise is primarily a result of experience [49,50]. Therefore,
151
researchers tend to measure an individual’s experience in activities to quantify the level
of individual’s expertise. However, experience level can indicate expertise, but cannot
directly measure the experience from these results of this study.
The studies of the FDM failure causes and the prototype testing both evaluated
participants’ experience levels in design and manufacturing. However, very few
statistically significant results were found from these two studies. In addition, participants
with experience tend to perform better than participants without experience for the
prototype testing. One possible explanation is the experience measured in the current
study did not represent the DFM expertise level. According to Gelder, the skills in a
specific domain cannot be learnt from studying other subjects, it must be studied and
practiced in its own way [142]. Therefore, the skills in design for manufacturing cannot
be learnt from design activities or manufacturing activities. Individuals should put
deliberate effort in practicing design for manufacturing activities. Deliberate practice is
the primary mechanism to create expert-level performance in a domain is deliberate
practice [49], which is a special type of experience. According to Ericsson and Charness,
individuals cannot improve their performance and reach an expert level through
automatic consequence of more experience with an activity, but through deliberate
practice [141]. Deliberate practice is an effortful activity motivated by the goal of
improving performance. There are four characteristics of deliberate practice [141,142]:
1. It is done with full concentration aiming at generating improvement;
2. It is engaging in the skill itself and doing special exercises designed to
improve performance in the skill;

152
3. It is graduated. Easier activities are mastered through repetition before harder
ones are practiced. And the practiced activities become harder gradually;
4. It is done with close guidance and timely, accurate feedback on performance
from experts.
Therefore, future work should be done to measure the DFM expertise level of
individuals, and investigate its relationship with fabrication failure rates.
The second contribution of this work is the identification of effective feedback
content and strategies for machining from observations and interviews of machinists and
designers. To identify the effective feedback content and strategies, communication
failures were identified for machining. Previous studies of machining fabrication failures
focused on the machine itself [70], but did not consider the failures caused by human
factors.
The feedback content identified includes the DFM guidelines and design
suggestions to inform novice designers about how to make changes to fix problems with
their designs. The feedback strategies identified include visualization of problematic
features by highlighting the features and providing example pictures to show high
manufacturability and low manufacturability features. Highlighting problematic features
is the strategy adopted by both benchmarking software DFMXpress and the novice
prototype. It also mimics the experts’ actions during the face-to-face communications.
From the survey results, it is an effective strategy to assist the novices to identify the
problematic features. Providing example pictures to show high and low manufacturability
features is an effective strategy to assist the novices to fix the problematic features. These

153
identified feedback content and strategies will be adopted to develop an automated DFM
software tool to assist designers make design decisions with minimized fabrication failure
risks. This automated DFM software tool will be a fundamental part for the overall CAD-
CAM software system.
8.3 Limitations
First, the novice engineering designers in this work are designers at the early stage
of mechanical design training. The novices include, but are not limited to, students. The
novices also include inexperienced practitioners in industry. However, the studies in this
work were primarily focused on students. The experiments, observations and interviews
were conducted within a university. Therefore, some concerns of mechanical design
could be overlooked, such as the monetary cost of making parts. In order to collect more
comprehensive data, studies should also be done in commercial machine shops.
Second, the design of experiments did not effectively measure the expertise level
of participants. For the studies, experience in design and manufacturing were measured
separately in order to evaluate the individual’s expertise level in DFM. However, it did
not work as expected. Therefore, future works should be done to accurately evaluate the
DFM expertise level of each participant. To evaluate the participants’ DFM expertise
level, questionnaires with knowledge questions for design, manufacturing and DFM will
be used.

154
8.4 Future Work
The participants using the novice prototype tend the perform better than using
DFMXpress due to two reasons from the survey feedback: the minimized usage of
terminologies in text and the visualization of possible solutions using example parts.
Future tests should be done to evaluate the quality of text and visualization used to
provide feedback. For the quality of text, future test will be done to ask the participants to
identify and fix problems using statements with terminologies and statements with
minimized terminologies. The results including numbers of problems identified and fixed
will be compared to test the hypothesis that novice designers could perform better using
guidelines with minimized usage of terminologies.
For the quality of visualizations, the revised hypothesis is information provided
more applicable to the designed parts could better assist the novice designers to identify
and fix the manufacturability problems. When novices approach problems, they base on
the literal features of the problems; however, the experts use principles to solve a
problem representation [196]. To test the revised hypothesis, sorting activities should be
done by providing different representations and example pictures for manufacturability
problems to participants at different expertise levels. The participants will be asked to
select the example pictures which they think could best assist them to fix the problems.
The identified high-quality visualization will be implemented into the DFM software tool
to provide most effective visualization assistance to designers.
With the high-quality text and visualization identified, future test should be done
to evaluate if providing only text, only visualizations of example parts, or both could

155
assist the designers more effectively and efficiently. It is expected that providing both
information can assist the designers better. However, it could also increase the time spent
to identify and fix the problems. Therefore, future tests will be done to by asking the
participants to modify parts using only text, only visualizations, and both. The best
approach identified will be implemented into the DFM software tool.
In addition, the novice prototype did not show statistically significantly
differences from the DFMXpress in usability results. There are two weak points of the
novice prototype from the survey feedback. First, the tolerance recommendation function
was not fully developed. Second, the novice prototype was not integrated into
SolidWorks. Therefore, users could not get feedback from clicking one button to show
feedback quickly. Therefore, the novice prototype is expected to be more usable by
providing recommended tolerance values for parts automatically, and integrating into
SolidWorks. After implementing these two functions, the usability scores of the novice
prototype and DFMXpress will be compared to show if the prototype is more usable than
the benchmarking software.
Moreover, from the results of the prototype testing, the novice prototype was able
to assist designers without experience in manufacturing and design better than it was able
to assist designers with experience. One possible explanation is that the experience
measured in the current study cannot represent the expertise level of the individuals.
Another hypothesis is that more experienced designers tend be become fixated on one
design solution. Therefore, future test should be done to ask the participants to modify
parts without interventions first, and then modify the same parts again with guidance

156
provided. Results will be compared to see how people with different expertise level
performed in order to test the hypothesis.
In addition, the findings from the studies of FDM and CNC machining should be
integrated to develop a feedback system for both AM and SM processes. The
environmental impacts of CNC machining in a novice environment should be
investigated. The framework developed in Chapter 3 for estimating the environmental
impacts of FDM should be applied to CNC machining with minor adjustments in the
operating phases considered for energy consumption and failures modes. The failure
sorting instructions should also be modified for the CNC machining process. In addition,
the current novice DFM prototype only applied to the CNC machining process. This
prototype should be expanded to support AM. The failure types of FDM have been
identified in Chapters 3 and 4. These findings should be implemented into the developed
algorithm to support feedback for FDM. With the integration of feedback systems for
both AM and SM processes, the system should also be applied to hybrid manufacturing
processes.
An automated DFM guidance software tool will be constructed from the findings
of these future studies, and become a fundamental part for the overall automatic CAD-
CAM system that enable individuals at different expertise level to engage in product
design and production. It will increase the opportunities for innovations without
increasing the environmental impacts.

157
APPENDIX A. QUOTES FROM OBSERVATIONS AND
INTERVIEWS
A.1 Observation Quotes
M: Machinist
D: Designer
A.1.1 Job submission and pick-up process
Observation 1:
• M: Did you put the request? (The machinist opened the request website.) When I
get it done, you will get an email. I will put it on the shelf. The shelf on the left is
the incoming shelf. The shelf on the right is you can come and pick up the part.
Observation 3:
• M: So you guys did not submit a job request. This is important. We start to
prioritize the capstone project.
• M: You should go to the me machine shop website, click here, submit the request.
Make sure you put senior design, then we know it. As long as you put it here, we
will probably prioritize all capstone this week.
• M: Do you have the SW for this file? Can you send them to the machine shop
email? Because you never submitted a CAD, you only submitted the drawing. We
need the SW.

158
Observation 4:
• M: Put your name on it, and put it on the shelf on the left. The shelf on the left is
incoming drop-off; the shelf on the right is for pick up.
Observation 5:
• M: If you go to the MMM website. This is our list of jobs. Please specify your
name, your contact info, material, specify that you are for capstone design. For
there, it gives you space for SW drawings, the more info we have the better. Put
on your name on the material. If we have any question, we will email you. I don’t
want this (paper drawing).
Observation 7:
• M: So all the other thing, mmm webpage, you go there, you will see something
about the technical request. You do that, that put you in the queue. When we have
it done, we can send you email. Then you can pick it up. We will do this, fill this
out, there is a place there to add your SW drawings. Please send me your
electronic file. As much information, the more information you will help out. The
least information that I will say come on. Any electronic file, hard copy is good,
drawings files, part files, assembly files, everything.
Observation 8:
• M: So if you go to our website. (The machinist showed the machine mall
website.) You go here, machine shop technical request, and fill out the
information, your name, your grad or undergrads, whatever you are. Leave your

159
contact information here. Research, material, department, affiliation. Here is your
drawing, we make your drawing. You can also supply your drawing. Fill the
information you have, submit this form. When we have it done, we will email
you. You need to leave everything with me. And you can leave this with me. That
is all I need (material, sketch, supply bar).
Observation 11:
• M: I like you to do to go back on our website, submit the request again. Just fill
out the request, and say you are trying to reposition the pieces of the chain. And
that’s all.
• M: If you can do that (submit the form again), it will give me some kind of
documentations. Submit the request, just put the rework.
Observation 13:
• M: Give me a technical request, you want to cut it.
Observation 14:
• M: Submit your SolidWorks, your pdf, everything.
Observation 15:
• M: We need CAD model and more information.
Observation 16:
• M: Something else, you gave me the SolidWorks. You need to give me the part
file. I cannot open the drawing file without the part file. I also need the assembly.
What I need is that you send me the assembly file, the part file. And we will

160
review it. If everything goes right, we are going to have… three assemblies in
total, and six parts for each.
A.1.2 Part features/dimensions clarification
Observation 1:
• When we talk about features. What features are required? What features are more
for aesthetic purpose? Clearly, you need these laps. These are for?
Observation 2:
• M: These features are important? Could they just be round? Does it need to be?
What does this cut-out for?
Observation 5:
• M: What does the .65 inches for?
Observation 6:
• M: Let me take a look at your drawing, I did see you email. (The designer
explained the drawing, just cut it into half, explaining by pointing to the piece of
material.)
Observation 7:
• M: Now this, is this one two pieces or one pieces?
D: This need to be perpendicular, I don’t know how to.
M: What we probably do is to put a small center on here. We will take it to the
machine, will machine this out.

161
D: So one piece is better?
M: I don’t know, we can try, we can press it in.
Observation 8:
• M: Okay, 3” by 3”. And you want to cut it in half. Cut in half, and drill M8.
• M: It has thread. Do you want to do it on one half or both half?
Observation 11:
• M: What is the position of this part you want?
D: As close to the bottom of this chain as possible.
M: So it will be all the way up.
Observation 12:
• M: I would like to find out the space in between each one. This one got .11, is that
the space?
D: this one will look like this. (The designer draw on the drawing.)
Observation 13:
• M: It needs to be 45 or 60 degrees? Just one angle, or you want a lot along the
side?
D: Cut it to half. How to measure the angle?
M: We can use the optical comparator. Let me show you. The optical comparator
is very good for the angle. (The machinist showed the designer how to use the
machine.) What we will do is you want to sketch it? Or you just cut it down? (The
machinist marked and wrote on the block using to mark how to cut.)
Observation 14:

162
• M: What is the width and depth?
• D: 1 mm by 1mm.
Observation 16:
• M: You have an assembly drawing here. We can look at it. I am not sure how
long is your rod that’s gonna be in it.
D: it will be about half an inch.
A1.3 Material
Observation 3:
• M: Did you guys decide what kind of material is best for the hinge?
D: Nylon.
Observation 5:
• M: What we will do is now the material for this is 1080 steel right?
D: Yes.
Observation 6:
• M: So I mean is this really soft or glassy? When you say glassy carbon.
D: It is not soft.
Observation 7:
• M: This material is what?
D: Plastic, anything is easy. Delrin is a little expensive, that is what we like, good
quality, good manufacturability.

163
• M: You will need to order material. (The students do not know what material.)
Let’s look at it.
• This is the steel? Is it stainless steel?
D: Yes.
M: Does it make different to what type of stainless steel? We prefer 303, which is
easy to machine stainless steel. I don’t like 316, but it’s used a lot in the
aerospace, combustion lab, a lot of heat, the easy thing the better. Half inch is the
thick about this.
D: That has to be Teflon.
M: The easiest thing is you order your material. I don’t charge anything for the
time. there is nothing for our machine time. if we need to buy some glue, we will
charge that. Teflon, obviously a round piece of Teflon.
D: It is good that you tell us what to buy.
M: I will say round piece of Teflon, McMaster-Carr. Give us at least 3 inches (of
material). It usually comes in 1, 3, 6, 12. This one we have to machine. This is 4
inches Delrin. I am sorry, it is a little bigger, 4 and half. The height… 1.35. we
probably 6 inches of this.
• M: What about bearing? Are you going to order bearings? You will do this in
standard piece?
D: Yes.
M: Is it gonna be an oilite bronze or just regular bronze? What type of material is
this?
D: Whatever Mc-Master has. what do you recommend?

164
M: It depends can you use the oilite? It is actually embedded with oil. It is going
to lubricate your shaft.
• (They are looking at McMaster-Carr, showing pages with bronze bushings.)
M: You may want to buy something like this. Oil-embedded, we call it oilite, then
you can see here.
D: Yes, it might be better than what we have.
• D: can you remind me what is for the steel rod?
M: 316, I don’t like 316, telling you that, but it is more corrosion resistance,
better.
D: Aluminum won’t be strong enough?
M: It may be strong enough. Let me see here, some good quality, 7075 aluminum,
400 may be okay. Let me see here. Is it magnetic? You don’t care. 303 is the one.
It is really close to 304. If you look into the characteristic, you may find 304
works. 316 is the superior for the corrosion resistance as I told you. I hate to tell
you that because (the manufacturability). Aluminum maybe okay. What is your
RPM? What about your forces? Let’s look at that. A good quality 7078, for the
corrosion resistance, we go to the 2000 series.
D: You want me to get aluminum.
M: Yes, I like aluminum.
D: Let’s get 2024.
M:Just give me a piece, let me turn it down. We may come back to 316.
Observation 8:
• M: The material is MACOR.

165
Observation 12:
• M: What is the material? Aluminum?
• D: yes.
Observation 13:
• M: It is acrylic.
Observation 14:
• M: What is the material?
D: Only braze copper.
M: Copper is soft, really gummy, really hard to machine.
• M: You might need to look at oxygen-free copper. It is good for braze.
Observation 15:
• M: What we would probably have to do is to get a piece of MACOR. The
problem of the MACOOR is the price and the machinability. My concern is that
we need to find out the hardware.
Observation 16:
• M: Everything is made of stainless steel.
A.1.4 Lead time
Observation 1:
• D: What is your estimation of the lead time?

166
M: It is probably about two weeks and half. It depends on the availability of the
EDM. We might get it towards the end of next week.
Observation 2:
• M: When is your competition?
• M: This came in last year, but too late. This year you come early.
Observation 3:
• M: We have two weeks left (to thanksgiving). So you have four weeks left. There
are only 20 working days left.
Observation 4:
• M: It will be probably about a week and half.
Observation 7:
• D: What is the turn around time for us?
M: We got about a week turn-around time. but capstone is coming up. you know
capstone. So reality is … the most is about two weeks.
Observation 10:
• M: We are now a week and half behind. It is probably sometimes next week. Is it
okay?
D: Yes.
Observation 11:
• M: It probably will be Monday or Tuesday.

167
Observation 13:
• M: It may be done tomorrow.
Observation 14:
• M: We are in capstone, so we will be around two weeks back.
A.1.5 Explaining manufacturing processes
Observation 1:
• M: We will do is to cut the shape. The only thing I will do is to put a straight line
along this. Then I will do is coming in and coming out.
Observation 2:
• M: Currently, your machining process will be you take a piece and machine it out,
turn this. And rotate it, and turn this, then you still got a big section in the middle,
right? You need to fixture it, then you have a really long tool coming down and
machine it.
• M: So with a fourth axis, the machine will actually rotate. if we’re gonna machine
the part as designed, you know having a fourth axis would be ideal. Cause we
could clamp here and machine this, rotate and machine this, rotate, machine this.
You could even do almost all of this. This is turning, this is turning. For me, this
is kind of a big challenge. Because this is too deep.
• M: If you have a way, this part could be wire EDM. If you can go all the way
through.

168
• M: I am going back to vertically doing this, and set it horizontally doing this. You
know machining all this, machining this, you going as far as you can, and then
rotating. That is kind of where I think it is a good way to do this part.
Observation 4:
• M: I’ve got an idea. What I am gonna do is to machine it. We are going to
probably cut it off with aluminum material, and you said the thickness does not
really matter. We may cut to that thickness, and put it back to the lathe, and
machine it again, push it up again to machine it again. So the faces are parallel. So
it will be machined surfaces. Not ground, it will be machined, it will be mirrored,
like this (with example for machined surface).
Observation 7:
• (The students ask the feature (groove), hard to machine)
M: Because you are doing on milling machine, you cannot do it on a lathe. Is it
like a o-ring groove?
(Student talk about design change, say do not know how to draw on drawings.)
M: What we can do is using a 1060 end-mill. Let’s change this to 1/16, that will
give us the ability 2000. Half mm, no problem (checking drawings).
Observation 9:
• M: You know a file. And what we want to do is just to use the file to make the
gap a little bigger. When you use the file, you can even use stroke to clean this
face to keep it straight. We will do that. Whatever you do, you want to make sure
the file is parallel to the surface.

169
• M: And do this side, turn it around. And remember file only do cuts in one
direction. See how it has slots, only cuts in one direction. Only cuts so you can
file it.
Observation 14:
• M: All we do is cut that plate, give a hand on the plate, glue the pieces. If you
bring it back, we will wire EDM it.
Observation 16:
• M: The threaded will be welding. The round will be threaded, and we will go a
little bit deeper to 100 thousandths.
A.1.6 Assembly/Mating pieces
Observation 2:
• M: Would you come to a mate part that cannot be changed? (
D: Connected to a tripod.
M: Where is the tripod is come from, from the car itself or it is something you
made by yourself? If you control the mating piece of this, could you perhaps
change. So it is much larger radius give you much large tool. So the mating piece
is changed to where it has different configurations. So this small corner radius you
can come with large tool because you have large radius which in terms of stronger
because of larger radius.
• M: If there is something else go on there?
D: Yes.

170
Observation 8:
• M: It mates by? You probably want to leave that with me (the rod the part will
mate to)? Can you leave it with me.
• M: You want it thread just this depth?
D: I want more.
M: You cannot go any further of this any way. Fit supply bar. Once it hit there, it
is gonna stop anyway. Because this diameter is small than this diameter. Cause
your bar is gonna like this (sketching the assembly view), it can only go so far. I
can go this deep, but it can only go this bit. Because it is gonna hit this shoulder.
D: This is going to be in high temperature, so want it to be deeper.
M: Yes, we can make it. So that will be deeper.
Observation 10:
• M: Did something fit inside here? Is something fit here? Is something inside the
hole?
D: Battery.
M: So that’s not a problem. So what about the other?
D: it fits a spring inside.
(Machinist checked the dimension)
M: What is the size of your spring?
D: I don’t know right now.

171
Observation 15:
• M: There are screws here. If it needs to go all through this and this hardware, that
is what we need to concern.
D: This will be connected to wires. So it does not need to be long.
M: The first thing we need to do is to figure out the size of the fasteners.
Observation 16:
• M: So it has to be remote, right?
D: the reason we are going to do that is because we got a ceramic plate that has a
hole in it. That plate will go from the bottom and then gripped from the top.
A.1.7 Process/Machine/Tool Selection
Observation 2:
• M: Go look at Multus (multitasking machine), or you can mill-turn. Take a look at
that process and see how it can be applied to this part. Or just the fourth axis on a
mill, which can make it rotate like this. Take a look at it from a programmer
perspective.
Observation 6:
• I will need to do is to investigate to see how to cut it. We will set to cut metals.
This might need a diamond saw. You may need to cut it with a diamond saw
which I don’t have.
D: Can you do wire EDM?
M: Potentially, I cannot cut glass. Is this glass?

172
D: This is glass carbon.
M: Let me do a quick test.
(The machinist was using multimeter.)
M: So it is conductive. So potentially we could cut it using wire EDM. Because
when I clamped into the machine, it needs to be grounded. This has to be
grounded to the machine.
Observation 9:
• D: I will use sand paper.
M: File is better. Because for sand paper, you cannot control the angle. Let’s go
and take a look.
(The machinist helped the student to modify the part using a file.)
Observation 14:
• M: I would like to get a drill that is specifically for copper. I would like you to
buy it.
D: How much does the tool cost?
M: It is probably less than 15 dollars.
Observation 16:
• M: So what are you gonna to fasten it? How will you fasten it?
D: it’s gonna be a threaded rod. But we can just use the same threaded rod we
used.
M: Does it have to fasten it? Why I asked it is can we weld it?
D: No.

173
M: Does it have to be remote?
D: Yes, it has to be remote at some point.
• M: I have got a guy that know… He does spend many years in aerospace. He is
gonna work for me here. He is gonna position very fine weld. He is using the
microscope. He does really nice weld. We can even weld it as well.
D: we could. That is the thing. We previously used rivets. I threaded those. The
reason I don’t like those is that it couldn’t go out without the hole and rivets
disassembled. But we can still do that. We can do that for it.
A.1.8 Manufacturability
Observation 2:
• M: So you did this in a CNC, the tool may be chattered or make a lot of noise.
• M: This is the harder part cause this is deep and the chips get caught there (the
deep hole).
Observation 12:
• M: For the wire, the problem is that the wire we have is 12 thousand, 10 thousand
exactly. But it burns, so it is actually 12 and half thousand. The second thing is
you want me to make something really thin, that’s we will try on the wire EDM,
not the thicker EDM. Right?
D: I am not sure.
M: The one on the left is the wire, this one got 10 thousands diameter. The one on
the right is the thicker, we use electronic which cut it into two.

174
D: I am thinking about the wire thing.) M: But the wire is way too big for all of
these. Let’s look at this. On a millimeter scale, the wire is .3.
D: So at least 300 micros?
M: Yes, that’s is the diameter of the wire.
D: the wire is accurate, the x, y positioning?
M: Yes, it is very accurate. The other thing, you need to think if this is the wire,
let say the wire is this big.
(The machinist draw on the paper to show the radius of the bottom made from
wire EDM) (D: It does not matter if here is this shape.)
M: You are going to have the larger radius.
D: Can I have 10 micros here for the x, y position?
M: we can try. I’ve never done it. The first you got to remember it was .0215
close to 300 micros wide with a wire. And overburn. The wire is not that thick,
the overburn will be a couple thousand. Therefore, it is going to be 12 thousand.
Observation 14:
• M: You need to remember, (use wire EDM) will give you the radius on the
bottom. The wire EDM is .0125 mm, we can do 300 micros.
Observation 15:
• M: It is small, but it is possible. We need to look at the machinability.
Observation 16:
• M: When we weld something, it may lose the perpendicularity. That will be a
concern. (D: we will need our perpendicularity for the electric surface.)

175
• M: I have no concern at all that it goes there 100 thousandths.
A.1.9 Redesign/Part modification
Observation 2:
• M: If this piece is separated, you can get much shorter piece. Even perhaps this
feature could be on this part, if there is a way to make this into two pieces.
• M: If you turn the piece to this shape, and then you also have a diameter here you
can turn some of the stock off. What can you do with this to make there is an
easier way to remove the stock.
• M: So this thing, are they 45 degrees of that? or whatever the degree of it. So you
can put something here and something here. So you can rotate that and soldering
that. You are adding a feature here. So you can just remove this thing and cut.
Observation 11:
• D: This is the drawings we have last time, so my mistake was I thought the
positioning of this can hold this part. But it does not do any of that. It is my fault,
communication wise. Do you remember last time that some machinist suggested
to use an interference fit? it should hold the position.
M: Let’s try it. If you want. let’s cut this off, and weld it. Before we do any of this
(the new parts). Let’s see if we can practice basically. Because these are already
no good. So let’s see if we can take two or three of this or even all of these.

176
• M: If it does work, we will close it up and start the new parts. If our plan of
cutting this away and slide it up. What am I thinking is you know if we can tight
them this side (the outside), we can tight them this side (inside).
D: Is that possible?
M: We will try.
Observation 12:
• M: If you can go back and draw that, redraw that and give me that width, you can
do whatever you want to do. And I can give you a try.
D: just keep this distance, I will increase the length due to the overburn.
M: I will give you a try.
Observation 16:
• M: You cannot go any deeper?
D: You can I guess. We just need that top surface here.
M: What I am saying here is you are only going 40 thousandths… So if I have
100 thousandths, it gives you 25 thousandths here.
D: you can do that. I think the issue comes I want to keep it standardized. If you
can do it for that, it is fine.
• M: The other thing that is important to you is when we do it, we might want to
change the SolidWorks drawing, and update you what we have done. We will
email you that.

177
A.1.10 Quantities of parts
Observation 1:
• D: I have two of this.
Observation 2:
• M: Will you make multiple pieces?
Observation 12:
• M: Are these separate pieces?
• D: Yes, 9 pieces.
Observation 16:
• M: Do you remember how many you need?
D: as many as we possibly can. So I think at least three of each. Is that okay?
M:Initially, let’s make one of all of them. You go to your lab. If it doesn’t work,
then we are going to know.
D: sorry, I forgot, these will be couples. So one inside and one out. So we need
six of each.
A.1.11 Tolerance
Observation 5:
• M: I also need to know why you get two decimal places. If you have two decimal
places, you tell people it is large. If you have three decimal places, you tell us it is
tight. You don’t want tight tolerances everywhere. You might need tight

178
tolerances, 3 decimal places here, 3 decimal places here, may be 3 decimal places
on your dent. I am not sure where you need them. So that’s why 2 decimal places
and 3 decimal places. Does it make sense?
Observation 7:
• M: what is the tolerance of the perpendicular?
• M: What if I tear the tolerance zone of the Teflon?
D: A tiny bit does not matter
Observation 10:
• M: What is the tolerance?
D: I don’t know.
A.1.12 Hole
Observation 3:
• M: So are you going to tap both sides of this?
D: Yes.
M: And this is for the hinge, right? So actually we will tap this in. so this is dowel
pin for hinge.
• M: This should be drilled for hinge. So this won’t this kind. Since you want this
can be move back and forth. And this can be drilled clearance for 6-32 correct?
Cause the screw can go through it and locked here.
• M: The hole goes all the way through. We could draw hidden line here. Then we
could see for sure that it goes all the way through.

179
Observation 10:
• M: I just want to make sure if it is critical. If yes, we can drill it. You see here (the
bottom of the hole) is flat. If we drill, drill has a drill point with 135 degrees. Is it
okay or does it need to be flat?
D: it should be flat. It should be flat bottom to make the spring sit in.
Observation 16:
• M: This is the one we have, no threads?
D: if you don’t have a drawing to do them. Then don’t worry about it.
A.1.13 Fixture
Observation 2:
• M: You need a good fixture to do that.
Observation 6:
• M: We need to have something to hold to. So hold here and we can cut it out.
A.1.14 Scale
Observation 3:
• M: What is the scale? Is it 1 to 1? (the machinist use a ruler to measure it). So
perhaps 3/8. 0.375 perhaps.

180
A.1.15 Clearance
Observation 3:
• M: This is gonna look slightly different because this is the side the hinge is and
you will cut out a little for the clearance here.
• M: We can always cut more space for the hinging, right? that is the opening.
What we can do is before we pin it, we can hold it and place it to make sure.
A.1.16 Unit system
Observation 5:
• M: This is on imperial? (D: Yes) Why do we have 200 thousand, .2?
D: Some dimensions in mm, some in inches.
M: Hold it on, that is probably not mm, that will be a really small hole. 0.31mm is
really one small hole.
D: I mean .31 inches converting to mm.
• M: My recommendation is go through and check your drawings. If you want, we
probably happy to have a hybrid drawing, that is you have everything in inches,
except these two pins. It is acceptable, at least we know this is 6 mm, and this is 8
mm.
A.1.17 Surface finish
Observation 13
• M: You want to polish the back side?

181
D: I want to sand it smooth in such a way it is flat.
M: What I will probably try to do is going there with a flat cutter, a single point
tool, and by doing that, you should be able to get a good surface finish. It should
be easy to machine.
A.2 Interview Quotes
A.2.1 Tolerances
Quotes from the designer:
• ‘I give them tolerances and dimensions, how they get there is not important to
me.’ [when answering if the interviewee cares about what manufacturing process
is chosen.’]
Quotes from machinist 1:
• ‘you can draw this perfect but it can’t be fabricated perfect. Not without a lot of
tolerances added to the drawing, a lot of flatness called out, hole diameters….’
• ‘I have people putting 4 decimal places on the whole drawing and they don’t
mean anything’
Quotes from machinist 2:
• Tolerance on acrylic and polycarbonate material, called out in ‘tenths’.
• ‘3 decimal is plus minus 5 typically’, ‘DO you want it that close?’ [refers to
making tolerance plus-minus 1]
• One decimal place means ‘outside is not critical’. ‘One place is plus-minus 50
thousandths’, ‘2 place is plus-minus 10 thousandths’

182
• ‘All of our machines machine straight from the model but we still need a drawing
to put in the hands of the machinist, so that he knows what the tolerance is.
A.2.2 Dimensions
Quotes from the designer:
• ‘cant really think of any miscommunication, because I know what they’re looking
for. I spend a lot of time making drawings accurately, with all the dimensions on
it.
• ‘every now and then there’s a dimension that was missing on the drawing.
Because I think it was clear, but it wasn’t.’
• ‘I think this is probably the most common situation.’ The designers who actually
build this part or actually design this part try to put these in the engineering
drawings. It’s very much in your mind what it is and really obviously what these
dimensions are. And they just oversee.’ [when asked missing
information/dimensions]
Quotes from machinist 1:
• ‘you can draw this perfect but it can’t be fabricated perfect. Not without a lot of
tolerances added to the drawing, a lot of flatness called out, hole diameters….’
• ‘outside of the profile does not really matter but all the hole patterns have to
match up with something else. They dimension everything off an edge that does
not matter and they dimensioned everything off another edge for a different part’
[Proceeds to draw and elaborate about this for another couple of minutes]

183
Quotes from machinist 2:
• ‘Typically outside dimensions are clear’
• ‘Hole dimensioned from this side to here and another hole dimensioned from this
side to here, but what they actually want is the distance between the two holes’
A.2.3 Hole callouts
Quotes from the designer:
• ‘because the drawing didn’t spell it, they could put the hole anywhere [in the
orifice plate]’
• ‘if you have to make holes bigger, it’s great, doesn’t quite work the other way.’
Quotes from machinist 1:
• ‘He used the word HOLE and said ¼-20.’ ‘He didn’t say tap ¼-20, he wrote
hole.’ ‘If I sent this to the shop, they will drill a hole and tap it for a ¼-20 bolt’ ‘I
called him.’ ‘He said, no, no, it should be clearance.’
Quotes from machinist 2:
• ‘Hole size, whether it’s supposed to be a threaded hole or a clearance hole’, ‘If
you want to thread, it needs to be smaller’ [talks for about 2 mins about threaded
and clearance holes and lack of callouts on drawings]
Quotes from machinist 3:
• ‘Sometimes, they are struggling understanding the difference between external
and internal thread.’
• ‘I have to let them understand I can’t do a square hole.’

184
A.2.4 Surface finish
Quotes from the designer:
• ‘material choice, for say like surface finish.’
• ‘if it’s too rough, there might be some leaks that come out of it.’, ‘I talked to the
company that brazes it and they said its okay’
Quotes from machinist 1:
• ‘vendor materials vary’
• ‘they pour Plexiglas and it becomes wavy’, ‘I can machine it but it will lose its
transparency’
• ‘When you get into chemical coating, we get into major issues because they have
not done their homework on the coating they are calling out.
A.2.5 Pin fits
Quotes from machinist 1:
• ‘….half inch hole for a dowel pin. Is that dowel pin being pressed or is that slip fit
for the dowel pin? They don’t call that out.’ [Talks about how hole dimensions
change based on that.]
Quotes from machinist 2:
• Dowel pins: ‘Does it need to be slip fit or press fit?’
• You can’t get information about pin fits from 3D model and what side they’re on.

185
Quotes from machinist 3:
• ‘They may come to me and say I want this to be a press-fit. How much smaller
this should be?’ ‘(I will) stop them, (ask) how much surface contact you are going
to have?’
A.2.6 Communication and feedback system between designers and machinists
Quotes from the designer:
• ‘few more occasions where I got some feedback’ ‘because I want to minimize the
risk, because that process has some risks associated with it’ , when talking about
brazing. ‘Less optimum design from bonding perspective’
• ‘when I review drawings, they point out challenges’, ‘iterative process of
feedback’
• ‘structural features because of pressures and so forth and pointing those out and
taking images of them.’
• ‘me going over there is limited to something very specific’ , ‘otherwise email is
good’ [when talking about how the interviewee deals with manufacturing
problems]
Quotes from machinist 1:
• ‘depending on my relationship with customer, if you’re a regular customer, I
would be more willing to help and go over your designs’
• ‘I try not to show my frustration, but it comes out sometimes.’

186
Quotes from machinist 2:
• ‘They don’t tell us how everything fits together’
• ‘Verbal information is good, but if you got detailed stuff, you really need a
drawing’
• ‘I’ll draw something and ask “Is this what you want?”’
• ‘I tell them upfront if I can do it or if I can’t’ [Talks about lack of ceramic
machining capability]
• Says he can ‘fix most problems on the phone 90% of the time’, otherwise
designers can be in shop ‘within 30 minutes’.
Quotes from machinist 3:
• ‘Ours are students working with drawings, and make a request… If you don’t
make it face by face, it will be 6 weeks behind.’
• ‘Personally in our shop, on our system online, there is a place the technicians can
go up and add comments.’ ‘it is all about documentation, if you don’t document
it. It’s he says she said, and then use some misunderstood words.’
A.2.7 Drawings
Quotes from the designer:
• ‘two-step process, where you have to split up your drawings, and spend a good
amount of time on both and eliminate a lot of the pitfalls that could occur with
one big assembly drawing.’
• ‘ambiguity is still left because this task of taking a 3D CAD model and putting it
into a form that is convenient and explicit for a machine shop is very mundane’,

187
‘not necessarily bad because process may force you to think about the design
more.’
• ‘[Drawings] facilitated or allowed the design to be simpler while maintaining its
functionality’
• ‘might make you careless during design phase, if you don’t have to make
engineering drawings.’
• Common questions regarding drawings: ‘usually I may have left out a dimension’,
‘copies and pastes part number of fitting onto drawing.’, ‘sometimes I put too
much information on the drawing’
• ‘happens more often than not, or rather every now and then’ [when asked if he has
revised drawings after submitting them to machine shop.]
Quotes from machinist 1:
• ‘use whole paper, machinists can’t see information on drawing’
• ‘People will design in metric and be like, “Hey, just convert it to inches’. Talks
about inches and metric for almost 2 minutes
• Third angle and first angle views: ‘When you draw in inches, it should be in third
angle. When you draw in millimeters, it should be in first angle.
• ‘They’ve gone back and started adding things or changing things’ [says this is a
trainwreck, in his opinion]
Quotes from machinist 2:
• ‘You can draw everything in 2D but it’s a little more complex when you start
breaking it down.’

188
Quotes from machinist 3:
• ‘What they are struggling is calling the accurate units.’ ‘Because you have the
metric system, and you have the English inch system.’
A.2.8 Need for designers to know manufacturing capabilities and for machinists to
know why design decisions were made.
Quotes from the designer:
• ‘certainly not the machine shop, because I kind off know what their capabilities
are’ ‘How they get to this doesn’t really matter with me’, when asked if he asks
questions about performance variables.
• ‘In some instances that, sort of made it easier if I changed something in the design
for them to make have significant benefit and their actual manufacturing process.’
• ‘it’s beneficial for them to think about what it is and what it does and what my
constraints are’, ‘eliminates some of the suggestions that they might make if they
had not known about the actual physical process.’
• ‘what they need to have to eliminate as much ambiguity as possible’
• ‘concerned about whether or not my design allows them to do whatever they need
to do during the assembly stage.’
• Some machinists: ‘People build it, they are just machinists.’ Just follow the
drawing, that’s the end of that.’ Good machinists: ‘The good ones, such as the
machine shop people or sheet metal people, they try to understand what is going
on. I am not sure that it’s something correlated to if they are good at it, they are
just generally more, maybe technical interested.’ ‘Or they are just curious to know

189
what it does; I’m not sure if knowing what it does really helps them build better
parts.’ ‘(Maybe) knowing what it does actually helps them understand and makes
it more efficient for them to understand the constraints that we are working with.’
Quotes from machinist 1:
• ‘you have to think about the process when you design’
• Talks for another 2 minutes about how he can provide the most help if he has all
the information about how things go together and what they do (‘acryllic
machining’)
Quotes from machinist 2:
• ‘We don’t want to be in a liability situation so we try to stay ahead of the curve
and try to figure out the application’
• ‘Sometimes when they design things, it looks good.’ ‘But if they would change
this feature, if they change that feature, it could go from a 10-hour part to a 2-hour
part.’
Quotes from machinist 3:
• ‘When you bring in a pawn piece, the first question will be what’s the material?’
(interviewer answered titanium) ‘Why would you make it out of titanium? The
next question will be why it is need to be titanium. What specifics requirements
telling you that needs to be titanium?’
• ‘I’m starting to look into the geometry. You are making this small radius. What is
going on here? Is it the strength? Could you angle it out of here so we don’t have
to go in this corner? You got this weird shape here. It is really hard to turn that.

190
And we probably had to put that into the CNC tool(?) for a 3D tool pass. It is
getting lots of machining. So could we modify the shape at all to make it more
easier to machine?’
• ‘The more features, the more axis the machines need to have. Or more operations.
More sequences. May need to go to three different machines.’
A.2.9 Experience of designers
Quotes from the designer:
• ‘designer has to be aware of standards’, pressure vessels ‘wall thickness’
• ‘sometimes when things are done too quickly, there’s a fitting that’s in the wrong
spot…..’
Quotes from machinist 1:
• ‘they want to force you to do it on a particular machine, where the precision is not
gonna be what they want it to be’
• ‘Everything goes back to how experienced you are.’
• ‘They don’t have any concept that I got to order material…’
Quotes from machinist 2:
• ‘Lack of just not knowing..’ [talking about material choices]

191
A.2.10 Design revisions
Quotes from the designer:
• ‘costs a lot of money and takes more time, rebuilding it in a modified way was
pretty challenging economically and time-wise.’
Quotes from machinist 2:
• ‘…..sometimes I’m thinking can we change this a little bit? Sometimes yes,
sometimes no, its about a 50-50’
• ‘…it might take an hour or less to machine if I change one feature by 10-
thousandths, they’re like have at it.’
A.2.11 Additional quotes and information about interviews
The designer
• Spends about a minute talking about how he knows what machine shops are
looking for, through his experience.
• Spoke 2-3 times about eliminating ambiguity
Machinist 1
• ‘understanding what you can or cannot do in a machine shop.’
• ‘We counterbore off the other side’
• Talks for a couple of minutes about flatnesses being an issue, due to material
being imperfect when it comes from vendors.

192
Machinist 2
• Says ‘lack of experience’ a lot. And talks about hole patterns and tolerances 3
times.
• ‘We have [taken jobs without drawings]’
• [Talks or about 3 mins on different types of drawing and CAD software they use]
• Speaks about tolerances a lot.
• Talks about pressure vessel standards. ‘Exotic materials’
• Talks about standards.
• ‘each material is gonna bend a little bit different, gonna stretch a little bit
different.’
• ‘They would have their own formulas based on the equipment they have.’
Machinist 3
• Talks about the students don’t know how much time needed to machine a part.
• Talks about 3d printing several times.
• Talks about an example that people keep changing their models.
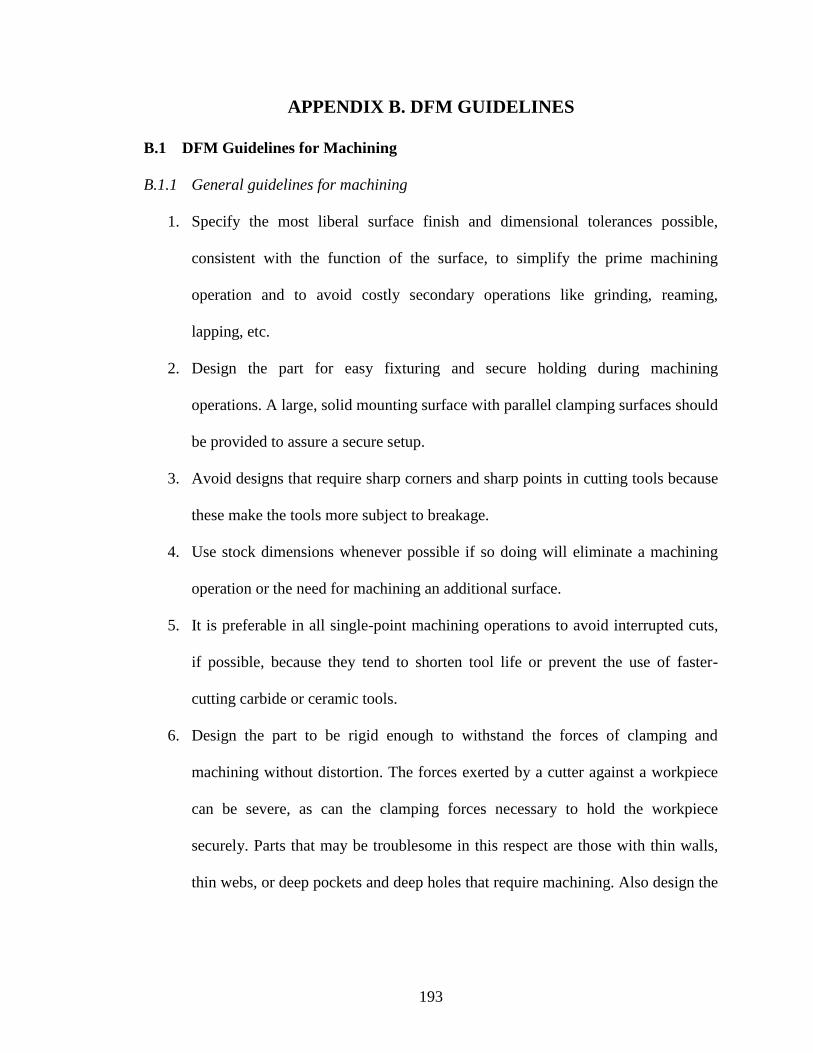
193
APPENDIX B. DFM GUIDELINES
B.1 DFM Guidelines for Machining
B.1.1 General guidelines for machining
1. Specify the most liberal surface finish and dimensional tolerances possible,
consistent with the function of the surface, to simplify the prime machining
operation and to avoid costly secondary operations like grinding, reaming,
lapping, etc.
2. Design the part for easy fixturing and secure holding during machining
operations. A large, solid mounting surface with parallel clamping surfaces should
be provided to assure a secure setup.
3. Avoid designs that require sharp corners and sharp points in cutting tools because
these make the tools more subject to breakage.
4. Use stock dimensions whenever possible if so doing will eliminate a machining
operation or the need for machining an additional surface.
5. It is preferable in all single-point machining operations to avoid interrupted cuts,
if possible, because they tend to shorten tool life or prevent the use of faster-
cutting carbide or ceramic tools.
6. Design the part to be rigid enough to withstand the forces of clamping and
machining without distortion. The forces exerted by a cutter against a workpiece
can be severe, as can the clamping forces necessary to hold the workpiece
securely. Parts that may be troublesome in this respect are those with thin walls,
thin webs, or deep pockets and deep holes that require machining. Also design the

194
part so that a rigid cutter can be employed while still permitting access to the
surface.
7. Avoid tapers and contours as much as possible in favor of rectangular shapes,
which permit simple tooling and setups.
8. Reduce the number and the size of shoulders because they usually require extra
operational steps and additional material.
9. Avoid undercuts, if possible, because they usually involve separate operations of
specially ground tools.
10. Consider the possibility of substituting a stamping for the machined component. If
tooling is available, or if quantities are sufficient to amortize the tooling cost, a
stamped-sheet-metal part invariably will be lower in cost than one made by
machining, provided of course that the dimensional accuracy and surface finish
are adequate for the component’s function.
11. Avoid the use of hardened or difficult-to-machine materials unless their special
functional properties are essential for the part being machined.
12. For thin, flat pieces that require surface machining, allow sufficient stock for both
rough and finish machining. In some cases, stress relieving between rough and
finish cuts also may be advisable. Rough and finish machining on both sides is
sometimes necessary. Allow about 0.4 mm (0.015 in) stock for finish machining.
13. It is preferable to put machined surfaces in the same plane or, if they are
cylindrical, with the same diameter to reduce the number of operations required.
When surfaces cannot be in the same plane, they should be located, if possible, so
that they all can be machined from one side or from the same setup.
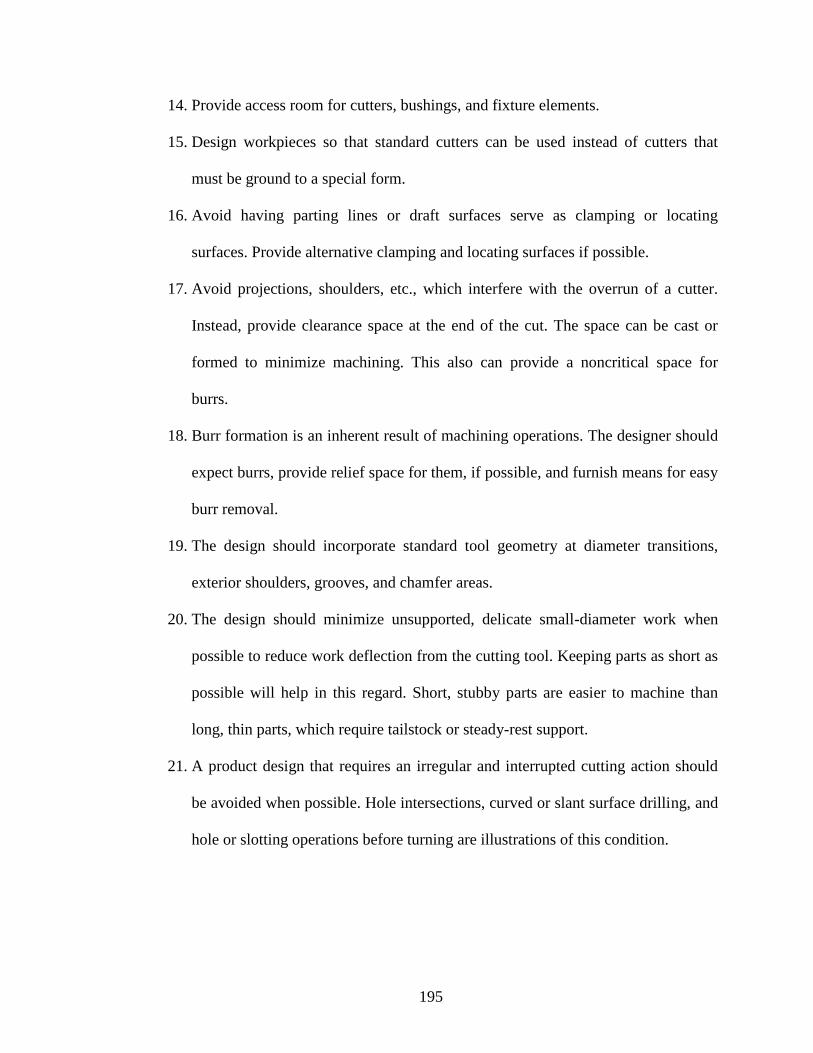
195
14. Provide access room for cutters, bushings, and fixture elements.
15. Design workpieces so that standard cutters can be used instead of cutters that
must be ground to a special form.
16. Avoid having parting lines or draft surfaces serve as clamping or locating
surfaces. Provide alternative clamping and locating surfaces if possible.
17. Avoid projections, shoulders, etc., which interfere with the overrun of a cutter.
Instead, provide clearance space at the end of the cut. The space can be cast or
formed to minimize machining. This also can provide a noncritical space for
burrs.
18. Burr formation is an inherent result of machining operations. The designer should
expect burrs, provide relief space for them, if possible, and furnish means for easy
burr removal.
19. The design should incorporate standard tool geometry at diameter transitions,
exterior shoulders, grooves, and chamfer areas.
20. The design should minimize unsupported, delicate small-diameter work when
possible to reduce work deflection from the cutting tool. Keeping parts as short as
possible will help in this regard. Short, stubby parts are easier to machine than
long, thin parts, which require tailstock or steady-rest support.
21. A product design that requires an irregular and interrupted cutting action should
be avoided when possible. Hole intersections, curved or slant surface drilling, and
hole or slotting operations before turning are illustrations of this condition.

196
22. When castings or forgings are designed with large shoulders or other areas to be
faced, the surface should be 2 to 3° from the plane normal to the axis of the part.
Such an incline provides edge relief for cutting tools.
23. Radii, unless critical for the part’s function, should be large and conform to
standard tool nose-radius specifications. Often, the radius can be left to
manufacturing preference.
24. Specify a break of sharp corners where sharpness or burrs may be hazardous or
disadvantageous to the function of the part. The product design should be specific
in this regard; i.e., do not specify “Break all corners” unless this is really
necessary, because such operations are quite costly. Sharp corners and burrs can
be minimized if chamfers or curved surfaces are placed at the intersection of other
surfaces. Often such curves or chamfers can be included in a casting or forging at
no extra cost before machining.
25. The design of the product must be such that parting lines, draft angles, and
forging flash are excluded from surfaces used in the clamping or locating of the
part.
26. When a part is to be tracer-turned, the turned contour should be such that easy
tracing is possible with a minimum number of changes of stylus and cutting tool.
Grooves with parallel or steep sidewalls are not feasible in one operation, and
undercuts should also be avoided.

197
B.1.2 Guidelines for drilling
1. The drill entry surface should be perpendicular to the drill bit to avoid starting
problems and to help ensure that the hole is in the proper location.
2. The exit surface of the drill also should be perpendicular to the axis of the drill to
avoid breakage problems as the drill leaves the work.
3. If straightness of the finished hole is particularly critical, it is best to avoid
interrupted cuts unless a guide bushing can be placed at each reentry surface. If
the drill intersects another opening on one side, some deflection will occur. Even
when straightness is not critical, it is important that the center point of the drill
remain in the material throughout the cut to avoid extreme deflection and possible
drill breakage.
4. It is best to use standard drill sizes whenever possible to avoid the added cost of
special drill grinding.
5. Through holes are preferable to blind holes because of easier clearance for tools
and chips, especially when secondary operations such as reaming, tapping, or
honing are required.
6. When blind holes are specified, they should not have flat bottoms. The preferred
drill bit generates a pointed hole, and if other bottom shapes are specified,
secondary operations are required. Square-bottomed holes also cause reaming
problems because reamers have tapered ends and require room for chips to fall if
tool wear and breakage are to be avoided.
7. Avoid deep holes (over 3 times diameter) because of chip-clearance problems and
the possibility of deviations from straightness. Note that while extremely deep

198
holes (e.g., gun barrels) can be drilled, they require different tooling, equipment,
and techniques (see “Gun Drilling and Gun Reaming” below). They are not
necessarily costly if gun-drilling is available but nevertheless constitute a special
operation and for this reason should be avoided if possible.
8. Avoid designing parts with very small holes if the small size is not truly
necessary, because small drills are more susceptible to breakage. About 3-mm
(1/8-in) diameter is a desirable minimum for convenient production.
9. If large finished holes are required, it is desirable to have cored (cast-in) holes in
the workpiece prior to the drilling operations. This saves material and reduces the
power required for drilling.
10. If the part requires several drilled holes, dimension them from the same surface to
simplify fixturing.
11. Rectangular rather than angular coordinates should be used to designate the
location of drilled, reamed, and bored holes. They are easier and more nearly
foolproof for the machinist to use in laying out the part or a drill fixture.
12. Insofar as possible, design parts so that all holes can be drilled from one side or
from the fewest number of sides. This simplifies tooling and minimizes handling
time.
13. Design a part so that there is room for a drill bushing near the surface where the
drilled hole is started.
14. Standardize the size of holes, fasteners, and other screw threads as much as
possible so that the number of drill spindles and drill changes can be minimized.

199
15. When production quantities are large enough to justify multiple-drilling
arrangements, the designer should bear in mind that there are limitations as to
how closely two simultaneously drilled holes can be spaced. Smaller holes can be
spaced more closely than larger ones because gearing, chucks, and bushings can
be smaller. As a rule of thumb for small holes of 6-mm (1/4-in) diameter or less,
spacing should not be less than 19 mm (3/4 in), center to center, although in some
cases 13 mm (1/2 in) is possible.
B.1.3 Guidelines for milling
1. The product design should permit the use of standard cutter shapes and sizes
rather than special, nonstandard cutter designs. Slot widths, radii, chamfers,
corner shapes, and overall forms should conform to those of cutters available off
the shelf rather than those which require special fabrication. Specialized form-
relieved cutters are costly and difficult to maintain.
2. The product design should permit manufacturing preference as much as possible
to determine the radius where two milled surfaces intersect or where profile
milling is involved. This will permit the use of standard available or most easily
ground cutters.
3. When a small, flat surface is required, as for a bearing surface or a bolt-head seat
perpendicular to a hole, the product design should permit the use of spotfacing,
which is quicker and more economical than face milling.
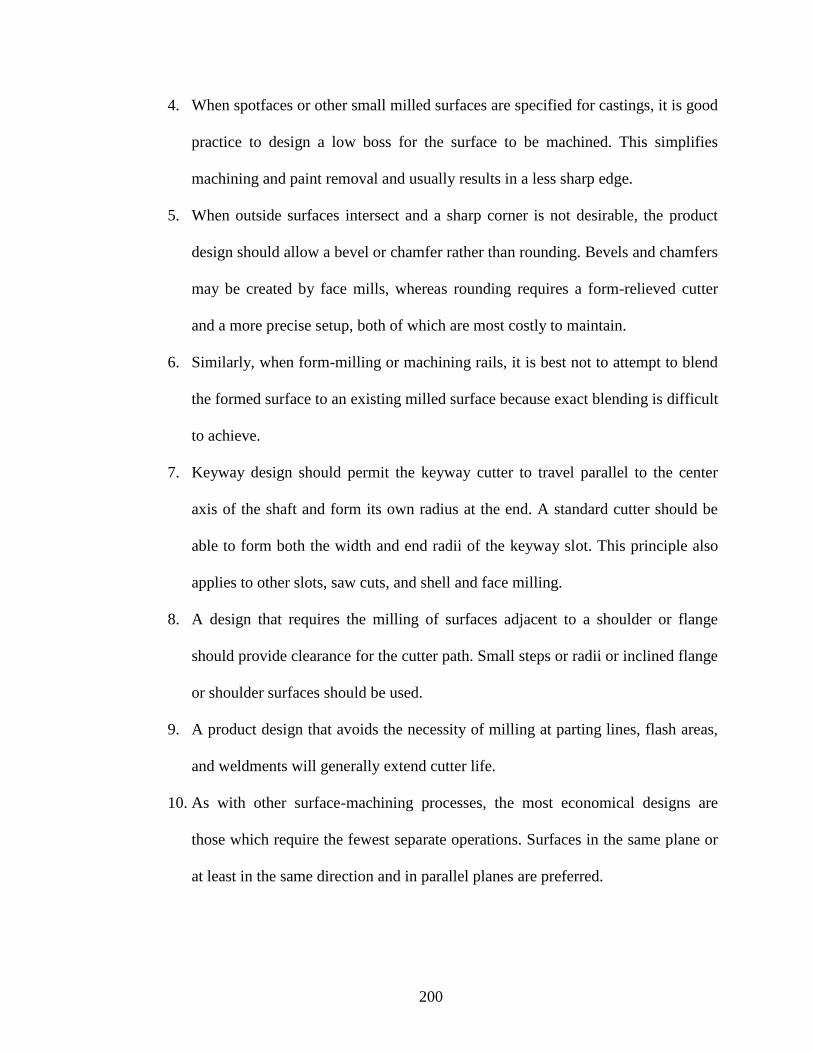
200
4. When spotfaces or other small milled surfaces are specified for castings, it is good
practice to design a low boss for the surface to be machined. This simplifies
machining and paint removal and usually results in a less sharp edge.
5. When outside surfaces intersect and a sharp corner is not desirable, the product
design should allow a bevel or chamfer rather than rounding. Bevels and chamfers
may be created by face mills, whereas rounding requires a form-relieved cutter
and a more precise setup, both of which are most costly to maintain.
6. Similarly, when form-milling or machining rails, it is best not to attempt to blend
the formed surface to an existing milled surface because exact blending is difficult
to achieve.
7. Keyway design should permit the keyway cutter to travel parallel to the center
axis of the shaft and form its own radius at the end. A standard cutter should be
able to form both the width and end radii of the keyway slot. This principle also
applies to other slots, saw cuts, and shell and face milling.
8. A design that requires the milling of surfaces adjacent to a shoulder or flange
should provide clearance for the cutter path. Small steps or radii or inclined flange
or shoulder surfaces should be used.
9. A product design that avoids the necessity of milling at parting lines, flash areas,
and weldments will generally extend cutter life.
10. As with other surface-machining processes, the most economical designs are
those which require the fewest separate operations. Surfaces in the same plane or
at least in the same direction and in parallel planes are preferred.

201
11. Milling operations often can be performed more economically if the product
design lends itself to stacking so that a milled surface can be incorporated into a
number of parts in one gang-milling operation. This also can occur if parts can be
“sliced” from a long workpiece after the milling operation. Even if the parts do
not have flat adjoining surfaces as shown, provided they are designed so that they
can nest together, gang milling may then be employed.
12. The product design should provide clearance to allow the use of larger-size cutters
rather than small cutters in order to permit high material-removal rates, more
efficient use of machine horsepower, and lower dynamic operating conditions
when machining. Smaller-sized cutters are less rugged and require higher
operating speeds to machine effectively. They are more subject to vibration,
chatter, and deflection of tool and machine components. Large clearances also
facilitate the use of carbide-insert cutters. These provide high production rates,
minimal cutter maintenance, and less frequent downtime for tool changes.
13. In end-milling slots in mild steel, the depth should not exceed the diameter of the
cutter.
B.1.4 Guidelines for reaming
1. Even though it is good practice to ream with a guide bushing when the hole
location or alignment is critical, do not depend on reaming to correct location or
alignment discrepancies unless the discrepancies are very small.
2. Avoid intersecting drilled and reamed holes if possible to prevent tool breakage
and burr-removal problems.

202
3. If a blind hole requires reaming, good practice calls for extra drilled depth to
provide room for chips.
B.1.5 Guidelines for boring
1. Even when boring operations are employed, avoid designing holes with
interrupted surfaces. Interrupted cuts tend to throw holes out of round and cause
vibration and tool wear.
2. Avoid designing holes with a depth-to-diameter ratio of over 4 or 5:1; otherwise,
accuracy may be lost owing to boring-bar deflection. (If carbide boring bars are
available, depth-to-diameter ratios of 8:1 are feasible.) If deep holes are
unavoidable, consider the use of stepped diameters to limit the depth of the bored
surface.
3. Use through holes whenever possible. If the hole must be blind, allow the rough
hole to be deeper than the bored portion by an amount equal to at least one-fourth
the hole diameter.
4. Remember that except for small quantities of special-diameter holes, boring is
more expensive than drilling and reaming. Equipment is more costly, and the
operation is slower. Use boring only when the accuracy requirements demand it.
Do not specify bored-hole tolerances unless really necessary.
5. With boring as with other precision machining operations, the part must be rigid
so that deflection or vibration as a result of cutting forces is avoided. Care also
must be taken in the workpiece and fixture design to avoid deflection of the part

203
when it is clamped in the fixture, for if this occurs, machined surfaces will be off
location when the part springs back from its clamped position.
B.1.6 Guidelines for planing, shaping and slotting
1. Since the cutting forces in planing and shaping may be abrupt and rather large,
design parts so that they can be easily clamped to the work table and are sturdy
enough to withstand deflection during machining.
2. It is preferable to put machined surfaces in the same plane to reduce the number
of operations required. (This stricture does not apply if a multitooled planer can
machine both surfaces simultaneously.)
3. Avoid multiple surfaces that are not parallel in the direction of reciprocating
motion of the cutting tool because this would necessitate additional setups.
4. Avoid contoured surfaces unless a tracer attachment is available, and then specify
gentle contours and generous radii as much as possible.
5. With shapers and slotters it is possible to cut to within 6 mm (1/4 in) of an
obstruction or the end of a blind hole. If possible, allow a relieved portion at the
end of the machined surface.
6. For thin, flat pieces that require surface machining, allow sufficient stock for a
stress-relieving operation between rough and finish machining, or, if possible,
rough-machine equal amounts from both sides. Allow about 0.4 mm (0.015 in) for
finish machining. Then finish-machine on both sides.
7. The minimum size of holes in which a keyway or a slot can be machined with a
slotter or shaper is about 1 in.

204
8. Because of a lack of rigidity of long cutting-tool extensions, it is not normally
feasible to machine a slot longer than 4 times the hole diameter (or the largest
dimension of the opening).
B.2 DFM Guidelines for FDM
1. Avoid simple parts. Considering different manufacturing processes if
a. The part is the same shape as common stock materials, or is completely 2D;
b. The part is mostly 2D and can be made in a mill or lathe;
2. Use FDM if the part curvature is complex (splines or arcs) for a machining
operation such as a mill or lathe.
3. Use FDM if there are interior features or surface curvature is too complex to be
machined.
4. FDM parts are light and medium duty. Considering different manufacturing
processes if mating surfaces are bearing surfaces, or are expected to endure for
1000+ of cycles.
5. Considering different manufacturing processes if mating surfaces move
significantly, experience large forces, or must endure 100-1000 cycles.
6. Use FDM if mating surfaces move somewhat, experience moderate forces, or are
expected to last 10-100 cycles.
7. Use FDM if surfaces are purely non-functional or experience virtually no cycles.
8. The support structure can ruin surface finish. Avoid support structure if not
necessary.
9. Use support structure for overhang features, unsupported features will drop.

205
10. Avoid thin features since they will almost always break.
11. Major structure elements such as walls, interlocking features should be thicker.
12. Minimum wall thickness for FDM parts varies depending upon the slice thickness
that will be used to build the part.
13. Consider stress concentration of the interior corners. Use generous chamfers,
fillets and/or ribs to transit the interior corners gradually.
14. Mating parts should not be the same size. Proper clearance should be given
between mating assembly parts to prevent them from fusing together. The
standard guideline for creating clearances on assemblies being produced fully
assembled is a minimum Z clearance of the slice thickness. The X/Y clearance is
at least the default extrusion width based on a suggested minimum wall thickness.
The minimum clearance needed for mating parts, when not producing the
components fully assembled, is equal to the tolerance of the FDM machine itself.
15. Avoid large, flat areas since they tend to warp.
16. Avoid producing hollow parts with a “watertight” interior. The support material
cannot be removed.
17. Make sure the opening to the part interior are of sufficient size to remove support
material.
18. Holes (those in bosses as well) on an FDM part are generally fractionally
undersized. When tight tolerances are required, holes will be drilled or reamed to
ensure the diameter is accurate.
19. When designing built-in threads, avoid sharp edges and include a radius on the
root. Sharp edges can be stress concentrators in plastic parts. Creating an ACME

206
thread design with rounded roots and crests has been found to work well when
using FDM. Also, use a “dog point” head of at least 1/32 in. (0.8 mm). This dog
point design makes starting the thread much easier. Small threads produced from
the FDM process are not recommended and not possible for holes or posts smaller
than a 1/16 in. (1.6 mm) diameter. An easy alternative is to use a tap or die to
thread holes or posts.
20. Because FDM is an additive process, undercuts for design features such as O-ring
grooves are easily handled without causing manufacturing issues.
21. Draft is unnecessary in FDM parts.
22. extruded plastic has its strongest strength in the tensile mode along the x-y plane.
Since the layers are held together by “hot flow” across the strands (one strand is
cooling while the other is laid upon it), the lowest strength is in the Z-direction for
both tensile and shear modes.
23. Overhanging non-supported features, such as the top of a closed box, require a
foundation of support material to be built, which increases build time and material
usage. Because of this, build orientation is usually determined by the part
processor. For example, half of a box-shaped casing will be built with the main
exterior facing down, so that no internal support is needed.
24. Parts may be sectioned (prior to manufacturing) in CAD. Sectioning can be used
to:
a. Build parts that are too big for the build chamber (cut parts into sections).
b. Eliminate excessive amounts of support structure.

207
c. Cut overhanging features from the top of the part (in its build orientation) and
build separately.
d. Preserve fragile features that may be damaged in post processing.
e. Section fragile features from the part and build them separately. (Once fragile
features are removed they can be built in an orientation that produces a
stronger part. There are a number of bonding methods to reattach features and
join sectioned parts.)
25. When using fastening hardware, use a cap screw or a flanged cap screw. The flat
surface eliminates multidirectional stresses from cracking the part. Washers can
also be used to spread the load over the largest possible surface area. Lock nuts,
embedded nuts, or metal inserts are all stronger fastening options than adding
threads to the FDM plastic.
26. Many times, the design of FDM parts can be solid rather than using a hollowed-
out design supported by bosses and ribs. This can reduce build time and use less
support material. It is not necessary to reduce wall thickness of a boss, rib, or
gusset in FDM parts. Generally, bosses can be the same size as the part thickness
or up to 0.02 in. (0.5 mm) less. It is also important to use gussets or ribs to support
the bosses in FDM parts. This will increase the amount of stress the feature can
withstand.
27. Minimum suggested text size on the top or bottom build plane of a FDM model is
16-point boldface. Minimum suggested text size on vertical walls is 10-point bold.
In most cases the supports generated to support text on a vertical wall can be
eliminated to save time and material.

208
Since the FDM process uses engineering-grade thermoplastics, the parts produced are
capable of withstanding a number of post-manufacturing processes, including machining
operations such as drilling and tapping, sawing, turning, and milling. (Note that heat is
easily built up in plastic parts, so removing the material slowly and using coolant keeps
the part from distorting.) Other post processing operations may include smoothing,
burnishing, sealing, joining, bonding, and plating.

209
REFERENCES
[1] CRISMOND DP, ADAMS RS. The Informed Design Teaching and Learning
Matrix. J Eng Educ 2012;101:738–97.
[2] Lenhart M, Birkhofer H. Classification of Users in the context of Knowledge
Transfer in Product Development. Int Des Conf 2006.
[3] Laxton M. Design education in practice. Attitudes Des Educ 1969.
[4] Cross N. Expertise in design: an overview. Des Stud 2004;25:427–41.
[5] Crismond D. Learning and Using Science Ideas When Doing Investigate-and-
Redesign Tasks: A Study of Naive, Novice, and Expert Designers Doing
Constrained and Scaffolded Design Work. J Res Sci Teach 2001;38:791–820.
[6] Ozkan O, Dogan F. Cognitive strategies of analogical reasoning in design:
Differences between expert and novice designers. Des Stud 2013;34:161–92.
[7] Guindon R. Knowledge Exploited by Experts During Software System Design. Int
J Man Mach Stud 1990;33:279–304.
[8] Xometry. Introducing our new SOLIDWORKS Add-In! - Xometry n.d.
https://www.xometry.com/blog/announcing-solidworks-add-in.
[9] SolidWorks. DFMXpress|SOLIDWORKS n.d.
http://www.solisdworks.com/sw/products/3d-cad/dfmxpress.htm.
[10] Shukor SA, Axinte DA. Manufacturability analysis system: issues and future
trends. Int J Prod Res 2009;47:1369–90.
[11] Kavakli M, Gero J. Strategic Knowledge Differences between an Expert and a
Novice Designer. In: Lindemann U, editor. Hum. Behav. Des., Springer-Verlag
Berlin Heidelberg; 2003, p. 42–52.
[12] Ahmed S, Wallace K, Blessing L. Understanding the Differences Between how

210
Novice and Experienced Designers Approach Design Tasks. Res Eng Des
2003;14:1–11.
[13] Kavakli M, Gero J. The structure of concurrent cognitive actions: a case study on
novice and expert designers. Des Stud 2002;23:25–40.
[14] Kavakli M, Suwa M, Gero J, Purcell T. Sketching Interpretation in Novice and
Expert Designers. Vis Spat Reason Des 1999:209–19.
[15] Kapur M. Productive Failure. Cogn Instr 2008;26:379–424.
[16] Soep E. Participatory politics: Next-generation tactics to remake public spheres.
MIT Press; 2014.
[17] Song R, Clemon L, Telenko C. Uncertainty and Variability of Energy and Material
Use by Fused Deposition Modeling Printers in Makerspaces. J Ind Ecol 2018.
[18] Song R, Telenko C. Material and energy loss due to human and machine error in
commercial FDM printers. J Clean Prod 2017;148:895–904.
[19] Ehrlich PR, Holdren JP. Impact of Population Growth. Science (80- )
1971;171:1212–7.
[20] Newstetter WC, McCracken WM. Novice conceptions of design: Implications for
the design of learning environments. Des. knowing Learn. Cogn. Des. Educ.,
Elsevier; 2001, p. 63–77.
[21] Atman C, Chimka J, Bursic K, Nachtmann H. A Comparison of Freshman and
Senior Engineering Design Processes. Des Stud 1999;20:131–52.
[22] Dreyfus H, Dreyfus S. Peripheral Vision: Expertise in Real World Contexts. Organ
Stud 2005;26:779–92.
[23] Bucciarelli LL. Reflective practice in engineering design. Des Stud 1984;5:185–
90.
[24] Goldstein WM, Hogarth RM. Judgment and decision research: Some historical
context. Res Judgm Decis Mak Curr Connect Controv 1997:3–65.

211
[25] Dwivedi SN, Klein BR. Design for manufacturability makes dollars and sense.
CIM Rev 1986;3:58.
[26] Sherif D. El Wakil. Processes and Design for Manufacturing. Prentice Hall; 1989.
[27] Boothroyd G. Product design for manufacture and assembly. Comput Des
1994;26:505–20.
[28] Bralla JG. Design for manufacturability handbook. McGraw-Hill; 1999.
[29] Poli C. Design for manufacturing: a structured approach. Butterworth-Heinemann;
2001.
[30] Molcho G, Zipori Y, Schneor R, Rosen O, Goldstein D, Shpitalni M. Computer
aided manufacturability analysis: Closing the knowledge gap between the designer
and the manufacturer. CIRP Ann 2008;57:153–8.
[31] Du W, Bai Q, Zhang B. A Novel Method for Additive/Subtractive Hybrid
Manufacturing of Metallic Parts. Procedia Manuf 2016;5:1018–30.
[32] Karunakaran KP, Suryakumar S, Pushpa V, Akula S. Low cost integration of
additive and subtractive processes for hybrid layered manufacturing. Robot
Comput Integr Manuf 2010;26:490–9.
[33] Zhu Z, Dhokia VG, Nassehi A, Newman ST. A review of hybrid manufacturing
processes - State of the art and future perspectives. Int J Comput Integr Manuf
2013;26:596–615.
[34] Gupta SK. Using manufacturing planning to generate manufacturability feedback.
J Mech Des 1997;119:73–80.
[35] Kim W. A Framework for Set-based Manufacturing Analysis and Visual
Feedback. The Pennsylvania State University, 2015.
[36] Binnard M, Cutkosky MR. Design by Composition for Layered Manufacturing. J
Mech Des 2000;122:91.
[37] Bronsvoort WF, Bidarra R, Noort A. Feature model visualization. Comput. Graph.

212
Forum, vol. 21, Wiley Online Library; 2002, p. 661–73.
[38] Balasubramaniam M, Sarma SE, Marciniak K. Collision-free finishing toolpaths
from visibility data. Comput Des 2003;35:359–74.
[39] Chen†* C-H, Occena LG, Fok SC. CONDENSE: a concurrent design evaluation
system for product design. Int J Prod Res 2001;39:413–33.
[40] Di Stefano P. Automatic extraction of form features for casting. Comput Des
1997;29:761–70.
[41] Selim HM, Askin RG, Vakharia AJ. Cell formation in group technology: review,
evaluation and directions for future research. Comput Ind Eng 1998;34:3–20.
[42] Boujut J-F, Blanco E. Intermediary objects as a means to foster co-operation in
engineering design. Comput Support Coop Work 2003;12:205–19.
[43] Hedberg T, Lubell J, Fischer L, Maggiano L, Feeney AB. Testing the digital thread
in support of model-based manufacturing and inspection. J Comput Inf Sci Eng
2016;16:21001.
[44] Stacey M, Eckert C. Against ambiguity. Comput Support Coop Work
2003;12:153–83.
[45] Murphy KM. Collaborative imagining: The interactive use of gestures, talk, and
graphic representation in architectural practice. Semiotica 2005;2005:113–45.
[46] Xu X., He Q. Striving for a total integration of CAD, CAPP, CAM and CNC.
Robot Comput Integr Manuf 2004;20:101–9.
[47] Grabowski M, You Z, Zhou Z, Song H, Steward M, Steward B. Human and
organizational error data challenges in complex, large-scale systems. Saf Sci
2009;47:1185–94.
[48] Wu D, Rosen DW, Wang L, Schaefer D. Cloud-based design and manufacturing:
A new paradigm in digital manufacturing and design innovation. Comput Des
2015;59:1–14.

213
[49] Ericsson K, Krampe R, Tesch-Romer C. The Role of Deliberate Practice in the
Acquisition of Expert Performance. Psychol Rev 1993;100:363–406.
[50] Ericsson K, Lehmann A. Expert and Exceptional Performance: Evidence of
Maximal Adaptation to Task Constraints. Annu Rev Psychol 1996;47:273–305.
[51] Petre M. How Expert Engineering Teams Use Disciplines of Innovation. Des Stud
2004;25:477–93.
[52] Lawson B. What Designers Know. Routledge; 2004.
[53] USDOC. Gross Domestic Product (GDP) by Industry Data. 2012.
[54] EIA. 2002 Manufacturing Energy Consumption Survey. 2006.
[55] Haapala KR, Zhao F, Camelio J, Sutherland JW, Skerlos SJ, Dornfeld D a., et al.
A Review of Engineering Research in Sustainable Manufacturing. J Manuf Sci
Eng 2013;135:041013.
[56] Jayal AD, Badurdeen F, Dillon OW, Jawahir IS. Sustainable manufacturing:
Modeling and optimization challenges at the product, process and system levels.
CIRP J Manuf Sci Technol 2010;2:144–52.
[57] Li W, Kara S. An empirical model for predicting energy consumption of
manufacturing processes: a case of turning process. Proc Inst Mech Eng Part B J
Eng Manuf 2011;225:1636–46.
[58] He K, Tang R, Zhang Z, Sun W. Energy Consumption Prediction System of
Mechanical Processes Based on Empirical Models and Computer-Aided
Manufacturing. J Comput Inf Sci Eng 2016;16:041008.
[59] Overcash M, Twomey J, Kalla D. Unit Process Life Cycle Inventory for Product
Manufacturing Operations. ASME 2009 Int. Manuf. Sci. Eng. Conf. Vol. 1, West
Lafayette, Indiana: ASME; 2009, p. 49–55.
[60] Seow Y, Rahimifard S. A framework for modelling energy consumption within
manufacturing systems. CIRP J Manuf Sci Technol 2011;4:258–64.

214
[61] Baumers M, Tuck C, Wildman R, Ashcroft I, Hague R. Energy inputs to additive
manufacturing: Does capacity utilization matter? Solid Free. Fabr. Symp., Austin,
TX: 2011, p. 30–40.
[62] Kreiger M, Pearce JM. Environmental life cycle analysis of distributed three-
dimensional printing and conventional manufacturing of polymer products. ACS
Sustain Chem Eng 2013;1:1511–9.
[63] Mognol P, Lepicart D, Perry N. Rapid prototyping: energy and environment in the
spotlight. Rapid Prototyp J 2006;12:26–34.
[64] Telenko C, Seepersad C. A comparison of the energy efficiency of selective laser
sintering and injection molding of nylon parts. Rapid Prototyp J 2012;18:472–81.
[65] Baumers M, Tuck C, Wildman R, Ashcroft I, Rosamond E, Hague R.
Transparency Built-in: Energy Consumption and Cost Estimation for Additive
Manufacturing Baumers et al. Energy and Cost Estimation for Additive
Manufacturing. J Ind Ecol 2013;17:418–31.
[66] Song R, Lu Y, Telenko C, Wang Y. Manufacturing Energy Consumption
Estimation Using Machine Learning Approach. ASME 2017 Int. Des. Eng. Tech.
Conf. Comput. Inf. Eng. Conf., Cleveland, OH: ASME; 2017, p. V004T05A037.
[67] Faludi J, Bayley C, Bhogal S, Iribarne M. Comparing environmental impacts of
additive manufacturing vs traditional machining via life-cycle assessment. Rapid
Prototyp J 2015;21:14–33.
[68] Keller AZ, Kamath ARR, Perera UD. Reliability analysis of CNC machine tools.
Reliab Eng 1982;3:449–73.
[69] Wang Y, Jia Y, Yu J, Yi S. Field failure database of CNC lathes. Int J Qual Reliab
Manag 1999;16:330–43.
[70] You D, Pham H. Reliability Analysis of the CNC System Based on Field Failure
Data in Operating Environments. Qual Reliab Eng Int 2016;32:1955–63.
[71] Kalpakjian S, Schmid SR. Manufacturing Engineering and Technology. Pearson
Upper Saddle River, NJ, USA; 2014.

215
[72] Xu F, Loh HT, Wong YS. Considerations and selection of optimal orientation for
different rapid prototyping systems. Rapid Prototyp J 1999;5:54–60.
[73] Alafaghani A, Qattawi A, Alrawi B, Guzman A. Experimental Optimization of
Fused Deposition Modelling Processing Parameters: A Design-for-Manufacturing
Approach. Procedia Manuf 2017;10:791–803.
[74] Onwubolu GC, Rayegani F. Characterization and Optimization of Mechanical
Properties of ABS Parts Manufactured by the Fused Deposition Modelling
Process. Int J Manuf Eng 2014;2014:1–13.
[75] Seepersad CC, Govett T, Kim K, Lundin M, Pinero D. A Designer’s Guide for
Dimensioning and Tolerancing SLS parts. 23rd Annu. Int. Solid Free. Fabr. Symp.,
Austin, TX: 2012, p. 921–31.
[76] all3dp.com. 3D Printing Troubleshooting: 34 Common 3D Printing Problems |
All3DP n.d. https://all3dp.com/1/common-3d-printing-problems-troubleshooting-
3d-printer-issues/ (accessed March 21, 2018).
[77] simplyfy3d. Print Quality Troubleshooting Guide | Simplify3D Software n.d.
https://www.simplify3d.com/support/print-quality-troubleshooting/ (accessed
March 21, 2018).
[78] reprap.org. Print Troubleshooting Pictorial Guide - RepRapWiki n.d.
http://reprap.org/wiki/Print_Troubleshooting_Pictorial_Guide (accessed March 21,
2018).
[79] Baumers M, Holweg M. Cost Impact of the Risk of Build Failure in Laser
Sintering. Proc. Solid Free. Fabr. Symp. 2016, University of Texas at Austin;
2016.
[80] Mueller B. Additive Manufacturing Technologies – Rapid Prototyping to Direct
Digital Manufacturing. Assem Autom 2012;32:aa.2012.03332baa.010.
[81] Yang S, Zhao YF. Additive manufacturing-enabled design theory and
methodology: a critical review. Int J Adv Manuf Technol 2015;80:327–42.
[82] Hopkinson N, Gao Y, McAfee DJ. Design for environment analyses applied to
rapid manufacturing. Proc Inst Mech Eng Part D J Automob Eng 2006;220:1363–

216
72.
[83] Mansour S, Hague R. Impact of rapid manufacturing on design for manufacture for
injection moulding. Proc Inst Mech Eng Part B J Eng Manuf 2003;217:453–61.
[84] Becker R, Grzesiak A, Henning A. Rethink assembly design. Assem Autom
2005;25:262–6.
[85] Atzeni E, Iuliano L, Minetola P, Salmi A. Redesign and cost estimation of rapid
manufactured plastic parts. Rapid Prototyp J 2010;16:308–17.
[86] Thomas D. The Development of Design Rules for Selective Laser Melting.
University of Wales, 2009.
[87] Adam GAO, Zimmer D. Design for Additive Manufacturing—Element transitions
and aggregated structures. CIRP J Manuf Sci Technol 2014;7:20–8.
[88] Lieneke T, Denzer V, Adam GAO, Zimmer D. Dimensional Tolerances for
Additive Manufacturing: Experimental Investigation for Fused Deposition
Modeling. Procedia CIRP 2016;43:286–91.
[89] Booth JW, Alperovich J, Chawla P, Ma J, Reid TN, Ramani K. The Design for
Additive Manufacturing Worksheet. J Mech Des 2017;139.
[90] Rosen D. Design for Additive Manufacturing: Past, Present, and Future Directions.
J Mech Des 2014;136:090301.
[91] Cheng W, Fuh JYH, Nee AYC, Wong YS, Loh HT, Miyazawa T. Optimization of
Part- Building Orientation in Stereolithography. Rapid Prototyp J 1995;1:12–23.
[92] Snyder JC, Stimpson CK, Thole K a., Mongillo DJ. Build Direction Effects on
Microchannel Tolerance and Surface Roughness. J Mech Des 2015;137:111411.
[93] Das P, Chandran R, Samant R, Anand S. Optimum Part Build Orientation in
Additive Manufacturing for Minimizing Part Errors and Support Structures.
Procedia Manuf 2015;1:343–54.
[94] Karim KF, Hazry D, Zulkifli AH, Ahmed SF, Razlan ZM, Wan K, et al. Feature

217
Extraction and Optimum Part Deposition Orientation for FDM. Appl Mech Mater
2015;793:642–6.
[95] Singhal SK, Pandey AP, Pandey PM, Nagpal AK. Optimum part deposition
orientation in stereolithography. Comput Aided Des Appl 2005;2:319–28.
[96] Alexander P, Allen S, Dutta D. Part orientation and build cost determination in
layered manufacturing. Comput Des 1998;30:343–56.
[97] Mohamed O a., Masood SH, Bhowmik JL. Optimization of fused deposition
modeling process parameters: a review of current research and future prospects.
Adv Manuf 2015:42–53.
[98] Griffiths CA, Howarth J, De Almeida-Rowbotham G, Rees A, Kerton R. A design
of experiments approach for the optimisation of energy and waste during the
production of parts manufactured by 3D printing. J Clean Prod 2016;139:74–85.
[99] Keoleian GA, Menerey D. Life cycle design guidance manual: Environmental
requirements and the product system. Life cycle Des. Guid. Man. Environ. Requir.
Prod. Syst., EPA; 1993.
[100] Brezet H. Ecodesign-A promising approach to sustainable production and
consumption. United Nations Environ Program 1997.
[101] Gungor A, Gupta SM. Issues in environmentally conscious manufacturing and
product recovery: a survey. Comput Ind Eng 1999;36:811–53.
[102] Gutowski T, Murphy C, Allen D, Bauer D, Bras B, Piwonka T, et al.
Environmentally benign manufacturing: observations from Japan, Europe and the
United States. J Clean Prod 2005;13:1–17.
[103] Giudice F, La Rosa G, Risitano A. Product design for the environment: a life cycle
approach. CRC press; 2006.
[104] Vezzoli C, Manzini E. Design for environmental sustainability. Springer; 2008.
[105] Telenko C, Seepersad CC, Webber ME. A Compilation of Design for Environment
Principles and Guidelines. Vol. 5 13th Des. Manuf. Lifecycle Conf. 5th Symp. Int.

218
Des. Des. Educ. 10th Int. Conf. Adv. Veh. Tire Technol., ASME; 2008, p. 289–
301.
[106] Fiksel J. Design for environment: a guide to sustainable product development: eco-
efficient product development. McGraw Hill Professional, Boston; 2009.
[107] Ramani K, Ramanujan D, Bernstein WZ, Zhao F, Sutherland J, Handwerker C, et
al. Integrated Sustainable Life Cycle Design: A Review. J Mech Des
2010;132:091004.
[108] Perry M, Sanderson D. Coordinating joint design work: the role of communication
and artefacts. Des Stud 1998;19:273–88.
[109] Boothroyd G, Alting L. Design for assembly and disassembly. CIRP Ann
1992;41:625–36.
[110] Hauser JR, Clausing D. The house of quality 1988.
[111] Leigh Star S. This is not a boundary object: Reflections on the origin of a concept.
Sci Technol Hum Values 2010;35:601–17.
[112] Eckert C, Boujut J-F. The role of objects in design co-operation: communication
through physical or virtual objects. Comput Support Coop Work 2003;12:145–51.
[113] Kleinsmann M, Valkenburg R. Barriers and enablers for creating shared
understanding in co-design projects. Des Stud 2008;29:369–86.
[114] Stevens J. Design as communication in microstrategy: Strategic sensemaking and
sensegiving mediated through designed artifacts. AI EDAM 2013;27:133–42.
[115] Lang SYT, Dickinson J, Buchal RO. Cognitive factors in distributed design.
Comput Ind 2002;48:89–98.
[116] Camba JD, Contero M. Assessing the impact of geometric design intent
annotations on parametric model alteration activities. Comput Ind 2015;71:35–45.
[117] Nickerson RS. How we know—and sometimes misjudge—what others know:
Imputing one’s own knowledge to others. Psychol Bull 1999;125:737.

219
[118] Denkena B, Shpitalni M, Kowalski P, Molcho G, Zipori Y. Knowledge
Management in Process Planning. CIRP Ann 2007;56:175–80.
[119] Hoque ASM, Halder PK, Parvez MS, Szecsi T. Integrated manufacturing features
and Design-for-manufacture guidelines for reducing product cost under
CAD/CAM environment. Comput Ind Eng 2013;66:988–1003.
[120] Ferrer I, Rios J, Ciurana J. An approach to integrate manufacturing process
information in part design phases. J Mater Process Technol 2009;209:2085–91.
[121] Wu D, Terpenny J, Schaefer D. Digital design and manufacturing on the cloud: A
review of software and services. Artif Intell Eng Des Anal Manuf 2017;31:104–18.
[122] Ramanujan D, Bernstein WZ, Totorikaguena MA, Ilvig CF, Ørskov KB.
Generating Contextual Design for Environment Principles in Sustainable
Manufacturing Using Visual Analytics. J Manuf Sci Eng 2018;141:021016.
[123] Thomas JJ, Cook KA. A visual analytics agenda. IEEE Comput Graph Appl
2006;26:10–3.
[124] Kamath M, Srivathsan S, Ingalls RG, Shen G, Pulat PS. Tiscsoft: A decision
support system for transportation infrastructure and supply chain system planning.
2011 44th Hawaii Int. Conf. Syst. Sci., IEEE; 2011, p. 1–9.
[125] Bernstein WZ, Ramanujan D, Elmqvist N, Zhao F, Ramani K. ViSER: Visualizing
supply chains for eco-conscious redesign. ASME Pap No DETC2014-34960 2014.
[126] Xu P, Mei H, Ren L, Chen W. ViDX: Visual diagnostics of assembly line
performance in smart factories. IEEE Trans Vis Comput Graph 2017;23:291–300.
[127] Rosen DW. Computer-Aided Design for Additive Manufacturing of Cellular
Structures. Comput Aided Des Appl 2007;4:585–94.
[128] Kumke M, Watschke H, Vietor T. A new methodological framework for design
for additive manufacturing. Virtual Phys Prototyp 2016;11:3–19.
[129] Bin Maidin S, Campbell I, Pei E. Development of a design feature database to
support design for additive manufacturing. Assem Autom 2012;32:235–44.

220
[130] Ponche R, Hascoet JY, Kerbrat O, Mognol P. A new global approach to design for
additive manufacturing. Virtual Phys Prototyp 2012;7:93–105.
[131] Klahn C, Leutenecker B, Meboldt M. Design Strategies for the Process of Additive
Manufacturing. Procedia CIRP 2015;36:230–5.
[132] Reddy K. SN, Maranan V, Simpson TW, Palmer T, Dickman CJ. Application of
Topology Optimization and Design for Additive Manufacturing Guidelines on an
Automotive Component. ASME 2016 Int. Des. Eng. Tech. Conf. Comput. Inf.
Eng. Conf., Ch: ASME; 2016, p. V02AT03A030.
[133] Kim S, Rosen DW, Witherell P, Ko H. Linking part design to process planning by
design for additive manufacturing ontology. Proc. 3rd Int. Conf. Prog. Addit.
Manuf. (Pro-AM 2018), 2018, p. 303–8.
[134] Kusiak A. Smart manufacturing. Int J Prod Res 2018;56:508–17.
[135] Tao F, Qi Q. New IT Driven Service-Oriented Smart Manufacturing: Framework
and Characteristics. IEEE Trans Syst Man, Cybern Syst 2019;49:81–91.
[136] Zheng P, Wang H, Sang Z, Zhong RY, Liu Y, Liu C, et al. Smart manufacturing
systems for Industry 4.0: Conceptual framework, scenarios, and future
perspectives. Front Mech Eng 2018;13:137–50.
[137] Wang J, Ma Y, Zhang L, Gao RX, Wu D. Deep learning for smart manufacturing:
Methods and applications. J Manuf Syst 2018;48:144–56.
[138] Urbina Coronado PD, Lynn R, Louhichi W, Parto M, Wescoat E, Kurfess T. Part
data integration in the Shop Floor Digital Twin: Mobile and cloud technologies to
enable a manufacturing execution system. J Manuf Syst 2018;48:25–33.
[139] Tao F, Cheng J, Qi Q, Zhang M, Zhang H, Sui F. Digital twin-driven product
design, manufacturing and service with big data. Int J Adv Manuf Technol
2018;94:3563–76.
[140] Litzinger T, Lattuca L, Hadgraft R, Newstetter W. Engineering Education and the
Development of Expertise. J Eng Educ 2011;100:123–50.

221
[141] Ericsson KA, Charness N. Expert performance: Its structure and acquisition. Am
Psychol 1994;49:725–47.
[142] Gelder T van. Teaching Critical Thinking: Some Lessons From Cognitive Science.
Coll Teach 2005;53:41–8.
[143] Patel VL, Groen GJ. The general and specific nature of medical expertise: A
critical look. Towar a Gen Theory Expert Prospect Limits 1991:93–125.
[144] Lawson B, Dorst K. Design Expertise. Elsevier Ltd.; 2009.
[145] Bereiter C, Scardamalia M. Surpassing ourselves: an inquiry into the nature and
implications of expertise. An Inq into Nat Implic Expert Chicago Open Court
1993.
[146] Ball L, Ormerod T. Structured and Opportunistic Processing in Design: a Critical
Discussion. Int J Hum Comput Stud 1995;43:131–51.
[147] Elio R, Scharf PB. Modeling novice‐to‐expert shifts in problem‐solving strategy
and knowledge organization. Cogn Sci 1990;14:579–639.
[148] Adams R, Turns J, Atman C. Educating Effective Engineering Designers: The
Role of Reflective Practice. Des Stud 2003;24:275–94.
[149] Goldschmidt G. The Design Thinking Approaches of Three Different Groups of
Designers Based on Self-Reports. Des Stud 2013;34:454–71.
[150] Atman CJ, Bursic KM. Teaching engineering design: Can reading a textbook make
a difference? Res Eng Des 1996;8:240–50.
[151] Rowland G. What do instructional designers actually do? An initial investigation
of expert practice. Perform Improv Q 1992;5:65–86.
[152] Simon HA. The structure of ill structured problems. Artif Intell 1973;4:181–201.
[153] Lawson B. Schemata, Gambits and Precedent: Some Factors in Design Expertise.
Des Stud 2004;25:443–57.

222
[154] Cross N, Cross A. Expertise in Engineering Design. Res Eng Des 1998;10:141–9.
[155] Bonnardel N, Marmeche N. Evocation Processes by Novice and Expert Designers:
Towards Stimulating Analogical Thinking. Creat Innov Manag 2004;13:176–86.
[156] Dorst K, Reymen I. Levels of Expertise in Design Education. Int Eng Prod Des
Educ Conf 2004;2:159–66.
[157] Bjorklund T. Initial Mental Representations of Design Problems: Differences
between Experts and Novices. Des Stud 2013;34:135–60.
[158] Cross N. Expertise in Design. Expert Des 2003.
[159] Crilly N. Fixation and Creativity in Concept Development: The Attitudes and
Practices of Expert Designers. Des Stud 2015;38:54–91.
[160] Fricke G. Successful Individual Approaches in Engineering Design. Res Eng Des
1996;8:151–65.
[161] Popovic V. Expertise Development in Product Design: Strategic and Domain-
Specific Knowledge Connections. Des Stud 2004;25:527–45.
[162] Onwubolu GC, Rayegani F. Characterization and Optimization of Mechanical
Properties of ABS Parts Manufactured by the Fused Deposition Modelling
Process. Int J Manuf Eng 2014;2014:1–13.
[163] Barrett TW, Pizzico MC, Levy B, Nagel RL. A Review of University Maker
Spaces. 122nd ASEE Annu. Conf. Expo., Seattle, WA: 2015.
[164] Chen D, Heyer S, Ibbotson S, Salonitis K, Steingrímsson JG, Thiede S. Direct
digital manufacturing: Definition, evolution, and sustainability implications. J
Clean Prod 2015;107:615–25.
[165] Kellens K, Baumers M, Gutowski TG, Flanagan W, Lifset R, Duflou JR.
Environmental dimensions of additive manufacturing: Mapping application
domains and their environmental implications. J Ind Ecol 2017.
[166] Björklund AE. Survey of approaches to improve reliability in {LCA}. Int J Life

223
Cycle Assess 2002;7:64–72.
[167] Ross S, Evans D, Webber M. How LCA studies deal with uncertainty. Int J Life
Cycle Assess 2002;7:47–52.
[168] Reap J, Roman F, Duncan S, Bras B. A survey of unresolved problems in life
cycle assessment. Int J Life Cycle Assess 2008;13:374–88.
[169] Weidema BP, Wesnæs MS. Data quality management for life cycle inventories—
an example of using data quality indicators. J Clean Prod 1996;4:167–74.
[170] Lloyd SM, Ries R. Characterizing, Propagating, and Analyzing Uncertainty in
Life-Cycle Assessment A Survey of Quantitative Approaches. J Ind Ecol
2007;11:161–81.
[171] Weidema BP, Bauer C, Hischier R, Mutel C, Nemecek T, Reinhard J, et al.
Overview and methodology Data quality guideline for the ecoinvent database. St.
Gallen: The Ecoinvent Centre: 2013.
[172] Moya J, Phillips L, Schuda L, Wood P, Diaz A, Lee R, et al. Exposure Factors
Handbook: 2011 edition. US Environ Prot Agency Washingt 2011.
[173] Vigon BW, Jensen AA. Life cycle assessment: data quality and databases
practitioner survey. J Clean Prod 1995;3:135–41.
[174] Hertwich EG, McKone TE, Pease WS. A Systematic Uncertainty Analysis of an
Evaluative Fate and Exposure Model. Risk Anal 2000;20:439–54.
[175] von Bahr B, Steen B. Reducing epistemological uncertainty in life cycle inventory.
J Clean Prod 2004;12:369–88.
[176] Nicholson AL, Olivetti EA, Gregory JR, Field FR, Kirchain RE. End-of-life LCA
allocation methods: Open loop recycling impacts on robustness of material
selection decisions. 2009 IEEE Int. Symp. Sustain. Syst. Technol., IEEE; 2009, p.
1–6.
[177] Huijbregts MAJ. Part II: Dealing with parameter uncertainty and uncertainty due
to choices in life cycle assessment. Int J Life Cycle Assess 1998;3:343–51.

224
[178] Lo S, Ma H, Lo S. Quantifying and reducing uncertainty in life cycle assessment
using the Bayesian Monte Carlo method. Sci Total Environ 2005;340:23–33.
[179] Sonnemann GW, Schuhmacher M, Castells F. Uncertainty assessment by a
{Monte} {Carlo} simulation in a life cycle inventory of electricity produced by a
waste incinerator. J Clean Prod 2003;11:279–92.
[180] Clemon LM. ENERGY AND EMISSION ESTIMATION UNCERTAINTY IN
FUSED DEPOSITION MODELING FOR A JOB-SHOP. 27th Annu. Int. Solid
Free. Fabr. Symp., Austin, Texas, USA: Laboratory for Freeform Fabrication and
University of Texas at Austin; 2016.
[181] Galvao AB, Sato K. Affordances in Product Architecture: Linking Technical
Functions and Users’ Tasks. Vol. 5a 17th Int. Conf. Des. Theory Methodol., vol.
2005, Long Beach, CA: ASME; 2005, p. 143–53.
[182] Wood KL, Otto KN. Product Design: Techniques in Reverse Engineering and New
Product Development. Upper Saddle River, NJ: Prentice Hall; 2001.
[183] Landis JR, Koch GG. The measurement of observer agreement for categorical
data. Biometrics 1977:159–74.
[184] CES EduPack 2016.
[185] Cerdas F, Juraschek M, Thiede S, Herrmann C. Life Cycle Assessment of 3D
Printed Products in a Distributed Manufacturing System. J Ind Ecol 2017.
[186] Kurti RS, Kurti DL, Fleming L. The Philosophy of Educational Makerspaces Part
1 of Making an Educational Makerspace. Teach Libr 2014;41:8–11.
[187] Xu T, Chen Z, Li J, Yan X. Automatic tool path generation from structuralized
machining process integrated with CAD/CAPP/CAM system. Int J Adv Manuf
Technol 2015;80:1097–111.
[188] Wohlers T. Wohlers report 2016. Wohlers Associates, Inc; 2016.
[189] Wohlers T. Wohlers Report 2017. 2017.

225
[190] Song R, Telenko C. Towards Sustainable Additive Manufacturing in University
Makerspaces. Proc. Constr. 2018 Conf., Atlanta, Georgia, USA: 2018.
[191] Lynn R, Contis D, Hossain M, Huang N, Tucker T, Kurfess T. Voxel model
surface offsetting for computer-aided manufacturing using virtualized high-
performance computing. J Manuf Syst 2017;43:296–304.
[192] Brooke J. SUS-A quick and dirty usability scale. Usability Eval Ind 1996;189:4–7.
[193] Bangor A, Kortum PT, Miller JT. An Empirical Evaluation of the System
Usability Scale. Int J Hum Comput Interact 2008;24:574–94.
[194] Lewis JR, Sauro J. Item benchmarks for the system usability scale. J Usability
Stud 2018;13:158–67.
[195] Sauro J, Lewis JR. Quantifying the user experience: Practical statistics for user
research. Morgan Kaufmann; 2016.
[196] Chi M, Feltovich P, Glaser R. Categorization and Representation of Physics
Problems by Experts. Cogn Sci 1981;5:121–52.