
airports' connective role in megaregions - SMARTech
316
AIRPORTS’ CONNECTIVE ROLE IN MEGAREGIONS A Thesis Presented to The Academic Faculty By Donald Samuel Katz In Partial Fulfillment Of the Requirements for the Degree Master of Science in Civil Engineering Georgia Institute of Technology December, 2010
-
Upload
khangminh22 -
Category
Documents
-
view
3 -
download
0
Transcript of airports' connective role in megaregions - SMARTech
AIRPORTS’ CONNECTIVE ROLE IN MEGAREGIONS
A Thesis
Presented to
The Academic Faculty
By
Donald Samuel Katz
In Partial Fulfillment
Of the Requirements for the Degree
Master of Science in Civil Engineering
Georgia Institute of Technology
December, 2010

AIRPORTS’ CONNECTIVE ROLE IN MEGAREGIONS
Approved by:
Dr. Michael D. Meyer, Advisor
School of Civil and Environmental Engineering
Georgia Institute of Technology
Dr. Laurie Garrow, Advisor
School of Civil and Environmental Engineering
Georgia Institute of Technology
Dr. Frank Southworth
School of Civil and Environmental Engineering
Georgia Institute of Technology
Date Approved: November 14, 2010

iii
ACKNOWLEDGEMENTS
I would like to show my gratitude to the professors at Georgia Tech who have
helped me along the way in preparing my thesis work. Dr. Michael D. Meyer, Dr. Laurie
A. Garrow, and Dr. Frank Southworth aided me in scoping my project based on my
interests, guiding me continually throughout the process, and supporting my endeavor
wholeheartedly.
I would like to thank Dr. Joseph Hummer for his continued encouragement
beyond my graduation from NC State. I would not be where I am today without the
guidance he’s provided through his mentoring.
I am grateful to the America 2050 initiative for their support. It was a pleasure to
work with Petra Todorovich and Yoav Hagler when I first started pursuing the topic of
megaregions; their guidance was invaluable. This thesis would not have been possible
without their aid in providing me data to pursue the topic.
I would most certainly like to thank my father, mother, and sister for being a
strong foundation throughout my education, providing advice and listening to my
concerns. I feel very fortunate to have a family that cheers me on always.
I lastly would like to thank Amy, who has seen me through all the tasks along the
way, and has been patiently supporting my writing. Your encouragement means so much.
This thesis was aided by the support of the National Science Foundation. I am
forever grateful to have received the honor of earning a Graduate Research Fellowship,
which has allowed me the freedom to explore a topic which I have had a long-time
interest in.

iv
TABLE OF CONTENTS
ACKNOWLEDGEMENTS ............................................................................................... iii
LIST OF TABLES ............................................................................................................ vii
LIST OF FIGURES ........................................................................................................... xi
LIST OF ABBREVIATIONS ........................................................................................... xv
SUMMARY ..................................................................................................................... xvi
CHAPTER 1: INTRODUCTION ....................................................................................... 1
1.1 Context and Purpose .................................................................................................. 1
1.2 Research Problem ...................................................................................................... 3
CHAPTER 2: LITERATURE REVIEW ............................................................................ 5
2.1 Megaregions ............................................................................................................... 5
2.1.1 Where and What Are the Megaregions? ............................................................. 6
2.1.2 Implications of Megaregions .............................................................................. 8
2.1.3 Megaregions and Transport .............................................................................. 10
2.2 Status of U.S. Airports ............................................................................................. 12
2.3 Airports and Connectivity: World Cities ................................................................. 13
2.4 Spatial Analysis of Regions and Airports ................................................................ 17
2.4.1 Megaregion Airport Analysis ........................................................................... 18
CHAPTER 3: METHODOLOGY .................................................................................... 21
3.1 Data Sources ............................................................................................................ 21
3.1.1 Origin-Destination Flows .................................................................................. 22
3.1.2 Airport Locations .............................................................................................. 25
3.1.3 Airport Characteristics ...................................................................................... 26
3.1.4 Airlines .............................................................................................................. 26
3.1.5 Airline Hubs ...................................................................................................... 28
3.1.6 Megaregions ...................................................................................................... 29
3.2 Data Processing ........................................................................................................ 34
3.2.1 Managing T-100 Reporting Rule Changes ....................................................... 35
3.2.2 Differences Between Airport and Flow Data Sources ...................................... 36
3.2.3 Missing Airport Error Analysis......................................................................... 37
3.2.4 Airport and Flow Megaregion Assignment ...................................................... 42
3.2.5 Dual-Megaregion Designation .......................................................................... 42
3.2.6 Standardizing Flows .......................................................................................... 43
3.3 Analysis Procedure .................................................................................................. 44
3.3.1 Megaregion Airport Infrastructure .................................................................... 45
3.3.2 Megaregion Air Traffic Volumes ..................................................................... 47
3.3.3 Origin-Destination Megaregion Pairs ............................................................... 47

v
3.3.4 Individual Megaregions: Origin-Destination Flows ......................................... 49
3.3.5 Individual Megaregions: Intramega Flows ....................................................... 49
3.3.6 Non-megaregion Areas and the International Market ...................................... 50
3.3.7 Growth of a Megaregion’s Air Traffic .............................................................. 51
CHAPTER 4: RESULTS .................................................................................................. 53
4.1 Megaregion Airport Infrastructure ........................................................................... 54
4.1.1 Airport Density ................................................................................................. 55
4.1.2 Airports per Capita ............................................................................................ 58
4.1.3 Airports and Economic Production ................................................................... 58
4.1.4 Hub Airports ..................................................................................................... 60
4.1.5 Summary ........................................................................................................... 66
4.2 Megaregion Air Traffic Volumes ............................................................................ 66
4.2.1 Gross Volume of Movements ........................................................................... 67
4.2.2 Movements Standardized by Area .................................................................... 71
4.2.3 Movements Standardized by Population........................................................... 73
4.2.4 Movements Standardized by Economic Production ......................................... 75
4.2.5 Summary ........................................................................................................... 78
4.3 Origin-Destination Megaregion Pairs ...................................................................... 79
4.3.1 Gross Volume of OD Pair Movements ............................................................. 79
4.3.2 OD Pair Movements Standardized by Area ...................................................... 86
4.3.3 OD Pair Movements Standardized by Population ............................................ 91
4.3.4 OD Pair Movements Standardized by Economic Productivity ......................... 95
4.3.5 Summary ........................................................................................................... 99
4.4 Individual Megaregions: Origin-Destination Flows .............................................. 101
4.4.1 Arizona Sun Corridor ...................................................................................... 103
4.4.2 Cascadia .......................................................................................................... 106
4.4.3 Front Range ..................................................................................................... 109
4.4.4 Gulf Coast ....................................................................................................... 112
4.4.5 Midwest ........................................................................................................... 115
4.4.6 Northeast ......................................................................................................... 118
4.4.7 Northern California ......................................................................................... 121
4.4.8 Piedmont ......................................................................................................... 124
4.4.9 Southern California ......................................................................................... 127
4.4.10 Southern Florida ............................................................................................ 130
4.4.11 Texas Triangle .............................................................................................. 132
4.4.12 Summary ....................................................................................................... 135
4.5 Individual Megaregions: Intramega Flows ............................................................ 138
4.5.1 Arizona Sun Corridor ...................................................................................... 142
4.5.2 Cascadia .......................................................................................................... 145
4.5.3 Front Range ..................................................................................................... 148
4.5.4 Gulf Coast ....................................................................................................... 151
4.5.5 Midwest ........................................................................................................... 151
4.5.6 Northeast ......................................................................................................... 157
4.5.7 Northern California ......................................................................................... 160
4.5.8 Piedmont ......................................................................................................... 163
4.5.9 Southern California ......................................................................................... 166

vi
4.5.10 Southern Florida ............................................................................................ 169
4.5.11 Texas Triangle .............................................................................................. 172
4.5.12 Summary ....................................................................................................... 175
4.6 Non-megaregion Areas and the International Market ........................................... 178
4.6.1 Non-megaregion Areas ................................................................................... 179
4.6.2 International Market ........................................................................................ 183
4.6.3 Summary ......................................................................................................... 185
4.7 Growth of Megaregion Air Traffic ........................................................................ 185
4.7.1 Passenger Traffic ............................................................................................ 186
4.7.2 Freight Traffic ................................................................................................. 190
4.7.3 Intramega Traffic Growth: Case Study on Piedmont Megaregion ................. 194
4.7.4 Summary ......................................................................................................... 198
CHAPTER 5: CONCLUSIONS ..................................................................................... 200
5.1 Key Findings .......................................................................................................... 200
5.2 Future Directions ................................................................................................... 204
APPENDIX A: STUDY AIRPORTS ............................................................................. 207
APPENDIX B: MEGAREGION FLOW TABLES ........................................................ 243
APPENDIX C: MEGREGION SPECIFIC FLOWS ...................................................... 256
REFERENCES ............................................................................................................... 296
vii
LIST OF TABLES
Table 3.1 Attributes from T-100 Domestic Data ......................................................... 23
Table 3.2 Additional Attributes from T-100 International Data .................................. 24
Table 3.3 Top 15 Passenger Airlines by Volume, 1990-2008 ..................................... 27
Table 3.4 Freight Airlines by Volume, 1990-2008 ...................................................... 28
Table 3.5 America 2050 Megaregion Statistics ........................................................... 34
Table 4.1 Megaregion Airports by Area and Population ............................................. 56
Table 4.2 Megaregion Airports and Economic Production.......................................... 59
Table 4.3 Megaregion FAA Airport Hubs ................................................................... 61
Table 4.4 Megaregion Airline Hubs Gross .................................................................. 63
Table 4.5 Megaregion Passenger Traffic ..................................................................... 68
Table 4.6 Gross Megaregion Freight Movements ........................................................ 69
Table 4.7 Megaregion Passenger Traffic by Land Area .............................................. 71
Table 4.8 Megaregion Freight Movements by Land Area ........................................... 73
Table 4.9 Megaregion Passenger Traffic by Population .............................................. 74
Table 4.10 Megaregion Freight Movements by Population ........................................... 75
Table 4.11 Megaregion Passenger Traffic by Economic Productivity .......................... 76
Table 4.12 Megaregion Freight Movements by Economic Productivity ....................... 77
Table 4.13 Top 20 Megaregion Passenger Flow Pairs ................................................... 81
Table 4.14 Top 20 Megaregion Freight Flow Pairs ....................................................... 84
Table 4.15 Top 20 Megaregion Passenger Flow Pairs by Area ..................................... 88
Table 4.16 Top 20 Megaregion Freight Flow Pairs by Area ......................................... 90
viii
Table 4.17 Top 20 Megaregion Passenger Flow Pairs by Population ........................... 92
Table 4.18 Top 20 Megaregion Freight Flow Pairs by Population ................................ 94
Table 4.19 Top 20 Megaregion Passenger Flow Pairs by Economic Productivity ........ 96
Table 4.20 Top 20 Megaregion Freight Flow Pairs by Economic Productivity ............ 98
Table 4.21 Intramega Passenger Flow Summary ......................................................... 139
Table 4.22 Intramega Freight Flow Summary ............................................................. 140
Table A.1 Airports in T-100 Database Used in Study ................................................ 207
Table A.2 U.S. Airline Hubs ....................................................................................... 241
Table B.1 OD Passenger Flows .................................................................................. 244
Table B.2 Combined OD Passenger Flows ................................................................ 245
Table B.3 OD Freight Flows ....................................................................................... 246
Table B.4 Combined OD Freight Flows ..................................................................... 247
Table B.5 Combined OD Passenger Flows by Area ................................................... 248
Table B.6 Combined OD Passenger Flows by Population ......................................... 249
Table B.7 Combined OD Passenger Flows by Economic Productivity ..................... 250
Table B.8 Combined OD Freight Flows by Area ....................................................... 251
Table B.9 Combined OD Freight Flows by Population .............................................. 252
Table B.10 Combined OD Freight Flows by Economic Productivity .......................... 253
Table B.11 Passenger Growth Over Time .................................................................... 254
Table B.12 Freight Growth Over Time......................................................................... 255
Table C.1 Arizona Sun Corridor Passenger Flows ..................................................... 257
Table C.2 Arizona Sun Corridor Freight Flows ......................................................... 258
Table C.3 Cascadia Passenger Flows ......................................................................... 260
ix
Table C.4 Cascadia Freight Flows .............................................................................. 261
Table C.5 Front Range Passenger Flows .................................................................... 263
Table C.6 Front Range Freight Flows ........................................................................ 264
Table C.7 Gulf Coast Passenger Flows....................................................................... 266
Table C.8 Gulf Coast Freight Flows ........................................................................... 267
Table C.9 Midwest Passenger Flows .......................................................................... 269
Table C.10 Midwest Freight Flows .............................................................................. 270
Table C.11 Northeast Passenger Flows ........................................................................ 272
Table C.12 Northeast Freight Flows ............................................................................. 273
Table C.13 Northern California Passenger Flows ........................................................ 275
Table C.14 Northern California Freight Flows ............................................................. 276
Table C.15 Piedmont Passenger Flows ......................................................................... 278
Table C.16 Piedmont Freight Flows ............................................................................. 279
Table C.17 Southern California Passenger Flows ........................................................ 281
Table C.18 Southern California Freight Flows ............................................................. 282
Table C.19 Southern Florida Passenger Flows ............................................................. 284
Table C.20 Southern Florida Freight Flows ................................................................. 285
Table C.21 Texas Triangle Passenger Flows ................................................................ 287
Table C.22 Texas Triangle Freight Flows .................................................................... 288
Table C.23 Non-megaregion Areas Passenger Flows................................................... 290
Table C.24 Non-megaregion Areas Freight Flows ....................................................... 291
Table C.25 International Passenger Flows.................................................................... 292
Table C.26 International Freight Flows ........................................................................ 293

x
Table C.27 Piedmont Passenger Growth Over Time .................................................... 294
Table C.28 Piedmont Freight Growth Over Time ........................................................ 295

xi
LIST OF FIGURES
Figure 3.1 U.S. Megaregions Used in Study from America 2050 ................................. 33
Figure 4.1 Continental U.S. Airports (T-100 Dataset) .................................................. 57
Figure 4.2 Continental U.S. Airline Hubs for Passenger and Freight ........................... 64
Figure 4.3 Gross Volume of Intermegaregional Passenger Movements ....................... 83
Figure 4.4 Gross Volume of Intermegaregional Freight Movements Movements ........ 87
Figure 4.5 Arizona Sun Corridor Passenger Flows ..................................................... 105
Figure 4.6 Arizona Sun Corridor Freight Flows .......................................................... 107
Figure 4.7 Cascadia Passenger Flows .......................................................................... 108
Figure 4.8 Cascadia Freight Flows .............................................................................. 107
Figure 4.9 Front Range Passenger Flows .................................................................... 110
Figure 4.10 Front Range Freight Flows ......................................................................... 111
Figure 4.11 Gulf Coast Passenger Flows ....................................................................... 113
Figure 4.12 Gulf Coast Freight Flows ........................................................................... 114
Figure 4.13 Midwest Passenger Flows .......................................................................... 116
Figure 4.14 Midwest Freight Flows .............................................................................. 117
Figure 4.15 Northeast Passenger Flows ........................................................................ 119
Figure 4.16 Northeast Freight Flows ............................................................................. 120
Figure 4.17 Northern California Passenger Flows ........................................................ 122
Figure 4.18 Northern California Freight Flows ............................................................. 123
Figure 4.19 Piedmont Passenger Flows ......................................................................... 125
Figure 4.20 Piedmont Freight Flows ............................................................................. 126

xii
Figure 4.21 Southern California Passenger Flows ........................................................ 127
Figure 4.22 Southern California Freight Flows ............................................................. 129
Figure 4.23 Southern Florida Passenger Flows ............................................................. 130
Figure 4.24 Southern Florida Freight Flows ................................................................. 132
Figure 4.25 Texas Triangle Passenger Flows ................................................................ 133
Figure 4.26 Texas Triangle Freight Flows .................................................................... 134
Figure 4.27 Arizona Sun Corridor Intramega Passenger Flows .................................... 143
Figure 4.28 Arizona Sun Corridor Intramega Freight Flows ........................................ 144
Figure 4.29 Cascadia Intramega Passenger Flows ........................................................ 146
Figure 4.30 Cascadia Intramega Freight Flows ............................................................. 147
Figure 4.31 Front Range Intramega Passenger Flows ................................................... 149
Figure 4.32 Front Range Intramega Freight Flows ....................................................... 150
Figure 4.33 Gulf Coast Intramega Passenger Flows ..................................................... 152
Figure 4.34 Gulf Coast Intramega Freight Flows .......................................................... 153
Figure 4.35 Midwest Intramega Passenger Flows ......................................................... 154
Figure 4.36 Midwest Intramega Freight Flows ............................................................. 155
Figure 4.37 Northeast Intramega Passenger Flows ....................................................... 158
Figure 4.38 Northeast Intramega Freight Flows ............................................................ 159
Figure 4.39 Northern California Intramega Passenger Flows ....................................... 161
Figure 4.40 Northern California Intramega Freight Flows ............................................ 162
Figure 4.41 Piedmont Intramega Passenger Flows ....................................................... 164
Figure 4.42 Piedmont Intramega Freight Flows ............................................................ 165
Figure 4.43 Southern California Intramega Passenger Flows ....................................... 167

xiii
Figure 4.44 Southern California Intramega Freight Flows ............................................ 168
Figure 4.45 Southern Florida Intramega Passenger Flows ............................................ 170
Figure 4.46 Southern Florida Intramega Freight Flows ................................................ 171
Figure 4.47 Texas Triangle Intramega Passenger Flows ............................................... 173
Figure 4.48 Texas Triangle Intramega Freight Flows ................................................... 174
Figure 4.49 Non-megaregion Passenger Flows ............................................................. 180
Figure 4.50 Non-megaregion Freight Flows ................................................................. 182
Figure 4.51 International Passenger Flows .................................................................... 183
Figure 4.52 International Freight Flows ........................................................................ 184
Figure 4.53 Passenger Air Travel Growth ..................................................................... 187
Figure 4.54 Relative Passenger Air Travel Growth ...................................................... 188
Figure 4.55 Intramega Passenger Air Travel Growth .................................................... 189
Figure 4.56 Freight Air Travel Growth ......................................................................... 191
Figure 4.57 Relative Freight Air Travel Growth ........................................................... 192
Figure 4.58 Intramega Freight Air Travel Growth ........................................................ 193
Figure 4.59 Piedmont Passenger Air Travel Growth .................................................... 195
Figure 4.60 Piedmont Relative Passenger Air Travel Growth ...................................... 195
Figure 4.61 Piedmont Freight Air Travel Growth ......................................................... 197
Figure 4.62 Piedmont Relative Freight Air Travel Growth ........................................... 198
Figure C.1 Arizona Sun Corridor Megaregion Airports (T-100 Dataset) .................... 259
Figure C.2 Cascadia Megaregion Airports (T-100 Dataset) ........................................ 262
Figure C.3 Front Range Megaregion Airports (T-100 Dataset) ................................... 265
Figure C.4 Gulf Coast Megaregion Airports (T-100 Dataset) ..................................... 268

xiv
Figure C.5 Midwest Megaregion Airports (T-100 Dataset) ......................................... 271
Figure C.6 Northeast Megaregion Airports (T-100 Dataset) ....................................... 274
Figure C.7 Northern California Megaregion Airports (T-100 Dataset) ....................... 277
Figure C.8 Piedmont Megaregion Airports (T-100 Dataset) ....................................... 280
Figure C.9 Southern California Megaregion Airports (T-100 Dataset) ....................... 283
Figure C.10 Southern Florida Megaregion Airports (T-100 Dataset) ............................ 286
Figure C.11 Texas Triangle Megaregion Airports (T-100 Dataset) ............................... 289

xv
LIST OF ABBREVIATIONS
BTS Bureau of Transportation Statistics
CQGRD Center for Quality Growth and Regional Development
DOT Department of Transportation
FAA Federal Aviation Administration
GDP Gross Domestic Product
GMP Gross Megaregion Product
GIS Geographic Information System
IATA International Air Transport Association
OAG Official Airline Guide
NORTAD North American Transportation Atlas Data
NPIAS National Plan of Integrated Airport Systems
NTAD National Transportation Atlas Database
RITA Research and Innovative Technology Administration
VBA Visual Basic
Megaregion Abbreviations
AZ Arizona Sun Corridor
Casc Cascadia
FR Front Range
Gulf Gulf Coast
Mid Midwest
NE Northeast
NCal Northern California
Pied Piedmont
SCal Southern California
SFl Southern Florida
TX Texas Triangle
N-M Non-megaregion Areas

xvi
SUMMARY
The megaregion spatial form has grown in prominence in recent years in planning
thought. Using the models developed over the last decade, megaregions have been
primarily used in discussions addressing freight movements and high-speed rail. The
relationships between megaregions and the aviation sector is rather untouched in
research. The purpose of this study is to examine the role airports play as transportation
hubs for megaregions, and how the megaregions are connected through air traffic
Comparing the megaregions involved an empirical study using attribute data
about the megaregions and the flows between them. All the U.S. airports were located
within a megaregion if applicable, and were labeled as a non-megaregion area airport
otherwise. The infrastructure in the megaregions was compared by density and type of
airports, including an examination into airline hubs. The connectivity between
megaregions, non-megaregion areas, and the international market was analyzed
employing T-100 data, separating the analysis for the passenger and freight sectors. The
top flows in the country were examined, along with the relationships each megaregion
has individually. Particular attention was paid to the flows within a megaregion, noting
which airports play the strongest roles.
Megaregions are much more active in air travel than non-megaregion areas due
likely to a larger presence of airline hubs and greater infrastructure. The international
component of the passenger and freight sectors is growing the fastest in relation to
megaregions, but only for the freight sector is this the largest component. The largest
component of the passenger sector is the flows between megaregions. Flows within

xvii
megaregions for the passenger sector are growing slowly and are declining in the freight
sector, but short-haul air traffic continues to be the cause of congestion. The flows
between airports in the megaregion are identified as being one of four different spatial
networks. The megaregion is a suitable level to manage infrastructure investment to better
prepare the regions for the coming growth. A megaregion-level institution is best suited
to managing the issues which must be faced by the numerous jurisdictions and entities
which are involved in the aviation industry of a megaregion.
1
CHAPTER 1
INTRODUCTION
Megaregions are a recent means of describing the urban development patterns that are
occurring worldwide. These entities are a collection of metropolitan regions that have
seemingly blended together; but more, they have interrelated cultures, industry, transport,
and natural resources that provide connectivity and help to fuel economic growth. This
large scale development pattern is exemplified across the United States, often spanning
several hundred miles. At such a large scale, the transportation system that provides
mobility for the region must be able to provide for the connections the residents and
businesses of the megaregion will desire to make. Airports play a large part in providing
connectivity within megaregions, but also link the megaregion’s population and
businesses to the rest of the country and around the world.
1.1 Context and Purpose
Emerging planning thought views megaregions as collections of metropolitan areas
connected through economic, physical and environmental interaction (Ross, 2009). The
physical interaction is facilitated by the transportation system, including the
megaregion’s road, rail, ports, and air networks. As an evolving concept, it is important
to understand how the flow of people and goods within and between megaregions
contributes to the economic health, stability, and growth of the region and the nation.
Airports provide critical intra- and inter-megaregional linkages, while linking
megaregions to non-megaregion and international markets. The connective traffic

2
airplanes provide is only going to increase, and quite rapidly, enforcing the importance of
understanding the characteristics of these connections now. Boeing (Crabtree, Hoang,
Edgar, & Heinicke, 2008) and Airbus (Airbus, 2007) predict that both air cargo and
passengers will more than triple during the next 20 years. This growth will need “to be
accommodated … through the strengthening of existing city pairs, primarily between
major centers of population” (Airbus, 2007). Capturing this growth in these hubs of
activity, though, will require having capacity in the precise places where airports are
currently the most congested (Tomer & Puentes, 2009). Having a strong focus on
developing the world’s largest airports can provide connectivity for passenger and freight
traffic, while aiding the economic growth of a city. The National Academy of
Engineering, however, is concerned about the fact that “we continue to design for one
airport in a region, rather than dealing with all of the airports in the region at once” (de
Neufville, 2008).
The purpose of this study is to examine the role airports play as transportation
hubs for megaregions. The U.S. Department of Transportation sees megaregions as
“places that operate - and thrive - at the center of a new economic and planning
geography, one in which high value is placed on networks and on building attractive and
healthy urban areas (Ross, 2008).” Under this definition, airports in megaregions must be
understood as a network, and the geography of airport flows between megaregions must
be seen in the context of the national system of economic ties. It is unknown whether the
existence of a megaregion ultimately makes network connections within it stronger, or
solely if a megaregion is identifiable by the transportation network which gives it
structure. It is also unclear as to what degree megaregions and the airports within are a

3
component of the national system. Air travel may or may not be representative of growth
in megaregions, but travel patterns can be analyzed to see if they validate megaregion
theory.
1.2 Research Problem
Ultimately, air facilities will face increased pressure to meet the challenge of a global
economy that requires good connections. The inability of a megaregion’s airports to serve
such a function may result in a competitive disadvantage. Despite their importance,
airports have had minor roles in megaregional studies and their effects need attention.
Thus, there is a research need to examine the comparative size of the U.S. megaregions’
airport systems, analyze the connectivity different megaregions have with each other
through air travel, understand if and how the competitive position of megaregions have
evolved over time, and determine the effect of airlines and international connections have
had on the ability of different megaregions in the U.S. to compete successfully in the
worldwide economy.
There is currently no broad understanding of the role of aviation in the
megaregion theory. Unlike rail and automotive networks which have received attention
from various megaregion geographers, the air system has been largely neglected. This
sector is important for study because it not only affects the internal movements of a
megaregion, but also the movements of people and freight between megaregions. These
longer-distance connections are generally only considered on an airport or metropolitan
level. To date the role of airports in the economic markets of megaregions has not been
thoroughly studied.
This study is different in that megaregions are the geographical unit being

4
analyzed in terms of air flows. One of the goals is to understand how well each of the
eleven megaregions in the U.S. is handling its capacity needs to take advantage of
expected growth in air travel. An inability of a megaregion’s airports to serve such a
function may result in a competitive disadvantage. By analyzing historic air passenger
and cargo freight movements over the last two decades (representing a wide range of
market conditions), it is possible to display the growth of connections between cities in
the same megaregion and between other national megaregions.
Megaregions are a new topic, and it is not fully explored how travel operates
within and between them. Exploring how air travel is a model for intra-megaregional
connectivity will aid in understanding how people in a megaregion travel, and can
provide insight into other connecting modal systems. Overall, the study’s results will be
an aid to help regions plan for all their air facilities as a whole, instead of independently.

5
CHAPTER 2
LITERATURE REVIEW
Megaregion theory is just beginning to be incorporated and applied into system analyses.
Regional planners are working to not only delineate where megaregions exist in the U.S.
and worldwide, but also are attempting to understand how the various systems within
megaregions can be comprehended. Due to the relative newness of the megaregion
concept, the role airports play within and between megaregions is yet to be fully
understood. Studying this topic requires a background on megaregion theory, the U.S.
airport system, and where the aviation field currently is in its application of megaregions.
2.1 Megaregions
The first mention of the megaregion was in reference to the Boston to Washington
corridor in the northeastern U.S. in 1957 (J. Gottmann, 1957). Jean Gottman, a French
geographer, makes note of how the cities in the Northeast have seemingly blended the
boundaries of their social and economic networks, creating a large urban pattern
stretching along the coast. Terming it a “megalopolis” in his book a few years later (Jean
Gottmann, 1961) he begins to lay out criteria as to how this regional form can be defined.
These remarks helped steer modern day geographers as they began to delineate the U.S.
megaregions.
Today, the volume of research on megaregions is rapidly growing. Recently, the
United Nations has noticed this trend, remarking that “cities are merging together to
create urban settlements on a massive scale” (Moreno, Oyeyinka, & Mboup, 2010).
6
Worldwide, megaregions are blending city boundaries, what the U.N. (2010) terms as
natural economic units, and will be the most impactful on the way people live and
economies flourish. Domestically, efforts at education institutions and planning
organizations have begun to study megaregions through formal research and discussion
forums. In the past couple of years, the first book on megaregions (Ross, 2009) was
published to collect in one place the variety of thoughts and discussions on megaregion
theory.
2.1.1 Where and What Are the Megaregions?
There has been much debate over where the U.S. megaregions are and what models
should be used to define them. The discussion is arising from numerous centers of
research across the country. Some attempts are aimed at producing a unified national
model. In addition, universities and planning organizations within many of the
megaregions have sought out their own analysis on the megaregion in which they are
located.
2.1.1.1 National Megaregion Studies
The study which brought discussion of the national megaregions into the spotlight came
out of the Metropolitan Institute at Virginia Tech (Lang & Dhavale, 2005), using the term
“megapolitan” in reference to the smaller geographical entity of the metropolitan area.
Using the county as the smallest component of their study, megaregions were defined by
projected populations, number of cities, a shared cultural identity, transportation
networks, geography, and metro- and micropolitan continuity. The study also attached

7
names to the megaregions, ten identified at the time, using regional terminology for how
the local and national population referred to each specific collection of cities.
America 2050, an offshoot of the Regional Plan Association, began focusing on
megaregions as their basis for what was felt to be the next important geographical unit
that planners would work at in the coming decades. Using five criteria to identify the
megaregions (environment, transportation infrastructure, economic linkages, patterns of
development, and cultural identity), the organization laid out ten megaregions, later to
become eleven, which stood out in the national landscape as centers where the strongest
economic production occurred (America 2050, 2006). The aim of the ongoing project is
to coordinate goals in infrastructure and cooperate over environmental and development
issues.
More recently, the Center for Quality Growth and Regional Development
identified a set of megaregions based strongly on the freight networks between
metropolitan centers (Ross, Woo, Barringer, West, & Doyle, 2008). Emphasizing the
relationship between core areas and the areas of influence surrounding them, a process is
developed that uses regional characteristics to work out the precise geographic area of
each megaregion. The resulting megaregion map consists of ten megaregions, and breaks
the historical concept of the megaregion by splitting into two parts Gottman’s original
megalopolis.
2.1.1.2 Megaregion-specific Models
Many efforts have been made on a megaregion-by-megaregion basis to further
understand how the theory can be applied to local conditions. The first of these studies
was done on the Northeast corridor, a new look at Gottman’s megalopolis (University of

8
Pennsylvania School of Design, 2005). The work from this studio was the spark, in fact,
to start America 2050.
Since then, studies in various university planning studios and research institutes
have occurred for the Piedmont megaregion (Contant et al., 2005), the Midwest
megaregion (Delgado et al., 2006), the Texas Triangle (Butler, Hammerschmidt, Steiner,
& Zhang, 2009), and Cascadia (Seltzer et al., 2005). In addition, planning policy
organizations have performed studies in Northern California (San Francisco Planning
And Urban Research Association, 2010) and Southern California (Kern County Council
of Governments, 2005).
These various studies have all taken their own spin on their own megaregion,
focusing often on a single aspect of the megaregion, such as transportation, the
environment, or economic goals. Many of the studies are integrated with America 2050
through outreach efforts, or have focused on the America 2050 as their foundation for
study.
2.1.2 Implications of Megaregions
With the wide variety of studies ongoing to identify megaregions, there have been efforts
to consolidate the existing knowledge into a workable theory. The U.S. Department of
Transportation (Ross, 2008) examined the history of megaregion theory and drew
conclusions about what the variety of studies had used as identification criteria, and how
this could be combined into a universal megaregion model. Ross’s book on megaregions
(2009) collected ideas from researchers in the U.S. and abroad on the implications of
megaregions on the environment, transportation, politics, and the economy.

9
One of the key issues surrounding megaregions is that this new spatial form will
overtake the metropolitan area in the way we picture our world. The extended networks
of the megaregion encompass the greater share of the nation’s population and are the
areas where growth is occurring the quickest (America 2050, 2006). It is argued that the
megaregions will become the recognizable gateways to nations, and will be how we
organize our infrastructure planning efforts (America 2050, 2008). The reason behind this
line of thinking is that the challenges that the world faces do not pay attention to
boundaries, and sustainable planning will require working around the forms that have
grown organically (Dewar and Epstein 2007).
The megaregion has certainly found respect on the worldwide stage. Just like
metropolitan areas are the components of a nation’s economy, so thus is the megaregion
operating similarly on the worldwide scale. “National borders no longer define
economies. Instead the mega-region has emerged as the ‘natural’ economic unit”
(Florida, Gulden, & Mellander, 2007). The extended networks that define megaregions,
reaching out from the city cores, make them powerful agglomerations. This contiguous
development is an indication that there is integration of all the components economically
within the megaregion. It is believed that the megaregion will redefine the world’s trade
systems over the course of the next century (America 2050, 2006). As described by Ross
et. al (2008), their prime purpose on the worldwide stage is to conduct international trade
and integrate in global economic markets. The possibility of the megaregion as a
financially viable power is reason enough to identify and understand them.
The large size of megaregions will require organization systems that have only
begun to be created. There is a need to create underlying institutional structures that are
10
able to manage policy issues in order to provide functional integration to all the parts of
the megaregion (Teitz and Barbour 2007). The implication of the existence of the
megaregion form is that metropolitan planning organizations and government councils
will need to work together to address the issues of the growth spilling over boundaries.
According to Dewar and Epstein (2007), the reason to have such planning organizations
and methods at the megaregion level is to remain competitive on an international scale.
The authors indicate that Europe and China are already planning for megaregions. It is of
utmost importance that cities are able to look at problems beyond the scope of the city
border. Issues like freight and the environment will need an authority to aid in
articulating the issues to all involved parties.
2.1.3 Megaregions and Transport
Transportation is a key issue in megaregions, with much of the focus geared today
towards high-speed rail (HSR). America 2050 has had a focus on HSR for the past five
years, aiming to stimulate a national discussion on creating an infrastructure plan with
HSR as a key component. The efforts have resulted in a system of evaluating corridors
across the country, with a focus on the megaregions (Hagler & Todorovich, 2009), using
city pairs as a basis for the analysis. The discussion surrounding megaregions and HSR
has likely done the most to raise the profile of megaregions to the national level
conversations. There is agreement that HSR is a prime megaregion issue, as the spatial
spread of the megaregion is at the optimal distance for HSR to be constructed (Hagler &
Todorovich, 2009; Ross, Woo, Barringer, West, & Doyle, 2008; Taylor & Yaro, 2010).
There have been numerous studies done on HSR in the U.S., with the federal government

11
just now funding new systems. Using the Northeast Corridor as an example, Taylor and
Yaro (2010, p.14) describe the necessity of a megaregional government institution that
would manage HSR plans and ideas, with the authors providing a conceptual framework
for how such an organization would be governed.
Highway systems have also received plenty of focus in the discussion of
megaregions and their growing transport issues. Megaregions continue to attract the
country’s populace and businesses, and will universally struggle with providing internal
mobility along their road networks (Ross, Woo, Barringer, West, & Doyle, 2008). There
will need to be investment in the highway systems to meet the increased demand.
Airport systems in megaregions have received minimal attention in the majority
of megaregion discussions. The needs and expectations of travelers going long distances
in general are not well analyzed, as there is no public agency tasked with addressing
travel preferences or accessibility to long distance markets (Coogan et al., 2010). Within
the U.S., there have been regional aviation institutions that could potentially be models
for future megaregional aviation system planning. The New England Regional Airport
System Plan is the largest and most likely form of a megaregion aviation plan, as it
crosses multiple jurisdictional boundaries. The Bay Area’s plan in California is at a
smaller scale, although it makes up a large portion of the Northern California
megaregion. Its issues are less cross-jurisdictional but still require great coordination. The
plan surrounding the Washington, D.C. area in addition could be a model for future
megaregional planning, as many cities and two states are involved in the planning
process.
12
2.2 Status of U.S. Airports
The U.S. airport system is the most active in the world. The combination of a nation with
a large geographic expanse and a mobile wealthy population has resulted in the U.S.
airports being some of the most heavily used in the world (Airports Council International,
2010). Five of the top ten airports in the world by passenger volume are in U.S. cities:
Atlanta, Chicago (ORD), Los Angeles, Dallas, and Denver. Its freight airports are also
some of the world’s largest, with three in the top ten: Memphis, Anchorage, and
Louisville. Because the U.S. system is already well developed, its growth is not as rapid
as that occurring in nations with burgeoning airport networks such as China and Brazil.
One of the key issues in the national collection of airports is capacity. More than
ever the airports in the U.S. are limited in their ability to provide for passengers and
freight by the capacity of their runways, terminals, and access systems. The Federal
Aviation Administration’s (FAA) FACT-2 study (2007) reported that in 2007 four
airports and one metropolitan area were restricted by capacity. These numbers skyrocket
by 2025 as the desire to move and ship by air increases. The airport system is not
prepared for such growth, and it is suggested that new runways and new commercial
airports get constructed, backed by regional studies performed to understand how to
prepare for the growth (Federal Aviation Administration, 2007). The FACT-2 study
provides specific criteria on how to choose the airports that most need additional
capacity, and describes simulation models that can be used in estimating the future
demand. Looking elsewhere may not provide solutions; the U.S. air system already
approaches capacity needs in a liberal fashion, as compared to Europe, and policies allow
airports to make maximum use of their runways (Odoni & Morisset, 2010). It is clear
13
with the growth to be seen, the future of the U.S. system is at risk if capacity needs are
not met.
The issue of national airspace capacity is primarily focused on the primary hub
airports. Nearly all of the U.S. passengers arrive or depart from one of the airports in 26
metropolitan areas. Due to the consolidated nature of airports, with passengers and freight
coming through key hubs, the success of the country depends on the success of these few
metropolitan airports (Tomer & Puentes, 2009). Due to limited options for traveling even
moderate distances there is a large sector of the U.S. airline industry which focuses on
short-haul flights. This type of traffic unnecessarily congests the airports and the airspace,
an inefficient use of the limited capacity. Using the top 100 metropolitan areas as a study
set, Tomer and Puentes (2009) methodically determine the trends in the national system.
Their results lead them to conclude that the current U.S. policy is out of sync with the
source of most passengers – the largest metropolitan areas – and not enough funding goes
to these airports. It was seen that passengers bypassed smaller regional airports to drive to
large hubs, and thus the demand is coming from across larger areas. One of the
recommendations Tomer and Puentes (2009) put forward is the complete privatization of
airports, with congestion pricing for peak periods.
2.3 Airports and Connectivity: World Cities
Between megaregions, information must pass for business and socialization to occur. In
the 21st century, information exchange occurs through electronic communication modes,
such as the internet, and through the movement of people between places. On a national
and global scale, this latter exchange is primarily achieved by air travel. A significant

14
field of research on world cities has focused on the importance of airport flows as a
measure of world connectivity. The topic of world cities was made famous by Saskia
Sassen, whose seminal book changed the field to focus on advanced producer service
firms who made use of the cities with strong knowledge industry sectors (Sassen, 1991).
The concept of a world city expresses a form where cities reach beyond their local sphere
of influence, and interactions occur on a worldwide scale between the most prominent
urban centers on the planet. The concepts in this area of study are not far removed from
megaregion theory, where interactions are perceived to occur on a larger scale. The tenets
of world cities and the concepts of using air flows to measure their interaction is a model
for studying megaregion interaction.
The network of world cities is formed by the connections these service
agglomerations have with each other across the globe. To be a world city, thus, a city
needs a strong knowledge economy that can ensure participation in the network of
information and people flows. The primary cities of megaregions often are these world
cities. The high concentration of the knowledge workforce in these cities and surrounding
regions causes increased interaction and transfer of knowledge, an advantageous resource
for industries looking to reduce the cost of searching for and using skilled high-tech labor
(van Geenhuizen & Doornbos, 2008). For knowledge workers to reach their full
potential, however, they require access to other knowledge centers around the world.
Facilitating this need are international airports, where knowledge workers are able to
travel to visit other knowledge industries, interact with each other in transit, and attend
conferences near airports. Business firms have already recognized the importance of
being near a busy hub airport, given a strong correlation between professional

15
employment in a metropolitan area and the number of flights per day at the airport (Fik,
Ivy, & Malecki, 1995). It has been shown statistically that the causal factor in this
relationship is the airport (Button & Lall, 1999), with the volume of traffic leading to
increased number of jobs in the knowledge sector, particularly high-technology
businesses. Access to the airport thus ends up being a large influencing factor in being
able to participate in the world city network (van Geenhuizen & Doornbos, 2008).
With the importance of the airport established, the manner of examining world
cities is done through measuring the air passenger flows between the world city network
as a surrogate measure of connectivity. Keeling’s (1995) study was the first to recognize
that the importance of a city could be evaluated by its airport infrastructure,
acknowledging that face-to-face communication is still necessary for the knowledge
economy and airports are the manifestation of the interface between cities. This approach
of using infrastructure, particularly airports, to conduct empirical research on the topic
“recognizes that well-connected cities are typified by the presence of vast enabling
infrastructures” (Derudder and Witlox 2008, p. 307). Under this assumption, the most
important world cities would have the world’s most important airports, a testable
hypothesis using already collected airline data.
Determining how to measure the importance of a world city through an analysis
of its airport has been a contested issue (Derudder and Witlox 2005, 2008). To judge a
city’s connectivity, air flows between world airports is necessary. Some issues arise
though when using most data sources. First, most airport flow data comes in the form of
segment data, as opposed to market data, a problem in an age of hub-and-spoke networks
in the airline industry. The trend has been to report the former, mostly due to ease of
16
collecting, causing an uptick in many analyses for airports that serve as airline hubs
(Derudder and Witlox 2005). In addition, sources of worldwide data flows focus on
international flows only, and flows internal to a nation are disregarded. This results in a
negligence to properly attribute importance to two world cities in the same country
(Derudder and Witlox 2008), such as flows from Shanghai to Beijing. Derudder and
Witlox (2008) also point out that airport flows do not solely capture the importance of the
world city knowledge network, but encompass many types of traffic, notably tourism.
High passenger flows to Las Vegas therefore may insinuate world city status, but the true
nature of its prominence is likely not its knowledge network connection, but instead
reflects its role as a tourist destination.
Using flows between cities, once an acceptable database has been constructed,
geographers have created lists of world cities that show connections as well as
importance. Demonstrating connectivity, Derudder and Witlox (2005) compile a list of
the world’s most important economic cities and the flows between them. They rank the
cities by the number of passengers traveling in a given time period and make note of the
pairs of cities which have the largest volumes of flows. This attribute comparison allows
them to pick out which cities are most connected on the worldwide network, and thus
which are the top world cities. This also can include a precursor regional component that
helps in establishing connections amongst less prominent world cities that dominate a
cluster (Smith and Timberlake 1998; Witlox et al. 2004). A clique analysis further helps
define these connections to draw out hierarchal tendencies (Shin & Timberlake, 2000). In
another method, cluster analyses using various centrality measures allowed for both a
hierarchy and network display of the world cities (Choi, Barnett, & Chon, 2006).
17
Incorporating time into the analysis by looking at the flows between world cities over a
number of years allows a further understanding into how world cities have changed in
prominence due to historic events and growth (Smith and Timberlake 2001, 2002).
The use of airline data to support world city connectivity is a viable concept to be
applied to other larger scale spatial analyses. Megaregions lend themselves to this due to
the nature of industries that are found in the cities of megaregions and the need to
understand what connections exist between them.
2.4 Spatial Analysis of Regions and Airports
Looking at airports spatially has been done on numerous levels. Regional, national, and
worldwide studies have all been performed, using various spatial constructs as the
fundamental unit of analysis. As exemplified in the previous section, analysis of world
cities is just one area in which the analysis of how airports relate to each other, as the
ports of flows for their respective cities, is receiving attention. The megaregion, though,
has only just begun to be understood spatially in terms of airports.
Metropolitan area analyses of spatial airport relationships are commonly
performed. Using the metropolitan area as a spatial unit is popular due to its well
understood nature in the literature of geographers, and the broad amount of data which is
available for measuring the space. Being able to relate details such as employment
growth due to the linkages coming out of an airport are possible due to data availability,
and allow for conclusions on which cities are poised for capturing international job
growth and have international network integration (Irwin & Kasarda, 1991). Metropolitan
area airport analyses have also been done over time, examining where growth has

18
occurred and reasoning how population and employment growth can be attributed to the
data attached to the airport (Goetz, 1992).
A higher organization level of space has also been attempted, focusing on the
state, as a way to better understand regional patterns (Bhadra & Wells, 2005). The
attempt is to detach the analysis from the influence of individual cities, and understand
better how the air flows are affected by their origin and destination as it relates to position
in the country. At these larger scales, it is also possible to have flows within the spatial
area, and Bhadra and Wells (2005) find a relationship between state size and intrastate
travel. It is their conclusion that size alone does not mean heavy intrastate travel will
occur, but it is a necessary condition. The study also found that the location of a state
within the nation influenced its travel patterns, with being located along the coast having
a positive effect on air travel. The authors debate whether states and local jurisdictions
should compete actively to garner increased airline services, but warn that the attributes
of a spatial area will limit the impact of infrastructural investments. For example, airline
hubs can only function well in cities that already have sufficient size in population and
economic production to support hubbing activities, as there is an agglomeration effect
from the city with such an endeavor.
2.4.1 Megaregion Airport Analysis
Megaregion level airport analyses have not been performed on a nationwide scale,
but there has been some attention given to how airports function within the most
capacity-starved megaregions. ACRP Report 31 focuses on the airport systems of the
19
Northeast and the two California megaregions, referring to them as the East and West
coast study areas, respectively (Coogan et al., 2010).
The analysis on megaregions performed by Coogan et al. (2010) is an empirical
study looking at the primary airports in the megaregions. The megaregion definitions
used break the megaregion up into its smaller regions, and in the case of the East Coast
study area, even includes adjacent regions such as upstate New York and southern
Virginia. The study has a strong focus on the internal flows between the airports in each
study area, examining the scale of travel and congestion to determine what that means for
needed extra capacity. Delay at the airports is a focal point, as the authors use this
argument as a jumping off point to evaluate parallel modes such as HSR. A detailed
airport-by-airport analysis looks at airport choice and where people are traveling to in a
given population set. Lastly, due to the focus on capacity, there is a discussion on the
potential for demand management at the airports and what the implications would be.
Although the report looks significantly at HSR as an alternative for intramega
traffic, it also provides suggestions on how to put together and manage a megaregion air
authority to improve the airport planning process. The suggestion is made for further
analysis on how alternative forms of hubbing could relieve the major airports in the
megaregions studied, commenting that “regional solutions could gain optimized capacity
from a ‘family of airports’ concept” (Coogan et al., 2010, p.17). Procedures to support
such an endeavor would be backed by analysis tools that capture the true origin and
destination of passengers, and not just the part of the trip between airports. The result
would be a multi-airport planning process that could capture the potential of underused
airports and provide a better trip experience to the megaregion traveler.

20
The analysis of the two study areas, consisting of three megaregions, is a strong
basis for how to evaluate the U.S. megaregion airports. Empirical analyses using attribute
data is essential to forming an understanding of how megaregions are moving their
populations internally. A larger scale analysis incorporating all megaregions and using
flows to measure the interaction between megaregions, similar to what is done with world
cities, is the next reasonable step in the process of comprehending the full picture of
megaregions and their air systems.
21
CHAPTER 3
METHODOLOGY
The framework for this project involves assessing how megaregions, and the airports
within them, operate as hubs of airline traffic. Airline passenger and freight movements
over a twenty year period were obtained from the Office of Airline Information’s T-100
Market Database (OAI/US DOT). Using this data source, air travel demand from the hub
cities is measured by four categories of destinations: to other metropolitan areas within
the same megaregion, other national megaregions, non-megaregion destinations, and
international destinations. These four classes of flows are compared by the volume of
freight and passenger flows. The flows are examined to see which megaregions are most
active in air travel. An assessment is also done to see how megaregion air travel has
changed over time.
Megaregions are stratified based on the number of major airport hubs each
contains, and classified based on a region’s other airports’ distribution and services. Each
megaregion’s capacities and flows are assessed to see which have airport networks that
best operate to meet the population’s and economy’s demands, and the extent to which
the airports compliment or compete with each other for the megaregion’s demand.
3.1 Data Sources
This project used several data resource, most of which are available to the general public.
Only the megaregion GIS shapefile was used by the permission of a non-federal
government institution.

22
3.1.1 Origin-Destination Flows
The data used in this study comes from the Air Carrier Statistics database. The database
is also known as the T-100 data bank due to the name of the form which U.S. air carriers
fill out to report the data. Data is reported monthly and is collected by the Office of
Airline Information, part of the Bureau of Transportation Statistics (BTS), which itself is
a part of the Research and Innovative Technology Administration (RITA) of the U.S.
Department of Transportation (DOT). The data is compiled and reported as a complete
data set of all air travel occurring within, to, and from the United States, listed by origin-
destination pairings. This differs from the Airline Origin and Destination Survey, which
is a ten percent sampling of all airline tickets for U.S. air travel. The T-100 data set
considers the territories held by the United States as domestic markets.
Two sets of data, domestic and international, were acquired from the BTS
website. Both of these datasets are market data, as opposed to the alternatively available
segment data. Segment data breaks trips into links, such that a trip involving one
connection is considered to consist of two segments. The market data set, on the other
hand, would consider this one trip. Hub airports thus are overrepresented in the segment
data set. The reason for choosing market data was that it allowed analysis on the actual
origin and destination of travelers’ trips. In this analysis, there is no desire to capture the
effect of hub airports, and market data removes the bias that exists for hubs in the
segmented data.
For example, because Atlanta Hartsfield-Jackson International Airport is a hub for
both AirTran Airways and Delta Airlines, it will have a significantly larger representation

23
in the segment data set, as many passengers using Delta’s and AirTran’s networks make
connections in Atlanta. The airport is considered a destination on the first leg of a trip,
and an origin on the second leg. In the market data set, Atlanta’s airport would not show
up at all; instead the actual origin and destination of the traveler’s itinerary are reported.
The domestic data set encompasses all trips occurring in the U.S. internally.
Nineteen years worth of market data were downloaded from the BTS website. The
attributes of these acquired data sets were organized by month and year of travel for each
pairing of origin-destination pairs and operating airline. Airport codes are reported as
those in the Official Airline Guide (OAG), which are all recognized by the International
Air Transport Association (IATA). Origin and destination airport pairs are not
commutative. The specific attributes are listed in Table 3.1:
Table 3.1: Attributes from T-100 Domestic Data
Enplaned Items: Origin-Destination Attributes:
Passengers flown Distance between origin and destination (miles)
Freight Flown (pounds) Origin: IATA Airport Code, City Name, City Code,
Mail flown (pounds) State, and World Area Code
Destination: IATA Airport Code, City Name, City
Code, State, and World Area Code
Airline Attributes: Time Attributes:
Unique Airline Code Month
Airline ID number Year
Airline Name
The second data set encompasses all trips that begin or end internally within the
U.S., and for which the corresponding other end is in another country. From the BTS
website, nineteen years worth of market data were downloaded. This data set was similar

24
to that of the domestic data except for the attributes for Origin and Destination. Instead of
the Origin state and Destination state, the following specific attributes included are
shown in Table 3.2:
Table 3.2: Additional Attributes from T-100 International Data
Origin-Destination Attributes:
Origin: Country Code and Country Name
Destination: Country Code and Country Name
All services types were included in the dataset, both commercial and non-
commercial. This is different from the method used in a Brookings study of airport
congestion which excluded non-commercial service (Tomer & Puentes, 2009). Given that
this study is attempting to capture all types of passenger and freight flows, regardless of
service type, the decision was made to include all service types in the analysis.
Within the T-100 database, there are 1,880 airports listed as having some service
during the period 1990-2008. The varieties of airports that exist in the database represent
all the types of U.S. facilities, from large hubs in major metropolitan areas to small
airstrips that do not receive scheduled service.
3.1.1.1 Rule Changes to T-100
It is acknowledged that during the middle of the 1990-2008 study period, there were rule
changes implemented to the reporting system of the T-100 dataset. According to a memo
listing these changes (Bright, 2002), the largest effect is felt in the area of domestic
freight. Prior to October 2002, domestic all-cargo operators, such as UPS and FedEx,
were not required to report their freight flows. Another significant change, although less

25
apparent in the data, is foreign air carriers now had to report operations for small aircraft,
when previously only aircraft over 60 seats required reporting. In addition, small
certificated and commuter air carriers for the first time had to report their operations. A
final change affected joint service operations, in that the air carrier whose crew was
performing the flight operation was required to report the flight to the T-100 system.
3.1.2 Airport Locations
Geographic Information System (GIS) data was gathered on airport location from the
1998 North American Transportation Atlas Data (NORTAD) and the 2009 National
Transportation Atlas Database (NTAD) 2009. The point file Public-Use Airports was
used to spatially locate the airports in the GIS environ. There is attribute data for the
physical and operating characteristics of the airport and usage categories. Only airports
that exist for the public’s use are included in the NORTAD and NTAD datasets. Unlike
the T-100 data, the airport codes in the two spatial databases are assigned by the Federal
Aviation Administration. These are not always the same as the IATA codes.
Both the NORTAD and NTAD GIS databases were initially retained because of
the changes that occurred historically within the U.S. airport system. Between the release
of the 1998 NORTAD and 2009 NTAD, many airports in the U.S. changed either FAA or
IATA airport codes. The T-100 data, because it extends back to 1990, thus would need to
be carefully handled when attributing IATA codes spatially in these atlases.

26
3.1.3 Airport Characteristics
The FAA separates airports into different hub designations in order to determine funding
levels within federal programs. The National Plan of Integrated Airport Systems (NPIAS)
is a list of all the airports in the United States. The dataset for 2007-2011 was used to
classify each of the airports in the T-100 database.
Within the NPIAS list is a designation of Primary airports, which handle at least
10,000 passengers per year. The largest airport within this division is a large hub airport,
which has at least 1% of all annual U.S. passenger movements. Below this are medium
hubs, which have between 0.25 and 1% of U.S. passenger movements; small hubs with
between 0.05 and 0.25%; and non-hubs, which have above 10,000 but less than 0.05%.
Airports in NPIAS that have less than 10,000 annual passengers, but greater than 2,500
annual passengers are classified as non-primary airports. General aviation airports are
defined as having fewer than 2,500 passengers each year, and are the smallest category in
the NPIAS report. Reliever airports are general aviation airports that can be used to
relieve large primary airports when necessary, and are designated as such in the report.
3.1.4 Airlines
For part of the analysis, the location of airline hubs in the U.S. in relation to megaregions
was needed. To do this, it was necessary to identify the top airlines by volume in the
U.S., both freight and passenger, during the period of the study, 1990-2008.
3.1.4.1 Passenger Airlines
The data for choosing these airlines comes from the T-100 dataset from 1990 to 2008. To
choose which airlines to include in the passenger airline hub analysis, it was desired to
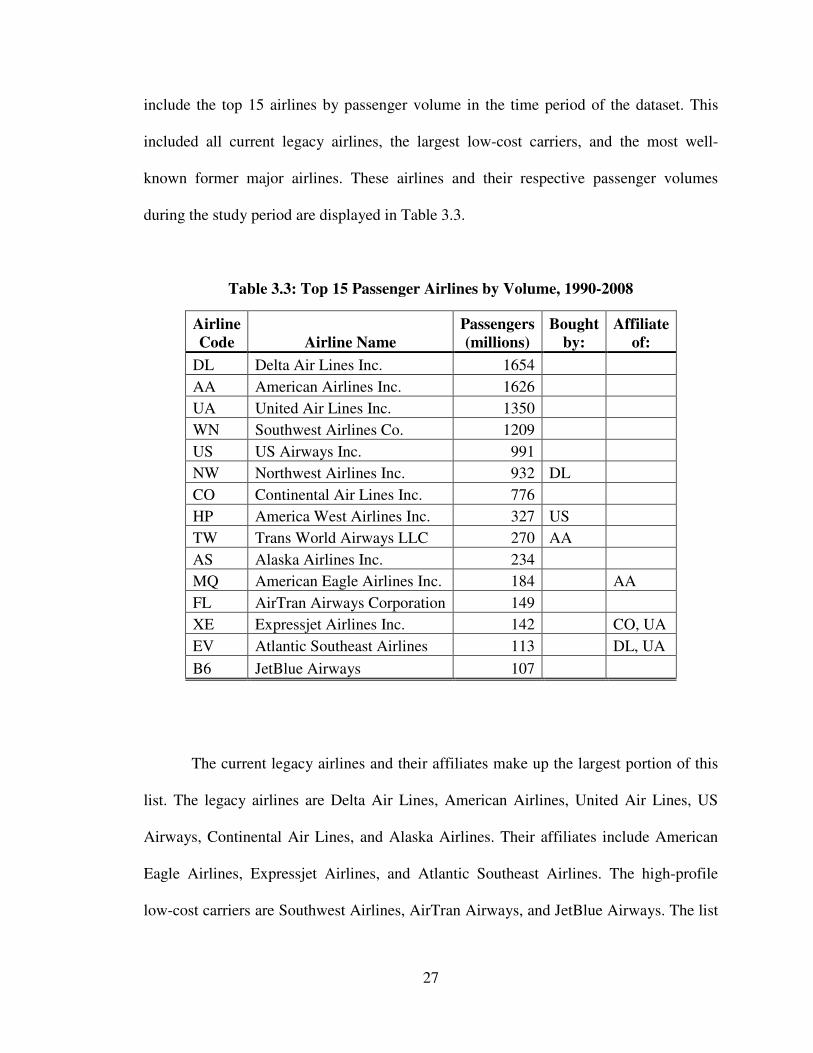
27
include the top 15 airlines by passenger volume in the time period of the dataset. This
included all current legacy airlines, the largest low-cost carriers, and the most well-
known former major airlines. These airlines and their respective passenger volumes
during the study period are displayed in Table 3.3.
Table 3.3: Top 15 Passenger Airlines by Volume, 1990-2008
Airline
Code Airline Name
Passengers
(millions)
Bought
by:
Affiliate
of:
DL Delta Air Lines Inc. 1654
AA American Airlines Inc. 1626
UA United Air Lines Inc. 1350
WN Southwest Airlines Co. 1209
US US Airways Inc. 991
NW Northwest Airlines Inc. 932 DL
CO Continental Air Lines Inc. 776
HP America West Airlines Inc. 327 US
TW Trans World Airways LLC 270 AA
AS Alaska Airlines Inc. 234
MQ American Eagle Airlines Inc. 184 AA
FL AirTran Airways Corporation 149
XE Expressjet Airlines Inc. 142 CO, UA
EV Atlantic Southeast Airlines 113 DL, UA
B6 JetBlue Airways 107
The current legacy airlines and their affiliates make up the largest portion of this
list. The legacy airlines are Delta Air Lines, American Airlines, United Air Lines, US
Airways, Continental Air Lines, and Alaska Airlines. Their affiliates include American
Eagle Airlines, Expressjet Airlines, and Atlantic Southeast Airlines. The high-profile
low-cost carriers are Southwest Airlines, AirTran Airways, and JetBlue Airways. The list

28
also includes three major passenger airlines that were bought out by other airlines during
the study period: Northwest Airlines, America West Airlines, and Trans World Airways.
3.1.4.2 Freight Airlines
The data for choosing these airlines also comes from the T-100 dataset from 1990 to
2008. Table 3.4 displays the two airlines that were used in this study. Federal Express and
the United Parcel Service are by far the leading freight only air carriers in the nation.
After these two, most of the carriers of freight in the database are the passenger carriers
that carry the most freight, including many international carriers. Since the purpose of
identifying the top airlines by volume was for hub identification, these passenger airlines
are already accounted for.
Table 3.4: Freight Airlines by Volume, 1990-2008
Airline
Code Airline Name
Freight (millions
of pounds)
FX Federal Express Corporation 84580
5X United Parcel Service 59906
3.1.5 Airline Hubs
Subsequent to identifying the major airlines for the study, each of the airlines’ current
and past hubs were located. Wikipedia was used as a reasonable source for each airline’s
history during the study period of 1990-2008. Any airport that served as a major focus of
airline operations for an airline during that time was attributed to the hub dataset. Four
types of hubbing activities were recorded, based on how the airline identified its
operations at an airport:
29
Passenger Airlines: Passenger Hub, Focus City*, Former Hub
Freight Airlines: Freight Hub *Note: Focus Cities were termed by some airlines as Secondary Hubs
3.1.6 Megaregions
The megaregions shapefile was acquired from America 2050, part of the Regional Plan
Association. America 2050’s megaregions were chosen over other nationwide options
such as those from the Center for Quality Growth and Regional Development (CQGRD)
or the Metropolitan Institute and megaregion-specific studies such as those performed by
the University of Pennsylvania on the Northeast, Georgia Institute of Technology on the
Piedmont, San Francisco Planning and Urban Research on Northern California, Kern
County Council of Governments on Southern California, the University of Michigan on
the Great Lakes, the University of Texas on the Texas Triangle, or Portland State
University on Cascadia. The reason for the decision to use America 2050’s megaregions
is outlined in the following section.
3.1.6.1 Megaregion-specific Studies
This research project is being conducted on a national scale, and thus all megaregions
will need to be considered in terms of the airports that reside within. Using a
conglomeration of megaregion-specific studies was considered because it would create a
system of megaregions based on how those familiar with the area view it. This viewpoint
could be considered more authoritative because those crafting a megaregion’s boundaries
are more familiar with the characteristics of the region.
The reasoning as to why there is a benefit in using megaregion-specific studies
can also be considered a detriment. There are major downsides to using a combined map
30
of megaregion-specific studies. First, not every megaregion has had a study performed on
it by a group internal to the megaregion’s boundaries. There would be a need to
supplement from national megaregion studies. Perhaps more importantly, each of the
megaregion-specific studies use a different methodology for boundary delineation,
creating an inconsistent set. It could cause some airports to be excluded from a
megaregion when under another megaregion definition, in the same set, they may have
been included. Lastly, each of the megaregion-specific studies were conducted at
different times. Population and economic growth and decline may have produced
different megaregion boundaries had these megaregion-specific studies all been
conducted simultaneously and with the same data. Due to inconsistency between
megaregion-specific studies, this option was not used.
3.1.6.2 Other National Level Studies
The clear benefit to using a national level study of megaregional delineation is a
consistency of method. Each megaregion would have boundaries that were determined
using the same set of tools and decision-making processes. Each of the three national-
level studies make use of different tools and data, considering different characteristics to
craft the shape of each megaregion. The method behind each system is described in the
literature review, but two points as to why America 2050 was used are outlined here.
The set of megaregions created by America 2050 is similar in many ways to those
of the Metropolitan Institute and CQGRD. All have the approximate same metropolitan
areas included in the megaregions, and group them in roughly similar ways. What stands
out though is the reasonableness that exists in the America 2050 megaregion set.
CQGRD’s megaregions stand out as strikingly different compared to the other
31
megaregion concepts that exist. Most apparent is the splitting of the Northeast (DC-
Boston) megaregion in two: a DC-Virginia megaregion and a Northeast megaregion only
consisting of Philadelphia, New York, and Boston. The Northeast was the original
megaregion as defined by Jean Gottman in 1957. The decision by CQGRD to split up the
original megaregion into two parts is a concern. It is one of the most familiar
megaregions both nationwide and around the world, and is consistently referenced as an
example of what a megaregion looks like.
The limited value of the CQGRD model is also demonstrated in the combination
of Northern and Southern California into one gigantic megaregion encompassing nearly
the entire state of California. This displays a lack of concern for regional culture,
something America 2050 makes use of in their definition. The two parts of the state are
strikingly different, and all other megaregion studies take this into account. Even the
leading megaregion discussion coming out of California (Teitz & Barbour, 2007)
specifically discusses California as having two megaregions, and supports this by
referring to the differences between the Northern and Southern California
conglomerations. The authors recognize the strong distinctions in industry, political and
social structures. In addition, they note the different styles of urban development, while
adding that the existence of separate megaregions exists in public perception too. In
addition, it is not practical to argue for megaregion institutions if a megaregion is already
an institution in itself: the state government. Teitz and Barbour (2007, p.1) argue this
point, stating California should not be considered one large megaregion because the state
has never worked as such. They identify the state’s strong “home rule” tradition by
discussing how it has been local and regional level movements over time that have

32
shaped the state’s urban growth more than the state government ever has (Teitz and
Barbour 2007, p. 7).
Megaregions are a new concept to many policymakers across the country, and
America 2050 has used their set of megaregions in conferences delivered nationwide.
Although the Metropolitan Institute’s definition is reasonable, it falters in the face of
America 2050’s megaregion set because it has not been used as a policy tool or furthered
beyond definition. Due to America 2050’s outreach effort, policymakers in each
megaregion are already having conversations with the image of the America 2050
megaregion map in their mind. The America 2050 megaregions are the most common set
used in news articles on the issue, and thus have been introduced into the public mindset.
Although there may be changes to America 2050’s map over time, as they improve their
definition and tweak which spaces are considered megaregions, they have a strong base
grounded in infrastructure, environmental, and economic systems. Given that America
2050 has pushed hard to get the word out through discussions in each megaregion, and
used their maps along the way, it would be beneficial to have conversations on airports
with this same set.
For reference, America 2050’s megaregions are listed in Table 3.5 along with
their size, population, population density, and gross megaregional product (GMP). Figure
3.1 shows a national map of the megaregions.

NorthernCalifornia
SouthernFlorida
Arizona SunCorridor
Cascadia
Midwest Northeast
PiedmontSouthernCalifornia
TexasTriangle
Gulf Coast
Front Range
¯0 490 980245
Miles
Figure 3.1: U.S. Megaregions Used in Study from America 2050
33
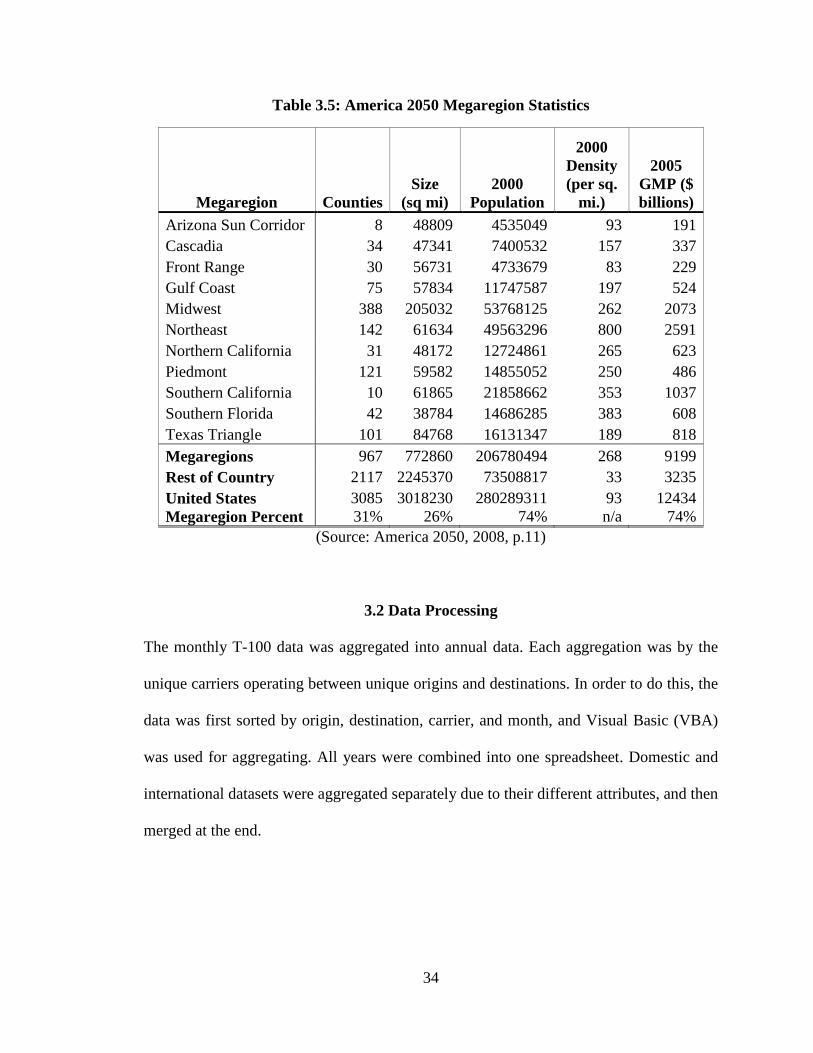
34
Table 3.5: America 2050 Megaregion Statistics
Megaregion Counties Size
(sq mi) 2000
Population
2000 Density (per sq.
mi.)
2005 GMP ($ billions)
Arizona Sun Corridor 8 48809 4535049 93 191 Cascadia 34 47341 7400532 157 337 Front Range 30 56731 4733679 83 229 Gulf Coast 75 57834 11747587 197 524 Midwest 388 205032 53768125 262 2073 Northeast 142 61634 49563296 800 2591 Northern California 31 48172 12724861 265 623 Piedmont 121 59582 14855052 250 486 Southern California 10 61865 21858662 353 1037 Southern Florida 42 38784 14686285 383 608 Texas Triangle 101 84768 16131347 189 818 Megaregions 967 772860 206780494 268 9199 Rest of Country 2117 2245370 73508817 33 3235 United States 3085 3018230 280289311 93 12434 Megaregion Percent 31% 26% 74% n/a 74%
(Source: America 2050, 2008, p.11)
3.2 Data Processing
The monthly T-100 data was aggregated into annual data. Each aggregation was by the
unique carriers operating between unique origins and destinations. In order to do this, the
data was first sorted by origin, destination, carrier, and month, and Visual Basic (VBA)
was used for aggregating. All years were combined into one spreadsheet. Domestic and
international datasets were aggregated separately due to their different attributes, and then
merged at the end.
35
3.2.1 Managing T-100 Reporting Rule Changes
The changes to the T-100 reporting system that occurred in October 2002 cannot be
ignored, and their effects are most visible in analyses done in regards to time.
The most impactful aspect of the 2002 changes is the requirement of domestic all-
cargo operations to report their flows. The freight flows before 2002 consisted primarily
of air carriers which carried cargo in the hull beneath the passenger deck. This change
caused a near doubling of freight flows between 2001 and 2003. Those megaregions
which have freight hubs for UPS and FedEx are the most likely to see major jumps in
freight traffic after 2002. There appears to be a transition period, as well, prior to the
formal rule change; in 2001 a sharp rise in freight traffic occurs, which appeared
abnormal. For the purpose of time series analysis, the data will be analyzed from 1990-
2000, and then from 2003-2008, with the transition years of 2001 and 2002 skipped. In
terms of comparisons of gross volumes of freight, it is likely that the megaregions that
have high freight flows would be even further separated from megaregions with low
freight flows. The results of the gross flow freight analysis will be reported without
concern for the rule changes, and it will be acknowledged in the final remarks of this
study that differences in freight flows likely would have been larger between
megaregions with and without freight hubs. The rule change, however, does not affect
international freight, as international all-cargo flights were always required to be
reported. This part of the data can be reported without concern.
The effect of international carriers having to report their small passenger aircraft
operations in addition to their large aircraft is less noticeable in the data than the freight
rule change. When examining the international flow changes between 2001 and 2003,

36
there is no abnormal jump in the dataset like there is with the domestic freight operations
change. It is reasoned that the rule change for international carriers was minimal, as most
carriers use large jets for passenger travel to international destinations. The most likely
megaregions to feel these minor effects would be those most connected internationally
(higher likelihood for any aircraft operating internationally, including small ones) and
megaregions which have strong ties to Mexico, Canada, and the Caribbean
(geographically close international markets that are more likely to be served with smaller
aircraft). In addition, is difficult to point out which rises in flows were due to post-9/11
air travel growth, and which were results of the change.
Changes in regards to small certificated and commuter aircraft being required to
start reporting in 2002 seem to be minimal in the dataset. These services do not make up
a sizeable amount of air flows as compared to the larger passenger carriers. Intramega
traffic is the most likely to be affected, but it is difficult to point out which rises in flows
were due to post-9/11 air travel growth, and which were the result of the rule change.
Joint service operation rule changes do not affect this study. No consideration is
given in this study to the operator of a flight, only the volumes that result from it.
3.2.2 Differences Between Airport and Flow Data Sources
There were discrepancies when comparing the T-100 list of airports and those in the
NORTAD and NTAD lists. Of the 1,880 airports reported in the T-100 system, 624 are
not included in the geographical NORTAD, and 584 are not listed in the more recent
NTAD. This accounts for only around 29,000 origin-destination pairs within the T-100
database. Although being a relatively small percentage of the full dataset, this raised a

37
concern over what types of airports were missing, and what magnitude of error these
airports missing from the spatial data would cause.
There was additional concern due to the T-100 database and the NORTAD and
NTAD using different airport codes; the former uses IATA while the latter uses FAA.
Although major hub airports have the same IATA and FAA codes, minor airports
sometimes have different codes due to discrepancies with other worldwide airports. For
example, St. Augustine Airport in St. Augustine, Florida uses the FAA code SGJ. Due to
another airport internationally using the code SGJ, which is assigned to Sagarai, Papua
New Guinea, St. Augustine Airport’s IATA code is UST.
It was noted that some of the airports that fail to show up in the spatial databases
from the T-100 data were due to the differences in FAA and IATA codes. This created a
matching failure when trying to attribute T-100 data spatially in GIS.
The NTAD airport list was used because it is a more current list of airports in the
U.S. system.
3.2.3 Missing Airport Error Analysis
Two reasons for the T-100 airports to be missing in the spatial database were
hypothesized. The first was that there was a mismatch with the FAA and IATA airport
codes. The second hypothesis was that the missing airports are privately owned and not
open to the public, but exist in the T-100 database because there was commercial and
non-commercial service provided to these airports at some point in time.
To test this hypothesis, a sample of the airports not in the spatial dataset was
examined. One of the reasons it seemed that airports were missing was due to changes in

38
airport codes. In this analysis, airnav.com and travelmath.com were used as resources to
verify airport coordinates and designation codes. In particular, airnav.com provides a list
of airports that have changed IATA airport codes since 1995; around 1000 private and
public airports are listed.
After examining the sample of missing airports, it appeared there were distinct
cases as to the situation of an airport listed in the T-100 database not showing up in the
spatial database.
Unlisted - Airport in T-100 database does not exist in spatial database, and would
need to be added with spatial coordinates. Very likely is a private airport, and thus
not listed in the spatial database. (e.g. A41 [IATA] Kogru River Airport, Kogru
River, AK.)
Changed Airport Code - An airport exists in the T-100 database with one IATA
code, and exists in the spatial database with a different airport code. At some
point this airport changed its IATA code, and may or may not exist in the
airnav.com list. (e.g. A66 [IATA], Hope Airport, is now 5HO [FAA].)
FAA/IATA mismatch – Some of the airports that appeared to have “Changed
Airport Codes” in fact did not, and simply have an IATA code different from their
FAA code. As noted before, an airport exists in the T-100 database with an IATA
code, but in the spatial database, it is listed with an FAA code. (e.g. UST [IATA]
and SGJ [FAA] for St. Augustine Airport, St. Augustine, FL.)
Switched Airport Code - An airport exists in the T-100 database with one IATA
code, and exists in the spatial database with a different FAA code. A different
39
airport now uses the former IATA code as its own. This change may or may not
exist in the airnav.com list. (e.g. A69 [IATA], Cold Bay Airport, is now CDB
[IATA, FAA]. A69 [FAA]now exists for a different airport, Tanis Mesa Airport,
Yakutat, AK.)
Stolen Airport Code - An airport exists in the T-100 database with one IATA
code, but does not exist in the spatial database. The FAA code equal to the IATA
code exists for a different airport. (e.g. A51 [IATA], Wien Lake Airport, Wien
Lake, AK does not exist in the spatial database. A51 [FAA] is a different airport,
Costin Airport, Port St. Joe, FL.)
It was determined that classifying each of the 584 airports in the T-100 dataset
that do not match with the NTAD into one of the above categories would not contribute
significantly to the study. The total number of passengers and freight volumes accounted
for by these 584 airports is no more than 0.30% of the total volume of all 1880 airports in
the T-100 database. There would be little return on the time investment needed to classify
the airports, with geo-location necessary for many.
It was felt after examining the missing airport data, however, that many of the
largest missing airports by volume were the easiest case to adjust for: an FAA/IATA
mismatch. These were considered worthwhile to manually adjust for, particularly because
some significant minor airports within the continental U.S. that receive commercial
service were on this list, including:

40
Marquette International Airport, Marquette, MI; MQT (IATA), SAW (FAA)
Hilton Head Airport, Hilton Head Island, SC; HHH (IATA), HXD (FAA)
University Park Airport, State College, PA; SCE (IATA), UNV (FAA)
McClellan-Palomar Airport, Carlsbad, CA; CLD (IATA), CRQ (FAA)
To correct for these airports with an FAA/IATA mismatch, it was decided to
manually change the FAA codes in the spatial database for some significant airports to
IATA codes. Significance was based on a volume cutoff. Any missing airport that had
over 10,000 passengers or 1,000,000 pounds of freight in a given year was examined for
an FAA/IATA mismatch. Twenty-six airports were identified using this process,
including the four listed above, and are no longer mismatched. Ten of these airports were
within megaregions, exemplifying the importance of going through this error checking
process.
Lastly, amongst the missing airports, there were some easy fixes that could be
made. For example, Colombia’s flag carrier Avianca listed its origin and destination
airport in New York City as an IATA code of “NYC”. This does not correspond to any
airport. A simple look on Avianca’s website shows that the airline uses John F. Kennedy
International Airport as a focus city for the region. Thus the error was corrected by
changing the code “NYC” to “JFK” within the T-100 database. Another airport, Mena
Intermountain Municipal Airport MEZ (FAA) has no IATA designation, thus was coded
blank as “XXX” in the T-100 database. It was given the FAA designation for the purpose
of this study.
41
It must be noted that some minor airports with significant volumes (above 10,000
passengers or 1,000,000 pounds of freight) were not in the NTAD list of airports. All of
these were primarily used for freight movements. They were excluded from this analysis
because no geolocating was performed to retain airports. The airports excluded were:
Hickam Air Force Base, Honolulu, HI; HIK (IATA)
Selief Bay Airport, Selief Bay, AK; A31 (IATA)
Ice Strip, Barrow, AK; A94 (IATA)
Barrow, AK; A96 (IATA)
Rantoul National Aviation Center, Rantoul, IL; II1 (IATA)
Donlin Creek Airport, Donlin Creek, AK; FVQ (IATA)
With the above changes, there are now 1,308 airports accounted for that can be
linked between the T-100 database and the NTAD spatial database. Approximately 2,500
origin-destination pairs are now retained due to cleaning of the dataset. The result of this
fix is a large reduction in missing volumes from the total due to missing airports in the
spatial database. The remaining 569 airports account for 0.04% of passenger volumes and
0.08% of freight volumes. The volumes these amount to were considered to have
minimal effects on the overall study conclusions.
The final product of this analysis is a T-100 database that only includes airports
that are able to be spatially located with the NTAD. The NTAD itself has been trimmed
to only include the airports in T-100, removing many public aviation facilities such as
hospitals and general aviation airports. These airports are listed in Appendix A and were

42
used in the analyses that follow. A map of each megaregion’s airports in the dataset are
shown in Figures C.1 through C.11.
3.2.4 Airport and Flow Megaregion Assignment
Using GIS, the NTAD airport list was spatially associated to the megaregion it was
located within. Any airport not within any megaregion was assigned non-megaregion
status. All non-megaregions airports are grouped together as one dataset for this study.
Using the airport list, with associated megaregions, each of the flows within the
T-100 database was classified by their origin and destination in terms of megaregions.
The only airports in the database that did not have a megaregion or non-megaregion label
after the spatial locating of the NTAD airport list are international airports. Thus, when
assigning origins and destinations, these airports label was “International”.
With this assignment throughout the T-100 database, all flows were able to be
classified as intra-megaregion flows, inter-megaregion flows, flows from megaregions to
international and non-megaregion airports, and flows from non-megaregion airports to
other non-megaregion and international airports. An origin-destination table for the T-
100 database was then able to be created for analysis of megaregion travel.
3.2.5 Dual-Megaregion Designation
Within America 2050’s set of megaregions, there is overlap between the Gulf Coast and
Texas Triangle megaregions. This dual-megaregion designation covers the full region of
the Houston Metropolitan area. The effect on this study is ten airports in the Houston
region are designated as being in two megaregions, including George Bush

43
Intercontinental Airport (IAH) and William P. Hobby Airport (HOU). Within the tables
summarizing air flows between megaregions, the movements between these ten airports
and the rest of the airport network are credited towards both the Texas Triangle and Gulf
Coast megaregion totals. Thus, the sum of all T-100 flows in the dataset is less than the
sum of all the eleven megaregions and the non-megaregional areas, because the T-100
flows for the Houston airports are doubly attributed.
3.2.6 Standardizing Flows
The megaregions in this study range in size, having vastly different land areas,
populations, and economies. Due to these differences, there are accordingly large
differences in flows. In general, the larger megaregions have larger passenger and freight
flows because they have the greater foundation on which to generate such flows. To
provide fair comparison in the study, the analyses comprise both an examination of gross
volumes and standardized flows. By comparing standardized flows, the megaregions can
be examined on an equal basis. Two types of standardization are performed in this study:
single megaregion standardization and market pair standardization.
Only megaregion and non-megaregion areas have standardized flows. The
international market does not have measurable attributes to tie to the data. Rather than
assume a land area, population, and economic production level for the combined set of
airports in the international market, this part of the data was excluded from
standardization.
To compare megaregions on their level of air activity, each megaregion’s gross
passenger and freight flows are standardized by its area, population, and economic

44
productivity. The gross productions and gross attractions are individually divided by the
three standardization characteristics associated with that megaregion. The calculation is
as follows:
���������� �� ��������������� �� ��������� �� ������� �������������
Market pair standardization involved the flows between two megaregions. To
calculate the standardized flow between two spaces, their combined standardization
values were used within the denominator. Thus, the standardized flow by economic
production between the Piedmont and the Texas Triangle would be divided by the
summed size of both economies. The calculation for standardized market flows is:
����� �� � � ����� �� �
����� � ����� �� ���������� � ������������ ������� ������������� � ������� ��������������
3.3 Analysis Procedure
Seven different analysis procedures were used to compare the role airports and aviation
play in megaregions. Focus was on the megaregion’s aviation infrastructure, the volume
of flows of each megaregion, the market pairs of megaregions, the internal megaregion
flows, the role of non-megaregion areas and the international market, and how aviation
has grown in megaregions over time. The following sections discuss each analysis
procedure.

45
3.3.1 Megaregion Airport Infrastructure
A comparison of the megaregion and non-megaregion areas’ infrastructure was
performed by looking at the concentration of airports within each. The number of airports
for each area was determined by the number of airports in the T-100 database that are
spatially located within the megaregion and non-megaregion areas. These totals were
divided by the area, population, and GMP of each of the areas, as defined by America
2050 (America 2050, 2008). This normalization produced values for airport density,
airports per capita, and number of airports with respect to economic productivity,
respectively. These values were then compared across the different areas to determine
which have the highest concentrations of airport infrastructure.
In order to compare the megaregions by the significance of the airport
infrastructure within each area, the NPIAS classifications were assigned to each airport in
the T-100 dataset. The megaregion and non-megaregion areas were compared by the
number of primary airports within each. The varying levels of large, medium, small, and
non-hub airports indicated which areas had more airports that play greater roles in the
U.S. airport system.
The megaregion and non-megaregion areas were also compared by their role in
the airline industry. A comparison was performed based on the degree to which each area
is involved in airline hubbing activity. For the purpose of mapping the airline hubs, an
airport was classified by the dominant hubbing activities for both passenger and freight
airlines occurring at that airport. Only the passenger hub status that carried the most
weight was used to characterize an airport, with the priority in order given by Passenger
Hub, then Focus City, and finally Former Hub. For example, an airport which is a
46
Passenger Hub for one airline, a Focus City for a second airline, and a Former Hub for a
third airline, would be characterized as a Passenger Hub. An airport that is a Focus City
for one airline, and a Former Hub for another airline, would be characterized as a Focus
City. From this procedure, six different airport types were seen occurring throughout the
U.S.:
Passenger Hub
Freight Hub
Passenger/Freight Hub
Freight Hub/Focus City
Focus City
Former Hub
Each of the megaregion and non-megaregion areas had their number of airports
with hub statuses tallied. The count was based on the six different airport types, such that
only the weightiest hub status for passenger airlines was recorded for that airport. For
example, a megaregion with two Passenger Hub airports, one Passenger/Freight Hub
airport, one Freight Hub/Focus City airport, two Focus Cities, and one Former Hub
would be given a count of three Passenger Hubs, two Freight Hubs, three Focus Cities,
and one Former Hub. The airline hub characteristics of each area were compared based
on the number and significance of hubs within that area.
47
3.3.2 Megaregion Air Traffic Volumes
The airport flows for the megaregion and non-megaregion areas were compared by the
volume of passenger and freight flows occurring in and out of each area’s airports. The
volumes, already summed up at the megaregion level, were examined for each area by
gross volume and normalized measures: by area, by population, and by economic
productivity.
The comparison between the megaregions, non-megaregion areas, and a
combined set of international airports was done for the gross volume of flows of
passenger and freight traffic. A ranking was done to be able to discuss which areas are
more involved in air travel. This is applicable because it shows which megaregions have
more air activity, and thus are larger players in the overall network. To show differences
based on activity that is fair based on the base characteristics of each area, rankings were
done also on the normalized flows. The purpose is to see if some areas are more active in
air travel based on the size of that area. For example, a small megaregion may not have
much air activity, but for the number of people residing there, the population may fly
more than the people in a larger megaregion.
3.3.3 Origin-Destination Megaregion Pairs
The origin-destination pairings of all the megaregions to each other, and to non-
megaregion areas and the international market were compared. Each of the pairings were
classified as either intramegaregional flows, those within a single megaregions;
intermegaregional flows, those between megaregions; non-megaregional, those involving
48
the non-megaregion areas; and international, those involving flights to and from
international cities.
Flows were considered to be the traffic in both directions in a pairing, although
directional flows are reported, and ranked based on this combination. Productions and
attractions are not compared separately because flows in each direction, particularly for
passenger flow, were similar. Freight flows more often differed by direction of flow in a
pairing, and the difference is captured through a percentage difference, which was
calculated as:
Percent difference in directional +lows . ����� �� � / ����� �� ��
012345 63 7812347 63 59
2;< 100%
Combined flows were sorted from greatest to smallest, and the Top 20 passenger
and freight movements between pairings were identified. These Top 20 are color coded
by the type of flow (intramega, intermega, non-mega, international).
Standardized flows are also reported in this portion of the study. To standardize a
directional flow between an OD pairing of megaregions or non-megaregion areas, a sum
of the attributes of both parts of the pairing were used. For example, a flow from the
Northeast to the Piedmont would be divided by the summed population of both
megaregions. The standardized OD directional flows were summed for each direction,
such that the combined standardized flow represented both directional flows of the
market. This was done for population, area, and economic productivity. International
flows were not included in the standardization portion of the analysis because no
population, area, and economic productivity attributes were readily available. The
49
combined flow pairings were ranked and the Top 20 are reported for both passenger and
freight traffic.
3.3.4 Individual Megaregions: Origin-Destination Flows
Using the same methods of summing of flow pairings, standardizing flows, and
comparing freight flow directional traffic, an analysis of each megaregion’s air activity
was performed. Each megaregion was individually discussed as to which areas they were
most connected with among all the megaregions, non-megaregion areas, and the
international market. For freight flows, the percent difference between the productions
from and attractions to a given megaregion were compared to show which markets the
megaregion was a net importer from or exporter to.
Standardized combined flow pairings were compared by area, population, and
economic productivity from a given megaregion to all other megaregions and non-
megaregion areas. The top three and bottom three connections were discussed.
3.3.5 Individual Megaregions: Intramega Flows
Analysis on the intramega flows of the megaregions allows an understanding on the
processes occurring between the metropolitan areas within the megaregion. The spatial
orientation of the airports within a megaregion is likely to have consequences on the level
of intramega traffic.
For each megaregion, the passenger and freight traffic between airports within are
mapped using GIS. The scale of flow lines between airports are kept consistent over the
eleven megaregion passenger flow maps, similarly over the eleven freight flow maps.

50
This allows comparison between the megaregions in terms of magnitudes of flows
occurring within the megaregions. In addition, the proportional difference between the
colored flow lines are the same between passenger and freight maps. For example, the
proportion between a yellow and red line on the passenger maps, is the same as the
proportion between a yellow and red line on the freight maps.
Each megaregion’s spatial form of airport flows was classified into categories
based on where the strongest connections are within the megaregion. Megaregions in
which all metropolitan areas had a focus on one major metropolitan area’s airports were
termed hub-focused. Those which had a strong pairing between two metropolitan areas
with all other airports mainly travelling between one of these two were termed a dyad,
while those with three main foci of activity were termed tri-poles. The fourth
classification was galactic, where there were many foci of activity, and not all airports
were significantly connected to all other major airports, and minor airports had an array
of roles with more flows between each other.
3.3.6 Non-megaregion Areas and the International Market
Similar to how megaregions are evaluated, the flow pairs with non-megaregion areas and
the international market are each analyzed to determine which megaregions are most
connected. For freight flows, the percent difference between the productions from and
attractions to a given megaregion were compared to show which markets the megaregion
was a net importer from or exporter to.
51
Standardized combined flow pairings were compared by area, population, and
economic productivity to all the megaregions and with non-megaregion areas. The top
three and bottom three connections were discussed.
3.3.7 Growth of a Megaregion’s Air Traffic
Capturing the differences in how air traffic has changed over time required the
compilation of the T-100 OD pairs by year. Each individual flow in the database was
classified by the flow types used throughout the study: intramega, intermega, non-mega,
and international. In addition, this part of the study has a fifth type of flow for the flows
between non-megaregion area airports. This flow was termed internal non-mega.
A time series analysis was performed over the 1990-2008 study period, plotting
the growth of the flows over time. The total of all flows was also plotted. This
comparison allows the visualization of how air traffic between the areas in the study
changed during the shifting market dynamics of the two decades being studied.
To compare the relative growth of each type of movement, each of the flows were
referenced to their level of activity in 1990. With this method, reading any referenced
flow in any year is an indication of the change in volume since 1990. For example, a
referenced intermega flow in 2006 of 2.5 means the intermega flows of that year were
two and a half times larger than they were in 1990. These referenced flows were plotted
against time along with the nation’s GDP, adjusted for inflation, and the national
population. These values were those compiled by the Budget of the U.S. Government and
the U.S. Census Population Estimates, respectively. In doing this comparison, it is
possible to tell which flows grew faster respective to others over the same time period. In

52
addition, it was possible to be seen how the aviation market compared against national
population and economic measures.
Intramega flows received extra attention in the time series analysis. Each
megaregion’s intramega flows were analyzed over time to see their growth patterns.
Their flows were referenced to 1990, and compared against one another.
A case study was also performed for the Piedmont megaregion. The focus of this
case study was to examine where flows were heading in the megaregion over time in
regards to the NPIAS hub status. The hub statuses were arranged into three groups: large
hub primary airports; medium, small, and non-hub primary airports; and non-primary
airports. The flows between each of these categories were calculated for each year in the
study period, creating six different flow profiles. These were then compared against each
other for total volume and relative growth over time in both the passenger and freight
sectors.
Passenger and freight flows were compared separately. As discussed earlier, the
T-100 reporting rule changes affected freight flows more significantly than passenger
flows. Thus, it was decided not to include the transition years of 2001 and 2002 in the
time series analysis, except for international freight flows which were not affected by the
rule changes. Therefore, referenced freight flow analyses are plotted with a gap in 2001
and 2002. Flows 2000 and prior are referenced to 1990. Flows from 2003-2008 are
referenced to 2003, because their magnitudes are many times larger than those prior to
2000 due to the rule changes.
53
CHAPTER 4
RESULTS This study’s results are broken down into six sections, examining airports and air travel
in the context of megaregions through different criteria.
The first discussion is on airport infrastructure as it relates to megaregions. The
megaregions and the non-megaregion areas are compared by the airports that are within
them and how this relates to area, population, airlines, and economic productivity.
The second discussion is a comparison of megaregions as origins and destinations
that attract and produce passenger and freight flows. The flows are standardized by area,
population, and economic productivity to compare the relative proclivity of megaregions
to be involved in the two different sectors.
An analysis on the flows between pairs of megaregions, non-megaregion areas,
and the international market makes up the third discussion. The Top 20 passenger and
freight flows are reported by gross volume, and standardized by area, population, and
economic productivity. The goal is to see where in the U.S. the most active air traffic
flows exist.
An individual examination of each megaregion’s flow pairs is conducted in the
fourth discussion. For each megaregion, its passenger and flow pairs to other
megaregions, non-megaregion areas, and internationally are compared by gross volume
and standardization of volumes by area, population, and economic productivity. This
analysis provides insight into which megaregions are most closely connected.
54
The fifth discussion is on the intramega flows of each megaregion. Maps of each
megaregion’s airports show the passenger and freight traffic occurring between them. An
examination of the spatial relationships between the airports and the significance of the
flows is used to draw conclusions as to how a megaregion’s metropolitan areas interact
through air travel.
The sixth discussion focuses on non-megaregion areas and the international
market. It is similar to the discussion on each megaregion, but with a goal to gain a better
understanding of how these areas themselves relate to the megaregions.
The seventh discussion brings in the element of time for passenger and freight
flow growth. Comparison of intermega, intramega, non-mega, internal non-mega, and
international flows is done against the population and economy of the U.S. The goal is to
see how fast each of these types of flows has grown compared to each other by
magnitude and rate. The intramega flows of each megaregion are compared to see how
they have changed over time. Lastly, a case study is done on the Piedmont megaregion, to
see how its internal airports’ flows have shifted over time.
4.1 Megaregion Airport Infrastructure
The airport system in the United States, as defined in this study to be the airports listed
both in the NTAD and T-100 database, consists of 1308 airports. Within megaregions
airport infrastructure occurs at much higher concentrations. Similar to road, rail, and
communication networks, which are found in dense networks, large airports with high
activity are generally found in U.S. megaregions. This is not surprising in that

55
megaregions are the focus of the U.S. population and economic activity, and the majority
of transport activity and infrastructure exists within the eleven megaregions.
In the following section, megaregion and the non-megaregion areas are compared
by the density of airports, the number of airports per capita, and the number of airports
with respect to economic productivity. In addition, the sizes of the airports within the
different megaregions are compared to see which have intensely built up airport
infrastructure. Lastly, the megaregions are compared by the number of airline hubs that
exist, as a measure of impact within the air industry.
4.1.1 Airport Density
Megaregions have higher densities of airports within their land area than non-
megaregional areas, even though there are more airports located throughout non-
megaregional areas (61% of U.S. airports exist in non-megaregional areas). This high
level of airports in non-megaregional areas though, is primarily due to the sheer size of
the remainder of the country, as non-megaregional space makes up 74% of the U.S. Thus
megaregions, which encompass only 26% of land area, have 39% of the airports. To
provide air service to the population throughout the country, airports are located even in
otherwise remote spaces, but in megaregions they exist in higher density.
The megaregions’ larger concentration of airports indicates better access to air
travel for megaregional populations. In most cases, each megaregion’s airport density is
much higher than the national average of 4.3 airports per 10,000 square miles.
Megaregions on average have a density of 6.6 airports per 10,000 square miles as
compared to non-megaregions at 3.5 airports per 10,000 square miles. All but three

56
megaregions have higher densities than the national average, as seen in Table 4.1, with
the highest being the Northeast megaregion at 14.0 per 10,000 square miles, and Southern
Florida in second with 11.9. This corresponds appropriately to their high population
densities, as these two megaregions are the top two in people per square mile. The desert
and mountainous megaregions, however, do stand out as exceptions. The Arizona Sun
Corridor, Front Range, and Texas Triangle megaregions all have lower airport densities
than the national average. This indicates that their airport infrastructure is concentrated
around the major metropolitan areas with fewer airports in between. Figure 4.1 shows the
national spatial distribution of airports in the U.S., and it is clear that these three
megaregions have a lower intensity of airport concentration.
Table 4.1 Megaregion Airports by Area and Population
Megaregion
Number of Airports in T-100 and
NTAD
Airport Density (per
10,000 sq miles)
Airports per capita (per
million persons)
Arizona Sun Corridor 16 3.3 3.5 Cascadia 25 5.3 3.4 Front Range 12 2.1 2.5 Gulf Coast 36 6.2 3.1 Midwest 138 6.7 2.6 Northeast 86 14.0 1.7 Northern California 35 7.3 2.8 Piedmont 43 7.2 2.9 Southern California 48 7.8 2.2 Southern Florida 46 11.9 3.1 Texas Triangle 36 4.2 2.2 Megaregions 511 6.6 2.5 Rest of Country 797 3.5 10.8 United States 1308 4.3 4.7 Megaregion Percent 39% n/a n/a
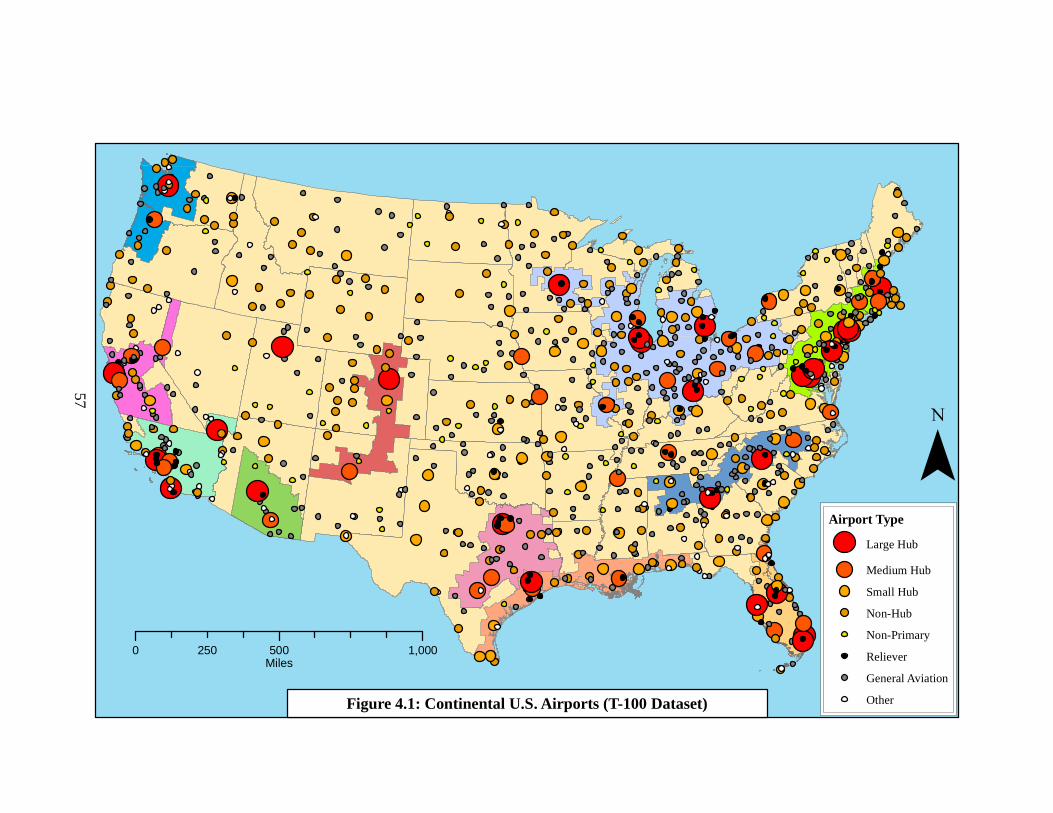
Airport Type
Large Hub
Medium Hub
Small Hub
Non-Hub
Non-Primary
Reliever
General Aviation
Other
¯
0 500 1,000250Miles
Figure 4.1: Continental U.S. Airports (T-100 Dataset)
57

58
4.1.2 Airports per Capita
The megaregions have a sharp difference in the number of airports for their respective
populations as compared to non-megaregional areas. This is verified when examining the
airports per capita, seen in Table 4.1; in non-megaregion areas there are more airports per
million persons than in megaregions, 10.8 for the former compared to 2.5 for the latter.
Although megaregions have higher densities of airports, there are fewer airports to serve
the respective populations. With five times as many airports for its population, non-
megaregion areas’ need for air service for passenger and cargo movements is directly
related to the larger areas served. Despite its large spread of where people and businesses
are located, airports still must exist to provide the infrastructure for air travel.
The Northeast has the fewest airports per capita with 1.7 airports per million
persons, a reflection of larger populations and population densities in the Northeast. This
measure potentially reflects the higher air congestion levels in this megaregion. Southern
California and the Texas Triangle have the second lowest number of airports per capita.
The Arizona Sun Corridor, Cascadia, Gulf Coast, and Southern Florida all have airports
per capita that are higher than three per million persons, but still are less than the national
average of 4.7 per million persons.
4.1.3 Airports and Economic Production
Megaregions’ economic production as measured in GMP is much higher than that for
other parts of the U.S. Nationally, there are 10.5 airports for every $100 billion of GDP.
There is a clear distinction between megaregions and non-megaregion areas as seen in
Table 4.2. Megaregions on average have 5.5 airports for every $100 billion of GMP,
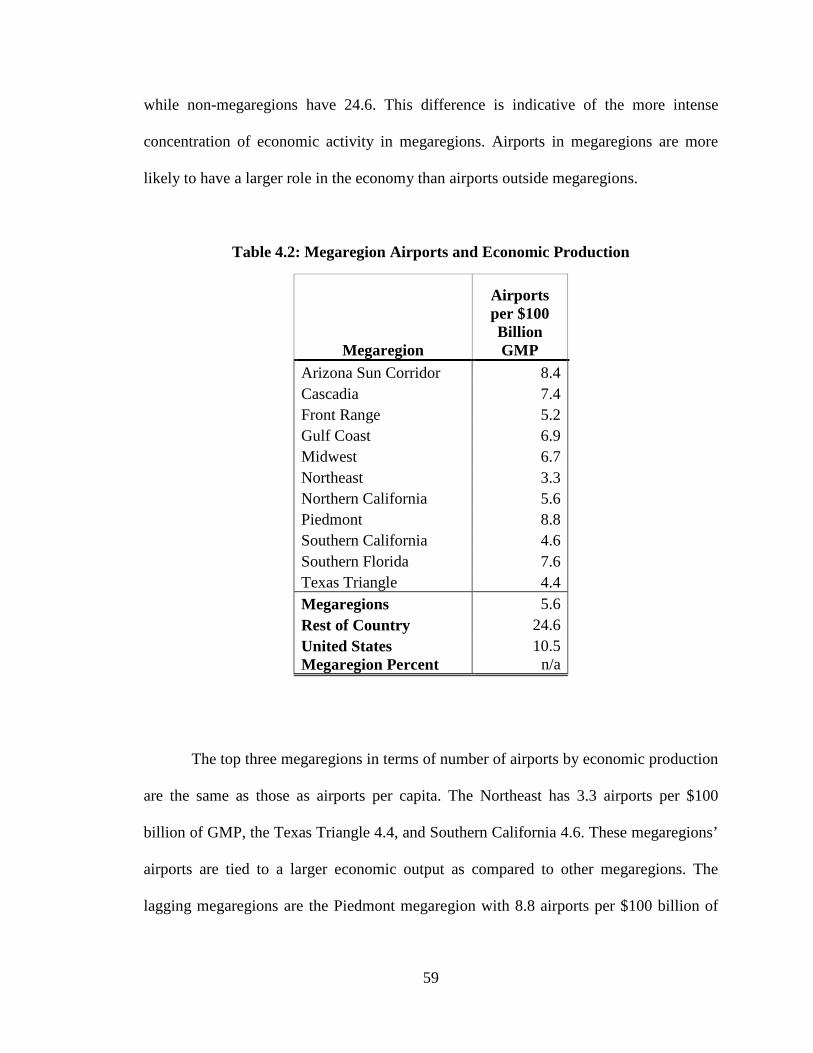
59
while non-megaregions have 24.6. This difference is indicative of the more intense
concentration of economic activity in megaregions. Airports in megaregions are more
likely to have a larger role in the economy than airports outside megaregions.
Table 4.2: Megaregion Airports and Economic Production
Megaregion
Airports per $100 Billion GMP
Arizona Sun Corridor 8.4 Cascadia 7.4 Front Range 5.2 Gulf Coast 6.9 Midwest 6.7 Northeast 3.3 Northern California 5.6 Piedmont 8.8 Southern California 4.6 Southern Florida 7.6 Texas Triangle 4.4 Megaregions 5.6 Rest of Country 24.6 United States 10.5 Megaregion Percent n/a
The top three megaregions in terms of number of airports by economic production
are the same as those as airports per capita. The Northeast has 3.3 airports per $100
billion of GMP, the Texas Triangle 4.4, and Southern California 4.6. These megaregions’
airports are tied to a larger economic output as compared to other megaregions. The
lagging megaregions are the Piedmont megaregion with 8.8 airports per $100 billion of

60
GMP, and the Arizona Sun Corridor with 8.4, although both are still in a better position
than the national average.
4.1.4 Hub Airports
Hub airports can be defined in two ways: a descriptive FAA measurement of activity at
an airport or an airport that functions as the hub in a hub-and-spoke network for an
airline. Both usages of the term “hub” are discussed in terms of megaregions in the
following section.
4.1.4.1 FAA Hubs
The definition of hubs under FAA terminology is used to determine funding for federal
programs, and is defined by the level of annual passenger activity at an airport. Primary
airports handle at least 10,000 passengers per year. Of these, large hubs handle at least
1% of all annual U.S. passenger movements, medium hubs between 0.25 and 1%, small
hubs between 0.05 and 0.25%, and non-hubs above 10,000 but less than 0.05%. Airports
in NPIAS that have less than 10,000 annual passengers, but greater than 2,500 annual
passengers are classified as non-primary airports. General aviation airports handle fewer
than 2,500 passenger each year, and are the smallest category. Reliever airports are
general aviation airports that can be used to relieve large primary airports when
necessary. All of these airport categories are displayed in Figure 4.1 to show the
distribution of hub airports throughout the U.S. In Table 4.3, each megaregion is listed
with the types and number of FAA hubs that are within the megaregion. Primary, non-
primary, reliever, and general aviation airports are only located on the map and included
in the analysis if they had T-100 data associated with them in the last eighteen years, so

61
Figure 4.1 is not a map of all airport facilities in the nation, only those that had passenger
or freight movements reported to the FAA through the T-100 form.
Table 4.3: Megaregion FAA Airport Hubs
Hubs
Megaregion Large Medium Small Non-hub
Total Primary
% Primary
Arizona Sun Corridor 1 1 0 0 2 12.5% Cascadia 1 1 0 6 8 32.0% Front Range 1 1 1 3 6 50.0% Gulf Coast 1 2 6 7 16 44.4% Midwest 5 6 10 25 46 33.3% Northeast 8 3 5 13 29 33.7% Northern California 1 4 1 3 9 25.7% Piedmont 2 1 4 2 9 20.9% Southern California 3 3 3 8 17 35.4% Southern Florida 4 3 2 7 16 34.8% Texas Triangle 2 4 0 6 12 33.3% Megaregions 28 28 32 79 167 32.7% Rest of Country 2 9 40 158 209 26.2% United States 30 37 72 237 376 28.7% Megaregion Percent 93% 76% 44% 33% 44% n/a
Major airports are more often found in megaregions than elsewhere. Within
megaregions, hub airports make up almost one third of all megaregion airports, but only
just over a quarter in nonmegaregion areas. Despite having only 39% of all U.S. airports
on 26% of U.S. land area, megaregions have 44% of all primary airports. Of these, the
majority of large hubs and medium hubs are found in megaregions, 93% and 76%,
respectively. Non-megaregions altogether have only two large hub airports. The
62
megaregions are the locations of the country’s largest economic engines, and large
airports are part of the conglomeration to support such strong growth.
Individually, megaregions have different distributions of primary airports. All
megaregions have at least one large hub and one medium hub airport. All but the Arizona
Sun Corridor has a large number of non-hub primary airports, and this FAA group is
often the largest of all the categories for a given megaregion. The Midwest megaregion
has the most primary airports – 46 – due mainly to its large size, five of which are large
hubs. The Northeast, although second with 29 primary airports, has the largest number of
large hubs with eight. The Southern California, Gulf Coast, and Southern Florida
megaregions are the next highest in the number of primary airports. The Arizona Sun
Corridor only has two primary airports, and lags behind all other megaregions in terms of
hub airport infrastructure.
4.1.4.2 Airline Hubs
U.S. legacy airlines are characterized by extensive hub-and-spoke networks, with airline
hubs having been established nationwide. Even low cost airlines have focus cities that
have higher levels of activity and transfers of passengers. Freight airlines also have hubs
built to focus where goods are transferred between airplanes. Megaregions are often the
choice place to locate airline hubs because airports there are often larger, have a higher
propensity for international passengers, and are located near major metropolitan areas
which have the talent pool necessary for the corporate management and maintenance of
an airline and its airplanes. The level of airline hubbing activity in a megaregion is
indicative of the role that a megaregion plays in the U.S. aviation industry.
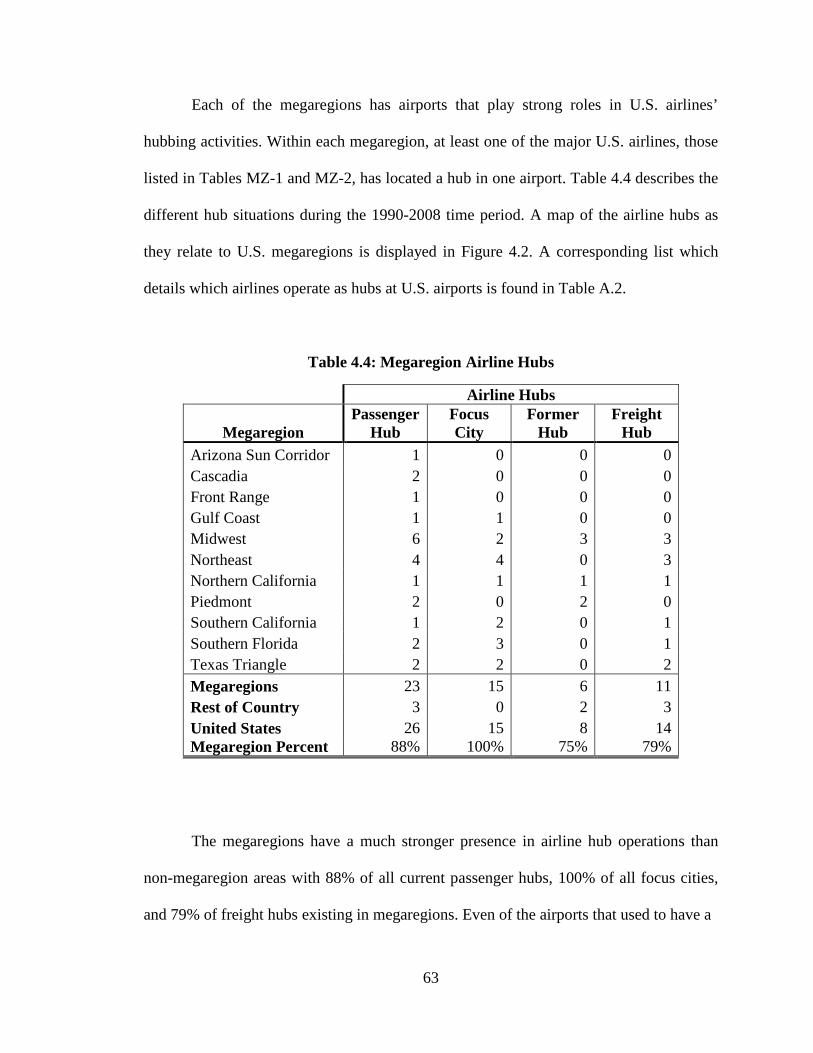
63
Each of the megaregions has airports that play strong roles in U.S. airlines’
hubbing activities. Within each megaregion, at least one of the major U.S. airlines, those
listed in Tables MZ-1 and MZ-2, has located a hub in one airport. Table 4.4 describes the
different hub situations during the 1990-2008 time period. A map of the airline hubs as
they relate to U.S. megaregions is displayed in Figure 4.2. A corresponding list which
details which airlines operate as hubs at U.S. airports is found in Table A.2.
Table 4.4: Megaregion Airline Hubs
Airline Hubs
Megaregion Passenger
Hub Focus City
Former Hub
Freight Hub
Arizona Sun Corridor 1 0 0 0 Cascadia 2 0 0 0 Front Range 1 0 0 0 Gulf Coast 1 1 0 0 Midwest 6 2 3 3 Northeast 4 4 0 3 Northern California 1 1 1 1 Piedmont 2 0 2 0 Southern California 1 2 0 1 Southern Florida 2 3 0 1 Texas Triangle 2 2 0 2 Megaregions 23 15 6 11 Rest of Country 3 0 2 3 United States 26 15 8 14 Megaregion Percent 88% 100% 75% 79%
The megaregions have a much stronger presence in airline hub operations than
non-megaregion areas with 88% of all current passenger hubs, 100% of all focus cities,
and 79% of freight hubs existing in megaregions. Even of the airports that used to have a
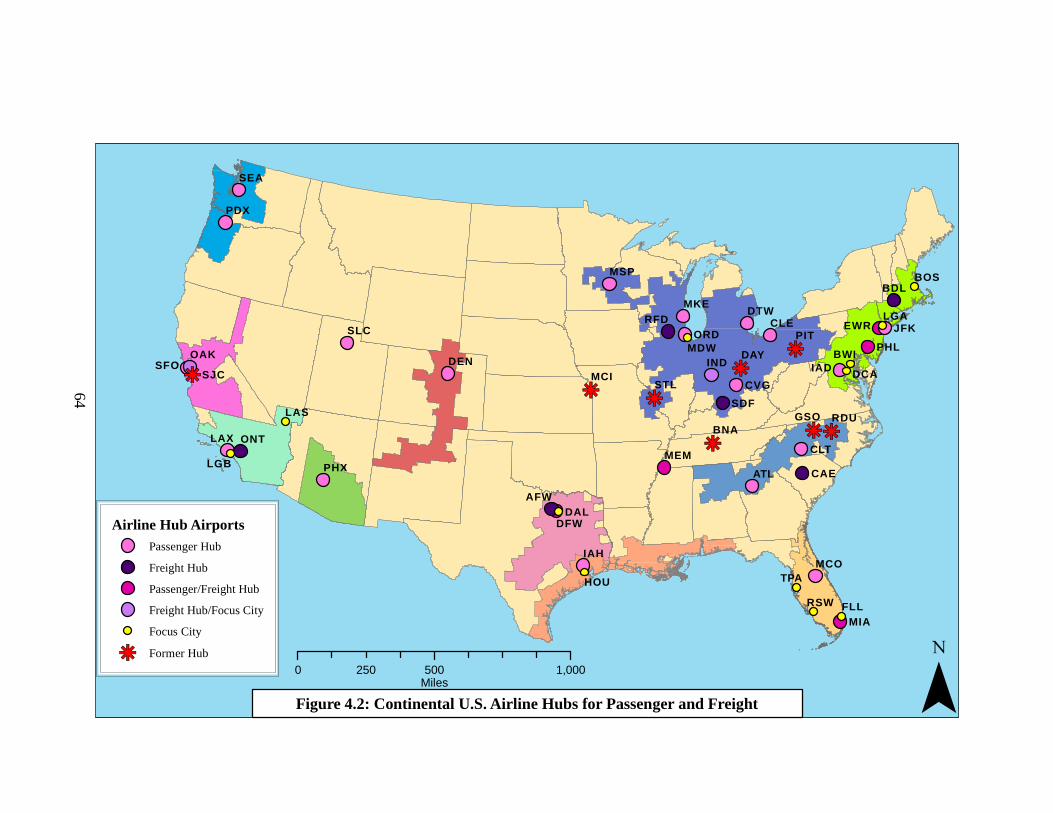
h h
hh
h
hhh
g g
gg
g
ggg
DFW
MIA
PHL
EWR
MEM
PDX
PHX
DENSFO
SLC
IAHMCO
LAXCLT
ATL
JFK
IAD
MKE
CLE
MSP
CVG
DTW
ORD
SEA
INDOAK
CAE
AFW
ONT
BDL
RFD
SDF
MCI
BNARDUGSO
SJC
PIT
DAY
STLDCA
LAS
HOU
DAL
TPA
MDW
RSW FLL
LGB
LGA
BWI
BOS
¯0 500 1,000250
Miles
Figure 4.2: Continental U.S. Airline Hubs for Passenger and Freight
Airline Hub AirportsPassenger Hub
Freight Hub
Passenger/Freight Hub
Freight Hub/Focus City
Focus City
hg Former Hub
64
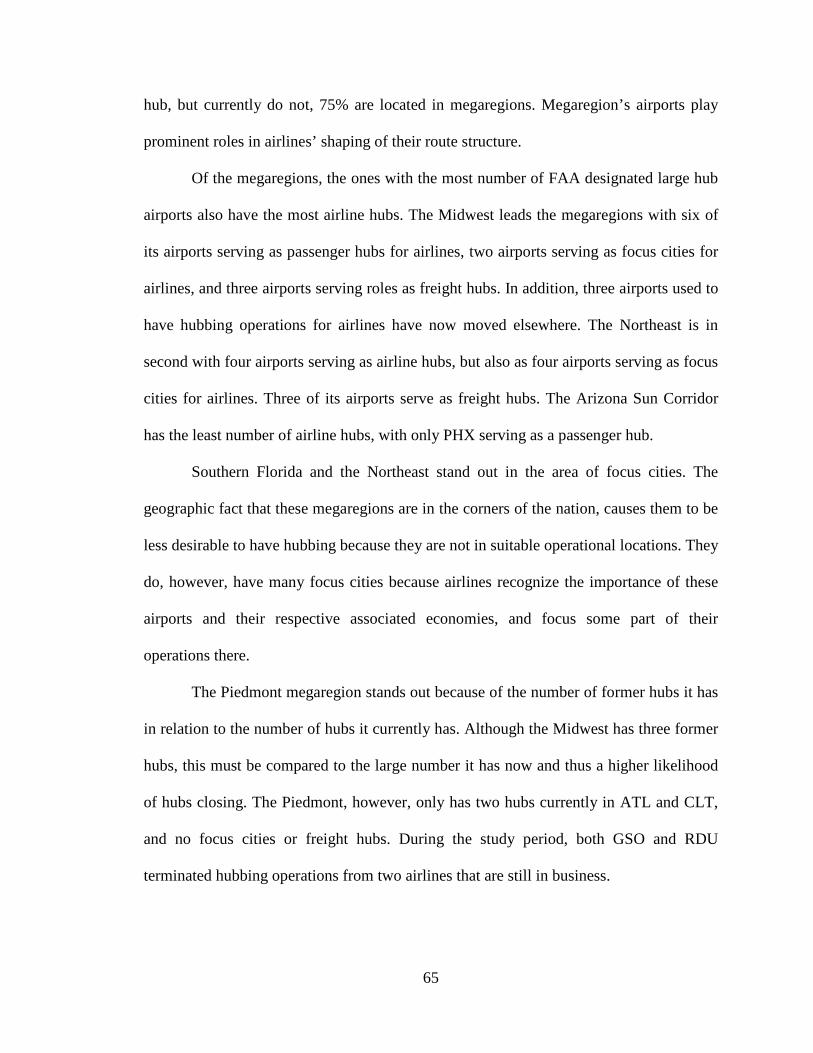
65
hub, but currently do not, 75% are located in megaregions. Megaregion’s airports play
prominent roles in airlines’ shaping of their route structure.
Of the megaregions, the ones with the most number of FAA designated large hub
airports also have the most airline hubs. The Midwest leads the megaregions with six of
its airports serving as passenger hubs for airlines, two airports serving as focus cities for
airlines, and three airports serving roles as freight hubs. In addition, three airports used to
have hubbing operations for airlines have now moved elsewhere. The Northeast is in
second with four airports serving as airline hubs, but also as four airports serving as focus
cities for airlines. Three of its airports serve as freight hubs. The Arizona Sun Corridor
has the least number of airline hubs, with only PHX serving as a passenger hub.
Southern Florida and the Northeast stand out in the area of focus cities. The
geographic fact that these megaregions are in the corners of the nation, causes them to be
less desirable to have hubbing because they are not in suitable operational locations. They
do, however, have many focus cities because airlines recognize the importance of these
airports and their respective associated economies, and focus some part of their
operations there.
The Piedmont megaregion stands out because of the number of former hubs it has
in relation to the number of hubs it currently has. Although the Midwest has three former
hubs, this must be compared to the large number it has now and thus a higher likelihood
of hubs closing. The Piedmont, however, only has two hubs currently in ATL and CLT,
and no focus cities or freight hubs. During the study period, both GSO and RDU
terminated hubbing operations from two airlines that are still in business.

66
4.1.5 Summary
It is evident that megaregions have a larger concentration of airports, especially
significant airports, than the non-megaregion areas. There are more airports per square
mile and a larger portion of those airports are primary hubs, with the largest hubs being
almost entirely found in megaregions. Although there are more airports total in non-
megaregion areas, they are more frequently smaller airport facilities serving areas that
require air service. Thus, it was seen that non-megaregion airports serve smaller groups
of people with more airports per capita. Lastly, megaregions are more likely to be the
location of airline hubs over non-megaregions.
Amongst the megaregions, there is certainly a difference between how involved a
megaregion is in air travel. The megaregions with greatest density of airports also have
the greatest population densities. The opposite statement is true as well, as the least
densely populated megaregions have the lower airport densities, even less than the non-
megaregion areas. Megaregions with larger economies have less airports per dollars
produced, but use their airports more intensely as they have less airports per person. The
megaregions with the largest size and population have the most airline hubs and focus
cities, but it is worthy to note that all megaregions have been picked by at least one
airline to have a hub located there, so each megaregion is connected to some extensive set
of direct flights.
4.2 Megaregion Air Traffic Volumes
The megaregions’ level of air traffic for passenger and freight differs by each individual
megaregion’s characteristics. There is no leading megaregion in air travel that is at the

67
top in all measures of comparison. The following section looks at passenger and freight
movements in air travel for the eleven megaregions, non-megaregion areas, and
international travel (when applicable).
In all cases, production and attraction numbers for air travel are displayed for
future researchers’ reference, but note that in almost all cases the ranked order is the
same. Thus, for purposes of discussion, productions and attractions are not discussed
separately, but grouped together and discussed generally as “trips” for passenger travel
and “freight” for pounds of freight.
4.2.1 Gross Volume of Movements
The following section is an examination of the flows from the T-100 database for all
airports grouped into their respective megaregions or other spatial designations. The
flows are from 1990-2008 and include all reported traffic during that time period.
4.2.1.1 Passenger Traffic
The rankings of air passenger traffic is very similar to the ranking of megaregions by
their population. The two most populated megaregions, the Midwest and the Northeast,
are at the top of the list with 2.2 and 1.8 billion trips, respectively, as seen in Table 4.5.
The remaining megaregions, on the list below non-megaregion and international areas,
are also primarily in order of the size of population. The only difference is the Front
Range, which has 20% more trips than Cascadia, although the latter has a population over
50% larger. The Arizona Sun Corridor has the least number of trips over the time period
with about 340 million.
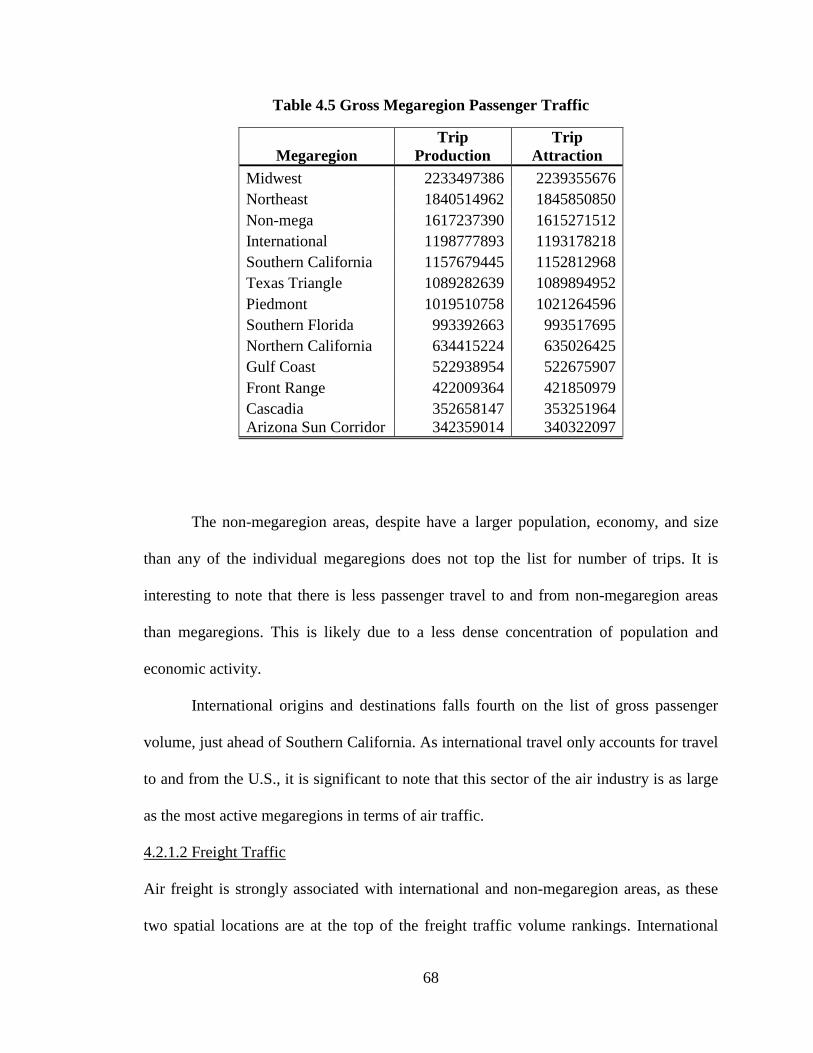
68
Table 4.5 Gross Megaregion Passenger Traffic
Megaregion Trip
Production Trip
Attraction Midwest 2233497386 2239355676 Northeast 1840514962 1845850850 Non-mega 1617237390 1615271512 International 1198777893 1193178218 Southern California 1157679445 1152812968 Texas Triangle 1089282639 1089894952 Piedmont 1019510758 1021264596 Southern Florida 993392663 993517695 Northern California 634415224 635026425 Gulf Coast 522938954 522675907 Front Range 422009364 421850979 Cascadia 352658147 353251964 Arizona Sun Corridor 342359014 340322097
The non-megaregion areas, despite have a larger population, economy, and size
than any of the individual megaregions does not top the list for number of trips. It is
interesting to note that there is less passenger travel to and from non-megaregion areas
than megaregions. This is likely due to a less dense concentration of population and
economic activity.
International origins and destinations falls fourth on the list of gross passenger
volume, just ahead of Southern California. As international travel only accounts for travel
to and from the U.S., it is significant to note that this sector of the air industry is as large
as the most active megaregions in terms of air traffic.
4.2.1.2 Freight Traffic
Air freight is strongly associated with international and non-megaregion areas, as these
two spatial locations are at the top of the freight traffic volume rankings. International

69
freight is very significant in the U.S. air system, accounting for more than the next two
spatial areas combined, as seen in Table 4.6. Although shipping and trucking (from
Canada and Mexico) are still significant portions of the international freight
transportation industry, air transportation is still an important means for goods to find
their way to the U.S.
Table 4.6: Gross Megaregion Freight Movements
Megaregion
Freight Production
(lbs)
Freight Attraction
(lbs) %
Diff. International 149055487830 119762786769 -24.5% Non-mega 67716165918 71690064963 5.5% Midwest 67107936434 69755512106 3.8% Northeast 51214365318 62305515009 17.8% Southern Florida 33059915447 36671690741 9.8% Southern California 32349299365 36127652823 10.5% Northern California 17174119559 17612612694 2.5% Texas Triangle 16492881128 17475940429 5.6% Piedmont 13693499432 15355998769 10.8% Cascadia 7965617308 7678087151 -3.7% Gulf Coast 6424920968 6350158174 -1.2% Front Range 3779691569 4738578159 20.2% Arizona Sun Corridor 2671148588 3180451077 16.0%
There was a significant difference between productions and attractions for the
megaregions, international, and non-megaregion areas. Table 4.6 shows the percent
difference between what was produced and attracted to a given area. It is noticeable that
the U.S. as a whole imports more goods through air freight than it exports. Thus, there is
a 25% difference between international freight production and attraction, with more
goods coming from overseas than being sent back by airplane. This difference in

70
international air exports and imports is seen all the way down through the list; all but two
of the megaregions and the non-megaregion areas have slightly larger freight attractions
than freight productions. The Front Range, Northeast, and Arizona Sun Corridor
megaregions have the highest rates of importing, with 20.2%, 17.8%, and 16.0%,
respectively. The two megaregions that produce more than they attract, Cascadia and
Gulf Coast, stand out among the rest by producing 3.7% and 1.2% more than they attract,
respectively.
The combined non-megaregion areas have the second highest level of freight
flows. This is indicative of the need of the populations to ship and receive goods to what
are more isolated areas. Because of the sheer size of the non-megaregion areas, it is
possible that for many populations, air freight is the most efficient way to transport
goods.
Comparing the overall volume of freight movements, three megaregions stand out
as being higher ranked as compared to megaregional population. Southern Florida is sixth
in terms of population yet is third of all the megaregions in terms of freight movements.
Northern California is seventh in population and fifth out of the megaregions for freight.
Cascadia also moves slightly up the list in terms of freight movements, jumping over the
Gulf Coast which has a higher population. In all, it seems the coastal megaregions are
more involved in attracting and producing air freight than the mid-continental
megaregions, likely because they are the major entry and exit points for international
goods.

71
4.2.2 Movements Standardized by Area
In the following section, the flows in Tables 4.5 and 4.6 are standardized by the
megaregions’ respective land area. In this part of the study, international movements are
excluded, because there is no suitable way to represent the area of the regions in which
freight travels to and from internationally.
4.2.2.1 Passenger Traffic
The most significant result from the comparison of passenger traffic per square mile is
the insignificant amount of travel from the non-megaregion areas. As seen in Table 4.7,
with just over 700 passenger trips per square mile over the study period, the non-
megaregion areas have an order of magnitude difference when compared to all
megaregions. It is clear that the non-megaregion populations have a much lower
propensity to engage in air travel than megaregion populations for the size of the area it
encompasses.
Table 4.7: Megaregion Passenger Traffic by Land Area
Megaregion Trip Production/
Sq mi Trip Attraction/
Sq mi Northeast 29862 29949 Southern Florida 25613 25617 Southern California 18713 18634 Piedmont 17111 17140 Northern California 13170 13182 Texas Triangle 12850 12857 Midwest 10893 10922 Gulf Coast 9042 9038 Cascadia 7449 7462 Front Range 7439 7436 Arizona Sun Corridor 7014 6973 Non-mega 720 719 International n/a n/a

72
The Northeast megaregion has the largest number of trips for its size, with nearly
30,000 trips per square mile. The Northeast is not nearly the smallest megaregion, but
still has very high levels of passenger travel for its size. Southern Florida is second on the
list, but also is the smallest of all the megaregions so there is a better opportunity for
more travel for its size. Southern California is third on the list despite being third in size
as well. The largest megaregion in size, the Midwest, is seventh in terms of trips per
square mile. The Front Range and the Arizona Sun Corridor are at the bottom of the list
of all megaregions by passenger traffic per square mile.
4.2.2.2 Freight Traffic
By land area, the non-megaregion areas again have the lowest volume of freight
movements. The ranking of all the spaces is shown in Table 4.8. The difference, though,
is not as large as it is with passenger travel, and is in the same order of magnitude.
Despite being at the top of gross flows, non-megaregion areas cover large areas, and are
not involved as heavily per square mile as the megaregions.
Southern Florida and the Northeast have the greatest amount of freight flows by
land area. These two megaregions, for their size, are very heavily involved in freight.
Their roles as international gateways likely have a strong effect in putting them at the top
of the list. These are followed by the two California megaregions. The largest
megaregion, the Midwest, is in fifth for freight volumes by land area. At the bottom of
the rankings, just over twice as much freight flows than the non-megaregion areas, is the
Arizona Sun Corridor.

73
Table 4.8: Megaregion Freight Movements by Land Area
Megaregion Freight Production
(lbs) / Sq mi Freight Attraction
(lbs) / Sq mi Southern Florida 852411 945537 Northeast 830943 1010895 Southern California 522901 583976 Northern California 356517 365619 Midwest 327305 340218 Piedmont 229826 257729 Texas Triangle 194565 206162 Cascadia 168260 162187 Gulf Coast 111092 109800 Front Range 66625 83527 Arizona Sun Corridor 54727 65161 Non-mega 30158 31928 International n/a n/a
4.2.3 Movements Standardized by Population
The standardization by population for megaregions gives a perspective as to which
megaregions’ populations travel more and ship more goods. The following section is a
comparison of the data from Tables 4.5 and 4.6 divided by the population. International
flows are not included because there is not a standard population base for these origins
and destinations.
4.2.3.1 Passenger Traffic
The top megaregions with volumes standardized by population are those which are more
isolated and landlocked in the center of the country. With a small population, but one
which is active in air travel, the Front Range leads all the megaregions in trips per person.
Due perhaps to its isolation in the center of the country, the Front Range has around 14
more trips per person than the second place Arizona Sun Corridor, as seen in Table 4.9.
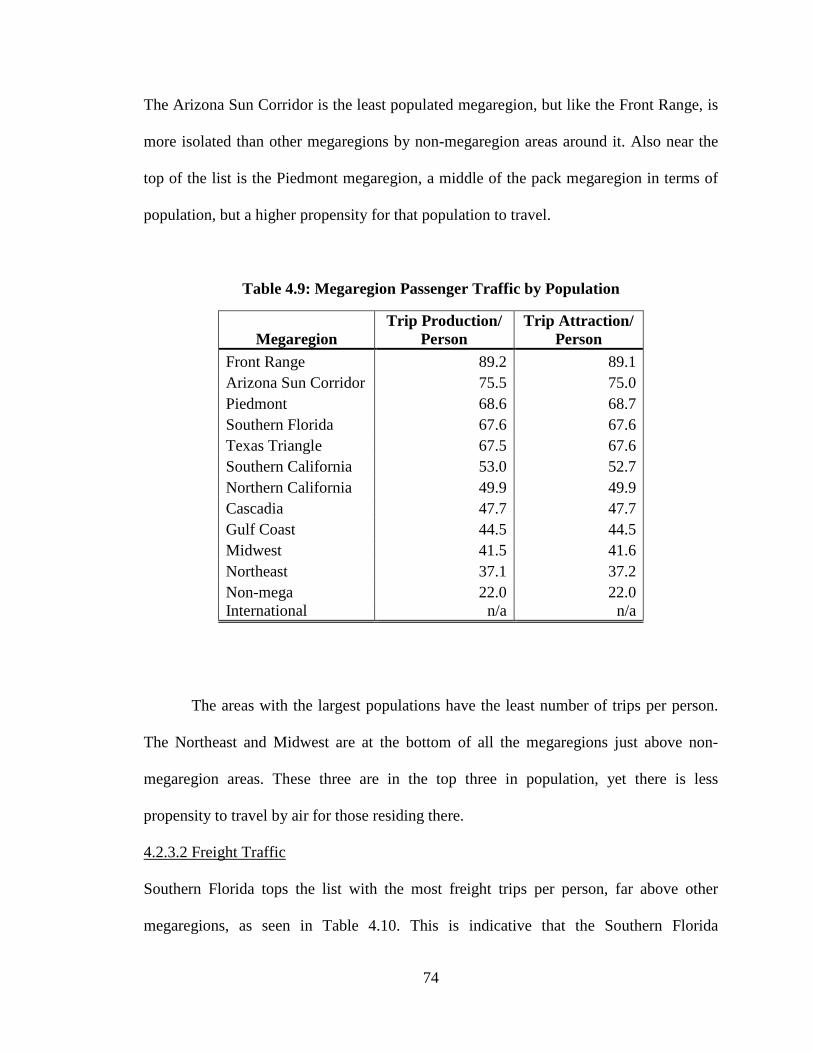
74
The Arizona Sun Corridor is the least populated megaregion, but like the Front Range, is
more isolated than other megaregions by non-megaregion areas around it. Also near the
top of the list is the Piedmont megaregion, a middle of the pack megaregion in terms of
population, but a higher propensity for that population to travel.
Table 4.9: Megaregion Passenger Traffic by Population
Megaregion Trip Production/
Person Trip Attraction/
Person Front Range 89.2 89.1 Arizona Sun Corridor 75.5 75.0 Piedmont 68.6 68.7 Southern Florida 67.6 67.6 Texas Triangle 67.5 67.6 Southern California 53.0 52.7 Northern California 49.9 49.9 Cascadia 47.7 47.7 Gulf Coast 44.5 44.5 Midwest 41.5 41.6 Northeast 37.1 37.2 Non-mega 22.0 22.0 International n/a n/a
The areas with the largest populations have the least number of trips per person.
The Northeast and Midwest are at the bottom of all the megaregions just above non-
megaregion areas. These three are in the top three in population, yet there is less
propensity to travel by air for those residing there.
4.2.3.2 Freight Traffic
Southern Florida tops the list with the most freight trips per person, far above other
megaregions, as seen in Table 4.10. This is indicative that the Southern Florida
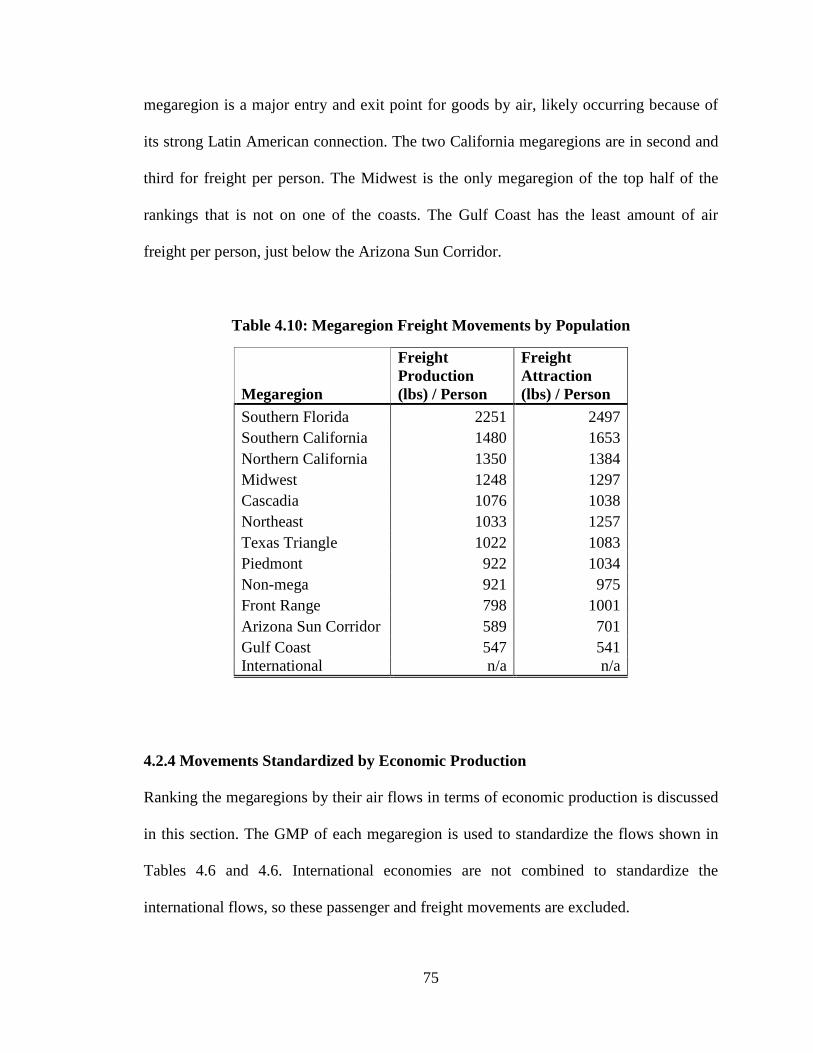
75
megaregion is a major entry and exit point for goods by air, likely occurring because of
its strong Latin American connection. The two California megaregions are in second and
third for freight per person. The Midwest is the only megaregion of the top half of the
rankings that is not on one of the coasts. The Gulf Coast has the least amount of air
freight per person, just below the Arizona Sun Corridor.
Table 4.10: Megaregion Freight Movements by Population
Megaregion
Freight Production (lbs) / Person
Freight Attraction (lbs) / Person
Southern Florida 2251 2497 Southern California 1480 1653 Northern California 1350 1384 Midwest 1248 1297 Cascadia 1076 1038 Northeast 1033 1257 Texas Triangle 1022 1083 Piedmont 922 1034 Non-mega 921 975 Front Range 798 1001 Arizona Sun Corridor 589 701 Gulf Coast 547 541 International n/a n/a
4.2.4 Movements Standardized by Economic Production
Ranking the megaregions by their air flows in terms of economic production is discussed
in this section. The GMP of each megaregion is used to standardize the flows shown in
Tables 4.6 and 4.6. International economies are not combined to standardize the
international flows, so these passenger and freight movements are excluded.
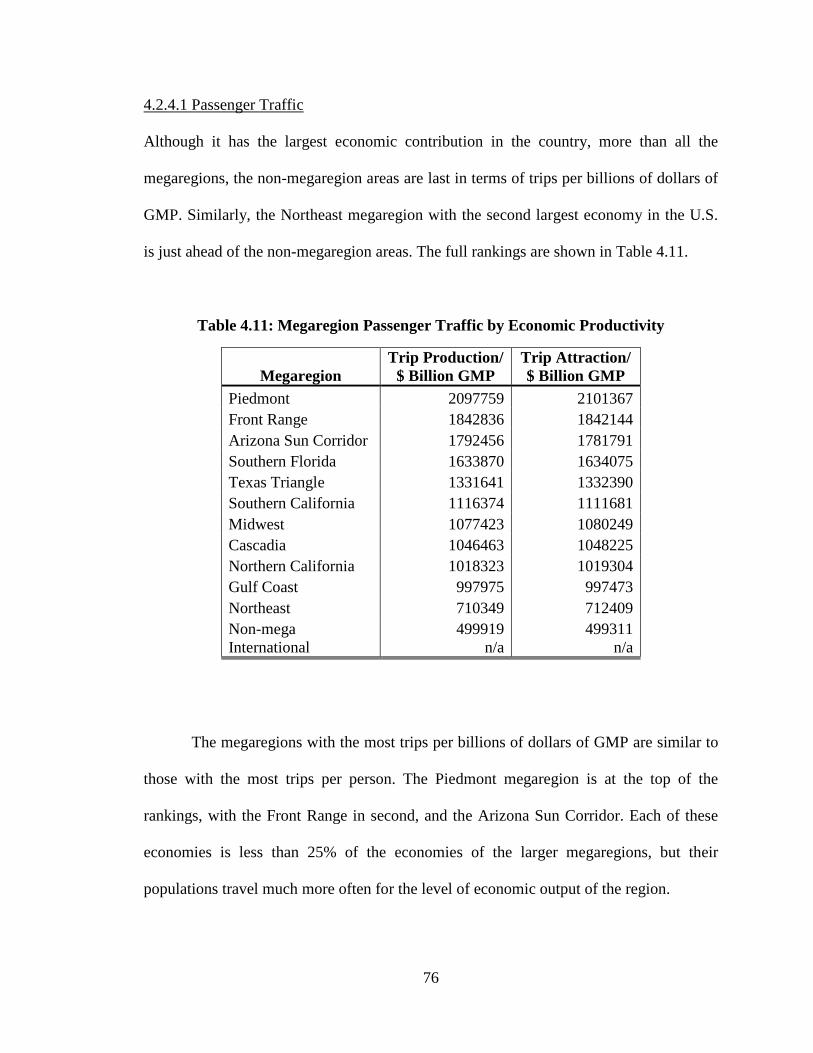
76
4.2.4.1 Passenger Traffic
Although it has the largest economic contribution in the country, more than all the
megaregions, the non-megaregion areas are last in terms of trips per billions of dollars of
GMP. Similarly, the Northeast megaregion with the second largest economy in the U.S.
is just ahead of the non-megaregion areas. The full rankings are shown in Table 4.11.
Table 4.11: Megaregion Passenger Traffic by Economic Productivity
Megaregion Trip Production/
$ Billion GMP Trip Attraction/ $ Billion GMP
Piedmont 2097759 2101367 Front Range 1842836 1842144 Arizona Sun Corridor 1792456 1781791 Southern Florida 1633870 1634075 Texas Triangle 1331641 1332390 Southern California 1116374 1111681 Midwest 1077423 1080249 Cascadia 1046463 1048225 Northern California 1018323 1019304 Gulf Coast 997975 997473 Northeast 710349 712409 Non-mega 499919 499311 International n/a n/a
The megaregions with the most trips per billions of dollars of GMP are similar to
those with the most trips per person. The Piedmont megaregion is at the top of the
rankings, with the Front Range in second, and the Arizona Sun Corridor. Each of these
economies is less than 25% of the economies of the larger megaregions, but their
populations travel much more often for the level of economic output of the region.

77
4.2.4.2 Freight Traffic
Freight movement is closely tied to the size of an economy, and Southern Florida is a
much larger producer of freight trips per billion dollars of GMP than all the other
megaregions. The Midwest and Southern California megaregion, the second and third
largest of the megaregion economies, each have a standardized flow rate that is less than
60% that of Southern Florida, as seen in Table 4.12.
Table 4.12: Megaregion Freight Movements by Economic Productivity
Megaregion
Freight Production (lbs)/ $ Billion GMP
Freight Attraction (lbs)/ $ Billion GMP
Southern Florida 54374861 60315281 Midwest 32372376 33649548 Southern California 31195081 34838624 Piedmont 28175925 31596705 Northern California 27566805 28270646 Cascadia 23636847 22783641 Non-mega 20932354 22160762 Texas Triangle 20162446 21364230 Northeast 19766254 24046899 Front Range 16505203 20692481 Arizona Sun Corridor 13985071 16651576 Gulf Coast 12261300 12118622 International n/a n/a
The non-megaregions are higher up on this list than any other previous
standardized freight list. This indicates that even with its overall large economic
contribution, it is still very active in the movement of freight. The bottom of the list is
similar to other freight standardized freight lists, with the Gulf Coast taking the bottom
spot, and the Arizona Sun Corridor and the Front Range megaregions just ahead.
78
4.2.5 Summary
Comparing megaregions by their passenger travel is almost as simple as ordering them in
terms of the size of their populations. It appears that the larger a population is the higher
volume of passenger flow occurs. Non-megaregion areas, however, are an exception, and
although it has a very large population, it falls behind two megaregions in terms of
passenger flow.
Standardizing passenger flow does not produce a clear frontrunner for a
megaregion that is more apt to passenger flow. The Piedmont and Southern Florida
megaregions are consistently at the top of rankings of standardized flows by area,
population, and economic productivity, but other megaregions are at the top for some and
at the bottom for others. The Northeast for example is at the top of trip production per
square mile, but the bottom megaregion when comparing standardizations by population
and economic productivity. Non-megaregion areas consistently are at the bottom of the
standardized rankings, and appear to lag behind the megaregions in terms of passenger
flow rate.
Freight flows have a consistent group of megaregions which fall at the top and
bottom of any standardized ranking. Southern Florida is at the top of all the standardized
rankings, splitting only the ranking by area with the Northeast. This shows the
megaregion is very active in freight movements for the size of its population, area, and
economy. Just as Southern Florida dominates the top, the Arizona Sun Corridor and the
Gulf Coast have the lowest standardized freight flows.
79
It must be noted that international freight has the largest effect on the flow of
freight in U.S. As a whole, the country imports much more than it exports, an almost 25%
different. It follows that most of the megaregions, except Cascadia and the Gulf Coast,
have higher exports. It appears that the megaregions most likely to be involved with
international freight, those along the coasts, are at the top of the standardized rankings.
4.3 Origin-Destination Megaregion Pairs
The air passenger and freight flows between megaregion, non-megaregion areas, and
international markest provide insight into the social and economic connections between
populations and industries. In this section, the origin-destination flows between pairs of
megaregions, non-megaregion areas, and internationally are analyzed. Through a ranking
of top pairs, the strongest connections are examined and relationships are found. As such,
this section only focuses on the largest flows, while the section after provides a
megaregion-by-megaregion examination of the flow of each. The comparisons that
follow are for both passenger and freight flows, looking at the gross totals, and
normalizations by area, population, and economic productivity.
4.3.1 Gross Volume of OD Pair Movements
The top flows between the areas in the study are listed in the following section. These
flows are the gross flows over the course of the study period. Each of the flows is
described by two endpoints, the flow between them, the directional flows, and the
difference between the directional flows. Pairings are described as being
80
Intermegaregional (Intermega), Intramegaregional (Intramega), Non-megaregional (Non-
mega), and International.
4.3.1.1 Passenger Traffic
The largest megaregions, the Northeast and Midwest dominate the rankings of passenger
flow pairs. Twelve of the top twenty pairings of flows, including the entire top five, have
one endpoint within either the Northeast or the Midwest megaregions, as seen in Table
4.13. These megaregions, large in population and economic production, are not
surprisingly very significant players in the U.S. air industry. Together, as well, they make
up the top pairing, with 688 million passengers.
The Northeast has a strong connection to other countries because it contains the
nation’s financial (New York) and government (Washington, D.C.) centers, and thus the
number two pairing is the Northeast and International airports, with 660 million
passengers. As well, the Northeast has a strong connection to Southern Florida, and this
pairing is the fifth largest in volume with 500 million passengers. The Northeast’s flows
with the Piedmont megaregion (349 million), non-megaregion areas (301), and its
intramega flows (256) also make the Top 20.
The Midwest is the largest megaregion by area with long distances between many
of its largest cities. There is a strong connection between these cities, causing the
Midwest intramega flows to land at third on the list with 616 million passenger trips. The
Midwest also has a strong connection with non-megaregion areas, which is in fourth
place with 560 million passengers. Other connections in the Top 20 for the Midwest are
with Southern Florida (323 million), the Piedmont (306), International (291), and
Southern California (283).

81
Table 4.13: Top 20 Megaregion Passenger Flow Pairs
Total Flow (millions) A B Flow Type
A to B (millions)
B to A (millions)
% Difference in Directional Flows
688 Midwest Northeast Intermega 344 344 -0.2% 660 Northeast International International 328 332 -1.1% 616 Midwest Midwest Intramega 616 560 Midwest Non-mega Non-mega 280 281 -0.4% 500 Northeast Southern Florida Intermega 250 250 -0.1% 394 Northern California Southern California Intermega 196 197 -0.3% 356 Southern Florida International International 177 178 -0.5% 351 Piedmont Non-mega Non-mega 176 175 0.3% 349 Northeast Piedmont Intermega 174 175 -0.3% 323 Midwest Southern Florida Intermega 161 162 -1.0% 322 Non-mega Non-mega Non-mega 322 320 Texas Triangle Non-mega Non-mega 160 160 -0.3% 316 Piedmont Southern Florida Intermega 159 157 0.9% 306 Midwest Piedmont Intermega 153 153 0.4% 301 Northeast Non-mega Non-mega 151 150 0.4% 186 Texas Triangle Texas Triangle Intramega 186 291 Midwest International International 144 147 -1.8% 287 Southern California International International 145 143 1.4% 283 Midwest Southern California Intermega 141 142 -1.1%
81

82
Several other megaregions show up prominently in the Top 20 pairs. The
Piedmont is one part of four pairings, Southern Florida part of four pairings, and
Southern California part of three pairings. The Texas Triangle is interesting because it
only shows up in two pairings, one of which is its intramega flow (only one of three
intramega flows on the list besides the Northeast and Midwest). The other is its pairing
with non-megaregional areas. Four of the megaregions are not represented anywhere on
the Top 20 list.
The Top 20 list is mixed in its types of pairings, with several international, non-
mega, and intramega flows. Intermega flows are the most common on the list, however,
with eight of the twenty pairings. The only pairing not involving the eastern megaregions
is between Northern California and Southern California, displaying the strong connection
between the two California megaregions. There is one pairing that spans the nation east
to west, making the list at number 20 between the Midwest and Southern California. The
remaining intermega pairings are between the four eastern megaregions: Midwest,
Northeast, Piedmont, and Southern Florida. Every possible combination between these
four megaregions is represented in the Top 20, thus showing the dominance in volume
the eastern megaregions have over the U.S. airport system.
The gross passenger flow pairs, solely between megaregions, are shown in Figure
4.3. On this map, international and non-megaregion flows are not shown.
4.3.1.2 Freight Traffic
It is clear that freight flows are dominated strongly by international flows, which make up
nine of the Top 20. The top five of the rankings are all movements to and from the
international market, as seen in Table 4.14. These top flows are from four megaregions
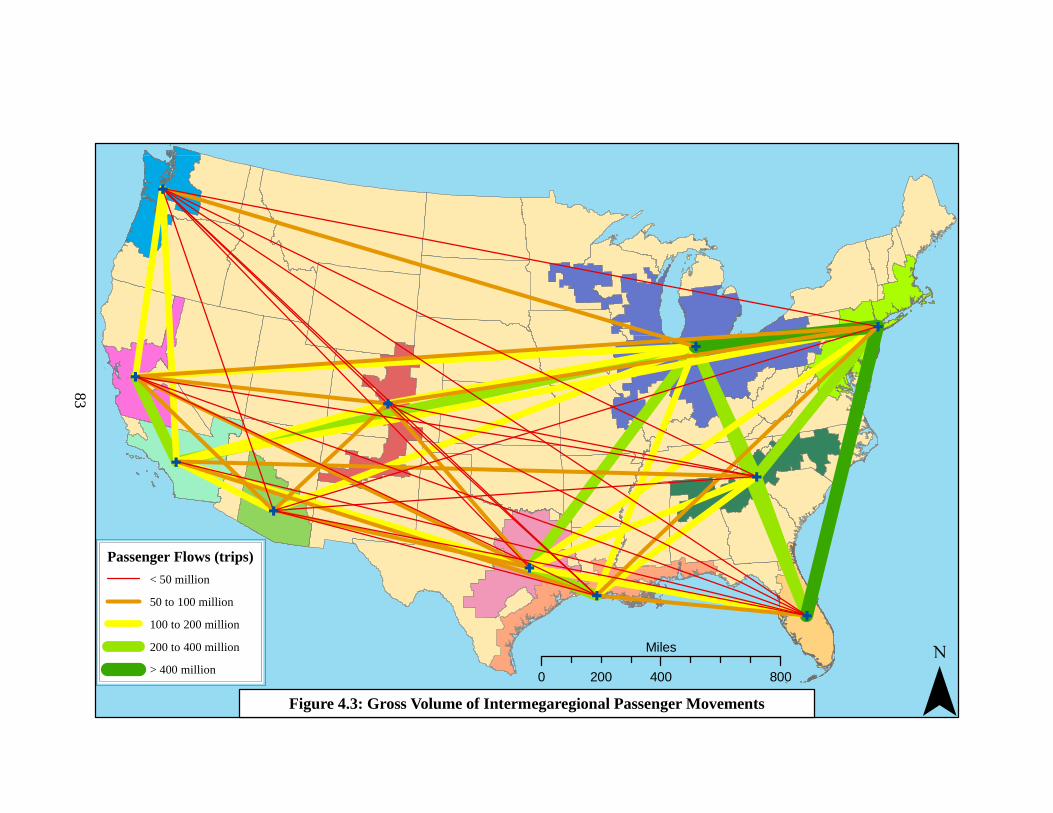
G
G
G
G
G
G
G
G
G
G
G
Passenger Flows (trips)
< 50 million
50 to 100 million
100 to 200 million
200 to 400 million
> 400 million
¯Figure 4.3: Gross Volume of Intermegaregional Passenger Movements
0 400 800200
Miles
83
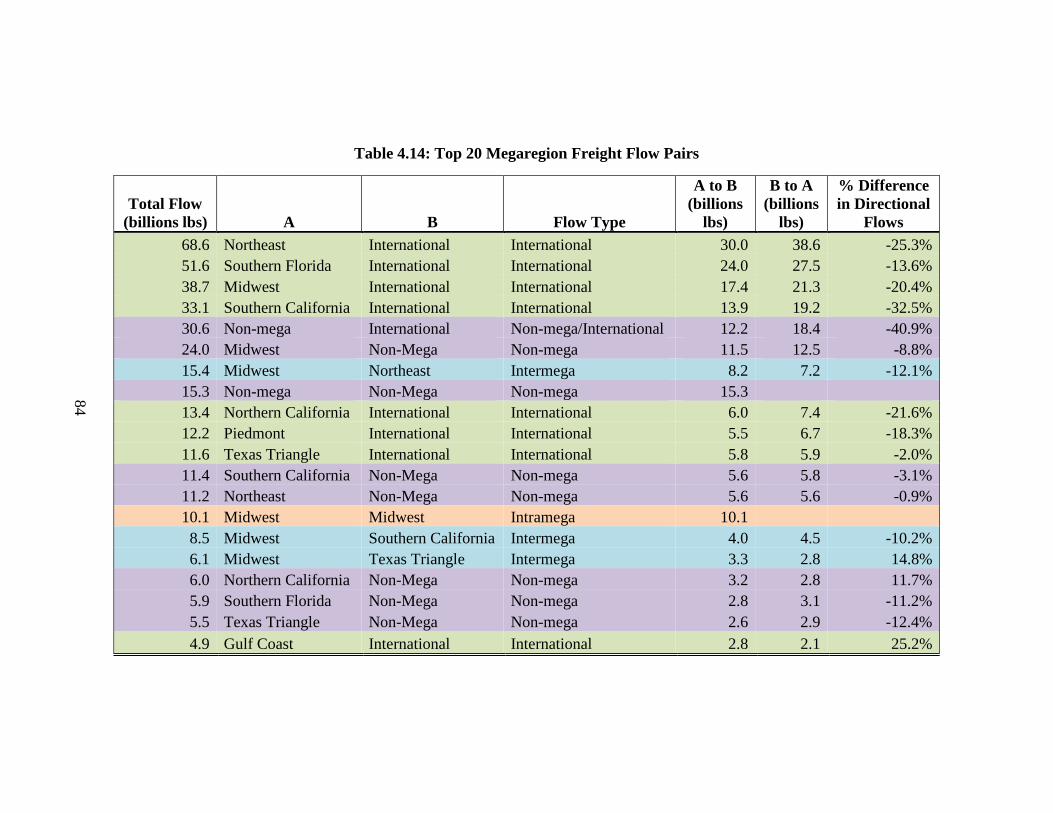
84
Table 4.14: Top 20 Megaregion Freight Flow Pairs
Total Flow (billions lbs) A B Flow Type
A to B (billions
lbs)
B to A (billions
lbs)
% Difference in Directional
Flows 68.6 Northeast International International 30.0 38.6 -25.3% 51.6 Southern Florida International International 24.0 27.5 -13.6% 38.7 Midwest International International 17.4 21.3 -20.4% 33.1 Southern California International International 13.9 19.2 -32.5% 30.6 Non-mega International Non-mega/International 12.2 18.4 -40.9% 24.0 Midwest Non-Mega Non-mega 11.5 12.5 -8.8% 15.4 Midwest Northeast Intermega 8.2 7.2 -12.1% 15.3 Non-mega Non-Mega Non-mega 15.3 13.4 Northern California International International 6.0 7.4 -21.6% 12.2 Piedmont International International 5.5 6.7 -18.3% 11.6 Texas Triangle International International 5.8 5.9 -2.0% 11.4 Southern California Non-Mega Non-mega 5.6 5.8 -3.1% 11.2 Northeast Non-Mega Non-mega 5.6 5.6 -0.9% 10.1 Midwest Midwest Intramega 10.1 8.5 Midwest Southern California Intermega 4.0 4.5 -10.2% 6.1 Midwest Texas Triangle Intermega 3.3 2.8 14.8% 6.0 Northern California Non-Mega Non-mega 3.2 2.8 11.7% 5.9 Southern Florida Non-Mega Non-mega 2.8 3.1 -11.2% 5.5 Texas Triangle Non-Mega Non-mega 2.6 2.9 -12.4% 4.9 Gulf Coast International International 2.8 2.1 25.2%
84
85
and non-megaregion areas: Northeast, 68.6 billions of pounds of freight; Southern
Florida, 51.6; Midwest, 38.7; Southern California, 33.1; and non-megaregion areas, 30.6.
Four other megaregions also have flows internationally that make the Top 20: Northern
California, Piedmont, Texas Triangle, and the Gulf Coast. Of all these megaregions, only
the Gulf Coast is a net exporter.
There is also a large number of freight flows to and from non-megaregion areas,
making up eight of the Top 20. The top flow is with the international market, and the
remaining seven are to six of the megaregions (Midwest, Southern California, Northeast,
Northern California, Southern Florida, and the Texas Triangle) and the internal freight
flows of non-megaregion areas.
The remaining freight flows in the Top 20, the intermega and intramega flows, all
involve the Midwest megaregion. The Midwest freight flow to and from the Northeast is
seventh on the list with 15.4 billions of pounds of freight, while farther down are the
freight flows to and from Southern California and the Texas Triangle. The Midwest
intramega flow is the only one in the Top 20.
Freight flows have a high percent difference between directional movements.
While passenger flows are relatively even in both directions (the highest percent
difference in the Top 20 list is 1.8%), freight flows are very skewed to one area in the
pairing. The smallest percent difference for the Top 20 freight flows is 0.9% (Northeast
to non-megaregion areas), however, the majority are greater than 10%, with the largest
being 40.9% (non-megaregion areas to internationally).
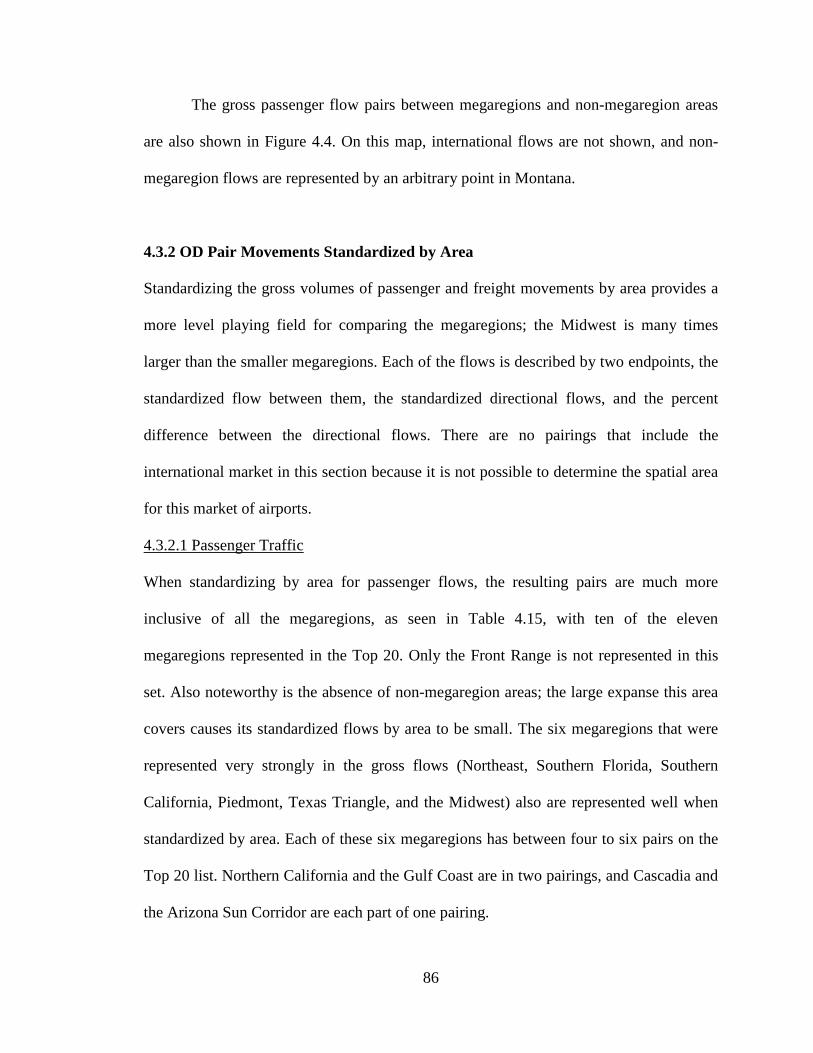
86
The gross passenger flow pairs between megaregions and non-megaregion areas
are also shown in Figure 4.4. On this map, international flows are not shown, and non-
megaregion flows are represented by an arbitrary point in Montana.
4.3.2 OD Pair Movements Standardized by Area
Standardizing the gross volumes of passenger and freight movements by area provides a
more level playing field for comparing the megaregions; the Midwest is many times
larger than the smaller megaregions. Each of the flows is described by two endpoints, the
standardized flow between them, the standardized directional flows, and the percent
difference between the directional flows. There are no pairings that include the
international market in this section because it is not possible to determine the spatial area
for this market of airports.
4.3.2.1 Passenger Traffic
When standardizing by area for passenger flows, the resulting pairs are much more
inclusive of all the megaregions, as seen in Table 4.15, with ten of the eleven
megaregions represented in the Top 20. Only the Front Range is not represented in this
set. Also noteworthy is the absence of non-megaregion areas; the large expanse this area
covers causes its standardized flows by area to be small. The six megaregions that were
represented very strongly in the gross flows (Northeast, Southern Florida, Southern
California, Piedmont, Texas Triangle, and the Midwest) also are represented well when
standardized by area. Each of these six megaregions has between four to six pairs on the
Top 20 list. Northern California and the Gulf Coast are in two pairings, and Cascadia and
the Arizona Sun Corridor are each part of one pairing.

G
G
G
G
G
G
G
G
G
G
G
Freight Flows (Pounds)< 750 million
750 million to 1.5 billion
1.5 to 3 billion
3 to 6 billion
> 6 billion
Figure 4.4: Intermegaregional Freight Movements
¯Figure 4.4: Gross Volume of Intermegaregional Freight Movements Movements
0 400 800200
Miles
87
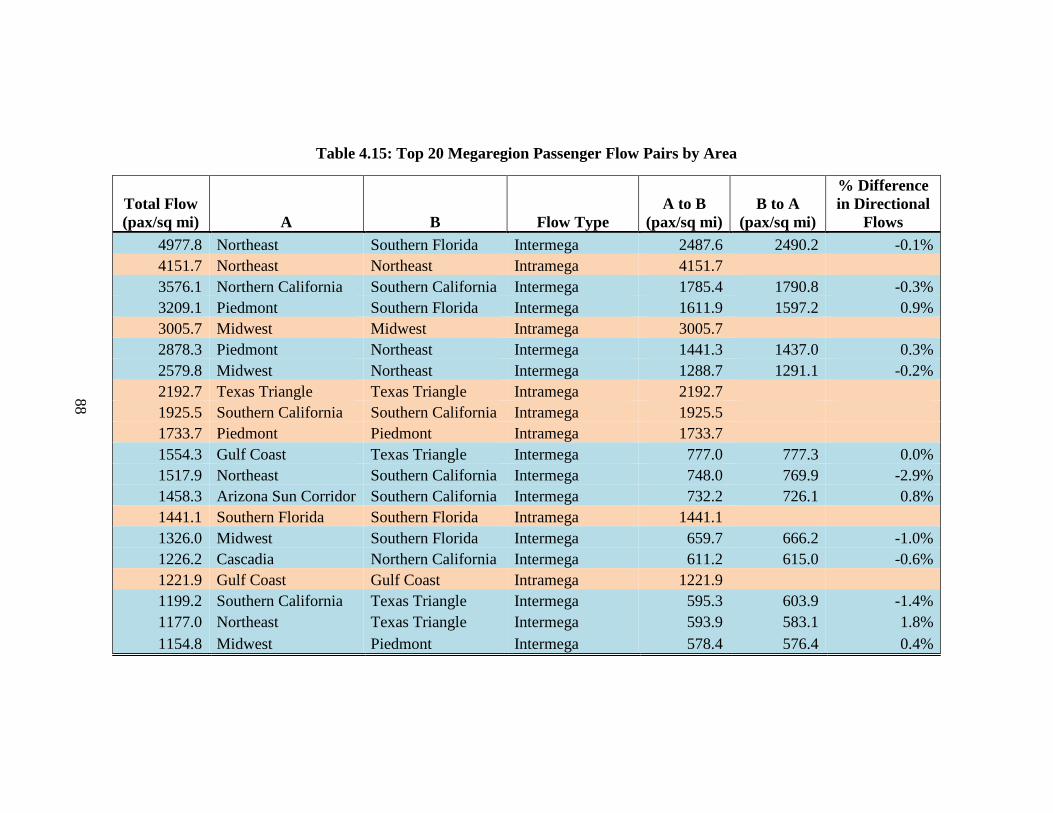
88
Table 4.15: Top 20 Megaregion Passenger Flow Pairs by Area
Total Flow (pax/sq mi) A B Flow Type
A to B (pax/sq mi)
B to A (pax/sq mi)
% Difference in Directional
Flows 4977.8 Northeast Southern Florida Intermega 2487.6 2490.2 -0.1% 4151.7 Northeast Northeast Intramega 4151.7 3576.1 Northern California Southern California Intermega 1785.4 1790.8 -0.3% 3209.1 Piedmont Southern Florida Intermega 1611.9 1597.2 0.9% 3005.7 Midwest Midwest Intramega 3005.7 2878.3 Piedmont Northeast Intermega 1441.3 1437.0 0.3% 2579.8 Midwest Northeast Intermega 1288.7 1291.1 -0.2% 2192.7 Texas Triangle Texas Triangle Intramega 2192.7 1925.5 Southern California Southern California Intramega 1925.5 1733.7 Piedmont Piedmont Intramega 1733.7 1554.3 Gulf Coast Texas Triangle Intermega 777.0 777.3 0.0% 1517.9 Northeast Southern California Intermega 748.0 769.9 -2.9% 1458.3 Arizona Sun Corridor Southern California Intermega 732.2 726.1 0.8% 1441.1 Southern Florida Southern Florida Intramega 1441.1 1326.0 Midwest Southern Florida Intermega 659.7 666.2 -1.0% 1226.2 Cascadia Northern California Intermega 611.2 615.0 -0.6% 1221.9 Gulf Coast Gulf Coast Intramega 1221.9 1199.2 Southern California Texas Triangle Intermega 595.3 603.9 -1.4% 1177.0 Northeast Texas Triangle Intermega 593.9 583.1 1.8% 1154.8 Midwest Piedmont Intermega 578.4 576.4 0.4%
88
89
The Northeast to Southern Florida pairing is the top pairing when standardized by
area, with 4977.8 passenger trips per square mile. In second is the intramega flow for the
Northeast, at 4151.7. The trans-California flow between the two California megaregions
is third with 3576.1, followed by the pairing of the Piedmont and Southern Florida with
3209.1. The top five is concluded by the intramega flow in the Midwest with 3005.7.
Intramega flows are much more strongly represented when standardized by area.
Each of the six megaregions predominant in gross passenger flows have their intramega
flows in the Top 20 list by area. A seventh megaregion, the Gulf Coast, also joins this
list, although below the other six. More pairs that span coasts or link to central
megaregions show up on the list standardized by area. This includes the Northeast to
Southern California, Southern California to the Texas Triangle, and the Northeast to the
Texas Triangle.
Also on the showing up on the Top 20 list are pairings between megaregions that
are near to each other, away from the eastern megaregions. Included are the Gulf Coast
and the Texas Triangle, Arizona Sun Corridor and Southern California, and Cascadia and
Northern California.
4.3.2.2 Freight Traffic
Without the presence of international flows, and the large size of non-megaregion areas,
freight flows standardized by area consists of mostly intermega flows, as seen in Table
4.16. The majority of these freight flows, even when standardized by area, are dominated
by the Midwest and the Northeast. Southern California, Southern Florida, Northern
California, and the Texas Triangle are also well represented.

90
Table 4.16: Top 20 Megaregion Freight Flow Pairs by Area
Total Flow (pounds/sq mi) A B Flow Type
A to B (pounds/sq
mi)
B to A (pounds/sq
mi)
% Difference in Directional
Flows 57644.9 Midwest Northeast Intermega 30569.1 27075.7 12.1% 49268.6 Midwest Midwest Intramega 49268.6 38460.5 Northeast Southern California Intermega 15411.5 23049.0 -39.7% 31779.4 Midwest Southern California Intermega 15076.6 16702.8 -10.2% 26153.4 Northeast Northern California Intermega 12081.7 14071.7 -15.2% 24837.9 Northeast Northeast Intramega 24837.9 24674.0 Northeast Southern Florida Intermega 10179.9 14494.1 -35.0% 22563.1 Northern California Southern California Intermega 11262.5 11300.6 -0.3% 21179.6 Midwest Texas Triangle Intermega 11375.4 9804.2 14.8% 19358.3 Midwest Northern California Intermega 9539.3 9819.1 -2.9% 18231.0 Midwest Piedmont Intermega 9303.3 8927.8 4.1% 17633.6 Midwest Southern Florida Intermega 9709.1 7924.5 20.2% 16710.1 Piedmont Southern Florida Intermega 7921.0 8789.1 -10.4% 16081.3 Northeast Piedmont Intermega 8531.9 7549.3 12.2% 15334.9 Southern California Texas Triangle Intermega 8159.7 7175.3 12.8% 15087.6 Cascadia Northern California Intermega 6369.7 8717.8 -31.1% 13498.3 Cascadia Midwest Intermega 6497.8 7000.5 -7.4% 10839.9 Southern Florida Texas Triangle Intermega 5172.4 5667.5 -9.1% 10553.1 Northeast Texas Triangle Intermega 5682.0 4871.0 15.4% 10496.2 Front Range Midwest Intermega 4526.6 5969.6 -27.5%
90

91
The pairing between the Midwest and the Northeast is the top ranked pair with
around 57,000 pounds of freight per square mile. The Midwest intramega flow is in
second with around 49,000. The remainder of the top five is from the Midwest or
Northeast to the two California megaregions. In fact, the California megaregions have a
strong presence in freight flows by area, part of seven pairings.
The freight flows standardized by area also have large differences in directional
flows, even without the international market being represented on the list. The smallest
difference in directional flows is between Northern and Southern California with 0.3%.
The difference is as large as 39.7% between the Northeast and Southern California, with
the greater share heading east. In general, the Midwest and Southern California are
producing air freight, while the Northeast and Texas Triangle are attracting air freight.
4.3.3 OD Pair Movements Standardized by Population
Examining the OD pairs of megaregion and non-megaregion areas for passenger and
freight volumes standardized by population reveals the tendencies of each area’s
populace. The top pairings of areas show which populations are more connected than
others through air travel and sending air freight. There are no pairings that include the
international market in this section because it is not possible to determine the combined
population bases for these airports.
4.3.3.1 Passenger Traffic
What is first apparent from the Top 20 list of pairs standardized by population is that
every megaregion is represented on the list. It is clear that all megaregions share close
connections in passenger travel to a megaregion very close to them, as seen in Table 4.17.

92
Table 4.17: Top 20 Megaregion Passenger Flow Pairs by Population
Total Flow (pax/pop of
A&B) A B Flow Type
A to B (pax/pop of
A&B)
B to A (pax/pop of
A&B)
% Difference in Directional
Flows 11.5 Texas Triangle Texas Triangle Intramega 11.5 11.5 Midwest Midwest Intramega 11.5 11.4 Northern California Southern California Intermega 5.7 5.7 -0.3% 10.7 Piedmont Southern Florida Intermega 5.4 5.3 0.9% 7.9 Gulf Coast Texas Triangle Intermega 4.0 4.0 -0.1% 7.8 Northeast Southern Florida Intermega 3.9 3.9 -0.1% 7.0 Piedmont Piedmont Intramega 7.0 6.7 Midwest Northeast Intermega 3.3 3.3 -0.2% 6.1 Arizona Sun Corridor Southern California Intermega 3.1 3.0 0.8% 6.0 Gulf Coast Gulf Coast Intramega 6.0 5.8 Cascadia Northern California Intermega 2.9 2.9 -0.6% 5.5 Arizona Sun Corridor Front Range Intermega 2.7 2.7 0.2% 5.4 Southern California Southern California Intramega 5.4 5.4 Northeast Piedmont Intermega 2.7 2.7 -0.3% 5.2 Northeast Northeast Intramega 5.2 4.7 Midwest Southern Florida Intermega 2.3 2.4 -1.0% 4.6 Texas Triangle Southern California Intermega 2.3 2.3 1.4% 4.6 Front Range Texas Triangle Intermega 2.3 2.3 -2.4% 4.5 Midwest Piedmont Intermega 2.2 2.2 0.4% 4.4 Midwest Non-mega Non-mega 2.2 2.2 -0.4%
92
93
Looking at megaregions which did make the top gross flow list, the following make the
Top 20 by population: the Gulf Coast and Texas Triangle, Arizona Sun Corridor and
Southern California, Arizona Sun Corridor and Front Range, Front Range and Texas
Triangle, and Cascadia and Northern California. As well, the flows between the
megaregions very active in passenger travel still have a large presence on this list.
The top five in the rankings have a wide array of megaregions represented, and
the flows of passenger trips per person are not vastly different as in other lists. The
intramega flows of the Texas Triangle and the Midwest top the list, both around 11.5
trips per person. The pairing of Northern California and Southern California is in third
with 11.4 trips per person. In fourth is the Piedmont to Southern Florida with 10.7, and in
fifth is the Gulf Coast to the Texas Triangle with 7.9.
Intramega flows show up six times on the Top 20 list standardized by population.
Already mentioned are those for Texas Triangle and the Midwest. In addition, the
Piedmont, Gulf Coast, Southern California, and the Northeast also have high levels of
internal passenger traffic per capita.
Only one flow outside of the megaregions appears on the list: the flow from the
Midwest to non-megaregion areas, with 4.4 trips per capita.
4.3.3.2 Freight Traffic
By population, the Midwest and non-megaregion areas dominate the list of freight
movements standardized by population. Together they encompass 15 of the Top 20 pairs,
including nine of the top ten, as seen in Table 4.18. The large volume of air freight that
originates and is destined for the Midwest and non-megaregion areas differs though in

94
Table 4.18: Top 20 Megaregion Freight Flow Pairs by Population
Total Flow (pounds/pop
of A&B) A B Flow Type
A to B (pounds/pop
of A&B)
B to A (pounds/pop
of A&B)
% Difference in Directional
Flows 208.7 Non-mega Non-Mega Non-mega 208.7 188.9 Midwest Non-Mega Non-mega 90.3 98.6 -8.8% 187.9 Midwest Midwest Intramega 187.9 148.8 Midwest Northeast Intermega 78.9 69.9 12.1% 119.8 Southern California Non-Mega Non-mega 59.0 60.8 -3.1% 112.2 Midwest Southern California Intermega 53.2 58.9 -10.2% 91.3 Northeast Non-Mega Non-mega 45.4 45.9 -0.9% 87.8 Midwest Texas Triangle Intermega 47.2 40.6 14.8% 73.7 Midwest Northern California Intermega 36.3 37.4 -2.9% 71.8 Northern California Southern California Intermega 35.8 36.0 -0.3% 71.6 Cascadia Northern California Intermega 30.2 41.4 -31.1% 70.3 Midwest Piedmont Intermega 35.9 34.4 4.1% 69.6 Northern California Non-Mega Non-mega 36.8 32.8 11.7% 66.7 Southern Florida Non-Mega Non-mega 31.5 35.2 -11.2% 66.5 Northeast Southern California Intermega 26.6 39.9 -39.7% 62.8 Midwest Southern Florida Intermega 34.6 28.2 20.2% 61.5 Texas Triangle Non-Mega Non-mega 28.8 32.6 -12.4% 59.2 Southern California Texas Triangle Intermega 31.5 27.7 12.8% 55.7 Cascadia Midwest Intermega 26.8 28.9 -7.4% 55.6 Piedmont Southern Florida Intermega 26.4 29.3 -10.4%
94

95
that the Midwest is predominantly an exporter of freight to other areas while non-
megaregion areas are predominantly importing.
The top five of the list begins with the flows between all the non-megaregion
areas, with 208.7 pounds of freight per person. The Midwest to non-megaregion area
flow is in second with 188.9, while the Midwest intramega flow is in third with 187.9. In
fourth is the Midwest and the Northeast pairing with 148.8, and the pairing of Southern
California and non-megaregion areas is in fifth with 119.8.
Only eight megaregions are represented on this list, with the Front Range,
Arizona Sun Corridor, and the Gulf Coast being absent. Southern California appears five
times, the second most to the Midwest. Northern California appears four times. The
Northeast, Southern Florida, and the Texas Triangle appear three times, while Cascadia
and the Piedmont appear twice. All but the last two have a pairing with non-megaregion
areas on the list.
4.3.4 OD Pair Movements Standardized by Economic Productivity
A comparison of passenger and freight flows standardized by economic productivity is
discussed in the following section. The size of two economies and their flows helps to
understand the economic bond between them. There are no pairs that include the
international market in this section because it is not possible to determine the combined
economic bases for these airports.
4.3.4.1 Passenger Traffic
Standardized by economic productivity, the top pairs between areas are representative of
all the megaregions, whether in intramega or intermega flows. As seen in Table 4.19, all

96
Table 4.19: Top 20 Megaregion Passenger Flow Pairs by Economic Productivity
Total Flow (pax/$
trillions) A B Flow Type
A to B (pax/ $
trillions)
B to A (pax/ $
trillions)
% Difference in Directional
Flows 297.3 Midwest Midwest Intramega 297.3 288.5 Piedmont Southern Florida Intermega 144.9 143.6 0.9% 237.1 Northern California Southern California Intermega 118.3 118.7 -0.3% 227.2 Texas Triangle Texas Triangle Intramega 227.2 212.6 Piedmont Piedmont Intramega 212.6 165.2 Gulf Coast Texas Triangle Intermega 82.6 82.6 0.0% 156.3 Northeast Southern Florida Intermega 78.1 78.2 -0.1% 147.5 Midwest Northeast Intermega 73.7 73.8 -0.2% 134.9 Gulf Coast Gulf Coast Intramega 134.9 131.4 Arizona Sun Corridor Southern California Intermega 66.0 65.4 0.8% 122.0 Cascadia Northern California Intermega 60.8 61.2 -0.6% 120.6 Midwest Southern Florida Intermega 60.0 60.6 -1.0% 120.4 Arizona Sun Corridor Front Range Intermega 60.3 60.1 0.2% 119.4 Midwest Piedmont Intermega 59.8 59.6 0.4% 114.9 Southern California Southern California Intramega 114.9 113.4 Northeast Piedmont Intermega 56.6 56.8 -0.3% 105.6 Midwest Non-mega Non-mega 52.7 52.9 -0.4% 101.5 Gulf Coast Piedmont Intermega 50.7 50.8 -0.2% 99.6 Non-mega Non-mega Non-mega 99.6 98.8 Northeast Northeast Intramega 98.8
96
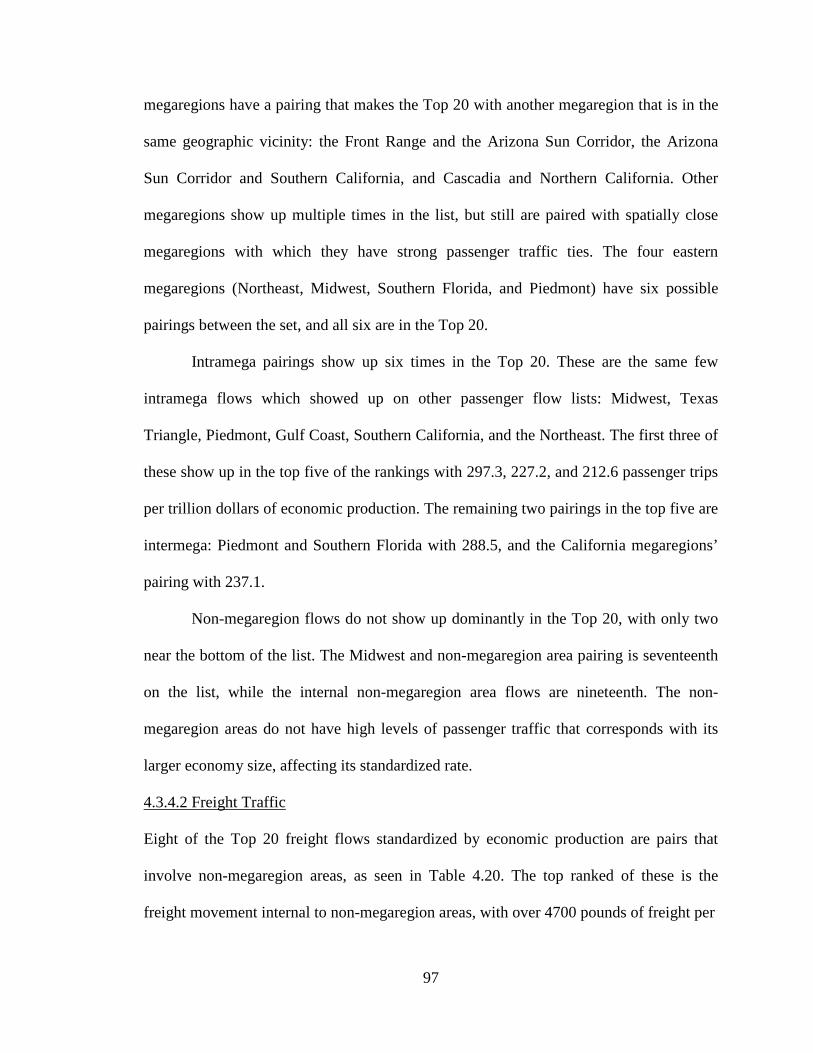
97
megaregions have a pairing that makes the Top 20 with another megaregion that is in the
same geographic vicinity: the Front Range and the Arizona Sun Corridor, the Arizona
Sun Corridor and Southern California, and Cascadia and Northern California. Other
megaregions show up multiple times in the list, but still are paired with spatially close
megaregions with which they have strong passenger traffic ties. The four eastern
megaregions (Northeast, Midwest, Southern Florida, and Piedmont) have six possible
pairings between the set, and all six are in the Top 20.
Intramega pairings show up six times in the Top 20. These are the same few
intramega flows which showed up on other passenger flow lists: Midwest, Texas
Triangle, Piedmont, Gulf Coast, Southern California, and the Northeast. The first three of
these show up in the top five of the rankings with 297.3, 227.2, and 212.6 passenger trips
per trillion dollars of economic production. The remaining two pairings in the top five are
intermega: Piedmont and Southern Florida with 288.5, and the California megaregions’
pairing with 237.1.
Non-megaregion flows do not show up dominantly in the Top 20, with only two
near the bottom of the list. The Midwest and non-megaregion area pairing is seventeenth
on the list, while the internal non-megaregion area flows are nineteenth. The non-
megaregion areas do not have high levels of passenger traffic that corresponds with its
larger economy size, affecting its standardized rate.
4.3.4.2 Freight Traffic
Eight of the Top 20 freight flows standardized by economic production are pairs that
involve non-megaregion areas, as seen in Table 4.20. The top ranked of these is the
freight movement internal to non-megaregion areas, with over 4700 pounds of freight per
98
Table 4.20: Top 20 Megaregion Freight Flow Pairs by Economic Productivity
Total Flow (pounds/$ trillion) A B Flow Type
A to B (pounds/ $
trillion)
B to A (pounds/ $
trillion)
% Difference in Directional
Flows 4873.0 Midwest Midwest Intramega 4873.0 4742.6 Non-mega Non-Mega Non-mega 4742.6 4528.8 Midwest Non-Mega Non-mega 2164.7 2364.2 -8.8% 3295.9 Midwest Northeast Intermega 1747.8 1548.1 12.1% 2727.3 Midwest Southern California Intermega 1293.9 1433.4 -10.2% 2673.7 Southern California Non-Mega Non-mega 1316.1 1357.6 -3.1% 2123.1 Midwest Texas Triangle Intermega 1140.3 982.8 14.8% 1929.0 Northeast Non-Mega Non-mega 960.0 969.0 -0.9% 1885.2 Midwest Piedmont Intermega 962.0 923.2 4.1% 1818.1 Midwest Northern California Intermega 895.9 922.2 -2.9% 1603.6 Midwest Southern Florida Intermega 883.0 720.7 20.2% 1555.8 Northern California Non-Mega Non-mega 823.3 732.5 11.7% 1531.6 Southern Florida Non-Mega Non-mega 723.0 808.6 -11.2% 1502.5 Piedmont Southern Florida Intermega 712.2 790.3 -10.4% 1501.1 Cascadia Northern California Intermega 633.7 867.4 -31.1% 1495.6 Northern California Southern California Intermega 746.6 749.1 -0.3% 1413.5 Cascadia Midwest Intermega 680.4 733.1 -7.4% 1359.5 Texas Triangle Non-Mega Non-mega 637.7 721.8 -12.4% 1309.2 Northeast Southern California Intermega 524.6 784.6 -39.7% 1269.3 Piedmont Non-Mega Non-mega 631.3 638.0 -1.0%
98

99
trillion dollars of economic production. The Midwest, Southern California, Northeast,
Northern California, Southern Florida, Texas Triangle, and Piedmont megaregions also
have pairings with non-megaregion areas that make the Top 20.
The only flow amongst the Top 20 which is intramega is for the Midwest. It is,
however, the only intramega flow on the entire list. The number two and three flows are
the internal non-megaregion area flows and the pairing of non-megaregion areas with the
Midwest. It is clear these two areas are significant producers of freight for the economies
happening within. The number four and five flows are intermega, the pairing between the
Midwest and the Northeast and the pairing between the Midwest and Southern California.
The dominant flow pairings on the list involve the Midwest heavily, with nine of
the twenty involving the largest of the megaregions. Those intermega flows which do not
involve the Midwest are Piedmont and Southern Florida, Cascadia and Northern
California, Northern California and Southern California, and the Northeast and Southern
California.
4.3.5 Summary
The OD pairs of megaregions and non-megaregion areas for passenger and freight
movements do not deviate from what would be expected. In passenger traffic, the
intermega and intramega flows are dominant on the lists that are standardized by area,
population, and economic production. Denser in population and with larger economies,
the megaregion populations travel to other megaregions quite frequently due to economic
ties and dynamic locations that are ripe for travel. International traffic heads to the

100
megaregions most expected, those with strong ties to international economies: the
Northeast, Midwest, Southern California, and Southern Florida.
Passenger pairings that show up consistently as the most heavily traveled for
passenger traffic are: Northeast and Southern Florida, Midwest intramega flows,
Northern California and Southern California, and the Piedmont and Southern Florida.
For freight traffic, the top flows are predominantly to and from the international
market and non-megaregion areas. Sixteen of the Top 20 gross flows go to these two
areas. On the standardized lists, which do not include international, non-megaregion
flows show up very strongly. The only one in which they are absent is in area, where the
non-megaregion spatial area is large enough to create smaller standardized flows. The
Midwest is a dominant megaregion in air freight and on standardized lists ends up in
many of the top pairs. This shows the close ties that many megaregions have with the
Midwest in terms of air freight. The top freight flow pairs less often include the less
populated megaregions with smaller economies, even when standardized.
Freight pairs that show up consistently as the most heavily traveled for freight
traffic are: Midwest and non-megaregion areas, Midwest intramega flows, Midwest and
Northeast, non-megaregion internal flows, and the Midwest and Southern California.
One interesting result is the tendency for megaregions’ top passenger flow pairing
to be a megaregion nearby. The four eastern megaregions have flows between them that
consistently show up in the Top 20 of all lists. When smaller megaregions break through
on the list, they often do so with flows to the closest geographical megaregion. This
shows a tendency for megaregions to have one or a few close ties to megaregions that are
close to them. Three of the consistent top flows outside the eastern megaregions are

101
between Northern California and Southern California, Arizona Sun Corridor and
Southern California, the Gulf Coast and Texas Triangle, and Cascadia and Northern
California.
Intramega flows are high for passenger traffic and low for freight traffic. There is
very little intramega traffic for freight flow, as air freight has a tendency to be moved
over longer distances, and intramega freight often can go by truck. Intramega passenger
traffic, on the standardized lists, is consistently near the top. This gives indication that
intramega traffic plays a significant role in megaregion air systems. Consistently highly
ranked intramega passenger flows exist for the Midwest, Northeast, Texas Triangle,
Piedmont, Southern California, and Gulf Coast. Only the Midwest has a consistently a
highly ranked intramega freight flow.
The difference between directional flows is telling of the nature of air freight and
passenger movements. Passenger traffic is evenly split between the pair because most
passengers flying return to their origin. Freight traffic is the movement of goods which
will ultimately be consumed at some points, and thus is not on a return ticket. Thus with
percentage differences that are often above 10% and reach above 40%, it is clear that in
freight pairings there is a clear net exporter and net importer. This is the strongest
between international pairings, as most of the traffic is towards the U.S.
4.4 Individual Megaregions: Origin-Destination Flows
This section discusses the passenger and freight traffic flowing in and out of each U.S.
megaregion and the non-megaregion areas. All flow pairs in this section are what were
102
termed intermega, intramega or non-mega flows in the previous section. Intramega flows
are discussed in further detail in the subsequent section.
All discussions of flows are based on tables located in Appendix B. Tables B.1
and B.3 provide the raw T-100data summed up as OD flows between megaregions for
passengers and freight, respectively. In these tables, the flow from the Northeast to the
Midwest, for example, is different from the flow in the reverse direction. Thus, the table
can be read to find the productions into and attractions out of each megaregion. Tables
B.2 and B.4 look similar, but report the combined flows between a given pair of
megaregions.
Given the results from the previous section about the top origin-destination
movements, flows are discussed differently in this section. Because passenger traffic is
relatively balanced within a pair, combined flows in both directions are discussed. Freight
flows, however, had significant differences between directional movements. Thus, in the
following section there is an additional discussion on the gross volumes of freight flows
for attractions to and productions from particular megaregions. Standardized flows for
both passenger and freight movements are discussed as combined flows between pairs.
Appendix C provides data on a megaregion by megaregion level. A summary of
flows and standardized flows for each megaregion’s passenger and freight traffic is
shown in each table.
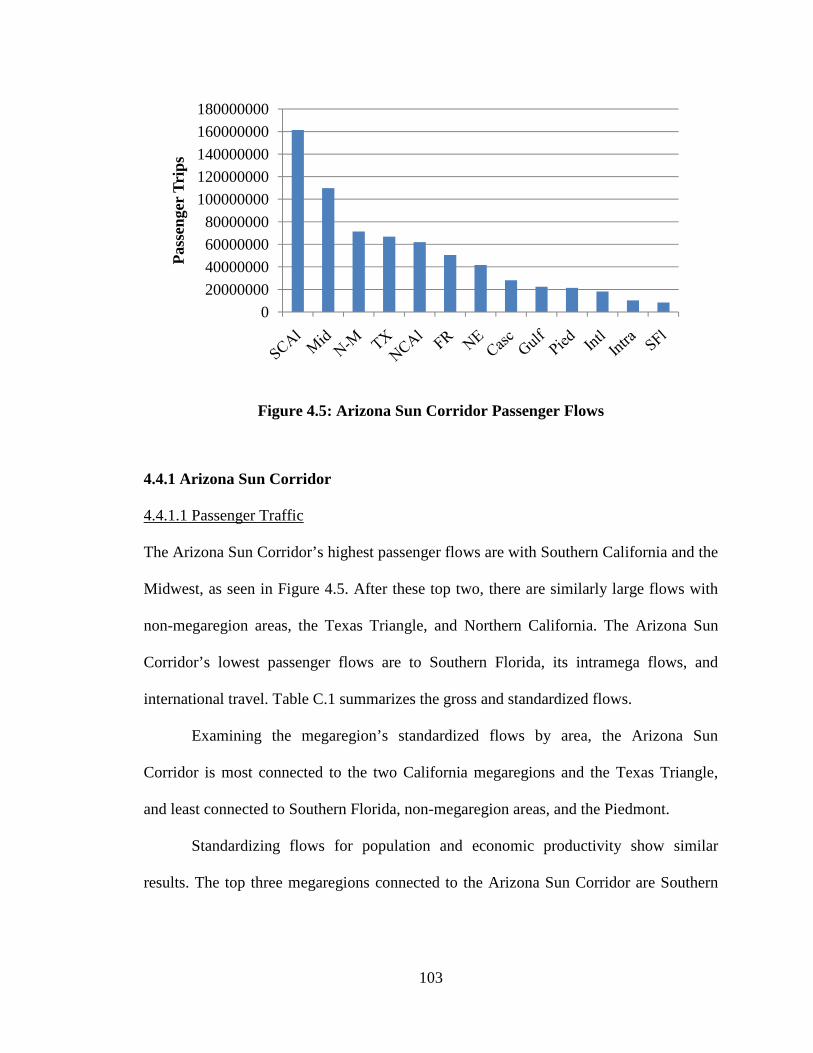
103
Figure 4.5: Arizona Sun Corridor Passenger Flows
4.4.1 Arizona Sun Corridor
4.4.1.1 Passenger Traffic
The Arizona Sun Corridor’s highest passenger flows are with Southern California and the
Midwest, as seen in Figure 4.5. After these top two, there are similarly large flows with
non-megaregion areas, the Texas Triangle, and Northern California. The Arizona Sun
Corridor’s lowest passenger flows are to Southern Florida, its intramega flows, and
international travel. Table C.1 summarizes the gross and standardized flows.
Examining the megaregion’s standardized flows by area, the Arizona Sun
Corridor is most connected to the two California megaregions and the Texas Triangle,
and least connected to Southern Florida, non-megaregion areas, and the Piedmont.
Standardizing flows for population and economic productivity show similar
results. The top three megaregions connected to the Arizona Sun Corridor are Southern
0
20000000
40000000
60000000
80000000
100000000
120000000
140000000
160000000
180000000
Pas
seng
er T
rips

104
California, Front Range, and Northern California. The least connected are Southern
Florida, the Northeast, and non-megaregion areas.
Overall, in terms of passenger flows, it is clear that the Arizona Sun Corridor’s
connection with Southern California is very strong. Not only does this pairing have the
highest gross volume of all the Arizona Sun Corridor’s pairs, but is also the top pairing
when standardized by area, population, and economic productivity. The Arizona Sun
Corridor is also closely tied to other western megaregions such as Northern California
and the Front Range. It is least connected to the megaregions on the eastern seaboard:
Northeast and Southern Florida. Despite having strong flows to non-megaregion areas,
when standardized, these flows are not as significant. The Arizona Sun Corridor is not
strongly tied internationally.
4.4.1.2 Freight Traffic
The largest freight flows for the Arizona Sun Corridor are to the Midwest, non-
megaregion areas, and Southern California, as seen in Figure 4.6. There is a sloping drop-
off to the lower volume pairings. It has the lowest freight connections with Southern
Florida, the Gulf Coast, and internally. It is a net exporter to the Front Range megaregion,
but a net importer for all other megaregions, non-megaregion areas, and international.
The megaregions with which it has the largest differential between exports and imports
are the Midwest, Southern California, and the Piedmont, which all send 25% more goods
to the Arizona Sun Corridor than they receive. Table C.2 summarizes the gross and
standardized flows.
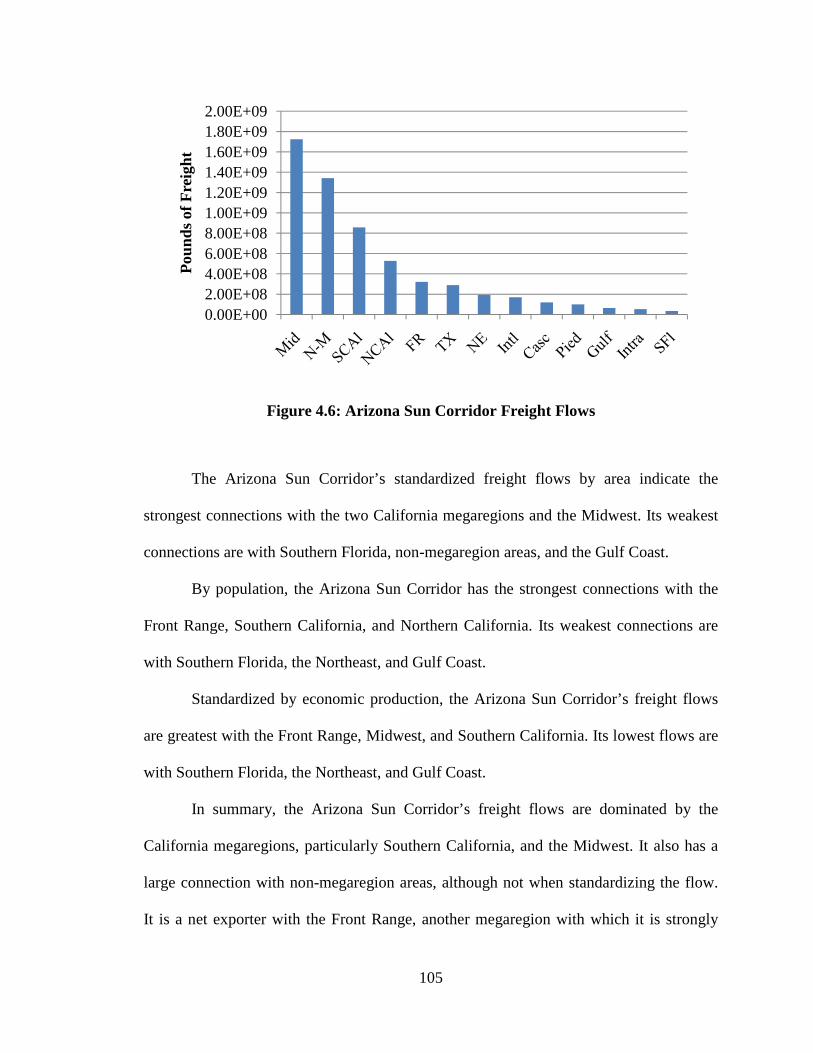
105
Figure 4.6: Arizona Sun Corridor Freight Flows
The Arizona Sun Corridor’s standardized freight flows by area indicate the
strongest connections with the two California megaregions and the Midwest. Its weakest
connections are with Southern Florida, non-megaregion areas, and the Gulf Coast.
By population, the Arizona Sun Corridor has the strongest connections with the
Front Range, Southern California, and Northern California. Its weakest connections are
with Southern Florida, the Northeast, and Gulf Coast.
Standardized by economic production, the Arizona Sun Corridor’s freight flows
are greatest with the Front Range, Midwest, and Southern California. Its lowest flows are
with Southern Florida, the Northeast, and Gulf Coast.
In summary, the Arizona Sun Corridor’s freight flows are dominated by the
California megaregions, particularly Southern California, and the Midwest. It also has a
large connection with non-megaregion areas, although not when standardizing the flow.
It is a net exporter with the Front Range, another megaregion with which it is strongly
0.00E+002.00E+084.00E+086.00E+088.00E+081.00E+091.20E+091.40E+091.60E+091.80E+092.00E+09
Pou
nds
of F
reig
ht

106
connected when standardized. Freight flows are weak with coastal eastern megaregions,
particularly Southern Florida. It has a fairly weak international connection for freight.
4.4.2 Cascadia
4.4.2.1 Passenger Traffic
The Cascadia megaregion has strong megaregional ties to the other two western
megaregions in California. After non-megaregion areas, the second and third highest
volumes are to Northern and Southern California, as seen in Figure 4.7. The fourth
highest flow, to the Midwest, is not significantly smaller, but there is a larger drop to the
remaining pairings. It is least connected to the megaregions on the opposite end of the
country in the southeastern U.S.: Southern Florida, Gulf Coast, and the Piedmont. Table
C.3 summarizes the gross and standardized flows.
The standardized flows of Cascadia show that the high gross volumes are also
significant on an even playing field. The California megaregions are the top passenger
connections standardized by area, population, and economic production. In third by area
and economic production are Cascadia’s intramega flows, while by population it is the
Front Range. Cascadia’s weakest connection is to Southern Florida in all standardization
of flows. The Gulf Coast is the third weakest in all standardizations as well. The second
worst by area is non-megaregion areas, and by population and economic production it is
the Northeast.

107
Figure 4.7: Cascadia Passenger Flows
In summary, Cascadia’s passenger traffic has a strong western focus, with large
volumes, even when standardized, to both California megaregions. Northern California is
always the greater of the two. It also has a strong intramega network when standardizing
the flows, but by gross volumes it is very connected to non-megaregion areas. Cascadia is
the least tied to the eastern and particularly southeastern megaregions of the country.
Southern Florida, the Gulf Coast, Northeast, and Piedmont megaregions do not show up
high in Cascadia’s lists.
4.4.2.2 Freight Traffic
Cascadia is one two U.S. megaregions that are overall net exporters. Not only does it ship
more goods internationally by air than it receives, but it also exports to the Piedmont,
Northeast, and Gulf Coast more than it imports by over a 50% difference. Cascadia also
produces more air freight than it receives to the Front Range, Texas Triangle, the Arizona
0
20000000
40000000
60000000
80000000
100000000
120000000
140000000
160000000
Pas
seng
er T
rips

108
Sun Corridor, and Southern Florida. It imports more its nearest neighbors, the two
California megaregions, but also from non-megaregion areas.
Cascadia’s largest air freight ties are to non-megaregion areas, internationally, and
the Midwest. As seen in Figure 4.8, there is a large drop-off to the fourth highest flow
with Northern California. Its weakest connections are to the Gulf Coast, Southern
Florida, and the Arizona Sun Corridor. Table C.4 summarizes the gross and standardized
flows.
Figure 4.8: Cascadia Freight Flows
Standardized flows by area for Cascadia’s freight movements show a strong
connection to the two California megaregions and the Midwest. The weakest connections
are to the Gulf Coast, Southern Florida, and the Arizona Sun Corridor.
Cascadia’s standardized flows by population and economic production are
similar. The top three connections are to Northern California, the Midwest, and non-
0.00E+00
5.00E+08
1.00E+09
1.50E+09
2.00E+09
2.50E+09
3.00E+09
3.50E+09
4.00E+09
4.50E+09
Pou
nds
of F
reig
ht
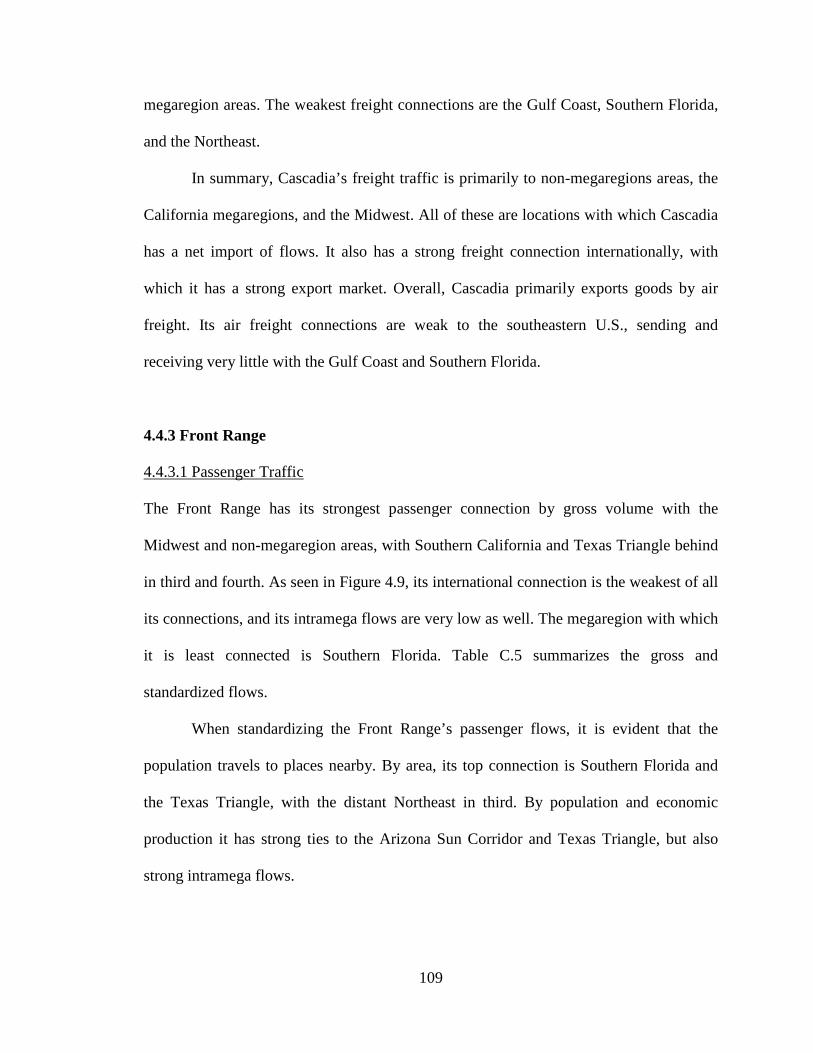
109
megaregion areas. The weakest freight connections are the Gulf Coast, Southern Florida,
and the Northeast.
In summary, Cascadia’s freight traffic is primarily to non-megaregions areas, the
California megaregions, and the Midwest. All of these are locations with which Cascadia
has a net import of flows. It also has a strong freight connection internationally, with
which it has a strong export market. Overall, Cascadia primarily exports goods by air
freight. Its air freight connections are weak to the southeastern U.S., sending and
receiving very little with the Gulf Coast and Southern Florida.
4.4.3 Front Range
4.4.3.1 Passenger Traffic
The Front Range has its strongest passenger connection by gross volume with the
Midwest and non-megaregion areas, with Southern California and Texas Triangle behind
in third and fourth. As seen in Figure 4.9, its international connection is the weakest of all
its connections, and its intramega flows are very low as well. The megaregion with which
it is least connected is Southern Florida. Table C.5 summarizes the gross and
standardized flows.
When standardizing the Front Range’s passenger flows, it is evident that the
population travels to places nearby. By area, its top connection is Southern Florida and
the Texas Triangle, with the distant Northeast in third. By population and economic
production it has strong ties to the Arizona Sun Corridor and Texas Triangle, but also
strong intramega flows.

110
Figure 4.9: Front Range Passenger Flows
The weakest connections for the Front Range when passenger flows are
standardized are non-megaregion areas, Southern Florida, and the Piedmont. Although
the Northeast was a strong connection by area, by population and economic production it
is considered a weak pairing.
Overall, the Front Range has a strong passenger connection with the adjacent
megaregions: the Texas Triangle, Midwest, Southern California, and Arizona Sun
Corridor. For its population and economic production, it has a high intramega flow
volume. It also has strong ties to the non-megaregion areas, appropriately as it is
surrounded by great distances on all sides by non-megaregion areas. Its weakest
connections are to megaregions in the southeast. It also has a weak international
connection.
0
20000000
40000000
60000000
80000000
100000000
120000000
140000000
160000000
Pas
seng
er T
rips

111
4.4.3.2 Freight Traffic
The Front Range’s strongest freight connections are the same as those for its passenger
connection: the Midwest, non-megaregion areas, and Southern California. For freight,
Northern California is also a high connection, as seen in Figure 4.10. It has low intramega
freight flows, and low volumes to the southeastern U.S.: Southern Florida, Piedmont, and
Gulf Coast. The Front Range is a net importer of air freight with all but two areas. Only
with Southern California is it a net exporter. The difference in directional flows is
greatest with the Texas Triangle and Southern Florida, with a difference of over 70%.
Table C.6 summarizes the gross and standardized flows.
Figure 4.10: Front Range Freight Flows
The Front Range’s flows when standardized reveal a tendency to move air freight
with western megaregions. Although its top pairing is consistently the Midwest, it also
has strong standardized flows with the Arizona Sun Corridor, Northern California, and
0.00E+00
5.00E+08
1.00E+09
1.50E+09
2.00E+09
2.50E+09
3.00E+09
Pou
nds
of F
reig
ht

112
Southern California. By area, its standardized flows with non-megaregion areas are low,
but otherwise it has low standardized flows with southeastern megaregions: the Gulf
Coast, Piedmont, and Southern Florida.
It is noted that overall the Front Range is more strongly connected to western
megaregions in terms of freight, and low connections to southeastern megaregions. Its
strongest consistent standardized connections are with the Midwest and Northern
California. The international freight component is moderate, but the Front Range has a
high connection with non-megaregion areas. It is a net importer of goods, a trend that
exists with all but two megaregions. It does not send many goods by air internally.
4.4.4 Gulf Coast
4.4.4.1 Passenger Traffic
The Gulf Coast’s top pairing is with the Texas Triangle, which is influenced by the dual-
megaregion designation of the Houston metropolitan area airports. Despite this, their
close proximity to one another would indicate strong connections, as these are the only
two megaregions which touch. The Gulf Coast also has high passenger flows to two other
nearby megaregions, as seen in Figure 4.11, the Piedmont, as well as the Midwest. Its
flow with non-megaregion areas is comparable as well. It is the least connected to
Cascadia, the Arizona Sun Corridor, and Northern California. Table C.7 summarizes the
gross and standardized flows.
The standardized flows indicate the Texas Triangle as the Gulf Coast’s most
connected megaregion; in second, the Gulf Coast’s intramega flow; and the Piedmont as
its third most connected.
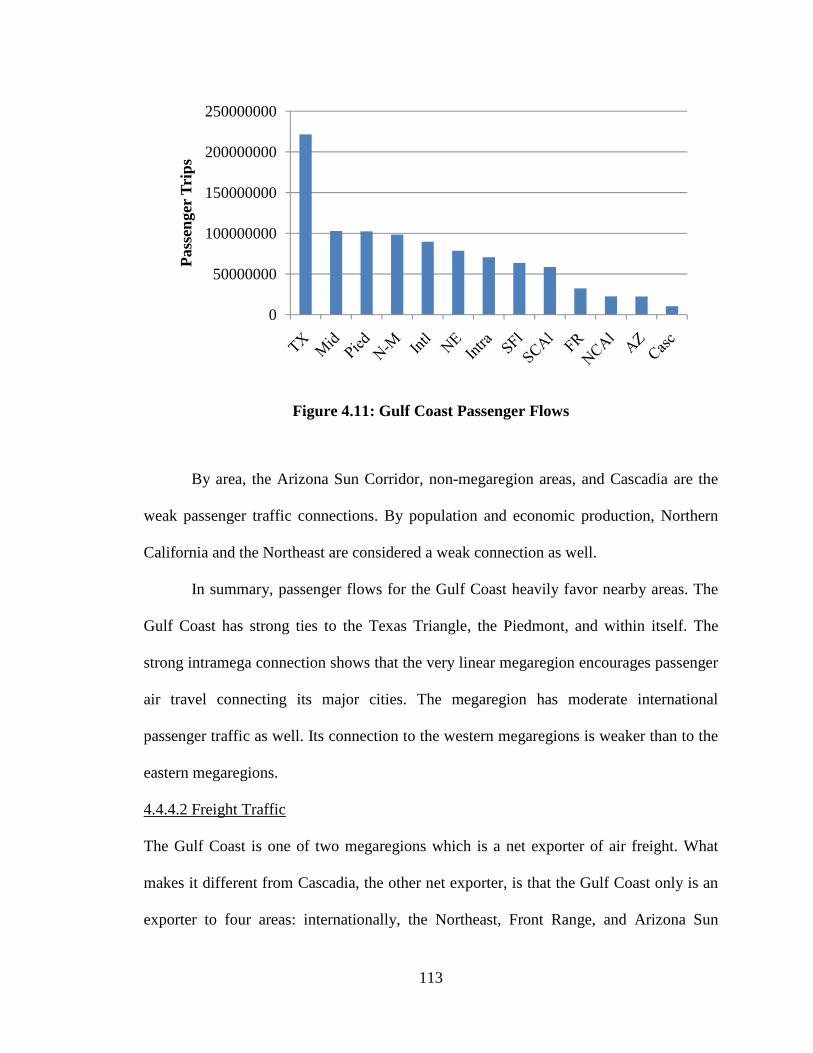
113
Figure 4.11: Gulf Coast Passenger Flows
By area, the Arizona Sun Corridor, non-megaregion areas, and Cascadia are the
weak passenger traffic connections. By population and economic production, Northern
California and the Northeast are considered a weak connection as well.
In summary, passenger flows for the Gulf Coast heavily favor nearby areas. The
Gulf Coast has strong ties to the Texas Triangle, the Piedmont, and within itself. The
strong intramega connection shows that the very linear megaregion encourages passenger
air travel connecting its major cities. The megaregion has moderate international
passenger traffic as well. Its connection to the western megaregions is weaker than to the
eastern megaregions.
4.4.4.2 Freight Traffic
The Gulf Coast is one of two megaregions which is a net exporter of air freight. What
makes it different from Cascadia, the other net exporter, is that the Gulf Coast only is an
exporter to four areas: internationally, the Northeast, Front Range, and Arizona Sun
0
50000000
100000000
150000000
200000000
250000000
Pas
seng
er T
rips

114
Corridor. The international connection though, is so much larger than the flows to other
megaregions, and the difference so large, as seen in Figure 4.12, that it more than
balances out the flows from other megaregions coming into the Gulf Coast. Cascadia,
non-megaregion areas, and Southern Florida have the largest differences in directional
flows with the Gulf Coast for megaregions with which the Gulf Coast is a net importer.
Table C.8 summarizes the gross and standardized flows.
Figure 4.12: Gulf Coast Freight Flows
The three top pairings with which the Gulf Coast ships air freight are
international, non-megaregion areas, and the Midwest. Texas Triangle, its conjoined
megaregion is in fourth. The lowest flows are toward the western megaregions: the
Arizona Sun Corridor, Cascadia, and Front Range.
Standardizing by area, population, and economic productivity, Texas Triangle and
the Midwest have strong connections to the Gulf Coast. By area, the Northeast also has a
0
1E+09
2E+09
3E+09
4E+09
5E+09
6E+09
Pou
nds
of F
reig
ht

115
strong connection to the Gulf Coast, while non-megaregion areas have a strong
connection when standardizing by for population and economic productivity. The
weakest connections are Cascadia, the Arizona Sun Corridor, and Northern California,
and non-megaregion areas when standardizing by area.
In summary, the Gulf Coast’s freight traffic is very strong internationally. Within
the U.S., it is well connected to the Texas Triangle and the Midwest. Non-megaregion
areas also play a strong role in the Gulf Coast’s air freight. It has moderate intramega
freight traffic. The Gulf Coast is a net exporter of goods, although mostly influenced by
its international traffic, as it is a net importer with nine megaregions and non-megaregion
areas.
4.4.5 Midwest
4.4.5.1 Passenger Traffic
The Midwest megaregion’s passenger flows are highest to the Northeast, within the
Midwest, and to non-megaregion areas, as seen in Figure 4.13. After these top three flow
pairings, there is a group of five pairings that are just under half as large as the top three.
It has low passenger flows to the Arizona Sun Corridor, the Gulf Coast, and Cascadia.
Table C.9 summarizes the gross and standardized flows.
When standardizing the passenger flows, the Midwest is mostly strongly
connected to itself. Its intramega flows are the highest by every standardization. In
second and third consistently are the Northeast and Southern Florida. Non-megaregion
areas, when standardized by area are the least connected, but not when standardized by

116
population or economic productivity. Cascadia, the Gulf Coast, and Northern California
are the least connected megaregions when flows are standardized.
Figure 4.13: Midwest Passenger Flows
In summary, the Midwest is well tied to the Northeast and Southern Florida. It has
high flows to non-megaregion areas, and moderately high international flows. Its gross
flows are similar to its standardized flows, even with its intramega traffic at or near the
top of both. Its least strong connections are the smaller megaregions of the Gulf Coast,
Cascadia, Northern California, and the Arizona Sun Corridor.
4.4.5.2 Freight Traffic
The Midwest does not have very high international freight flows compared to other
megaregions, but it is still high compared to its other pairings. As seen in Figure 4.14, it
has significant freight flows to non-megaregion areas, internally as intramega flows, and
to the Northeast as well. It has low air freight flows to the smaller megaregions: the Front
0
100000000
200000000
300000000
400000000
500000000
600000000
700000000
800000000
Pas
seng
er T
rips
117
Range, Gulf Coast, and Arizona Sun Corridor. The Midwest exports goods to most
megaregions except Southern California and Northern California. Table C.10 summarizes
the gross and standardized flows.
Figure 4.14: Midwest Freight Flows
Standardizing by area, the top three pairings are with the Northeast, the Midwest
intramega flows, and with Southern California. It is weakly connected by area to the
Arizona Sun Corridor, non-megaregion areas, and the Gulf Coast.
The Midwest’s flows standardized by population and economic productivity are
similar. By population its top flow is to non-megaregion areas, while by economic
production its top standardized flow is its intramega movements. In third for both
standardization methods is the Northeast. The Arizona Sun Corridor has the weakest
standardized connection by population and economic productivity, with the Gulf Coast
and Front Range just above it.
0
5E+09
1E+10
1.5E+10
2E+10
2.5E+10
3E+10
3.5E+10
4E+10
4.5E+10
Pou
nds
of F
reig
ht

118
The Midwest’s air freight traffic is very strong internally to the megaregion,
internationally, and to the Northeast. Its connection to non-megaregion areas is also high.
The Midwest’s connections to other megaregions dwarfs that of the other areas, but
especially weak with the Arizona Sun Corridor, Gulf Coast, and Front Range. Even when
standardized, these smaller economies cannot compete with a large economy such as the
Northeast for the Midwest’s air traffic.
4.4.6 Northeast
4.4.6.1 Passenger Traffic
The Northeast has very strong passenger connections to both the Midwest and
internationally, as seen in Figure 4.15. In addition, Southern Florida is a very large
market pair for the Northeast, followed by a slow drop-off in other connections. The
lowest volumes are to and from the Front Range, Arizona Sun Corridor, and Cascadia.
Table C.11 summarizes the gross and standardized flows.
Passenger flows for the Northeast when standardized by area show that Southern
Florida is the strongest connection. The Northeast’s intramega flows are the second
strongest connection, with the Piedmont in third. The weakest connection by area is with
non-megaregion areas, followed by Cascadia and the Arizona Sun Corridor.
Standardized flows by population and economic productivity are similar.
Southern Florida is still the top pairing for the Northeast, while the Midwest and
Piedmont are also strong. The weakest connection is with Cascadia, followed by the
Arizona Sun Corridor and the Gulf Coast.

119
Figure 4.15: Northeast Passenger Flows
In summary, the Northeast has strong pairings with Southern Florida, the
Midwest, and the Piedmont. These four eastern megaregions consistently show up at the
top of each other’s lists. The Northeast has very strong international connections, and
also moderately large flows with the non-megaregion areas. It is the least connected with
megaregions with small populations and economies spatially farther away: the Arizona
Sun Corridor, Gulf Coast, and Cascadia.
4.4.6.2 Freight Traffic
The freight connection the Northeast has internationally is four times larger than what it
has with any other area. As a net importer (with a 25% difference between exports and
imports internationally), this part of the Northeast’s air freight market is a critical piece of
the Northeast freight network. As seen in Figure 4.16, the next largest flows behind the
international market are the Midwest and non-megaregion areas, each over twice as large
as the fourth place megaregion, Southern California. The lowest freight connections are
0
100000000
200000000
300000000
400000000
500000000
600000000
700000000
800000000
Pas
seng
er T
rips
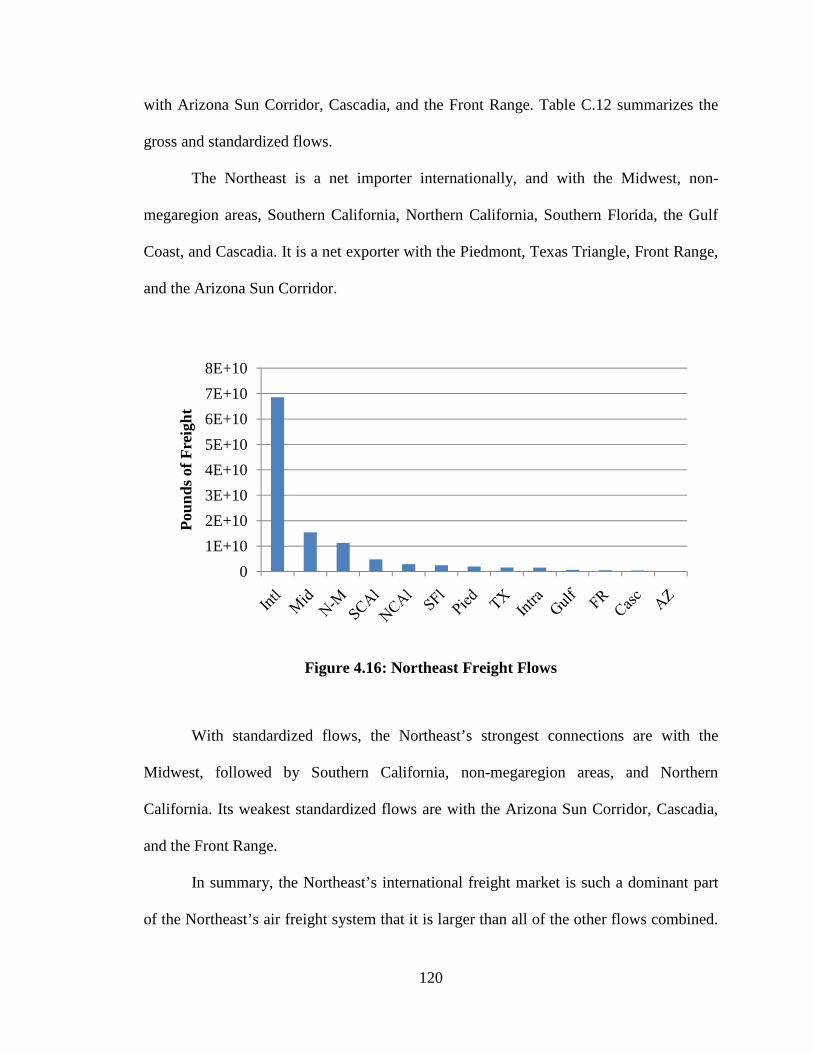
120
with Arizona Sun Corridor, Cascadia, and the Front Range. Table C.12 summarizes the
gross and standardized flows.
The Northeast is a net importer internationally, and with the Midwest, non-
megaregion areas, Southern California, Northern California, Southern Florida, the Gulf
Coast, and Cascadia. It is a net exporter with the Piedmont, Texas Triangle, Front Range,
and the Arizona Sun Corridor.
Figure 4.16: Northeast Freight Flows
With standardized flows, the Northeast’s strongest connections are with the
Midwest, followed by Southern California, non-megaregion areas, and Northern
California. Its weakest standardized flows are with the Arizona Sun Corridor, Cascadia,
and the Front Range.
In summary, the Northeast’s international freight market is such a dominant part
of the Northeast’s air freight system that it is larger than all of the other flows combined.
0
1E+10
2E+10
3E+10
4E+10
5E+10
6E+10
7E+10
8E+10
Pou
nds
of F
reig
ht

121
Still, the Northeast has strong connections to the Midwest as well. In addition, it is well
connected to non-megaregion areas, and to Southern California. It has very little
connection with the non-California western megaregions: Front Range, Cascadia, and
Arizona Sun Corridor. Its intramega freight flow is only moderately high.
4.4.7 Northern California
4.4.7.1 Passenger Traffic
Not surprisingly, Northern California has a very strong passenger tie with Southern
California, with flows to its neighbor in-state that are larger than the next three highest
flow pairs combined. Figure 4.17 shows the high flow rates between these two
megaregions, with similarly sized flows for the several pairings after. The next three are
to the international market, the Midwest, and Cascadia. Northern California has very low
flows to Southern Florida and the Gulf Coast and low intramega flows. Table C.13
summarizes the gross and standardized flows.
Standardized flows verify the strong connection Northern California has with
Southern California and Cascadia. In addition, the Arizona Sun Corridor is a strong
connection when standardized by population and economic productivity. By area,
Northern California’s intramega flows are strong.
North California’s weak connections are revealed through standardized flows.
The weak connections are with the Gulf Coast and Southern Florida when standardized
by all three methods. By area, in addition, non-megaregion areas are a weaker
connection, but by population and economic productivity, Northern California’s
connection with the Piedmont is considered one of the weaker flows.

122
Figure 4.17: Northern California Passenger Flows
In summary, Northern California is strongly connected to the western
megaregions of Southern California, Cascadia, and the Arizona Sun Corridor. The
megaregion has a strong presence in international passenger traffic. Due to its small
megaregion size, there are very little internal flows, but the flows that do exist are
relatively high for its size. Northern California is not well connected to the southeastern
megaregions of Southern Florida, Piedmont, and the Gulf Coast.
4.4.7.2 Freight Traffic
International freight traffic is the number one pairing for Northern California, being a net
importer from the international market. As seen in Figure 4.18, there is a small drop in
magnitude after international flows, followed by non-megaregion areas and the Midwest.
Northern California has low air freight flows with the Gulf Coast, Southern Florida, and
within the Northern California megaregion. Although Northern California only imports
from two megaregions, Southern Florida and Southern California, it is still a net importer
0
50000000
100000000
150000000
200000000
250000000
300000000
350000000
400000000
450000000
Pas
seng
er T
rips

123
as a whole because of the immense volume of international flows sending air freight to
Northern California. Table C.14 summarizes the gross and standardized flows.
Figure 4.18: Northern California Freight Flows
Despite having a low magnitude of intramega flows, when standardized by area,
the small size of the Northern California megaregion causes this flow to be the top
ranked. Other top flows by area are with Southern California and the Midwest. Low
connections exist with the Gulf Coast, non-megaregion areas, and Southern Florida when
standardizing by area.
When standardizing by population, Northern California’s top connections are with
the Midwest, Cascadia, and Southern California. Its weakest connections are with the
Gulf Coast, Southern Florida, and Piedmont.
0
2E+09
4E+09
6E+09
8E+09
1E+10
1.2E+10
1.4E+10
1.6E+10
Pou
nds
of F
reig
ht
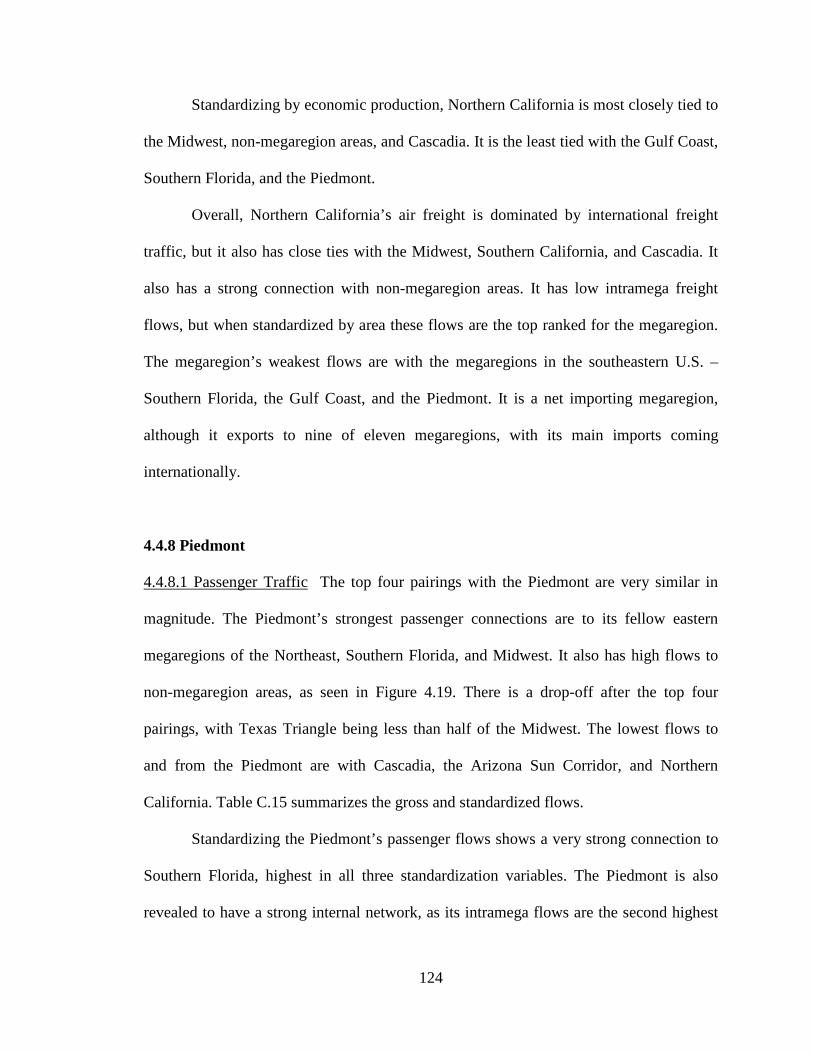
124
Standardizing by economic production, Northern California is most closely tied to
the Midwest, non-megaregion areas, and Cascadia. It is the least tied with the Gulf Coast,
Southern Florida, and the Piedmont.
Overall, Northern California’s air freight is dominated by international freight
traffic, but it also has close ties with the Midwest, Southern California, and Cascadia. It
also has a strong connection with non-megaregion areas. It has low intramega freight
flows, but when standardized by area these flows are the top ranked for the megaregion.
The megaregion’s weakest flows are with the megaregions in the southeastern U.S. –
Southern Florida, the Gulf Coast, and the Piedmont. It is a net importing megaregion,
although it exports to nine of eleven megaregions, with its main imports coming
internationally.
4.4.8 Piedmont
4.4.8.1 Passenger Traffic The top four pairings with the Piedmont are very similar in
magnitude. The Piedmont’s strongest passenger connections are to its fellow eastern
megaregions of the Northeast, Southern Florida, and Midwest. It also has high flows to
non-megaregion areas, as seen in Figure 4.19. There is a drop-off after the top four
pairings, with Texas Triangle being less than half of the Midwest. The lowest flows to
and from the Piedmont are with Cascadia, the Arizona Sun Corridor, and Northern
California. Table C.15 summarizes the gross and standardized flows.
Standardizing the Piedmont’s passenger flows shows a very strong connection to
Southern Florida, highest in all three standardization variables. The Piedmont is also
revealed to have a strong internal network, as its intramega flows are the second highest
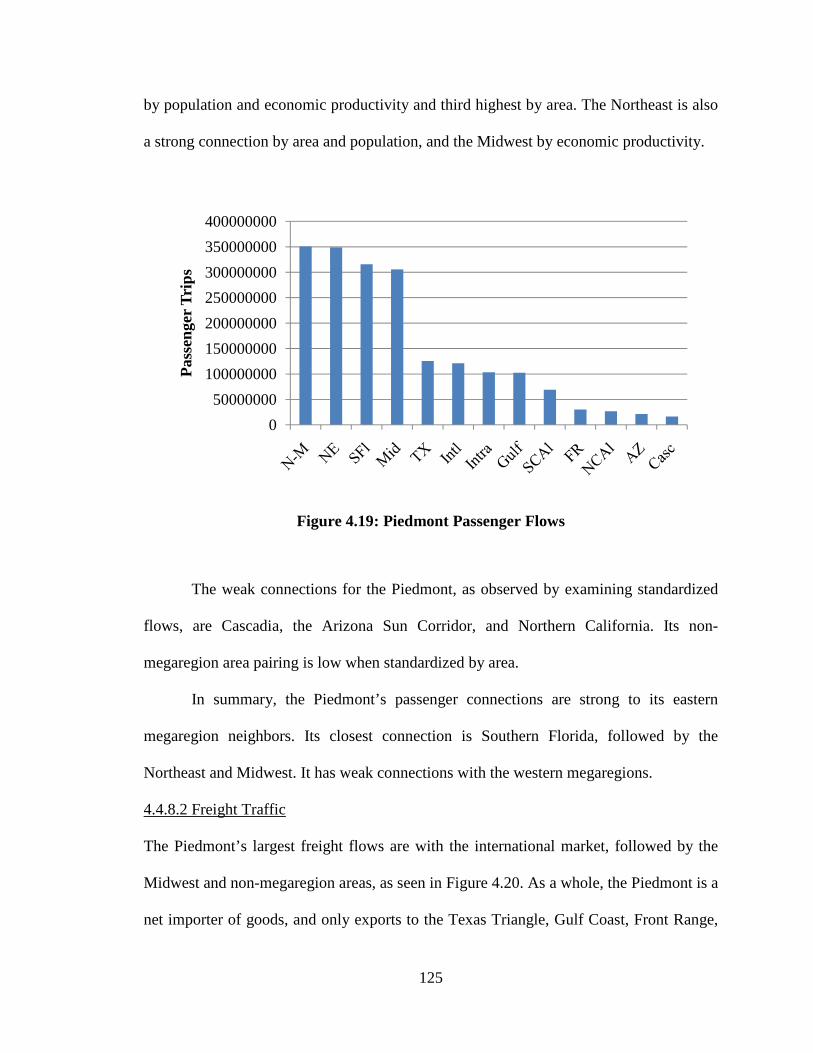
125
by population and economic productivity and third highest by area. The Northeast is also
a strong connection by area and population, and the Midwest by economic productivity.
Figure 4.19: Piedmont Passenger Flows
The weak connections for the Piedmont, as observed by examining standardized
flows, are Cascadia, the Arizona Sun Corridor, and Northern California. Its non-
megaregion area pairing is low when standardized by area.
In summary, the Piedmont’s passenger connections are strong to its eastern
megaregion neighbors. Its closest connection is Southern Florida, followed by the
Northeast and Midwest. It has weak connections with the western megaregions.
4.4.8.2 Freight Traffic
The Piedmont’s largest freight flows are with the international market, followed by the
Midwest and non-megaregion areas, as seen in Figure 4.20. As a whole, the Piedmont is a
net importer of goods, and only exports to the Texas Triangle, Gulf Coast, Front Range,
0
50000000
100000000
150000000
200000000
250000000
300000000
350000000
400000000
Pas
seng
er T
rips
126
and Arizona Sun Corridor, some of its smallest air freight flow pairs. It also has low
intramega freight traffic. Table C.16 summarizes the gross and standardized flows.
The Midwest and Southern Florida are the two strongest connections the
Piedmont has in freight flows, first and second, respectively, in all standardizations.
Standardized by area, the Piedmont’s pairing with the Northeast is near the top, but by
population and economic productivity the pairing with non-megaregion areas is strong.
The Piedmont has its weakest connections in air freight with the Arizona Sun Corridor
and the Front Range.
Figure 4.20: Piedmont Freight Flows
In summary, the Piedmont’s air freight flows consist of strong connections
internationally as well as to the eastern megaregions such as the Midwest and Southern
Florida. Its non-megaregion area connection is strong as well, even by standardized
0
2E+09
4E+09
6E+09
8E+09
1E+10
1.2E+10
1.4E+10
Pou
nds
of F
reig
ht

127
flows. Western megaregions have weaker flows to the Piedmont, but it is with its weaker
connections that the Piedmont exports goods.
4.4.9 Southern California
4.4.9.1 Passenger Traffic
Southern California’s primary passenger markets are with Northern California, the
international market, and the Midwest. As seen in Figure 4.21 there is a slow decline in
flows from the busiest to smallest flows. Its lowest flows are with the Piedmont, Gulf
Coast, and Southern Florida. Table C.17 summarizes the gross and standardized flows.
Figure 4.21: Southern California Passenger Flows
By area, Southern California’s flows are greatest with Northern California and the
Northeast, along with its intramega flows. It has weaker connections with non-
megaregion areas, Southern Florida, and the Gulf Coast.
0
50000000
100000000
150000000
200000000
250000000
300000000
350000000
400000000
450000000
Pas
seng
er T
rips

128
Southern California’s standardized flows by area and population are similar in
rankings. Northern California has the greatest ties, with the Arizona Sun Corridor in
second. Southern California’s intramega flows are the third highest. Southern Florida, the
Gulf Coast, and the Piedmont have the weakest flows with Southern California.
In summary, passenger connections with Southern California are strong to its
neighbors of Northern California and the Arizona Sun Corridor. It has high traffic levels
to its nearest neighbors. In addition, the megaregion has high flows internationally but
also internally as intramega flows. It is the least tied to the southeastern megaregions of
Southern Florida, the Gulf Coast, and the Piedmont.
4.4.9.2 Freight Traffic
International freight is very dominant in Southern California, almost equaling the
magnitude of all other freight flows elsewhere combined. It is a net importer with a 33%
difference in exports and imports. The second highest flow is to non-megaregion areas,
one-third the magnitude of international flows, followed by the Midwest, as seen in
Figure 4.22. The lowest flows are intramega, to the Gulf Coast, and to the Arizona Sun
Corridor. Table C.18 summarizes the gross and standardized flows.
Southern California is a net importer, influenced strongly by the flows it has with
the international market. To the U.S. and its megaregions, it is a net importer from non-
megaregion areas, Southern Florida, and the Front Range. To all other megaregions it is a
net exporter.
Standardized by area, Southern California’s strongest flows are to the Northeast
but also to the Midwest and Northern California. It has weak flows by area to the Gulf
Coast and non-megaregion areas, as well as its intramega flows.

129
Figure 4.22: Southern California Freight Flows
The standardizations of flows by population and economic productivity show that
Southern California’s strongest ties are the Midwest, Northern California, and non-
megaregion areas. It has weak connections with the Gulf Coast and Southern Florida, as
well as having weak intramega flows.
In summary, Southern California has one of the strongest international
connections for air freight of all the U.S. megaregions. It is tied to Northern California as
its in-state neighboring megaregion, but also across the country to the Midwest. It has a
high volume and significant standardized flow to non-megaregion areas. Southern
California is weakly tied by air freight to the southeastern U.S., with low flows to the
Gulf Coast and Southern Florida. Southern California’s intramega network is small
compared to the size, population, and economic productivity of the megaregion.
0
5E+09
1E+10
1.5E+10
2E+10
2.5E+10
3E+10
3.5E+10
Pou
nds
of F
reig
ht
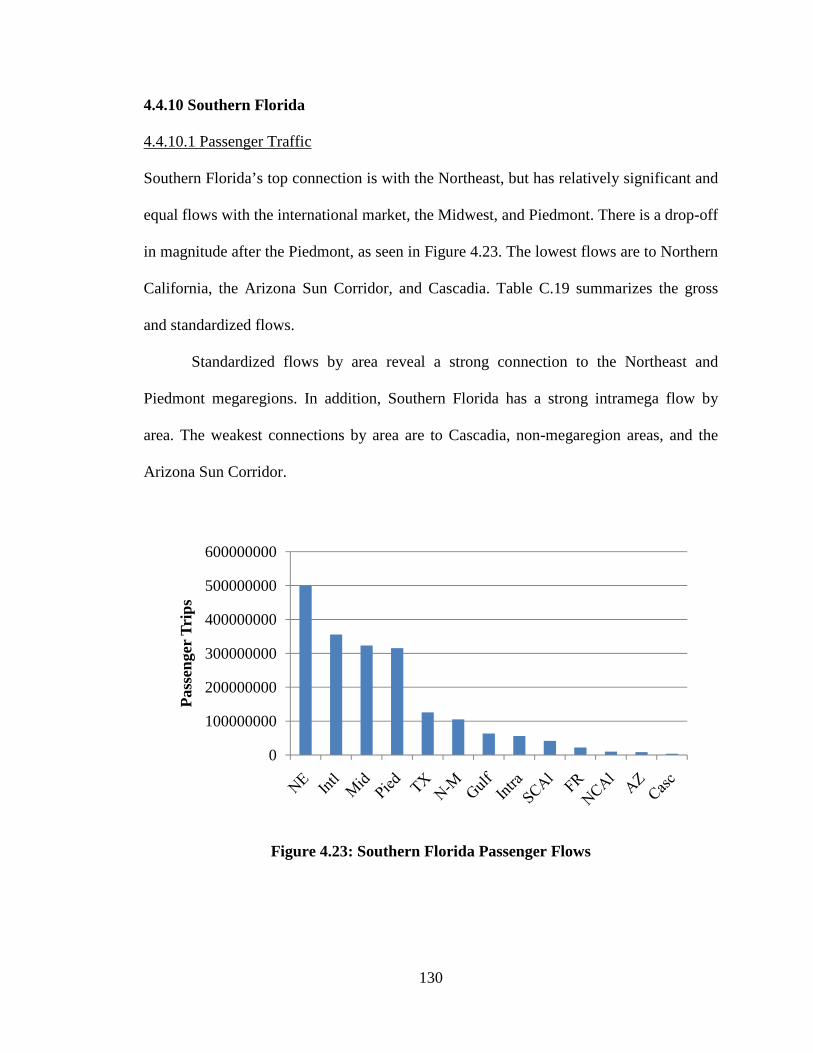
130
4.4.10 Southern Florida
4.4.10.1 Passenger Traffic
Southern Florida’s top connection is with the Northeast, but has relatively significant and
equal flows with the international market, the Midwest, and Piedmont. There is a drop-off
in magnitude after the Piedmont, as seen in Figure 4.23. The lowest flows are to Northern
California, the Arizona Sun Corridor, and Cascadia. Table C.19 summarizes the gross
and standardized flows.
Standardized flows by area reveal a strong connection to the Northeast and
Piedmont megaregions. In addition, Southern Florida has a strong intramega flow by
area. The weakest connections by area are to Cascadia, non-megaregion areas, and the
Arizona Sun Corridor.
Figure 4.23: Southern Florida Passenger Flows
0
100000000
200000000
300000000
400000000
500000000
600000000
Pas
seng
er T
rips

131
Flows standardized by population and economic productivity are similar. The top
connections for Southern Florida are to the Piedmont, Northeast, and Midwest. The
weakest flows are to Cascadia, Northern California, and the Arizona Sun Corridor.
Southern Florida is one of the four eastern megaregions that have strong
connections in passenger traffic, and thus flows to and from the Northeast, Piedmont, and
the Midwest show up prominently even in standardizations. Its international connection is
strong as well. Southern Florida is not well tied to the western megaregions.
4.4.10.2 Freight Traffic
International freight’s dominance over Southern Florida’s air flows is clear. Nearly three
times as much freight is destined to or coming from the international market than all
other combined flows into and out of Southern Florida. Compared to international flows,
as seen in Figure 4.24, the remaining pairings seem small. Non-megaregion areas, nearly
nine times smaller than the international flows, are the second highest, followed by the
Midwest. The weakest air freight connections are with the Arizona Sun Corridor, Front
Range, and Cascadia. Due to the high volume of the international traffic, Southern
Florida is a net importer megaregion. It does, however, act as a net exporter to seven of
the megaregions, and is a net importer to non-megaregion areas, Midwest, Texas
Triangle, and Cascadia. Table C.20 summarizes the gross and standardized flows.
The standardized flows reveal strong freight connections to the Midwest,
Piedmont, non-megaregion areas, and the Northeast. Weaker flows are seen to be with
the Arizona Sun Corridor, the Front Range, and Cascadia.
Southern Florida’s freight flows center around its international connections. The
flows to the U.S. are to nearby megaregions in the east: the Midwest, Piedmont, and the

132
Northeast. It also has high gross and standardized flows to non-megaregion areas.
Southern Florida has weaker freight ties with western megaregions, and has moderately
high intramega freight flows.
Figure 4.24: Southern Florida Freight Flows
4.4.11 Texas Triangle
4.4.11.1 Passenger Traffic
The Texas Triangle’s top flow is to non-megaregion areas, but the top flows after decline
slowly, as seen in Figure 4.25. The second and third largest flows are to the Midwest and
the Gulf Coast, with its intramega flows in fourth. Its smallest flows are with Northern
California, the Arizona Sun Corridor, and Cascadia. Table C.21 summarizes the gross
and standardized flows.
0
1E+10
2E+10
3E+10
4E+10
5E+10
6E+10
Pou
nds
of F
reig
ht

133
Figure 4.25: Texas Triangle Passenger Flows
The Texas Triangle’s standardized flows reveal that its intramega flows are very
strong compared to other pairings. Behind its intramega flows are those with the Gulf
Coast, Southern California (by area and population), and the Piedmont (by economic
productivity). Its weaker flows pairings by area are with non-megaregion areas, Cascadia,
and the Arizona Sun Corridor. By population and economic productivity the weakest
flows are with Cascadia, the Northeast, and Northern California.
Overall, the Texas Triangle has one of the strongest intramega passenger flow
levels of any megaregion. It is well connected to the adjacent Gulf Coast and with
Southern California. In addition, its non-megaregion area connection by gross volume is
its largest flow. Texas Triangle’s weakest flows are with Cascadia and Northern
California, as well as with the Northeast.
0
50000000
100000000
150000000
200000000
250000000
300000000
350000000
Pas
seng
er T
rips

134
4.4.11.2 Freight Traffic
The largest freight flow for the Texas Triangle is its international freight connection,
about twice as large as the next two largest flows, as seen in Figure 4.26, to the Midwest
and non-megaregion areas. The weakest flows are to the Front Range, Arizona Sun
Corridor, and Cascadia. As a whole, the Texas Triangle is a net importer. It only is a net
exporter with Southern Florida, the Gulf Coast, Front Range, and the Arizona Sun
Corridor. Table C.22 summarizes the gross and standardized flows.
Standardized freight flows for the Texas Triangle show that the Midwest is the
top pairing for freight movement. Southern California and non-megaregion areas are also
a significant pair, although non-megaregion areas are considered weak when standardized
by area. Weak standardized freight pairings exist with Cascadia, the Arizona Sun
Corridor, and the Front Range.
Figure 4.26: Texas Triangle Freight Flows
0
2E+09
4E+09
6E+09
8E+09
1E+10
1.2E+10
1.4E+10
Pou
nds
of F
reig
ht

135
The Texas Triangle’s strong international freight connection is dominant, but the
megaregion also has significant flows with the Midwest, Southern California, and non-
megaregion areas. The weaker connections are with the western non-California
megaregions.
4.4.12 Summary
The collection of each of the megaregions’ unique set of flow pairs for passenger and
freight traffic have identifiable trends. Through an examination of each of the
megaregions’ flows, it was possible to identify the character of each megaregion’s
networks. The purpose of this summary is to gather what was learned about each
megaregion and discuss these findings.
If one were to combine all of the megaregions, intermega flows would be the top
pairing for all of the megaregions. Consisting of the majority of the country’s
metropolitan areas, population, and economic production, megaregion to megaregion
travel is naturally the largest portion of the U.S. passenger travel market. The proportion
of megaregions’ total flows that were intermega flows ranged from 53% (Midwest) to
84% (Arizona).
Overall, it is seen that megaregions generally have their greatest passenger
connections with the megaregions that are nearest to them, and have similar weak flows
to other parts of the country. The four eastern megaregions, the Midwest, Northeast,
Piedmont, and Southern Florida, all have high passenger flows to each other over other
megaregions in the central or western part of the country. Western megaregions often
have their highest flows to other western megaregions, and have weak flows to the

136
southeastern U.S. For any given megaregion, two of its top three standardized passenger
flows were to the megaregions nearest to it geographically or its intramega flow.
When comparing intermega, intramega, non-megaregion, and international flows,
the second most prominent pairing after intermega flows is different among the
megaregions. Three megaregions had intramega traffic as the second highest, the case for
Gulf Coast, Midwest, and Texas Triangle. The second highest pairing for four
megaregions was non-megaregion areas, the case for Arizona Sun Corridor, Cascadia,
Front Range, and Piedmont. These four megaregions are the four smallest megaregions
by land area. The second most prominent pairing for four megaregions was the
internationals market, the case for the Northeast, Northern California, Southern
California, and Southern Florida. These are four of the top six in terms of GMP.
Megaregion size plays a strong role in deciding the magnitude of its intramega
flows. This makes sense practically, as a larger megaregion is more likely to require air
travel for passengers to reach its extents. Thus, it is not surprising that the megaregions
with the strongest intramega flows are the Midwest, Texas Triangle, and Southern
California, the three largest megaregions. Also with significant intramega flows are the
Gulf Coast and the Front Range, both very linear megaregions. By gross volumes, the
four megaregions that have intramega traffic as one of its top two megaregion
destinations are all in the top six in size.
Freight traffic is strongly oriented towards the international market. Of the eleven
megaregions, only three megaregions did not have their pairing with the international
market as their top flow. One of these, Cascadia, had international flows as their second
highest pairing, just behind non-megaregion areas. That leaves two megaregions that do

137
not have a prominent international flow pairing: the Arizona Sun Corridor and the Front
Range. These two megaregions are far inland, requiring air freight to be transported
farther at high costs to these megaregions. In addition, they have small populations and
fewer major cities than the other megaregions. In conjunction with having newer, less
established economies, it is not surprising that they lack in the international freight
business. The remaining megaregions have international freight as their highest flow due
to their proximity to the coasts (less distance for air freight to have to be shipped), and
due to established network economies more tuned into other world cities and markets.
Nine of the eleven megaregions had the same three gross volume pairs as their top
flows. Already mentioned was international flows, but non-megaregion flows and flows
with the Midwest are also very high. For the two megaregions which do not have high
international flows, the Midwest and non-megaregion areas are their top two flow pairs.
By gross volumes, all of these are large in freight flows due to the large markets (the
international, non-megaregion area, and Midwest markets) they represent. Even though
they may not be high when standardized, airports within megaregions still must handle
such high volumes of freight to these areas.
The Midwest is interesting in particular, because it exists with high flows to all
megaregions in freight, while it did not in passenger traffic. This detail leads to an
important finding. While there is a spatial element to where the greatest connections are
for passenger traffic (nearby megaregions have higher flow pairs), freight traffic’s spatial
relationship is less clear. Many megaregions in fact have high standardized flows, not just
high gross volumes, within the U.S. to the Midwest and non-megaregion areas.
138
Although not always at the top of gross volumes, the California megaregions are
often one of the top standardized flows, even for the Northeast across the country. There
are clear ties to the west coast in terms of air freight, and the only megaregions that are
not associated with the west coast through air freight are the three southeastern
megaregions: the Gulf Coast, Piedmont, and Southern Florida. The Gulf Coast is tied
strongly to the Texas Triangle, while the latter two are strongly tied to each other.
One aspect of the freight traffic that cannot be ignored is the prominence of
freight hubs in their network, as compared to passenger hubs in their networks. Much of
the freight traffic, even in a set of market data, goes through the major freight hubs of the
major freight carries: UPS and FedEx. Thus, a brief examination of the top airport freight
flows in the country reveals many flows which originate in or are destined for UPS’s
primary U.S. hub in Louisville, Kentucky (SDF), or FedEx’s primary U.S. hub in
Memphis, Tennessee (MEM). This has a large effect on the distribution of flows to the
areas in the study. SDF is located in the Midwest megaregion and MEM is within the
non-megaregion area. Appropriately, these two areas are part of the top freight pairings
nationwide. Although it does not tell the whole story, it has a mentionable effect on the
results.
4.5 Individual Megaregions: Intramega Flows
The flows within a megaregion are telling of how significant the connections between the
megaregion’s cities are. This connection gives insight into the role of air travel for the
passengers and freight of that megaregion. Spatially looking at each megaregion’s
passenger and freight flows helps reveal how the size and shape of a megaregion relates

139
to its population and economic productivity. From that synthesis, it is possible to draw
out how air travel plays a role in moving people and goods within a megaregion.
Two summary tables are provided in Tables 4.21 and 4.22 for passenger and
freight traffic, respectively. The tables are each ranked by gross volumes, but provide
standardizations by area, population, and economic productivity.
Table 4.21: Intramega Passenger Flow Summary
Megaregion Gross (trips)
Trips per sq mi
Trips per capita
Trips per $ trillion GMP
Midwest 616259829 3006 11.5 297.3 Northeast 255887384 4152 5.2 98.8 Texas Triangle 185872799 2193 11.5 227.2 Southern California 119118232 1925 5.4 114.9 Piedmont 103299958 1734 7.0 212.6 Gulf Coast 70666029 1222 6.0 134.9 Southern Florida 55891075 1441 3.8 91.9 Cascadia 22959605 485 3.1 68.1 Front Range 20658751 364 4.4 90.2 Northern California 20130096 418 1.6 32.3 Arizona Sun Corridor 10334221 212 2.3 54.1
The top intramega flows for passenger traffic are in the Midwest, Northeast,
Texas Triangle, and Southern California. These are the four largest megaregions by
population, economic productivity, and land area. The Midwest and Texas Triangle,
compared to the other two, have much more active intramega passenger traffic as their
standardization by economic productivity and population are greater than the Northeast
and Southern California. The Northeast, however, is the most active megaregion in
passenger travel for its size. Although not at the top for gross volumes, the Piedmont and

140
Gulf Coast megaregions are very active for the size of their economy and population,
third and fourth on the list, respectively, in both of these standardizations.
Table 4.22: Intramega Freight Flow Summary
Megaregion Gross (lbs of
freight) Freight per
sq mi Freight
per capita Freight per $ trillion GMP
Midwest 10101634112 49269 187.9 4873.0 Northeast 1530860378 24838 30.9 590.8 Texas Triangle 873741146 10307 54.2 1068.1 Southern Florida 396491414 10223 27.0 652.1 Southern California 388561448 6281 17.8 374.7 Northern California 316494097 6570 24.9 508.0 Piedmont 303227302 5089 20.4 623.9 Cascadia 299287420 6322 40.4 888.1 Gulf Coast 216749252 3748 18.5 413.6 Front Range 55143624 972 11.6 240.8 Arizona Sun Corridor 53962549 1106 11.9 282.5
Northern California is the weakest megaregion for intramega traffic. Despite
having a moderately high population, area, and economic productivity, its intramega
traffic is near the bottom of the list.
The Front Range and Arizona Sun Corridor, on the other hand, have smaller
economies, areas, and populations, and accordingly have some two of the smallest
intramega flows. How they differ though is that the Front Range greatly exceeds the
Arizona Sun Corridor in standardized flows.
Freight traffic’s rankings are skewed slightly by the dominance of the Midwest.
Due to the presence of UPS’s freight hub, the Midwest’s intramega freight flows are an
order of magnitude larger than the rest of the megaregions, with the Northeast being the
141
closest, over six times smaller. It is reasonable that even without the UPS hub, the
Midwest would be the top megaregion, as it was for passenger traffic. Behind the
Midwest still is the Northeast, which has intramega freight flows twice as large as the
third place megaregion, the Texas Triangle. It is then a dropoff to the smaller intramega
freight flows of Southern Florida, Southern California, and Northern California. Of these
top megaregions in intramega flows, apart from the dominant Midwest, the Texas
Triangle stands above the rest with high standardized flows by population and economic
productivity. One must look further down the list though for the next greatest in these two
categories, as the Cascadia’s smaller intramega flow network are quite large for the size
of its population and economic productivity.
Southern California, in fact, has relatively weak intramega freight traffic. Its
standardized flows by economic productivity and population put it just above the two
weakest freight systems, the Front Range and the Arizona Sun Corridor, and just behind
the Gulf Coast.
The size of a megaregion certainly has a role to play in its intramega passenger
and freight traffic, but slight shifts in the ordering of megaregions likely has some effect
from the number and distribution of airports in a megaregion, the spread of the largest
metropolitan areas, and geography.
The following sections describe each megaregion’s intramega flows. Maps are
provided to show where airplanes travel amongst each megaregion’s airports. All of the
passenger flow maps have the same scales for the passenger flows, measured in trips.
Similarly, all of the freight flow maps have the same scales for the freight flows,
measured in pounds of freight. The color scales were determined based on the largest

142
intramega flows in all the megaregions: 20 million trips was chosen as the largest bin for
passenger flows, and 100 million pounds was chosen as the largest bin for freight flows.
In addition, the flow scales of passenger and freight movements are proportional.
A similarly colored freight flow line, in pounds, is five times the value of a passenger
flow line, in trips. This provides for a comparison between passenger and freight maps in
terms of the magnitudes of flows between an airport pair. For example, on a
megaregion’s passenger flow map, a pair’s line is red, while on the megaregion’s freight
flow map that same pair’s line is orange. One can identify that the freight flows between
the pair of airports are relatively more active, as compared to the greatest flows
nationwide, than the passenger flows.
4.5.1 Arizona Sun Corridor
4.5.1.1 Passenger Traffic
The intramega passenger system for the Arizona Sun Corridor is almost entirely focused
on passenger traffic between Phoenix and Tucson, the megaregion’s two largest
metropolitan areas, and the only two hub airports in the megaregion. A map of the
passenger flows is shown in Figure 4.27. Non-primary airports in the Arizona Sun
Corridor generally only had passenger flows to either PHX or TUS. It is clear that the
megaregion’s intramega passenger air traffic is a dyad.

PHX
TUS
AirportsNPIAS Hubs
Large
Medium
Non-primary
Passenger Flows (trips)PASSENGERS
< 1 million
1 to 5 million
5 to 10 million
> 10 million
¯0 50 10025
Miles
Figure 4.27: Arizona Sun Corridor Intramega Passenger Flows
143

PHX
TUS
AirportsNPIAS Hubs
Large
Medium
Non-primary
Freight Flows (lbs)< 5 million
5 to 25 million
25 to 50 million
> 50 million
¯0 50 10025
Miles
Figure 4.28: Arizona Sun Corridor Intramega Freight Flows
144
145
4.5.1.2 Freight Traffic
Phoenix and Tucson make up nearly the entire Arizona Sun Corridor intramega air
freight market, as seen in Figure 4.28. There are a few non-primary airports which had
very light freight flows to the two hub airports. It is clear that the megaregion’s intramega
freight traffic is a dyad.
4.5.2 Cascadia
4.5.2.1 Passenger Traffic
The Cascadia megaregion has a passenger network that is dominated by its two largest
metropolitan areas, Seattle and Portland. Over 10 million passengers traveled between
SEA and PDX, , and all other significant flows had one of these airports as an endpoint,
as seen in Figure 4.29. EUG is the only city to have significant flows greater than one
million passenger trips to SEA and PDX. Many non-primary and non-hub airports have
flows between each other, especially along the Pacific coastline. It is clear, though, that
the Cascadia megaregion’s intramega passenger traffic is a dyad.
4.5.2.2 Freight Traffic
Freight traffic in Cascadia is dominated by the two metropolitan areas of Seattle and
Portland. A map of the intramega freight network is show in Figure 4.30. The freight
flows in Seattle, however, are produced at and attracted from not only SEA, but also to
and from Boeing Field (BFI), Seattle’s primary air freight airport and the location of
Boeing’s final preparation facilities. Within Cascadia, BFI’s primary freight flow is with
PDX, while SEA has significant freight flows with several non-hub airports. Cascadia’s
intramega freight network makes use of non-primary airports much

EUG
PDX
BLI
CLM
SEABFI
YKM
FRD
AirportsNPIAS Hubs
Large
Medium
Non-hub
Non-primary
Passenger Flows (trips)< 1 million
1 to 5 million
5 to 10 million
> 10 million
¯
0 100 20050Miles
Figure 4.29: Cascadia Intramega Passenger Flows
146
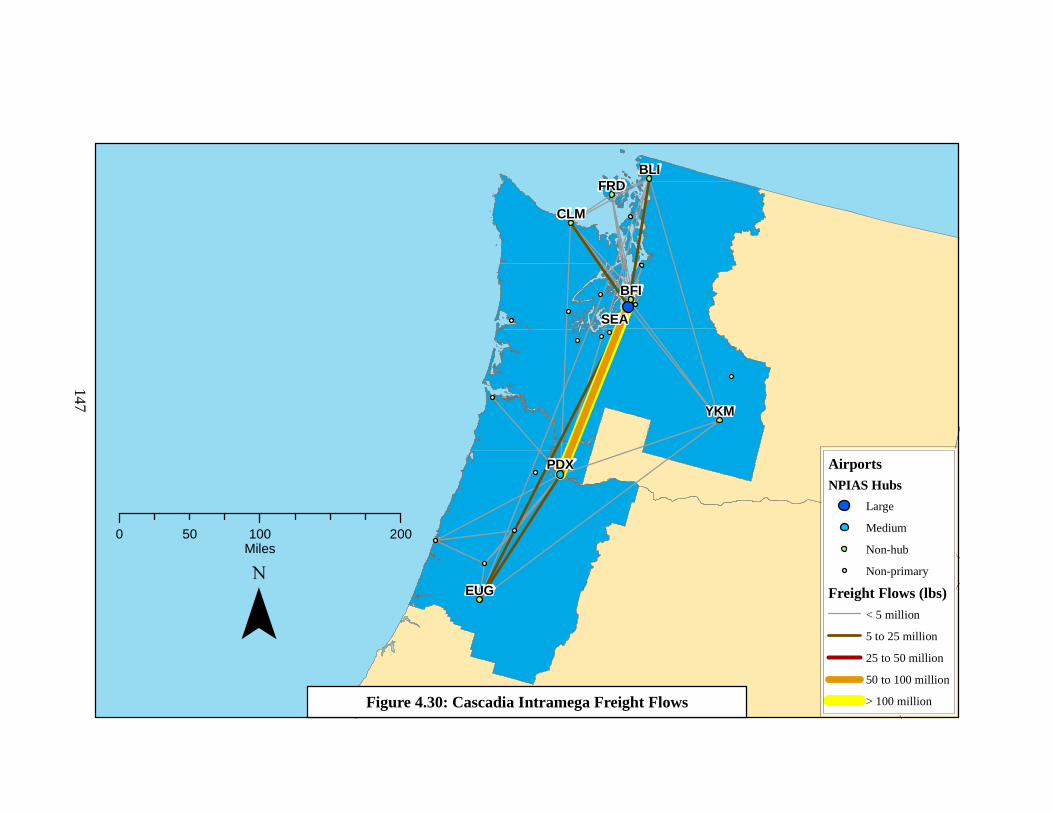
EUG
PDX
BLI
CLM
SEA
BFI
YKM
FRD
AirportsNPIAS Hubs
Large
Medium
Non-hub
Non-primary
Freight Flows (lbs)< 5 million
5 to 25 million
25 to 50 million
50 to 100 million
> 100 million
¯
0 100 20050Miles
Figure 4.30: Cascadia Intramega Freight Flows
147

148
less than the passenger network. EUG is the only non-hub airport with significant flows
to both PDX and SEA. Cascadia’s intramega freight network is a dyad.
4.5.3 Front Range
4.5.3.1 Passenger Traffic
Passenger travel in the Front Range megaregion is primarily between the Denver and
Albuquerque metropolitan areas. Within the intramega passenger system there are also
significant flows from Denver to Eagle and Colorado Springs, Colorado, as seen in
Figure 4.31. The flow between Denver and Colorado Springs, is actually just under 90%
of the flow Denver has with Albuquerque. The non-hub and non-primary airports in the
megaregion have low flows to the megaregion’s larger airports, and there are connections
between many of the smaller airports. Overall, though, Denver is the centerpoint of the
megaregion, and the intramega passenger flow network is clearly hub-focused.
4.5.3.2 Freight Traffic
The Front Range’s intramega air freight network is not as prominent as the passenger
network, with the major flow between the two main Front Range metropolitan areas
being less significant on a national scale. A map of the intramega freight network is
shown in Figure 4.32. That main flow, between Denver and Albuquerque, encompasses
over 80% of the Front Range’s freight flows. There is minimal air freight between
Denver and Colorado Springs. The small airports exchange air freight primarily with
either Albuquerque or Denver. Due to the prominence of the main flow in the
megaregion, Front Range’s intramega freight network is considered a dyad.

COS
DENEGE
FNL
ABQ
CYS
AirportsNPIAS Hubs
Large
Medium
Small
Non-hub
Non-primary
Passenger Flows (trips)< 1 million
1 to 5 million
5 to 10 million
> 10 million
¯0 100 20050
Miles
Figure 4.31: Front Range Intramega Passenger Flows
149

COS
DENEGE
FNL
ABQ
CYS
AirportsNPIAS Hubs
Large
Medium
Small
Non-hub
Non-primary
Freight Flows (lbs)< 5 million
5 to 25 million
> 25 million
¯0 100 20050
Miles
Figure 4.32: Front Range Intramega Freight Flows
150

151
4.5.4 Gulf Coast
4.5.4.1 Passenger Traffic
The Gulf Coast megaregions intramega passenger network has a strong focus on the
Houston metropolitan area. HOU and IAH play similar roles in serving the megaregion to
the south and to New Orleans, but IAH plays a greater role in connecting the megargion’s
eastern half. The greatest flows are between Houston and New Orleans, but no significant
flows are paired with MSY, as seen in Figure 4.33. It is concluded that the Gulf Coast has
a hub-focused intramega passenger flow network, with the hub being the Houston
metropolitan area airports.
4.5.4.2 Freight Traffic
In the Gulf Coast megaregion’s intramega freight network, IAH plays a larger role than
HOU. MSY has a smaller role in the megaregion’s freight network than it does in the
passenger network. In Figure 4.34, it is seen that the megaregion’s small and no-hub
airports have relatively insignificant freight flows. It is clear by Houston’s dominance in
the Gulf Coast intramega network that it has a hub-focused system.
4.5.5 Midwest
4.5.5.1 Passenger Traffic
As the largest megaregion with a large number of airports, the Midwest passenger flow
map, as seen in Figure 4.35, has a large density of intramega passenger movements. The
network has a galactic shape, with airports in the center having greater flows than cities
on the fringe. The Chicago metropolitan area has a large effect on this, as the distance
between airports in Chicago and the fringe is far, encouraging significant air travel over

BPT
HOU
IAH
MOBPNS VPS
AEX
BTR
LFTLCH MSY
GPT
BRO
CRP
HRLMFE
AirportsNPIAS Hubs
Large
Medium
Small
Non-hub
Non-primary
Passenger Flows (trips)< 1 million
1 to 5 million
5 to 10 million
> 10 million
¯0 100 20050
Miles
Figure 4.33: Gulf Coast Intramega Passenger Flows
152

BPT
HOU
IAH
MOBPNS VPS
AEX
BTR
LFTLCH MSY
GPT
BRO
CRP
HRLMFE
AirportsNPIAS Hubs
Large
Medium
Small
Non-hub
Non-primary
Freight Flows (lbs)< 5 million
5 to 25 million
25 to 50 million
> 50 million
¯0 100 20050
Miles
Figure 4.34: Gulf Coast Intramega Freight Flows
153
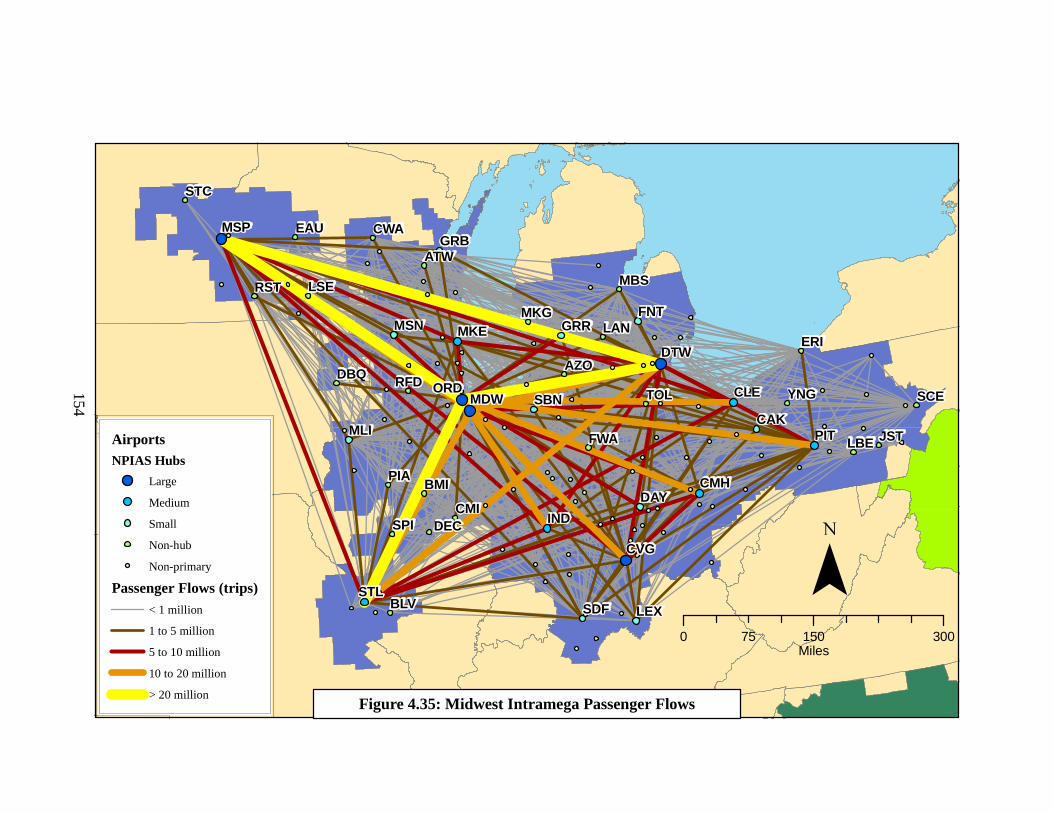
DBQ
BLV
BMI
CMI
MDWORD
DEC
MLI
PIA
RFD
SPI
FWA
IND
SBN
CVG
LEXSDF
DTW
FNTGRR
AZO
LANMKG
MBS
MSP
RST
STC
STL
CAK
CLE
CMHDAY
TOL YNG
ERI
JSTLBEPIT
ATW
EAUGRB
LSE
MSN MKE
CWA
SCE
¯0 150 30075
Miles
AirportsNPIAS Hubs
Large
Medium
Small
Non-hub
Non-primary
Passenger Flows (trips)< 1 million
1 to 5 million
5 to 10 million
10 to 20 million
> 20 millionFigure 4.35: Midwest Intramega Passenger Flows
154

DBQ
BLV
BMI
CMI
MDWORD
DEC
MLI
PIA
RFD
SPI
FWA
IND
SBN
CVG
LEXSDF
DTW
FNTGRR
AZO
LANMKG
MBS
MSP
RST
STC
STL
CAK
CLE
CMHDAY
TOL YNG
ERI
JSTLBEPIT
ATW
EAUGRB
LSE
MSN MKE
CWA
SCE
AirportsNPIAS Hubs
Large
Medium
Small
Non-hub
Non-primary
Freight Flows (lbs)< 5 million
5 to 25 million
25 to 50 million
50 to 100 million
> 100 million
¯0 150 30075
Miles
Figure 4.36: Midwest Intramega Freight Flows
155

156
other modes. The Chicago airports are not the only large role players, as there are strong
air travel patterns even amongst the fringe cities of the Midwest, such as St. Louis,
Minneapolis, Pittsburgh, Detroit, and Cincinnati. There is a slight reduction in intramega
air travel as you head farther from Chicago to the east. Flows with cities in Ohio and to
the east have weaker connections with each other and with cities in the west; it appears
intramega traffic is not as prolific on the eastern end of the megaregion, farther from
Chicago.
The metropolitan areas with the greatest intramega passenger flows in the
Midwest are Chicago, Minneapolis, St. Louis, and Detroit. The next tier of cities with
intramega flows are Cleveland, Indianapolis, Pittsburgh, Colombus, and Cincinnati. In
the Chicago area, ORD handles a greater share of intramega passenger flow, with
Midway close behind. The Chicago dominance in intramega traffic reduces Milwaukee, a
prominent medium hub within the region, to handling very little intramega traffic, as
compared to other medium hubs in the megaregion. St. Louis, another medium size hub,
handles a great portion of intramega traffic, with strong flows to Chicago airports and
Detroit. Cincinnati is the weakest of the Midwest’s large hubs, with its most significant
flows to Chicago and Colombus.
4.5.5.2 Freight Traffic
The Midwest freight network is the densest of all megaregions. Prominent flows occur
between nearly all major large and medium hubs, as seen in Figure 4.36. What is most
noticeable is the effect of SDF, the location of UPS’s freight hub, and the prominent
flows it shares with every major airport in the Midwest. Compared to nearby LEX,
another small hub, one can see the difference a freight hub makes. Minneapolis,

157
Indianapolis, and the Chicago airports (including RFD) are also the endpoints of a large
number of prominent pairs. The flows have a galactic shape, with major concentrations
focused on ORD, MDW, and SDF.
The freight network of the Midwest also consists of several prominent small and
non-hubs airports that play much stronger roles in freight than they do passenger traffic.
Airports such as TOL, LCK, LAN, GRR, RFD, and FWA all have prominent connections
to either RFD, SDF, or MSP. The Midwest uses non-passenger hub airports quite often to
move freight traffic.
4.5.6 Northeast
4.5.6.1 Passenger Traffic
The Northeast has one of the strongest intramega flow networks, fueled by eight large
hub airports, the most in the nation. The flows are centered on the four largest
metropolitan areas of the megaregion: Boston, New York, Philadelphia, and Washington
D.C, as seen in Figure 4.37. The only two flows that are above 20 million passenger trips
travel through LGA, to BOS in the north and DCA in the south. The larger, more
internationally focused airports in New York, EWR and JFK do not play as large of a role
in connecting the major metropolitan areas. JFK especially has not one flow even half as
large as LGA, and EWR is connected strongly to BOS, as much so to any Washington
airport. IAD and BWI both have significant flows to BOS, but less significant to the other
large hub airports (although BWI has some significant flows to medium and small hub
airports in New England). PHL plays a relatively small role in intramega traffic, with a
large flow to BOS and less significant flows to New England interior airports.

HVN
BDL
DCAIAD
BED BOS
HYA
ACKEWB
PVC
MVY
ORH
BWI
MHTPSM
ACY
EWRTEB
TTN
ISP
SWF
JFK
LGA
HPN
ABE
MDT PHL
AVP
PVD
AirportsHUB
Large
Medium
Small
Non-hub
Non-primary
Passenger Flows (trips)< 1 million
1 to 5 million
5 to 10 million
10 to 20 million
> 20 million
¯0 100 20050
Miles
Figure 4.37: Northeast Intramega Passenger Flows
158

HVN
BDL
DCAIAD
BED BOS
HYA
ACKEWB
PVC
MVY
ORH
BWI
MHTPSM
ACY
EWRTEB
TTN
ISP
SWF
JFK
LGA
HPN
ABE
MDT PHL
AVP
PVD
AirportsHUB
Large
Medium
Small
Non-hub
Non-primary
Freight Flows (lbs)< 5 million
5 to 25 million
25 to 50 million
50 to 100 million
> 100 million
¯0 100 20050
Miles
Figure 4.38: Northeast Intramega Freight Flows
159

160
The Northeast megaregion’s flows are not galactic in that there is still a strong focus on
the major airports in the main cities. Its shape is best characterized as a tri-pole network,
with a focus on New York, Washington, and Boston.
4.5.6.2 Freight Traffic
The Northeast megaregion’s freight network’s largest flows are paired between a variety
of airports, with very few other prominent flows. The largest flows occur between PHL
and MHT, PHL and BDL, PHL and BOS, EWR and BOS, and EWR and IAD. Other
prominent flows go through BDL as well, largely an effect of it being a hub for UPS. The
remaining large hub airports, as seen in Figure 4.38, play minor roles in the movement of
air freight in the Northeast megaregion, although the majority of flows of 5 to 10 million
pounds of freight move through the four major metropolitan areas. Due to the wide range
of airports that encompass the Northeast megaregion’s intramega freight flows, with
major foci at PHL, EWR, and BDL, it fits the description of a galactic network.
4.5.7 Northern California
4.5.7.1 Passenger Traffic
Northern California has one of the smallest intramega passenger flows, and a map of its
intramega flows reveals no passenger flows greater than 5 million trips as in other maps.
The connections in Northern California primarily involve the Reno metropolitan area to
the Bay Area metropolitan area, as seen in Figure 4.39, to OAK, SFO, and SJC. The
remaining significant passenger flows are from SFO only, to MRY, FAT, and SMF. It is
clear that the collective Bay Area airports are the focal point of the Northern California
megaregion’s intramega flows, and thus it is considered a hub-centered network.

FAT
MOD
MRY
OAK
SMF
SFO
SJC
SCK
RNO
AirportsNPIAS Hub
Large
Medium
Small
Non-hub
Non-primary
Passenger Flows (trips)< 1 million
> 1 million
¯0 100 20050
Miles
Figure 4.39: Northern California Intramega Passenger Flows
161
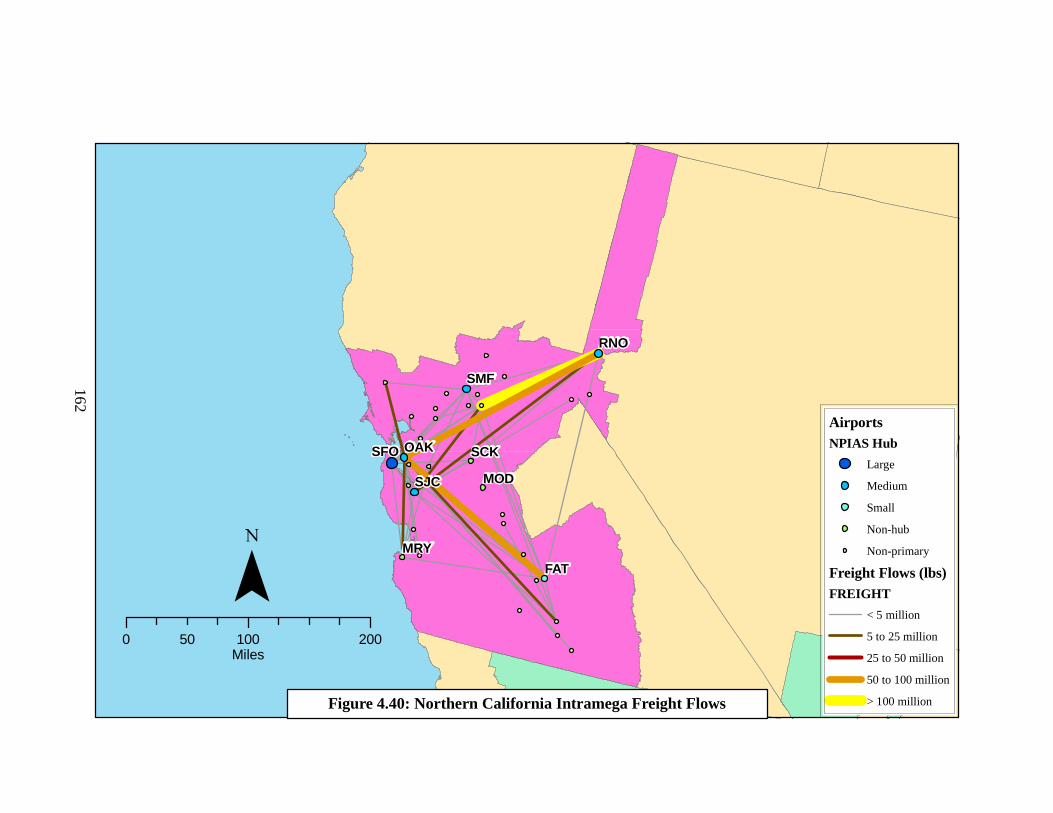
FAT
MOD
MRY
OAK
SMF
SFO
SJC
SCK
RNO
AirportsNPIAS Hub
Large
Medium
Small
Non-hub
Non-primary
Freight Flows (lbs)FREIGHT
< 5 million
5 to 25 million
25 to 50 million
50 to 100 million
> 100 million
¯0 100 20050
Miles
Figure 4.40: Northern California Intramega Freight Flows
162

163
4.5.7.2 Freight Traffic
The largest flow in the Northern California intramega freight network is from RNO to
MHR, Sacramento’s cargo airport. The only other airport which is significantly
connected to MHR is SJC. Otherwise, OAK is the hub of the Northern California
intramega air freight system, as seen in Figure 4.40, similar to SFO for passenger traffic.
There are strong freight flows from OAK to RNO and FAT. Despite the large flow
between Reno and Sacramento, the majority of the Northern California megaregion is a
hub-centered network focused on the Bay Area metropolitan area.
4.5.8 Piedmont
4.5.8.1 Passenger Traffic
The Piedmont megaregion boasts two major airline hubs in Charlotte and Atlanta, as well
as several metropolitan areas across four states. The megaregion’s standardized
intramega network flows are fairly high compared to other megaregions. A map of the
megaregion and its passenger flows is shown in Figure 4.41. Although there are
significant flows from ATL to each of the major metropolitan areas, each of the North
Carolina metropolitan areas have significant flows to CLT. However, the flows from
these same metropolitan areas have stronger flows to ATL. Many non-hub airports have
minor flows to each of CLT and ATL. Due to the prominence of ATL and CLT in
intramega traffic, and all smaller airports are focused on the two, the Piedmont in terms
of intramega passenger traffic is a dyad.
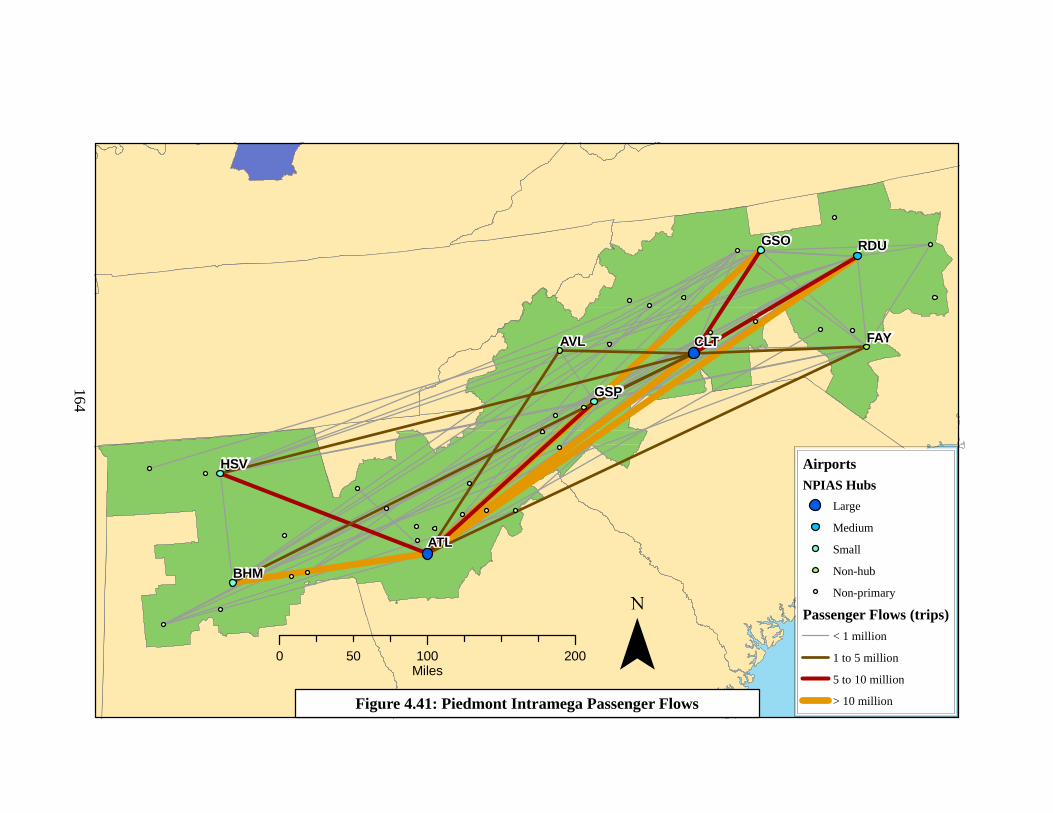
BHM
HSV
ATL
AVL CLT FAY
GSO RDU
GSP
AirportsNPIAS Hubs
Large
Medium
Small
Non-hub
Non-primary
Passenger Flows (trips)< 1 million
1 to 5 million
5 to 10 million
> 10 million
¯0 100 20050Miles
Figure 4.41: Piedmont Intramega Passenger Flows
164
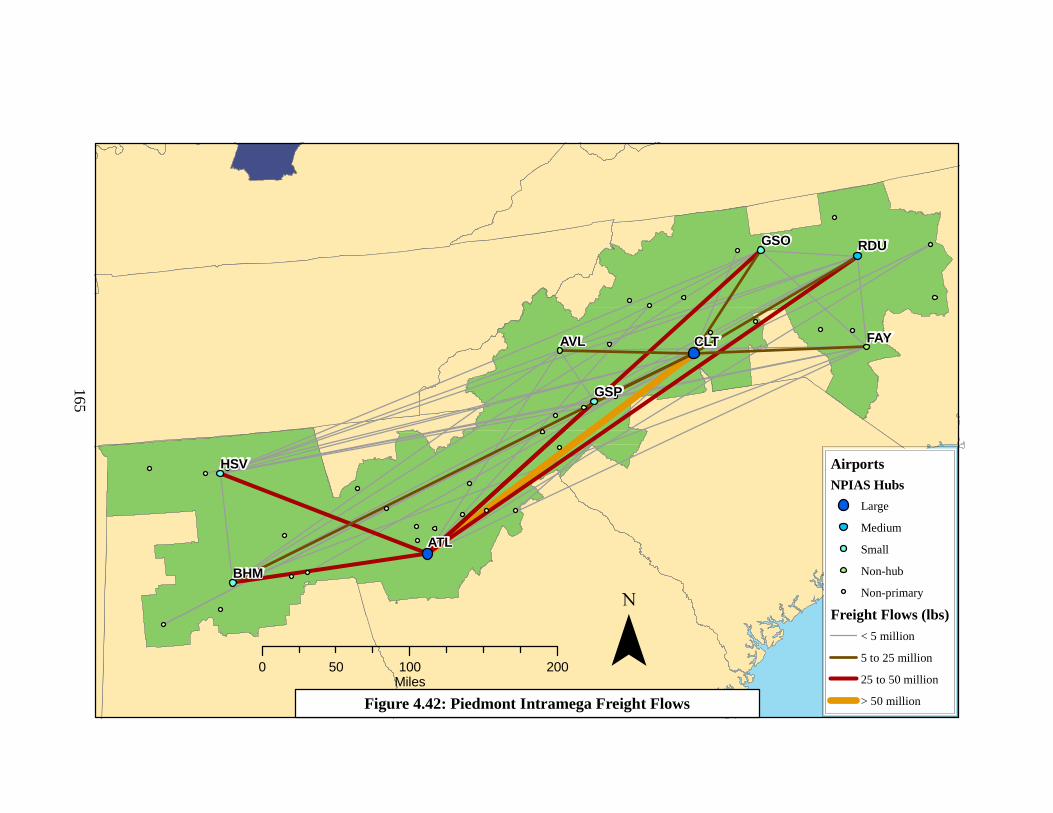
BHM
HSV
ATL
AVL CLT FAY
GSO RDU
GSP
AirportsNPIAS Hubs
Large
Medium
Small
Non-hub
Non-primary
Freight Flows (lbs)< 5 million
5 to 25 million
25 to 50 million
> 50 million
¯0 100 20050Miles
Figure 4.42: Piedmont Intramega Freight Flows
165

166
4.5.8.2 Freight Traffic
The Piedmont megaregion’s freight network is dominated by ATL. Although there is a
strong flow between ATL and CLT, the remaining metropolitan area airports, including
GSO, RDU, GSP, HSV, and BHM have more prominent flows to ATL, with smaller yet
significant flows to CLT. The only primary airport in the Piedmont megaregion not to
have a freight flow greater than 5 million pounds of freight to ATL is AVL. The
intramega freight system of the Piedmont megaregion, as seen in Figure 4.42, is best
described as a hub network.
4.5.9 Southern California
4.5.9.1 Passenger Traffic
The intramega passenger flow network in Southern California has a large flow between
the Los Angeles and Las Vegas metropolitan areas. The five main airports of the Los
Angeles area (LAX, BUR, ONT, SNA, and LGB) all have significant flows to LAS. In
addition though, each of LAX and LAS have strong connections with the San Diego
metropolitan area, as seen in Figure 4.43. The triangular connection between these three
large hub airports make up three of the top five intramega flows (ONT and BUR’s
connection to LAS is larger than that from LAX to SAN). The small hub and non-hub
airports have their only significant flows to the three main airports, and non-hub and non-
primary airports connect to each other with small flows. Overall, Southern California’s
intramega flows have a tri-pole shape that dominates the rest of the flow network.

BFL
BUR
IPL
IYK
LGB
LAX ONT
OXR
PSP
SAN
SNA
SBA
SMX
VGTLAS
CLD
BLD
AirportsNPIAS Hubs
Large
Medium
Small
Non-hub
Non-primary
Passenger Flows (trips)< 1 million
1 to 5 million
5 to 10 million
10 to 20 million
> 20 million
¯0 50 10025
Miles
Figure 4.43: Southern California Intramega Passenger Flows
167
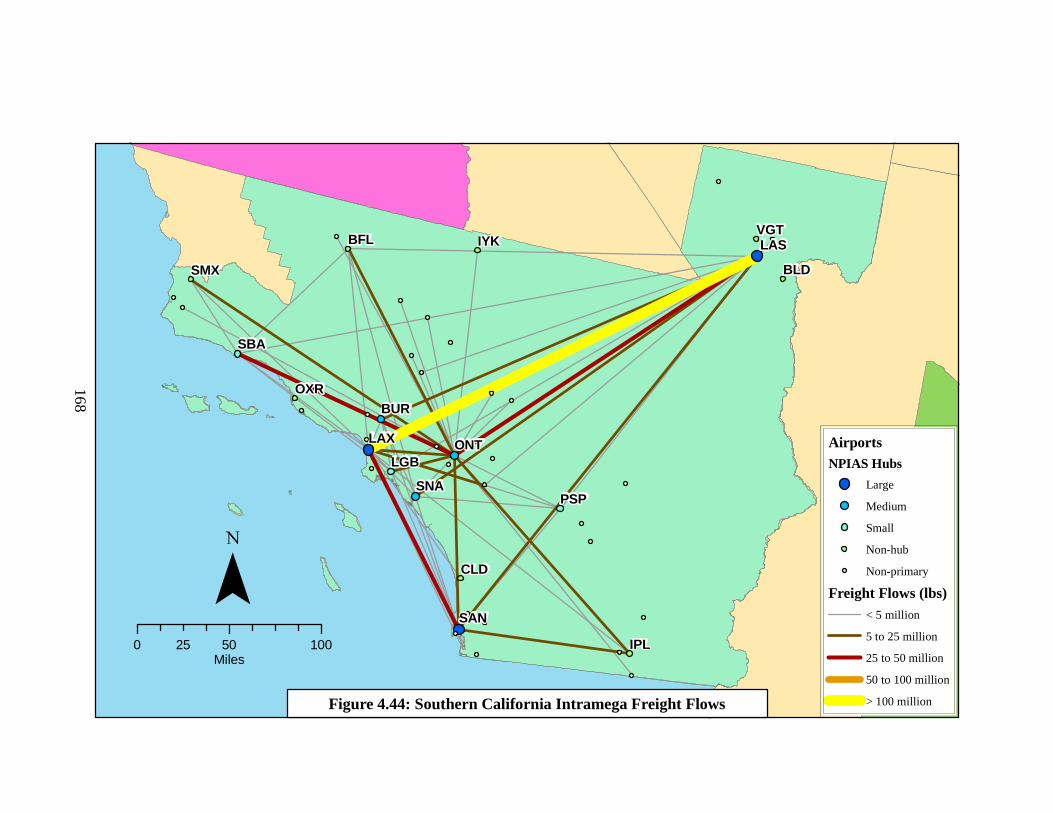
BFL
BUR
IPL
IYK
LGB
LAX ONT
OXR
PSP
SAN
SNA
SBA
SMX
VGTLAS
CLD
BLD
AirportsNPIAS Hubs
Large
Medium
Small
Non-hub
Non-primary
Freight Flows (lbs)< 5 million
5 to 25 million
25 to 50 million
50 to 100 million
> 100 million
¯0 50 10025
Miles
Figure 4.44: Southern California Intramega Freight Flows
168

169
4.5.9.2 Freight Traffic
Two features stand out in the map of Southern California’s intramega freight network,
seen in Figure 4.44,. First, the main flow in the network is between LAX and LAS,
dominating all other flows. Second, is the prominence of ONT within the freight network.
Due to the location of a UPS hub at ONT, more cities have significant flows to ONT than
to any of the three large hub airports of LAX, LAS, and SAN. In addition, other Los
Angeles metropolitan area airports, such as BUR and SNA have significant flows to
LAS. Outside the large and medium hub airports, there is not always a predictable
strongest connection. IPL, for example, connects primarily to SAN and ONT. Due to the
combination of ONT’s hub status, the large flow between LAX and LAS, and smaller
airports not having significant connections to each metropolitan area, the Southern
California intramega freight network is galactic.
4.5.10 Southern Florida
4.5.10.1 Passenger Traffic
Passenger traffic in the Southern Florida megaregion occurs between each of the two
metropolitan areas on the Interstate 4 corridor, Tampa and Orlando, and each of those on
the southern Atlantic Coast, Fort Lauderdale and Miami. A map of the megaregion’s
passenger flows is shown in. The largest flow is between MIA and MCO, as seen in
Figure 4.45, the greatest distance among the four airports. The Jacksonville metropolitan
area does not have as strong of a connection with the southern part of the megaregion, as
neither of the flows from the four main southern airports have a flow with JAX greater
than 5 million trips. Southern Florida’s small and non-hub airports are scattered around

DAB
FLLRSW
GNV
JAX
EYW
MLB
MIAAPF
MCO
SFB
PIE
SRQ
TPA
PBI
BQK
AirportsNPIAS Hubs
Large
Medium
Small
Non-hub
Non-primary
Passenger Flows (trips)< 1 million
1 to 5 million
5 to 10 million
> 10 million
¯0 100 20050
Miles
Figure 4.45: Southern Florida Intramega Passenger Flows
170

DAB
FLLRSW
GNV
JAX
EYW
MLB
MIAAPF
MCO
SFB
PIE
SRQ
TPA
PBI
BQK
AirportsNPIAS Hubs
Large
Medium
Small
Non-hub
Non-primary
Freight Flows (lbs)< 5 million
5 to 25 million
25 to 50 million
> 50 million
¯0 100 20050
Miles
Figure 4.46: Southern Florida Intramega Freight Flows
171

172
the rim of the megaregion, and have a connection with all of the medium and large hub
airports. Southern Florida’s intramega passenger flow network is essentially a dyad
system.
4.5.10.2 Freight Traffic
MIA is the focal point of the Southern Florida freight network, with flows greater than 25
million pounds of freight occurring even to FLL just up the coast. From MIA there are
two pairs over 50 million pounds of freight to MCO and PBI. Away from MIA, flows are
less significant, but still are between the megaregion’s medium and large hub airports, as
seen in Figure 4.46. Southern Florida’s intramega freight network is hub-focused,
revolving around MIA.
4.5.11 Texas Triangle
4.5.11.1 Passenger Traffic
The Texas Triangle lives up to its name in shape in terms of its passenger flows, as seen
in Figure 4.47. With the corners at the Dallas-Forth Worth metropolitan area, Houston
metropolitan area, and San Antonio and Austin, the triangular air pathways are heavily
trafficked. The top connection in the megaregion is between HOU and DAL, indicating
that the megaregion’s major international airports at DFW and IAH are not as significant
in intramega traffic. The significance of the flows between the cities indicates that the
Dallas-Forth Worth metropolitan area is the greater focal point of the megaregion, as all
flows greater than 20 million passenger trips are out of DFW or DAL, with lesser flows
headed between San Antonio and Austin to Houston. Despite Dallas’s prominence, the

AUS
BPT
CLL
DFWDAL
GRK
HOU
IAH
GGG
SAT
TYR
ACT
AirportsNPIAS Hubs
Large
Medium
Non-hub
Non-primary
Passenger Flows (trips)< 1 million
1 to 5 million
5 to 10 million
10 to 20 million
> 20 million
¯0 50 10025
Miles
Figure 4.47: Texas Triangle Intramega Passenger Flows
173

AUS
BPT
CLL
DFWDAL
GRK
HOU
IAH
GGG
SAT
TYR
ACT
AirportsNPIAS Hubs
Large
Medium
Non-hub
Non-primary
Freight Flows (lbs)< 5 million
5 to 25 million
25 to 50 million
50 to 100 million
> 100 million
¯0 50 10025
Miles
Figure 4.48: Texas Triangle Intramega Freight Flows
174

175
Texas Triangle cannot be considered a hub-focused network, and the tri-pole shape is a
better description.
4.5.11.2 Freight Traffic
The triangular shape of the cities in the Texas Triangle is still visible in the megaregion’s
freight flows, but the link between Houston, San Antonio, and Austin is much weaker
compared to those to Dallas-Fort Worth. The map of the freight flows in Figure 4.48
shows major flows to DFW, DAL, and AFW. For freight traffic, DFW and IAH are
dominant over DAL and HOU, respectively. Within the Dallas-Forth Worth area, though,
AFW shows up as a focal airport for freight, due to the location of a FedEx hub at the
airport. Unlike the passenger network, the freight network of the Texas Triangle is best
described as hub-based, referring to the dominance of the Dallas-Forth Worth area
airports.
4.5.12 Summary
Every megaregion’s intramega flows are indicative of the connections between its
population and business centers. There is no single type of flow network that can
characterize a megaregion’s intramega flows. Even between a megaregion’s passenger
and freight movements there can be differences in the network’s spatial form, due to
some airports having higher propensities for different types of flows. Four types of spatial
forms were identified in this section, and each megaregion’s passenger and freight flows
were classified into one of the categories. The four types are discussed below with
examples.
176
The first, and simplest, type of network is a hub-focused system. Networks within
this classification are characterized by a system of flows that revolve around a single
airport or several airports within a metropolitan area. There are generally limited
connections occurring away from the center hub airport, such that the majority of market
pairs exist with the hub airport. Among passenger systems, the Gulf Coast (hub at
Houston), Front Range (DEN), and Northern California (Bay Area) megaregions are hub-
focused. Among freight systems, the Gulf Coast (hub at Houston), Northern California
(Bay Area), Piedmont (ATL), Southern Florida (MIA), and Texas Triangle (hub at
Dallas-Fort Worth) are hub-focused.
The second type of spatial system classification is a dyad. These megaregions’
intramega flow networks revolve around two metropolitan areas, with the majority of
flows occurring between the two. In addition, most flows in the megaregion go to and
from the two poles of the megaregion, and much less often between each other. Among
passenger systems, the Arizona Sun Corridor (PHX and TUS), Cascadia (SEA and PDX),
Piedmont (ATL and CLT), and Southern Florida (Atlantic Coast and I-4 regions) have
dyad networks. Among freight systems, the Arizona Sun Corridor, Cascadia (Seattle and
PDX), and the Front Range (DEN and ABQ) have dyad networks.
The third type of spatial form is a tri-pole network. These systems are focused on
three primary airports or metropolitan areas, with less significant networks outside. As
these tend to be larger megaregions with more complex networks, it is more likely in
these forms to see flows occurring between those airports not at the poles, however there
is always an orientation towards the three foci. Passenger systems that can be described
as tri-poles are the Northeast (Washington, New York, and BOS), Southern California
177
(Los Angeles, LAS, and SAN), and of course the Texas Triangle (Dallas, San
Antonio/Austin, and Houston). No freight networks were classifiable as tri-poles.
Galactic networks are the most complex megaregion system form. In this type of
spatial shape, many cities and airports have significant flows between them. They may be
a variety of hubs that exist, significant flows happening between many airports with no
dominating pattern, and smaller airports that do not always have significant flows to all
major airports, but have significant flows with each other. The galactic network shows a
smaller focus on certain airports, and starts to lean towards a point-to-point system. Only
one passenger system has a galactic spatial form, the Midwest. Three freight systems
have galactic forms: the Midwest, Northeast, and Southern California.
Six megaregions do not have the same spatial form for both their passenger and
freight networks. This is indicative of airports or cities within the network that may have
a strong passenger or freight focus, but not both. For example, ONT is a minor player in
Southern California’s passenger system, but affects its freight system heavily as a hub for
UPS. This shifts the freight system into galactic form, while its passenger system is a tri-
pole. In the Piedmont, Charlotte is a major player in the passenger system due to a US
Airways hub, but its freight role is minimal compared to ATL. This causes the Piedmont
to have a dyad passenger system, and a hub-focused freight system. The other four
megaregions with differences are: the Front Range, Southern Florida, Northeast, and
Texas Triangle.
The results indicate that there is not a strong relationship between the
classification of a megaregion’s passenger spatial flow network and the connectivity of
its intramega standardized passenger flows. Thus, a megaregion that has a hub-focused
178
passenger network is only slightly less likely to have a population less active in travel
than a tri-pole or galactic network. This relationship is not extremely indicative, because
there are glaring exceptions to any generalization. The Gulf Coast, for example, has high
standardized flows and is a hub-focused network, while the Northeast has a tri-pole
network yet is in the middle of all the megaregions ranked by standardized flows. Still,
with four of the top six of standardized flows (by population and by economic
productivity) being galactic or tri-pole passenger networks, and the bottom five being a
dyad or hub-focused, there could be a slight relationship. Flows standardized by area do
indicate, however, a relationship by spatial network type. Galactic and tri-pole networks
are more active in air travel per size of the megaregion than a dyad or hub-focused
networks.
Freight travel does not have an identifiable relationship between the classification
of a megaregion’s freight spatial network and the connectivity of its intramega
standardized freight flows. The top three standardized flows by population and economic
productivity include a galactic (Midwest), hub-focused (Texas Triangle), and a dyad
(Cascadia) classification, while the bottom three include a galactic (Southern California)
and two dyad megaregions (Front Range and Arizona Sun Corridor). Rankings of flows
standardized by area also have a mixture of network types near both the top and bottom
of the rankings.
4.6 Non-megaregion Areas and the International Market
As the focus of this study, megaregions have received the majority of attention, and non-
megaregion-areas and the international market have mostly just been part of this

179
discussion as side actors. These two groupings of airports make up a significant portion
of the T-100 dataset, and have been shown to play large roles in many of the
megaregions’ flow networks. Their impact is not disregarded, and this section focuses on
the role these two collections of airports play in the U.S. megaregion system.
It must first be acknowledged that non-megaregion areas and the international
market are not geographical entities. They are solely the remainder of space not
associated with megaregions, and thus it is would not considered a spatial entity under
the viewpoint of geographers. Non-megaregion areas are the collection of space in the
U.S. that is not within a megaregion, including airport facilities in Alaska and Hawaii.
This area does have a calculable land area, population, and economy because it is the
remainder of the country outside the megaregions. The international market does not
have any identifiable attributes of area, population, or economy. It is solely made up of
all the airports that have connected to the U.S., and between passenger and/or freight
flows occurred.
4.6.1 Non-megaregion Areas
4.6.1.1 Passenger Traffic
The gross passenger flows amongst the areas outside of megaregions are equivalent to
those of the most active megaregions in passenger travel. Based on the land area,
population, and economy of non-megaregion areas, this flow of passengers puts this
collective area as the least active in air travel. It is clear that non-megaregion areas lag
behind the megaregions in air travel activity, but the relationship to the megaregions is
still important to be understood.

180
The top megaregions with which non-megaregion areas are connected are the
Midwest, Piedmont, Texas Triangle, and Northeast. As seen in Figure 4.49, there is a
large drop-off after the Midwest, and another drop-off after the Northeast. There also is a
large flow internally amongst non-megaregion areas. The least connected megaregions
are the Arizona Sun Corridor, Gulf Coast, and Southern Florida. Non-megaregion areas
do not have especially high connections internationally, but are on par with most
megaregions in terms of where the international market falls in its rankings. The
passenger flow connections for non-megaregions areas are show in Table C.23. The
standardized flows indicate that the most connected areas are the same as the list for
gross volumes; similarly for the least connected areas.
Figure 4.49: Non-megaregion Passenger Flows
Non-megaregion areas have strong internal connections, even when standardized,
which shows that this is not solely a megaregion phenomenon. Nine of the eleven
0
100000000
200000000
300000000
400000000
500000000
600000000
Pas
seng
er T
rips

181
megaregions had intramega flows as a significant part of their network, and non-
megaregion areas follow suit. The megaregion concept of having greater connectivity
within the borders of the megaregion could also be reasoned for non-megaregion areas.
It is interesting to note which megaregions are most connected to non-megaregion
areas and which are not. These relationships are hard to define because of the large
expanse, varied geography, and diverse populations of non-megaregion areas. What must
be taken away is that certain megaregions have attributes that cause them to have a
greater connection to areas outside of megaregions. Similarly, the megaregions that are
not well connected to non-megaregion areas have characteristics within their population
and economy that influence them to have a weaker connection to non-megaregion areas.
4.6.1.2 Freight Traffic
The international market is the highest volume connection for non-megaregion areas,
followed by the Midwest and the internal flows of non-megaregion areas. The
distribution of flows is displayed in Figure 4.50. These top three are the ones which were
consistent for most of the megaregions. The smallest flows for non-megaregion areas are
with the Arizona Sun Corridor, Front Range, and Gulf Coast megaregions. The freight
flow connections for non-megaregions areas are show in Table C.23.
Non-megaregion areas have a net import of air freight. This is primarily due to
their drastic difference in air flows with the international market, over a 40% difference.
The only megaregion with which non-megaregion areas import from is Northern
California. Otherwise, non-megaregion areas export to ten of the eleven megaregions,
with as much as a 34% difference with the Gulf Coast.
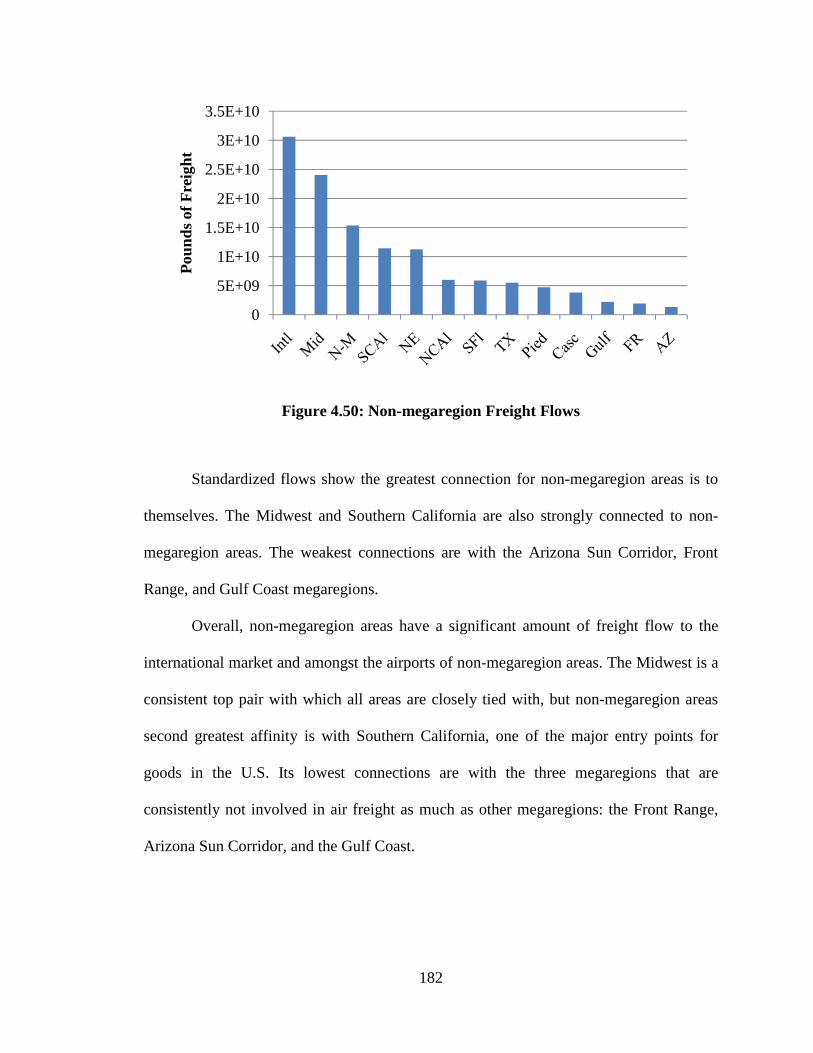
182
Figure 4.50: Non-megaregion Freight Flows
Standardized flows show the greatest connection for non-megaregion areas is to
themselves. The Midwest and Southern California are also strongly connected to non-
megaregion areas. The weakest connections are with the Arizona Sun Corridor, Front
Range, and Gulf Coast megaregions.
Overall, non-megaregion areas have a significant amount of freight flow to the
international market and amongst the airports of non-megaregion areas. The Midwest is a
consistent top pair with which all areas are closely tied with, but non-megaregion areas
second greatest affinity is with Southern California, one of the major entry points for
goods in the U.S. Its lowest connections are with the three megaregions that are
consistently not involved in air freight as much as other megaregions: the Front Range,
Arizona Sun Corridor, and the Gulf Coast.
0
5E+09
1E+10
1.5E+10
2E+10
2.5E+10
3E+10
3.5E+10
Pou
nds
of F
reig
ht

183
4.6.2 International Market
4.6.2.1 Passenger Traffic
The collection of international airports within the T-100 dataset is the international
market for this study. The flows to and from these airports to the U.S. are shown in Table
C.25. It is seen that the greatest flows are to the Northeast, Southern, Florida, Midwest,
and Southern California. As seen in Figure 4.51, the flow with the Northeast is much
greater than all other megaregions by a wide margin, indicative of the large connection
the Northeast has internationally as opposed to other parts of the country. The other top
megaregions are also the gateways into the country, with MIA having a large connection
to Latin American in Southern Florida, and LAX doing the same for the Pacific Rim. The
Midwest is likely near the top of the list because it has many major large hub airports
which handle large volumes of international traffic, such as ORD and DTW. The smallest
international connections are with the Arizona Sun Corridor, Front Range, and Cascadia.
Figure 4.51: International Passenger Flows
0
100000000
200000000
300000000
400000000
500000000
600000000
700000000
Pas
seng
er T
rips

184
4.6.2.2 Freight Traffic
The Northeast, Southern Florida, and the Midwest are the greatest U.S. markets for the
collection of international airports in the study. As seen in Figure 4.52, there is a gradual
decrease amongst the top connected areas internationally. After Southern California and
non-megaregion areas, there is a drop-off to the remaining megaregions. The
international markets are least connected to the Arizona Sun Corridor, Front Range, and
Cascadia megaregions for freight flows.
Overall, the international market is a net exporter, a large source of air freight for
every megaregion. Only with two megaregions does the international market have a net
import of flows: the Gulf Coast and Cascadia. The flows to and from the international
market for air freight is shown in Table C.26.
Figure 4.52: International Freight Flows
0
1E+10
2E+10
3E+10
4E+10
5E+10
6E+10
7E+10
8E+10
Pou
nds
of F
reig
ht
185
4.6.3 Summary
Non-megaregion areas are a weak passenger connection for megaregions, but a stronger
freight connection. Its internal flows are large for both passenger and freight traffic.
There is no clear indication that non-megaregion areas are vastly different from
megaregions. They are attracted to some of the largest megaregion in passenger traffic,
and have large international flows for freight. Their weakest connections for both
passenger and freight are the least established megaregion historically: Front Range,
Arizona Sun Corridor, and Gulf Coast.
International flows occur to the megaregions which contain the U.S.’s world cities
of New York, Chicago, Los Angeles, and Miami. It is not surprising that the flows are
occurring to these areas at the highest rates. The megaregions that contain these cities
have business environments which are more globally oriented. The airports in these
megaregions are best prepared to receive and process the connections with the
international market.
The megaregions’ connections with non-megaregion areas and the international
market are just as critical as those with other megaregions. It was seen through the
previous analyses how these two play an important role in passenger networks for many
megaregions, and in the freight networks of almost all megaregions.
4.7 Growth of Megaregion Air Traffic
Demand for air travel and air freight is always changing due to external pressures from
the economy and global crises. The U.S. passenger and freight markets overall are
steadily growing, despite small drops periodically. This growth is due largely to
186
population and economic growth, with an increasingly mobile population. The following
section details how megaregions have played a role in the growth of the U.S. air industry,
and how this growth compares to that in non-megaregion areas and in relation to the
international market.
In this part of the study, the internal traffic of non-megaregion areas has been
broken out to show the differences in this part of the air system over time. Thus non-
mega air traffic refers only to flows between megaregions and non-megaregion areas.
4.7.1 Passenger Traffic
Travel within the U.S. passenger system has seen steady growth since 1990, with a dip
after 9/11 and another dip during the recession of 2008. Intermega traffic was the largest
component of the U.S. system, as seen in Figure 4.53, remaining relatively steady at
about 51% of all passenger flows in U.S. airports. The next largest component has been
non-mega traffic, although twice in the past 19 years international traffic has almost
eclipsed it. The flows internal to megaregions has remained steady, but because of the
increase in intermega traffic, the intramega flows have decreased as a percentage of the
U.S. flows from about 12.5% to 9%. Within the 19 year time period, overall passenger
travel in the U.S. increased by 65%, as seen in Figure 4.54. This growth was greater than
the growth of the nation’s GDP (adjusted for inflation), and also significantly greater than
the population growth. Table B.11 details all of the growth in passenger traffic over time
by type of flow.
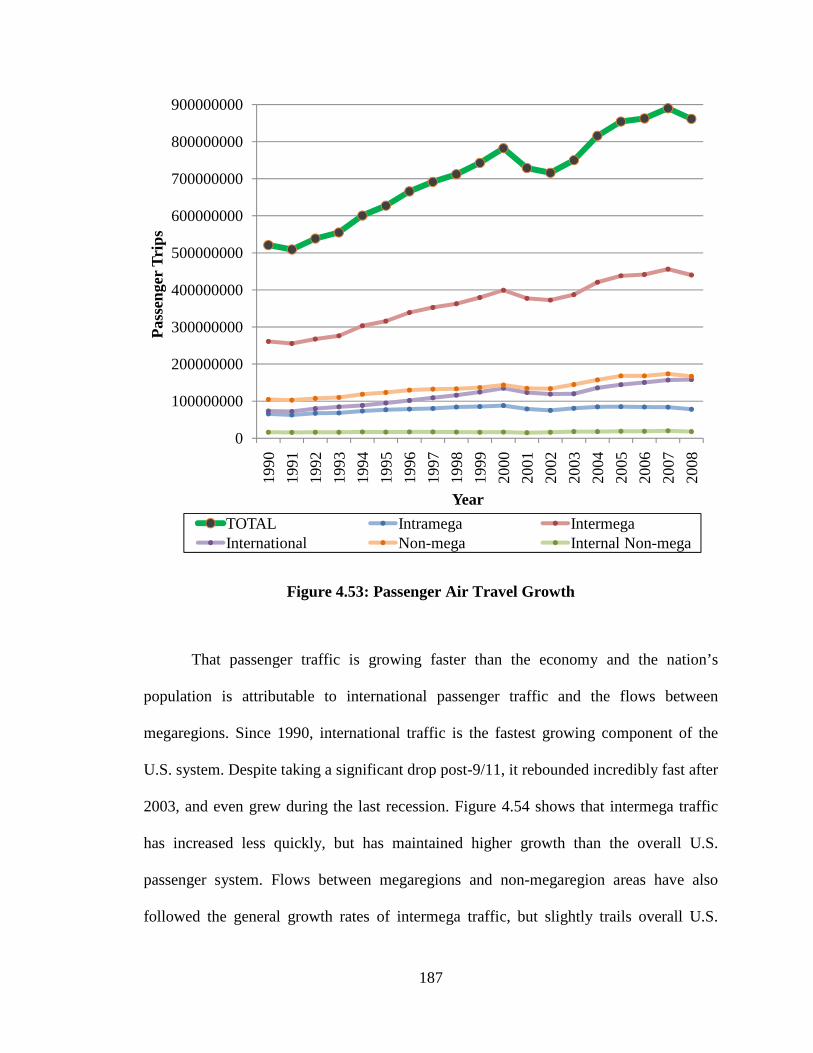
187
Figure 4.53: Passenger Air Travel Growth
That passenger traffic is growing faster than the economy and the nation’s
population is attributable to international passenger traffic and the flows between
megaregions. Since 1990, international traffic is the fastest growing component of the
U.S. system. Despite taking a significant drop post-9/11, it rebounded incredibly fast after
2003, and even grew during the last recession. Figure 4.54 shows that intermega traffic
has increased less quickly, but has maintained higher growth than the overall U.S.
passenger system. Flows between megaregions and non-megaregion areas have also
followed the general growth rates of intermega traffic, but slightly trails overall U.S.
0
100000000
200000000
300000000
400000000
500000000
600000000
700000000
800000000
900000000
1990
1991
1992
1993
1994
1995
1996
1997
1998
1999
2000
2001
2002
2003
2004
2005
2006
2007
2008
Pas
seng
er T
rips
Year
TOTAL Intramega IntermegaInternational Non-mega Internal Non-mega

growth. The components of the U.S. passenger system which have lagged behind has
been intramega and internal non
hit post-9/11, remaining relative constant while f
Internal non-mega traffic actually was the first portion of the U.S. air system to rebound
after 9/11, and has performed much better than before 9/11. However, it still struggles to
keep up with the size of the U.S. econom
Figure 4.54: Relative Passenger Air
0.75
1
1.25
1.5
1.75
2
2.25
1990
1991
1992
1993
Rel
ativ
e G
row
th (
Ref
eren
ced
to 1
990)
TOTALGDP (Inflation Adjusted)IntermegaNon-mega
188
growth. The components of the U.S. passenger system which have lagged behind has
been intramega and internal non-mega traffic. Intramega traffic seemed particularly hard
9/11, remaining relative constant while flows leaving the megaregion grew.
mega traffic actually was the first portion of the U.S. air system to rebound
after 9/11, and has performed much better than before 9/11. However, it still struggles to
keep up with the size of the U.S. economy and population growth.
Figure 4.54: Relative Passenger Air Travel Growth
1993
1994
1995
1996
1997
1998
1999
2000
2001
2002
2003
2004
2005
Year
PopulationGDP (Inflation Adjusted) Intramega
InternationalInternal Non-mega
growth. The components of the U.S. passenger system which have lagged behind has
mega traffic. Intramega traffic seemed particularly hard
lows leaving the megaregion grew.
mega traffic actually was the first portion of the U.S. air system to rebound
after 9/11, and has performed much better than before 9/11. However, it still struggles to
2005
2006
2007
2008
mega
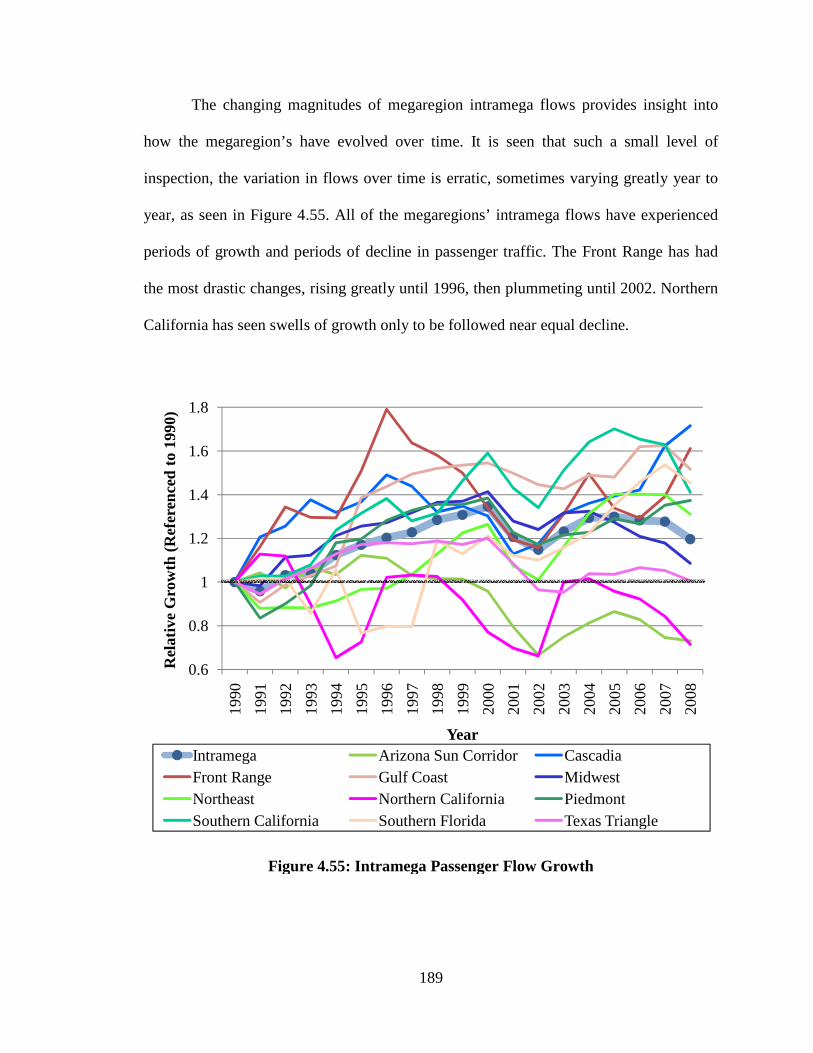
The changing magnitudes of megaregion intramega flows provides insight into
how the megaregion’s have evolved over time. It is seen that such a small level of
inspection, the variation in flows over time is erratic, sometimes varying greatly year to
year, as seen in Figure 4.
periods of growth and periods of decline in passenger traffic. The Front Range has had
the most drastic changes, rising greatly until 1996, then plummeting until 2002. Northern
California has seen swells of growth only to be followed near equal decline.
Figure 4.55: Intramega Passenger Flow Growth
0.6
0.8
1
1.2
1.4
1.6
1.8
1990
1991
1992
1993
Rel
ativ
e G
row
th (
Ref
eren
ced
to 1
990)
IntramegaFront RangeNortheastSouthern California
189
The changing magnitudes of megaregion intramega flows provides insight into
how the megaregion’s have evolved over time. It is seen that such a small level of
ariation in flows over time is erratic, sometimes varying greatly year to
Figure 4.55. All of the megaregions’ intramega flows have experienced
periods of growth and periods of decline in passenger traffic. The Front Range has had
drastic changes, rising greatly until 1996, then plummeting until 2002. Northern
California has seen swells of growth only to be followed near equal decline.
Figure 4.55: Intramega Passenger Flow Growth
1993
1994
1995
1996
1997
1998
1999
2000
2001
2002
2003
2004
2005
YearArizona Sun Corridor CascadiaGulf Coast MidwestNorthern California Piedmont
Southern California Southern Florida Texas Triangle
The changing magnitudes of megaregion intramega flows provides insight into
how the megaregion’s have evolved over time. It is seen that such a small level of
ariation in flows over time is erratic, sometimes varying greatly year to
have experienced
periods of growth and periods of decline in passenger traffic. The Front Range has had
drastic changes, rising greatly until 1996, then plummeting until 2002. Northern
California has seen swells of growth only to be followed near equal decline.
2005
2006
2007
2008
CascadiaMidwestPiedmontTexas Triangle
190
The megaregions which had the most steady growth in passenger traffic are
Cascadia, Gulf Coast, Front Range, Northeast, Piedmont, Southern California, and
Southern Florida megaregions. The Texas Triangle and Midwest both rose slightly in the
mid-1990s, but have returned to 1990 levels over the study period. Northern California
and the Arizona Sun Corridor have mostly seen decline in intramega passenger flow.
The Front Range, Cascadia, and Piedmont were the least affected by the
beginning of the recession, growing from 2007 to 2008, while all other megaregions
declined.
The rule changes for T-100 data do not seem to affect the passenger travel
statistics greatly. There is no distinguishable jump due to the changes for commuter
airlines and small international aircraft when combined with the post-9/11 recovery in air
travel. It is reasoned that the rule changes had a minimal effect on the data.
4.7.2 Freight Traffic
Air freight has seen steady growth over time, although this growth has slowed in the
middle of the 2000s. Due to the T-100 rule changes that affected domestic all-cargo
carriers, there is a drastic jump in the data between 2000 and 2003, as seen in Figure
4.56. International cargo, however, was not affected by this rule change, and can be used
as a general descriptor of the nature of air travel during that middle period. There was a
dip in air freight due to 9/11 terrorist attacks, but international air freight had recovered
by 2002. The economic downturn in 2008 caused air freight to drop in all sectors. Before
this time though, intermega and intramega freight flows had already been declining
slightly since 2004.

191
Figure 4.56: Freight Travel Growth Over Time
The rule change period is excluded in the analysis when examining the relative
freight flows. With all but international cargo traffic being held to constant relative
growth in 2001 and 2002, it is seen which components of the system have grown faster
than others. Because all components of the freight system have similar growth patterns
pre-2000 and post-2003, as seen in Figure 4.57, it is assumed that the addition of
domestic all-cargo, although much greater in magnitude than cargo carried by passenger
carriers, did not shift the OD sectors in which air cargo was moving between. It is
reasoned that the domestic all-cargo activity pre-2000 was similar to the cargo
movements of passenger carriers.
0
5E+09
1E+10
1.5E+10
2E+10
2.5E+10
3E+10
3.5E+10
4E+10
4.5E+10
1990
1991
1992
1993
1994
1995
1996
1997
1998
1999
2000
2001
2002
2003
2004
2005
2006
2007
2008
Pou
nds
of F
reig
ht
YearTOTAL Intramega IntermegaInternational Non-mega Internal Non-mega
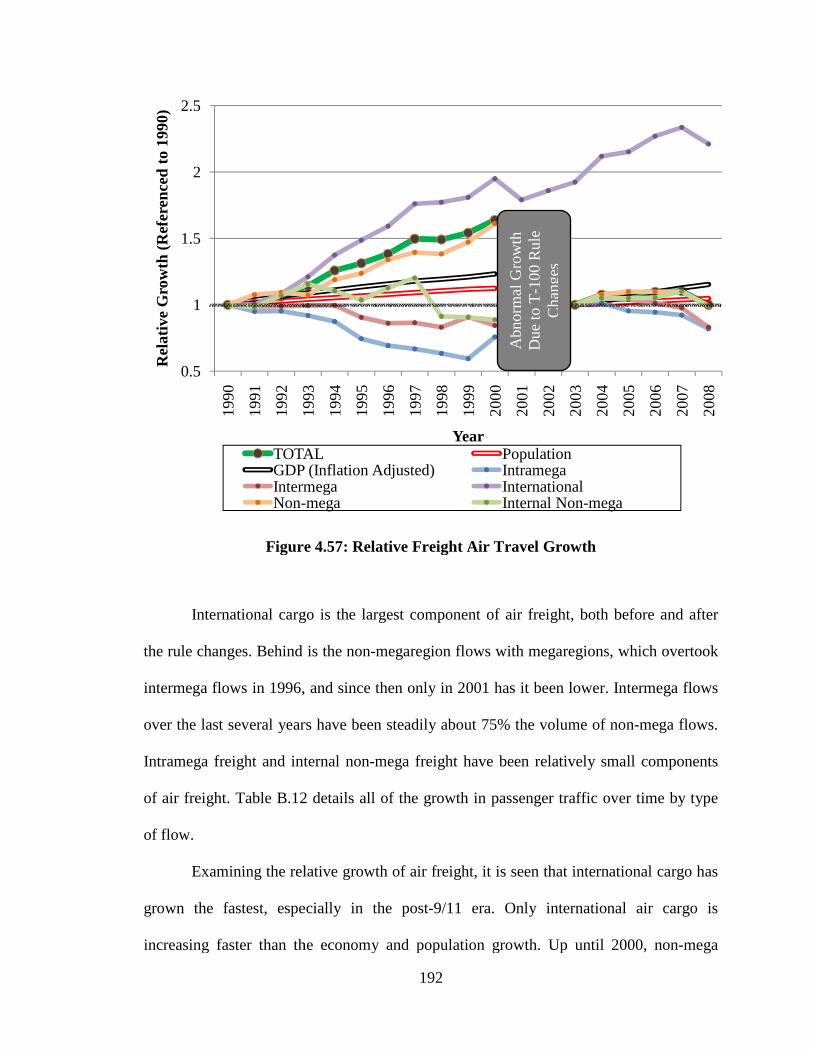
Figure 4.57: Relative Freight Air Travel Growth
International cargo is the largest component of air freight, both before and after
the rule changes. Behind is the non
intermega flows in 1996, and since then only in 2001 has it been lower. Intermega flows
over the last several years have been steadily about 75% the volume of non
Intramega freight and internal non
of air freight. Table B.12 details
of flow.
Examining the relative growth of air freight, it is seen that international cargo has
grown the fastest, especially in the
increasing faster than the economy and population growth. Up until 2000, non
0.5
1
1.5
2
2.5
1990
1991
1992
1993
Rel
ativ
e G
row
th (
Ref
eren
ced
to 1
990)
TOTALGDP (Inflation Adjusted)IntermegaNon-
192
Figure 4.57: Relative Freight Air Travel Growth
International cargo is the largest component of air freight, both before and after
the rule changes. Behind is the non-megaregion flows with megaregions, which overtook
intermega flows in 1996, and since then only in 2001 has it been lower. Intermega flows
over the last several years have been steadily about 75% the volume of non
Intramega freight and internal non-mega freight have been relatively small components
12 details all of the growth in passenger traffic over time by type
Examining the relative growth of air freight, it is seen that international cargo has
grown the fastest, especially in the post-9/11 era. Only international air cargo is
increasing faster than the economy and population growth. Up until 2000, non
1993
1994
1995
1996
1997
1998
1999
2000
2001
2002
2003
2004
YearTOTAL PopulationGDP (Inflation Adjusted) IntramegaIntermega International
-mega Internal Non-megaA
bnor
mal
Gro
wth
D
ue to
T-1
00 R
ule
Cha
nges
International cargo is the largest component of air freight, both before and after
egaregions, which overtook
intermega flows in 1996, and since then only in 2001 has it been lower. Intermega flows
over the last several years have been steadily about 75% the volume of non-mega flows.
een relatively small components
all of the growth in passenger traffic over time by type
Examining the relative growth of air freight, it is seen that international cargo has
9/11 era. Only international air cargo is
increasing faster than the economy and population growth. Up until 2000, non-mega
2004
2005
2006
2007
2008
mega
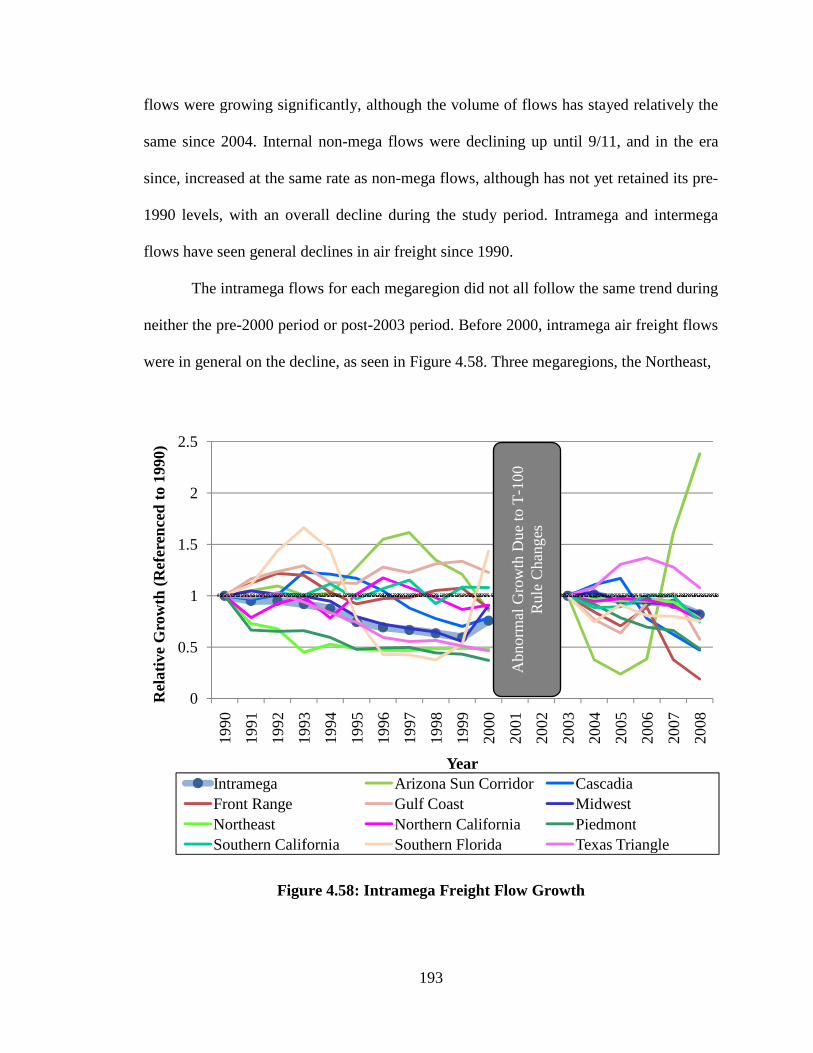
flows were growing significantly, although the volume of flows has stayed relatively the
same since 2004. Internal non
since, increased at the same rate as non
1990 levels, with an overall decline during the study period. Intramega and intermega
flows have seen general decline
The intramega flows for each megaregion did not all follow the same trend during
neither the pre-2000 period or post
were in general on the decline, as seen
Figure 4.58: Intramega Freight Flow Growth
0
0.5
1
1.5
2
2.5
1990
1991
1992
1993
Rel
ativ
e G
row
th (
Ref
eren
ced
to 1
990)
IntramegaFront RangeNortheastSouthern California
193
flows were growing significantly, although the volume of flows has stayed relatively the
same since 2004. Internal non-mega flows were declining up until 9/11, and in the era
since, increased at the same rate as non-mega flows, although has not yet retained its pre
1990 levels, with an overall decline during the study period. Intramega and intermega
flows have seen general declines in air freight since 1990.
The intramega flows for each megaregion did not all follow the same trend during
2000 period or post-2003 period. Before 2000, intramega air freight flows
were in general on the decline, as seen in Figure 4.58. Three megaregions, the Northeast,
Figure 4.58: Intramega Freight Flow Growth
1993
1994
1995
1996
1997
1998
1999
2000
2001
2002
2003
2004
YearArizona Sun Corridor CascadiaGulf Coast MidwestNorthern California Piedmont
Southern California Southern Florida Texas Triangle
Abn
orm
al G
row
th D
ue
to T
-100
R
ule
Cha
nges
flows were growing significantly, although the volume of flows has stayed relatively the
ws were declining up until 9/11, and in the era
mega flows, although has not yet retained its pre-
1990 levels, with an overall decline during the study period. Intramega and intermega
The intramega flows for each megaregion did not all follow the same trend during
2003 period. Before 2000, intramega air freight flows
Three megaregions, the Northeast,
2005
2006
2007
2008
CascadiaMidwestPiedmontTexas Triangle
194
Piedmont, and Texas Triangle had intramega freight flows half of what they were in
1990. Southern Florida, Midwest, and Cascadia also looked to have decreasing intramega
flows until increasing in 1999. Several megaregions had relatively similar intramega
flows throughout the decade: the Front Range and the California megaregions. Arizona
looked to be on the rise for more than half the decade, before dropping significantly in
1997. Only the Gulf Coast had a general rise in air freight from 1990-2000.
After 9/11, and the reporting rules change, intramega flows declined for all but
two megaregions. The hardest hit was the Front Range, dropping over 75% in a span of
five years. Cascadia, the Gulf Coast, and the Piedmont dropped drastically as well. Only
two megaregions had gains over the post 9/11 period. The Texas Triangle rose about 40%
until dropping into the recession. Very oddly, the Arizona Sun Corridor had a roller
coaster of intramega flows from 2003-2008. Dropping nearly 75% in 2 years, and then
increasing ten-fold from 2005 to 2008.
4.7.3 Intramega Traffic Growth: Case Study on Piedmont Megaregion
4.7.3.1 Passenger Traffic
The Piedmont megaregion two large hubs, ALT and CLT, have seen a steady amount of
traffic between each other from 1990 to 2004. As seen in Figure 4.59, starting in 2004
passenger trips increased significantly though, nearly doubling in three years. The largest
component within the Piedmont megaregion is the traffic between the medium, small,
and non-hub primary airports to the large hubs of ATL and CLT. This sector had a drop
post-9/11, and has remained level since that time, although still much higher than in
1990.

195
Figure 4.59: Piedmont Passenger Air Travel Growth
Figure 4.60: Relative Piedmont Passenger Air Travel Growth
0
1000000
2000000
3000000
4000000
5000000
6000000
7000000
1990
1991
1992
1993
1994
1995
1996
1997
1998
1999
2000
2001
2002
2003
2004
2005
2006
2007
2008
Pas
seng
er T
rips
YearTOTAL Large to Medium/Small/Non-hub (M/S/N)Large to Large M/S/N to M/S/N
0
0.5
1
1.5
2
1990
1991
1992
1993
1994
1995
1996
1997
1998
1999
2000
2001
2002
2003
2004
2005
2006
2007
2008Rel
ativ
e G
row
th (
Ref
eren
ced
to 1
990)
YearTotal Large to Medium/Small/Non-hub (M/S/N)Large to Large M/S/N to M/S/N

196
Relative to 1990, both the flows between large hubs and from the large hubs to
the smaller primary airports increased, as seen in Figure 4.60. The biggest difference over
time in the Piedmont megaregion has been the near disappearance of passenger flows
between smaller primary airports. Starting in 1993, passenger flows between medium,
small, and non-hub airports decreased greatly. During the early 1990s, American Airlines
had a hub at RDU and Continental at PTI. By 1995 both of these airlines had retracted
their hubbing operations, leaving the airports to have a more supportive role in terms of
intermega traffic. No longer did they receive direct routes to the smaller primary airports,
and this caused a reduction in traffic between the smaller airports in the megaregion.
With the distance across the Piedmont megaregion not being excessively long for air
travel, those who would have taken these routings to PTI and RDU likely opted to not
travel or drive. Interestingly, there was a simultaneous rise from the smaller primary
airports to the large hubs and between the large hubs.
Table C.27 shows the precise passenger volumes for the Piedmont megaregion in
each year. Starting in 2002, with the rule changes that affected small certificated and
commuter airlines, there is a sudden beginning of flows to and from non-primary airports.
The most significant of these is with the large hubs of ATL and CLT. There is negligent
traffic to the smaller primary airports as well as between non-primary airports.
4.7.3.2 Freight Traffic
Intramega freight flows in the Piedmont megaregion have been declining since 1990,
over 75% during the study period. The rule changes for T-100 caused a small increase in
flows, due to the inclusion of domestic all-cargo flights in the dataset, but the decline
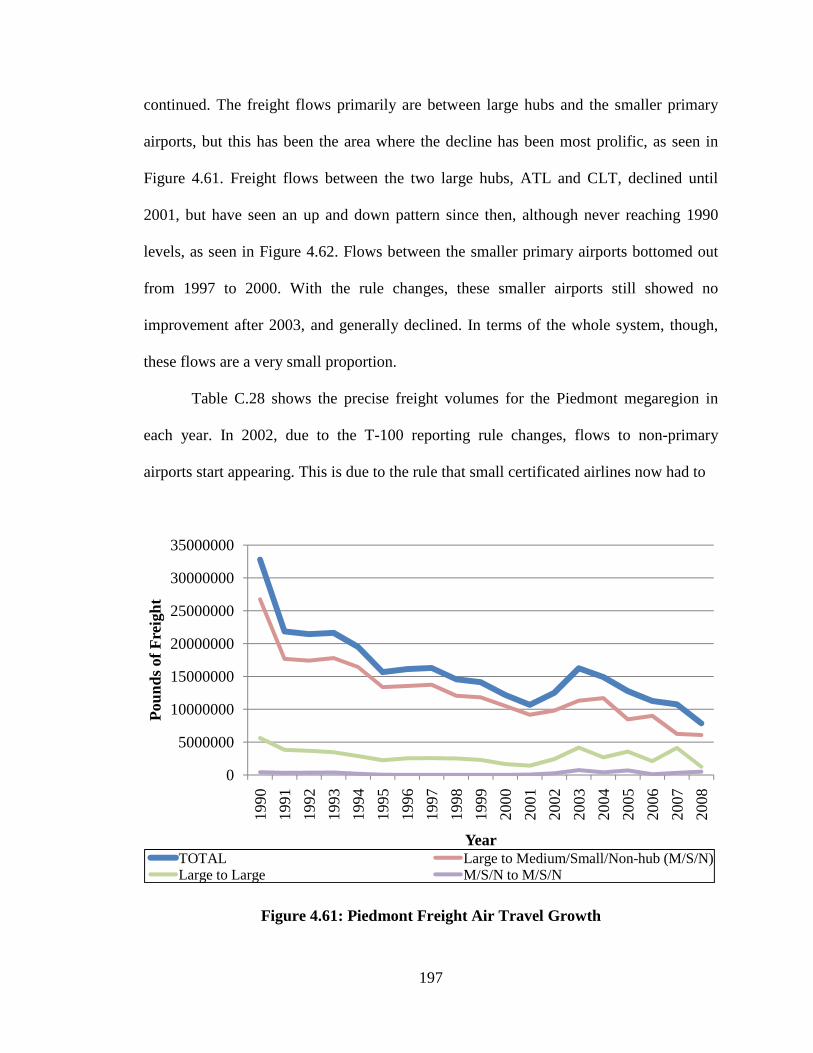
197
continued. The freight flows primarily are between large hubs and the smaller primary
airports, but this has been the area where the decline has been most prolific, as seen in
Figure 4.61. Freight flows between the two large hubs, ATL and CLT, declined until
2001, but have seen an up and down pattern since then, although never reaching 1990
levels, as seen in Figure 4.62. Flows between the smaller primary airports bottomed out
from 1997 to 2000. With the rule changes, these smaller airports still showed no
improvement after 2003, and generally declined. In terms of the whole system, though,
these flows are a very small proportion.
Table C.28 shows the precise freight volumes for the Piedmont megaregion in
each year. In 2002, due to the T-100 reporting rule changes, flows to non-primary
airports start appearing. This is due to the rule that small certificated airlines now had to
Figure 4.61: Piedmont Freight Air Travel Growth
0
5000000
10000000
15000000
20000000
25000000
30000000
35000000
1990
1991
1992
1993
1994
1995
1996
1997
1998
1999
2000
2001
2002
2003
2004
2005
2006
2007
2008
Pou
nds
of F
reig
ht
YearTOTAL Large to Medium/Small/Non-hub (M/S/N)Large to Large M/S/N to M/S/N

Figure 4.62: Relative Piedmont Freight Air Travel Growth
report their flows, the aircraft that typically cater to non
non-primary airports to large hubs are minute compared to the other flows in the
megaregion, and to smaller airports is sporadic and often non
4.7.4 Summary
Both overall passenger and freight traffic have been increasing since 1990, with their
main drop in flows occurring post 9/11.
international components
increase in globalization and
the international market.
0
0.5
1
1.5
1990
1991
1992
1993Rel
ativ
e G
row
th (
Ref
eren
ced
to 1
990)
TotalLarge to Large
198
Figure 4.62: Relative Piedmont Freight Air Travel Growth
report their flows, the aircraft that typically cater to non-primary airports. Flows from
primary airports to large hubs are minute compared to the other flows in the
, and to smaller airports is sporadic and often non-existent.
passenger and freight traffic have been increasing since 1990, with their
main drop in flows occurring post 9/11. It is important to note that for both sectors, the
nternational components have been the fastest growing. This growth is indicative of the
increase in globalization and the importance of interaction between the megaregion
1993
1994
1995
1996
1997
1998
1999
2000
2001
2002
2003
2004
2005
YearLarge to Medium/Small/NonM/S/N to M/S/N
Abn
orm
al G
row
th D
ue
to T
-100
R
ule
Cha
nges
Figure 4.62: Relative Piedmont Freight Air Travel Growth
primary airports. Flows from
primary airports to large hubs are minute compared to the other flows in the
passenger and freight traffic have been increasing since 1990, with their
or both sectors, the
is indicative of the
interaction between the megaregions and
2005
2006
2007
2008
Large to Medium/Small/Non-hub (M/S/N)

199
The other flow type which is growing for megaregions in both freight and
passenger traffic is to non-megaregion areas. The growing connection between the major
population and industry centers in the U.S. with the outlying areas indicates the
increasing influence megaregions have on the rest of the country. Comparing this flow to
intermega traffic reveals more about the situation. For freight, intermega traffic is a
sizeable component but dropping. Freight traffic is increasingly not between the
megaregions, but to places outside of them, either international or to the rest of the
country. In passenger traffic, intermega flows are the largest component and increasing as
well. The long distance connection with megaregions, whether to each other or to the
outlying areas, is increasing as a whole.
Internal flows are faring poorly both within megaregions and within non-
megaregion areas, already small components overall in both sectors. Both of these flow
types, although increasing, lag behind in the passenger market behind all other flows. The
shorter distance flights have not been able to keep up with the growth in long distance
flights. In terms of freight, both are decreasing in prominence, and are smaller overall as
compared to 1990. The Piedmont megaregion case study is an example of what is
occurring internally within the megaregion. The intramega passenger market has grown
to focus more on the large hubs over time, both flows to them and between them, while
flows between the smaller primary airports has dropped markedly. In freight traffic, flows
between all airports has dropped significantly over time.

200
CHAPTER 5
CONCLUSIONS Megaregions are the locations of the nation’s largest airports and major airline hubs.
Using this infrastructure, megaregion populations engage in strong economies requiring
air travel and air freight to socialize, conduct business, and stay connected. The
megaregion is large enough that there can be significant internal flows within it, in
addition to long distance movements to other megaregions, the areas in between, and
internationally. A well planned airport system, integrated successfully into the urban
fabric, can enhance the economic productivity and mobility of a megaregion’s population
and businesses that locate themselves there.
5.1 Key Findings
It is clear that megaregions play a significant role in the U.S. air transport system. The
collection of cities and supporting areas in a megaregion have a higher propensity for air
travel and shipping air freight, as compared to areas outside the megaregions. This
conclusion is not surprising, as the country’s cities with the greatest populations are the
most active in air travel, and thus the megaregions which contain these cities are fueled
by this activity.
A large reason for the megaregion-centric air system is the infrastructure and
competitive advantage megaregions have for conducting air travel. The largest most
active airports in the country are located within the confines of the megaregions at higher
densities as compared to non-megaregion areas. This infrastructure density increases the

201
availability of air facilities for individuals and businesses that require mobility over long
distances. Having this access to a large airport thus encourages air travel, and in turn,
attracts businesses to the megaregion. The same can be said for airline hubs, of which the
megaregions’ have the greatest share. The presence of a hub induces travel due to the
availability of a large number of direct flights for passengers. Airline hubbing has thus
made megaregions more important in air travel than they would be without. Hubs
facilitate easier access for megaregion populations to a wider range of destinations.
Megaregions have a final advantage in that there is consolidation within their system.
There are fewer airports per person in the megaregions, because non-megaregion areas
must have a wider spread of air infrastructure and services to provide for the population’s
dispersal. In megaregions this means there is an increased level of service for a few key
airports, inducing airline competition and a conglomeration of supporting services. This
in turn, assumingly, reduces the cost of air travel from those airports, making it even
easier for megaregion populations to travel and ship. It is not surprising that megaregions
are the focal point of the U.S. aviation system.
The connections megaregions have with the international market is significant and
is growing in both passenger and freight sectors. The connectivity megaregions have with
the international market illustrates their role as the gateways into the country. It is in the
megaregions that the nation’s global cities reside, interacting through their international
airports with the world economy. In both sectors, international traffic has been increasing
over the last two decades. Freight especially is seen to be angled internationally, with the
top flows out of megaregions headed to international markets. The megaregion’s are able
to orient themselves internationally more than non-megaregion areas due to the nature of

202
the industries in megaregions, larger service-based economies which frequently require
traveling overseas, and the airport infrastructure that is prepared for the international
travel.
The internal connections within megaregions are stronger in the passenger sector
than it is in the freight sector, although in both it lags behind other flow types in growth.
Intramega passenger traffic has some of largest gross volumes of all flows nationwide,
especially when the flows are standardized by the respective attributes of the market.
Passenger traffic within the megaregion is focused heavily towards the large hubs, seen
strongly in megaregions with hub-focused, dyad, and tri-pole spatial flow systems.
Intramega freight flows, in general decline over the last two decades, are not generally
significant. Only the Midwest, within which is the UPS national hub, has very strong
intramega freight flows. It is evident that freight is a movement not typically handled
within a megaregion by air. At the smaller distances, it is more economically sound to
ship by truck, and thus the market for freight has declined as road systems continually are
upgraded. Due to the greater necessity for intramega passenger traffic than freight traffic,
the smaller airports in a megaregion often see a greater volume of passenger flows, while
the freight traffic is oriented to a few key airports.
In the passenger sector, it is generally seen that megaregions have their strongest
connections with the megaregions closest to them. Even at this large scale, crossing state
and metropolitan area boundaries, the effects that are described by a gravity model are
still seen: distance is important. In the airline industry, costs increases with distance, and
this likely has an effect on where passengers are more willing to travel. The four eastern
megaregions (Midwest, Northeast, Southern Florida, and Piedmont) are the most traveled

203
grouping of megaregions. The six flow pairings that exist between these megaregions are
the most traveled in the nation. Elsewhere, the two California megaregions are very
closely tied together, while each individually has a strong flow to its other nearest
neighbor: Northern California to Cascadia and Southern California to the Arizona Sun
Corridor. The Gulf Coast is closely tied to Southern Florida and the Texas Triangle. The
Front Range to the Arizona Sun Corridor and Texas Triangle. Across the board, it seen
that in the passenger sector, high passenger flows occur to nearby megaregions.
The distance argument does not apply so easily to freight. In the freight sector,
freight hubs play a much more decisive role as to where air freight moves to. Apart from
the importance of the international market, freight moves primarily to non-megaregion
areas and the Midwest. The argument can be made that these two spaces have large areas,
but neither dominated passenger traffic in the way they dominate freight. The Midwest is
the first or second highest destination standardizing by pairing attributes for all
megaregions. The reason for these effects is the dominance of UPS and FedEx, so much
so that it can influence the spatial flows on a megaregion level. With the main UPS hub
(Louisville) in the Midwest, and the main FedEx hub (Memphis) in non-megaregion
areas, a large portion of the air freight network flows to there. This is even seen on the
intramega level, as exemplified by the influence Ontario Airport has on the Southern
California network due to its UPS hub status.
The megaregion model certainly has an application to aviation and a governance
structure could be created to address megaregion issues. Capacity issues at the country’s
largest airports, all located in megaregions, are restraining the possibility for growth. The
megaregion could serve as the spatial form over which infrastructure investment

204
decisions are made. If a balancing of demands at airports is necessary within a
megaregion to provide a better functioning system, optimizing at the megaregion level
could be necessary. An institution at the megaregion level would be needed to handle
such a delicate process, managing the interests of public and private airports and the
airlines. Using the information on the growth of the different flow types, airports
planning could be performed so the megaregion system improves, and not just one airport
at the expense of others.
5.2 Future Directions
This study has been an exploration into the interaction between the aviation system and
megaregions. In a sense, it is an exploratory study, the first of its kind, to find out the
state of air traffic between the U.S. megaregions. The analyses focused on the attributes
of the megaregions, simply ranking them against each other for comparison, and profiling
each megaregion to understand where its traffic heads, and what happens internally. This
research project can be furthered with a strong statistical analysis, to find more about
what causes stronger megaregion flows and what factors are influencing growth.
One addition to this study that could improve the assessment of the megaregion
situation is to evaluate the capacity of the megaregion’s airports. This study focuses
solely on the demand for megaregion travel, but to effectively address how megaregions
must meet the demand, the current capacity must be known. Several studies have made
use of the OAG to calculate the capacity of an airport, and this could be done to calculate
it for an entire megaregion. In doing so, it would be able to be determined what
megaregions are strained for slots and which have room for growth.

205
Another addition to this study that could be useful is the introduction of the value
and type of goods being shipped by air freight. Volume of freight is certainly important,
but air freight is particularly known for shipping high value goods, as compared to truck,
railroads, or sea shipping. The cost per mile to ship a valuable good is a smaller part of
the good’s cost, and it becomes suitable to ship by air. This has not been captured in this
study, and is an important feature of air shipments. In addition, knowledge of the type of
good would give insight into the type of industry making use of the mode. The inclusion
of this in the study, using data from the commodity flow survey, would add depth to the
discussion on air freight. This could further answer the question of the role of air
movements in megaregion freight traffic.
The spatial analysis of the flows between megaregions should be looked into
further with tests commonly found in a geographer’s toolkit. The first step should be to
run a spatial interaction model between the eleven megaregions. Determining how much
distance is a factor is key to determining more about the nature of aviation in regards to
megaregions. The output of such a model should be analyzed to see how they deviate
from what really is occurring. A principal component analysis could be performed to
compare the effects of megaregion attribute data on both the intramega and intermega
flows.
Techniques to look more into the nature of the connections would give a more
through look at the relationships megaregions have with each other. One spatial analysis
procedure is a hierarchal cluster analysis (employed by Choi, Barnett, and Chon 2000),
which results in the natural groupings that spatial entities have with each other. Using an
OD matrix table as an input, the output can be viewed as a diagram that shows the
206
ordering of places which have the greatest tie. Another geographical technique is a clique
analysis (employed by Shin and Timberlake 2000), which employs a range of centrality
measures. This method finds groupings of spaces that have a tendency to interact more
closely with each other than all other areas, creating a clique of spaces. It allows the
functional tendencies that exist in the hierarchy to be displayed.
There is further work to be done in understanding the airline’s role in shaping the
patterns of a megaregion. In freight transport, the influence of UPS and FedEx on
megaregion flows could be further studied to see the precise roles the airlines play in
changing a freight network over time. Legacy passenger carriers could be analyzed to see
the differences in having different types of hubbing activities in a megaregion and the
effect it has on intramega and intermega traffic of that airline.
This study provides insight into how the U.S. megaregion functions within the
aviation network, but more could be learned from other worldwide megaregions. The
European Union and China have very active air networks and also have experienced a
trend towards megaregion formation. Studying their airport flows between and within
megaregions over time could aid in determining what affects megaregional air traffic
levels.
How airports can be expanded and managed to serve megaregions in the future is
affected by their current effectiveness to meet demand. Air facilities will face increased
pressure to meet the challenge of a global economy that requires easy connections, and an
inability to serve such a function may result in a competitive disadvantage. The
megaregion model could be used to manage the upcoming growth.

207
APPENDIX A
STUDY AIRPORTS
Table A.1: Airports in T-100 Database Used in Study
IATA Code Airport Name State Megaregion FAA Hub
01A PURKEYPILE AK
04A FRANK SIKES AL
09A BUTLER-CHOCTAW COUNTY AL
1G4 GRAND CANYON WEST AZ N
1N7 BLAIRSTOWN NJ NE
A05 DIXIE USFS ID
A09 EAGLE AIRPARK AZ
A13 BOLD AK
A14 PORTAGE CREEK AK
A20 SUN VALLEY AZ
A23 SAGINAW AK
A24 CALIFORNIA PINES CA
A26 ADIN CA
A27 SELDOVIA AK
A28 FORT BIDWELL CA
A29 SITKA AK
A30 SCOTT VALLEY CA
A36 HADLEY NV
A43 TAKU HARBOR AK
A51 COSTIN FL
A57 ALSEK RIVER AK
A61 TUNTUTULIAK AK
A63 TWIN HILLS AK
A67 HARLEQUIN LAKE AK
A69 TANIS MESA AK
A79 CHIGNIK LAKE AK
AAF APALACHICOLA REGIONAL FL
ABE LEHIGH VALLEY INTL PA NE S
ABI ABILENE RGNL TX N
ABL AMBLER AK
ABQ ALBUQUERQUE INTL SUNPORT NM FR M
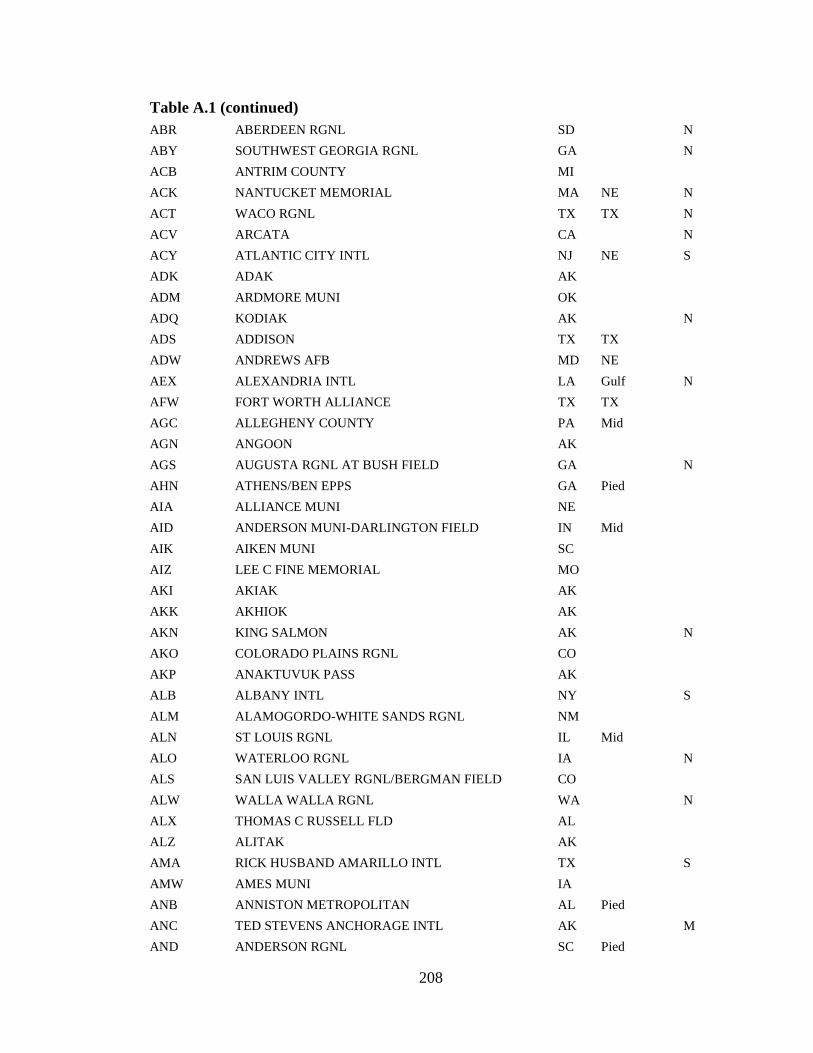
208
Table A.1 (continued)
ABR ABERDEEN RGNL SD N
ABY SOUTHWEST GEORGIA RGNL GA N
ACB ANTRIM COUNTY MI
ACK NANTUCKET MEMORIAL MA NE N
ACT WACO RGNL TX TX N
ACV ARCATA CA N
ACY ATLANTIC CITY INTL NJ NE S
ADK ADAK AK
ADM ARDMORE MUNI OK
ADQ KODIAK AK N
ADS ADDISON TX TX
ADW ANDREWS AFB MD NE
AEX ALEXANDRIA INTL LA Gulf N
AFW FORT WORTH ALLIANCE TX TX
AGC ALLEGHENY COUNTY PA Mid
AGN ANGOON AK
AGS AUGUSTA RGNL AT BUSH FIELD GA N
AHN ATHENS/BEN EPPS GA Pied
AIA ALLIANCE MUNI NE
AID ANDERSON MUNI-DARLINGTON FIELD IN Mid
AIK AIKEN MUNI SC
AIZ LEE C FINE MEMORIAL MO
AKI AKIAK AK
AKK AKHIOK AK
AKN KING SALMON AK N
AKO COLORADO PLAINS RGNL CO
AKP ANAKTUVUK PASS AK
ALB ALBANY INTL NY S
ALM ALAMOGORDO-WHITE SANDS RGNL NM
ALN ST LOUIS RGNL IL Mid
ALO WATERLOO RGNL IA N
ALS SAN LUIS VALLEY RGNL/BERGMAN FIELD CO
ALW WALLA WALLA RGNL WA N
ALX THOMAS C RUSSELL FLD AL
ALZ ALITAK AK
AMA RICK HUSBAND AMARILLO INTL TX S
AMW AMES MUNI IA
ANB ANNISTON METROPOLITAN AL Pied
ANC TED STEVENS ANCHORAGE INTL AK M
AND ANDERSON RGNL SC Pied

209
Table A.1 (continued) ANI ANIAK AK N
ANN ANNETTE ISLAND AK
ANP LEE MD NE
ANV ANVIK AK
AOH LIMA ALLEN COUNTY OH Mid
AOO ALTOONA-BLAIR COUNTY PA Mid
APA CENTENNIAL CO FR
APC NAPA COUNTY CA NCAl
APF NAPLES MUNI FL SFl N
APG PHILLIPS AAF MD NE
APN ALPENA COUNTY RGNL MI
APV APPLE VALLEY CA SCal
AQY GIRDWOOD AK
ARA ACADIANA RGNL LA Gulf
ARB ANN ARBOR MUNI MI Mid
ARC ARCTIC VILLAGE AK
ARG WALNUT RIDGE RGNL AR
ART WATERTOWN INTL NY
ARV LAKELAND/NOBLE F. LEE MEMORIAL FIELD WI
ASE ASPEN-PITKIN CO/SARDY FIELD CO N
ASH BOIRE FIELD NH NE
ASL HARRISON COUNTY TX TX
ASN TALLADEGA MUNI AL Pied
AST ASTORIA RGNL OR Casc
ASX JOHN F KENNEDY MEMORIAL WI
ATK ATQASUK EDWARD BURNELL SR MEMORIAL AK
ATL HARTSFIELD - JACKSON ATLANTA INTL GA Pied L
ATS ARTESIA MUNI NM
ATU CASCO COVE CGS AK
ATW OUTAGAMIE COUNTY RGNL WI Mid N
ATY WATERTOWN RGNL SD
AUG AUGUSTA STATE ME
AUK ALAKANUK AK
AUM AUSTIN MUNI MN
AUN AUBURN MUNI CA NCAl
AUO AUBURN-OPELIKA ROBERT G. PITTS AL
AUS AUSTIN-BERGSTROM INTL TX TX M
AVL ASHEVILLE RGNL NC Pied N
AVP WILKES-BARRE/SCRANTON INTL PA NE N
AWK WAKE ISLAND AIRFIELD WQ
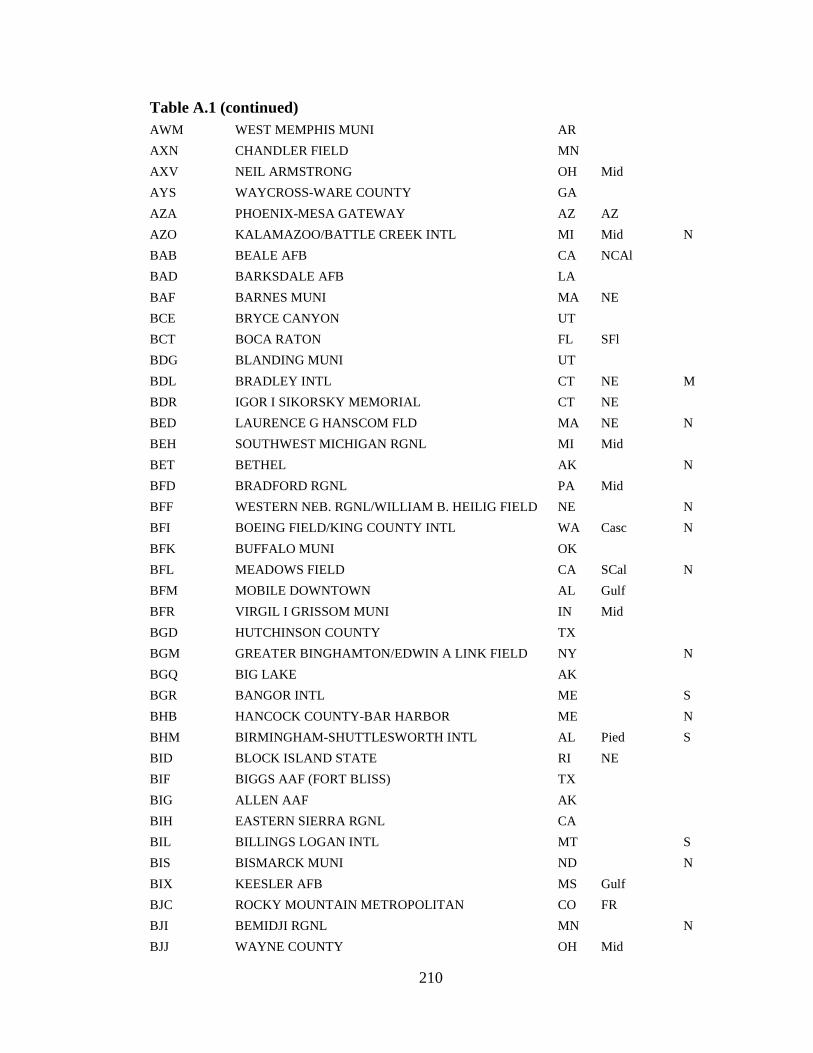
210
Table A.1 (continued)
AWM WEST MEMPHIS MUNI AR
AXN CHANDLER FIELD MN
AXV NEIL ARMSTRONG OH Mid
AYS WAYCROSS-WARE COUNTY GA
AZA PHOENIX-MESA GATEWAY AZ AZ
AZO KALAMAZOO/BATTLE CREEK INTL MI Mid N
BAB BEALE AFB CA NCAl
BAD BARKSDALE AFB LA
BAF BARNES MUNI MA NE
BCE BRYCE CANYON UT
BCT BOCA RATON FL SFl
BDG BLANDING MUNI UT
BDL BRADLEY INTL CT NE M
BDR IGOR I SIKORSKY MEMORIAL CT NE
BED LAURENCE G HANSCOM FLD MA NE N
BEH SOUTHWEST MICHIGAN RGNL MI Mid
BET BETHEL AK N
BFD BRADFORD RGNL PA Mid
BFF WESTERN NEB. RGNL/WILLIAM B. HEILIG FIELD NE N
BFI BOEING FIELD/KING COUNTY INTL WA Casc N
BFK BUFFALO MUNI OK
BFL MEADOWS FIELD CA SCal N
BFM MOBILE DOWNTOWN AL Gulf
BFR VIRGIL I GRISSOM MUNI IN Mid
BGD HUTCHINSON COUNTY TX
BGM GREATER BINGHAMTON/EDWIN A LINK FIELD NY N
BGQ BIG LAKE AK
BGR BANGOR INTL ME S
BHB HANCOCK COUNTY-BAR HARBOR ME N
BHM BIRMINGHAM-SHUTTLESWORTH INTL AL Pied S
BID BLOCK ISLAND STATE RI NE
BIF BIGGS AAF (FORT BLISS) TX
BIG ALLEN AAF AK
BIH EASTERN SIERRA RGNL CA
BIL BILLINGS LOGAN INTL MT S
BIS BISMARCK MUNI ND N
BIX KEESLER AFB MS Gulf
BJC ROCKY MOUNTAIN METROPOLITAN CO FR
BJI BEMIDJI RGNL MN N
BJJ WAYNE COUNTY OH Mid

211
Table A.1 (continued)
BKE BAKER CITY MUNI OR
BKF BUCKLEY AFB CO FR
BKL BURKE LAKEFRONT OH Mid
BKW RALEIGH COUNTY MEMORIAL WV
BKX BROOKINGS RGNL SD
BLD BOULDER CITY MUNI NV SCal N
BLF MERCER COUNTY WV
BLI BELLINGHAM INTL WA Casc N
BLM MONMOUTH EXECUTIVE NJ NE
BLV SCOTT AFB/MIDAMERICA IL Mid N
BMC BRIGHAM CITY UT
BMG MONROE COUNTY IN Mid
BMI CENTRAL IL REGL ARPT AT BLOOMINGTON-NORMAL IL Mid N
BNA NASHVILLE INTL TN M
BNF WARM SPRING BAY AK
BNO BURNS MUNI OR
BOI BOISE AIR TERMINAL/GOWEN FLD ID S
BOK BROOKINGS OR
BOS GENERAL EDWARD LAWRENCE LOGAN INTL MA NE L
BOW BARTOW MUNI FL SFl
BPT SOUTHEAST TEXAS RGNL TX TX/Gulf N
BQK BRUNSWICK GOLDEN ISLES GA SFl N
BQN RAFAEL HERNANDEZ PR N
BQV BARTLETT COVE AK
BRD BRAINERD LAKES RGNL MN N
BRL SOUTHEAST IOWA RGNL IA
BRO BROWNSVILLE/SOUTH PADRE ISLAND INTL TX Gulf N
BRW WILEY POST-WILL ROGERS MEMORIAL AK N
BRY SAMUELS FIELD KY Mid
BTI BARTER ISLAND LRRS AK
BTL W K KELLOGG MI Mid
BTM BERT MOONEY MT N
BTP BUTLER COUNTY/K W SCHOLTER FIELD PA Mid
BTR BATON ROUGE METROPOLITAN, RYAN FIELD LA Gulf S
BTT BETTLES AK
BTV BURLINGTON INTL VT S
BTY BEATTY NV
BUF BUFFALO NIAGARA INTL NY M
BUR BOB HOPE CA SCal M

212
Table A.1 (continued)
BVX BATESVILLE RGNL AR
BVY BEVERLY MUNI MA NE
BWD BROWNWOOD RGNL TX
BWG BOWLING GREEN-WARREN COUNTY RGNL KY
BWI BALTIMORE/WASHINGTON INTL THURGOOD MARSHAL MD NE L
BYA BOUNDARY AK
BYG JOHNSON COUNTY WY
BYH ARKANSAS INTL AR
BYI BURLEY MUNI ID
BZN GALLATIN FIELD MT N
C01 SOUTHERN CROSS NJ NE
C02 GRAND GENEVA RESORT WI Mid
CAD WEXFORD COUNTY MI
CAE COLUMBIA METROPOLITAN SC S
CAK AKRON-CANTON RGNL OH Mid S
CAR CARIBOU MUNI ME
CBE GREATER CUMBERLAND RGNL MD
CBM COLUMBUS AFB MS
CCR BUCHANAN FIELD CA NCAl
CDB COLD BAY AK
CDC CEDAR CITY RGNL UT
CDH HARRELL FIELD AR
CDR CHADRON MUNI NE
CDV MERLE K (MUDHOLE) SMITH AK N
CDW ESSEX COUNTY NJ NE
CEC JACK MC NAMARA FIELD CA N
CEF WESTOVER ARB/METROPOLITAN MA NE
CEM CENTRAL AK
CEU OCONEE COUNTY RGNL SC Pied
CEV METTEL FIELD IN Mid
CEW BOB SIKES FL Gulf
CEZ CORTEZ MUNI CO
CFT GREENLEE COUNTY AZ
CFV COFFEYVILLE MUNI KS
CGA CRAIG AK
CGE CAMBRIDGE-DORCHESTER MD
CGF CUYAHOGA COUNTY OH Mid
CGI CAPE GIRARDEAU RGNL MO
CGS COLLEGE PARK MD NE

213
Table A.1 (continued)
CGZ CASA GRANDE MUNI AZ AZ
CHA LOVELL FIELD TN N
CHD CHANDLER MUNI AZ AZ
CHL CHALLIS ID
CHO CHARLOTTESVILLE-ALBEMARLE VA N
CHP CIRCLE HOT SPRINGS AK
CHS CHARLESTON AFB/INTL SC S
CHU HOUSTON COUNTY MN Mid
CIC CHICO MUNI CA N
CID THE EASTERN IOWA IA S
CIK CHALKYITSIK AK
CIN ARTHUR N NEU IA
CIU CHIPPEWA COUNTY INTL MI N
CKB NORTH CENTRAL WEST VIRGINIA WV
CKU CORDOVA MUNI AK
CKV OUTLAW FIELD TN
CKX CHICKEN AK
CLD MC CLELLAN-PALOMAR CA SCal N
CLE CLEVELAND-HOPKINS INTL OH Mid M
CLF CLEAR SKY LODGE AK
CLK CLINTON RGNL OK
CLL EASTERWOOD FIELD TX TX N
CLM WILLIAM R FAIRCHILD INTL WA Casc N
CLP CLARKS POINT AK
CLR CLIFF HATFIELD MEMORIAL CA SCal
CLT CHARLOTTE/DOUGLAS INTL NC Pied L
CLU COLUMBUS MUNI IN Mid
CMH PORT COLUMBUS INTL OH Mid M
CMI UNIVERSITY OF ILLINOIS-WILLARD IL Mid N
CMX HOUGHTON COUNTY MEMORIAL MI N
CNM CAVERN CITY AIR TRML NM
CNO CHINO CA SCal
CNW TSTC WACO TX TX
CNY CANYONLANDS FIELD UT
COD YELLOWSTONE RGNL WY N
COE COEUR D'ALENE - PAPPY BOYINGTON FIELD ID
COF PATRICK AFB FL SFl
COM COLEMAN MUNI TX
CON CONCORD MUNI NH NE
COS CITY OF COLORADO SPRINGS MUNI CO FR S
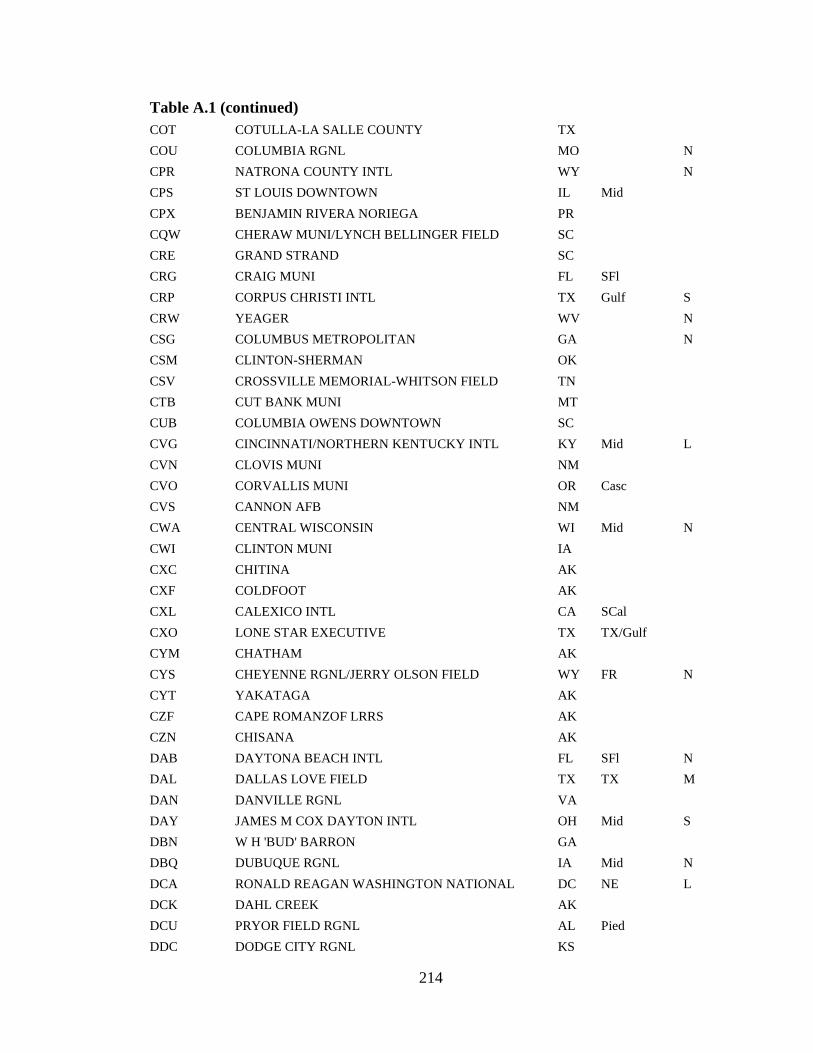
214
Table A.1 (continued)
COT COTULLA-LA SALLE COUNTY TX
COU COLUMBIA RGNL MO N
CPR NATRONA COUNTY INTL WY N
CPS ST LOUIS DOWNTOWN IL Mid
CPX BENJAMIN RIVERA NORIEGA PR
CQW CHERAW MUNI/LYNCH BELLINGER FIELD SC
CRE GRAND STRAND SC
CRG CRAIG MUNI FL SFl
CRP CORPUS CHRISTI INTL TX Gulf S
CRW YEAGER WV N
CSG COLUMBUS METROPOLITAN GA N
CSM CLINTON-SHERMAN OK
CSV CROSSVILLE MEMORIAL-WHITSON FIELD TN
CTB CUT BANK MUNI MT
CUB COLUMBIA OWENS DOWNTOWN SC
CVG CINCINNATI/NORTHERN KENTUCKY INTL KY Mid L
CVN CLOVIS MUNI NM
CVO CORVALLIS MUNI OR Casc
CVS CANNON AFB NM
CWA CENTRAL WISCONSIN WI Mid N
CWI CLINTON MUNI IA
CXC CHITINA AK
CXF COLDFOOT AK
CXL CALEXICO INTL CA SCal
CXO LONE STAR EXECUTIVE TX TX/Gulf
CYM CHATHAM AK
CYS CHEYENNE RGNL/JERRY OLSON FIELD WY FR N
CYT YAKATAGA AK
CZF CAPE ROMANZOF LRRS AK
CZN CHISANA AK
DAB DAYTONA BEACH INTL FL SFl N
DAL DALLAS LOVE FIELD TX TX M
DAN DANVILLE RGNL VA
DAY JAMES M COX DAYTON INTL OH Mid S
DBN W H 'BUD' BARRON GA
DBQ DUBUQUE RGNL IA Mid N
DCA RONALD REAGAN WASHINGTON NATIONAL DC NE L
DCK DAHL CREEK AK
DCU PRYOR FIELD RGNL AL Pied
DDC DODGE CITY RGNL KS
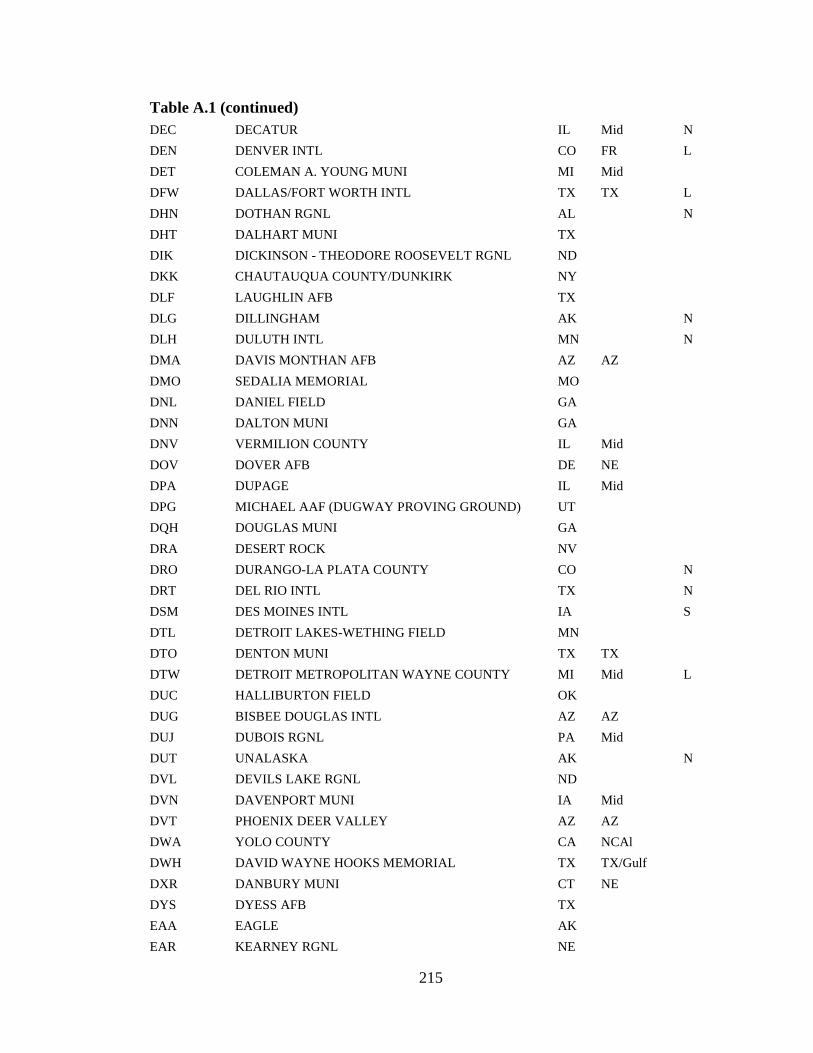
215
Table A.1 (continued)
DEC DECATUR IL Mid N
DEN DENVER INTL CO FR L
DET COLEMAN A. YOUNG MUNI MI Mid
DFW DALLAS/FORT WORTH INTL TX TX L
DHN DOTHAN RGNL AL N
DHT DALHART MUNI TX
DIK DICKINSON - THEODORE ROOSEVELT RGNL ND
DKK CHAUTAUQUA COUNTY/DUNKIRK NY
DLF LAUGHLIN AFB TX
DLG DILLINGHAM AK N
DLH DULUTH INTL MN N
DMA DAVIS MONTHAN AFB AZ AZ
DMO SEDALIA MEMORIAL MO
DNL DANIEL FIELD GA
DNN DALTON MUNI GA
DNV VERMILION COUNTY IL Mid
DOV DOVER AFB DE NE
DPA DUPAGE IL Mid
DPG MICHAEL AAF (DUGWAY PROVING GROUND) UT
DQH DOUGLAS MUNI GA
DRA DESERT ROCK NV
DRO DURANGO-LA PLATA COUNTY CO N
DRT DEL RIO INTL TX N
DSM DES MOINES INTL IA S
DTL DETROIT LAKES-WETHING FIELD MN
DTO DENTON MUNI TX TX
DTW DETROIT METROPOLITAN WAYNE COUNTY MI Mid L
DUC HALLIBURTON FIELD OK
DUG BISBEE DOUGLAS INTL AZ AZ
DUJ DUBOIS RGNL PA Mid
DUT UNALASKA AK N
DVL DEVILS LAKE RGNL ND
DVN DAVENPORT MUNI IA Mid
DVT PHOENIX DEER VALLEY AZ AZ
DWA YOLO COUNTY CA NCAl
DWH DAVID WAYNE HOOKS MEMORIAL TX TX/Gulf
DXR DANBURY MUNI CT NE
DYS DYESS AFB TX
EAA EAGLE AK
EAR KEARNEY RGNL NE

216
Table A.1 (continued)
EAT PANGBORN MEMORIAL WA N
EAU CHIPPEWA VALLEY RGNL WI Mid N
ECG ELIZABETH CITY CG AIR STATION/RGNL NC
EDE NORTHEASTERN RGNL NC
EDF ELMENDORF AFB AK
EDW EDWARDS AFB CA SCal
EEK EEK AK
EEN DILLANT-HOPKINS NH
EFD ELLINGTON FIELD TX TX/Gulf
EFK NEWPORT STATE VT
EGE EAGLE COUNTY RGNL CO FR N
EGX EGEGIK AK
EHM CAPE NEWENHAM LRRS AK
EHR HENDERSON CITY-COUNTY KY
EIL EIELSON AFB AK
EKA MURRAY FIELD CA
EKO ELKO RGNL NV N
EKX ADDINGTON FIELD KY Mid
EKY BESSEMER AL Pied
ELD SOUTH ARKANSAS RGNL AT GOODWIN FIELD AR
ELI ELIM AK
ELM ELMIRA/CORNING RGNL NY N
ELN BOWERS FIELD WA Casc
ELP EL PASO INTL TX S
ELV ELFIN COVE AK
ELY ELY ARPT /YELLAND FLD/ NV
EMK EMMONAK AK N
EMM KEMMERER MUNI WY
ENA KENAI MUNI AK N
END VANCE AFB OK
ENN NENANA MUNI AK
ENV WENDOVER UT N
ENW KENOSHA RGNL WI Mid
EOK KEOKUK MUNI IA
EPH EPHRATA MUNI WA
ERI ERIE INTL/TOM RIDGE FIELD PA Mid N
ESC DELTA COUNTY MI N
ESF ESLER RGNL LA Gulf
ESN EASTON/NEWNAM FIELD MD
EUG MAHLON SWEET FIELD OR Casc N
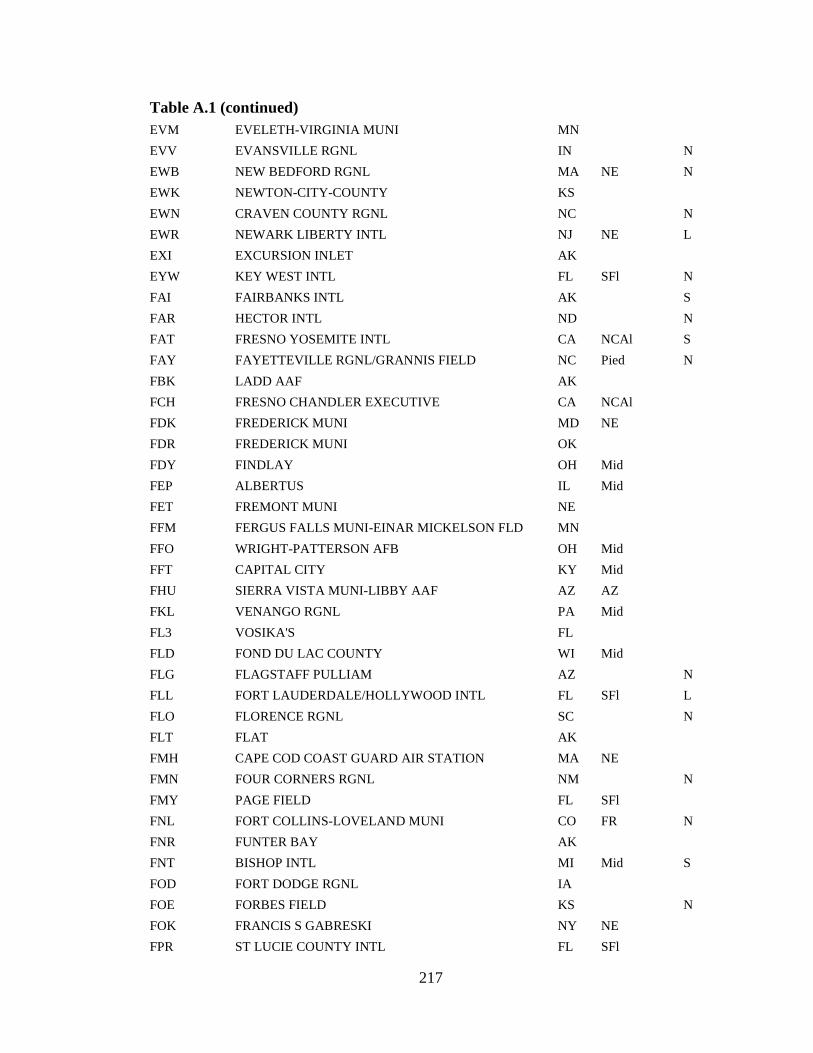
217
Table A.1 (continued)
EVM EVELETH-VIRGINIA MUNI MN
EVV EVANSVILLE RGNL IN N
EWB NEW BEDFORD RGNL MA NE N
EWK NEWTON-CITY-COUNTY KS
EWN CRAVEN COUNTY RGNL NC N
EWR NEWARK LIBERTY INTL NJ NE L
EXI EXCURSION INLET AK
EYW KEY WEST INTL FL SFl N
FAI FAIRBANKS INTL AK S
FAR HECTOR INTL ND N
FAT FRESNO YOSEMITE INTL CA NCAl S
FAY FAYETTEVILLE RGNL/GRANNIS FIELD NC Pied N
FBK LADD AAF AK
FCH FRESNO CHANDLER EXECUTIVE CA NCAl
FDK FREDERICK MUNI MD NE
FDR FREDERICK MUNI OK
FDY FINDLAY OH Mid
FEP ALBERTUS IL Mid
FET FREMONT MUNI NE
FFM FERGUS FALLS MUNI-EINAR MICKELSON FLD MN
FFO WRIGHT-PATTERSON AFB OH Mid
FFT CAPITAL CITY KY Mid
FHU SIERRA VISTA MUNI-LIBBY AAF AZ AZ
FKL VENANGO RGNL PA Mid
FL3 VOSIKA'S FL
FLD FOND DU LAC COUNTY WI Mid
FLG FLAGSTAFF PULLIAM AZ N
FLL FORT LAUDERDALE/HOLLYWOOD INTL FL SFl L
FLO FLORENCE RGNL SC N
FLT FLAT AK
FMH CAPE COD COAST GUARD AIR STATION MA NE
FMN FOUR CORNERS RGNL NM N
FMY PAGE FIELD FL SFl
FNL FORT COLLINS-LOVELAND MUNI CO FR N
FNR FUNTER BAY AK
FNT BISHOP INTL MI Mid S
FOD FORT DODGE RGNL IA
FOE FORBES FIELD KS N
FOK FRANCIS S GABRESKI NY NE
FPR ST LUCIE COUNTY INTL FL SFl
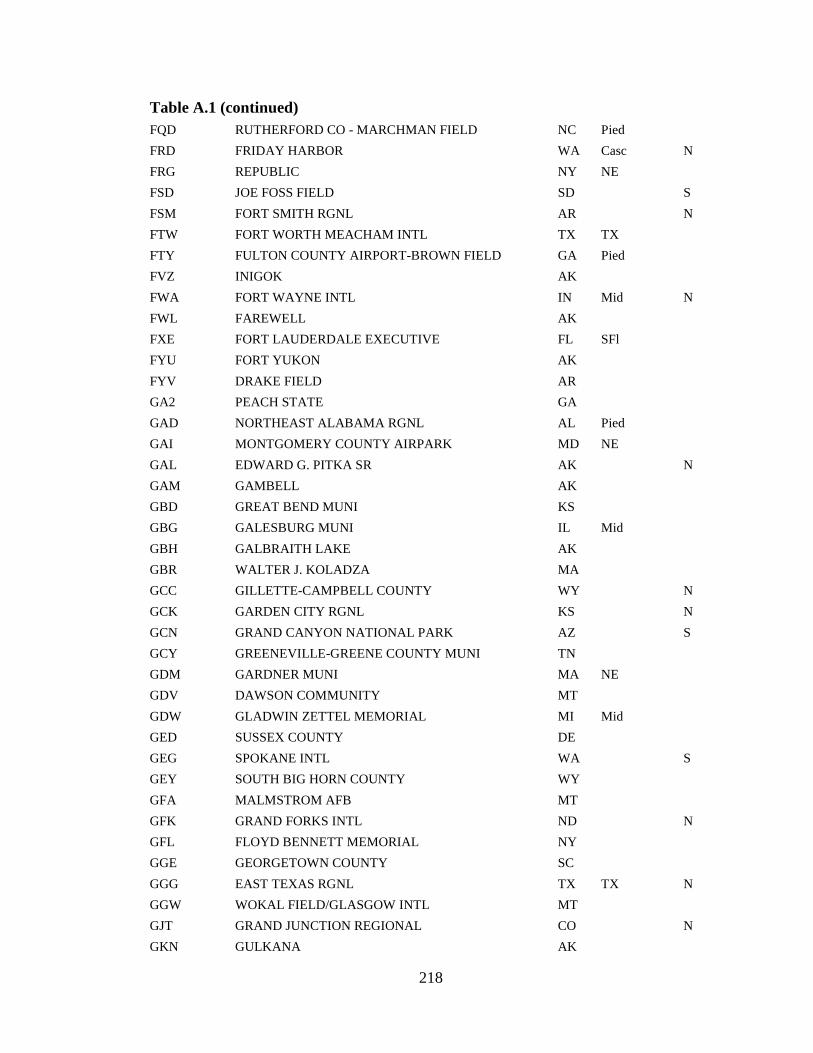
218
Table A.1 (continued)
FQD RUTHERFORD CO - MARCHMAN FIELD NC Pied
FRD FRIDAY HARBOR WA Casc N
FRG REPUBLIC NY NE
FSD JOE FOSS FIELD SD S
FSM FORT SMITH RGNL AR N
FTW FORT WORTH MEACHAM INTL TX TX
FTY FULTON COUNTY AIRPORT-BROWN FIELD GA Pied
FVZ INIGOK AK
FWA FORT WAYNE INTL IN Mid N
FWL FAREWELL AK
FXE FORT LAUDERDALE EXECUTIVE FL SFl
FYU FORT YUKON AK
FYV DRAKE FIELD AR
GA2 PEACH STATE GA
GAD NORTHEAST ALABAMA RGNL AL Pied
GAI MONTGOMERY COUNTY AIRPARK MD NE
GAL EDWARD G. PITKA SR AK N
GAM GAMBELL AK
GBD GREAT BEND MUNI KS
GBG GALESBURG MUNI IL Mid
GBH GALBRAITH LAKE AK
GBR WALTER J. KOLADZA MA
GCC GILLETTE-CAMPBELL COUNTY WY N
GCK GARDEN CITY RGNL KS N
GCN GRAND CANYON NATIONAL PARK AZ S
GCY GREENEVILLE-GREENE COUNTY MUNI TN
GDM GARDNER MUNI MA NE
GDV DAWSON COMMUNITY MT
GDW GLADWIN ZETTEL MEMORIAL MI Mid
GED SUSSEX COUNTY DE
GEG SPOKANE INTL WA S
GEY SOUTH BIG HORN COUNTY WY
GFA MALMSTROM AFB MT
GFK GRAND FORKS INTL ND N
GFL FLOYD BENNETT MEMORIAL NY
GGE GEORGETOWN COUNTY SC
GGG EAST TEXAS RGNL TX TX N
GGW WOKAL FIELD/GLASGOW INTL MT
GJT GRAND JUNCTION REGIONAL CO N
GKN GULKANA AK

219
Table A.1 (continued)
GLD RENNER FLD /GOODLAND MUNI/ KS
GLH MID DELTA RGNL MS
GLR GAYLORD RGNL MI
GLS SCHOLES INTL AT GALVESTON TX TX/Gulf
GLW GLASGOW MUNI KY
GMU GREENVILLE DOWNTOWN SC Pied
GNU GOODNEWS AK
GNV GAINESVILLE RGNL FL SFl N
GON GROTON-NEW LONDON CT NE
GPT GULFPORT-BILOXI INTL MS Gulf S
GPZ GRAND RAPIDS/ITASCA CO-GORDON NEWSTROM FLD MN
GRB AUSTIN STRAUBEL INTL WI Mid S
GRD GREENWOOD COUNTY SC
GRF GRAY AAF WA Casc
GRI CENTRAL NEBRASKA RGNL NE
GRK ROBERT GRAY AAF TX TX N
GRR GERALD R. FORD INTL MI Mid S
GSB SEYMOUR JOHNSON AFB NC Pied
GSH GOSHEN MUNI IN Mid
GSO PIEDMONT TRIAD INTL NC Pied S
GSP GREENVILLE SPARTANBURG INTL SC Pied S
GST GUSTAVUS AK N
GTF GREAT FALLS INTL MT N
GTR GOLDEN TRIANGLE RGNL MS N
GUC GUNNISON-CRESTED BUTTE RGNL CO N
GUM GUAM INTL GU S
GUP GALLUP MUNI NM
GUS GRISSOM ARB IN Mid
GUY GUYMON MUNI OK
GVL LEE GILMER MEMORIAL GA Pied
GVT MAJORS TX TX
GWO GREENWOOD-LEFLORE MS
GWR GWINNER-ROGER MELROE FIELD ND
GYR PHOENIX GOODYEAR AZ AZ
GYY GARY/CHICAGO INTL IN Mid
HAE HANNIBAL RGNL MO
HAO BUTLER CO RGNL OH Mid
HBC MOHALL MUNI ND
HBG HATTIESBURG BOBBY L CHAIN MUNI MS

220
Table A.1 (continued)
HCA HOLY CROSS AK
HDN YAMPA VALLEY CO N
HEZ HARDY-ANDERS FIELD NATCHEZ-ADAMS COUNTY MS
HFD HARTFORD-BRAINARD CT NE
HGR HAGERSTOWN RGNL-RICHARD A HENSON FLD MD NE
HHH HILTON HEAD SC N
HIB CHISHOLM-HIBBING MN N
HIE MOUNT WASHINGTON RGNL NH
HIF HILL AFB UT
HII LAKE HAVASU CITY AZ
HIO PORTLAND-HILLSBORO OR Casc
HKS HAWKINS FIELD MS
HKY HICKORY RGNL NC Pied
HLG WHEELING OHIO CO WV Mid
HLM PARK TOWNSHIP MI Mid
HLN HELENA RGNL MT N
HMN HOLLOMAN AFB NM
HNH HOONAH AK
HNL HONOLULU INTL HI L
HNM HANA HI
HNS HAINES AK
HOB LEA COUNTY RGNL NM
HOM HOMER AK N
HON HURON RGNL SD
HOP CAMPBELL AAF (FORT CAMPBELL) KY
HOT MEMORIAL FIELD AR
HOU WILLIAM P HOBBY TX TX/Gulf M
HPB HOOPER BAY AK
HPN WESTCHESTER COUNTY NY NE S
HQM BOWERMAN WA Casc
HRL VALLEY INTL TX Gulf S
HRO BOONE COUNTY AR
HSI HASTINGS MUNI NE
HSP INGALLS FIELD VA
HST HOMESTEAD ARB FL SFl
HSV HUNTSVILLE INTL-CARL T JONES FIELD AL Pied S
HTO EAST HAMPTON NY NE
HTS TRI-STATE/MILTON J. FERGUSON FIELD WV N
HUA REDSTONE AAF AL Pied

221
Table A.1 (continued)
HUF TERRE HAUTE INTL-HULMAN FIELD IN Mid
HUL HOULTON INTL ME
HUM HOUMA-TERREBONNE LA Gulf
HUS HUGHES AK
HUT HUTCHINSON MUNI KS
HVN TWEED-NEW HAVEN CT NE N
HVR HAVRE CITY-COUNTY MT
HVS HARTSVILLE RGNL SC
HWD HAYWARD EXECUTIVE CA NCAl
HWI HAWK INLET AK
HYA BARNSTABLE MUNI-BOARDMAN/POLANDO FIELD MA NE N
HYG HYDABURG AK
HYL HOLLIS AK
HYS HAYS RGNL KS N
IAB MC CONNELL AFB KS
IAD WASHINGTON DULLES INTL DC NE L
IAG NIAGARA FALLS INTL NY
IAH GEORGE BUSH INTERCONTINENTAL/HOUSTON TX TX/Gulf L
IAN BOB BAKER MEMORIAL AK
ICT WICHITA MID-CONTINENT KS S
IDA IDAHO FALLS RGNL ID N
IDI INDIANA COUNTY/JIMMY STEWART FLD/ PA Mid
IDP INDEPENDENCE MUNI KS
IFP LAUGHLIN/BULLHEAD INTL AZ N
IGG IGIUGIG AK
IGM KINGMAN AZ
IKK GREATER KANKAKEE IL Mid
IKO NIKOLSKI AS AK
IKV ANKENY RGNL IA
ILE SKYLARK FIELD TX TX
ILG NEW CASTLE DE NE
ILI ILIAMNA AK
ILM WILMINGTON INTL NC N
ILN AIRBORNE AIRPARK OH Mid
IMT FORD MI
IND INDIANAPOLIS INTL IN Mid M
INL FALLS INTL MN N
INS CREECH AFB NV SCal
INT SMITH REYNOLDS NC Pied

222
Table A.1 (continued)
INW WINSLOW-LINDBERGH RGNL AZ
IPL IMPERIAL COUNTY CA SCal N
IPT WILLIAMSPORT RGNL PA N
IRK KIRKSVILLE RGNL MO
IRS KIRSCH MUNI MI Mid
ISM KISSIMMEE GATEWAY FL SFl
ISN SLOULIN FLD INTL ND
ISO KINSTON RGNL JETPORT AT STALLINGS FLD NC N
ISP LONG ISLAND MAC ARTHUR NY NE S
ISQ SCHOOLCRAFT COUNTY MI
ISW ALEXANDER FIELD SOUTH WOOD COUNTY WI Mid
ITH ITHACA TOMPKINS RGNL NY N
ITO HILO INTL HI S
IWD GOGEBIC-IRON COUNTY MI
IYK INYOKERN CA SCal N
JAC JACKSON HOLE WY N
JAN JACKSON-EVERS INTL MS S
JAX JACKSONVILLE INTL FL SFl M
JBR JONESBORO MUNI AR
JEF JEFFERSON CITY MEMORIAL MO
JFK JOHN F KENNEDY INTL NY NE L
JHM KAPALUA HI
JHW CHAUTAUQUA COUNTY/JAMESTOWN NY
JLA QUARTZ CREEK AK
JLN JOPLIN RGNL MO N
JMS JAMESTOWN RGNL ND
JNU JUNEAU INTL AK S
JQF CONCORD RGNL NC Pied
JRA WEST 30TH ST. NY NE
JRB PORT AUTH-DWNTN-MANHATTAN/WALL ST NY NE
JST JOHN MURTHA JOHNSTOWN-CAMBRIA CO PA Mid N
JVL SOUTHERN WISCONSIN RGNL WI Mid
JWN JOHN C TUNE TN
JXN JACKSON COUNTY-REYNOLDS FIELD MI Mid
JZI CHARLESTON EXECUTIVE SC
K01 FARINGTON FIELD NE
KAE KAKE AK
KAL KALTAG AK
KBE BELL ISLAND HOT SPRINGS AK
KCC COFFMAN COVE AK

223
Table A.1 (continued)
KCL CHIGNIK LAGOON AK
KCN CHERNOFSKI HARBOR AK
KCR COLORADO CREEK AK
KDK KODIAK MUNI AK
KEB NANWALEK AK
KEK EKWOK AK
KFP FALSE PASS AK
KGX GRAYLING AK
KIB IVANOF BAY AK
KKA KOYUK ALFRED ADAMS AK
KKB KITOI BAY AK
KKI AKIACHAK AK
KKL KARLUK LAKE AK
KKU EKUK AK
KLG KALSKAG AK
KMY MOSER BAY AK
KNB KANAB MUNI UT
KNW NEW STUYAHOK AK
KOA KONA INTL AT KEAHOLE HI S
KOY OLGA BAY AK
KPB POINT BAKER AK
KPC PORT CLARENCE CGS AK
KPR PORT WILLIAMS AK
KPY PORT BAILEY AK
KQA AKUTAN AK
KSM ST MARY'S AK N
KTB THORNE BAY AK
KTN KETCHIKAN INTL AK N
KTS BREVIG MISSION AK
KVC KING COVE AK
KVL KIVALINA AK
KWF WATERFALL AK
KWK KWIGILLINGOK AK
KWP WEST POINT VILLAGE AK
KWT KWETHLUK AK
KXA KASAAN AK
KYK KARLUK AK
KYU KOYUKUK AK
LAA LAMAR MUNI CO
LAF PURDUE UNIVERSITY IN Mid

224
Table A.1 (continued)
LAL LAKELAND LINDER RGNL FL SFl
LAM LOS ALAMOS NM FR
LAN CAPITAL CITY MI Mid N
LAR LARAMIE RGNL WY N
LAS MC CARRAN INTL NV SCal L
LAW LAWTON-FORT SILL RGNL OK N
LAX LOS ANGELES INTL CA SCal L
LBB LUBBOCK PRESTON SMITH INTL TX S
LBE ARNOLD PALMER RGNL PA Mid N
LBF NORTH PLATTE RGNL AIRPORT LEE BIRD FIELD NE
LBL LIBERAL MID-AMERICA RGNL KS
LCH LAKE CHARLES RGNL LA Gulf N
LCI LACONIA MUNI NH
LCK RICKENBACKER INTL OH Mid
LEB LEBANON MUNI NH N
LEE LEESBURG INTL FL SFl
LEW AUBURN/LEWISTON MUNI ME
LEX BLUE GRASS KY Mid S
LFI LANGLEY AFB VA
LFK ANGELINA COUNTY TX TX
LFT LAFAYETTE RGNL LA Gulf N
LGA LA GUARDIA NY NE L
LGB LONG BEACH /DAUGHERTY FIELD/ CA SCal S
LGC LAGRANGE-CALLAWAY GA
LGD LA GRANDE/UNION COUNTY OR
LGU LOGAN-CACHE UT
LHB HEARNE MUNI TX TX
LHQ FAIRFIELD COUNTY OH Mid
LHV WILLIAM T. PIPER MEMORIAL PA
LIH LIHUE HI S
LIT ADAMS FIELD AR S
LJN BRAZORIA COUNTY TX TX/Gulf
LKE KENMORE AIR HARBOR WA Casc
LKK KULIK LAKE AK
LKV LAKE COUNTY OR
LMT KLAMATH FALLS OR N
LNK LINCOLN NE N
LNS LANCASTER PA NE
LNY LANAI HI N
LOU BOWMAN FIELD KY Mid

225
Table A.1 (continued)
LOZ LONDON-CORBIN ARPT-MAGEE FLD KY
LPC LOMPOC CA SCal
LQK PICKENS COUNTY SC Pied
LRD LAREDO INTL TX N
LRF LITTLE ROCK AFB AR
LRU LAS CRUCES INTL NM
LSE LA CROSSE MUNI WI Mid N
LSF LAWSON AAF (FORT BENNING) GA
LSR LOST RIVER 1 AK
LSV NELLIS AFB NV SCal
LTS ALTUS AFB OK
LUF LUKE AFB AZ AZ
LUK CINCINNATI MUNI AIRPORT LUNKEN FIELD OH Mid
LUL HESLER-NOBLE FIELD MS
LUP KALAUPAPA HI
LUR CAPE LISBURNE LRRS AK
LVK LIVERMORE MUNI CA NCAl
LVM MISSION FIELD MT
LWB GREENBRIER VALLEY WV N
LWC LAWRENCE MUNI KS
LWM LAWRENCE MUNI MA NE
LWS LEWISTON-NEZ PERCE COUNTY ID N
LWT LEWISTOWN MUNI MT
LWV LAWRENCEVILLE-VINCENNES INTL IL
LXN JIM KELLY FIELD NE
LYH LYNCHBURG RGNL/PRESTON GLENN FLD VA N
LZU GWINNETT COUNTY - BRISCOE FIELD GA Pied
MAC MACON DOWNTOWN GA
MAE MADERA MUNI CA NCAl
MAF MIDLAND INTL TX S
MAW MALDEN MUNI MO
MAZ EUGENIO MARIA DE HOSTOS PR
MBL MANISTEE CO.-BLACKER MI
MBS MBS INTL MI Mid N
MCB MC COMB/PIKE COUNTY/JOHN E LEWIS FIELD MS
MCC MC CLELLAN AIRFIELD CA NCAl
MCD MACKINAC ISLAND MI
MCE MERCED MUNI/MACREADY FIELD CA NCAl
MCF MAC DILL AFB FL SFl
MCG MC GRATH AK
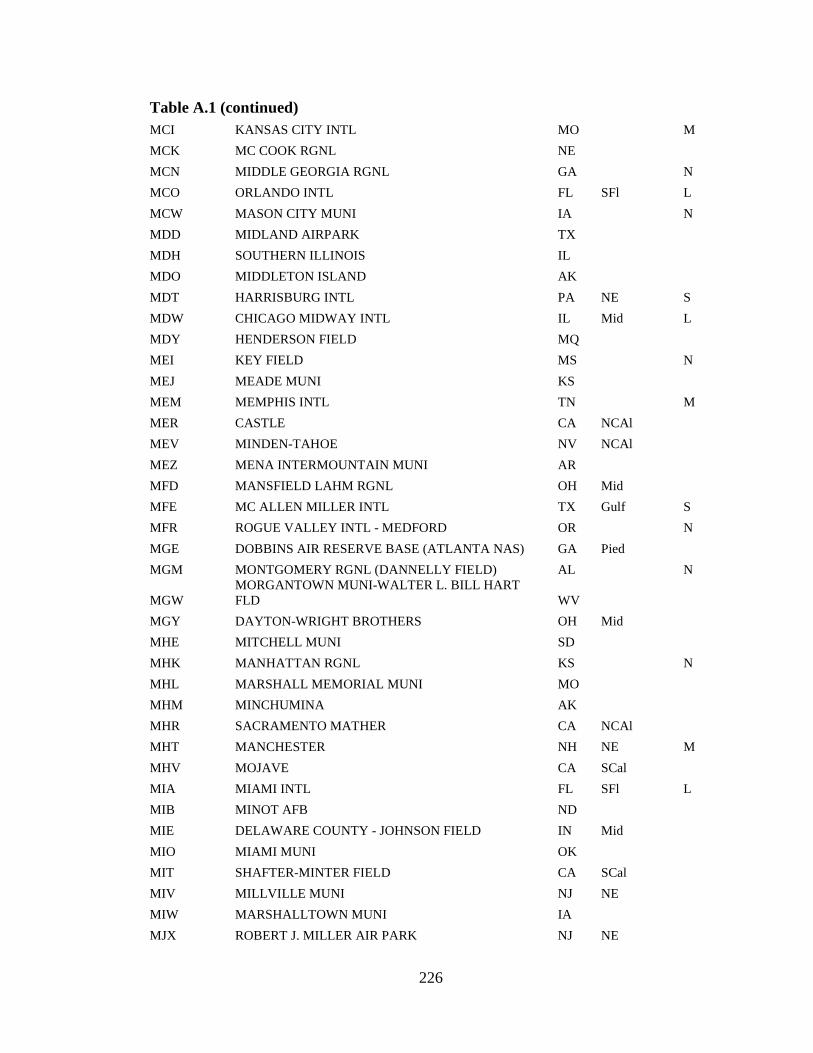
226
Table A.1 (continued)
MCI KANSAS CITY INTL MO M
MCK MC COOK RGNL NE
MCN MIDDLE GEORGIA RGNL GA N
MCO ORLANDO INTL FL SFl L
MCW MASON CITY MUNI IA N
MDD MIDLAND AIRPARK TX
MDH SOUTHERN ILLINOIS IL
MDO MIDDLETON ISLAND AK
MDT HARRISBURG INTL PA NE S
MDW CHICAGO MIDWAY INTL IL Mid L
MDY HENDERSON FIELD MQ
MEI KEY FIELD MS N
MEJ MEADE MUNI KS
MEM MEMPHIS INTL TN M
MER CASTLE CA NCAl
MEV MINDEN-TAHOE NV NCAl
MEZ MENA INTERMOUNTAIN MUNI AR
MFD MANSFIELD LAHM RGNL OH Mid
MFE MC ALLEN MILLER INTL TX Gulf S
MFR ROGUE VALLEY INTL - MEDFORD OR N
MGE DOBBINS AIR RESERVE BASE (ATLANTA NAS) GA Pied
MGM MONTGOMERY RGNL (DANNELLY FIELD) AL N
MGW MORGANTOWN MUNI-WALTER L. BILL HART FLD WV
MGY DAYTON-WRIGHT BROTHERS OH Mid
MHE MITCHELL MUNI SD
MHK MANHATTAN RGNL KS N
MHL MARSHALL MEMORIAL MUNI MO
MHM MINCHUMINA AK
MHR SACRAMENTO MATHER CA NCAl
MHT MANCHESTER NH NE M
MHV MOJAVE CA SCal
MIA MIAMI INTL FL SFl L
MIB MINOT AFB ND
MIE DELAWARE COUNTY - JOHNSON FIELD IN Mid
MIO MIAMI MUNI OK
MIT SHAFTER-MINTER FIELD CA SCal
MIV MILLVILLE MUNI NJ NE
MIW MARSHALLTOWN MUNI IA
MJX ROBERT J. MILLER AIR PARK NJ NE
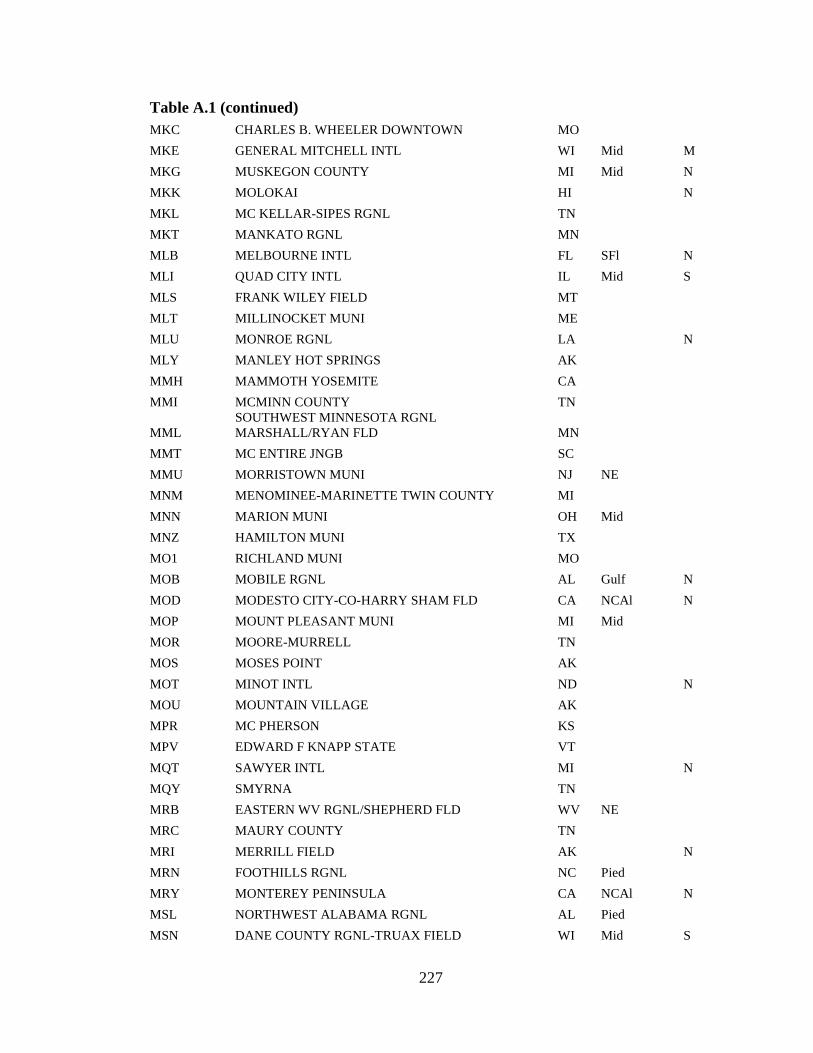
227
Table A.1 (continued)
MKC CHARLES B. WHEELER DOWNTOWN MO
MKE GENERAL MITCHELL INTL WI Mid M
MKG MUSKEGON COUNTY MI Mid N
MKK MOLOKAI HI N
MKL MC KELLAR-SIPES RGNL TN
MKT MANKATO RGNL MN
MLB MELBOURNE INTL FL SFl N
MLI QUAD CITY INTL IL Mid S
MLS FRANK WILEY FIELD MT
MLT MILLINOCKET MUNI ME
MLU MONROE RGNL LA N
MLY MANLEY HOT SPRINGS AK
MMH MAMMOTH YOSEMITE CA
MMI MCMINN COUNTY TN
MML SOUTHWEST MINNESOTA RGNL MARSHALL/RYAN FLD MN
MMT MC ENTIRE JNGB SC
MMU MORRISTOWN MUNI NJ NE
MNM MENOMINEE-MARINETTE TWIN COUNTY MI
MNN MARION MUNI OH Mid
MNZ HAMILTON MUNI TX
MO1 RICHLAND MUNI MO
MOB MOBILE RGNL AL Gulf N
MOD MODESTO CITY-CO-HARRY SHAM FLD CA NCAl N
MOP MOUNT PLEASANT MUNI MI Mid
MOR MOORE-MURRELL TN
MOS MOSES POINT AK
MOT MINOT INTL ND N
MOU MOUNTAIN VILLAGE AK
MPR MC PHERSON KS
MPV EDWARD F KNAPP STATE VT
MQT SAWYER INTL MI N
MQY SMYRNA TN
MRB EASTERN WV RGNL/SHEPHERD FLD WV NE
MRC MAURY COUNTY TN
MRI MERRILL FIELD AK N
MRN FOOTHILLS RGNL NC Pied
MRY MONTEREY PENINSULA CA NCAl N
MSL NORTHWEST ALABAMA RGNL AL Pied
MSN DANE COUNTY RGNL-TRUAX FIELD WI Mid S

228
Table A.1 (continued)
MSO MISSOULA INTL MT N
MSP MINNEAPOLIS-ST PAUL INTL/WOLD-CHAMBERLAIN MN Mid L
MSS MASSENA INTL-RICHARDS FIELD NY
MSV SULLIVAN COUNTY INTL NY NE
MSY LOUIS ARMSTRONG NEW ORLEANS INTL LA Gulf M
MTC SELFRIDGE ANGB MI Mid
MTH THE FLORIDA KEYS MARATHON FL SFl
MTJ MONTROSE RGNL CO N
MTM METLAKATLA AK
MTN MARTIN STATE MD NE
MTO COLES COUNTY MEMORIAL IL
MTP MONTAUK NY NE
MUE WAIMEA-KOHALA HI
MUO MOUNTAIN HOME AFB ID
MUT MUSCATINE MUNI IA
MVL MORRISVILLE-STOWE STATE VT
MVM MACHIAS VALLEY ME
MVN MOUNT VERNON IL
MVY MARTHAS VINEYARD MA NE N
MWA WILLIAMSON COUNTY RGNL IL N
MWH GRANT CO INTL WA
MWO HOOK FIELD MUNI OH Mid
MXF MAXWELL AFB AL
MYF MONTGOMERY FIELD CA SCal
MYK MAY CREEK AK
MYL MC CALL MUNI ID
MYR MYRTLE BEACH INTL SC S
MYU MEKORYUK AK
MZJ PINAL AIRPARK AZ AZ
MZZ MARION MUNI IN Mid
N47 POTTSTOWN MUNI PA NE
N87 TRENTON-ROBBINSVILLE NJ NE
NBG NEW ORLEANS NAS JRB/ALVIN CALLENDER FIELD/ LA Gulf
NEW LAKEFRONT LA Gulf
NFL FALLON NAS /VAN VOORHIS FLD/ NV
NGF KANEOHE BAY MCAF HI
NGP CORPUS CHRISTI NAS/TRUAX FIELD TX Gulf
NGU NORFOLK NS (CHAMBERS FLD) VA
NHK PATUXENT RIVER NAS/TRAPNELL FIELD/ MD NE
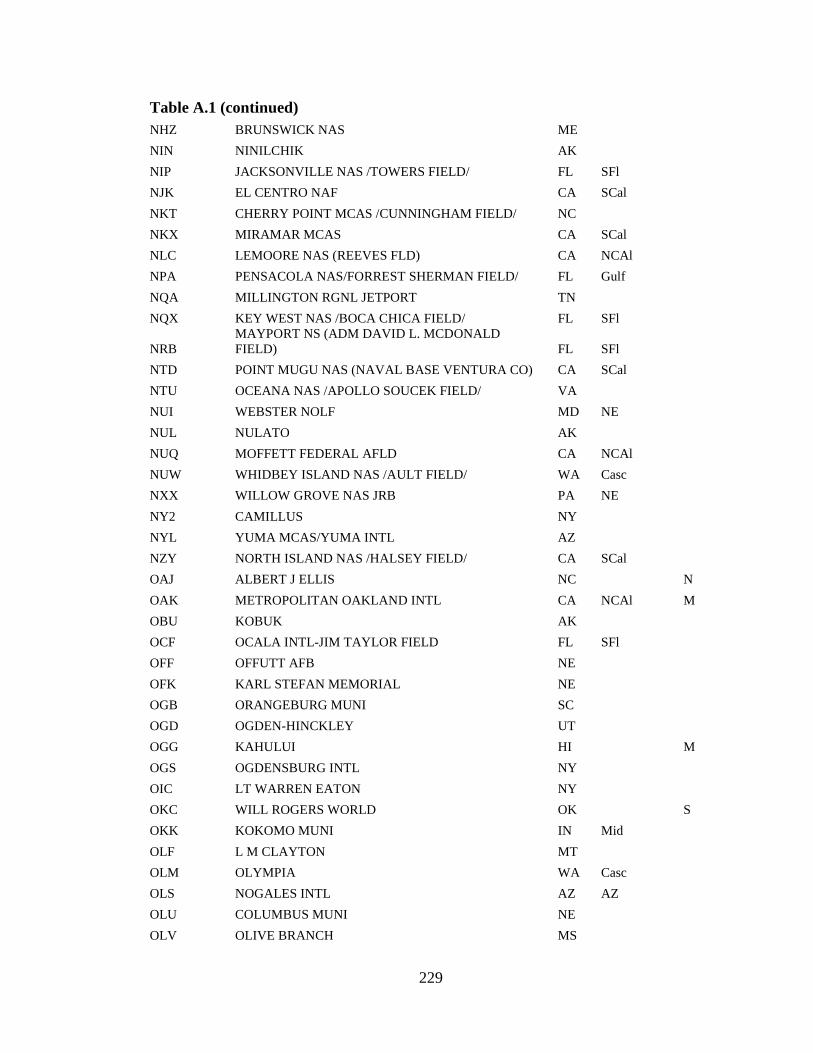
229
Table A.1 (continued)
NHZ BRUNSWICK NAS ME
NIN NINILCHIK AK
NIP JACKSONVILLE NAS /TOWERS FIELD/ FL SFl
NJK EL CENTRO NAF CA SCal
NKT CHERRY POINT MCAS /CUNNINGHAM FIELD/ NC
NKX MIRAMAR MCAS CA SCal
NLC LEMOORE NAS (REEVES FLD) CA NCAl
NPA PENSACOLA NAS/FORREST SHERMAN FIELD/ FL Gulf
NQA MILLINGTON RGNL JETPORT TN
NQX KEY WEST NAS /BOCA CHICA FIELD/ FL SFl
NRB MAYPORT NS (ADM DAVID L. MCDONALD FIELD) FL SFl
NTD POINT MUGU NAS (NAVAL BASE VENTURA CO) CA SCal
NTU OCEANA NAS /APOLLO SOUCEK FIELD/ VA
NUI WEBSTER NOLF MD NE
NUL NULATO AK
NUQ MOFFETT FEDERAL AFLD CA NCAl
NUW WHIDBEY ISLAND NAS /AULT FIELD/ WA Casc
NXX WILLOW GROVE NAS JRB PA NE
NY2 CAMILLUS NY
NYL YUMA MCAS/YUMA INTL AZ
NZY NORTH ISLAND NAS /HALSEY FIELD/ CA SCal
OAJ ALBERT J ELLIS NC N
OAK METROPOLITAN OAKLAND INTL CA NCAl M
OBU KOBUK AK
OCF OCALA INTL-JIM TAYLOR FIELD FL SFl
OFF OFFUTT AFB NE
OFK KARL STEFAN MEMORIAL NE
OGB ORANGEBURG MUNI SC
OGD OGDEN-HINCKLEY UT
OGG KAHULUI HI M
OGS OGDENSBURG INTL NY
OIC LT WARREN EATON NY
OKC WILL ROGERS WORLD OK S
OKK KOKOMO MUNI IN Mid
OLF L M CLAYTON MT
OLM OLYMPIA WA Casc
OLS NOGALES INTL AZ AZ
OLU COLUMBUS MUNI NE
OLV OLIVE BRANCH MS

230
Table A.1 (continued)
OMA EPPLEY AIRFIELD NE M
OME NOME AK N
OMK OMAK WA
ONA WINONA MUNI-MAX CONRAD FLD MN Mid
ONP NEWPORT MUNI OR Casc
ONT ONTARIO INTL CA SCal M
OOK TOKSOOK BAY AK
OPF OPA- LOCKA EXECUTIVE FL SFl
OQN BRANDYWINE PA NE
ORD CHICAGO O'HARE INTL IL Mid L
ORF NORFOLK INTL VA M
ORH WORCESTER RGNL MA NE N
ORI PORT LIONS AK
ORL EXECUTIVE FL SFl
ORT NORTHWAY AK
OSC OSCODA-WURTSMITH MI
OSH WITTMAN RGNL WI Mid
OSU OHIO STATE UNIVERSITY OH Mid
OTG WORTHINGTON MUNI MN
OTH SOUTHWEST OREGON RGNL OR N
OTM OTTUMWA INDUSTRIAL IA
OTZ RALPH WIEN MEMORIAL AK N
OUN UNIVERSITY OF OKLAHOMA WESTHEIMER OK
OWA OWATONNA DEGNER RGNL MN Mid
OWB OWENSBORO-DAVIESS COUNTY KY
OWD NORWOOD MEMORIAL MA NE
OXC WATERBURY-OXFORD CT NE
OXR OXNARD CA SCal N
PAE SNOHOMISH COUNTY (PAINE FLD) WA Casc
PAH BARKLEY RGNL KY N
PAK PORT ALLEN HI
PAM TYNDALL AFB FL
PAQ PALMER MUNI AK
PBF GRIDER FIELD AR
PBG PLATTSBURGH INTL NY
PBI PALM BEACH INTL FL SFl M
PCA PICACHO STAGEFIELD AZ AZ
PDK DEKALB-PEACHTREE GA Pied
PDT EASTERN OREGON RGNL AT PENDLETON OR
PDX PORTLAND INTL OR Casc M

231
Table A.1 (continued)
PEC PELICAN AK
PFN PANAMA CITY-BAY CO INTL FL N
PGA PAGE MUNI AZ N
PGD CHARLOTTE COUNTY FL SFl
PGL TRENT LOTT INTL MS Gulf
PGM PORT GRAHAM AK
PGV PITT-GREENVILLE NC N
PHD HARRY CLEVER FIELD OH Mid
PHF NEWPORT NEWS/WILLIAMSBURG INTL VA S
PHL PHILADELPHIA INTL PA NE L
PHN ST CLAIR COUNTY INTL MI Mid
PHO POINT HOPE AK
PHT HENRY COUNTY TN
PHX PHOENIX SKY HARBOR INTL AZ AZ L
PIA GREATER PEORIA RGNL IL Mid N
PIB HATTIESBURG-LAUREL RGNL MS N
PIE ST PETERSBURG-CLEARWATER INTL FL SFl N
PIH POCATELLO RGNL ID N
PIM HARRIS COUNTY GA
PIR PIERRE RGNL SD N
PIT PITTSBURGH INTL PA Mid M
PIZ POINT LAY LRRS AK
PKA NAPASKIAK AK
PKB MID-OHIO VALLEY RGNL WV
PKD PARK RAPIDS MUNI-KONSHOK FIELD MN
PLB CLINTON CO NY
PLK M. GRAHAM CLARK - TANEY COUNTY MO
PLN PELLSTON RGNL AIRPORT OF EMMET COUNTY MI N
PMB PEMBINA MUNI ND
PMD PALMDALE RGNL/USAF PLANT 42 CA SCal
PMH GREATER PORTSMOUTH RGNL OH Mid
PMU PANOLA COUNTY MS
PNC PONCA CITY RGNL OK
PNE NORTHEAST PHILADELPHIA PA NE
PNS PENSACOLA RGNL FL Gulf S
POB POPE AFB NC Pied
POC BRACKETT FIELD CA SCal
POU DUTCHESS COUNTY NY NE
POY POWELL MUNI WY
PPC PROSPECT CREEK AK
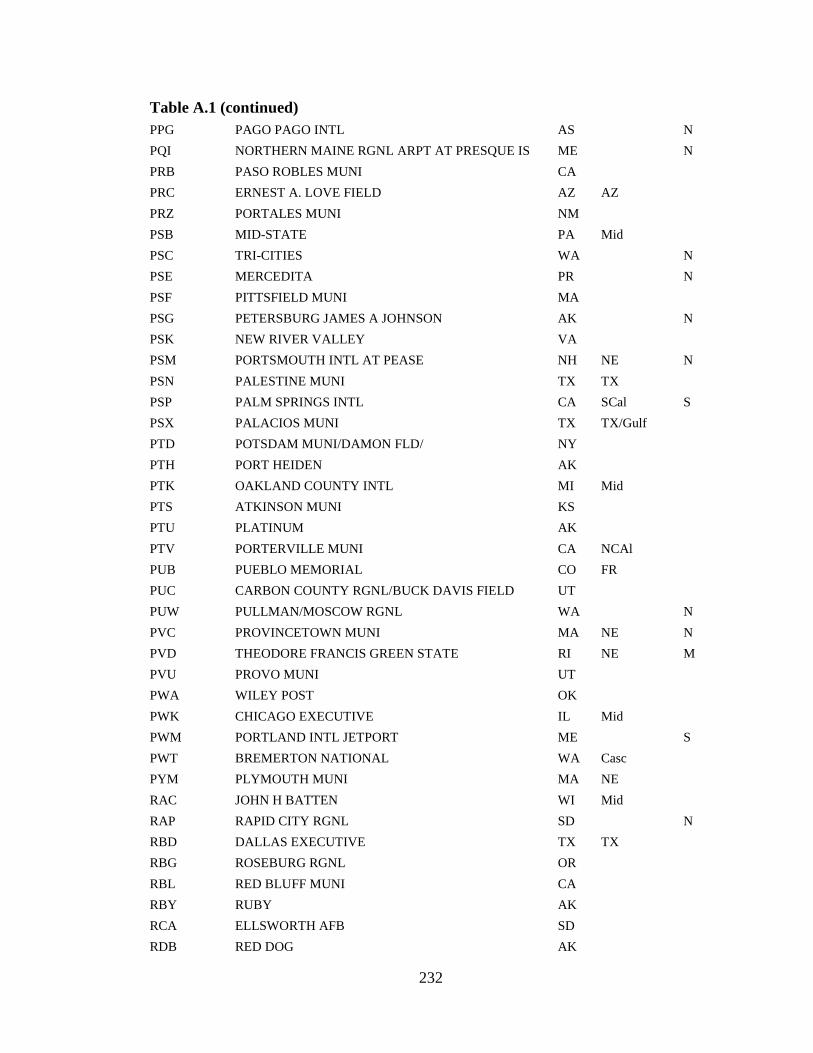
232
Table A.1 (continued)
PPG PAGO PAGO INTL AS N
PQI NORTHERN MAINE RGNL ARPT AT PRESQUE IS ME N
PRB PASO ROBLES MUNI CA
PRC ERNEST A. LOVE FIELD AZ AZ
PRZ PORTALES MUNI NM
PSB MID-STATE PA Mid
PSC TRI-CITIES WA N
PSE MERCEDITA PR N
PSF PITTSFIELD MUNI MA
PSG PETERSBURG JAMES A JOHNSON AK N
PSK NEW RIVER VALLEY VA
PSM PORTSMOUTH INTL AT PEASE NH NE N
PSN PALESTINE MUNI TX TX
PSP PALM SPRINGS INTL CA SCal S
PSX PALACIOS MUNI TX TX/Gulf
PTD POTSDAM MUNI/DAMON FLD/ NY
PTH PORT HEIDEN AK
PTK OAKLAND COUNTY INTL MI Mid
PTS ATKINSON MUNI KS
PTU PLATINUM AK
PTV PORTERVILLE MUNI CA NCAl
PUB PUEBLO MEMORIAL CO FR
PUC CARBON COUNTY RGNL/BUCK DAVIS FIELD UT
PUW PULLMAN/MOSCOW RGNL WA N
PVC PROVINCETOWN MUNI MA NE N
PVD THEODORE FRANCIS GREEN STATE RI NE M
PVU PROVO MUNI UT
PWA WILEY POST OK
PWK CHICAGO EXECUTIVE IL Mid
PWM PORTLAND INTL JETPORT ME S
PWT BREMERTON NATIONAL WA Casc
PYM PLYMOUTH MUNI MA NE
RAC JOHN H BATTEN WI Mid
RAP RAPID CITY RGNL SD N
RBD DALLAS EXECUTIVE TX TX
RBG ROSEBURG RGNL OR
RBL RED BLUFF MUNI CA
RBY RUBY AK
RCA ELLSWORTH AFB SD
RDB RED DOG AK
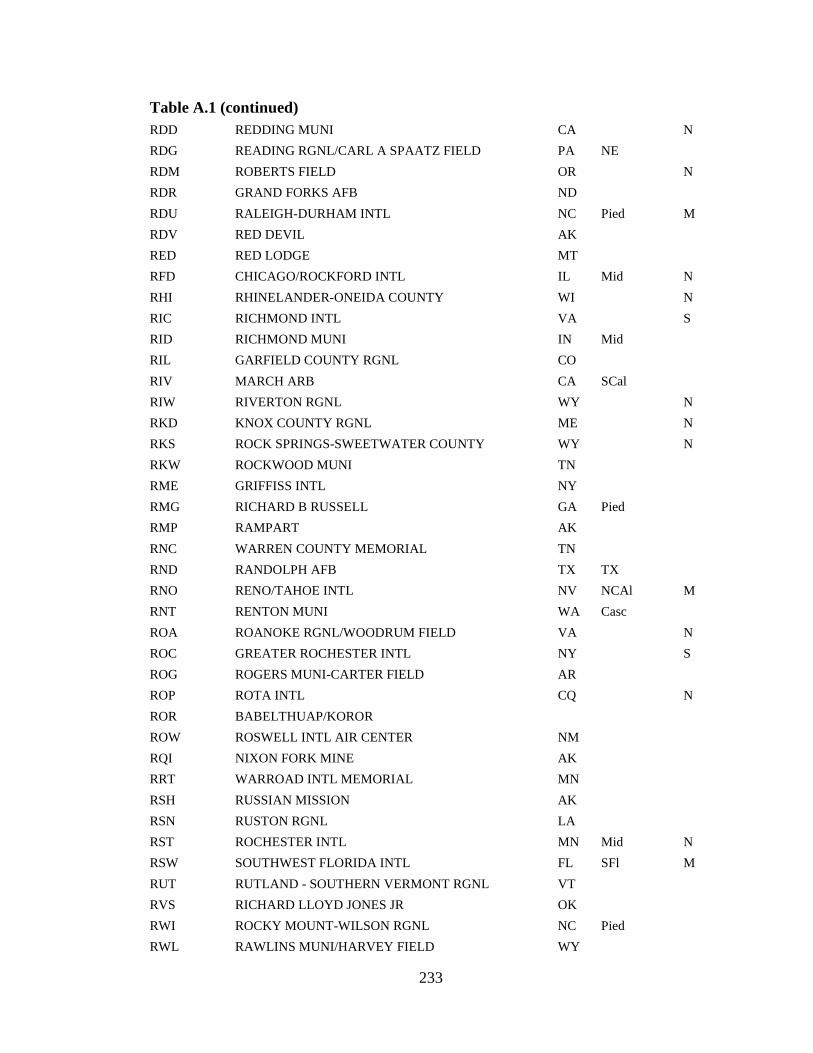
233
Table A.1 (continued)
RDD REDDING MUNI CA N
RDG READING RGNL/CARL A SPAATZ FIELD PA NE
RDM ROBERTS FIELD OR N
RDR GRAND FORKS AFB ND
RDU RALEIGH-DURHAM INTL NC Pied M
RDV RED DEVIL AK
RED RED LODGE MT
RFD CHICAGO/ROCKFORD INTL IL Mid N
RHI RHINELANDER-ONEIDA COUNTY WI N
RIC RICHMOND INTL VA S
RID RICHMOND MUNI IN Mid
RIL GARFIELD COUNTY RGNL CO
RIV MARCH ARB CA SCal
RIW RIVERTON RGNL WY N
RKD KNOX COUNTY RGNL ME N
RKS ROCK SPRINGS-SWEETWATER COUNTY WY N
RKW ROCKWOOD MUNI TN
RME GRIFFISS INTL NY
RMG RICHARD B RUSSELL GA Pied
RMP RAMPART AK
RNC WARREN COUNTY MEMORIAL TN
RND RANDOLPH AFB TX TX
RNO RENO/TAHOE INTL NV NCAl M
RNT RENTON MUNI WA Casc
ROA ROANOKE RGNL/WOODRUM FIELD VA N
ROC GREATER ROCHESTER INTL NY S
ROG ROGERS MUNI-CARTER FIELD AR
ROP ROTA INTL CQ N
ROR BABELTHUAP/KOROR
ROW ROSWELL INTL AIR CENTER NM
RQI NIXON FORK MINE AK
RRT WARROAD INTL MEMORIAL MN
RSH RUSSIAN MISSION AK
RSN RUSTON RGNL LA
RST ROCHESTER INTL MN Mid N
RSW SOUTHWEST FLORIDA INTL FL SFl M
RUT RUTLAND - SOUTHERN VERMONT RGNL VT
RVS RICHARD LLOYD JONES JR OK
RWI ROCKY MOUNT-WILSON RGNL NC Pied
RWL RAWLINS MUNI/HARVEY FIELD WY

234
Table A.1 (continued)
SAA SHIVELY FIELD WY
SAC SACRAMENTO EXECUTIVE CA NCAl
SAD SAFFORD RGNL AZ AZ
SAF SANTA FE MUNI NM FR
SAN SAN DIEGO INTL CA SCal L
SAT SAN ANTONIO INTL TX TX M
SAV SAVANNAH/HILTON HEAD INTL GA S
SBA SANTA BARBARA MUNI CA SCal S
SBD SAN BERNARDINO INTL CA SCal
SBM SHEBOYGAN COUNTY MEMORIAL WI Mid
SBN SOUTH BEND RGNL IN Mid S
SBO EMANUEL COUNTY GA
SBP SAN LUIS COUNTY RGNL CA N
SBY SALISBURY-OCEAN CITY WICOMICO RGNL MD N
SCC DEADHORSE AK N
SCE UNIVERSITY PARK PA Mid N
SCH SCHENECTADY COUNTY NY
SCK STOCKTON METROPOLITAN CA NCAl N
SCM SCAMMON BAY AK
SDF LOUISVILLE INTL-STANDIFORD FIELD KY Mid S
SDM BROWN FIELD MUNI CA SCal
SDP SAND POINT AK
SDY SIDNEY-RICHLAND MUNI MT
SEA SEATTLE-TACOMA INTL WA Casc L
SEE GILLESPIE FIELD CA SCal
SEF SEBRING RGNL FL SFl
SEM CRAIG FIELD AL
SER FREEMAN MUNI IN Mid
SFB ORLANDO SANFORD INTL FL SFl S
SFF FELTS FIELD WA
SFM SANFORD RGNL ME NE
SFO SAN FRANCISCO INTL CA NCAl L
SFZ NORTH CENTRAL STATE RI NE
SGF SPRINGFIELD-BRANSON NATIONAL MO S
SGH SPRINGFIELD-BECKLEY MUNI OH Mid
SGR SUGAR LAND RGNL TX TX/Gulf
SGU ST GEORGE MUNI UT N
SGY SKAGWAY AK
SHD SHENANDOAH VALLEY RGNL VA
SHG SHUNGNAK AK

235
Table A.1 (continued)
SHH SHISHMAREF AK
SHN SANDERSON FIELD WA Casc
SHR SHERIDAN COUNTY WY N
SHV SHREVEPORT RGNL LA N
SHX SHAGELUK AK
SIG FERNANDO LUIS RIBAS DOMINICCI PR
SIK SIKESTON MEMORIAL MUNI MO
SIT SITKA ROCKY GUTIERREZ AK N
SJC NORMAN Y. MINETA SAN JOSE INTL CA NCAl M
SJN ST JOHNS INDUSTRIAL AIR PARK AZ
SJT SAN ANGELO RGNL/MATHIS FIELD TX N
SJU LUIS MUNOZ MARIN INTL PR M
SKA FAIRCHILD AFB WA
SKF LACKLAND AFB (KELLY FLD ANNEX) TX TX
SKW SKWENTNA AK
SKY GRIFFING SANDUSKY OH Mid
SLB STORM LAKE MUNI IA
SLC SALT LAKE CITY INTL UT L
SLE MCNARY FLD OR Casc
SLJ HAGLER AAF MS
SLK ADIRONDACK RGNL NY
SLN SALINA MUNI KS
SLO SALEM-LECKRONE IL
SLQ SLEETMUTE AK
SME LAKE CUMBERLAND RGNL KY
SMF SACRAMENTO INTL CA NCAl M
SMK ST MICHAEL AK
SMN LEMHI COUNTY ID
SMO SANTA MONICA MUNI CA SCal
SMX SANTA MARIA PUB/CAPT G ALLAN HANCOCK FLD CA SCal N
SNA JOHN WAYNE AIRPORT-ORANGE COUNTY CA SCal M
SNL SHAWNEE RGNL OK
SNP ST PAUL ISLAND AK
SNS SALINAS MUNI CA NCAl
SNY SIDNEY MUNI/LLOYD W. CARR FIELD NE
SOP MOORE COUNTY NC Pied
SOV SELDOVIA AK
SOW SHOW LOW RGNL AZ
SPA SPARTANBURG DOWNTOWN MEMORIAL SC Pied
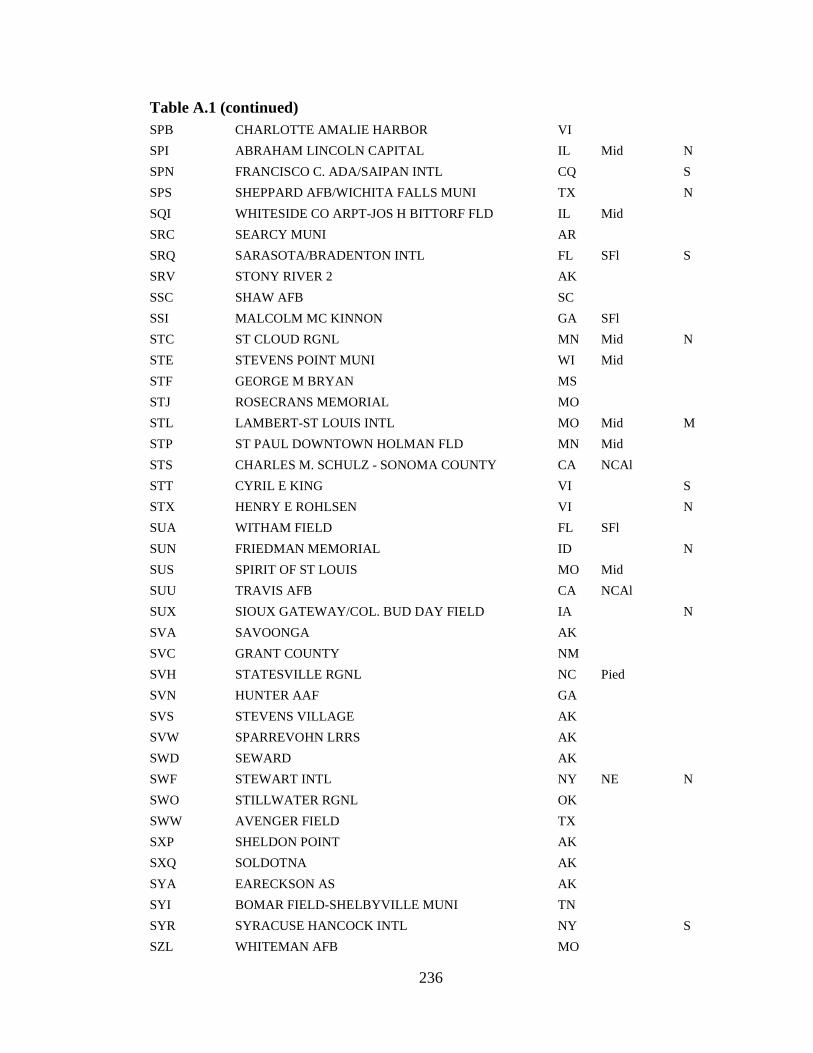
236
Table A.1 (continued)
SPB CHARLOTTE AMALIE HARBOR VI
SPI ABRAHAM LINCOLN CAPITAL IL Mid N
SPN FRANCISCO C. ADA/SAIPAN INTL CQ S
SPS SHEPPARD AFB/WICHITA FALLS MUNI TX N
SQI WHITESIDE CO ARPT-JOS H BITTORF FLD IL Mid
SRC SEARCY MUNI AR
SRQ SARASOTA/BRADENTON INTL FL SFl S
SRV STONY RIVER 2 AK
SSC SHAW AFB SC
SSI MALCOLM MC KINNON GA SFl
STC ST CLOUD RGNL MN Mid N
STE STEVENS POINT MUNI WI Mid
STF GEORGE M BRYAN MS
STJ ROSECRANS MEMORIAL MO
STL LAMBERT-ST LOUIS INTL MO Mid M
STP ST PAUL DOWNTOWN HOLMAN FLD MN Mid
STS CHARLES M. SCHULZ - SONOMA COUNTY CA NCAl
STT CYRIL E KING VI S
STX HENRY E ROHLSEN VI N
SUA WITHAM FIELD FL SFl
SUN FRIEDMAN MEMORIAL ID N
SUS SPIRIT OF ST LOUIS MO Mid
SUU TRAVIS AFB CA NCAl
SUX SIOUX GATEWAY/COL. BUD DAY FIELD IA N
SVA SAVOONGA AK
SVC GRANT COUNTY NM
SVH STATESVILLE RGNL NC Pied
SVN HUNTER AAF GA
SVS STEVENS VILLAGE AK
SVW SPARREVOHN LRRS AK
SWD SEWARD AK
SWF STEWART INTL NY NE N
SWO STILLWATER RGNL OK
SWW AVENGER FIELD TX
SXP SHELDON POINT AK
SXQ SOLDOTNA AK
SYA EARECKSON AS AK
SYI BOMAR FIELD-SHELBYVILLE MUNI TN
SYR SYRACUSE HANCOCK INTL NY S
SZL WHITEMAN AFB MO

237
Table A.1 (continued)
TAL RALPH M CALHOUN MEMORIAL AK
TBN WAYNESVILLE-ST. ROBERT RGNL MO
TBR STATESBORO-BULLOCH COUNTY GA
TCL TUSCALOOSA RGNL AL Pied
TCM MCCHORD AFB WA Casc
TCT TAKOTNA AK
TDF PERSON COUNTY NC Pied
TDW TRADEWIND TX
TDZ METCALF FIELD OH Mid
TEB TETERBORO NJ NE N
TEX TELLURIDE RGNL CO N
THA TULLAHOMA RGNL ARPT/WM NORTHERN FIELD TN
THV YORK PA NE
TIK TINKER AFB OK
TIW TACOMA NARROWS WA Casc
TIX SPACE COAST RGNL FL SFl
TKA TALKEETNA AK
TKE TENAKEE AK
TKI COLLIN COUNTY RGNL AT MC KINNEY TX TX
TKL TAKU LODGE AK
TLH TALLAHASSEE RGNL FL S
TLJ TATALINA LRRS AK
TLR MEFFORD FIELD CA NCAl
TLT TULUKSAK AK
TMA HENRY TIFT MYERS GA
TMB KENDALL-TAMIAMI EXECUTIVE FL SFl
TNC TIN CITY LRRS AK
TNP TWENTYNINE PALMS CA SCal
TNT DADE-COLLIER TRAINING AND TRANSITION FL SFl
TOA ZAMPERINI FIELD CA SCal
TOG TOGIAK AK
TOL TOLEDO EXPRESS OH Mid N
TOR TORRINGTON MUNI WY
TPA TAMPA INTL FL SFl L
TPH TONOPAH NV
TPL DRAUGHON-MILLER CENTRAL TEXAS RGNL TX TX
TPO PORT ALSWORTH AK
TRI TRI-CITIES RGNL TN/VA TN N
TRM JACQUELINE COCHRAN RGNL CA SCal
TSG TANACROSS AK

238
Table A.1 (continued)
TSP TEHACHAPI MUNI CA SCal
TTN TRENTON MERCER NJ NE N
TUL TULSA INTL OK S
TUP TUPELO RGNL MS N
TUS TUCSON INTL AZ AZ M
TVC CHERRY CAPITAL MI N
TVF THIEF RIVER FALLS RGNL MN
TVL LAKE TAHOE CA NCAl
TWF JOSLIN FIELD - MAGIC VALLEY RGNL ID N
TXK TEXARKANA RGNL-WEBB FIELD AR N
TYE TYONEK AK
TYR TYLER POUNDS RGNL TX TX N
TYS MC GHEE TYSON TN S
UAM ANDERSEN AFB GU
UBS COLUMBUS-LOWNDES COUNTY MS
UCY EVERETT-STEWART RGNL TN
UDD BERMUDA DUNES CA SCal
UDG DARLINGTON COUNTY JETPORT SC
UES WAUKESHA COUNTY WI Mid
UGB UGASHIK BAY AK
UGN WAUKEGAN RGNL IL Mid
UIN QUINCY RGNL-BALDWIN FIELD IL
UKI UKIAH MUNI CA
ULS ULYSSES KS
UMT UMIAT AK
UNK UNALAKLEET AK N
UOX UNIVERSITY-OXFORD MS
UST ST AUGUSTINE FL SFl
UTO INDIAN MOUNTAIN LRRS AK
UVA GARNER FIELD TX TX
UXL SOUTHLAND FIELD LA Gulf
VAD MOODY AFB GA
VAK CHEVAK AK
VBG VANDENBERG AFB CA SCal
VCB NUT TREE CA NCAl
VCT VICTORIA RGNL TX Gulf
VCV SOUTHERN CALIFORNIA LOGISTICS CA SCal
VDZ VALDEZ PIONEER FIELD AK N
VEE VENETIE AK
VEL VERNAL RGNL UT

239
Table A.1 (continued)
VGT NORTH LAS VEGAS NV SCal N
VIH ROLLA NATIONAL MO
VIS VISALIA MUNI CA NCAl
VLD VALDOSTA RGNL GA N
VNC VENICE MUNI FL SFl
VNY VAN NUYS CA SCal
VOK VOLK FIELD WI
VPC CARTERSVILLE GA Pied
VPS EGLIN AFB FL Gulf N
VPZ PORTER COUNTY MUNI IN Mid
VQS ANTONIO RIVERA RODRIGUEZ PR N
VRB VERO BEACH MUNI FL SFl
VUJ STANLY COUNTY NC Pied
VYS ILLINOIS VALLEY RGNL-WALTER A DUNCAN FIELD IL Mid
WBB STEBBINS AK
WBQ BEAVER AK
WCR CHANDALAR LAKE AK
WDG ENID WOODRING RGNL OK
WDR NORTHEAST GEORGIA REGIONAL GA Pied
WFB KETCHIKAN HARBOR AK
WJF GENERAL WM J FOX AIRFIELD CA SCal
WLK SELAWIK AK
WMO WHITE MOUNTAIN AK
WNA NAPAKIAK AK
WRB ROBINS AFB GA
WRG WRANGELL AK N
WRI MC GUIRE AFB NJ NE
WRL WORLAND MUNI WY
WSM WISEMAN AK
WSN SOUTH NAKNEK NR 2 AK
WST WESTERLY STATE RI NE
WTK NOATAK AK
WVI WATSONVILLE MUNI CA NCAl
WVL WATERVILLE ROBERT LAFLEUR ME
WWD CAPE MAY COUNTY NJ NE
WWR WEST WOODWARD OK
WWT NEWTOK AK
WYS YELLOWSTONE MT
XMR CAPE CANAVERAL AFS SKID STRIP FL SFl

240
Table A.1 (continued)
XNA NORTHWEST ARKANSAS RGNL AR S
YAK YAKUTAT AK N
YIP WILLOW RUN MI Mid
YKM YAKIMA AIR TERMINAL/MCALLISTER FIELD WA Casc N
YKN CHAN GURNEY MUNI SD
YNG YOUNGSTOWN-WARREN RGNL OH Mid N
ZNC NYAC AK
ZZV ZANESVILLE MUNI OH Mid

241
Table A.2: U.S. Airline Hubs
Airport Passenger
Hub Focus City Former Hub Freight
Hub AFW FX ANC AS FX ATL DL, FL TW* BDL 5X BNA AA BOS AA, B6, FL BWI FL, WN US CAE 5X CLE CO UA CLT US CVG DL DAL WN DAY US DCA US DEN UA WN CO DFW AA DL 5X DTW DL NW* EWR CO FX FLL B6, FL GSO CO HOU WN IAD UA IAH CO IND FL FX JFK AA, B6, DL TW* LAS WN US LAX AA, UA AS, WN CO, DL, TW* LGA AA, FL LGB B6 MCI TW*, US MCO FL B6, WN DL MDW WN MEM DL NW* FX MIA AA UA 5X, FX MKE FL MSP DL NW*
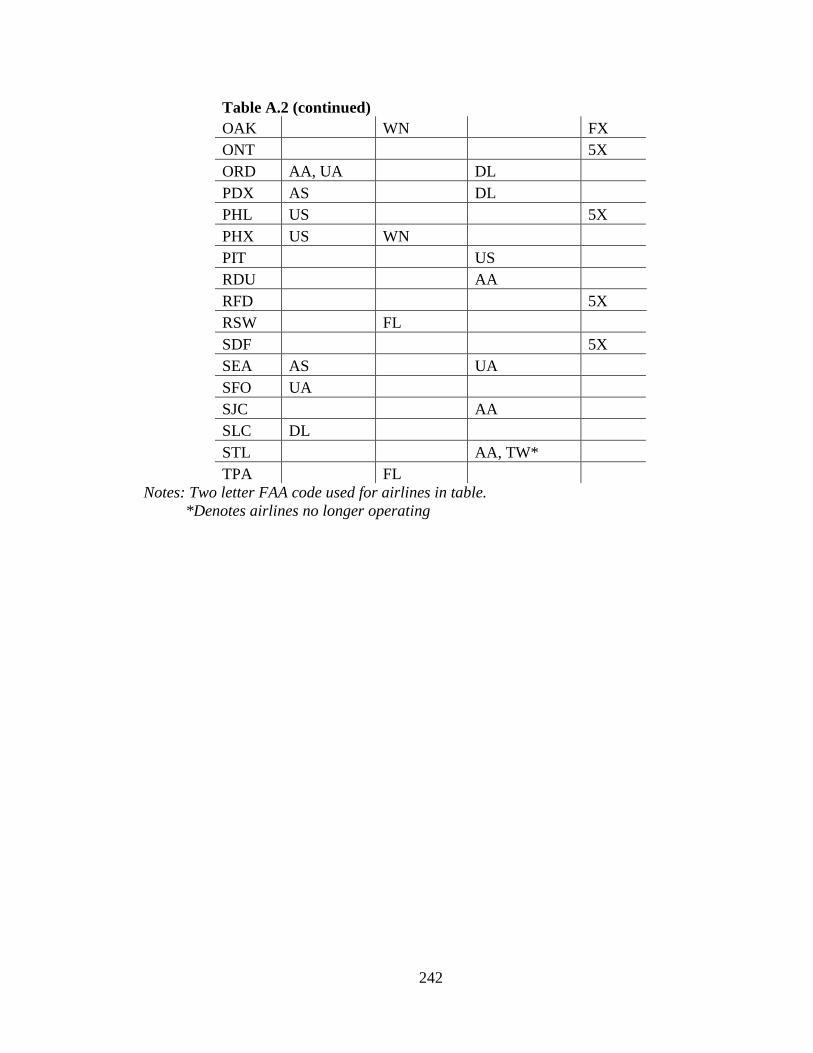
242
Table A.2 (continued)
OAK WN FX ONT 5X ORD AA, UA DL PDX AS DL PHL US 5X PHX US WN PIT US RDU AA RFD 5X RSW FL SDF 5X SEA AS UA SFO UA SJC AA SLC DL STL AA, TW* TPA FL
Notes: Two letter FAA code used for airlines in table. *Denotes airlines no longer operating

243
APPENDIX B
MEGARGION FLOW TABLES
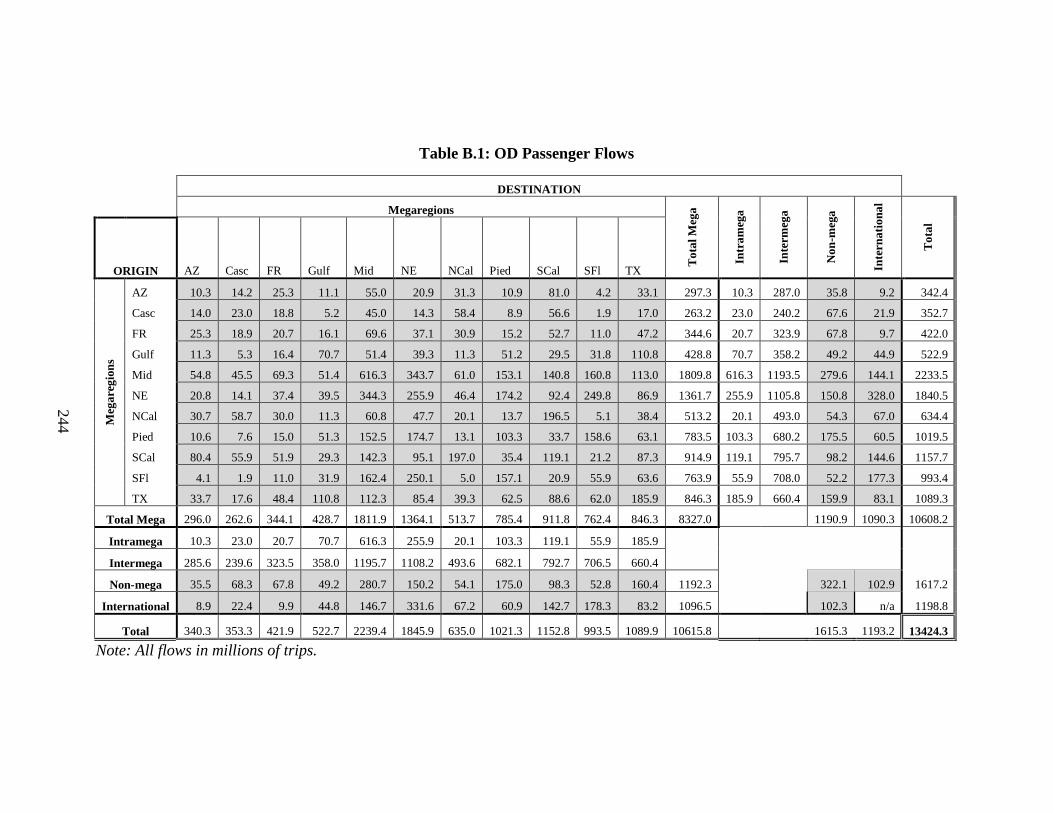
244
Table B.1: OD Passenger Flows
DESTINATION
Megaregions
Tot
al M
ega
Intr
ameg
a
Inte
rmeg
a
Non
-meg
a
Inte
rnat
iona
l
Tot
al
ORIGIN AZ Casc FR Gulf Mid NE NCal Pied SCal SFl TX
Meg
areg
ions
AZ 10.3 14.2 25.3 11.1 55.0 20.9 31.3 10.9 81.0 4.2 33.1 297.3 10.3 287.0 35.8 9.2 342.4
Casc 14.0 23.0 18.8 5.2 45.0 14.3 58.4 8.9 56.6 1.9 17.0 263.2 23.0 240.2 67.6 21.9 352.7
FR 25.3 18.9 20.7 16.1 69.6 37.1 30.9 15.2 52.7 11.0 47.2 344.6 20.7 323.9 67.8 9.7 422.0
Gulf 11.3 5.3 16.4 70.7 51.4 39.3 11.3 51.2 29.5 31.8 110.8 428.8 70.7 358.2 49.2 44.9 522.9
Mid 54.8 45.5 69.3 51.4 616.3 343.7 61.0 153.1 140.8 160.8 113.0 1809.8 616.3 1193.5 279.6 144.1 2233.5
NE 20.8 14.1 37.4 39.5 344.3 255.9 46.4 174.2 92.4 249.8 86.9 1361.7 255.9 1105.8 150.8 328.0 1840.5
NCal 30.7 58.7 30.0 11.3 60.8 47.7 20.1 13.7 196.5 5.1 38.4 513.2 20.1 493.0 54.3 67.0 634.4
Pied 10.6 7.6 15.0 51.3 152.5 174.7 13.1 103.3 33.7 158.6 63.1 783.5 103.3 680.2 175.5 60.5 1019.5
SCal 80.4 55.9 51.9 29.3 142.3 95.1 197.0 35.4 119.1 21.2 87.3 914.9 119.1 795.7 98.2 144.6 1157.7
SFl 4.1 1.9 11.0 31.9 162.4 250.1 5.0 157.1 20.9 55.9 63.6 763.9 55.9 708.0 52.2 177.3 993.4
TX 33.7 17.6 48.4 110.8 112.3 85.4 39.3 62.5 88.6 62.0 185.9 846.3 185.9 660.4 159.9 83.1 1089.3
Total Mega 296.0 262.6 344.1 428.7 1811.9 1364.1 513.7 785.4 911.8 762.4 846.3 8327.0 1190.9 1090.3 10608.2
Intramega 10.3 23.0 20.7 70.7 616.3 255.9 20.1 103.3 119.1 55.9 185.9
Intermega 285.6 239.6 323.5 358.0 1195.7 1108.2 493.6 682.1 792.7 706.5 660.4
Non-mega 35.5 68.3 67.8 49.2 280.7 150.2 54.1 175.0 98.3 52.8 160.4 1192.3 322.1 102.9 1617.2
International 8.9 22.4 9.9 44.8 146.7 331.6 67.2 60.9 142.7 178.3 83.2 1096.5 102.3 n/a 1198.8
Total 340.3 353.3 421.9 522.7 2239.4 1845.9 635.0 1021.3 1152.8 993.5 1089.9 10615.8 1615.3 1193.2 13424.3
Note: All flows in millions of trips.
244

245
Table B.2: Combined OD Passenger Flows
AZ Casc FR Gulf Mid NE NCal Pied SCal SFl TX Non-mega
Inter-national
AZ 10.3 28.2 50.6 22.3 109.9 41.7 62.0 21.4 161.4 8.4 66.8 71.3 18.1 Casc 28.2 23.0 37.7 10.5 90.5 28.4 117.1 16.5 112.5 3.8 34.6 135.9 44.3 FR 50.6 37.7 20.7 32.5 138.9 74.6 60.9 30.2 104.6 22.0 95.6 135.6 19.5 Gulf 22.3 10.5 32.5 70.7 102.8 78.8 22.6 102.5 58.8 63.7 221.6 98.4 89.6 Mid 109.9 90.5 138.9 102.8 616.3 688.0 121.8 305.6 283.1 323.3 225.3 560.4 290.8 NE 41.7 28.4 74.6 78.8 688.0 255.9 94.1 348.9 187.5 499.9 172.3 301.0 659.6 NCal 62.0 117.1 60.9 22.6 121.8 94.1 20.1 26.8 393.5 10.1 77.7 108.4 134.2 Pied 21.4 16.5 30.2 102.5 305.6 348.9 26.8 103.3 69.1 315.7 125.6 350.5 121.3 SCal 161.4 112.5 104.6 58.8 283.1 187.5 393.5 69.1 119.1 42.1 175.8 196.5 287.3 SFl 8.4 3.8 22.0 63.7 323.3 499.9 10.1 315.7 42.1 55.9 125.6 104.9 355.7 TX 66.8 34.6 95.6 221.6 225.3 172.3 77.7 125.6 175.8 125.6 185.9 320.3 166.3 Non-mega 71.3 135.9 135.6 98.4 560.4 301.0 108.4 350.5 196.5 104.9 320.3 322.1 205.2 Inter-national 18.1 44.3 19.5 89.6 290.8 659.6 134.2 121.3 287.3 355.7 166.3 205.2 n/a
Note: All flows in millions of trips.
245

246
Table B.3: OD Freight Flows
DESTINATION
Megaregion
Tot
al M
ega
Intr
ameg
a
Inte
rmeg
a
Non
-meg
a
Inte
rnat
iona
l
Tot
al
ORIGIN AZ Casc FR Gulf Mid NE NCal Pied SCal SFl TX
Meg
areg
ion
AZ 5.4 5.7 16.7 2.8 72.7 8.9 24.0 4.4 36.9 1.6 12.9 192.1 5.4 186.7 66.7 8.3 267.1
Casc 6.2 29.9 16.4 4.2 164.0 22.4 60.8 26.8 50.9 4.7 12.5 398.8 29.9 368.9 187.2 210.5 796.6
FR 15.5 11.3 5.5 4.8 118.5 19.4 37.4 5.0 47.2 2.5 11.3 278.3 5.5 272.8 86.1 13.6 378.0
Gulf 3.6 2.5 7.3 21.7 94.7 36.9 6.7 16.2 23.5 13.9 47.9 274.7 21.7 253.0 91.3 276.5 642.5
Mid 99.6 176.7 156.3 110.8 1010.2 815.2 241.5 246.2 402.4 236.7 329.7 3825.2 1010.2 2815.1 1149.0 1736.6 6710.8
NE 10.4 12.4 28.2 27.7 722.0 153.1 132.7 103.4 190.3 102.2 83.2 1565.6 153.1 1412.5 559.3 2996.5 5121.4
NCal 28.7 83.3 42.7 7.4 248.6 154.5 31.6 19.7 123.9 10.8 52.7 803.8 31.6 772.2 317.6 596.0 1717.4
Pied 5.7 15.9 5.4 16.3 236.2 91.5 14.5 30.3 40.9 77.9 46.0 580.6 30.3 550.3 234.9 553.8 1369.3
SCal 48.9 60.8 44.1 23.7 445.8 284.7 124.3 53.0 38.9 42.5 119.6 1286.3 38.9 1247.5 562.2 1386.4 3234.9
SFl 1.8 4.3 5.6 19.2 193.2 145.5 15.4 86.5 49.1 39.6 63.9 624.1 39.6 584.5 277.8 2404.0 3306.0
TX 16.0 11.7 24.5 53.2 284.1 71.3 49.5 41.7 105.2 70.0 87.4 814.7 87.4 727.3 258.4 576.2 1649.3 Total Mega 241.8 414.5 352.5 291.8 3590.0 1803.3 738.5 633.1 1109.1 602.5 867.0 10644.3 3790.8 10758.3 25193.3
Intra-mega 5.4 29.9 5.5 21.7 1010.2 153.1 31.6 30.3 38.9 39.6 87.4 Inter-mega 236.4 384.5 347.0 270.1 2579.9 1650.3 706.9 602.8 1070.3 562.9 779.6
Non-mega 67.6 194.2 106.2 128.7 1254.9 564.5 282.6 237.4 580.0 310.8 292.6 4019.4 1534.2 1218.0 6771.6 Inter-
national 8.7 159.1 15.1 214.5 2130.6 3862.7 740.1 665.1 1923.7 2753.9 588.0 13061.5 1844.0 n/a 14905.5
Total 318.0 767.8 473.9 635.0 6975.6 6230.6 1761.3 1535.6 3612.8 3667.2 1747.6 27725.2 7169.0 11976.3 46870.5
Note: All flows in ten million pounds of freight.
246

247
Table B.4: Combined OD Freight Flows
AZ Casc FR Gulf Mid NE NCal Pied SCal SFl TX Non-mega
Inter-national
AZ 5.4 11.9 32.2 6.4 172.4 19.3 52.7 10.1 85.8 3.4 28.9 134.3 17.0 Casc 11.9 29.9 27.7 6.7 340.7 34.8 144.1 42.7 111.7 9.0 24.1 381.4 369.6 FR 32.2 27.7 5.5 12.0 274.8 47.5 80.0 10.3 91.3 8.1 35.8 192.3 28.7 Gulf 6.4 6.7 12.0 21.7 205.5 64.6 14.1 32.4 47.2 33.1 101.1 220.0 491.0 Mid 172.4 340.7 274.8 205.5 1010.2 1537.2 490.2 482.4 848.2 429.9 613.8 2403.9 3867.2 NE 19.3 34.8 47.5 64.6 1537.2 153.1 287.2 194.9 475.0 247.8 154.5 1123.8 6859.2 NCal 52.7 144.1 80.0 14.1 490.2 287.2 31.6 34.2 248.3 26.2 102.2 600.2 1336.1 Pied 10.1 42.7 10.3 32.4 482.4 194.9 34.2 30.3 93.9 164.4 87.7 472.3 1218.9 SCal 85.8 111.7 91.3 47.2 848.2 475.0 248.3 93.9 38.9 91.6 224.9 1142.2 3310.0 SFl 3.4 9.0 8.1 33.1 429.9 247.8 26.2 164.4 91.6 39.6 133.9 588.6 5157.9
TX 28.9 24.1 35.8 101.1 613.8 154.5 102.2 87.7 224.9 133.9 87.4 551.0 1164.2 Non-mega 134.3 381.4 192.3 220.0 2403.9 1123.8 600.2 472.3 1142.2 588.6 551.0 1534.2 3062.0 Inter-national 17.0 369.6 28.7 491.0 3867.2 6859.2 1336.1 1218.9 3310.0 5157.9 1164.2 3062.0 n/a
Note: All flows in ten million pounds of freight.
247

248
Table B.5: Combined OD Passenger Flows by Area
AZ Casc FR Gulf Mid NE NCal Pied SCal SFl TX Non-Mega
AZ 211.7 293.4 479.1 209.6 432.8 377.4 639.3 197.7 1458.3 95.6 499.8 31.1 Casc 293.4 485.0 362.2 100.1 358.5 260.7 1226.2 154.2 1030.0 44.7 261.6 59.3 FR 479.1 362.2 364.2 283.5 530.8 629.9 580.4 259.5 881.9 229.9 675.5 58.9 Gulf 209.6 100.1 283.5 1221.9 391.1 659.4 213.2 873.0 490.9 659.6 1554.3 42.7 Mid 432.8 358.5 530.8 391.1 3005.7 2579.8 481.0 1154.8 1060.8 1326.0 777.5 228.7 NE 377.4 260.7 629.9 659.4 2579.8 4151.7 857.0 2878.3 1517.9 4977.8 1177.0 130.5 NCal 639.3 1226.2 580.4 213.2 481.0 857.0 417.9 248.9 3576.1 116.1 584.4 47.2 Pied 197.7 154.2 259.5 873.0 1154.8 2878.3 248.9 1733.7 569.3 3209.1 870.0 152.1 SCal 1458.3 1030.0 881.9 490.9 1060.8 1517.9 3576.1 569.3 1925.5 418.7 1199.2 85.2 SFl 95.6 44.7 229.9 659.6 1326.0 4977.8 116.1 3209.1 418.7 1441.1 1016.2 45.9 TX 499.8 261.6 675.5 1554.3 777.5 1177.0 584.4 870.0 1199.2 1016.2 2192.7 137.4
Non-mega 31.1 59.3 58.9 42.7 228.7 130.5 47.2 152.1 85.2 45.9 137.4 143.4 Note: All flows in trips per square mile of both megaregions (or non-megaregion areas).
248
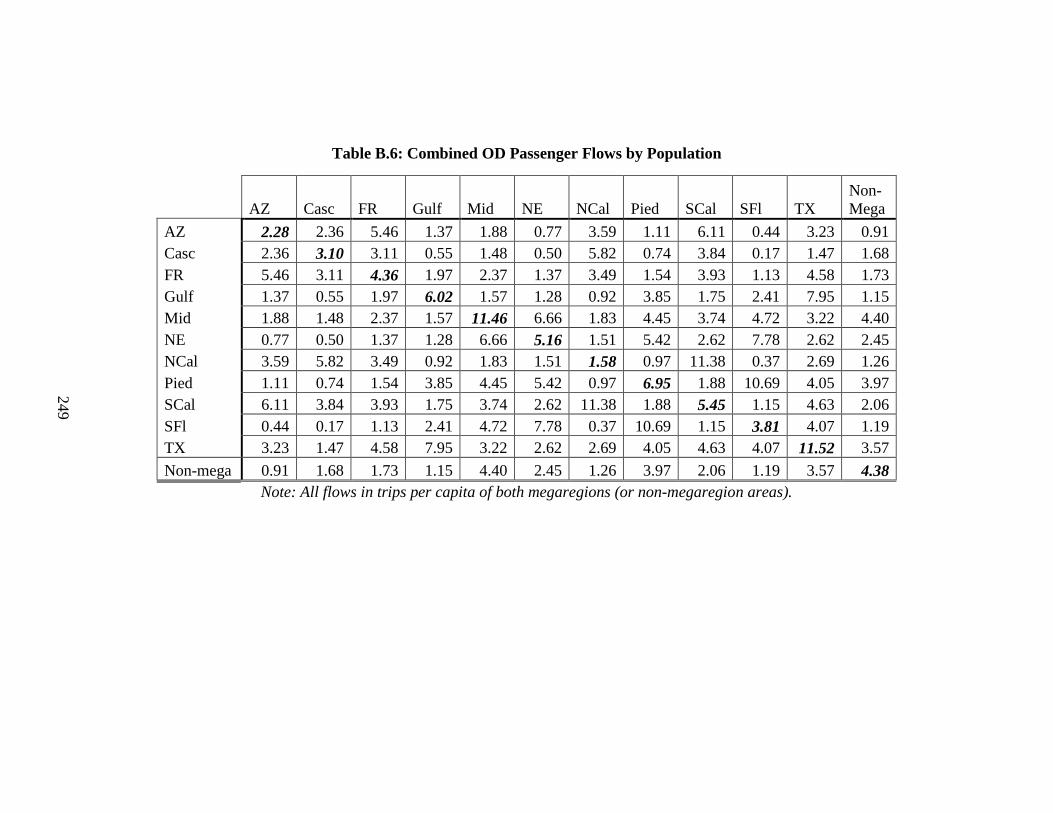
249
Table B.6: Combined OD Passenger Flows by Population
AZ Casc FR Gulf Mid NE NCal Pied SCal SFl TX Non-Mega
AZ 2.28 2.36 5.46 1.37 1.88 0.77 3.59 1.11 6.11 0.44 3.23 0.91 Casc 2.36 3.10 3.11 0.55 1.48 0.50 5.82 0.74 3.84 0.17 1.47 1.68 FR 5.46 3.11 4.36 1.97 2.37 1.37 3.49 1.54 3.93 1.13 4.58 1.73 Gulf 1.37 0.55 1.97 6.02 1.57 1.28 0.92 3.85 1.75 2.41 7.95 1.15 Mid 1.88 1.48 2.37 1.57 11.46 6.66 1.83 4.45 3.74 4.72 3.22 4.40 NE 0.77 0.50 1.37 1.28 6.66 5.16 1.51 5.42 2.62 7.78 2.62 2.45 NCal 3.59 5.82 3.49 0.92 1.83 1.51 1.58 0.97 11.38 0.37 2.69 1.26 Pied 1.11 0.74 1.54 3.85 4.45 5.42 0.97 6.95 1.88 10.69 4.05 3.97 SCal 6.11 3.84 3.93 1.75 3.74 2.62 11.38 1.88 5.45 1.15 4.63 2.06 SFl 0.44 0.17 1.13 2.41 4.72 7.78 0.37 10.69 1.15 3.81 4.07 1.19 TX 3.23 1.47 4.58 7.95 3.22 2.62 2.69 4.05 4.63 4.07 11.52 3.57
Non-mega 0.91 1.68 1.73 1.15 4.40 2.45 1.26 3.97 2.06 1.19 3.57 4.38 Note: All flows in trips per capita of both megaregions (or non-megaregion areas).
249
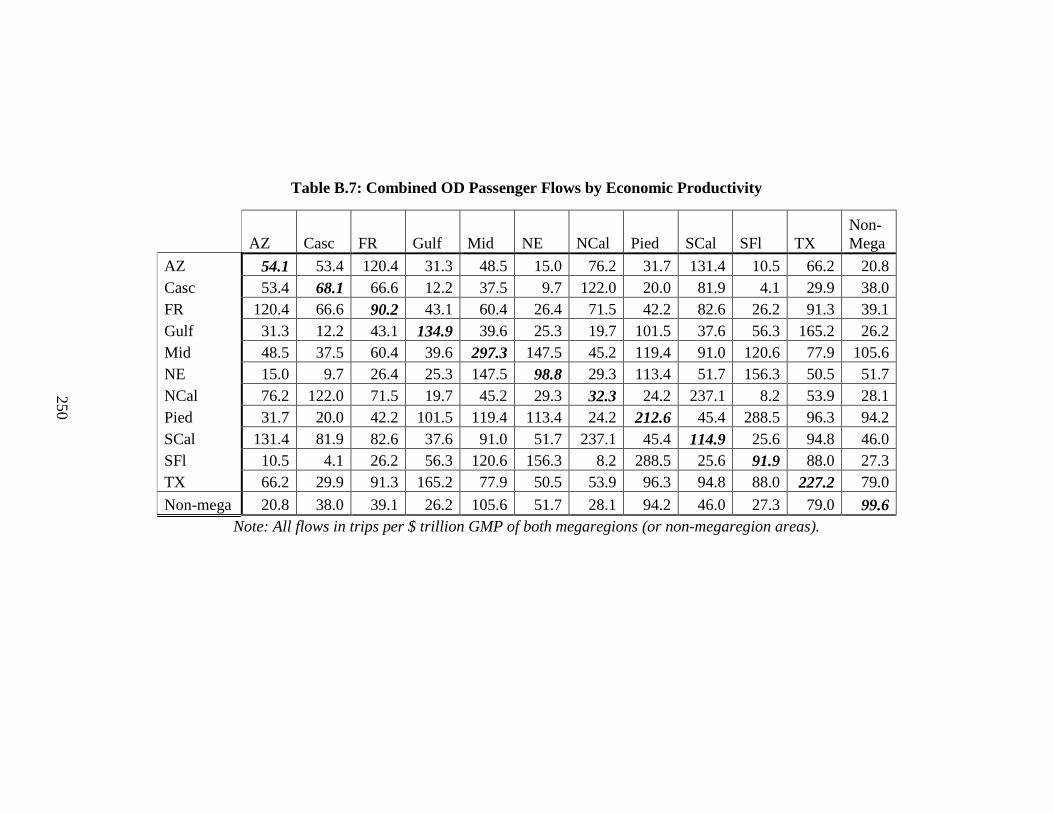
250
Table B.7: Combined OD Passenger Flows by Economic Productivity
AZ Casc FR Gulf Mid NE NCal Pied SCal SFl TX Non-Mega
AZ 54.1 53.4 120.4 31.3 48.5 15.0 76.2 31.7 131.4 10.5 66.2 20.8 Casc 53.4 68.1 66.6 12.2 37.5 9.7 122.0 20.0 81.9 4.1 29.9 38.0 FR 120.4 66.6 90.2 43.1 60.4 26.4 71.5 42.2 82.6 26.2 91.3 39.1 Gulf 31.3 12.2 43.1 134.9 39.6 25.3 19.7 101.5 37.6 56.3 165.2 26.2 Mid 48.5 37.5 60.4 39.6 297.3 147.5 45.2 119.4 91.0 120.6 77.9 105.6 NE 15.0 9.7 26.4 25.3 147.5 98.8 29.3 113.4 51.7 156.3 50.5 51.7 NCal 76.2 122.0 71.5 19.7 45.2 29.3 32.3 24.2 237.1 8.2 53.9 28.1 Pied 31.7 20.0 42.2 101.5 119.4 113.4 24.2 212.6 45.4 288.5 96.3 94.2 SCal 131.4 81.9 82.6 37.6 91.0 51.7 237.1 45.4 114.9 25.6 94.8 46.0 SFl 10.5 4.1 26.2 56.3 120.6 156.3 8.2 288.5 25.6 91.9 88.0 27.3 TX 66.2 29.9 91.3 165.2 77.9 50.5 53.9 96.3 94.8 88.0 227.2 79.0
Non-mega 20.8 38.0 39.1 26.2 105.6 51.7 28.1 94.2 46.0 27.3 79.0 99.6 Note: All flows in trips per $ trillion GMP of both megaregions (or non-megaregion areas).
250

251
Table B.8: Combined OD Freight Flows by Area
AZ Casc FR Gulf Mid NE NCal Pied SCal SFl TX Non-Mega
AZ 1105.6 1237.8 3052.5 601.6 6790.8 1748.3 5431.8 933.1 7748.8 392.0 2162.0 585.4 Casc 1237.8 6321.9 2657.2 639.6 13498.3 3194.3 15087.6 3996.9 10228.2 1046.3 1827.2 1663.7 FR 3052.5 2657.2 972.0 1050.4 10496.2 4017.1 7629.0 887.9 7699.4 848.4 2531.1 835.3
Gulf 601.6 639.6 1050.4 3747.8 7816.7 5404.8 1332.2 2761.3 3940.0 3423.9 7091.3 955.3 Mid 6790.8 13498.3 10496.2 7816.7 49628.6 57644.9 19358.3 18231.0 31779.4 17633.6 21179.6 9810.2 NE 1748.3 3194.3 4017.1 5404.8 57644.9 24837.9 26153.4 16081.3 38460.5 24674.0 10553.1 4871.5 NCal 5431.8 15087.6 7629.0 1332.2 19358.3 26153.4 6570.1 3170.5 22563.1 3007.5 7686.7 2617.0 Pied 933.1 3996.9 887.9 2761.3 18231.0 16081.3 3170.5 5089.2 7733.2 16710.1 6074.5 2049.1 SCal 7748.8 10228.2 7699.4 3940.0 31779.4 38460.5 22563.1 7733.2 6280.8 9097.8 15334.9 4950.6 SFl 392.0 1046.3 848.4 3423.9 17633.6 24674.0 3007.5 16710.1 9097.8 10223.1 10839.9 2576.8 TX 2162.0 1827.2 2531.1 7091.3 21179.6 10553.1 7686.7 6074.5 15334.9 10839.9 10307.4 2364.7
Non-mega 585.4 1663.7 835.3 955.3 9810.2 4871.5 2617.0 2049.1 4950.6 2576.8 2364.7 6832.9 Note: All flows in pounds of freight per square mile of both megaregions (or non-megaregion areas).
251
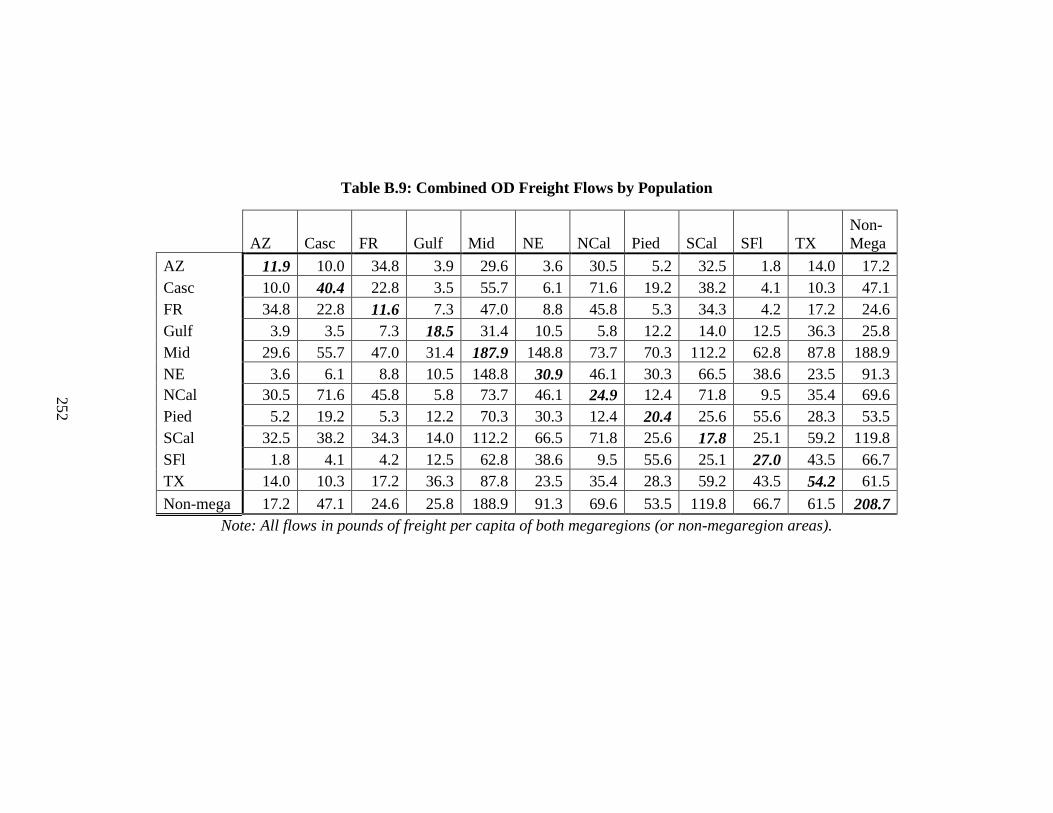
252
Table B.9: Combined OD Freight Flows by Population
AZ Casc FR Gulf Mid NE NCal Pied SCal SFl TX Non-Mega
AZ 11.9 10.0 34.8 3.9 29.6 3.6 30.5 5.2 32.5 1.8 14.0 17.2 Casc 10.0 40.4 22.8 3.5 55.7 6.1 71.6 19.2 38.2 4.1 10.3 47.1 FR 34.8 22.8 11.6 7.3 47.0 8.8 45.8 5.3 34.3 4.2 17.2 24.6 Gulf 3.9 3.5 7.3 18.5 31.4 10.5 5.8 12.2 14.0 12.5 36.3 25.8 Mid 29.6 55.7 47.0 31.4 187.9 148.8 73.7 70.3 112.2 62.8 87.8 188.9 NE 3.6 6.1 8.8 10.5 148.8 30.9 46.1 30.3 66.5 38.6 23.5 91.3 NCal 30.5 71.6 45.8 5.8 73.7 46.1 24.9 12.4 71.8 9.5 35.4 69.6 Pied 5.2 19.2 5.3 12.2 70.3 30.3 12.4 20.4 25.6 55.6 28.3 53.5 SCal 32.5 38.2 34.3 14.0 112.2 66.5 71.8 25.6 17.8 25.1 59.2 119.8 SFl 1.8 4.1 4.2 12.5 62.8 38.6 9.5 55.6 25.1 27.0 43.5 66.7 TX 14.0 10.3 17.2 36.3 87.8 23.5 35.4 28.3 59.2 43.5 54.2 61.5
Non-mega 17.2 47.1 24.6 25.8 188.9 91.3 69.6 53.5 119.8 66.7 61.5 208.7 Note: All flows in pounds of freight per capita of both megaregions (or non-megaregion areas).
252
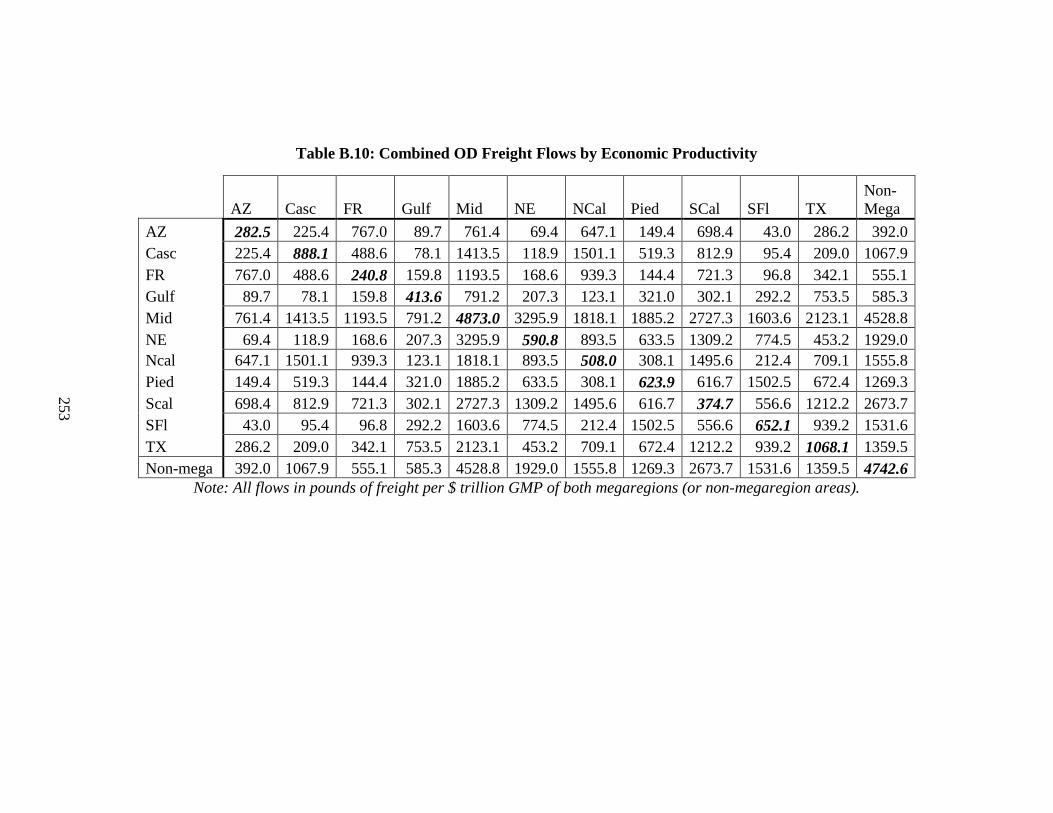
253
Table B.10: Combined OD Freight Flows by Economic Productivity
AZ Casc FR Gulf Mid NE NCal Pied SCal SFl TX Non-Mega
AZ 282.5 225.4 767.0 89.7 761.4 69.4 647.1 149.4 698.4 43.0 286.2 392.0 Casc 225.4 888.1 488.6 78.1 1413.5 118.9 1501.1 519.3 812.9 95.4 209.0 1067.9 FR 767.0 488.6 240.8 159.8 1193.5 168.6 939.3 144.4 721.3 96.8 342.1 555.1 Gulf 89.7 78.1 159.8 413.6 791.2 207.3 123.1 321.0 302.1 292.2 753.5 585.3 Mid 761.4 1413.5 1193.5 791.2 4873.0 3295.9 1818.1 1885.2 2727.3 1603.6 2123.1 4528.8 NE 69.4 118.9 168.6 207.3 3295.9 590.8 893.5 633.5 1309.2 774.5 453.2 1929.0 Ncal 647.1 1501.1 939.3 123.1 1818.1 893.5 508.0 308.1 1495.6 212.4 709.1 1555.8 Pied 149.4 519.3 144.4 321.0 1885.2 633.5 308.1 623.9 616.7 1502.5 672.4 1269.3 Scal 698.4 812.9 721.3 302.1 2727.3 1309.2 1495.6 616.7 374.7 556.6 1212.2 2673.7 SFl 43.0 95.4 96.8 292.2 1603.6 774.5 212.4 1502.5 556.6 652.1 939.2 1531.6 TX 286.2 209.0 342.1 753.5 2123.1 453.2 709.1 672.4 1212.2 939.2 1068.1 1359.5 Non-mega 392.0 1067.9 555.1 585.3 4528.8 1929.0 1555.8 1269.3 2673.7 1531.6 1359.5 4742.6
Note: All flows in pounds of freight per $ trillion GMP of both megaregions (or non-megaregion areas).
253

254
Table B.11: Passenger Growth Over Time
YEAR FLOW TYPE 1990 1991 1992 1993 1994 1995 1996 1997 1998 1999 2000 2001 2002 2003 2004 2005 2006 2007 2008 AZ 6 6 6 6 6 7 7 6 6 6 6 5 4 4 5 5 5 4 4 Casc 9 11 11 12 12 12 13 13 12 12 12 10 11 12 12 13 13 15 15 FR 8 9 11 10 10 12 14 13 12 12 11 9 9 10 12 11 10 11 13 Gulf 27 25 27 28 29 38 39 41 41 42 42 41 39 39 40 40 44 44 41 Mid 264 260 294 297 320 332 336 348 360 362 373 338 328 348 350 336 319 311 287 NE 121 106 106 106 110 117 117 125 136 148 152 130 122 140 158 169 169 169 158 NCal 12 13 13 11 8 9 12 12 12 11 9 8 8 12 12 11 11 10 8 Pied 45 38 41 44 53 54 58 60 61 61 62 55 53 55 55 58 57 61 62 SCal 46 47 47 49 57 60 63 59 60 67 73 65 61 69 75 78 76 75 65 SFl 26 27 27 23 28 20 21 21 31 30 32 30 29 30 32 36 38 40 38 TX 91 86 92 97 103 107 107 107 108 107 109 99 88 87 94 94 97 96 91 Intra-mega
654 627 675 683 735 766 787 803 841 856 881 790 751 806 846 851 839 836 783
Inter-mega
2612 2556 2677 2761 3031 3159 3388 3528 3625 3796 3991 3772 3726 3871 4207 4379 4415 4561 4404
Non-mega 1045 1026 1076 1102 1187 1232 1297 1322 1332 1368 1434 1344 1335 1447 1572 1680 1681 1736 1669
Inter-national
736 722 797 844 884 948 1017 1092 1159 1245 1350 1233 1189 1197 1357 1445 1502 1570 1582
Internal Non-mega
163 158 161 160 168 166 169 168 163 162 166 150 160 177 176 188 188 198 176
TOTAL 5210 5090 5385 5550 6006 6271 6658 6914 7120 7428 7822 7288 7161 7499 8158 8543 8626 8901 8613
Note: All flows in one hundred thousand trips.
254
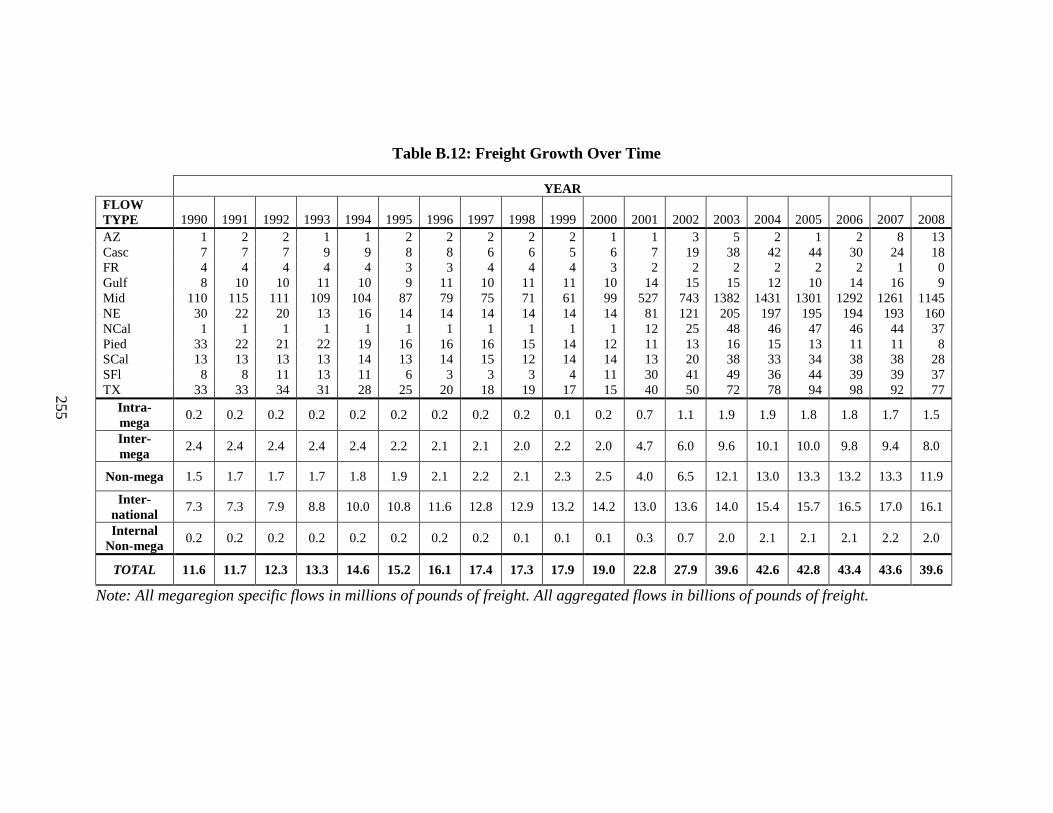
255
Table B.12: Freight Growth Over Time
YEAR FLOW TYPE 1990 1991 1992 1993 1994 1995 1996 1997 1998 1999 2000 2001 2002 2003 2004 2005 2006 2007 2008 AZ 1 2 2 1 1 2 2 2 2 2 1 1 3 5 2 1 2 8 13 Casc 7 7 7 9 9 8 8 6 6 5 6 7 19 38 42 44 30 24 18 FR 4 4 4 4 4 3 3 4 4 4 3 2 2 2 2 2 2 1 0 Gulf 8 10 10 11 10 9 11 10 11 11 10 14 15 15 12 10 14 16 9 Mid 110 115 111 109 104 87 79 75 71 61 99 527 743 1382 1431 1301 1292 1261 1145 NE 30 22 20 13 16 14 14 14 14 14 14 81 121 205 197 195 194 193 160 NCal 1 1 1 1 1 1 1 1 1 1 1 12 25 48 46 47 46 44 37 Pied 33 22 21 22 19 16 16 16 15 14 12 11 13 16 15 13 11 11 8 SCal 13 13 13 13 14 13 14 15 12 14 14 13 20 38 33 34 38 38 28 SFl 8 8 11 13 11 6 3 3 3 4 11 30 41 49 36 44 39 39 37 TX 33 33 34 31 28 25 20 18 19 17 15 40 50 72 78 94 98 92 77
Intra-mega
0.2 0.2 0.2 0.2 0.2 0.2 0.2 0.2 0.2 0.1 0.2 0.7 1.1 1.9 1.9 1.8 1.8 1.7 1.5
Inter-mega
2.4 2.4 2.4 2.4 2.4 2.2 2.1 2.1 2.0 2.2 2.0 4.7 6.0 9.6 10.1 10.0 9.8 9.4 8.0
Non-mega 1.5 1.7 1.7 1.7 1.8 1.9 2.1 2.2 2.1 2.3 2.5 4.0 6.5 12.1 13.0 13.3 13.2 13.3 11.9
Inter-national
7.3 7.3 7.9 8.8 10.0 10.8 11.6 12.8 12.9 13.2 14.2 13.0 13.6 14.0 15.4 15.7 16.5 17.0 16.1
Internal Non-mega
0.2 0.2 0.2 0.2 0.2 0.2 0.2 0.2 0.1 0.1 0.1 0.3 0.7 2.0 2.1 2.1 2.1 2.2 2.0
TOTAL 11.6 11.7 12.3 13.3 14.6 15.2 16.1 17.4 17.3 17.9 19.0 22.8 27.9 39.6 42.6 42.8 43.4 43.6 39.6
Note: All megaregion specific flows in millions of pounds of freight. All aggregated flows in billions of pounds of freight.
255

256
APPENDIX C
MEGAREGION SPECIFIC FLOWS
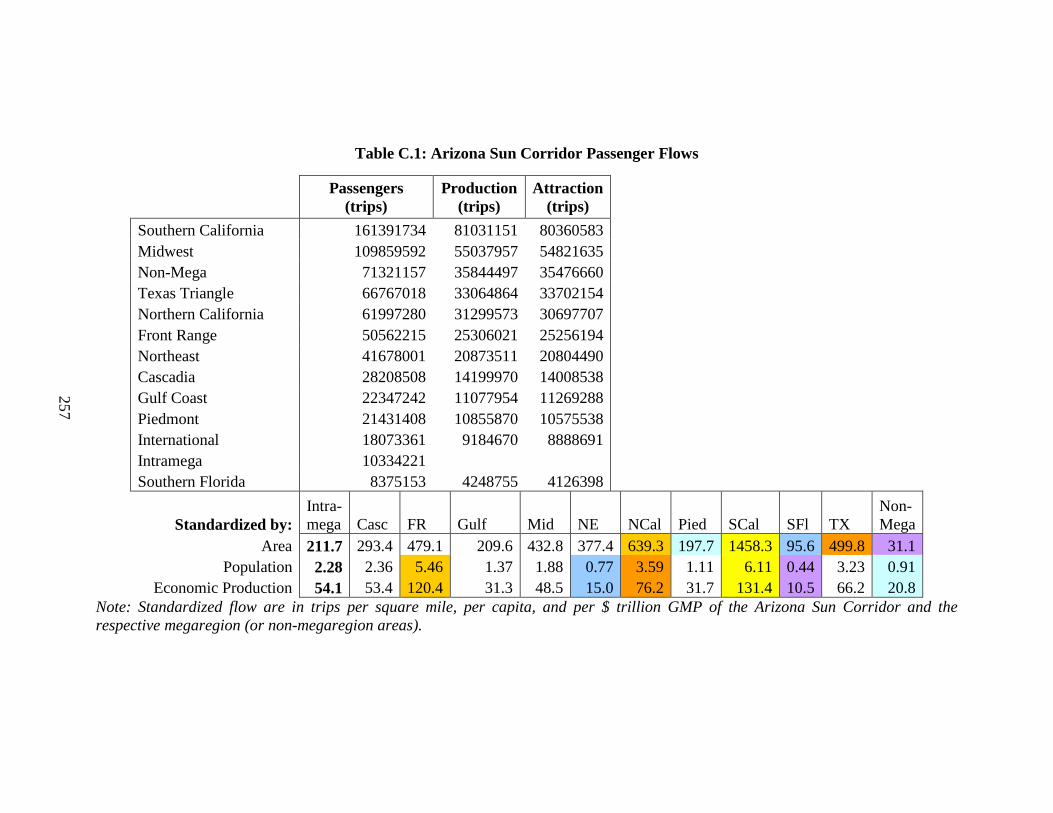
257
Table C.1: Arizona Sun Corridor Passenger Flows
Passengers (trips)
Production (trips)
Attraction (trips)
Southern California 161391734 81031151 80360583 Midwest 109859592 55037957 54821635 Non-Mega 71321157 35844497 35476660 Texas Triangle 66767018 33064864 33702154 Northern California 61997280 31299573 30697707 Front Range 50562215 25306021 25256194 Northeast 41678001 20873511 20804490 Cascadia 28208508 14199970 14008538 Gulf Coast 22347242 11077954 11269288 Piedmont 21431408 10855870 10575538 International 18073361 9184670 8888691 Intramega 10334221 Southern Florida 8375153 4248755 4126398
Standardized by: Intra-mega Casc FR Gulf Mid NE NCal Pied SCal SFl TX
Non-Mega
Area 211.7 293.4 479.1 209.6 432.8 377.4 639.3 197.7 1458.3 95.6 499.8 31.1 Population 2.28 2.36 5.46 1.37 1.88 0.77 3.59 1.11 6.11 0.44 3.23 0.91
Economic Production 54.1 53.4 120.4 31.3 48.5 15.0 76.2 31.7 131.4 10.5 66.2 20.8 Note: Standardized flow are in trips per square mile, per capita, and per $ trillion GMP of the Arizona Sun Corridor and the respective megaregion (or non-megaregion areas).
257

258
Table C.2: Arizona Sun Corridor Freight Flows
Freight (lbs) Production
(lbs) Attraction
(lbs) %
Difference
Midwest 1723772482 727301090 996471392 31.2% Non-Mega 1343019943 667167992 675851951 1.3% Southern California 857589544 368500650 489088894 28.1% Northern California 526778396 240241425 286536971 17.6% Front Range 322158884 166935517 155223367 -7.3% Texas Triangle 288790999 129035494 159755505 21.3% Northeast 193087915 89105984 103981931 15.4% International 169834839 83248941 86585898 3.9% Cascadia 119011010 57111680 61899330 8.0% Piedmont 101141844 44232910 56908934 25.1% Gulf Coast 64151334 28216629 35934705 24.1% Intramega 53962549 Southern Florida 34337377 16087727 18249650 12.6%
Standardized by: Intra-mega Casc FR Gulf Mid NE NCal Pied SCal SFl TX
Non-Mega
Area 1105.6 1237.8 3052.5 601.6 6790.8 1748.3 5431.8 933.1 7748.8 392.0 2162.0 585.4 Population 11.9 10.0 34.8 3.9 29.6 3.6 30.5 5.2 32.5 1.8 14.0 17.2
Economic Production 282.5 225.4 767.0 89.7 761.4 69.4 647.1 149.4 698.4 43.0 286.2 392.0 Note: Standardized flow are in pounds of freight per square mile, per capita, and per $ trillion GMP of the Arizona Sun Corridor and the respective megaregion (or non-megaregion areas).
258
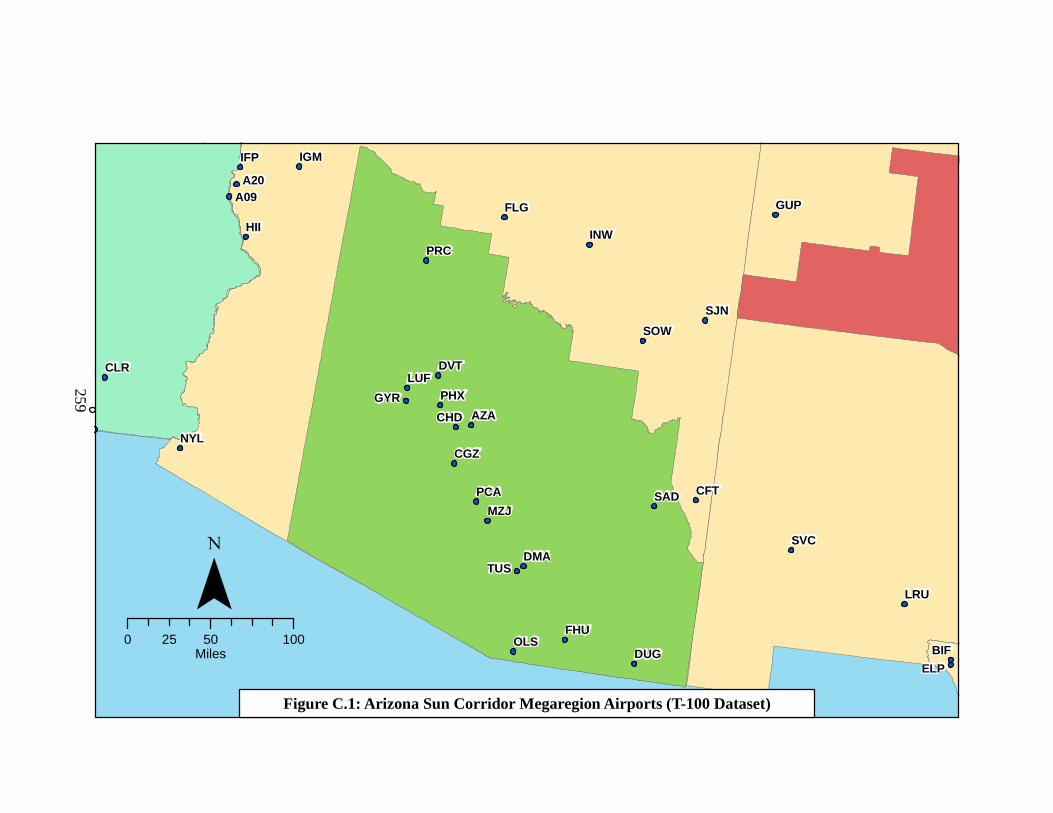
IFP
A20A09
CGZ
CHD
CFT
DUG
FLG
FHU
LUF
GYR
IGM
HII
MZJ
OLS
DVT
PHX
PCA
PRC
SAD
SJN
SOW
TUSDMA
INW
NYL
CLR
GUP
LRU
SVC
ELP
BIF
AZA
¯
Figure C.1: Arizona Sun Corridor Megaregion Airports (T-100 Dataset)
0 50 10025Miles
259
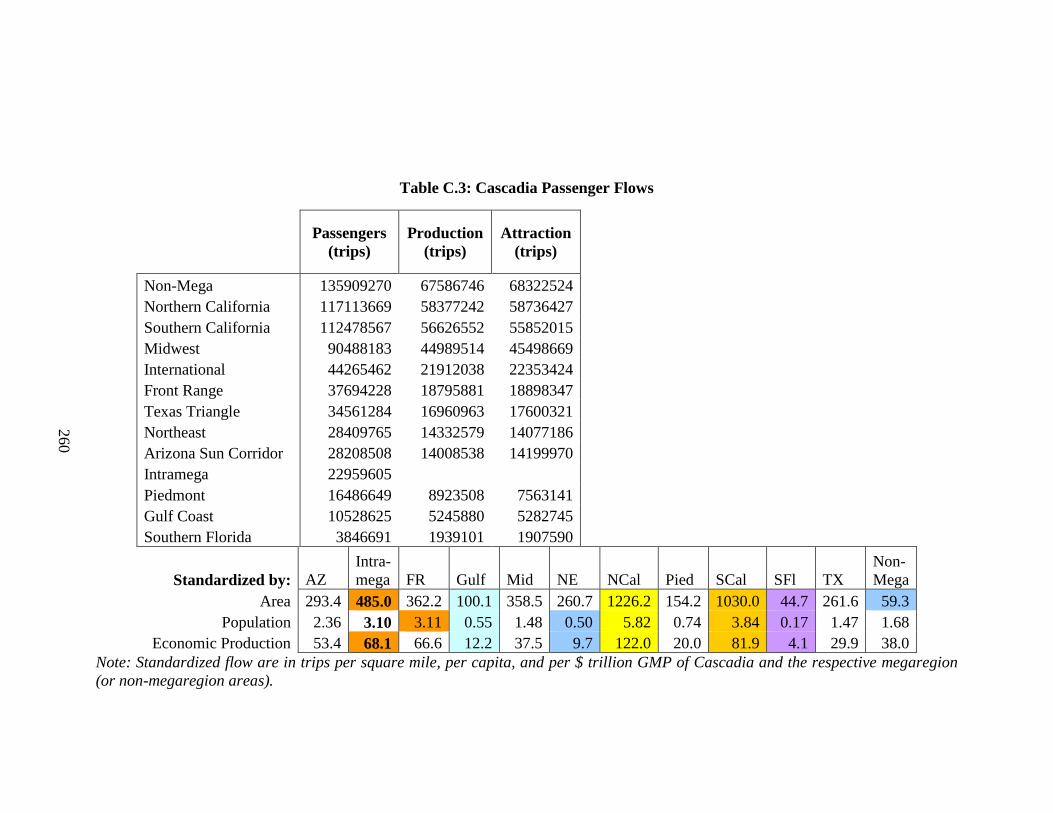
260
Table C.3: Cascadia Passenger Flows
Passengers (trips)
Production (trips)
Attraction (trips)
Non-Mega 135909270 67586746 68322524 Northern California 117113669 58377242 58736427 Southern California 112478567 56626552 55852015 Midwest 90488183 44989514 45498669 International 44265462 21912038 22353424 Front Range 37694228 18795881 18898347 Texas Triangle 34561284 16960963 17600321 Northeast 28409765 14332579 14077186 Arizona Sun Corridor 28208508 14008538 14199970 Intramega 22959605 Piedmont 16486649 8923508 7563141 Gulf Coast 10528625 5245880 5282745 Southern Florida 3846691 1939101 1907590
Standardized by: AZ Intra-mega FR Gulf Mid NE NCal Pied SCal SFl TX
Non-Mega
Area 293.4 485.0 362.2 100.1 358.5 260.7 1226.2 154.2 1030.0 44.7 261.6 59.3 Population 2.36 3.10 3.11 0.55 1.48 0.50 5.82 0.74 3.84 0.17 1.47 1.68
Economic Production 53.4 68.1 66.6 12.2 37.5 9.7 122.0 20.0 81.9 4.1 29.9 38.0 Note: Standardized flow are in trips per square mile, per capita, and per $ trillion GMP of Cascadia and the respective megaregion (or non-megaregion areas).
260

261
Table C.4: Cascadia Freight Flows
Freight (lbs) Production
(lbs) Attraction
(lbs) %
Difference
Non-Mega 3814413745 1871940405 1942473340 3.7% International 3696275053 2105251269 1591023784 -27.8% Midwest 3406614833 1639872638 1766742195 7.4% Northern California 1441057256 608393829 832663427 31.1% Southern California 1116982985 509244587 607738398 17.6% Piedmont 427362159 268167352 159194807 -51.0% Northeast 348100707 223943679 124157028 -57.3% Intramega 299287420 Front Range 276542125 163909684 112632441 -37.1% Texas Triangle 241388269 124616342 116771927 -6.5% Arizona Sun Corridor 119011010 61899330 57111680 -8.0% Southern Florida 90111295 46981480 43129815 -8.5% Gulf Coast 67270182 42109293 25160889 -50.4%
Standardized by: AZ Intra-mega FR Gulf Mid NE NCal Pied SCal SFl TX
Non-Mega
Area 1237.8 6321.9 2657.2 639.6 13498.3 3194.3 15087.6 3996.9 10228.2 1046.3 1827.2 1663.7 Population 10.0 40.4 22.8 3.5 55.7 6.1 71.6 19.2 38.2 4.1 10.3 47.1
Economic Production 225.4 888.1 488.6 78.1 1413.5 118.9 1501.1 519.3 812.9 95.4 209.0 1067.9 Note: Standardized flow are in pounds of freight per square mile, per capita, and per $ trillion GMP of Cascadia and the respective megaregion (or non-megaregion areas).
261

COE
LWS
MYL
AST
BKE
CVO
EUGLGD
ONP
OTH
PDT
PDXHIO
RDM
RBG
SLE
BLI
PWT
ELNEPH
PAE
GRF
HQM
MWH
NUW
OLM
OMK
PSC
CLM
PUW
RNT
SEA
BFISHN
GEG
SFFSKA
TCMTIW
ALW
EAT
YKM
FRD
LKE
¯
Figure C.2: Cascadia Megaregion Airports (T-100 Dataset)
0 100 20050Miles
262

263
Table C.5: Front Range Passenger Flows
Passengers (trips)
Production (trips)
Attraction (trips)
Midwest 138938180 69644262 69293918 Non-Mega 135583415 67752022 67831393 Southern California 104584778 52707030 51877748 Texas Triangle 95577679 47217842 48359837 Northeast 74552581 37117030 37435551 Northern California 60880788 30865517 30015271 Arizona Sun Corridor 50562215 25256194 25306021 Cascadia 37694228 18898347 18795881 Gulf Coast 32479436 16078700 16400736 Piedmont 30187997 15158456 15029541 Southern Florida 21959526 10997777 10961749 Intramega 20658751 International 19542018 9657436 9884582
Standardized by: AZ Casc Intra-mega Gulf Mid NE NCal Pied SCal SFl TX
Non-Mega
Area 479.1 362.2 364.2 283.5 530.8 629.9 580.4 259.5 881.9 229.9 675.5 58.9 Population 5.46 3.11 4.36 1.97 2.37 1.37 3.49 1.54 3.93 1.13 4.58 1.73
Economic Production 120.4 66.6 90.2 43.1 60.4 26.4 71.5 42.2 82.6 26.2 91.3 39.1 Note: Standardized flow are in trips per square mile, per capita, and per $ trillion GMP of the Front Range and the respective megaregion (or non-megaregion areas).
263

264
Table C.6: Front Range Freight Flows
Freight (lbs)
Production (lbs)
Attraction (lbs)
% Difference
Midwest 2747508770 1184884198 1562624572 27.5% Non-Mega 1922919768 861115941 1061803827 20.9% Southern California 913121082 471866453 441254629 -6.7% Northern California 800309212 373718738 426590474 13.2% Northeast 475487356 193670569 281816787 37.1% Texas Triangle 358154639 113494795 244659844 73.2% Arizona Sun Corridor 322158884 155223367 166935517 7.3% International 287133073 135708835 151424238 10.9% Cascadia 276542125 112632441 163909684 37.1% Gulf Coast 120341397 47626974 72714423 41.7% Piedmont 103272180 49517610 53754570 8.2% Southern Florida 81033994 25088024 55945970 76.2% Intramega 55143624
Standardized by: AZ Casc Intra-mega Gulf Mid NE NCal Pied SCal SFl TX
Non-Mega
Area 3052.5 2657.2 972.0 1050.4 10496.2 4017.1 7629.0 887.9 7699.4 848.4 2531.1 835.3 Population 34.8 22.8 11.6 7.3 47.0 8.8 45.8 5.3 34.3 4.2 17.2 24.6
Economic Production 767.0 488.6 240.8 159.8 1193.5 168.6 939.3 144.4 721.3 96.8 342.1 555.1 Note: Standardized flow are in pounds of freight per square mile, per capita, and per $ trillion GMP of the Front Range and the respective megaregion (or non-megaregion areas).
264

FLG
GCN
PGA
SJNSOW
INW
AKO
ALS
ASEBKF
COS
CEZ
BJC
APA
DEN
DRO
EGE
FNL
GJT
GUC
HDN
LAA
MTJ
PUB
RIL
TEX
DDCGCK
GLD
GBD
HYS
LBLMEJ
ULS
HSIEARLXN
MCK
LBFSNY
ABQ
CVS CVN
FMN
GUPLAM
SAF
LTS
BFK
CSMCLK
GUY
LAW
WWR
TDW AMA
BGD
DHT
BDG
BCE
DPG
KNB
CNY
PUC
PVU
SLC
VEL
CYSLARSAA
¯0 100 20050
Miles
Figure C.3: Front Range Megaregion Airports (T-100 Dataset)
265
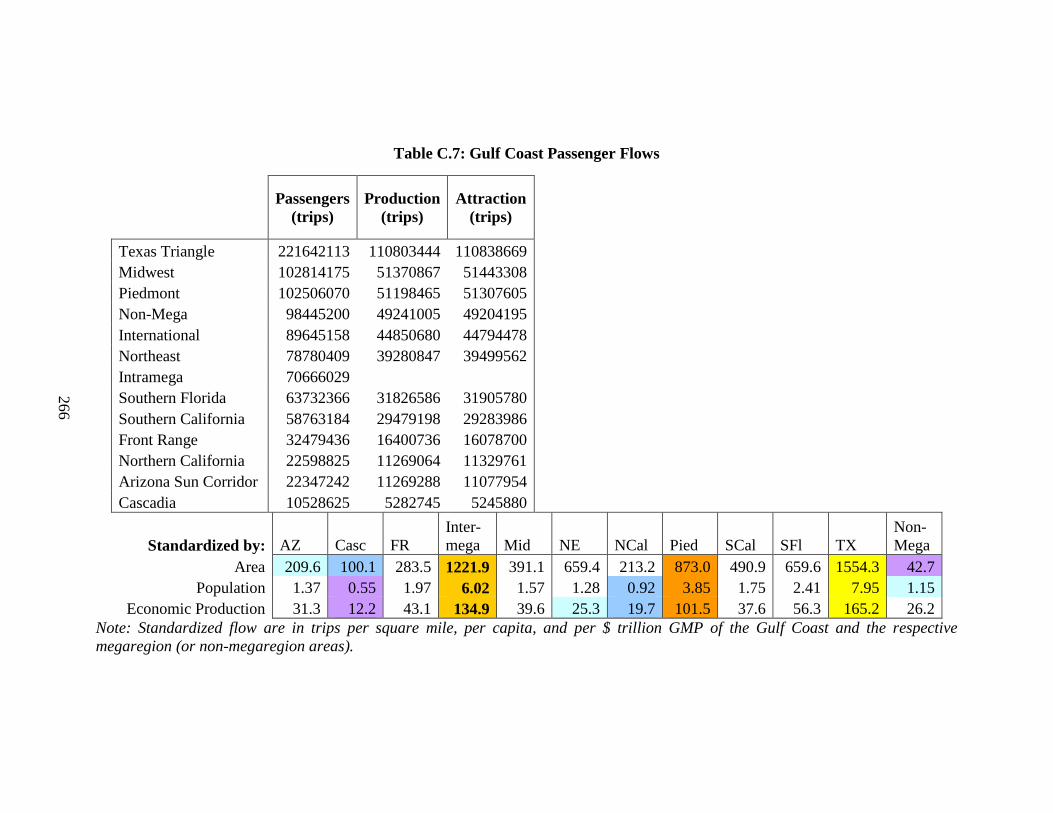
266
Table C.7: Gulf Coast Passenger Flows
Passengers (trips)
Production (trips)
Attraction (trips)
Texas Triangle 221642113 110803444 110838669 Midwest 102814175 51370867 51443308 Piedmont 102506070 51198465 51307605 Non-Mega 98445200 49241005 49204195 International 89645158 44850680 44794478 Northeast 78780409 39280847 39499562 Intramega 70666029 Southern Florida 63732366 31826586 31905780 Southern California 58763184 29479198 29283986 Front Range 32479436 16400736 16078700 Northern California 22598825 11269064 11329761 Arizona Sun Corridor 22347242 11269288 11077954 Cascadia 10528625 5282745 5245880
Standardized by: AZ Casc FR Inter-mega Mid NE NCal Pied SCal SFl TX
Non-Mega
Area 209.6 100.1 283.5 1221.9 391.1 659.4 213.2 873.0 490.9 659.6 1554.3 42.7 Population 1.37 0.55 1.97 6.02 1.57 1.28 0.92 3.85 1.75 2.41 7.95 1.15
Economic Production 31.3 12.2 43.1 134.9 39.6 25.3 19.7 101.5 37.6 56.3 165.2 26.2 Note: Standardized flow are in trips per square mile, per capita, and per $ trillion GMP of the Gulf Coast and the respective megaregion (or non-megaregion areas).
266
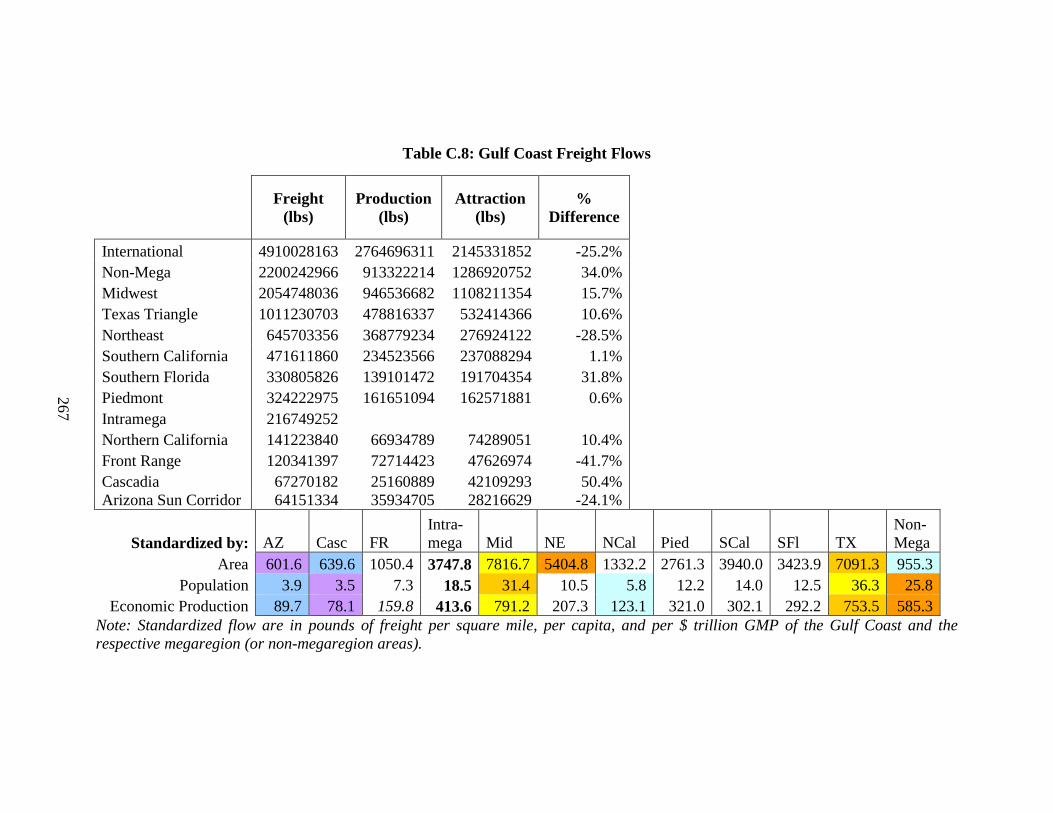
267
Table C.8: Gulf Coast Freight Flows
Freight (lbs)
Production (lbs)
Attraction (lbs)
% Difference
International 4910028163 2764696311 2145331852 -25.2% Non-Mega 2200242966 913322214 1286920752 34.0% Midwest 2054748036 946536682 1108211354 15.7% Texas Triangle 1011230703 478816337 532414366 10.6% Northeast 645703356 368779234 276924122 -28.5% Southern California 471611860 234523566 237088294 1.1% Southern Florida 330805826 139101472 191704354 31.8% Piedmont 324222975 161651094 162571881 0.6% Intramega 216749252 Northern California 141223840 66934789 74289051 10.4% Front Range 120341397 72714423 47626974 -41.7% Cascadia 67270182 25160889 42109293 50.4% Arizona Sun Corridor 64151334 35934705 28216629 -24.1%
Standardized by: AZ Casc FR Intra-mega Mid NE NCal Pied SCal SFl TX
Non-Mega
Area 601.6 639.6 1050.4 3747.8 7816.7 5404.8 1332.2 2761.3 3940.0 3423.9 7091.3 955.3 Population 3.9 3.5 7.3 18.5 31.4 10.5 5.8 12.2 14.0 12.5 36.3 25.8
Economic Production 89.7 78.1 159.8 413.6 791.2 207.3 123.1 321.0 302.1 292.2 753.5 585.3 Note: Standardized flow are in pounds of freight per square mile, per capita, and per $ trillion GMP of the Gulf Coast and the respective megaregion (or non-megaregion areas).
267

09A04A
BFMMOBCEW
PNSNPA
VPS
AEX ESF
BTR
BAD
HUM
LFTLCH
ARANBG
MSY NEW
SHV
UXLBIX
SLJ
GPT
HBGPIB
JANHKS
LUL
MCB
HEZ
AUS
BPT
BRO
CLL
CRPNGP
GRK
GLS
MNZ
HRL
LHB
EFD
SGR HOU
IAH
CXO
DWH
ILE
GGG
LFK
MFE
ASL
PSX
PSN
SKF
SAT
TPL
TYR
RND
VCT
ACT CNW
PGL
LJN
¯0 100 20050
Miles
Figure C.4: Gulf Coast Megaregion Airports (T-100 Dataset)
268

269
Table C.9: Midwest Passenger Flows
Passengers (trips)
Production (trips)
Attraction (trips)
Northeast 687953180 343659669 344293511 Intramega 616259829 Non-Mega 560354045 279615079 280738966 Southern Florida 323291470 160849872 162441598 Piedmont 305569547 153054202 152515345 International 290824582 144129881 146694701 Southern California 283132159 140822559 142309600 Texas Triangle 225308290 113044240 112264050 Front Range 138938180 69293918 69644262 Northern California 121800001 61004525 60795476 Arizona Sun Corridor 109859592 54821635 55037957 Gulf Coast 102814175 51443308 51370867 Cascadia 90488183 45498669 44989514
Standardized by: AZ Casc FR Gulf Intra-mega NE NCal Pied SCal SFl TX
Non-Mega
Area 432.8 358.5 530.8 391.1 3005.7 2579.8 481.0 1154.8 1060.8 1326.0 777.5 228.7 Population 1.88 1.48 2.37 1.57 11.46 6.66 1.83 4.45 3.74 4.72 3.22 4.40
Economic Production 48.5 37.5 60.4 39.6 297.3 147.5 45.2 119.4 91.0 120.6 77.9 105.6 Note: Standardized flow are in trips per square mile, per capita, and per $ trillion GMP of the Midwest and the respective megaregion (or non-megaregion areas).
269

270
Table C.10: Midwest Freight Flows
Freight (lbs) Production
(lbs) Attraction
(lbs) %
Difference
International 38671772113 17365580273 21306191840 20.4% Non-Mega 24039018436 11490034949 12548983487 8.8% Northeast 15371924580 8151749308 7220175272 -12.1% Intramega 10101634112 Southern California 8481821935 4023897228 4457924707 10.2% Texas Triangle 6137856670 3296594102 2841262568 -14.8% Northern California 4901606073 2415376956 2486229117 2.9% Piedmont 4824185391 2461777488 2362407903 -4.1% Southern Florida 4299350997 2367242505 1932108492 -20.2% Cascadia 3406614833 1766742195 1639872638 -7.4% Front Range 2747508770 1562624572 1184884198 -27.5% Gulf Coast 2054748036 1108211354 946536682 -15.7% Arizona Sun Corridor 1723772482 996471392 727301090 -31.2%
Stand. by: AZ Casc FR Gulf Intra-mega NE NCal Pied SCal SFl TX
Non-Mega
Area 6790.8 13498.3 10496.2 7816.7 49268.6 57644.9 19358.3 18231.0 31779.4 17633.6 21179.6 9810.2 Population 29.6 55.7 47.0 31.4 187.9 148.8 73.7 70.3 112.2 62.8 87.8 188.9 Econ. Prod. 761.4 1413.5 1193.5 791.2 4873.0 3295.9 1818.1 1885.2 2727.3 1603.6 2123.1 4528.8
Note: Standardized flow are in pounds of freight per square mile, per capita, and per $ trillion GMP of the Midwest and the respective megaregion (or non-megaregion areas).
270

IAD
AMW
IKV
BRL
CIN CID CWIDVN
DSM
DBQFOD
EOK
MIW
MCW
MUT
OTM
SLB ALO
ALN
BLV
BMI
CPS
MDH
CMI
UGN
MDW
ORDPWK
DPA
DNVDEC
FEP
GBGIKK
LWV
MWA
MTO
MLI
MVN
PIA
VYS
UIN
RFD
SLO
SPI
SQI
AID
BFR
BMG
CEV
EVV
FWA
GYY GSH
IND
OKKLAF
MZZMIE
GUS
RID
SER
SBN
HUF
VPZ
LWC
PTS
BRY
BWG
CVG
EKX
FFT
GLW
EHR
LEX
LOZ
SDFLOU
OWB
PAH
SME
CBE FDK
GAI
HGR
APN
ARBBTL
ACB
BEH
CAD
DETDTW
YIP
ESC
FNT
GLR
GDW
GRRHLM
IMT
JXNAZO
LAN
MCD
MBL
ISQ
MNM
MTC
MOP
MKG
OSC
PLN
PTK
PHN
MBS
IRS
TVC
AXN
AUM
BRD
CHU
MKT
MSP
OWARST
STC
STP
ONA
OTG
CGI
COU
TBN
HAE
JEF
AIZ
MKC
MCI
IRK
SZL
MHL
MO1
VIH
STJ
STLSUS
DMO
SGF GSO
TDF
BUF
NY2
DKK ELM
ITH
JHW
IAGROC
ART
CAK
LUK
CLE
CGFBKL
LCK
OSUCMHDAY
FFO
FDY
HAO
LHQ
AOHMFD
MNN PHD
PMH
SKY
SGH
TOL
TDZ
AXV
ILN
BJJ
YNG
ZZV
AOO
BFD
BTP
DUJ
ERI
FKL
IDIJST
LBE
LHV
PSB
AGC
PIT
IPT
TRI
CHO
DAN
PSK
HSP
LYHROA
SHD
ATW
VOK
EAU
FLD
GRB
JVLENW
LSE
C02
MSN MKE
ARV
CWA
OSH
RAC
RHI
SBM
STE
UES
ISW
BKW
BLF
CRW
CKB
HTS
LWB
MRBMGW
PKB
HLG
CLU
SCE
¯
0 100 20050Miles
Figure C.5: Midwest Megaregion Airports (T-100 Dataset)
271

272
Table C.11: Northeast Passenger Flows
Passengers (trips)
Production (trips)
Attraction (trips)
Midwest 687953180 344293511 343659669 International 659618020 328046376 331571644 Southern Florida 499860779 249796626 250064153 Piedmont 348891309 174181563 174709746 Non-Mega 300977817 150814497 150163320 Intramega 255887384 Southern California 187454212 92375211 95079001 Texas Triangle 172314726 86946199 85368527 Northern California 94100245 46356806 47743439 Gulf Coast 78780409 39499562 39280847 Front Range 74552581 37435551 37117030 Arizona Sun Corridor 41678001 20804490 20873511 Cascadia 28409765 14332579 14077186
Standardized by: AZ Casc FR Gulf Mid Intra-mega NCal Pied SCal SFl TX
Non-Mega
Area 377.4 260.7 629.9 659.4 2579.8 4151.7 857.0 2878.3 1517.9 4977.8 1177.0 130.5 Population 0.77 0.50 1.37 1.28 6.66 5.16 1.51 5.42 2.62 7.78 2.62 2.45
Economic Production 15.0 9.7 26.4 25.3 147.5 98.8 29.3 113.4 51.7 156.3 50.5 51.7 Note: Standardized flow are in trips per square mile, per capita, and per $ trillion GMP of the Northeast and the respective megaregion (or non-megaregion areas).
272
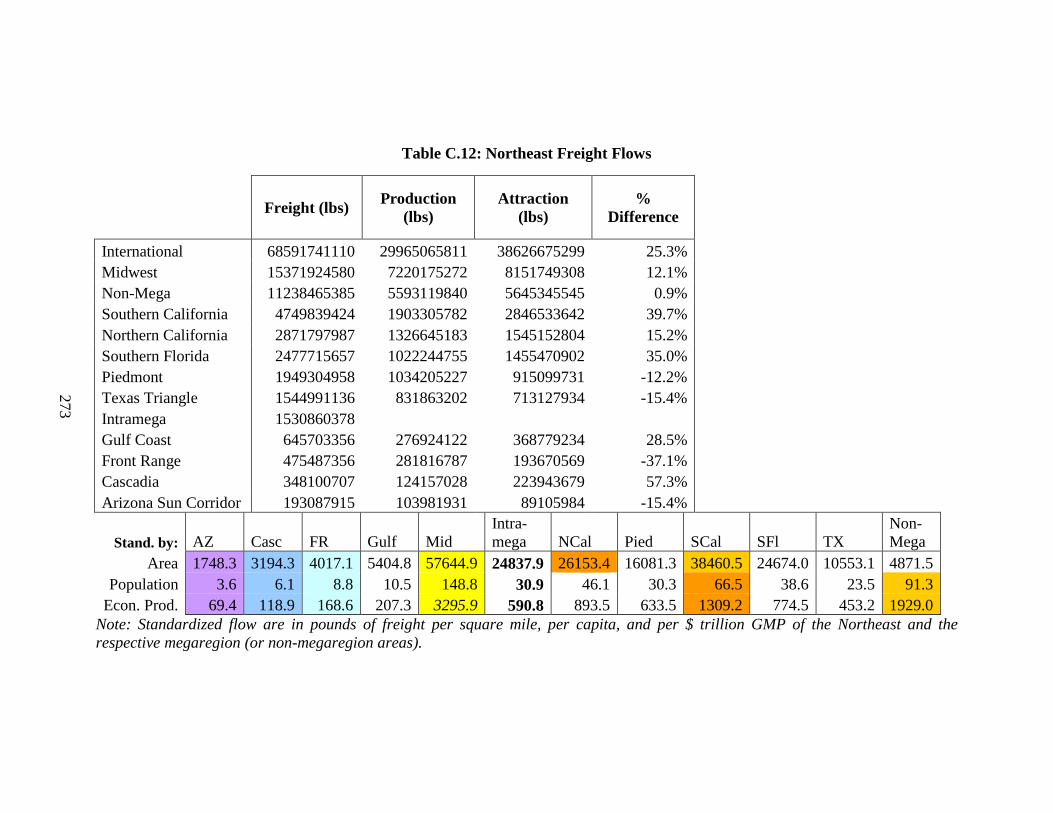
273
Table C.12: Northeast Freight Flows
Freight (lbs) Production
(lbs) Attraction
(lbs) %
Difference
International 68591741110 29965065811 38626675299 25.3% Midwest 15371924580 7220175272 8151749308 12.1% Non-Mega 11238465385 5593119840 5645345545 0.9% Southern California 4749839424 1903305782 2846533642 39.7% Northern California 2871797987 1326645183 1545152804 15.2% Southern Florida 2477715657 1022244755 1455470902 35.0% Piedmont 1949304958 1034205227 915099731 -12.2% Texas Triangle 1544991136 831863202 713127934 -15.4% Intramega 1530860378 Gulf Coast 645703356 276924122 368779234 28.5% Front Range 475487356 281816787 193670569 -37.1% Cascadia 348100707 124157028 223943679 57.3% Arizona Sun Corridor 193087915 103981931 89105984 -15.4%
Stand. by: AZ Casc FR Gulf Mid Intra-mega NCal Pied SCal SFl TX
Non-Mega
Area 1748.3 3194.3 4017.1 5404.8 57644.9 24837.9 26153.4 16081.3 38460.5 24674.0 10553.1 4871.5 Population 3.6 6.1 8.8 10.5 148.8 30.9 46.1 30.3 66.5 38.6 23.5 91.3
Econ. Prod. 69.4 118.9 168.6 207.3 3295.9 590.8 893.5 633.5 1309.2 774.5 453.2 1929.0 Note: Standardized flow are in pounds of freight per square mile, per capita, and per $ trillion GMP of the Northeast and the respective megaregion (or non-megaregion areas).
273

GED
GBR
PSF
CGE
CBE
ESN
SBY
PWM
CAK
CLE
CGF
BKL
CMH
LHQ
MFD
PHD
PMH
BJJ
YNG
ZZV
AOO
BFD
BTP
DUJ
ERI
FKL
IDI
JSTLBE
PSB
AGCPIT
HLG
SCE
BDR
DXR GON
HFD
HVNOXC
BDL
DCAIAD
DOV
ILG
BED BVY
BOS
FMH
GDM
HYA
LWM
ACK
EWB
OWDPYM
PVC
CEF
MVY
BAFORH
APG
ANP
MTNBWI
ADWCGS
FDK
GAI
HGR
NHK
NUI
SFM
CON
MHT
ASH
PSM
ACY
BLM
1N7CDW
MIV
MMUEWR
N87
TEB
MJX
TTN
WWD
C01WRI
HTO
FRG
ISP
MTP
MSV
SWF
JRBJRA
JFK
LGA
POU
FOKHPN
ABE
MDTLNS
PHL
PNE
N47RDG
OQN
AVP
NXX
THV
BID
SFZPVD
WST
MRB
EEN
LCILEB
ALB
BGM
BUF
NY2
DKK ELM
GFL
ITH
JHW
IAG OIC
ROC
RME
SLK
SCH
SYR
ART
LHVIPT
CHO
LFI
HSPPHF
RIC
SHD
BTV
RUT
BKW
CRW
CKB
HTS
LWB
MGW
PKB
¯0 100 20050
Miles
Figure C.6: Northeast Megaregion Airports (T-100 Dataset)
274
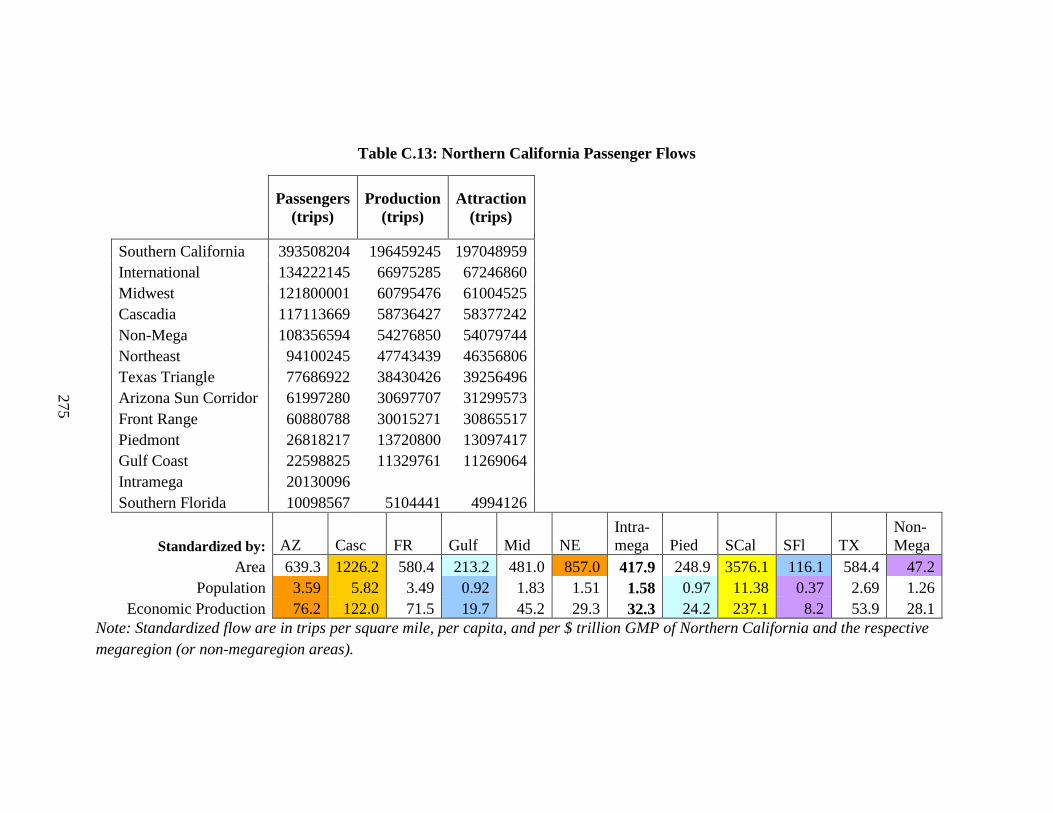
275
Table C.13: Northern California Passenger Flows
Passengers (trips)
Production (trips)
Attraction (trips)
Southern California 393508204 196459245 197048959 International 134222145 66975285 67246860 Midwest 121800001 60795476 61004525 Cascadia 117113669 58736427 58377242 Non-Mega 108356594 54276850 54079744 Northeast 94100245 47743439 46356806 Texas Triangle 77686922 38430426 39256496 Arizona Sun Corridor 61997280 30697707 31299573 Front Range 60880788 30015271 30865517 Piedmont 26818217 13720800 13097417 Gulf Coast 22598825 11329761 11269064 Intramega 20130096 Southern Florida 10098567 5104441 4994126
Standardized by: AZ Casc FR Gulf Mid NE Intra-mega Pied SCal SFl TX
Non-Mega
Area 639.3 1226.2 580.4 213.2 481.0 857.0 417.9 248.9 3576.1 116.1 584.4 47.2 Population 3.59 5.82 3.49 0.92 1.83 1.51 1.58 0.97 11.38 0.37 2.69 1.26
Economic Production 76.2 122.0 71.5 19.7 45.2 29.3 32.3 24.2 237.1 8.2 53.9 28.1 Note: Standardized flow are in trips per square mile, per capita, and per $ trillion GMP of Northern California and the respective megaregion (or non-megaregion areas).
275

276
Table C.14: Northern California Freight Flows
Freight (lbs) Production
(lbs) Attraction
(lbs) %
Difference
International 13360881436 5959587142 7401294294 21.6% Non-Mega 6002280717 3176410255 2825870462 -11.7% Midwest 4901606073 2486229117 2415376956 -2.9% Northeast 2871797987 1545152804 1326645183 -15.2% Southern California 2482777964 1239291595 1243486369 0.3% Cascadia 1441057256 832663427 608393829 -31.1% Texas Triangle 1021873724 526687584 495186140 -6.2% Front Range 800309212 426590474 373718738 -13.2% Arizona Sun Corridor 526778396 286536971 240241425 -17.6% Piedmont 341634071 196631143 145002928 -30.2% Intramega 316494097 Southern Florida 261523383 107555899 153967484 35.5% Gulf Coast 141223840 74289051 66934789 -10.4%
Stand. by: AZ Casc FR Gulf Mid NE Intra-mega Pied SCal SFl TX
Non-Mega
Area 5431.8 15087.6 7629.0 1332.2 19358.3 26153.4 6570.1 3170.5 22563.1 3007.5 7686.7 2617.0 Population 30.5 71.6 45.8 5.8 73.7 46.1 24.9 12.4 71.8 9.5 35.4 69.6
Econ. Prod. 647.1 1501.1 939.3 123.1 1818.1 893.5 508.0 308.1 1495.6 212.4 709.1 1555.8 Note: Standardized flow are in pounds of freight per square mile, per capita, and per $ trillion GMP of Northern California and the respective megaregion (or non-megaregion areas).
276

A26A24
ACV
AUN
BFL
BIH
CIC
CCR
DWA
EKA
SUU
A28
FCH FAT
HWD
IYK
NLC
LVK
MAE
MMH
BAB
MCE
MER
MOD
MRY
NUQ
APC
OAK
PRB PTV
RBL
RDD
SMF
MHRSAC
MCC
SNS
SFO
SJC
SBP
SMX
STS
MIT
TVL
SCK
TLR
UKI
VCB
VIS
WVI
TWF
BTY
EKO
ELY
NFL
INS
LSVVGT
LAS
DRA
MEV
RNO
A36
TPH
CDC
SGU
ENV
BLD
¯0 100 20050
Miles
Figure C.7: Northern California Megaregion Airports (T-100 Dataset)
277

278
Table C.15: Piedmont Passenger Flows
Passengers (trips)
Production (trips)
Attraction (trips)
Non-Mega 350542821 175525299 175017522 Northeast 348891309 174709746 174181563 Southern Florida 315663512 158554902 157108610 Midwest 305569547 152515345 153054202 Texas Triangle 125590777 63116181 62474596 International 121341314 60475037 60866277 Intramega 103299958 Gulf Coast 102506070 51307605 51198465 Southern California 69145817 33741048 35404769 Front Range 30187997 15029541 15158456 Northern California 26818217 13097417 13720800 Arizona Sun Corridor 21431408 10575538 10855870 Cascadia 16486649 7563141 8923508
Standardized by: AZ Casc FR Gulf Mid NE NCal Intra-mega SCal SFl TX
Non-Mega
Area 197.7 154.2 259.5 873.0 1154.8 2878.3 248.9 1733.7 569.3 3209.1 870.0 152.1 Population 1.11 0.74 1.54 3.85 4.45 5.42 0.97 6.95 1.88 10.69 4.05 3.97
Economic Production 31.7 20.0 42.2 101.5 119.4 113.4 24.2 212.6 45.4 288.5 96.3 94.2 Note: Standardized flow are in trips per square mile, per capita, and per $ trillion GMP of the Piedmont and the respective megaregion (or non-megaregion areas).
278
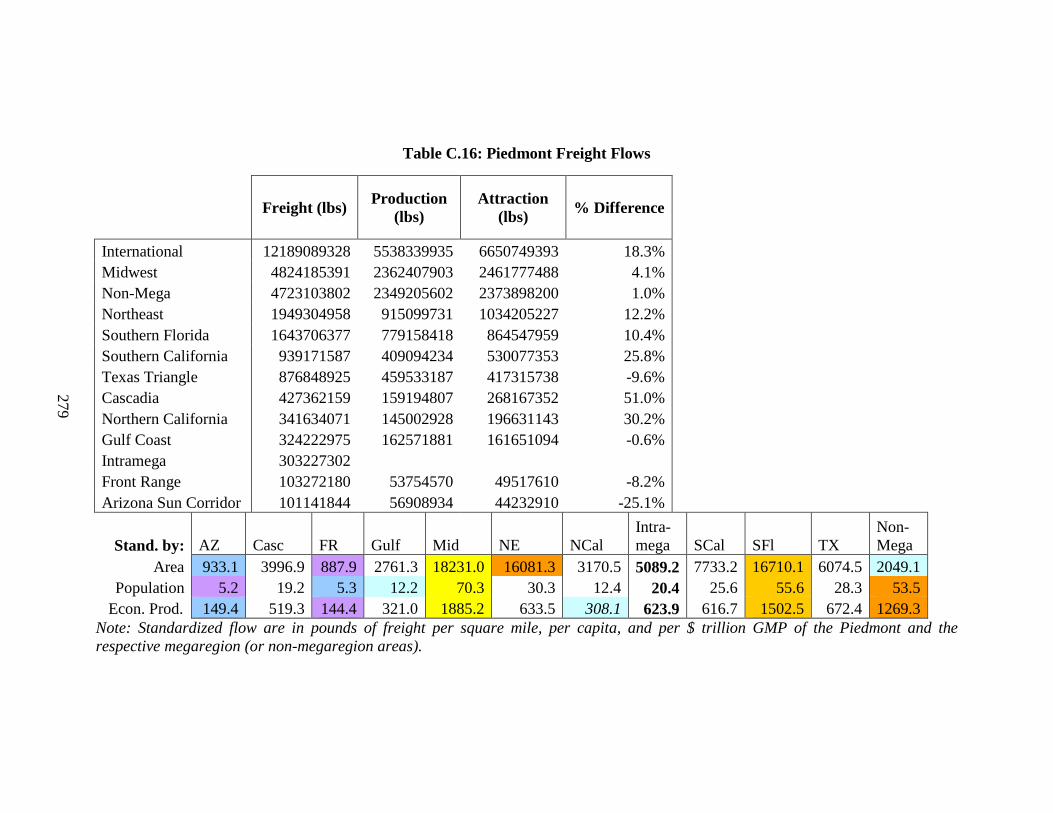
279
Table C.16: Piedmont Freight Flows
Freight (lbs) Production
(lbs) Attraction
(lbs) % Difference
International 12189089328 5538339935 6650749393 18.3% Midwest 4824185391 2362407903 2461777488 4.1% Non-Mega 4723103802 2349205602 2373898200 1.0% Northeast 1949304958 915099731 1034205227 12.2% Southern Florida 1643706377 779158418 864547959 10.4% Southern California 939171587 409094234 530077353 25.8% Texas Triangle 876848925 459533187 417315738 -9.6% Cascadia 427362159 159194807 268167352 51.0% Northern California 341634071 145002928 196631143 30.2% Gulf Coast 324222975 162571881 161651094 -0.6% Intramega 303227302 Front Range 103272180 53754570 49517610 -8.2% Arizona Sun Corridor 101141844 56908934 44232910 -25.1%
Stand. by: AZ Casc FR Gulf Mid NE NCal Intra-mega SCal SFl TX
Non-Mega
Area 933.1 3996.9 887.9 2761.3 18231.0 16081.3 3170.5 5089.2 7733.2 16710.1 6074.5 2049.1 Population 5.2 19.2 5.3 12.2 70.3 30.3 12.4 20.4 25.6 55.6 28.3 53.5
Econ. Prod. 149.4 519.3 144.4 321.0 1885.2 633.5 308.1 623.9 616.7 1502.5 672.4 1269.3 Note: Standardized flow are in pounds of freight per square mile, per capita, and per $ trillion GMP of the Piedmont and the respective megaregion (or non-megaregion areas).
279
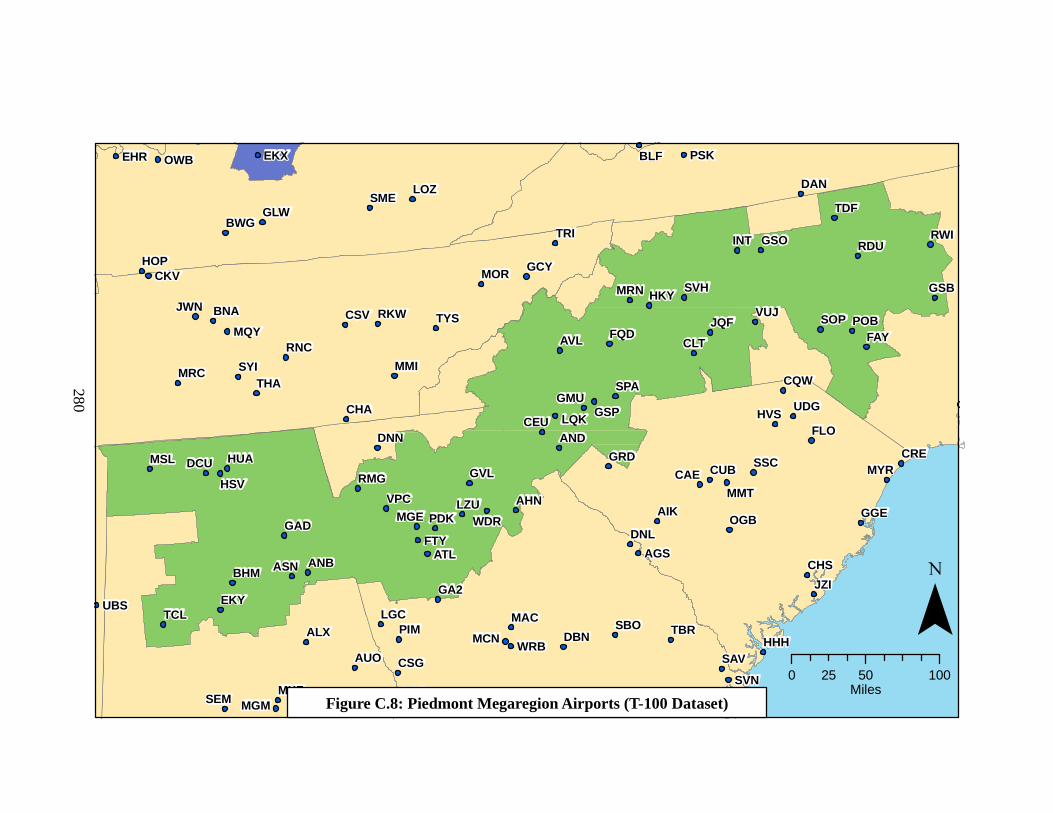
ALX
ANB
AUO
EKY
BHM
DCU
GAD
HSV
MXFMGM
MSL HUA
SEM
ASN
TCL
AHN
FTYATL
PDKDNL
AGS
VPC
CSG
DNN
DBN
LSF
GVL
LGC
LZU
MAC
MCN
MGE
PIM
RMG
SVN
SAV
TBRSBO
WRB
GA2
WDR
BWG
EKX
HOP
GLW
EHR
LOZ
OWB
SME
UBS
VUJ
AVL CLT
JQFFAY
POB
GSB
GSO
HKYMRN
SOP
RDURWI
TDF
FQD
SVH
INT
AIK
AND
JZI
CHS
CQW
CEU
CAE CUB
UDG
MMT
FLO
GGE
GMU
GRD
GSP HVS
MYRCRE
OGB
LQK
SPA
SSC
MMI
TRI
CHA
CKV
MRC
CSV
GCY
TYS
RNC
MOR
BNAJWNRKW
SYI
MQY
THA
DAN
PSKBLF
HHH¯
0 50 10025Miles
Figure C.8: Piedmont Megaregion Airports (T-100 Dataset)
280

281
Table C.17: Southern California Passenger Flows
Passengers (trips)
Production (trips)
Attraction (trips)
Northern California 393508204 197048959 196459245 International 287299045 144629896 142669149 Midwest 283132159 142309600 140822559 Non-Mega 196506726 98193475 98313251 Northeast 187454212 95079001 92375211 Texas Triangle 175845476 87288998 88556478 Arizona Sun Corridor 161391734 80360583 81031151 Intramega 119118232 119118232 Cascadia 112478567 55852015 56626552 Front Range 104584778 51877748 52707030 Piedmont 69145817 35404769 33741048 Gulf Coast 58763184 29283986 29479198 Southern Florida 42146047 21232183 20913864
Standardized by: AZ Casc FR Gulf Mid NE NCal Pied Intra-mega SFl TX
Non-Mega
Area 1458.3 1030.0 881.9 490.9 1060.8 1517.9 3576.1 569.3 1925.5 418.7 1199.2 85.2 Population 6.11 3.84 3.93 1.75 3.74 2.62 11.38 1.88 5.45 1.15 4.63 2.06
Economic Production 131.4 81.9 82.6 37.6 91.0 51.7 237.1 45.4 114.9 25.6 94.8 46.0 Note: Standardized flow are in trips per square mile, per capita, and per $ trillion GMP of Southern California and the respective megaregion (or non-megaregion areas).
281
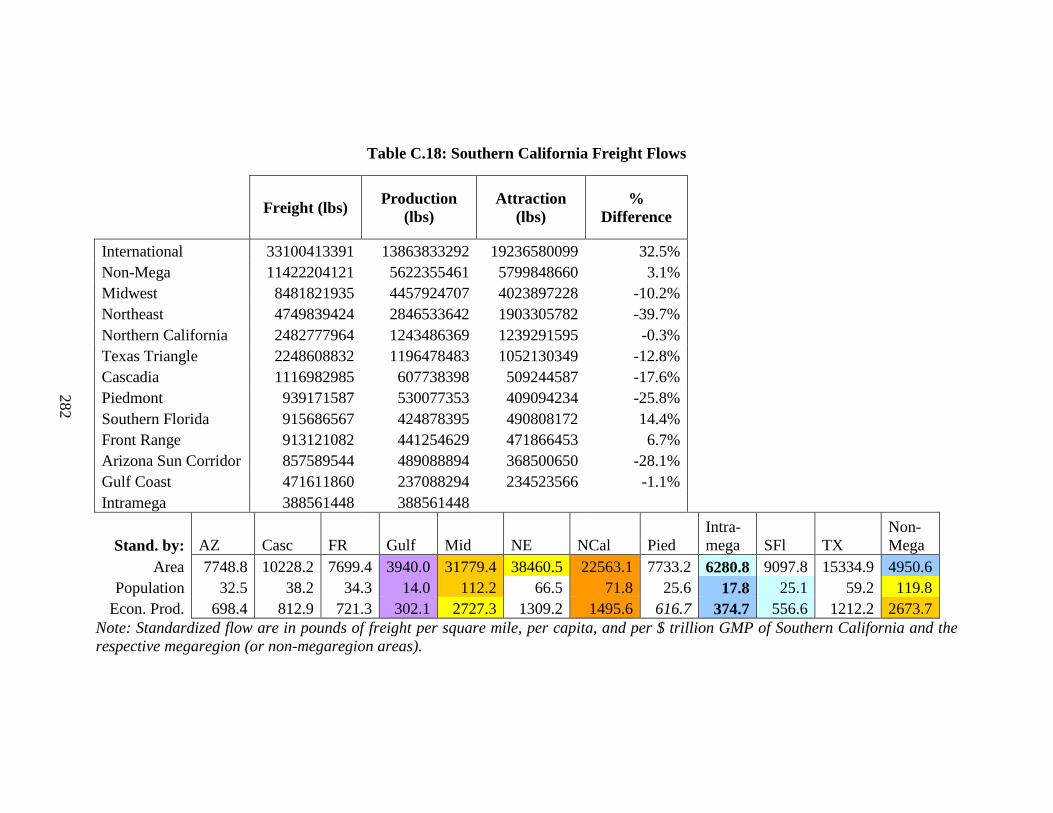
282
Table C.18: Southern California Freight Flows
Freight (lbs) Production
(lbs) Attraction
(lbs) %
Difference
International 33100413391 13863833292 19236580099 32.5% Non-Mega 11422204121 5622355461 5799848660 3.1% Midwest 8481821935 4457924707 4023897228 -10.2% Northeast 4749839424 2846533642 1903305782 -39.7% Northern California 2482777964 1243486369 1239291595 -0.3% Texas Triangle 2248608832 1196478483 1052130349 -12.8% Cascadia 1116982985 607738398 509244587 -17.6% Piedmont 939171587 530077353 409094234 -25.8% Southern Florida 915686567 424878395 490808172 14.4% Front Range 913121082 441254629 471866453 6.7% Arizona Sun Corridor 857589544 489088894 368500650 -28.1% Gulf Coast 471611860 237088294 234523566 -1.1% Intramega 388561448 388561448
Stand. by: AZ Casc FR Gulf Mid NE NCal Pied Intra-mega SFl TX
Non-Mega
Area 7748.8 10228.2 7699.4 3940.0 31779.4 38460.5 22563.1 7733.2 6280.8 9097.8 15334.9 4950.6 Population 32.5 38.2 34.3 14.0 112.2 66.5 71.8 25.6 17.8 25.1 59.2 119.8
Econ. Prod. 698.4 812.9 721.3 302.1 2727.3 1309.2 1495.6 616.7 374.7 556.6 1212.2 2673.7 Note: Standardized flow are in pounds of freight per square mile, per capita, and per $ trillion GMP of Southern California and the respective megaregion (or non-megaregion areas).
282

IFP
A20A09
IGM
HII
1G4
NYL
APV
BFL
BUR
CXL
CLR
CNO
EDW
NJK
IPL
IYK
WJF
POC
VBG
LPC
LGBLAX
MHV
ONT
OXR
PMD
PSPUDD
TRM
PRB
NTD
PTV
RIV
SBD
SEESANNKX
NZYSDM
SBP
SNA
SBA
SMX
SMO
MIT
TSP
TOA
TLR
TNP
VNY
VCV
INS
LSVVGT
LAS
DRA SGU
CLD
BLD
¯0 50 10025
Miles
Figure C.9: Southern California Megaregion Airports (T-100 Dataset)
283
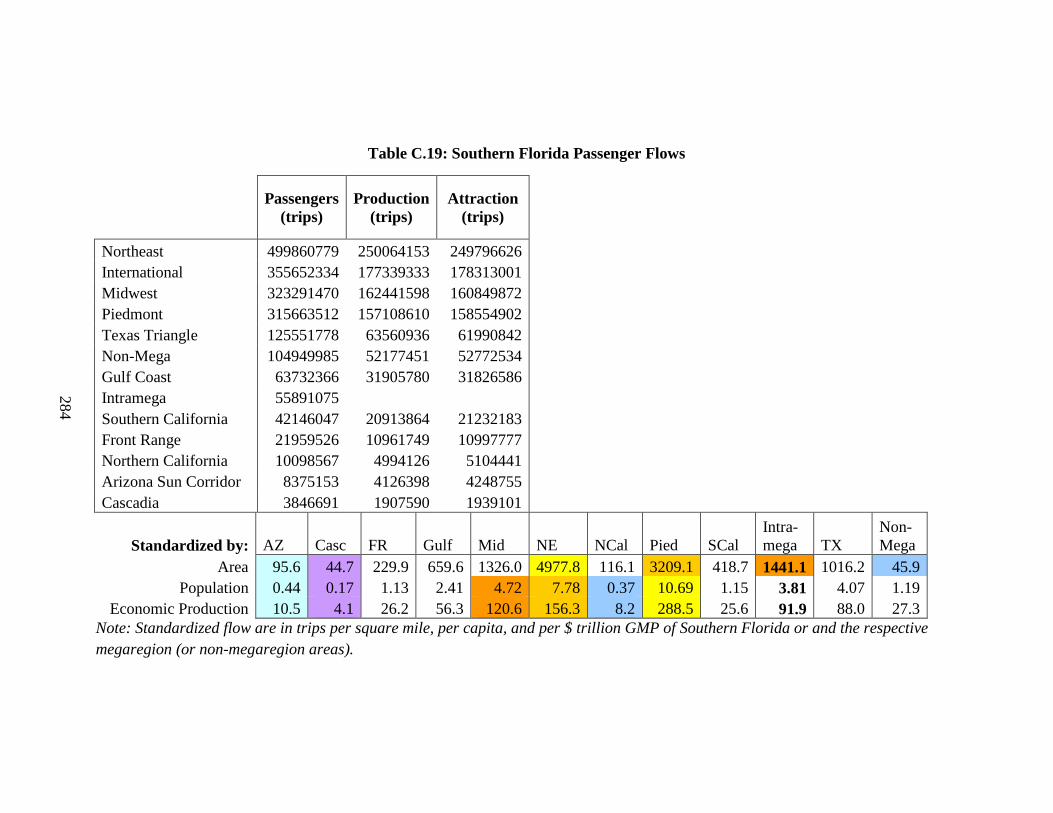
284
Table C.19: Southern Florida Passenger Flows
Passengers (trips)
Production (trips)
Attraction (trips)
Northeast 499860779 250064153 249796626 International 355652334 177339333 178313001 Midwest 323291470 162441598 160849872 Piedmont 315663512 157108610 158554902 Texas Triangle 125551778 63560936 61990842 Non-Mega 104949985 52177451 52772534 Gulf Coast 63732366 31905780 31826586 Intramega 55891075 Southern California 42146047 20913864 21232183 Front Range 21959526 10961749 10997777 Northern California 10098567 4994126 5104441 Arizona Sun Corridor 8375153 4126398 4248755 Cascadia 3846691 1907590 1939101
Standardized by: AZ Casc FR Gulf Mid NE NCal Pied SCal Intra-mega TX
Non-Mega
Area 95.6 44.7 229.9 659.6 1326.0 4977.8 116.1 3209.1 418.7 1441.1 1016.2 45.9 Population 0.44 0.17 1.13 2.41 4.72 7.78 0.37 10.69 1.15 3.81 4.07 1.19
Economic Production 10.5 4.1 26.2 56.3 120.6 156.3 8.2 288.5 25.6 91.9 88.0 27.3 Note: Standardized flow are in trips per square mile, per capita, and per $ trillion GMP of Southern Florida or and the respective megaregion (or non-megaregion areas).
284

285
Table C.20: Southern Florida Freight Flows
Freight (lbs) Production
(lbs) Attraction (lbs) %
Difference
International 51579177100 24040060904 27539116196 13.6% Non-Mega 5885882057 2778367192 3107514865 11.2% Midwest 4299350997 1932108492 2367242505 20.2% Northeast 2477715657 1455470902 1022244755 -35.0% Piedmont 1643706377 864547959 779158418 -10.4% Texas Triangle 1339292730 639063139 700229591 9.1% Southern California 915686567 490808172 424878395 -14.4% Intramega 396491414 396491414 Gulf Coast 330805826 191704354 139101472 -31.8% Northern California 261523383 153967484 107555899 -35.5% Cascadia 90111295 43129815 46981480 8.5% Front Range 81033994 55945970 25088024 -76.2% Arizona Sun Corridor 34337377 18249650 16087727 -12.6%
Stand. by: AZ Casc FR Gulf Mid NE NCal Pied SCal Intra-mega TX
Non-Mega
Area 392.0 1046.3 848.4 3423.9 17633.6 24674.0 3007.5 16710.1 9097.8 10223.1 10839.9 2576.8 Population 1.8 4.1 4.2 12.5 62.8 38.6 9.5 55.6 25.1 27.0 43.5 66.7
Econ. Prod. 43.0 95.4 96.8 292.2 1603.6 774.5 212.4 1502.5 556.6 652.1 939.2 1531.6 Note: Standardized flow are in pounds of freight per square mile, per capita, and per $ trillion GMP of Southern Florida and the respective megaregion (or non-megaregion areas).
285

DHN
04A
BFM
AAF
BOW
BCT
COF
XMR
CEW
DAB
FLLFXE
FMY
RSW
FPR
GNV
HST
JAX
CRGNIP
EYWNQX
LAL
LEE
MTH
NRB
MLB
TMBTNT
MIAOPFAPF
OCF
MCO
SFB
ISMORL
PAMPFN
PNSNPA
A51
PGD
PIE
SRQSEF
SUA
TLH
TPA
MCF
TIX
VPS
VNC
VRB
PBI
ABYSSI
BQKDQHTMA
VLD
VAD
AYS
FL3
UST
¯0 100 20050
Miles
Figure C.1: Southern Florida Megaregion Airports (T-100 Dataset)
286
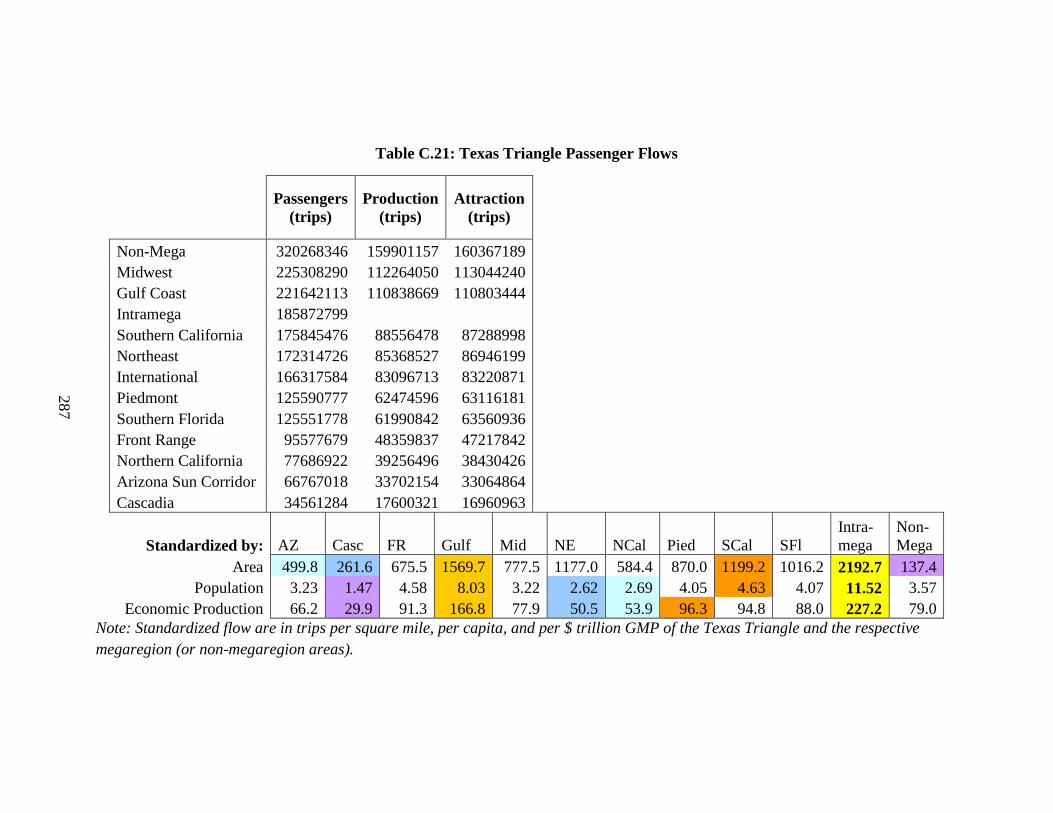
287
Table C.21: Texas Triangle Passenger Flows
Passengers (trips)
Production (trips)
Attraction (trips)
Non-Mega 320268346 159901157 160367189 Midwest 225308290 112264050 113044240 Gulf Coast 221642113 110838669 110803444 Intramega 185872799 Southern California 175845476 88556478 87288998 Northeast 172314726 85368527 86946199 International 166317584 83096713 83220871 Piedmont 125590777 62474596 63116181 Southern Florida 125551778 61990842 63560936 Front Range 95577679 48359837 47217842 Northern California 77686922 39256496 38430426 Arizona Sun Corridor 66767018 33702154 33064864 Cascadia 34561284 17600321 16960963
Standardized by: AZ Casc FR Gulf Mid NE NCal Pied SCal SFl Intra-mega
Non-Mega
Area 499.8 261.6 675.5 1569.7 777.5 1177.0 584.4 870.0 1199.2 1016.2 2192.7 137.4 Population 3.23 1.47 4.58 8.03 3.22 2.62 2.69 4.05 4.63 4.07 11.52 3.57
Economic Production 66.2 29.9 91.3 166.8 77.9 50.5 53.9 96.3 94.8 88.0 227.2 79.0 Note: Standardized flow are in trips per square mile, per capita, and per $ trillion GMP of the Texas Triangle and the respective megaregion (or non-megaregion areas).
287
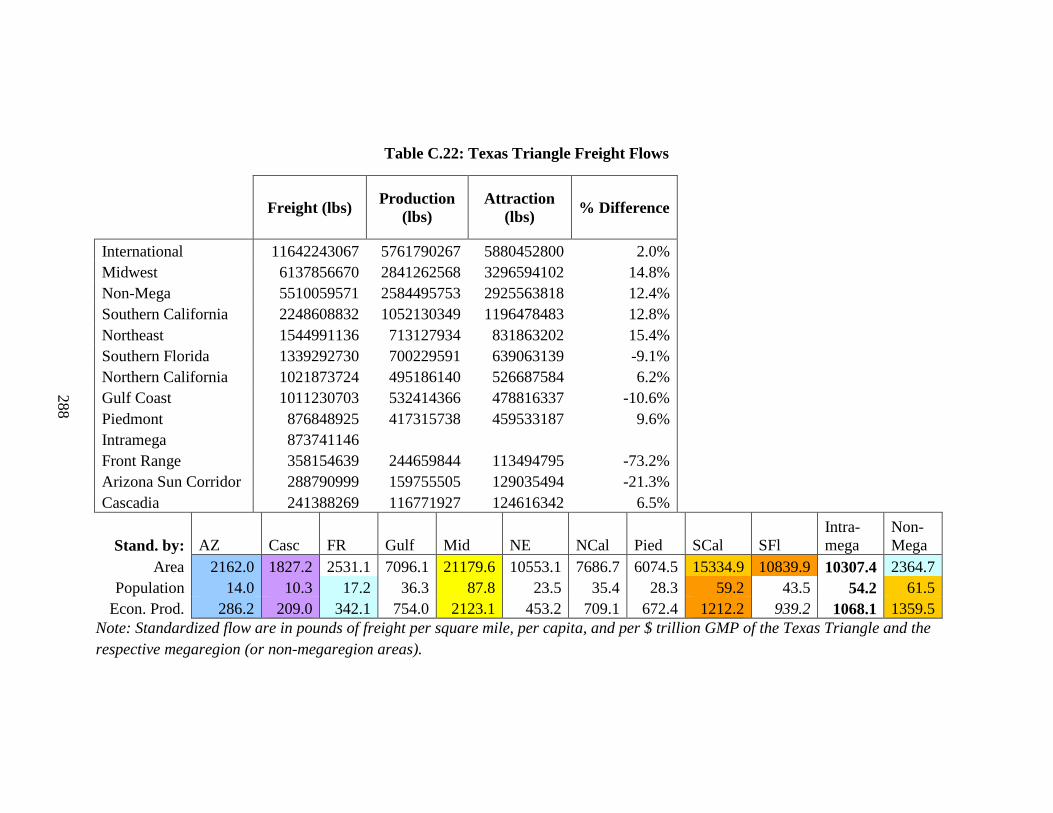
288
Table C.22: Texas Triangle Freight Flows
Freight (lbs) Production
(lbs) Attraction
(lbs) % Difference
International 11642243067 5761790267 5880452800 2.0% Midwest 6137856670 2841262568 3296594102 14.8% Non-Mega 5510059571 2584495753 2925563818 12.4% Southern California 2248608832 1052130349 1196478483 12.8% Northeast 1544991136 713127934 831863202 15.4% Southern Florida 1339292730 700229591 639063139 -9.1% Northern California 1021873724 495186140 526687584 6.2% Gulf Coast 1011230703 532414366 478816337 -10.6% Piedmont 876848925 417315738 459533187 9.6% Intramega 873741146 Front Range 358154639 244659844 113494795 -73.2% Arizona Sun Corridor 288790999 159755505 129035494 -21.3% Cascadia 241388269 116771927 124616342 6.5%
Stand. by: AZ Casc FR Gulf Mid NE NCal Pied SCal SFl Intra-mega
Non-Mega
Area 2162.0 1827.2 2531.1 7096.1 21179.6 10553.1 7686.7 6074.5 15334.9 10839.9 10307.4 2364.7 Population 14.0 10.3 17.2 36.3 87.8 23.5 35.4 28.3 59.2 43.5 54.2 61.5
Econ. Prod. 286.2 209.0 342.1 754.0 2123.1 453.2 709.1 672.4 1212.2 939.2 1068.1 1359.5 Note: Standardized flow are in pounds of freight per square mile, per capita, and per $ trillion GMP of the Texas Triangle and the respective megaregion (or non-megaregion areas).
288

CDH
ELD
TXK
AEXESF
BTR
BAD
LFTLCH
MLU
ARA
RSNSHV
UXL
GLH
HEZ
DYS
ABI
AUS
BPT
BWDCOM
CLL
COT
RBD
ADS
DFW DAL
DLFDRT
DTO
GRK
FTW
AFW
GLS
GVT
MNZ
LHB
EFDSGR HOU
IAH
CXO
DWH
ILE
GGG
LFK
TKI
ASL
PSX
PSN
SJT
SKFSAT
SWW
TPL
TYR
RNDUVA
VCT
ACT CNW
SPS
LJN
¯0 100 20050
Miles
Figure C.11: Texas Triangle Megaregion Airports (T-100 Dataset)
289
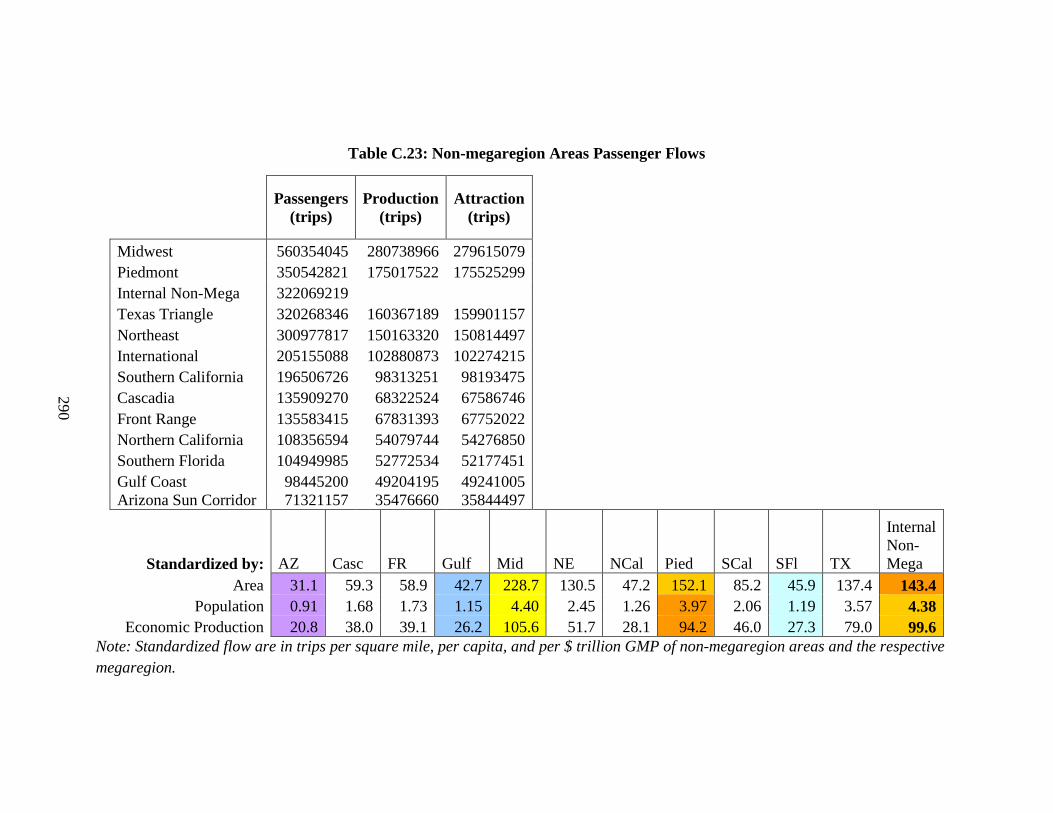
290
Table C.23: Non-megaregion Areas Passenger Flows
Passengers (trips)
Production (trips)
Attraction (trips)
Midwest 560354045 280738966 279615079 Piedmont 350542821 175017522 175525299 Internal Non-Mega 322069219 Texas Triangle 320268346 160367189 159901157 Northeast 300977817 150163320 150814497 International 205155088 102880873 102274215 Southern California 196506726 98313251 98193475 Cascadia 135909270 68322524 67586746 Front Range 135583415 67831393 67752022 Northern California 108356594 54079744 54276850 Southern Florida 104949985 52772534 52177451 Gulf Coast 98445200 49204195 49241005 Arizona Sun Corridor 71321157 35476660 35844497
Standardized by: AZ Casc FR Gulf Mid NE NCal Pied SCal SFl TX
Internal Non-Mega
Area 31.1 59.3 58.9 42.7 228.7 130.5 47.2 152.1 85.2 45.9 137.4 143.4 Population 0.91 1.68 1.73 1.15 4.40 2.45 1.26 3.97 2.06 1.19 3.57 4.38
Economic Production 20.8 38.0 39.1 26.2 105.6 51.7 28.1 94.2 46.0 27.3 79.0 99.6 Note: Standardized flow are in trips per square mile, per capita, and per $ trillion GMP of non-megaregion areas and the respective megaregion.
290

291
Table C.24: Non-megaregion Areas Freight Flows
Freight (lbs)
Production (lbs)
Attraction (lbs)
% Difference
International 30619685926 12179623789 18440062137 40.9% Midwest 24039018436 12548983487 11490034949 -8.8% Internal Non-Mega 15342467222 Southern California 11422204121 5799848660 5622355461 -3.1% Northeast 11238465385 5645345545 5593119840 -0.9% Northern California 6002280717 2825870462 3176410255 11.7% Southern Florida 5885882057 3107514865 2778367192 -11.2% Texas Triangle 5510059571 2925563818 2584495753 -12.4% Piedmont 4723103802 2373898200 2349205602 -1.0% Cascadia 3814413745 1942473340 1871940405 -3.7% Gulf Coast 2200242966 1286920752 913322214 -34.0% Front Range 1922919768 1061803827 861115941 -20.9% Arizona Sun Corridor 1343019943 675851951 667167992 -1.3%
Standardized by: AZ Casc FR Gulf Mid NE NCal Pied SCal SFl TX
Internal Non-Mega
Area 585.4 1663.7 835.3 955.3 9810.2 4871.5 2617.0 2049.1 4950.6 2576.8 2364.7 6832.9 Population 17.2 47.1 24.6 25.8 188.9 91.3 69.6 53.5 119.8 66.7 61.5 208.7
Economic Production 392.0 1067.9 555.1 585.3 4528.8 1929.0 1555.8 1269.3 2673.7 1531.6 1359.5 4742.6 Note: Standardized flow are in pounds of freight per square mile, per capita, and per $ trillion GMP of non-megaregion areas and the respective megaregion.
291

292
Table C.25: International Passenger Flows
Passengers (trips)
Production (trips)
Attraction (trips)
Northeast 659618020 331571644 328046376 Southern Florida 355652334 178313001 177339333 Midwest 290824582 146694701 144129881 Southern California 287299045 142669149 144629896 Non-Mega 205155088 102274215 102880873 Texas Triangle 166317584 83220871 83096713 Northern California 134222145 67246860 66975285 Piedmont 121341314 60866277 60475037 Gulf Coast 89645158 44794478 44850680 Cascadia 44265462 22353424 21912038 Front Range 19542018 9884582 9657436 Arizona Sun Corridor 18073361 8888691 9184670 International n/a n/a n/a
292

293
Table C.26: International Freight Flows
Freight (lbs) Production
(lbs) Attraction
(lbs) %
Difference
Northeast 68591741110 38626675299 29965065811 -25.3% Southern Florida 51579177100 27539116196 24040060904 -13.6% Midwest 38671772113 21306191840 17365580273 -20.4% Southern California 33100413391 19236580099 13863833292 -32.5% Non-Mega 30619685926 18440062137 12179623789 -40.9% Northern California 13360881436 7401294294 5959587142 -21.6% Piedmont 12189089328 6650749393 5538339935 -18.3% Texas Triangle 11642243067 5880452800 5761790267 -2.0% Gulf Coast 4910028163 2145331852 2764696311 25.2% Cascadia 3696275053 1591023784 2105251269 27.8% Front Range 287133073 151424238 135708835 -10.9% Arizona Sun Corridor 169834839 86585898 83248941 -3.9% International n/a n/a n/a n/a
293

294
Table C.27: Piedmont Passenger Growth Over Time
Year Flow Type 1990 1991 1992 1993 1994 1995 1996 1997 1998
Large to Large 737714 555425 572943 588402 718393 694562 892709 938443 871023 Large to M/S/N* 3632735 3101226 3370988 3728181 4517335 4668108 4879841 5043563 5236786 Large to N-P* 0 0 0 64 0 0 0 0 0 M/S/N to M/S/N 134727 106967 114666 112780 80324 28953 4934 1766 2360 M/S/N to N-P 0 0 0 0 0 30 0 0 0 N-P to N-P 0 0 0 0 0 0 0 0 0
TOTAL 4505176 3763618 4058597 4429427 5316052 5391653 5777484 5983772 6110169
Year 1999 2000 2001 2002 2003 2004 2005 2006 2007 2008
Large to Large 871727 850382 712921 678975 664678 671670 885267 1059770 1359562 1371588 Large to M/S/N 5228630 5383583 4794439 4590647 4805141 4824137 4885566 4626156 4681129 4796938 Large to N-P 0 0 0 4488 1675 15792 37605 18863 19787 6839 M/S/N to M/S/N 1824 4530 24527 5392 4679 18274 8587 3078 27559 13152 M/S/N to N-P 0 0 0 556 381 148 458 371 279 460 N-P to N-P 0 0 0 97 160 66 36 0 445 996
TOTAL 6102181 6238495 5531887 5280155 5476714 5530087 5817519 5708238 6088761 6189973 Note: All flows in number of trips. *M/S/N = Medium/Small/Non-hub primary airports *N-P = Non-primary airport
294
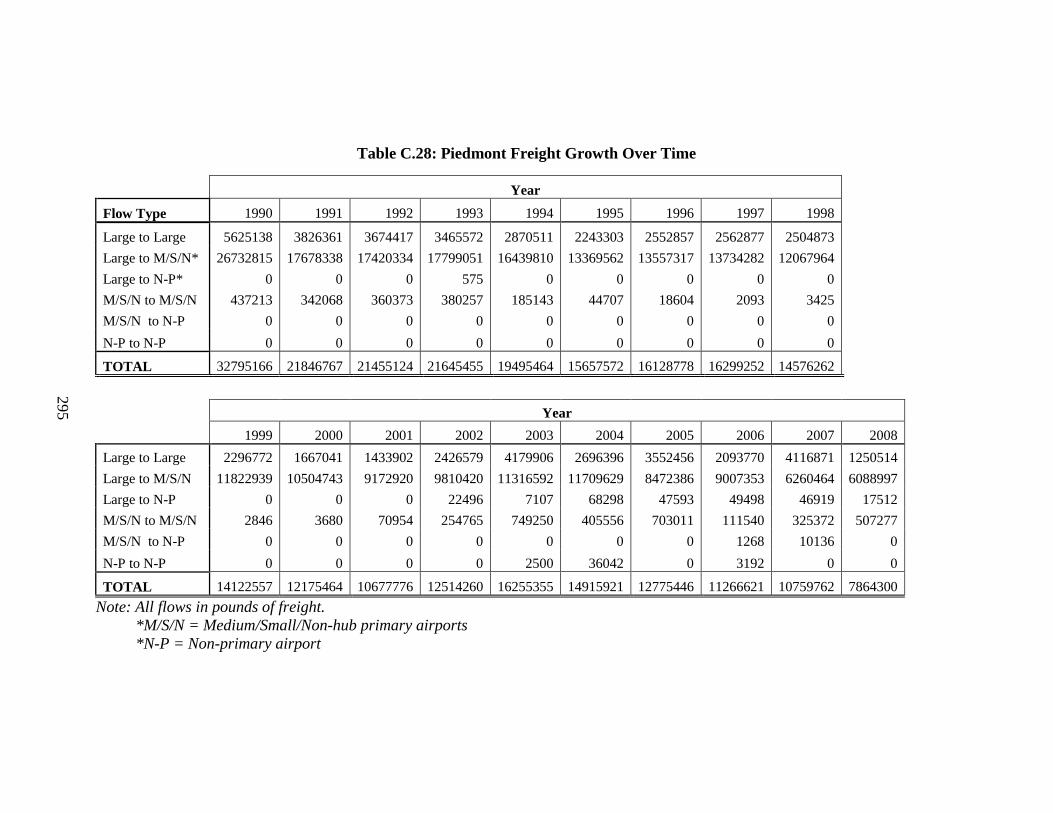
295
Table C.28: Piedmont Freight Growth Over Time
Year
Flow Type 1990 1991 1992 1993 1994 1995 1996 1997 1998
Large to Large 5625138 3826361 3674417 3465572 2870511 2243303 2552857 2562877 2504873
Large to M/S/N* 26732815 17678338 17420334 17799051 16439810 13369562 13557317 13734282 12067964
Large to N-P* 0 0 0 575 0 0 0 0 0
M/S/N to M/S/N 437213 342068 360373 380257 185143 44707 18604 2093 3425
M/S/N to N-P 0 0 0 0 0 0 0 0 0
N-P to N-P 0 0 0 0 0 0 0 0 0
TOTAL 32795166 21846767 21455124 21645455 19495464 15657572 16128778 16299252 14576262
Year
1999 2000 2001 2002 2003 2004 2005 2006 2007 2008
Large to Large 2296772 1667041 1433902 2426579 4179906 2696396 3552456 2093770 4116871 1250514
Large to M/S/N 11822939 10504743 9172920 9810420 11316592 11709629 8472386 9007353 6260464 6088997
Large to N-P 0 0 0 22496 7107 68298 47593 49498 46919 17512
M/S/N to M/S/N 2846 3680 70954 254765 749250 405556 703011 111540 325372 507277
M/S/N to N-P 0 0 0 0 0 0 0 1268 10136 0
N-P to N-P 0 0 0 0 2500 36042 0 3192 0 0
TOTAL 14122557 12175464 10677776 12514260 16255355 14915921 12775446 11266621 10759762 7864300
Note: All flows in pounds of freight. *M/S/N = Medium/Small/Non-hub primary airports *N-P = Non-primary airport
295
296
REFERENCES Airbus. (2007). Flying By Nature - Global Market Forecast 2007-2026. Blagnac: Airbus.
Airports Council International. (2010). “ACI releases World Airport Traffic Report 2009.” Media Release. Geneva.
America 2050. (2006). America 2050: A Prospectus. New York: Regional Plan Association.
---- (2008). America 2050: An Infrastructure Vision for 21st Century America. New York: Regional Plan Association.
Bhadra, D., & Wells, M. (2005). “Air Travel by State: Its Determinants and Contributions in the United States.” Public Works Management & Policy, 10(2), 119-137.
Bright, D. W. (2002). Final Rule Changes to T-100 and T-100 ( f ) Traffic Reporting Systems. Washington D.C.: U.S. Department of Transportation, Bureau of Transportation Statistics, Office of Airline Information.
Butler, K., Hammerschmidt, S., Steiner, F., & Zhang, M. (2009). Reinventing the Texas Triangle: Solutions for Growing Challenges. Sustainable Development. Center for Sustainable Development, School of Architecture, The University of Texas at Austin.
Button, K., & Lall, S. (1999). “The Economics of Being an Airport Hub City.” Research in Transportation Economics, 5, 75-105.
Choi, J. H., Barnett, G. A., & Chon, B. (2006). “Comparing World City Networks: A Network Analysis of Internet Backbone and Air Transport Intercity Linkages.” Global Networks, 6(1), 81-99.
Contant, C., Ross, C. L., et al. (2005). The Piedmont Atlantic Megalopolis [PAM]. Georgia Institute of Technology, Tech College of Architecture.
Coogan, M. A., Hansen, M., Ryerson, M. S., Kiernan, L., Last, J., Marchi, R., & Yatzeck, R. (2010). ACRP Report 31: Innovative Approaches to Addressing Aviation Capacity Issues in Coastal Mega-regions. Airport Cooperative Research Program.
Crabtree, T., Hoang, T., Edgar, J., & Heinicke, K. (2008). World Air Cargo Forecast 2008-2009. Seattle: Boeing.
de Neufville, R. (2008). “Building the Next Generation of Airport Systems.” The Bridge, Transportation Infrastructure, 38(2).

297
Delgado, E., Epstein, D., Joo, Y., Mann, R., Moon, S., Raleigh, C., Rhodes, E., & Rutzick, D. (2006). Methods for Planning the Great Lakes MegaRegion. University of Michigan, Urban and Regional Planning Program.
Derudder, B., & Witlox, F. (2005). “An Appraisal of the Use of Airline Data in Assessing the World City Network: A Research Note on Data.” Urban Studies, 42(13), 2371-2388.
---- (2008). “Mapping World City Networks Through Airline Flows: Context, Relevance, and Problems.” Journal of Transport Geography, 16(5), 305-312.
Dewar, M., & Epstein, D. (2007). “Planning for "Megaregions" in the United States.” Journal of Planning Literature, 22(2), 108-124.
Federal Aviation Administration. (2007). Capacity Needs in the National Airspace System and Operational Capacity. Washington, D.C.
Fik, T. J., Ivy, R. L., & Malecki, E. J. (1995). “Changes in Air Service Connectivity and Employment.” Environment and Planning A, 27(2), 165-179.
Florida, R., Gulden, T., & Mellander, C. (2007). “The Rise of the Mega-Region.” Population (English Edition), October, 1-31.
Goetz, A. R. (1992). “Air Passenger Transportation and Growth in the U.S. Urban System, 1950-1987.” Growth and Change, 23(2), 217-238.
Gottmann, J. (1957). “Megalopolis or the Urbanization of the Northeastern Seaboard.” Economic Geography, 33, 189-200.
---- (1961). Megalopolis or the Urbanization of the Northeastern Seaboard . New York: Twentieth Century Fund.
Hagler, Y., & Todorovich, P. (2009). Where High-Speed Rail Works Best. New York: America 2050.
Irwin, M. D., & Kasarda, J. D. (1991). “Air Passenger Linkages and Employment Growth in U.S. Metropolitan Areas.” American Sociological Review, 56(4), 524-537.
Keeling, D.J. (1995). “Transport and the World City Paradigm”. In: P.L. Knox & P.J. Taylor, (Eds.). World Cities in a World-System, 115-131. Cambridge : Cambridge University Press.
Kern County Council of Governments, et al. (2005). The Southern California Mega-region: A Case Study of Global Gateway Regions: America’s Third Century Strategy.
Lang, R. E., & Dhavale, D. (2005). “Beyond Megalopolis: Exploring America’s New "Megapolitan" Geography.” Metropolitan Institute Census Report Series, 05(01), 1-36.
298
Moreno, E. L., Oyeyinka, O., & Mboup, G. (2010). State of the World’s Cities 2010/ 2011: Bridging The Urban Divide. New York: United Nations.
Odoni, A., & Morisset, T. (2010). “Performance Comparisons Between US and European Airports.” 12th World Conference on Transport Research , 9. Lisbon.
Ross, C. L. (2008). Megaregions: Literature Review of the Implications for U.S. Infrastructure Investment and Transportation Planning. Washington D.C.:U.S. Department of Transportation, Federal Highway Administration.
---- (2009). Megaregions: Building for Global Competitiveness. Washington D.C.: Island Press.
Ross, C. L., Woo, M., Barringer, J., West, H., & Doyle, L. H. (2008). Identifying Megaregions in the US: Implications for Infrastructure Investment. Georgia Institute of Technology, Center for Quality Growth and Regional Development.
San Francisco Planning And Urban Research Association. (2010). The Northern California Megaregion: It’s Time to Start Solving Problems at the Scale of the Megaregion. San Francisco.
Sassen, S. (1991). The Global City: New York London, Tokyo. Princeton: Princeton University Press.
Seltzer, E., et al. (2005). Ecolopolis: Making the Case for a Cascadian Supercity. Portland State University.
Shin, K., & Timberlake, M. (2000). “World Cities in Asia: Cliques, Centrality and Connectedness.” Urban Studies, 37(12), 2257-2285.
Smith, D., & Timberlake, M. (1998). “Cities and the Spatial Articulation of the World Economy through Air Travel.” In: P. S. Ciccantell & S. G. Bunker (Eds.), Space and Transport in the World, 213-240. Westport, Connecticut: Greenwood Press.
---- (2001). “World City Networks and Hierarchies, 1977-1997: An Empirical Analysis of Global Air Travel Links.” American Behavioral Scientist, 44(10).
---- (2002). “Hierarchies of Dominance Among World Cities: A Network Approach.” In: S. Sassen (Ed.). Global Networks, Linked Cities, 117-141. London : Routledge.
Taylor, M. J., & Yaro, B. (2010). “Making High-speed Rail Work in the Northeast Megaregion.” Practice. Philadelphia.
Teitz, M. B., & Barbour, E. (2007). “Megaregions in California : Challenges to Planning and Policy.” The Healdsburg Research Seminar on Megaregions.
Tomer, A., & Puentes, R. (2009). Expect Delays: An Analysis of Air Travel Trends in the United States. Washington.: Brookings.
University of Pennsylvania School of Design. (2005). Reinventing Megalopolis: The Northeast Megaregion.

299
van Geenhuizen, M., & Doornbos, H. (2008). “Airports as Nodes in Global Knowledge Networks.” In: M. Giaoutzi & P. Nijkamp (Eds.), Network Strategies in Europe: Developing the Future for Transport and ICT , 219-237. Ashgate Publishing, Ltd.
Witlox, F, Vereecken, L., & Derudder, B. (2004). GaWC Research Bulletin 157: Mapping the Global Network Economy on the Basis of Air Passenger Transport Flows.