a-678_327309_v1.pdf - SMARTech
333
GEORGIA INSTITUTE OF '"TEChNOLOGY Engineering Experiment Station . PR_OJECT INITIATION Date June ll, 3 ••••• ....... " ........... 4 " ........... " • • • • • • • • • • • • .. • • • • • • • • .. • • • Project Title: Electronic Equipment Interference Characteristics - Communication Type project No.: A..-678 ' .t·-- ,, Sponsor: Department of the Army 1 Signal .. Corps Effective: ........ ... ............................................ Estimated to run until: ., .. ... *Anticipatory Costa Permitted /;from 2-15-63 to this date. _,,.,,._ ,;;: •' Amount: Estimated· Total of· $159 1 880.00 of which $99,660.02 has been allotted Reports: Monthly Letter Reports · •· ;. Quarterly Progress Reports Final Report · .. Directory Ma.nusc,;,:i:pt __ ,_ .... ,.. .. ---·· .. ....... w. •. ,.,. ... f u.s.Army Electronics Ms.terial Agency · Fort Monmouth.Procurement Office Fort Monmouth, New Jersey Attn: Contracting·. (for admin. :matters) U.S.Army Electronics ResearCh & Development Laboratory Attn: New matters) · Assigned to .Communicat.ions .. .BI:an.oh, ... ........................... Di v lsi on COPIES TO: 0 Project Director Technical Information Section 0 Director 0 :;. ' Associate Direotor 0 Assistant Director(s) . Photographic Laboratory •. ;... 0 ;;s9Pp ., ·. ·.( , .·. . .. . D. Division Chiefs ;•' .>·' 0 Accounting '. 0 Branch Head Purchasing General Office Services Repprt Section · Rich Electronic Computer Center D Library · .: · 0 Engineering Design Services ·. ,· S Form 400 (Rev 10-62) I'
-
Upload
khangminh22 -
Category
Documents
-
view
1 -
download
0
Transcript of a-678_327309_v1.pdf - SMARTech

GEORGIA INSTITUTE OF '"TEChNOLOGY Engineering Experiment Station
. PR_OJECT INITIATION
Date June ll, ~96 3 ••••• ~ ~ ....... " ........... 4 " ........... " • • • • • • • • • • • • .. • • • • • • • • .. • • •
Project Title: Electronic Equipment Interference Characteristics - Communication Type
project No.: A..-678 :~-.:~;~~· '
.t·-- ,, Sponsor: Department of the Army 1 Signal .. Corps
Effective: ........ ?.:-:~~?} ... ~ ............................................ Estimated to run until:
., .. ~\ ... *Anticipatory Costa Permitted /;from 2-15-63 to this date.
_,,.,,._ ,;;:
.~-. •'
Amount: Estimated· Total of· $1591 880.00 of which $99,660.02 has been allotted
Reports: Monthly Letter Reports · •· ;. Quarterly Progress Reports
Final Report · .. Directory Ma.nusc,;,:i:pt __ ,_ .... ,.. .. ---·· .. -·-·-~-~·-·--~·~"·
::.....--.:.:.~--.-...-- ....... w. ··~·-·"··-""· •. ,.,. ... f
contact~:Pe'~son: u.s.Army Electronics Ms.terial Agency · Fort Monmouth.Procurement Office
Fort Monmouth, New Jersey
Attn: Contracting·. Offi,~~r (for admin. :matters)
U.S.Army Electronics ResearCh & Development Laboratory
Attn: '-~~j~~u~?~ New J~rsey
~chn~ matters)
· Assigned to .Communicat.ions .. .BI:an.oh, ... Ele.o.t.rnn..:l..c.~ ........................... Di v lsi on
COPIES TO:
0 Project Director Technical Information Section
0 Director
0 :;. '
Associate Direotor
0 Assistant Director(s)
. Photographic Laboratory •. ; ... 0 ;;s9Pp ., ·. ·.( , .·. . <~ .. ~/;·
~ecuri~/om~er .
D. Division Chiefs ;•' .>·' 0 Accounting '.
0 Branch Head Purchasing
General Office Services Repprt Section ·
Rich Electronic Computer Center D Library
· .: · 0 Engineering Design Services ·. ,·
S Form 400 (Rev 10-62)
I'

'··t
.~· ' )
GEORGIA· INSTITU#rE OF TECHNOLOGY
Engineering Experiment Station
PROJECT TERMINATION
PHOJECT TITLE:
PROJECT NO:
PHOJECT DIHECTOR: ~ W. R. Free
SPONSOH: D.;;pt. o.f the Ar.tly, Sign~1l Corp. 9-3o-56
TEHMINATION EFFECTIVE:---------------
October 7, 19'5·S Date---------
CHAHGES SHOULD CLEAH ACCOUNTING BY: All chnrges ha.ve clettred
COPIES TO:
Project Director
Director
Associate Director
Assistant Directors
Division Chief
Branch Head
Accounting
CB, E.
Engineering Design Services
l. /' · Avl ·~'t~l':~ ofi ' /\g~(" General Office Services i i V 'i;
Photographic Laboratory
. (I~~ .
Technical Information Section "'YJJ (llY ~ri'ty
Purchasing
·shop
Form EES 402 (R 10-62)

GEORGIA INSTITUTE OF TECHNOLOGY ENGINEERING IDCPERIMENT 8TATION
ATLANTA 13, GEORGIA
3 April 1963
Department of the Army Headquarters U. S. Army Signal Research and Development Laboratory Fort Monmouth, New Jersey
ATTN: Jv'"JX. Sidney Weitz, SELRA/ SL-GFE
L.
SUBJ: Monthly Letter Report No. 1, 15 March 1963, "Electronic Equipment Interference Characteristics, Connnunication Type."
REFERENCES: (l) RFP No. AMC-36-039-63-l2L~24-9l
Gentlemen:
(2) Georgia Tech Research Proposal dated 18 February 196~ (3) Telegram dated 7 March 1963. Contracting of:'icc
SELMA-FMB-lAlB. Intention of Contracting Office·~· to authorize anticipatory cost beginning 15 February 1963 under any contract resulting from RFP No. AY~-36-039-63-12424-91.
The program of research in Electronic Equipment Interference Characteristics, Communication Type, is continuing. The work is over and beyond the work performed under Contract DA-36-039-sc-87183.
Studies are being conducted on cochru1nel CW and pulse interference to a connnunications system utilizing the .AN/TRC-29 and AN/TCC-13 sets. A GEL speech system test set is being used to determine the pattern correspondence index of a speech sample passing through the system.
Case radiation studies have been conducted on the AN/GRC-50 transmitter. The results indicate that steps should be taken to reduce the strength of signals emanating from the upper-right air duct of the high-band tuning head.
Several types of diode mixers are being tested and the resulting data are being processed and analyzed. An objective of the mixer evaluation is to try to find methods for mixer data prediction utilizing only a few measured data points.
Approved:(!
L.ttJ./({e~~ D. W. Robertson, Head Communications Branch
Respectfully submitted:
~?},p E. W. Wood Project Director
lib-sascan
Rectangle
lib-sascan
Rectangle

GEORGIA INSTITUTE OF TECHNOLOGY ENGINEERING EXPERIMENT GTATlON
ATLANTA 13. GEORGiA
16 April 1963
Department of the Army Headquarters U. S. Army Signal Research and
.Development Laboratory Fort Monmouth, New Jersey
ATTN: Mr. Sidney Weitz, SELRA/SL-GFE
SUBJ: Monthly Letter Report No. 2, 15 April 1963, "Electronic Equipment Interference Characteristics, Communication Type.''
Dear Mr. Weitz:
Mr. E. W. Wood attended the 1963 IEEE International Convention at New York City on March 25-28. The paper, "-The Spectral Behavior of Spurious Responses," was presented.
}tr. E. W. Wood visited Fort Monmouth on March 29 to discuss the progress made in the research program of E.lectronic Equipment Interference Characteristics since February , 1963.
Further testing has revealed that the AN/GRC-50 receiver should meet the designed specifications on noise figure throughout the high band.
The results of analyses of the gathered mixer data indicate that incoming signal harmonics cause serious measurement problems. Additional ideas are being formulated which should lead to better. spurious response estimation.
Plans are being made to possibly include in the First Quarterly Report the results of the work done in the following areas of investigation:
1. Transmitter tests 1.1. Case radiation 1.2. pitfalls
2. Receiver Tests 2.1. pitfalls
3. Systems Tests 3.1. Improvements on the GEL machine 3.2. System S/N versus PCI 3.3. CW and pulse interference effects
·.

Monthly Letter Report No. 2
4. Mixer Evaluation
- 2 -
4.1. Effects of harmonics
16 April 1963
4~2. Comparison of data taken on several different diodes
5. Computer Techniques 5.1. Discussion of need for an automated spurious
response selection program to aid receiver design engineers 5.1.1. Crossover spurious responses 5.1.2. p = q spurious responses 5.1.3. responses in 2nd and 3rd
conversion stages
Work has been initiated to our RFI literature abstract file up-to-date. Plans are to include a second b as an appendix to the Second Quarterly
Several are being considered as possible papers at the Tri-Service Coaference. ~nong the s are: Mixer Evaluation and Systems Tests. Abstracts for at least one paper will be submitted for security approval around 15.
D. W. Robertson, Head Communications Branch
Respectfully submitted:
E. W. Wood Project Director
lib-sascan
Rectangle
lib-sascan
Rectangle

GEORG~A T:::C~-H\!OLOGV
ENG!NEE:~ING :;:x?E~IMENT SThTION
ATLANTA 13, GEORGiA
6 June
Accountable Property Officer
Supply Officer, USAELRDL 2504, Charles Wood Area
Fort Monmouth, New Jersey
Sciences. Department, Interference Branch at Destination
Order No. 5871-PM-63-9ln
ATTN: Mr. Sidney Weitz, SELRA/GFE
SUBJ: Monthly Letter Report No. 3, 20 15 to YJ.ay 1963, Contract No., DA ) , 11Electronic
Interfere::.'1CC C!J.aracteristics' Communication Type. rr
Gentlemen:
Further receiver testing has revealed that from the AN/GRC-50 ccrMrrunications and third order intexmodulation tuned are identified to
sho\v rejection values greater including the image and IF fre
(P)/GRC receiver than 95 db second
responses near the second conversion -~1 other s~urious
db. 'rhese spectrum signature data appear are rejected more
to result from the u~ilization of a duplexer; a
preceding the first
1.-re re made on t~1.e
different C~l and ICTrJ ments -vrere J::.ade for CW interference at
and a tclei~le
system a~ciio S/N measure
and pm·rel"' levels, Index and S/N was deter
interference data exenylify and a between Pattern Corres~~on,ae:nc!e mined. The techniques used to obtain these C1,'! the need for an automatic voice is valid for both linear and nonlinear
ins trum.en t -vrlli ch interference conditions.
A and apparently reliable responses has been found which indicates
method of mixer spurious of mixer conformity to
PATENT .. k.:J~ .. ~--~~-~~ BY~ ... FORMAT ... JQ.~.'f. ....... 19 .. 6..3. BY ..... t.l!?. ...
lib-sascan
Rectangle

Monthly Letter No. 3 - 2 - 6 June 1963
existing mixer Diode mixers, regardless of the make or manufac-ture of the diode, appear to have ~ost identical relative characteristics 1dth a shift in the relative diode bias.
The First Report is being prepared and the number of draft copies \dll be forwarded in June.
Approved:
I : {) I .~ ,/:_ ,,l{i{U. v'-'
D. W. Robertson, Head Communications Branch
Respectfully submitted:
'i~)~//(;~:;r-;;;_ E. W. Wood Project Director
lib-sascan
Rectangle
lib-sascan
Rectangle

I
GEORGIA INSTITUTE OF TECHNOLOGY ENGINEERING EXPERIMENT STATION
ATLANTA 13. GEORGIA
19 July 1963
Activity Supply Officer, USAELRDL Building 2504, Charles Wood Area Fort Monmouth, New Jersey
MARKED: 11For Engineering Sciences Department, Interference Branch Inspect at Destination Order No. 5871-PM-63-91"
ATTN: Mr. Sidney Weitz, SELRA/GFE
SUBJ: Monthly Letter Report No. 4, 20 July 1963, Report period 15 June to 15 July 1963, Contract No. DA 36-039 AMC-02294(E), "Electronic Equipment Interference Characteristics, Communication Type."
Gentlemen:
A quantitative study is being made of pulse-type interference on the AN/GRC-50 receiver. The HP-614A and TS-4o3/U signal generators were modified to obtain linear FM deviation up to the receiver rated deviation.
An investigation of impulse-type interference to an AN/GRC-50 receiver has shown that this receiver is not susceptible to impulse-type interference for levels up to 85 db/~v/Mc. The impulse generator used in the NF-105 NFIM was modified to obtain the impulse interference.
Multipath transmission delay of 0.25 ~sec has been achieved with the ill~/TRC-29 communications system. An effort will be made to simulate longer delays. Predicted intelligibility measurements as a function of the ratio of power levels between the direct and delayed signals will be made for various delay times and various received signal levels. The measurements will be made using the GEL machine. From these measurements, an attempt will be made to validate the predicted PCI versus S/N ratio concept presented in Quarterly Report No. 1 for this type of interference.
A statistical evaluation for determining the theoretical maximum error in predicted mixer spurious response data has been made. In addition, previously measured and predicted mixer data are being statistically analyzed to determine the accuracy of the predicted values. The results obtained by these statistical methods indicate measurement difficulties which are now
PATENT .f:.:-1:.~ .. ~~--~-~ BY ..• ;;!~.~\ FORMAT ..!.f.::::.'l.. ..... 19 .. f. . .J!. BY ..• ~:~
lib-sascan
Rectangle

Monthly Letter Report No. 4 - 2 - 19 July 1963
being investigated. Further measured data are needed for a complete evaluation of the mixer prediction method.
Over 14oO abstracts related to the RFI field have been folli~d in more than 50 publications. It is suggested that the second bibliography of RFI abstracts be published as Volume 9 of the Manuscript of Catalogue.
Approved:
,£, ?J, (?tj;;;j;;V\ D. W. Robertson, Head Communications Branch
Respectfully submitted:
E. ~-!. Wood Project Director
lib-sascan
Rectangle
lib-sascan
Rectangle

GEORGIA INSTITUTE OF TECHNOLOGY ENGINEERING EXPERIMENT STATION
ATLANTA 13, GEORGIA
16 August 1963
Activity Supply Officer, USAELRDL Building 2504, Charles Wood Area Fort Monmouth, New Jersey
MARKED: "For Engineering Sciences Department, Interference Branch Inspect at Destination Order No. 5871-PM-63-91"
ATTN: Mr. Sidney Weitz, SELRA/ GFE
-·--- _ .. --..,... - ~v~·~~.;·~--', ~··.
SUBJ: Monthly Letter Report No. 5, 20 August 1963, Report period 15 July to 15 August 1963, Contrl\.ct No. DA 36-039 AMC-02294(E), "Electronic Equipment Interference Characteristics, Communication Type."
Gentlemen:
Two signal tests are being conducted on the R-1148(P)/GRC receivers. Pulse, AM, and FM signal generators are being used as interfering sources.
Multipath propagation studies are continuing on the AN/TRC-29 and AN/TCC-13 communications system. It has been found that for a path delay of 0.25 ~sec, the S/N ratio at the output of a multiplexer channel depends not only on the relative power, but also on the relative phase angle between the direct and delayed path RF signals. Predicted PCI measurements as a function of relative power have been made for two conditions of receiver quieting and four different relative phase angles.
Since the wavelength of the tuned frequency is approximately 5.3 inches, very small path length changes such as that caused by temperature change at any point along the delayed path cable have been found to cause significant changes in phase angles. This extreme sensitivity in the path length precludes any measur~ments with the GEL machine since they would require a constant phase angle over the length of a data run. Thus, no further data have been taken to substantiate the predicted--measured PCI relationship.
It is important to note that under every relative power level condition at both quieting levels tested, a wide range of phase angles exists at which the predicted PCI was 100 per cent. This indicates that 0.25 ~sec is not a sufficient delay to cause significant degradation of intelligibility for this communications system. Cables for achieving path delays greater than

..,~,., •••• ,. "". ,,_,.., --<.. "--·~· ~ ... ~---.
Monthly Letter Report No. 5 - 2 - 16 August 1963
0. 25 IJ.Sec have been acquired and further multipath te·sting will follow.
The results of the statistical evaluation for determining the accuracy of predicted values of mixer data have not been completed. The investigations of prior indicated measurement difficulties have revealed that extremely fine control of input levels and the IF response indicator are necessary for repeatable mixer measurements. Additional factors such as equipment level stability and the fact that some responses are near relative "holes" contribute to the inaccuracy and nonrepeatability of the mixer datao
Mr. Sidney Weitz and Mr. R. L. McKenzie from USAELRDL visited Georgia Tech on 16-18 July for a technical discussion.
Mr. Warren Kesselman fro~ USAELRDL visited Georgia Tech on 30-31 July to discuss project progress made during the second quarter of the research program.
Mr. J. T. Ludwig, Mr. Martin Sherman, and Mr. I. N. Mindel from IITRI, Chicago, Illinois, visited Georgia Tech on 30 July. The nonlinear effects of dummy loads and the results of current mixer studies were discussed.
The paper "The Behavior of Nonlinear Mixing" to be presented at the Ninth TRI-SERVICE Conference on RFI Compatibility has been forwarded for approval for unclassified presentation.
Plans are to prepare a paper on "The Effects of Multipath Interference on the Intelligibility of Transmitted Speech Over an FM System Employing Time Division Multiplexing" by c. w. Stuckey and E. W. Wood, for presentation at the 1964 IEEE International Convention. The abstract and summar,y for this paper will be forwarded during August for approval.
Quarterly Report No. 2 is being prepared and will be forwarded in September.
. Approved: /)
]J.f;J./(a~ D. W. Robertson, Head Communications Branch
Respectfully submitted:
E. W. Wood Project Director
lib-sascan
Rectangle
lib-sascan
Rectangle

GEORGIA INSTITUTE OF TECHNOLOGY IINGINKDING IIXPIIJtiiiDIT IITA'nGII
ATLANTA 13. GEORGIA
18 October 1963
Activity Supply Officer, USAELRDL Building 2504, Charles Wood Area· Fort'Monmo~th, New Jersey
MARKED: "For Engineering Sciences Department, Interference Branch ·Inspect at Destination Order No. 5871-PM-63-91"
ATI'N: Mr. Sidney Weitz, SELRA/GFE
SUBJ: Monthly Letter Report No. 6, 20 October 1963, Report Period 15 September to 15 October 1963, Contract No. DA 36-039 AMC-02294(E), '~lectronic Equipment Interference Characteristics, Communication T.Y:Pe. "
Gentlemen:
A Hewlett-Packard signal generator, Model 8614A, has been evaluated at our laborator,y following a demonstration of several equipments by Hewlett-Packard's field representatives. It was found'that this generator is 'capable of linear frequency modulation characteristics up to ±3 Me over the tuned frequency range from 1600 to 2660 Me. Plans are to obtain the 8614A .signal generator to aid in further evaluation· ·tests on the .AN/TRC-29 sys.tems.
Since multiplexer e~uipments or PCM simulators are not currently available for use with the ANfGRC-50 systems, PCM signals are being simulated which approximate the known characteristics of the MUltiplexer Set AN/TCC-44. These simulated signals will be used to evaluate the characteristics of the ~/GRC-50 system when operated in the PCM mode.
Multipath interference data for delays up to 1.4 JlSec have been ·collected on the AN/TRC-29 and AN/TCC-13 system and are being analyzed. The variable parameters used in the test configuration were 1) the delay time between paths or path length differences, 2) the relative power levels between paths, 3) the absolute power level or receiver quieting, and 4) the relative phase angle between paths. The audio output S/N ratio was measured under various test conditions and used to predict the intelligibil-
. ity of received isolated monosyllabic words. Further work is being done to locate the various receiver' and demultiplexer stages where degradation of the desired signal in the presence of multipath interference occurs.
\ '
PATENT /R..::;~~ .. ~~ .. ~ W BY .• ~ FO~MAT .l.'l.::::!: .. 'f.. .... 19 .. f~ BY ~f/,; . . .. ~6 ..... .
lib-sascan
Rectangle

. ' Monthly Letter Report No. 6 -2- 18 October 1963
Additional mixer data taken on germanium diode mixer configurations are being ·.analyzed. An attempt is being made to develop a technique for obtaining universal mixer parameters .for germanium mixers which are valid up to the tenth order of generation. A vacuum tube mixer is being designed
. which utilizes fer:rite-core, toroidal components to obtain the de~ired input and output impedance characteristics.
The preparation of·Volume '9 of the Manuscript of Catalogue is continuing.
Mr. E. W. ~ood visited the Electromagnetic Compatibility Analysis Center, Annapolis, Maryland, on 3-4 October 1963. Mr. Wood attended a meet·ing·on spectrum signatures and visited the technical information facilities at the center.
75°~~:~{~~ D. W. Robe.rtson, Head Communications Branch
RespectfUlly submitted:
~9 E. W. Wood Project Director
lib-sascan
Rectangle
lib-sascan
Rectangle

, GEORGIA INSTITUTE OF TECHNOLOGY.
ENCIINEERING EXPERIMENT STATION
ATL.ANTA 13, GEORGIA
18 November 1963
Activity Supply Officer, USAELRDL Building 2504, Charles Wood Area Fort Monmouth, New Jersey
MARKED: "For Engineering Sciences Department, Interference Branch Inspect at Destination Order No. 5871-FM-63-91"
ATTN: Mr. Sidney Weitz~ SELRA/GFE
SUBJ: Monthly Letter Report No. 7, 20 November 1963, Report Period 15 October to 15 November 1963, Contract No. DA 36-039 AMC-02294(E), "Electronic Equipment Interference Characteristics, Connnunication Type."
Gentlemen:
An Empire Devices preselector, Model PF-190C tunable from 3.9 to 7.2 kMc, has been evaluated at our laboratory. It was found that a spurious passband exists between the preselector tuned frequency and the second harmonic frequency. In addition, other spurious passbands exist between the second and third harmonic frequencies, and below the "sub-harmonic" frequency for any dial setting. The attenuation at these spurious passbands ranges from 4 to 30 db, depending upon the dial setting. This preselector was returned for factory diagnosis and reduction of the spurious passband between the fundamental and second harmonic frequencies. Two additional preselectors have been ordered and are scheduled for delivery in November: the Empire Devices Model PF-190D and the Frequency Engineering La.boratories Model 200CC. The ulitization of these and other preselectors should permit measurements of preselected signals, such as those found in intermodulation and spurious emissions tests, for improved testing limitations. A Hew·lett-Packard signal generator, Model 8614A, has been ordered and should be delivered during January 1964.
The preselector utilized in the AN/GRC-50 receiver has also been evaluated.. The measured data show a spurious passband between the second and third harmonic frequencies. 'Ihis band-pass filter, however, used in conjunction with a low-pass filter with a cutoff frequency near 1900 Me provides the spurious signal rejection reported in Monthly Letter Report Noq 3.
The analysis qf the collected multipath interference data is completed for delays up to 1.4 ~sec which correspond to path length differences up to 0.26 mile. Based on a system expected to operate over a range in excess of 20 miles, the free space attenuation of the desired and reflected signals will be essentially identical at these path length differences; therefore,
lib-sascan
Rectangle

Monthly Letter Report No. 7 -2- 18 November 1963
the relative direct to reflected (delay) path power level will depend predominantly on the efficiency of the reflecting surface{s). It was found that significant degradation in predicted intelligibility can occur for the relatively small delay times used in the multipath tests on the available FM system which ulitizes PPM or TDM.
The completion of the evaluation tests on available PPM/FM communications systems is· scheduled at the end of the fourth quarter's effort. The tests and test procedures resulting from these PPM/FM system studies will then be combined with the procedures developed during the evaluation tests on the PCM/FM systems on hand. Further knowledge acquired regarding the PCM signal requirements for the AN/GRC-50 systems necessitates additional circuitry for simulating and detecting the information pulses. The feasibility of constructing the desired circuitry and, in addition, devising an error rate detector for the system will be investigated.
An attempt to derive mixer polynomial coefficients using measured diode current versus input voltage relationships yielded similar results as those established in Report No. 1, July 1963, under contract DA 36-039 AMC-02200(E). It was found that the computer round-off of digits due to the "single-precision" computer techniques currently available and the measurement limitations prohibited the assurance of reliable computed polynomial coefficients for the method selected. This work was instigated prior to the receipt of the report, and is being abandoned at this time to avoid duplication of effort in this area. A simplified approach is expected to avoid the laborous computations necessary to obtain coefficients of responses arising from the use of an nth degree polynomia~ as a mathematical model of mixer characteristics.
Analytical studies are being made on an "envelope recovery" type mixer to determine the possibilities of this configuration for improved mixer spurious rejection. The particular mixer being examined is theoretically similar to the experimental mixer discussed in the Final Technical Report under contract DA 36-039 sc-87183. Preliminary testing on a vacuum tube mixer being designed with input and output torodial components indicates that additional shielding between components will be necessary before the mixer will be ready for a. critical evaluation.
The preparation of Volume 9 of the Manuscript of Catalogue is continuing after a delay pending the receipt of written permission from European and domestic publishers to publish their RFI related abstracts. The preparation and proof-reading of the duplication masters of the RFI bibliography, which should contain over 300 pages, are approximately 60% completed.

,
Monthly Letter Report No. 7 -3- 18 November 1963
Quarterly Report No. 3 is being prepared and will be forwarded in December. The final results of the multipath interference studies on a PPM/FM system will be reported. Emphasis will be placed on the usage and importance of previously reported information regarding reduction and prediction methods for spurious signals generated in communications receivers.
The abstract and summary of the paper on "The Effect of Mul tipath Interference on the Intelligibility of Speech Transmitted Over an FM System Employing Time Division Multiplexing" by Charles W. Stuckey and E. W. Wood was submitted to the 1964 IEEE International Convention Program Chairman a:rter the receipt of the required clearance of the materials.
Mr. R. D. Trammell, Jr., and Mr. E. W. Wood attended the Ninth TRISERVICE Conference on Electromagnetic Compatibility held in Chicago, Illinois, on 15-17 October 1963. Mr. Trammell presented a paper on "The Behavior of Nonlinear Mixing 11
•
Approved:
-~ . tJ. e~]i;;;c D. W. Robertson, Head Communications Branch
RespectfUlly submitted:
E. W. Wood Project Director
lib-sascan
Rectangle
lib-sascan
Rectangle

, GEORGIA INSTITUTE OF TECHNOLOGY
ENGINEERING EXPERIMENT STATION
ATLANTA 13. GEORGIA
15 ~Ta.nuary 1964
Activity Supply Officer, USAELRDL Building 2504, Charles Wood Area Fort Monmouth, New Jersey
MARKED: "For Engineering Sciences Department, Interference Branch Inspect at Destination Order No. 5871-PM-63-91"
ATTN: Mr. Sidney Weitz,
SUBJ: Monthly Letter Report No. 8, 20 January 1964, Report Period December 1963 to 15 January 1964, Contract No. DA 36-039 AMC-02294(E), 11Electronic Equipment Interference Characteristics, Connnunication Type.u
Gentlemen:
A Frequency Engineering Laboratories band-pass filter, Model A200CC tunable from 2 to 4 kMc, has been evaluated for conformity to specifications. Multiple spurious pa ssbands were noted above the tuned frequency, and several lie between the tuned frequency and the second harmonic. The passband selectivity is well within specifications but rejection to the third harmonic is below specification a.t the high end of the tuning range. This filter was accepted regar<il.ess of failure to meet specifications since, in conjunction with the low·-pass filters presently on hand, the unit can be used for the desired intermodulation tests. Further delay of these tests is intolerable in view of the limited time remaining for spectrum signature investigation.
An investigation of mixer acti•rity using an exponential mathematical model has shown little promise. Neither series nor exponential solutions to mixer activity give sufficient explanation of the recurring nulls in the harmonic and spurious response levels which are evidenced by factual data. These nulls occur with respect to bias level and are adequately explained using a Fourier analysis of the output waveform. A suitable ma.thematical model of the mixer must explain these nulls and demonstrate their occurrence w·ith changes in bias level.
Attempts to show· that vacuum tube mixers follow the law'S of prediction applicable to diode mixers has thusfar been unsuccessful. The chief problem appears to stem from the difficulty of coupling 500 generator and detector sets to the high impedance vacuum tube circuits. Higher local oscillator voltages are required for vacuum tube operation than for diodes and such levels are difficult to obtain with 50D equipment. Further attempts will be made using modified circuits and techniques.

Monthly Letter Report No. 8 -2- 15 January 1964
The preselector of a typical 1.6 to 2.3 kMc FM receiver was evaluated in order to determine those frequencies most likely to create IM or spurious responses in the receiver. It was found that the combination of the duplexer and the preselector has approximately the same characteristic as the preselector itself when the interconnecting cable provided with the receiver is used to couple the duplexer to the preselector. The use of different length cables to interconnect the two units causes alteration in some of the spurious preselector peaks by as much as 40 db. The preselector-duplexer characteristic is extremely helpful in locating intermodulation products on this type of equipment.
Initial attempts to establish the spurious response levels of the receiver utilizing the preselector characteristic and mixer characteristic data previously assembled for the 1N21B diode mixer are promising. All spurious responses detected for this equipment fall in the spurious passbands of the preselector with exception of the very large mixer responses which can be detected rather far down on the preselector characteristic. The measured and calculated spurious response levels for this equipment are markedly similar over the limited range of prediction values available. This tion technique will be extended in range by data extrapolation and the values compared to the actual measured response levels. Successful prediction can cut the time required for spurious response determination on this type equipment by a considerable margin, since preselector measurement is generally less tedious than spurious response level determination.
Volume 9 of the Manuscript of Catalogue is bound in the final editor 1 s copy. The final required copies should be forwarded by 17 January 1964.
:Mr. Sidney Weitz and :Mr. Guy Johnson of USAELRDL, Fort Monmouth, New Jersey, visited the Communications Branch on 16-17 December 1963 to discuss project progress. Project effort to that date and opinions as to work required were presented by Georgia Tech personnel.
The paper on Effect of Multipath Interference on the Intelligibility of Speech Transmitted Over an FM System Employing Time Division Multiplexing, 11
has been accepted by the IEEE INTERNATIONAL CONVENTION program committee for presentation during the propagation session of the program.
Approved: /-1 , !. ' ' l t /1},·&i~ l'.:.. i '
D. W. Robertson, Head Communications Branch
Respectfplly,;submitted: / I '/ .,
/r l.t~·;· ' ";/. i.t:·:::::"'.,..,.-/ f ·~ .r..... 1':
~ R. D. Tran:rrnell, Assistant Project Director
lib-sascan
Rectangle
lib-sascan
Rectangle

GEORGIA INSTITUTE OF TECHNOLOGY ENGINEERING EXPERIMENT STATION
ATLANTA 13, GEORGIA
18 February 1964
Activity Supply Officer, USAELRDL Building 2504, Charles Wood Area Fort Monmouth, New Jersey
W.RKED: "For Engineering Sciences Department, Inter:ference Branch at Destination"
ATTN: Mr. Guy- Johnson, SEL-qA/GFE
SUBJ: Monthly Letter Report No. 9, 20 February 1964, Report Period 15 January 1964 to 15 February 1964, Contract No. DA 36-039 AMC-02294(E), "Electronic Equipment Interference Characteristics, Conrrnunication Type."
Gentlemen:
The Empire Devices cavity filter, Model PF-190C, has been received and accepted by our laboratory. The Empire Devices cavity filter, Model PF-190D, scheduled to be delivered last November, has not been received. Such filters may be used to reduce spectrum analyzer spurious responses when transmitter spectrum surveillance tests are oeing conducted.
A new delivery date for a Hewlett-Packard generator, Model 8614A, is now 1 April 1964.
A request to substitute a TVl'I1 , I''.fodel 324D, for two
cavity filters authorized under the contrac:t v1as forwCl.rded to the USAELRDL Contracting Officer on 21 January 1964. The need exists f~r such an amplifier which will deliver more energy than presently availablL ignal generators for testing spurious responses and intermodulation characteristics of the U. s. Army equipments on hand.
A request to acquire excess GSA and DoD property wh-'-c~l .:;&-r: benefit the performance of the work under this contract was forw~rded to SELRA/GFE in January. The suggested procedures for obtaining excess equipments in this manner should entail essentially no cost to the recipients and will not affect the overall contractual requirements and costs in any manner.
Quarterly Report No. 4 is being prepared and th~ appropriate number of copies will be forwarded in March. This report w·ill emphasize the importance of the receiver pre selector and du:plexer :.i..L l"bdUcing spurious

Monthly Letter Report No. 9 -2- 18 February 1964
responses and intermodulation in the U. S. Army receiver equipments on hand. In addition, the report will contain significant data and analyses on diode and vacuum tube mixers.
Tne Final Report, Volu.-ne 1, on 11 Pu.lse Code Modulation Systems" by the Raytheon Company under Contract No. DA 36-039 sc-78148 has been received and evaluated. Tnis report contains information on the PCM multiplexer sets JI.N/TCC-44 and 45 which may be used in conjunction -v;ith the AN/GRC-50 connnunications sets available at our laboratory. It -~-ras learned that the simulated PCM techniques being developed at our laboratory are not completely compatible with techniques employed in the Jh~/TCC-44 and 45 sets which are not available at the present time. This incompatibility, however, is not expected to affect the tests and test procedures derived from the use of the simulated PCM signals.
The last quarter's effort will be devoted primarily to the tests and test procedures being developed for the U. S. Army pulse type con'llunications equipments. Several volumes of the Manuscript of Catalogue are planned which will include all corr~unications equipment spectrum signature data collected during the course of the contract. A volume of the Manuscript of Catalogue is also planned which will combine all mixer investiga~~ons and analyses conducted under this contract.
Volume 9 of the Manuscript of' Catalogue was for-v;arded to USAELRDL in January. This volume was concerned with "A Second Bibliography on Radio Frequency Interference, With Abstracts," and contair·ed over 1150 abstracts, summaries, and references in the field of radio f.~equency interference.
:Mr. E. W. Wood c::ttended the "Sy:r~posium on and Applications, 11 sponsored by the U.S. Arrrry in Huntsville, Alabama, on 4-6 February 1964. NASA Marshall Space Flight Center EMC Division on 6 February 1964.
Measurements--Techniques Missile Support Command, Mr. vlood also visited the at the Redstone Arsenal
Mr. R. D. Trammell, Jr., attended the Southeastern Simulation Council Meeting sponsored by General Electric Company which was held at Cape Kennedy, Florida, on 14 February 1964.
Approved:-; ,_j ,/
~//(/; I ,• / ,-{F'i/ I if"~: , ..
~~- W. ~~be~f~on, Head o~ Communications Branch
Respectfully Submitted:
t:?_/.FLf/::1"1•• V ('';
[//, //~~
E. w. Wood Project Director
lib-sascan
Rectangle
lib-sascan
Rectangle

GEORGIA INSTITUTE OF TECHNOLOGY ENQINEERINQ EXPERIMENT STATION
ATLANTA 13, GEORGIA
17 April 1964
Activity Supply Officer, USAELRDL Building 2504, Charles Wood Area Fort Monmouth, New Jersey
MARKED: "For Engineering Sciences Department, Interference Branch Inspect at Destination"
ATTN: Mr. Guy Johnson, SELRA/GFE
SUBJ: Monthly Letter Report No. 10, 20 April 1964, Report Period 15 March 1964 to 15 April 1964, Contract No. DA 36-039 AMC-02294(E), ,.Electronic Equipment Interference Characteristics,
·Connnunication T.ype."
Gentlemen:
The AN/FRC-34 radio relay set has been set up and is being checked out prior to evaluative testing. New procedures will probably be required for this equipment because of the nature of its output.
Case radiation measurements in the microwave region have been conducted on the AN/TRC-29 transmitters with different planes of polarization. The results of these measurements are presently being analyzed.
The methods devised for calculating spurious responses on cavitycrystal types of receiving equipments can be extended to include intermodulation response calculation using methods originated by Steiner. These calculations will be performed and validated by measured data using the AN/TRC-29 receiving equipments. The method, if satisfactory, may eliminate the extremely time consuming intermodulation and spurious response measurements for this type of equipment. Only cavity and crystal measurements would be required.
Tests on a transistor mixer have produced inconclusive prediction results thusfar. Approximately one-half of the tests show good prediction while the other one-half are poor. Transistor damage is suspected as well as poor isolation between generators. These tests should conclude the mixer work under this project.

Monthly letter Report No. 10 -2- 17 April 1964
An effort was initiated on 1 April to construct and compute a MIC and lash-up output data to determine electromagnetic compatibility conditions for the AN/VRC-12 and AN/PRC-25 operating ~n close proximity. Spectrum signature data measured at USAEPG, Fort Huachuca, Arizona, and the computer programs reported in Volumes 6, 7, and 8 or the Manuscript or Catalogue are being utilized in this exercise.
The delivery date for the Empire Devices/Singer tunable band-pass filter, PF-190D, order in 1963 is still indefinite. The Hewlett-Packard generator, Model 8614A, due on 1 April 1964, has not been delivered to date because or klystron difficulties encountered at the factory. The new delivery date is set for 1 May 1964.
Mr. E. W. Wood attended the 1964 IEEE INTERNATIONAL CONVENTION held in New York on 23-26 March 1964. Mr. Wood presented a paper on '~The Effect of Multipath Interference on the Intelligibility of Speech Transmitted Over an FM System Employing Time Division Multiplexing.''
Mr. D. W. Robertson and Mr. E. W. Wood visited USAELRDL, Fort Monmouth, New Jersey, on 27 March 1964. A meeting was held with Mr. Guy Johnson, Mr. R. L. McKenzie, and Mr. Warren; Kesselman in which project progress and technical details were discussed.
Ap]v~~.e~ D. w. Robertson, Head Communications Branch
i:Zlf4 R. D. ~1, Jr. Asst. Project Director
lib-sascan
Rectangle
lib-sascan
Rectangle

GEORGLA.. INSTITU-tE o:=- TSCHNOLOGY ENGINEERING G:XPZRIM:::,,~T ST.:...'TION
ATLANTA 13, GEOF-GIA
18 August 1964
Supply Officer, USAEL 2504, Charles Wood Area
Fort I.Corrrnouth, New Jersey
~.Jl.R:KED: "For Engineering Sciences Department, Interference Analysis and Control lu~ee."
ATTI~: Contracting Officer 1 s Designated Representative
SUBJ: Monthly Letter Report No. 11, 20 August 1964, Report Period 15 July 1964 to 15 August 1964, Contract No. DA 36-039 AMC-02294(E), "Electronic Equipment Interference Characteristics, Communication 'Iype. ~~
Gent=..emen:
?ne majority of effort during this reporting period has been concentrated in a =..iterature survey effort. Some 100 reports, papers, and references have 8een located and are being analyzed and abstracted--these references cover screen room fabrication techniQues, shielding effectiveness, anechoic chambers, absorbing materials, screen room measurement techniques, and cross-polarized antenna configurations.
Measure:nents are being conducted in a screen room (12'x8'x8') in an attempt to determine the field distribution within the room and the changes in the field distribution as a function of frequency.
An investigation of absorbing materials is in progress. A nQ~ber of absorbing materials have been obtained in sample quantities for evaluation purposes. Data and sample quantities of other materials will be obtained from a number of vendors.
P~1 investigation of cross-polarized antenna configurations is in progress. The characteristics and availability of broadband hybrid couplers, for inclusion in orthogonal antenna configurations, over the frequency range of interest are presently being investigated.
V~. E. E. Donaldson attended a meeting at the Electromagnetic Compatibility Analysis Center, Annapolis, Maryland on July 30? 1964, at the request of Mr. W. A. Kesselman, USAEL, to discuss the mixer work conducted at Georgia Tech and ECAC Special Test No. 7 (Stuqy of Receiver Mixer Characteristics).
~·_::·

1-.{onthly Letter Report No. 11 -2- 18 August 1964
TI1e program for the next repor~lng period is expected to follow the sam.e pattern ,,ri th increased effort in the a:-eas of analyzing references, screen room measurements, evaluation of absorbing materials, and analyzing antenna configurations.
Approved:
·.'- A"',-
Respectfully submitted:
1il. R. :Free Project Director
' /~-·--·:/_/~ ~- .. ': .
~v~ D. W. Robert?on, Head r. Co:mmunications Branch {j
lib-sascan
Rectangle
lib-sascan
Rectangle

GEORGIA INSTITUTE OF TECHNOLOGY ENGINEERING EXPERIMENT STATION
ATLANTA 13, GEORGIA
17 September 1964
Activity SupplY Officer, USAEL Building 2504, Charles Wood Area Fort Monmouth, New Jersey
MARKED: "For Engineering Sciences Department, Interference Analysis and Control Area"
ATTN: Contracting Officer's Designated Representative
SUBJ: Monthly Letter Report No. 12, 20 September 1964, Report Period 15 August 1964 to 15 September 1964, Contract No. DA 36-039 AMC-02294(E), "Electronic Equipment Interference Characteristics, Communication Type."
Gentlemen:
The literature survey has· continued during this reporting period. Over 200 references pertinent to this effort have been located and are being analyzed and abstracted.
For the purpose of analyzing the references, the project has been divided into five major tasks: (1) Case Radiation and Case Susceptibility Measurement Techniques, (2) Modeling Techniques, (3) Absorbing Materials, (4) Antennas and Probes, and (5) Techniques for Measuring and Improving Shielded Room Characteristics.
Assignments of the project personnel have been made on a task basis. Although these initial assignments were made primarily to accomplish a thorough analysis of the references, it is planned to conduct the entire program on this task basis to the extent possible.
Major emphasis is being placed on the Radiation and Susceptibility Measurement Techniques, Antennas and Probes, and Absorbing Material tasks at the present time. It is considered necessary that an optimum, standard test setup and procedure be developed early in the program, since it is felt that any improvements which are obtained in the shielded room characteristics will be highly dependent on the measurement setup and procedure being used. Hence, by adopting a standard measurement technique early in the program, it will be possible to incorporate shielded room improvement techniques which are compatible with the measurement procedure to be used. In addition, the early development of a standard measurement setup and procedure will allow open-field data to be obtained which can serve as a meaningful reference from which to determine the degree of shielded room improvement.
PAT~NT ... :~.:~1: ~'JtWBY.~ f-ORMAT ..• f.::.tl..Y.... tck.Y... BY .• ~ •••
lib-sascan
Rectangle

Monthly Letter Report No. 12 -2- 17 September 1964
The adoption or development of standard test antennas and/or probes is an integral and important part of the development of a standard measurement setup and procedure and must be accomplished concurrently with this task.
It is desirable that the types of absorbing materials to be investigated be determined and sample quanities of these materials be obtained as early as possible, since the modeling effort will be effected by these factors. It is anticipated that the modeling effort will provide the maximum advantages in the areas of evaluating absorbing materials and shielded room shapes and dimensions. ~aterials to be used in the modeling effort are presently being ordered.
A list of suggested changes to MIL-STD-449B was prepared during this reporting period at the request of Mr. Warren Kesselman, USAEL, and was submitted 15 September 1964.
The program for the next reporting period is expected to follow the same pattern with the major effort in the areas of analyzing references, development of a standard measurement setup and test procedure, selection or development of standard test antennas and probes, and selection of absorbing materials to be investigated.
Approved:
J,w ... /2~ D. W. Robertson, Head Communications Branch
Respectfully submitted:
lJillOL~ :fl\(tee__ W. R .. Free Project Director
lib-sascan
Rectangle
lib-sascan
Rectangle

GEORGIA INSTITUTE OF TECHNOLOGY ENGINEERING EXPERIMENT STATION
ATLANTA t3, GEORGIA
18 November 1964
Activity Supply Officer, USAEL Building 2504, Charles Wood Area Fort Monmouth, New Jersey
MARKED: "For Engineering Sciences Department, Interference Analysis and Control Area 11
ATTN: Contracting Officer's Designated Representative
SUBJ: Monthly Letter Report No. 13, 20 November 1964, Report Period 15 October 1964 to 15 November 1964, Contract No. DA 36-039 AMC-02294(E), "Electronic Equipment Interference Characteristics, Communication Type."
Gentlemen:
The analysis and abstracting of the references compiled during the literature survey has continued during this reporting period.
Two model shielded enclosures, one 2' x 2' x 2' and one 2' x 3' x 2', are being fabricated. It is planned that a 4:1 scaling factor will be used for the modeling, and hence, these enclosures will simulate a 8' x 8' x 8' and a 8' x 12' x 8' shielded enclosure. After correlation has been established between these models and the full-size enclosures, the models will be utilized to evaluate enclosure shaping factors, absorbing materials, and absorbing material placements within the enclosures.
Development of measurement techniques for measuring the VSWR of shielded enclosures over an extremely wide frequency range is in progress. A pair of ;;.rideband, four-terminal, hybrid networks for use in the 50 Me frequency range have been constructed and tested. These units vdll be used to form a bidirectional coupler to be used as a reflectometer for shielded enclosure VSWR measurements at low frequencies. Data are presently being assembled to determine the accuracy obtainable using the reflectometer for the measurement of VSWR in coaxial lines.
An investigation is presently underway to determine the feasibility of shielding the test antenna in all but the desired direction by means of a metal hood lined with absorbing material. In theory, the metal hood shields the test antenna from the reflected waves from the shielded enclosure walls, while the absorbing material prevents standing waves inside the hood. If a satisfactory "hooded" antenna can be obtained, case radiation and susceptibility measurements can be made in conventional
PATENT .. /f!:J.~; .. ~J. BY ..•• ~ FORMAT .f"J: .. -::!f::. .... 19.0..~ BY .... ~ ..
lib-sascan
Rectangle

Monthly Letter Report No. 13 -2- 18 November 1964
screen rooms in which one wall has been lined with absorbing material.
During the next reporting period, it is anticipated that the fabrication of the model shielded enclosures will be completed and that some model measurements will be made. The fabrication of a "hooded" antenna and a preliminary evaluation of this antenna as a possible screen room measurement technique should also be completed during this period. Investigation of techniques for making case radiation and susceptibility measurements at low frequencies (below 50 Me) ~ill continue.
Approved:
l I , I /) f---h--_/\~ .. / • Vv • { r~ bt-t~ia.-Jvv
D. W. Robertson, Head Communications Branch
Respectfully submitted:
~0£rm:_ W. R. Free Project Director
lib-sascan
Rectangle
lib-sascan
Rectangle

GEORGIA INSTITUTE OF TECHNOLOGY ENGINEERING EXPERIMENT STATION
ATLANTA 13. GEORGIA
17 December 1964
Activity Supply Officer, USAEL Building 2504, Charles Wood Area Fort Monmouth, New Jersey
MAR.KED: "For Engineering Sciences Department, Interference Analysis and Control Area"
ATTN: Contracting Offic~r's Designated Representative
SUBJ: Monthly Letter Report No. 14, 20 December 1964, Report Period 15 November 1964 to 15 December 1964, Contract No. DA 36-039 AMC-02294(E), Electronic Equipment Interference ·characteristics, Communication Type.rr
Gentlemen:
Some preliminary results have been obtained with the hooded antenna technique, discussed in the last monthly report, at frequencies above 1 Gc. These results appear promising, and indicate that virtually all effects from undesired reflections from the shielded room walls can be eliminated by proper placement of a balanced antenna in a hooded shield. Data thus far have been restricted to a few discrete frequencies where tuned balanced antennas and tuned baluns were fabricated to accomplish the desired measurements. A broadband, balanced log-periodic antenna and a broadband, tapered . line balun to cover the frequency range from 1 to 10 Gc have been designed and are presently being fabricated. It is anticipated that the use of this broadband antenna in the hooded shield will permit a complete evaluation of the hooded antenna technique over the frequency range from 1 to 10 Gc.
The anechoic chamber obtained from Western Electric as surplus equipment has been received, but assembly of the chamber has been held up due to the fact that no drawings or assembly instructions were received with the unit. The General Services Administration and Western Electric both report that they have no drawings or assembly information on the chamber. Emerson and Cuming were contacted and they have.agreed to furnish drawings and assembly instructions. This information is supposedly en route at this time.
The development of measurement techniques for measuring the VSWR of shielded enclosures at low frequencies has continued during this reporting period. Two hybrid junctions have been assembled which yield a 6 db insertion loss and a 60 db minimum isolation for frequencies in the neighborhood of 50 me. These are capable of measuring VSWR's of 1.1 and larger in coaxial lines with various known terminations.

... ... Monthly Letter Report No. 14. -2- 17 December 1964
Using tuned antennas, the hybrid reflectometer shows sufficient VSWR change between operation in'the open and in the screen room to establish the maximum VSWR within the screen room in the vicinity of the antenna. The use of non-tuned loop or rod antennas has not been successful since the line to antenna reflection coefficient is excessively large. Stub .tuning and compensation networks are being attempted as a means of reducing the high VSWR in the non-tuned antenna case in the hope that these less cumbersome antennas may replace the tuned variety. At very low frequencies, the tuned antennas cannot be placed in the screen room and the non-tuned variety must be utilized.
The fabrication of a 2' x 2' x 2' model shielded enclosure was completed during this reporting period. The evaluation of this enclosure and the use of various absorbing materials and absorbing material placements within the model enclosure has been held up awaiting a satisfactory technique for measuring the VSWR.
During the next reporting period it is planned that the broad-band, balanced L - P antenna will be evaluated as a part of the hooded antenna technique. If the antenna proves satisfactory it is anticipated that a complete set of data on the hooded antenna technique will be included in the next quarterly report.
AJ;::=a~ D. W. Robertson, Head Communications Branch
Res~ectfully submitted: ·l"'1 .11C? vJJliluw ~ '/Y"e'f_ W. R. Free Project Director
1 i t l
I ~ , f I
'
lib-sascan
Rectangle
lib-sascan
Rectangle
GEORGIA INSTITUTE OF TECHNOLOGY ENGINEERING EXPERIMENT STATION
ATLANTA 13, GEORGIA
17 February 1965
Activity Supply Officer, USAEL Building 2504, Charles Wood Area Fort Monmouth, New Jersey
MARKED: "For Engineering Sciences Department, Interference Analysis and Control Area. If
ATT.EN: Contracting Officer's Designated Representative
SUBJ: Monthly Letter Report No. 15, 20 February 1965, Report Period January 1965 to 15 February 1965, Contract No. DA 36-039
AMC-02294(E), "Electronic Equipment Interference Characteristics-:Comrnunication Type. 11
Gentlemen:
The evaluation of the "hooded" antenna technique has continued during this reporting period. Antenna pattern measurements were made in a shielded enclosure using a "hoodedn antenna as the receiving antenna. The results of these measurements indicate that making antenna pattern measurements in a shielded enclosure utilizing the 11hooded 11 antenna technique appears to be quite feasible. The degree to which nulls in the antenna pattern can be measured repeatably seems to depend primarily on the antenna peak-to-null response ratio and the absorption characteristics of the material used on the end wall. In general, excellent results can be expected if the reflected power from the end wall is at least 20 db below the null response of the test antenna. Variations in pattern nulls of about ± 3 db can be obtained if the reflected power from the end wall is 10 db below the null responses. It appears that the "hooded" antenna technique will yield results comparable with those obtained in an anechoic chamber when the s~e absorbing material is used for both experiments; however, no tests have been made in the anechoic chamber to veri~ this at this point.
If the source under test has physical size large compared to the wavelength of the radiation, it appears that some multipath reflections may occur between the unlined end wall of the shielded enclosure and the source which could terminate on the hooded receiving antenna. Absorbing material has been placed on the other end wall to determine if better results can be obtained with the hooded antenna technique. To date, the results are inconclusive.

Monthly Letter Report No. 15 -2- 20 February 1965
An omnidirectional, balanced, log-periodic antenna was designed and fabricated to serve as a radiating source for additional testing of the hooded antenna technique over the frequency range of 900 Me to 10 Gc. A circularly-polarized, balanced, log-periodic antenna was also designed and partially constructed to operate over the 900 Me to 10 Gc frequency range as a receiving antenna within a hood.
Work has continued on the model shielded enclosure measurement program and the fabrication of the paraboloidial-section model enclosure during this reporting period. The fabrication of the paraboloidial-section enclosure is approximately 75 percent complete and it is estimated that this unit will be completed within the next two weeks.
The missing absorbing material for the anechoic chamber obtained as excess equipment has not been located and no further work on the assembly of this unit has been accomplished during this reporting period.
D. W. Robertson, Head Communications Branch
~s~e:tfully ~ub~ted:
~ LCJLtitcvc-~ 'r1~ W. R. Free Project Director
lib-sascan
Rectangle
lib-sascan
Rectangle

.. J7::: 0?' TSC~-:~OLOGY
ATLANTA 13. GEORGIA
17 March 1965
Activity Supply Officer, USAEL 2504, Charies Wood· Area
Fort Monmouth, Nevr
:V.Lfu.1UCED: 11For Engineering Sciences Department, Interference Analysis and Control Area.n
ATTEN: Contracting Officer's Designated Representative
SUBJ: Monthly Letter Report No. 16, 20 March 1965, Report Period 15 February 1965 to March 1965, Contract No. DA 36-039 AMC-0229h(E), "Electronic Equipment Interference CharacteristicsCommunication T,y:pe. 11
Gentlemen:
The evaluation of the "hooded'' antenna technique has continued during this reporting period. Additional antenna pattern rr.easurements a better grade of absorbing material on the shielded enclosure wall have been made. Measurements have also been made the broadband, omnidirectional, balanced, log-periodic antenna as the source.
~~e broadband ferrite absorbing rr.aterial was received this reporting period and fabrication of a nhoodn for use at lower frequencies is presently under way. The ferrite absorbing material is capable of operation down to 50 Me. The effects of the hooded box configuration at these low·er frequencies are yet to be determined.
A broadband, balanced, circularly-polarized, log-periodic antenna and broadband, tapered-line balun to be operated in the ferrite-lined hood over the frequency range from 400 Me to l Gc are presentiy being fabricated.
Measurements to determine the relative merits of various types of absorbing materials and their placements w·ithin a shielded enclosure, utiliz
the antenna coupling measurement technique with the 2 x 2 x 2 foot model shielded enclosure, have continued during this period.
The fabrication of the paraboloidial-section model enclosure has been completed. Measurements to evaluate this enclosure configuration will be performed at the conc~usion of the present series of measurements being conducted on the 2 x 2 x 2 foot mode~ enclosure.
Authorization to modify the anechoic chamber, and thus mlnlmlze the effects of the mis absorbing material, and at the same time, make the chamber more compatible with our intended use, has been received from the

Monthly Letter Report No. 16 -2-
Contracting Officer. It is anticipated that the assembly of this chamber vtill be completed during the next period.
D. vl. Robertson, Head Communications Branch
i R1~;~;ul]_y su~ottc v~~~w~ <lv~ ~ \~
W. R. Free Project Director
lib-sascan
Rectangle
lib-sascan
Rectangle

GEORGIA INSTITUTE OF TECHNOLOGY ENGINEERING EXPERIMENT STATION
ATLANTA 13, GEORGIA
3 June 1965
Activity Supply Officer, USAEL Building 2504, Charles Wood Area Fort Monmouth, New Jersey
NOTICE This dJcumcnt ; n i , used by anyone.
Prior to t -...3 -~-~-19q without !1 i :~_S2J!ch Sponsor and the Experiment SLti:)n Se;::urity Office.
MARKED: "For Engineering Sciences Department, Interference Analysis and Control Area."
ATTEN: Contracting Officer's Designated Representative
SUBJ;
Gentlemen:
A theoretical and experimental study to determine the optimum configuration(s) and characteristics of balanced, broadband, cross-polarized antenna systems for near-field RFI measurements was initiated 1 May 1965.
A literature survey to determine the state-of-the-art in broadband, balanced, cross-polarized antenna techniques has been conducted during the period covered by this report. The work on frequency-independent antennas which has been accomplished at the University of Illinois over the past ten years appears to be particularly appropriate to the present antennas requirements. A number of the antenna. configurations which resulted from this 1·mrk will be investigated as possible approaches.
A conical log-helix antenna to operate over the frequency range from 200 Me to 1 Gc has been designed, fabricated and is presently being evaluated.
A crossed-bowtie antenna for operation in the 200 Me to 1 Gc region is presently being designed. A hybrid, 3 db, orthogonal coupler, designed to operate over the frequency range from 200 Me to 1 Gc, has been obtained to feed the two orthogonal bowtie antennas. Two broadband baluns (one for each bowtie) for operation over the same frequency range are being developed for use 1.;ri th this antenna.
The fabrication of a low· frequency (400 Me to 1 Gc) ferrite-lined hooded antenna was completed in April and is presently being evaluated. The broadband, circularly-polarized, log-periodic antenna and tapered-line balun utilized in this hooded antenna assembly appear to be particularly
PATENT ••• J.Q .. :.4.~~ .. l{ BY~ FORMAT .. J(l:::ff.. ... 19;~. BY .. lft..._ ....
lib-sascan
Rectangle

Monthly Letter Report No. 17 -2- 3 June 1965
applicable to the present antenna investigation.
It is anticipated that the fabrication of the crossed-bowtie antenna will be completed during the next reporting period. The three broadband, circularly-polarized antenna. configurations (crossed-bowtie, conical loghelix, and log-periodic) will be evaluated and compared. The best configuration will be selected and the design and fabrication of lower frequency antennas will be attempted.
Approved; /)
, Q , tU .I tO~:;};:;:;;. D. W. Robertson, Head Communications Branch
Respectfully submitt~
{~~rteL William R. Free Project Director
lib-sascan
Rectangle
lib-sascan
Rectangle

_.,, '·~··•t , ... ,
·~-.:.v·_--.,..·~ ...... ~~-
2
Cfi'ice::~ 1
Sciences
Off i.e e:.~ r s
SU3J:
1 r
7-,:2...
Ir:.terference
)
DA Period
Jl.l"v;:C-:=nterfe::..~e:::.ce Characteristics-
. r'·
r::::h.e 2YC.~...:_r_a-cion a:=· t~-:e ferrite lined hooded arrcenna range fro:,: .crCO
Gc
test (?) \·Ti th the ,~
in a screen
below these dis-
in the 200 lvlc to bmvtie e::Lements
ies
have bc::c:..: e-:_c:o:.::.ntered in t:-.:.e S~o~dband Daluns for this
of t~e ba:u:c.s is still in progress.
COY;}-
REVIEW
PATENT .J2.: .. ~:.~ ... 19.!:!..~. BY Pt ..... J ......................... FORMAT .. {~:::./f. .... 19{_r._ BY .. m. ....
lib-sascan
Rectangle
Let~e:r
It is bo-vrtie ante:c.na and the
antenna periodic) will be
D. W. Robertson, ~ead
Communications Branch
Ko. -2- 2
\·Tilliam R. F-.cee ect Director
lib-sascan
Rectangle
lib-sascan
Rectangle

GEORGIA INSTITUTE OF TECHNOLOGY ENGINEERING EXPERIMENT STATION
ATLANTA 13, GEORGIA
2 November 1965
Activity Supply Officer, USAEL Building 2504, Charles Wood Area Fort Monmouth, New· Jersey
'I
MARKED FOR: Engineering Support Services Department Electromagnetic Environment Division Interference Analysis Branch Order No. 5871-PM-63-91
FOR: Accountable Property Officer
! -•. ~ 7 .l ' '
II- ..:2-
SUBJ: Monthly Report No. 19, 5 November 1965, Report Period 1 October 1965 to 1 November 1965, Contract DA 36-039 AMC-02294(E), "Electronic Equipment Interference Characteristics-Communication Type."
Gentlemen:
A conical log-helix antenna compatible with mounting in the low frequency, ferrite lined hood has been designed, fabricated, and evaluated (unhooded). This antenna was designed to operate over the frequency
~ 1' _7
range from 300 Me to 1 Gc. To make the length of the antenna compatible with the available hood, the cone angle was increased to 30 degrees. This antenna is presently being installed in the hood, and the hooded configuration will be evaluated during the next reporting period.
A 11 short 11 crossed bow·-tie antenna has been designed, fabricated and is presently being evaluated. This antenna was designed to be one-half wavelength at 1 Gc and will be evaluated, initially, over the frequency range from 200 Me to 1 Gc. Since the antenna w·ill be equal to or less than onehalf wavelength over the operating range, the beam-splitting encountered w·ith the "long" bow·-tie (one-half wavelength at the lowest operating frequency) should not present a problem with this configuration. The evaluation should determine if the gain and impedance characteristics of the "short" bow-tie are adequate to allow· it to be used as a standard test antenna for case emission and susceptibility measurements.
..,,.-.'.•1'',•\-::><V~
REVI,EW L::' PATENT 12-:2.. ,/ 19 1-(' BY .................... .
FORMAT::;~·~::~:~: 19~~ BY .. LU~ .. .
lib-sascan
Rectangle

Monthly Letter Report No. 19 -2- 2 November 1965
Development of a "short r! dipole antenna for evaluating the hooded antenna technique at lower frequencies is presently in progres's. Transistor emitter followers are being incorporated in this configuration to improve the gain and impedance characteristics at low frequencies.
Approved:
j).hJ./2~ D. W. Robertson, Head Communications Branch
......
submitted:
~k Williarp. R. Free Project Director
lib-sascan
Rectangle
lib-sascan
Rectangle

,
ATLANTA 13, GEORGIA
3 December 1965
Activity Supply Officer, USAEL 2504, Charles 1vood Area
Fort Monmouth, ~ew· Jersey
MARKED FOR: Support Services Department Electromagnetic Environment Division Interference Analysis Branch Order No. 5871-PM-63-91
FOR: Accountable Property Officer
1..3--- 3
SUBJ: Monthly Report No. 20, 5 Decemoer 1965, Report Period l November 1965 to l December 1965, Contract DA 36-039 Al\1C-02294(E), 11 Electronic Equipment Interference Characteristics-Communication Type. 11
Gentlemen:
Tne evaluation of a 30-degree conical log-helix antenna, both in the open-field and mounted in the low· frequency, ferrite lined hood, has continued during this reporting period. An identical evaluation of a nshort" (one-half at the frequency of interest) bow-tie antenna has been performed in w'ith the log-helix evaluation. The majority of the measurements required for these evaluations have been completed, and it is anticipated that the complete evaluation of the tW'o antennas will be in the next quarterly report.
The evaluation of a "short 11 dipole antenna, containing transistor emitter follow·ers to improve the and impedance characteristics at low has also been in progress this period. The objective of this antenna development is to obtain small, low· frequency probe antennas which can be utilized in an evaluation of the uhooded antenna 11 technique at low frequencies and in investigations of the waveguide-below-cutoff characteristics of tunnel-like structures partially and lined w'ith absorbing materials.
A preliminary attempt was made to 11 load" a log-helix antenna with carbonyl iron particles suspended in an epoxy binder to increase the electrical size of the antenna. This preliminary attempt was unsuccessful. It is felt that the thickness of the nloading 0 layer was not sufficient to
sh the desired results, and that some additional experimentation,

Renort No 20 -2-Contract N~. DA 3tS-039 PJILC-02294 (E)
3 Decemoer 1965
will oe necessary. For the purposes of tnis the use of small antennas, which will
-r,he fabrication of the antennas and will minimize the amount of materials required, appears desirable. A small conical log-helix
antenna, de to operate over the range from 1 to 10 Gc, is fabricated for tnis pL~rpose. ?nis antenna is constructed of small, solid-shield coaxial line so that it is self-supporting not a conical form. The elimination of the form -vrill greatly o:f the antenna w·i th material.
A theoretical study of problem areas associated with near-field measurements has continued during this reporting period. Tnis study is primarily concerned with the complex field configuration in the near-field, the measurement probe re in this area, and w·hat must be measu~ed to adequately descrioe the near-field configuration.
Approved:
0 \ /'v ;
D. itJ. Robertson, Head Communications Branch
Hilliam R. Free Project Director
lib-sascan
Rectangle
lib-sascan
Rectangle
lib-sascan
Rectangle

GEORGIA INSTITUTE OF TECHNOLOGY ENGINEERING EXPERIMENT STATION
ATLANTA. GEORGIA 30332
3 February 1966 . t~ or 1 c £
ifhls d:Jcument ,·:..) n t b
Activity Supply Officer, USAEL Building 2504, Charles Wood Area Fort Monmouth, New Jersey
Prior fo
MARKED FOR:
FOR:
SUBJ:
Gentlemen:
Engineering Support Services Department Electromagnetic Environment Division Interference Analysis Branch Order No. 5871-PM-63-91
Accountable Property Officer
Monthly Report No. 21, 5 February 1966, Report Period l January 1966 to l February 1966, Contract DA 36-039 AMC-02294(E), "Electronic Equipment Interference Characteristics- Communication Type."
used by anyone·OJ
An 8' x 8' shielded enclosure and an 8' x 12' shielded enclosure have been combined to form an 8' x 20' shielded enclosure. A low·-frequency absorbing material, Emerson and Cuming HPY-72, is being mounted on one end wall of this enclosure. This enclosure will be utilized to evaluate the hooded antenna technique over the frequency range from 50 to 400 Me during the next reporting period. The larger enclosure was necessary for this evaluation due to the fact that the thickness of the low-frequency absorbing material to be utilized on the end wall is 72 inches.
The characteristics of the quadrature coupler have determined the low frequency limit of the evaluation of the "short" crossed bow-tie antenna. The broadband coupler presently being utilized with this antenna covers the frequency range from 200 Me to l Gc and is 15 inches long. It is desired to evaluate this antenna at frequencies below 200 Me, but, utilizing the present coupler technique, a coupler covering the 40 to 200 Me range would be approximately 30 inches long. In order to cover lower frequencies, the coupler would be much more unwieldy. On the basis of this, an investigation of broadband quadrature coupling techniques has been initiated to investigate the feasibility of techniques for developing shorter broadband quadrature couplers. This investigation will be continued during the next reporting period.
The investigation of loading a log-helix antenna with carbonyl iron particles suspended in an epoxy binder to increase the electrical size of the antenna has continued during this reporting period. The fabrication

Monthly Report No. 21 -2- 3 February Contract No. DA 36-039 AMC-02294(E)
of a small, self-supporting, log-conical antenna to be utilized in this investigation has been completed, and the evaluation of this antenna is in progress. It is anticipated that a small ferrite lined antenna hood for this antenna will be fabricated during the next reporting period.
A theoretical study of problem areas associated with near-field measurements has continued during this reporting period.
D. W. Robertson, Head Communications Branch
Respectfully submitted:
w~{__-t~ William R. Free Project Director
lib-sascan
Rectangle
lib-sascan
Rectangle

S03J:
3 i'vhrch
O::c ... :.?icer) ·cs..4EIJ Ct.:::,rle s ~Tood .FL."e&., i\~ e•d·
OrG.er I\o.
Services
C~a~acteris0ics-Cor~~nication
r·
This cJ
Frier
.:rt~nent
Interference
S:·he .~nstall;stion of: the material" Ern.erson & x 20 foot shielded enclosure was :v.::;;asJrerJen·cs ·co evaluate the hooded antenna tech-
rauge from 50 lv:c to 400 Me are pre in pro;;resa.
a~tenna
fabrication of a this w·eek.
--"'~n evalu&tio:c o--.:_' Jcne !-woC.ed an-':;ecna ¥till -be ir1.:. tia-,_-,ed as soon as the antenna conclusion of this the
L:on-epo:xy n-~ixture and re-evaluated.
-~ sel~:.e s ection ca2.i bratio::-1 Let-vror:~ has ·oeeE incorporated into the conical ven~a described in the lOth
Tne secoL~ helic&l utilized as ~~e series ill ·che c&:.i l/~ea.::u::::·e:;::.e:~ts -co evaluate
-oalanced conical antenna v-ras
an ar.:.d. ca_._i ~:~B.:te
results of the antenna structure.
series injection calibration :i.n progress.
Project Director
f ·~,, f \....'-'~• .: •• /----~· ... ,.-/-..;_ ....... ~
lib-sascan
Rectangle
lib-sascan
Rectangle
lib-sascan
Rectangle

GEORGIA INSTITUTE OF TECHNOLOGY ENGINEERING EXPERIMENT STATION
ATLANTA, GEORGIA 30332
4 April 1966
Activity Supply Officer, USAEL Building 2504, Charles Wood Area Fort MOnmouth, New Jersey
This
MARKED FOR: Engineering Support Services Department Electromagnetic Environment Division Interference Analysis Branch Order No. 5871-PM-63-91
FOR: Accountable Property Officer
SUBJ: Monthly Report No. 23, 5 April 1966, Report Period 1 March 1966 to 1 April 1966, Contract DA 36-039 AMC-02294(E), "Electronic Equipment Interference Characteristics-Cormnunication Type."
Gentlemen:
The measurements to evaluate the hooded antenna technique over the frequency range from 50 MHz to 400 MHz are still in progress. It is anticipated that this measurement program will be completed by 15 April 1966. The results, conclusions and recommendations obtained from the analysis
. of the data resulting from this measurement program will be presented in the final report.
The measurement program to evaluate and calibrate the 30-degree conical log-helix antenna incorporating the series injection calibration netvrork has been completed. The analysis of the data obtained from the measurement program and the preparation of the conclusions and recommendations for inclusion in the final report are in progress.
The evaluation of the small self-supporting log-conical antenna mounted in a small ferrite-lined hood is in progress·. There are indications that the presence of the ferrite absorbing material in close proximity to the antenna is loading the antenna to some extent and shifting the operating range to lo-w·er frequencies. This phenomenon will be investigated in more detail as the measurement program progresses. It is anticipated that the measurement portion of this phase of the small hooded antenna evaluation w·ill be completed by 8 April 1966. At this point, the antenna -w·ill be loaded with a car9onyl iron-epoxy mixture and re-evaluated.
D. W. Robertson, Head Communications Branch
Respectfully submitted:
~~ William R. Free Project Director
:c 0R ./
lib-sascan
Rectangle
lib-sascan
Rectangle
lib-sascan
Rectangle

LIBRARY DOES NOT HAVE It is classified.

\
•
REPORT NO. 23
QUARTERLY REPORT NO. 2
PROJECT A-678
ELECTRONIC EQUIPMENT INTERFERENCE CHARACTERISTICS-COMMUNICATION TYPE
By R. D. Trammell, Jr., C. W. Stuckey, E. W. Wood, 0. H. Ogburn, and E. E. Donaldson, Jr.
CONTRACT NO. DA 36-039 AMC-02294(E) (Continuation of Contract No. DA 36-039 sc-87183) DEPARTMENT OF THE ARMY PROJECT: 3B24-0l-001
Placed by the U. S. Army Electronics Research and Development Laboratory Fort Monmouth, New Jersey
15 May 1963 to 15 August 1963
Engineering Experiment Station
GEORGIA INSTITUTE OF TECHNOLOGY Atlanta, Georgia
RFV!E\N ~ P/l.TENT .. /!.-::.?./ ..... 19 .. ~~- BY ......... ." .......... .
. "· r.•• , .. l. u- ')_"') (:g'...3 [''·'~ F~ . .J;..~\:cts!-: ~ . ,_ .. .,. - ~•••"'1, J.. a "'•··••.,•• ,_j '. '• ... • ••-•..._•
lib-sascan
Rectangle

ENGINEERING EXPERIMENT STATION of the Georgia Institute of Technology
Atlanta, Georgia.
REPORT NO. 23
QUARTERLY REPORT NO . 2
PROJECT A-678
ELECTRONIC EQUIPMENT INTERFERENCE CHARACTERISTICS-COMMUNICATION TYPE
By
R. D. TRAMMELL, JR., C. W. STUCKEY, E. W. WOOD, 0. H. OGBURN, and E. E. DONALDSON, JR.
CONTRACT NO. DA 36-039 AMC-02294(E) (Continuation of Contract No. DA 36-039 sc-87183) DEPARTMENT OF THE ARMY PROJECT: 3B24-0l-001
The object of this research program is to conduct a. comprehensive investigation to determine methods for measuring the interference characteristics (spectrum signature) of U. S. Army communications equipment deemed necessary for the prediction and minimizing of electromagnetic interference.
15 MAY 1963 to 15 AUGUST 1963
PLACED BY THE U. S . ARMY ELECTRONICS RESEARCH AND DEVELOPMENT LABORATORY
FORT MONMOUTH, NEW JERSEY

TABLE OF CONTENTS
I. PURPOSE .
II. ABSTRACT.
III. PUBLICATIONS, LECTURES, REPORTS, AND CONFERENCES ..
IV.
v.
VI.
VII.
VIII.
FACTUAL DATA.
A. Multipath Transmission Tests on FM Systems.
l. Introduction.
2. Common-Channel Interference Tests on a Typical Wide-Band FM System . . . . . . . . . . . .
3. Multipath Transmission Tests on a PPM/FM Radio Relay . . . . . . · · · ·
B. Mixer Study
l. Introduction ..
2 Errors in Measurement
3· Generalized Prediction Equations ..
4. Experimental Error in Prediction"
5, Analysis of the Effective Mixer Constants .
6. Conclusions
CONCLUSIONS
PROGRAM FOR NEXT INTERVAL .
IDENTIFICATION OF KEY TECHNICAL PERSONNEL
REFERENCES. . . . . . . . . . . . . . . . .
This report contains 66 pages. ii
Page
l
2
3
4
4
4
4
12
30
30
31
37
56
63
64
65
66

LIST OF FIGURES
1. Block Diagram of Test Configuration Used For Simulated Common-Channel Interference Tests on a Wide-Band FM System
2.
3·
4.
5·
6.
7·
Power Required to Give 22 db of Quieting as a Function of Frequency at a Tuned Frequency of 1550.5 Me ....
Quieting With a Signal Level of -10 dbm as a Function of Frequency at a Tuned Frequency of .5 Me ....
Block Diagram of Test Configuration Used For Simulated Multipath Interference .. o •••••••••••
Voltage Spectrum of the Direct Path Signal Showing (Left to Right) Main Lobe, First, Second, and Third Side Lobes ..
Voltage Spectrum of the Multipath Received Signal With the Relative Phase Adjusted to Give Cancellation of the Main Lobe
Upper: The Received Direct Path Signal With the Delayed Signal Attenuated 100 db . . . . . . . . . . . . .
Lower: The Received Multipath Signal With the Spectrum Adjusted as Shown in Figure 6. . . . . . .
8. Predicted PCI as a Function of Relative Power With the Relative Phase Adjusted For Maximum Voltage Cancellation of the Main Lobe at a Receiver Quieting of 39 db ...
9.
10.
ll.
12.
Predicted PCI as a Function of Relative Power With the Relative Phase Adjusted For Maximum Voltage Cancellation of the First Side Lobe at a Receiver Quieting of 39 db
Voltage Spectrum of the Multipath Received Signal With the Relative Phase Adjusted to Give Cancellation at the First Side Lobe* ............... .
Voltage Spectrum of the Multipath Received Si With the Relative Phase Adjusted to Give Cancellation at the Second Side Lobe . . . . . . . . . . . . . . . . .
Upper: Received Multipath Signal With the Spectrum Adjusted as Shown in Figure 10 . . . . . . . . .
Lower: Received Multipath Signal With the Spectrum Adjusted as Shown in ll . . . . . . . . .
(Continued)
iii
Page
5
6
9
14
17
20
22
22
22
22

13.
14.
LIST OF FIGURES (Continued)
Predicted PCI as a Function of Relative Power With the Relative Phase Adjusted For Maximum Voltage Cancellation of the Second Side Lobe at a Receiver Quieting of 39 db .
Predicted PCI as a Function of Relative Power With the Relative Phase Adjusted For Maximum Voltage Cancellation of the Third Side Lobe at a Receiver Quieting of 39 db
Voltage Spectrum of the Multipath Received Signal With the Relative Phase Adjusted to Give Cancellation of the Third Side Lobe • • • • . . • . . • . . • . • . • • • •
16. Upper: The Received Multipath Signal With the Spectrum
17.
18.
19.
20.
21.
22.
23.
24.
25.
26.
27.
28.
Adjusted as Shown in Figure . • . . . • • .
Lower: The Received Delayed Signal With the Direct Path Signal Attenuated 100 db. . . . • . . ..••.
Predicted PCI as a Function of Relative Power With the Relative Phase Adjusted For Maximum Voltage Cancellation of the Main Lobe at a Receiver Quieting of 20 db •••••
Predicted PCI as a Function of Relative Power With the Relative Phase Adjusted for Minimum Receiver Noise at a Receiver Quieting of 20 db. . . . . . . . . Test Setup For Spurious Response Measurements . Response Density Versus Prediction Error For a lN82A Diode
Response Density Versus Prediction Error For a lN82A Diode
Response Density Versus Prediction Error For a lN82A Diode
Response Density Versus Prediction Error For a 1N82A Diode
Response Density Versus Prediction Error For a lN82A Diode
Response Density Versus Prediction Error For a 1N82A Diode
Response Density Versus Prediction Error For a lN2lB Diode
Response Density Versus Prediction Error For a 1N21B Diode
Response Density Versus Prediction Error For a lN2lB Diode
(Continued)
iv
Page
23
24
25
25
27
29
33
Mixer. 38
Mixer. 39
Mixer. 40
Mixer. 41
Mixer. 42
Mixer. 43
Mixer. 44
Mixer. 45
Mixer. 46

LIST OF FIGURES (Concluded)
Page
29. Response Density Versus Prediction Error For a lN2lB Diode Mixer. 47
30. Response Density Versus Prediction Error For a lN2lB Diode Mixer. 48
3lo Response Density Versus Prediction Error For a lN23C Diode Mixer. 49
32. Response Density Versus Prediction Error For a lN23C Diode Mixer. 50
33· Response Density Versus Prediction Error For a lN23C Diode Mixer. 51
34, Schematic Diagram of lN82A Test Mixer
35· Response Density Versus Prediction Error Using Averaged Power Ratio . . . . . . . . . . . . . . . . . . . . . . . . . . . . 54
36. (2, l) Response Level Versus Bias Voltage For Single Diode Mixer With No Fre~uency Discriminationo .
37·
38.
39
I.
Relative Response Level Versus Forward Diode Bias Order Responses of the lN2lB Diode Mixer. . Relative Response Level Versus Forward Diode Bias Order Responses of the lN2lB Diode Mixer.
Relative Response Level Versus Forward Diode Bias Order Responses of the lN2lB Diode Mixer.
LIST OF TABLES
SPURIOUS RESPONSE TRIANGLE FOR A MIXER HAVING A POLYNOMIAL REPRESENTATION OF THE TENTH DEGREE .
v
For Third
For Fourth
For Fifth
59
60
. 61

I. PURPOSE
The purpose of this project is to conduct a feasibility study and investi
gation to determine methods for measuring the interference characteristics
(spectrum ture) of U. S. Army communications equipment deemed necessary
for the prediction and minimi of electromagnetic interference. Emphasis
shall be placed on modulated type communications equipments operating
in the 1-10 kMc frequency range. Measurement techniques for obtaining the
required data and a format for a directory of these data shall be developed.
Computer methods shall be developed for proce these data to obtain
outputs useful in determining optimum characteristics for communications
equipments operating in prescribed interference environments.
The areas of investigation on this project are divided into two tasks
as follows:
I< The development of tests and procedures for the evaluation of the
interference ty and emanation characteristics of pulse modulated
type communications equipments.
II. The use of computer techniques for processing measured interference
data to produce outputs useful in interference prediction and control
tions.
-1-

II. ABSTRACT
Qualitative common-channel interference tests were made on a wide~band
FM The effect of simultaneous reception of two on the
understandability of the desired received signal is reported.
Two path interference tests were initiated on a radio relay system
which employs time division multiplexing. Predicted PCI as a function of
relative phase are for a delay of 0. ~sec. These data
indicate that this is not a sufficient delay to cause ficant
tion in intelli for this communications system.
Equipment limitations and the inherent errors of the tech-
nique are examined as sources of mixer prediction errors. Error-
density data are shown for fourteen diode mixer tests from which the prob-
able causes for ction errors are deduced. These data indicate that
the examined sources can produce si
tions of mixer operation.
cant errors under certain condi-
-2-

III. PUBLICATIONS, LECTURES, REPORTS, AND CONFERENCES
Mr. R. D. Trammell, Jr., attended the 5th National Symposium on Radio
Frequency Interference in Philadelphia, Pennsyl va,.nia, on 4-5 June
Mr. Weitz and Mr. R. L. McKenzie from USAELRDL visited Georgia Tech
on 16-18 July for a technical discussion.
Mr. Warren Kesselman from USAELRDL visittt:d Georgia Tech on 30- July to
discuss project progress made during the second quarter of the research program.
Mr. J. T. Ludwig, Mr. Martin Sherman, and Mr. I. N. Mindel from IIT Research
Institute, Chicago, Illinois, visited Tech on 30 July. The nonlinear
effects of dummy loads and the results of current mixer studies were discussed.
-3-

IV. FACTUAL DATA
A. Multipath Transmission Tests on FM Systems
l. Introduction
Two U. S. Army FM communications , which were de to
utilize time division to frequency modulate the trans-
mitter , were used to multipath interference characteristics
of modulated type comrrmnications A PCM simulator was not
available for one of the FM studied, and this system was tested as a
channel communications link. A PPM set and a wide-band
FM transmitter and receiver set provided a PPM/FM radio link for a
quantitative
2. Common-Channel Interference Tests on a T,ypical Wide-Band FM System
Qualitative common-channel interference tests were made on an FM
system which tunes between 1 and 2 Gc in an effort to gain some into
the multipath interference problem at these s. In these tests, two
transmitters and a receiver were used as shown in 1. Initially,
one transmitter was tuned to 1549.4 Me and the other was tuned to .6 Me
The receiver was tuned to 50.5 Me. The receiver response was approximately
6 db and 10 db down from the receiver peak response at these two transmitter
frequencies, as shown in 2.
The transmitters were modulated by tape an Ampex 601
as shown in 1. Two dual channel test tapes were
made for the study. The first tape was made by recording a local AM radio

TRANSMITTER 500 r- -----. l LOAD I I AMPEX VARIABLE
ATTENUATOR 1 I I RECORDER I I
I RECEIVER I
I REPRODUCER
I I I I TRANSMITTER son
2 LOAD L_ _ _j ---VARIABLE SCREEN ROOM
ATTENUATOR 2
Figure 1. Block Diagram of Test Configuration Used for Simulated Cownon-Channel Interference Tests on a Wide-Band FM System.
-5-

I 0\ I
e -10 ...Q -o -(.!) z 1-w ::J a ...Q -o N N
a::: 0 u.. a w a::: :::J a w a::: a::: w 3:: 0 0...
-5
0
1549 1550 1551
FREQUENCY (Me)
1552 1553
Figure 2. Power Required to Give 22 db of Quieting as a Function of Frequency at a Tuned Frequency of 1550.5 Me.

broadcast on each track of the tape with no delay time between tracks~ The
second tape consisted of the recording of a local AM radio broadcast on both
tracks with one track delayed 142 msec from the other. The delay was achieved
by recording one track from the playback of the other. Thus, the delay time
was the time req_uired for the tape to travel from the recording head of the
recorder to the playback head.
The power arriving at the receiver from each transmitter could be con
trolled by General Radio type 874-GA adjustable attenuators. The insertion
loss of these attenuators is 33 ± 2 db and the variable attenuation is con
tinuously adjustable from 0 to 120 db. The power available at the transmitter
antenna terminals of transmitters 1 and 2 was 9.5 watts and 5.6 watts, respec-
tively. With the attenuation in the line from one transmitter the
relative power levels of the two transmitters could be varied by adjusting
the attenuator in the other line.
As a first test, the transmitters were modulated by playing the undelayed
tape. Variable attenuator 2 was at 0 db and attenuator 1 was adjusted for the
maximum attenuation at which no audio from transmitter 2 was detectable
at the receiver when the modulation was removed from transmitter 1.. The result
ing relative power level at the receiver between the signals from transmitters
1 and 2 was such that the receiver exhibited complete capture on a signal from
transmitter 1. The range of relative powers over which the audio signal from
both transmitters could be detected simultaneously proved to be approximately
20 db.
The transmitters were modulated by playing the delayed tape and the result
audio signal was monitored at the receiver. Attenuator 1 was adjusted in
-7-

2 db over the 20 db range of simultaneous detection. Changing the rela-
tive power by adj the attenuator caused a corresponding change in the
relative levels of the direct and delayed audio si When the direct signal
level was greater than that of the signal) the effect was that of echo.
When the delayed signal level was greater than that of the direct signal the
effect was reminiscent of "print-througho" Under both conditions the audio
si was 100 per cent intelligible.
Some confusion arose at that relative power level at which both the delayed
and direct signal were approximately equal in level at the receiver antenna ter-
minalso Had a different audio signal been used in of the delayed signal)
the effect would have been very much like two-voice babble. The intelligibility
of this si would depend primarily on the listener's to concen-
trate on the desired signal. The range of relative power levels at which this
condition existed was less than l db.
The phenomenon of simultaneously receiving both signals over a wide range
of relative power levels can be attributed to not having sufficient voltage at
the receiver to operate the limiter. This is graphically illustrated in
3) which shows the receiver quieting obtained with a constant input signal power
of -10 dbm as a function of transmitter frequency. The two selected transmitter
) 1549.4 and 1551.6 Me) lie on the slopes of the limiting curve.
The two transmitters were retuned to the 1550.5 Me channels. The actual
resulting frequencies were 1550.3 and 15 .7 Me) both of which are well within
the limiting curve of Figure 3. Again, variable attenuator 2 was set at 0 db.
Attenuator l was adjusted through its entire range. The receiver exhibited
on the si from transmitter l until that RF si had been attenuated
-8-

I \D
I
25
20
::0 15 ~
(.!) z 1-w :J cr
10
5
1549 1550 1551
FREQUENCY (Me)
1552 1553
Figure 3. Quieting with a Signal Level of -10 dbm as a Function of Frequency at a Tuned Frequency of l550-5 Me.

such that the power at the receiver from transmitter l was about +1.5 db with
to the power from transmitter 2. The receiver exhibited on
the from transmitter 2 when attenuator l was usted such that the
power from transmitter l was about -1.5 db or less with respect to the power
from transmitter 2. Within the 3 db interval centered about equal power at
the receiver from each transmitter) the output audio was noisy. With
fixed attenuator within the 3 db interval the S/N ratio varied con-
siderably. This was probably caused by random fluctuation in output power from
the transmitters) causing the relative powers to shift about 0 db. This
same power fluctuation effect caused the attenuator setting at which capture
occurred on the two signals not to be sharply defined. The interval of incom
plete capture was measured to be from 0.5 to 4 db wide) with an average width
of about 3 db.
Because of the relative power fluctuations) it was not possible to set and
maintain the relative power levels at 0 db. Had this been ) the audio
l probably would have proved unintelligible because of the noise. However)
even when the transmitters were modulated with the ) the connected
discourse proved highly intelli although some individual words were lost
because of noise during the transitions from capture on one si to
l capture on the other. Had a different voice message been used in ce
of the delayed message) parts of the desired signal would have been lost because
of random partial capture of the undesired si
The observed of the FM receiver in the presence of two common-
channel transmitted signals was in aN~cc~c.~ with published observations
and theory. Corrington1 reported simultaneous of two FM radio stations
-10-

~hich operated on the same frequency ~hen their carrier wave voltage levels drop-
ped below the level at which the limiter in the receiver operated. This effect
was observed in the system when the transmitter frequencies were tuned
too far from the receiver tuned frequency to permit complete at the
available power levels.
Arguimbau2 ' 3 and others 1 ' 4 ' 5 through the use of mathematical models have
shown that maximum interference results from multipath and common-channel trans-
missions when the ratio of the received po~er levels is one. Further, they have
demonstrated that essentially distortion-free results should be obtained when the
2 relative power levels differ by more than 10 per cent. Laboratory measurements
latter hypothesis. Although the exact relative po~er levels were not measured,
it that distortion-free results were obtained with the present system
when the power levels differed by from at least 10 to 30 per cent.
Even with a 142 msec audio delay and the relative power levels adjusted as
equal as possible, the audio output of the receiver proved in tel-
ligible. Since a multipath delay of 10 msec requires a path length difference
in excess of 1800 miles, it would be unlikely that power for the two
received si would exist at any delay ~hich would cause the audio to be
unintelli However, it is conceivable that equal or very equal
power levels could arrive at a receiver from two (or more) paths ~hich differ
in by a few miles. The delays corresponding to these path
differences are on the order of 20 ~sec or less. While the data indicate
that the intelli ty of a signal received by the wide-band FM would
be r~latively unaffected by such , the intelligibility of a trans-
-ll-

mitted and received by a PPM/FM communications system might be
lowered as a result of path length differences of this rna
spacing on many PPM/FM systems which use time division
The channel
ranges from
3 to 10 !J.Sec. of the same order of arising from multipath
transmission could probably be expected to be a source of interference in such
a system. The work reported in the following paragraphs is part of a
investigation of the multipath transmission distortion effect on a PPM/FM radio
system time division multiplexing¢
Multipath transmission tests were initiated during the quarter on a
PPM/~1 radio relay system which utilizes time division The multi-
has independent channels and uses a sampling frequency of 8 kc. The
23 channel are separated equally by 5.2 !J.Sec. A double pulse used as a
marker or starting pulse plus the channel comprise the f-LSec sam
is 0.6 f..1Sec, time. The pulse width of both the marker and channel
The separation of the two 0.6 ~sec pulses which make up the marker is 1.25 f..1Sec.
The channel
The
deviation at 100 per cent modulation is ±0.5 !J.Sec.
fications of this indicate that audio interference
should result at the system output whenever the path lengths of two or more
multipath differ by enough to cause a relative delay of approximately
0.5 ~sec or greater, provided the
the same power. Depending upon the
from audio "noisen to random
the interference should range
and complete loss of the desired
si The ty of crosstalk between channels caused by delayed pulse
-12-

trains is also suggested by the multiplexer cations. It is the above
conjectures that the experiment outlined below will confirm or disprove.
Multipath reception tests were initiated on the PPM/FM radio relay
which is operated as shown in Figure 4. Different direct and delayed path cable
are used to obtain the experimental By viewing the recovered
pulse train (after transmitted and received) on the oscilloscope, the
degradation due to
and the adjustable line can be observed.
A analyzer Model SPA-4a, Panoramic Radio Produc can be used
to observe selected portions of the transmitted A radio interference
mea set (RIMS), Empire Devices NF-112, can be used as a comparison measur-
instrument for setting power levels at the receiver
Addition of the
DA-3FN resistance adder.
and direct signals is in a Microlab
using this device the VSWR at all in the
system is maintained below 1.50 The adjustable attenuator in the direct
is a General Radio 874-GAS2. Care is taken to always approach attenuator
from the same direction of barrel travel since this attenuator has
about l db of backlash. A General Radio adjustable line type 874-LK20 serves
to set the phase between the direct and delayed signals. A
directional coupler, Narda Model 3022, isolates (20 db) the spectrum
and the RIMS from the signal
Because of its availability, a foot length of RG-8 cable was used as
an initial delay path cable. This cable has a measured attenuation of 0.17
db/ft at the transmitter tuned or about db for the entire span.
A relative delay between the direct and delayed paths of 0.25 ~sec was obtained
at the receiver.
-13-

I f-l + I
TRANS
MITTER
SCREEN ROOM
DELAY PATH (Cable)
DIRECT PATH
I I
------, I MUL Tl
.,__....__.111111 PLEXER
DE-
l MULTIPLEXER
I L __
RECEIVER
OSCILLO
SCOPE RIMS
I I I I
SPECTRUM
ANALYZER
RESISTIVE ADDER
ADJUSTABLE LINE
Figure 4. Block Diagram of Test Configuration Used for Simulated Multipath Interference.

With the direct path attenuator of Figure 4 adjusted for maximum attenua
tion) the unmodulated signal at the receiver was measured to be -47 dbmJ which
is 20 db above the level required to produce 20 db of quieting and which corre
sponds to 39 db of quieting at the video output. Equal power could be obtained
at the receiver from the direct signal path when the direct path attenuator was
set to 20" db and the delayed path was broken and terminated at the adjustable
line"
The audio output of channel 7 of the multiplexer was monitored for the tests
reported in this section. The audio of this channel was set at approxi-
mately 1.2. A Ballantine RMS vol tmemter was used to measure S/N rat,ios at
the channel 7 output) and the S/N ratio measurements were converted to predicted
PCI" Details of the S/N ratio measurement technique and conversion of these
measurements to predicted PCI are covered in Quarterly Report No l of this
contract.
The transmitter was modulated with the pulse train from the multiplexer.
With the power levels in the direct and delayed paths set about , the
noise at the audio output of channel 7 could be varied over a considerable
range varying the adjustable line. The S/N ratios corresponding to these
noise variations ranged from +34 to -16.5 db.
With the modulating pulse train removed, it was found that with equal
power in the direct and delayed paths) the receiver quieting could be varied
from 45 db to nearly 0 db the adjustable line, This variation in
receiver quieting can be attributed to reinforcement and cancellation of the
RF direct by varying the relative phase between the direct signal
and the delayed signal when the path length of the latter is increased or

decreased. The wave length of the tuned frequency is 5·3 inches and the adjust
able line can be varied over an 8.5 inch interval; thus, it was possible to vary
the relative phase angle by more than 360°.
The RF voltage spectrum of the received direct path signal is shown in
Figure 5 'rhe corresponding video input to the demultiplexer is shown in the
upper portion of Figure 7. The voltage spectrum is made up of a main lobe and
three side lobes. For fixed relative phase angles, as the direct to delayed
po~rer ratio is changed, changes occur in the voltage spectrum, Similarly, for
fixed relative power levels voltage spectrum changes occur as the relative
phase angle is changed. Both relative phase angle and relative power changes
cause variations in the noise level at the audio output of channel 7" The
maximum noise occurred when the relative power and phase were adjusted such
that one of the four lobes of the voltage spectrum was minimized. Thus, it
was decided to determine the predicted PCI as a function of relative power in
the direct and delayed paths with the relative phase adjusted in each case to
cause a minimum voltage at the midpoint of each one of the four lobes of the
voltage spectrum.
Figure 8 shows predicted PCI as a function of relative direct to delayed
path power with the relative phase angle adjusted to give minimum RF voltage
at the main lobe. Predicted PCI is 100 for relative power levels greater than
+l db and less than -1 db. When the relative power levels are equal, the S/N
ratio becomes very small (less than db) and the predicted PCI falls to
zero. The insensitivity of the system to multipath interference under the
outlined conditions at relative power levels which differ by l db or more can
be attributed to the high quieting level (39 db) at which the data are taken.

I f-' -_;] I
l 0 G 0 B
0
• • •
-20.
• • • -· o.s
PANORAMIC RADIO PRODUCTS. INC. MODEL SPA· 40
I
r_~:-r~ 1
; l __ ! )
r I
I \
I ,.'j 111 d& •l u ".J •lflllofl ~
-0+ SWEEP WIDTH FACTOR
1.
0.1
0.6
0.4
0.2
u
v 0 L T A G E
Figure 5. Voltage Spectrum of the Direct Path Signal Showing (Left to Right) Main Lobe, First, Second, and Third Side Lobes.
L 0 G 0 B
0
• • •
-20.
•
• •
-4()41
0.5
PANORAM IC RADIO PRODUCTS. INC. MODEL SPA · 40
.. ..
l -- ' I '
I . · ···~-- ·
l J
i _,_
! l
d 111 - 0+
SWEEP WIDTH FACTOR
1.
0.1
0.&
0.4
0.2
u -
v 0 L T A G E
Figure 6. Voltage SpectrTh~ of the Multipath Received Signal with the Relative Phase Adjusted to Give Cancellation of the Main Lobe.
Figure 7. Upper: The Received Direct Path Signal with the Delayed Signal Attenuated 100 db.
Lower: The Received Multipath Signal with the Spectrum Adjusted as Shown in Figure 6 .

I f--' co I
100
90
80
70
u 60 a_
0 w 1- 50 u 0 w g: 40
30
20
10
0~--~----~----~----~--~-----L--------~----~----~----._--~~--~----~----~--~ -10 -9 -8 -7 -6 -5 -4 -3 -2 -1 0 + 1 +2
POWER IN DIRECT PATH RELATIVE TO DELAY PATH (db)
Figure 8. Predicted PCI as a Function of Relative Power with the Relative Phase Adjusted for Maximum Voltage Cancellation of the Main Lobe at a Receiver Quieting of 39 db.
+4 +5

Adjusting the relative phase for minimum RF voltage at the main lobe causes
carrier cancellation between s of the modula pulse train,. The extent
of this cancellation depends directly on the relative of the direct
and delayed si and hence on the relative power. The si at the
receiver dwells at the main lobe frequency more than 70 per cent of the time
(approximately 3,7 ~sec out of every 5.2 ~sec). At equal relative power levels
the receiver is essentially not quieted during the dwell timej thus, at
powers the S/N ratio is very small. At unequal power levels, even though the
main lobe voltage is minimized and attenuated from its maximum
value, the residual power during the dwell time is sufficient to cause receiver
quieting at this relatively high signal input. Greater sensitivity to main lobe
cancellation should occur at lower overall signal levels.
Figure 6 shows the voltage spectrum of the multipath received signal with
the relative phase adjusted to give minimum RF voltage at the main lobe when
the relative direct and delayed path power levels are equal" The received video
signal under these conditions is shown in the lower half of Figure 7. The noise
between caused by carrier cancellation during the dwell time is apparent.
Th.e pulse distortion is caused by the addition of the two different simultaneous
RF frequencies in the receiver discriminator. Thus, the direct path
phase modulated in the discriminator·by the delayed signal.
is
Figure 9 shows predicted PCI as a function of relative direct to delayed
path power with the relative phase adjusted to minimum RF voltage
at the first side lobe. The lowest PCI determined by any relative power was
than As shown in Quarterly Report No. 1, the predicted intelligi-
bility corresponding to a PCI of 85 for isolated monosyllabic words is greater
-19-

I 1\) 0 I
0 a..
0 w I-u 0 w a::: a..
100
90
80
70
60
50
40
30
20
10
0 -10 -9 -8 -7 -6 -5 -4 -3
POWER IN DIRECT PATH RELATIVE TO DELAY PATH (db)
Figure 9· Predicted PCI as a Function of Relative Power with the Relative Phase Adjusted for Maximum Voltage Cancellation of the First Side Lobe at a Receiver Quieting of 39 db.

than 95 per cent. Thus no degradation in the intelligibility of transmitted
speech is to be expected at this relative phase angle. Figure 10 shows the
voltage spectrum of the multipath received signal with the relative phase
adjusted to minimum RF voltage at the first side lobe when the relative
and delayed path power levels are equal. The received video signal under
these conditions is shown in the upper half of 12.
13 shows predicted PCI as a function of relative power with the
relative phase angle adjusted for minimum RF voltage at the second side lobe.
11 shows the voltage spectrum of the multipath received signal corre
sponding to this phase adjustment when the relative power levels are equal.
1rhe lo""..rer half of 12 shows the corresponding received video signal. No
degradation in the intelligibility of transmitted speech is to be at
this relative angle.
Figure 14 shows predicted PCI as a flinction of relative power with the
relative phase angle adjusted for minimum RF voltage at the third side lobe.
Figure shows the spectrum of the multipath received signal corresponding to
this phase adjustment when the relative po-;;..rer levels are equal. The upper half
of Figure shows the corresponding received video signal. As seen from Figure
15, when the relative phase is adjusted for cancellation of the third side
lobe, the main lobe voltage is greatly attenuated. As seen in Figure 16 random
noise results between because of reduced receiver quieting during the
dwell time. Thus, Figure 14 is essentially the same as Figure Sj however, the
S/N ratio at equal power levels is less when the main lobe is completely can
celed than when partial cancellation occurs as a result of third side lobe can
cellation, The S/N ratios which correspond to Figs. 6 and 15 are -17 and -12 db
-21-

I 1\) 1\) I
PANORAMIC RADIO PRODUCTS. INC .
• •
v L • 0 ~-+-4~··"--~.,., --+---+---; 0. 6 0
l T A
G -20 ............... ~-+--· +>•• · •••r•···-' ·~······--
~ .~W-~m --+--.......,__--; 0.4 G E
-40-
0+ ~· SWEEP WIDTH FACTOR
Figure 10. Voltage Spectrum of the Multipath Received Signal with the Relative Phase Adjusted to Give Cancellation at the First Side Lobe.
ll iO G -20. ;[) :e
•
PANORAMIC RADIO PRODUCTS. INC. SPA·40
v .. ._ .... ,..-~.-..... f-.-f------1---t--......... 0. 6 0
l T
--+--......,._--1 0.4 ~ E
~s -o+ SWEEP WIDTH FACTOR
Figure 11. Voltage Spectrum of the Multipath Received Signal with the Relative Phase Adjusted to Give Cancellation at the Second Side Lobe.
Figure 12. Upper: Received Multipath Signal with the Spectrum Adjusted as Shown in Figure 10.
Lower: Received Multipath Signal with the Spectrum Adjusted as Shown in Figure 11.

0 a.. Q w 1-u 0 w ~ a..
I f\) w I
100
90
80
70
60
50
40
30
20
10
0~--_.----~----~--_.----~----~--~----~----~--~----~----~--~----~----~--~ -10 +2
POWER IN DIRECT PATH RELATIVE TO DELAY PATH (db)
Figure 13. Predicted PCI as a Function of Relative Power with the Relative Phase Adjusted for Maximum Voltage Cancellation of the Second Side Lobe at a Receiver Quieting of 39 db.

I 1\)
+ I
u c.. 0 w 1-u 0 w 0:: c..
100
90
80
70
60
50
40
30
20
10
0 -10 -9 -8 -7 -6 -5 -4 -3 -2 -1 0 +1 +2 +3
POWER IN DIRECT PATH RELATIVE TO DELAY PATH (db)
Figure 14. Predicted PCI as a Function of Relative Power with the Relative Phase Adjusted for Maximum Voltage Cancellation of the Third Side Lobe at a Receiver Quieting of 39 db.
+4 +5 +6

I f\) \J1 I
l Q G 0 8
0
• . •
-20. . • • _.,.
0.5
PANORAMIC RADIO PRODUCTS.INC. MODEL SPA - 40
i l
I I
1 dl ~ 11 ,l J
-0+ SWEEP WIDTH FACTOR
I.
0.1
0.6
0.4
0.2
u --
v 0 L T A G E
Figure 15. Voltage Spectrum of the Multipath Receiver Signal with the Relative Phase Adjusted to Give Cancellation of the Third Side Lobe.
Figure 16. Upper: The Received Multipath Signal with the Spectrum Adjusted as Shown in Figure 15.
Lower: The Received Delayed Signal with the Direct Path Signal Attenuated 100 db.

A visual comparison of Figures 7 (lower) and 16 (upper) shows the
difference in the video waveform resulting from complete and partial main lobe
cancellation. The lower half of Figure shows the received video si when
the direct path si was attenuated 100 db. This signal is identical with
that of Figure 7 (upper) that it is delayed 0. ~sec.
From the foregoing data, it can be concluded that for a delay of 0. ~sec
between the direct and reflected paths, multipath interference will degrade the
transmitted intelli over this communications system at 39 db of
when the relative powers are within ±l db and the relative angle is adjusted for
cancellation or near cancellation of the carrier frequency. The degradation in
intelli lity under these conditions can be attributed to greatly reduced
receiver quieting between the modulating pulses.
A variable attenuator was inserted in the delayed path at the transmitter
end and 20 db of fixed attenuation was removed from the delayed path at the
adder, The variable attenuator was adjusted to. dbm at the receiver
when the direct path adjustable attenuator was set at 100 db. This power
level corresponds to 20 db of receiver Equal power could be obtained
at the receiver from the direct path when the direct path attenuator was
set at 41.5 db and the delayed path was broken and terminated at the adjustable
line.
shows predicted PCI as a function of relative power with the
relative se angle adjusted for maximum voltage cancellation of the main lobe
of the voltage spectrum. The data which were taken at a power level which gives
20 db of quieting correspond to those shown in 8, which were taken at
39 db quieting. As expected, the range of relative power levels over which the
-26-

I 1\) -J I
u a.. Q w 1-u 0 w a::: a..
100
90
80
70
60
50
40
30
20
10
0 -11 -10 -9 -8 -7 -6 -5 -4 -3 -2 -1
POWER IN DIRECT PATH RELATIVE TO DELAY PATH (db)
Figure 17. Predicted PCI as a Function of Relative Power with the Relative Phase Adjusted for Maximum Voltage Cancellation of the Main Lobe at a Receiver Quieting of 20 db.

predicted PCI is less than 100 is much for 20 db ~uieting than for 39 db
~uieting. At slightly relative power levels when the main lobe voltage
is minimized, complete voltage cancellation of the main lobe does not
occur; however, at this reduced overall power level (20 db of ~uieting) the
residual power available during the dwell time is insufficient to cause suffi
cient ~uieting for a PCI of 100. The nonsymmetry of the curve of Figure
can also be attributed to receiver ~uieting. For direct-to-delayed
path relative power ratios, attenuation is removed from the direct path, and
fur ratios attenuation is added to the direct path" Thus, at positive
ratios more power is available at the receiver than is available at the corre-
sponding negative ratios. The ~uieting at any given ratio is therefore
greater than it is at the corresponding negative ratio, and the predicted PCI
curve rises from zero more for positive ratios than for ratios.
Figure shows predicted PCI as a function of relative power at 20 db of
quieting with the relative phase angle adjusted for minimum interference. Pre
dicted PCI does not fall below 64 at any relative power. Predicted
bility corresponding to PCI of is greater than per cent for isolated
monosyllabic words. Thus, it is possible to adjust the relative phase
under these conditions such that there is essentially no degradation in intel
ligibility of a transmitted voice message.
It is to note that for every relative power condition at both
levels tested, it is possible to adjust the relative phase so
that than 90 per cent predicted ty can be achieved on
isolated monosyllabic words transmitted over this communications system. Fur
ther, the range of phase angles for which such noise free transmission is

u a.. a w 1-u a w
I e::::
[\) a.. \0
I
100
90
80
70
60
50
40
30
20
10
0 -10
POWER IN DIRECT PATH RELATIVE TO DELAY PATH (db)
Figure 18. Predicted PCI as a Function of Relative Power with the Relative Phase Adjusted for Minimum Receiver Noise at a Receiver Quieting of 20 db.

possible is wide compared to the range of se angles at which degradation of
intelligibility takes This conclusively indicates that 0.25 ~sec is
not a sufficient delay to cause ficant degradation of intelligibility for
this communications system.
Approximately 1000 feet of RG-l7A/U cable has been acquired. Since meas
ured attenuation of this cable is only 0.07 db/ft, it should be possible to
obtain delays in excess of l ~sec at workable RF signal levels. Several spe-
cific delays between 0.25 and l. ~sec will be studied; the results of these
tests will be evaluated with respect to the time division multiplexer specifica-
tions to determine if dia c techniques can be to predict desired
si degradation at specific delays.
B. Mixer Study
l. Introduction
The mixer prediction scheme established in Quarterly Report No. l
as the most acceptable method of prediction among the several presented was shown
to be accurate within 4 or 5 db. 6 Further accumulation of data and associated
prediction have indicated that the scheme may yield predicted values with con-
siderably errors. One cause for such errors presently appears to stem
from the measurement difficulties discussed subsequently.
Another source of prediction error may result from the basic assumptions
made in establishing the entire method for determining the mixer characteris-
tics. The generation similarities peculiar to members of a common generating
order may be sufficiently different to produce ficant errors with large
input levels.
-30-

2. Errors in Measurement
In any study the need for accurate and reliable data, the
investigator is often plagued with measurement errors which prevent data repeti
tion and correlation of measured and calculated values. Since the validity of
the results of an investigation is dependent upon substantiating data, the re
searcher must either eliminate these errors, or else recognize their si
cance by their source. Numerous errors may be found to be associ-
ated with improper eQuipment operation or calibration. Others can be elimi
nated by a change in measurement techniQUe. One source of error that cannot
be completely eliminated, however, is that due to eQuipment limitations.
Because of this, allowances must be made for data variations depending upon
the particular eQuipment and test used.
Specifications of accuracy, stability, etc. on most commercial test eQuip
ment available today are very conservative, and operation of the instruments
will normally be well within the limits imposed by the manufacturer. However,
an instrument cannot be assumed to accurately except within the range
of its limits, and thus any measurements made should be considered only as
accurate as the measuring of the instrument.
To date, the studies of mixer action have resulted in the accumulation of
large amounts of data, not only for the purpose of show similarity of
operation between different mixer types, but also to substantiate theoretical
calculations of mixer action. The deviation in measured data and predicted
mixer action has been sufficient in some cases to warrant a study of the
effect of measurement errors upon correlation of measured and calculated
results. To illustrate the variations in results that may occur due to
-31-

measurement errors, a typical measurement procedure is given below, along with
the errors that may occur. Only errors associated with equipment
limitations are considered.
shows the test involved in the measurement of spurious
responses of a lN82A diode mixer. The sequence of pertaining to the
measurement of a response are listed, along with the error associated
with each
a. Calibrate radio interference measuring set for a standard response.
Error e + 2e l 3
b. Set local oscillator to desired level. Error = +
c. Set signal generator to standard response as measured on
radio interference mea set. Error
d. Monitor signal to mixer using radio interference measuring
set. Error = e3
e. Measure signal input to mixer by signal substitution method.
Error + 2e 3
error in db associated with stability/accuracy of
used for signal substitution measurements.
error in db associated with stability/accuracy of local
oscillator.
= error in db associated with dial
Total error + + 7e 3

I w w I
LOCAL
OSCILLATOR
SIGNAL
GENERATOR
RADIO
INTERFERENCE -
MEASURING
SET (
(~ ,.. GENERATOR
DIODE INPUT
J - DIODE IF
-- MIXER
RADIO
INTERFERENCE
MEASURING
SET
Figure 19. Test Setup for Spurious Response Measurements.

It is seen that the cumulative effect of errors associated with each step
can result in quite a large error in the measured response. The absolute value
of the error will be dependent upon accuracy, while variations in
repeated data depend upon equipment stability. Since the errors e1
, and
are established by the particular equipment being used, no great improvement
is possible in the measured data.
Consider the absolute errors associated with a measured response for
±l db, = ±l db, and ±0.1 db, These particular values of and
are those associated with the accuracy of the equipment used in the mixer
studies, and is an estimation of dial reading error. For these values, the
total error possible in a given response is .7 db. The differences in mea-
sured data for independent investigations could therefore be spread over a
range of 7.4 db. Next consider the effects of instrument stability upon
repeated data. For = ±0.3 db, e2 ±0.3 db, and ±0.1 db, a range of
3.2 db could exist in a repeated measurement for this particular test con
figuration. Although not of unreasonable magnitude, this error is
considerably in spurious response calculation, and its effect upon
mixer action can become intolerable.
The above illustration not only emphasizes a particular problem encountered
in the measurement of spurious responses, but also indicates a general measure-
ment associated with equipment limitations. Added to errors from other
sources, errors resulting from instrument accuracy and stability can eliminate
the validity of measured data. Only if the investigator understands these
limitations can he make the fullest use of experimental data obtained by
measurements.
-34-

3. Generalized Prediction Equations
The entire mixer response system can be expressed as a
zed equation the ection value of any chosen response:
R ::::: ection to the (p, p,q
M l,l
Measured value of (l,
M2,l == Measured value of (2,
~,2 ::::: Measured value of (l,
M (n-l),l == Measured value of
n = P
K p,q
+ q
(cp,q - c(n-l),l)/q
q, ±) responses in db.
l, ±) responses in dbm.
l, ±) responses in dbm.
±) responses in dbm.
[(n-1), l, ± J responses in dbm.
Response constant from Table I for (p, q, ±) responses.
(l)
c (n-l),l =Response constant from Table I for [(n-1), l, ±] responses.
The generalized equation can also be written to express the absolute response
level for the system sensitivity:
A p,q
2 M q 1,2
A Absolute response value in dbm. p,q
M + ~ M - 2 p,q q 2,1
can be written in terms of the measurement accuracy, ±e db:
-35-
(2)
(3)

0
2
3
4
I w 5 0\ I
6
7
8
9
10
a +
a..
t
TABLE I SPURIOUS RESPONSE TRIANGLE FOR A MIXER HAVING A POLYNOMINAL REPRESENTATION OF THE TENTH DEGREE
10 9 8 7 6 5 4 3 2 0 2 3 4 5 6 7 8 9 10 Q- P--....
~ vo ' "~~/ ' v/
---""
'" "" / f), v...., .. ~ 0 [>( 0
~ I" / ..;>
[<« _'\ 6 ~ 0 [X 6
v ~ ~0 ~ l" / '(
":::-.!.:::> ' [>( [>( [X l/ sr v~ ~~ f'.. 12 2.5 2.5 12 /
O,.e..
/- ~\ 18 ~ 6 [>( 2.5 [X 6 [>( 18 /~s 9~
b !".
~ ~ [>( [>( [>< r:i
' 24 10 4 4 10 24 v '\ " /
.> '\ 30 [>( 14.5 [>< 6.5 ~ 4 [X 6.5 [>( 14.5 [>( 30 IL
co "' / t:9
' 36 [>( 19.2 [>( 9.7 [>( 5.2 [>( 5.2 [>( 9.7 [X 19.2 [X 36 v ~ ' / .P
' 42 X 24 )( 13.2 X 7.2 >< 5.2 [X 7.2 X 13.2 [>( 24 C>< 42 v
,~ 1\. / ' 48 [>< 29 [X 17 X 9.7 L( 6.1 >< 6.1 [X 9.7 )( 17 [X 29 ~ 48
" / I 52 I [X 34.2 X 21.2 X 12.6 ~ 7.8 ~ 6.1 [X 7.8 X 12.6 [>( 21.2 )< 34.2 [X 52 I
I CHART VALUES ARE IN db BELOW INPUT LEVEL
/ /o
1i 0
u 0 ·e 0 c >. 0
a..

E p,~
± e ± ~-l e + 2 ~-l e + 1 e. ~ ~ ~
(4)
In the limit as~ ~oo, the maximum possible error is ±4e db, Lower values of
~yield successively less error. Actuall~, the absolute maximum
possible error is only ±3e db since the error in measuring the absolute response
level is considered in e~uation (3). The limiting case for e~uation (3) indi-
cates the maximum differences to be expected between measured and predicted
values.
Considering the maximum measurement error possible and the error
function for the ction scheme, outside errors of as much as 6.4 db may
be obtained. However, the likelihood of occurrence of the maximum possible
error is not very hi and the average error should lie considerably within
these outer bounds.
Fourteen sets of mixer data were collected to check the accuracy of the
prediction method. The tests were conducted different conditions of
local oscillator sensitivity level, and mixer output These
data are plotted as prediction error versus response density as shown in
20 through 33. The diode type and the conditions imposed during the
tests are noted on the individual figures. 34 shows the circuit used
to obtain the various response measurements through the tenth order of
generation.
It is noted that for large local oscillator levels and for conditions of
tuned diode output, the prediction error is displaced in the negative
direction by a considerable amount. The peak of the rough density integral,
~7-

15
14
13
12 DIODE: 1NB2A L.O. LEVEL: + 2 dbm SENSITIVITY: - 95 dbm
11 I.F. FREQUENCY: 1 Me TUNING: None
10 L.O. FREQUENCY: 10 Me
>-CROSSHATCHED: True Density 1-
9 v; DASHED: Density Integral z ,...,
w I I 0 I I w 8 I I V') r-' L1 z 0 0... 7 I I V') I I w I I a::
6 I I I I I
w I I OJ
5 I I I
4
3
2
PREDICTION ERROR IN db
Figure 20. Response Density Versus Prediction Error for a IN82A Diode Mixer.

15
14
13 DIODE: 1N82A
12 L.O. LEVEL: + 2 dbm SENSITIVITY: - 95 dbm I.F. FREQUENCY: 3 Me
11 TUNING: None L.O. FREQUENCY: 10 Me
10 CROSSHATCHED: True Density
>- 9 DASHED: Density Integral 1-in .-..rl z w
8 I I a I I w I I V) I I z 7 0 I I a.. I L1 V) I w 6 .-.J L, a:::
I L, I
I 5 I L-----, VJ r.J \.0 I I I
4 I L, I .-.J I
I 3 L1
I I
2
PREDICTION ERROR IN db
Figure 21. Response Density Versus Prediction Error for a lN82A Diode Mixer.

I -r::-0 I
15
14
13
12
11
10
~ 9 v; z ~ 8 w II)
z 0
7 a.. II)
w 6 0::
5
4
3
2
,.-"'1 : ... _, r-.J I I I
r-' I
! L-1 r-~ L-1 I I I I i L-,
'--, I I I
DIODE: L.O. LEVEL: SENSITIVITY: I.F. FREQUENCY: TUNING: L.O. FREQUENCY:
CROSSHATCHED: DASHED:
-., I '----,
I L-, L_,
I
1N82A + 9 dbm - 95 dbm 1 Me None 10 Me
True Density Density Integral
0~----~--._~--~~~~~~L-~~~~~~~~~~~~_._.~~---r----~----~._~~----~
-13 -12 -11 -10 -9 -8 -7 -6 -5 -4 -3 -2 -1 0 +2 REDUCTION ERROR IN db
Figure 22. Response Density Versus Prediction Error for a 1N82A Diode Mixer.

15
14
13
12
11
10
>- 9 1-;:;; z 8 UJ 0
UJ 7 !./')
z 0 a.. !./') 6 I UJ
-!=" a:: 1-l I 5
4
3
2
-17 -16 -15 -14 -13 -12 -11 -10 -9 -8 -7
PREDICTION ERROR IN db
DIODE: L.O. LEVEL: SENSITIVITY: I.F. FREQUENCY: TUNING: L.O. FREQUENCY:
CROSSHATCHED: DASHED:
-6 -5
1N82A + 2 dbm - 95 dbm 1 Me Output to 1 Me 10 Me
True Density Density Integral
-4 -3
Figure 23. Response Density Versus Prediction Error for a 1N82A Diode Mixer.
-2 -1

15
14
13
12
11
10
>-t- 9 v; z UJ 0 8 UJ V')
z 7 0
a. V')
UJ 0::: 6
I .f:"" 1\) I 5
4
3
2
-9 -8 -7
Figure
-6 -5 -4 -3
r-.... _ I I
I : r-' --1 I I I
I f I -~
I L--,
I I I .._.,.
I -, I I
-2 -1 0
-1 ._, I
+1
PREDICTION ERROR IN db
DIODE: 1N82A L.O. LEVEL: - 5 dbm SENSITIVITY: - 102 dbm I.F. FREQUENCY: 1 Me TUNING: None L.O. FREQUENCY: 10 Me
CROSSHATCHED: True Density DASHED: Density Integral
+2
Response Density Versus Prediction Error for a 1N82A Diode Mixer.
+7

15
14
13
12
11
10
>- 9 1-ii') z w
8 0
w II)
z 7 0 a.. II)
w 6 l ~
.f.:"'" w I 5
4
3
2
-8 -7 -6 -5 -4 -3 -2
DIODE: L.O. LEVEL: SENSITIVITY: l.F. FREQUENCY: TUNING: L.O. FREQUENCY:
CROSSHATCHED: DASHED:
,...., I I I L..., I I
~- I I L--1 I I I I I I
~~ ..... .., I L..,
-..J L.., I_J L---, I I
-1 0
PREDICTION ERROR IN db
L, I I
+4
1N82A -5 dbm - 102 dbm 3 Me None 10 Me
True Density Density Integral
+6
Figure 25. Response Density Versus Prediction Error for a 1N82A Diode Mixer.
+7 +8

15
14
13
12
11
10
>-1-
9 ;:;; z w 0
8 w ..,., z 0 7 a.. ..,., w 0::
6 I + + I 5
4
3
2
-9 -8 -7 -6 -5 -4
DIODE: L.O. LEVEL: SENSITIVITY: I.F. FREQUENCY: TUNING: L.O. FREQUENCY:
CROSSHATCH ED: DASHED:
-3 -2 -1 0 + 1
PREDICTION ERROR IN db
1N21B + 2 dbm - 95 dbm 1 Me None
10 Me
True Density
Density Integral
+4
Figure 26. Response Density Versus Prediction Error for a 1N21B Diode Mixer.
+6 +7

15
14
13
12
11
10
>- 9 1-v; z LU 8 a LU V')
7 z 0 S;
I LU 6 + 0::
V1 I
5
4
3
2
-8
DIODE: L.O. LEVEL: SENSITIVITY: l.F. FREQUENCY: TUNING: L.O. FREQUENCY:
CROSSHATCHED: DASHED:
1N21B + 2 dbm - 95 dbm 3 Me None
10 Me
True Density Density Integral
-2 -1
,..-... ,.._ .. : I I I '--.,
: I ,.-J '----., I I I '--, I I I I I I
,..-~ L-~ I I I I I I I I
r•J ~-~ I I I I I I I I
.---' '--, I I
r-" '--, I I I I ,.---""
I
0
PREDICTION ERROR IN db
Figure 27. Response Density Versus Prediction Error for a lN2lB Diode Mixer.
+8

15
14
13
12
11
10 >-I-v;
9 z w 0
w 8 (/)
z 0 Q_
7 (/)
w 0:::
6
I + 5 0\ I
4
3
2
-10 -9 -8
r r.J
r------J r.J I
-7 -6 -5
,., I -, I ._, I I
,-..J I I 1 I I I I I
r.J L, ,-.J L, I I I I
r----J L, I I I I I I I I
DIODE: 1N21B L.O. LEVEL: + 2 dbm SENSITIVITY: - 95 dbm I.F. FREQUENCY: 1Mc TUNING: Output to 1 Me L.O. FREQUENCY: 10 Me
CROSSHATCHED: DASHED:
True Density Density Integral
---,
-4 -3 -2 -1 0
PREDICTION ERROR IN db
L, L,
L--, '-----------
+1 +2 +4
28. Response Density Versus Prediction Error for a 1N21B Diode Mixer.
+5 +6

15
14
13
12
11
10 >-I-Vi 9 z w 0
w 8 V)
z 0 CL 7 V)
w 11':
I -f::"" 6 -...:] I
5
4
3
2
-6 -5 -4 -3 -2 -1
,..., I -, I I I I
r----' .... ., f I f I I I I .._,
r.J ; I .... ,
,...J I I I I ~~
,..~ L~ I I
~.J I __ ,.,
0
PREDICTION ERROR IN db
DIODE: L.O. LEVEL: SENSITIVITY: I.F. FREQUENCY: TUNING: L.O. FREQUENCY:
CROSSHATCHED: DASHED:
+5
1N21B -6 dbm - 95 dbm 1 Me: None 10 Me:
True Density Density Integral
+7 +8
Figure 29. Response Density Versus Prediction Error for a 1N21B Diode Mixer.
+10

15
14
13
12
11
10
>-t-
9 v; z w Cl
8 w V')
z 0 7 a.. V')
w a::
I 6 + (X) I
5
4
3
2
-8 -7 -6 -5 -4 -3
r--. r-J I I I I I
r .. J I l..-,
I I I Li
I I
DIODE: L.O. LEVEL: SENSITIVITY: I.F. FREQUENCY: TUNING: L.O. FREQUENCY:
CROSSHATCH ED: DASHED:
1N21B -9 dbm - 95 dbm 1 Me None 10 Me
True Density
Density Integral
NOTE: Many Responses are not Measurable Under these Conditions.
r--' I
L-- --1
I r~J I I
'
I
' I I
-2 -1 0 + 1 +2
PREDICTION ERROR IN db
+3 +4 +5
30. Response Density Versus Prediction Error for a 1N21B Diode Mixer.
+7 +8

15
14
13
12
11
10
>- 9 1-v; z w
8 0
w II)
z 7 0 I ll..
II)
+ w 6 \0 0::
I
5
4
3
2
-9 -8 -7 -6 -5 -4
r, I
r-' ,......J
I I
r.J • I I I I
r-' I I I I
1 I I I I I -----. L,
L, L--,
DIODE: LO. LEVEL: SENSITIVITY: I.F. FREQUENCY: TUNING: LO .• FREQUENCY:
CROSSHATCH ED: DASHED:
1N23C + 2 dbm -95 dbm 1 Me None
10 Me
True Density
Density Integral
L-------,
-3 -2 -1 0 +1
PREDICTION ERROR IN db
+2
L-----, I
+3 +5
Response Density Versus Prediction Error for a 1N23C Diode Mixer.
+6 +7

15
14
13
12
11
10
>-1-v; 9 z w 0
w 8 V')
z 0 7 c..
I V')
\.Jl w 0 0:::
I 6
5
4
3
2
-8 -7 -6 -5
Figure
r-i : I
r--~ ... _, I t I I I t I t I .__-:
I I I t I I ,..... .
I I
: L., I I
r-~ 1 I I ,._ ..
I ,._,., I I • I r-----"'
I
r-"' I
r-"' I
r-" I
-4 -3 -2 -1 0 +1 PREDICTION ERROR IN db
DIODE: L.O. LEVEL: SENSITIVITY: I.F. FREQUENCY: TUNING: L.O. FREQUENCY:
CROSSHATCHED: DASHED:
+2 +4
1N23C + 2 dbm - 95 dbm 3 Me None
10 Me
True Density Density Integral
Response Density Versus Prediction Error for a lN23C Diode Mixer.
+7 +8

-14 -13 -12 -11 -10 -9 -8 -7 -6 -5 -4 -3 -2 -1 0 +1 +2 PREDICTION ERROR IN db
Figure 33· Density Versus Prediction Error for a lN23C Diode Mixer.

I \Jl [\) I
BNC NO.2 INPUT TEST OUT
·-------, I ~n I
- I VARIABLE I
BIAS I SOURCE I
I I I L _______ J
Figure 34.
1N82A
Schematic Diagram of 1N82A Test Mixer.
BNC NO.4
TEST OUT
BNC NO.5
TEST OUT

indicated by the dashed encirclement, lies in the center of the distribution
and indicates the distribution mean. The position of the mean with respect
to the overall distribution is similar fdr all tests made. This would indicate
that the calculation procedure is satisfactory in all the test cases. The
displacement of the mean indicates an error in the value of local oscillator
to signal power ratio.
The latter fact is verified by utili many measured responses to cal-
culate an average power ratio. This average power ratio is used in the pre
diction calculation instead of the power ratio determined by the (2, 1) and
(1, 2) responseso The result is the return of the distribution mean to the
vicinity of the 0 db error position. Figure 35 shows the response density
versus prediction error chart for the same data used to abtain the chart of
Figure 22 that an average power ratio was utilized.
Since the power ratio of local oscillator to input signal is normally
determined using the (2, 1) and (1, 2) responses, an error in either response
measurement could cause the distribution mean to shift. Errors in these meas-
urements appear to be the chief cause for the errors in prediction which
are associated with a shift in the distribution mean.
A consideration for the cause of measurement errors in the ( 1) and
( 2) responses is the fact that both of these responses lie near or in
response nulls for the normal bia conditions of the diodeo7 Small
changes in local oscillator absolute level may result in response level
variations since the slopes of response curves are very steep near response
nulls and the bias point is chiefly determined by the local oscillator level.
Figure 36 shows the curve of the (2, l) response level versus diode bias
where a sharp null is seen to exist near the point of zero bias.

15
14
13
12
11
10
>- 9 1-Vi z
8 w 0
w 1,/) 7 z
I 0 Vl 0... + 1,/)
I w 6 ~
5
4
3
2
-8 -4
r-"' I I I 1..-, I I I I
r-.J I I I I L---, I I
r-~ L-, I I
r-~ 1 I : L.,
,...J L-, I I
r-J L., I '
DIODE:
L.O. LEVEL: SENSITIVITY: I.F. FREQUENCY: TUNING: L.O. FREQUENCY:
CROSSHATCH ED: DASHED:
L--,
+1
PREDICTION ERROR IN db
'--; ' 1..-~
I '----, I ._ __ _
+4
1N82A + 9 dbm - 95 dbm 1 Me None
10 Me
True Density Density Integral
Figure 35. Response Density Versus Prediction Error Using Averaged Power Ratio.

I \Jl \Jl I
-D -o
_J w > w _J
~ z 0 1J:; w 0::
w 2: t-<{ _J w 0::
! 10 db
• • •
1N21B
1N23C
1N82A
• •
0
0
0
0
-0.6
-0.6
-0.5
-0.5
Figure 36.
BIAS VOLTAGE
(2, 1) Response Level Versus Bias Voltage for Single Diode Mixer with no Frequency Discrimination.
L.O.: lO Me, ' 13 dbm
-- 1N21B DIODE MIXER
0 1N23C DIODE MIXER
• 1N82A DIODE MIXER
p ·- 2, q 1
0

The averaged local oscillator to signal power ratio offers the most
accurate solution but suffers because of the large data sample necessary to
resolve the average. Examination of the data has indicated that the value of
local oscillator to input si power ratio obtained from the (3, 1) and (1, 3)
responses follows the average power ratio, It is reasonable that such is
h th . t h 11 1 t th b . . t 8 Th t e case since lS response se , as no nu s c ose o e zero las poln . e
use of these two response levels rather than the (2, l) and (1, 2) response levels
may yield better prediction values when the diode is operated near the zero bias
condition.
5. Analysis of the Effective Mixer Constants
The large errors in determining the average power ratio may not be
entirely due to measurement error. The problem may lie in the inherent error
of the computation method used to predict response levels The entire system
is based on the fact that members of a common order follow very similar curves
when their levels are plotted versus changes in diode bias. 9 The relative
It is assumed that each member of a order of generation has as a factor
the same identical constant as all other members of the order and that this
constant is a function of both the order and the diode bias. The constant is
not necessarily the same as that of the like ordered term of the mixer polynomial.
An example of this is ea
10 response:
k + (15 e 2 eb 3 8 a
constructed using the coefficient of the (2, 1)
4 ) +
-56-
( e a 4 3

2 5 . 105 + eb + 64 ea
+ 945 e 6 3 315 + 64 64 a
6 eb) 2 e 7 + 63
b 32
+
e a
8
4 e 5 b
(5)
In the prediction scheme, only the first term of the coefficient is considered. 11 , 12
The sample response measurement determines a value for the constant, k3
, and this
value is assumed to be the same as that in the (1, 2) response coefficient~
3 2 ( e 3 2 +2 eb4) k5 + ( 105 3 4 '4 eb k3 + a eb 4 16 eb
105 5 2 105 eb6) ( 315 5 4 + 32 eb + 64 + 16 eb
945 3 6 + 315 e 7 2 63 ebB ) (6) + 64 ea 64 a eb + 32 +
of which again only the first term is considered.
In reality, the constant determiped by the sample response measurement is
not a constant, but that sum of terms which remains after the response
coefficient by its first term ...._ .... ~.-.... ..LJ.Jf'> k . Thus the constants, K , determined n n
by the sample response measurements of the
and (1, 2) responses:
K I
3
k + 3 (
2e2 3 a
+ (lO, 2
(2e2 2 a
+ ( 4
+ 2 e 2) 2 b
+ e a
5 2 ) + 3 eb
+ e a
+
4 +
+
2
-57-
ction scheme are, for the ( l)
( 35 e 2 e 2 + 35 e 4 + 35 e 4) k 4 a b 16 a 8 b 7
e a
( 3~
6 + +
+
+ (8)

The differences in the value of K3
and the value of K3
' are manifested in the
constants of corresponding terms since the same type and number of terms appear
in both. The differences are ordinarily slight but increase readily with larger
signal levels.
The sl difference in the constants, K , is evidenced in the shi n
of the response or harmonic generation nulls for a common generating order.
Figures 37 through 39 show curves of common generation orders taken on a lN2lB
diode with a +2 dbm local oscillator level at the diode. It is noted that the
of these curves are somewhat but that the nulls consistently
shift to the with increa q. The shapesof the harmonic and the q = l
response curves are often so similar that the differences might be attributed
to measurement error. The plots of q responses, however, indicate a
definite trend of shift with increasing q. The effective mixer con-
stant is therefore only a semiconstant and not identical for all members of a
common order. With the exception of operation in close proximity to
however, the assumption is valid and good results are obtainable.
6.
Mixer response prediction errors may be the result of several factors
in conjunction or any single factor alone. Measurement accuracies are greatly
affected by equipment limitations and the response prediction system is sensi-
tive to measurement error. The assumptions upon which the prediction system is
based are imperfect to a which may be sufficient to produce rather
errors under certain conditions of mixer operation. Sli alterations of the
ction procedure appear to greatly reduce the prediction errors.
-58-

.....J
~ 50 w .....J
w > ~ 40 .....J w 0::
30
'::l-
+"+I+
' 1+-+
I+ .
Figure 37.
'' u ~"-r+-
++~-'+':r
FORWARD BIAS VOLTS
Relative Response Level Versus Forward Diode Bias for Third Order Responses of the 1N21B Diode Mixer.
-59-

z 60 ~
~ w > w ~
50 w ~ ~ ~ ~ w ~ 40
0.0 0.1 0.2 0.3
FORWARD BIAS VOLTS 0.4
38. Relative Response Level Versus Forward Diode Bias for Fourth Order Responses of the 1N21B Diode Mixer.
-60-

80
Ld 50 > UJ _J
UJ > ~ 40
g ·······-30
20
10
0.0 0.1 0.2 0.3 0.4 0.5 0.6
FORWARD BIAS VOLTS
Figure 39. Relative Response Level Versus Forward Diode Bias for Fifth Order Responses of the 1N21B Diode Mixer.
-61-
0.7

Further analysis is necessary to determine which of the several factors
is the predominant cause for prediction error. Subsequent quarters will be
devoted to such analysis and to the gathering of data for other mixer types.
-62-

V. CONCLUSIONS
The observed performance of the FM receiver in the presence of two common-
channel transmitted si was in general agreement with published observations
and theory. Corrington reported simultaneous reception of two FM radio stations,
which operated on the same frequency, when their carrier wave voltage levels
dropped below the level at which the limiter in the receiver operated. This
effect was observed in the present system when the transmitter frequencies were
tuned too far from the receiver tuned frequency to permit complete limiting at
the available power levels.
The multipath study made on the PPM/FM communications system indicated
that for every relative power condition at two direct path signal levels, it
is possible to adjust the relative phase so that greater than 90 per cent
predicted intelligibility can be achieved on isolated monosyllabic words trans-
mitted. In addition, the range of phase for which such noise free
transmission is possible is wide compared with the range of phase angles at
which degradation of intelligibility takes place. It is concluded that 0.25 ~sec
is not a sufficient delay to cause significant degradation of intelligibility
for the PPM/FM communications system which was investigated.
The prediction of mixer response levels suffers from errors due to measure
ment inaccuracies and to inherently imperfect assumptions in the prediction
calculations. These errors may be reduced by substituting certain responses
for those normally used to obtain the local oscillator to input signal power
ratio. Reliable prediction is obtainable for ordinary mixer operation.
-63-

VI . PROGRAM FOR NEXT INTERVAL
Additional interference susceptibility studies will be conducted on avail
able communications sets.
The effects of several delays between 0.25 and 1.25 ~sec on multipath
interference conditions will be studied the PPM/FM communications system
described in this report. The results of this investigation will be evaluated
with respect to the time division multiplexer specifications to determine if
diagnostic techniques can be applied to predict desired signal degradation at
specific delays.
Further analysis will be made to determine which of the several factors
is the predominant cause for prediction errors of mixer data. The
of data for different mixer configurations will continue.
An RFI bibliography) with abstracts) should be completed during the next
interval.
-64-

VII. IDENTIFICATION OF KEY TECHNICAL PERSONNEL
Title Approximate Hours
R. M. Cook Grad. Research Assistant 81
H. w. Denny Research Assistant 14
E. E. Donaldson, Jr. Grad. Research Assistant 343
0. H, Ogburn Research Assistant 516
D. w Robertson Head, Communications Branch 61
c. w. Stuckey Asst. Research Engineer 499
H. D. Trammell, Jr. Asst. Project Director 513
J. R. Walsh, Jr. Research Engineer 69
Wo B. Warren, Jr. Research Engineer 41
E. W, Wood Project Director 371
Mr. Cook accepted a position with the Federal Communications Commission
on 3 June 1963.
Approved:
~. /J, {Gtdl;co D. W. Robertson, Head Communications Branch
-65-
Respectfully submitted:
E. W. Wood Project Director
lib-sascan
Rectangle
lib-sascan
Rectangle

VIII. REFERENCES
l. Murlan S. Corrington, "Frequency Modulation Distortion Caused by Connnonand Adjacent-Channel Interference,'' RCA Review, Vol. 7, pp. 522-545, ( 1946).
2, L, B. Arguimbau and J. Granlund, ''The Possibility of Transatlantic Connnunication by Means of Frequency Modulation, t1 Proceedings NEC, Chicago, pp. 644-653, (November 1947).
3 L. B. Arguimbau and J. Granlund, "Sky-Wave F-M Receiver, 11 Electronics, pp. lOl-103, (December 1949).
4~ Harold A. Wheeler, "Connnon-Channel Interference Between Two FrequencyModulated Signals, f! Proceedings IRE, pp. 34-50, (January 1942).
5 Elie J. Ba ghdady, !!The FM Random-Noise Threshold, '' Frequency, pp. 12-17, (March-April 1963).
6. Eo W, Wood, R. D. Trammell, Jr., C. W. Stuckey, H. W. Denny, E. E. Donaldson, Jr., and R. M. Cook, t!Quarterly Report No. l, Project A-678, 11 Electronic ~quipment Interference Characteristics-Communication pe, Contract No. DA 3 -039 AMC-0229 E , Georgia Institute of Technology, Engineering Experiment Station, pp. 91-95, (15 February 1963 to 15 May 1963)
7" R. N. Bai R. D. Trammell, Jr., J. R. Walsh, Jr., and E. W. Wood,
8.
9o
10,
ll.
12"
°Final Technical Report, Project A-543, 11 Electronic Equipment Interference ,Characteristics-Communication Type, Contract No. DA 36-039 sc-87183, Georgia Institute of Technology, Engineering Experiment Station, pp.77-78,
February 1963).
Wood, op. cit. , p. 78.
Bailey, op. cit., pp. 63-83.
Bailey, op. cit., p. 129.
Bailey, op. cit., pp. 80-89.
Wood, op. cit., pp. 81-102.
-66-

No. of
1
1
1
3
10
1
1
1
2
1
1
1
1
1
1
DISTRIBUTION LIST
To
OASD (R&E) Rm ' Pentagon, Washington ATTN: Technical Library, The
, D. C.
Chief of Research & Development, OCS1 Department of the Army, Washington , D. C.
Commanding U. S. Army MBteriel Command, ATTN: R&D,Directorate, Washington 25, D. C.
Commanding General, U. S. Army Electronics Command, ATTN: AMSEL-AD, Fort Monmouth, New
Commander, Defense Documentation Center, ATTN: TISIA, Cameron Station, . 5, Alexandria,
Commanding General, USA Combat Developments Command, ATTN: CDCMR-E, Fort Belvoir, Virginia
Commanding Officer, USA Communication and Electronics Combat Agency, Fort Huachuca, Arizona
Commanding U. S. Army Electronics Research and Development Activity, ATTN: Technical Library, Fort Huachuca, Arizona
Chief, U. S. Army Agency, Arlington Hall Station, Arlington Virginia
Deputy President, U. S. Army Security Agency Board, Arlington Hall Station, Arlington 12,
Director, U. S. Naval Research Laboratory, ATTN: Code , Washington, D. C. 20390
Commanding Officer and Director, U. S. Navy Electronics laboratory, San Diego 52, California
Aeronautical Division, ATTN: ASAPRL, Wright-Patterson Air Force Base, Ohio
Air Force Research Laboratories, ATTN: CRZC, . G. Hanscom Field, Mass.
Air Force Cambridge Research Laboratories, ATTN: CRXL-R, L. G. Hanscom Field, Bedford, Mass.

No. of
1
1
1
1
1
1
1
1
1
1
1
1
1
DISTRIBUTION LIST
To
Hq. Electronic Systems Division, ATTN: ESAT, L. G. Hanscom Field, Bedford, Mass.
Rome Air Development Center, ATTN: RAALD, Griffiss Air Force Base, New York
AFSC Scientific/Technical Liaison Office, U. S. Naval Air Development Center, Johnsville,
Commanding Officer, U. S. Army Electronics Materiel Support Agency, ATTN: SELMS-ADJ, Fort Monmouth, New
Director, Fort Monmouth Office, USA Communication and Electronics Combat Development Agency, Fort Monmouth, New
Corps of Research
Liaison Office, U. S. Army Electronics Laboratories, Fort Monmouth, New
Marine Corps Liaison Office, U. S. Army Electronics Research and Development Laboratories, Fort Monmouth, New
Commanding Officer, U. S. Army Electronics Research and Development Laboratories~ ATTN: Director of Fort Monmouth, New
Commanding Officer, U. S. Army Electronics Research and Development Laboratories, ATTN: Tech Documents Center, Fort Monmouth, New
Commanding Officer, U. S. Army Electronics Research and Development Laboratories, ATTN: SELRA/GF, Fort Monmouth, New Jersey
Commanding Officer, U. S. Army Electronics Research and Development Laboratories, ATTN: SELRA/GFA, Fort Monmouth, New Jersey
Commanding Officer, U. S. Army Electronics Research and Development Laboratories, ATTN: SELRA/NRL, Fort Monmouth, New
Commanding Officer, U. S. Army Electronics Research and Development Laboratories, ATTN: SELRA/GFR, Fort Monmouth, New Jersey

No. of Copies
1
1
1
1
1
1
1
1
1
10
1
DISTRIBUTION LIST
To
Commander, Rome Air Development Center, Griffiss Air Force Base, New York, ATTN: RAUMA (C. R. Miller)
CommEnding Officer, U. S. Army Electronics Research and Development Activity, ATTN: Sig Corum Department, Tech Division, Fort Huachuca, Arizona
Chief, Bureau of Ships, Department of the Navy, Washington 25, D. C. ATTN: 8lld(E. G. Nucci)
Chief, Bureau of Ships, Department of the Navy, Washington , D. C. ATTN: Code 452 (Mr. Roman)
Chief, Bureau of Aeronautics, Department of the Navy, Washington 25, D. C.
Chief, U. S. Army Signal Radio Propagation Agency, Bldg. 2525, Fort Monmouth, New Jersey
Commanding Officer, U. S. Army Electronics Research and Development Activity, ATTN: FC-05, White Sands, New Nexico
Director, Electromagnetic Compatibility Analysis Center, ATTN: ACX (Lt. Col. John A. Gahr), U. S. Navy Marine Engineering Laboratory, Annapolis, Maryland 21402
Commanding General, Hq. U. S. Army Materiel Command, ATTN: AMCRD-RS-PE, Washington 25, D. C.
Commanding Officer, U. S. Army Electronics Research and Development Laboratories, ATTN: Logistics Division, (MARKED FOR SELRA/GFE), Fort Monmouth, New Jersey
AFSC Scientific/Technical Liaison Office, U. S. Army Electronics Research and Development Laboratories, Fort Monmouth, New Jersey

REPORT NO. 24
QUARTERLY REPORT NO. 3
PROJECT A-678
ELECTRONIC EQUIPMENT INTERFERENCE CHARACTERISTICS-COMMUNICATION TYPE
By C. W. Stuckey, E. W. Wood, R. D. Trammell, Jr., E. E. Donaldson, Jr., and 0. H. Ogburn
CONTRACT NO. DA 36-039 AMC-02294(E) (Continuation of Contract No. DA 36-039 sc-87183) DEPARTMENT OF THE ARMY PROJECT: 3B24-0l-001
Placed by the U. S. Army Electronics Research and Development Laboratory Fort Monmouth, New Jersey
15 August 1963 to 15 November 1963
Engineering Experiment Station
GEORGIA INSTITUTE OF TECHNOLOGY Atlanta, Georgia

ENGINEERING EXPERIMENT STATION of the Georgia Institute of Technology
Atlanta, Georgia
REPORT NO. 24
QUARTERLY REPORT NO. 3
PROJECT A-678
ELECTRONIC EQUIPMENT INTERFERENCE CHARACTERISTICS-COMMUNICATION TYPE
By
C. W. Stuckey, E. W. Wood R. D. Trammell, Jr., E. E. Donaldson, Jr.,
and 0. H. Ogburn
CONTRACT NO. DA 36-039 AMC-02294(E) (Continuation of Contract No. DA 36-039 sc-87183)
DEPARTMENT OF THE ARMY PROJECT: 3B24-0l-00l
The object of this research program is to conduct a comprehensive investigation to determine methods for measuring the interference characteristics (spectrum signature) of U. S. Army communications equipment deemed necessary for the prediction and minimizing of electromagnetic interference.
AUGUST 1963 to 15 NOVEMBER 1963
PLACED BY THE U. S. ARMY ELECTRONICS RESEARCH AND DEVELOPMENT LABORATORY
FORT MONMOUTH, NEW JERSEY

FOREWORD
This report was prepared at the Georgia Tech Engineering Experiment Sta-
tion on Contract No. DA 36-039 AMC-02294(E). The report covers the activity
and results of the third quarter's effort on a project to conduct a feasibil-
ity study and investigation to determine methods for measuring the interfer-
ence characteristics (spectrum signature) of U. S. Army pulse modulated
type communications equipment deemed necessary for the prediction and minimiz-
ing of electromagnetic interference.
D. W. Robertson, Head Communications Branch
ii
Respectfully submitted:
E. W. Wood Project Director
lib-sascan
Rectangle
lib-sascan
Rectangle

TABLE OF CONTENTS
I. PURPOSE
II. ABSTRACT . .
III. PUBLICATIONS, LECTURES, REPORTS, AND CONFERENCES
IV. FACTUAL DATA .
A. The Effect of Multipath Interference on the Intelligibility of Speech Transmitted Over an FM System Employing Time Division Multiplexing
l. Test Procedure . 2. Data Evaluation
3· Test Results . . 4. Discussion . . 5· Conclusions
B. Mixer Testing and Evaluation
1. Introduction ....
2. Prediction and Mixer Operating Conditions
3. Prediction and Mixer Driving Circuitry .
4. Prediction and Mixer Design
5· Considerations for Receiver Design .
6. Conclusions
C. A Method for Determining Response Coefficients .
1. Introduction .....
2. Development of Method
3. Procedure
4. Conclusions
(Continued)
iii
Page
l
2
3
4
4
4
7
10
19
23
24
24
24
29
31
33
34
34
34
34
39
42

TABLE OF CONTENTS (Concluded)
V. CONCLUSIONS
VI. PROGRAM FOR NEXT INTERVAL
VII. IDENTIFICATION OF TECHNICAL PERSONNEL
VIII. REFERENCES . . . • . • • . . . . . . .
This report contains 48 pages. iv
Page
44
45
46
47

1.
LIST OF FIGl.JRES
Block Diagram of Test Configuration Used For Multipath Interference Tests . . . . . •
2. Predicted Intelligibility of Isolated Monosyllables as a Function of S/N Ratio at the System Audio Output
3. General Electronic Laboratories Scoring Curve
4. PCI as a Function of S/N Ratio at the System Audio Output
5. Predicted Intelligibility as a Function of Direct to Delay Power Level Ratio For a Relative Delay of 0.2 ~sec
6. Predicted Intelligibility as a Function of Direct to Delay Power Level Ratio For a Relative Delay of 0.4 ~sec
7. Predicted Intelligibility as a Function of Direct to Delay Power Level Ratio For a Relative Delay of 0.6 ~sec
8. Predicted Intelligibility as a Function of Direct to Delay Power Level Ratio For a Relative Delay of 0.8 ~sec
9. Predicted Intelligibility as a Function of Direct to Delay Power Level Ratio For a Relative Delay of 1.0 ~sec
10. Predicted Intelligibility as a Function of Direct to Delay Power Level Ratio For a Relative Delay of 1.2 ~sec
11. Predicted Intelligibility as a Function of Direct to Delay Power Level Ratio For a Relative Delay of 1.4 ~sec
12. Predicted Intelligibility as a Function of Relative Delay Time For Five Quieting Levels . • . .
13. Photographs of Demultiplexer Pulse Trains
14.
15.
16.
17.
Response Density Versus Prediction Error For a 1N82A Diode Mixer With +0.1 Volt Bias . • • ••.••••
Response Density Versus Prediction Error For a 1N82A Diode Mixer With -0.1 Volt Bias . . . • . .•.
Response Density Versus Prediction Error For a 1N82A Diode Mixer With +0.2 Volt Bias . . . . • ..•..
Response Density Versus Prediction Error For a 1N82A Diode Mixer With +0. 2 rna Bias • . • . • • . . . • . .
(Continued)
v
Page
5
5
8
8
11
12
13
14
15
16
17
20
21
26
26
27
27

18.
LIST OF FIGURES (Concluded)
Response Density Versus Prediction Error For a lN82A Diode Mixer With Tuned Output • . . . . . • • • . .
19. Response Density Versus Prediction Error For a lN82A Diode Mixer With Unfiltered Input Signal •••...
20. Schematic Diagram of Double-Diode Mixer Test Circuit
21.
22.
Response Density Versus Prediction Error For Two Cascaded lN82A Diodes . • • . • . . . . .
Change in Spurious Response Rejection With a Change in IF Sensitivity .......•
23. Triangle of Constant Coefficients
24. Responses Generated from the Power Series Representation of a Mixer Characteristic When the Input is Two Summed Sinusoids
25. Table of Binomial Coefficients ..
26. Response Coefficient in Triangular Form
27.
28.
Numerical Coefficients (k. 1 s) of the Terms in the (2, l) Response Coefficient . . ~ • • • • • • • . • .
Triangle for the (3, 2) Response Formed from the Table of Binomial Coefficients . • . • . • . . . • • .
vi
Page
28
28
30
30
32
35
36
38
40
41

I. PURPOSE
The purpose of this project is to conduct a feasibility study and investi
gation to determine methods for measuring the interference characteristics
(spectrum signature) of U. S. Army communications equipment deemed necessary
for the prediction and minimizing of electromagnetic interference. Emphasis
shall be placed on pulse modulated type communications equipments operating
in the 1-10 kMc frequency range. Measurement techniques for obtaining the
required data and a format for a directory of these data shall be developed.
Computer methods shall be developed for processing these data to obtain
outputs useful in determining optimum characteristics for communications
equipments operating in prescribed interference environments.
The areas of investigation on this project are divided into two tasks
as follows:
I. The development of tests and procedures for the evaluation of the
interference susceptibility and emanation characteristics of pulse modulated
type communications equipments.
II. The use of computer techniques for processing measured interference
data to produce outputs useful in interference prediction and control applica
tions.
1

II. ABSTRACT
The effects of multipath interference on the intelligibility of speech
transmitted over an FM system employing time division multiplexing are reportedo
Predicted intelligibility measurements based on audio output ratios indi-
cate that significant degradation in intelligibility will exist for the FM/TDM
system tested when multipath signals of strength are received over paths
which differ in length by as little as 0.15 mile (0.8 ~sec delay). The prob-
ability of significant multipath interference in FM systems which use TDM
is expected to be greater than that for ordinary wide-band FM systems.
The accuracy of mixer spurious response level prediction is demonstrated
for variations in mixer operating and drive conditions. Utilization of the
prediction techni~ue in the design of mixers is discussed. Several signif-
icant facts concerning the design of radio receiving e~uipments as illuminated
by the mixer studies are presented for future guidance.
A simplified method of obtaining the series describing a given response
amplitude using only the Pascal triangle of binomial coefficients is presentedo
Any single term or the entire series coefficient for any response of a mixer
th represented by an n degree polynomial may be readily obtained.
2

III. PUBLICATIONS, LECTURES, REPORTS,AND CONFERENCES
Mr. J. F. Chappell and Mr. N. R. Castellini from USAELRDL, Fort Monmouth,
New Jersey, visited Georgia Tech on 15-16 August 1963. The results of current
mixer studies were discussed.
Mr. R. D. Trammell, Jr., visited USAELRDL, Fort Monmouth, New Jersey,
on 28 August 1963. A meeting with USAELRDL and industrial personnel was held
for the purpose of discussing mixer and spurious response theories.
Mr. R. D. Trammell, Jr., and Mr. E. W. Wood attended the Ninth TRI-SERVICE
Conference on Electromagnetic Compatibility held in Chicago, Illinois, on 15-17
October 1963. Mr. Trammell presented a paper on uThe Behavior of Nonlinear
Mixing.u
Mr. E. W. Wood visited the Electromagnetic Analysis Center, Annapolis,
Maryland, on 3-4 October 1963. Mr. Wood attended a meeting on spectrum
signatures and visited the technical information facilities at the Center.
3

IV. FACTUAL DATA
A. The Effect of Multipath Interference on the Intelligibility of Speech Transmitted Over an FM System Employing Time Division Multiplexing
Multipath interference occurs in wide-band FM systems when two or more
signals of approximately equal strength arrive from the same transmitter over
paths which differ greatly in length. 1- 5 In contrast, the specifications of
FM systems which employ T.DM suggest that such systems may be subject to multi-
path interference when the path lengths differ by less than one mile. Since
equal power levels are more probable at reduced path length differences, the
incidence of multipath interference might be expected to be greater for FM
systems which use TDM.
1. 'I'est Procedure
Two path interference tests were made on a typical FM system which
employs TDM. The PPM multiplexer video specifications for this system are as
follows:
Sampling Time: 125 ~sec
Channel Pulse Separation: 5.2 ~sec
Sampling or GatiEg Sig~al: Two pulses separated by 1.25 ~sec
Pulse Width: 0.6 ~sec
Figure 1 is a block diagram of the test configuration used for data
collection. Tne variable parameters of the experiment were (1) delay time
between paths or path length difference, (2) the absolute power level or
receiver quieting, (3) relative power level between the two paths, and (4)
the relative RF phase angle between the two paths.
4

t=:' 80
z w u 0:: w ~
>- 60 t: ..J co § ..J ..J w 1- 40 ~
0 w 1-u 5 w 0:: Q_ 20
SYNC-MASTER GATE OUTPUT
1.
SCREEN ROOM r ------------------, I I I I 1
I I I I I I I I I I I L---- --------------..J
OSCILLO· SCOPE
DELAY PATH (CABLE)
FIXED
ATTENUATION
Block Diagram of Test Configuration Used for Multipath Interference Tests.
S/N RATIO (db)
2. Predicted Intelligibility of Isolated Monosyllables as a Function of S/N Ratio at the System Audio Output.
5

Three lengths of RG-17A cable were cut to correspond to relative delay
times of 0.2, 0.4, and 0.8 ~sec, respectively, when connected between the
transmitter and adjustable line. Relative delays of from 0.2 to 1.4 ~sec
could be achieved in 0.2 ~sec intervals by interconnecting the three cable
lengths appropriately.
Receiver quieting was made continuously variable by using an adjustable
attenuator in the delay path. The total attenuation along the delay path
consisted of the delay path adjustable attenuator insertion loss (33 ± 2 db),
the adjustable attenuation, the delay path cable loss (0.07 db/ft. at the
transmitter tuned frequency), and the dela~ path fixed attenuation. Receiver
quieting was measured using an unmodulated signal; for making this measure
ment on the delay path signal, 120 db of attenuation was used in the direct
path adjustable attenuator. The delay path adjustable attenuator was set
to give the desired receiver quieting. Data were taken at each of the relative
delays at 20, 25, 30, 35, and 40 db of receiver quieting. To achieve high
quieting levels at the longer delays, it was necessary to remove the delay
path adjustable attenuator and set the receiver quieting with selected fixed
attenuators. Fine adjustments were made under these conditions by slightly
altering the transmitter power output level.
The relative power levels between the two paths were controlled with the
direct path adjustable attenuator. After the receiver quieting level had
been established for the delay path signal, the delay path cable was temporarily
disconnected at the adjustable line and replaced by a 50 ohm termination.
Equal direct to delay path power levels were achieved by setting the direct
path adjustable attenuator to give equal receiver quieting. After the direct
path cable was reconnected, the relative power levels were made positive or
6

negative by decreasing or increasing the attenuation of the direct path
adjustable attenuator. All relative power readings were made on the latter
attenuator with respect to the reading for equal power. At each of the delay
time-quieting level combinations, the relative power level was adjusted in
0.5 db steps over a range centered about 0 db which included receiver capture
of the direct and delayed path signals as end point limits.
The relative phase angle between the direct and delay path RF signals
was controlled by varying the adjustable line. The wavelength of the trans
mitter tuned frequency is 5.3 inches and the adjustable line could be varied
over an 8.5 inch interval; thus, it was possible to change the relative phase
angle by more than 360~ For each delay time-quieting level-relative power
level combination, the relative phase angle was adjusted to give both the
maximum possible interference and the minimum possible interference.
2. Data Evaluation
The measure chosen to reflect the extent to which interference is
produced at the audio output of the communications system by the presence of
the multipath signal was the predicted intelligibility of transmitted isolated
monosyllabic words. Figure 2 shows the predicted intelligibility or predicted
average articulation score that would be obtained by a trained listening team
using a test vocabulary of 1000 Harvard Phonetically Balanced (PB) words6
as a function of system output S/N ratio.
The relationship of Figure 2 was derived from two calibration curves
which permit approximate articulation scores to be predicted for certain linear
interference conditions. The first of these curves is the General Electronic
Laboratories scoring curve shown in Figure 3, which relates the composite
7

t=: 80 z UJ u 0:: w e:. >- 60 1-:J iii Q ..J ..J w 1- 40 = 0 UJ 1-u a UJ 0:: 0.. 20
PCI
Figure 3. General Electronic Laboratories Scoring Curve.
u 0..
S/N RATIO (db)
Figure 4. PCI as a Function of S/N Ratio at the System Audio Output.
8

listener test results from five independent articulation studies7-11 to Pat-
tern Correspondence Index (PCI) for a speech system to which random noise
was added. The PCI measure of intelligibility is obtained as the output
from the General Electro~ic Laboratories Speech System Test Set, an electro-
mechanical test apparatus which measures the degradation in understandability
of a speech sample that passes through a noisy intelligence channel. Details
of the theory of the test set and PCI measure of intelligibility can be
found in reference 12. An extensive investigation and evaluation of the
test set verified that the PCI measure of intelligibility is valid for random
noise and a limited number of other linear interference conditions. 13
tl'ests on the FM system shown in Figure 1 showed that noise generated
in the receiver discriminator produced random gating by the demulti-
14 plexer gate. This resulted in noise with a positive and/or negative tilted
spectrum at the demultiplexer audio output. Since these noise types are
examples of the limited interference conditions for which the test set can
be used to provide a synthesized listener score, the test set was used to
evaluate the performance of the FM system in the presence of CW interference.
A study revealed that PCI is a linear function of S/N ratio measured at the
demultiplexer audio output. This relationship is shown in Figure 4 and is the
second curve from which Figure 2 was derived. The curve of Figure l~ was used
to predict PCI measurements from S/N ratio measurements for a nurr.Lber of CW
interference conditions. Extremely close agreement was found between the
predicted PCI and the corresponding PCI measured with the test set. Details
of these tests and test results can be found in reference 14.
While no evidence yet exists to validate the general application of a
predicted intelligibility-S/N ratio relationship for every system using T.DM,
the experimental results reported above give creditability to the use of the
9

curve of Figure 2 in evaluating the performance of the particular FM system
used in these multipath interference tests. At each delay time-quieting level
rela.ti ve pow~er level-relative phase angle combination tested, the S/N ratio a.t
the audio output of a. channel of the multiplexer set was determined as outlined
in equation (l) of reference 14. Briefly, this consisted of the following
measurements. The audio input (Figure l) was adjusted to give the maximum
vol ta.ge a.t w~hich the peak amplitude excursions of the speech waveform w·ere
not clipped by the multiplexer. The gain of the external amplifier system
was set for a convenient listening level. The peak rms speech voltage
ratio at the rms voltmeter was determined in db with respect to a. l volt
reference when the system was operated with no delay path signal. For each
of the test conditions the rms noise signal voltage ratio was determined in
db with respect to a. l volt reference when the system was operated with no
speech input. The S/N ratios corresponding to those on the abscissa. in Figure
2 ~<7ere formed by algebraically subtracting the noise signal ratio from the
speech signal ratio. Predicted intelligibility corresponding to each S/N
ratio was read from the ordinate.
Since the audio input and external amplifier were held constant
for all tests, it was necessary to measure the speech ratio only once.
:Maximum possible interference a.nd minimum possible interference attainable a.t
each delay time-quieting level-power level combination were readily obtained
by shifting the phase with the adjustable line to give a. maximum and minimum
noise reading, respectively, on the rms voltmeter.
3. Test Results
Figures 5 through ll show the predicted maximum and minimum attain-
able intelligibility as a. function of relative direct to
level for seven delays and five quieting levels.
10
path power

DELAY .. 0.2 p.sec
CMETING- 40 db
DELAY .. 0,2 p.uc
QUIETING- JS db
RATIO OF DIRECT TO DELAY PATH POWER LEVELS (db) RATIO OF DIRECT TO DELAY PATH POWER LEVELS (db)
DELAY- 0.1, .. ,
QUIETING • 30 db
-1 -6
(B)
-8
RATI() OF DIRECT TO DELAY PATH POWER LEVELS (db) RATIO OF DIRECT TO DELAY PATH POWER LEVELS (db)
Figure 5 (a-e) .
(C)
DELAY • 0.1 ,.,.,
QUIETING " 10 db
-2 -4
RATIO OF DIRECT TO DELAY PATH POWER LEVELS (db)
(E)
-6 -8
(0)
e MAXIMUM INTERFERENCE
X MINIMU.~ INTERFERENCE
Predicted Intelligibility as a Function of Direct to Delay Power Level Ratio for a Relative Delay of 0.2 ~sec.
11

DELAy ... 0, 4 ,ILSI!iC
QUIETING • 40 db
4 2 0 -2 -4 RATIO OF DIRECT TO DELAY PATH POWER LEVELS (db)
DELAY- 0.4 p.SOC
QUIETING- 30 db
(A)
-4
RATIO OF OIRECT TO DELAY PATH POWER LEVELS (db)
(C)
DELAY • 0:.4 ~!Sec
~UifTING. 2U db
-6 -a
DELAY .. 0.4 ~sec
QUIETING • 35 db
-2 -4
RA TID OF DIRECT TO DELAY PATH POWER LEVELS (db)
DELAY ... 0.4 i<sK
QUIETING. 25 db
I B)
4 1 0 -2 _j
RATIO OF DIRECT TO DELAY PATH POWER LEVELS (db)
(0)
-6 -8
-B
e MAXIMUM INTERFERENCE
X MINIMUM INTERFERENCE
6( a-e). Predicted Intelligibility as a Function of Direct to Delay Power Level Ratio for a Relative Delay of 0.4 ~sec.
12

40
20
DELAY .. 0.6 ,~~.sec
OUtETtNG ~ 40 db
DELAY"' 0.6 ~o~.-sec
QUIETING • 30 db
4 ~ ~
RATIO OF DIRECT TO OELAY PATH PO~ER LEVELS (db)
(A)
2 0 -2 -4 RATIO DIRECT TO DELAY PATH POWER LEVELS (db)
(C)
100
~80
DELAY .. 0. 6 fl"~c:
QUIETING • 20 db
DELAY"" 0.6 f"SitC
QUIETING • 25 db
4 0 -2 -4
RATIO OF DIRECT TO DELAY PATH POWER LEVELS (db)
(El
4 ~ ~
RATIO OF DIRECT TO DELAY PATH POWER LEVELS (db)
-x'x x \I X
-2 -· RATIO OF DIRECT TO DELAY PATH POWER LEVELS (db)
-6 -8
(D)
• MAXII.IUM INTERFERENCE
X MINIMUM ·~TERFERENCE
Figure 7(a-e). Predicted Intelligibility as a Function of Direct to Delay Power Level Ratio for a Relative Delay of 0.6 ~sec.
13

100
ao
60
40
20
100
BO
60
40
20
DELAY "" IU! ).I.$CC
OUIETIHG • 40 .Jb
DELAY - 0.8 trsec
I;!UIETING-30db
RATIO DIRECT TO DELAY PATH POWER LEVELS (db)
IAI
-2
RATIO OF DIRECT TO DELAY PATH POWER LEVELS (db)
(Q
DELAY .. 0.8 psec
QUIETING • 20 db
lOO
80
60
DELAY ..-O.S:".sec
QUIETING. 35 db
1i)
-8
-2
RATIO OF DIRECT TO DELAY PATH POWER LEVELS (dbl
(E)
RATIO OF DIRECT TO DELAY PATH POWER LEVELS (db)
IBI
RATIO OF DIRECT TO DELAY PATH POWER LEVEU {db)
(!)}
-8
e MAXIMUM INTERFERENCE
X MINIMUM JHTERFERENCE
8( a-e). Predicted Intelligibility as a Function of Direct to Delay Power Level Ratio for a Relative Delay of 0.8 ~sec.
14

DELAY -1.0 J<SK
QUIETING< 40 db
DELAY - 1.0 ""' QUIETING~ 30 db
~2
RATIO Of DIRECT TO DELAY PATH POWER LEVELS
(A)
_, -·
-8
-6
DELAY .. l.O ~sec
QUIETING • J5 db
DELAY. 1.0 ,,..c QUIETING- 15 di>
RATIO OF DIRECT TO DELAY PATH POWER LEVELS (db)
(0
100
DELAY .. l.OJ.sec
QUIETING • 10 db
4 ~ ~
RATIO OF DIRECT TO DELAY PATH POWER LEVELS (db)
[E)
RATIO OF DIRECT TO DELAY PATH POWER LEVELS (db)
(BJ
-1 -4 -6 RATIO OF DIRECT TO DELAY PATH POWER LEVELS (db)
(D)
-6
e MAXIMUM INTERFERENCE
X MINIMUM INTERFERENCE
Figure 9(a-e). Predicted as a Function of Direct to Delay Power Level Ratio for a Relative Delay of 1.0 !J.Sec.
15

DELAY .. 1.2 puc
CUIETING • 40 db
OELAY .. 1.21tSoc
QUIETING. Jl) db
4 0 -2 -4 RATIO OF DIRECT TO DELAY PATH POWER LEVELS (db)
(A)
X
4 2 0 -2 -~ RATIO OF DIRECT TO DELAY PATH POWER LEVELS (db)
(C)
DELAY • 1.2 ,.sec
QUIETING • 20 db
DELAY -1.2 "'"" QUIETING • 35 db
j 2 0 -2 -~ RATIO OF DIRECT TO DELAY PATH POWER LEVELS (db)
(B)
100
\ 80
\ 60
DELAY· U" .. ' QUIETING • 25 db
jQ
• 2 0 -2 -4 -8 RATIO OF DIRECT TO DELAY PATH POWER LEVELS (db)
(D)
o MAXIMUM lt!TERFERENCE
X MINIMUM INTERFERENCE
4 2 0 -2 -~
RATIO OF DIRECT TO DELAY PATH POWER LEVELS (db)
(E)
Figure 10( a-e). Predicted Intelligibility as a Function of Direct to Delay Power Level Ratio for a Relative Delay of 1.2 ~sec.
16

100-
80
60-
20
100
20
DELAY .. 1.~ fA.NC
QUIETING • 40 db
j
4 1 0 -2 -4 RATIO OF DIRECT TO DELAY PATH POWER LEVELS (~b)
(A)
DELAY • 1.4 ,...,
QUIETING • 30 db
DELAY • 1.4 pH<
QUIETING • 20 db
I I
DELAY. 1.4 pH<
QUIETING • 35 db
DELAY ... \. .. pSK
QUIETING -15 db
• 1 0 -2 -4 -6 RATIO OF OIRECT TO DELAY PATH POWER LEVELS (db)
{Dl
4 2 0 -2 -4 RATIO OF DIRECT TO DELAY PATH POWER LEVELS (db)
(E)
-6
• MAXIt.IUt.l INTERFERENCE
X MINIMUM INTERFERENCE
Figure ll(a-e). Predicted Intelligibility as a Function of Direct to Delay Power Level Ratio for a Relative Delay of 1.4 ~sec.
17

1~e curves of Figures 5 through ll show the general characteristic shape
that would be expected for wide-band FM systems in the presence of multipath
interference. Specifically, predicted intelligibility is a minimum at equal
direct to delay path power levels and increases monotonically with increasingly
positive and negative relative power levels. Higher quieting levels generally
give rise to higher predicted intelligibility; lower predicted intelligibility
is prevalent at longer delays.
Differences also exist between the curves of Figures 5 through ll and
those intuitively expected for wide-band FM systems. One difference of
potentially great importance is the significant degradation in predicted
intelligibility that exists at the relatively small delay times used in
these tests. A delay of 1.4 ~sec corresponds to a free space path length
difference of only 0.26 mile. Based on a system expected operating range
in excess of 20 miles, the free space attenuation of the desired and reflected
signals will be essentially identical at this path length difference. There
fore, the relative direct to reflected (delay) path power level will depend
predominantly on the efficiency of the reflecting surface(s). The absence of
a difference in the free space attenuation of the direct and reflected si&lals
should enhance the probability of equal or nearly equal power levels, and
hence should increase the probability of multipath interference in FM systems
which use T.DM.
The nonsymmetry of the curves can be attributed to the method used in
forming direct to delay power ratios. For positive ratios, attenuation was
removed from the direct path, whereas for negative ratios attenuation was
added to the direct path. Thus, at positive ratios more total power was
available at the receiver than was available at the corresponding negative
ratios.
18

4. Discussion
The data are summarized in Figure 12 which shows the predicted maxi
mum attainable intelligibility as a function of relative delay time between
paths for each of the five quieting levels at direct to delay path power
ratios of 0 db and 1 db. These curves can best be interpreted from the stand
point of system operation.
Under interference-free operating conditions, a pulse position modulated
pulse train such as that shown in Figure 13a is detected and fed to the
demodulator. The double pulse is the gating signal, and the single pulses
each correspond to a multiplexer channel. Each channel demodulator operates
to convert a position modulated pulse (PPM) to a width modulated pulse (PWM)
which contains the audio component and when filtered gives the audio output.
The instantaneous width of the latter pulse corresponds to the instantaneous
amplitude of the original modulating signal. The instantaneous width of
the PWM pulse is determined by the length of time between the gating signal
and the PPM pulse.
Video signal distortion is produced at the receiver output (demultiplexer
input) when the equipment is operated in a multipath enviror~ent. This
distortion is caused primarily by the following:
(1) Limiter noise due to absence of the carrier,
(2) Noise produced by amplitude modulation due to the absence of
effective limiting action at low signal levels, and
(3) Phase modulation of the direct signal by the delayed signal.
The distorted video signal generates sampling or gating pulses in the demulti
plexer in addition to those transmitted. This condition is called random
or false gating, and results in the generation of random noise at the audio
19

100
~ "' IJ.J "-,... .... :i ai i3
:3 ~ § u fii !f
100
~ u
"' w "-
~ 60 :J 1ii i3 :J ..J
~ frl .... u
~
0
~ db u
"' IJ.J "-,... .... :i 1ii i3 :i u:l ~ 0 UJ .... u
~
0 0.2 0.4 0.6 0 0.2 0.4 0.6 0.8
RELATlVE DELAY TIME ("sec) RELATIVE DELAY TIME ("sec)
(A) (B)
100
~ 80
QUIETING LEVEL 30 db "' w "-,... .... :::; Cii i3
~ 0
b ~ "-
0 0 0.2 0.4 0.6 0.8 1.0 1.2 1.4 0 0.2 0.4 0.6 0.8 1.0
RELATIVE DELAY TIME ("sec) RELATIVE DELAY TIME (l.sec)
(C) (D)
100 ±1 db
~ 80
u
"' w QUIETING LEVEL , 40 db "-,...
60 .... :::; ai t5
~ ~ 40
fil t ~ "-
20
0 0 1.0
RELATIVE DELAY TIME ("sec)
(E)
Figure l2(a-e). Predicted Intelligibility as a Function of Relative Delay Time for Five Quieting Levels.
20

f\) 1--'
t t '' 1 ' '' 1 rt' t rt't • t r• 'y • t l' ' t , ' ·1 ', ', , ' ' • ~ -·· ~! f ~ ~:~ ·~1 . •
I i i I I ~ I j u i I i ' l I l i i l i • i ' I j i i I j i j i ,. ' ' ' • .
(a) PPM PULSE TRAIN UNDER INTERFERENCE - FREE CONDITIONS
'f
(c) LOW DENSITY FALSE GATING (Note: Time Exposure)
I I . 1r .. •
(b) GATING PULSES UNDER INTERFERENCE - FREE CONDITIONS (Note: Time Exposure)
a 'f - ~ -- ~· -·' - ~ - ........ ..... .L .
(d) HIGH DENSITY FALSE GATING (Note: Time Exposure)
f.' ... y ' !1 • • • ' • '' ' ' • t 1 t ~ t lr~ 1 ..
(e) PPM PULSE TRAIN UNDER A CONDITION OF BLANKING
Figure l 3 (a -e). Phot ographs of Demultiplexer Puls e Trains .

output by causing the PWM pulse following the false gate to exhibit a false
instantaneous width. Figure l3b shows the gating pulses under interference
free conditions and Figures l3c and l3d show two conditions of false gating
caused by multipath interference.
1~e S/N ratio at the system audio output is a function of the density
(number per unit time) of the false gating signals: a high false gating
density results in a low S/N ratio and a low false gating density results i~
a high S/N ratio. A very high density of false gating signals arose from
video signal distortion caused by limiter noise in the receiver when the
relative phase angle of the direct and delay path signals was adjusted to
give carrier cancellation between channel pulses. This generally resulted
in the lowest S/N ratios at each delay time-quieting level-relative power
level combination; this condition could easily be avoided in the field by
antenna relocation or rotation, and hence is not reflected in the curves
of Figures 12.
For a fixed relative delay time, the density of the false gating signals
resulting from noise in the video signal produced by amplitude modulation
would be expected to decrease with increasing quieting levels. Figure 12 shows
that this did occur, as evidenced by increased intelligibility for fixed delay
times as a function of increased signal level. Increased effectiveness of
amplitude modulation limiting at high signal levels also accoQ~ts for the
larger increase in intelligibility predicted at higher signal levels when the
delay to direct path power ratios are changed from 0 db to ±1 db.
The density of the false gating signals resulting from distortion of the
video signal caused by phase modulation would be expected to increase as the
22

relative delay time increased. Occurrence of this phenomenon is evidenced by
the decrease in predicted intelligibility with increased relative delay times.
In addition to the three general causes of video signal distortion listed
and discussed above, a fourth type of distortion occurs at 40 db of quieting.
At relative delay times of 1.0 and 1.2 ~sec at this quieting level, the video
pulse train appears as shown in Figure 13e when the direct to delayed path
power ratio is 0 db. The pulse train consists primarily of the transmitted
gating pulses; the channel pulses are "blankedrr or highly attenuated. Under
blanking conditions, neither noise nor desired audio signals can be heard at
the system audio output. This condition does not exist at any of the other
delay time-quieting level-relative power level combinations used. Blanking
accounts for the discontinuity of the 0 db curve of Figure 12e. The cause
of the blanking effect may be related to gating pulse reinforcement since
the delay times involved are close to the desired gating pulse separation time
(1.25 ~sec), but the relationship is unclear as of this writing.
5. Conclusions
When the FM/TDM equipment was operated in a multipath environment,
video signal distortion was produced at the receiver output. The distorted
video signal produced false gating signals in the demultiplexer, resulting in
the generation of random noise at the system audio output. Predicted intel
ligibility measurements based on audio output S/N ratios indicate that signifi
cant degradation in intelligibility ca~ be expected for this system when
multipath signals of equal or near equal strength are received at a level cor
responding to 35 db or less of receiver quieting over paths which differ in
length by as little as 0.15 mile (0.8 ~sec delay). At normal operating ranges,
23

the free space attenuation of the desired and reflected signals will be essen
tially identical for path length differences of this magnitude. This should
enhance the probability of equal or near equal power levels, and hence should
increase the probability of significant multipath interference in FM systems
which use TDM as compared to ordinary wide-band FM systems.
B. Mixer Testing and Evaluation
1. Introduction
Quarterly Reports Nos. l and 2 have established and partially
evaluated a technique for predicting the spurious response rejection data
for single diode mixers. The technique generally yields predicted values
within 6 db of the measured rejection data but occasionally errors in excess
of 10 db are obtained. These errors in prediction appear to stem from
certain imperfections inherent to the prediction technique as well as inac
curacies in the measurement of the actual mixer response levels. Better
prediction can come only at the expense of complexity in the methods of
measuring and calculating response levels.
2. Prediction and Mixer Operating Conditions
Although the prediction technique previously discussed is not
highly accurate in all cases, its simplicity and relative accuracy render
it useful in determining a mixer characteristic with a minimum of measured
data. It has the further advantage that the data may be taken with the mix
ing element connected into ap~ desired mixer circuit. Since all previously
assembled data demonstrating prediction accuracy were obtained under conditions
24

of zero de bias, a question concerning the effect of diode bias on the accuracy
of prediction was raised.
It is known that for a given local oscillator level, the relative rejec
tion of a spurious response is dependent on the relative diode bias as well
as the associated generating order. The diode bias must therefore be set
to the designed operating value prior to prediction measurements or the pre
dicted rejections will be in error for the conditions of operation within
the equipment. It is desirable therefore to ascertain whether or not the
prediction accuracy is significantly affected by the relative bias level at
which the mixer data are obtained. The prediction error data obtained with
three constant bias voltages and one constant bias current for a 11~2A diode
are shown in Figures 14 through 17. These data indicate little significant
degradation in prediction accuracy with change in diode operating point or
bias level.
Previous data have indicated large prediction errors when the mixer
diode output termination is tuned to the intermediate frequer-cy rather than
being almost entirely resistive. These errors are manifested by a shift
in the response density mean and spreading of the error range about the
mean. It was noted that a shift of the mean also occurred with local
oscillator overdrive and that perhaps a reduction in the level of the local
oscillator input would improve the prediction. The data shown in Figure 18
tend to validate this assumption in that the density mean remained near the
zero error point. The error spread, however, was not improved by a reduction
in the local oscillator input level. It should be observed that the local
oscillator level was not reduced below the level required for satisfactory
conversion efficiency.
25

15
14
13
12
11
10 >-~9 z w 0 8 w ...... ~ 7 c.. ...... Mt 6
r, I I
J I I I I L1
L., I I I ... ,
DIODE: 1N82A LO. LEVEL: -5 dbm SENSITIVITY: -102 dbm I.F. FREQUENCY: 1 Me TUNING: None L.O. FREQUENCY: 10 Me
CROSSHATCHED: True Density DASHED: Density Integral
0 4---~----------~--~--~+-~~~~~~~~~~~~--~---U4~---~~~--~~~ -8 -7 -6 -5 -4 -3 -2 -1
PREDICTION ERROR IN db
Figure 14. Response Density Versus Prediction Error for a 1N82A Diode Mixer with +0.1 Volt Bias.
>-1-;:;; z w 0
!!:l :z: 0 S; w
"'
15
14
13
12
11
10
7
5
.. -, I I I .. _,
: L, I I I I I I
I ~-,
I I I I ......
I -., I ... __ ,
L., 1..
DIODE: 1N82A L.O. LEVEL: -5 dbm SENSITIVITY: -102 dbm I.F. FREQUENCY: 1 Me TUNING: None L.O. FREQUENCY: 10 Me
CROSSHATCHED: True Density DASHED: Density Integral
04---~----..----~--~~--~~-..-~~~~~~~~~~--~~~~~-----~--~--~ -3 -2 -1 0 10 11 12 13
PREDICTION ERROR IN db
Figure 15. Response Density Versus Prediction Error for a 1N82A Diode Mixer with -0.1 Volt Bias.
26

15
14
13
12
11
10
>-1-Vi z w 0
~ z 7 ~ V')
w 0::
-11 -10 -9 -8 -7 -6 -5
r, I I I l..1
: : I L,
-3
~...,
I I I I I
-2 PREDICTION ERROR IN db
-1
DIODE: 1N82A L.O. LEVEL: -5 dbm SENSITIVITY: -102 dbm I.F. FREQUENCY: 1 Me TUNING: None L.O. FREQUENCY: 10 Me
CROSSHATCHED: True Density DASHED: Density Integral
Figure 16. Response Density Versus Prediction Error for a 1N82A Diode Mixer with +0.2 Volts Bias.
15
14
-10 -9 -8 -7 -6 -5 -4
DIODE: 1N82A L.O. LEVEL: -5 dbm SENSITIVITY: -102 dbm I.F. FREQUENCY: 1 Me TUNING: None L.O. FREQUENCY: 10 Me
CROSSHATCHED: True Density DASHED: Density Integral
-3 -2 -1 0 PREDICTION ERROR IN db
Figure 17. Response Density Versus Prediction Error for a lN82A Diode Mixer with +0.2 rna Bias.
27

15
14
13
12
11
10
>-.... 9 ;:;; z ~ 8 LIJ
~ 7
~ M:! 6
r.,_, r.J ~...,
I I I I I I
I L.--,
L, I I
DIODE: L.O. LEVEL: SENSITIVITY:
1N82A -5 dbm -102 dbm
I.F. FREQUENCY: 1 Me TUNING: Output to 1 Me L.O. FREQUENCY: 10 Me
CROSSHATCHED: True Density DASHED: Density lntegrol
L--, I L---.,
L-----
0+-~~---~~~~------~~~~~~~~~~~~~~--~L-,--L~L-~~---~~~---~
-9 -8 -7 -6 -5 -4 -3 -2 -1 0 PREDICTION ERROR IN db
Figure 18. Response Density Versus Prediction Error for a 1N82A Diode Mixer with Tuned Output.
15
14
13
12
11
10
r.J r--- ___ ..J
r--..J ----...J
-28 -26 -24 -22 -20 -18 -16 -14 -12 -10 -8 -6 -4 -2
r1 I I I I
: I
PREDICTION ERROR IN db
DIODE: 1N82A LO. LEVEL: -5 dbm SENSITIVITY: -102 dbm I.F. FREQUENCY: 1 Me TUNING: None L.O. FREQUENCY: 10 Me
CROSSHATCHED: True Density DASHED: Density lntegrol
10 12 14 16 18 20 22
Figure 19. Response Density Versus Prediction Error for a 1N82A Diode Mixer with Unfiltered Input Signal.
28

3. Prediction and Mixer Driving Circuitry
A study of the effect of injecting signal and local oscillator har
monics into a mixer was presented in Quarterly Report No. 1. 16 The effect of
injected signal harmonics on response level was shown to be significant. The
resultant effect on prediction error is also significant as illustrated in
Figure 19.
No significant shift in the density mean is observed but the error spread
increased almost threefold over the normal error spread obtained using filtered
inputs. This fact severely limits the utilization of the predictio~ technique
to receiver spurious response prediction when there are amplifiers without low-
pass filters prior to the mixer. The possibility of harmonics being generated
within such amplifiers is distinct, especially with the high signal levels
required to obtain responses with large values of q.
The prediction technique was originally developed as a means to evaluate
receiver spurious response rejection data using a.:minimum of receiver measure-
ments. The assumption inherent in applying the technique to receivers is that
the prediction error for a device containing ma~~ cascaded nonlinear elements
will not be significantly larger than the corresponding error for a device
containing only one nonlinear element. The data obtair.ed with injected signal
harmonics tend to invalidate the above assumption conclusively. For complete
assurance of result, two diodes were connected within the test circuit as
shown in Figure 20. The prediction error data obtained with this cascaded pair
of diodesa.re given in Figure 21. It is obvious that the prediction error
spread is many times larger than normal and there is a significant shift of
the distribution mean. O~ly if the premixer circuitry is entirely linear can
the prediction method be utilized with any assurance of accuracy.
29

BNC NO. 1
SIGNAL
BNC NO.2
INPUT TEST
L.O.
Figure
15
14
13
12
11
10 >-1-;:;; z w 0
w "" z 0 7 0.. ..,., w e::::
5
1N82A 1N82A
TEST OUT
20. Schematic Diagram of Double-Diode Mixer Test Circuit.
DIODE: 1N82A L.O. LEVEL: -5 dbm SENSITIVITY: -102 dbm I.F. FREQUENCY: 1 Me TUNING: None LO. FREQUENCY: 10 Me
CROSSHATCHED: True Density DASHED: Density Integral
0+-~~-r--~~--~--~UT~~~~~~~~~~~~~~~~~~4-~~--,-~~~~~~-34
PREDICTION ERROR IN db
Figure 21. Response Density Versus Prediction Error for Two Cascaded 1N82A Diodes.
30
14 16

4. Prediction and Mixer Design
The prediction technique has perhaps its greatest utilization in the
design of equipments using mixers. The effect of changes in mixer operating
conditions on the overall spurious response rejection can be found with only
a basic set of measurements at each operating point. The test mixer setup
need not have the same IF sensitivity as the intended equipment since conversion
to the equipment sensitivity level is automatically accomplished in the predi
tion calculations. The measurements must be made with the mixer element in
the final circuit using the same operating levels as expected in the end
equipment.
Mixer spurious response rejection is dependent upon the IF output level
at the mixer and is thus a function of the gain or sensitivity of the IF ampli
fier. Furthermore, the effect of the IF sensitivity on spurious response
rejection is a function of the value of q for the response in question. This
is the case since the response level is proportional to the response input
voltage raised to the qth power. It follows that the relative rejection to
responses having a unity q value will remain constant for all values of IF
sensitivity and that all other spurious response rejections will increase with
increasing IF sensitivity. The percentage increase in the rejection to a
spurious response of given q for a known decibel increase in IF sensitivity
may be obtained from the envelope curve shown in Figure 22. If the ratio of
local oscillator level to input signal level is increased by the exact decibel
increase in IF sensitivity and the prediction of response rejections is calcu-
lated using this corrected ratio, the predicted spurious response rejections
will conform to those expected at the higher IF sensitivity. 17
31

1.0
0.9
::0 ::!:!..
z 0.8 0 i= u w ., w 0.7 c:t::
w cl)
z 0
0.6 0.. cl)
w c:t:: cl)
:J 0.5 0 n: :J 0.. cl)
z 0.4 VJ w 1\)
(.!) z <(
0.3 J: u 1-z :J
c:t:: 0.2
w 0..
0.1
0
0 2 3 4 5 6 7 8 9 RESPONSE Q VALUE
NOTE: This Curve Shows the Envelop of the Rejection Change Versus q Since q is an Integer.
10 11 12 13 14 15
Figure 22. Change in Spurious Response Rejection with a Change in IF Sensitivity.

5. Considerations for Receiver Design
Several factors concerning receiver design have been illuminated
by the mixer studies and resultant prediction techniques. Though this facet
of communications equipment is not specifically covered by the present studies,
it is felt that facts pertinent to design should be stated for future guidance.
Harmonics of the local oscillator and especially those of the input signal
can cause excessive generation of spurious products within a mixer, particularly
whe~ spurious product generation by the mixer alone is very slight. Both the
signal and the local oscillator inputs should be isolated from the mixer using
suitable low-pass filters with at least a 3 db pad between the filters and the
mixer proper. Amplifiers preceding the mixer require a high degree of low-
pass filtering prior to the mixer. At high spurious signal levels, these units
exhibit clipping which generates considerable harmonic content and which is
perhaps the largest single contributor to receiver intermodulation product
formation. The preponderance of the band selectivity filtering should occur
prior to any amplification in order to prevent out-of-band clipping in the
first stages of the amplifier. This consideration should apply to both RF and
IF amplifiers.
Spurious response rejection values are increased by maintaining the IF
gain at the maximum level consistent with the mixer noise figure. AGC action
and similar automatic or manual control systems should not alter the gain of the
IF amplifiers. The AGC control should act prior to the RF amplifier, if at all
possible, and certainly prior to the mixer. Control of the mixer conversion
efficiency by alteration of the local oscillator input level may also provide
a method of AGC consistent with the reduction of spurious responses.
33

6. Conclusions
Mixer response prediction by simple means is limited in accuracy
and in utilization. The present technique is useful in mixer design and
for certain cases of receiver spurious response prediction. The technique
is too sensitive to harmonic interference for receiver prediction where non-
linear elements precede the mixer. Significant improvement in prediction can
be realized only through more complex techniques for the measurement and cal-
culation of spurious responses. A more reasonable approach appears to be
that of concentrating future effort toward eliminating the cause rather than
trying to predict its results.
C. A Method for Determining Response Coefficients
1. Introduction
The purpose of this section is to present a method for determining
the coefficients of the responses arising from the use of an nth degree poly-
nomial as a mathematical model of mixer characteristics. The laborious com-
putations necessary to obtain these coefficients from the binomial expansions
of the summed input signals indicate the desirability of such a method, and
previous mixer studies have provided the basis for its development. 14, 18 The
triangle of constant coefficients shown in Figure 23 and the response coeffi-
cients listed in Figure 24 are taken from reference 18. These coefficients
and the mixer theory presented in references 14 and 18 furnish the foundation
from which the following method evolved.
2. Development of Method
The representation of the mixer characteristic by the power series

"' /
"' / """
/
" /
""' /
""' /
1 l l 2 2 2
" /
""" /
""' /
""" /
.!. 3 1
4 4
4"'-~
.. +
" /
""" """ /
""' / / "'(':
"j¢ ~eo. "Q
,, l .!_ 6 4 I '1:>~
o"" 8 8 8 8 8 o,-
«/''- "' /
""' /
""" /
""" /
""" /
""' / ~
/ 1 5 lQ. lQ. _!L _l ~ 16 16 16 16 16
16 ""' "' /
""' / /
""" /
""" /
""' / /
1 .i 11 20 15 ~ 1
32 32 32 32 32 32 32
"' ""' /
""' /
""" /
""" /
""" / /
""' /
w I 7 1!_ ~ ~ 1l L ..!.
\Jl 64
64 ""'
64 64 64 64 64 64
"' /
""' / /
""" /
""" /
""" / /
""' /
""' /
1 8 56 56 _!_ 2 - rn i2a 128 128 128 128
"' /
""' ""' / /
""" /
""" /
""' /
""" /
""' / /
1 36 ~ 126 ~ 36 I 10 10 - 2~ 256 256 256 256 256
256 ""'
"' /
""' /
""' /
""' / / /
""' /
""" /
""" /
""' / /
1 45 210 210 10 1 ll 11 512 ill m ill 5!2 512
" / ""'
/
""" /
""' /
""" /
""' / /
""" /
""" /
""" /
""' /
""' /
1 11 55 ~ 462 ~ 330 165 11
1o2i 1024 1024 1024 1024 1024 1024 1024 1024
Figure 23. Triangle of Constant Coefficients.

w 0\
1575 e 5e 5 + 525 3 7) J + -- a b - ea eb K 10 + 1 I.+
61J 61J
Figure 24. Responses Generated from the Power Series Representation of a Mixer Characteristic when the Input is Two Summed Sinusoids.

expression
i = K 0
+ K1 e i + K2 e~ + · · · + Kn e ~
involves the binomial expansions through degree n of the input signal
e. = e cos a+ ebcos b. 1 a
This expansion yields a multitude of response terms of the form C cos p,q
(pa ± qb), and harmonic terms of the form C cos(pa) or C cos(qb). Each of p q
the response coefficients, cp,q' is in the form of a series, and Figure 24
indicates that this series is one comprised of modified binomial expansions.
This is not unexpected, since each term in the series arises from a binomial
expansion of the input signal. Thus it should be possible to derive this
series from an inspection of the operation of the power series expression on
the binomial expansions of the input. It will be shown that the generation of
response coefficients is possible through the use of only the table of binomial
coefficients, Figure 25, and the triangle of constant coefficients, Figure 23.
From Figure 24, it is noted that any given response may be written
[cos (pa + qb) J [ k0 e~ ~ Kptq + (kl e~+2 ~ + k2 e~ er) Kp+q+2
e~ ~+J Kptq+4
er-6 ~ + k7 er-4 ~+2 + kg er-2 ~+4 + k9 e~ er? Kp+q+6
+ ... + J
37

VALUE OF p ~ VALUE OF q
6 7 8 9 10 11 12
1
+1
3+ 1
+4+1
10 + 5 +1
+15+6+1
35 + 21 + 7 + 1
+56+28+8 +1
126 + 84 + 36 + 9 + 1
+ 210 + 120 + 45 + 10 + 1
0
2
3
4 w ::>
5 <1. > ....
6 m z; 0
7 ~ w
8
9
10
462 + 330 + 165 + 55 + 11 + 1 11
220 + 66 + 12 + 1 - 12
Figure 25. Table of Binomial Coefficients.
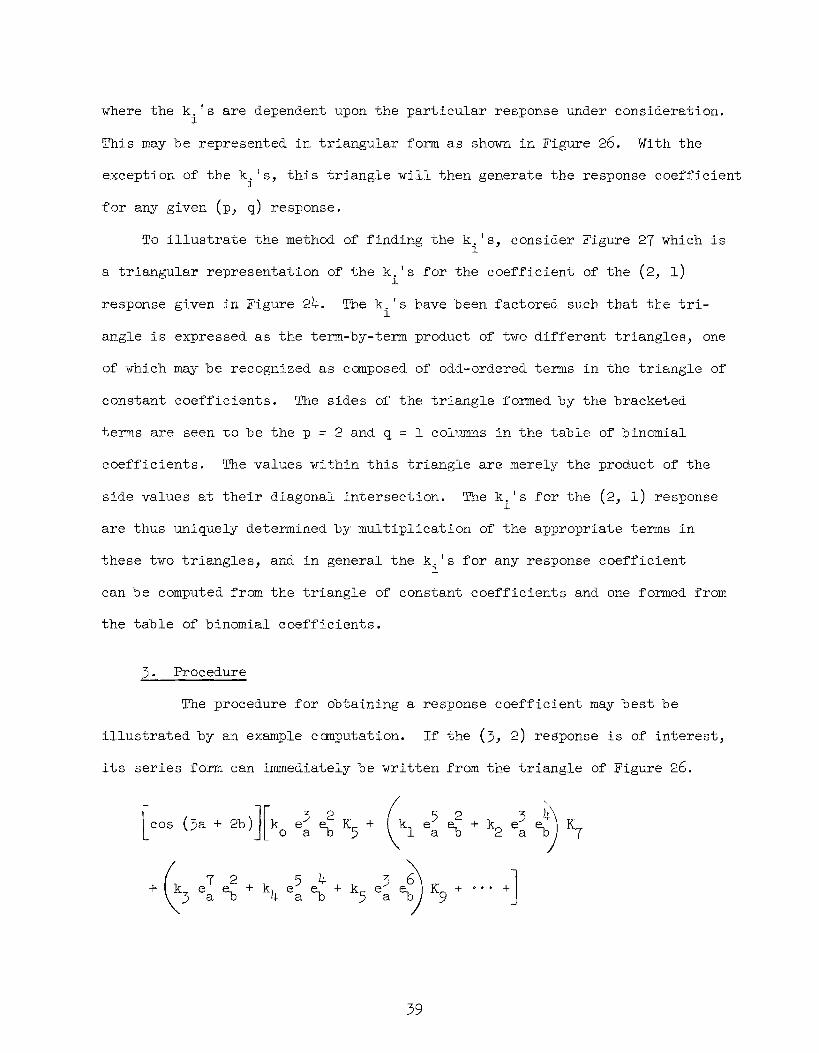
where the k. 's are dependent upon the particular response under consideration. l
This may be represented in triangular form as shown in Figure 26. With the
exception of the k.'s, this triangle will then generate the response coefficient l
for any given (p, q) response.
To illustrate the method of finding the k. 's, consider Figure 27 which is l
a triangular representation of the k. 's for the coefficient of the (2, l) l
response given in Figure 24. The k. 'shave been factored such that the tril
angle is expressed as the term-by-term product of two different triangles, one
of which may be recognized as composed of odd-ordered terms in the triangle of
constant coefficients. The sides of the triangle formed by the bracketed
terms are seen to be the p = 2 and q = l columns in the table of binomial
coefficients. The values within this triangle are merely the product of the
side values at their diagonal intersection. The k. 's for the (2, 1) response l
are thus uniquely determined by multiplication of the appropriate terms in
these two triangles, and in general the k. 's for any response coefficient l
can be computed from the triangle of constant coefficients and one formed from
the table of binomial coefficients.
3. Procedure
The procedure for obtaining a response coefficient may best be
illustrated by an example computation. If the (3, 2) response is of interest,
its series form can immediately be written from the triangle of Figure 26.
[cos (3a + 2b)][k0 e~ e; K5 + ~k1 e~ e; + k2 e~ ~~ ~
+ G3 e ~ e; + k 4 e~ ~ + k 5 e~ ~ K9 + • • · + J
39

p+2 q p q+2 k lea eb -- k2ea eb ------------------------ Kp+q+2
Figure 26. Response Coefficient in Triangular Form.

-r=-1---1
I), /
" / + .)..
.; 3 ~ 00 - [1] !!'+: ;r ~ 4 ..} :.00
~ " / ""'- / ")$
~0 "'"' ~0 o,. «7
5 10 ~
/ - [4] 16 [3]
~ b 16 .s
" / "' / "' / 7 35 [ 12] 21 [ ,
co 64 [ 15] 64 64 10J
.>
" / ""' / "" / ""'- /
9 84 126 36 '(':)
256 [56] 256 [45] 256 [401 256 [35] .J)
" / ~ / ~ / ~ / ~ / 11
1024 [ 210] 165
1024 [ 168] 462 1024 [ 1501
330 1024 [ 1401
55 1024 [ 1261
Figure 27. Numerical Coefficients (k. 's) of the Terms in the (2, 1) Response Coefficient. l

th To determine the k. 's, first form a triangle whose sides are the p l
th and q columns of the table of binomial coefficients, in this case the third
and second columns respectively. Inside terms of this triangle located at
the intersection of the diagonal rows are obtained from the product of the
side values in these rows. Figure 28 shows the completed triangle.
The value of k. associated with a given term in the (3, 2) response l
coefficient can now be computed by multiplying the particular (x, y) value in
the triangle of Figure 28 by its corresponding (x, y) term in the triangle
of constant coefficients. For example, to compute k4
, note that k4
is
associated with the term whose exponents are x = 5 and y = 4. The (5, 4)
values in Figure 28 and 23 are (20) and (126/256) respectively, and their
product yields k4
= 315/32. Sample calculations for other k. 'sin the (3, 2) l
response coefficient are given below.
k = (1)~ = ~ k3 = (21) 36 = 189 0 256 E)4
(5)~ 105 84 315 kl = b4 k5 = (l5 )256 = E)4
k2 = (4)~ = fi
The generation of the response coefficient through the desired number of
terms is thus complete.
4. Conclusions
The above method provid·es a simple approach to the problem of
generating response coefficients. The triangles necessary for numerical
computations are easily obtained from the table of binomial coefficients.
Although the above discussion and examples are concerned with response co-
efficients, the method works equally well for harmonic coefficients.
42
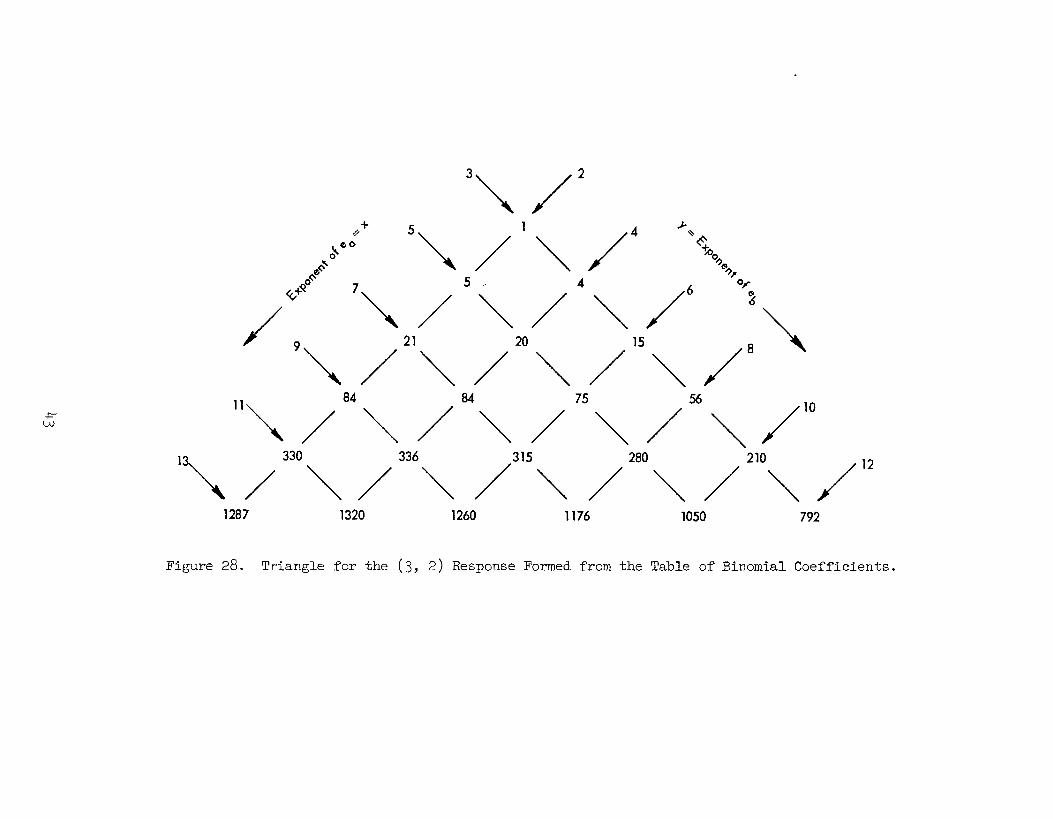
1287 1320 1260 1176 1050 792
Figure 28. Triangle for the (3, 2) Response Formed from the Table of Binomial Coefficients.

V. CONCLUSIONS
This report contains the concluding results of two quarter's study on
multipath interference for FM systems which employ TDM. Multipath inter
ference data were taken at receiver input levels corresponding to 20, 25,
30, 35, and 40 db of receiver quieting. The delay path time was adjustable
in 0.2 ~sec steps from 0.2 ~sec up to 1.4 ~sec and the relative phase angle
was variable over 360~
Multipath interference was found to cause several interference producing
conditions in the receiving system. These are: (1) random multiplexer gating,
(2) video signal blanking, and (3) distortion of the video signal caused by
phase modulation of the direct signal by the delayed signal. Predicted intelligi
bility results indicate that significant intelligibility degradation can be
expected for the FM/TDM system tested when multipath signals of equal strength
are received at a level corresponding to 35 db or less of receiver quieting
over paths which differ in length by as little as 0.15 mile (0.8 ~sec delay).
Serious effect of multipath interference is felt to be more probable in FM
systems which utilize TDM than in ordinary wide-band FM systems.
Higher accuracy in mixer prediction can be realized only at the expense
of increased mathematical complexity .. The simple technique of the mixer pre
diction method concluded in this report is useful under limited conditions,
but is unsuitable for accurate receiver response prediction.
The coefficient series of any mixer response or harmonic can be easily
calculated from the Pascal triangle of binomial coefficients regardless of
the order of nonlinear representation.
44

VI. PROGRAM FOR NEXT INTERVAL
The completion of the evaluation tests on available PPM/FM communications
systems is scheduled at the end of the fourth quarter's effort.
Further kno1-rledge acquired regarding the PCM requirements for
available PCM/FM systems necessitates additional circuitry for simulating
and detecting the information pulses. The feasibility of constructing the
desired circuitry w·ill be investigated.
Band-pass filters and preselectors on order will be evaluated when
received.. The utilization of these a.nd other filters should permit improved
testing limitations at the frequencies involved.
Volume 9 of the Manuscript of Catalogue which w·ill contain a. second
general RFI Bibliography will be published in the next interval. A delay
wa.s encountered in the receipt of wTitten permission from publishers to
publish their RFI related abstracts.
Data. on transistor a.nd vacuum tubes mixers w"ill be collected a.nd analyzed.

VII. IDENTIFICATION OF TECHNICAL PERSONNEL
Name Title Approximate Hours
E. E. Donaldson, Jr. Grad. Research Assistant 316
0. H. Ogburn Research Assistant 495
I. E. Perlin Research Professor 6
D. w. Robertson Head, Communications Branch 78
P. T. Spence Grad. Research Assistant 150
c. w. Stuckey Asst. Research Engineer 501
R. D. Trammell, Jr. Asst. Project Director 466
J. R. Walsh, Jr. Research Engineer 47
w. B. Warren, Jr. Research Engineer 26
E. w. Wood Project Director 376
Mr. Spence ha.s been associated -with the Engineering Experiment Station
since September 1963. He received a. B.E.E. degree in 1960 at Auburn University.
He is currently pursuing an M.S. degree in E.E. a.t the Georgia. Institute of
Technology. His previous experience includes two years as a. Factory Test
Planning Engineer and one year as a.n Equipment Engineer for the Western
Electric Company.
46

VI I I • REFERENCES
1. Murlan S. Corrington, "Frequency Modulation Distortion Caused by Commonand Adjacent-Channel Interference," RCA Review, Vol. 7, pp. 522-545, (1946).
2. L. B. Arguimbau and J. Granlund, ''The Possibility of Transatlantic Communication by Means of Frequency Modulation," Proceedings NEC, Chicago, pp. 644-653, (November 1947)~
3. L. B. Arguimbau and J. Granlund, "Sky-Wave F-M Receiver," Electronics, pp. 101-103, (December 1949).
4. Harold Ao Wheeler, "Common-Channel Interference Betw·een Two FrequencyModulated Signals," Proceedings IRE, pp. 34-50, (January 1942).
5. Elie J. Baghdady, ''The FM Random-Noise Threshold, 11 Frequency, pp. 12-17, (March-April 1963).
6. J. P., Egan, "Methods of Articulation Testing, '' Laryngoscope, 58, pp. 955-991, (1959)"
1. Egan, Miller, Stein, Thompson and Waterman, "Studies of the Effect of Noise on Speech Communication," Harvard University, Psycho-Acoustic Lab. PB22907, (November 1942).
8. G. A. Miller, "The Masking of Speech,'' Psychol. Bull., 44, 105-129, 1947; also, Harvard University, Psycho-Acoustic La.b. PNR 23, PEL 80873, (March 1947)"
9. J. C. R. Licklider, "The Influence of Interaural Phase Relations Upon the Masking of Speech of White Noise," J. Acoust. Soc .. .Amer., 20, pp. 150-159, (1948).
10. J .. C. R. Licklider and G. A .. Miller, "The Perception of Speech," Handbook of Experimental Psychology, John Wiley and Sons, Ne-vr York, pp. 1040-1074' (1951) ..
11. J. C. R. Licklider and N. Guttman, "Marking of Speech by Line Spectrum Interference," J .. Acoust. Soc • .Amer .. , 29, pp .. 287-295, (February 1957).
12. Instruction Book for Speech Systems Test Set, General Electronic La.boratories, Inco, Cambridge, Ma.ss., ContractDA36-039-SC-72788, (1958).
13. DG W. Robertson, and C. W. Stuckey, "Investigation a.nd Evaluation of the GEL Speech System Test Set, '' Engineering Experiment Station, Georgia Institute of~ Technology, Contract AF-30(602)-2150, (1961).
14. E. W .. Wood, R .. D. Trammell, Jr., C. W. Stuckey, H .. W. Denny, E. E. Donaldson, Jr., and R. M. Cook, "Quarterly Report No.1, Project A-678, 11 Electronic Equipment Interference Characteristics-Communication T,ype, Contract No. DA 36-039 AMC-02294(E), Georgia. Institute of Technology, Engineering Experiment Station, pp. 24-49, (15 February 1963 to 15 May 1963).
(Continued)
47

15. R. D. Tra.mmell, Jr., c. W. Stuckey, E. W. Wood, 0. H. Ogburn., and E. E. Donaldson, Jr., "Quarterly Report No. 2, Project A-678., u Electronic Equipment Interference Characteristics-Communication T.ype, Contract No. DA 36-039 AMC-02294(E), Georgia. Institute of Technology, Engineering Experiment Station, pp. 38-51, (15 May 1963 to 15 August 1963).
16. Wood, op. cit., pp. 64-73.
17. Wood, op. cit., pp. 91-99.
18. R. N. Bailey, E. W. Wood, R. D. Trannnell, Jr., and J. R. Walsh, Jr., "Final Technical Report, Project No. A-543, 11 Electronic Equipment Interference Characteristics-Communication T.ype, Contract No. DA 36-039 sc-87183, Georgia. Institute of Technology, Engineering Experiment Station, pp. 58-59, and 117-134, (1 September 1961 to 15 February 1963).
48

No. of Copies
1
1
1
3
20
1
1
1
2
1
1
1
1
1
1
DISTRIBUTION LIST
To
OASD (R&E), Rm 3El065, ATTN: Technical Library, The Pentagon, Washington , D. C.
Chief of Research and Development, OCS, Department of the Army, Washington , D. C.
Commanding General, U. S. Army Materiel Command, ATTN: R & D Directorate, Washington 25, D. C.
Commanding General, U. S. Army Electronics Command, ATTN: AMSEL-AD, Fort Monmouth, N. Jo
Commander, Defense Documentation Center, ATTN: Cameron Station, • 5, .A.lexandria, Virginia
TISIA, 22314
Commanding Officer, U. S. A. Combat Developments Command, ATTN: CDCMR-E, Fort Belvoir, Virginia
Commanding Officer, Uo S. Army Combat Developments Command, Communications-Electronics Agency,Fort Huachuca, Arizona
Commanding Officer, Ue S. Army Electronics Research and Development Activity, ATTN: Technical Library, Fort Huachuca, Arizona
Chief, U. S. Army Security Agency, Arlington Hall Station, Arlington 12, Virginia
Deputy President, Uo S. Army Security Agency Board, Arlington Hall Station, Arlington 12, Virginia
Director, U. S. Naval Research L:lboratory, ATTN: Code 2027, Washington , D. C.
Commanding Officer and Director, U .. So Navy Electronics Laboratory, San Diego 52, California
Aeronautical Systems Division, ATTN: ASNXRR, Wright-Pat-terson Air Force Ohio 45433
Air Force Cambridge Research Laboratories, ATTN: CRZC, 1. G. Hanscom Field, Bedford, Massachusetts
Air Force Cambridge Research Laboratories, ATTN: CRXL-R, Lo G. Hanscom Field, Bedford, Massachusetts

No. of Copies
1
1
1
1
1
1
1
1
1
3
1
1
1
DISTRIBUTION LIST
To
Hq, Electronic Systems Division, ATTN: ESAT, L. Go Hanscom Field, Bedford, Massachusetts
Rome Air Development Center, ATTN: RAALD, Griffiss Air Force Base, New York
AFSC Scientific/Technical Liaison Office, Uo S. Naval Air Development Center, Johnsville, Pennsylvania
USAELRDL Liaison Office, Rome Air Development Center, ATTN: RAOL, Griffiss Air Force Base, New York
Commanding Officer, U. S. Army Electronics Materiel Support Agency, ATTN: SELMS-ADJ, Fort Monmouth, New Jersey
Director, Monmouth Office, U. S. Army Combat Developments Command, Communications-Electronics Agency, Fort Monmouth, New Jersey
Commanding Officer, Laboratories, ATTN: Belvoir, Virginia
Research and Development Technical Documents Center, Fort
Marine Corps Liaison Office, U. S. Army Electronics Research and Development Laboratories, Fort Monmouth, N. J.
AFSC Scientific/Technical Liaison Office, U. S. Army Electronics Research and Development Laboratories, Fort Monmouth, N. J.
Commanding Officer, U. So Army Electronics Research and Development Laboratories, ATTN: Logistics Division, Fort Monmouth, N. J. (MARKED FOR: GUY JOHNSON)
Commanding Officer, U. S. Army Electronics Research and Development Laboratories, ATTN: SELRA/DE, Fort Monmouth, N. J.
Commanding Officer, U. s. Army Electronics Research and Development Laboratories, ATTN: Technical Documents Center, Fort Monmouth, N. J~
Commanding Officer, U. S. Army Electronics Research and Development Laboratories, ATTN: SELRA/GF, Fort Monmouth, N. J.

No. of Copies
1
1
1
1
1
1
1
1
DISTRIBUTION LIST
To
Commander, Rome Air Development Center, Griffiss Air Force Base, New York, ATTN: EMCVR (Co R. Miller)
Chief, Bureau of Ships, Dept. of the Navy, Washington 25, D. C. ATTN: Code 452 (Mr. Roman)
Director, Electromagnetic Compatibility Analysis Center, ATTN: ACX (Lt. Col. John A. Gahr), U. S. Navy Marine Engineering Laboratory, Annapolis, Maryland 21402
Commanding U. S. Army Electronics Research and Development Ulboratories, ATTN: SELRA/GFA, Fort Monmouth, N. J.
Commanding Officer, U. S. Army Electronics Research and Development Laboratories, ATTN: SELRA/GFR, Fort Monmouth, N. J o
Chief, Bureau of Ships, Department of the Navy, Washington 25, D. Co ATTN: 8lld (E. C. Nucci)
Commanding Officer, U. So Army Electronics Research and Development Activity, ATTN: FC-05, White Sands, New Mexico
IIT Research Institute, ATTN: Mr. J. T. Ludwig, 10 W. 35th Street, Chicago 16, Illinois

~-------------------------~~~~'---
REPORT NO. 25
QUARTERLY REPORT NO. 4
PROJECT A-678 . . ...... ~ ..... ..........
ELECTRONIC EQUIPMENT INTERFERENCE CHARACTERISTICS-COMMUNICATION TYPE
By 0. H. Ogburn, E. E. Donaldson, Jr., P. T. Spence a nd C. W. Stuckey
CONTRACT NO. DA 36-039 AMC-02294(E) (Continuation of Contract No. DA 36-039 sc-87183) DEPARTMENT OF THE ARMY PROEJCT: 3B24-0l-00l
Placed by the U. S. Army Electronics Research and Development laboratory Fort Monmouth, New Jersey
15 November 1963 to 15 February 1964
Engineering Experiment Station
1964
GEORGIA INSTITUTE OF TECHNOLOGY Atlanta, Georgia
lib-sascan
Rectangle

ENGINEERING EXPERIMENT STATION of the Institute of Technology
Atlanta, Georgia
REPORT NO.
QUARTERLY REPORT NO. 4
PROJECT A-678
ELECTRONIC EQUIPMENT INTERFERENCE CHARACTERISTICS-COMMUNICATION TYPE
By
0. H. Ogburn, E. E. Donaldson, Jr., P. T. , and C. W.
CONTRACT NO. DA 36-039 AMC-02294(E) (Continuation of Contract No. DA 36-039 sc-87183)
DEPARTMENT OF THE ARMY PROJECT: 3B24-0l-001
The object of this research program is to conduct a invest to determine methods for measuring the interference characteristics (spectrum
) of U. S. Army communications equipment deemed necessary for the pre-diction and of electromagnetic interference.
NOVEMBER 1963 to FEBRUARY 1964
PLACED BY THE U. S. ARMY ELECTRONICS RESEARCH AND DEVELOPMENT LABORATORY
FORT MONMOUTH, NEW JERSEY

FOREWORD
This was at the Georgia Tech Engineering Experiment Sta-
tion on Contract No. DA 36-039 AMC-02294(E). The report covers the
and-results of the fourth quarter's effort on a project to conduct a feasibil-
ity study and investigation to determine methods for measuring the interfer-
ence characteristics (spectrum
conrrnunications
interference.
D. W. Robertson, Head Communications Branch
ii
of U. S. Army modulated type
submitted:
E. W. Wood Project Director
of
lib-sascan
Rectangle
lib-sascan
Rectangle

TABLE OF CONTENTS
I~ PURPOSE
II. ABSTRACT
IIIe PUBLICATIONS, REPORTS AND CONFERENCES
IV. FACTUAL DATA
Ao Receiver Tests
lo Intermodulation
a 0 The Receiver Preselector and its Importance in Intermodulation Interference
Techniques
2. Spurious Responses •
a. The Preselector Techniques ..
Selectivity, Sensitivity, and Noise Figure
Mixer Te and Evaluation . . • . • . . .. •
Introduction .,
Calculated and Measured Data
3. Conclusions
c. Response Prediction of Triode Mixers
1 .. Introduction
2. Triode Mixer Theory
3. Data Evaluation
4. Conclusions
v. CONCLUSIONS
VI. PROGRAM FOR NEXT INTERVAL
VII. IDENTIFICATION OF TECHNICAL PERSONNEL
VIIIo REFERENCES ., o .. • .. • .. .. .. • .. • • •
This report contains 45 pages.
iii
1
2
3
4
4
4
6 9
12
13
18
19
32
34
34
37
39
42
43
44

1 ..
2.
3.
4 ..
6 ..
LIST OF FIGURES
Preselector Insertion Loss as a Function of for a PPM/FM Receiver. • .. • .. .. • .. .. ..
Block Diagram of Suggested Test Configuration for Receiver Intermodulation Evaluation • .. • • • • •
Block Diagram of Receiver Spurious
Test Configuration for Evaluation .. .. .. .. • ..
Test Configuration for Measurements ......... .
Block of sted Test Configuration for Receiver Sensitivity Measurements ..... " ... e ..
Block Diagram of Test Configuration for Noise Figure Measurements
7.. Ideal Diode Operation for Sinusoidal. Input Plus Bias
8. Calculated Level of 2nd Harmonic Versus B/A Where B = Bias Voltage Input and A = Peak Amplitude of Sinusoi.dal Input .. .. .. .. .. ., ., . .. • • ., ., ~
9. Calculated Level Harmonic Versus Where
10.
B = Bias Sinusoidal Input
and A = Peak Amplitude of
Calculated Level of 4th Harmonic Versus Where B = Bias Voltage Input and A = Peak Amplitude of Sinusoidal Input e ., • .. • .. $ • • .. • • • • • • •
Calculated Level of 5th Harmonic Versus Where B = Bias Voltage Input and A = Peak Amplitude of Sinusoidal Input • • • .. • .. . • • • .. • • ••
12. Diode Current Versus Bias Voltage for IN21B Diode
14.
in the Circuit of 13
Diagram of Test Mixer Circuit
I Measured Level of 2nd Harmonic Versus B;A Where B = Bias Voltage Input and A = Peak Amplitude of S:inusoidal Input .. .. • • .. • .. • .. .. . . ..
(Continued)
iv
7
10
10
16
20
22
26
28

LIST OF FIGURES (Concluded)
Meas~red Level of 3rd Harmonic Versus B/A Where B = Bias Voltage Input and A = Peak Amplitude of Sinusoidal Input o " o ., • • • • • • .. • • • .. •
Measured Level of 4th Harmonic Versus Where B = Bias Voltage Input and A = Peak Amplitude of Sinusoidal Input • • .. . . . . • • • • • • o • •
Measured Level of 5th Harmonic Versus B/A Where B = Bias Voltage Input and A = Peak A~plitude of Sinusoidal Input • • • • • ., • • • .. • • o
Response of the Mixer Circuit in Sinusoidal Input .
Mixer Schematic
to a
20., Time Transconductance Between the Grid and
22 ..
Plate of a ~riode Mixer Tube • a • • • • • • •
Block Diagram of the Test Configuration Used to Measure Triode Mixer .. • . • . • .. . • •
Density Versus Prediction Error for 6J4 Triode Mixer • • • • .. . . • • .. •
v
Page
30
35

I_ PURPOSE
The purpose of this project is to conduct a fea and investi-
gation to determi.ne methods for measuring the interference characteristic
(spectrum signature) of U. S. Army communications equipment deemed necessary
of interference. sis for the prediction and
shall be placed on modulated type communications equipments operating
in the 1-10 kMc frequency range. Measurement techniques for obtaining the
data and a format for a directory of these data shall be
Computer methods shall be for these data to obtain
""''" . .,....,,.,.,... s useful in optimum characteristics for communications
in interference environments.
The areas of investigation on this project are divided into two tasks
as follows:
I. The development of tests and
interference susceptibility and emanation characteristics of pulse modu.lated
communications equipments.
II. The use of techniques for proces measured interference
data to outputs useful in interference and control
tions.
1

II. ABSTRACT
sted derived from standard spectrum
tests conducted on U. S. Army microwave communications receivers are o~tlined.
The of the receiver in the receiver evaluation studies
is sized.. Common encountered in the procedures are
discussed and alternate test methods are presented.
A fini.te mathematical model of a mixer characteristic is
the use of the Fourier series. Calculated harmonic levels based on the mathe-
matical model were found to approximate the measured levels from
a diode mixer circuit. Modifications of the model which 10rill more
closely realize actual diode nonlinearities are considered.
Mixer is discussed for a vacuum tube triode mixer. Data taken on
a 6J4 triode mixer are compared to responses computed a previously
prediction
that the
tested.
applicable for diode mixers. This comparison indicates
is valid for vacuum tube mixers of the
2

III. PUBLICATIONS, LECTURES, REPORTS AND CONFERENCES
Mr. W. L. and Mr. E. W. Wood attended a field service seminar
sponsored oy the Hewlett-Packard Company on 20 Novemoer 1963 in Atlanta,
Mr. Guy Johnson and Mr. Sidney Weitz of USAELRDL, Fort Monmouth, New
Jersey, visited the Tech Experiment Station on 16-17 Decem-
progress and effort to that date were discussed.
Volume 9 of the Manuscript of Catalogue was forwarded to USAELRDL in
1964. This volume was concerned with "A Second Bioliography on Rad:io
Interference, With Aostracts,n and contained over aostracts,
su.nnnari.es, and references in the field of radio interference.
Mr. E. W. Wood attended the ''Symposium on Measurements- and
11 oy the U. S. Army Mi sile Command, in
Huntsville, Alaoama, on 4-6 Mr. Wood also visited the NASA
Marshall Space Flight Center EMC Division at the Redstone Arsenal on 6
Mr. R. D.
on 14
ities at
Jr. attended the Southeastern Simulation Council
the General Electric
1964. Mr. Trammell
3
at Cape Kennedy, Florida,
in a tour of the NASA facil-

IV. FACTUAL DATA
A. Receiver Tests
The following receiver te techniques and test resuJ..ts are di.scussed
in this intermodulation, spurious response,
and noise The tests descri.bed are the generally a quality
for most receivers but some are conducted using approaches which differ from
those employed. attention is given to the role of the re-
ceiver
tion of a
in receiver characteristics evaluation. With the excep
preselector curve, little data from receiver tests are
published in this sectionj rather, sis is on the
ed and on to avoid v.rhen the tests are conducted. The data for
the
be
and PCM/FM receivers used in the verificati.on of these tests wili
in volumes of the of Catalogue.
1. Intermodulation
Receiver intermodulation is the production of a spurious in
a receiver by two or more RF which differ in frequency from the
receiver tuned frequency. Upon reaching the receiver mixer (or other non-
linear elements), the or their harmonics mix. An unwanted and inter-
intermodulation response may be generated if the mix
at either the receiver intermediate frequency, the tuned
a signal
or the
image If the nonlinearity produces a at any other fre-
quency, the receiver intermodulation is generally of no consequence$
The intermodulation responses are identified by their order, i.e.,
total of the harmonic number the response. For
harmonic of one combines with the third harmonic of the other to
4

response, a fifth order intermodulation product resuJ..ts. Other
are s follows:
Let f = lower signal frequency a
f = tuned 0
(local oscillator - IF), or
= tuned image (local oscillator + IF), or
= IF
Then f = fb - f is 0 a a second order (primary mix) intermodu:ation
response;
= 2f a
is a third order intermodulation response;
f = 0
is a fourth order intermodulation response;
= is a fifth order intermodulation response.
intermodulation responses above the fourth order are not
to be of any consequence.
It is conceivable that the above type intermodulation mixes are not the
only ones These are based on the receiver mixer pro-
a difference rather than a summation when
on the two off-channel One su~ation type product was observed in
the laboratory on an FM test receiver which utilizes modulated tech-
The which excited this response were = 4939.88 Me and
= Me.
In this receiver the local oscillator frequency was measured to be
2160.01 Me.
+ = 4939. + 8136. = 13076.63 Me
5

(LO
The intermediate
) X 6 =
12960.
.01 X 6 =
.57 Me
.06 Me
of this wideband FM receiver ranges from
to .,5 Me; therefore, it appears that the sum of the two input
with the sixth harmonic of the local oscillator to a
mixed
in the
IF passband. The order of this intermodulation response is not defined by
the conventional methods of identification~
It should be noted that in order to "track" a difference type inter-
modulation it is necessary to both
in the same direction. With an additive type product it is necessary to
increase the of one signal and correspondingly decrease the fre-
quency of the other in order to track the response.
a. The Receiver Preselector and its Inter-
modulation Interference. A most important element in the of
i.ntermodulation responses is the receiver The
should have an insertion loss at the receiver tuned of
a few decibels and a loss than 70 db at all other frequencies~ As with
most microwave filters, this is not the case. The measured pre-
selector response of a PPM/FM receiver tuned to
18 The response to
maximum attenuation at 4.9 Gc. Secondary
to exist in the response curve at
ence of the spurious passbands in the
of intermodulation responses is enhanced.
6
Me is presented in
above 4 Gc increases to
passbands are seen
Because of the exist
response, the probability

0
5
10
::0 3 15 V') V')
0 _j
z 20 Q 1-0:: UJ 25 V')
~
0:: 0 30 1-u UJ _j
UJ 35 V')
UJ 0:: a...
40
45
50
55
60 0.1 0.2
TUNED FREQUENCY: 2040 Me
0.4 0.6 0.8 1.0 4.0 6.0
FREQUENCY kmc
1. Preselector Insertion Loss as a Function of Frequency for a PPM/FM Receiver.
8.0 10.0

From the curve it can be seen that there is an i.ncreased
possibility of a primary (2280 Me) intermodulation mix at
= 5000 Me and = 7280 Me. An intermodulation response was meas·urable
when these signals were at the receiver antenna terminals. A
number of such combinations resulting in intermodulation responses may be
observed to coincide near the spurious passbands in the preselector curve.
The fact -!:.;hat an intermodulation combination is possible does not
mean that the response will exist. However, the measured data were
found to indicate the most combinations giving rise to inter-
modulation responses in the receivers tested for a given signal
level.
At the the most reliable and accurate method known for plotting
a preselector response curve is that of by point data
and a response indicator such as a spectrum or
radio interference mea set. Swept oscillator and noise offer
faster but less accurate means of obtaining response data on filters wi.th
w:ide variations of attenuation.. It was found to be sufficient to plot only
the major variations in response as function of frequency in
order to its influence on intermodulation interference~
It should be noted that when such devices as were inserted in
the receiver antenna circuit, the input characteristics slightly;
however, the
desired i.n
was the dominating element. If extreme accuracy is
the (input) response, it would be advan-
tageous to connect all circuit test components to conducting this
test.
8

Two of the communications receivers of the same type which were examined
were found to be susceptible to intermodulation interference for 0 dbm input
ls. Two receivers of another type were found to reject intermodulation
interferences greater than 90 db under the same testing conditions. The lat-
ter receivers utilized low-pass filters which had a cutoff above
the maximum tuned frequency in the band, whereas the former receivers utilized
no low-pass filters. inserting low-pass filters in the antenna circuits of
these receivers, it was determined that the intermodulation rejection was more
than db at all greater than 100 Me from the tuned frequency in
the frequency range of 1 to 10 Gc. The receiver sensitivity was reduced less
than 1 db during this experiment.
b. Testing Techniques. The test configuration used to evaluate
the intermodulation characteristics of laboratory receivers is shown in
Figure 2. As indicated in the paragraph, it is advantageous to
study the preselector response curve to determine which intermodulation pro-
ducts are more to exist and over what range of frequencies. When
a response is detected the general
range and record~f:
is to "track" it over a wide
and the equal power setting for f a
and necessary to produce a standard receiver response. A sufficient
number of data points should be taken to plot a smooth curve of ~f as a func
tion of the power required to produce the response. The power levels
should be corrected for cable and other losses in order to yield the result
ing power at the receiver antenna terminal. The standard receiver response
for the present laboratory measurements is 6 db of receiver quieting.
(with an unmodulated input 1) as measured with a Hewlett-Packard Model
9

QUIETING INDICATOR
CW (VOLTMETER) SIGNAL
GENERATOR j
VIDEO (fa)
COAXIAL SWITCH OUTPUT ~---~-, RESISTIVE
I • I ADDER FM
I • I - RECEIVER
I u I ANT UNDER TEST
L. --- _ _I
CW SIGNAL
GENERATOR (fb)
FREQUENCY COUNTER
Figure 2. Block Diagram of Suggested Test Configuration for Receiver Intermodulation Evaluation.
QUIETING FREQUENCY - INDICATOR
COUNTER
'
COAXIAL SWITCH VIDEO 0 UTPUT r-- ..... ---, I 4~ I
SIGNAL - LOW-PASS I ... - I TEST GENERATOR FILTER I ; ANT RECEIVER
I L ____ ..J
Figure 3· Block Diagram of Suggested Test Configuration for Receiver Spurious Response Evaluation.
10

voltmeter. The 6 db of quieting level does not agree with the 20 db of
level in MIL-STD-449B; in order to obtain a refer-
ence for the receivers tested, the 20 db of reference was found to
be an ctical for the maximum output levels of the generators
used in the laboratory tests. However, it must be pointed out that the rejec-
tion ratios of ordered intermodulation products will differ when measured
with different reference levels.
Care must be taken to be certain that the observed intermodulation is
actually place within the receiver and not in the external circilit
components, such as
for the
confirm
generatorso A hybrid ring or directional
generators is one method commonly used to prevent or
intermodulation. It was found that an ar•r><..:>F'\'T'-l
method is that of placing appropriate filters in the external eire-edt -vrhen
the two differed more than a few hundred mega
As an example., suppose an intermodulation mix of 7000 Me and Me to pro-
duce a tuned of 2000 Me is to be A high-pass 3000 Me
filter in the :receiver antenna line would reduce any
2000 Me intermodulation product which inters the receiver. At many
generator frequencies
for use in the
combinations of filters can be obtained
and/or receiver antenna leads to prove the existence
of receiver intermodulation responses. It appears sufficient to show that
a response is actually caused by receiver intermodulation at only one or
two points along a given tracking range
modulation is found.
Each time an intermodulation response is
no trace of external inter-
it is necessary to
ascertain that the response is not a receiver spurious response to one of
11
the signal fre s. This can be checked noting whether the level of
the response changes with power level changes on both generators. A true
intermodulation response will be affected by power level changes in either of
the signals, whereas a spurious response level will be affected by a change in
level of only one generator. For this reason it is advantageous to conduct
receiver response measurements prior to intermodulation tions
in order to determine the range of a frequency in which spurious responses
are most
2.
responses are unwanted receiver responses caused by the
local oscillator or its harmonics mixing with an external l or its bar-
moni.cs to prod"U.Ce the receiver intermediate frequency. The harmonics of
the external 1 are not present at the receiver antenna terminal but
are in some nonlinear element within the receiver, such s the re-
ceiver mixer. Genera spurious response are given the fol-
relation:
f sr
where f , r1
, f.f are spurious response sr o l local oscillator fre-
quency, and intermediate respectively. The symbol (p, q,
represents the order of the harmonics of the local oscillator and external
l and conversion process which produces the intermediate
a. The Preselector. As in an intermodulation response investiga-
the receiver preselector was found to an important role in
12

response evaluation for the receivers tested. An examination of the
of a response. Initially, it is advantageous to search for
responses '\vhere there are passbands rather than scan-
ning a very large frequency range.
Since the receivers tested had no RF amplification to the mixer
stages, the response rejection depended on the
response, response and mixer conversion loss at the in
question. Therefore, for the (2, 1, ±) response which may have a
2 conversion loss of only 9 db, the and must contribute
the ma attenuation characteristics. For one receiver the (2, 1, +)
response rejection was 46 db, and the combined and
attenuation was measured to be db at the spurious
In many cases, the spurious responses could be predicted within 6 db with
of mixer behavior and attenuation characteristics of the
the mixer
b. Testing Techniques. The test configuration for
response meas~rements is shown in 3. A low-pass filter should be used
as shown in order to eliminate harmonics of the spurious response test
that are at the output. It is desirable to
mea sure the frequency response on the lo-vr-pass filters used in the mea sure-
ment setup to determine if spurious passbands exist in these filters which
could cause false spurious responses. Many low-pass filters have attenuation
characteristics, as near the filter cutoff but exhibit
low and fluctuating attenuation characteristics at
13

The and power to produce a standard response should
be recorded i.n this test. The standard response level used in the laboratory
tests wa 6 db of receiver since a maximum of +2 dbm of signal
power was available over the frequency range from 1.25 to 10 Gc.
The spurious response ection data 20 db of is
to different results because of the difference in the nonlinea order
of each response. For two receivers tested at a tuned frequency there
were only six spurious responses that were measurable between 0.
l.O Gc with the following power levels available:
Frequency range Available
o. - 65 Me + 23 dbm
- 450 Me + 13 dbm
- 1250 Me + 7 dbm
1.250 - 10 Gc + 2 dbm
Me to
These receivers utilized a and low-pass filter to achieve these
results. The image response, 120 Me from the tuned frequency, was not
detected. For each of two other receivers tested, over spurious response
data points were recorded for a given tuned frequency under the same condi-
tions. The
frequency.
A TWT
response wa db at 240 Me from the tuned
has been ordered which will provide sufficiently
power to excite the other spurious responses at frequencies where the pre-
selector attenuation effects.

The l shape of the spurious responses should also be known
to measuxing the spurious responses of wideband receivers. The
is useful in the identification process.
and Noise
is a measure of how well a receiver is able to
undesirable ls which are very near the tuned The selectivity
characteristics of a receiver are primarily by the res-
ponse and the bandwidth of the intermediate amplifier. The the
the greater the rejection of off channel ls; however,
in a frequency modulation receiver the
must be ma i.nta ined wide enough to
modulated carrier ..
cover the
response and IF bandwidth
excursions of the
In the receivers the receiver passband was not flat, and detailed
measurements were necessary to define the The active AFC circuits
were disabled these measurements. The influence of the presence of the
counter was found to be
The test configuration used for ma selectivity measurements is shown
in 4. For the receivers tested, readings were made of the difference
between the nominal tuned frequency and the test frequency, and of the power
to produce a standard response at the test frequency. It was neces-
sary to measure all
was limited. A
necessity.
accurately since the selectivity passband width
with a vernier frequency dial was found to be a
Receiver sensitivity is a measure of the minimum signal required at the
antenna terminal to produce a given response at the receiver output. This
test is conducted at the tuned frequency.
15

FREQUENCY COUNTER
SIGNAL GENERATOR
r--~--,
I u I I _ _ I I - - I I I L ____ ..J
COAXIAL SWITCH
QUIETING INDICATOR
VIDEO 0 UTPUT
TEST ANT RECEIVER
Figure 4. Block Diagram of Suggested Test Configuration for Receiver Selectivity Measurements.
QUIETING INDICATOR
VIDEO 0 UTPUT
SIGNAL TEST GENERATOR ANT RECEIVER
Figure 5· Block Diagram of Suggested Test Configuration for Receiver Sensitivity Measurements.
TERMINATION
r{ I NOISE ~ SOURCE
'---NOISE
FIGURE ANT"- TEST
METER IF RECEIVER
Figure 6. Block Diagram of Suggested Test Configuration for Noise Figure Measurements.
16

The test used for making receiver sensitivity measurements
i.s shown in 5. This test should be made at several in the
tuning range of the receiver. The power, corrected for losses to the antenna
terminal, necessary to produce the standard response should be recorded. Care
should be taken to adjust the signal frequency to the center of the
passband since the passband may be multipeaked with the
response levelso
having different
The receiver noise figure is defined as the ratio of the available input-
to-output l to noise power ratios. It is measure of the degradation
in ratio of a signal with a receiver. Noise generated in the
first or second RF stages in the receiver contribute most to the noise
since noise generated in these is more than noise
in later
The noise figure measurement configuration used is shown in 6.
Measurements have been made on wideband communications receivers using an
Airborne Instruments laboratory Automatic Noise-Figure Indicator. It was
found that the comparison of noise figure data and sensitivity data showed
that poor noise data were obtained at where poor sensi-
tivity data were recorded and better noise figure data were recorded at fre
where the receiver was more sensitive. The input to the receiver
was made at the antenna terminal and the output was taken from the pre-IF
amplifier. Any convenient point in the IF amplifier stage is satisfactory
for the output since additional stages of IF amplification will not appre-
ciably affect the noise figure. The shortest cable should be used
from the noise source to the receiver since cable attenuation will yield an
17

erroneous noise reading. An a:pproxi:rnate attenuation correction can 'be
made subtracting the cable attenuation in decibels from the noise figure in
deci.bels as read from the noise figure meter.. This is a good approximation
for cable attenuation values less than 10 :per cent of the noise figure meter
reading~ Measurements with the receiver tuned to several different channels
should be made. The instruction manual should be consulted for
instructions for the noise meter ..
B.. Mixer and Evaluation
1~ Introduction
The search for a method which the spurious responses in receiv-
may be accura calculated usually results in the
'ing problem. of obtaining a usable mathematical model which will represent
the mixer characteristic. Since no finite model has been found which
will adequa represent the of a nonlinear device, the investi
form of infinite series to express the mixer gator is forced to resort to
cu.:rve mathematicallyo
Considerable effort has been in :previous of
mixer the :power series .3-5
+ "" .. + + ....
as a :mathematical model of the mixer characteristic. The :prediction method
developed was derived from this approach, and so far has proved to
be a simple and means of predicting spurious response formation

in the particular experimental mixer circuits tested. However, efforts to
calculate the absolute values of responses using this representation have not
been successful, primarily because of difficulties in obtaining the proper
coefficients of the terms in the expansion. Experimental data on various mixer
configurations have shown that the amplitudes of the harmonics and responses
are a function of bias voltage, and no approximating polynomial has been
found which will yield this phenomenon.
Ah alternate approach to the problem of expressing mixer action mathe-
matically is that of representing the mixer characteristics by a trigonometric
or Fourier series. Since previous studies have indicated that spurious response
formation is a function of harmonic generation in the mixer, efforts have
been expended toward the derivation of a mathematical harmonic generator.
Agreement between the experimental data and the calculated harmonic values
when using an ideal diode as a basic model indicate the possibilities of
this approach as a means of representing mixer operation.
2. Calculated and Measured Data
The characteristic curve of an ideal diode is shown in Figure 7.
For the input e. = B + A sin rnt, the output will be a series of current ln
pulses whose amplitude is dependent upon the bias voltage B and slope of
the ideal characteristic k, and whose width is dependent upon B. If one
expresses this waveform as a Fourier series, the amplitude of the coefficients
of the harmonic terms may be represented by:
c = p
2k.A 1(
sin pa cos a - p sin a cos pa
p(p2 - 1)
where a= ; T, T T -1 -B
= rr cos A
19

[\) 0
I I
ein = B + A sin ((t)t)
\ I \ I \ It \ I \ I \ I
\ I \ I ..... ,
Figure 7. Ideal Diode Operation for Sinusoidal Input Plus Bias Voltage.
\ \ \ \ \ \
' '

and p = 1, 2, 3, · · ·
Figures 8 through 11 represent the calculated power level of various harmonics
as a function of the ratio of bias voltage to peak sinusoidal input, for A= 0.3
volts and a value of k = k1
on the curve of a 1N21B diode as shown in Figure 12.
The calculated power level is expressed in dbm which excludes the phase relation
of C , the harmonic output voltage. The curves are symmetrical about the point p
B/A = 0, the point at which the odd order harmonics are zero and the even order
harmonics are at a maximum. The curves are nonexistent for IB/AI ~ 1, which is
expected in view of the representation in Figure 7. Considering the points
jB/AI = 1 to be nulls, it is seen that the number of nulls appearing in a partie-
ular harmonic C is equal to p. For a given sinusoidal and bias voltage input, p
the amplitude of the output harmonics are entirely dependent upon the slope of
the ideal diode curve, and the change 6k in this slope results in an identical
change in the amplitude of each harmonic. Thus the relative amplitude between
successive harmonics does not change with variations in k.
Figure 12 represents the E versus I curve of the simple 1N21B diode mixer
circuit shown in Figure 13. Data for this curve were taken with an applied
sinusoidal peak voltage input of 0.3 volt which results in the characteristic
having a nonzero value for zero bias. The measured harmonic levels as a func-
tion of bias for this mixer are shown in 14 through 17. Except for a
shift in the abscissa scales, these curves are very similar to those obtained
by calculation, with the absolute amplitudes and the distances between null
points being approximately the same in both cases. However, it should be noted
that the close agreement obtained here is not only dependent upon the slope
selected for the ideal diode curve, but also requires a knowledge of the shift
in abscissa scale. No logical basis for deriving these values has been
determined.
21

e ...0
~
..J w > w ..J
0 w t-<(
l\) ..J l\) :::::J
u ....J <( u
-10
-20
-30
-40
-50
-60
-70
-80
-90
-100
-0.6 -0.4 -0.2 0
B/A
+0.2
Figure 8. Calculated Level of 2nd·Harmonic Versus B/A Where B = Bias Voltage Input and A = Peak Amplitude of Sinusoidal Input.
+ 1.0

-10
-20
-30
-E -40 ..Q
~
_J w > -50 w _J
0 w -60 1-<(
/\) _J
\.N ::J u _J -70 <( u
-80
-90
-100
-1.0 -0.8 -0.6 -0.4 -0.2 0
B/A
+0.2 +0.4
9· Calculated Level of 3rd Harmonic Versus B/A Where B = Bias Voltage Input and A = Peak Amplitude of Sinusoidal Input.

-10
-20
-30
-E ...Q -40 3 ...J w > -50 w ...J
0 w
-60 t-< ...J ::J u ...J -70 < u
-80
-90
-100
-1.0 -0.8 -0.6 -0.4 -0.2 0
B/A
+0.2 +0.6
Figure 10. Calculated Level of 4th Harmonic Versus B/A Where B ; Bias Voltage Input and A; Peak Amplitude of Sinusoidal Input.
+0.8 + 1.0

-10
-20
-30
-E ...Q -40 3 _J w > --50 w _J
0 w
-60 1-<( _J
[\) ::::::> Vl u
...J -70 <( u
-80
-90
-100
-1.0 -0.8 -0.6 -0.4 -0.2 0
B/A
+0.6
Figure 11. Calculated Level of 5th Harmonic Versus B/A Where B = Bias Voltage Input and A= Peak Amplitude of Sinusoidal Input.
+0.8 + 1.0

1\) 0\
--0.6 -0.5
I (ma)
-0.4 -0.3 -0.2 -0.1 0 +0.1 +0.2 +0.3 +0.4
BIAS VOLTS
Figure 12. Diode Current Versus Bias Voltage for 1N21B Diode in the Circuit of Figure
+0.6 +0.7

GENERATOR 10 Me
BIAS
1N21B
FILTER H
Figure 13. Diagram of Test Mixer Circuit.
RADIO INTERFERENCE MEASURING SET

-10
-20
-30
e ...0
-40 3 _J w -50 > w ....J
0 -60 w Q:
I\) :::> 1.1)
m <( w -70 :E
-80
-90
-100
-0.8 -0.6 -0.4 -0.2 0 +0.2 +0.4 +0.6 +0.8 +1.0 B/A
Figure 14. Measured Level of 2nd Harmonic Versus B/A Where B = Bias Voltage Input and A= Peak Amplitude of Sinusoidal Input.
+1.2 +1.4

-10
-20
-30
e -40 ..a ~
...J w -50 > w ...J
Q -60 w
~ :::>
1\) V)
<( \.0 w -70
~
-80
-90
-100
-0.8 -0.6 -0.4 -0.2 0 +0.2 +0.4 +0.6 +0.8 + 1.0 B/A
Figure 15. Measured Level of 3rd Harmonic Versus B/A Where B = Bias Voltage Input and A = Peak Amplitude of Sinusoidal Input.
+ 1.2 + 1.4

-10
-20
-30
'E -40 ..0
3 ..J w -50 > w ..J
Q -60 w
0::
\.N ~ V')
0 ..q: w -70 ::E
-80
-90
-100
-0.8 -0.6 -0.4 -0.2 0 +0.4 +0.6 +0.8 +1.0 B/A
Figure 16. Measured Level of 4th Harmonic Versus B/A Where B = Bias Voltage Input and A = Peak Amplitude of Sinusoidal Input.
+1.2 +1.4

-10
-20
-30
e -40 ..Jl
3 _J w -50 > w _J
0 -60 w
a::: :::l
\J.J tl)
f-' <( w -70 ::E
-80
-90
-100
-0.8 -0.6 -0.4 -0.2 0 +0.2 +0.4 +0.6 +0.8 + 1.0 B/A
Figure 17. Measured Level of 5th Harmonic Versus B/A Where B =Bias Voltage Input and A= Peak Amplitude of Sinusoidal Input.
+1.2 + 1.4

As discussed previously, the value of k used in the har-
monic levels was selected from the E versus I curve of 12. The
value k1
was used in the actual computations, while k2 was determined to be
the value which calculated harmonic amplitudes equal to the measured
amplitudeso The significance of this particular value of k2 has not been
and further investigation is being conducted in order to deter-
mine its upon diode parameters and/or signal levels.
It can be seen from 12 that the larger the sinusoidal
signal the more closely the diode curve approaches an ideal characteristic
to the signal input). as the signal level is decrea
the nonlinear portion of the curve is predominant. 18 shows the
response of the ci.rcuit in Figure to a sinusoidal It is seen that
this response is more approximated by (coswt)2 pulse or a (coswt) 3
rather than a (coswt) A study of this waveform by the Fourier
series approach has been initiated in order·to determine its value as a rrillthe-
matical model of mixer operation. A mixer study6
the modified
Bessel function of the first kind has also been reported.
Conclusions
The Fourier series approach to the of ana mixer
action has yielded a mathematical model, the operation of which can be
clo correlated with that of a 1 diode mixer. the finite
model used was only an approximation of the actual mixer characteristics,
the promising results obtained warrant further investigation using this
approach, and effort has begun toward the derivation of a model which will
also realize the nonlinearity of the diode curve.

-TT
A cos wt
-rr/2 0 +rr/2
Figure 18. Response of the Mixer Circuit in Figure 13 to a Sinusoidal Input.
wt
+rr

Ca Response Prediction of Triode Mixers
1. Introduction
toward a study of diode mixers. An accurate technique to predict the
spurious responses of a diode mixer with a minimum amount of labors-
tory measurements has been demonstrated. 7 During the current quarter this
has been evaluated for applicability to triode mixers.
2 Q Triode Mixer Theory
The mixer circuit used in the is shown in
The local oscillator which has an
to the control grid of the 6J4 tube. This voltage,
19.
rn is sup~ o'
with
the bias voltage it produced grid is suffieient to reduce
the current to a smaJ..l value or even cut it off for an appreciable
part cf the cycle" The oscillator voltage thus controls the
grid-to-plate transconductance, g , in the manner shown in Figure 20~ The m
transcond~ctance between the and is therefore a time va
quantity that varies periodically at the oscillator frequency.
In the mixer of the voltage is supplied in the cathode
circ;J.it; thus, the current is proportional to the signal
difference between the grid and the cathode. Since the signal voltage e s
is much smaller than the oscillator voltage, it has no appreciable
effect on the instantaneous value of g • The varying component of the plate m
current produced by the simultaneous presence of the oscillator and l
voltages is given approximately by:

\.)'J \.n
PLATE
VOLTAGE o--------..J TEST POINT
L.O. O.lpf
INPUT ~ son
S6n
TEST POINT son
SIGNAL INPUT son
l 0. lpf
330k
1820flflf
6J4
390n
660
6.3 V AC.
Figure 19. Mixer Schematic.
0. lpf 5.6k
O.lpfi
I.F. ~OUTPUT
son
PLATE
lOOk BIAS

OSCILLATOR ELECTRODE VOLTAGE
E m
w u z
w< t-t<(u ...J:::J
a..~ oO t-~ oz _<( ~~ <.:>t-
Figure 20. Time Varying Transconductance Between the Grid and Plate of a Triode Mixer Tube.

here both e and g are functions of time. s 'lll
If the oscillator voltage is represented as a cosine wave in Figure 20,
the transconductance is an even periodic function and may be
the Fourier series:
= a + 0
cos (1) t + 0
cos 2w t + · • • 0
The signal voltage may be represented as a pure cosine wave:
e = A cos w t s c
where w is the carrier angular frequency. The varying component of the c
current is then:
i = a A cos w t + A cos (w - w )t c 0 p 0 c
2
2
a2 A cos (rn + w )t + -- A cos (w - 2w )t
c 0 2 c 0 +
2 A cos (rn + 2w )t + •·•
c 0 +
by
The plate current equation for triode mixers is characteristic of the
equations presented in earlier reports for diode mixers. Although differences
exist in the absolute values of the coefficients of the terms, the predic-
tion technique makes allovrances for these differences s.ince the predicted
response levels are computed relative to selected measured response levels.
3. Data Evaluation
The test configuration used in obtaining the response data is
illustrated in Figure 21. The responses were first measured without the
10 db pad in the signal input. Several measured responses differed from their
37

SIG. GEN.
LOCAL osc.
RADIO SWITCH INTERFERENCE - MEASURING SET
SWITCH 10 db LOW-PASS IF OF 1 Me RADIO MIXER INTERFERENCE
PAD FILTER MEASURING SET
~
10 Me AT + 20 dbm LOW-PASS PLATE
FILTER VTVM VOLTAGE TEST
DC BIAS
SOURCE
Figure 21. Block Diagram of the Test Configuration Used to Measure Triode Mixer Responses.

predicted values by more than 7 db. This was found to be caused by inter
modulation products which were eliminated by the addition of the 10 db pad
between the signal generator and local oscillator. Figure 22 shows prediction
error as a function of response density with the 10 db pad inserted. All
responses through the tenth order of generation were predicted and found to
be within 3.5 db of the measured value except the (1, 8 ±) and (1, 9 ±)
responses. The signal input frequencies necessary to these two
responses are 1.375 Me and 1.22 Me, respectively. With the oscillator of
21 disconnected and the signal generator set for the standard response
level at 1.22 Me, an output of -108 dbm was obtained on the Radio Interfer
ence Measuring Set when the latter was tuned to 1 Me. An output of -120 dbm
was obtained in a similar manner for 1.375 Me. This indicates that the
signal input frequencies necessary to generate the (1, 8 ±) and (1, 9 ±)
responses are within the passband of the Radio Interference Measuring Set
when it is tuned to 1 Me, thereby causing excessive errors for these two
responses.
A 6J4 triode grounded-grid mixer was constructed and an attempt was
made to collect data. This mixing technique did not prove satisfactory
because the signal generators used to supply oscillator and signal voltages
in the cathode circuit were not capable of developing an adequate voltage
difference between the grid and cathode to produce proper mixing action.
4. Conclusions
Although extreme case was exercised in obtaining the data, it is
believed that errors of as much as 3 to 4 db exist between the measured and
calculated responses because of possible accumulation of equipment and
39

13
12 TRIODE: 6J4 L.O. LEVEL: + 20 dbm SENSITIVITY: - 110 dbm
11 I.F. FREQUENCY: 1 Me TUNING: Output to 1 Me
10 L.O. FREQUENCY: 10 Me PLATE VOLTAGE: + 100 v
9 CROSSHATCHED: True Density DASHED: Density Integral
>- 8 t-v; z w 7 0
w V')
6 z 0 a..
+:- V')
w 5 0 c::
4
3
2
-11 -10 -9 -8 -7 -6 -5 -4 -3 -2 -1 0 +1 +3 +4
PREDICTION ERROR (db)
Figure 22. Response Density Versus Prediction Error for 6J4 Triode Mixer.

. 8 t measurement errors. The da a in 22 indicate that the
is highly accurate for triode mixers of the type shown
in Figure However) other vacuum tube configurations should be examined
before a statement can be made about all vacuum tube mixers. Ap-
plicability of this technique to mixers of multigrid configurations and to
mixers transistors and tunnel diodes will be investigated as a part of
41

V. CONCLUSIONS
The verificati.on test results of standard tests conducted on available
U .. S. Army cormnunications receivers show that powered signal generators
are required to excite and measure spurious and intermodulation responses at
where the receiver exhibits high attenuation effects.
On the other hand, preselectors on certain receivers exhibited many spurious
passbands which cause these receivers to be highly vunerable to spurious re-
sponse and intermodulation interference above the tuned These pro-
blem.s were reduced in other examined receivers which ulitized low-pass filters
witb cutoff above the receiver tuning ranges. The spurious response
data co~ld be closely estimated from the measured preselector response charac-
teristi.cs and recorded mixer conversion loss data.
The Fourier series approach to the ana of mixer action has
a mathematical model, the operation of which compares with that of a
1 diode mixero The results obtained indicate that a similar approach
whi~h would incorporate the nonlinearity of the diode curve may be promising.
The mixer response prediction technique for diode mixers discussed in
previous reports was used to predict the responses of a vacuum tube
triode mixero The results indicate that the technique is equa valid for the
mixer type examined. However, other vacuum tube configurations such as multi
' as well as mixers using transistors or tunnel diodes,
should be tested before the general application of the prediction technique
can be evaluated.
42

VI • PROGRAM FOR NEXT INTERVAL
The next quarter's effort will be concentrated on the completion and
documentation of all previously examined equipment interference tests and
test procedureso
The tests, test procedures, and testing techniques and pitfalls for
obta interference characteristics of U. S. Army communications equipments
which utilize modulation techniques will be submitted in a volume of the
Manuscript of Catalogue.
Several volumes of the Manuscript of Catalogue will be published
which will contain the data collected in the verification tests conducted
on the AN/TRC-29, AN/TCC-13, AN/GRC-50, and AN/FRC-34 communications equip
ments ..
All pertinent mixer data, a , and materials during
the course of the contract will be combined in one volume of the Manuscript
of Catalogue. Work on transistor and vacuum tube mixers during this quarter
will also be included in this volume.
43

VII. IDENTIFICATION OF TECHNICAL PERSONNEL
Name Title Approximate Hours
E. E. Donaldson, Jr. Grad .. Research Assistant
J. H. Jv18ckay Research Mathematician 2
0. H. Ogburn Research Assistant 416
I. E. Perlin Research Professor 2
w. L .. Research Assistant 420
D. w. Robertson He a Connnunications Branch 48
P .. T. Grad. Research Assistant
c. w. Stuckey Asst. Research 418
R. D. rr'r a:mme 11 J Jr. Asst. Project Director 414
J .. R. Walsh, Jro Research Engineer
w. B. Warren, Jr. Research Engineer 12
E. w. Wood Project Director 364
44

VIII . REFERENCES
le Measurement of Radio Frequency Spectr·wm Characteristics, Military Standard7
MIL-STD-449B_, (1963) ~
2. E. We Wood, R. Do Trammell, Jro, C. W. Stuckey, H. W. Denny, E. E. Donald-son, Jr .. J and R. M. Cook, "Quarterly No. 1, Project A-678, '' Elec-tronic Equipment Interference Characteristics-Communication Type, Contract No. DA 36-039 AMC-02294(E), Georgia Institute of Technology, Engineering Experiment Station, p. 90, ( February 1963 to May 1963)8
3. R. N. Ba Ec W. Wood, Ro D. Trammell, Jr., and J. R. Walsh, Jr., l. Technical Report, Project A-543," Electronic Equipment Interference
Characteristics-Communication Type, Contract No. DA 36-039 sc-87183, Georgia Institute of Technology, Engineering Experiment Station, pp. 58-89, (l 1961 to 15 February 1963).
4. Wood, et al, loc cit.
5. E. Jo Lefferts and W. M. Rise, Report No. 1, Interference Reduction Techniques for Nonlinear Devices, Contract DA 36-039 AMC-02200(E), Martin Company, (l April 1963 to 30 June 1963).
"Intermodulation 2, PPo 173-179, (
of Crystal Mixer, 11 Proc. 1964)., ----
7Q R. D. Trammell, Jr., C. W. Stuckey, E. W. Wood, 00 He Ogburn, and E. E. Dona Jr .. , "Quarterly Report No.2, Project A-678," Electronic Equip~ ment Interference Characteristics-Conrrnunication Type, Contract No. DA 36~039 AMC-02294(E), Georgia Institute of Technology, Engineering
Station, pp. 35-37, (15 May 1963 to 15 August 1963).
8. Trammell, loc cit.

No .. of Copies
1
1
1
3
20
1
1
1
2
l
1
l
l
l
l
DISTRIBUTION LIST
To
OASD (R&E), Rm 3El065, ATTN: Technical Library, The Pentagon, Washington 25, D. C.
Chief of Research and Development, OCS, Department of the Army, Washington 25, D. C.
Commanding General, U. S. Army Materiel Command, ATTN: R & D Directorate, Washington 25, D. C.
Commanding General, U. S. Army Electronics Command, ATTN: AMSEL-AD, Fort Monmouth, N. J.
Commander, Defense Documentation Center, ATTN: Cameron Station, Bldg. 5, Alexandria, Virginia
TISIA, 22314
Commanding Officer, U. S. A. Combat Developments Command, ATTN: CDCMR-E, Fort Belvoir, Virginia
Commanding Officer, U. S. Army Combat Developments Command, Communications-Electronics Agency, Fort Huachuca, Arizona
Commanding Officer, U. S. Army Electronics Research and Development Activity, ATTN: Technical Library, Fort Huachuca, Arizona
Chief, U. S. Army Security Agency, Arlington Hall Station, Arlington 12, Virginia
Deputy President, U. S. Army Security Agency Board, Arlington Hall Station, Arlington 12, Virginia
Director, U. S. Naval Research Laboratory, ATTN: Code 2027, Washington 25, D. C.
Commanding Officer and Director, U. S. Navy Electronics Laboratory, San Diego 52, California
Aeronautical Systems Division, ATTN: ASNXRR, Wright-Patterson Air Force Base, Ohio 45433
Air Force Cambridge Research Laboratories, ATTN: CRZC, L. G. Hanscom Field, Bedford, Massachusetts
Air Force Cambridge Research Laboratories, ATTN: CRXL-R, L. G. Hanscom Field, Bedford, Massachusetts

No. of Copies
l
1
l
l
l
1
l
l
1
4
l
1
1
DISr:f.1HIBUTION LIST (Continued)
To
Hq, Electronic Systems Division, ATTN: ESTI, L. G. Hanscom Field, Bedford, Massachusetts 01731
Rome Air Development Center, ATTN: RAALD, Griffiss Air Force Base, New York
AFSC Scientific/Technical Liaison Office, U. S. Naval Air Development Center, tTohnsville,
USAELRDL Liaison Office, Rome Air Development Center, ATTN: RAOL, Griffiss Air Force Base, New York
Commanditlg Officer, U. S. Army Electronics Materiel Support Agency, ATTN: SELMS-ADJ, Fort Monmouth, New Jersey
Director, Monmouth Office, U. S. Army Combat Developments Command, Communications-Electronics Agency, Fort Monmouth, New
Commanding Officer, Engineer Research and Development Laboratories, ATTN: Technical Documents Center, Fort Belvoir, Virginia
Marine Corps Liaison Office, U. S. Army Electronics Research and Development Laboratories, Fort Monmouth, N. J.
AFSC Scientific/Technical Liaison Office, U. S. Army Electronics Research and Development Laboratories, Fort Monmouth, New
Commanding Officer, U. S. Army Electronics Research and Development Laboratories, ATTN: Logistics Division, Fort Monmouth, New Jersey, (MARKED FOR: GUY JOHNSON)
Commanding Officer, U. S. Army Electronics Research and Development Laboratories, ATTN: SELRA/DE, Fort Monmouth, New Jersey
Commanding Officer, U. S. Army Electronics Research and Development Laboratories, ATTN: Technical Documents Center, Fort Monmouth, New
Commanding Officer, U. S. Army Electronics Research and Development Laboratories, ATTN: SELRA/GF, Fort Monmouth, New Jersey

No. of Copies
l
l
1
l
1
1
l
DISTRIBUTION LIST (Concluded)
To
Commander, Rome Air Development Center, Griffiss Air Force Base, New York, ATTN: EMCVR (C. R. Miller)
Chief, Bureau of Ships, Dept. of the Navy, Washington 25, D. C. ATTN: Code 452 (Mr. Roman)
Director, Electromagnetic Compatibility Analysis Center, ATTN: ACX (Lt. Col. John A. Gahr), U. S. Navy Marine Engineering Laboratory, Annapolis, Maryland 21402
Commanding Officer, U. S. Army Electronics Research and Development Laboratories, ATTN: SELRA/GFA, Fort Monmouth, New
Commanding Officer, U. S. Army Electronics Research and Development Laboratories, ATTN: SELRA/GFR, Fort Monmouth, New Jersey
Commanding Officer, U. S. Army Electronics Research and Development Activity, ATTN: FC-05, White Sands, New Mexico
IIT Research Institute, ATTN: Mr. J. T. Ludwig, 10 W. 35th Street, Chicago 16, Illinois

REPORT NO. 26
QUARTERLY REPORT NO. 5
PROJECT A-678
ELECTRONIC EQUIPMENT INTERFERENCE CHARACTERISTICS-CO~JICATION TYPE
C. W. Stuckey, R. D. Trammell, Jr., and E. W. Wood
Contract DA 36-039 AMC-02294(E) (Continuation of Contract DA 36-039 sc-87183) DEPARTMENT OF THE ARMY PROJECT: lG6-2050l-D-449
15 February 1964 to 15 July 1964 Issued 15 July 1964
Prepared for U. S. Army Electronics Laboratories Fort Monmouth, New Jersey
Engineering Experiment Station
GEORGIA INSTITUTE OF TECHNOLOGY Atlanta, Georgia
REVIEW~ P·".-,- .·-;· IT {)- ~('./ ,, ; ::,\, ... 6 ..... 1. ..... 19 .. (e;'!.': BY .. 7li:. ........ _ ..... . F·Q· OI\ ,-''T ~l· .-K /t
t\ 11J ) /"1 u " .. , ................... 19 ....... BY ................••
lib-sascan
Rectangle

GEORGIA INSTITUTE OF TECHNOLOGY Engineering Experiment Station
Atlanta, Georgia
REPORT NO. 26
QUARTERLY REPORT NO. 5
PROJECT A-678
ELECTRONIC EQUIPMENT INTERFERENCE CHARACTERISTICS-COMMUNICATION TYPE
By
C. W. Stuckey, R. D. Trammell, Jr., and E. W. Wood
CONTRACT NO. DA 36-039 AMC-02294(E) (Continuation of Contract No. DA 36-039 sc-87183) DEPARTMENT OF THE ARMY PROJECT: 1G6-2050l-D-449
The object of this research program is to conduct a comprehensive investigation to determine methods for measuring the interference characteristics (spectrum signature) of U. S. Army communications equipment deemed necessary for the prediction and minimizing of electromagnetic interference.
15 FEBRUARY 1964 to 15 JULY 1964 Issued 15 July 1964
Performed for U. S. ARMY
ELECTRONICS LABORATORIES FORT MONMOUTH, NEW JERSEY

FOREWORD
This report was prepared at the Georgia Tech Engineering Experiment Sta-
tion on Contract No. DA 36-039 AMC-02294(E). The report covers the activity
and results of the fifth quarter's efrort on a project to conduct a feasibil-
ity study and investigation to determine methods for measuring the interfer-
ence characteristics (spectrum signature) of U. S. Army pulse modulated type
communications equipment deemed necessary for the prediction and minimizing of
electromagnetic interference.
Appro~ed: ./J
~.?J.,ca~ D. W. Robertson, Head Communications Branch
ii
Respectfully submitted:
E. W. Wood Project Director
lib-sascan
Rectangle
lib-sascan
Rectangle

TABLE OF CONTENTS
I. PURPOSE •
II. ABSTRACT
III. PUBLICATIONS, LECTURES, REPORTS, AND CONFERENCES
IV. FACTUAL DATA
A~ Pulse testing of a typical FM/PCM system
1. Error detection system
2. Effects of receiver tuning on error rates •
a. Test procedures ••• b. Test results
3. Effects of interference on error rates
a~ CW interference tests • b. AM interference tests • • c. FM interference tests
4. Conclusions •
B. Spurious response and intermodulation predictions in cavity-crystal receivers • • • • . •••
1. Introduction
2. Measurement techniques
3. Calculation techniques
4. Experimental results
5. Simplification measures •
6. Advantages and disadvantages of prediction
7. Conclusions and recommendations
C. Summary of publications during the contract period from 15 February 1963 to 15 July 1964 •••••
1. Report No. 22, Quarterly Report No. 1, 15 February 1963
Page
l
2
3
5
5
9
9 L3
15
17 29 36
47
48
48
49
52
57
66
70
71
72
to 15 May 1963, (Confidential) • • • • • . • 72
(Continued)
iii

2.
3.
4.
TABLE OF CONTENTS (Continued)
Report No. 23, Quarterly Report No. 2, 15 May 1963 to 15 August 1963, (Unclassified) ••••
Report No. 24, Quarterly Report No. 3, 15 August 1963 to 15 November 1963, (Unclassified) ••••
Report No. 25, Quarterly Report No. 4, 15 November 1963 to 15 February 1964, (Unclassified) ••
5. Manuscript of Catalogue, Volume 9, "A Second Radio Frequency Interference Bibliography, With Abstracts,"
Page
73
73
74
1 December 1963, (Unclassified) • • • • • • 75
6. Manuscript of Catalogue, Volume 10, "Methods for Measuring and Processing the Interference Characteristics of Communications Equipments Operating in the 1 to 10 kMc Range," 15 July 1964, (Unclassified) • • • • • • • • 75
7. Manuscript of Catalogue, Volume 11, "Mixer Interference Characteristics," 15 July 1964, (Unclassified) • • • • • 76
8. "Manuscript of Catalogue, Volume 4oo, "Interference Characteristics of Radio Set AN/~C-29 and Multiplexer Set AN/TCC-13,'' 15 July 1964, (Secret) • • • • • • • • • • 77
9. Manuscript of Catalogue, Volume 401, "Interference Characteristics of Radio Set AN/GRC-50," 15 July 1964, (Confidential) • • • • • • • • • • • • • • • • • • 77
10. "Manuscript of Catalogue, Volume 402, "Interference Characteristics of Radio Set AN/FRC-34,1! 15 July 1964, (Secret) • • • • • • • • • • • • • • • • • • • • • • • 77
11. "Mutual Interference Chart (MIC) (AN/VRC-12 Transmitter and AN/PRC-25 Receiver), 11 submitted to the Electromagnetic Environment Division, USAEL, 15 April 1964, (Unclassified) • • • • • • • • • • • • • • • • • 77
12. "Lash-Up Output Data (AN/VRC-12 and AN/PRC-25 Equipm~nts)," submitted to the Electromagnetic Environment Division, USAEL, 15 April 1964, (Unclassified) • • • • 78
13. "Mutual Interference Chart (MIC) and Lash-Up Exercise," submitted to the Electromagnetic Environment Division, USAEL, 24 April 1964, (Unclassified) • • • • 78
(Continued)
iv

14.
15.
TABLE OF CONTENTS (Concluded)
"The Behavior of Nonlinear Mixing," Proceedings of the Ninth Tri-Service Conference on EMC, Chicago, Illinois, pp. 59-81, October 1963, (Unclassified) ••••••••••••• . . . . . . . . "The Effect of Multipath Interference on the Intelligibility of Speech Transmitted Over an FM System Employing Time Division Multiplexing," 1964 IEEE International Convention Record, Vol. 12, Part 6, pp. 305-319, New York, N. Y., 23-26, March 1964, (Unclassified) •••••
V. CONCLUSIONS . . . . . VI. PROGRAM FOR NEXT INTERVAL
VII. IDENTIFICATION OF TECHNICAL PERSONNEL
VIII. REFERENCES •
IX. APPENDIX • •
This report contains 85 pages. v
.
. . . . . . .
Page
79
80
81
82
83
84
8~3

LIST OF FIGURES
Page
l. Block Diagram of Error Detection System •••••••• 6
2. Schematic Diagram of Pulse Delay and Shaping Circuits • 7
3. Block Diagram of the Test Configuration Used in Tuning Tests • • 10
4. Error Rate as a Function of Receiver Quieting for Three Tuning Methods • • • • • • • • • •••••• 12
5. Block Diagram of Test Configuration Used in System Interference Tests • • • • • • • • • • • • • • • • • • • • • • 16
6. Error Rate as a Function of Desired to Interfering Signal Power Ratio for CW Interference. Condition l .••••••••••• 18
7. Error Rate as a Function of Desired to Interfering Signal Power Ratio for CW Interference. Condition 2 • . . . . . . . . . . . 19
8. Error Rate as a Function of Desired to Interfering Signal Power Ratio for CW Interference. Condition 3 . . . . . . . . . . . . 20
9. Error Rate as a Function of Desired to Interfering Signal Power Ratio for CW Interference. Condition 4 • . . . . . . . . . . . 21
10. Error Rate as a Function of Desired to Interfering Signal Power Ratio for CW Interference. Condition 5 . . . . . . . . . . . . 22
ll. Error Rate as a Function of Desired to Interfering Signal Power Ratio for CW Interference. Condition 6 . . . . . . . . . . . . 23
12. Error Rate as a Function of Desired to Interfering Signal Power Ratio for CW Interference. Condition 7 . . . . . . . . . . . . 24
13. Error Rate as a Function of Desired to Interfering Signal Power Ratio for CW Interference. Condition 8 . . . . . . . . . . . . 25
14. Error Rate as a Function of Desired to Interfering Signal Power Ratio for CW Interference. Condition 9 . . . . . . . . . . . . 26
15. Error Rate as a Function of Desired to Interfering Signal Power Ratio for CW Interference. Condition 10 . . . . . 27
16. Receiver Sensitivity with Active AFC as a Function of Input Signal Frequency . . . . . . . . . . . . . . . . . . . 30
(Continued)
vi

LIST OF FIGURES (Continued)
Page
17. Error Rate as a Function of Desired to Interfering Signal Power Ratio for AM Interference. Condition 1 . . . . . . . . . . . 31
18. Error Rate as a Function of Desired to Interfering Signal Power Ratio for AM Interference. Condition 2 • . . . . . . . . . . 32
19. Error Rate as a Function of Desired to Interfering Signal Power Ratio for AM Interference. Condition 3 . . . . . . . . . . . 33
20. Error Rate as a Function df Desired to Interfering Signal Power Ratio for AM Interference. Condition 4 . . . . . . . . . . . 34
21. Error Rate as a Function of Desired to Interfering Signal Power Ratio for AM Interference. Condition 5 . . . . . . . . . . . 35
22. Error Rate as a Function of Desired to Interfering Signal Power Ratio for FM Interference. Condition 1 . . . . . . . . . . . 37
23. Error Rate as a Function of Desired to Interfering Signal Power Ratio for FM Interference. Condition 2 . . . . . . . . . . . 38
24. Error Rate as a Function of Desired to Interfering Signal Power Ratio for FM Interference. Condition 3 . . . . . . . . . . . 39
25. Error Rate as a Function of Desired to Interfering Signal Power Ratio for FM Interference. Condition 4 . . . . . . . . . . . 40
26. Error Rate as a Function of Desired to Interfering Signal Power Ratio for FM Interference. Condition 5 . . . . . . . . . . . 41
27. Error Rate as a Function of Desired to Interfering Signal Power Ratio for FM Interference. Condition 6 . . . . . . . . . . . 42
28. Error Rate as a Function of Desired to Interfering Signal Power Ratio for FM Interference. Condition 7 . . . . . . . . . . . 43
29. Error Rate as a Function of Desired to Interfering Signal Power Ratio for FM Interference. Condition 8 . . . . . . . . . . . 44
30. Error Rate as a Function of Desired to Interfering Signal Power Ratio for FM Interference. Condition 9 . . . . . . . . . . . 45
31. Error Rate as a Function of Desired to Interfering Signal Power Ratio for FM Interference. Condition 10 . . . . . . . . 46
32. Equipment Setup for Measuring Mixer Harmonic Generation . 51
(Continued)
vii

LIST OF FIGURES (Concluded)
Page
33. Spurious Response Prediction Error for a Cavity-Crystal Receiver 58
34. Third Order Intermodulation Power Prediction Errqr for a Cavity-Crystal Receiver ••••••••• 58
35. Second Order Intermodulation Characteristics 64
36. Change in Spurious Response Rejection with a Change in Receiver Sensitivity • • • • • • • • • • ••• 67
37. Asymptotic Limit Curve for Responses with p = 1 69
viii

I. PURPOSE
The purpose of this project is to conduct a feasibility study and inves
tigation to determine methods for measuring the interference characteristics
(spectrum signature) of U. S. Army communications equipment deemed necessary
for the prediction and minimizing of electromagnetic interference. Emphasis
shall be placed on pulse modulated type communications equipments operating
in the 1-10 kMc frequency range. Measurement techniques for obtaining the
required data and a format for a directory of these data shall be developed.
Computer methods shall be developed for processing these data to obtain
outputs useful in determining optimum characteristics for communications
equipments operating in prescribed interference environments.
The areas of investigation on this project are divided into two tasks
as follows:
I. The development of tests and procedures for the evaluation of the
interference susceptibility and emanation characteristics of pulse modulated
type communications equipments.
II. The use of computer techniques for processing measured interference
data to produce output! useful in interference prediction and control appli
cations.
l

II. ABSTRACT
During the previous quarter, systems tests have been made on a wideband
FM system which will utilize a multiplexer that employs pulse code modulation.
To evaluate the system in a PCM environment it was necessary to provide pulse
modulation which simulates that which will be used by the multiplexing equip
ment. This was achieved by modulating the transmitter with a continuous binary
pulse train at the pulse repetition frequency (PRF) of the multiplexer. The
pulses consisted of alternate zeros and ones. The system performance under
various interference conditions was measured by an error detection system which
determined the total number of transmitted pulses which were received incor
rectly. The fraction of total pulses received incorrectly was determined, and
this fraction, or error rate, was used as a measure of system performance.
The effects of various methods of receiver tuning were evaluated. Interference
tests included CW interference, AM interference, and ~4 interference.
The techniques of predicting the spectrum signature of cavity-crystal
receivers are presented and the results of an experimental prediction on a typical
military receiver are reported. Results indicate that prediction of the spectrum
signature for spurious response and intermodulation data is reliable and pro
vides more information on the receiver interference characteristic than previous
direct measurement methods.
A summary of all publications and work accomplished on the contract
during the period of 15 February 1963 to 15 July 1964 are presented in this
report. The contents and classifications of the fifteen reports and papers
published during this period are described.
2

III. PUBLICATIONS, LECTURES, REPORTS, AND CONFERENCES
Mr. E. W. Wood attended the 1964 IEEE International Convention held in
New York on 23-26 March 1964. Mr. Wood presented a paper on "The Effect of
Multipath Interference on the Intelligibility of Speech Transmitted Over an
FM System Employing Time Division Multiplexing."
Mr. D. W. Robertson and Mr. E. W. Wood visited USAEL, Fort Monmouth,
New Jersey, on 27 March 1964. A meeting was held with Mr. Guy Johnson,
Mr. R. L. McKenzie, and Mr. Warren Kesselman in which project progress and
technical details were discussed.
The following reports were prepared during the 5th Quarter of the research
program. The classification and contents of these reports are summarized in
part C, section IV of this report.
1. "Mutual Interference Chart (MIC) (AN/VRC-12 Transmitter and AN/PRC-25
Receiver)," 15 April 1964.
2. "Lash-Up Output Data (AN/VRC-12 and AN/PRC-25 Equipments)," 15 April
1964.
3. "Mutual Interference Chart (MIC) and Lash-Up Exercise," 24 April 1964.
4. Manuscript of Catalogue, Volume 10, "Methods for Measuring and Process
ing the Interference Characteristics of Communications Equipments Operating
in the 1 to 10 kMc Frequency Range," 15 July 1964.
5. Manuscript of Catalogue, Volume 11, "Mixer Interference Character
istics.''
6. Manuscript of Catalogue, Volume 400, "Interference Characteristics
of Radio Set AN/TRC-29 and Multiplexer Set AN/TCC-13," 15 July 1964.
3

7. Manuscript of Catalogue, Volume 401, "Interference Characteristics
of Radio Set AN/GRC-50," 15 July 1964.
8. Manuscript of Catalogue, Volume 402, "Interference Characteristics
of Radio Set AN/FRC-34,u 15 July 1964 ..
4

IV. FAGI'UAL DATA
A. Pulse testing of a typical FM/PCM system
During the previous quarter, systems tests have been made on a wideband
FM system which will utilize a multiplexer that employs pulse code modulation.
The multiplexer unit is not yet operational and was not available for testing.
To evaluate the system in a PCM environment it was necessary to provide pulse
modulation which simulates that which will be used by the multiplexing equip
ment. This was achieved by modulating the transmitter with a continuous binary
pulse train at the pulse repetition frequency (PRF) of the multiplexer. The
pulses consisted of alternate zeros and ones. No other pulse coding was
attempted.
The system performance under various interference conditions was measured
by an error detection system which determined the total number of transmitted
pulses which were received incorrectly. The fraction of total pulses received
incorrectly was determined, and this fraction, or error rate, was used as a
measure of system performance.
The effects of various methods of receiver tuning were evaluated. Inter
ference tests included CW interference, AM interference, and FM interference.
1. Error detection system
Figure 1 shows a block diagram of the error detection system used in
these tests. Figure 2 is a schematic diagram of the pulse delay, shaping and
filtering circuits.
The operation of the error detection system consists of inverting the
shaped pulse in the received channel and adding it to the shaped pulse in the
direct channel. If the FM system is operating in an interference-free environ
ment, this type of pulse addition ideally yields pulse cancellation, or no
5

0\
RECEIVED CHANNEL
OUTPUT .. PULSE
FROM -----~~~~~ SHAPER RECEIVER
DIRECT CHANNEL
INPUT TO TRANSMITTER
·~
PULSE _ PULSE H.P. 211A SHAPER .... _11----a DELAY ... -:-........ ---..SQUARE WAVE
CIRCUIT GENERATOR
INPUT INPUT ---- ~------------------------4- -----NO. 1 •• ~~ NO. 2
•r
VARIABLE GAIN
INVERTER
TEKTRONIX 545 OSCILLOSCOPE
- LINEAR ADDER
VARIABLE GAIN
--• VERTICAL
OUTPUT
I FILTER I ~
OUTPUT TO COUNTER
Figure 1. Block Diagram of Error Detection System.

CHANNEL NO.2 PULSE SHAPER
AND DELAY
Figure 2.
1N54
39k
3.3 k
INPUT~TTO ERRO/~~TMECTOR t. gg~~~ER -!- ~30 ~~ -!-
FILTER
Schematic Diagram of Pulse Delay and Shaping Circuits.

voltage at the adder output. If a pulse is detected in the received channel
at a time when no pulse exists in the direct (transmitted) channel, an output
or error voltage pulse is produced. Similarly, if no pulse is detected in the
received channel at a time when a pulse exists in the direct channel, an error
voltage pulse is produced.
In actual operation, some error voltages are produced when the system
is operating in an interference-free environment. These errors result primarily
from slight instability in the Hewlett-Packard 211A square wave generator and
differences in the attack and decay times of some corresponding RC networks
in the direct and received channel pulse shaping networks. These residual
error voltages are of shorter duration and/or lower amplitude than are the
true error pulses. The residual errors were eliminated by low-pass filtering
of the error detector output.
The amplitude of the output voltage of the error detection system is
continuously variable over a 50 db range. By using an attenuator at the counter
input, it was possible to choose a number of arbitrary threshold voltages above
which the counter detected error pulses and below which it did not. Varying the
error voltage threshold was found to affect significantly the total number of
errors recorded under a given interference condition. This was expected since
the output filter caused residual errors to be attenuated rather than eliminated;
by increasing the vertical output voltage (figure 1) and decreasing the counter
input attenuation various numbers of residual errors could be detected. The
most reliable results were obtained when the error detection system output
voltage was set 3 db higher than the minimum output at which the counter counted
the PRF correctly when the input to the received channel pulse shaper was
grounded. For simplicity no attenuation was used at the counter input.
8

Under these conditions the results proved very repeatable. No residual errors
could be detected when the received power was sufficient to yield 20 db or more
of unmodulated receiver quieting.
2. Effects-of receiver tuning on error rates
It was necessary to determine error rate as a function of receiver
quieting in order to choose suitable power levels at which to operate the
receiver during external interference tests. The degree of receiver quieting
at a given input signal level is determined by the "closeness" of receiver
tuned frequency to the transmitter frequency. Three methods of tuning the
receiver were investigated to discover a repeatable tuning method which would
produce a high degree of receiver quieting at input power levels which might
reasonably be expected under field conditions. The three methods investigated
were (1) optical tuning, (2) tuning for maximum quieting without the use of
AFC, and (3) tuning for maximum quieting with the use of AFC. The latter
method is the suggested method of field tuning when the received signal is audio.
The test configuration used in the tuning tests is shown in figure 3.
a. Test procedures. The optical tuning method consisted of dis
abling the receiver AFC and tuning the receiver to give a desired PCM output
waveform as viewed on an oscilloscope at the receiver PCM output terminal.
The desired PCM output, as determined by the specifications of the pulse
shaping circuit, consisted of a waveform at least 0.1 volt peak-to-peak in
amplitude and as nearly sinusoidal as·possible. This tuning method relies
ultimately on an observer opinion and has the drawback of being mostly
qualitative. The obvious flaw of the nonrepeatability of the optical tuning
method was quickly verified. Two curves of error rate as a function of quieting
9

CIRCUIT CONFIGURATION ,-------------------------1 I SCREEN ROOM NO. 1
600
I H.P. 211A OHM .& :: SQUARE OUTPUT r
I WAVE 75 PRF =288 kc
I GENERATOR OUT~~~ f--,! I ~--------~-,
I
SIMULATED PCM PULSE CIRCUIT
DIRECT CHANNEL I ... -11---------. PULSE SHAPER I RECEIVED CHANNEL -
AND DELAY I PULSE SHAPER
r ,, DIFFERENCE CIRCUIT AND
ERROR DETECTOR
( PCM OUTPUT
I RECEIVER
I ANTENNA I FILTER TERMINAL
I ,--~- J .-----. I
6 db TS-403/U
I l r 10 db _ MATCHED ~o~~~::1----t PAD ..... --1 SIGNAL
I BERKELEY MODEL TEE CONNECTOR ._ GENERATOR
7370 COUNTER I ·~
'----------~ jSCREENROOMN0.-2--~l
I IN~3~ +- I I ANTENNA I
I TRANS~I~·;~·;L I l _______ l
H.P. TYPE 400D VTVM
(QUIETING METER) -
I I J
GENERAL RADIO TYPE 874-GA
VARIABLE ATTENUATOR
..
Figure 3· Block Diagram of the Test Configuration Used in Tuning Tests.
50 OHM DUMMY LOAD

for this method are shown dotted in figure 4. These curves represent the "best"
and "worst" conditions of tuning which might reasonably be expected using the
optical technique. It should be re-emphasized that nonrepeatability is the
major objection to the optical tuning technique, since the better results from
this method could never quite be equaled using the nonobserver techniques
discussed below.
Tuning the receiver for maximum quieting without AFC consisted of dis
abling the receiver AFC and tuning the receiver to give maximum quieting at a
given unmodulated transmitter signal level. To determine if the input signal
level affected the final tuning, the receiver was tuned at five different input
levels ranging from -61 dbm to -100 dbm.
Nearly equal results were obtained for all five levels tested. All of
the error rate-quieting curves compared favorably with the results obtained
using the optical tuning technique, with the additional advantage of much better
repeatability for the maximum quieting technique. When the input power level
was in excess of -75 dbm, it was found that the tuning range over which maximum
quieting existed was quite wide. Consequently, it was difficult to determine
when maximum quieting was reached. This "flat topping" is the result of complete
receiver limiting action and could be avoided by tuning at input power levels
of less than -75 dbm. When the input power level was small, it was extremely
difficult to find initial tuning settings which would deflect the quieting meter.
Once the initial settings were obtained, however, the quieting level was very
sensitive to small tuning changes, thereby producing good selectivity.
As a compromise between too much and too little power, a level of -80 dbm
was chosen at which to evaluate the maximum quieting without AFC tuning method.
Eight curves of error rate as a function of receiver quieting were made. The
11

100
80
60
40
20
30
--- OPTICAL TUNING METHOD -o-o-o- MAXIMUM QUIETING METHOD WITHOUT AFC
• • • MAXIMUM QUIETING METHOD WITH AFC
20 QUIETING
(db)
7 /
/~EST OPTICAL RESULT
I I
10 0
Figure 4. Error Rate as a Function of Receiver Quieting for Three Tuning Methods.
12

receiver was detuned and retuned prior to each run; two operators were used in
the tuning tests. Figure 4 shows a curve derived by averaging the data from
th,:se eight curves. The maximum deviation of any of the eight curves from the
average curve was found to be less than 10 per cent, thereby indicating that a
high degree of repeatability could be obtained using this tuning technique.
Eight error rate versus receiver quieting curves were also made using the
maximum quieting with AFC tuning technique. The test procedures for obtaining
these eight curves were identical to those used for tuning without AFC; however,
the AFC circuit was switched on after the receiver was tuned. Error rate as
a function of receiver quieting for this tuning method obtained by averaging
the results of the eight curves is shown in figure 4. The maximum deviation
of any of the eight curves from the average curve was less than 7 per cent.
b. Test results. At a receiver quieting of 0 db, essentially no RF
power exists at the receiver antenna terminals. Hence, the PCM output of the
receiver consisted of unquieted noise. Intuitively, one would suspect that
under these conditions the error rate would be approximately 50 per cent, since
the receiver channel pulse shaper would produce pulses from the received noise
that would be equally likely to be more in phase or out of phase with the desired
pulses in the direct channel. However, the curves of figure 4 indicate that
the measured error rate at 0 db receiver quieting was 40 per cent.
To investigate this apparent discrepancy, a Hewlett-Packard 1490A random
noise generator was used as an input to the received channel. Band-limited
random noise with an amplitude of 0.1 volt rms was introduced at the. received
channel pulse shaper input terminals and the resultant error rate was recorded.
When the noise was limited to a 20 kc upper frequency limit, the error rate was
found to be 72 per cent. When the upper frequency limit was raised to 500 kc,
13

the error rate dropped to 30 per cent. Raising the upper frequency limit to
5 Me produced an error rate of 26 per cent.
A detailed study of the pulse shaping circuit shows these results to be
compatible with the circuit design. Primarily, the results show that the
bandwidth of the error detection system is limited. If the instanteous voltage
at the input terminals never dropped below the threshold at which the circuit
detects a pulse (de "noise"), the output of the received channel would always
be "on". Thus, the difference circuit would always detect a pulse from the
received channel and compare it to the input from the direct channel. An
error would be detected each time the direct channel pulse did not exist; this
would occur at the PRF and an error rate of 100 per cent would be recorded.
As the upper frequency limit of the noise is increased, the error rate
would continue to decrease, as was observed when the random noise generator
was used as an input.
The nominal bandwidth of the PCM output of the receiver is 250 kc. Based
on the findings of the random noise input tests, an error rate of 40 per cent
for unquieted noise is reasonable for this bandwidth.
The maximum quieting method of tuning proved to be highly repeatable
either with or without AFC. As indicated in figure 4, the results of this
method with AFC were superior to the results without AFC for quieting levels
better than 15 db. As a result of the tuning tests, the maximum quieting
with AFC tuning techniques was adopted for tuning the receiver for the remainder
of the FM/PCM system tests.
The decrease in error rate shown in figure 4 as quieting decreased from
10 db to 0 db for the maximum quieting method with AFC was apparently caused
by an upward shift in the noise spectrum. The average time required for a half
14

cycle of noise at -10 db of quieting was approximated by observing a number of
single noise sweeps on an oscilloscope. At 0 db of quieting the average time
decreased noticeably, thereby indicating an increase in high frequency com
ponents in the noise. Hence, the error rate was lower at 0 db than at 10 db
of quieting. This is in agreement with the noise spectrum effects on error
rate noted above.
3. Effects of interference on error rates
A number of interference tests were made on the FM/PCM system to
examine their effects on error rate. These were CW interference tests, AM
interference tests, and FM interference tests. Each test was repeated at five
interference frequencies. The interference frequencies used were the trans
mitter tuned frequency, 0.5 Me above and below the tuned frequency, and 1.0 Me
above and below the tuned frequency. The rated peak-to-peak deviation of the
transmitter is 0.75 Me. At 20 db quieting, the power response of the receiver
is 3 db down at 0.8 Me above and below the tuned frequency. Hence, the fre
quencies chosen cover the receiver band adequately.
Figure 5 shows a block diagram of the test configuration used for the
interference tests. Under each test condition, the total number of errors
occurring in 1 second were counted 10 different times. No less than 15 seconds
elapsed between successive 1 second counts. Each data point shown on the in
terference tests graphs in the section was derived by averaging the 10 error
rate observations made under that test condition.
a. CW interference tests. Error rate as a function of desired signal
level to CW interference signal level power ratio was determined at two receiver
quieting levels at each of the five chosen interference frequencies. The
interference signal source used was a TS-403/U signal generator.
15

,------, I
SCREEN ROOM I NO.2
I I I TRANSMITTER I I PCM ! I
INPUT ANTENNA L TERMINAL
-- ----------------1 I ---------. I ANTENNA I
750 H.P. 211A TERMINAL
I SQUARE l
BERKELEY COUNTER
MODEL 7370
BERKELEY TRANSFER OSC.
MODEL 7580
SIGNAL SOURCE
WAVE RECEIVER I I GENERATOR ._4---~~ j 6oo n I
H.P. 400D VTVM
(QUIETING METER)
I I I SIMULATED PCM PULSE CIRCUIT I I DIRECT CHANNEL ,' RECEIVED CHANNEL I I
PULSE SHAPER PULSE SHAPER I AND DELAY
I I I DIFFERENCE CIRCUIT I I AND I
ERROR DETECTOR
I I I I I SCREEN ROOM
I NO.1
L__ _________________ J
BERKELEY COUNTER
MODEL 5570
Figure 5. Block Diagram of Test Configuration Used in System Interference Tests.

Figures 6 through 10 show the results of the CW interference test when
the desired signal level is set to give 30 db of (unmodulated) receiver quieting.
Figures 11 through 15 give the results of 40 db of receiver quieting.
Figures 6, 10, 11, and 15 graphically depict the characteristic shape
of the capture curve of an "ideal" FM receiver. However, when the interfering
signal frequency is at or close (±0.5 Me) to the transmitter tuned frequency,
as in figures 7, 8, 9, 12, 13, and 14, error rate does not increase monotonically
with interfering signal to desired signal power ratio. The points of inflection
in the curves were found to occur either when the noise spectrum of the receiver
output shifted or when the overall noise level decreased.
The rms noise level of the receiver PCM output was monitored and the
tests were rerun as the CW power level was increased, the noise level was found
to first increase, then decrease as equal RF power was approached, then increase
to the previous level, and finally to decrease as the CW signal was captured.
Further tests revealed that this phenomenon was caused by the receiver dis
criminator, which was always referenced to the signal with the highest power.
At nearly equal power, the discriminator was referenced between the signals,
and relatively little discriminator output was present. When the discriminator
was referenced to either of the signals (when one was greater than the other)
the PCM output contained noise which was interrupted at the rate of the dif
ference frequency between the desired and interfering signals.
The decrease in error rate that occurs at desired to interfering signal
power ratios just above that ratio required for capture of the undesired signal
is the result of decreased discriminator output. All other points of inflection
on the curves were traced to noise spectrum shifts, and result in relatively
minor error rate decreases as compared to the above effect.
17

lOO
80
60 w 1--<(+-a:: ~ a::U 0 ... a::~ a::-w
40
1--J (J:J
20
DESIRED SIGNAL FREQUENCY: 1825.50 Me INTERFERING SIGNAL FREQUENCY: 1824.50 Me QUIETING LEVEL: 30 db RF POWER AT 0 db: -73 dbm
40 30 20 10 0 -10
DESIRED SIGNAL TO INTERFERING SIGNAL POWER RATIO {db)
-20 -30
Figure 6. Error Rate as a Function o~ Desired to Inter~ering Signal Power Ratio ~or ~N Inter~erence. Condition 1.
-40

100
80
60 w 1--<(-~ i ~u 0 .. ~cf. ~-w
40
I-' \0
20
DESIRED SIGNAL FREQUENCY: 1825.48 Me INTERFERING SIGNAL FREQUENCY: 1824.98 Me QUIETING LEVEL: 30 db RF POWER AT 0 db: -73 dbm
40 30 20 10 0 -10 -20 DESIRED SIGNAL TO INTERFERING SIGNAL POWER RATIO
(db)
-30
Figure 7. Error Rate as a Function of Desired to Interfering Signal Power Ratio for CW Interference. Condition 2.
-40

100
80
w 60 ..... _ <(+-IX ~ IXU 0 ... IX u IXe:. w
40
!\) 0
20
DESIRED SIGNAL FREQUENCY: 1825.48 Me INTERFERING SIGNAL FREQUENCY: 1825.48 Me QUIETING LEVEL: 30 db RF POWER AT 0 db: -73 dbm
40 30 20 10 0 -10 -20
DESIRED SIGNAL TO INTERFERING SIGNAL POWER RATIO (db}
-30
Figure 8. Error Rate as a Function of Desired to Interfering Signal Power Ratio for CW Interference. Condition 3·
-40

100
80
60 w 1--<C'E 0:': G)
D:':u 0 t 0:':0.. 0:':-w
40
1\) 1--'
20
DESIRED SIGNAL FREQUENCY: 1825.48 Me INTERFERING SIGNAL FREQUENCY: 1825.98 Me QUIETING LEVEL: 30 db RF POWER AT 0 db: -73 dbm
40 30 20 10 0 -10
DESIRED SIGNAL TO INTERFERING SIGNAL POWER RATIO {db)
-20 -30
Figure 9· Error Rate as a Function of Desired to Interfering Signal Power Ratio for CW Interference. Condition 4.
-40

100
80
w 60 t-..-.. <(+-et: ~ et:u 0 ... et: 41 et:~
1\) w 1\) 40
20
DESIRED SIGNAL FREQUENCY: 1825.47 Me INTERFERING SIGNAL FREQUENCY: 1826.47 Me QUIETING LEVEL: 30 db RF POWER AT 0 db: -72 dbm
40 30 20 10 0 -10 -20 DESIRED SIGNAL TO INTERFERING SIGNAL POWER RATIO
{db)
-30
Figure 10. Error Rate as a Function of Desired to Interfering Signal Power Ratio for CW Interference. Condition 5.
-40

w 1-.-... <(-0:: ~ o::U 0 .. 0::~ 0::-w
I\) w
100
80
60
40
20
DESIRED SIGNAL FREQUENCY: 1825.47 Me INTERFERING SIGNAL FREQUENCY: 1824.47 Me QUIETING LEVEL: 40 db RF POWER AT 0 db: -62 dbm
0~--~--------_.--------~--------~~~~~ .......... ._._ ________ ~--------~--------_. __ ___ 40 30 20 10 0 -10 -20
DESIRED SIGNAL TO INTERFERING SIGNAL POWER RATIO (db)
-30
Figure 11. Error Rate as a Function of Desired to Interfering Signal Power Ratio for CW Interference. Condition 6.
-40

100
80
w 60 ..... -:;::-<( 1: ~ 4) u ~ ... 0 4) O!Q._ ~-w
40
1\)
+
20
DESIRED SIGNAL FREQUENCY: 1825.47 Me INTERFERING SIGNAL FREQUENCY: 1824.97 Me QUIETING LEVEL: 40 db RF POWER AT 0 db: -62 dbm
40 30 20 10 0 -10 -20
DESIRED SIGNAL TO INTERFERING SIGNAL POWER RATIO (db)
-30
Figure 12. Error Rate as a Function of Desired to Interfering Signal Power Ratio for GW Interference. Condition 7.
-40

100
80
60 w 1-_ <C-0:::: c
G)
a:::U 0 ... 0:::: G)
a::!::. w
40
1\) \.Jl
20
0
DESIRED SIGNAL FREQUENCY: 1825.48 Me INTERFERING SIGNAL FREQUENCY: 1825.48 Me QUIETING LEVEL: 40 db RF POWER AT 0 db: -62 dbm
40 30 20 10 0 -10 -20
DESIRED SIGNAL TO INTERFERING SIGNAL POWER RATIO (db)
-30
Figure 13. Error Rate as a Function of Desired to Interfering Signal Power Ratio for CW Interference. Condition 8.
-40

100
80
w 60 1--<C'E 0::: Q)
o:::u 0 Q; a::: a.. a:::-w
40
f\) 0\
20
DESIRED SIGNAL FREQUENCY: 1825.47 Me INTERFERING SIGNAL FREQUENCY: 1825.97 Me QUIETING LEVEL: 40 db RF POWER AT 0 db: -61 dbm
40 30 20 10 0 -10 -20
DESIRED SIGNAL TO INTERFERING SIGNAL POWER RATIO (db)
-30
Figure 14. Error Rate as a Function of Desired to Interfering Signal Power Ratio for CW Interference. Condition 9·
-40

100
80
w 60 I--;:-<t 1: ~ 4) u ~ ... 0 4)
~a.. ~-w
40
1\) --.:j
20
DESIRED SIGNAL FREQUENCY: 1825.47 Me INTERFERING SIGNAL FREQUENCY: 1826.47 Me QUIETING LEVEL: 40 db RF POWER AT 0 db: -61 dbm
40 30 20 10 0 -10 -20
DESIRED SIGNAL TO INTERFERING SIGNAL POWER RATIO (db)
-30
Figure 15. Error Rate as a Function of Desired to Interfering Signal Power Ratio for CW Interference. Condition 10.
-40

The major difference between the data taken at 40 db of quieting and the
data taken at 30 db of quieting is that the curves of.the latter data show
wider, more pronounced excursions than the curves of the former data.
The frequencies to which the interfering signal was tuned were chosen to
be equally spaced with respect to the tu~ed frequency. However, the results
of the tests do not show this symmetry.* For example, capture of the undesired
signal occurred at a desired to interfering signal power ratio of -9 to -10 db
when the interfering signal was tuned to 1.0 Me below the desired signal. The
corresponding ratio for capture of the undesired signal was 0 db when it was
tuned 1.0 Me above the tuned frequency. Thus, approximately 10 db less inter-
fering signal power was required for capture 1.0 Me above the tuned frequency
than was required 1.0 Me below the tuned frequency.
Figure 16 shows receiver quieting as a function of frequency as a signal
generator with a constant output power was tuned across the frequency range of
interest. It is immediately apparent from this figure that the transmitter
tuned frequency was not in the center of the receiver passband. Further, it
is detuned in the direction to explain the nonsymmetry observed above. Retuning
the receiver in accordance with the adopted tuning procedure produced essentially
no change. It was not determined if this effect was the result of the tuning
*All tests reported herein were made by initially having the receiver captured on the desired signal and increasing the undesired signal strength until capture of the undesired signal occurred. The undesired signal strength had to be increased significantly greater than 0 db for capture of the undesired signal using this procedure. However, when the receiver was initially captured on the undesired signal and the undesired signal strength was reduced until capture of the desired signal occurred, the opposite effect was noted; in this case the undesired signal strength had to be reduced significantly less than 0 db for capture of the desired signal. In this respect, symmetry was observed for the two methods.
28

technique adopted or the result of a slight tuning defect in the AFC of the
receiver used. The latter is suspected.
b. AM interference tests. Error rate as a function of desired signal
level to AM interference signal level power ratio was determined at a 40 db
quieting level at each of the five chosen interference frequencies. The AM
interference source used was a Hewlett-Packard 8614A signal generator 100 per
cent externally modulated by a 288 kc sine wave. This external modulation
frequency is nominally equal to the pulse modulation PRF of the desired signal.
Figures 17 through 21 show the results of the AM interference tests. The
effect of capture of the interfering signal is less pronounced for AM inter
ference than for CW interference. This indicates that even with the limiter
operating at a level to give 40 db of receiver quieting (unmodulated), some AM
is allowed to pass. It is expected that this effect would be more severe with
less limiting.
The nonsymmetry of the results at frequencies above and below the tuned
frequency caused by receiver detuning is apparent for AM interference, just as
it was for CW interference. Complete capture occurs at a desired to interfering
signal power ratio of -9 db with the interfering frequency 1.0 Me below the
tuned frequency and at a ratio of -5 db with the interfering frequency 1.0
Me above the tuned frequency.
c. FM interference tests. Error rate as a function of desired signal
level to FM interference signal level power ratio was determined at a 40 db
quieting level at each of the five chosen interference frequencies. The FM
interference source used was a Hewlett-Packard 8614A signal generator externally
modulated with a 288 kc sine wave to give peak-to-peak frequency deviations of
29

(.!)
~ 1-IJj
::> cr f:t:Jl UJ~
w ~ 0 IJj
u IJj
r::t:
-40
TRANSMITTER TUNED FREQ. 1825.50 Me
-30
-20
-10
0~~._----~--------~--------._ ________ ._ ________ ._ ________ ._ ________ ._ ________ ._ ________ ._ ______ ~ 1824.0 1824.5 1825.0 1825.5 1826.0 1826.5 1827.0
SIGNAL GENERATOR FREQUENCY (Me)
1827.5 1828.0
Figure 16. Receiver Selectivity with Active AFC as a Function of Input Signal Fre~uency.
1828.5 1829.0

100
80
w 60 t--. <C1: 0:: Cl)
a::U 0 .. 0::~ 0::-w
40
w ~
20
DESIRED SIGNAL FREQUENCY: 1825.51 Me INTERFERING SIGNAL FREQUENCY: 1824.51 Me QUIETING LEVEL: 40 db RF POWER AT 0 db: -62 dbm
40 30 20 10 0 -10 -20
DESIRED SIGNAL TO INTERFERING SIGNAL POWER RATIO (db)
-30
Figure 17. Error Rate as a Function of Desired to Interfering Signal Power Ratio for AM Interference. Condition 1.
-40

100
80
w 60 1--<( .... 0::: ~ o::;U 0 ... 0::: Q)
0:::~ w
40
w 1\)
20
DESIRED SIGNAL FREQUENCY: 1825.53 Me INTERFERING SIGNAL FREQUENCY: 1825.03 Me QUIETING LEVEL: 40 db RF POWER AT 0 db: -62 dhm
40 30 10
DESIRED SIGNAL TO INTERFERING SIGNAL POWER RATIO (db)
Figure 18. Error Rate as a Function of Desired to Interfering Signal Power Ratio for AM Interference. Condition 2.

100
80
60 w t-,-... <'E 0:.: Q)
e::.:u 0 Qi a::.: a. 0:.: .._.. w
40
w w
20
DESIRED SIGNAL FREQUENCY: 1825.52 Me INTERFERING SIGNAL FREQUENCY: 1825.52 Me QUIETING LEVEL: 40 db RF POWER AT 0 db: -62 dbm
40 30 20 10 0 -10 -20
DESIRED SIGNAL TO INTERFERING SIGNAL POWER RATIO (db)
-30
Figure Error Rate as a Function of Desired to Interfering Signal Power Ratio for AM Interference. Condition 3·
-40

100
80
60 UJ 1-..-.. <( .....
~ i ~u 0 ... ~.f. ~-UJ
40
w +:-
20
DESIRED SIGNAL FREQUENCY: 1825.51 Me INTERFERING SIGNAL FREQUENCY: 1826.01 Me QUIETING LEVEL: 40 db RF POWER AT 0 db: -62 dbm
40 30 20 10 0 -10 -20
DESIRED SIGNAL TO INTERFERING SIGNAL POWER RATIO (db)
-30
Figure 20. Error Rate as a Function of Desired to Interfering Signal Power Ratio for AM Interference. Condition 4.
-40
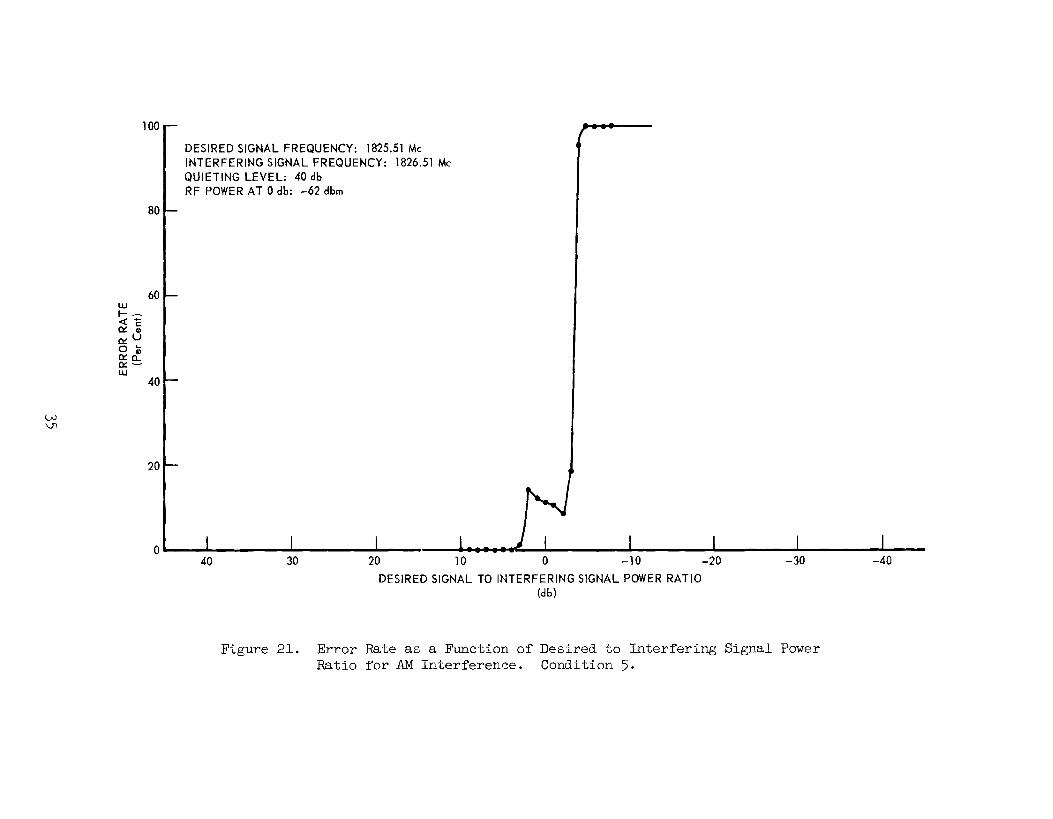
100
80
60 UJ 1--<C'E 0!: G)
O!:u 0 ... O!:cf. 0!:-UJ
40
w \J1
20
DESIRED SIGNAL FREQUENCY: 1825.51 Me INTERFERING SIGNAL FREQUENCY: 1826.51 Me QUIETING LEVEL: 40 db RF POWER AT 0 db: -62 dbm
40 30 20 10 0 -10
DESIRED SIGNAL TO INTERFERING SIGNAL POWER RATIO (db)
-20
Figure 21. Error Rate as a Function of Desired to Interfering Signal Power Ratio for AM Interference. Condition 5·

1.0 Me and 2.0 Me. Figures 22 through 26 show the results for a 1.0 Me
deviation and figures 27 through 31 show the results of a 2.0 Me deviation.
The results show approximately the same degree of system sensitivity to
FM interference as they do to CW and AM interference. At 2.0 Me of FM devi
ation (figures 27 through 31) the receiver interfering signal was of sufficient
amplitude to trigger the received signal pulse shaping network. Thus, instead
of capture of the undesired signal being represented as an error rate of 100
per cent, it is represented as the average error rate produced by two signals
of the same nominal frequency being added with a random and continually changing
phase relationship. The average resultant error rate was about 70 per cent as
indicated in the figures. This phenomenon resulted in the apparent capture of
the undesired signal at a higher desired to undesired signal power ratio for a
2.0 Me deviation than at a 1.0 Me deviation. Since complete "capture" at a 2.0
Me deviation occurs whenever the received undesired pulse voltages exceed the
noise voltage, and complete capture at a 1.0 Me deviation occurs when the noise
disappears, the observed result does not seem to be significant.
4. Conclusions
Pulse testing of a typical FM/PCM system yields results which indicate
that the system is almost equally susceptible to CW interference, AM inter
ference, and FM interference. Tests on methods of receiver tuning showed that
the suggested methods of field tuning for audio (tuning for maximum quieting
with the use of AFC) also proved to be the most repeatable method of tuning
for pulse reception. Although the pulse tests made were comprehensive in
scope, it is felt that they are of limited value in predicting the performance
of the pulse code modulated multiplexing system. When the multiplexing equipment
36

w t--<(1; 0:: G)
o::u 0 :u o::a.. o::w
100 .--
80 !-
60-
40 !-
20 !-
DESIRED SIGNAL FREQUENCY: 1825.48 Me INTERFERING SIGNAL FREQUENCY: 1824.48 Me QUIETING LEVEL: 40 db RF POWER AT 0 db: -60 dbm FM DEVIATION: 1.0 Me
o~--~'------~~------~------~~~--,---Hl~~-~~--~~----~------~------~---40 30 20 1 0 0 -1 0 -20
DESIRED SIGNAL TO INTERFERING SIGNAL POWER RATIO (db)
-30
Figure 22. Error Rate as a Function of Desired to Interfering Signal Power Ratio for FM Interference. Condition 1.
-40

LU_ r--4 c: ~d a::: .. 0 II)
a:::E:. ~ LU
w (X)
100
80
60
40
20
DESIRED SIGNAL FREQUENCY: 1825.48 Me INTERFERING SIGNAL FREQUENCY: 1824.98 Me QUIETING LEVEL: 40 db RF POWER AT 0 db: -62 dbm FM DEVIATION: 1.0 Me
o~------------_.--------~~---------~~ .... ~._--------~--------~--------~--------~-----40 30 20 1 0 0 - 1 0 -20
DESIRED SIGNAL TO INTERFERING SIGNAL POWER RATIO (db)
-30
Figure 23. Error Rate as a Function of Desired to Interfering Signal Power Ratio for FM Interference. Condition 2.
-40

w 1-<("';:" 0:: c
Cl) o::u 0 ... 0:: Cl) o::CL w-
w \.0
100
80
60
40
20
DESIRED SIGNAL FREQUENCY: 1825.48 Me INTERFERING SIGNAL FREQUENCY: 1825.48 Me QUIETING LEVEL: 40 db RF POWER AT 0 db: -60 dbm FM DEVIATION: 1.0 Me
0~------------~----------------~~~r-------*-------------------~--------~---------------40 30 20 10 0 -10 -20
DESIRED SIGNAL TO INTERFERING SIGNAL POWER RATIO (db)
-30
Figure 24. Error Rate as a Function of Desired to Interfering Signal Power Ratio for FM Interference. Condition 3·
-40

w 1-,........ <(+-~ ~ ~u 0 ... ~ G)
~e::. w
+ 0
100
80
60
40
20
DESIRED SIGNAL FREQUENCY: 1825.48 Me INTERFERING SIGNAL FREQUENCY: 1826.08 Me QUIETING LEVEL: 40 db RF POWER AT 0 db: -60 dbm FM DEVIATION: 1.0 Me
o~------------_.--------~--------~~~~-----~--------._ ________ ._ ________ ~--------~----40 30 20 10 0 -10 -20 -30 -40
DESIRED SIGNAL TO INTERFERING SIGNAL POWER RATIO (db)
Figure 25. Error Rate as a Function of Desired to Interfering Signal Power Ratio for FM Interference. Condition 4.

100
80
60 w 1--<( .... Ct: ; et:u 0 ... Ct:~ Ct:-w
+ 40 f--J
20
0
DESIRED SIGNAL FREQUENCY: 1825.48 Me INTERFERING SIGNAL FREQUENCY: 1826.48 Me QUIETING LEVEL: 40 db RF POWER AT 0 db: -60 dbm FM DEVIATION: 1.0 Me
40 30 20 10 0 -10 -20
DESIRED SIGNAL TO INTERFERING SIGNAL POWER RATIO (db)
Figure Error Rate as a Function of Desired to Interfering Ratio for FM Interference. Condition 5·
-30 -40.
Signal Power

100
80
w 60 ....... _ <(-et: i et:U 0 ... et: II)
et:e::. w
40 + [\)
20
0
DESIRED SIGNAL FREQUENCY: 1825.46 Me INTERFERING SIGNAL FREQUENCY: 1824.46 Me QUIETING LEVEL: 40 db RF POWER AT 0 db: -58 dbm FM DEVIATION: 2.0 Me
40 30 20 10 0 -10 -20
DESIRED SIGNAL TO INTERFERING SIGNAL POWER RATIO (db)
Figure 27. Error Rate as a Function of Desired to Interfering Ratio for FM Interference. Condition 6.
-30 -40
Signal Power

w ............ <(c 0::: ., o:::u 0 ~ 0:::0.. o:::w
100
80
60
40
DESIRED SIGNAL FREQUENCY: 1825.46 Me INTERFERING SIGNAL FREQUENCY: 1824.96 Me QUIETING LEVEL: 40 db RF POWER AT 0 db: -60 dbm FM DEVIATION: 2.0 Me
40 30 20 10 0 -10 -20
DESIRED SIGNAL TO INTERFERING SIGNAL POWER RATIO (db)
-30
Figure 28. Error Rate as a Function of Desired to Interfering Signal Power Ratio for FM Interference. Condition 7·
-40

100
80
60 w 1--:;::-<( c .:t: G:l u .:t: ... 0 G:l .:t:O.. .:t:-w
40
..p-
..p-
DESIRED SIGNAL FREQUENCY: 1825.46 Me INTERFERING SIGNAL FREQUENCY: 1825.46 Me QUIETING LEVEL: 40 db RF POWER AT 0 db: -60 dbm FM DEVIATION: 2.0 Me
40 30 20 10 0 -10 DESIRED SIGNAL TO INTERFERING SIGNAL POWER RATIO
(db)
-20 -30
Figure Error Rate as a Function of Desired to Interfering Signal Power Ratio for FM Interference. Condition 8.
-40

w 1-..-.. <(+-0:: ~ o::U 0 ... 0:: " o::f::. w
100
80
60
49
DESIRED SIGNAL FREQUENCY: 1825.46 Me INTERFERING SIGNAL FREQUENCY: 1825.96 Me QUIETING LEVEL: 40 db RF POWER AT 0 db: -60 dbm FM DEVIATION: 2.0 Me
40 30 10 10 0 -10 -20
DESIRED SIGNAL TO INTERFERING SIGNAL POWER RATIO (db)
-30
Figure 30. Error Rate as a Function of Desired to Interfering Signal Power Ratio for FM Interference. Condition 9·
-40

100
80
60
40
DESIRED SIGNAL FREQUENCY: 1825.46 Me INTERFERING SIGNAL FREQUENCY: 1826.46 Me QUIETING LEVEL: 40 db RF POWER AT 0 db: -60 dbm FM DEVIATION: 2.0 Me
40 30 20 10 0 -10
DESIRED SIGNAL TO INTERFERING SIGNAL POWER RATIO (db)
-20 -30
Figure 31. Error Rate as a Function of Desired to Interfering Signal Power Ratio for FM Interference. Condition 10.
-40

is available, it is recommended that the tests be repeated using the techniques
outlined in this report.
47

B. Spurious response and intermodulation predictions in cavity-crystal receivers
1. Introduction
Mixer studies conducted at Georgia Tech have shown that certain mixer
types are reliably predictable with regard to their level of spurious product
t. 1 genera 10n. The excellent results of the prediction technique have encouraged
its use in the calculation of the spurious response rejection levels for an
entire communications receiver. Harmonic pollution problems encountered with
cascaded nonlinearities render the technique useless for ordinary receivers
which employ RF amplification prior to the mixing element, or which utilize
multigrid tubes as multiplying mixers. The receiver which achieves preselection
in an entirely passive or linear manner and mixes with a singularly nonlinear
device (a device which may be represented by a single Taylor series) may be
reliably predicted using mixer and preselector data alone. Cavity-crystal
receivers, i.e. receivers which employ a tuned cavity preselector immediately
prior to a crystal diode mixer, fall into this category and thus are predictable
within the accuracy limitations of the method.
The spurious response prediction technique developed by Georgia Tech in
conjunction with a method by Steiner2 may provide an accurate means of evaluating
both spurious and intermodulation product rejection with a minimum of receiver
measurements. The Georgia Tech spurious response technique is known to be
accurate using a measured set of q = 1 responses for the calculation base and
should be equally or more precise using a harmonic set of measurements. Once
the response rejections are calculated using this method, the IM rejections
can be obtained for the necessary orders. The preselector characteristics may
then be measured and the total receiver rejection calculated. Since most of
48

the computations can be programmed for computer solution, the entire spectrum
signature for the receiver would be rapidly attainable after the initial pre-
selector and mixer measurements had been obtained.
2. Measurement techniques
In order to predict the spectrum signature of a cavity-crystal receiver,
the insertion loss of the cavity preselector must be known over the entire
frequency spectrum of interest. In addition, a mixer product level representing
each of the required orders of mixer nonlinearity must be obtained. These
measurements together with receiver sensitivity and signal-to-local oscillator
ratio are all that are required for the calculation of the entire spectrum
signature of the receiver in regard to the antenna input port.
Receiver sensitivity is obtained in the normal manner specified for the
type of receiver under consideration. In the case studied, the signal-to-local
oscillator power ratio was accurately obtained by the following procedure:
1) Remove the local oscillator connection to the receiver mixer unit.
2) Connect an RIMS (radio interference measurement set) to the antenna port and tune it to the receiver tuned frequency.
3) Connect a signal generator to the local oscillator input port to the mixer and tune it to the receiver tuned frequency.
4) Set the signal generator level for an IF Mixer meter reading as specified for the equipment.
5) Record the level indicated on the RIMS.
This measurement establishes the local oscillator reference level as it
is normally established during ordinary usage of the receiver.
6) With a directional coupler, connect two generators to the local oscillator port of the mixer.
7) Tune generator No. 1 to the normal local oscillator frequency and establish the specified IF Mixer meter reading.
49

8) Tune generator No. 2 to the receiver tuned frequency and set the level for the standard response indication used in establishing the receiver sensitivity.
9) Record the level indicated on the RIMS.
This measurement establishes the signal level relative to the local
oscillator level and the difference of these two readings expressed in db is
the signal-to-local oscillator power ratio required for prediction. The
validity of this measurement may be dependent on the exact configuration of
mixer design and therefore may not represent a universal means for obtaining
the indicated power ratio.
The entire mixer characteristic can be calculated from the set of local
oscillator harmonics generated by the mixer. In order to avoid variable
coupling effects, all measurements are made at the receiver tuned frequency
and the local oscillator level is established at subharmonic frequencies by
obtaining the specified IF Mixer meter reading. With sufficient power avail-
able, this can be accomplished by inserting the subharmonic signal through
the mixer local oscillator input port to obtain the specified IF Mixer meter
reading. The desired harmonic output level is obtained with an RIMS at the
receiver tuned frequency through the receiver antenna port. Since relative
levels are of interest, the various insertion losses can be neglected. In the
case tested, the power out~ut of the available generators was insufficient to
always establish the required IF mixer reading through the mixer local oscillator
input port. The setup shown in figure 32 was substituted to establish the set
of harmonics using an identical technique and a commercial mixer mount.
Determining the preselector insertion loss characteristics for the sig-
nificant spectrum is somewhat difficult in that the mixer is usually mounted to
the cavity and no cavity output port is readily available. In the case at hand,
50

SUBHARMONIC OF
TUNED FREQUENCY SIGNAL .. LOW-PASS .- - 3 db - _j l- -- MIXER GENERATOR - FILTER - - PAD - - uT'' - - MOUNT
n ••
RECEIVER IF
AMPLIFIER
RECEIVERTUNED FREQUENCY HIGH-PASS RIMS - --- FILTER - ,, RECEIVER METERING
Figure 32. E~uipment Setup for Measuring Mixer Harmonic Generation.

the mixer local oscillator input port was used to detect the signal level
passing the preselector. This port is padded internally with 250 ohms and
the mismatch causes some VSWR problems in the measurements as well as a
sensitivity loss. The problem of measuring the preselector may be eased by
dismounting the mixer and attaching a specially built 50 ohm coupling loop to
the preselector for the output port.
Ideally, the preselector should be measured while it is loaded by the
mixer because this is the situation encountered under ordinary operation. The
measurement could be accomplished with high available power and two generators
in each band. One generator functions as the local oscillator and the other
provides t~e test signal. The two generators are tracked at the IF difference
frequency so that the receiver may function as the standard response indicator.
The local oscillator level is set for the specified IF mixer meter indication
at each datum point and the signal level required for a standard response
indicates the relative preselector insertion loss. This technique is lengthy
but includes the frequency admittance characteristic of the mixer diode in
the preselector insertion loss characteristic. The result should be a higher
overall accuracy in the prediction of the spectrum signature.
3. Calculation techniques
The calculation procedure for the mixer spurious response levels has
3 4 been adequately covered in previous quarterly reports. ' In this case, however,
a harmo~ic set is used to establish the expanded mixer response triangle instead
of the p = n, q = 1 response set. The procedure is identical except.that the
calculation begins in the q = 0 diagonal instead of the q = 1 diagonal. A
rejection value of zero is established in the p = 1, q = 1 position and the
harmonic set is normalized to this value by back-calculation from the p = 1,
52

q = 1 position to the p = 2, q = 0 position using the measured signal-to-local
oscillator power ratio. The normalized harmonic set is then used to expand
the spurious response rejection triangle. The response constants or weighting
functions required for expanding the triangle through high orders of non-
linearity are most easily generated using the digital computer.
Fvr the tests reported herein, a set of response constants was generated
through the 40th order using the Burroughs 220 computer and the ALGOL program
outlined in the appendix.
Calculation of the mixer intermodulation rejection values is a new
technique developed from the work of James W. Steiner of the ITT Federal
Laboratories.5
According to Steiner, the level of an IM response is:
where: A = product level,
N = product order,
n = number of input frequencies,
P. = power level of jth term in product, J
P f . th . t f i = power o l lnpu requency,
W = weighting function for the product
~ = order constant.
( 1)
If the sum of all input powers is very nearly that of the larger signal alone,
the second term in (1) becomes equal to the power level of the larger signal
in dbm. This is the normal condition found in a mixer where the injected local
oscillator power determines the input power level and (1) becomes:
53

N ~w J A( dbm) =I Pj (dbm) - NP LO( dbm) + 20 1og10 [ 2
N_1 • (2)
j=l
The Georgia Tech method employs ratios in determining a response rejection
and since the local oscillator power is constant, the second term in (2) drops
out. The third term in (2) can be broken down into two terms, one containing
the weighting function and the other containing the order constant divided by
N-1 2 • If the ratios used are all in the same order, the second of these terms
drops out. The remaining terms establish the ratio of two products of like
order:
~ N Pj [w J 10 1og10 A_ = 10 log10 TI P
1 + 20 1og10 w1
2. or,
--c j=l j2
~_( db ) - ~ (db ) = f [ p j 1 (db ) - p j 2 (db ) J + w 1 (db ) - w 2 (db ) '
j=l
N
~(db) = ~ (db) + \ [ P. (db) - P. (db)] + w1 (db) - w2 (db), ~ Jl J2 J=l
The Georgia Tech method for two signal IM (spurious responses) is a form of
this equation where:
N
\ [ p. (db ) - p. (db )] ' ~ Jl J2 J=l
(3)
(4)
(5)
(6)
reduces to the power ratio in db of the two mixed signals for adjacent responses
within the same order. It should be remembered that these equations are based
on constant-input-variable-output power levels.
54

As an example of how this equation can yield IM data, consider the spurious
response (1,2,+) and the IM response (f1 - f2 - fL 0). The spurious response
rejection is desired. It will be assumed that f1 and f2 have equal power levels,
though this may not necessarily be the case.
Equation (5) becomes:
= -100 + 2Pf f - 2Pf - 9.5 + 15.5 , (8) 1 2 SR
= -1 00 + 6 + 2P f f - 2P ( 9) 1 2 fSR
With constant input power, 2Pf f = 2Pf and AIM(db) = -94. Converting to 1 2 SR
constant output power level is accomplished by dividing the resultant by the
number of input frequencies other than the local oscillator:
94 RIM(db) = ~ = 47 db , ( 10)
where RIM is the IM response rejection. This quantity represents the number of
decibels above the desired input signal level required of the two intermodulating
signals in order to obtain a standard response.
A more generalized form of the equation may be arrived at by transposing
the sum of input power levels of the IM response to the left and equating it to
the remaining terms. The resulting equation is:
(11)
55

where the lower case p and q are the harmonic multipliers as defined for spurious
responses.
Since a full set of spurious responses is easily calculated, the term
containing PLO can be eliminated by choosing PsR = PIM
(12)
The sample IM rejection calculation now becomes:
(13)
= 2(50) + 9.5 - 15.5 (14)
= 100 - 6 = 94 db • (15)
Thus, the sum of the input power levels of the two intermodulating fre-
quencies in decibels must exceed the power level of the desired signal by 94 db
in order to obtain a standard response. For equal IM power levels, the resultant
47 db rejection level is obtained.
It should be noted that the weighting functions employed by Steiner and
carried through in the above equations are divided by 2N-l to obtain the Georgia
Tech response constants. This enables relationships to be carried out between
adjacent orders with the same set of constants. The difference in weighting
functions produces no alteration in the above outlined procedure for the deter-
mination of mixer intermodulation response rejections. The intermodulation
response constants utilized in this study were obtained from the charts given in
reference 5.
56

Total receiver spurious response rejection values are obtained by summing
the mixer response rejection and the preselector insertion loss at the response
frequency for each response of interest. The calculation of receiver intermodu
lation rejection is somewhat more involved in that the total input power rejec
tion is added to the sum of the insertion loss values of the preselector at the
several intermodulating frequencies. The resultant sum is then divided by (N-p),
i.e. the number of external intermodulating powers, to arrive at the equal power
intermodulation rejection of the receiver for the frequencies chosen. The equal
power input level in dbm can be obtained by adding this rejection value to the
receiver sensitivity in dbm. When dealing with intermodulating orders in which
the input powers carry multipliers, the preselector insertion loss must carry a
multiplier of the same value as its associated frequency's power multiplier.
4. ExPerimental results
In order to test the validity of the foregoing techniques and to pro
vide sample calculations, the spectrum signature of a typical military, cavity
crystal, FM receiver was predicted. Comparison of the calculated and measured
data for the receiver indicates a relatively high degree of successful pre
diction. Figures 33 and 34 show the response density versus prediction error in
db for the measureable spurious responses and third order intermodulation prod
ucts respectively. The ultimate accuracy of the method is not indicated by
these histograms since the preselector data were averaged to eliminate VSWR
problems and frequency errors in the preselector measurements.
Sample calculations for the first three orders of receiver spurious
response and intermodulation rejection are presented below.
Receiver Sensitivity: -70 dbm for 20 db quieting
Signal to L. 0. ratio: 68 db at 20 db quieting
Rejection of (1,1) response: 0 db at 20 db quieting
57

Vl CD
15
14
13
12
11
10
Figure 33·
-10 -9 -8 -7 -6 -5 -4 -3 -2 -1 4 PREDICTION ERROR (db)
STANDARD ~ESPONSE: 6 db QUIETiNG SENSITIVITY: -79 dbm
TRUE DENSITY: CROSSHATCHED MEAN DENSITY INTEGRAL: DASHED
10 11 12 13 14
Spurious Response Prediction Error for a Cavity-Crystal Receiver.

Vl \.0
15
14
13
12
11
10
II 1- I
I '-, I I_, I I I I
11 L
1
STANDARD RESPONSE: 6 db QUIETING SENSITIVITY: -76 dbm
TRUE DENSITY: CROSSHATCHED MEAN DENSITY INTEGRAL: DASHED
I ~__,
1_1 1 ___ 1
r----~ L-, ~~ ~ I I r- 1
-12 -11 -10 -9 -8 -7 -6 -5 -4 -3 -2 -1 10 11 12
Figure 34.
PREDICTION ERROR (db)
Third Order Intermodulation Power Prediction Error for a Cavity-Crystal Receiver.

(16)
= 0 - 0 - 68 + 6.0 , (17)
= -62 db ' (18)
where: R . (2,0) =Constant input rejection of the L. 0. second harmonic. Cl
R (l,l) = Constant output rejection of the (p = l, q = l) responses. co
= Weighting function or response constant of the (l,l) responses.
=Weighting function or response constant of the (2,0) response.
With the normalized rejection level of the local oscillator second har-
monic now calculated, the remaining harmonic set is easily normalized. The
measured level of the (2,0) harmonic is added to the normalized rejection level
and each measured value in the remaining harmonic set is subtracted from this
value to yield the corresponding normalized rejection values for the set.
Thus:
R( 3,0) = -62 + (-28.5) (-34.0) = -56.5 db ' (19)
R( 4,0) = -62 + (-28.5) - (-38.5) = -52.0 db , (20)
Returning to the spurious response calculations and continuing with corre-
sponding symbols and definitions:
R (0,2) co = Rc 0 (l,l) - w(l,l) + 68 + w(o, 2 )
2
0 - 0 + 68 + 6.0 = 2
60
(21)
(22)

R ( 1, 2) co
74 = ~ = 37.0 db '
= -56.5 - 12.0 + 68 + 2.5 '
= 2.0 db '
= Rei (3,0) - w( 3,o) + 2(68) + w( 1, 2 )
2
-56.5 - 12.0 + 136 + 2.5 =
2
= 7 ~· 0 = 35.0 db
R (O 3 ) = -56.5 - 12.0 + 204 + 12 , co ' 3
= 147•5
= 49.2 db ' 3
R (3,1) = -52.0 - 18.1 + 68 + 6.0 , co
= 3.9 db '
-52.0 - 18.1 + 136 + 2.5 R (2,2) = co 2
= 64•8 = 34.2 db 2
-52.0 - 18.1 + 204 + 6.0 R (1,3) = co 3
= 13
;·9
= 46.6 db '
61
(23)
(24)
(25)
(26)
(27)
(28)
(29)
(30)
(31)
(32)
(:33)
(34)
( 35)
(36)
(37)

R (0, 4) = -52.0 - 18.1 + 272 + 18.1 , co 4 ( 38)
220.0 = -4- = 55. 0 db • (39)
This concludes the mixer rejection for the second through the fourth orders
of nonlinearity. To obtain the total receiver rejection for these responses,
the relative preselector insertion loss at each response frequency is added to
the mixer rejection for the response.
Thus:
SR (0,2) = 37.0 + > 65 = > 102.0 db ' (40)
SR (0,3) = 49.2 + > 65 = > 114.0 db ' (41)
SR ( o, 4) = 55.0 + > 65 3 > 120.0 db ' (42)
SR (1,2,+) = 35.0 + 45.0 = 80.0 db ' (43)
SR (1,2,-) = 35.0 + 57.0 = 92.0 db ' (44)
SR (1,3,±) = 46.6 + > 65 = > 111.6 db ' (45)
SR (2,1,+) = 2.0 + 65.0 = 67.0 db ' (46)
SR (2,1,-) = 2.0 + > 65 = > 67.0 db ' (47)
SR (2,2,+) = 34.2 + > 65 = > 99.2 db ' (48)
SR (2,2,-) = 34.2 + 37.0 = 71.2 db ' (49)
SR (3,1,+) = 3.9 + 65.0 = 78.9 db ' (50)
SR (3,1,-) = 3.9 + 44.0 = 47.9 db • (51)
62

It is noted that for several frequencies the preselector insertion loss is
greater than the measurement sensitivity and that the spurious response
rejection can only be recorded as greater than a given value. Furthermore, it
is evident that the prediction .technique will yield data that are below the direct
measurement sensitivity under ordinary circumstances. Thus, prediction yields
a greater knowledge of the spectrum signature than can be obtained through direct
measurement.
Second, third, and fourth order intermodulation are calculated as shown
in the following examples for each of the above orders:
Second order (fa,fb) intermodulation is calculated from the (0,2) mixer
response rejection since no local oscillator power is utilized. Substituting
into equation (12) for 20 db quieting:
Pa + Pb = 2(37) + (-6) - 0 = 68 db, (52)
above -70 dbm at the mixer input. Adding the relative preselector insertion loss
at the intermodulating frequencies, fa and fb, one obtains:
Pa + Pb = 68 + 34.5 + 44.0 = 146.5 db, (53)
above -70 dbm at the antenna port. For Pa = Pb the rejection is:
146.5 = ---2-- = 73.3 db . (54)
Curves of this type of intermodulation are shown in figure 35.
In cavity-crystal receivers, second order intermodulation exists only
when the sum or difference of fa and fb is equal to the receiver intermediate
frequency. This and other variations from the normal intermodulation order
designations are phenomena of the mixer element occurring as the first
nonlinearity in the receiver RF section.
63

DESCRIPTION: f0
- fb = INTERMEDIATE FREQUENCY
ORDER: SECOND
o~---o MEASURED IM
..,__ __ .... CALCULATED IM
E" ...a 3 0::: w ~ 0 a... 1-::::l a... ~ _J <( ::::l
0'\ 0
-5 w +
-4
-3
-2
-1
0
10 20 30 40 50 60 70 80 90 100 110 120 130 140 150 160
Figure 35. Second Order Intermodulation Characteristics.

Third order (fa,fb,f10) intermodulation is calculated from the (1,2) mixer
response rejection since the local oscillator term appears once in the inter-
modulation product. This type of intermodulation, normally designated second
order, exists when the sum or difference of fa and fb is equal to the tuned or
image frequency of the receiver.
Substituting into equation (12) for 20 db quieting:
p + a
= 2(35) + (-2.5) - 3.5 = 64 db ' (55)
above -70 dbm at the mixer input. Adding the relative preselector insertion
loss at the intermodulating frequencies, fa and fb' one obtains
Pa + Pb = 64 + 17.5 + 50.0 = 131.5 db, (56)
above -70 dbm at the antenna port. For Pa = Pb the rejection is:
(57)
The error density distribution of the predicted third order intermodulation is
shown in figure 35.
Fourth order (2fa,fb,f10 ) intermodulation is calculated from the (1,3)
mixer response since the local oscillator term appears once in the intermodulation
product. This type of intermodulation exists when the sum or difference of 2f a
and fb is equal to the tuned or image frequency of the receiver.
Substituting into equation (12) for 20 db quieting:
2Pa + Pb = 3(46.6) + (-6)- 3.5 = 130.3 db
above -70 dbm at the mixer input. Adding twice the relative preselector loss at
fa and the actual relative preselector loss at fb' one obtains:
65

2Pa + Pb = 130.3 + 2(17) + 65.0 = 229.3 db ,
above -70 dbm at the antenna port. For
=229.3= 3
the rejection becomes:
76.4 db •
(59)
(60)
No data were collected on the receiver for this type of intermodulation. This
case is presented as an example of the calculation procedure and indicates that
any desired type of intermodulation can be claculated for a receiver of this type.
The actual data collected from the test receiver were taken at a standard
response level of 6 db of quieting rather than the normal 20 db of quieting
because more responses could be measured at the lower sensitivity level. The
comparison between predicted and measured spectrum signature values was enabled
through the use of the curve shown in figure 36 and a knowledge of the 6 and 20
db sensitivity levels of the receiver. Using this curve, spectrum signature
values may be obtained for any desired level of quieting. It is worthy to note
that rejection tends to decrease with an increase in quieting level. Conse-
quently, a receiver operating in the field at greater than 20 db of quieting
has less rejection to spurious interference than its spectrum signature indi-
cates. It is true, however, that the actual power level required for inter-
ference will always increase with increased quieting regardless of the decrease
in ection.
5. Simplification measures
The entire technique of prediction may be simplified through the use
of computers and a theoretical approach to mixer prediction which eliminates
the necessity for a response representing each order of nonlinearity.
66

1.0
0.9
::0 ~
z 0.8 0 1-u w ..., w 0.7 a:::
w V)
z 0 a.. 0.6 V) w a::: V)
::::> 0.5 0
iX ::::> a.. V)
0\ z 0.4 -.J
w (.!) z «( J: 0.3 u !-z ::::>
a::: 0.2 w a..
0.1
0
0 2 3 4 5 6 7 8 RESPONSE Q VALUE
9
NOTE: This Curve Shows the Envelop of the Rejection Change Versus q Since q is an Integer.
10 11 12 13 14 15
Figure 36. Change in Spurious Response Rejection with a Change in Receiver Sensitivity.
It has been recognized for many years that the magnitude of spurious
responses falls off asymptotically toward a finite limit as the order of the
response increases. If a maximum-upper-bound style of prediction is contem
plated, the null points6 of responses can be ignored and a value which is always
equal to or greater than the actual response level can be utilized. This
approach leans slightly toward the generation of pessimistic spectrum signa
tures, but is probably more reliable since two or more receivers of a given
type will not necessarily exhibit null positioning of the same orders.
Throughout the mixer study conducted at Georgia Tech, the marked similarity
of the asymptotic approach of the p = 1, q = n responses was noted. No means
for utilizing this phenomenon was deduced because the order had not been carried
out sufficiently far to determine the asymptotic approach limit. By carrying
the order to 33 in the receiver prediction attempt, the asymptote was disclosed
to be the signal-to-local oscillator power ratio expressed in db. This is the
separation factor used to expand the spurious response triangle and is easily
obtained through proper measurement. The rejection values for the p = 1, q = n
responses are plotted in figure 37 and the asymptotic approach is indicated by
the smooth curve.
The fact that the asymptotic limit appears to be the separation of the
signal level producing a standard response and the local oscillator level is
further substantiated from consideration of the classical limit theory for mixers.
Variation of the amplitude of the larger signal presented to a mixer has little
effect on the amplitude of the output signal. As the small signal level is
increased, the output increases until the level approaches that of the larger
signal, whence the signals reverse roles and the output ceases any further incre~se.
Since the separation factor represents the maximum power increase of the smaller
68

0
5
10
15
20
25
:::a ""0
; 30 Q 1-
~ 35 -, w 0:::
0\ 40 \0
45
50
55
60
65
68
0 2 4 6 8 10 12 14 16
NOTE: THIS CURVE SHOWS THE ENVELOPE OF THE REJECTION VARIATION WITH q SINCE q IS AN INTEGER.
18 20 22 24 26 28 30 32 34 VALUE OF q
Figure 37. Asymtotic Limit Curve for Responses with p 1.
36 38 40

signal, i.e., it then becomes the larger signal; the upper limit of rejection
is realized when this value is approached.
The asymptotic limit thus establishes one end of the envelope of the p = 1,
q = n response rejection values and, since the other end is represented by the
(1,1) response, it is automatically established at zero. The curve may thus be
normalized between zero and an asymptote of unity such that for any given value
of separation, the entire mixer characteristic can be obtained. Calculation
would proceed from the p = l diagonal in both directions along the triangle rows
to expand the spurious response triangle as a maximum-upper-bound rejection set.
Hopefully, all mixers of a given class will exhibit asymptote approach
curves of sufficient similarity to enable the use of a single curve to represent
the entire class. No effort has been extended in this direction to date but
the noted similarity of silicon diode behavior holds high promise for a suc
cessful investigation. If such curves were established and all computations
were programmed for computer solution, the only measurements required WJUld
include sensitivity, separation factor, and preselector insertion loss for a
rapid and accurate assessment of the receiver spectrum signature.
6. Advantages and disadvantages of prediction
The one outstanding advantage of spectrum signature prediction thus
far is the great wealth of information attainable. The complexity of measure
ments is not substantially smaller than in the direct measurement approach since
the preselector characteristic must be measured over the entire frequency spectrum
of interest. The measurement complexity can be reduced through the use of
normalized mixer curves and some means of rapidly sweeping the preselector to
obtain an 80 db limit insertion loss characteristic.
70

With the use of standard zero dbm signal generators, the rejection to
spurious responses can be predicted to levels some 50 db higher than attainable
by direct measurement techniques. The problems encountered in eliminating
generator intermodulation are practically nonexistent in the prediction tech
nique since only one two-generator measurement is required. These advantages
allow the equipment user to establish mutual interference information with
combinations employing high power transmitters since the rejection levels are
known for an equivalent input power of 50 dbm. Responses with such high rejec
tions cannot be detected using standard signal generators.
7. Conclusions and recommendations
The reliable prediction of cavity-crystal receiver spectrum signatures
is a reality. The spectrum signatures so obtained contain far more information
on the receiver interference characteristic than can be obtained by the standard
direct measurement approach. The entire prediction calculation can be programmed
for computer solution such that rapid expansion of the entire characteristic can
be obtained from the measured data.
The establishment of normalized mixer curves according to class should be
undertaken in an effort to reduce the required receiver measurements. In
addition, computer programs should be written for the computation of the expanded
receiver characteristic. In the light of improving measurement techniques,
studies should be initiated to develop sweeper detectors with at least -80 dbm
sensitivities such that accurate preselector characteristics may be rapidly and
automatically obtained. Prediction techniques for other receiver types should
be further investigated.
71

C. Summary of publications during the contract period from 15 February 1963 to 15 July 1964
This section contains a summary of the contract work accomplished to date
under the Electronics Command Technical Requirements SCL-4187, ELECTRONIC
EQUIPMENT INTERFERENCE CHARACTERISTICS, COMMUNICATION TYPE, dated 27 August
1959. The summary is presented in this report since subsequent work will be
done in accordance with Amendment no. 1 of SCL-4187, dated 7 April 1964. The
classification and contents of fifteen publications are listed and discussed
below. In addition, ten monthly letter type reports were submitted to the
U. S. Army Electronic Laboratories, Fort Monmouth, New Jersey.
1. Report No. 22, Quarterly Report No. 1, 15 February 1963 to 15 May 1963, (Confidential)
Many useful spectrum signature measuring techniques are discussed in
this report. Results of several tests and test procedures evaluated using the
AN/GRC-50, AN/TRC-29, and AN/TCC-13 communications sets are presented. The
spectral behavior of spurious responses for wideband receivers is shown to be
instrumental in identification procedures for spurious responses.
Tests were conducted on the AN/TRC-29 and AN/TCC-13 PPM radio relay com-
munications system to determine system susceptibility characteristics in the
presence of CW and ICW interfering signals. A modified General Electronics
Laboratories speech system test set was used to evaluate the degree to which
the running power density spectrum of speech was preserved when the system was
subjected to CW interference at various selected frequencies near the tuned
frequency. Tape recordings were made of the system audio output for 260 dif-
ferent CW and ICW interference conditions.
The effects of injected harmonics on mixer activity and measurements are
presented. The measured data for three different diode mixers show that the
72

diodes behave in a similar manner for a particular bias condition. The results
of diode mixer response prediction methods which indicate proof of conformity
to current mixer theory are presented.
2. Report No. 23, Quarterly Report No. 2, 15 May 1963 to 15 August 1963, (Unclassified)
This report contains qualitative common channel interference tests
made on a wideband FM system. The effect of simultaneous reception of two
signals on the understandability of the desired received signal is reported.
Two path interference tests were initiated on a radio relay system which
employs time division multiplexing. Prediction PCI as a function of relative
phase angles are presented for a delay of 0.25 ~sec. These data indicate that
this is not a sufficient delay to cause significant degradation in intelligi-
bility for this communications system.
Equipment limitations and the inherent errors of the prediction technique
are examined as possible sources of mixer prediction errors. Error-density data
are shown for fourteen diode mixer tests from which the probable causes for
prediction errors are deduced. These data indicate that the examined sources
can produce significant errors under certain conditions of mixer operation.
3. Report No. 24, Quarterly Report No. 3, 15 August 1963 to 15 November 1963, (Unclassified)
The effects of multipath interference on the intelligibility of speech
transmitted over an FM system employing time division multiplexing are reported.
Predicted intelligibility measurements based on audio output S/N ratios indi-
cate that degradation in intelligibility will exist for the FM/TDM system tested
when multipath signals of equal strength are received over paths which differ
in length by as little as 0.15 mile (0.8 ~sec delay). The probability of
73

significant multipath interference in FM systems which use TDM is felt to be
greater than that for ordinary wideband FM systems.
The accuracy of mixer spurious response level prediction is demonstrated
for variations in mixer operating and drive conditions. Utilization of the
prediction technique in the design of mixers is discussed. Several significant
facts concerning the design of radio receiving equipments as illuminated by the
mixer studies are presented for future guidance.
A simplified method of obtaining the series describing a given response
amplitude using only the Pascal triangle of binomial coefficients is presented.
Any single term or the entire series coefficient for any response of a mixer
th represented by an n degree polynomial may be readily obtained.
4. Report No. 25, Quarterly Report No. 4, 15 November 1963 to 15 February 1964. (Unclassified)
Suggested testing techniques derived from standard spectrum signature
tests conducted on U. S. Army microwave communications receivers are outlined.
The importance of the receiver preselector in the receiver evaluation studies is
emphasized. Common pitfalls encountered in the testing procedures are discussed
and alternate test methods are presented.
A finite mathematical model of a mixer characteristic is developed through
the use of the .Fourier series. Calculated harmonic levels based on the mathe-
matical model were found to approximate the corresponding measured levels from
a simple diode mixer circuit. Modifications of the model which will more closely
realize actual diode nonlinearities are considered.
Mixer theory is discussed for a vacuum tube triode mixer. Data taken on
a 6J4 triode mixer are compared to responses computed by a previously developed
prediction technique applicable for diode mixers. This comparison indicates
that the prediction technique is valid for vacuum tube mixers of the type tested.
74

5. Manuscript of Catalogue, Volume 9, "A Second Radio Frequency Interference Bibliography, With Abstracts," 1 December 1963, (Unclassified)
This bibliography, with abstracts, is the result of a continued liter-
ature search which is being conducted in conjunction with the measurements
portion on a research program for developing tests and test procedures for
determining the interference characteristics of U. S. Army pulse type communi-
cations systems. The bibliography contains over 1150 titles, summaries, and
abstracts of published works related to radio frequency interference and electro-
magnetic compatibility during the period from January 1960 to June 1963. In
essence, the bibliography is a continuation of the materials contained in the
first general RFI bibliography, with abstracts, initially published under
Contract DA 36-039 sc-74855 and later published in the IRE Transactions on
Radio Frequency Interference, Vol. RFI-4, No. 1, February 1962.
The accumulated references from more than 50 sources should be useful in
all phases of RFI investigations ranging from the practical elimination of TV!
to a theoretical discussion of signal detection for various interference envi-
ronments. An author index and a subject index containing 68 categories are
included to aid the researcher in finding pertinent subject information.
6. Manuscript of Catalogue, Volume 10, "Methods for Measuring and Processing the Interference Characteristics of Communications Equipments Operating in the 1 to 10 kMc Frequency Ranqe,"l5 July 1964, (Unclassified)
This report is a compilation of measuring techniques developed during
the contract period which can be helpful in establishing interference character-
istics of communications equipments. Methods for establishing the interference
characteristics of U. S. Army radio relay systems are described. System common-
channel, ICW, and multi th interference tests are outlined along with methods
for avoiding pitfalls in existing spectrum signature tests.
75

Emphasis is placed on the receiver preselector in evaluating receiver
susceptibility to spurious response and intermodulation interference. A com-
puter program is presented for use in spurious response measurement and iden-
tification procedures.
The limitations of test equipment are illustrated with data and graphs
depicting the characteristics of filters, generators, radio interference
measuring sets, couplers, and hybrids. In general, it is shown that test equip-
ment exhibits various characteristics such that false spectrum signature data
can be obtained unless these undesirable characteristics are realized.
7. Manuscript of Catalogue, Volume 11, nMixer Interference Characteristics, lr (Unclassified)
This volume is a compilation of mixer interference characteristics
investigated under the Electronic Command Technical Requirements, SCL-4187,
ELECTRONIC EQUIPMENT INTERFERENCE CHARACTERISTICS, COMMUNICATION TYPE, dated
27 August 1959. There are three major categories of mixer and nonlinear inves-
tigations described in this report: 1) the effects of mixer characteristics of
spurious responses, 2) response prediction techniques, and 3) mixer mathematical
models.
Experimental and measured data show the effects of harmonic test results
and mixer data. Curves and graphs are presented which illustrate the variation
of response and harmonic levels versus bias conditions for mixer orders up to
ten. Experimental and theoretical results are compared and discussed.
A method for predicting the levels of spurious response data has been
developed. Steps leading to the development of this method are described in
detail. Expected errors in mixer measurements are outlined. Comparison of
measured and predicted data show promising results within 10 db. Data are
presented on triode, transistor, diode, and multigrid vacuum tube mixers.
76

A mixer mathematical model is described in detail. Fourier analysis and
other mathematical techniques are used to describe mixer term coefficients.
B. Manuscri of Radio
This contains data taken on two R-418/G receivers and two
T-303/G transmitters. System test data on one Radio Set AN/TRC-29 and one
Multiplexer Set AN/TCC-13 are also presented.
9. Manuscript of Catalogue, Volume 401, "Interference Characteristics of Radio Set .AN/GRC-50, 11 15 July 1964, (Confidential)
T~is report contains interference test data on two R-ll48(P)/GRC
receivers and two T-893(P)/GRC transmitters. Interference test data are pre
sented for the AN/GRC-50 operating as a system.
10. Manuscri Characteristics of Radio
This report contains interference test data for one 4UR2B2 receiver
and one 4UT2B2 transmitter.
11. "Mutual Interference Chart (MIC) (AN/VRC-12 Transmitter and AN/PRC-25 Receiver)," submitted to the Electromagnetic Environment Division, USAEL, 15 April 1964, (Unclassified)
This report contains a complete MIC for the AN/VRC-13 transmitter and
AN/PRC-25 receiver. Approximately 200 pages of computer printout contain all
compatible anj noncompatible frequencies for the conditions imposed by the
measured spectrum signature data which were used in the exercise. The computer
programs contained in Volumes 6 and 7, Manuscript of Catalogue, form the basis
for the computer techniques demonstrated in this report.
12.
Unclassified
to
This report contains a computer printout of compatible frequencies for
the AN/VRC-12 and AN/PRC-25 equipments operating push-to-talk or relay. A set
77

of available operating frequencies were used with measured spectrum signature
and antenna coupling data as input to the program written for the Burroughs 220
computer. The simplified modifications of the computer program presented in
Volume 8, Manuscript of Catalogue, and the transmitter spurious emission and
receiver spurious response programs presented in Volume 7, Manuscript of Cata-
logue, emphasize the versatility of modular computer program construction.
13. "Mutual Interference Chart (MIG) and Lash-Up Exercise," submitted to the Electromagnetic Environment Division, USAEL, 24 April 1964, (Unclassified)
This report contains a summary of the exercise at Georgia Tech to
establish MIG and lash-up capabilities for determining the electromagnetic
compatibility operation of the AN/VRC-12 and AN/PRC-25 equipments operating in
close proximity. Limitations and comments regarding the existing computer
programs and data presented in parts 11 and 12 above are discussed. This exer-
cise demonstrated the flexibility of the lash-up program as it appears in
Volume 8, Manuscript of Catalogue. Because of its modular construction, it is
necessary only to add library procedures to this existing program to accomplish
different equipment lash-up tasks.
This exercise brought out many problems which could not be fully resolved
regarding the measured spectrum signature data. For close proximity EMC appli-
cations, it is felt that adequate tests are not being conducted on receivers to
determine strong signal effects on 1) spurious response data, 2) two-signal
(adjacent channel) selectivity data, and 3) RF selectivity data. In addition,
improved methods for measuring and identifying the spectrum output from fre-
quency synthesizer type transmitters are needed.
14. "The Behavior of Nonlinear Mixing," Proceedings of the Ninth Tri-Service Conference on EMC, Chicago, Illinois, pp. 59-81, October 1963, (Uncla ssi fi ed)
The purpose of this paper is to discuss the basis for the formation
of spurious products and to show methods for prediction of troublesome spurious
78

responses. Considerable research has been expended toward these goals for a
period in excess of ten years. Many investigations in this field begin with
the normal binomial expansion of two summed sine or cosine functions and eventu
ally attempt to show that the mixer rigorously follows these equations in the
formation of spurious products. Many devices and methods have been employed
for demonstrating that mixers behave according to the assigned mathematical
model, and more recently researchers have accurately predicted the amplitudes
of the spurious products generated by certain mixer types up to about the fifth
order of generation.
The majority of experimental evidence demonstrates that, for the conditions
established during the experiment, the mixer will follow the mathematical model.
Unfortunately, devices for reducing spurious products based upon the theories
so established do not always function as intended. In fact, the data presented
by any given investigator may not agree with the data extracted by another, even
though the conditions for both experiments were believed to be established in
the same manner.
This paper discusses the effects of injected local oscillator and input
signal harmonics, emphasizes their relative importance in producing responses,
and demonstrates their experimental effect on mixer measurements. Possible
sources of such harmonics are outlined.
The absolute response level is shown to affect the relative spurious
response rejection measurements for responses having large q values.
A reliable mixer response prediction method based on sample response
measurements is presented. Its application to receiver spurious response pre
diction is discussed along with associated pitfalls and limitations. The basis
for the method and the v2rious relationships for its use are examined. Experi
mental results illustrate the accuracy of the prediction procedures to the
tenth order of generation.
79

15. uThe Effect of Multipath Interference on the Intelligibility of Speech Transmitted Over an FM System Employing Time Division Multip1exing,u 1964 IEEE International Convention Record Volume 12 Part 6 • 305 -319 New York N. Y. 23-26 March 1964 Unclassified
This paper reports the results of two-path interference tests on a
typical FM system which utilizes TDM. The variable parameters of the test con-
figuration used were the delay time between paths or path length difference, the
relative power levels between paths, the absolute power level or receiver quiet-
ing, and the relative phase angle between paths. The audio output S/N ratio
was measured under various test conditions and used to predict the intelligi-
bility of received isolated monosyllabic words. It was found that the video
distortion produced was primarily assignable to the following causes:
(1) limited noise due to absence of the carrier,
(2) noise produced by amplitude modulation due to lack of effective
limiting action at low signal levels, and
(3) phase modulation of the direct signal by the delay signal.
The distorted video signal produced random gating in the demultiplexer, result-
ing in the generation of random noise at the audio output.
It was found that at approximately equal relative power levels, the pre-
dieted intelligibility fell to zero for a delay of 0.8 ~sec at absolute power
levels corresponding to 35 db or less of receiver quieting. In general, the
data indicate that degradation in the intelligibility of transmitted speech
can be expected from the effects of multipath interference on this system for
path length differences of a few tenths of a mile.
80

V. CONCLUSIONS
Pulse testing of a typical FM/PCM system yields results which indicate
that the system is almost equally susceptible to CW interference, AM inter
ference, and FM interference. Tests on methods of receiver tuning show that
the suggested methods of field tuning for audio (tuning for maximum quieting
with the use of AFC) also proves to be the most repeatable method of tuning
for pulse reception. Although the pulse tests made were comprehensive in scope,
it is felt that they are of limited value in predicting the performance of the
pulse code modulated multiplexing system. When the multiplexing equipment is
available, it is recommended that the tests be repeated using the technique
outlined in this report.
The reliable prediction of cavity-crystal receiver spectrum signatures
is a reality. The spectrum signatures so obtained contain far more information
on the receiver interference characteristic than can be obtained by the standard
direct measurement approach. The entire prediction calculation can be programmed
for computer solution such that rapid expansion of the entire characteristic can
be obtained from limited measured data.
The establishment of normalized mixer curves according to class should be
undertaken in an effort to reduce the required receiver measurements. In addi
tion, computer programs should be written for the computation of the expanded
receiver characteristic. In the light of improving measurement techniques,
studies should be initiated to develop sweeper detectors with at least -80 dbm
sensitivities such that accurate preselector characteristics may be rapidly and
automatically obtained. Prediction techniques for other receiver types should
be further investigated.
81

VI. PROGRAM FOR NEXT INTERVAL
The next quarter's effort will initiate investigations in determining
the interference characteristics of U. S. Army communications equipment to
include the near-field emission and su lity characteristics which are
important in intra-system and lash-up compatibility. The study will be con
ducted in accordance with the Electronics Command Technical Requirements
SCL-4187, ELECTRONIC EQUIPMENT INTERFERENCE CHARACTERISTICS, COMMUNICATION
TYPE, 27 August 1959, Amendment no. 1, 7 April 1964. The scope of the pro
gram is to conduct a study for establishing a controlled electromagnetic envi
ronment for measuring near-field radiated and susceptibility interference
characteristics of electronics equipments. The objectives are to conduct a
mathematical and experimental study to determine the most economical and practi
cal means for measuring and reducing the VSWR and other undesirable effects of
anechoic shielded rooms.
The specific efforts for the next quarter will include a literature
survey of existing anechoic shielded room design and measuring techniques appli
cable to this study. Methods will be investigated for improving existing and
developing new measuring techniques utilizing screen rooms which are presently
available.
82

VII. IDENTIFICATION OF TECHNICAL PERSONNEL
Name Title Approximate Hours
E. E. Donaldson, Jr. Assistant Research Engineer 325
N. T. Huddleston Graduate Research Assistant 605
s. P. Lenoir Special Research Engineer 70
w. L. Reagh Research Assistant 628
D. w. Robertson Head, Communications Branch 140
P. T. Spence Graduate Research Assistant 424
c. w. Stuckey Assistant Research Engineer 776
R. D. Trammell, Jr. Assistant Project Director 841
J. R. Walsh, Jr. Research Engineer 111
R. D. Wetherington Special Research Physicist 9
E. w. Wood Project Director 739
Mr. Lenoir is a staff member of the Georgia Tech Computer Center and has
been associated with Georgia Tech for fifteen years. He had been responsible
for the design, construction, and operation of special purpose data logging
and analyzi-ng equipment using both analog and digital techniques. He has
provided extensive analyst and programmer services on several of Georgia Tech's
radio interference and frequency assignment projects.
Mr. 0. H. Ogburn accepted a position with Civil Service in April 1964.
83

VIII. REFERENCES
1. R. D. Trammell, Jr., E. E. Donaldson, Jr., and P. T. Spence, "Manuscript of Catalog~J2, Volume 11, Mixer Interference Characteristics, Project A-678," Electronic E ui ment Interference Characteristics-Communication T e, Contract No. DA 36-039 AMC-02294(E , Georgia Institute of Technology, Engineering Experiment Station.
2. J. W. Steiner, "An Analysis of Radio Frequency Interference Due to Mixer Intermodulation Products,'' IEEE Transactions on Electromagnetic Compatibiiity, Volume EMC-6, pp. 62-68, (January 1964).
3. E. W. Wood, R. D. Trammell, Jr., C. W. Stuckey, H. W. Denny, E. E. Donaldson, Jr., and R. M. Cook, "Quarterly Report No. 1, Project A-678," Electronic Equipment Interference Characteristics-Communication T e, Contract No. DA 36-039 AMC-02294 E , Georgia Institute of Technology, Engineering Experiment Station, pp. 81-101, (15 February 1963 to 15 May 1963).
4. R. D. Trammell, Jr., C. W. Stuckey, E. W. Wood, 0. H. Ogburn, and E. E. Donaldson, Jr., "Quarterly Report No. 2, Project A-678,,. Electronic Equipment Interference Characteristics-Communication Type, Contract No. DA 36-039 AMC-02294(E), Georgia Institute of Technology, Engineering Experiment Station, pp. 35-62, (15 May 1963 to 15 August 1963).
5. Steiner, op cit.
6. Trammell, Donaldson, and Spence, op cit.
84

2 corviMEriT BOB's FOLLEY 2 INTEGER N,K,I 2 FLOP.TING OTHERWISE 2 ARRAY S(4l),T(41) 2 OVERFLOW (5) 2 N=O 2 PPl .•
IX. APPENDIX
2 K=l $ N=N+l $FOR I=(O,l,40) $BEGIN S(I)=l $ T(I)=l END 2 PP2 •• 2 =0 2 PP3 .• 2 S(K)=S(K).(N-I) 2 T(K)=T(K).(I+l) 2 I =I+ 1 2 IF I LSS K $ CD TO PP3 2 IF K LSS N $ BEGIN K=K+l $ GO TO PP2 END 2 FOR I=(O,l,K) $ S(I)=S(I)/T(I) 2 IF N LEQ 20 BEGIN FOR I=(O,l,K) $ S(I)=S(I)/(2*(N-l)) 2 IF N GTR 20 BEGIN FOR I=(O,l,K) $ S(I)=S(I)/(2*20) 2 FOR I=(O,l,K) $ S(I)=S(I)/(2*(N-21)) END 2 FOR I=(O,l,K) $ S(I)=((LOG(S(I)))/2.3026) 2 FOR I=(O,l,K) $ S(I)=20.S(I) 2 WRITE($$DATAl,DATA2) 2 OUTPUT DATAl( FOR I=(O,l,K) $ (N,S(I))) 2 FORMAT DATA2(I3,B5,Fl2.6,W2) 2 IF N LEQ 39 $ GO TO PPl 2 FINISH
85
:t $ $ $
END$ $ $ $ :] $ $ $ $ $

s
l
l
20
l
l
l
2
l
l
1
l
l
'Jlo
, ATTN: Technical 25, D.
Chief of Resea~ch ~nd 2 , D. C.
General, U. S. Army Materiel R & D Directorate, Washington 25, D. C.
U. S. Army Electronics ATTN: AMSEL-AD, Fort Monmouth, N. ,J.
Cormnander, Defense Documentation Center, ATTN: Cameron Station, • 5, Virginia
Commanding Officer, U. S. NrTN: CDCMR-E, Fort Belvoir,
of
NJ'TI'J:
Cormnand,
Officer, U. S. Army Combat Developments. Command, Communications-Electronics Fort Huachuca, Arizona
Commanding Officer, U. S. Army Electronics Research and Activity, ATTN: Technical Library, Fort
Huachuca, Arizona
U. S. Army Security Arlington Hall Arlington Virginia
Deputy President, U. . Army Security Agency Hall Sta.tion, Arlington
Director, U. . Naval search 25, D. C.
Commacding Officer and Director, U. S. Electronic San , California
Aeronautical Systems Divis terson Air Force Base, Ohio
ASNXRR, Wright-Pat-
Air Force
Air Force
Research Laboratories, ATTN: CRZC, Bedford, Massachusetts
Research Lc:tboratories, CRXL-R_, Bedford, Massachusetts

No. of s
l
l
l
l
l
l
l
l
l
4
l
l
l
To
Division, ATTN: ESTI, L. G. Hanscom Massachue.etts
Rome Air Development Center, ATTN: RAALD, Griffiss Air Force Bae.e, New York
AFSC Scientific/Technical Liaison Office, U. S. Naval Air Center, Johnsville,
USAELRDL Liaison Office, Rome Air Development Center, ATT~: RAOL, Griffiss Air Force Base, New York
Commanding Officer, U. S. Electronic Materiel Support Agency, ATTN: SELMS-ADJ, Fort Monmouth, New
Director, Monmouth Office, U. S. Army Combat Command, Communications-Electronics Fort Monmouth, New Jersey
Commanding Officer, Engineer Research and Development Laboratories, ATTN: Technical Documents Center, Fort Belvoir, Virginia
Marine Corps Liaison Office, U. S. Electronics Research and Development Laboratories, Fort Monmouth, N. J.
AFSC Scientific/Technical Liaison Office, U. S. Army Elec-tronics Research and Laboratories, Fort Monmouth, New
Commanding Officer, U. S. Electronics Ree.earch and Development Laboratories, ATTN: Logistics Division, Fort Monmouth, New (MARKED FOR: GUY JOHNSON)
Commanding Officer, U. S. Army Electronics Research and Development Laboratories, ATTN: SELRA/DE, Fort Monmouth, New Jersey
Commanding Officer, U. S. Army Electronics Research and Development Laboratories, ATTN: Technical Documents Center, Fort Monmouth, New
Commanding Officer, U. S. Electronics Research and Development Laboratories, ATTN: SELRA/GF, Fort Monmouth, New ,Jersey

Nc'. of
1
1
1
1
1
1
DISTRIEUTION LIST (Cone
To
Commander, Rome Air Base, New York, ATTN:
Center, Griffiss. iUr Force EMCVR (C. R. Miller)
Bureau of D. C. ATTN: Code
, Dept. of the (Mr. Roman)
Director, Compatibility ATTN: ACX (Lt. Col. John A. Gahr), U. S.
Laboratory,
Officer, U. S. Army Development Laboratories, ATTN: New Jersey
Research and Fort Monmouth,
Commanding Officer, U. S. Electronics search and Development Laboratories, ATTN: SELRA/GFR, Fort Monmouth, New
Commanding Officer, U. S. Army Electronics Research and Activity, ATTN: FC- , White New Mexico
IIT Research Institute, ATTN: Mr. J. T. Ludwig, 10 W. 35th Street, 16, Illinois

AD A~:: ' 'l No . Eng.l'-:-, ---:-,.--""T::"==::.o=,..,-::c::--;,-. Lx:~erime n t. Otation, G -;;-::tA-r,:-: ' t• r f 'l'~c·;:;:hn::::o"lo:::gy""",-A"'t'-l~'""n~tu-, "CJeo:co=r eia, C . II . , l. D. : -. --mell, ,!r., ~;~.nd E . W, Wood.
, Qc:~rrt.f! r !y ~epar t. No . ) 1 1) Feb ruary .1))64 i..o 1 5 .Tul 'i . l -', ! ..._ -:fA..-. , Es pnp; e~,, 37 i ll us. ( Cont n u:t No . DA ) 6- 059 AMC - 024. . .. ,l_ , C tl ,.. a -
ti on_.: - ~~; ;~ :!""J t~t ~~ : -~ir~~- ~~?u~~~ 8'rl83 , r, _ r L of Uu~ Army ProJt>ct : 1--;6-
D"~:r int"; th~· p1·~v1ou ~ ::;yot c·m~ te sLR hrtVf' been !Jlll.dd (Hl ·"l widc-"bo.nd Fi.-f ;,yst?.m whi ch will ut. i l i:z.c a thaL ~m_~1 l oyc pulse code modul~tion . ':'c eval uat e '!..he in a 1-'CM r:nv l~ · (H"Uncnt it wa~ m:~P.ssary t u provide pul s e mn(lu 1FJ.tion ~o:: Gir.lU..L-1-te s that whit:h •·•ill l H! 1J Gcd by the mu 1t.1 ,.:.. .i ,e ; . ""; . 'l'his was
~~~: i ~~~~~0. :):l' (' 'i . t - ~l .. . ~ - ,~ ' :: (r~ :\·~. w~ ~~ ~u~~~i:~~~~~ 11·~~~l·;Lir~;~e r.~~:~ ~t:~ uf ttlt. ._-~r no.t c z • ' 1 :-e-rfo nrmnr.(' und e r va!'iou::. int crfc1·enef:' C'owli -:ion:. wJ.;.::; r:lf:' n:)~J'l"C'i t::r ·;.n '! r ror • •• • • e sy::;tcll". wh i ch dP ' t• l \. • •.•f tra n;.rr.1t.tr:::i pu .!. .>f:' S \.;hi C' h "-'C!' t" r• •h r d i !'lcurrec:Lly . r ~ : • ~·:. 1 :."', 1':::; r cc~i •:f:>d i r1r:O'!"r ~ c tly w~w •' • _ne d , A.nd t.hi ~ fr u. ; • 1 , f" r n r • .. , uzert :1 :.; ~t :nt:a::;urc c f ~ , ' •-· 'TI:c ct'i'cc t ::; of var i ous methode-{ o f receiver tt tniniJ "''~r t'! e valu :tLrJ•l - l ~ renr P tp::;t n included CW i nter f ere ncP , AM inter f e r -l.ncc , :tr.d FM intr.l 'f'f!!"ence.
f.)f !'r ed ict ine t he ::.pe rt. r nm sir;nature of cavity- e!)·::; tal r ..:cei ve r-s n..n1: t he re ~ ul t..r:; of an e xt: r -·ntal prP.dic tion <m A. typic -3.1 m1lt tnry
' ~ · i ndil·H. t • - t pre dlc tlCJn of the :-; pe(~t..rum !;;ip;na.-l"-; ~; :.e and i ntr:rmoc:). J.el. ~m 1lat a is r elin.b lr: and pruv i r.ie ::; more
r .. ver i.nt<"rfc renc -\ l ' Fl.ct e ri ~th~ lhan previ ous direct rr..ec.f;>tu' f.! Jne n t me:tho,js.
t, c-..unma:·y of nl l puolic ~J.t.lon ::; and -work . - p l 1 shed on \.. he contract during t he period of 15 ~ ·ebruary 1965 t o 1) ,July 1964 n.re present~rl i.n this report. 'L'he r·nnt • A .. ; :.. • l "' . .. :. c- : of tht'! fifteen r epo r t. c. a nd paper ~ publ i !:hed dur ing Lh ( ::; p0.:·i od a::-f:' :k .sc ribed .
/\D Acee::;.::;ion No. .Enp; lw:eri.ne; :Sxperi!nc Et fl"l.o. t ion, fi;>orgia ! n::o Li t ute of 'l'P.r::.-.:-h,::::lo"lo:::gy=:-, "At"l"""nn:.t::-a,---,;:Ge::-:o-::crg071-=-a, ."' , VI . !:'tlle key , :-: . n. T'!'r.l.ITII!le ll , •. 1r ., :tw'! L W. WooJ .
Ho . 5, J5 Fr:bru:'try 1 • ' C. ·'·•Y l?t., , I - ued (lontrnct No . DA )i-:': _.. .f 1"-tll...·- - · ).( ) , ::' '"1 inun
l:> i.: - 8718.) , Departmt:nt ur t he Army Pro,icct: lGG-
Jt:ri n,_: tr:r c.J· •'vl r. ~l .J ·:uf1.r 1.Pr 1 t:;( <:-:le r> l:; 1 . ~ hav e~ beeu ma tlc: o n ;'I -w1<kband FM sy::; t em ·.:tt l .·t "-'il.l 1:1.il iz. c- a lw1i.ipl('x c•r that • lly~ pulsP r:od12 modu]o.tion . To evnlua l~ · r ,,., :-:yGte! ~: ir t ::c. \-""";1.1 r-' nv i ron:w:.•o.t. it wa : • · ~:scary to prov ide pu l se modulati o n .....-tti :- 1! s im1Jl a. "'... e ~ t..~l · Jt '.o.'h i ··l• w1 !:. t e w;c thf-! mul ti plexinc; e quipmP.nt . 'llJ"ll n -wns
t h~ t r r.nmnitt eJ • l l h ·'l c1.mt t l ' • ..,. pul s e Lr ain at (!'~F) r~ ': f,e mult..1pl pul :,;e r. ~onsif:>t €> 11 o i'
"o r'l'll ance a. • r a.r! • 1 i nt e rfe r encc condi -t.iun~; w·:J.::: tru-, ~1r ·1 ~· e ·..:. l ·y :,n c ! 'l'or c.ystem ,,:h i 1"""' .r 'cot I .c'l the t.ot;ll munb er nf tr:t:wP. i ~t ~- · - "-'hh ·"l", wc r (• l"l?f 'f-'1V(':d incorrect -( . 7'1 \ C Lion of t otal :1;,,.:. !: • - r~ r ~·: c- P(: t t:r ... , ... u . .; and t ld J #" ~= · ! 1 , or t: rr or· r ate, wah
• y~tem ef le0. t!l oi' va.riou~ lile i.. hn<l G of r·eec iver ~unl n1~, we ~ • · ~ ~.. t e st~ include-d CW j nt e rfere ncc , A.M. intP.rfer-
un•j
( •f ':""'TC:di ct..i nr; t he ~p~ctnun ::ol gnn.ture of ~~n.vity- cryntnl rer.: ei v~:r!-3
n.nc-1 ... Uw rr.~ ult :·; of em expi:'T'imental predictio n on a i..ypl cFLl mili tr..ry n.re r·epm·tc-d . ~P:;u1t~ indicat e thRt. :.-r-1.1 ~ 1 o :r U tf.' spectrum c.igna-
Lurr· fo r ~'f!ll rio'.t~ !'( ... nr1 i nte.rmo<lu l ation · ' t r eliable and provides more i:t1'onw.J.Lion e-n i..l1P r - ,.~ • r i n t erf f:'rf'nce d ttt.r a • .j .I than prev1ou ~ di rE>r.t.
• 1 .. , ~ :. meL hods .
~~ suwmo.t·y of' Hll put ... • ~ and work accomp.l \ J r he c.; o utra.ct duri ng the p·t·iocJ Ul' 15 FclJruaJ 1 "t' \. 0 15 ,?" 'Jly 1964 ar E' _ , .:<T,t i j n thi~ r eport. The ':':Onten t~.; a n:l -:la3 t.d fl.:o::r~ lt ot' thE;;! fift een r·Aports and paper s publ i~hed Uur ine;: t.t1i :s pcri.od are dA::.cribed.
' 'NC' M J<;lfiF.D HEron-r l . :tadi.o c()lTCTI\lnicai.. lons
?. • Int e r f f: rene !;;!
.; . 11a diu Frc q-..1enr:y I nterfr.r enc!.:
I . c. w. St.. ·.H~ kc·y , n. D.
IV .
Tr ammell , ,_rr . 1 a. ud 1:: . W. Wood
:t '"'< ~ No . 2G, Q- -ly RPport i'-!o .
C ' ,. .:- t ~io . D/1. ;.O .. OYJ A ' . ~ !<)I , (E ), Dent. of L• .rrt.:; Pro~~P-ct l "':6-2 • • ~-41< 9
r:AEL , Fort Mon!IlO':.lth, New ,Jerse-y
l JNC LJ, !"" '! RE RlR'f 1 . Rad it1 ~ A 1i c ation~
; . !~adio f're>qut:ncy l nte r fercn c e
r. C . W. Stu c.·key, H. D. ·· --, J r., a nd
} • -·. -..:;.od
I T. t " n . 26, ~ • t - . y R•port No .
TTl. :•· : • t1o . DA 36-03') •. : -..IJI(f-) 1 DeJ:'t . nf
-J Proje ct 116-20501- D- l>i19
I V. IJ::iA.E[J, For t Monmouth , New .TP.r ~ey
AU Ac ce::;n1on j;o . EVneP.-r i nti r.::-r ~ rL C . w. Stw: !:ey,
' "' t i on , Ge-org i li ! nstl t..utc of Tec;:;:hn:-::o""1o::-:gy::-,.......,.,At".l "'an'"'.t-=-a ,--o-0e-=-o ..,.,r g"'"1a,.--, - .11 , ..: r ., 9.nd i': , W. Wood.
Report ~,Jo . ) 1 15 Fetr .JD.ry 196!1 to 15 ,Ju l .y 19(>4 , .i.::;:::; ue:d illuo , ( Cont,·ae t. ~io . !JA 36 - 0 )9 AMC- 022<)11(TC) , r.ontinu~
oc - 13' (1(1), !Jc,po.rtmenl o f th~ Army Pro j ect: 1 -~(,-
DJri ng t t,e _ ~ .- r , :;yst r:ms t <::> ~ U~ have been rnac1i'! on ~ wi deln'l.nd FM cystf:!m whi c!1 '"' l ll ;:. ~Ju.lt. irlc~xc·r tbat 1:>mp l oys pulst> r: otk r.todul ni.. i o n . J'o evalu~Le t.~e:- sy'Jt.elf! in n l?Cf·~ envtronm..:nt i i. wus n r~ <:c-ssary to provi de p~lh>e modt1la.ti o n w·r.l ·.:h .>1tl~-1te s Lktt. whio:h \./i ll b€' used by Lhe lnul• 4r:..r I 1' 1t. . Tid::; was n r ·hin·('·.~ "!..y )'llCJ.:lu \ :"l t inp, · " · t · er -wtth n cont . • ..... ~'1'""";_1 r ~ t rn in at tht: pt;: .• e •·r·p(•t itlon f l' • \ i) of' t he mu1Llp1t:xcr. '!.he _! lu l::;c::; cunsi si..e d f")f :~.P•r 'r .. <# l - ~ -e :~y:> tt7lll perfo n:1.:=t.ncc unde r va riCJllS i nterfer-eiH~ t: condi -1. i on ::; ·w::.~ ::te :!.~llr<"'fl ty ~c f:' !Tnr det ec t ion ;,y ;, tt:m -wh l:.:b de t t:t-::: i ned t. he tot;-:.;_ :1tur:ber cf' t ::an::;;·1i t tctl r-uls e :::; wh~r: h '-'ere rec· ei vt~d i ncorrect1 y· . 'lhe frac· t. ion of' tolal rul ~ ~:> s n~c~ i vo<? 'i l;. t·on'(.-ct ::..y w~~ -:lt:t.~mir.ed, .'ln rl thi ~ fraeLion, or t t .. r r A.t r: , ·w.':ls : .:a~ , : .?.S ·.~ :ne a.:w : t: o i' zy:.;Lf:'! 'i< - ; ·-:-- l:, nf vn.r i ous methoci ::; of' re o:.·e i VL'l'
-. .:r r: eY:~..lu:;. l fo:.O · l . Tt~ .. : .. • • • · · - ! I C\o.' interfererK:r~ , Nv1 int..f:'rfr.r -~·t ; N .l. rt i...t.~r ~'t":rc nce .
rli quc·:::. of th'= ~>pPc trum ::.ien~-l.i..ure of' cavity - e ry::;t n.l reeeiver G ... ~nted H.n~l m~ FJ.n e x peri:uent.al predi c J ' ~"" ~ on i1. typlt.:a.l mi li tary
l • - •-- :'l,rr. r eport •· .. . t ~ ~ "• , . • • r ·; •!._ I~ of the spr.ctrum ~ignn-l . spu:-l r. 1.l:l r ))""~ r- 1 .1 'f; : ! t·e ] iablc and prCJvides mor<~ -'•: ".. ion Or t the r e r.eive r 1r,tr::=-f'erence dl.r.tracte rist i r: than prev i ous d i rec t ~- · r~ent mt: thod::;..
.D. :>1ml!l1ilry <.> .:. ... :-t11 pub l icat ion:> ann -w or k ft <:c· #" t ~ on th('; contract. Uur inr,- th e Pf~riod of 1 ; h .... b r uary 1963 t o 1) .Tuly 196L. - ..1. rt nt c d in Lhi:; rr:port . The cor.te nLn nnd c.:. • .! '" 1 t l l of t.hc fift ee r. r eport::; n.nd paper:; publ i sh e d nuri ng t h i :'"> ~'r--rioti ar t
Al) Ac·cc:ssi on :'!CJ . f,n[)ineer : ng .!:;xve r tr~cnt :itation, ·}eorn ia Tn s t1t ute of 'T't - -;-:-:::-:---=-::--.-:--,.....,=-:::-~·. W. 2tucK(:'y, ~,. D. ':-'r nr.1Il1ell, ,· ~. 1 an.-1 :: . w. Wnon .
f.h1 ri r.:: C 1 whi c!1 w1. l
.( l\~olS ' fll I t 1
~ 1 z. c a i'r • ~ • \ - ..
1~)6!1 to l) r. ;~ly 1964 , i s sne<l 3G-G)9 ANC- ~---).4 (1!:) , Conti. nua
Del;artmr:!lt tlf t he A11n.y Pro jec t: 1:;6-
w • have beer1 made. on n videbo.nd Fl-1 ~W!-3tem
· oyr:. rul.:;C' r:ode :nodulat ion . rr'CJ c va.l mti.P. "l 1't''·~ >:'rt ' • r~s sa.ry to pTuvldc pulse modu l ati o n ~ 1.b Jt, ~o.•J1i. ·.· !t \·:i l i be ~I :;r:d l'Y Lhc multi!)l P.xinp; ea ~d l t. ~1::; Wa !i
':!'lr.- t:·ar:mn:.tt e~ wit.!". n. t:or JL inuou.s b1nrtry ~,. oe t rain at (r~:r ) nf' the nt Jlf' t ... ~ t" Xer. The pul s er; con:.il;,tcd of
• :- §O r ~ .. tc::r var i ou ::; i.nterf~;> rP.nce cowli --:i ~.m~; ·wo.r : ·~t'' .. :; uro:-:. 1:/ Errol ~ . • \::' , de>tt:>"l"~ined t.. he tot .:tl nn.mb r.r 0 f !. .. ..... Jl~.cs -...:h l ·:b ·,...'r:!'c .:: · ~(:civcd in(·CJrT'.,..._,. - ,i . The f'r.'3.ction o f totr.t l
~ U: '."UI"I" I-". ·-r-ly HT·; rlr-: t e rmlm.! cl, ·'3.11d ... f'rnc l l , < .,,.,. ... r flte , wa ::; 1\.-H"d ac ·~ mcn~·Jre nf r;yzte ::J 'n:e e f .. _•-;.;, of v ••lp~ I s of r~ceiver :un.i.r4,.; w'<'::.·r- E:'V ~Ll lln ~-::· :1 . tr~ .. ~ ts tnclOJded CW int e r f ere nce, AM intcrfer -f'~ l<..' l' 1 :l1Xl. H / 1nt€'l' fercncc:,
'T1K· t~:• .. :i·,nio ue ::; of :- r -: :.et.i ng thf~ ::;p r.c tnun ~ignntui'e of cavity - ~rystal r~cc:ivers
c.:n pn :senl.P•l nne. Ute r c:r.u ltg m"""' n.n experimenta] predic:Li • •• ' I y· , ,. _1 mi l itnry l"Ci.:eiVe "!' nr e n"pcrted. ~c ::;ult s J!·,r11cr:.te t..lt r.Lt p!.·edi ~.·t.. ion ! L ..... 1 .m oip;mt-r~u~· t: 1'or :-.r-ur iou1,: r PSl"Xmse a 'lr • tr - ~ · t ic .. .. i '"'P. l i a ble D.nU provi(lP. ::; more inf'Qr"mal i011 Uri. \., b1; receiver ..... . ~ rl ) al'" •• ( ,, 1 than prP.Vi OU!-3 dli'CCt
. t method ~;.
fo. ~wrrrnnt·y oi' :-~ . ll pu bl i r: r:tt. ionz and work accom~ I~ 1 ,.,.. ";he cCJ n• . '. du.r inp; t he [..'E:'r ll'•tl of 15 Fr:b!' UM-r y 196"3 t o 1) ,,l u l y 1964 ar. ;.r-nt 1 in thi:-; rr~port. The Nmt enV> n.rul c l assif' icatlo n c of thP. "fi ftee n r ,.~ r• I paper s p ubl i shP.tl c'luring this !Jf:> t' iOd ~1' 1:' Ucscribed.
lTI'lC LA:J~~l V.!.ED REPOnrr l. n.a ctlo Communi cat i o ns.
2 . Tntcr f e rP-nce
I. C. W, !: tuck (-;y , R. D. T'ra.mmf:! l 1 , •. •r . 1 and E . W. Wood
iT. ·,.· ~ ·· ·· t ~0 . 261
./u:l!'f.f:' !' l y Report ~·Io ,
TT1 . Contnn~t No . Dfl ; G- O _.'"I~ .A.MC- ri2294( F. ) , !Jt>1 ·L, of t h E> Amy Proje- ct 1 ~;G .. 20)01 - D- 44 y
IV . lj:::A£T,, Fort Mo runouth , New ."!"ers~y
'JNCTA S~~;H'lED RF.FOR': 1 . Ra.Uio Communi r.Ation~
_. Interf' t:r e nce
.. , . :1iid i o Prequen(:y I nterferenc e
T, C . W. Stuckey, R. D. 'Prnmme ll, ~T r ., nnd F.. w. woo(l
TI. Report No . 26, Qua.r t e r ly R0.port I': a . 5
ITT. <~ tr ' No. DA 36- 039 •4(E) , Dept . of
lhc fu:m.y Proje ct F;6-205C1- D- 449
TV . U:iAF.T . -·..;;rt ~ '1 ,
New ... r 1

AD A<;ce ssj on rio. J::n6'1 [u:·ering Experime nt fJtat ion , Georgia l n;;ti tut e of Tec···""hn"'o""lo"'r;;:r"",---.:J\t"l-::c~ =o:.-,--.,. __ .,-_.,.;-r:""'l-, .~ . \J , ~Luc.: key, 11 . D . ·j'r Jl J J r., and E . w. Wo od.
ihe Pl' cv i o u.~ ': • \. •- 'HlVF:> bee n TIK-I.d( ~ on ':l w1. rl o l'l d .F'M r;y~;tem 1vi l l ut i l ize ~ .... · : : . • s -:. ~'-'J" G pu]se l'Ode rnCi<lula tion. 'l_·u e vn lu::t.ie
U:e system ln a PCM e n vironmr.n1' I w·- sary t o pr uvid r. lhJ. lt.i e mo lat ion ~·f if'll <!i_mJJ.l ·.:d t-> <-:. t ha.t whL· l! wi l l be l~ S ed by the mult t plE;!xi np; ~ ~ .~ r:-:. '!ld ~ wa.s
! · ' 1 • J1 'i.L l ne the l rant>mi tt P.r "W i t h a conli nuous hi.. nary train A..t
.. •• i tion fr e auenc:y (PRF) of t he multipl exe r . ':lH:! ... <'Ons i ~t ed nf •t • • .':lnd ~n p::; . 1'hc ., ' ~~r:t'orma.nce ;.mtler va r i ot .. .,.. rf'c:ruw:e ccndi -
Li v:::::. ;,; :;~. ::; men.r.ure·l by <ln (~ :·r IJ l' • '"' • t n "'y:::. t r:m wliic h d~tennit~ t ut a.] numbE;!r o; r Lran;;m t t l ed whi ch -..:pre T""-~ , l: ":-rP.c-tly . •nw [ ! ~--~ of Lotal :;:. ~ ;.e-.c; W·'lG 11 • _ \ , • thl.G f n~xtion , • • -ror raL~ J was
; l'ormnnt:- e. l'he ef f e cts o f vario u.G me lhods of rece i ver • • .. -. rf:'n ~:f' t c":~l:; .incl ~ded CW intcrf':!rence , AM lnter f{":l" -
o f' r• r ed. h·Ling the spectrqm :.,; i r;nn t.u re of c avity - t•r;ys tnJ receiver::. ;.;.nd. t he r~!mlt f-i of an exper jmenLal prcdh:L l on IJn <t t ypic ."l l rnill t. a ry
io:c GuJ ind i c:nte 1. h..-.~-t predi ction of ihe spcctrtlln ~ • .. --:-.· ).Xm:;t! a nd int. e nnodulat i on do.ta is rel iab le a nd provi :'l~s more
.:. nl 'm•mn Ll ~;.• •. r .:ei v0r lnteri"c: rc~ H t·e chilra0.ter i o.ti c than prev1 o u :=; d i rec t t:~e af.:urcmcm L r:~.et hoil:; .
J.. s·.1r.1nary of r:1 l .Publ i cnt1ons a nd 'WOl'k 1:\.t'C'ompl :1 :;hed on th~ cont r act. duri np; thL" ; :e r i oc"l ()f 1 5 YP.bru ~try 1~)63 tc; 15 .)u l y 1961. :~.re present ed in t h is r eport. 'i'he ~~(HI !. ""( .....
1 - •!r' ('al l ont> o f t.he f iftr:en r-epor ts a nd pa pen; pqbli~hed clur i ne
th1 ~ J r _.;.t lr : ,..··· i hed .
~:~f, incc~ ri. ng Expe!'i:ncnt st'iit 10n, _ :~ Inr;~~~:~=i~~ ~~:~-. ,...hn-o-,-lo-gy-,~J\t-,-ln-n.,--t~ , Geur e; i a J ~ . W. S i..~lC J.:c~:r , ::· . TJ. ·i'~ .. -:..mm.~ ll , ,,Tr., <'l n d E . W. Wood .
.. ~.eport No . 5, l) Yc brunry 1961..1 to 1~ ,Ju l y l~ , isGucc.l il h t>' . (Ccmt i·acL No . !JA )6- 059 AMC- 02294 ( •. : , Cont i nuo.-
~: : - L1"(185 , Dep rt&=nt of thr.• A.nny Pro,)cct : lG()-
trH~ ar·tc: r·, :>.v:~L-::rn:; t c ::;tr. hi'tv e bteen ma rlc on "1. wide bnnd Ff4 systtem \Vl ll • ultipim: P•' t.hnt empl oyG puls e ._:ode rnodu l<l i..ion. ·ro cvnlua Le
t ho:- :.;:;~t.cr.. ~ .. v i ro!Uncnt. i L w~:~.:; ne t'e55nry t o provide puJ ::. c mo<lulati on · . ·b :> l r::q_;.J~.~ec tt. ·:t wb i"l! .. · lJ..L ue ·..1:::. ~ · 1 lJy lhe :nul ti plcx Lug equipment . 'T'hiR W<l f:;
.r~l l r~\'cll~'Y th(.t.r·r-""' ' ' l•r•.!.~}- n· · · ,~ , .. .,....1 ~ · t.r;,.lr ·. ~111 .' ! : ~ll..>e repetit i otr '" II .o.t•rt, • r.,. "'J.;. · • . -,.1 of ~: .. t. crnf!LP ;;- p .:\nJ. c-r.c ;:.: . ~;y ::. L em pcrfor"Manr.-e under vari ou ~; l nt erfr:r~n<~ t:' l"Ondi -~i<. · n ~: w.:l::· mc ;-,::;:.n·(:1 L~t ··.n C'l'YOl" ·lf>tec:l l un !:>ystcm .. ,.:hi<:h determin~ cl t h e t t1tal number .. 1 1~ L:· :., ~ ll. • r •• 1 ., 1 ! . -:"r-t J . Th e f r .3.(:tion of Lotal r·.l..:.:::~":G .r : · •~"""':~" ... ~ · 'II! f::-a<."'t i on , or e r ror rfit ~ , wah (l,"!f.•·! a:.. n l:K·a.::.urc c:f ~..; y::; Lem pe1· ·,.. '!'· of" variouG nu~t.hods-; of rec e ive turJ.inu wc:r·e e~.·:;o,l u·:t r:d . Tnt. P r·rer~?nr:c t cstl3 lneluded CW inl€rferenc e , J\M t nl!::!Tf e r':" t t ·: ~, ~Ln ~t ]" ~··1 i nt.r .. r· f'f~'· e nc e .
t:l ' rr(: r1i ,~ t. i ng t h e ~-;:pectrum .slgnatur 0. of' cav1 t.y-crysta. l rccc l ver· :, n.nt1 Lhe res ults cf a n t 1.1"'r:· ~· ~ ,... "'1 t~c.n on a t..yp l t·al militn.ry
~r· ··· r·er:o!~te •l. !1o~ull::> i ndi c- a • "' • .u · : ' t"< .. Lhe ~pectrum sl~nR-
spur i ou:::; re::;ponse nnr1 1 ntP.rrnodu1atio n (l atH ls reliablP. <1nd provi de s mor e l nfor ::1n Lion t't1 the '!''P.I'f> Lver i r.t ert'crcnce cha racteri ct. i r: t han previ ou~ U:l: r e~.: L
•..., nt !'JPihud.s.
fl. c ... uronfJ.ry of Pwll pu.bli r: ~li. i Ci rJS -3.nd work - ~: 'r 1 c r- , ,.., • 1 r • .... ing ihe pe r ll}rt or' J ~~ FP1>ruary 1963 to 15 J ul y 1 /( ..,._, ; ...... , ... J • t.r ! · ',., r• _' or-.. . 'i'he contPnt.s ~nd c lnccif icallon~ of' t he f1 ftf:>en re portr. a wl pnper s pub l 15hP.d dur i ng t hi s p1 :r·lod are deccr H)t'!d,
'JI·;C .:...ASSlf'I.J::D REIDR~ 1 . ~adio Communi c a t ions
RaJ i o FT , ! nt ~~·fe't" 0.nc:0.
T. C' . W. Sluckey 1 H. D. l'ramm0.11 , ,Tr . , ~nd
E . W. Wood
TT . ~Ppo r·t No . ?6, Qua.rtc r l y Report. f·!o . 5
J! I . Contrn.ct t:o . ll.~ )6- 0)9 AMC- 02294( E), D<·nt . o f L.he A.rmy FTc: t 1 ·,c;_ 20)01- D- 41;9
IV. lS/I.ELJ Fort Mm:1mo·.tthJ H~w· ~7~ n:;!:'y
l~\C J:ASSHTJ::D Rl\FDR~
1. ;~ ad 1 o Cormnunicn.t t ons
2. TnL t> r f erence
) . Ra d io ~ ·re qucncy
Int e r·f er l::! nce
T. C . w. 8tuckcy , R. D. ':'rrumncl1, J r. 1 anil E. w. wooa
II . Rf·port No . 26, Quart!"'r 1y Report No. 5
TE. Contro.ct No . DA 36- 039 AMC - Or'20)4 (E ), Tle pt. oi' th~ M111Y Project lr.6-?0')0l - D- 4h9
IV . I TSAEL, fort _· uth, N0.'W ,Jersey
J\D Acc(':::.r>ion :~o . ~"\:· ·..i.ne Exrx=r l ment Stcil t on, Georgi a Tnst i t ut c of Tec·"'h=-=nocclo-:-:g.r- , ...,.At'""l-.>n--,-ti, ('.eorgia, C . W. 3tur:.>\ey, .:L D. 'Pr·Rl1ltlel l J ,· r ., ~;~.nd t: . W. Wood .
H~port No . 5, ~ 5 Feb r uar .{ 19611 to 1) .Tuly 1~64 , i. nsued i llus . (Contrn0.t No . DA 36- 059 AMC - 02294(E) , Conttnua
r. ~- 8718), IJ<··partment of the Arm,y Projec t : lG6-
Duri ntj t h(o> Il: ·e,.; :.ou;:; qu<.u· t eT .~ • lr t e sts li~ ve be en ma(le on~'!. wid~h.md i"t-1 ~y:.t~m whlch ¥,ril l. utl llze a mulli p:..,("Jr• '1 :. L , .. ~ 1 1 ~ ll!l) dul ~;~.t ion . ?o cvr...lual~ ! llt> i r. q PCM e n vi r·onrnent 1. t. w·:t.s ~ • f' ,. ·'- ;;:- _ i (le l)U lsc rno(l u. l;:.t ion
S lia~~ lntr:5 l ht L 'oo,'hi ;;h Wi l l be UGC:'l ·uy t h t=! M1ll'tipl eXil'lf2: ! ,. .: _ r • . - • wa£: c~d:i c.·vc: J l:,y r::•Yiul :Jting the t2·an::.::~.l Lt er wi th ::t. cont inuous b inary pulse t1"~ in al t be .i :. r '1 queney ( f'H F) of the ~~ll..i.pl exer. lhe pul::.c ::::; r: l":n:;i 5tP.d o f .1l t c 'rtie system pe :·furmanc: r. under variou::i i nter ff' r e>ne t- condi -t ion~ 'W~:~• mea~.; ·.Jr('~~ Ly <in e r - ~ ~ ~ - ... 1 ' ·.. 1 ~ • Ue Lermi nerl thf? t ot al m unh:-.: n i' lrans~itted pulGc ~ -....l ,L· ~ ~ or •• • •· r~-;· -.i · 7h e f.., ... ! 1~ Lot<ll ;>ul:-: ,... s re ~·e ivr: : i i rwvr r e..::tJ:v '<::-~. ·; detcnnjr~ed , (!. tV~ th is :fra·~t ic J r r • "" rate, wa~ u::.cd o.~ "! mea~ur r. of sy :..;ten pcrfor me.nce . Ti te effect s of var i ou:. methods of n ·•. :eiver t.1 :: i ue wer .. ,.. I . TrtLerl'err:nce Le . .;tc inc ·, ude d '..:W 1 nt e r f erenct: , Ar-t interfer -~"'11..!~ , n.n(l ! - • r enee .
o f t h.r! :; pJ:>c trum ~ign ~t Lure of' ~avt ty- c ryct <J.l re (..: e i vers D.r11l of an c xpt:!rlrne ntn.l p rJ:> dlctio n on 1:t Lypi cn1 military
n~J..lo r tecl . ~ e:-:·.:.;. 1 t~ indicttte thnt pl~edi ct ion of the spe~trum s i e n o. -t. -.- r - _ .. rl..:J"~ .._ r• ~ :·and lntermociu1at hm Uat<: is reliab le a nd provi d(':5 more inl'<.n·rnat. ion tm the r et·ei ver int(:- r .... opor ... ~., chl:i.!'a ct erist i ~ than prcvi ous direct rne :?..S'..l.rcmc:ni !rte thods .
A s ununary c: f .:-~ll pu'ulicationr; a nd \o" t~rk a ccomplit>heil on i he c~ L dur i nr, t he : < ... • • ' l - r 1 ' - j to l ) : tJly 1964 an:- presented i n lhi~ report.. '!11<7
' .. r-~·· t lo') n ::; o f t he fifte e n r eports and pa~r:> publ i~hcd Uuring
/ , !..:;
Eng ineering 1,
(' . ·'i<: . Sl l't"!-.ey;
,. lN't,
t o 15 •.'uly 1964 , i ooue<l AMC- - -- )4(~ ), Conti nun
Army Pr o ,i " <'t : l GG-
~~t!~ i n(' t !t~"' tW"V i nu. ;.; uu:t !~ter , ~yct ct:t r> le lj ll:i. llav~ b~0.n -:nadP on :t wi dcbnn<l F'M sy;,tern ..... h Ld! "'' .:.:.1 ~ti ..:.i z c· a. wul l l plex"!'r that i!mpl\)ys fl'..ilse c-od e rnoliu1n.l lon . 'J'o ~valuate 1 L•: ...... :.;t ee: in ·., :•cJ.l Pnvi •·c,nr: 1 i t W"·:'cti :ll'!CC . r • ·.. t .c pll1 :i.e :nodul at ion .... ~.i.;:: :;i:notl:tl"':; lb:.tt ;,;hi :h \. , l c u :;~d 'JY .. ,... • · · 1 1 f' ~l ~ equi pment . Tlti::; wn.s
lJlt' L~·am~mitt cr y.•ith 1 ~!- ~ .... inary pul .... ' .e~t.
( n~F) of the: mult i plexer . 'ihe pulst'!s l'Onsist ed of a l tc.:::-r.ctt t: zcrn.s <;,nri cme s . ~y:;t(:m perfo rmance tm<1P. r var i ous i nterference c ondi-t j,·>nr: '>rt :· r::ea.-:. ·.lr c~c by <"n c n ·or 'let.e o:- t i on ::;y s t e tr1 wh ic h det r.r mi ne<l Lb e t otal numbP. r c :"' t r rm;,mille·l \...'hie:h 'W("l" f:' ;e ·:~ ! ,.. 1 ---~·ectly . 'I'he fra.~t ion of total
~l ;~:; ~~.~ r. ·t mP.:~:.; ~Ir:11 ~:~.!·~~~~ :.~~ ~~Q~ dct.0.r- ~ \ ,1A "~.r~~~~ s f:;(=:~~~~u~\~=~~~~s r ~~ ; ~ •. t Lr.;,nlnr: w·z. r c C\'fl ~ u -,. L ~ :l. Le s t s included CW inler .ference 1 AM 1 n L~? r r t:>rcnc c: , <lntl ? !.: lnterfr.r~n c· A .
'!'h.: techni que ;; of p·e cti •1 .. •• I,... 1~ · • . t'l .,r . Lty- cr;ystal re~P.lve~·s ~re pr c:lt:!ttle c.t a.nd the r • • ~· t c t r \ ' • . r" • c "'tr n on a t.ypica l rnili t <ll""Y J e ~..·~lver nr0. r er,.m· Led . Hcsult:::. jndl eale that pr0.dict. ion of t he 8pectrwn r, 1
turr~ t' nr :·.;purlou s resp:msc and l ntermodulat1 on dr'lt.:t is reli ~b lc .1.nd provide;:, mvr e it- --.: te r e e eiver i nLPrference c har a ctc:'!·i cl lc Unm previous d1ref't
r.~ _ .. .. ·-l)ds .
A ctunm<lry of tt ll publi t•a iionG ancl work ·~ • r t - ... ,.. t he JA.:rlod t}f 1 ·.~ ~cDruary 196) t.o 15 .. :uly J • rt ; :~ & ... & • r -. 1.. The ·.:ont(~nt~ ~nd r·lass i f i cations of t he fiftee n re port.:=; A..nd pF!.pers publ ished duri ng thi :;. pcrioJ an: de :5 l"r i bed.
ll'NC TAfl f: J FTF.D TtF.PCJRIT' l. Ra.JJ.Ci Conmrun i ea. Ll on G
? . I nterferen r. e
Had io fre r;,uency I n t e rference
. • C: . W. :itu~k~y , fL D. • 11, .Jr. 1 a nd
~ ... ,.; .,. Wuod
n . ~:o. 26 , . .. rl rly Re port ~:o . 5
IT! . r l' t No . DA ~~G - 039 AMC - 02291< (!\), Tlt.':>l . <>r t.hr. A1'7fr.;/ Pro,ie ct l ~ ti -20C,01-D- 44')
T'V . !l fiAFL , ForL Monmouth, New .rc:rsr.y
IINCT.Af.f,IF'IED REIDRT 1. Radio Corrommieat ion z
2 . Tnt.P. r rerence
' . Pa.dio Fre quency lnt0.r:t" f" r ene e
T . C. W. Stuckey, n. D. 'l'rammc11, ,Tr· . J and E. W. Wood
TT. ~,...f'O,...t. Nl"'l, ?h t . t r .. 7 , .... ... t r.:o . )
ITT . Coutr·o.c· t No . DA )6- 03~1 AMC- 0??')1: (E), Dent . or t he JlrTI\)' Project l >;G-20501-D- 449
A f. r•l'rt ut h , New Jer zc:y