BLUP for genetic evaluation of plants in non-inbred families of annual crops
Upload
theconsultationcenterCategory
view
1download
0
JOURNAL OF BONE AND MINERAL RESEARCHVolume 24, Number 4, 2009Published online on December 8, 2008; doi: 10.1359/JBMR.081224� 2009 American Society for Bone and Mineral Research
Phenotypic Integration Among Trabecular and Cortical Bone TraitsEstablishes Mechanical Functionality of Inbred Mouse Vertebrae
Steven M Tommasini,1 Bin Hu,2 Joseph H Nadeau,3 and Karl J Jepsen2
ABSTRACT: Conventional approaches to identifying quantitative trait loci (QTLs) regulating bone mass andfragility are limited because they examine cortical and trabecular traits independently. Prior work examininglong bones from young adult mice and humans indicated that skeletal traits are functionally related and thatcompensatory interactions among morphological and compositional traits are critical for establishing me-chanical function. However, it is not known whether trait covariation (i.e., phenotypic integration) also isimportant for establishing mechanical function in more complex, corticocancellous structures. Covariationamong trabecular, cortical, and compositional bone traits was examined in the context of mechanical func-tionality for L4 vertebral bodies across a panel of 16-wk-old female AXB/BXA recombinant inbred (RI)mouse strains. The unique pattern of randomization of the A/J and C57BL/6J (B6) genome among the RIpanel provides a powerful tool that can be used to measure the tendency for different traits to covary and tostudy the biology of complex traits. We tested the hypothesis that genetic variants affecting vertebral size andmass are buffered by changes in the relative amounts of cortical and trabecular bone and overall minerali-zation. Despite inheriting random sets of A/J and B6 genomes, the RI strains inherited nonrandom sets ofcortical and trabecular bone traits. Path analysis, which is a multivariate analysis that shows how multipletraits covary simultaneously when confounding variables like body size are taken into consideration, showedthat RI strains that tended to have smaller vertebrae relative to body size achieved mechanical functionalityby increasing mineralization and the relative amounts of cortical and trabecular bone. The interdependenceamong corticocancellous traits in the vertebral body indicated that variation in trabecular bone traits amonginbred mouse strains, which is often thought to arise from genetic factors, is also determined in part by theadaptive response to variation in traits describing the cortical shell. The covariation among corticocancelloustraits has important implications for genetic analyses and for interpreting the response of bone to genetic andenvironmental perturbations.J Bone Miner Res 2009;24:606–620. Published online on December 8, 2008; doi: 10.1359/JBMR.081224
Key words: path analysis, biomechanics, inbred mice, vertebral body, phenotypic integration
INTRODUCTION
BONE IS A highly evolved, complex system in whichmultiple compositional and morphological traits con-
tribute to mechanical functionality (i.e., stiffness andstrength for everyday use). A general paradigm of complexsystems such as bone is that different genotypes lead todifferent sets of physical traits resulting in similar func-tions. Although no single gene is responsible for estab-lishing functionality, genetic variants affecting multipleaspects of a structure can potentially threaten functionality.Additionally, the design challenge of building functionalbones is similar to that of building a bridge where func-tional structures must be built as efficiently as possibleusing limited resources. Fortunately, nature found a way tomeet this design challenge.
Functional (i.e., compensatory) interactions among bonetraits play a critical role in determining normal mechanicalfunction. However, little is known about the nature of thisphenotypic integration in the context of genetic variants af-fecting skeletal size, mass, and quality, which are key deter-minants of bone functionality and fracture susceptibility.(1–9)
In long bones, phenotypic integration of morphological andcompositional bone traits is critical for establishing mechan-ically functional structures by compensating for genetic var-iants leading to slender phenotypes. However, phenotypicintegration also contributes to fracture susceptibility by giv-ing rise to genotype-specific trait sets that are more dam-ageable and brittle.(10,11) Thus, improved understanding ofthe biological processes that contribute to phenotypic inte-gration may provide a novel approach to identifying sets oftraits that better predict fracture risk.
We expect phenotypic integration is not limited to longbone but is a general paradigm affecting all skeletal sites
1New York Center for Biomedical Engineering, CUNY Graduate Center, Department of Biomedical Engineering, City College ofNew York, New York, New York, USA; 2Leni & Peter W. May Department of Orthopaedics, Mount Sinai School of Medicine, NewYork, New York, USA; 3Department of Genetics, Case Western Reserve University School of Medicine, Cleveland, Ohio, USA.
The authors state that they have no conflicts of interest.
606
including more complex corticocancellous structures.Fractures typically occur in metaphyseal regions such asthe distal radius, proximal femur, and vertebral body.(12)
Previous studies conducted genetic analyses of cortico-cancellous structures by examining cortical and cancelloustraits independently,(13–15) rarely considering the interde-pendence among these traits. However, growing evidencesuggests that sets of interdependent morphological andcompositional traits, in addition to BMD, provide moreaccurate predictions of fracture risk in more complex cor-ticocancellous sites.(16) Previous work in inbred mousevertebrae showed that individual strains do not inherit asingle bone trait, but a set of trabecular, cortical, andcompositional traits that reflect the organ-level mechanicalfunctionality of adult vertebrae.(17) Although never formallytested, other studies speculate that similar coadaptive mech-anisms observed in long bones exist in corticocancellousstructures.(18,19)
Knowing which traits are functionally related and howthese interactions define bone stiffness and strength willadvance our understanding of the biological origins of traitvariation and will provide alternative phenotypes that canbe used in genetic analyses to identify fracture suscepti-bility genes. Previous studies have generally segregatedcortical and trabecular traits and have not considered thatphenotypic values of trabecular architecture may dependon cortical traits. Correlations among adult cortical andtrabecular traits are thought to arise in part from a commonstimulus (e.g., mechanical forces) occurring during growth.(20)
Bone cells work in a coordinated manner to construct afunctional structure designed to share load among its com-ponents with limited available resources (i.e., the amount oftissue is limited to minimize mass).(21,22) As the relativeamounts of cortical and trabecular tissue vary in a structure,the load-sharing among these components also varies.(23,24)
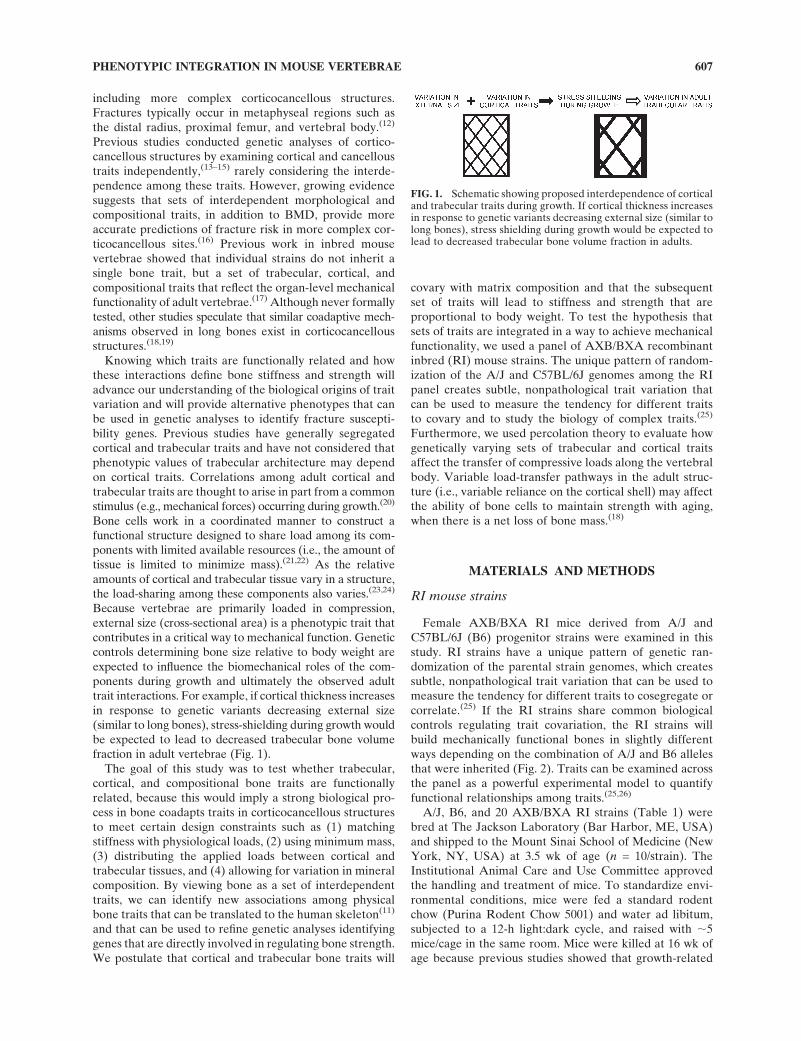
Because vertebrae are primarily loaded in compression,external size (cross-sectional area) is a phenotypic trait thatcontributes in a critical way to mechanical function. Geneticcontrols determining bone size relative to body weight areexpected to influence the biomechanical roles of the com-ponents during growth and ultimately the observed adulttrait interactions. For example, if cortical thickness increasesin response to genetic variants decreasing external size(similar to long bones), stress-shielding during growth wouldbe expected to lead to decreased trabecular bone volumefraction in adult vertebrae (Fig. 1).
The goal of this study was to test whether trabecular,cortical, and compositional bone traits are functionallyrelated, because this would imply a strong biological pro-cess in bone coadapts traits in corticocancellous structuresto meet certain design constraints such as (1) matchingstiffness with physiological loads, (2) using minimum mass,(3) distributing the applied loads between cortical andtrabecular tissues, and (4) allowing for variation in mineralcomposition. By viewing bone as a set of interdependenttraits, we can identify new associations among physicalbone traits that can be translated to the human skeleton(11)
and that can be used to refine genetic analyses identifyinggenes that are directly involved in regulating bone strength.We postulate that cortical and trabecular bone traits will
covary with matrix composition and that the subsequentset of traits will lead to stiffness and strength that areproportional to body weight. To test the hypothesis thatsets of traits are integrated in a way to achieve mechanicalfunctionality, we used a panel of AXB/BXA recombinantinbred (RI) mouse strains. The unique pattern of random-ization of the A/J and C57BL/6J genomes among the RIpanel creates subtle, nonpathological trait variation thatcan be used to measure the tendency for different traitsto covary and to study the biology of complex traits.(25)
Furthermore, we used percolation theory to evaluate howgenetically varying sets of trabecular and cortical traitsaffect the transfer of compressive loads along the vertebralbody. Variable load-transfer pathways in the adult struc-ture (i.e., variable reliance on the cortical shell) may affectthe ability of bone cells to maintain strength with aging,when there is a net loss of bone mass.(18)
MATERIALS AND METHODS
RI mouse strains
Female AXB/BXA RI mice derived from A/J andC57BL/6J (B6) progenitor strains were examined in thisstudy. RI strains have a unique pattern of genetic ran-domization of the parental strain genomes, which createssubtle, nonpathological trait variation that can be used tomeasure the tendency for different traits to cosegregate orcorrelate.(25) If the RI strains share common biologicalcontrols regulating trait covariation, the RI strains willbuild mechanically functional bones in slightly differentways depending on the combination of A/J and B6 allelesthat were inherited (Fig. 2). Traits can be examined acrossthe panel as a powerful experimental model to quantifyfunctional relationships among traits.(25,26)
A/J, B6, and 20 AXB/BXA RI strains (Table 1) werebred at The Jackson Laboratory (Bar Harbor, ME, USA)and shipped to the Mount Sinai School of Medicine (NewYork, NY, USA) at 3.5 wk of age (n = 10/strain). TheInstitutional Animal Care and Use Committee approvedthe handling and treatment of mice. To standardize envi-ronmental conditions, mice were fed a standard rodentchow (Purina Rodent Chow 5001) and water ad libitum,subjected to a 12-h light:dark cycle, and raised with ;5mice/cage in the same room. Mice were killed at 16 wk ofage because previous studies showed that growth-related
FIG. 1. Schematic showing proposed interdependence of corticaland trabecular traits during growth. If cortical thickness increasesin response to genetic variants decreasing external size (similar tolong bones), stress shielding during growth would be expected tolead to decreased trabecular bone volume fraction in adults.
PHENOTYPIC INTEGRATION IN MOUSE VERTEBRAE 607

changes in traits slowed before this age.(27) Lumbar ver-tebral segments (L4–L6) were harvested and stored frozenat 2208C in PBS with added calcium.(28)
Physical bone traits
Microarchitectural traits and tissue mineral density (TMD)were measured using an eXplore Locus SP PreClinicalSpecimen MicroComputed Tomography (mCT) system(GE Healthcare, London, Ontario, Canada). The L4 ver-tebrae were scanned at 16-mm voxel resolution. Vertebralbodies were isolated for analyses and cortical bone wassegmented manually from trabecular bone (Fig. 3).(17)
Cortical and trabecular volumes were thresholded sepa-rately to differentiate bone from nonbone voxels asdescribed previously.(29) Trabecular and cortical morphom-etry, including trabecular bone volume fraction (BV/TV),trabecular thickness (Tb.Th), trabecular number (Tb.N),trabecular separation (Tb.Sp), cortical area (Ct.Ar), andcortical thickness (Ct.Th), were assessed using MicroViewAdvanced Bone Analysis (v. 1.23; GE Healthcare). Ver-tebral body size was measured in 2D as total cross-sectionalarea (Tt.Ar) averaged for all transverse sections along theheight of the vertebral body per bone (16-mm resolution)and in 3D as total vertebral volume (Tt.V = total bonevolume [Tt.BV] + marrow volume). The relative amount ofcortical area (RCA) was calculated as Ct.Ar/Tt.Ar. TMDwas calculated from the mCT images by converting thegrayscale output of bone voxels in Hounsfield units (HU)to mineral values (mg/ml of hydroxyapatite) through theuse of a calibration phantom containing air, water, andhydroxyapatite (SB3; Gamex RMI, Middleton, WI, USA).TMD is defined as the average bone voxel HU value di-vided by the average HU value of the hydroxyapatitephantom multiplied by 1130 mg/ml (hydroxyapatite phys-ical density). The same calibration phantom was included
in all scans to adjust mineral density measurements forthe variability in X-ray attenuation inherent to inde-pendent scan sessions.(10) Trabecular TMD (Tb.TMD),cortical TMD (Ct.TMD), and total TMD (Tt.TMD) werecalculated.
Network model and percolation parameters
The corticocancellous architecture of a complex skeletalsite such as the vertebra or proximal femur is a connectednetwork of bone capable of transferring mechanical loads.A network model based on percolation theory allows us toanalyze quantitatively the load transferring behavior of theemergent structure as a function of the connected com-ponents.(30) The network topology of the vertebral bodieswas assessed from the thresholded mCT images as de-scribed previously.(30) Each RI strain consists of a distinctset of physical traits that are expected to transfer load inunique ways depending on the proportions of cortical andtrabecular tissue volume fractions. Network percolationtheory parameters provided an integrative and quantitativeapproach to evaluate how different combinations of corti-cal and trabecular traits transfer load along the cranial–caudal axis. The corticocancellous architecture of the ver-tebral body was treated as a connected network whosefunction is to support compressive loads. 2D coronal sec-tions (two per bone) were skeletonized, and nodes andbranches were identified using an iterative thinning algo-rithm (Matlab; The Mathworks, Natick, MA, USA). These2D sections were taken from each bone at approximatelyone third and two thirds of the anteroposterior width of thevertebral body. The skeleton graphs were converted intonetwork maps by considering the cortical surface as onehighly connected node or hub.
Percolation parameters were calculated as describedpreviously.(30) The inputs into the percolation algorithm
FIG. 2. Coronal sections of vertebral bodiesshowing widely varying architectures amongA/J, B6, and representative AXB/BXA RIstrains: AXB10, AXB2, AXB4, and BXA25.Each RI strain contains unique, approxi-mately equal proportions of genetic contri-butions from the A/J (white chromosomalsegments) and B6 (black chromosomal seg-ments) progenitor inbred mouse strains.
608 TOMMASINI ET AL.

are the set of nodes with their connected neighboringnodes and the starting and endpoints or surfaces. Thus,the network inputs did not take morphology of individualtrabeculae or the cortex into consideration. The onlypredefined rules for our network were that informationcan only travel from the superior surface toward the in-ferior surface (i.e., load applied to the superior surfacecan only travel to connected nodes in the network locatedeither horizontal to or below) and the information isself-avoiding (i.e., information cannot travel to a node it
has been to previously). The correlation and chemicalpath lengths measure the load sharing capacity of thenetwork, which is expected to vary with genetic back-ground. The chemical length (ChemL) is the number ofnodes along the shortest path of the percolating networkthat connects opposite boundaries. The correlation length(CorrL) is the average number of nodes along all pathsbetween connected opposite boundaries. To test howgenetic variation in the combination of trabecular andcortical traits influences network behavior (i.e., load
TABLE 1. VARIATION IN VERTEBRAL BODY SIZE, MORPHOLOGY, COMPOSITION, AND WHOLE BONE STIFFNESS AND STRENGTH
AMONG A/J, B6, AND 20 AXB/BXA RI STRAINS
nBW(g)
Height(mm)
Tt.V(mm3)
Tt.Ar(mm2)
BV/TV
Tb.N(mm21)
Tb.Th(mm)
Tb.Sp(mm)
Tb.TMD(mg/ml)
Ct.Th(mm)
Ct.Ar(mm2)
Ct.TMD(mg/ml)
Tt.TMD(mg/ml) RCA
S(N/mm)
FU
(N)
A/J 10 18.7 1.9 2.45 1.40 0.20 4.97 0.040 0.16 680.6 0.09 0.34 871.4 802.9 0.24 171.1 17.4
1.7 0.1 0.21 0.09 0.02 0.31 0.002 0.01 22.4 0.00 0.02 16.9 35.2 0.01 82.5 4.4
B6 10 20.6 2.2 3.30 1.66 0.25 5.91 0.040 0.13 691.5 0.10 0.42 891.3 811.7 0.25 161.0 24.5
0.9 0.1 0.18 0.04 0.02 0.47 0.001 0.01 22.8 0.01 0.02 22.6 31.6 0.01 65.9 3.6
AXB1 9 20.8 2.2 2.83 1.44 0.17 4.28 0.040 0.20 682.5 0.09 0.35 925.9 844.1 0.24 102.8 21.6
1.0 0.1 0.16 0.10 0.01 0.31 0.001 0.02 12.9 0.01 0.03 31.8 143.8 0.02 41.5 4.0
AXB2 10 20.1 1.8 2.46 1.51 0.21 5.27 0.040 0.15 663.4 0.09 0.36 867.3 786.1 0.24 110.0 22.2
1.1 0.1 0.22 0.09 0.02 0.31 0.002 0.01 50.7 0.01 0.03 57 42.9 0.02 43.1 4.2
AXB4 10 15.9 1.7 1.68 1.11 0.17 4.55 0.037 0.18 616.7 0.08 0.27 821.4 753.3 0.25 65.7 14.1
1.3 0.1 0.14 0.07 0.02 0.61 0.002 0.03 35.6 0.01 0.02 28.7 36.9 0.02 30.4 5.9
AXB5 9 19.3 2.0 2.26 1.29 0.14 3.62 0.039 0.24 651.8 0.08 0.31 831.0 776.3 0.24 75.2 13.9
1.1 0.1 0.10 0.09 0.01 0.17 0.002 0.01 45.1 0.00 0.03 58.1 41.0 0.01 39.8 3.3
AXB6 10 24.02 2.3 3.41 1.64 0.22 4.97 0.044 0.16 722.6 0.10 0.41 927.6 849.4 0.25 150.0 29.5
1.8 0.2 0.56 0.20 0.04 0.54 0.004 0.03 70.7 0.01 0.06 89.3 57.0 0.02 51.6 7.9
AXB8 9 17.6 2.1 2.56 1.35 0.13 3.63 0.039 0.24 592.8 0.08 0.30 851.7 775.5 0.22 98.9 12.7
2.9 0.2 0.23 0.08 0.00 0.40 0.002 0.02 43.4 0.00 0.02 77.7 57.2 0.01 61.9 2.4
AXB10 9 21.4 2.0 2.94 1.58 0.25 5.68 0.043 0.13 699.7 0.09 0.37 895.8 811.4 0.23 122.0 24.2
1.6 0.1 0.22 0.12 0.05 0.54 0.004 0.02 43.1 0.01 0.04 36.2 77.0 0.03 44.5 9.4
AXB12 9 19.8 2.0 2.78 1.58 0.21 5.15 0.040 0.15 635.3 0.07 0.32 814.5 735.8 0.21 89.6 15.0
1.6 0.1 0.26 0.08 0.01 0.31 0.001 0.01 20.8 0.00 0.02 36.0 52.8 0.01 38.5 4.2
AXB13 10 19.0 2.0 2.67 1.47 0.21 5.25 0.041 0.15 662.8 0.08 0.35 844.0 774.7 0.24 113.5 19.2
1.4 0.1 0.23 0.11 0.01 0.12 0.001 0.01 16.2 0.00 0.02 27.6 39.2 0.02 48.0 6.3
AXB15 10 24.8 2.3 3.52 1.68 0.20 4.74 0.042 0.17 680.3 0.09 0.40 892.3 813.1 0.24 111.5 21.4
1.4 0.1 0.31 0.13 0.01 0.14 0.001 0.01 57.1 0.01 0.02 29.7 37.2 0.02 53.2 6.5
AXB18 10 18.7 2.1 2.84 1.50 0.15 4.30 0.036 0.20 557.4 0.07 0.30 795.0 714.2 0.20 65.3 10.5
2.8 0.2 0.56 0.17 0.02 0.67 0.001 0.03 54.3 0.01 0.04 71.5 47.4 0.01 33.5 4.4
AXB19 10 22.9 2.0 2.94 1.55 0.18 4.66 0.039 0.18 650.9 0.09 0.37 886.9 808.4 0.24 151.2 17.8
1.8 0.4 0.73 0.13 0.02 0.61 0.002 0.02 35.9 0.01 0.02 42.3 58.9 0.02 61.6 4.6
AXB20 10 15.2 1.9 3.42 1.39 0.18 4.82 0.037 0.17 561.1 0.07 0.28 778.7 694.0 0.20 80.9 11.4
2.7 0.2 0.42 0.11 0.02 0.32 0.002 0.02 39.8 0.01 0.02 65.9 61.4 0.01 32.3 2.5
AXB23 10 20.5 1.9 2.55 1.44 0.25 5.67 0.043 0.13 718.8 0.09 0.36 892.8 824.6 0.25 128.4 23.0
0.9 0.1 0.09 0.08 0.01 0.25 0.002 0.01 39.3 0.00 0.01 37.5 36.8 0.01 31.9 3.5
AXB24 9 19.9 2.2 2.94 1.47 0.27 6.32 0.043 0.12 729.0 0.09 0.36 885.7 816.5 0.25 163.9 24.9
0.6 0.1 0.21 0.07 0.02 0.60 0.002 0.01 18.5 0.01 0.02 35.4 37.3 0.01 131.1 6.7
BXA7 10 23.1 2.1 3.35 1.80 0.15 3.58 0.042 0.24 685.4 0.10 0.45 891.6 830.1 0.25 131.1 21.8
1.1 0.1 0.31 0.09 0.03 0.60 0.001 0.05 21.5 0.01 0.04 24.0 35.2 0.01 36.5 4.9
BXA14 10 23.3 2.2 3.18 1.52 0.25 5.75 0.044 0.13 708.0 0.09 0.37 887.8 814.5 0.25 139.3 29.0
1.8 0.1 0.22 0.07 0.01 0.19 0.001 0.01 34.1 0.00 0.02 41.3 35.7 0.01 36.9 3.8
BXA17 10 22.6 2.2 3.09 1.53 0.25 5.97 0.042 0.13 666.6 0.08 0.35 846.3 769.2 0.23 140.5 25.0
1.0 0.1 0.28 0.10 0.03 0.58 0.001 0.02 33.5 0.01 0.02 50.0 53.2 0.02 46.3 5.2
BXA25 10 24.1 2.1 3.08 1.61 0.28 6.31 0.044 0.11 734.6 0.10 0.42 930.9 849.1 0.26 163.2 30.6
1.7 0.0 0.15 0.07 0.01 0.16 0.002 0.00 15.3 0.01 0.03 17.0 35.5 0.01 72.0 8.0
BXA26 10 17.9 1.9 2.40 1.44 0.19 4.80 0.040 0.17 657.7 0.09 0.35 864.4 791.1 0.25 146.9 19.2
1.3 0.0 0.21 0.08 0.01 0.24 0.001 0.01 28.7 0.00 0.02 47.3 39.9 0.01 67.6 2.6
Mean 20.5 2.0 2.80 1.5 0.21 5.01 0.041 0.17 665.9 0.09 0.36 867.9 791.6 0.24 121.9 20.4
SD 2.6 0.2 0.44 0.2 0.04 0.82 0.003 0.04 49.4 0.01 0.04 41.4 43.2 0.02 49.8 4.9
RI strains are designated by uppercase abbreviations of both parental strain names, with the female strain written first, and separated by an X. All
members of RI sets involving the same two strains are serially numbered. Data shown as mean ± SD.
PHENOTYPIC INTEGRATION IN MOUSE VERTEBRAE 609

transfer) CorrL, ChemL, the number of load transfer paths(#paths), the number of nodes (#nodes), and the percent-age of existing links connected to the cortex (%hub) werecalculated.
Whole bone mechanical properties
Whole bone mechanical properties of intact L4 vertebrae(n = 10/strain) were measured by compressing the vertebralbody with a 3-mm-diameter platen as described previ-ously.(17) Mechanical properties, including failure load(FU) and stiffness (S), were measured using a servohy-draulic materials testing machine (Instron model 8872;Instron, Canton, MA, USA). FU was defined as the highestload preceding a rapid decrease in the measured load.
Covariation among adult traits
Cosegregation of traits after genetic randomization canbe examined using correlation analysis. Trait means andSDs were calculated for each AXB/BXA RI strain. Linearregressions between each of the traits were conductedacross the RI panel using the mean values for each RIstrain. Pearson correlation coefficients were calculated forall trait–trait comparisons to test whether the morpholog-ical traits, mechanical properties, and network parameterscorrelated significantly with the architectural and com-positional traits. The correlation matrix retained themagnitude and direction of each correlation coefficient.Statistically significant correlations were identified by es-tablishing a threshold correlation magnitude determinedusing permutation tests,(25,31) which corrected for multiplecomparisons and established the maximum correlationcoefficient that arises when the bone traits are randomlyarranged across the RI panel.
Narrow sense heritability
The narrow sense heritability, h2, estimates the propor-tion of phenotypic variation attributable to additive geneticeffects. h2 was calculated for all traits and mechanicalproperties using the method described by Belknap.(32) Forthe RI panel, h2 was determined as VA/(VA + VE), whereVA is the additive genetic component of variance, VE is theenvironmental component of variance, and VA + VE is thephenotypic variance, VP. The value of h2 was estimated
using the R2 value from a one-way ANOVA of traits acrossthe RI panel.
Path analysis
Path analysis is a multivariate analysis that shows howmultiple traits covary simultaneously when confoundingvariables like body size are taken into consideration. Pathanalysis also offers the flexibility required to representuser-defined models based on hypotheses that best match aparticular situation (i.e., directed relationships).(10,33–35)
Path analysis allowed us to test whether specific functionalrelationships among trabecular, cortical, and composi-tional bone traits exist for the AXB/BXA RI mouse ver-tebrae. Three path models were examined to test specificaspects of the trait correlations. Trait values were con-verted to Z-scores as Z-scorei = (xi – xref)/SDref, where xi isthe trait value for each mouse and xref and SDref are themean and SD, respectively, calculated using the averagevalues for all 20 AXB/BXA RI strains. Z-transformationstandardizes the variables so each trait shows a mean of 0and an SD of 1 across the RI panel.
Path coefficients, which represent the magnitude of thedirect and indirect relationships between traits, were cal-culated using the Z-transformed data (LISREL v.8.8;Scientific Software International, Lincolnwood, IL, USA).Structural equations were constructed using the path co-efficients to specify the interconnected relationships.Observed and model-implied covariance matrices were com-pared using maximum likelihood estimation, and overallfit was determined by a x2 test. Unlike conventional nullhypothesis testing, Path analysis favors the a priori, theory-based model such that models are only rejected if the ob-served data and the expectations derived from the modeldo not match (i.e., if p < 0.05).(33) The root mean squareerror of approximation (RMSEA) was also reported and isa measure of fit adjusted for population size and degrees offreedom.(36,37) For RMSEA, the p value represents thesignificance of fit with p < 0.05, indicating close fit, 0.05 < p< 0.08 indicating fair fit, and p > 0.10 indicating poor fit.(36)
Preferred models should meet certain standards including(1) it should have at least 1 df; (2) the p value associatedwith x2 should be >0.05; (3) individual path coefficientsshould be significantly different from 0 based on a t-test; (4)path coefficients should be >0.05; and (5) a substantial
FIG. 3. Cortical bone was segmented man-ually from trabecular bone in mCT imagesof L4 vertebral bodies. Trabecular traits in-cluded BV/TV, Tb.N, Tb.Th, Tb.Sp, andTb.TMD. Cortical traits included Ct.Ar,Ct.Th, and Ct.TMD.
610 TOMMASINI ET AL.
proportion of phenotypic variance of the endogenousvariables (i.e., R2 values associated with structural equa-tions) should be explained by the model.(26)
Path model to test for phenotypic integration among
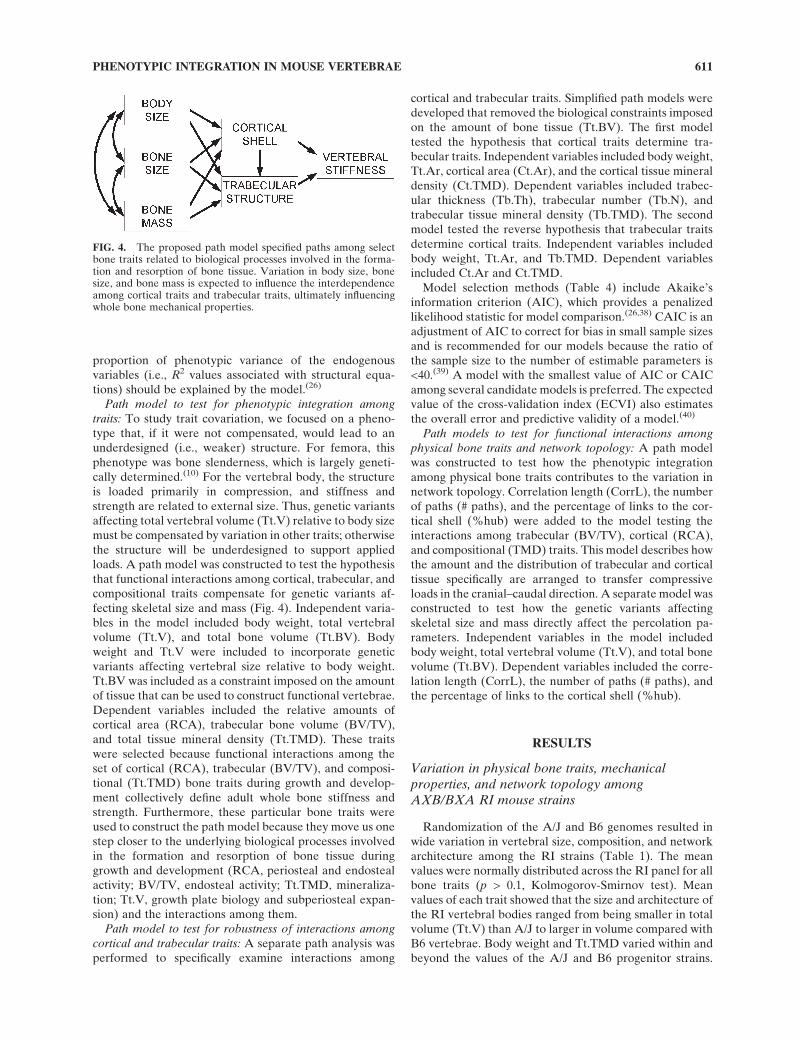
traits: To study trait covariation, we focused on a pheno-type that, if it were not compensated, would lead to anunderdesigned (i.e., weaker) structure. For femora, thisphenotype was bone slenderness, which is largely geneti-cally determined.(10) For the vertebral body, the structureis loaded primarily in compression, and stiffness andstrength are related to external size. Thus, genetic variantsaffecting total vertebral volume (Tt.V) relative to body sizemust be compensated by variation in other traits; otherwisethe structure will be underdesigned to support appliedloads. A path model was constructed to test the hypothesisthat functional interactions among cortical, trabecular, andcompositional traits compensate for genetic variants af-fecting skeletal size and mass (Fig. 4). Independent varia-bles in the model included body weight, total vertebralvolume (Tt.V), and total bone volume (Tt.BV). Bodyweight and Tt.V were included to incorporate geneticvariants affecting vertebral size relative to body weight.Tt.BV was included as a constraint imposed on the amountof tissue that can be used to construct functional vertebrae.Dependent variables included the relative amounts ofcortical area (RCA), trabecular bone volume (BV/TV),and total tissue mineral density (Tt.TMD). These traitswere selected because functional interactions among theset of cortical (RCA), trabecular (BV/TV), and composi-tional (Tt.TMD) bone traits during growth and develop-ment collectively define adult whole bone stiffness andstrength. Furthermore, these particular bone traits wereused to construct the path model because they move us onestep closer to the underlying biological processes involvedin the formation and resorption of bone tissue duringgrowth and development (RCA, periosteal and endostealactivity; BV/TV, endosteal activity; Tt.TMD, mineraliza-tion; Tt.V, growth plate biology and subperiosteal expan-sion) and the interactions among them.
Path model to test for robustness of interactions among
cortical and trabecular traits: A separate path analysis wasperformed to specifically examine interactions among
cortical and trabecular traits. Simplified path models weredeveloped that removed the biological constraints imposedon the amount of bone tissue (Tt.BV). The first modeltested the hypothesis that cortical traits determine tra-becular traits. Independent variables included body weight,Tt.Ar, cortical area (Ct.Ar), and the cortical tissue mineraldensity (Ct.TMD). Dependent variables included trabec-ular thickness (Tb.Th), trabecular number (Tb.N), andtrabecular tissue mineral density (Tb.TMD). The secondmodel tested the reverse hypothesis that trabecular traitsdetermine cortical traits. Independent variables includedbody weight, Tt.Ar, and Tb.TMD. Dependent variablesincluded Ct.Ar and Ct.TMD.
Model selection methods (Table 4) include Akaike’sinformation criterion (AIC), which provides a penalizedlikelihood statistic for model comparison.(26,38) CAIC is anadjustment of AIC to correct for bias in small sample sizesand is recommended for our models because the ratio ofthe sample size to the number of estimable parameters is<40.(39) A model with the smallest value of AIC or CAICamong several candidate models is preferred. The expectedvalue of the cross-validation index (ECVI) also estimatesthe overall error and predictive validity of a model.(40)
Path models to test for functional interactions amongphysical bone traits and network topology: A path modelwas constructed to test how the phenotypic integrationamong physical bone traits contributes to the variation innetwork topology. Correlation length (CorrL), the numberof paths (# paths), and the percentage of links to the cor-tical shell (%hub) were added to the model testing theinteractions among trabecular (BV/TV), cortical (RCA),and compositional (TMD) traits. This model describes howthe amount and the distribution of trabecular and corticaltissue specifically are arranged to transfer compressiveloads in the cranial–caudal direction. A separate model wasconstructed to test how the genetic variants affectingskeletal size and mass directly affect the percolation pa-rameters. Independent variables in the model includedbody weight, total vertebral volume (Tt.V), and total bonevolume (Tt.BV). Dependent variables included the corre-lation length (CorrL), the number of paths (# paths), andthe percentage of links to the cortical shell (%hub).
RESULTS
Variation in physical bone traits, mechanicalproperties, and network topology amongAXB/BXA RI mouse strains
Randomization of the A/J and B6 genomes resulted inwide variation in vertebral size, composition, and networkarchitecture among the RI strains (Table 1). The meanvalues were normally distributed across the RI panel for allbone traits (p > 0.1, Kolmogorov-Smirnov test). Meanvalues of each trait showed that the size and architecture ofthe RI vertebral bodies ranged from being smaller in totalvolume (Tt.V) than A/J to larger in volume compared withB6 vertebrae. Body weight and Tt.TMD varied within andbeyond the values of the A/J and B6 progenitor strains.
FIG. 4. The proposed path model specified paths among selectbone traits related to biological processes involved in the forma-tion and resorption of bone tissue. Variation in body size, bonesize, and bone mass is expected to influence the interdependenceamong cortical traits and trabecular traits, ultimately influencingwhole bone mechanical properties.
PHENOTYPIC INTEGRATION IN MOUSE VERTEBRAE 611
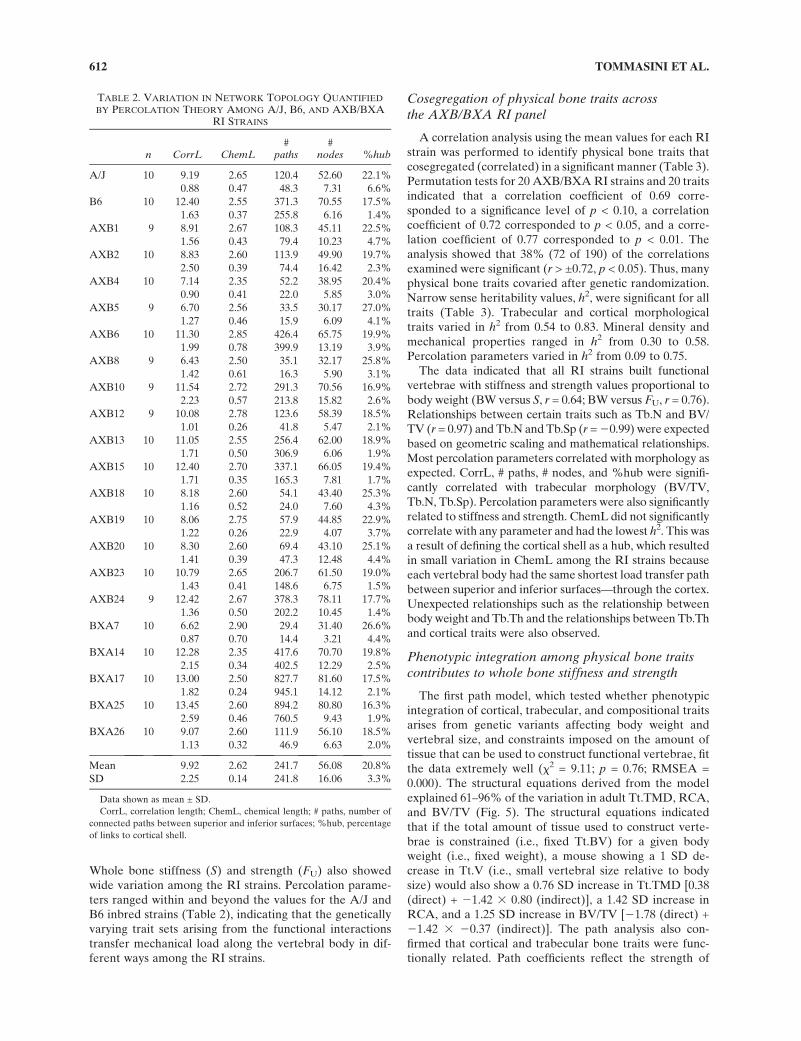
Whole bone stiffness (S) and strength (FU) also showedwide variation among the RI strains. Percolation parame-ters ranged within and beyond the values for the A/J andB6 inbred strains (Table 2), indicating that the geneticallyvarying trait sets arising from the functional interactionstransfer mechanical load along the vertebral body in dif-ferent ways among the RI strains.
Cosegregation of physical bone traits acrossthe AXB/BXA RI panel
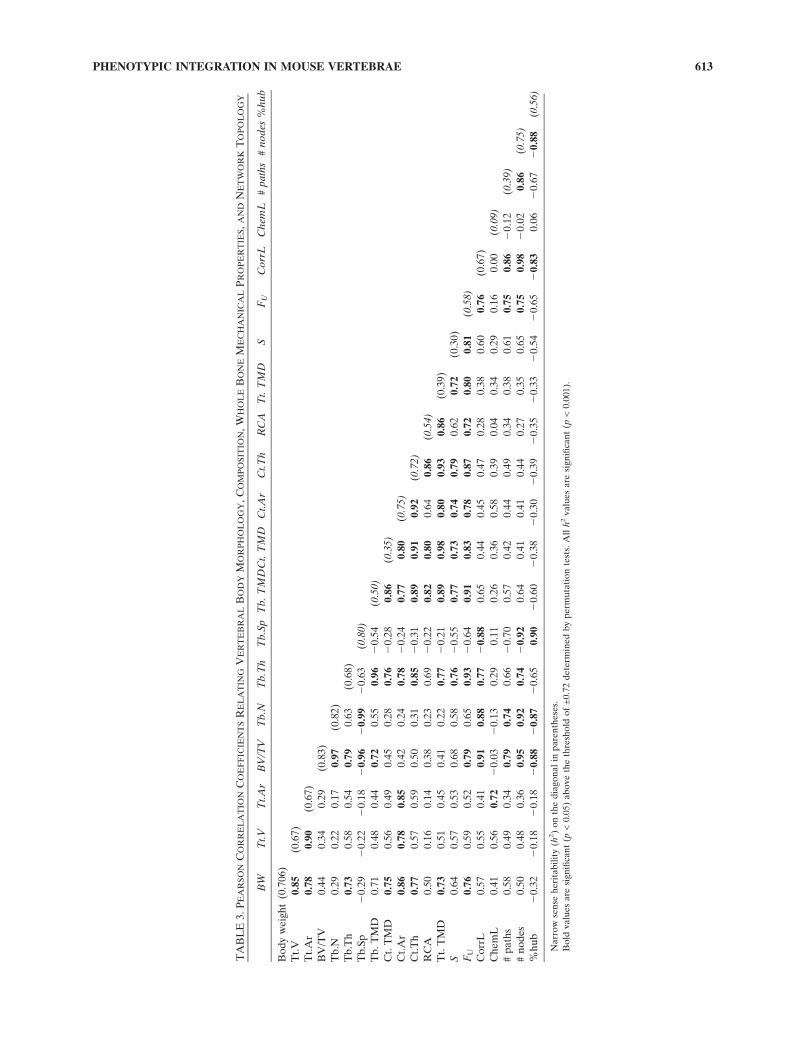
A correlation analysis using the mean values for each RIstrain was performed to identify physical bone traits thatcosegregated (correlated) in a significant manner (Table 3).Permutation tests for 20 AXB/BXA RI strains and 20 traitsindicated that a correlation coefficient of 0.69 corre-sponded to a significance level of p < 0.10, a correlationcoefficient of 0.72 corresponded to p < 0.05, and a corre-lation coefficient of 0.77 corresponded to p < 0.01. Theanalysis showed that 38% (72 of 190) of the correlationsexamined were significant (r > ±0.72, p < 0.05). Thus, manyphysical bone traits covaried after genetic randomization.Narrow sense heritability values, h2, were significant for alltraits (Table 3). Trabecular and cortical morphologicaltraits varied in h2 from 0.54 to 0.83. Mineral density andmechanical properties ranged in h2 from 0.30 to 0.58.Percolation parameters varied in h2 from 0.09 to 0.75.
The data indicated that all RI strains built functionalvertebrae with stiffness and strength values proportional tobody weight (BW versus S, r = 0.64; BW versus FU, r = 0.76).Relationships between certain traits such as Tb.N and BV/TV (r = 0.97) and Tb.N and Tb.Sp (r = 20.99) were expectedbased on geometric scaling and mathematical relationships.Most percolation parameters correlated with morphology asexpected. CorrL, # paths, # nodes, and %hub were signifi-cantly correlated with trabecular morphology (BV/TV,Tb.N, Tb.Sp). Percolation parameters were also significantlyrelated to stiffness and strength. ChemL did not significantlycorrelate with any parameter and had the lowest h2. This wasa result of defining the cortical shell as a hub, which resultedin small variation in ChemL among the RI strains becauseeach vertebral body had the same shortest load transfer pathbetween superior and inferior surfaces—through the cortex.Unexpected relationships such as the relationship betweenbody weight and Tb.Th and the relationships between Tb.Thand cortical traits were also observed.
Phenotypic integration among physical bone traitscontributes to whole bone stiffness and strength
The first path model, which tested whether phenotypicintegration of cortical, trabecular, and compositional traitsarises from genetic variants affecting body weight andvertebral size, and constraints imposed on the amount oftissue that can be used to construct functional vertebrae, fitthe data extremely well (x2 = 9.11; p = 0.76; RMSEA =0.000). The structural equations derived from the modelexplained 61–96% of the variation in adult Tt.TMD, RCA,and BV/TV (Fig. 5). The structural equations indicatedthat if the total amount of tissue used to construct verte-brae is constrained (i.e., fixed Tt.BV) for a given bodyweight (i.e., fixed weight), a mouse showing a 1 SD de-crease in Tt.V (i.e., small vertebral size relative to bodysize) would also show a 0.76 SD increase in Tt.TMD [0.38(direct) + 21.42 3 0.80 (indirect)], a 1.42 SD increase inRCA, and a 1.25 SD increase in BV/TV [21.78 (direct) +21.42 3 20.37 (indirect)]. The path analysis also con-firmed that cortical and trabecular bone traits were func-tionally related. Path coefficients reflect the strength of
TABLE 2. VARIATION IN NETWORK TOPOLOGY QUANTIFIED
BY PERCOLATION THEORY AMONG A/J, B6, AND AXB/BXARI STRAINS
n CorrL ChemL#
paths#
nodes %hub
A/J 10 9.19 2.65 120.4 52.60 22.1%
0.88 0.47 48.3 7.31 6.6%
B6 10 12.40 2.55 371.3 70.55 17.5%
1.63 0.37 255.8 6.16 1.4%
AXB1 9 8.91 2.67 108.3 45.11 22.5%
1.56 0.43 79.4 10.23 4.7%
AXB2 10 8.83 2.60 113.9 49.90 19.7%
2.50 0.39 74.4 16.42 2.3%
AXB4 10 7.14 2.35 52.2 38.95 20.4%
0.90 0.41 22.0 5.85 3.0%
AXB5 9 6.70 2.56 33.5 30.17 27.0%
1.27 0.46 15.9 6.09 4.1%
AXB6 10 11.30 2.85 426.4 65.75 19.9%
1.99 0.78 399.9 13.19 3.9%
AXB8 9 6.43 2.50 35.1 32.17 25.8%
1.42 0.61 16.3 5.90 3.1%
AXB10 9 11.54 2.72 291.3 70.56 16.9%
2.23 0.57 213.8 15.82 2.6%
AXB12 9 10.08 2.78 123.6 58.39 18.5%
1.01 0.26 41.8 5.47 2.1%
AXB13 10 11.05 2.55 256.4 62.00 18.9%
1.71 0.50 306.9 6.06 1.9%
AXB15 10 12.40 2.70 337.1 66.05 19.4%
1.71 0.35 165.3 7.81 1.7%
AXB18 10 8.18 2.60 54.1 43.40 25.3%
1.16 0.52 24.0 7.60 4.3%
AXB19 10 8.06 2.75 57.9 44.85 22.9%
1.22 0.26 22.9 4.07 3.7%
AXB20 10 8.30 2.60 69.4 43.10 25.1%
1.41 0.39 47.3 12.48 4.4%
AXB23 10 10.79 2.65 206.7 61.50 19.0%
1.43 0.41 148.6 6.75 1.5%
AXB24 9 12.42 2.67 378.3 78.11 17.7%
1.36 0.50 202.2 10.45 1.4%
BXA7 10 6.62 2.90 29.4 31.40 26.6%
0.87 0.70 14.4 3.21 4.4%
BXA14 10 12.28 2.35 417.6 70.70 19.8%
2.15 0.34 402.5 12.29 2.5%
BXA17 10 13.00 2.50 827.7 81.60 17.5%
1.82 0.24 945.1 14.12 2.1%
BXA25 10 13.45 2.60 894.2 80.80 16.3%
2.59 0.46 760.5 9.43 1.9%
BXA26 10 9.07 2.60 111.9 56.10 18.5%
1.13 0.32 46.9 6.63 2.0%
Mean 9.92 2.62 241.7 56.08 20.8%
SD 2.25 0.14 241.8 16.06 3.3%
Data shown as mean ± SD.
CorrL, correlation length; ChemL, chemical length; # paths, number of
connected paths between superior and inferior surfaces; %hub, percentage
of links to cortical shell.
612 TOMMASINI ET AL.
TA
BL
E3
.P
EA
RS
ON
CO
RR
EL
AT
ION
CO
EF
FIC
IEN
TS
RE
LA
TIN
GV
ER
TE
BR
AL
BO
DY
MO
RP
HO
LO
GY
,C
OM
PO
SIT
ION
,W
HO
LE
BO
NE
ME
CH
AN
ICA
LP
RO
PE
RT
IES,
AN
DN
ET
WO
RK
TO
PO
LO
GY
BW
Tt.
VT
t.A
rB
V/T
VT
b.N
Tb
.Th
Tb
.Sp
Tb
.T
MD
Ct.
TM
DC
t.A
rC
t.T
hR
CA
Tt.
TM
DS
FU
Co
rrL
Ch
emL
#p
ath
s#
no
des
%h
ub
Bo
dy
we
igh
t(0
.70
6)
Tt.
V0
.85
(0.6
7)
Tt.
Ar
0.7
80
.90
(0.6
7)
BV
/TV
0.4
40
.34
0.2
9(0
.83
)
Tb
.N0
.29
0.2
20
.17
0.9
7(0
.82
)
Tb
.Th
0.7
30
.58
0.5
40
.79
0.6
3(0
.68)
Tb
.Sp
20
.29
20
.22
20
.18
20
.96
20
.99
20
.63
(0.8
0)
Tb
.T
MD
0.7
10
.48
0.4
40
.72
0.5
50
.96
20
.54
(0.5
0)
Ct.
TM
D0
.75
0.5
60
.49
0.4
50
.28
0.7
62
0.2
80
.86
(0.3
5)
Ct.
Ar
0.8
60
.78
0.8
50
.42
0.2
40
.78
20
.24
0.7
70
.80
(0.7
5)
Ct.
Th
0.7
70
.57
0.5
90
.50
0.3
10
.85
20
.31
0.8
90
.91
0.9
2(0
.72
)
RC
A0
.50
0.1
60
.14
0.3
80
.23
0.6
92
0.2
20
.82
0.8
00
.64
0.8
6(0
.54)
Tt.
TM
D0
.73
0.5
10
.45
0.4
10
.22
0.7
72
0.2
10
.89
0.9
80
.80
0.9
30
.86
(0.3
9)
S0
.64
0.5
70
.53
0.6
80
.58
0.7
62
0.5
50
.77
0.7
30
.74
0.7
90
.62
0.7
2(0
.30
)
FU
0.7
60
.59
0.5
20
.79
0.6
50
.93
20
.64
0.9
10
.83
0.7
80
.87
0.7
20
.80
0.8
1(0
.58)
Co
rrL
0.5
70
.55
0.4
10
.91
0.8
80
.77
20
.88
0.6
50
.44
0.4
50
.47
0.2
80
.38
0.6
00
.76
(0.6
7)
Ch
em
L0
.41
0.5
60
.72
20
.03
20
.13
0.2
90
.11
0.2
60
.36
0.5
80
.39
0.0
40
.34
0.2
90
.16
0.0
0(0
.09)
#p
ath
s0
.58
0.4
90
.34
0.7
90
.74
0.6
62
0.7
00
.57
0.4
20
.44
0.4
90
.34
0.3
80
.61
0.7
50
.86
20
.12
(0.3
9)
#n
od
es
0.5
00
.48
0.3
60
.95
0.9
20
.74
20
.92
0.6
40
.41
0.4
10
.44
0.2
70
.35
0.6
50
.75
0.9
82
0.0
20
.86
(0.7
5)
%h
ub
20
.32
20
.18
20
.18
20
.88
20
.87
20
.65
0.9
02
0.6
02
0.3
82
0.3
02
0.3
92
0.3
52
0.3
32
0.5
42
0.6
52
0.8
30
.06
20
.67
20
.88
(0.5
6)
Narr
ow
sen
seh
eri
tab
ilit
y(h
2)
on
the
dia
go
nal
inp
are
nth
ese
s.
Bo
ldvalu
es
are
sign
ifica
nt
(p<
0.0
5)
ab
ove
the
thre
sho
ldo
f±
0.7
2d
ete
rmin
ed
by
perm
uta
tio
nte
sts.
All
h2
valu
es
are
sign
ifica
nt
(p<
0.0
01).
PHENOTYPIC INTEGRATION IN MOUSE VERTEBRAE 613

association among traits (line thickness). In particular, theproportional amount of cortical bone (RCA) was nega-tively related (20.37) to the proportional amount of tra-becular bone (BV/TV) and positively related to Tt.TMD(0.80). Thus, holding all other variables fixed, a 1 SD in-crease in RCA would result in a 0.37 SD decrease in BV/TV and a 0.80 SD increase in Tt.TMD.
The structural equations derived from the path modelshowed that the functional interactions among Tt.TMD,RCA, and BV/TV explained 66% of adult stiffness and 91%of adult strength. Furthermore, the dependence of adultstiffness and strength on physical bone traits was split equallybetween Tt.TMD (mineralization) and trabecular BV/TV.These results indicated that mean trait values covaried amongthe RI strains such that smaller vertebrae relative to body sizeachieved mechanical functionality by increasing Tt.TMD andthe relative amounts of cortical and trabecular bone.
Functional interactions among cortical andtrabecular traits
The first path model (Fig. 5) confirmed that trabecularmass and mineralization depend on cortical traits. The in-clusion of arrows from RCA to Tt.TMD and BV/TV wascritical for the model to fit the data. Reversing the directionof one of these arrows or removing one of these arrowsdecreased the goodness of fit, suggesting that the relativeamount of cortical bone used to construct vertebrae wasfunctionally related to the amount and composition oftrabecular bone in the adult structure. Next, path modelswere constructed to test the robustness of the relationshipbetween cortical and trabecular traits (Figs. 6A and 6B).Total vertebral body cross-sectional area (Tt.Ar) and bodyweight were included to take body size into consideration.Goodness-of-fit statistics indicated that both models fit thedata (Table 4). Model selection statistics (Table 4) indi-cated that the model with the trabecular traits determiningthe cortical traits (Fig. 6B) is slightly preferred over the
model testing the reverse direction (Fig. 6A). However,caution is recommended in this interpretation because thephysical traits are the result of multiple effects, some ofwhich may be influenced by unobserved factors.
Phenotypic integration among physical bone traitscontributes to network topology
Including selected percolation parameters to the pathmodel (Fig. 7A) showed that network topology was relatedto the phenotypic integration among physical bone traits.The structural equations derived from the path modelshowed that the functional interactions among Tt.TMD,RCA, and BV/TV explained 88% of correlation length(CorrL), 74% of the number of load transfer paths (# paths),and 77% of the percentage of connections to the corticalshell (%hub). These results indicated that the functionalinteractions among trabecular, cortical, and compositionaltraits influence how the architecture is designed to transferload. Thus, the coadaptation of traits in response to geneticvariants affecting skeletal size and mass occurred in amanner that created different functional load transfer net-works. Mean trait values covaried among the RI strains suchthat smaller vertebrae relative to body size achieved me-chanical functionality by increasing the number of loadtransfer paths through trabeculae in the center of the ver-tebral body. Therefore, %hub decreased and CorrL (i.e.,load sharing capacity of the network) increased.
The path analysis also showed that network measuresprovided by percolation theory coadapt in direct responseto genetic variants affecting skeletal size and mass (Fig.7B). Removing the physical bone traits (BV/TV, RCA,Tt.TMD) from the path model and directly linking bodyweight, vertebral size (Tt.V), and the total amount of bonetissue (Tt.BV) to percolation parameters (CorrL, # paths,%hub) resulted in a significant fit between the model andthe data (x2 = 0.06; p = 0.80; RMSEA = 0.000). The reducedstructural equations showed the same relationship between
FIG. 5. Path model showing how functionalinteractions among cortical and trabeculartraits compensate for genetic variants affect-ing vertebral size and contribute to mechan-ical properties. Path coefficients (located nextto arrows), which were calculated using Z-transformed data, represent the magnitude ofthe direct and indirect relationships betweentraits. Structural equations were constructedusing the path coefficients to specify the in-terconnected relationships.
614 TOMMASINI ET AL.

changes in skeletal size and mass, and network topologyexisted as in the model that included the physical bonetraits. Variation in body weight, Tt.V, and Tt.BV ac-counted for 82% of the variation in CorrL, 70% of thevariation in # paths, and 66% of the variation in %hub(reduced structural equations; Figs. 7A and 7B).
DISCUSSION
Phenotypic integration provides insight into thebiological basis of skeletal functionality and fragility
The data showed that cortical and trabecular traits arefunctionally related and that phenotypic integration among
trabecular, cortical, and compositional traits plays a keyrole in achieving organ-level mechanical functionality.Although each of the RI strains inherited a random set ofA/J and B6 alleles, examination of trait values across thepanel showed that the RI strains did not inherit a randomset of traits. Instead, the RI strains inherited highly inte-grated sets of traits with the apparent aim of transferringload as efficiently as possible (i.e., using limited availableresources). The data thus indicated that, within the rangeof nonpathological genetic variation, there is tremendousorder in the way a functional bone is constructed. The var-iation in trait values observed among inbred mouse strainshas traditionally been attributed to genetic factors,(41,42) andseveral studies have mapped QTLs regulating individualbone traits.(14,43–47) However, the inheritance of nonrandomtrait sets by the RI strains indicated that individual bonetraits are not regulated by independent genes. These resultsindicated that variation in cortical and trabecular trait valuesamong inbred mouse strains may also result from adaptiveprocesses that covary traits to achieve mechanical func-tionality. Because our analysis of adult traits did not allow usto establish the causal nature of these functional relation-ships, an examination of how cortical and trabecular traitsco-develop during growth will be important for determiningwhich traits are directly influenced by genetic variants andwhich traits are indirectly influenced through compensatoryadaptive mechanisms.
The path models presented here provide insight into thegenetic basis of skeletal fragility by suggesting that thecovariation observed among adult traits is a result of bio-logical processes that coadapt traits during growth. Basedon the analyses of the RI strains, smaller vertebrae relativeto body size achieved stiffness sufficient for mechanicalfunctionality by increasing TMD and the relative amountsof cortical and trabecular bone. Without this phenotypicintegration, smaller vertebrae relative to body size wouldbe unable to support daily loads (i.e., not functional).However, because mineralization is involved, phenotypicintegration may lead to a set of traits that is functional fordaily loading, yet susceptible to fracture under extremeloading (i.e., fall). This is consistent with previous workexamining phenotypic integration in the mouse and humanskeletons that offered a different perspective on howfracture susceptibility may arise: (1) some sets of traitsarising from phenotypic integration may be susceptible tofracture under challenging physiological conditions and (2)genetic or environmental variants that disrupt the biolog-ical processes involved in phenotypic integration would beexpected to affect functionality.(10,11)
FIG. 6. Path models testing the robustness of the functional in-teractions among cortical and trabecular traits. (A) Variation incortical traits dictate observed variation in trabecular traits. (B)Variation in trabecular traits dictate observed variation in corticaltraits. Goodness-of-fit statistics indicated that both models fit thedata exceptionally well.
TABLE 4. MODEL COMPARISON FOR RELATIONSHIP BETWEEN
CORTICAL AND TRABECULAR TRAITS
Modeldirection x2 df p
RMSEA(90% CI)
ECVI(90% CI) AIC CAIC
Ct / Tb 2.05 5 0.84 0 (0.0–0.20) 3.40 (3.40–3.61) 48.05 93.95
Ct ) Tb 0.13 1 0.72 0 (0.0–0.49) 2.73 (2.73–2.97) 40.13 80.04
x2, goodness-of-fit; RMSEA, root mean square error of approximation;
df, degrees of freedom; ECVI, expected value of the cross-validation index;
AIC, Akaike’s information criterion; CAIC, corrected AIC.
PHENOTYPIC INTEGRATION IN MOUSE VERTEBRAE 615

Systems approach identified functionally related traits
Assessment of physical bone traits that determine me-chanical strength of corticocancellous bone largely centers onBMD of individual components (i.e., trabecular BV/TV).However, few studies are conducted with knowledge of therelationships among genes, cellular processes, physical traitsof cortical and trabecular bone, and mechanical function.Prior studies reported functional relationships among phys-ical bone traits using correlation analysis.(17,42,48,49) In thisstudy, the observed trait correlations in the bivariate anal-ysis did not fully describe the relationship between traits.However, in a complex system such as bone, the overallnature of the interactions of multiple traits in the context offunction is better understood through a systems analysis.(25)
The path analysis explained how bone traits interacted andhow the interactions defined mechanical functionality. Forexample, the bivariate analysis (Table 3) showed a positiverelationship between BV/TV and Tt.V. The path analysisshowed that, in the context of body weight and the amount
of bone, Tt.V and BV/TV had a net negative relationship(Fig. 5). Thus, the systems analysis showed the compensa-tory nature of the relationships among traits that was notevident from the bivariate analysis.
The functional interactions among traits observed in thisstudy resulted from a cross between A/J and B6 inbredmouse strains. We expect that a similar study conductedusing a cross between different genotypes (e.g., B6 3 C3H/HeJ) may show differences in the functional interactionsamong traits given that different inbred strains constructvertebral bodies using different amounts of tissue (i.e.,different set points).(17,50) However, we expect that traitswill be functionally related as this interdependence seemsto be part of the inherent adaptive nature of bone.
Integrative network approach can be used tocharacterize how trait sets contribute to fracture risk
Although traditional measures of cortical and trabecularbone adequately characterize the phenotypes of each bone
FIG. 7. (A) Path model showing how in-teractions among trabecular and corticaltraits influence network topology. Thestructural equations showed that the func-tional interactions among Tt.TMD, RCA,and BV/TV explained 88% of correlationlength (CorrL), 74% of the number of loadtransfer paths (#paths), and 77% of the per-centage of connections to the cortical shell(%hub), indicating that the coadaptation oftraits in response to genetic variants affectingskeletal size and mass occurred in a mannerthat created different functional load transfernetworks. (B) Removing the physical bonetraits (BV/TV, RCA, Tt.TMD) from the pathmodel and directly linking body weight, ver-tebral size (Tt.V), and the total amount ofbone tissue (Tt.BV) to percolation parame-ters (CorrL, #paths, %hub) resulted in asignificant fit between the model and the dataindicating that network measures providedby percolation theory coadapt in direct re-sponse to genetic variants affecting skeletalsize and mass.
616 TOMMASINI ET AL.
type, knowledge of the trait values themselves does notfully show how function is established for each genotype.Phenotypic integration ensures that the vertebral bodyis mechanically functional for normal activity duringgrowth.(22,51,52) However, this design is not perfect, becausecertain trade-offs establish function that can lead to frac-ture risk. For example, previous work revealed that slenderlong bones showed increased mineralization resulting indeleterious consequences in the context of extreme loadconditions.(10,11,53,54) This study showed that smaller ver-tebrae compensated in terms of morphology and increasedmineralization, presumably to compensate for limitationsof reduced overall size. Whether the compensatory in-crease in mineralization has a negative effect on postyieldproperties is more complex in compression than it is inbending and is not understood fully.
Another potentially deleterious outcome could be vari-ation in load transfer characteristics. In engineering, de-signs often have to balance between competing objectivesto satisfy a criterion when available resources are lim-ited.(55) Ongoing work showed that the amount of tissuethat can be used to construct a functional structure is ge-netically defined and limited. Thus, Tt.BV was included asan independent variable in the path models. Together withthe limited amount of bone tissue available, the covariationamong cortical and trabecular traits resulted in differentsets of traits, each having a unique mechanism of trans-ferring load in the cranial–caudal direction. This may leadto the construction of a functional structure for daily ac-tivity, but phenotypic integration may have long-termconsequences on skeletal fragility because compensatorytrait interactions lead to variability in the distribution ofloads among cortical and cancellous tissues.
Furthermore, not all genotypes are expected to showthe same capacity to maintain strength with aging.(56–58)
Age-related changes in bone may be an extension of theinherent adaptive nature of bone that establishes bonestrength during growth. It is unclear how genetic variationin osteoblast and osteoclast activity on existing bone sur-faces impacts whole bone mechanical properties with ag-ing.(59) The age-related changes in trabecular bone massare associated with age-related changes in cortical bonemorphology, suggesting that expansion of the cortical shellmay compensate mechanically for the loss of trabecularbone mass.(18) How the compensatory relationship be-tween cortical and trabecular traits affects the ability ofbone to maintain function with aging is not understoodfully. Analysis of variability in aging across the RI panelprovides a model to begin to understand these complexinteractions in more quantitative ways. Furthermore, wepreviously developed novel traits based on percolationtheory to quantify the architecture of the vertebral body inan integrative way.(30) The percolation parameters providequantitative measures of the load transferring behavior of adeveloping system as a function of the connected corticaland trabecular components. The network topology of theadult structure (quantified by percolation theory) thus haspotential for determining the structural stability, dynamicbehavior, robustness, and attack tolerance of a structurecaused by loss with aging.(30)
Interdependence among cortical and trabeculartraits has relevance to genetic and environmentalperturbation studies
Trabecular bone begins as an isotropic structure and thenmatures during growth into a highly adapted, anisotropicstructure.(51,60) Given that physiological forces are impor-tant for the normal development of trabecular tissue, theamount of load imparted to the trabecular tissue duringgrowth may be a critical determinant of adult bone mass andarchitecture. The amount of load imparted to the trabeculartissue will depend on the amount of load borne by the cor-tical shell. Paths critical to load transfer are expected to beretained and paths that are not critical to load transfer wouldbe expected to be resorbed. Thus, the degree of load sharingbetween the cortical and trabecular components duringgrowth may play an important role in the development oftrabecular bone. Furthermore, the degree of load sharingwill depend on the genetic and/or environmental factorsaffecting the structural stiffness of the cortical shell.
Because the relationships between RCA and Tt.TMDand between RCA and BV/TV were critical for the pathmodel of the mouse vertebral body (Fig. 5), we examinedthe specific nature of the relationships between cortical andtrabecular traits. We postulate that there exists a temporaland ordered relationship between cortical and trabeculartraits such that during growth, the amount and compositionof the cortical shell determine the amount, morphology,and composition of the trabecular bone in cortico-cancellous structures (Fig. 1). Although the model with thetrabecular traits determining the cortical traits was slightlypreferred based on model selection criteria (Table 4), bothmodels (Fig. 6) fit the data well, indicating that the func-tional relationships are tightly coupled, and it is not pos-sible to clearly state which traits determine which. Thus,the true nature of the relationship between adult corticaland trabecular traits may not be determined withoutknowledge of how the traits develop over multiple timepoints during growth.(27,60,61) Furthermore, the data pro-vide an integrative approach for interpreting genetic andenvironmental perturbation studies. Rather than simplycharacterizing the effect of perturbations on cortical andtrabecular traits independently, genetic or environmentalperturbations during growth would be expected to affectboth components because of the interdependence amongcortical and trabecular traits.(18,19) Perturbations after thematuration process would be expected to have much lesseffect on multiple traits. Thus, understanding the biologicalcontrol mechanisms coordinating the set of trabecular andcortical traits into functional networks during growth andwith aging is important to improving analyses studying thegenetic basis of skeletal fragility.
Phenotypic integration in inbred mouse vertebraehas relevance to the human skeleton
Inbred mouse models have proven to be an extremelyvaluable resource for understanding the genetic basis ofcomplex traits.(48) RI mouse strains are a powerful exper-imental model to quantify phenotypic integration among
PHENOTYPIC INTEGRATION IN MOUSE VERTEBRAE 617
traits.(25,26) Random segregation of naturally occurring al-lelic variants during meiosis results in each RI strain havinga random assortment of parental genomic regions. Thisrandomization results in a wide range of phenotypesamong the strains. The specific combination of adult traitsfor each RI strain is a reflection of how the particular genesfor that strain work together to influence cellular activitiesinvolved in phenotypic integration.
Inbred mouse models also have proven to be reliablemodels for studying both growth(27) and aging(18,62) of hu-man bone. Although mouse bone is small and does not havean extensive osteonal microstructure compared with humanbone, the biological concepts learned from the mouse di-aphysis(10,53) have been successfully translated to the humanskeleton.(11,63,64) This suggests that phenotypic integrationneeded to establish mechanical function is similar in mouseand human long bone. Although the mouse vertebral bodyhas proportionally fewer trabeculae compared with the hu-man vertebral body, the age-related changes in mouse tra-becular bone and the associated changes in the cortex areconsistent with those observed in the human skeleton.(18)
Furthermore, the cortical shell of the mouse vertebral bodycomprises 20–26% of the total area fraction of the structure,consistent with the human vertebrae.(23) Mouse models inspine research are limited in the comparison with humanvertebrae because of differences in posture and locomotiveforces. However, recent studies have shown that tensileforces from muscles and ligaments control the posture of aquadruped spine, and consequently, the spine is mainlyloaded by axial compression.(65) Thus, the mouse vertebralbody provides a relevant model to study phenotypic inte-gration in the human skeleton.
Summary
The results of this study showed that phenotypic inte-gration among trabecular and cortical traits contributes tothe mechanical functionality of corticocancellous struc-tures. Based on the RI analysis, smaller vertebrae relativeto body size achieved stiffness sufficient for mechanicalfunctionality by increasing TMD and the relative amountsof cortical and trabecular bone. A network analysis usingmeasures provided by percolation theory indicated thatthis phenotypic integration among cortical and trabeculartraits responds to genetic variants affecting skeletal sizeand mass relative to body size in a manner that createsfunctional load transfer networks. Together, the data sug-gested that there is tremendous order in the way a func-tional bone is constructed. This order, which improved thepredictability of whole bone mechanical properties, may benecessary to buffer the deleterious effects of certain ge-netic variants by allowing the skeletal system to constructfunctional structures in different ways. The impact of thesevarious heritable trait sets on fracture susceptibility later inlife has yet to be determined. The current data are con-sistent with previous work examining phenotypic integra-tion in the mouse and human long bones.(10,11) The resultsof these studies and this study have great clinical signifi-cance because they provide two new areas of focus instudying skeletal fragility: (1) sets of traits arising fromphenotypic integration that may be susceptible to fracture
under challenging physiological conditions and (2) geneticor environmental variants that disrupt the biological pro-cesses involved in phenotypic integration and thus affectfunctionality. This study showed that, together, the systemsand network analyses offer the potential to identify sets oftraits that are susceptible to fracture and the biologicalmechanisms controlling phenotypic integration for corti-cocancellous structures. A better understanding of thegenetic factors regulating the interaction among sets oftraits will allow genetic analyses to be conducted in a novelway by focusing on the processes that establish function,rather than on individual trait values alone.
ACKNOWLEDGMENTS
We thank the National Institutes of Health (AR44927,RR12305) for support of this research.
REFERENCES
1. Albright F, Smith PH, Richardson AM 1941 Post-menopausalosteoporosis. Its clinical features. JAMA 116:2465–2474.
2. Beck TJ, Ruff CB, Mourtada FA, Shaffer RA, Maxwell-Williams K, Kao GL, Sartoris DJ, Brodine S 1996 Dual-energy X-ray absorptiometry derived structural geometry forstress fracture prediction in male U.S. Marine Corps recruits.J Bone Miner Res 11:645–653.
3. Duan Y, Parfitt A, Seeman E 1999 Vertebral bone mass, size,and volumetric density in women with spinal fractures. J BoneMiner Res 14:1796–1802.
4. Duan Y, Seeman E, Turner CH 2001 The biomechanical basisof vertebral body fragility in men and women. J Bone MinerRes 16:2276–2283.
5. Duan Y, Turner CH, Kim BT, Seeman E 2001 Sexual dimor-phism in vertebral fragility is more the result of gender dif-ferences in age-related bone gain than bone loss. J Bone MinerRes 16:2267–2275.
6. Giladi M, Milgrom C, Simkin A, Stein M, Kashtan H, Mar-gulies J, Rand N, Chisin R, Steinberg R, Aharonson Z 1987Stress fractures and tibial bone width. A risk factor. J BoneJoint Surg Br 69:326–329.
7. Gilsanz V, Loro ML, Roe TF, Sayre J, Gilsanz R, Schulz EE1995 Vertebral size in elderly women with osteoporosis. Me-chanical implications and relationship to fractures. J Clin In-vest 95:2332–2337.
8. Milgrom C, Giladi M, Simkin A, Rand N, Kedem R, Kashtan H,Stein M, Gomori M 1989 The area moment of inertia of thetibia: A risk factor for stress fractures. J Biomech 22:1243–1248.
9. Vega E, Ghiringhelli G, Mautalen C, Rey Valzacchi G, ScagliaH, Zylberstein C 1998 Bone mineral density and bone size inmen with primary osteoporosis and vertebral fractures. CalcifTissue Int 62:465–469.
10. Jepsen KJ, Hu B, Tommasini SM, Courtland HW, Price C,Terranova CJ, Nadeau JH 2007 Genetic randomization re-veals functional relationships among morphologic and tissue-quality traits that contribute to bone strength and fragility.Mamm Genome 18:492–507.
11. Tommasini SM, Nasser P, Hu B, Jepsen KJ 2008 Biological co-adaptation of morphological and composition traits contrib-utes to mechanical functionality and skeletal fragility. J BoneMiner Res 23:236–246.
12. National Osteoporosis Foundation. National OsteoporosisFoundation Fast Facts on Osteoporosis. Available online athttp://www.nof.org/osteoporosis/diseasefacts.htm. AccessedMay 20, 2008.
13. Kohler T, Stauber M, Donahue LR, Muller R 2007 Automatedcompartmental analysis for high-throughput skeletal pheno-typing in femora of genetic mouse models. Bone 41:659–667.
618 TOMMASINI ET AL.
14. Bouxsein ML, Uchiyama T, Rosen CJ, Shultz KL, DonahueLR, Turner CH, Sen S, Churchill GA, Muller R, Beamer WG2004 Mapping quantitative trait loci for vertebral trabecularbone volume fraction and microarchitecture in mice. J BoneMiner Res 19:587–599.
15. Patterson PH, Cook ME, Crenshaw TD, Sunde ML 1986Mechanical properties of the tibiotarsus of broilers and poultsloaded with artificial weight and fed various dietary proteinlevels. Poult Sci 65:1357–1364.
16. Faulkner RA, Bailey DA 2007 Osteoporosis: A pediatricconcern? Med Sport Sci 51:1–12.
17. Tommasini SM, Morgan TG, van der Meulen M, Jepsen KJ 2005Genetic variation in structure-function relationships for the inbredmouse lumbar vertebral body. J Bone Miner Res 20:817–827.
18. Glatt V, Canalis E, Stadmeyer L, Bouxsein ML 2007 Age-related changes in trabecular architecture differ in female andmale C57BL/6J mice. J Bone Miner Res 22:1197–1207.
19. Waarsing JH, Day JS, Verhaar JA, Ederveen AG, Weinans H2006 Bone loss dynamics result in trabecular alignment inaging and ovariectomized rats. J Orthop Res 24:926–935.
20. Cheverud JM 1996 Developmental integration and the evo-lution of pleiotropy. Am Zool 36:44–50.
21. Currey JD, Alexander RMcN 1985 The thickness of the wallsof tubular bones. J Zool 206:453–468.
22. Frost HM 1987 Bone ‘‘mass’’ and the ‘‘mechanostat’’: A pro-posal. Anat Rec 219:1–9.
23. Eswaran SK, Gupta A, Adams MF, Keaveny TM 2006 Cor-tical and trabecular load sharing in the human vertebral body.J Bone Miner Res 21:307–314.
24. Silva MJ, Keaveny TM, Hayes WC 1997 Load sharing between theshell and centrum in the lumbar vertebral body. Spine 22:140–150.
25. Nadeau JH, Burrage LC, Restivo J, Pao YH, Churchill G, HoitBD 2003 Pleiotropy, homeostasis, and functional networksbased on assays of cardiovascular traits in genetically ran-domized populations. Genome Res 13:2082–2091.
26. Li R, Tsaih SW, Shockley K, Stylianou IM, Wergedal J, PaigenB, Churchill GA 2006 Structural model analysis of multiplequantitative traits. PLoS Genet 2:e114.
27. Price C, Herman BC, Lufkin T, Goldman HM, Jepsen KJ 2005Genetic variation in bone growth patterns defines adult mousebone fragility. J Bone Miner Res 20:1983–1991.
28. Gustafson MB, Martin RB, Gibson V, Storms DH, Stover SM,Gibeling J, Griffin L 1996 Calcium buffering is required to main-tain bone stiffness in saline solution. J Biomech 29:1191–1194.
29. Otsu N 1979 A threshold selection method from gray-levelhistograms. IEEE Trans Syst Man Cybern 9:62–66.
30. Tommasini SM, Wearne SL, Hof PR, Jepsen KJ 2008 Percola-tion theory relates corticocancellous architecture to mechanicalfunction in vertebrae of inbred mouse strains. Bone 42:743–750.
31. Churchill GA, Doerge RW 1994 Empirical threshold valuesfor quantitative trait mapping. Genetics 138:963–971.
32. Belknap JK 1998 Effect of within-strain sample size on QTLdetection and mapping using recombinant inbred mousestrains. Behav Genet 28:29–38.
33. Grace JB 2006 Structural Equation Modeling and Natural Sys-tems. Cambridge University Press, Cambridge, United Kingdom.
34. Linkhart TA, Linkhart SG, Kodama Y, Farley JR, Dimai HP,Wright KR, Wergedal JE, Sheng M, Beamer WG, DonahueLR, Rosen CJ, Baylink DJ 1999 Osteoclast formation in bonemarrow cultures from two inbred strains of mice with differentbone densities. J Bone Miner Res 14:39–46.
35. Sharkey NA, Lang DH 2007 Genes in context: Probing thegenetics of fracture resistance. Exerc Sport Sci Rev 35:86–96.
36. MacCallum RC, Hong S 1997 Power analysis in covariancestructural modeling using GFI and AGFI. Multivariate BehavRes 32:193–210.
37. Stieger JH, Lind JM 1980 Statistically based tests for the numberof common factors. Annual Meeting of the Psychometric Soci-ety, May 28–30, 1980, Iowa City, IA, USA.
38. Akaike H 1973 Information theory as an extension of themaximum likelihood principle. In: Petrov B, Csaki F (eds.).Second International Symposium on Information Theory.Akademiai Kiado, Budapest, Hungary, 297–281.
39. Burnham K, Anderson D 1998 Model Selection and Multi-model Inference: A Practical Information-Theoretic Approach.Springer, New York, NY, USA.
40. Browne M, Cudeck R 1993 Alternative ways of assessing modelfit. In: Bollen K, Long S (eds.). Testing Structural EquationModels. Sage Press, Thousand Oaks, CA, USA, pp. 136–162.
41. Beamer WG, Donahue LR, Rosen CJ, Baylink DJ 1996 Ge-netic variability in adult bone density among inbred strains ofmice. Bone 18:397–403.
42. Turner CH, Hsieh YF, Muller R, Bouxsein ML, Baylink DJ, RosenCJ, Grynpas MD, Donahue LR, Beamer WG 2000 Genetic regu-lation of cortical and trabecular bone strength and microstructure ininbred strains of mice. J Bone Miner Res 15:1126–1131.
43. Beamer WG, Shultz KL, Churchill GA, Frankel WN, BaylinkDJ, Rosen CJ, Donahue LR 1999 Quantitative trait loci forbone density in C57BL/6J and CAST/EiJ inbred mice. MammGenome 10:1043–1049.
44. Bower AL, Lang DH, Vogler GP, Vandenbergh DJ, BlizardDA, Stout JT, McClearn GE, Sharkey NA 2006 QTL analysisof trabecular bone in BXD F2 and RI mice. J Bone Miner Res21:1267–1275.
45. Klein RF, Mitchell SR, Phillips TJ, Belknap JK, Orwoll ES1998 Quantitative trait loci affecting peak bone mineral den-sity in mice. J Bone Miner Res 13:1648–1656.
46. Lang DH, Sharkey NA, Mack HA, Vogler GP, VandenberghDJ, Blizard DA, Stout JT, McClearn GE 2005 Quantitativetrait loci analysis of structural and material skeletal pheno-types in C57BL/6J and DBA/2 second-generation and re-combinant inbred mice. J Bone Miner Res 20:88–99.
47. Volkman SK, Galecki AT, Burke DT, Paczas MR, Moalli MR,Miller RA, Goldstein SA 2003 Quantitative trait loci forfemoral size and shape in a genetically heterogeneous mousepopulation. J Bone Miner Res 18:1497–1505.
48. Rosen CJ, Beamer WG, Donahue LR 2001 Defining the ge-netics of osteoporosis: Using the mouse to understand man.Osteoporos Int 12:803–810.
49. Ng AH, Wang SX, Turner CH, Beamer WG, Grynpas MD2007 Bone quality and bone strength in BXH recombinantinbred mice. Calcif Tissue Int 81:215–223.
50. Turner CH, Hsieh YF, Muller R, Bouxsein ML, Rosen CJ,McCrann ME, Donahue LR, Beamer WG 2001 Variation inbone biomechanical properties, microstructure, and density inBXH recombinant inbred mice. J Bone Miner Res 16:206–213.
51. Tanck E, Hannink G, Ruimerman R, Buma P, Burger EH,Huiskes R 2006 Cortical bone development under the growthplate is regulated by mechanical load transfer. J Anat 208:73–79.
52. van Oers RF, Ruimerman R, Tanck E, Hilbers PA, Huiskes R2008 A unified theory for osteonal and hemi-osteonal re-modeling. Bone 42:250–259.
53. Jepsen KJ, Akkus OJ, Majeska RJ, Nadeau JH 2003 Hierar-chical relationship between bone traits and mechanical prop-erties in inbred mice. Mamm Genome 14:97–104.
54. Jepsen KJ, Pennington DE, Lee YL, Warman M, Nadeau J2001 Bone brittleness varies with genetic background in A/J andC57BL/6J inbred mice. J Bone Miner Res 16:1854–1862.
55. Petroski H 2004 Small Things Considered: Why There Is NoPerfect Design. Vintage, New York, NY, USA.
56. Duan Y, Wang XF, Evans A, Seeman E 2005 Structural andbiomechanical basis of racial and sex differences in vertebralfragility in Chinese and Caucasians. Bone 36:987–998.
57. Christian JC, Yu PL, Slemenda CW, Johnston CC Jr 1989Heritability of bone mass: A longitudinal study in aging maletwins. Am J Hum Genet 44:429–433.
58. Kelly PJ, Nguyen T, Hopper J, Pocock N, Sambrook P, Eis-man J 1993 Changes in axial bone density with age: A twinstudy. J Bone Miner Res 8:11–17.
59. Waarsing JH, Day JS, van der Linden JC, Ederveen AG,Spanjers C, De Clerck N, Sasov A, Verhaar JA, Weinans H2004 Detecting and tracking local changes in the tibiae ofindividual rats: A novel method to analyse longitudinal in vivomicro-CT data. Bone 34:163–169.
60. Fazzalari NL, Moore AJ, Byers S, Byard RW 1997 Quantita-tive analysis of trabecular morphogenesis in the human
PHENOTYPIC INTEGRATION IN MOUSE VERTEBRAE 619
costochondral junction during the postnatal period in normalsubjects. Anat Rec 248:1–12.
61. Tanck E, Homminga J, van Lenthe GH, Huiskes R 2001 In-
crease in bone volume fraction precedes architectural adap-tation in growing bone. Bone 28:650–654.
62. Halloran BP, Ferguson VL, Simske SJ, Burghardt A, VentonLL, Majumdar S 2002 Changes in bone structure and mass
with advancing age in the male C57BL/6J mouse. J BoneMiner Res 17:1044–1050.
63. Tommasini SM, Nasser P, Jepsen KJ 2007 Sexual dimorphism
affects tibia size and shape but not tissue-level mechanicalproperties. Bone 40:498–505.
64. Tommasini SM, Nasser P, Schaffler MB, Jepsen KJ 2005 The
relationship between bone morphology and bone quality in
male tibiae: Implications for stress fracture risk. J Bone MinerRes 20:1372–1380.
65. Smit TH 2002 The use of a quadruped as an in vivo modelfor the study of the spine - biomechanical considerations.Eur Spine J 11:137–144.
Address reprint requests to:Karl J Jepsen, PhD
Leni and Peter W. May Department of Orthopaedics
Mount Sinai School of MedicineBox 1188, One Gustave L. Levy Place
New York, NY 10029, USA
E-mail: [email protected]
Received in original form June 17, 2008; revised form October 1,2008; accepted December 5, 2008.
620 TOMMASINI ET AL.
Copyright © 2022 FDOKUMEN