BLUP for genetic evaluation of plants in non-inbred families of annual crops
10
This article was published in the above mentioned Springer issue. The material, including all portions thereof, is protected by copyright; all rights are held exclusively by Springer Science + Business Media. The material is for personal use only; commercial use is not permitted. Unauthorized reproduction, transfer and/or use may be a violation of criminal as well as civil law. ISSN 0014-2336, Volume 174, Number 1
Transcript of BLUP for genetic evaluation of plants in non-inbred families of annual crops
This article was published in the above mentioned Springer issue.The material, including all portions thereof, is protected by copyright;all rights are held exclusively by Springer Science + Business Media.
The material is for personal use only;commercial use is not permitted.
Unauthorized reproduction, transfer and/or usemay be a violation of criminal as well as civil law.
ISSN 0014-2336, Volume 174, Number 1
BLUP for genetic evaluation of plants in non-inbred familiesof annual crops
Jose Marcelo Soriano Viana • Isis Fernanda de Almeida •
Marcos Deon Vilela de Resende • Vinıcius Ribeiro Faria •
Fabyano Fonseca e Silva
Received: 30 September 2009 / Accepted: 23 November 2009 / Published online: 5 December 2009
� Springer Science+Business Media B.V. 2009
Abstract Best Linear Unbiased Prediction (BLUP)
has become the most widely used method for genetic
assessment of animal and perennial species, and it is
potentially relevant for annual crops. The objective of
this study was to assess this method for selection
within non-inbred families in recurrent breeding
programs. The ‘animal model’ was fitted. The data
were expansion volume (EV) and grain yield of
plants in recombination plots of two to three selection
cycles in the popcorn population Vicosa, with half-
and full-sib progenies. The ASReml program was
used to perform the analyses. For both EV and yield
the breeding values predicted from the additive and
additive-dominant models were highly correlated.
Multi-generation BLUP was, in general, more accu-
rate than single-generation analysis. These two
methods resulted in highly correlated predicted
breeding values. The dominance genetic values
predicted from the single- and multi-generation
analysis were also highly correlated. The pedigree
information reduced the percentage of coincidences
among the selected individuals relative to phenotypic
selection mainly in the population structured in half-
sib families. Based on breeding values predicted by
BLUP analysis, the most efficient selection procedure
was mass selection.
Keywords Mixed model � Animal model �Recurrent selection
Introduction
Recurrent selection aims for a continuous increase in
favorable gene frequency. Regardless of the selection
unit, its efficiency depends on accurate identification
of the individuals with the best additive genetic value.
A commonly used methodology in animal and
perennial species breeding for predicting additive
genetic values of individuals under selection is the
Best Linear Unbiased Prediction, which was pro-
posed by Henderson (1974). Ideally, predictions are
made taking into account the relationship among
individuals, using estimates of the variance compo-
nents of the model (genetic and non-genetic), with
correction for fixed effects.
Regarding the use of BLUP in annual crops, the
most relevant application until recently was prediction
of the performance of non-assessed hybrids, proposed
J. M. S. Viana (&) � I. F. de Almeida � V. R. Faria
Departamento de Biologia Geral, Universidade Federal de
Vicosa, Vicosa, MG 36570-000, Brazil
e-mail: [email protected]
M. D. V. de Resende
Departamento de Engenharia Florestal, Embrapa CNPF;
Universidade Federal de Vicosa, Vicosa, MG 36570-000,
Brazil
F. Fonseca e Silva
Departamento de Informatica, Universidade Federal de
Vicosa, Vicosa, MG 36570-000, Brazil
123
Euphytica (2010) 174:31–39
DOI 10.1007/s10681-009-0094-2
Author's personal copy
by Bernardo (1996), which is possible only when
sufficient relationship information among inbred lines
is available. In his study with 4,099 hybrids and 16
combinations among nine heterotic corn groups
assessed in up to 15 locations, Bernardo found
estimates of the correlation between predicted value
and phenotypic performance for grain yield ranging
from 0.49 to 0.70, with a tendency toward higher
estimates for groups with a greater number of assessed
hybrids. According to this author, these values can be
considered moderately high, and it was suggested that
BLUP might be efficient for identifying non-per-
formed crosses with superior performance.
Other relevant applications common in animal and
perennial species breeding have been incorporated
during the last 5 years in the breeding programs of
annual allogamous and autogamous crops. Piepho
et al. (2008) reviewed the use of the BLUP method-
ology in plant breeding, showing its relevance even
without pedigree information. The applications
included genetic assessment of individuals (additive
genetic value prediction) and of pure and inbred lines
(prediction of genotypic values and the effects of
general combining ability) with and without pedigree
information in single and multi-trait analyses. Flache-
necker (2006a, b) used BLUP to predict the mean
additive genetic value of parents of full-sib families of
a corn population. This permitted satisfactory predic-
tions of the performance of the progeny in the
subsequent cycle for grain moisture and/or the
selection index trait, calculated as a function of grain
yield and dry matter content. From an analysis of
wheat genotypes in several environments, Crossa
et al. (2006) concluded that the prediction of breeding
value by BLUP with pedigree information was more
precise than traditional analyses assuming fixed and
random effects. Reis et al. (2005) used BLUP in
combination with the bootstrap technique in a diallelic
analysis of inbred corn lines. They reported that the
correlation between the predicted and observed mean
yields of the hybrids decreased with a reduction in the
number of parents, and they emphasized that the
decrease was less pronounced with the use of BLUP
compared to the BLUE (fixed model) method.
The value of pedigree information was investi-
gated by Nunes et al. (2008) using simulation. They
concluded that inclusion of relationship information
resulted in higher predicted gains. Bauer et al. (2006)
used molecular marker information to calculate the
relationship matrix and concluded that the BLUP
methodology could be used in inbred line selection.
The same conclusion was reported by Sebolai et al.
(2005) from a simulation study of selection of pure
lines. In another simulation study, Bauer and Leon
(2008) analyzed the efficiency of superior line
selection by multi-trait BLUP. The results showed
that this analysis was superior to single-trait analysis
for identifying superior lines and prediction accuracy.
Kruuk (2004) used the ‘‘animal model’’ to estimate
genetic parameters of natural populations and con-
cluded that the BLUP methodology permitted the
most efficient use of the available data in addition to
giving greater statistical power to the tests.
In order to show that this method can be used regu-
larly by plant breeders of annual crops, the objective of
this study was to assess its use in the selection of plants
in non-inbred families in recurrent breeding programs.
Materials and methods
Theoretical aspects
The selection efficiency in recurrent intrapopulation
breeding programs is proportional to the efficiency of
identifying the parents with superior additive genetic
values, because the other components of the genetic
value are not correlated with the number of favorable
genes present. Although the genotypic value (G) and
the additive genetic value (A) are, in general, both
positively correlated with the number of favorable
genes (N), the correlation of A with N is usually
greater or equal (in the absence of dominance) to the
correlation of G with N (Viana 2005).
Assuming an absence of epistasis we have
G ¼ Mþ Aþ D
where M is the population mean and D is the
dominance genetic value.
Thus, the phenotypic value of an individual can be
defined as
P ¼ Mþ Aþ DþX
k
ðfixed effectÞk
þX
l
ðnon-genetic random effectÞl þ error
In matrix notation, assuming no other non-genetic
random effects,
32 Euphytica (2010) 174:31–39
123
Author's personal copy
y ¼ Xbþ Zu1 þ Zu2 þ e
where y is the vector of phenotypic values, X is the
incidence matrix of fixed effects, b is the vector of
the effects of the levels of each fixed factor (including
the population mean), Z is the incidence matrix of
random effects, u1 is the vector of the additive genetic
values, u2 is the vector of the dominance genetic
values and e is the residuals vector. This model,
called by animal breeders as the ‘animal model’, is
appropriate for prediction of genetic values of the
measured individuals, which are the selection units.
In plant breeding the appropriate term is ‘individual
model’. The criterion for obtaining the best linear
unbiased predictor of a random vector is the maxi-
mization of the joint probability density function of y
and the random vectors (Henderson 1974), obtaining
(under normality) the mixed model equations.
Assuming a non-inbred population (Cov(u1, u2)
equal to a null vector) and that there is no correlation
among the errors (Var(e) = R = Ir2), the mixed
model equations are
X0X X0Z X0ZZ0X Z0Zþ r2G�1
1 Z0ZZ0X Z0Z Z0Zþ r2G�1
2
2
4
3
5bo
~u1
~u2
2
4
3
5
¼X0yZ0yZ0y
24
35
where G1 ¼ r2AAðnÞ and G2 ¼ r2
DDðnÞ are the variance
matrices of the vectors of additive and dominance
genetic values. A(n) and D(n) are the additive and
dominance relationship matrices, given by
AðnÞ ¼
2r11 2r12 � � � 2r1n
2r12 2r22 � � � 2r2n
� � � � � � . ..
� � �2r1n 2r2n � � � 2rnn
266664
377775
and
DðnÞ ¼
u11 u12 � � � u1n
u12 u22 � � � u2n
� � � � � � . ..
� � �u1n u2n � � � unn
266664
377775
where rij is the coefficient of coancestry between
individuals i and j, and uij ¼ uðmfÞðm0f 0Þ ¼ rmm0 rff0 þrmf0 rfm0 is the probability of individuals i and j having
genotypes identical by descent, where m and f are the
parents of i, and m0 and f0 are the parents of j (Mrode
2005).
The fit of the model by an iterative process gives
estimates of the variance components, a prediction of
each random vector and a solution for the fixed
effects vector. The process most used to estimate the
components of variance is restricted/residual maxi-
mum likelihood (REML), which was developed by
Patterson and Thompson (1971). Alternatively, the
maximum likelihood (ML) method, the minimum
variance quadratic unbiased estimation (MIVQUE)
method and Henderson’s method III (Littell et al.
2006) can be used.
Although the model described suggests that it is
always possible to predict the additive and domi-
nance genetic values, this unfortunately is not always
true. For example, in the case of annual allogamous
species such as corn, if the population in the
recombination plot is structured in half-sib progenies,
the additive-dominant model cannot be fitted because
the dominance relationship matrix is an identity in
each cycle. Thus, as G2 ¼ r2DI and R ¼ r2I there is
no convergence in the REML process. This is not
necessarily true in the case of animal and perennial
species. If the population is structured in full-sib
progenies, even if the dominance relationship matrix
is not an identity, there is no guarantee that the
additive-dominant model can be fitted. In general, for
the additive-dominant model to be fitted there must
be at least two different covariances among relatives
that are functions of the additive variance and of
dominance variance.
The prediction accuracy of the additive genetic
values is
rA~A ¼ffiffiffiffiffiffiffiffiffiffiffiffiffiffiffiffiffiffiffiffiffiffiffiffiffi
1� PEV
~r2A
� �s
where PEV is the prediction error variance and ~r2A is
the restricted maximum likelihood estimate of the
additive variance (Mrode 2005, pp. 50–51).
Two selection strategies based on EV were
considered in each cycle: selection of 9–10 plants
in each one of the 20 families selected based on the
progeny test (totaling 196 individuals) and selection
of 196 plants (mass selection). The direct and indirect
genetic gains were calculated based on the parental
control (c = 1/2 with selection within half-sib family
and c = 1 with selection within full-sib family) and
Euphytica (2010) 174:31–39 33
123
Author's personal copy
the additive genetic values of the selected individuals
(~As) by the function
DMp ¼ c1
ns
X
i
~Ais
!
where ns is the number of selected parents (196
females with selection within half-sib family, and 196
females and up to 196 distinct males with selection
within full-sib progeny). If the population is struc-
tured in full-sib families, this function is biased when
there are allelic and non-allelic gene interaction
(dominance and epistasis). Assuming Hardy–Wein-
berg equilibrium and absence of epistasis, the mean
of the population obtained after selection can be
expressed as (Viana et al. 2009)
M1 ¼Mþ ð1=2ÞEðAsÞ; if the population is
structured in half-sib progenies, or
M1 ¼Mþ Eð�AsÞ þ Eð�DosÞ; if the population is
structured in full-sib families
where M is the mean of the base population, EðAsÞ is
the expectation of the additive genetic values of the
selected individuals, Eð�AsÞ is the expectation of the
average additive genetic values of the selected full-
sib family parents, and Eð�DosÞ is the expectation of
the average dominance genetic values of the individ-
uals in selected full-sib families. The offspring
average dominance genetic value is a function of
the allelic frequencies and d, the dominance deviation
(difference between the genotypic value of the
heterozygote and m, the mean of the genotypic
values of the homozygotes), for each gene.
The prediction function is also obtained by an
equivalent derivation of that used by Eberhart (1970),
assuming that the predicted gain is proportional to a
selection differential based on predicted breeding
values (DMp ¼ bð�AS � �AÞ). Considering that the
coefficient of proportionality is the regression coef-
ficient of the genotypic value of half-sib/full-sib
family in the improved population as a function of the
additive genetic value of its common parent (selected
individual)/average additive genetic value of the
parents, we have
b ¼ CovðAs or �As; �GoÞVðAs or �AsÞ
Assuming irrelevant changes in gene frequen-
cies, b = 1/2 in the population structured in half-
sib families or b = 1 in the case of full-sib
progenies.
For comparison the genetic gains were also com-
puted from the function proposed by Cullis et al.
(2006), including the parental control. The indirect
expected genetic gain in relation to trait Y with
selection based on trait X is
EGGYðXÞ ¼ c � i � qgX;YrgY
hX
where i is the selection intensity, qgX;Yis the genetic
correlation, r2gY
is the genotypic variance and h2X is
the generalized measure of heritability (Cullis et al.
2006).
Experimental data
Were analyzed the phenotypic values of expansion
volume (EV; ml/g) and grain yield (g/0.18 m2) of
plants in the recombination plots (areas of crosses
between selected families) of cycles 1, 2 and 3 of the
selection program with half-sib families, and of the
cycles 1 and 2 of the selection program with full-sib
families, both with the popcorn population Vicosa.
The two breeding programs aim the development of
superior open pollinated populations. Each cycle
consisted of evaluation of 196 families in a repli-
cated trial, selection of the best 20 progenies,
recombination of these families in isolated area
(recombination plot), using remnant seeds, and
selection of 196 superior plants for the next cycle.
The tests were designed as a 14 9 14 simple lattice
and carried out in the experimental station of the
Federal University of Vicosa (UFV) in Coimbra,
Minas Gerais (MG), Brazil, in the 1999/2000, 2001/
2002, 2002/2003, 2003/2004 and 2004/2005 growing
seasons. They are simultaneously conducted to offer
experimental data appropriate to studies on Quanti-
tative Genetics and Statistical Genomics (compara-
tive analysis of genetic parameters and selection
efficiency, influence of the effective population size
on genetic variability, genetic evaluation based on
BLUP, marker assisted selection based on linkage
disequilibrium (LD) between molecular markers and
QTL, among others).
The recombination plots with half-sib progenies
were conducted at the experimental station of the
UFV in Ponte Nova-MG, Brazil, in the 2000/2001,
2002/2003 and 2004/2005 growing seasons. The
34 Euphytica (2010) 174:31–39
123
Author's personal copy
twenty selected families were randomly planted inter-
calating one row of male plants to every four rows of
female plants. Two rows were also planted with the
single hybrid IAC 112 (control), developed by the
Agronomic Institute of Campinas (IAC). Each row
was 20 m long with up to 100 plants. The rows of
females and the control were detasseled at flowering.
The recombination plots with full-sib progenies were
conducted in an experimental field at UFV in Vicosa-
MG in the 2003/2004 and 2005/2006 growing seasons.
The 20 selected families were randomly planted in
rows with 10 m long with up to 50 plants. Crosses were
controlled at flowering so that at least 19 full-sib
families were obtained for each progeny (one male
from each of the other 19 families). The plants used as
males were not measured. In the analyses they were
inserted in the pedigree to permit prediction of their
breeding values. The prediction is possible only for
those with pedigree information.
In the half-sib family recombination plots, 20
plants were measured for each progeny and 5–10
plants in each row of the control. In the full-sib
family recombination plots, 8–31 plants were mea-
sured for each family, totaling 324 and 390 plants.
The EV was assessed in a hot air popcorn machine
(1,200 w) using 10 g samples.
Statistical analysis
The software ASReml v2.00 (Gilmour et al. 2006)
was used for the analyses. In the analyses with data
from the half-sib family recombination plots the IAC
112 was inserted in the pedigree as an individual with
unknown parents. In the multi-generation BLUP
model (see the ASReml code in the Appendix), since
the single hybrid IAC 112 is not a genotype from the
base population, we inserted a fixed effect of
population. Once we grouped populations structured
in half- and full-sib families, from two different
selection cycles, conducted in two locals and in
4 years, to be parsimonious we define a second fixed
factor named environment (the environment effect
includes confounded effects of population structure,
cycle, local and year). It is important to note that the
estimation of additive and residual variance in the
single generation analysis of the population struc-
tured in full-sib families was possible since G1 ¼r2
AA 6¼ R ¼ r2I in each cycle.
Results
The most probable application of the BLUP method-
ology, by breeders of annual allogamous plants,
would be estimation of genetic parameters and
prediction of the breeding values of the individuals
under selection for each cycle. The tests showed that
there is genetic variability for EV and grain yield in
the populations regardless of their family structure
(Tables 1, 2). The test relative to EV in cycle 1 of the
full-sib family population is associated with a prob-
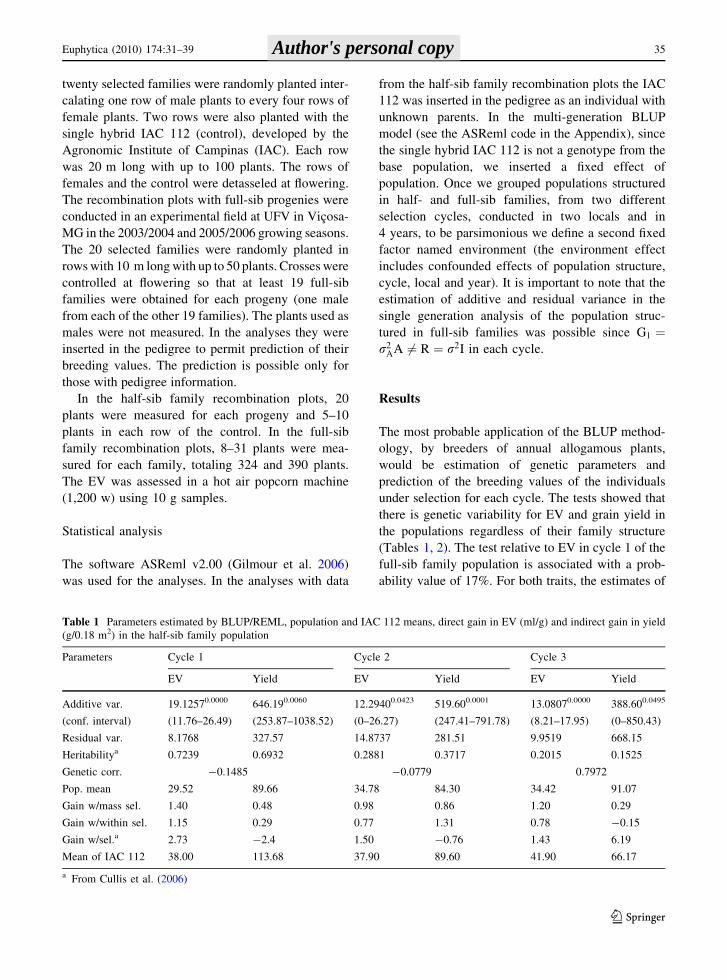
ability value of 17%. For both traits, the estimates of
Table 1 Parameters estimated by BLUP/REML, population and IAC 112 means, direct gain in EV (ml/g) and indirect gain in yield
(g/0.18 m2) in the half-sib family population
Parameters Cycle 1 Cycle 2 Cycle 3
EV Yield EV Yield EV Yield
Additive var.
(conf. interval)
19.12570.0000
(11.76–26.49)
646.190.0060
(253.87–1038.52)
12.29400.0423
(0–26.27)
519.600.0001
(247.41–791.78)
13.08070.0000
(8.21–17.95)
388.600.0495
(0–850.43)
Residual var. 8.1768 327.57 14.8737 281.51 9.9519 668.15
Heritabilitya 0.7239 0.6932 0.2881 0.3717 0.2015 0.1525
Genetic corr. -0.1485 -0.0779 0.7972
Pop. mean 29.52 89.66 34.78 84.30 34.42 91.07
Gain w/mass sel. 1.40 0.48 0.98 0.86 1.20 0.29
Gain w/within sel. 1.15 0.29 0.77 1.31 0.78 -0.15
Gain w/sel.a 2.73 -2.4 1.50 -0.76 1.43 6.19
Mean of IAC 112 38.00 113.68 37.90 89.60 41.90 66.17
a From Cullis et al. (2006)
Euphytica (2010) 174:31–39 35
123
Author's personal copy
the additive genetic variance were greater in the half-
sib progeny population. The estimates of genetic
correlation between EV and yield were consistent in
sign in the two populations for cycles 1 and 2,
although the magnitudes were greater in the full-sib
family population (Tables 1, 2). However, selection
based on quality should not imply a significant
change in grain yield. The first cycle of among and
within selection based on EV reduced the magnitude
of the genetic correlation in the two populations. In
the third cycle in the population structured in half-sib
families the estimate was closer to 1.
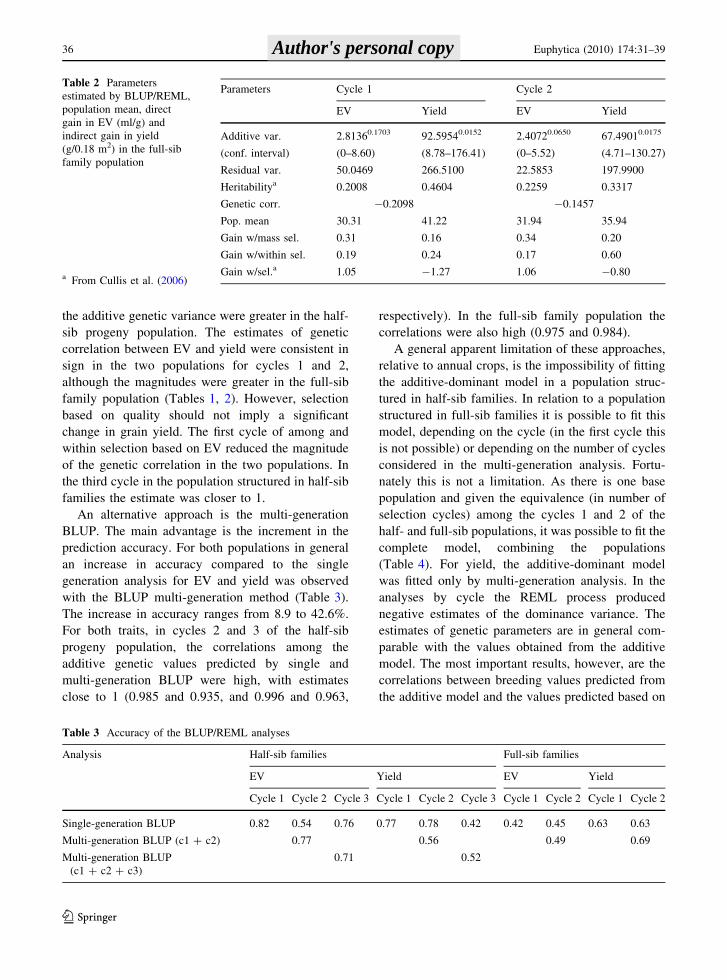
An alternative approach is the multi-generation
BLUP. The main advantage is the increment in the
prediction accuracy. For both populations in general
an increase in accuracy compared to the single
generation analysis for EV and yield was observed
with the BLUP multi-generation method (Table 3).
The increase in accuracy ranges from 8.9 to 42.6%.
For both traits, in cycles 2 and 3 of the half-sib
progeny population, the correlations among the
additive genetic values predicted by single and
multi-generation BLUP were high, with estimates
close to 1 (0.985 and 0.935, and 0.996 and 0.963,
respectively). In the full-sib family population the
correlations were also high (0.975 and 0.984).
A general apparent limitation of these approaches,
relative to annual crops, is the impossibility of fitting
the additive-dominant model in a population struc-
tured in half-sib families. In relation to a population
structured in full-sib families it is possible to fit this
model, depending on the cycle (in the first cycle this
is not possible) or depending on the number of cycles
considered in the multi-generation analysis. Fortu-
nately this is not a limitation. As there is one base
population and given the equivalence (in number of
selection cycles) among the cycles 1 and 2 of the
half- and full-sib populations, it was possible to fit the
complete model, combining the populations
(Table 4). For yield, the additive-dominant model
was fitted only by multi-generation analysis. In the
analyses by cycle the REML process produced
negative estimates of the dominance variance. The
estimates of genetic parameters are in general com-
parable with the values obtained from the additive
model. The most important results, however, are the
correlations between breeding values predicted from
the additive model and the values predicted based on
Table 2 Parameters
estimated by BLUP/REML,
population mean, direct
gain in EV (ml/g) and
indirect gain in yield
(g/0.18 m2) in the full-sib
family population
a From Cullis et al. (2006)
Parameters Cycle 1 Cycle 2
EV Yield EV Yield
Additive var.
(conf. interval)
2.81360.1703
(0–8.60)
92.59540.0152
(8.78–176.41)
2.40720.0650
(0–5.52)
67.49010.0175
(4.71–130.27)
Residual var. 50.0469 266.5100 22.5853 197.9900
Heritabilitya 0.2008 0.4604 0.2259 0.3317
Genetic corr. -0.2098 -0.1457
Pop. mean 30.31 41.22 31.94 35.94
Gain w/mass sel. 0.31 0.16 0.34 0.20
Gain w/within sel. 0.19 0.24 0.17 0.60
Gain w/sel.a 1.05 -1.27 1.06 -0.80
Table 3 Accuracy of the BLUP/REML analyses
Analysis Half-sib families Full-sib families
EV Yield EV Yield
Cycle 1 Cycle 2 Cycle 3 Cycle 1 Cycle 2 Cycle 3 Cycle 1 Cycle 2 Cycle 1 Cycle 2
Single-generation BLUP 0.82 0.54 0.76 0.77 0.78 0.42 0.42 0.45 0.63 0.63
Multi-generation BLUP (c1 ? c2) 0.77 0.56 0.49 0.69
Multi-generation BLUP
(c1 ? c2 ? c3)
0.71 0.52
36 Euphytica (2010) 174:31–39
123
Author's personal copy
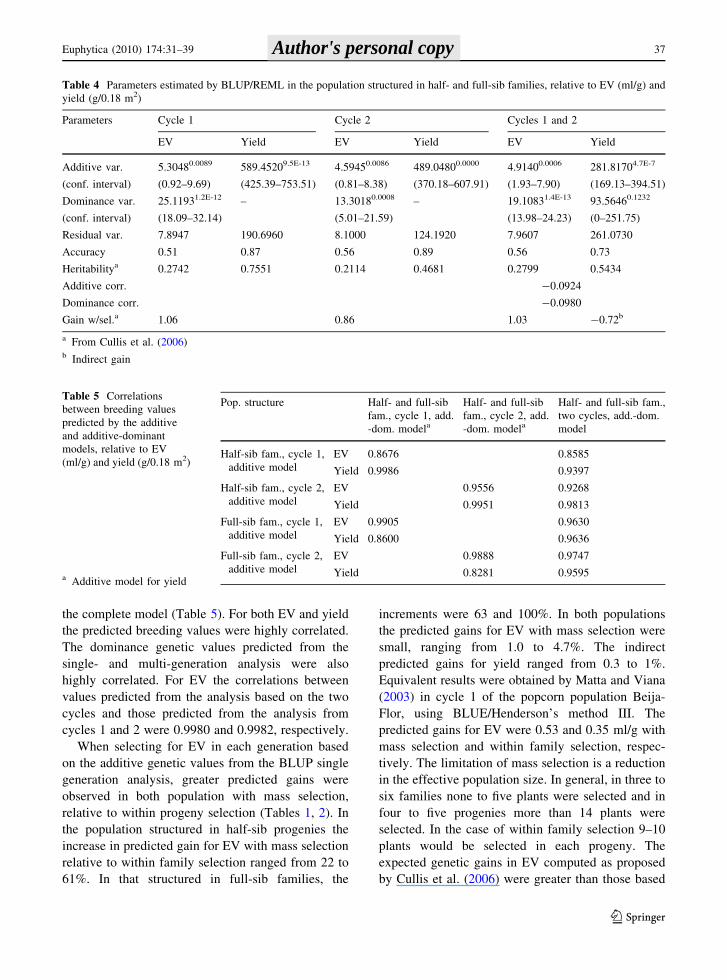
the complete model (Table 5). For both EV and yield
the predicted breeding values were highly correlated.
The dominance genetic values predicted from the
single- and multi-generation analysis were also
highly correlated. For EV the correlations between
values predicted from the analysis based on the two
cycles and those predicted from the analysis from
cycles 1 and 2 were 0.9980 and 0.9982, respectively.
When selecting for EV in each generation based
on the additive genetic values from the BLUP single
generation analysis, greater predicted gains were
observed in both population with mass selection,
relative to within progeny selection (Tables 1, 2). In
the population structured in half-sib progenies the
increase in predicted gain for EV with mass selection
relative to within family selection ranged from 22 to
61%. In that structured in full-sib families, the
increments were 63 and 100%. In both populations
the predicted gains for EV with mass selection were
small, ranging from 1.0 to 4.7%. The indirect
predicted gains for yield ranged from 0.3 to 1%.
Equivalent results were obtained by Matta and Viana
(2003) in cycle 1 of the popcorn population Beija-
Flor, using BLUE/Henderson’s method III. The
predicted gains for EV were 0.53 and 0.35 ml/g with
mass selection and within family selection, respec-
tively. The limitation of mass selection is a reduction
in the effective population size. In general, in three to
six families none to five plants were selected and in
four to five progenies more than 14 plants were
selected. In the case of within family selection 9–10
plants would be selected in each progeny. The
expected genetic gains in EV computed as proposed
by Cullis et al. (2006) were greater than those based
Table 4 Parameters estimated by BLUP/REML in the population structured in half- and full-sib families, relative to EV (ml/g) and
yield (g/0.18 m2)
Parameters Cycle 1 Cycle 2 Cycles 1 and 2
EV Yield EV Yield EV Yield
Additive var.
(conf. interval)
5.30480.0089
(0.92–9.69)
589.45209.5E-13
(425.39–753.51)
4.59450.0086
(0.81–8.38)
489.04800.0000
(370.18–607.91)
4.91400.0006
(1.93–7.90)
281.81704.7E-7
(169.13–394.51)
Dominance var.
(conf. interval)
25.11931.2E-12
(18.09–32.14)
– 13.30180.0008
(5.01–21.59)
– 19.10831.4E-13
(13.98–24.23)
93.56460.1232
(0–251.75)
Residual var. 7.8947 190.6960 8.1000 124.1920 7.9607 261.0730
Accuracy 0.51 0.87 0.56 0.89 0.56 0.73
Heritabilitya 0.2742 0.7551 0.2114 0.4681 0.2799 0.5434
Additive corr. -0.0924
Dominance corr. -0.0980
Gain w/sel.a 1.06 0.86 1.03 -0.72b
a From Cullis et al. (2006)b Indirect gain
Table 5 Correlations
between breeding values
predicted by the additive
and additive-dominant
models, relative to EV
(ml/g) and yield (g/0.18 m2)
a Additive model for yield
Pop. structure Half- and full-sib
fam., cycle 1, add.
-dom. modela
Half- and full-sib
fam., cycle 2, add.
-dom. modela
Half- and full-sib fam.,
two cycles, add.-dom.
model
Half-sib fam., cycle 1,
additive model
EV 0.8676 0.8585
Yield 0.9986 0.9397
Half-sib fam., cycle 2,
additive model
EV 0.9556 0.9268
Yield 0.9951 0.9813
Full-sib fam., cycle 1,
additive model
EV 0.9905 0.9630
Yield 0.8600 0.9636
Full-sib fam., cycle 2,
additive model
EV 0.9888 0.9747
Yield 0.8281 0.9595
Euphytica (2010) 174:31–39 37
123
Author's personal copy
on the predicted breeding values. The predicted
indirect gains in yield were not concordant in
magnitude and/or sign.
In the half-sib progeny population, coincidence
involving the 196 individuals selected by mass selec-
tion using BLUP single generation analysis and
phenotypic selection decreased over the cycles. In
the BLUP analyses, 85.7, 77.5 and 53.1% of the
individuals selected in the first, second and third cycles
were also indicated as superior by phenotypic selec-
tion. Therefore, as the pedigree information was added
to the BLUP individual analyses, the coincidence
decreased between the methods. When selection was
based on predictions from the multi-generation anal-
ysis, there were slightly higher coincidence values
with phenotypic selection, of 83.7 and 58.2% for the
second and third cycles, respectively. In the population
structured in full-sib families, the coincidence among
the individuals selected by mass selection using
individual BLUP analyses and phenotypic selection
also decreased from the first to the second cycle, from
85.7 to 82.6%. In contrast, an increase in coincidence
between phenotypic selection and selection based on
multi-generation BLUP analysis was observed, from
70.0 to 98.0% in the two selection cycles.
Discussion
The most important aspect that should be discussed
when using the BLUP method through the animal
model is the fit of the additive model, even when it is
known that the expression of the trait depends on
interactions between alleles (dominance). This, how-
ever, is never taken into consideration in many
applied and simulated studies, probably because there
is a consensus among breeders that the methodology
adequately predicts the true additive genetic values
that are generally more accurate than those obtained
by other methods (Kumar et al. 2008). This was
demonstrated in our study. Simulation studies by
Leclerc et al. (2008) and Stock et al. (2007) involving
continuous and categorical traits and molecular data
in QTL analyses have shown the great efficiency and
usefulness of the BLUP methodology, even with
multi-trait and random regression analyses.
There is also a consensus that the technique offers
adequate prediction of additive genetic values when
there is generation overlay and/or partial or total lack
of pedigree information and selection effect, whether
by man or natural. Kruuk (2004) indicated that the
BLUP/REML methodology is a powerful way to
estimate the components of variance and to predict
additive genetic values in natural populations. But
Cantet et al. (2000), in a simulation study, reported
underestimation of heritability in the population
under selection, because the relationship information
was only partially available and the existence of
selection makes heritability biased.
There is no doubt, however, that the fit of the
additive-dominance model is important in combining
ability studies, especially when there is interest in
predicting non-performed crosses (Bernardo 1996).
In the study by Flacheneckar et al. (2006a, b), where
the additive model was fitted, the prediction of the
performance of the full-sib families by the mean
additive genetic value of the parents was not satis-
factory for yield, but it was satisfactory for a less
important characteristic (grain moisture) and for a
second characteristic called the selection index
(which is a function of the yield and dry matter
content), probably because it not does not depend
greatly on dominance effects.
Although the results obtained in many theoretical
and applied studies have systematically shown the
superiority of the BLUP method compared to BLUE,
because of the greater accuracy of the predicted
values compared to the phenotypic values, the
difference between the different selection methods
is not always emphasized (Kumar et al. 2008),
especially when the data are balanced and from only
one generation (Knott et al. 1995).
Acknowledgements We thank the Foundation for Research
Support of Minas Gerais State (Fapemig), the Brazilian Federal
Agency for Support and Evaluation of Graduate Education
(Capes) and the National Council for Scientific and
Technological Development (CNPq) for financial support.
Appendix
ASReml code for the additive-dominant model
!Workspace 200
BLUP analysis, population structured in half- and
full-sib families, two cycles
38 Euphytica (2010) 174:31–39
123
Author's personal copy
a 1535 !p # additive value
d 1535 # dominance value
pop 2 # population
env 4 # environment
ev # expansion volume
y # grain yield
z ! = ev ! ? y # to permit estimation of gen./
non gen. corr./covariance
ped.txt # pedigree file
Amatrix.grm # additive relationship matrix
Dmatrix.grm # dominance relationship matrix
data.asd # data file
!ddf # correction of df by the Kenward-Roger
method
!continue # to continue REML process
!maxit 30 # maximum number of interactions
ev or y or z * mu pop env pop.env !r a d
predict a !vpv # necessary to compute generalized
measure of heritability
The additive and dominance relationship matrices
files were generated by a program developed in
REALbasic 5.5. To read the prediction error variance
matrix in the file .pvs another REALbasic 5.5 program
was developed.
References
Bauer AM, Leon J (2008) Multiple-trait breeding values for
parental selection in self-pollinating crops. Theor Appl
Genet 116:235–242
Bauer AM, Reetz TC, Leon J (2006) Estimation of breeding
values of inbred lines using best linear unbiased predic-
tion (BLUP) and genetic similarities. Crop Sci 46:2685–
2691
Bernardo R (1996) Best linear unbiased prediction maize sin-
gle-cross performance. Crop Sci 36:50–56
Cantet RJC, Birchmeier AN, Santos-Cristal MG, de Avila VS
(2000) Comparison of restricted maximum likelihood and
Method R for estimating heritability and predicting
breeding value under selection. J Anim Sci 78:2554–2560
Crossa J, Burgueno J, Cornelius PL, McLaren G, Trethowan R,
Krishnamachari A (2006) Modeling genotype x environ-
ment interaction using additive genetic covariances of
relatives for predicting breeding values of wheat geno-
types. Crop Sci 46:1722–1733
Cullis BR, Smith AB, Coombes NE (2006) On the design of
early generation variety trials with correlated data. J Agric
Biol Environ Stat 11:381–393
Eberhart SA (1970) Factors effecting efficiencies of breeding
methods. Afr Soils 15:669–680
Flachenecker C, Frisch M, Falke KC, Melchinger AE (2006a)
Modified full-sib selection and best linear unbiased
prediction of progeny performance in a European F2
maize population. Plant Breed 125:248–253
Flachenecker C, Frisch M, Falke KC, Melchinger AE (2006b)
Trends in population parameters and best linear unbiased
prediction of progeny performance in a European F2
maize population under modified recurrent full-sib selec-
tion. Theor Appl Genet 112:483–491
Gilmour AR, Gogel BJ, Cullis BR, Thompson R (2006)
ASReml user guide release 2.0. VSN International Ltd,
Hemel Hempstead
Henderson CR (1974) General flexibility of linear model
techniques for sire evaluation. J Dairy Sci 57:963–972
Knott SA, Sibly RM, Smith RH, Moller H (1995) Maximum
likelihood estimation of genetic parameters in life-history
studies using the ‘‘animal model’’. Funct Ecol 9:122–126
Kruuk LEB (2004) Estimating genetic parameters in natural
populations using the ‘‘animal model’’. Philos Trans R
Soc Lond B Biol Sci 359:873–890
Kumar A, Gandh RS, Singh A, Haile A (2008) Comparison of
animal model with other conventional methods of sire
evaluation for milk production in Karan Fries cattle.
Indian J Anim Sci 78:1393–1396
Leclerc H, Wensch-Dorendorf M, Wensch J, Ducrocq V,
Swalve HH (2008) A general method to validate breeding
value prediction software. J Dairy Sci 91:3179–3183
Littell RC, Milliken GA, Stroup WW, Wolfinger RD, Scha-
benberger O (2006) SAS for mixed models, 2nd edn. SAS
Institute Inc., Cary
Matta FP, Viana JMS (2003) Eficiencias relativas dos processos de
selecao entre e dentro de famılias de meiosirmaos em popu-
lacao de milho-pipoca. Ciencia e Agrotecnologia 27:548–556
Mrode RA (2005) Linear models for the prediction of animal
breeding values, 2nd edn. CABI Publishing, Oxfordshire
Nunes JAR, Ramalho MAP, Ferreira DF (2008) Inclusion of
genetic relationship information in the pedigree selection
method using mixed models. Genet Mol Biol 31:73–78
Patterson HD, Thompson R (1971) Recovery of inter-block
information when block sizes are unequal. Biometrika
58:545–554
Piepho HP, Mohring J, Melchinger AE, Buchse A (2008)
BLUP for phenotypic selection in plant breeding and
variety testing. Euphytica 161:209–228
Reis AJD, Chaves LJ, Duarte JB, Brasil EM (2005) Prediction
of hybrid means from a partial circulant diallel table using
the ordinary least square and the mixed model methods.
Genet Mol Biol 28:314–320
Sebolai B, Pedersen JF, Marx DB, Boykin DL (2005) Effect of
control plot density, control plot arrangement, and
assumption of random or fixed effects on nonreplicated
experiments for germplasm screening using spatial mod-
els. Crop Sci 45:1978–1984
Stock KF, Hoeschele I, Distl O (2007) Estimation of genetic
parameters and prediction of breeding values for multi-
variate threshold and continuous data in a simulated horse
population using Gibbs sampling and residual maximum
likelihood. J Anim Breed Genet 124:308–319
Viana JMS (2005) Dominance, epistasis, heritabilities and
expected genetic gains. Genet Mol Biol 28:67–74
Viana JMS, Faria VR, Silva AC (2009) Bias in the prediction
of genetic gain due to mass and half-sib selection in
random mating populations. Genet Mol Biol 32:497–506
Euphytica (2010) 174:31–39 39
123
Author's personal copy