Madagascar Export Crops Sub-sector Review
184
Report No. S097-MAG Madagascar Export Crops Sub-sector Review Decemir 28, 1984 EastAfiica Prjects Dcpartmnent Central Agriculture Division FOR OFFICIAL USE ONLY 1::_ -bidlosued oAf tht World: Bank'atoiain MS ,. . -hi doumn ha a ret-ce ditibto an ma be use by .re-. ;. .. e.s. 1nl -nth per_orancef terffca du-s -t cotet ma no othewis be di,sclosed w_hu Wol Ban authorization Public Disclosure Authorized Public Disclosure Authorized Public Disclosure Authorized Public Disclosure Authorized
-
Upload
khangminh22 -
Category
Documents
-
view
2 -
download
0
Transcript of Madagascar Export Crops Sub-sector Review

Report No. S097-MAG
MadagascarExport Crops Sub-sector ReviewDecemir 28, 1984
East Afiica Prjects DcpartmnentCentral Agriculture Division
FOR OFFICIAL USE ONLY
1::_
-bidlosued oAf tht World: Bank'atoiain
MS ,. .
-hi doumn ha a ret-ce ditibto an ma be use by .re-. ;. ..e.s.1nl -n th per_orancef terffca du-s -t cotet ma no othewis
be di,sclosed w_hu Wol Ban authorization
Pub
lic D
iscl
osur
e A
utho
rized
Pub
lic D
iscl
osur
e A
utho
rized
Pub
lic D
iscl
osur
e A
utho
rized
Pub
lic D
iscl
osur
e A
utho
rized

CURRENCY EQUIVALENTS
currency Unit tialsy Francs (FMG)USS1.00 - FMG 550 1/FMG 100 - US$0.18
WEIGHTS AND MEASURESmetric System
metric
1 hectare (ha) 2.47 acres1 kilometer (ka) - 0.62 mileI square kilometer (km2) , 0.39 square mile1 kilogram (kg) - 2.20 poundsI liter (1) 0.26 US gallon
0.22 Imperial gallon1 metric tonne (t) 2,204 pounds
GOVERNMENT ADNINISTRATIONFokonolona Institutions
Fokantany - villageFiraisam-pokontany - group of Fokontany
(or Firaisana) (former canton)Fivondronan-pokonolona - group of Firaisana
(or Fivondronana) (former sub-prefecture)Faricany - group of Fivondronana
(former province)
FISCAL YEAR
Government of Madagascar January 1-December 31Parastatals Vary by institutions but most
commonly january 1-December 31
11 The exchange rate between the US dollar and the Malagasy franc used inthis report is based on an average of the rates obtained during thesecond half of 19b3.

FOR OMCIAL USE ONLY
Abbreviations and Glossary
BCRDH Central Bank of Madagascar (Banque Centrale de la RepubliqueDemocratique de Madagascar)
BCSPG Clove Marketing Board and Price StabilIzatiou Fund (Bureau deCommercialisation et de Stabilisation des prix du Girofle)
BCSPP Pepper Marketing Board and Price Stabilization Fund (Bureau deCommercialisation et de Stabilisation des Prix du Poivre)
BFV National Commercial. Bank (Banky Fampandrosoana Ny Varotra)BNI National Industrial Development Bank (Bankin' Ny Indostria)BTH Rural Development Bank of Madagascar (Bankin' Ny Tantsaha
Mpamokatra)CAVAGI Coffee Vanilla and Cloves Stabilization FundsCCCE French Development Fund (Caisse Ceutrale de Cooperation
Econouique)-CMN Malagasy navigation company (Compagnie ialgache de Navigation)COROI State marketing company (Comptoir de Commerce et de
Representation de L'Oc-an ludien)CSPC Coffee Price Stabilization Fund (Caisse de Srabilisation des Prix
du Cafe)CSPV Vanilla Price Stabilization Fund (Caisse de Stabilisation des
Prix de la Vanille)DGP Directorate General of Planning (Direction Generale de la
Planification)EXA txport Assistance InternationalFAC Prench Technical Assistance Agency (Fonds d'Aide et de
Cooperation) -
FAO Food and Agiculture Organization of the United NationsFED European Development Fund (Fonds Europeen de D&vEloppement)FNUP Natioual Consolidated Equalization Fund (Fonds National Unique de
Pfir6quation)FOB Free on boardFOFIFA National Center for Applied Research on Rural Development (Foibe
Fikorahana Mombnon ny Fampandrosanan ny eny Ambarivohitra)GATT General Agreement on Tariffs and TradeGNIV National Vanilla Association (Groupement National
Interprofessionel de la Vanille)ICA International Coffee AgreementICCO International Cocoa OrganizationICO International Coffee OrganizationINSRE National Institute of Statistics and Economic Research (Institut
National des Statistiques er de la Recherche Economique)IPC International Pepper CommunityISNAR International Service for National Agricultural ResearchITC International Trade CenterMIEM Ministry of Industry, Energy and Mines (Ministare de l'Indust_ie,
de l'Energie et des Mines)MPAEF Ministry of Animal Production, Water and Forests (Ministere de la
Production Animale, des Eaux et Forets)
This document has a restricted distribution and may be used by recipients only in the performanceof their official duties. Its contents may not otherwise be disclosed without World Bank authorization.

MPARA Ministry of Agricultural Production and Agrarian Reform(MinistAre de la Produciton Agricole et de la Reforme Agraire)
MPFE Ministry of Finance and Economy (Ministtre auprAs de laPrgsidence charge des Finance et de 1'Economie)
KRSTD Ministry of Scientific and Techaological Research (MinistAre dela Recherche Scientifique et Tecnnologique pour le d6vRloppement)
MTP Ministry of Public Works (Ministare des Travaux Publics)MTRT Ministry of Transport, Supply and Tourism (Ministare des
Transports, du Ravitaillement et du Tourisme)OAMCAF African and Malagasy Coffee Organization (Organisation Africaine
et Malgache du CafE)OCPGC Coffee, Pepper, Cloves and Cocoa Operation (Operation
Cafe-Poivre-Girofle-Cacao)ODR Rice Development Operation (Op6ration de Developpement Rizicole)RINDRA State audit company (Foibe Mpanaramaso Ny Fanjarianasa)RNCFM National railway network (REseau National des Chemins de Fer
Malagasy)
ROSO State marketing company (Tranombarotra Roso)SICE State marketiug company (SociEte Industrielle et Commrciale de
L'Emyrne)SMTM National maritime transport company (SocietE Malgache des
Transports Maritimes)SOMACODIS State marketing company (SociEte Malgache pour la Collecte et La
Distribution)UNCTAD United Nations Conference on Trade and Development

Executive Summary
Ci) Objectives and Focus. Export crops are the main means oflivelihood for almost one-third of Madagascar's population, and thecountry's principal source of foreign exchange. Coffee alone contributesan average 40-50X of annual export revenue. Cloves and vanilla are alsocritically important to the economy. Together these three account forabout 80% of export revenues. This report examines Madagascar'sperformance, policies and prospec.s with regard to development of these andother export crops, in order to provide a framework for Government/Bankdialogue and subsequent action in this important sub-seccor of agriculture(Chapter I).
(ii) External Market Constraints and Prospects. Over the past decadeMadagascar's export earnings have been sustained mainly by the 1976-77 boomin world market prices for coffee, and by the subsequent sharp rise inexport prices for cloves and vanilla. Simultaneously the export volume formost other crops has been in steep decline. Increases in export revenueswill be difficult to sustain in view of unpromising prospects for rapidgrowth in world markets for Madagascar's key export commoditites. Externalmarket constraints (including slow consumption growth, international quotaagreements and quality standards, and increasingly intense competition frommore enterprising trading countries) limit export growth potential.However internal policies and constraints (including declining volume,reliability and quality of production, lack of price incentives for exportcrop production, Government monopolies and excessive controls on exporttrading, and neglect of export services and promotion) have also seriouslyweakened Madagascar's ability to expand agricultural exports. Marketopportunities are identified for renewed growth in exports of coffee,vanilla, cocoa, green pepper, sisal and a diversified range of lesser,inadequately exploited crops (Chapter II).
(iii) Crop Production Constraints and Prospects. Despite favorablelands, soiLs and climatic conditions for tropical agriculture, productionof export crops (with the exception of cloves and, to a lesser extent,vanilla) has become increasingly unprofitable for small farmers as a resultof prevailing pricing policies. Yields are well below potential.Production is severely constrained by labor shortages at times of peakdemand, low standards of farming technology, inadequate input supplyservices, weak extension services, neglect of crop research, and lack offarmer access to wage goods and to protection against climatic risks.Faced with these problems, many cash crop farmers have reverted to asemi-subsistence system of cultivation. To reverse this situation, majoradjustments in agricultural policy and services are required, most urgentlyfor coffee. Cocoa, sisal and cassava also warrant attention forrehabilitation, and longer-term opportunities are identified for increasedproduction of coconut, cashew, maize, various fruit crops and spices. Toprovide an adequate foundation for future production growth, early actionis needed to overhaul extension services and techniques, to re-establishessential infrastructure and input supply services, to create a viablesystem for crop monitoring and forecasting, and to reformulate export croppricing policies to provide production incentives (Chapter III).

Cii)
(iv) Internal Marketing Constraints and Prospects. Policy changes andlegislative measures introduced during the 1970s greatly increasedGovernment involvement in the marketing system for export crops. Coffee,cloves, black pepper and certain lesser crops became subject to statetrading monopolies, and the activities of private sector marketing andprocessing enterprises were severely circumscribed. In general, theregulated marketing system has functioned poorly, and operationaLdifficulties are widespread. Lack of strategic planning, inadequatefaciliti-s at the primary marketing level, deteriorating transportinfrastructure, inefficiencies in port handling, severe weaknesses inquality control of export commodities, complex export administrationprocedures, inadequate market-research and promotion services, andstructural distortions in the marketing and pricing system are among themost serious constraints. Reduction of marketing costs offers possibly thegreatest scope for early improvement in the profitability of agriculturalexport production and trade. Initial action in this direction calls mainlyfor organizational and policy adjustments (Chapter IV).
(v) Pricing Policy Constraints and Prospects. For the main exportcrops a system of administered pricing, providing guaranteed minimum pricesto producers and exporters, has been maintained since Madagascar becameindependent in 1960. A separate price stabilization scheme is operated foreach commodity, and official price structures are issued annually. Thesystem has provided a degree of protection to growers under volatilecommodity trading conditions, but it has become arbitrary, inflexible andinefficient. Price setting procedures are bureaucratic, are not based oneconomic criteria, and have been unresponsive to farm production costs andconstraints. The structures and operations of the Price StabilizaitonFunds have not evolved in line with changing production and tradeconiditious, and have been weakened by poor financial management, seriousaccounting flaws and organizational weaknesses. Pricing policies aredictated mainly by the short-term needs of the Government Treasury. Thedecline of coffee production, for example, is mainly attributed toarbitrary pricing, heavy taxation, diversion of Stabilization Fund revenuesto non-productive sectors of the economy and inadequate re-investment ofresources in coffee development. Major changes in pricing policies andprocedures are called for, including reexamination of the level oftaxation, liberalisation or abolition of the set differentiels, andfixation of producer floor prices, based on improved knowledge of actualproduction and marketing costs and the criterion of border pricing (ChapterV).
(vi) Institutional Constraints and Prospects. Government policychanges since 1972 have vastly expanded the role and numbers of publicinstitutions in foreign and domestic trade. Export crop developmentdirectly or indirectly involves no fewer than eight ministries, of whichMPARA (and its dependent agency OCPGC) and MC (which overseas theStabilization Funds and parastatal trading agencies) are the mostimportant. Since 1982 an extensive realignment and internal reorganizationof these institutions has been underway, but the process is not yetcomplete. In the private sector, Government policies since the early 1970s

Ciii)
actively discouraged investment and severely curtailed export operations.Howerer, a well-established residual nucleus of private enterprises existswhich handles the vanilla trade and could rapidly expand exports of otheragricultural products under more favorable production and tradingconditions. A review of institutional structures and resources shows theneed to address a range of organizational issues facing the public sector(fragmented responsibilities, ill-defined objectives, weak planning andcoordination, poor information services, procedural and managementconstraints) and to re-activate private sector investment in order toaccelerate export growth (Chapter VI).
(vii) Action Undertaken. Since 1981 the Government has sought ways toinitiate a strong recovery in export crop production and trade. Variousstabilization measures and policy adjustments have been implemented to dealwith the broader economic and agricultural sector issues affecting exportgrowth. Specific steps taken recently to alleviate the identified externaltrading, production, marketing, pricing and institutional constraints areitemized (Chapter VII, 7.02-7.03). Outstanding issues for early attentionare identified (7.04-7.05). Conclusions and recommendations for follow-upaction arising from this review are both commodity-specific and applicableto the export crops sub-sector as a whole (7.06).
CViii) Coffee. The problems for coffee development are the mosteconomically important and complex among the major crops, and the leastamenable to rapid solutions. Long-term strategy should aim to strengthenMadagascar's competitive position in the world market through crop researchand technological diversification. A medium-term plan (1986-1990) shouldseek to revitalize the coffee sector through rehabilitation of robustacoffee production, exploitation of arabica coffee potential, and upgradingof coffee quality. Short-term action (1984-85) should focus on improvedcultivation, marketing and trading efficiency. Immediate prioritiesinclude action on: (a) pricing policy and incentives (including an increasein real producer prices of 502 over teLree years, and an initial increase in1984/85 of 15-20% over the 1983/84 guaranteed producer price); (b) thestructure and mechanisms for price setting and.administration (includingestablishment of economic criteria for price determination, and an improvedmethodology and procedure for annual price reviews); (c) improvement ofinput supply and distribution; (d) reduction of transport and shippingbottlenecks to coffee exporting, (e) upgrading of processing and qualitycontrol, and (f) improvements in organization and administration(7.07-?7.08).
(ix) Cloves. The prospects for development of clove exports are notpromising, since Madagascar's existing production capacity far exceeds theexpected growth rate of world market demand. A dual strategy isrecommended which calls for production and price restraint and vigorousexploitation of available markets for clove products. Medium-term planning(1986-1990) should aim to promote broader growth of the country's spicetrade based on established markets for cloves. Short-term action (1984-85)should focus on reduction of accumulated stocks. Immediate prioritiesinclude: (a) active market promotion in target countries; (b) more flexible

(iv)
export pricing to secure entry into new markets; (c) maintenance ofunchanged producer prices; (d) utilization of Stabilization Fund Resourcesto finance export market development; (e) basic improvements to cropquality and storage; and (f) formulation of a program of industrial andtechnological research to identify the scope for diversified product formsand industrial uses for subsidiary clove products (7.09-7.10).
(x) Vanilla. Demand growth prospects are relatively stable.Nadagascar's position as leading world supplier has made possibleapplication of monopolistic pricing policies; however, the high pricescharged are threatening Madagascar's revenue prospects as they haveencouraged consumers to switch to cheap synthetic flavorings. In order tosustain long-term demand, early action is recommended to raise yieldsthrough improved crop husbandry and extension services, to strengthenongoing agronomic research, and to explore new consumer uses for naturalvanilla. Short-term plans (1984-85) should focus on re-investment ofStabilization Fund resources in crop and market development under amedium-term (1986-1990) plan. Priorities for investment include: (a)development of vanilla research and extension services; (b) diversificationof production areas and cropping systems; (C) technological, productdevelopment and market research; and (d) providing institutional supportfor GNIV (the National Vanilla Association), a private sector institution(7.11-7.12).
(xi) Pepper. The outlook is favorable for continued growth in worldmarkets for both black and green pepper, but Madagascar's export growthprospects differ between the two. A pepper development strategy shouldfavor expanded production and promotion of green pepper (a Malagasyspeciality) by improving extension, input supply and crop collectionservices and by encouraging additional private sector investment in thisproduct. For black pepper, fundamental policy changes are needed quicklyto restore production and trade on a profitable basis. In the area oftrade policy, (a) removal of marketing and pricing controls and (b)abolition of the price stabilization scheme for black pepper arerecommended. Priorities from an agricultural policy standpoint shouldfocus on (c) raising crop yields through supply of improved plant material,reduction of plant material, reduction of plant disease, improved use offertilizer, and husbandry techniques, and (d) linkage of production andtrading operations within a coherent strategy and action plan torestructure and expand pepper exports with effect from 1985 (7.13-7.14).
(xii) Cocoa. Despite generally unpromising world market and pricetrends, cocoa offers some scope for increased production and exportearnings. Production by small farmers is expanding, yields are moderateand capable of further increases, and apparent demand exists for Malagasycocoa varieties. Short-term action (1984-85) should focus on: (a) carryingout a detailed study on cocoa development potential and (b) maintaining andincreasing support for varietal and yield improvement through OCPGC.Experience gained in this period would guide the formulation of a moreprecise medium-term (1986-1990) strategy for expansion of cocoa exports(7.15-7.16).

(v)
(xiii) Lesser Crops. In addition to the five principal export crops,eight other commodities are suggested for further research and developmentin the immediate future (7.17). An in-depth study is needed on sisal, awell-established crop in Madagascar and traditional foreign-exchange earner(7.18). Recent liberalization of trade in butter beans ('pois du cap')should assist a revival of production and renewed export growth of thiscrop (7.19). Production and long-term export possibilities for coconuthave not been sufficiently exploited (7.20). Another versatile crop,well-established in certain areas, is cashew, for which Madagascar has asmall export market capable of further development (7.21). Production ofcassava is second only to rice among the food crops, and provides the rawmaterial for processing and export of tapioca in increased quantities(7.22). High priority should be given to detailed study of maize exportpotential in the light of apparent adaptability of this crop to variousregions and unfulfilled export demand (7.23). The export prospects forvarious spices, such as cinnamon, nutmeg and ginger, have so far beenpoorly exploited and should be examined, in conjunction with vanilla andcloves, by a proposed National Spice Promotion Board (7.24). Madagascar'sdiversified climate and land resources also offer considerable long-termscope for increasing exports of tropical fruits, for which rehabilitationof transport infrastructure and an investment code to attract privatecapital would be essential pre-conditions for trade expansion (7.25).
(xiv) Export Crop Development Strategy. Development planning forspecific crops should be reviewed in the broader context of economic andsector development plans. Preparation of a long-term inter-sectoralstrategy and action plan for the export crops sub-sector is recommended andshould follow Government/Bank review of the present report (7.26).
Cxv) Components of an Export Crop Strategy. The principal policychoices lie between expansion, rehabilitaiton and diversification, or acombination of these three options. Crop diversification policy shouldalso weigh options for crop, product, market and production areadiversification. An overall strategy for Madagascar should seek to: (a)reconcile crop resource potential with external market opportunities, (b)establish policy linkages between production, internal marketing,agro-industrial processing and pricing policies for specific crops, and (c)ensure coordination of information, research, extension, input supply andpromotion services. Relationships between external and domestic marketsand prices, and between cash crop and food crop policies, should becarefully evaluated (7.27).
(xvi) Recommended Strategy. The three main export crops (coffee,cloves and vanilla) offer limited prospects for long-term economic growth.It is therefore recommended that Government's long term goals should focuson regional crop and product diversification. In the medium-term, however,Madagascar will remain heavily dependent on the existing major crops; forthe 1986-1990 period emphasis should be on expansion of established cropexports and progressive diversification of production. In the short term(1984-85), Government efforts should focus on (a) measures forrehabilitation of production and diversification of markets for the major

(vi)
export crops, (b) expansion of the existing export trade among lessercrops, and (c) preparation of a strategy and action plan for long-termdiversification and development (7.28).
(xviL) Priorities for Action. Follow-up action in response to thisreview will require Government/Bank dialogue on a range of issues whichcall for early attention. These issues include information management,manpower training, price policy formulation, institutional reform,marketing infrastructure, control of quality standards, and the role inexport crop development assigned to the private sector (7.29). The mainelements of an action plan and schedule to address these issues is annexedto this report (7.30). It is suggested that within this framework foraction, the agenda for discussions should focus on five key topics:
(a) coffee development(b) marketing policy issues(c) pricing policy issuesCd) institutional reforms(e) export diversification

MADAGASCAR
EXPORT CROPS
SUB-SECTOR REVIEW
Table of Contents
Page
I. INTRODUCTION .............................. ...... ........ .......... I
I1. EXPORT MARKETS: STATUS AND TRENDS
A. Structure of External Trade ............. ..... ............... 4B. The Market for Coffee . 4C. The Market for Cloves ......................................... 13D. The Market for Vauilla .. .... .. ... ..... .. . .. .. . * * * * * * * * * * * * * * * 17E. Markets for Lesser Crops ..... ............... .... .................... 22F. Conclusions ......... ........ ............ ................... ... 29
III. EXPORT CROP PRODUCTION
A. Ecological Conditions for Crop Production .............. ...... 31B. Production and Post-Harvest Practices ........................ 31C. Production Volumes and Yields ................................ 35D. Farming Systems and Constraints .............................. 40E. Economics of Crop Production ..... .... ........................ 44F. Scope for Crop Diversification ...... *..*................ .... 49G. Conclusions ................................................ . 52
IV. EXPORT CROP MARKETING
A. Crop Marketing Systems ........ ...................................... 54B. Status of Marketing Operations ............................... 58C. Conclusions ....... ........................................ .. 66
V. PRICING AND PRICE STABILIZATION
A. Price Administration System ............ . ................. 68B. PLices and Margins .......................................... 70C. Role and Operations of the Stabilization Funds ............ ... 73D. Utilization of Export Revenues ............................... 75E. Conclusions ....... ......... ....................... 78

VI, ORGANIZATION FOR EXPORT
A. Institutional Framework .. . .... .. . .. .. . ... . ... .. . ... . ... . .. .. 80B. *Private Sector Operations *.*... ... . .......... .87
C. Organization of Export Services ............................. 88
VII. PROSPECTS FOR DEVELOPM4ENT
A. General Situation Summary ....... **** ****. ................... . 92B. Commodity Prospects and Scope for Development ............... 98C. Towards an Export Crop Development Strategy ........... 105
Annex: Main Elements of an Action Plan
Tables (separate listing)
Graphs and Charts (separate listing)
map: IBRD 28282

List of Tables
TableNo. Title
1. Structure of Merchandise Imports (c.i.f_) 1978-19822. Structure of Merchandise Exports (f.o.b_) 1978-19823. Value and Volume of Total Exports, 1960-19824. Crop Production, 1973-19825. Major Merchandise Exports (Volume m/t), 1973-19826. Major Merchandise Exports (Value f.o.b., FMg mill.) 1973-19827_ World Net Imports of Coffee by Major Regions/Countries8. Coffee Prices, 1973-82 and 1983-95 (Projected)9. Price Differences between Centrals and Other Kinds of Coffee
10. Coffee Year 1983/84: Exporting Members Entitled to a basic Quota11. Coffee Year 1983/84: Exporting Members Initial Annual and Quarterly
Quotas12. Madagascar: Coffee Production and Exports 1973-198413. Coffee Exports by ICO Exporting Members to Non-Members14. Madagascar: Cloves Production and Exports 1973-198215. Indonesian Imports of Cloves, 1973-198116. Imports of Cloves (Excluding Indonesia), 1976-198017. New York Spot Prices for Cloves and Madagascar Producer Prices,
1973-1983
18. Madagascar: VaniUa Production and Exports, 1973-198419. Imports of Vanilla, 1976-198020. New York Spot Prices for Vanilla and Madagascar Producer Prices21. Madagascar: Pepper Production and Exports 1973-198422. World Imports of Pepper, 1976-198023. New York Spot Prices for Pepper and Madagascar Producer Prices24. Production and Export Volumes of Principal Export Crops, 1978-198325. Distribution of Farm Types (October 1983)26. Number of Producers and Farm Size (1983)27. Participation of Women in Agricultural Activities28. Crop Establishment Data for Export Crops29. Estimated Yields of Principal Export Crops30. Producer Prices for Export and Other Crops (October 1983)31. Returns per Laborday on Farm Production from Operation of Existing
Farms, 1982-8332. Prices of Farm Inputs (October 1983)33. Imports of Agricultural Chemicals (Tons), 1979-198334. Price Structure for Coffee, 1975-198335. Price Structure for Clove Buds, 1975-198436. Price Structure for Vanilla, 1975-198337. Price Structure for Black Pepper, 1974-198338. Changes in Coffee Price Components, 1978-198339. Changes iu Clove Price Components, 1978-198340. Changes in Vanilla Price Components, 1978-198341. Changes in Black Pepper Price Components, 1978-198342. Stabilization Fund Receipts and Expenditures, FY 1979/80-1982/8343. FNUP - Annual Receipts and Expenditures, 1979-8244. FNUP - Revenues, Expenses and Investments by Commodity

List of Graphs and Charts
Graphs
Figure 1 World and Brazil's Coffee Production
Figure 2 Real World Coffee Prices and World Stocks
Figure 3 Coffee prices, Actual and Projected
Figure 4 Ratio of Robusta to Arabica Prices
Figure 5 Producer Price as X of Coffee Guaranteed Export Price andActual Export Price
Figure 6 Producer Price as Z of Cloves Guaranteed Export Price andActual Export Price
Figure 7 Producer Price as Z of Vanilla Guaranteed Export Price andActual Export Price
Figure 8 Producer Price as Z of Pepper Guaranteed Export Price andActual Export Price
Figure 9 Producer Prices of Selected Crops as Z of Guaranteed ExportPrice
Figure 10 Producer Prices of Selected Crops as Z of Actual Export Prices
Charts
Chart 1 Export Crop Marketing Circuit
Chart 2 Export Crop Marketing Calendar
Chart 3 List of Participants in Decision-Making
Map: Principal Export Crops of Madagacsar

MADAGASCAR
EXPORT CROPS SUB-SECTOR REVIEW
I. INTRODUCTION
1.01 Objective. Export crops are the main means of livelihood formore than 500,000 farm families, almost one-third of the population ofladagascar. They are also the country's principal source of foreignexchange and important for the future expansion of employment opportunitiesin agriculture. Growth in this sector is therefore critical for social andeconomic development. How to improve Madagascar's competitive standing inworld markets, sustain and expand crop production, increase marketingefficiency, and ensure optimal use of export crop revenues are the mainissues addressed in this review. It is intended that the information,analysis and conclusions presented in the report should provide a frameworkfor Government/Bank dialogue on export policy in the agriculture sector andfor subsequent action.
1.02 Background. The present economic crisis in Madagascar hasprompted renewed interest in export crops after a prolonged period ofrelative neglect. When independence was achieved in 1960, production andtrade in agricultural commodities dominated the national economy. Duringthe 1960s the Government and the private sector sought to build on thiscolonial inheritance. Political changes in the early 1970s, however, ledto new approaches. By the mid-1970s agricultural policy had shiftedexplicitly towards achieving self-sufficiency in food production as apriority goal. Public sector investment increased, and many production andtrading enterprises were nationalised. While the value of crop exportscoutinued to rise, the volume of exports failed to keep pace. Growth inthe agriculture sector as a whole was slow. Another Government policyinitiative in 1978 sought to diversify the economy through rapid expansionof the manufacturing sector. An ambitious public investment programfollowed in 1979, financed in part by a sudden large increase in externalborrowings. As the worldwide recession approached, Madagascar found itsfinancial resources over-extended and the economy plunged quickly intosevere crisis. Since 1980 this crisis has dominated the national scene.Faced now with acute balance of payments difficulties, continued productionstagnation and widespread economic dislocation, the Government has begun tolook more deeply into its export crop performance and prospects.
1.03 Commodity Focus. The range of agricultural exports is broad. Itextends from tropical beverages and spices to livestock, fish, and variousprocessed products, such as tapioca, vegetable fibers and essential oils.Collectively these exports account for about 90% of foreign exchangeearnings. However, a few commodities account for a disproportionatelylarge share of the export trade. Coffee alone contributes an average40-50% of annual export revenue. Cloves and vanilla are also of criticaleconomic importance. In the 1981-82 period the combined value of thesethree crop exports amounted to 80% of foreign exchange earnings froi

-2-
agriculture. Of necessity, this report assigns priority to this group oftraditional exports.. Lesser crops, including pepper, sisal, cocoa, butterbeans (pois du cap), various other spices and essential oils play asignificant supporting role in the export trade and are also examined inthis review. The prospects for crop diversification are also given someconsideration. However, other important sub-sectors of agriculture -livestock, fisheries, and industrial crops such as sugar and cotton - areaddressed more appropriately either in separate studies or in the contextof ongoing Bank-assisted projects. They are therefore considered onlyperipherally in this report.
1.04 Multi-sectoral Implications. The problem of export cropdevelopment is not exclusively agricultural. The production process mustperforce be geared to the final goal of sale in international markets, andtrading performance may be affected by structural, organizational oreconomic weaknesses at any point in the farr-to-market chain. ForMadagascar, given the thousands of miles which separate rural producersfrom their major ultimate markets, this chain is exceptionally long. It isalso internally complex, involving both the public and private sector and alarge number of intermediaries and institutions. Within the Government,export crop development currently involves no fewer than eight ministries,those of Agricultural Production and Agrarian Reform (MPARA), Commerce(MC), Transport, Supply and Tourism (MTRT), Public Works (MTP), IndustryEnergy and Mines (MIEM), Scientific and Technological Research (MBSTD),Finance and Economy (MPFE), and Planning (DGP). The formulation of acoherent development policy in this sector must therefore engage all keyparticipants in the process. Accordingly, the approach adopted for thisreview is inter-sectoral. It recognises that constraints and theirremedies should be identified throughout the export crop production andtrading system.
1.05 Report Structure. The structure of the report is designed toassist sequential study of the system's component parts. Chapter IIexamines trends and prospects in the international commodity markets whichwill influence the progress of Madagascar's exports for the foreseeablefuture. It analyses both past and present constraints and seeks todifferentiate between short-term (19b4/85) and longer-term (1986-1990)opportunities. Chapter III reviews the production of export crops in thislight. It examines the ecological conditions and local environments forcrop production, farming practices, constraints and achievements, and thescope for expanding production in the context of prevailing prices andavailable services. Chapter IV looks into the internal workings of themarketing system on which the farmer depends and which must supply theproducts to the port of exit for international trade. Marketing channels,infrastructure, procedures and services are reviewed, and an assessment ismade of the scope for improving crop processing and marketing efficiency.Chapter V focusses on prices, pricing mechanisms and the issue of pricestabilization. It explores the role and operations of the PriceStabilization Funds, and the use made of export crop revenues controlled bythe Government. Desirable changes in pricing policies and procedures arealso identified. Chapter VI reviews the relationships between various

-3-
participants in the export crop trade, the institutions concerned, and therespective roles which are or should be played by the public and privatesectors. The organization and management of export operations is the mainissue addressed in this chapter. Finally, in Chapter VII, the prospectsfor development are summarized. For each of the commodities considered, aprofile is provided of the opportunities for growth and the measures neededto achieve that growth. The outlines of a coherent inter-sectoral exportcrop development policy are suggested, and alternative strategies andaction plans are reviewed. Relevant tables, charts, and matrices and mapsupporting the body of the report are grouped together in the Annexes.
1.06 Acknowledgements. The report is a product of Government/Bankconsultations on export crop issues over the past three years. It draws onmany sources, and benefits from considerable information assembled for apreliminary Bank working paper on export crops issued in June 1982. Thiscontributed to a first overview of agricultural export issues in the SectorMemorandum on Agriculture and Rural Development issued in March 1983.Following further discussions on these issues, a mission comprisingMessrs. N. Wilkie, E. Los (EAPCA) and M. Couillaud (consultant) visitedMadagascar in September 1983 to carry out a more extensive study of theexport crop sub-sector. The present report mainly reflects the work ofthis mission and its close collaboration with many Government officials inconcerned ministries and agencies. A follow-up mission in March 1984 byMr. N. Wilkie, the study coordinator, assisted in updating the analysis ofproduction and trade statistics and in reviewing institutional changesresulting from Government reorganization during the latter half of 1983.Outstanding information gaps and statistical inconsistencies, where theseare especially important, are discussed in relevant sections of thereport. EAPCA staff responsible for the present report recognize thevaluable contributions made by Malagasy officials, by the studies of otherorganizations cited in the text, and by colleagues in various quarterswithin the Bank during its preparation.
1.07 Note. The statistical data and commentary contained in thisreport were updated in April 1984. The report therefore does not takeaccount of either subsequent developments or action subsequently undertakenby the Government of Madagascar. Following review of the findings andconclusions of this report, additional economic analysis of export croppricing and taxation issues will be carried out by the Bank. The resultsof this work will be incorporated in follow-up discussions with theGovernment on its action plan for export crop development.

-4-
II. EXPORT MABRXETS: STATUS AND TRENDS
A. Structure of External Trade
2.01 As a large island situated in the Indian Ocean and adjacent tomainland Africa, Madagascar Is uniquely positioned for internationaltrade. Nevertheless the country's trading structure shows many featurescommon to other developing nations in the tropics. Exports consist mainlyof primary commodities. Imports consist mainly of capital goods, rawmaterials and energy supplies. Although independence in 1960 inspiredhopes for broader and more rapid economic growth, Madagascar, like otherdeveloping countries, has been profoundly affected both by the changingeconomic climate in world markets and by internal shifts in nationaldevelopment policy. In general progress has been slow. In recent yearseconomic difficulties have prompted significant changes in the import tradestructure, marked by rapid increases in rice and fuel imports.Simultaneously lack of progress in the never industry and energy sectorshas led to even greater dependence on primary agricultural commodities asthe foundation of export trade. (Tables 1 and 2).
Export Trends
_.02 Export revenues show a continuous upward tread. Sinceindependence, the value of total exports measured at current prices hasmultiplied sixfold, from FMG 18.4 billion in 1960 to FMG 109.0 billion in1982. With the excreptiou of 1977, when export revenue jumped by 25% overthe previous year (largely in response to the sudden boom in world marketprices for coffee), earnings from exports show a pattern of relativelysteady growth over more than two decades. Throughout the 1960s the volumeof exports grew even faster than export income, rising from 235,000 tons in1960 to 782,000 tons in 1970, an increase of 333%. (Export value, bycomparison, rose by only 218% over the same period.) In the 1970s,however, this promising trend was reversed. While in current termsearuings more than doubled from FMG 40.2 billion in 1970 to FMG 84.7billion in 1980 and in real terms export income continued to show modestgrowth, the actual volume of goods exported declined sharply. From thepeak of 782,000 tons in 1970 export volume dropped by 10% in 1971,recovered slightly In 1972-74, then declined steadily for the remainder ofthe decade. By 1980 export volume was only 372,000 tons, the lowest levelof achievement in 15 years (Table 3). While these officially reportedtrade figures are at best approximate and are subject to manyinconsistencies (deriving from the use of multiple sources, occasional datagaps, weaknesses in collection methods and - more recently - diffusion ofresponsibility for data collection), the general decline in exportperformance since 1970 is indisputable.
2.03 The export pattern for agricultural products generally reflectsthat of Madagascar's total export trade, demonstrating both the importanceof agricultural commodities in the export portfolio and also the almostuniversally poor performance across all sectors of the economy since theearly 1970s. In 1973, excluding agro-industrial products, agriculture's

-5-
share of exports amounted to 77% in value and 23Z in volume terms; in 1981the comparable proportion of primary agricultural commodity exports tototal exports amounted to 82% in value, 25% in volume. The addition ofagro-industrial exports (processed foods and other processed products,textiles, shoes, wood and paper products) shows that agriculture's totalshare amounted to 90% of the FMG 109.0 billion in export revenues earned byMadagascar in 1982. Stagnation in other sectors has meant that over the 10years from 1973 to 1982, despite declining output, the agriculture sectoras a whole has enjoyed a rising share of total export earnings. Of thisshare, the primary commodities have consistently accounted for at leasttwo-thirds in terms of both the value and the volume of agriculturaltrade. In the present period of crisis, the national economy is thereforeespecially dependent on export crops for earning foreign exchange.
Agricultural Commodity Trends
2.04 With its large land area (about 592,000 Im2), varied climate,topography and soils, and a total population of about 10 million,Madagascar has a diversified agricultural economy to support exportdevelopment. At present this potential is poorly exploited. Rice, thedominant crop and staple food of almost all Malagasy, was formerly also anexport crop. As recently as 1970 rice exports amounted to 66,000 tons.Stagnating production over the subsequent decade, however, has transformedMadagascar's trading status in rice to that of a major importer. In 1982imports of rice reached a peak of 352,000 tons while exports, a mere 170tons, virtually ceased. Bananas, likewise once included among the range ofexport crops (an average of 7,000 tons were exported annually between 1971and 1974), have also almost disappeared from the export balance sheet.Only 423 tons were exported in 1982, although production (281,000 tons in1982) remains close to the levels achieved a decade previously. Certainexport commodities, including sugar and cassava, show a pattern ofsustained or expanded production growth which contrasts with a sharpdecline in the actual export performance of these crops in world marketsover the past decade. Other formerly importaut export items, includinglivestock products, butter beans, sisal, raffia, and oilseed cake,demonstrate a steady decline in the volume of both exports and production.
2.05 While the agriculture sector as a whole has failed during thel97Us to keep pace wi:h domestic market demand and volatile conditions inglobal markets, several key export crops have proved more resilient.Coffee, the leading export revenue earner since the pre-independence era,is still the most important export crop. Although over the past decadecoffee export volume has declined by almost one-fifth from an annualaverage of 65,000 tons in the early 1970s to 53,000 tons in 1982, foreignexchange earnings from coffee, expressed in current prices, have more thandoubled over the same period. Exports of cloves have increasedsubstantially over the past decade and in the 1981-82 period werecontributing 27% of agricultural export earnings. Madagascar remains theleading world producer of vanilla, another high value crop, from whichexport earnings at current prices have multiplied ninefold since 1973.Other traditional crop exports such as pepper (black and green) retain some

-6-
importance in the export accounts. Production and exports of cocoa, apotentially high value but relatively new crop in Madagascar, have shownslight growth in the 1978-82 period over the previous five years. Effortsto halt the prolonged decline in the volume of agricultural exports and tosustain foreign exchange earnings in the short term will depend veryconsiderably on the performance of this key group of commodities. (Tables4, 5, and 6).
2.06 The position of each of these key commodities is being eroded inworld markets by factors only partially under Madagascar's control. Globalconsumption of coffee has shown little growth in recent years andinternational prices remain low. I: this tight and highly competitivemarket, for various reasons Madagascar is poorly placed to strengthen itsalready small (1.5:) world marKet share. As a member of the OAMCAF groupof Francophone African partners within the International Coffee Agreement(ICA), Madagascar has little influence on global decision-making.Competition in the (mainly Eastern European) markets not covered by the ICAis intense. Furthermore as an exporter of the robusta (canephora) varietyof coffee, and of only average quality, Madagascar's access to the premiummarkets for arabica and high-quality robusta coffees is extremely limited.The market for Madagascar's cloves is also fragile, being highly dependenton Indonesia's capacity to replace clove imports by local production forthe clove cigarette industry. Even Madagascar's near-monopoly domination(with an approximately 80% share) of world markets for natural vanilla isbeing progressively undermined by successful competition from the cheapsynthetic, vanillin, and other substitutes. These market situations, andpossible strategies to deal with them, are examined in detail later in thisreport. It suffices here to stress the extreme vulnerability ofMadagascar's entire export crops sub-sector in the light of recent worldmarket trends.
Trading Partners
2.07 In value terms, 96% of Madagascar's export trade is shared amongabout 30 importing countries. In 1979, the last year for which detaileddata are available almost half of export revenues derived from sales toWestern Europe: EEC member countries accounted for 42.2%. Trade withFrance, the former colonial power, accounted for more than half the EECshare and about a quarter of all exports. Western Germany is the secondmost important trading partner in the EEC. Exports to North America (14.8%of total in 1979) were almost exclusively to the USA, a major consumer ofboth coffee and vanilla from Madagascar. Asian countries took 20.2% ofexports in 1979, dominated by Indonesian imports of cloves and, to a lesserextent, Japanese imports of fish products and minerals. Trade with Africancountries (b.2Z, mainly Algeria), Eastern Europe (5.4%) and neighbouringcountries of the Indian Ocean (4.1%) accounted for almost all residualexports in 1979. Over the past ten years, Madagascar has managed todiversify its market outlets for export crops (especially coffee) byentering new markets in Western and Eastern European countries, NorthAfrica and elsewhere. however, these openings resulted mainly fromshort-term opportunities and have not provided stability. In the absence

-7-
of renewed and sustained vigor in export market development, the EEC, theUSA and (for cloves) Indonesia will continue to be the main outlets forMadagascar's agricultural export trade. Subsequent sections of thischapter explore trends in each of the world commodity markets affecting thegrowth of this trade.
B. The Market for Coffee
World Trade
2.08 The coffee plant, originally native to Africa, is now cultivatedin about 60 tropical countries around the world. Most of these producingcountries export virtually all of the coffee they grow. World productionfor the 1983/84 season is expected to be around 5.5 million tons (92million bags), of which approximately three-quarters will enter worldtrade.1/ In terms of export revenues for developing coutries, coffee isthe most important non-fuel commodity.
2.09 World Supply. Since 1950 the world coffee market has beencharacterized by slow growth and periodic adjustment to sharp fluctuationSin production and prices. On the supply side, market trends have beenmainly affected by events in Brazil, the largest producer country, whichpresently accounts for about one-third of world exports. Erratic swings inBrazilian coffee production, caused mainly by sudden frosts (severe in1975, less so in 1981), have intermittently destabilised prices andstrongly influenced movements in world trade. Shortfalls in Brazilianoutput have uevertheless been fully made up by other producers in LatinAmerica, Africa and Asia, and over a 30-year period the increase in globalproduction has averaged 2.1Z per annum (Figure 1).
2.10 World Demand. Growth of consumption has uot kept pace withoutput over the past two decades. Whereas total world net importsincreased by an average 2.0% in the period from 1961 to 1970, consumptiongrowth declined in the 1970-79 period to a mere 0.6Z per annum (Table 7).Although world import demand grew fairly steadily until 1976, rapid priceincreases that year in the wake of the Brazilian frost accentuated otherfactors depressing market growth in the main consuming regions. Theindustrialized countries of Western Europe, the U.S.A. and Japan, whichtogether account for about 90% of global coffee imports, experienced slowerincome growth. Competition from other beverages (especially soft drinksand fruit juices), conceru over health side-effects from coffee drinking,and technological developments increasing liquid coffee yields fromprocessed coffee beans have contributed to a fall-off in world demand.Although consumption trends vary markedly among the major consumingcountries, with above average growth in some countries of Western Europe,Japan aud certain newer markets in Eastern Europe, North Africa and the
1/ See World Bank "Prospects of World Coffee Economy and theirImplications on Producing Countries,' Revised Draft, 10/24/1983.

8-
Middle East, consumption in the United States, the single most importantcoffee-drinking country, shows a long-term decline in imports of 1.9% perannum. Global demand overall is currently rising by only about 1% perannum, and coffee stocks in producer countries, estimated at 50 million60-kg bags (3 million tons) in January 1984 were already at a post-1975record level and still rising at a rate of between 4 and 6 million bags perannum (Figure 2).
Prices
2.11 In most countries demand for coffee is highly inelastic withrespect to incomes and pr'ces. In the USA and EEC, which together accountfor about two-thirds of imports, the market response to the tripling ofprices which occurred in 1976-77 as a result of the Brazilian crop crisiswas a 12-15% drop in consumption levels. Price movements over the pastdecade therefore closely reflect the changing equilibrium between supplyand demand. The trends in prices are shown in Table 8 and Figures 2 and3. Low prices in the early 197 0s reflected the vastly increased plantingswhich took place during the 1960s and more moderate consumption growth.The unprecedented price boom of 1976-77 dramatically increased the coffeeearnings of Brazil's smaller competitors, but led quickly to a situation ofrenewed global over-production and steadily declining prices and a wave ofeconomic problems in producer countries. By 1981 prices had dropped byabout 55Z against 1977 levels, and in constant terms had again reverted tothe low levels of 1973-75. The generally depressed prices over the pastseveral years oblige producers to exploit more deliberately the specialized-arkets for particular coffee types and qualities.
Types and Qualities of Coffee
2.12 Although there are over a hundred known coffee plant varieties,world trade is conducted on the basis of two types: arabica and robusta.The arabicas thrive at higher altitudes and are most widely grown in LatinAmerica and East African highlands. Robustas, which are normally grown inlowland plantations and on hill slopes below 800 metres, are exportedmainly from Brazil, African and Asian countries. Arabica coffees areconsidered to have a milder flavor, higher acidity and lower caffeinecontent than robustas. Arabicas are generally regarded as superior forregular (ground roasted) coffee, and command a premium price about 5-15%above robusta prices on the world market. Nevertheless, robustas havetraditionally been favored in some major markets (e.g. France, Italy), andhave the advantage that they produce a higher yield of soluble coffee perpound of beans. Consumption of soluble C"instant) coffees has expandedsteadily since the early 1950s to a point where this form now dominatesconsumer sales in the U.K. and Japan and accounts for almost a quarter ofthe coffee sold in the U.S.A. Although arabicas and robustas areinterchangeable and most coffees reaching consumers are blends of severalvarieties of different origins, relative demand for robusta has increasedwhile robusta's share of world production has remained basically unchangedfor the past 20 years. The price discount of robusta against arabica hastherefore tended to decline over time (Figure 4).

-9-
2.13 Price differentials exist not ouly between arabica and robustabut among various coffees from different origins (Table 9). Coffee tradedon world markets through the New York and London commodity exchanges isalso subject to different premiums and discounts applicable to spotpurchases and deliveries against future coutracts. Differences in prices,however, are an inadequate gauge of product quality as perceived by coffeeimport -rs, roasters, blenders and ultimate consumers. Exportable 'green"coffee (i.e. hulled coffee beans), graded in accordance with internationalstandards, may further vary in color, taste and flavor characteristics andother properties important to the buyer. These variables are complex andcan occur not only between coffees of different types and country originsbut between different production areas within countries and withindifferent consignments (even within the same grade) for export. Trends inthe quality of coffee traded in the world market are therefore extremelydifficult to measure. Recent studies nevertheless suggest that worldquality standards, at least as perceived by major importers, are droppingcontinuously for all coffees in general. A Bank-financed study carried outin 1983 suggests that 'top quality' coffees are produced mainly by Kenya,Central America, Ethiopia, Tanzania, Papua New Guinea and Zimbabwe.2 /Annual availability of such top quality coffee is estimated at between100,000 and 150,000 tons or about 2Z of current world production.
Harket Regulation
2.14 For the past twenty years, regulation of the world coffee markethas been carried out under the International Coffee Agreement (ICA), towhich Nrdagascar is a signatory. Since tbe first agreement was signed in1962 by a large group of consuming and producing countries, the ICA hasbeen iatermittently successful in sustaiuing prices for producer countriesand regulating trade flows. It main instrument has been an export quotasystem. At the height of turbulence in the world coffee market in themid-1970s, quotas were in abeyance (1973-76) due to a breakdown inagreements between producer and consumer countries on price and quotalevels. In 1976 the ICA was renewed, with specific provisions to basemember country quotas not only on the basis of past export performance, ashitherto, but also on the basis of the stocks held by each producercountry. However, quota provisions under the ICA 1976 came into force onlyin October 1980 in response to the sharp fall in prices over the 1978-8Wperiod, ending a seven-year period of intense free market competition inthe world coffee trade. Since then the global market has again stabilised,and a new agreement, ICA 1983, which came into force in October 1983 isscheduled to last until September l189. The provisions of this agreementgovern curreat short-term and medium-term prospects for Madagascar's coffeetrade.
2/ "World Availability of Top Quality Arabica Coffee." Report to theWorld Bank (RMEA) by H.J. von Rilten, Coffee Consultant. August 1983.

- 10 -
2.15 Quota and Price Controls. Producer member countries of the ICAaccount for over 99% of world net exports; importing country membersaccount for about 88% of world net imports. The main non-member importingcountries include most Eastern European countries, the USSR, and somecountries in North Africa and the Middle East. Quotas are assigned to ICAproducer member countries only for their exports to ICA importing members,and no limits are placed on their sales to the non-quota countries whoabsorb 12% of global coffee exports. For ICA member countries, the Councilof the International Coffee Organization (ICO), its administrativeauthority, sets a global annual quota for each coffee year (October toSeptember), taking into account annual world consumption and estimatedchanges in inventory level among importing members. The mechanism by whichannual country quotas are set is complex but offers some scope fornegotiation by individual producer country members in the light of theirexport performance and production and stock levels. Initial global quotasare adjustable during the coffee year, increases or decreases in quotasbeing triggered at pre-determined price levels in response to market andprice fluctuations. From 1980 to 1983, however, initial and final annualquotas have stagnated around 56 million bags (equivalent to 3,360,000tons), which represents only about 77% of exportable production, or 59% oftotal world production at estimated current (1983/84) levels (Tables10,11). While this quota mechanism aud the relatively low levels set bythe ICO in recent years have effectively stabilized prices since 1980, thestagnant market has kept prices at generally depressed levels until the1983/84 season. The initial quota of 56.2 milliou bags agreed by ICAmembers in October 1983 for 1983/84 was increased by 1 million bags inDecember and subsequently by three further increments of I million bagsbetween February and June 1984, the first indicators of an upturn in marketand revenue prospects for producer countries for over four years.
Madagascar 's Export Performance
2.16 Notwithstanding the above-mentioned multiple constraints imposedby conditions and movements in the world coffee market, Madagascar'scompetitive performance in this market has been weak. Historical data showthat following the introduction of coffee cultivation during the nineteenthcentury, by 1930 Madagascar was the leading coffee producer in francophoneAfrica with an 83% share of exports to France from its African colonies.By 1956, annual global exports had reached over 50,000 tons. A new peak inproduction was reached in the 1970/71 season with an estimated output ofover 90,000 tons. Exports subsequently reached an all-time high of 72,960tons in 1976, since when they have only twice (in 1979 and 1980) exceeded60,000 tons. Since 1980 annual exports have retreated to the averagelevels, around 55,000 tons, which prevailed over a decade previously.(Table 12). Growth of the country's coffee exports has not kept pace withthe slow upward trend in the world market, of which Madagascar's currentshare is about 1.5%. Among francophone African exporting countries,Madagascar's once dominant position has been progressively eroded overtime. Whereas the OAMCAF group as a whole accounts for 12.3% of ICO'sglobal quota, Madagascar's present share of the OAMCAF quota is only11.0%. Since the early 1970s her export performance has been faroutstripped by Ivory Coast and, more recently, by Cameroon both in ICAquota markets and more recently in non-quota markets (Table 13).

- 11 -
2.17 Causes of Declining Market Share. Aspects of Madagascar'sperformance in the coffee sub-sector have been the subject of severalrecent studies and a National Coffee Symposium sponsored by Governmentagencies (OCPGC/BTM) at Toamasina in May 1983. A study of export prospectsundertaken in 1981 by the International Trade Center (ITC)3/ briefly citednumerous difficulties: (a) inadequate production (due to ageingplantations, dispersed and poorly maintalned smallholdings, shortage ofland, insufficient supplies of fertilizer, declining product quality, lowproducer prices, and competition with other crops), (b) inadequatetransportation (lack of feeder roads, deteriorating road surfaces, decayingharbour facilities, infrequent shipping services), and tc) various problemsin pricing and marketing (fluctuating world market prices, disincentiveeffects of internal pricing controls, and related factors). however, noattempt was made in this ITC study to analyse these factors and theirrelationship to export market performance, or to review more fundamentalissues of national policy and objectives, organization and structure of thecoffee trade, and priorities for sub-sector development. A simultaueousstudy carried out by an UNCTAD consultant4 / focussed primarily onmicroeconomic trends and prospects for coffee and other key commodities inMadagascar's export trade. Other studies have reviewed organizational andfinancial aspects of coffee marketing.5 / At the National Coffee Symposiumheld in May 1983, participants sought to trace the causes of deterioratingcoffee production and trading performance, identified various weaknesses incurrent marketing and pricing policies, and proposed a number of measuresto improve short-term and long-term production and exports.6/ Theseproposals are considered later in this report. It nevertheress appearsthat there has been no systematic effort to diagnose Maui.gascar'scompetitive position in the world coffee market from the standpoint ofcomparative advantage or to assess the root causes of declining exportvolumes in recent years.
31 "Etude du potentiel a l'exportation de la Republique Democratique deMadagascar et de la situation de l'offre des entreprises industrielleset commerciales exportatrices." Rapport de mission du M. Jean Muller,9 July - 22 October 191l. International Trade Centre, UNCTAD/GATT,June 1982.
4/ "Madagascar: Microeconomic Analysis of Commodity Production and Trade."Walter C. Labys, Consultant, UNCTAD - Geneva. September 1981.
5/ See "Development des Exportations Malgaches: Diagnostic des Caisses deStabilisation," Export Assistance International, Paris. March 1980;and 'Caisses et Bureau de Commercialisation et de Stabilisation desPrix du Cafe, de la Vanille et du Girofle (CA.VA.GI): Revue des comptesdes exercices 1978-1979 et 1979-1980 et du Dispositif de ControleInterne," RINDRA. May 1982.
61 Rapport du Colloque sur le Cafe:, 16-20 May 1983, Toamasina. OCP/BTM.

- 12 -
World Market Prospects
2.18 Recent Bank studies have assessed the prospects for coffee marketgrowth and expected price trends into the 1990s.7/ World import demand isprojected to grow at a very slow pace, about 1.0 - 1.5X per annum, up to1990. The adoption of the new ICA in 1983 and the willingness of producercountries in recent years to maintaln tight quotas to preserve pricessuggest that a period of relatively stable conditions accompanied by slowincreases in quotas may be expected for the remainder of the 1980s.Non-quota markets offer additional scope for producer countries, butintense competition as a result of excess world production and high stocklevels is likely to stimulate further downward pressure on prices in thesemarkets. While lower prices could encourage some importing countries tofollow the recent withdrawals of Hong Kong, Hungary and Israel from the ICAprior to the new 1983 agreement, this is not to be expected. Per capitaconsumption levels are thought to be already relatively high in some of theEastern European markets, and newer consumer countries in the Middle Eastand Africa are unlikely to expand rapidly given the still depressedeconomic conditions affecting these regions. Strong action is promisedunder the new ICA to clamp down on the hitherto profitable so-called-'tourist' coffee trade from non-quota into quota importing countries. Thiswould further curtail growth of market opportunities in the non-quotacountries.
2.19 The increases in ICA quotas since December 1983 and currentlyimproving prices are likely to strengthen the confidence of producercountries in the ICO and its quota system as the safest mechanism forcontinued expansion. However, given that their present stocks amountglobally to one year's world market supply and that Brazil has takenelaborate measures (by transferring production into more northerlyfrost-free areas) to combat previous disruptions of output, the scope forexpanding exports is extremely limited. The Bank's econometric projectionssupport the conclusion that for the remaining 1980s producing countrieswill need to adjust their production growth to the combined growth rate ofdomestic consumption and world export demand. For countries with smalldomestic markets this implies production increases of only about 1.32 perannum up to 1990. In the absence of unpredictable occurrences, such associo-political turmoil in a major producer country, stock accumulations ateven this modest rate of production growth are likely to postpone anysignificant increases in coffee prices until at least the early 1990s.
Implications for Madagascar
2.20 The above scenario implies that for Madagascar, as for othercoffee producing countries in Africa, world market prospects shoulddiscourage reliance on rising coffee prices as a source of Increasedforeign exchange earnings to fuel economic growth. UnLess economic

- 13 -
recovery in the industrialized countries stimulates abnormal growth ofdemand in major expanding coffee markets such as Japan, quotas and priceswill grow only very slowly. Competition from other beverages, greatercoucentration within the international coffee roasting and blendingindustry and narrowing profit margius are likely to further encouragetechnological innovations and stret.gthen existing trends to improve coffeeextraction rates and reduce coffee bean demand. (The recent introductionof -extended-yield- coffee, which uses about 20Z less coffee to produce anormal brew, is already making inroads on markets in the U.S.A_ and WestGermany; its effect is to decrease coffee bean demand even when demand forliquid coffee is stable.)
2.21 In the foreseen global market situation of slow consumptiongrowth, high stock levels and intense international competitioa betweenproducer countries, Madagascar cannot afford to permit any further declinein its steadily weakening position. Current prospects would suggest athree-pronged strategy: (a) for the short term (1984/85), to improveproduction, marketing and trading efficiency, (b) for the medium-term1986-1990), to revitalize the coffee sub-sector with a view to increasing
Madagascar 's share of world markets in the 1990s; and (c) to acceleratedevelopment planning for long-term crop and market diversification. Thedesirability and feasibility of achieving these goals are explored in moredetail in later chapters of this report.
C. The Market for Cloves
World Trade
2.22 The clove tree provides three products entering world trade.Dried clove buds, marketed wtole or iL ground form, are by far the mostimportant of these. They have two distinct markets. One use is as aspice, widely consumed by households and the food industries inindustrialized countries, for baked products, desserts and (by industry) inspice blends for seasonings, sauces and pickles. Their second, highlyspecialized, use is for blending with tobacco in the manufacture of'kretek' cigarettes in Indonesia, in which proportions of clove contentvary between 25-40%, according to brand. Approximately 40,000 tons ofcloves are absorbed internationally in these markets, of which about halfenters world trade. In normal years the Indonesian cigarette marketaccounts for up to 80% of this trade. Other cLove products are clove budoil, distilled from the buds, stalks and leaves of the tree for sale to theperfumery, pharmaceutical and flavoring industries, and clove oleoresin,which is used in extract form by the food processing industry as areplacement for the whole or ground spice. Madagascar has alternated withTanzania as the world's leading exporter of dried cloves and is the leadingexporter of clove bud oil.
2.23 World Supply. The clove trade is highly irregular from year toyear. Oa the production side, harvests are cyclical, with peaks in yieldreached every 3-4 years. In all three major producing countries -Indonesia, Tanzania (on the islands of Zanzibar and Pembal and Madagascar -
crop productiou patterns are also vulnerable to cyclones and plant

- 14 -
diseases. Annual output in Indonesia, the world's largest producer, rangesfrom 25,000 tons in an average season to 45,000 tons in a good year.ALthough production hectarage more than doubled between 1976 and 1981 in adrive towards staf-sufficiency in supplies for Indonesia's expanding clovecigarette industry, domestic output still meets only two-thirds ofrequirements. Imports from Tanzania and Madagascar have normally made upthis deficit. In Tanania, however, clove production has experienced asteady declifne over the past decade. Madagascar's production hasfluctuated sharply over the same period (between 4,200 tons in the low yearof 1979 and 17,800 tons in the bumper year of 1974). (Table 14). Theextremely uneven production patterns within the three largest clove tradingcountries have opened up market opportunities for the smaller producers,including Sri Lanka and Comoros, and for the start-up of new productionschemes in Brazil, India and Malaysia.
2.24 World Demand. Indonesia's kretek cigarette industry has been themain factor behind a slow but steady increase in world demand for clovesover the past decade. From an annual output of 22 billion kretekcigarettes in 1972, production had risen to over 40 billion by 1977 andapproximately 50 billion by the early 1980s. Despite a marked growth inIndonesia's production of cloves over this period, domestic output has notkept pace with demand. As a consequence, average annual imports have risenfrom around 10,000 tons in the early 1970s to about 15,000 tons in1980-1982 (Table 15). Global consumption of cloves as a culinary spice hasbeen stable over this period, with signs of a low level of growth inimports from around 4,000 tons in the early 1970s to around 4,600 tons inthe period 1976-1980 (Table 16). Among these markets, the U.S.A. has onaverage absorbed about 25% of exports and appears to have stabilizedcurrent imports around 1,000 tons per annum. Consumption in EEC countries,the second most important market grouping, has been increasing at around4.5Z per annum since the mid-1970s to a current annual level of around1,5U0 tons. Demand in other markets, including Japan, Scandinavia, EasternEurope, Saudi Arabia and Singapore, shows continued slow growth. Theentrepot trade in cloves through Singapore to Indonesia and other countriesnevertheless remains clauded by the uncertainties affecting Indonesianproduction. Demand for clove bud oil and oleoresins in industrializedcountries, the main markets, has been relatively stable.
Prices
2.25 Cloves are a high-value spice. In 1982 world market pricesreached an average of US$5.30 per lb, an all-time high. Despite theyear-to-year fluctuation in supplies within the major producing countries,clove prices remained relatively stable in the early 1970s. Later in thedecade, and particularly since 1980, there has been a strong upward trendin prices, although prices slipped to an average of US$4.70/lb in 1983.High prices reflect both the continued inadequacy of Indonesian supplies tofeed the domestic market and a slowly strengthening demand for cloveselsewhere. Prices show considerable competition between the exportingcountries, reflected in annual price movements. Until the late 1970sprices from Madagascar tended to be around 10% lower than prices fromTanzania and 5-1OZ lower than those from Sri Lanka. However, Brazilianprices in the U.S. market are presently 5% lower below those of Madagascar(Table 17).

- 15 -
Quality Factors
2.26 Demand for cloves, both for kretek cigarettes in Indonesia and asa spice ingredient for food preparations elsewhere, is sensitive to avariety of factors associated with product quality. Indonesia's clovesupply problem is partly affected by the high oil content of locallyproduced cloves, which are both less suitable for cigarette manufacture andless pungent than the Zanzibar and Malagasy varieties. The major qualitycriteria in the food industry are flavor and oil content, appearance, andfreedom from humidity and foreign matter. In these respects, cloves fromSri Lanka, Indonesia and Brazil appear to have acquired a competitive edgein major markets over the less selective suppliers, Madagascar andTanzania. Strict standards in the food industry, particularly thoseexerted by the Food and Drug Administration in the U.S.A., place a premiumon quality grading and dependability. Quality variables also have someinfluence on prices.
Market Regulation
2.27 The clove trade is virtually free from international regulation.Historically, standards and prices were mainly determined by traders inSingapore. During the 1970s Indonesia introduced regulations restrictingimport purchases to those coutracted directly with Tanzanian and Malagasysuppliers under letters of credit. These regulations, still in force, havesharply reduced but not eliminated the entrepot trade. On the exportsupply side, a Tanzanian/Malagasy Clove Marketing Organization (TAMCO) wasestablished in April 1977 toz increase sales, strengthen prices and improvethe quality of cloves. Through a marketing branch of TAMCO known asUni-Cloves, import orders were to be allocated between Tanzanian andMalagasy exporters. However, this organization never functionedeffectively and has been allowed to lapse.
Madagascar's Export Performance
2.28 Cloves have accounted for a rising share of Madagascar's exporttrade over the past decade. The volume of exports has grown from an annualaverage of 8,300 tons in the 1973-77 period to an average of 10,700 tons in1978-82 (see Table 5). This progress appears to have been roughly in linewith import demand growth in Indonesia and other markets. Over the decadethe value of clove exports has risen significantly faster than volume, froman average of FMg 7 billion at current prices in 1973-77 to FMg 17.5billion in 1978-82 (see Table 6). This impressive growth reflectsiacreases in both export volume and particularly prices. During the same10-year period Madagascar has also increased its world market share at theexpense of Tanzaiia. While Madagascar's export volume increased annuallyby an average of about 6% per arnum between 1973-77 and 1978-82, Tanzanianexports in 1980 (5,300 tons) had slumped to less than half the volumeachieved in 1973 (10,800 tons). By 1980 Madagascar had become theprincipal supplier of cloves to virtually all the major importingcountries. By these criteria the country's clove export performance over

i -~ ~ ~~~~~~~~~~~i
- 16 -
the past decade has been a notable success. In 1982, however, exportvolume and foreign exchange earnings from cloves dropped precipitously to1,972 tons and FMg 7 billion, representing respective declines of 81% and75Z over 1982 figures. These disappointing results stemed mainly fromfailure to negotiate a new trade contract with Indonesia, and expose thebasic vulnerability of Madagascar's clove export trade.
2.29 Underlying Trends. Various reviews by Government services andITC and UNCTAD consultants have charted the trend of Madagascar's cloveexports but offer little explasatory analysis. Among external factors,steadily rising demand and a continuing shortfall of domestic supplies ofcloves in Indonesia have driven up prices and provided the main spur toMadagascar's overall growth in export volume and earnings. The decline inTanzania's production and export capability has undoubtedly also worked toMadagascar's advantage. Internal policies have also influenced exportgrowth. Exceptionally high exports (22,300 tons) iz 1975 following a poorharvest in Indonesia in 1974 prompted the Malagasy Government to launch a5-year production expansion program from 1975 to 1980. Although this fellfar short of planting targets, comparatively favorable producer pricesstimulated sufficient production growth to sustain Madagascar's emergingposition as the primary source of large volume supplies available toIndonesia in poor harvest years (e.g. in 1982). This progress has not beenachieved without cost. The high world market prices prevailing over thepast few years have restrained consumption growth in other importingcountries and encouraged price competition from newer producers. Since1977 the emergence of Brazil and Malaysia as new clove exporters hasalready affected the level of Madagascar's exports to the U.S.A. andJapan. Recent ITC studies suggest that clove prices quoted by Madag2scarare now too high, that product quality has deteriorated, that deliveriesare unreliable, and that trading practices are unsatisfactory. These andother internal factors affecting the country's competitive position arereviewed in more detail later in this report. The latest market indicatorssuggest that Madagascar's clove export trade has now reached a crossroad.
World Market Prospects
2.30 The import demand outlook for cloves is closely linked to theproduction prospects in Indonesia and this country's future tradingpolicy. Good harvests in 1980, 1981 and 1983 have eased the growth ofimports, but the goal of self-sufficiency (which in the mid-1970s wasexpected by 1983) has not yet been secured. The most likely rospect isfor continued fluctuatious in Indonesia's import needs from year to year,and an overall slackening of demand for the remainder of the 1980s as theplanting program undertaken in the 1970s bears full results. Qualitativedifferences between local and imported clove varieties should help tosustain import demand at a moderate level. Elsewhere, long-term prospectsfor steady growth in the global spice market are firm, and the use ofcloves in the food industries and among household consumers in theindustrialized countries is likely to continue slow expansion. Importgrowth averaging 5% per annum is expected, in line with recent trends.This suggests that market absorbtion in this sector could rise to around7,000-8,000 tons per annum by 1990. Concurrent growth in the industrialmarket for clove oil and oleoresins would absorb an additional 2,000-3,000tons of cloves by 1990.

- 17 -
2.31 The prospect is therefore that import demand, excludingIndonesia, could reach around 10,000 tons per annum by 1990. Cyclicalfactors in production, weather and plant disease hazards and annualfluctuations in demand will probably lead to continued volatility in globaltrading patterns. Prices generally seem likely to slacken from their1981-1983 peaks as Indonesian imports stabilize. However, the greatestrisk to export earnings for developing country producers is the emergingsituation of global over-supply. Quantities of exportable cloves fromtraditional producers and, since 1977, from Brazil now seem likely toexceed demand growth in the 1980s, thus putting further downward pressureon prices. In this increasingly competitive situation, marketingefficiency and innovation, competitive pricing, and guaranteed productquality will become progressively more critical for developing countryexporters.
Implications for Madagascar
2.32 The immediate prospect for Madagascar is a rapid change from thegenerally favorable conditions for clove exports which prevailed over thedecade from 1973 to 1982. Furthermore, the failure in 1983 to negotiate asales contract with Indonesia left the country with an already high levelof current stocks (estimated at around 11,000 tons in October 1983) priorto the 1983 harvest at a time when prices appear to be turning down.Although the latest harvest coincides with the cyclical low in productionand is estimated at under 7,000 tons, Madagascar's clove stockpile is nowat an unprecedented level. (Provisional estimates placed total stocks ataround 14,000 tons in March 1984.) Over the 1984-85 period, a decline inboth export volume and value from the 1981-82 levels is in prospect. Forthe remainder of the 1980s, market and price prospects seem equallyunpromising, in view of the emerging global surplus. Markets for clove budoil and oleoresins can absorb only a fraction of these supplies. Thissituation calls for a comprehensive review of clove production policy andtrading strategy as a matter of urgency. In the light of current andprospective world market conditions, two needs appear paramount: (a) forthe short-term (1984/85), to adopt a flexible marketing and pricing policyand aggressively pursue opportunities to expand sales outside theIndonesian market, and (b) for the medium-term (1986-90) to reorganizeclove production and trading activities within the Framework inter-sectoralplan to develop Madagascar's spice trade. Proposals in these directionsare explored more fully later in this report, taking account of otherfactors incluencing production, marketing, pricing and organization forexport.
D. The Market for Vanilla
World Trade
2.33 Vanilla is the perfumed fruit of a tropical climbing orchidnative to Mexico. In world trade it is classified as a spice. Naturalvanilla products are sold in four different forms: (i) as dried vanillabeans (the elongated pods of the orchid), (ii) as a ground powder, (iii) asan extract or essence, and (iv) dispersed on a sugar or dextrose base.

- 18 -
These products are used mainly by the dairy, ice cream, confectionery(especially chocolate), pastry and perfumery industrles in the U.S.A. andWestern Europe. For the past several decades natural vanilla has had tocompete in these markets with extremely cheap synthetics, particularlyvanillin, which is produced from the waste sulphite liquor of paper mills,coal tar extracts and clove oil. Natural vanilla probably accounts for atmost about 5% of the world market for vanilla flavoring. At their peak in1978, world exports of natural vanilla were around 2,800 tons. Bycomparison annual production of synthetics exceeded 40,000 tons in naturalvanilla equivalent during the 1970s. In average years the global trade invanilla beans varies around 1,500-2,000 tons. Although the volume of tradeis small, vanilla is second only to saffron as a high-value spice.
2.34 World Supply. The particular climatic and ecological conditionsrequired for vanilla have tended to limit its production to a relativelysmall group of countries. The preferred, highly flavored and scentedBourbon variety grown in the Indian Ocean countries accounts for about 907of world trade. Among these, Madagascar has traditionally been the largestexporter. In an average year Madagascar alone accounts for about 75% ofglobal exports. Comoros and Indonesia each have a market share of around10%. Reunion, French Polynesia and Mexico export small quantities.Madagascar's dominant position among the exporters dates from thenineteenth century, hence production conditions and policies in thiscountry have long been the major determinants of world export and pricetrends. Until the late l96Os output levels in Madagascar and elsewheremore than kept pace with the slight annual increases in global demand.This situation acted as a brake on prices and led to accumulation ofstocks. An agreement reached in 1963 between the Indian Ocean suppliers(Madagascar, Comoros and Reunion) and industry consumers in the USA and EEChas generally tended to stabilize trade movements. However, production inMadagascar has been erratic. Deliberate Government action to depletestocks, in 1968 and again in 197b, and severe crop damage from a hurricanein 1976 had changed the supply-demand ratio by the late 1970s (Table 18).In 1977 Madagascar's harvest of 'green" vanilla (4.6 kg - 1 kg of driedvanilla beans) fell to a 20-year low of 1,000 tons. Production hassteadily recovered again since 1980, but stocks are still below the levelsof the l9bOs. The shortage and unpredictability of natural vanillasupplies in recent years has kept prices high, restrained demand andfurther encouraged the swing towards the synthetics.
2.35 World Demand. The United States is by far the single largestmarket both for natural vanilla and competing synthetics. Vanilla beanimports into the USA normally absorb 40-60% of world trade, with Madagascarthe main supplier (Table 19). Virtually all imported vanilla istransformed into extract, primarily for the food and drink industries.After steadily increasing during the early 197 0's, U.S. vanilla importsreached a peak of 1,550 tons in 1977, but have since fallen to an annualaverage of 800 tons as a result of high prices and the attraction of thecheap synthetics. France is the second largest importer, absorbing onaverage about 400 tons per annum, or about 25Z of global export shipments.In both these markets use of natural vanilla by the food industries has

- 19 -
been sustained by labelling legislation enacted in the late 1960s. Marketpromotion, respectively, by the Vanilla Bean Association of America andUnivanille in France, has also helped to counter the use of synthetics.However, efforts by vauilla bean producer and consumer groups to promotesimilar legislation elsewhere, among EEC and other industrialized countryimporters such as Japan, have made no progress. Market promotion effortshave also stagnated in recent years because of unpredictable supplies. Ingeneral, over the past decade world market growth has averaged only about2% per annum.
Prices
2.36 During the prolonged period of general over-supply whichprevailed up to 1976-77, world market prices for natural vanilla fluctuatedin the vicinity of USS12-15 per kilo. Iu the later 197Us, mainLy underpressure from Madagascar and other producers in the Vanilla Alliance,prices rose sharply (Table 20). The official FOB price for Malagasyexports rose from US$19.80/kg in mid-1976 to US$38/kg in mid-1978 and toUS$45/kg in 1980. As a result of tight supplies, even spot prices of up toUS$lOO/kg were being quoted in some major consumer markets during 1979-80.Since this volatile period, prices have tended to stabilize but the overallupward trend has been maintained. (In March 1984 the annual meeting ofVanilla Alliance producers and consumers is reported to have raised theiragreed price for the 1984-85 trade year to US$70/kg, or 12% above the1983-84 level of US$62.5/kg.)
Quality Factors
2.37 Quality variables affect both demand and prices. The particularfragrance and flavor characteristics of vanilla from the Indian Oceanproducers have contributed to their domination of the world market. Mexicoalso produces good quality vanilla but for any years quantities availablefor export have been negligible. The -Java" vanilla beans from Indonesiaare generally priced about 1OZ below the 'Bourbon- variety fromMadagascar. International quality standards are well defined, but are notuniversally applied. Natural vanilla is generally marketed in fivequalities: extra, 1st, 2nd, 3rd and 4th. The classification is based onbean length (between 20 and 25 cm), aroma, color, consistency, and freedomfrom blemishes, insects and mildew. For the food and drink industries,humidity level (optimally less than 20%) and content of natural vanillin(normally 0.2 gr per 100 millilitres of extract) are major considerations.A recent ITC study of the U.S. market suggests, for example, that vanillabeans imported from Indonesia and having a humidity level of only 11.compare favorably with some recent imports from Madagascar which barelyconform to minimum standards. To raise the natural vanillin content of thedried beans to optimum levels, up to three years of controlled storage maybe necessary prior to export.

- 20 -
Market Regulation
2.38 The agreement concluded in 1963 between Indian Ocean producersand principal USA and EEC importers who make up the Vanilla Alliance hasremained in force. In practice this association governs the world vanillatrade. At annual meetings both sides agree to an export plan whichestablishes quotas, prices and delivery schedules for the followingcommercial year (April 1 to March 31). Madagascar participates through theVanilla Price Stabilization Fund and the private consortium of producers,processers and exporters which was established in 1966, known as theNational Vanilla Association (GNIV). The general level of tariffs onvanilla bean imports is low (zero for entry into the USA market), sotariffs have little influence on trading patterns.
Madagascar's Export Performance
2.39 As the world's largest producer-exporter of natural vanilla,Madagascar has reaped exceptional profits from the constant demand for thishigh-value spice, the country's--black gold-. During the 1960s and early1970s relative stability in the world markets and careful nurturing ofdomestic vanilla stocks provided regular and increasing export earnings(see Table 6). Since 1978 increasingly short supplies from both Madagascarand other exporters have further boosted prices and revenues. In 1983vanilla provided Madagascar with record earnings of FMG 25.8 billion, abouttriple the value of 1978. Contraband sales of vanilla caused somedisturbance in the export market for vanilla in late 1981. Furthermore theimpressive gain in revenue earnings has been achieved at high risk tolong-term market growth. The exceptionally high prices prevailing over thepast five years appear to have sharply curtailed demand and acceleratedmarket movements towards the synthetics. (An ITC study in 1983 suggeststhat synthetic vanilla flavorings are now available to the U.S. foodindustries at about one-hundredth of the cost of natural vanilla extractequivalent.) The accelerating growth of Madagascar's export revenues fromvanilla has also masked an overall decline in production and stocks since1976. This has had adverse side-effects on the quality of exported vanillaand on Madagascar's reliability as a source of supply. These trends havefurther encouraged food industry buyers to seek alternative sources (e.g.in Hexico). Disruptions in supplies have also led to a fall-off in marketpromotion by vanilla traders in importing countries. In short, althoughMaiagascar has managed to retain roughly a 75% share of the world vanillatrade over the past decade and has enjoyed a rapid growth in earnings, highprices and supply difficulties have seriously jeopardised further growthprospects.
2.40 Factors Affecting Recent Performance. Market regulation by theVanilla Alliance has worked generally to Madagascar's advantage.Legislation promoted by the Alliance's member associations has done much toprotect established markets in the U.S.A. and France against the inroads ofartificial vanilla substitutes among industry users. Joint promotionalefforts have contributed since the 1960s to a growing consumer awareness ofthe differences between natural vanilla and the synthetics and have helped

- 21 -
to sustain slow market growth. Within Madagascar GNIV appears to have beenan effective partner in these processes. The changed world marketsituation which developed in the late 1970s, from relative oversupply torelative undersupply of import needs, stems from both external and internalfactors affecting Madagascar. In response to the severe crop damage causedby the cyclone in 1976, US importers in particular sharply increasedimports from Madagascar to a record level (1,049 tons) in 1977 to build upstocks. By 1979 Madagascar's exports (437 tons) and domestic stocks hadreached record low levels. Although that year producer prices were raisedby an unprecedented 64%, other internal factors (including unfavorableweather, plant disease) restrained production until the 1981-82 seasons.In 1982 the supply-demand equilibrium improved, and unfavorable weatheraffecting Indonesia's crop helped to sustain the overall rise in prices.However, 1983 was again only a moderate year for Madagascar's harvest. Torestore stocks to a safer level, in April 1983 the Government raisedproducer prices for green vanilla to 1,000 FMG/kg, an increase of 43% abovethe 1982 level.
World Market Prospects
2.41 The prospects appear fair for a return in 1984-85 to normallevels of demand among vanilla importing countries. Subject to favorableclimatic conditions in the producer countries, especially in Madagascar,over the next two seasons there are also good prospects that the supplysituation will continue to improve. There could therefore be some taperingoff of the recent growth in world market prices in the short-term. Beyond1985 the prospects for market and price growth appear less certain. Thelong-term market outlook is favorable for most spices, with increasedconsumption expected in established markets among the industrializedcountries and some scope for developing new markets elsewhere. For vanillathe situation is problematical and highly sensitive to trends among foodindustries, especially in the U.S.A. Their consump:ion of natural vanillais declining. The U.S. Food and Drug Administration controls on thetransformation of vanilla beans into extract are precise, strict, regularand exacting. Prices of vanillin, the main artificial flavoringsubstitute, remain stable and continuously more attractive to industry. Itis also reported that the two largest vanilla importers among U.S.corporations are participating in a revival of vanilla production in Mexicofor future export supplies.
2.42 These developments imply continued contraction of the U.S. marketfor traditional exporters. The European market is also insecure. InFrance, the main EEC vanilla importer, the 1967 legislation to protectnatural vanilla against substitutes has not prevented domestic industrialproduction of vanillin. The large chocolate industries in the UK and WestGermany use vanillin almost exclusively, and there are slim prospects thatlegislation similar to that in France could achieve support among other EECcountries. In short, vanilla is not a growth market. Prices are probablyclose to their ceiling. Any long-term increase in exports will dependheavily on the market promotion initiatives of the producer countries.

- 22 -
t mplications for Madagascar
2.43 Although in the short-term Madagascar's leadership in the vanillaexport trade is not in question, the longer-term market and price prospectsoffer no grounds for complacency. On the contrary Madagascar'snear-monopoly situation is highly exposed. Some lowering of price growthexpectations should be tolerated in order to retain and strengthenestablished markets and prevent further long-term erosion by thesynthetics. The high market value of vanilla is a strong incentive toother developing country producers, particularly the smaller exporters suchas Comoros, to compete more actively for export earnings. It also places apremium on effective control of contraband. Both Indonesia and Mexico maybe expected to boost their future vanilla exports to the extent possible,given their comparative advantages of lower prices (Indonesia), quality andproximity to the U.S. market (Mexico). There are also reports of increasedoutput by new producers in Uganda and Brazil. 'As market leader, Madagascarwill need to act with prudence to avoid being outflanked. The situationcalls for a revised strategy to sustain the vanilla trade into the l9YOs.This will require attention not only to (a) production and control ofstocks, but also to (b) crop research, (c) quality control, (d) marketingorganization, (e) trade promotion, (f) product diversification, and (g)pricing policy.
E. Markets for Lesser Crops
2.44 Four crops - pepper, cocoa, sisal, and butter beans - areimportant secondary sources of agricultural export earnings. Over thefive-year period 1978-1982, annual export revenues averaged US$1-3 millionfor each of these crops. All four are also vital as sources of income tofarmers living outside the Eastern coastal belt where coffee, cloves andvanilla predominate, and as such are key crops for balanced regionaldevelopment in the agriculture sector. Their present and future marketprospects therefore merit particular attention.
The Market for Pepper
2.45 Pepper is the most widely used of all the spices. In terms ofboth tonnage and value, it accounts for about one-third of the world spicetrade. A product of the pepper vine which thrives in wet tropical areas,the small pepper berries are traded on the world market mai nly in threeforms: as (i) black pepper, the dried unripe fruit, which normally accountsfor about 8OZ of the trade and is preferred by food industry users whorepresent the largest market segment; (ii) white pepper, which is derivedfrom ripe or unripe fruit with the mesocarp removed, and is used mainly asa condiment by household consumers, and (iii) green pepper, which isproduced by preserving immature berries in brine or vinegar, and sellsmainly as a luxury item for use in the catering sector. There is also asmall trade in pepper oleoresin. The world's major producers and exportersof pepper are Brazil, Indonesia, Malaysia and India. Madagascar is thefifth largest producer-exporter of black pepper, though with a minor marketshare which is presently under 2Z (Table 21). Conserved green pepper,however, is a speciality of Madagascar, which remains the leading supplier.

- 23 -
2.46 Market and Price Trends. Global imports of pepper are currentlyestimated at around 130,000 tons per annum, representing a total value ofabout US$200 million at average 1983 prices of US$0.70/lb. The USA and EECcountries, as a group, each account for about 25% of imports; EasternEuropean markets also absorb considerable quantities, and Singapore is amajor re-exporter especially to countries in Asia and the Middle East(Table 22). World consumption has increased substantially over the past 20years, rising on average by 4% per annum during the 1970s. Despitefluctuations in output among the main Asian producers, rapid expansion inBrazilian production and exports (which doubled between 1971 and 1980)maintained global supplies well above market growth. As a result pepperprices fell steadily during the 1970s, and deteriorated even more sharplyfrom 1979 to 1982 as consumption slackened. Depressed prices have prompteda notable fall in Brazilian production since 1979 and moderate to mediocreharvests elsewhere. Since March 1983, however, tight supplies, low stocksand improving demand among major importers have driven prices sharplyupwards, and by March 1984 export prices of almost all varieties and gradesof pepper had recovered, at least temporarily, to 1979-80 levels. The fourleading producer countries, which account for over 95% of pepper exports,are members of the International Pepper Community (IPC), which hasgradually taken shape since 1972. (Brazil joined only in 1981; Madagascar,although invited to join, is not a member but holds observer status.)Although the IPC has so far been unsuccessful in sustaining floor prices,in July 1983 agreement was reached for the first time to establish a singleminimum price (US$0.70/lb since November 1983) for exports of all grades ofblack pepper. Although production and prices of pepper have been depressedfor some years, there appear to be reasonable prospects for improvedstability and renewed market growth over the 1984/85 period, and long-termdemand for pepper is likely to remain firm.
2.47 Madagascar's Market Position and Prospects. Madagascar has beena pepper producer for fifty years, but never a major exporter. At the peaklevels achieved around 1970, total production reached 4,000-4,500 tons perannum, from a cultivated area of about 11,000 ha. In most yearsapproximately 95% of pepper production is exported, mainly to France andWest Germany. In the year of highest exports (1972), the total volumetraded amounted to 4,200 tons or about 5% of world exports. Over thesubsequent decade, however, the area cultivated, production and exportvolume all declined by about 50Z. While global output and exports steadilyincreased, Madagascar's share of the black pepper market declined. By1981, when global exports reached 132,000 tons, Madagascar exported only1,440 tons, just over 1% of the total. Simultaneously, however, from smallbeginnings in the late 1960s, exports of green pepper have shown somegrowth, reaching over 1,000 tons in 1977. Although green pepper output andexports have declined more recently, their share of Madagascar's totalpepper exports has risen to about one-third.
2.48 Depressed world market prices, reflected in low and (in realterms) declining minimum prices for Malagasy producers, have been a majorconstraint on pepper production (Table 23). Other internal factors havealso contributed to poor performance: the overall neglect of export crop

- 24 -
research and development, lack of priority assigned to pepper research andextension, low fertilizer use and low yields, the uneven quality ofexportable product, the general deterioration of marketing infrastructureand organization, and problems of pepper plant disease. Although greenpepper quality has been maintained by the private sector processors andpackers, identified opportunities for increasing crop collection and exportvolume have not been adequately exploited. Given the favorable ecologicalconditions for pepper growing (especially in the Sambirano area and Nosy-BHisland), the existence of established trading channels, the firm marketprospects for black pepper and the excellent reputation of Madagascar'sgreen pepper, a concerted effort is needed to restore the country'scompetitive position in the world pepper market. Over the 1984/85 periodpriorities would include (a) maximizing green pepper production andexports, (b) improving the economics of pepper production, (c) attention topricing questions, and (d) rejuvenating pepper extension and researchservices.
The Market for Cocoa
2.49 World trade in cocoa covers several products: cocoa beans, whichare fermented and dried after harvest, and various products (cocoa liquor,butter, powder and presscake) which result from grinding and processing thebeans. These products are consumed in various forms, mainly in chocolate,cocoa drinks and other confectionery items. Production of cocoa isconcentrated in a few developing countries of the tropics: Brazil, IvoryCoast, Ghana, Nigeria and Cameroon account for about three-quarters ofworld production and exports. The main importers are the industrializedcountries of Western Europe and North America, Eastern Europe and the USSR:together these markets account for 80Z of world consumption. In thisinternational trade, Madagascar has a miniscule share of only O.1..However, alone among Madagascar's export crops, cocoa made gaiss during thel97Us while agriculture as a whole was in decline. Production area, outputand exports of cocoa all doubled between 1970 and 1980. Current markettrends can therefore provide pointers for further growth.
2.50 Market and Price Trends. According to recent estimates by theInternational Cocoa Organization (ICCO), world cocoa production in the1983/84 season was about 1.5 million tons. Although for various reasonsglobal cocoa supplies and prices are subject to sharp seasonalfluctuations, production in 1983/84 came close to the median for theprevious ten years. In this period the main features of the supply
position have been: (a) the emergence of Ivory Coast as the largest cocoaproducer, (b) a marked fall in output in Ghana, (iii) expansion ofhectarage in early bearing and high-yielding hybrid varieties (mainly inBrazil, Ivory Coast and Malaysia), and (iv) a progressive shift in grindingfacilities from importing to producing countries. Structural changes ir.the cocoa trade have made parallel estimates of consumption trends acomplex task. A Bank study on the cocoa market in 1982 showed that for the1970-78 period, apparent world consumption declined by O.1Z per annum.8/
8/ Analysis of the World Cocoa Market, World Bank Staff Commodity WorkingPaper Np. 8. June 1982.

- 25 -
A recent ICCO report suggests continuing stagnation of consumption since1978, although varying trends are found among major consuming countries.9 /Overall the markets in Western Europe (where average consumption is around2 kg per head per annum) and the USA (the largest market, averaging 1.5 kgper head per annum) have been static, whereas Eastern Europe and the USSRshowed rapid growth in the early 1970s until checked by a sharp rise inprices in 1976. Since 1977 market prices for cocoa beans have steadilyfallen and in real terms are below the levels prevailing in the late1960s. Successive international agreements through the ICCO have so farfailed to establish effective price stabilization measures, in part becauseneither the Ivory Coast nor the USA (respectively the largest producer andconsumer countries) have been partners to these agreements. Although ICCOproposals are being prepared for a new agreement to replace the current onewhich expires in September 1984, the general outlook for cocoa remainsuncertain. Long-term projections made in the Bank's 1982 study warn of afurther decline in producer prices unless the growth of world cocoasupplies can be held below 2% per annum up to 1990.
2.51 Madagascar's Market Position and Prospects. Cocoa accounts foronly 1% of Madagascar's exports, and world market trends would appear todiscourage further export growth. Forecasts of short-term price stagnationare also unpromising. However, as a marginal producer and non-member ofthe ICCO, Madagascar operates under fewer constraints than many largercompetitors. Furthermore, marketing of cocoa in Madagascar is not subjectto export and price controls. The main problem is that cocoa has been aneglected crop, and existing growth potential has not been exploited.Malagasy cocoa is of the "Criollo' type, light colored and much in demandfor fine chocolate manufacturing. It commands a higher price than theForestero' type widely grown in tropical Africa. Established plantationsin the northern area around Ambanja, the center of Malagasy cocoaproduction, have been poorly maintained and could yield a much higheroutput. Research and extension have also been neglected. Currentproduction is stagnating around 1,500-2,000 tons per annum. Over 90% ofthis is exported to France, West Germany and the Netherlands, where demandfor high quality cocoa remains relatively firm. In this situation, a casecan be made for re-launching cocoa exports. Over the 1984/85 periodattention should be given to undLrtakiag detailed production, marketing andeconomic feasibility studies on Madagascar's cocoa potential, and to thepreparation of a coherent inter-sectoral policy for this commodity.
The Market for Sisal
2.52 Sisal is among the natural hari fibers (including hemp, abaca andcoconut) which provide the raw material for spun twines, ropes, andcordage. Agricultural markets for twines, binders and balers haveconsistently absorbed the greater part of sisal imports, but sisal cordagealso has a wide range of industrial, outdoor and household uses.
9/ An Analysis of the World Cocoa Economy. International CocoaOrganization. 19 January 1984.

- 26 -
Productiou of sisal is concentrated in two regions of the tropics: in LatinAmerica, where Brazil (the world's largest producer), Mexico and Haiti arethe main growing countries, and in East Africa, where Tanzania, KenyaMozambique and Madagascar are leading suppliers. For Madagascar, sisal Isimportant as a cash crop in the south-eastern area around Taolanaro and asan established source of export earnings. In 1982, export volume of 15,500tons of raw sisal fiber accounted for about 2% of agricultural exportvalue. Several hundred tons of locally manufactured sisal products arealso exported.
2.53 Market and Price trends. Over the past twenty years the worldsisal market has been hard hit by two adverse trends: the growth oflower-cost polypropylene substitutes for natural fiber twines and cordage,and changes in grain baling and binding techniques associated withagricultural mechanization. In the USA, the largest importer of hardfibers, synthetics had gained 20% of the market by 1980, and agriculture'sshare of sisal product usage had declined from 80% of imports in 197b to65Z in 1980. Although the pace of these structural and technologicalchanges has varied among importing countries, their cumulative effect onglobal sisal demand has been negative. During the 1970s, falling demandwas eased by some improvement in prices following the oil crises of 1974and 1979, but led to falling levels of production in several producingcountries (e.g. Tanzania, Mozambique). In 1982 world production of sisaland hemp was about 485,000 tons, a decline of 11% over a five-year period.Sisal accounted for about 85Z of this volume. Since 1981, as a result of afurther reduction in supplies, in part affected by drought in Brazil, themarket has shown a modest recovery. Prices for East African fibers havealso strengthened in 1982-83. However, trading patterns are presently in astate of flux, and prospects for short-term stabilization of the marketremain uncertain. Long-term growth prospects are unpromising. However, asa result of the heightened competition of recent years, there is scope forthe more efficient producers of high-quality sisal fiber to sustain exportgrowth. Kenya, for example has mounted a program to increase smallholderproduction which increased sisal production and exports by over 50Z between1978 and 1982.
2.54 Madagascar's Market Position and Prospects. Madagascar is theworld's fifth largest sisal producer. Official fuiures suggest that ftom1970 to 1980 production and exports declined by about one-third, due bothto trends in external demand and to various internal factors (lack of cropmaintenance and investment, deteriorating infrastructure for input supplyand marketing). Production and exports have since stabilized around the15,000 ton level, which is approximately 3.6t of tve world sisal trade.Traditiosally most of Madagascar's exports went to European markets.However, as cheaper Brazilian sisal has gained a larger share in thenorthern European countries, additional new export outlets have been foundin North Africa, the USSR and China. Despite unfavorable market conditionsand declining port and shipping facilities at Ta%,lanaro, Madagascar appearsto have retained a competitive position in the world sisal trade. This maybe partly attributable to the reputed high quality of Malagasy fiber, whichis well suited to specialized cordage production. Domestic competition in

- 27 -
crop handling and export may also be a factor. Production, marketing andexport of fiber are handled by 6 different enterprises in the private andpublic sectors. Manufacture of twines and cordage for domlrstic and exportmarkets is handled bv a single parastatal enterprise, SIPOR. Given theseproduct advantages and established facilities, there would appear to bescope for rehabilitation and expansion of sisal exports. Market studiesundertaken by ITC and EXA provide initia 1 guidance in this direction. Overthe 1984/85 period it will be important o carry out a fuller investigatioQof the export growth possibilities for Malagasy sisal, including detailedfeasibility studies on the economics of production and an updated review ofpossibilities for product and market diversification.
The Market for Butter Beans
2.55 Madagascar's 'pois du cap', a variety of butter bean, is one ofseveral pulses (including red and white beans, kidney beans and lentils)which are cultivated in the western, southern auc plateau regions of thecountry. In some respects similar to, but larger than, the better knownCalifornian lima bean, this product has been exported since 1920 for highlyspecialized markets. Although market information is sparse, it is knownthat the bulk of exports have gone to the United Kingdom, where the highestgrades are reportedly conserved and consumed as a family food and inpet-foods. Mauritius and Reunion nave also imported the fresh butterbdans. The lowest grade, which is exported mainly to Japan, is used -thereas an ingredient in manufactured biscuits. In Madagascar t s domesticmarket, the 'pois du cap' competes with other varieties of dried beans as afamily food.
2.56 The 'pois du cap' is unique among the export crops in severalrespects: (a) Madagascar is reputed to be the sole producer and exporter,(b) it is the only legume crop which has been a significant export, and (c)in the decade since 1972 no other export crop experienced such a rapid andtotal decline. Whereas at their peak in the early 1970s, exports werearound 20,000 tons (about 2.3X of agricultural export value), by 1981 thistrade had fallen almost to zero. The causes of this export collapse havenot been systematically analysed but are thought to include: (i)inadequate, fixed producer prices (e.g. la 1981/82, FMg 65/kg for 'pois ducap', compared with FMg 120-170 for other varieties of beans); (ii) growthof official export prices to uncompetitive levels since the mid-1970s, whena Government export monopoly was introduced, (iii) declining supplies,exacerbated by the effects of drought in 1978 which caused production thatyear to fall by almost half, (iv) declining quality of the product,worsened by vulnerability to insect disease and lack of insecticides, (v)sanagement inefficiences in parastatal enterprises sharing the state exportmonopoly, and (vi) deteriorating export infrastructure (particularly accessto, and shipping facilities at the ports of Morombe, Morondava andToliara).
2.57 Prospects for the revival of butter bean exports depend primarilyon Government policy and supportive action. A promising step was taken inAugust in 1983 when Government terminated its export monopoly and announced

- 28 -
the liberalization of all domestic and export trade in dry grains,including 'pols du cap' (Ministry of Commerce Decree No. 83-313). After analmost total halt to production and exports in 19dL, provisional estimatesby MPARA. suggest that output recovered somewhat in the 1982-63 period.Exports of about 2,500 tons were recorded for 1982, and this volume wasexceeded in the first six months of 1983. Renewed interest by UK importersis reported, and in response to the recent price and trade liberalizationmeasures continued recovery is expected in 1984. The historical importanceof butter beans as a cash crop and supplementary food crop in the west andsouth-west regions makes it imperative now to carry out a detailed study ofexport market development prospects, and associated economic, agronomic andorganizational issues affecting production and marketLag. Prospects forother pulse crops should be examined in this context as a basis forformulating a viable long-term strategy.
Other Agricultural Exports
2.58 Market studies undertaken for the Ministry of Commerce by EXA(1980) and ITC (1981-83) have indicated possibilities for expanding otheragricultural exports which are not reviewed here. The EXA study exploredprospects for tea, lychees, mangoes, avocados, cut flowers, medicinalplants and essential oils, as well as specific import markets for sisalProducts and green pepper. The series of ITC studies included summnaryreviews of export potential for each of Madagascar's agricultural andindustrial crops, and more detailed reviews for specific crops (e.g.cinnamzn and other spices) and import markets (e.g. USA, Japan, Singapore,and neighboring Indian Ocean countries). Since commodity markets, pricesand trading conditions change rapidly, the findings of these reports shouldbe re-examined and updated where necessary to reassess medium and long-termexport potential. Furthermore, the EXA and ITC studies purposely addressedmainly external market factors; production, domestic marketing, pricing,and organizational constraints are given limited consideration. Theprospects for certain important food crops with export potential, such ascassava and maize, should particularly be reviewed in the context ofnational food policy and priorities. These issues are examined further inChapters III and VII of this report.
F. Conclusions
2.59 The recent growth in revenues from Madagascar's majoragricultural exports will be difficult to sustain. The world market forcoffee is stable, but marked by very slow consumption growth, excesssupplies, only slight improvement in prices, and intense iaternationalcompetition. Prospects for clove exports and prices are discouraging.Demand for natural vanilla remains relatively stable, but high pricesseverely limit the prospects for growth. Madagascar's excessive dependenceOa these crops and passive neglect of other options has placed thecountry's export trade in a highly vulnerable position. Competition fromlarge, dynamic exporting countries such as Brazil and Indonesia hasweakened Madagascar's positioa in traditional consumer markets. Lack ofattention to changing market conditions, declining product quality,

- 29 -
inadequate investment in crop and market research and development and theabsence of clear strategies for export promotion and growth are proving tobe severe handicaps. To reverse the general downward trend of exportvolume calls for rapid action to rehabilitate and diversify export cropproduction and a rigorous re-appraisal of trading policies.
Export Market Constraints
2.60 In formulating a strategy to renew agricultural export growth,particular account should be taken of the following current constraints:
(a) international quota agreements (affecting coffee, vanillaand possibly cocoa), which place limits and strictconditions on the quantities of exportable crops;
(b) difficult access to growth markets in North America andAsia (because of distance, freight costs, pricecompetition and delivery times), requiring a thoroughreview of trade prospects in other established markets(principally EEC and Indian Ocean countries) andalternative new targets for export promotion;
(c) excessive dependence on traditional exports of primarycommodities vulnerable to world price fluctuations, lackof Government priority and incentives for diversificationand development of new exportable products;
(d) unreliability of supplies and uneven quality of producefor export, resulting in reduction or loss of export salesopportunities;
Ce) lack of continuous export market research, strategicplanning and effective trade promotion, resulting in slowand inadequate adaptation to changes in client demand forMadagascar's crop exports;
(f) Government monopolies and controls on export tradingactivity, restraining private sector initiative andinvestment and lowering Madagascar's ability to competeagainst entrepreneurial export efforts in such countriesas Brazil, Malaysia, Mexico and Kenya; and
(g) diversion of exportable production to the domestic market,encouraged by trade controls and official pricing (e.g.for coffee, pois du cap).
Export Market Opportunities
2.61 The long-term outlook for the main export crops is bleak. In theshort-term, however, coffee, vanilla, and to a lesser extent, cloves andsisal will continue to provide the foundations for Madagascar's export

- 30 -
trade and earnings. Opportunities exist to improve earnings from coffee byraising robusta quality, promoting the development of arabica productionfor export, pressing for an increased quota allotment from ICO/OAMCAF,exploiting markets in ICO non-member countries, and extending the availablerange of coffee varieties, products and by-products. Options for clovesare more limited, although there is some scope for penetration of newmarkets, and diversifying outlets for clove oils and resins. Vanillaexports may perh. .s best be sustained by active promotion in establishedmarkets and by identifying new forms and uses for vanilla-based products.There is scope for steady growth of green pepper exports, and forincreasing Madagascar's share of the black pepper trade in selected targetcountries. (Other spices such as cinnamon could also be promoted morevigorously.) As a minor exporter of high-quality cocoa, there is somescope for increasing trade in this neglected commodity. The structure ofthe well-established but depressea sisal industry should be carefullyinvestigated with a view to reviving export growth and capitalizing oncontinued demand for high-quality Malagasy fiber. Renewal and growth ofbutter bean exports is feasible, and non-traditional markets should beexplored. The diverse climate, soils and range of agricultural producefound in Madagascar offer further possibilities for export development ofvarious tropical fruits, grains and oilseed products, and preliminarymarket studies have been undertaken on some of these crops. Subsequentchapters of this review examine the pre-conditions that must necessarily bemet in order to develop successfully the most promising alternatives.

- 31 -
III. EXPORT CROP PKODUCTION
A. Ecological Conditions for Crop Production
3.01 The main export crops grow in humid tropical areas which extendinland from the eastern northern and north-west coasts to about 1,000 maltitude (see Map). Within this vast elongated zone, robusta coffee is thedominant crop. Cloves production is also widely dispersed. Vanilla (inthe north-east), pepper (in the north-west and lower east coast) and cocoa(in the north-west) each cover a more limited area. Cultivation ofbananas, coconut, miscellaneous spices and condiments and several otherexportable crops is also concentrated mainly along the eastern coast.Production of food crops such as rice and cassava has become progressivelymore important in this area for family subsistence. Certain export cropsare grown elsewherez sisal in the south-east, butter beans in the west andsouth-west. Two industrial crops - cotton and sugar - which were formerlysignificant exports but now supply mainly the domestic market, are grownextensively in the west. Arabica coffee production, which is presentlysold in the domestic market but could be developed for export, isconcentrated in central highland areas and a few higher altitude locationsin the north-east. The prospects for export crop development in each ofthese regions calls for further consideration. In this chapter, however,reference will be made mainly to the east coast and northern regions; andto the group of five crops - coffee, cloves, vanilla, pepper and cocoa -which provide the bulk of Madagascar's export revenues (Table 24).
3.02 Natural Features. The east coast region consists of a beltof very broken country, 5U-100 km wide. In many areas, the land fallssteeply from the high plateau to the Indian Ocean, and is intersected by anumber of short meandering rivers. Flooding is increasing withdeforestation, and transport problems are widespread. The north issomewhat isolated from the rest of the country by a high mountain rangebetween Antalaha and Ambanja. Most agricultural activities areconcentrated in the many small river valleys, which occupy about 5-10% ofthe area. The hill side areas (tanety), occupying 65% of the land area,have well-weathered, generally depleted ferruginous or ferralitic soils,with very variable but generally low production potential. Near the coastthere are ridges of sandy soils suitable for coconuts, root-crops andvanilla. The remaining area is formed by steep slopes unsuitable forcultivation.
3.03 Climate. Rainfall is distributed over the whole year without adry period. Total rainfall is lowest in the far south and north, butrarely drops below 1500 mm. In the most important coffee area ofMananjary, rainfall is around 2000-2500 am, while further north aroundToamasina it increases to 3000-3500 mm. There are about 170 rainy days perannum, with the lowest rainfall in September/October, but the monthlyamount seldom drops below 50 mm. Cyclones occur mostly between January andMarch, creating havoc for all crops, but in particular for cloves. Outsidethe cyclone period rain can fall iu tropical storms, and maximum daily

- 32 -
rains up to 200 mm/day are experienced. These heavy rains are particularlydamaging to coffee if they occur during the flowering period. In spite ofa continuous rainfall throughout the year, the number of sunshine hours ishigh, averaging about 7 hours per day. For certain crops, vanilla inparticular, shadow cropping is indispensable, and for pepper and coffee itis also widely practised. Evaporation varies between 60 and 160 mm/monthor about 1000-1300 mm/year, with a minimum during the winter, when lowertemperatures prevail. Except for the narrow sandy coastal strip there isno water deficit of importance. The average minimum and maximumtemperature varies between 20' and 30'C, but in winter months the absoluteminimum can drop during the night to 10-12°C. This is very low for a humidtropical region, and affects the distribution of production over the year.Humidity varies between 60% and 95%. Data are not available on theinfluence of this variability on production, although it is known, forinstance, that the humidity at critical flowering phases affects coffee andpepper production.
3.04 The ecological conditions are in general favorable for growingtropical export crops, but conditions vary considerably in terms of timeand place. These variations between localities favor development of smalland medium sized farming operations rather than large-scale agriculture,and particularly favor family scale production systems which are highlydependent on the quality of infrastructure ant agriculture services.
B. Production and Vost-harvest practices
3.05 In the pre-independence period the development of crop productionwas based maiuly on extension of the planted area and promotion of largerproduction units. This policy fostered the growth of the bigger modernplantations, and of small and medium commercial farms using 5 or more hiredlabourers. It also encouraged cultivation by outgrowers working withnucleus estates or public organizational structures. In spite of thesedevelopments, traditional small farms remain the backbone of agriculturalproduction. Smallholders account for about 80% of the planted area andcontribute about 70X of the value of export production. The difficulteconomic circumstances of recent years have reinforced the reliance ontraditional family units (Table 25).
3.06 Farm Size. The average size of the traditional farm variesbetween 0.4-1.5 ha, and that of commercial enterprises between 4-10 ha.,though some are up to 50 ha. Plantations and state farms cultivate blocsof 50-3000 ha., mostly for coffee and fooderops. In the case of cloves,most trees are planted scattered on hillsides which are otherwise not aptfor agriculture, and farmers count their cloves in number of trees (averageb0-120)and not in hectares. Only a very few regular clove plantingsexist. In the case of vanilla, the planted areas are very small indeed,and vanilla is often planted in secondary forest, with cleared underbrush.Among the main export crops, only sisal and cocoa are predominantlycultivated in plantations (Table 26).

- 33 -
3.07 Cultivation Practices. Until recently, promotion of export cropswas heavily oriented to monoculture, and existing programs and institutionsdeal mostly with one crop only. (OCPGC, the main export crop extensionagency, has a broader mandate but has coacentrated almost exclusively oncoffee.) This situation disregards the basic interest of the farmer infavor of a multicrop and mixed crop system, to minimize risks and to makeoptimal use of available family labor. Mixed-cropping in foodcrops is awell known option, but research so far in Madagascar has not made muchprogress in this field. Mixed cropping for perennial export crops isbeginning to receive more attention and the OCPGC has started some trials(e.g. pepper and coffee). Present techniques for cultivation of exportcrops are unsatisfactory for a variety of reasons, including the generallack of availability and use of fertilizers, lack of extension to smallfarmers and certain crop-specific problems (e.g. inadequate pruning incoffee). In general there is a need to upgrade the quality of plantingmaterial, particularly in coffee and cocoa, and planting techniques; toimprove substantially weeding practices; to increase fertilizer andpesticide use where economically justified; to expand mixed-cropping; andto improve farm management. There are also many secondary problemsrequiring attention, such as the use of better tools for weeding, erosioncontrol, planting of wind hedges, and promotion of animal husbandry, whichshould be addressed in the medium and long term.
3.08 Harvest Practices. The organization and effectiveness of theharvest depends on the type of enterprise. Commercially oriented farms aimto reduce harvest losses, while for the traditional farmer harvesting ofexport crops has to fit into the overall structure of his farm, which aimsin the first place to satisfy his food demands. As a consequence,harvesting the export crop may often become a residual activity (the.culture de cueillette") and harvest losses are common. In general,harvest techniques are simple. Most harvesting is done by hand, andtherefore remAins labor intensive. In general farmers carefully work outtask systems for hired labor, and arraage an orderly organization of workwhen working in groups or for mutual help. However, internal transport in'he field is one aspect which so far has not received much attention:planting in hedges would allow animal transport, and better farm layoutcould reduce harvest cost. The quality of harvest, the selection of ripefruits and avoidance of damage to plants or trees, varies according tothe farmer's perceptions of market prices. Harvesting of cloves is aspecial case. The clove harvest occurs during a limited short period,October-December, in which almost the entire crop has to be harvested. Thefarmer therefore tries to interest as many people as possible from hisneighbourhood and village to pick his trees, and they receive half of thepicked cloves in payment. Seldom are all cloves collected and in years ofabundance up to 20-30% of the available produce is not harvested. Inpoor crop years the possibility to harvest leaves for the production ofclove-oil gives the farmer the option to compensate for reduced cloveproduction. Harvesting for all the major export crops is carried outmainly by women, particularly for coffee and vanilla. For this reason,available family or hired labor is not the only requirement for successful

- 34 -
completion of the harvest; the availability of female labor is especiallyimportant. Furthermore, women also participate substantially in theplanting, weeding and harvesting of foodcrops (Table 27). Much of thislabor is normally supplied through mutual help systems operating at thelocal level. However, a fuller understanding of the social structure isadvisable before planning to expand production of export crops which havehigh labor peaks during harvest periods.
3.09 Post-harvest Practices. Farm practices at the post-harvest stageare of great importance for assessing labor requirements and for maximizingthe quality of the produce. Although a detailed study is lacking,information from a recent FAO report of labor demand and supply inMadagascar suggests that about 20% of all labor is used for manual on-farmpost-harvest activities. For the main crops, these include:
Coffee - transport to farm - drying - decorticating - cleaning -sorting - bagging - storage - transport to collectionpoint: (total post-harvest labor represents about 30%of all required labor);
Vanilla - transport to collection point;
Cloves - transport to farm - stem removal - drying - cleaning -sorting - bagging transport to collection point;
Pepper - transport to farm - drying - cleaning - bagging (andsorting, in the case of green pepper) - transport tocollection point;
Cocoa - opening of pods on site - transport to drying floor -drying - cleaning - sorting - bagging - transport tocollection point.
Since most of this work is done by hand (women participate to the extent of70%) and crops are transported on the back, many of these tasks could bemechanized. Transport, decortication, cleaning and sorting particularlylend themselves to mechanization. This would set free an enormous amountof labor, which could then be devoted to crop maintenance and other fieldactivities, with a substantial beneficial impact on yields. Smallprocessing centers could be set up to do most of the post-harvest work,which could be organized and managed by the community at cost.
3.10 Farmer Services. Some state farms and socialist cooperatives areengaged in export crop production: however, the vast majority of producersare independent smallholder families who rely on various public and privateservices for assistance. In general, support services provided by thepublic service agencies are highly deficient and in many instancesnon-existent. Research institutions, centralized since 1974 under FOFIFA,have been unable to pursue earlier research on export crops (except forvanilla) through lack of both financial and technical staff resources. Theexisting network of research stations and experimental plots has been

- 35 -
seriously neglected and is now almost inoperative. An ISNAR studycompleted for MPARA in mid-1983 has well analysed current deficiencies andrecommended rapid action to reorganize the institution. Although generalrehabilitation of the FOFIFA research network would be extremely costly,urgent action is needed to support the coffee and vanilla stations in orderto maintain varietal inventory and avoid irrevocable disruption oflong-term trials. Extension services provided by OCPGC have assisted inintroducing new coffee varieties and clones and improving pruningtechniques; for pepper and cloves, improved plant material has beendistributed and advice is given on proper planting techniques. However,these services have generally been poorly managed and scant attention hasbeen paid to improvement of farming systems and the farm economy. Forvanilla, the extension services provided through GNIV, the vanilla tradeassociation, have been more commercially oriented. Due to research budgetconstraints, available improved plant material for vanilla has not yet beendistributed for farm trials. Input supply is a major bottleneck, mainlybecause of the lack of foreign exchange and severe transport constraints.The breakdown in supply of materials, tools, equipment and agriculturalchemicals has substantially affected coffee production. Lack of inputs hasless dramatically affected vanilla, pepper and cocoa production. Improvedcultivation techniques for these crops are currently more important thanfertilizer application. For cloves, use of fertilizer has been promoted byOCPGC, but clove production is primarily conditioned by available labor andthe scale of leaf harvesting. Credit services for export crop productionare available through the rural development bank, BTM, but the demand forsmallholder credit is not well established, and is highly dependent on theavailability of adequate input supply, credit rates, transport andmarketing services. Marketing problems are examined in the followingchapter. In general, the export crop smallholder is severely handicappedby weak support services, and is obliged to rely on traditional informalchannels for assistance to crop production.
C. Production Volumes and Yields
3.11 Crop Statistics. For the main export crops a general overviewwas provided in Chapter II on production volumes and trends in the contextof market development. Reference was also made (para. 2.02) to theweaknesses and inconsistencies of official trade statistics. The generaldeterioration in Madagascar's statistical services and the lack of recentcensus data are well known problems which affect planning and analysisacross several sectors. These problems are particularly acute inagriculture, and defy accurate evaluation of export crop production andyields. Statistics reported by MPARA and OCPGC are at best crudeestimates. No regular crop surveys are undertaken, and data assembly byOCPGC from field reports and ad hoc spot surveys, although useful as astarting-point for analysis, is methodologically weak and unreliable. Thedegree of accuracy of available production figures also varies considerablybetween crops. Most statistics purporting to show export crop productionare derived indirectly from official marketing and trade data: these
figures may commonly include production from more than one crop year, and

- 36 -
also make no allowance for domestic market consumption, informal trade,possible home consumption and processing, and crop losses in storage.Yield statistics are eves more unreliable, since they are derived from twosets of inaccurate indicators: (a) on production, and (b) on planted area,which is also not measured.10/ Although HPARA estimates can illustrateyield trends, they provide no guidance on real yields and therefore makecomparisons with the performance of other producing countries in thisrespect largely hypothetical. (FAO indices suggest that among theimportant export crops, only for sisal are yields in Madagascar on a parwith the most efficient African producers. For coffee and cocoa, yieldsare cited which are close to the African average.) The figures onproduction and yields cited in this review, which represent the bestavailable estimates, should therefore be used with extreme caution (Tables28,29). Key indicators for the major crops are summarized below.
Coffee Production
3.12 Planted Area. The total area planted in coffee is estimated at231,000 hectares. Of this roughly 220,000 ha represent robusta plantingsalong the eastern coastal belt which stretches from Vohimarina in the northto Taolanaro in the south. The greatest density of coffee production is inthe hiaterlands of Manakara and Mananjary. An additional 6,000 ha ofrobusta is grown near Mahajanga in the north-west. The remaining 5,000 ha(about 2X of total) comprises arabica coffee production in the highlandareas around Lake Alaotra. Approximately 350,000 smallholders account for85Z of the total cultivated area for coffee, and their coffee holdings varybetween 10-50% (0.10-0.75 ha) of an average small farm (1.0-1.5 ha). Largecommercial plantations amount to only 5Z of all land under coffee, and notalL of them remain in production. Several of the largest coffee estates,established near Manakara during the colonial era, have either beenabandoned or are only partially cultivated. OCPGC data suggest that thetotal area under coffee has declined by about 4% over the 1978-U2 period.
3.13 Production and Yields. Coffee production is difficult tomeasure, because a considerable quantity is consumed at home, there is alarge domestic market (variously estimated between 12,000-18,000 tons), andharvest and processing losses can be considerable. Estimated total coffeeproduction has fluctuated around 80,000 tons in recent years. Thiscompares with an official target of 104,000 tons by 1980 set under the1978-80 Development Plan. (Throughout the late 1960s and 1970s bothproduction and new plantings consistently fell short of official targets bya wide margin.) Yield levels are particularly uncertain because available
10/ Estimates of planted area are derived from (i) the number of treesplanted (as reported by farmers, based on a general estimate of alltrees planted, irrespective of age), and (ii) an assumed tree/plantpopulation per hectare (based on unadjusted averages for relativelywell run plantations, with no allowances made for trees/plants lostfrom disease or cyclones, or for those scattered over the farm, whichis commonly the situation for cloves).

- 37 -
figures take no account of the differences between old and newplantations. Average yields among smallholders are estimated at 380 kg ofgreen coffee per hectare per year. This is above the quoted averages forleading robusta producing countries in West Africa (e.g. 245 kg/ha in IvoryCoast, 300 kg/ha in Cameroon) and on a par with Zaire, but far below theaverages achieved in Kenya (731 kg/ha), Colombia (636 kg/ha) andelsewhere. Under improved conditions, with adequate use of fertilizer andother inputs, proper cultivation techniques and regular maintenance, yieldsof coffee from pure stands in traditional smallholdings could be raised to600 kg/ha. digher yields, averaging 1,000 kg/ha in small commercial farmsand 1,500 kg/ha in large plantations, would be attainable under optimalconditions. The generally poor results achieved to date in coffeeproduction can be attributed iu part to factors which lie outside thefarmer's control, including official pricing policy, marketing facilitiesand the organization of agricultural services. Farmers themselves,however, are also to some extent accountable for the malaise: plantationsgenerally are poorly maintained, and many have been slow or unwilling torespond to available new varieties and technical improvements.
Clove Production
3.14 Planted Area. The total planted area for cloves is now about110,000 hectares, or half that devoted to coffee. The heaviestconcentration of plantings is to be found north of Toamasina in the areasaround Fenerive and Vavatenina, which on average account for about half oftotal production. The production zone extends along the east coast both tothe south (around Brickaville and Toamasina, and as far as Manakara) and tothe north (as far as Sambava and Antalaha, which are relatively new areasfor cloves). Active Government promotion of cloves since the mid-1970s hasled to a rapid expansion of plantings, and the total planted area increasedby one-third over a five-year period (1978-82). Because of this recentgrowth, only about 73,000 ha, two-thirds of the total clove area, are yetin full production. Cloves are a classic crop for smallholders, and of anestimated 80,000 clove producers, 70,000 have plots averaging less than onehectare. The few larger plantations are owned mainly by Malagasyentrepreneurs.
3.15 Production and Yields. As noted in Chapter II (para 2.23), cloveharvests are cyclical: between good and bad crop years production may varyby 500%. Because harvesting is highly dependent on labor availabilitywithin a two-month span (November/December), the total available crop isoften not fully collected. Estimates of actual production volumes aretherefore subject to a wide margin of error, although trade deliveriesprovide a reasonable proxy for harvested clove buds and stems. In averageyears this harvest is around 10,000 tons. Clove leaf production isvirtually immeasurable because the leaves are sold mainly to small localdistilleries, but proxy measures can be established from trade data onclove oil ingredients. Clove oil production fl-actuates around 800-1000tons per annum. Average yields of clove bud6 are estimated at about 220kg/ha, or slightly more than 1 kg per tree. In well-maintained commercialplantations, yields of over 500 kg/ha are readily obtainable, and under

- 38 -
improved conditions average yields could probably be raised by 150% overpresent levels. OCPGC has claimed two benefits from proper use offertilizer: yield increases of up to 10OZ in average years, and averageyields in low years of the crop cycle. The cost/benefit value offertilizer use, however, is open to question. Current low yields arelargely due to negligible maintenance, to outbreaks of a plant disease(Andreta) which attacks leaves and branches and can lower yields by up to30%, and to tree damage caused by unskilled and ill-timed harvesting of theleaves. Clove production potential increases considerably with age andclove trees have a long productive life. The potential benefits of raisingcurrent yield levels should therefore be weighed carefully in view ofprospective market and price trends.
Vanilla Production
3.16 Planted Area. Vanilla production is highly concentrated andspecialized. Climate, soil conditions, plant characteristics andcultivation techniques are particularly demanding and have largely confinedvanilla growing to coastal areas in the north-east. 952 of the plantedarea is located within a region centred around Sambava (38%) and includingAntalaha (24X), Vohimarina (22%) and Andapa (lb%). There are also smallgrowing areas in the north-west at Sambirano and on Nosy-Be island. Of atotal planted area estimated in 1983 at 27,000 ha (one-fourth that ofcloves), only about 22,000 ha are yet fully productive. Vanilla isessentially a smallholder crop: 96Z of the planted area comprises smallfarms, many of which include also tree crops. There are about 70,000vanilla growers, of whom about 5,000 operate semi-commercial enterprises.Only a few large plantations exist (averaging about 8 ha), mainly becauseof high labor requirements. Cyclones, a relatively frequent phenomenon inthe main growing areas, have intermittently caused serious damage to thedelicate vanilla crop, but highly attractive market prices have encouragedconstant renewal and expansion of cultivated areas in recent years.
3.17 Production and Yields. Local consumption and post-harvest lossesof vanilla are negligible. Production should therefore be easilymeasurable from trade data, since almost the entire crop passes throughpreparation plants for export. Mowever, vanilla undergoes a particularlylong preparation process (18-24 months), and reported trade statistics mayinclude production from more than one harvest. Clandestine sales may alsodistort estimates of real production, and production trends discussed inChapter II (Para 2.34) are based on sometimes contradictory officialstatistics. In 1983, a relatively poor crop year, harvested production wasaround 3,200 tons of vanilla pods, equivalent to about 700 tons of curedvanilla. Relatively sharp fluctuations in annual output and yields are notuncommon because of vanilla's sensitivity to micro-climatic variables,attack from plant diseases (fusarioses) and methods of husbandry. Althoughvanilla holdings are claimed to be relatively well-maintained, averageyields of only 150 kg/ha were recorded for 1982, and have been declining inrecent years. Current yield levels are barely 20% of theoreticalobtainable yields, and clearly call into question the quality of actualcrop husbandry. Under favorable climatic conditions and with improved

- 39 -
cultivation and maintenance, current yields could easily be doubled. Thepresent lack of vanilla extension services is reflected in recent results.Considerable research has been done on vanilla varieties and yields at theFOFIFA station in Antalaha, but unfortunately this wo-k has not yet reachedthe stage of application in the field.
Pepper Production
3.18 Planted Area. The total area planted to pepper diminished byhalf between 1970 (ll,ZOO ha) and l90U (5,450 ha), and has only recentlystabilized. Cultivation currently extends over approxi-nately 6,000 ha, themain areas of concentration being in the Sambirano delta near Ambanja, theeastern part of Nosy-Bg, the Toamasina plain and southern sectors of theeast coast belt. The Sambirano/Nosy-Be region in the north-west, whichincludes most of the remaining commercial pepper estates, accounts forabout one-third of pepper output. In other areas peppt.r is overwhelminglya smallholder crop. Family-type farms account for about 90Z of the totalcultivated area, and pepper vines are commonly grown in mixed stands withtree crops such as coffee and cloves which provide shade. Altogether thereare about 60,000 pepper growers, but their numbers have been steadilydeclining.
3.19 Production and Yields. In the absence of reliable cropstatistics, trade statistics can provide a broad indication of productionlevels since the domestic market for pepper is relatively small (about50-100 tons per annum). However, trade data do not reflect crop losses inthe field and during processing, which in the case of pepper could beconsiderable (up to 10%) in view of the generally low levels of harvestingand processing technology which prevail. Furthermore, trade statistics donot consistently distinguish between black and green pepper. Availablefigures suggest that total pepper production oscillated between 3,000-4,000tons per year during the 1970s, but has since stabilized around 2,500-3,000tons. Within these totals the share of green pepper has risen over aten-year period from around lOX to 30-40X of total production. Averageyields of 400-600 kg/ha were reported during the 1970s, but seem to havebeen declining. For 1982 an average yield of 440 kg/ha is estimated.OCPGC data have shown that under experimental conditions, with availableimproved plant material and proper use of fertilizer, yields of 1,000-1,200kg/ha are obtainable in plantations of pure stands. Much higher yieldswould be theoretically obtainable under conditions of intensivecultivation. Pepper vines thrive best in rich, well-draia2d lowland soils,and the areas presently cultivated in Madagascar are potentiallywell-suited to intensive cultivation. The present low production volumesand yields appear to result from a combination of factors: unattractiveproducer prices, unsophisticated production technology, and the generalneglect of pepper research and extension.
Cocoa Production
3.20 Planted Area. Cocoa production in north-west Madagascar startedup during the colonial era, principally in the Sambirano delta area around
- 40 -
Ambauja. Originally grown exclusively on plantations, cocoa cultivationhas gradually been taken up by suallholders in this area and in a fewplaces aloug the east coast. Simultaneously some of the former plantationshave been neglected or abandoned. Unfortunately, statistics which couldillustrate these trends are sparse and unreliable. The available estimatessuggest that in 1970 the total area planted to cocoa covered about 2,800ha, and has increased steadily to around 5,000 ha in 1982 (although OCPGCreports higher figures). Because of recent plantings, it is estimated thatabout 4,500 ha are currently in production. The large plantations in theSambirano area account for approximately four-fifths of this total. Theremainder is distributed among about 2,000 suallholdings.
3.21 Production and Yields. Official statistics suggest that totalannual production of cocoa beans rose by almost 50% between the early 19708(an average of 1,200 tous) and early 1980s (about 1,750 tons). Thisapparent trend would be consistent with statistics reporting occasionalannual fluctuations but an underlying pattern of growth in local processingand export of cocoa products. Production growth rates have neverthelessfallea far short of targets set in successive national development plans,partly because of a lack of sufficient investment and because of theperiodic devastarion of cocoa plantations by cyclones. Increases inproduction appear to be mainly associated with an expansion of thecultivated area, since estimated yields have slipped from about 400 kg/hain 1977/78 to an average of 330 kg/ha in 1982. Thi_ is still above averageyields reported for important producing countries in Africa such as Ghana(213), Nigeria (250) and Cameroon (259), but far below yields obtained bythe present world market leaders Ivory Coast (516) and Brazil (701). Thisdecline in average yield in Madagascar to some degree reflects thetransition from plantation to suallholder cultivation, but may also beexplained by other factors. Yields can be raised significantly by use ofimproved plant material, and although OCPGC has made progress in developingnew clones and distributing seedlings, there is reported to be a largeunsatisfied demand. Support services for cocoa producers are generallyweak. OCPGC has assigned relatively low priority to cocoa and has not yetdeveloped a serious extension program. A research program initiated L the1960s investigated new hybrid varieties (Criollo with Trinitario) with theaim of raising yields and bean quality, but since FOFIFA took over theprogram in 1974 research support has gradually petered out. Lack offinancial and personnel resources has restricted FOFIFA work to limitedmaintenance of activities in the Ambanja and Ilaka-Est research stations.
D. Farming Systems and Constraints
3.22 The generally low outputs and yields observed for the main exportcrops are only partially explained by crop-specific risks anddeficiencies. For a fuller appreciation of the problems of cropcultivation and development in a sub-sector which has relied almostentirely on smallholders, consideration should be given to the farmingsystem as a whole. Real improvements in crop production depend to a greatextent on the individual farmer's perceptions, attitudes and responses tomajor problems, such as availability of labor, family objectives and risk

- 41 -
aversion. Three aspects of the farming system merit particular attentionhere: (a) the farming eavironment, (b) the farmer's objectives andpriorities, and (c) farm resources and constraints.
Farm Environment
3.23 The main external circumstances affecting farmers' behavior andcultivation practices have already been indicated. Ecological conditionsin particular impose numerous constraints: periodic damage to crops bycyclones and floods, occasional outbreaks of insect-borne and plantdiseases, and high levels of humidity which pose constant problems fordrying and on-farm storage of crops. The cyclone risk factor is especiallyhigh in the main export crop zone: cyclones occur annually and over thepast decade crop damage by cyclones has been recorded for 1976, 1978, 1981and most recently in early 1984. Government should take this factor fullyiuto account in setting minimum producer prices, and the feasibility ofsetting up a crop insurance scheme for smallholders should be seriouslyconsidered. The vulnerability of most export crops to a variety ofdiseases is well-known, but inadequate supplies of pesticides and thealmost total abandonment of agricultural research on these crops hasseriously limdted the possibilities for farmers to deal effectively withidentified disease problems. The general inadequacy of support services isa coustant constraint, and in view of the prevailing low levels ofcultivation, harvesting and post-harvest technology, few improvements canbe expected from producers in the absence of effective research andextension services. Another problem for farmers is the lack of ruralfacilities for the distribution of consumer goods. Opportunities forincreasing income have little appeal if opportunities for expenditure arevirtually non-existent, and the sharp reduction in availability of basicsupplies over recent years has had incalculable effects on the readiness offarmers to produce crops for sale. Farmers appear in general to havereacted to this situation by building into the farm system increasedprovisions for food crop production.
Farmer Objectives and Priorities
3.24 Subsistence Objectives. The farmer's primary objective is tosecure an adequatc family food supply, either by buying or by producing.Where the market network for supply is deficient in export crop zones (inremote areas, due to transport problems, or lack of supply) the farmer willnormally concentrate on production of food. His marketing objectives aresubordinated to the food supply constraint and he is likely to analyse theresults of his work on cash-crops in terms of his return per labor day orthe rice-buying power per labor day.
3.25 Relative Priorities. Fluctuations in cash and foodcrop pricesinfluence the farmer's final decisions on his production system. Lowcoffee prices have prompted farmers to neglect coffee and to concentrateinstead on food crops and better paying short-term activities such assugarcane and clove-oil production (Table 30). There is no evidentincentive to switch to other treecrops, because inadequate marketing and

- 42 -
transport services make this option too risky. The production of exportcrops is especially subject to movements in the rice supply system. Withfalling rice prices, a farmer's perception of his return per laborday oncash crops will improve in terms of family food security. In areas of riceabundance without possibilities for marketing (e.g. Antalaha), low riceprices will motivate cashcrop planting. (If the surplus were to be soldoutside the region, however, the same motivation would not exist.) Ingeneral increased availability of local rice for purchase can provide animportant stimulus for greater production of the export crops. In thisrespect the Government's current policy in favor of increasing riceproduction as a first priority should also progressively assist a renewalof export crop production in some areas, provided that transport andmarketing facilities are simultaneously improved.
3.26 Marketing objectives. In the export crop areas farmers'marketing possibilities are largely limited to the traditional exportcommedities. Trade circuits for rice, maize, cassava and other root-cropsare not well developed, and a small oversupply of food items at localmarkets can reduce prices dramatically. The farmer will therefore adjusthis food production -as precisely as possible to foreseeable family demand.Demand for cereals is calculated as about 400 gr per full-time worker/day,and the same average applies to tubers. Other food requirements can besupplied from the home garden. For the average family of 5, at currentyield levels farmers would need to plant about 1 ha of cereals androotcrops each. In this situation, farmers having an average farm size of2.5 ha would have little opportunity to go into cashcrops, unless assuredof remunerative prices and stable provision of consumer goods. Increasesin yield levels of foodcrops could therefore improve the capacity offarmers also to produce cash crops for export.
Farmers Resources
3.27 Land. The average farmer's plot is about 2.5 ha. This consistsof (a) some permanently occupied land, mainly for housing and for perennialcrops, (0.5 - 1 ha) and (b) plots in tanety or tavy, which are used forshifting cultivation. Land tenure systems in Madagascar are complex andmay affect export crop production through their influence on investment inperennial crops and the supply of family and farm labor. The land tenurestructure should be particularly studied in conjunction with the laborsupply structure in export crop zones. The quality of land also influencesthe land tenure structure, because in the more fertile valleys land rightsare better defined and average plot sizes are higher. A landclassificaZion and aptitude survey exists for the main growing areas in theexport crop zone, but unfortunately these data are not widely available.
3.28 Labor. The farm family supplies up to 100% of the labor requiredfor rice production depending on the region and the area under cultivation,and more than half of that for tuber production. For the establishment ofperennial crops, the farmer relies heavily on hired labor or mutual help(50-60%), but for vanilla the family has to do most of the work. About50-60% of operational tasks in cash crop production are also

- 43 -
performed by hired labor, except for vanllla and pepper. Available familylabor would apparently be insufficient to expand either average farmplotsor the portion of the cultivated area devoted to export crops. It is alsoinadequate to permit adoption of the cultivatios techniques most necessaryto increase yields. The incentives in agriculture are also insufficiert toattract young family members, and this exacerbates the situation. Thequestion of the structure and organization of the agricultural labor forceis therefore extremely important, especially since the availability ofhired labor is uncertain.
3.29 Capital. The average farm family cash income from farm and offfarm activities is equivalent to about US$300/year. This is too low toencourage significant on-farm investments, and it may be a constraint toseeking credit for intensification of cultural practices.
Cropping Patteras
3.30 The above-mentioned land, labor and capital constraints, combinedwith deteriorating agricultural services, encourage the farmer to reducehis labor input, to restrict hired labor and to distribute risks. He willnormally seek to avoid labor peaks (e.g. in the Ambanja region, byswitching from coffee to cocoa where coffee and rice harvests coincide) andto reduce maintenance costs (e.g. by mixed cropping of coffee and pepper).In general cropping patterns are determined mainly by conditions for riceproduction (in primary forest or regenerated bushland or as inundatedrice). Information from MPARA provides details of planting calendars inthe various ecological regions. This shows that the rice cultivationperiod in the wet export crop zones lies generally between September andMarch, with a labor peak from November to January, while the harvest periodis generally around June. This calendar will normally set the limits forsmallholders' expansion of export crop production.
3.31 Options for mixed Cropping. More research is needed to identifymixed cropping systems which could respond to farmers' seasonal needs.Currently coffee is mostly planted as a pure-stand crop, although somefarmers plant fruit, vegetables and maize or rice in coffee plantationsduring pruning. Trials of mixed cropping of coffee with pepper, usingshadetrees and tutors, have been made. Vanilla, being a typical familyfarming crop, is mostly planted on sandy soils in light forest areas wherethe underbrush is cut. This system lends itself poorly to intensifiedmixed cropping. Because the fertilizing of vanilla occurs in theOctober-January period, it tends to interfere with rice activities,although the work is mainly done by women in the early mornings. Clovesare not grown as a regular crop and therefore receive little attention.Although clove harvesting is heavily concentrated in the October-Decemberperiod, it does not interfere with other crop activities, because theharvest is contracted out to seasonal laborers who are not engaged inregular farm activities. Pepper is now mainly cultivated in mixed standswith various rice crops. The harvest partly coincides with the riceharvest, but further research could suggest solutions for integratingpepper in a mixed cropping pattern which meets farmers' needs and labor

- 44 -
constraints. Cocoa seems to fit well into the small farmer's croppingpattern in the most favorable area (Ambanja). Other crops could beincorporated in a cropping system which would make optimal use of thefarmer's main resource, family labor. Possibilities to be explored couldinclude such options as cocoa/coconut, vanilla/coconut, intercroppingduring establishment (e.g. coffee/rice) and intercropping during coffeepruning. Various fruit trees such as jackfruit might also be considered inthis context. Mixed farming, which could combine cash crop cultivationwith livestock-raising, is another possibility to be explored.
E. Economics of Crop Production
3.32 Export crop producers are predominantly smallholders, and many ofthe economic problems they face are common to smallholder agriculturethroughout Madagascar. The prolonged neglect of national agriculturalresearch, lack of regular input supplies, deteriorating distributionfacilities, and the general bias of Government pricing, subsidy andtaxation policies in favor of the urban consumer have affected most sectorsof the rural economy. In addition, export crop producers face particulardifficulties. Most major export crops are perennials. The benefits ofproduction investments are subject over time to unpredictable trends indistant markets. The financial risks for perennials are proportionatelygreater than for annual crops, particularly in areas subject to frequentcyclone and flood damage. Long-term investment credit, even if loans canbe secured on favorable terms, places producers of perennial crops under aheavier debt burden. These producers also have very limited flexibility inswitching from one crop to another in response to cv!.tnges in their buyingpower. For these various reasons, the generally depressed state of therural economy in Madagascar has progressively reduced the economic securityof smallholder producers dependent on export crop revenues. The responseof many has been -o look first to their own family food security and onlysecondarily to maiatenance and economic management of their plantations.
Production Costs
3.33 The recent decline of agricultural production as a whole inMadagascar is attributed by most observers largely to the inadequacy ofproducer prices. For those crops subject to Government export monopolies,this issue is particularly contentious, since officially guaranteed minimumprices to producers are claimed by agricultural managers to bear littlerelationship to actual costs of production. However the availabledocumentation from Government sources which could support this propositionis extremely sketchy. Little systematic analysis has been undertaken ofthe costs of export crop production under different sets of conditions(e.g. location, farm size, cropping pattern, use of inputs, present andpotential yield). Lack of recent investment in the sub-sector has alsolimited the number of external studies. Agricultural economics serviceswithin MPARA and OCPGC are weak, and inter-agency price reviews thereforetend to take place in a vacuum of knowledge on real farm production costsand markets. Efforts have only recently been made to redress thissituation: an inter-agency ad hoc commission convened at the National

- 45 -
Coffee Symposium in May 1983 prepared a fairly detailed analysis of coffeeproduction costs, and a new unit for economic studies was formed by MPARAin November 1983 (see Chapter VI, para 6.03). This unit has since begunpreparing a series of crop profiles which are expected to provide necessarydata for production cost analyses for the other major export commodities.Pending more detailed studies, comparisons of returns to labor for themajor crops have been prepared by Bank staff for this review. These arepresented in Table 31.
3.34 Basis for Cost Estimates. Because the major export crops areperennial, on-farm production costs vary according to the age of theplantation. For some crops, such as coffee and pepper, periodicdeep-pruning is necessary, and this also influences overall costs.Optimally production costs should be calculated on the basis of (a) costsat full maturity, (b) amortization of the crop establishment costs, basedon the productive lifespan, (c) amortization of periodic upgrading, basedon the pruning cycle, and (d) inclusion of the cyclone risk factor(estimated at 10%) shown in Table 31. For coffee, these factors areincluded in the preliminary cost estimates. For other crops, amortizationcosts are not included. For cloves, a different basis is adopted becausethe lifespan of clove trees is particularly long: cost estimates for thiscrop are based on harvest and transport costs, plus a standard allowancefor maintenance costs. Although supplies of certain inputs (plantingmaterial for coffee, cloves, and cocoa; fertilizers, tools and services)are presently provided to farmers at subsidized prices, these subsidyprovisions are excluded from the estimates made in Table 31 as they provideno incentive for crop maintenance or investment.
3.35 Definition of Farm Enterprises. A recent FAO study of farmenterprises makes no distinction between farm enterprises (menages) andfarm families. Enterprises are recorded as having an average from 3.3-6.6workers and from 5-9 persons, but are not categorized further. A farmfamily, however, may operate more than one farm enterprise, with differentfamily members acting as independent decision-makers (chefs de menage) forvarious parts of the family property. For the preliminary cost estimatesin Table 31 three categories of enterprise are assumed: (i) a traditionalfamily plot with one family/one enterprise; (ii) a semi-commercial plot,with one family but possibly more enterprises; and (iii) a plantation withan enterprise management and mostly hired labor. It is assumed that theaverage farm family consists of 5 persons, with 3 full-time workers (2 menand 1 woman).
3.36 Availability of Hired Labor. Hired labor on estates consists of(i) permanent labor, mostly paid on a monthly basis and working on average8 hours per day, and (ii) casual hired labor paid on a task basis andmostly working about 4-5 hours per day. Small farm laborers also workabout 4-5 hours per day except at harvest time. Preliminary cost estimatesassume that all labor days represent 8-hour day tasks. The availability oflabor for hire depends on the season, the level of economic development ofthe area, and educational structure. MPARA estimates assume that a field

- 46 -
worker is available for 200 effective working days per annum. An FAO studyin 1982 suggested that 20 labordays per month are available for labor onsmall farms, but gave no indication of hours per day spent on task labor.Assuming a 5-hour workday, the preliminary estimates assume for eachworker: (a) 200 labordays per annum, (b) 25 labordays per month at harvesttime, and (c) 10 labordays per month required for fooderop cultivation.
3.37 Wage Systems. Various wage systems exist, as follows:
(a) Plantations. Payments are made in cash (or a monthly ortask basis) and fringe benefits are payable for medicalservice, vacation allowances, etc. which amount to 2bZ ofcash payments. Total costs of wages and allowances areestimated at FMg 1,000 - 1,100 per day;
(b) Semi-co-mrcial farms. Daily wages are paid per dayFzMg 4UU-QUU)plus provision of rice (350 gr/day), assistancein house building, and allowance to cultivate a food plot.Total average costs are estimated at FMg 750/day for coffee,vanilla and pepper;
(c) Seasonal group work. This is common for crops such assugar, cotton, cloves, and rice. Costs include dailypayment (FIg 600-700) and daily allowance (FMg 100).Recruitment, transport costs and lodging costs (FMg50-100/day) should also be included. Total costs averageF'Mg 8 0 0 -1,000/day.
(d) Payment in kind. This applies in the case of cloves. Laboris recruited on the basis of granting the worker 50% of theproduce harvested by him as payment.
(e) Share cropping. The most common system is for the farmowner to supply land and some assistance in the form ofseeds, advances etc. he receives 1/3 or 1/2 of the harvestin payment. There are three varients of the sharecroppingsystems, namely:
- "partage"; sharing the produce harvested 50%/5U%without any assistance;
- wmetayage ; providing land, seed and lodging and somesort of payment in kind; and
- tsous-metayage" for special activities and payment inkind.
Costs of sharecropping are not considered in the preliminaryestimates;
(f) Traditional system. This signifies working in mutualassistance (repayment in working time) or for payment at FMg85/hour. In this study, costs are estimated at FHg 650/day.

- 47 -
3.38 On-farm Transport Costs. Among traditional farmers, work is doneand loads are moved mostly by manpower, without tools or equipment.Improved on-farm transport could be provided by the use of animal power,but there is no tradition among export crop farmers in handling animals orincorporating animal husbandry in farm management. Costs require furtheranalysis. Preliminary estimates indicate that the average farmer spendsabout 3 labor days per 100 kg of produce in on-farm transport (equivalentto FMg 20/kg of coffee, or about 7% of the current official producerprice). These costs would be much less (down to 1X) in favorably locatedand well-run farms, but would be higher in remote plantings.
Profitability
3.39 Between the traditional and the commercial farmer differentcriteria are likely to be applied in evaluating the profitability of exportcrop production. Small farmers are concerned not only with potentialfinancial returns, but with the finaucial consequences of the risksinvolved in cultivating a particular crop. The ad hoc inter-agencycommission which analyzed coffee production costs in May 1983 attempted toquantify this risk factor by increasing the calculated wage factor by 50%,although the issue for the farmer is one of family security and stabilityrather than financial return. The relative importance of financial returnsto the small farmer may also decline sharply if the availability ofconsumer goods declines as it has recently done in Madagascar. For thecommercial farmer potential financial returns and risks will both be takeninto account and expressed as returns on total resources and on investmentcapital. Profitability estimates for commercial farmers will need to takeinto account higher wage levels, social costs, overheads, taxes andinterest on investment loans. (Between the semi-commercial and plantationlevel labor costs respectively represent an estimated 15% and 70% of totalcosts; interest rates on small farmer credit are presently set at 16.5% forshort-term and 22% for medium term loans.) For coffee, the ad hocinter-agency commission estimated the appropriate profit margin forproducers at 15% on the calculated cost of production. This assumedadequate local availability of credit to finance rehabilitation, pruningand expansion of coffee holdings. It is questionable, however, whetherthis level of profit would be sufficient to attract capital investment innew coffee plantations.
3.40 From data gathered by the mission the following conclusions aredrawn:
(a) Coffee. Under current conditions coffee production is notprofitable. The costs of production at plantation wagelevels, including financing of periodic rejuvenation ofcoffee plantings, is estimated at a minimum of 350 FMg/kg.At the 1983-84 guaranteed minimum producer price of FMg280/kg, coffee production for export is clearly unattractiveto suallholders. They can be expected to neglect minimalhusbandry ana urgently needed rejuvenation, and the

-48-
quantity and quality of coffee production will continue todecline. Even at the semi-commercial level, at an estimatedcost price of about FMg 350/kg, there is no incentive toincrease production and future prospects are discouraging.
(b) Cloves. At 1983-84 prices, cloves are an attractive cropfor both smallholders and commercial farmers. Cloves arenot normally planted in a plantation system, and thesemi-commerical plantings refer to the total size ofplantings rather than to a system of cultivation. Continuedproduction of cloves in established crop areas would appearprobable unless changes are made in official pricing andmarketing policy.
(c) Vanilla. At 1983-84 price levels, vanilla appears to give areasonable return of up to 20% at yield levels of 1,200kg/ha (green beans) for commercial and 600 kg/ha forsemi-commercial farming. In all farm types/sizes vanilla ishighly sensitive to crop husbandry techniques. When yieldsfall below 1,000 kg/ha (commercial) and 500 kg/ha(semi-commercial), vanilla cultivation ceases to beattractive, except when cultivated extensively by smallfermers.
(d) Pepper. At current prices, traditional production of blackPepper is not attractive (although green pepper calls forseparate review). Pepper production is labor intensive,requires constant care, and only lends itself to plantationoperations under the most favorable ecological price andlabor supply conditions. In general, the economic prospectsfor pepper production would appear discouraging.
Ce) Cocoa. The cost price for zocoa is difficult to establishbecause most plantations are managed by the chocolateprocessing industry and precise information on managementcosts is not available. However, it is estimated that atcurrent price levels the revenues cover the operating costs,and as such the plantations function as a security for thesupply of raw material for the industry. Cocoa cultivationseems to present positive opportunities for expansion,provided that the required agricultural services areobtainable.
3.41 These findings demonstrate the predicament of export cropproducers at the present time, and help to explain why for many crops thevolume of production and exports has been progressively declining.Production of coffee and pepper in particular is not economicallyattractive under current conditions, and for coffee a dramatic increase inproducer prices may be necessary to restore production growth. For smallfarmers, cloves and sugarcane are among the few traditional export crops

- 49 -
which are seemingly profitable. Vanilla is also an attractive cash crop;it fits well into the farmer's cropping calendar, is responsive to improvedhusbandry, and at higher yield levels is capable of providing asatisfactory financial return. Cocoa appears to offer some scope for farmincome growth, particularly under well-managed plantation conditions.Sisal production has been profitable as a commercial crop and the potentialfor revival and improved profitability for sisal requires detailed study.Coconut appears to be .the least developed but also one of the mosteconomically attractive crops for snallholders: it fits readily into thefarming system and provides a reasonable financial return. TheProfitability of other crops should also be investigated within theframework of an export crop rehabilitation and diversification programwhich woula examine production returns with output and input prices alignedto border level.
F. Scope for Crop Diversification
3.42 From an agronomic viewpoint, there are numerous possibilities forcrop diversification in Madagascar. The country's varied climaticconditions, land resources and soils have favored the growth of a widerange of tree crops, cereals, oilseeds and pulses, fiber crops, herbs andspices, exotic tropical fruits and plants. Some of these crops arecultivated mainly for the domestic market; others grow naturally in thewild, and researchers have not yet evaluated their agricultural andeconomic potential. Nor has any inventory been made of crop varieties, notpresently grown in the country, which thrive elsewhere in the tropics andcould be tested for their suitability to Madagascar. Various recentstudies, by the ITC, UNCTAD/GATT and others, have indicated a number ofdiversification possibilities. At this stage, pending a more systematicreview of agronomic factors and potential export constraints, comment islimited to some of the more promising options.
Perennial and Multi-Annual Crops
3.43 Coconut. Coastal fringes of the East Coast are well suited tococonut growing, and pilot plantations recently established in the Sambavaarea by the SocietE Sambava Voania have shown promising results. Coconutis also a typical smallholder crop, axid provisional estimates sbow thatcoconut is economically attractive for small farmers (see para. 3.43). Itgives a reasonable return per laborday, does not interfere with croppingcalendars, and can very well be grows in mixed cultivatiou and also in amixed cropping system with coffee, cocoa, pepper and vanilla. Althoughexpanded cultivation of coconut would necessarily be designed initially tosatisfy local demand for vegetable oils, development of copra and copracakeexports should be considered as a longer-term objective. The world marketfor copra is relatively stable and price prospects appear favorable.
3.44 Cashew. Cashew is a versatile tree crop: its nuts, oil, cake,shells, and rice are all marketable products. It is already wellestablished in the Mahajanga and Antslranana areas, and is grown in someother areas along the west coast. It needs very little labor, does not

- 50 -
poach on land required for other crops, and is potentially of greatimportance as a protective crop against erosion. From a total planted areaestimated at over 15,000 ha, ITC estimates suggest that annual productionamounts to about 50,000 tons of which about 600-1,00U tons of unshellednuts are presently exported (mainly to India). The international market ishighly competitive, but there would seem to be scope for Madagascar tocompete more aggressively in this crop sector.
3.45 Spices. In addition to cloves and vanilla, Madagascar produces avariety of spices (including cinnamon, nutmeg and giuger) for which thereis a steady world demand. At present there is no organized production forexport. Cinnamon grows wild in eastern and northern areas; exports havedwindled from 600 tons per annum in the early 1970s to a present level ofaround 100 tons. About 600 tons of ginger (as annual) are produced eachyear, but only small quantities are exported. Export trials of nutmeg havebeen made, but this crop too is grown and harvested mainly in the wild.Madagascsar's existing credentials as a major exporter of tropical spicescould be exploited more vigorously by organized cultivation and sale bycontract of these presently minor crops.
3.46 Fruits. Many tropical fruits, citrus and temperate fruits growwell in Madagascar. For some of the economically important fruits, such asbananas, the issue is crop rehabilitation rather than diversification.Bananas, once exported in significant quantities, are cultivated on about35,000 ha, mainly in east coast areas. Around 280,000 tons are producedannually, and since Malagasy production and marketing costs are now toohigh to compete in the world market, the crop is almost entirely consumedby the domestic market. Even a modest revival of banana exports wouldrequire highly organized plantation production, minimal yields of 40tons/ha, assured marketing and shipping services, and concentration ofproduction close to the port of exit. Of the other fruits, production andexport of lychees (20,000 tons and 300-500 tons per annum respectively)appears to be well organized and capable of further expansion.Possibilities for more efficient exploitation of mangoes, avocados andother exotic fruits as export crops require further careful study. Citrusfruits are a special case. Recent growth in citrus output may be primarilya result of tree maturity since the total planted area has not increased.New investment in citrus would require careful identification of areasoffering most scope for competitive export production. Certain temperatefruits might also be developed eventually for export, but systematic cropand market research would be a pre-requisite for identification of possiblevarieties, locations and marketing systems which might justify investment.
3.47 Tes. Cultivation of tea in Madagascar dates only from 1978 andis limited to about 500 ha located near Fianarantsoa. About 200 tons ofPekoe Fanning tea are produced annually for export, and the OperationTheicole de Sahambavy is providing extension support. At the present pilotscale tea production is not profitable. Local consumption is small, andexport growth would depend on finding and building up regular marketingchannels. Prospects for diversification into speciality teas for selectedmarkets could be explored if the pilot program can show that tea productioncould become economically self-sustaining.

- 51 -
Annual Crops
3.48 Root Crops. Cassava is by far the most important of the rootcrops, and is second only to rice as a foodcrop. Total production hasincreased by about 50Z since 1970, from about 1.2 million tons to over 1.7million tons in 1982. The importance of cassava from the export standpointrests in the relatively stable market for Madagascar's processed tapioca(over 1,000 tons per annum over the 1978-1982 period), and the attractiveand growing world markets for cassava meal and chips for the animal feedindustry. Cassava is basically a smallholder crop, and adapts well to lessfertile soils. It is widely grown throughout the country, particularly incentral and southern regions. Expansion and diversification of exportablecassava products appears both desirable and feasible, but this wouldrequire attention to all aspects of supply (including provision of improvedplanting material, upgrading of extension services, and establishment ofmultiplication centers for selected cultivars), collection and processing(machinery for processing dried cassava, improved plant design), exportmarketing and pricing.
3.49 Grains. In this crop group, maize appears to offer the mostinteresting possibility, for developmeat both as a fooderop and forexport. Maize is grown in many areas of Madagascar; traditionally in theProvinces of Flanarantsoa and Toliara, in various parts of the centralhighlands and in the north-east around Antsiranana. Recent trials ofimproved cultivation in the highlands around Lac Itasy and Antsirabe arereported to be particularly promising. Since the 1960s total annualProduction of maize bas fluctuated between 100,000 and 130,000 tons, andexport volumes show more extreme variations (between 200 and over 5,000tons per annum). Despite rising export prices, demand from neighboringIndian Ocean countries and Government policies favoring food production,maize has been a neglected crop. There has been no clear policy in MPARAfor maize development, research by FOFIFA on improved varieties has lagged,and there have been no explicit incentives for production or export. Thiscrop requires detailed iavestigation in the context of formulatingstrategies for achieving both food self-sufficiency and export growth_ Theresumption of rice exports is clearly only a long-term possibility, butprospects for wheat, sorghum and other grains which are at present onlymarginal crops should simultaneously be explored.
3.50 Oilseeds. Various studies are in progress on crops in this groupwhich might have export potential and should be reviewed on completion.Groundnuts, oilpalm, cottonseed and soya are all primarily of interest fordomestic markets. The oilseeds sector has performed particularly poorly inrecent years, supplies of key edible oils (such as groundnuts andcottonseed) have fallen, and the oilseed industry has been affected bynumerous problems stemming from official pricing and marketing policies.Among the lesser oilseeds, the possibilities of ricinus are at presentunexploited. This crop is cultivated mainly in small patches nearhomesteads in the drier areas of the south (about 1,000 ha in total) andpresent yields are low. Ricinus produces a high-value quality oil and isin good demand on world markets. Madagascar already exports 500-1,000 tonsper annum. This and other crops should be explored further beforeidentifying export growth prospects.

- 52 -
Other Crops
3.51 Several traditional crops, including fiber crops (such as sisal,paka and raffia), and pulses (butter beaus and other dry grains), call forrehabilitation rather than diversification and are not reviewed in detailhere. Development of other interesting long-term export possibilities,such as fresh vegetables and cut flowers, will require first and foremostGovernment incentives for private investment, organization of a marketingsystem and fundametal improvements to transport infrastructure. Existingstudies provide a starting-point for identifying the most promising cropsand markets, and can be supplemented and updated as the Government'sdevelopment plans for export agriculture mature.
G. Conclusions
3.52 Despite the favorable lands, soils and general climate conditionsfor tropical agriculture in Madagascar, the production of export crops,with few exceptions, has been in a depressed state for the past decade. Ineast coast areas cloves and, to a lesser extent, vanilla production haveprovided profitable opportunities for small farmers. Elsewhere, cocoa andsisal have also survived relatively well the combination of weather hazardsand economic difficulties which have generally disrupted agriculturalproduction in recent years. However, conditioas for major export cropssuch as coffee, black pepper and butter beans remain unfavorable. There isa high risk of coutinued stagnation or decline of coffee production inparticular unless a dynamic new strategy is adopted which can provideadequate price incentives and effective support services to small farmers.Current Government food strategies and passive neglect of the export cropsub-sector have generally encouraged the reversion of cash crop farmers toa semi-subsistence system. These trends must rapidly be reversed. Thesituation calls for new policies based on a fundamental reappraisal offarmers' objectives, cultivation and farm management practices, farmers'and needs for basic agricultural services, and comparative advantage.
Production Constraints
3.53 The most important farming constraints to be addressed inreviving export crop production include:
(a) inadequate producer price incentives, particularly forcoffee and pepper, resulting in unprofitable production, lowquality output, and progressive abandonment of these andother crops by small farmers;
(b) serious shortages of labor at times of peak demand,compelling farmers to assign priority to family foodsecurity, to reduce harvested prodtction of cash crops andto carry out only limited crop malatenance tasks at thesetimes;

- 53 -
(c) excessive post-harvest manual labor requirements and lowstandards of post-harvest technology, severely reducing thescope for economic small farm management;
(d) inadequate facilities for supply and irregular availabilityof farm inputs, impeding the realization of potential yieldsand encouraging inefficient planting and cultivationtechniques;
(e) weak extension services and lack of research support,preventing the application of urgently needed improvementsin crop quality and husbandry;
(f) insufficient supplies and lack of access to wage goods,reducing the incentives for cash crop production;
(g) weak and unreliable crop statistics, preventing systematicmeasurement and forecasting of crop output and yields; and
Ch) lack of farmer protection against agricultural risks.
Production Opportunities
3.54 If these basic constraints could be overcome, the loug-termprospects for increasing production of many export crops would be bright.In the short term, however, this is clearly an uphill task for most crops.Yields are almost universally low, and well below potential under theprevailing ecological conditions. Although is general policies whichaccentuate intensive cultivation and iscreased yields show the most promisefor production growth, the application of such policies should be highlyselective. Among the crops most in need of rehabilitation, coffee, cocoa,sisal and cassava have an established production base and should be high onthe list of priorities. Coconut and cashew are potentially the mostversatile of the crops capable of long-term development and should beconsidered for new investment. Maize, various fruit crops and spices alsooffer scope for early development, and should therefore be made a focus foradditional agronomic and economic research. Particular attention isrequired to regional and sub-regional agricultural plans which wouldprovide area and crop-specific targets for research and development ofexportable production. I: the short-term, however, an adequate fouadationmust be laid for long-term growth. This particularly involves overhauling
extension services and techniques, re-establishment of essentialiafrastructure and input supply services, creation of a viable system forcrop monitoring and forecasting, and a profound re-evaluation of currentpricing policies. For coffee, in particular, this is perhaps the highestpriority. In subsequent chapters of this review, the wider implications ofmarketing and pricing of coffee and the other major export crops will beexamined. Production prospects and plans should be carefully reviewedwithin this broader policy context.

- 54 -
IV. EXPORT CROP HARKETING
A. Crop Marketing Systems
Background
4.01 In 1960, the year of Madagascar's independence, marketing ofexport crops was undertaken entirely by the private sector. Cropcollection was mainly in the hands of immigrant entrepreneurs who employedMalagasy agents in the more remote plantation areas. Transportation washandled by private truckers. Crop processing, storage and export tradingactivities were dominated by the local subsidiaries of large French tradingcompanies. The first commodity price stabilization funds had beenestablished for cloves (1958) and pepper (1959) to provide guaranteedprices to producers and exporters and to support crop development fromexport profits. Legislation governing trade in agricultural crops derivedfrom a decree passed under the colonial administration in 1943.
4.02 In the years immediately following independence the existingsystem was further developed. Price stabilization funds were establishedby presidential decree for coffee and vanilla (1961), and later for cassavaand cotton (1962). New statutes were approved in 1963 which modified thestatus and functions of the clove and pepper stabilization funds andcreated a similar bureau of marketing and price stabilization forgroundnuts. In 1969 another stabilization fund was set up for sugar. Alleight of these commodity price stabilization institutions still function onthe basis of the respective statutes approved during the 1960s. Forvanilla, a professional trade association of planters, processors andexporters was set up iu 1966 to regulate trade flows and standards incollaboration with the vanilla price stabilization fund. In the coffeesub-sector domestic trading practices were adjusted duriag the 1960s inline with international quota arrangements set up under the ICA. Gradingnorms and export quality standards for coffee were established by a decreein 1965. Purchasing quotas for coffee exporters were determined byinformal agreement between the various trading companies, and calculatedeach year in accordance with their relative shares of export volume in theprevious year. For all commodities covered by price stabilization funds anannual price structure ("differentiel") was established which fixedguaranteed minimum prices to producers, guaranteed FOB prices to exportersand intervening margins. Producers were assured of a regular market and abasic return oa labor. In practice, crop purchase payments to plantersrarely exceeded the official minimum price even though the margins receivedby collectors during the 1960s were probably more than adequate to covercollection costs. Farm output of cash crops was frequently bartered foressential foods and other household,goods. In such transactions,enterprising and well informed collectors and agents were able to exploitthe weak and dependent position of the small farmers. Such abuse ofproducers by prosperous commodity traders was considered to be widespreadin the export crop areas and helped to inspire the profound changes in thecrop marketing system which took place during the 1970s.

- 55 -
4.03 Over the past decade several legislative measures were introducedwhich have greatly increased government involvement in the marketingsystem. Under presidential order No. 73/054 dated September 11, 1973, acomprehensive reform of domestic trade and prices was initiated whichofficially brought all trade in agricultural coomodities under publiccontrol. Following constitutional changes in 1975 which called fornationalization of the main productive enterprises, the four principalFrench-owned trading companies engaged in processing and export of coffeeand cloves were nationalised and renamed (SCMACODIS, ROSO, COROI andSICE). Presidential decrees issued in 1976 and '977 introduced a furthertypological distinction between enterprises engaged in this trade. Privatecompanies were restricted to the role of -conditionneur/stockeur-, whichconfined their coffee, clovei and black pepper business to processing andstorage and eliminated their previous export rights. For thesecommodities, the assignment of functions as an opErateur/chargeur' wasrestricted to the four parastatal enterprises, in effect granting thesecompanies exclusive rights as export agents and loaders on behalf of theGovernment. Although competition between private and public enterpriseswas retained at the level of both primary and secondary marketing, pricingand marketing advantages were weighted in favor of the public sector. Overthe decade the role of the private sector has been progressivelydiminished, and its operations severely circumscribed. Through its variousagencies, the Government has established an official monopol.y over trade incoffee, cloves and black pepper, and exerts a broad range of administrativeand financial controls over trade in vanilla and other agricultural exportcommodities.
Current Marketing System
4.04 The internal organization of marketing is broadly similar forcoffee, cloves, vanilla and pepper and is shown in Chart 1. The cropproduction, processing and marketing calendar, which varies between crops,is shown in Chart 2. The official price structures (differentiels) forthese crops, which indicate intermediary charges and margins, are given inTables 35-38. The main steps in the marketing process from farmgate toshipment, the roles of each intermediary and their sources of payment, andany significant variations between major crops are outlined below.
4.05 Collection. Primary marketing is organized at the level of thefokontany (group of villages) and guaranteed producer prices are set attlis ileveJ. Under the official system one buying point is established ineach fokontany. Marketing transactions are conducted at buying points,which in principle are held once a week throughout the crop marketingseason. These transactions usually involve three parties:producer-sellers, collector-buyers, and the representatives of the localfokontany appointed to supervise-the ma-rket process. Field agent employees(agents de pre-conditionnement) of the Price Stabilization Funds and otherobservers may also be present. Producers are obliged to transport theircrops to the buying point, which by law must be accessible to motorvehicles. They are alerted in advance to the guaranteed producer price,which is supposed to be announced at the start of each marketing season,publicised in official bulletins, information media and by word-of-mouthand posted in public at the fokontany offices. The crop buyers

56 -
(collecteurs) may include some private entrepreneurs, either itineranttradesmen or rural shopkeepers. However, the majority are. ath rd-zedagents of the processing/storage companies (conditionneurs/stockeurs),public and private, who handle secondary marketing on behalf of theGoverament. Crop buyers must carry a licence issued at the level of the
faritanV (equivalent to former provinces), must agree to purchase at theofficial price, and must respect officially established norms for productquality at point of purchase. In the presence of the fokontanyrepresentative, the farmer's crop is weighed, inspected and exchanged. Theproducer is paid on site by the buyer in accordance with the officialprice, plus (for coffee) any entitlement to the pre-sort.nag bonus which isallowed under the price structure. To pay producers, individual buyers mayhave drawn on crop credit furnished by one of three aational banks: BTM,BFV, and BNI. Authorized agents are normally pre-financed by theirrespective processing/storage company through these banks. Buyers at theprimary stage are responsible for payment of the fixed fee allocated underthe price structure to cover the supervisory and facilitating servicesprovided by the fokontany. Under current law buyers whose crop purchasesexceed FMg 10 million (approximately US$25,000) are subject to payment of asales tax, the T.U.T. (taxe unitaire de transaction).
4.06 Transport. Transportation from the buying point to the portpremises of the processing/storage companies is handled in several ways,according to crop and location. Transport of black pepper is theresponsibility of the primary buyer, the collect,r; green pepper, whichmust arrive at the processing plant within 48 hours of harvesting, isnormally transported directly by the grower. For coffee and cloves, the
allowance included for transport expenses under the price structure istheoretically payable to the collector with whom the processing/storagecompanies agree on the price for delivery; in practice transportation frommarket to port may sometimes be handled by the processing/storagecompanies themselves. According to crop and growing area, transportationmay be by road, rail, barge, canoe or coastal vessel and commonly requiressome combination of these transport media.
4.07 Processing and storage. The processing/storage companles areinstalled in the principal ports of Madagascar, and inclule both public andprivate businesses (see para 4.17). The parastatals handle roughly 80% oftrade volume for coffee and cloves; the remaining 20%, and almost allpreparation of vanilla for export, is handled by private enterprises. Forcrops covered by Government export monopoly (coffee, cloves, vanilla, blackpepper), the main functions of these companies are to assemble, prepare,process, pack and store the crops according to prescribed standards forexport. Responsibility for quality and stock control rests with thecompany. The level of remuneration for each activity, including allowancesfor losses during processing, is fixed in the annual price structure foreach crop. Once ready for export, product inspection is carried out byagents of the Government's quality control and certification service. Ifapproved as conforming to prescribed standards, a certificate is issued bythe inspecting agent which is valid for 60 (coffee) or 90 (cloves) days.At this stage, ownership of the produce is technically transferred bycontract ("contrat-caisse) to the commodity price stabilization fund

- 57 -
concerned. The contract may cover lots of varying size for coffee from oneto seven lots of 24 tons each), and should normally be jointly signed byrepresentatives of the fund, the company and the company's banker. Thecontract is registered at the port by a product committee, comprising allpartners to the export process, which serves as the local liaison unit forthe stabilization fund. Contracts are sent to the fund headquarters inAntanasarivo, to whom the product committee also sends weekly censusreports on the product quantities processed, stored, authorized for exportand actually exported. Physical ownership of the product neverthelessremains with the processing/storage company concerned until export isauthorized. Storage indemnities specified in the price structure arepayable to the company with effect from the day following counter-signingof the contract at fund headquarters.
4.08 Export sale. For the fully controlled commodities (coffee,cloves and black pepper), the next steps in the process of export sale andshipment are initiated by the Ministry of Commerce. Although the pricestabilization funds have the statutory power to negotiate sales contractswith foreign buyers and develop overseas markets, since 1975 thesefunctions have been assumed by the Ministry for all products covered bygovernment export moaopoly. On receipt of an offer to purchase, theMinistry's Department of Foreign Trade determines a proposed export pricein the light of overall import demand, world market prices, guaranteed FOBprice levels fixed by the price structure, quota obligations, trade policyand other factors. For certain commodities (e.g. coffee, black pepper) anannual sales plan is prepared at the start of each campaign, and quotas areallocated by country. For coffee and vanilla multi-year sales contractsmay be agreed with foreign buyers, subject to annual revision. Salesoffers received directly by public and private companies for controlledcommodities are channelled to the Ministry for review and decision; forother products, such as green pepper and cocoa, the processing/storagecompanies can deal directly with importers. Upon signature of a salescontract, the MInistry informs the price stabilization fund concerned. Thefund decides which of the four parastatal agencies (SORACODIS, ROSO, COROIand SICE) designated as operator/loaders should handle the export shipmeut,identifies the port of export and destination, and confirms the quantity tobe despatched. (For vanilla, however, most authorized shipments are madeby air freight). Authorisation to export is sent by letter (or, if urgent,by cable) to the product committee at the port, with copies to the selectedparastatal export agent and the chief or the faritany concerned. Theproduct committee notifies the processing/storage company holding thestocks for shipment. This, if a private company, in turn arranges forphysical transfer of stocks to the authorised parastatal agency andnotifies the stabilization fund. The processing/storage company, if otherthan the receiviag parastatal, is at this stage entitled to invoice theparastatal agency for all processing, storage and transport charges andindemnities sustained for the consignment, in accordance with margins citedin the differentiel. After approval by the stabilization fund concerned,the authorised parastatal export agency makes the appropriate payment.

- 58 -
4.09 Shipment. The parastatal agency verifies that the goods receivedconform to quality certification, initiates customs formalities andcompletes a declaration to repatriate payments received in foreignexchange. The goods are transferred to customs control at the dockside,and documents are consigned to the forwarding agent ('transitaire')handling the shipment. Loading charges are aormally paid by the parastatalexport agency, but the forwarding agency may be liable to additional porthandling and customs storage charges at certain periods. All Madagascar'sexport prices for monopoly crops are quoted on an FOB basis, and theparastatal export agency's responsibility for shipment therefore ends atthe port. Any difference between the actual export price and theguaranteed FOB export price is documented in the parastatal export agency'sinvoice to the stabilization fund concerned. Excess receipts over theguaranteed export price are credited to the fund through a special accountsupervised by the fund's treasurer. Operational costs sustained by theparastatal export agencies are chargeable to the stabilization fund inaccordance with items listed in the price structure. However, since thepresent system was established in 1978 these agencies have been granted anadditional margin, to cover structural costs and provide incentives forcrop collection, amounting to 10% of the actual export price. Therationale for this provision, and its effects, are examined in greaterdetail elsewhere in this chapter.
B. Status of Marketing Operations
4.10 The general procedure outlined above highlights the need forclosely interlocking flows of goods, funds and services within the existingmarketing system for export crops. This system has evolved from successiveGovernment interventions during the 1970s to regulate traditional marketingpractices and to bring the export of key crops under closer Governmentcontrol. In practice, the system functions poorly and in many respects isclose to breakdown. Severe economic and financial difficulties in recentyears have placed a heavy strain on the system, and its administrativecomplexity has made it close to unmanageable. Operational problems havebecGme widespread at each stage of the marketing process. The most evidentproblems, their probable causes and apparent effects, are reviewed below.
Problems of Crop Collection
4.11 Marketing incentives. The rural environment for production andmarketing of cash crops for export has steadily deteriorated. Incentivesto farmers are conspicuously lacking. For coffee, the major cash crop,producer prices relative to rice, the main staple, have declinedcontinuously for over 30 years and especially during the past decade.Whereas in 1950 the coffee price per kilo was five times that of rice, in1983 the official guaranteed price for coffee, 280 FMg/kg, was merelydouble the Afixed price for imported ordinary rice (140 FMgIkg). (Commodityprice issues are reviewed in greater detail in Chapter V). Given thedifferences in labor costs, many smallholders have neglected their coffeeplantations and shifted to cultivation of rice, cassava, other foodcrops

- 59 -
or alternative cash crops, especially cloves. Among those who do harvesttheir coffee for marketing, other factors affect decisions on where, whenand how to sell. Many smallholders are tied by mutual interest and customto local shopkeepers, and still prefer to barter their crops for essentialgoods or credit. On-farm transport on average accounts for up to 30Z offarm investment costs. To avoid additional transport costs to the officialfaritany buying point, not uncommonly planters prefer to sell their cropson-site to clandestine collectors even below official minimum prices.
4.12 Product quality. Standards of post-harvest preparation andstorage of crops are generally low in Madagascar, and the price structuresfor most controlled export crops do not provide for payment of qualitypremiums to producers. For coffee, the sole exception, a token margin of 5FMg/kg is allowed to producers for pre-sorting but is commonly absorbed bythe collector. MPARA extension agents have had little or no impact onquality standards. The technical field agents employed by the Coffee PriceStabilization Fund to inspect the quality of marketed produce are few innumber (about 60 covering the entire export crop zone), poorly paid (about25,000 FMg/month), insufficiently trained and reputedly lax. Prevailingprice incentives for collectors and parastatal processing/storage companiesto maximize quantities purchased have exacerbated the quality problem, withserious repercussions throughout the marketing chain. Ministry servicesreport that of the coffee and cloves inspected and rejected at inspectionprior to export, on average four-fifths of the defects are traceable topoor control at the collection stage. The major problems include.harvesting before crop maturity, poor sorting and inadequate drying. Theconsequences include higher processing and re-processing costs to reducehumidity and product defects, an increased proportion of lower-gradeproduct for export, a growing reputation for undependable export qualityand, in some instances, loss of export markets.
4.13 Collector behavior. There are no reliable data on the numbers ofcrop collectors and their trading practices, but various problems have beenreported. Collectors' licences are readily obtainable from the issuingauthorities, and in practice most are free agents. Those engaged byprocessing companies are obliged to sign semi-contractual letters ofagreement, but these serve mainly to safeguard monetary advances made bythe companies. Authorized agents are not obliged to deliver specificquantities or qualities to a single processor: some are said to use thecompanies' advances mainly to finance their own trading inventory. Thecurrent collection system, rather than eradicating farmer exploitation bytraders, has tended to foster distortions and inequities in commercialpractice. Among those working through the official system, coffee andclove collectors engaged by the parastatal processing companies benefitfrom especially favorable terms. The lOX margin on the realized FOB exportprice granted to these companies allows them to pay a higher margin('surench4re') to collectors than their private competitors, and to offeran additional premium to farmers. In the most accessible areas wherecompetition among collectors is intense, farmers may gain a higher retururegardless of quality. In the more remote areas, the mitimum guaranteedprice to farmers in effect becomes the maximum price obtainable, and some

- 60 -
farmers in practice receive less than the floor price. The leastscrupulous of the itinerant traders operating in such areas are reported tomake high profits and, given the ineffectiveness of official controls, atrelatively low risk. Examples were reported at the National CoffeeSymposium in May 1983 of various widespread illicit practices among certain
agents, including product adulteration, clandestine sales and taxavoidance.
4.14 Market organisation. The process of institutionaldecentralization initiated after 1972 included the formation of economiccommittees ("vatoeka") at fokontany level. Organization of local marketsfor crop collection became a major responsibility of the vatoeka. Inpractice this organization worked poorly, was unpopular with farmers andhas since been abandosed. Official markets now rarely take place; wherethey survive they appear to be subject to inaumerable bureaucraticcontrols, interventions and manipulations. (As an example, one observerreported in 1982 that market transactions for groundauts is the fivoadronanof Anjozorobe took place under the controlling authority of the fivondronanchief, the mayor, deputies, chefs de quartiers, gendarmes, ruralcounsellors and agricultural extension ageuts). Farmers' resentment ofthese multiple controls and associated exploitation is believed to haveaccelerated the revival of traditional marketing processes outside theofficial system.
Problems of Internal Transport
4.15 The evacuation of export crops from production zones is gravelyhandicapped by the country's ianaequate, ageing and deteriorating roadinfrastructure. Many areas of smallholder production remain almostinaccessible, cut off by mountains and rivers and remote from main highwaysin normal times and further isolated by seasonal flooding of access tracksand feeder roads. In other areas bridges have collapsed or been renderedimpassable by cyclone damage and structural deterioration. (In theMananjary region, the only outlet open to some coffee growers was to sendtheir crop down river by canoe.) An almost total lack of road maintenancein recent years has slowed some truck journeys to a crawl and causedwidespread delays to crop deliveries. (One coffee processor in Toamasinaclaims that the journey along the coastal highway to Maroansetra which in1951 took one day now normally takes four.) Deterioration of road surfaceshas caused abnormal damage to vehicles and has led some processing/storagecompanies to ban their drivers from using many rural roads. Lack of spareparts has sharply reduced some vehicle fleets; lack of fuel has immobilisedothers for long periods.
4.16 The severe problems of road transport have had multiple effects.Crops harvested in some isolated areas (e.g. Ifanadriana and Nosy Varikafivondronana) have remained uncollected. It has been reported thatfollowing the 1981/82 marketing campaign 10,000-20,000 ton of coffee werestill held in rural enclaves awaiting transportation, 12-18 months afterharvesting. In some growing areas no longer served by itinerant

- 61 -
traders, cash-starved coffee planters are virtually compelled by neglect torevert to a subsistence economy. In other areas, where trade controls areineffective, coffee bought on site in the plantations by mobile traders haseventually found its way unofficially into the domestic market or abroad.(One study carried out In 1980 estimated that 5,000 tons of coffee werespirited away to overseas buyers, uncontrolled by either Government qualityinspectors or the parastatal processing companies.) The duration of thecoffee marketing campaign has become progressively longer as transportservices and equipment have deteriorated. (In 1980 it was estimated thatthe normal 4-month campaign had become extended to 7-8 months. In May1983, 6 weeks before the start of the 1983/84 campaign, it was reportedthat more than one-third of the 1982/83 harvest had still not beencollected. The 1983/84 campaign, however, is said to have been completedmuch more rapidly.) Real transport costs have increased sharply. In mostyears these costs have only been partially compensated by annualadjustments in the price structure, thereby dissuading collectors andprocessing companies from penetrating unremunerative areas. Maintenance ofsecondary and local roads is the responsibility of the respectivefokonolona institutions, but margins received by these authorities underthe differeatiels for export crops have rarely been used for this purpose.An allocation of FMg 5 billion FMg ia 1980/81 by the Caisse CAVAGI for roadconstruction and rehabilitation in export crop areas was allegedlyappropriated to fokonolona institutions but without result. Important cropareas served by rail (in the vicisities of Toamasina and Manakara) areseriously affected by inadequate freight capacity, congestion at the portrailheads, and unreliable services.
Problems of Processing and Storage
4.17 The majority of the processing/storage companies arewell-established businesses trading in a range of commodities for theexport and domestic markets. For coffee, the four parastatal companiesconcerned (SOMACODIS, ROSO, COKUI and SICE) currently handle almost equalone-quarter shares of the 80% of trade through the public sector; privatecompanies (including DAFMAD, DESLANDRES, DUBOSC, FRAISE and RAMAEXPORT)handle the remaining 20% of the trade. (Roasting of coffee for thesizeable domestic market is carried out by a dozen or so private companieslocated mainly in Antanananarivo.) To varying degrees these sameparastatal and private companies also deal in cloves; distillation of cloveoils is more widely diffused, and is handled primarily by a number ofsmaller private enterprises but only by COROI among the parastatals.Commercialisation of black pepper is limited to the parastatal enterprises;processing, conservation and export of green pepper is handled byspecialized private enterprises (principally CODAL). Preparation andexport of vanilla is undertaken exclusively by the private sector, apartfrom minor quantities handled by ROSO; the main companies include TATIENNE,SAKICA, LO MONE, LO PAT, RAMAEXPORT, SOMACONORD and FRAISE, with processingfactories located mainly in Antalaha and Sambava. Commercialisation andprocessing of other export commodities is spread among eaterprises in bothpublic and private sectors.

- 62 -
4.18 For most commodities, particularly the larger volume crops(coffee and cloves), installed processing capacity is considerablyunderutilized due to stagnating crop production and the severe problems ofcollection. For example, annual throughput of coffee in COROI's fourfactories averages 10,000 tons, under 50X of total potential capacity(21,400 tons). Because Government policy and profit incentives favor theparastatals, under-utilization of installed capacity is even morepronounced in the private sector. Storage capacity is normally adequate inmost locations, but in some years poses major problems for specificcommodities. Abnormally high stocks of cloves in 1983 have filled existingstorage depots and, because of the powerful and residual clove aroma,temporary conversion of other depots to house the excess stocks restrictstheir future use for other purposes. Most processing companies have beenseverely affected since 1979 by the constraints imposed on imports ofequipment and spare parts. The profitability of processing operations inthe private sector has steadily declined since the early 1970s as a resultof the rigidity of the differentiels, inadequate annual adjustments tocover rising collection, transport and processing costs and excessivedelays in settlement of storage indemnities.
4.19 The most fundamental problem in the processing sector isstructural. Successive Government interventions since the early 1970s haveseverely distorted the pattern of trading operations among theagro-industrial companies producing for export. Nationalisation of thefour major foreign-owned enterprises in 1978 was accompanied by geographicand commodity reorientation of these businesses in order to promotenational distribution of essential goods at subsidised prices for thedomestic market. To cover the operating losses incurred in augmenting theinternal coverage of their respective distribution networks, SOMACODIS,ROSO, COROI and SICE were made beneficiaries of a lOX margin on therealized FOB export prices for coffee and cloves. This margin is nominallyearned by administering export shipment operations for these commodities onbehalf of the stabilization funds. In practice it is a direct subsidy tothe four parastatals, amounting in 1982, for example, to an estimated FMG8.5 billion, or approximately US$24.6 million at average 1982 rates ofexchange 1345 FMg - $1]. Competition between the four parastatals tomaximize their share of the supplementary margin of lOX has become the maindriving force in export crop marketing operations. It has squeezed theprivate processing companies into a secondary, relatively marginal role,and by increasing the commission of the trading intermediaries hasartificially depressed producer prices. Among the four parastatals,assured coffee and clove export profits serve not only to cover the costsof domestic distribution of basic essentials but also as a form of internalsubsidy for their export crop operations. Although these collection,transport, processing, storage and despatch functions are routinelyrecompensed under the respective items in the differentiels, the actualcosts and relative profitability of each activity is not easilyidentified. Separate cost accounting for each commodity is not practiced,and commercial personnel within the companies work interchangeably onexport and domestic trade activities. In the absence of detailed studies

- 63 -
on operating costs for each commodity, it is assumed that the lOZ"commission chef de file" provides a permanent subsidy to the parastatalswhich masiks both inefficiencies in marketing and processing and financiallosses resulting from low productivity of their operations. (This problemis addressed further in Chapter V).
Problems of Export Administration
4.20 The effective monopoly exerted by the Ministry of Commerce overexport negotiations and administration has placed a heavy burden on themarketing system and weakened the capacity of associated institutions andindustries to fulfil their potential export roles. Export policy is guidedby short-term needs for foreign exchange, and lacks clear strategicobjectives for development of export markets and sales. Export and pricingdecisions have usually been taken by a few senior officials behind closeddoors. Support staff in the Ministry have very limited commercial trainingand are ill-equipped to analyse market trends and opportunities. Researchand information facilities are insufficient to provide adequate data forcommercial decision-making. Overseas representation is limited to contactoffices in Milan and Singapore and commercial counsellors at Malagasyembassies in major importing countries. Routine communications from thesesources on market and price movements are slow, infrequent and inadequate.Telex facilities had still not been installed in the Ministry by March1984, and an information center, proposed for financing in 1983 by theInternational Trade Center, is not yet equipped or staffed. Such marketinformation as is received is not systematically passed on to exporters.Sales opportunities identified by processing/storage companies aresometimes rejected, ignored, or lost as a result of bureaucratic anddecision-making bottlenecks.
4.21 The price stabilization funds, contrary to their governingstatutes, have steadily abandoned their primary responsibilities toproducers and conceded their powers of authority to the Ministry. Inpractice they have become largely an administrative instrument for theexecution of Government commercial policy. Even in this role the funds arepoorly equipped for marketing organization and management. They have fewcommercially trained staff. Field agents responsible for surveying cropquantities and qualities marketed spend much of their time in offices andtheir crop reporting is unreliable. For stock control at the ports, funddirectors depend on reports issued by the product committees which notinfrequently arrive late and incomplete. Fund decisions on the allocationof export consignments are based on only second-hand knowledge of thelogistics involved (condition and exact location of stocks, customs storagecapacity and port handling prospects). Communications by letter and cableauthorizing exportation are not systematically numbered and referenced; notuncommonly they arrive late or are lost. Public and private sectorcompanies are not accorded equal treatment. Regardless of respective stocklevels, the parastatals are generally given priority. (Since productcommittees at the ports are chaired in turn by the respective parastatalsthey are well placed to ensure this.) Moreover, the cumbersome procedureof re-assigning stocks to the selected parastatal export agent abnormally

- 64 -
slows reimbursement of the private companies. Examples have been reportedof delays of 8-12 months in processing payments due to private exporters onexport consignments.
4.22 Control and inspection of products prior to export has become amajor problem. To perform these functions, the product conditioning andcontrol service (recently switched from MPARA to MC) maintains a permanentstaff of about 80 technical agents and controllers, located in all portsand provincial centers. Prior to export these agents must verify, for allproducts, their conformity to minimum standards prescribed under nationallegislation. For many crops (including coffee, cloves and vanilla), thesereflect established international standards, and most importers expectrigid adherence to these norms. In Madagascar, which has a coastline of5,000 km and 22 official exit points, ensuring control and compliance is anexacting task in normal times. Over recent years it has becomeprogressively more difficult. Government-operated quality controlinstallations at Toamasina, Maroansetra, Sambava and Antalaha are rundownand poorly equipped: no equipment has been replaced or added since the1960s. Humidimeters required for coffee analysis date from 1968: about 40%are currently unusable and of the remainder many are under repair orinaccurate, posing risks of false evaluation. Various routine analyses canbe performed only if equipment and chemical supplies are obtainable fromthe processing companies. Some analysts urgently need specializedtechnical training. Despite these weaknesses in the control system, in thefirst six months of 1983 up to 8.1% of coffee, 9.0% of black pepper and4.7% of cloves analysed by Government quality control agents failed to passcertification standards at first inspection. In the second half of 1983,as a result of deteriorating quality in storage, approximately 11,000 tonsof cloves had to be re-conditioned to pass export standards; about 10% ofthe 1982/83 crop was classified as unexportable. Even after re-processing(at considerable added cost to the processor), in average years 1% ofcoffee fails to meet exportable standard specifications. Little attempt ismade by the authorities to enforce legal sanctions on negligentprocessors. Many consignments certified for export at best meet theminimum prescribed standards at the time of inspection; in the normallyhumid climate of Madagascar's ports subsequent deterioration to belowprescribed norms is not uncommon.
Problems of Shipment
4.23 The export marketing process is ultimately dependent onconditions for physical handling of freight at the port of exit. In thisrespect Madagascar's current situation is well nigh disastrous. Until theearly 1970s the east coast export crop zone was well served by its mainport Toamasina, and five or six thriving secondary ports. As tradestagnated 'n the later 1970s, all have fallen into a state of rapiddecline. Long-distance shipments from the secondary ports have virtuallyceased since 1980 and they survive mainly on coastal trade to Toamasinawhich is both costly and inefficient. Coastal vessels spend 80-90% of theyear lying idle in the ports. Harbour and storage facilities havedeteriorated rapidly through lack of maintenance. Storage and handling

- 65 -
procedures are poorly organized and turnaround times are slow. Forexample, sacks of coffee moving to Toamasina from Antalaha, which has noquay, have to be carried manually to the harbour bar, loaded into bargesand subsequently re-loaded into the coastal vessels.
4.24 The decline of the secondary ports has multiplied the problems inToamasina. Transhipments from coastal vessels to long-distance carriersare exceptionally slow and badly organized. Dockside warehouses inToamasina are normally jammed to capacity, causing a constant back-up ofstocks authorized for export in the processors' warehouses, which ia turnfrequently become overloaded. Lack of loading equipment (tractors,fork-lift trucks, pallettes, containers) in the port is a severebottleneck. Forwarding agents frequently have to rent equipment at theirown expense to assist the port authority. Coffee loading is now mainlycoatainerized, but handling rates are abnormally slow by internationalstandards (on average 0.2 containers per man/hour in Toamasina, comparedwith rates of 8.5 obtained in West African ports and 17.0 in ports ofsouth-east Asia). Most loading for other crops is done manually, carton bycarton. There are cossiderable problems of theft from warehouses and thedockside, which some observers estimate at 1-2X of total stocks. Mostvanilla is exported by air from Antananarivo, but Air Madagascar holdsexclusive rights for air freight of domestic produce and its currenttraffic handling capacity is inadequate to cope with demand at peak traffictimes.
4.25 Inefficiency in freight handling at the ports directly affectstue tariff rates for maritime freight from Madagascar established underinternational agreements and forces down the FOB prices acceptable toimporters. For round-trip voyages between Europe and Madagascar the mainshipping lines estimate 90 days, of which 50 are spent at sea and 40 inport. In September 1983 freight charges were approximately 32.5 FMg/kgfrom Toamasisa to Le Havre and 40 FMg/kg to the North Sea ports (fromsecondary ports the rates were 44.5 FMg/kg and 52 FMg/kg, respectively).By comparison shipping rates from Douala (Cameroon) to these destinationswere only 25.5 FMg/kg and 28 FMg/kg, respectively: because of thesedifferences FOB prices from Toamasina were 10 FMg/kg lower than those fromDouala. Although Madagascar is said to be handicapped by its long distancefrom main export markets, low productivity in the ports is the main causeof relatively high maritime freight charges. The direct financial risks ofexport delays are assumed by importers, but Madagascar's foreign tradesuffers in other ways, through loss of confidence among clients and loss oftrade revenues.
Export Marketing Services
4.26 The transfer of marketing authority for major crops to the publicsector during the 1970s was not supported by a transfer of marketingtechnology, services and management skills. Parastatal trading enterpriseshave had difficulty in finding, training and retaining suitable commercialmanagers, and basic market information, research and promotion skills andservices have still to be developed. In this area of export sales

- 66 -
promotion Madagascar is clearly at a disadvantage compared with such majortrade competitors as Brazil and Indonesia. Occasional financialcontributions have been made to export promotion campaigns in EEC countries(mainly France) for a few products such as vanilla and tapioca, and privatesector efforts to promote Madagascar's green pepper have made someprogress. In general, external trade promotion activities have beenminimal, although ICT has lately provided some technical assistance inthese areas. Internally, the aecessary infrastructure for market analysis,marketing management and product promotion barely exists. As in theagricultural production sector, basic statistics - on markets, distributionchannels, products aid prices - are poorly prepared, unreliable andtherefore little used. Needed efforts to improve the marketing skills andperformance of Malagasy agencies and operatisg companies can oily be fullyproductive when their basic tools - information, statistics and researchservices - have been upgraded.
C. Conclusions
4.27 The strategic importance of export crops to the national economyobliges the Goverment to maximize the flow of goods from rural producersto ultimate overseas consumers at least cost. Only by the operation of anefficient marketing system for these crops can Madagascar expect to be ableto maintain and expand its share of world trade and thus increase itsexport revenues. Demonstrably the marketing system currently in place isinadequate for achieving these goals, and corrective action is urgentlyneeded. This will require a thorough review of marketing structure andoperations in each of the key commndity sectors, with the coffee industryas the highest priority. Analysis of costs, benefits and options forre-structuring activities should be examined at each stage of the marketingchain.
Marketing Constraints
4.28 Although the information available at this stage is sketchy andincomplete on many aspects of marketing in general and of the marketingissues affecting specific commodities, the following would appear to beamong the major current constraints:
(a) lack of a coherent strategy for marketing management anddevelopment;
(b) inadequate iacentives and organization for rural marketingat the primary level, resulting in low quantities andqualities of produce available for secondary processingand marketing;
(c) highly inadequate and deteriorating surface transportinfrastructure for the movement of goods from cropproduction zones to the ports;
(d) inefficient use of public and private sector resources forcrop collection, processing, storage and shipment of goodsfor export;

- 67 -
(e) seriously defic'ent facilities and services at the portsfor handling export shipments, and inadequate mechanismsfor management and control of export stocks;
(f) structural distortions in the marketing and pricingsystems for coffee and cloves, resulting in high marketingcosts in the public sector, inequitable trading conditionsfor competition between public and private enterprises andinadequate mobilization of private sector resources forexport,
(g) a miscellany of unproductive and ineffectiveadministrative controls on export crop marketingoperations, resulting in organizational bottlenecks(especially in control of fluctuating stocks), finaecingdifficulties, and a general slowdown of marketiagprocesses; and
'h) low standards, poor facilities and weak mechanisms forquality control and certificatiou of produce for export,with consequent deleterious effects on export revenues andmarkets.
Marketing Opportunities
4.29 Action to overcome the above constraints would enable Madagascarto strengthen cossiderably its competitive position in world export marketsfor the major commodities. In circumstances which otherwise promise atbest only slow growth of export volumes and slackening of prices over themedium term, achieving savings through reduction of marketing costs offerspossibly the greatest scope for Improving the profitability of agriculturalexports. Moreover, action to streamline internal marketing operations andimprove efficiency is essential (particularly for coffee and cloves, inview of the current high level of stocks) if measures to stimulateincreased production are to be effective. Improvements in marketing willdepend as much on upgrading humAn resource skills as on facilities andprocedures. At all levels, Malagasy traders show considerableentrepreneurial talent. This talent could be further developed by theprovision of adequate incentives, by reducing trade controls, and byimproving essential services. In parastatal marketing enterprises andagencies, basic commercial skills could be strengthened by improvements inanalysis, planning and management capabilities. Existing infrastructurefor crop collection and processing provides a sound basis for furtherdevelopment provided that pricing anomalies are removed and strictereconomic criteria are applied. Although the seeded improvements in roadinfrastructure and cargo handling would require considerable capitalexpenditures, action to overcome other marketing constraints initiallywould require mainly adjustments is trading and pricing policies andorganization. These elements are reviewed further in the followingChapters V and VI.

- 68 -
V. PRICING AND PRICE STABILIZATION
A. Price Administration System
5.01 The system of administered pricing of export crops has been inplace in Madagascar siace independence. Its salient features, which haveremained unchanged under successive Governments, include:
(a) officially guaranteed minimum prices to producers, adjustedannually at the start of each crop year;
(b) officially guaranteed minimum FOB export prices for coffee,cloves and pepper (but not for vanilla);
(c) fixed margins for all items of expenditure incurred inmoving crops from farm to port, in accordance with theannual price structure (the 'differeatiel") formulated byGovernmeat for each commodity; and
(d) operation of a separate price stabilization scheme for eachcommodity, to maintain support prices to farmers and counterannual fluctuations in world market prices.
5.02 The central authorities responsible for administration of thesystem are the price stabilization funds, comprising:
- the Coffee Price Stabilization Fund, established by Dec=eeof June 21, 1961;
- the Vanilla Price Stabilization Fund, established by Decreeof March 8, 1961,
- the Clove Marketing and Stabilization Board, established byDecree of March 6, 1963;
- the Pepper Marketing and Stabilization Board, established byDecree of September 19, 1963.
Other Funds or Boards operate for cotton, cassava, sugarcane andgrousdauts. For management purposes, they are orga-ized into two groups:one (CAVAGI) for the Coffee, Vanilla and Clove Marketing and StabilizatiosFuads and Boards, and one for the Cassava and Cotton Funds and the Pepperand Groundnut Boards. (The Sugarcane Fuad is a separate entity.)
5.03 The general principles of the system and modalities adopted insetting prices are common to all the price stabilization funds. However,the timing of annual price adjustments varies between commodities, inaccordance with differences between crop cycles and associated differencesin the fiscal year of each organization, namply:

- 69 -
_Offe Cloves VallIa ppe
Escal year: jay 1-June 30 O(t 1-Sep*30 M4ay 1- Apr 30 July 1-Jue 30
-al p=ice adjustit: AprilMay hig/Sep 4¢il ('Green') DecJuly/hig ('Pred')
crop c-gyesr: lie 1/15 Oct l May 1 ('Gren') Jar-Feb &Ag 15/Sep 1 ('Prep'd') July-Sept
5.04 Decisions on anmual price guarantees and other adjustments to thecommodity price structure are purportedly reached after three successivestages of consultation. First, an internal comm1 ttee within eachStabilization Fund reviews the dossier and submits proposals through itsmanagement committee (Coffee and Vanilla Funds) or administrative council(Clove and Pepper Boards) to the Ministry of Commerce. These proposals arethen reviewed by an ad hoc technical committee, convened by the Ministry ofCommerce and normally including representatives of the Fund, otherMinistries, banks, and parastatal trading companies concerned. At thethird stage a Government committee comprising officials of two services(promotion, prices) within the Ministry of Commerce and a representative ofthe Ministry of Agricultural Production and Agrarian Reform prepares afinal decision for ministerial approval. Decisions on guaranteed producerprices and related adjustments are published under a Presidential decree.The fully itemised price structure is published and circulated underMinisterial decree. In practice it is unclear to what extent thepreparatory consultative committees function as effective advisory bodiesin the decision-making process and how the final Government decisions arereached.
_5.05 For coffee, cloves and pepper, the criteria adopted for pricesetting are also obscure. With the recent exception of coffee, nosystematic analysis has been undertaken of actual costs incurred byproducers, and reliable data are not available on operating costs incurredby the various intermediaries in the marketing chain. (For coffee, the adhoc committee formed in May 1983 under the auspices of the National CoffeeSymposium made a first useful attempt to calculate producer costs and hassince submitted recommendations to the Government for revision of theproducer price.) There is no evidence that the price settiag decisionprocess takes into account considerations of agricultural sector policy,nor that prices are based on specific commodity market projections. Themain criteria adopted for pricing decisions on these commodities appear tobe a combination of: (a) estimated ceiling FOB prices obtainable in worldmarkets for the following year, (b) movements in the domestic consumerprice index, and (c) general commercial experiesce over the previous year.For vanilla, contracts and export prices for the succeeding year are agreedduring annual negotiations held between Indian Ocean producer countryrepresentatives, the European Vansilla Trade Association and U.S.importers. The domestic price structure and export prices for vanilla aredetermined in accordance with the -results of these negotiations.

70 -
B. Prices and Margins
5.06 The official price structures for the main export crops, shown inTables 34-37, are the main instruments available for analysis of theGovernment's policy of administered pricing, since data is fragmentary onactual costs. However, from data provided by the Government on the averageFOB export prices realized in each year since 1978 it is also possible toreconstruct the pattern of distribution of annual revenues from exportsales, as shown in composite form in Tables 38-41. For the four maincommodities, trends in the movements of producer prices as proportions ofboth guaranteed and actual FOB prices respectively are shown _n Figures5-8. From this assembly of data, it is possible to identify in generalterms the relative movements, and the principal beneficiaries, of theadministered pricing system for each commodity.
Coffee Prices
5.07 Producer prices for coffee are fixed by the Governmentirrespective of actual production costs. For the 1983/84 crop season, theofficially guaranteed minimum producer price set in June 1983 was FMg280/kg, representing an overall increase of 70Z in producer prices since1975 (FMg 165/kg). Analysis shows, however, that whereas producer pricesover the shorter period 1975-81 increased overall by 52%, the official costof living index in Antananarivo increased by 103% over this period. In May1983, calculations made by the ad hoc commission reporting to the NationalCoffee Symposium estimated average minimum costs of FMg 348.84 forsmallholder producers, exclusive of crop risks, interest on credit, andprofit. In short, the evidence shows that producer prices have not keptpace with inflation, are currently about 25% below minimum producer costs,and are a positive disincentive to increased production.
5.08 Furthermore, over the period 1975-83 producer prices havedeteriorated as a percentage of the guaranteed FOB export price (Table34). Compared with the overall increase of 70% in producer prices overthis period, the guaranteed export price rose by 96% from approximately FMg224/kg in 1975 to FMg 440/kg in 1983. The producers' share of tbis pricehas steadily declined from roughly three-quarters in the mid-1970's to lessthan two-thirds in 1983 (Figure 5). Margins allocated under the officialprice structure for intermediary functions (including crop collection,transport, processing, storage, miscellaneous taxes, and administrative andoperating expenses) have correspondingly increased. Lack of data onrespective costs in these categories precludes detailed analysis of theadequacy of intermediary margins at this stage. However, it appears thatthe greatest relative growth has been in the margins for transport,processing and handling for export, and that the main beneficiaries of theincreased margins have been the crop collector/transporter and, to a lesserextent, the prorc'ssing/storage companies.
5.09 Whereas the Government has increased the guaranteed export priceby an average of 8.8% per annum over the period 1975-1983 (compared with anaverage 6.8% increase in producer prices), actual FOB prices have reflected
.

- 71 -
world market price trends and show a slower rate of growth. From 1978 to1983 this growth averaged only 5.1% per annum, representing a cumulativeincrease of 28X over the five-year period compared with a total increase of60X for the guaranteed FOB export price. As a consequence revenues due tothe Coffee Fund have been declining in relative terms, and actually show amarked fall in the 1981-1983 period (average FMg 7.3 billion) to less thanhalf the level of the previous 3 years, 1978-1980 (average Fig 15.8billion) (Table 38). This illustrates the problem of producer prices In abroader perspective and suggests the main consequences of the administeredpricing policy. In brief, although producer prices remain abnormally lowiin relation to costs, against a background of slow growth in actual FOBexport prices (5.1Z per annum in the period from 1978 to 1983) Governmentpricing policy has sustained at least a higher rate of relative growth inprices to producers. Over the same period, however, (i) allocations to
: internal marketing expenditures have soared; and (ii) residual revenues dueto the Coffee Fund have been declining. The disposition of these revenuesbetween the Coffee Fund, the parastatal trading companies, and the national
* treasury are considered later in this chapter (paras. 5.25-5.27).
Clove Prices
5.10 The guaranteed minimum producer price for cloves was set at FMg4 35/kg for the 1983/84 harvest and remains unchanged from 1982/83.Reliable estimates of production costs are not available, but provisionalBank calculations suggest that at this level cloves are a relativelyprofitable crop for farmers (see Table 31). Producer prices for cloveshave increased overall by only 36% since 1975 (FMg 320/kg) compared to theoverall increase of 70% in minimum coffee prices over this period. Whilethis relatively slow growth in clove prices, amounting to only 4.5% perannum, has been well below increases in the cost of living index, farmershave been less handicapped by this difference. The clove harvesting periodis short (October-December), and although harvesting requires high inputsof seasonal labor, once planted clove trees require relatively littlenmaitenance. In general the current level of official prices and the
annual adjustments made since 1975 appear to have imposed no particularconstraints on production.
5.11 Guaranteed FOB export prices for cloves have grown at a slightlyhigher rate than producer prices over the 1975-1983 period, showing anoverall increase of 41%. Adjustments within the price structure in themargins for intermediary marketing functions have broadly followed thispattern of relatively slow growth over time, the major change being aniacrease of 35% between 1977 and 1982 is the allowance for transportexpenditures, identical to that for coffee. Total allowances for cropcollection, heavily influenced by the adjustment for transport, moved up by23% overall. Between 1977 and 1982 margins for processing and storageincre-ased annually by only 8.5Z, which compares with an even lower growthof S.'C in producer prices over this five-year preriod.

r 72
5.12 The real growth since 1975 has been in actual export prices and,as a consequence, in surplus revenues accruing to the Cloves Board underthe stabilization scheme. Over the 1978-1982 period, for example, theserevenues increased on average by 45% per annum. In the exceptional year of1981, when export volume rose by 136Z over 1980, Government leviesincreased by an unprecedented 364%. on a similar export volume is 1982,these revesues iucreased by a further 35%. IA short, although producerprices for cloves have edged o0ly slightly upwards since 1975, the effectsof administered pricing of cloves have been generally favorable. Pricingpolicy for this commodity has not been a brake to production growth, andappears to have provided a remarkable degree of stability for bothproducers and intermediaries in the context of a highly volatile rarket.
Vaailla Prices
5.13 The average production costs for vanilla are not readilyavailable, but it would appear that this commodity, although lessprofitable than cloves, is a reasonably profitable item for farmers atcurrent price levels (see table 31). Minimum producer prices have beenraised overall by no less than 300% since 1975, far in excess of increasesin costs and inflation. Despite this growth in profitability to vanillaproducers, export profits to the Government and the vanilla traders haveexperienced even higher growth (by an estimated 269% in the 1978-1983period, compared to a 203% increase in producer prices over the sameperiod). Clearly these growth rates have been made possible only byMadagascar's continuing domination of the world market.
5.14 Internal adjustments in the price srructure show a somewhaterratic pattera, but suggest that overall since 1968 intermediary marginshave moved up by about 20-25% per annum. Despite the lack of availabledata on marketiag costs, it seems probable that these increased marginswill have generally exceeded increases in operating costs. The benefits ofthe vanilla trade, and Madagascar's quasi-monopoly in this sub-sector,appear to have been spread throughout the industry although perhapsunevenly among the participants. However, the distributioa of exportprofits between the Vanilla Fund, private companies exporting on behalf ofGovernment and the Government Treasury is not precisely documented.
Pepper Prices
5.15 There have been no specific studies on the farm costs of pepperproduction. Bank estimates for this review suggest that returns to farmersper labor day are extremely low, only fractionally better than for coffee,and that black pepper production is uneconomic at present price levels.Token producer price increases in the 1973-82 period amounted to an averageof only 3% per annum in nominal terms and a substantial decrease in realterms. However, since the early 1970s the Government has had little roomfor manoeuver in price setting. World market prices for pepper (unlikethose for coffee, cloves and vanilla) declined steadily for a decade until1983 and depressed producer prices in all exporting countries.
. -:-

- 73 -
Nevertheless the Government's administered price system protected Malagasypepper producers from the worst effects of this declie. In 1979/80 thePepper Board was forced to intervene to subsidize the domestic producerprice from its price stabilization reserves; throughout the 1978-83 periodthe Government has sustained the producers' share at around 50Z of actualexport revenues, a higher proportion than for most controlled commodities.
5.16 Annual adjustments of the official pepper price structure since1978 reflect the prevailing squeeze on guaranteed prices to both producersand exporters. Internal adjustments have been minimal, the main variablesbeing slight increases in allowances for transport and to cover creditcharges on crop financing. Guaranteed prices to exporters moved up atvirtually the same rate as producer prices. Income from levies, andtherefore Pepper Board reserves, have recovered somewhat since 1980 asactual export prices have improved, but otherwise there has been anegligible redistribution of benefits. In short, low export prices havelargely prevented any real adjustment of intermediary margins forcollection, marketing and processing activities in line with increasedoperating costs. The profitability of black pepper among all participantsin the trade - producers, mArketing intermediaries, the Pepper Board andthe Government - has beea marginal or negative under recent marketconditions.
Effects of Price Administrationi
5.17 The operation of price support schemes for the major export cropsappears to have secured a measure of real protection to producers againstsharp fluctuations in world market prices in recent years. However, onlyfor vanilla producers have the annual adjustments of guaranteed minimumprices provided real increases in purchasing power. Producer prices forcloves and pepper have not kept pace with cost-of-living increases, and inthe case of pepper this factor appears to have had a disincentive effect onproduction growth. For coffee producers the situation remaiss grave:upward price adjustments in recent years have provided a degree of incomesupport but have been insufficient to stimullate either production or incomegrowth. Coffee production indeed has become iacreasiagly unprofitable tofarmers, and only where cloves or vanilla have provided alternative cashcrop revenues have farmers enjoyed a real measure of income protection.This situation calls into question other aspects of price administrationand the present orientation of price stabilization operations inMadagascar.
C. Role and Operations of the Stabilization Funds
5.18 The Stabilization Funds were established in the 1960s to performthree main functions:
- to provide minimum price guarantees to producers;
- to identify and implement measures facilitating the marketing ofcrops for export; and

- 74 -
- to foster action programs which would increase productivity andimprove crop quality.
5.19 The financial resources required to carry out these functionswere to be obtained mainly from the export levy comprising the differencebetween guaranteed and realized export prices. From these resources, theFunds were expected:
- to finance the deficits arising from actual sales transactions atbelow the guaranteed export price;
- to finance action programs to improve production and reducemarketing costs; and
- to constitute a reserve fund to support domestic prices in timesof poor harvest or low world market prices.
5.20 Organizatiou and administration of the Funds followed a commonpattern. Each organization was established as an autonomous publicenterprise, under the technical authority of the Ministry of Commerce andfinancial authority of the Ministry of Finance. The governing -administrative body for each Fund comprised representatives of 'generalinterests" (Government appointees from various Ministries), and privatesector producers and exporters. This 'management committee' (for theCoffee and Vanilla Funds) or 'administrative council' (for the Clove andPepper Boards) had as its main function the approval of the annual budgetsand income and expenditure accounts. Authority for execution of Fundoperations was vested in a Director, appointed by the Minister of Commerce,assisted by a Deputy Director. Each Fund carried a nucleus of full-timestaff to handle its commercial, administrative and accounting functions.Implementation of operational programs financed by the Funds was normallyassigned to public services or other external agencies.
5.21 The original statutes of the Stabilization Funds remain inforce. However, successive Government policy initiatives since 19i9 havetransformed their role and status in the export trading system. First, theestabLishment in 1975 of Government export mosopolies for coffee, clo-'es,black pepper and other commodities obliged the Stabilization Funds toassume a new and major intermediary function as marketing agencies forthese crops. (Only the Clove and Pepper Boards, which wiere statutorilydefined as commercial public enterprises, had hitherto been empowered tointervene directly in market trading, and these powers had rarely, if ever,been used.) Secondly, in 1978, the nationalization of the major exporttrading companies and the designation of SOMACODIS, ROSO, COROI and SICE asexclusive export agencies for monopoly-controlled crops, made neworganizational demands on the administrations of the Funds and Boards whichthey were ill-equipped to carry out. Thirdly, the creation in 1977 of theFonds National Unique de P6rEquation (FNUP), initially as a reserve fund toabsorb surplus revenues accruing from the 1976-77 coffee boom, rapidlyeroded the managerial and financial aatonomy of the Stabilization Funds.These developments have both blurred their responsibilities and made theirexisting statutes obsolete.

- 75 -
5.22 The incompatibility between the de jure and de facto roles of theStabilization Funds has compounded other shortcomings in their operationssince the mid-1970s. Two external studies have shown the vast extent ofthese problems. A diagnostic review carried out irs 1980 by EXAInternational for the Ministry of Commerce focussed on weaknesses in theorganization and management of the Funds' commercial activities. It drewparticular attention to their diminished control over management, both ofexternal trade negotiations and communications (functions largely takenover by the Ministry) and of internal financing of marketing operations(functions at least partially assumed by the increasingly powerfulparastatal trading companies). The EXA report suggested that the Fundswere further handicapped by their lack of regional offices and directrepresentation at the ports; by underqualified and poorly motivatedcommercial personnel: by a rapid turnover of staff, resulting in inadequateand irregular documentation of commercial and financial transactions; andby inordinate bureaucratic delays in financial flows.
5.23 An audit report on the Coffee, Clove and Vanilla Funds undertakenby RINDRA in 1982 and covering the '978/79 and 1979/80 fiscal yearsprovided deeper analysis of these financial management issues, and drew agrim picture of weak administration, lack of internal financial contr'os,incomplete and unaudited accounts and other management failures. TheRINDRA report particularly highlighted problems arising from a separationof financial management powers between the Director of these Funds, whoseauthority extended only to the issuance of payment orders, and thePrincipal Treasurer of Antananarivo, to whom responsibility as treasurer ofthe Funds was assigned. Payr.ent requests issued by the Director could becountermanded by the external Treasurer. Major inconsistencies andomissions in the registration and settlement of expenditures by the Fundsand the Treasury precluded completion of a full audit by RINDRA. Thelimited administrative and financial powers of the Funds, noted by RINDRA,had also created a huge problem of debt recovery from the parastatalcompanies. Over the audited period, 1978/79-1979/80, the RINDRA reportrecorded outstanding claims, unpaid debts, and outstanding loans due to theCoffee Fund and Clove Board, and not wholly recoverable in the short term,which amounted to FMg 13.7 billion, or 53Z of their total income for thetwo fiscal years in question. Although some improvements in accounting andfinancial controls have been introduced over the past few years, thewidespread structural, organizational and administrative problems affectingthe Stabilization Funds are only now being seriously addressed.
D. Ut'lization of Export Revenues
5.24 It is difficult to obtain a clear picture of the distribution andutilization of revenues from the export levies. Changes in commercialpolicy and the export financing system since 1975 have led in practice tothe channelling of export revenues through three sets of institutions: (i)the Stabilization Funds, (ii) the four parastatal trading companies, and(iii) the FNUP. The criteria and mechanisms for movement of funds betweenthese institutions are not explicit. Furthermore, the interpretation ofavailable data is complicated by differences between fiscal calendars, the

- 76 -
institutions' different methods of presenting financial statements, timelapses in recording revenue transfers, and the infrequeucy of financialreporting by all the institutions concerned. Until the RINDRA audit reporton the Coffee, Clove and Vanilla Funds was issued in 1982, covering thefiscal years 1978/79 and 1979/80, so annual reports and accounts of thesefunds had been published since 1975. Financial reports on the parastataltrading companies unfortunately are not available, and only indicativefigures are available on operations of the FNUP. For these reasons, only apartial picture can be drawn of expenditure patterns.
5.25 In principle, revenues of the Stabilization Funds are used tomeet the costs of: (a) support of guaranteed export prices, (b)contributions to various investments in the export crop subsector, (c)operations carried out by research (FOFIFA) and extension (OCPGC) agencies,(d) storage indemnities, and (e) miscellaneous operations undertakendirectly by the Funds. In practice it is difficult to identify realexpenditures of the Funds because available data from FNUP and Fund recordsfor any one fiscal years show considerable differences due to accountingProcedures and schedules. Table 42 provides a composite summary ofreceipts from FNUP and expeaditkues by the Funds over the fiscal years1979/80-1982/83. Available administrative accounts for the Funds for thethree most recent fiscal years illustrate more precisely their patterns ofexpenditure (although inconsistent with Table 42). The Coffee Fund datashows total expenditures of FMg 27.8 billion over the period1980/81-1982/83. Of this amount approximately FMg 8.6 billion (31%) wasallocated to promotiA,g production of robusta and arabica coffees throughthe extension services. A further FMg 5.8 billion (21Z) was allocated forsector interventions, comprising malnly storage charges (FMg 2.1 billion,or 8%) and an allocatioa in 1980181 for the construction and rehabilitationof feeder roads in export crop areas (FMg 2.0 billion, or 1U of totalexpenditures). Only a token sum, amountiag to 0.4% of expenditures overthe three years, was required to support the guaranteed export price. Morethan half (FMg 13.3 billion) of total Coffee Fund expenditures in thisperiod were attributed to undefined investment projects, presumably throughthe FNUP. Total expenditures of the Clove Board over the same1980/81-1982/83 period amounted to FMg 7.3 billion (about one-quarter ofexpenditures for coffee), of which FIg 2.3 billion (32%) were required forstorage indemnities, FMg 2.65 billion (36%) were allocated to feeder roads,and FMg 2.2 billion (30%) were transferred to the Government's investmentbudget through FNUP. The most recent administrative accounts available forthe Vanilla Fund, covering fiscal years 1979/80 through 1981/82, showbudgeted receipts of FMg 7.1 billion from export levies over the three yearperiod (about the same as for cloves) and only minor expenditures for cropstorage, promotion and protection. Overlapping data on FNUP receipts fo'rthis period support the assumption that almost all excess revenues fromvanilla exports are transferred to the sational investment budget for otherpurposes. Among the four main crops only the accounts of the Pepper Boardindicate the use of funds (a small amount in 1980) for direct pricesupport.

- 77 -
5.2b Data provided by the Central bank on the movement of fundsthrough FNUP show that between 1979 and 1982 total FNUP receipts amountedto FMg 76.5 billion, an average of FMg 19.1 billion per annum (Table 43).Parallel data from the Ministry of Commerce and the various Funds implythat FNUP resources are drawn virtually entirely from the levies on exportcrops. Over fiscal years 1980/81 through 1982/83, coffee levies accountedfor 42% of FNUP receipts, cloves for 36Z, vanilla for 21%, and pepper forless than 1%. Table 44 illustrates the flow of FNUP receipts andexpeaditures by commodity over this period. It indicates particularly highgrowth in average net income from coffee (94.0%) and vanilla (90.5%) inthis period, but negative growth (-9.7%) from cloves (mainly reflectinghigh storage charges sustained by the Cloves Board) and a deficit on peppertransfers. The utilization of this FNUP income is of special interest.The Central Bank data show that of total FNUP expenditures (FMg 64.5billion) over the 1980-82 period, only FMg 16.5 billion (30%) was disbursedfor operation of the export crop price stabilization schemes. Theremaining expeaditures were for unrelated purposes: FMg 17.2 billion (32%)to subsidize prices of rice and other essential consumption itemsdistributed internally by the parastatal trading companies, FMg 15.5billion (28%) for investments in Regiosal University Centers in 1979-80,and FMg 15.3 billion (28%) for unspecified Government Interventions.
5.27 Data compiled from the RINDRA audit and other sources imply thatthe four parastatal trading companies (SOMACODIS, ROSO, COROI and SICE)receive funds both from (i) the Stabilization Funds (for crop collection,processing, storage and handling of coffee, cloves and black pepper, inaccordance with margins in the 'differentiel' plus the 10% commission 'chefdu file'), and from (ii) FNUP, (which finances the subsidies for internaldistribution of imported rice and other basic consumer goods, for whichnormal trading margins are fixed and average around only 4%). Over theperiod 1979-82, the parastatals' receipts via the Stabilization Funds onexport crop prices amounted to an estimated FMg 20.6 billion. RINDRA datashow loans from the Funds in 1979 amounting to a further FMg 2.8 billion,and unrecovered debt claims in 1980 amounting to a further FMg 6.0billion. From the standpoiat of these companies, handling the export cropsappears to be a particularly lucrative activity.
5.28 The complexity of these financial transactions makes it difficultto trace their full impact on price stabilization operations. It isnevertheless clear that extraction of export profits from the StabilizationFunds has been a matter of deliberate Government policy since the creationof FNUP in 1977. The subsequent imposition in 1978 of the 10% commissionon exports for financing other operations of the parastatal tradingcompanies is also likely to have had a negative impact on development ofthe export crops sub-sector. Although increased revenues have continued toaccrue to the Stabilization Funds despite these policies, in recent yearsthey have been unable to exercise real control over their own affairs.Changes have been underway since 1983 in b oth MC and the Funds which implythat a start is being made on addressing this problem (see Chapter VI,paras. 6.06-6.08). Plainly widespread structural and policy reforms areneeded throughout the price administration system if the export cropsub-sector is to survive and prosper.

- 78 -
E. Conclusions
5.29 The system of administered pricing adopted in Madagascar for thekey export crops has provided a degree of protection to growers undervolatile commodity trading conditions. However, the system has becomearbitrary, inflexible and inefficient. Price setting procedures arebureaucratic, are not based on economic criteria, and have beenunresponsive to farm production costs and constraints. The structures andoperations of the Price Stabilization Funds have not evolved in line withchanging production and trade conditions, and they have increasingly becomestatic instruments for execution of Government policy. Poor financialmanagement, serious accounting flaws and organizational deficiencies in theFunds have further weakened their effectiveness. Export crop pricingpolicies in general have been guided more by the short-term needs of theGovernment Treasury rather than needs for sustaining long-term economicgrowth in the sub-sector. The continuous decline in coffee production inparticular appears to be largely a consequence of ill-conceived producerpricing policies, lack of re-investment of Coffee Fund resources formaintenance and growth of the industry, and systematic transfer of coffeelevies to support the parastatal agencies and other sectors of theeconomy. A new approach is needed to export crop pricing and pricestabilization practices in order to restore production and export tradegrowth.
Price Policy Constraints
5.30 The following aspects of commodity pricing policy and priceadministration procedures are among the most serious constraints:
(a) disincentive effects nf the administered pricing system,which has made production c.f certain crops (such as coffeeand black pepper) unprofitable for farmers, generallyfavored marketing intermediaries, and hampered efficienteconomic growth.
(b) lack of a clear long-term strategy for development of theexport crop sub-sector which could provide a coherent policyframework for export commodity pricing decisions in relationto foodcrops;
(c) lack of data on actual costs of production and marketing andof an economically sound methodology for analysis of pricingoptions, resulting in arbitrary decision-making on the basisof undefined criteria;
(d) inadequate mechanisms for Government consultations on costsand prices with representatives of crop producers,processors, marketing intermediaries and exporters; anddiminution of the Stabilization Funds' autonomy andresponsibilities in this regard;

- 79 -
(e) a complex set of structural, legal, organizational andfinancial problems relating to the Stabilization Funds,resulting in decline in their efficiency and effectivenessand widespread loss of confidence in their operations amongfarmers and traders;
(f) inadequate re-investment of Fund proceeds from export croplevies in action programs to improve production and reducemarketing costs in accordance with their respectivemandates;
(g) systematic transfer, through FNUP, of a proportion of exportcrop revenues to finance consumer subsidies and othernon-productive purposes; and
(h) application of various levies and taxes on export crops,including the supplementary margin of 10% in favor of theparastatal trading companies, which has penalized producersand seriously distorted commercial conditions forcompetitors in coffee and cloves marketing.
pportunities for Pricing Policy Adjustment
5.31 The Bank's Sector Memorandum on Agriculture and Rural Development(March 1983) has reviewed broader issues of pricing policy in Madagascarand noted Government intentions to improve price administration systemsgenerally. Measures under consideration in 1983 included (i) theestablishment of an informal interministerial commission to preparetechrncal analyses and proposals on prices, (ii) a possible new system forprice evaluation which would give particular weight to considerations ofrelative pricing between commodities, (iii adjustment of indices fordetermination of producer prices, and (iv) revised scheduling for regularprice reviews and announcements before the start of each agriculturalseason (October for annual crops, January for perennial crops). However,implementation of these proposals has been slow during the recent period ofGovernment reorganization, and furthermore the proposed measures do not-recognize the overriding need to adjust export commodity pricing policiesin line with a single criterion, border pricing, and to apply thiscriterion in time to all export commodities. Consideratiou it; now beinggiven by Government to the status of the Price Stabilization funds,including their role in commodity sector development, and the Caisse CAVAGIis initiating a number of internal management reforms. However, the scopeof the Government's intentions in this area is also not clear.Furthermore, action on these issues would still leave unresolved theanomalous situation of the coffee sector, which has been steadily drainedof its own resources for rehabilitation and growth as a result ofshort-sighted and inequitable Government pricing policies. To raiseproducer prices for coffee to incentive levels would necessarily incur asharp reduction in the resources of FNUP (from cotfee levies) and/or of theparastatal trading agencies. Hence these broader issues of taxes andlevies must also be urgently addressed.

- 80 -
VI. ORGANIZATION FOR EXPORT
A. Institutional Framework
6.01 The organization of export crop production, marketing andoverseas trading has undergone many changes since 1960. While the originalinstitutions for price stabilization is the major commodity sectors haveremaimed in place, the broader institutional framework for managing exportcrop development has been subject to frequent adjustment. The fundamentalre-direction of Government policy which followed the 1972 revolution vastlyexpanded the role and numbers of public institutions in foreign anddomestic trade. Economic and financial difficulties since 1980 have led tofurther reorganization of Government institutions and services since 1982.In July 1983 a number of miaisteral changes were anaounced which includeda division of respossibilities for agriculture between MPARA and thenewly-formed MPAEF, and the separation of the commercial portfolio (now MC)from that of industry (now MTEM). Internal reorganization of theseministries is still proceeding in 1984 and inevitably there are still somegrey areas in the definition of responsibilities between mainistries foractivities of an iater-sectoral character (for example, is the developmentof agro-allied export industries). The institutional framework forpromoting export crop development is therefore incomplete. In thefollowing paragraphs, an outline is provided of the main institutionsconcerned, their known responsibilities and, to the extent possible in viewof ongoing changes, the scope of their current services.
Ministry of Agricultural Production and Agrarian Reform (MPAR&)
6.02 The Bank's Sector Memorandum oa Agriculture and Rural Developmentin Madagascar, published in June 1983, traces ia detail the history andchanging responsibilities of MPARA up to that time.11/ In July 1983 a newMinistry of Animal Production, Water and Forests (MPAEF) was created whichtook over MPARA's previous responsibilities for livestock, fisheries andforestry development. Although some residual anomalies stem from thismisisterial split - for example, certain tree crops such as cashews fallwithin MPAEF's forestry mandate - MPARA remains the Lead ministry forpolicy formulation, operations and evaluation pertaining to productionaspects of the export crops. This respossibility includes the applicationof pre-and post-harvest technologies to production (although the formationof a new Ministry of Scientific Research in October 1983 raises doubts asto where the borderline betweea pure and applied agricultural research maybe established in practice), as well as the implementation of agrarianreform policies and assistance to production cooperatives engaged incultivation of the field crops.
6.03 The 1982 reorganization of MPARA re-established the ministry'sstructure along fuactional lines following an unsuccessful three-year
11/ Report No. 4209-HAL, Annex 2.

- 81 -
period of decentralization during which all field services were groupedunder regional directors. Further refinement of this structure sincemid-1983 has led to the formation of five MPARA departments at centrallevel: Programming, Agricultural Extension, Rural Infrastructure,Agricultural Input Supplies, Finance and Personnel. For export crop policyand strategy development, the Department of Programming (DP) now has aleading role. Key support units in this department include the statisticsservice (DP/SMTIS) and a newly-formed economic studies service (DP/SEE).Technical services for crop production, including the export crops, arebeing re-grouped within the Department of Agricultural Extension (DVA)which has a total staff of about 1,600 permanent and 2,400 short-termemployees. At central level, DVA now comprises three services,respectively, for Plant Protection (DVAJSPV), Agricultural Training(DVA/SEA) and Extension Support and Research Liaison (DVA/SALIAR). Thelatter service is expected to play a major role for MPARA in planning,implementation and supervision of future export crop developmentoperations, and is being organized in five divisicns specializing inagronomic aspects of specific cultures (stimulant plants, including coffeeand cloves; medicinal plants; fibres and sugar; fruit and vegetables; foodcrops, especially grains and legumes), and a sixth division dealing withrural economics. The major operational programs handled by MPARA,including those of the ODR (Operation de DEveloppement Rizicole) and theOCPGC are also being attached for management purposes to the DVA. Thisdepartment accordingly carries the lion's share of MPARA's field programactivities and technical staff at all administrative levels, although theDepartment of Rural Infrastructure (which has responsibility within MPARAfor activities on feeder roa?.s and crop storage construction) and theDepartment of Agricultural Input Supplies also have important specializedcontributions to make towards export crop development. Staff reassignmentand recruitment to the reorganized departments, services and divisions wasstill proceeding in April 1984 pending the issuance of a ministerial arretewhich will formally define the functions of each MPARA unit. One furtherrecent change of special importance for export crop organization andoperations was the transfer in January 1984 of MPARA's former Conditioningand Quality Control Service to the Ministry of Commerce.
6.04 OCPGC. Within the spectrum of MPARA's operationalresponsibilities, the OCPGC has a special role. Conceived in 1964 andformally mede operational in 1966, the then OCP (Operation Cafe-Poivre) wasset up primarily to revitalize the coffee sub-sector, initially withexternal financing from the European Development Fund (FED) and later(1969-73) from French bilateral sources (FAC). In 1975 the OCP's mandatewas broadened to include cloves and cocoa extension services, whereupon itbecame known as OCPGC. Headquartered in Toamasina, the agency hasfunctioned administratively throughout this period as MPARA's extensionwing in the main export crop production zone along Madagascar's eastcoast. (Vanilla, however, is excluded from OCPGC responsibilities.) Overtime, the agency's operations have steadily expanded to a point where OCPGCnow employs approximately 3,700 people. Since 1977, the high point of thecoffee boom, OCPGC's staff and operational expenditures have been almost

-82 -
entirely funded by the Coffee Price Stabilization Fund, with the exceptionof senior staff, finaneed uader MPARA's geaeral budget, and expatriatetechnical assistaace financed by FAC. Currently the OCPGC budget isapproximately FMg 1.6 billion (US$5.3 million) per annum.
6.05 A series of recent papers has shed some light on theaccomplishments as well as the many difficulties and failures faced by theOCPGC over its lifetime.l12/ O the whole, although some progress has beenmade in the diffusion amnZ-doptio% of improved coffee plant varieties andpruning practices, OCPGC's performasce is not impressive. Weakorgasization and managemeat, inattestion to crop production goals andmeasurement, and lack of systematic programming point to internalfailings. Aside from robusta coffee promotion (and, on a limited scalesince 1982, efforts to promote arabics coffee-growiag in selected highlandareas), OCPGC has so far done little to improve output of its otherassigned crops. External factors, however, have also affected OCPGC'simpact: the underlying disincentive effects of producer pricing for coffee,the effects of the decaying infrastructure and recent economic crisis onstaff mobility and provision of input services, and frequent policy andorganizational changes made by Government over the past decade have alsotaken their toll on results. Since 1981, preparation of a project torestructure OCPGC and improve its impact on export crop production has beenunder discussion between MPARA and external donor agencies. A finalrevised proposal is expected by June 1984, provisionally for jointfinancing by FAC and CCCE. The new project would include: (a) reform ofthe statutes, structure and functions of OCPGC, (b) a program torehabilitate coffee production in 28,000 ha covering three zones of highestpotential output (Manakara, Maaanjary and Farafangana) among bothsmallholder plots and neglected large plantations, Zc) retraiaing andpartial redeployment of OCPGC agents to the zones targeted for intensifieddevelopment, and (t) a package of financial and techaical assistance forcoffee farmers, including credit, training, rehabilitation of feeder roadsand improved availability of consumer goods.
Ministry of Commerce (MC)
6.06 The Government reorganization which took place in July 1983included a realignment of the ministries responsible for economic,industrial and commercial policy. During the previous decade, efforts tostrengthen Government control over sational production and trade hadconsiderably increased the powers and responsibilities assigned to
121 See: (1) Working Paper on Export Crops. World Bank (EAPCA), June 2,1984.
(2) Role et Evolutioa de l'Op6ratioa Cafe and 'La ProductionCafEriAre a Madagascar.' Papers preseated by M. RamilisonAlphonse, Director OCPGC at the National Coffee Symposium,T,amasina, May 1983.

- 83 -
successive ministries of National Economy (1972-75), Commerce (1975-78)Economy and Commerce (1978-82), and Industry and Commerce (1982-83) withregard to both domestic and foreign trade. Included in these ministerialfunctions were the formulation and control of domestic and export pricing,supervision of the price stabilization funds and parastatal tradiagenterprises, major responsibility for the conduct and development ofintersal distribution and marketing, and exclusive responsibility forexport licencing, overseas trading and fulfilment of international tradingagreemwets on behalf of the Government. The present Ministry of Co-mmerce,formed ia July 1983, retains the leadership for Governmeat policy in thissector and is therefore expected to play a major role, with MPARA, incharting the future for internal marketing and overseas trading ofMadagascar's export crops.
6.07 A ministerial decree issued on January 26, 1984 (Decree No.84-028) established the scope of MC's responsibilities and the ministry'ssew internal structure, although the process of reorganization will clearlyevolve further and become better defined over the coming mouths. Inessence this decree (a) reiterates MC's responsibility for the elaborationand application of the Government's foreign and domestic trading policy,(b) formalises the transfer of responsibility from MPAR& for control ofproduct quality and processing services, (c) restates MC's inheritedtechnical and administrative responsibilities for marketing organizationsand the price stabilization funds (to be defined in a forthcomingministerial arrete), and (d) outlines the reorganization plan for MCdepartments and services. Major features of this reorganization includethe grouping of three restructured MC departments (Export, Import, andPrice Stabilization) within an enlarged General Department of ExternalTrade, the formation of a fourth (new) Department of Supervisioa andDistribution, and a re-grouping of services within a fifth (existing)Department of Economic Control. While the policy implications of this newstructure have not yet been articulated, the reorganization plau isreported to reflect significant changes in MC's role and futureactivities. Informal discussions with MC officials in March 1984 suggestthat the ministry proposes, inter alia, to assign a greater degree ofautonomy to the price stabilization funds operating in the traditionalexport crop sectors, to increase MC efforts to develop the domesticmarketing system, and to focus its owe export trading activities on theopening of non-traditional markets and promotion of exportdiversification. Whether such changes will include some relaxation of theexcessive controls on priciag and trading which have stifled the growth ofan efficient marketing system remains to be seen. Regardless of anyimpending shifts in policy focus, the ministry's historically dominant rolein the marketing and trading system for export crops makes MC and itsassociated commercial institutioas essential partners of MPARA so
overcoming widespread organizational problems in the sub-sector. Thedisappointiag export performance of recent years warrants a comprehensivereview of MC capabilities and services, including both huan- and financialresources, in this context.

- 84 -
6.08 Stabilization Funds and Boaris. The main functions, activitiesand weaknesses of the Stabilization Funds and Boards which operate under MCtutelage have been reviewed in Chapter V. Widespread dissatisfaction withthe internal management performance of the Caisse CAVAGI, the heavilycritical RDIRA and EXA reports on these Funds, and reconsideration byGovernment of its export trading situation and prospects appear to haveimproved the climate for reform of the Funds and Boards' operations since1982. In August 1983, a new director of the Caisse CAVAGI was appointed.Reportedly successful efforts have been made since then to speed up cropcollection and export administration, particularly for coffee, and plansare being drawn up to strengthen the operational capacity of the Caisses tomanage and monitor the export development programs (including OCPGC)financed from their resources. Discussions with MC and Caisse officials inMarch 1984 indicate that a major reorganization of the Stabilization Fundsand Boards is planned which would reflect the reorientation of MC policiesand structure presently under way. Proposals made in 1983 by the CaisseCAVAGI to upgrade, retrain and supplement its small permanent headquartersstaff (approximately 45) by the appointment of qualified technical andcommodity specialists are under review by MC. Initial consideration isalso being given to the possibility of pricing policy reforms and othermeasures to improve the productivity and efficiency of the parastataltrading enterprises engaged in export crop marketing.
6.09 Parastatal trading enterprises. The functions, operationalperformance and possible restructuring of the four major export tradingparastatals (SOMACODIS, ROSO, COROI and SICE) were the subjects of anorganization and management study carried out in 1979 by Peat, Marwick andCo. as consultants to the then Ministry of Economy and Commerce. The studyshowed deep-seated problems in their management of multiple tradingoperations (especially by ROSO). It proposed a master plan forrestructuring the wholesale trade in Madagascar, which recommendedgeographic and functional realignment of the four companies' operations anddivestiture of various non-commercial investments, industrial andagricultural activities. This master plan and its main recommendationswere apparently shelved. Partial information on these companies' tradingactivities which was made available for this export crops review isinadequate for evaluation of their recent trading performance andefficiency. The present scope for improving the organization andmanagement of the four companies has therefore not been identified. Priorto their nationalization in the late 1970s, SOMACODIS, ROSO, COROI and SICEwere diversified marketing organizations, engaged in a wide range ofexport/import and domestic processing and trading operations. As a group,they continue to market not only the principal export crops, but alsoessential consume: goods ("produits de premi4re necessitei) for thedomestic market and a diversified range of minor exports. However, nospecific zone of operation is assigned to each company, and in many productsectors they both coordinate and compete with others. Considerabledifferences are believed to exist between them with regard to

- 85 -
organiZational structure, maintenance of quality costrol and exportstandards, financial management and accounting practices. However, the 10%commission which they each receive on the realized FOB prices for exportmonopoly crops has tended to mask these differences. A full evaluation ofthe scope for improved organization and use of public resources for exportdevelopment would necessarily involve detailed review of these key tradingenterprises and their relative profitability.
Ministry of Transport, Supply and Tourism (MTRT)
6.10 The Bank's Transport Sector Memorandum published in February 1973drew attention to the predominant role of ITRT In transport sector policyand mAnagement and its influence on export operations. MTRT is responsiblefor road, rail, air and water transport, and operates all airports andports (with the exception of the Port of Toamasina, managed by anautonomous authority). It also oversees the parastatal agencies engaged ininternational shipping (5MTX), coastal shipping (CKN) and rail transport(RLNCFK), and Air Madagascar. The ministry 's responsibilities for roadtransport ilclude safety, tariffs, regulation and control, as well asdirecting the supply and transport of basic goods. An internalreorganization of MTRT, anaounced in December 1963, involves few changes inthe basic activities of the ministry, but provides for a strongerDepartment of Studies, Planaing and Coordination to meet the urgent needfor integrated transport planning and to improve the hitherto weak liakageswith other institutions involved in the transport sector. These include MC(for export of goods and import of vehicles), MPARA, the Army and theregional governments (each of which control and operate sizeable transportfleets), and especially MTP.
Ministry of Public Works (MTP)
6.11 .XTP is responsible for planaing, building and maintaininghighways, ports and airports. In principle lts involvement in roadtransport is limited to construction, maintenance and administration of thenational road network. Regional roads, feeder roads and access tracks arethe responsibility of the provincial and community authorities which reportto Government through the Ministry of the Interior (MI). However, theprimitive state of minor roads and the increasingly desperate problems ofcrop evacuation and distribution of essential goods in rural areas whichhave developed over the last decade intensified demands on NTP to intervenein these areas. Under the IDA-financed Sixth Highway Project approved inJune 1983, MTP will administer a rehabilitation program covering 10,000 kmof the economically most important feeder roads as determined by MThT,MPARA and MC. (While this amounts to only 20% of the total feeder roadaetwork, .he selected roads carry 90% of the goods traffic). MTP will alsobe providing technical assistance to the local authorities forrehabilitation and maintenance of access tracks until its own operationalcapacity has been built up. In April 1982 MTP was reorgasized to improveefficiency and accountability. Technical operations are presently groupedunder the Department of Works.

-:86 -
Other Ministries
6.12 Of the other ministries with responsibilities relating to exportcrops, two were formed only in 1983. The new Ministry of Scientific andTechnoloigical Research (MRSTD), through its dependent research agencyFOFIFA (formerly under MPARA) is likely to have an important role inpromoting research on bitherto neglected crops and in defining thetechnological opportunities for development of new crop varieties andproduct forms. Also reorganized in 1983 as a separate ministry, theMinistry of Industry, Energy and! ines (HIEM) has responsibility for exportmanufacturing industries which will include certain agro-industrialproducts. Two other ministries have long-standing responsibilities iD. thesub-sector: the Ministry of Finance and Economy (MPFE), which oversees the.finances of the stabilization funds, the application of resources fromexport levies through FNUP, customs, taxation and foreign exchange controlsand the Directorate of Planning (DGP), which has overall respoasibility fordevelopment planning and budgeting on behalf of the Government. Both MPFEand DGP would be important associates for MPARA in the formulation ofstrategies and action plans to develop future operations in the export cropsub-sector.
Banking Institutions
6.13 Pending the establisbment of an Orientation Council for theBanking and Financial Sector, the Central Bank (BCRK) is responsible forsetting national credit policy. It also has a pivotal role in carrying outeconomic and financial projections for the Government. This entailscontinuous review of international commodity market and price trends andtheir projected effects on national revenues, the balance of payments, andthe public investment budget. Since the present economic crisis arose in1980, the BCRM has also played a crucial role in allocating increasinglyscarce resources of foreign exchange (with MPFE), determining prioritiesfor issuance of import licences (with MC), and in budgeting and channellingforeign exchange earnings. In addition to BCRM participation with MPFE, MCand DGP in regular meetings of a coordination committee handling theforeign exchange crisis, BCRM officials participate by invitation in ad hocfield visits to inspect and verify the status of commodity stocks awaitingexport.
6.14 The banking system comprises three primary banks: BTM (foragriculture), BNI (for industry) and BFV (for commerce). In practice, allthree provide credit to commercial borrowers in the public and privatesectors, for pre-financing crop collection, processing, storage andexport. The Rural Development Bank of Madagascar (BTM), established in1977, is the main official channel for provision of agricultural credit,and has approximately 40 agencies spread around the country. Although BTMis a relatively strong institution and has retained its profitability inrecent years, its loan portfolio for smallholder export crop productionstarted only in 1981 and remains a small percentage of its total lending.Through the IDA financed First Agricultural Credit Project (Cr. 1064-MAG)Bank Group assistance has been extended to BTH to expand this portfolio andfurther strengthen the institution.

- 87 -
B. Private Sector Operations
6.15 >:There has been little systematic investigation of the preseut-role of the private sector in-Madagascar's export trade. The Governmeat'sdrive since,.the mid-1970s-to bring production, marketing and processing ofmajor crops under public control, the nationalization of the largaestforeign-owned&export/import tradiag compasies and the emergence of up to 90parastatal enterprises involved in agricultural activity have focussed theattention of most recent studies particularly on these.public sector-operations-. Only fragmentary -data is available from ITC., EXA and Banksector reports on residual private sector operations-and resources.
6.16 Although the scope for private investment and initiative inkexport development has been severely curtailed for a decade-, the privatesector remaias a significant element ia many aspects of agriculturalproduction, processing and trading. Production of the main export crops(coffee, cloves, vanilla, pepper) is predominantly in the hands of
.independent smallholders, in some instances grouped into voluntarycooperatives. (Goveranent-sponsored socialist cooperatives are still fewin aumber, and the state farms are important mainly for sugar, oil palm,coconuts and soya beans.) As total European holdings of land neverexceeded 40,000 ha (equivalent to 1.4X of all cultivated land), cropproduction in Madagascar has always been and remains primarily in the handsof indigenous farmers. For most crops, collection and primary marketing isalso largely undertaken by resident or itinerant private estrepreneurs,although many operate under contract to the major parastatal tradingcompanies. In the processing sector, many of the private enterprises stilloperating, which include European, Chinese and Malagasy owned companies,have been well established in Madagascar for more-than thi-ty years. Whilethey now hold only a minor share of the trade in major primary commoditysectors such as coffee and cloves, they dominate the vanilla trade andaccount for significant shares of the export trade in green pepper andother spices, clove and ylaag-ylang oils, sisal products, maize, tapioca,tropical fruits (lychees and mangoes), vegetables and medicinal plants.Although private sector coffee processing and storage capacity isunderutilized, machinery and equipment in most installations is generallywell maintained and in some instances (e.g. a coffee calibration facilityin Toamasina) jointly operated with parastatal competitors. Awell-established nucleus of 20-30 private enterprises exists which couldrapidly expand export operations under more favorable production andtrading conditions.
6.17 In present circulstances, this private sector capability isdormant. Government policies over the past ten years have activelydiscouraged private investment. Foreign-owned enterprises have norecognized facility for repatriation of profits or dividends. Distortedpricing systems, licensing restrictions and statutory monopoliesestablished by Government over many commodity sectors have severelyrestricted the scope for export expansion by the private sector. In recentyears, the priority allocation of scarce foreign exchange resources to thepublic sector has further hampered the competitive position of privatecompanies in obtaining vital input supplies. The lack of an investmeat

- 88 -
code covering agriculture and associated industrial activity has alsodiscouraged potential new investors. Although there are indicators thatthe present Government may be willing to change this situation-(proposalsfor an industry investment code and for easing export restrictions are inthe pipeline), a deliberate and sustained effort to encourage privateinvestment will be necessary in order to accelerate development anddiversification of Madagascar's agricultural export portfolio.
C. Organization of Export Services
6.18 The baak's recent project experience in Madagascar hashighlighted a large number of o-gaaization and management problemsaffecting development of the agriculture sector. Several sector andsub-sector reports and working papers since 1982 have analysed the mostcommon weaknesses. 1 3 / These include a lack of clearly defined objectivesand strategies, poor planaing and coordination of operations, unclearallocatioss of responsibilities between participating institutions, weakfinascial managemeat and accounting practices, inadequate or unreliabledata resources and monitoriag facilities, excessive bureaucratic controls,overstaffing of goverwment agencies, and inadequately trained personnel.
6.19 All these problems are manifest in present organization of theexport crops sub-sector. There is no coherent strategy for exportdevelopment: crop production is not geared to long-term trends in exportmarket demand. Planning and coordination are weak: no effective mechanismexists below cabinet level for inter-ministerial coordination of exportplanning and logistics. Allocation of responsibilities for exportpromotion between Government, the Stabilization Funds and the parastatalexport agencies is inefficient: over-centralization of decision-makingwithin MC has slowed export administration and discouraged commercialinitiatives. Poor financial management and inadequate accounting have beenwidespread among the export trading institutions: cumbersome andinefficient procedures for monitoring expenditures and transfers of fundsnave seriously hampered crop production, collection and marketingoperations. Lack of reliable crop data from MPARA and inconsistencies intrade statistics assembled by MC uadermine confidence in the data base foraaalysis of supplies, stocks and market trends: in general the informationflow between institutions and services is extremely weak. Conversely, anexcess of bureaucratic coatrols on the transfer and movement of goods raise
13/ See particularly:(a) Agriculture and Rural Development: Sector Memorandum, June 29,
1983 (Report No. 4209-HAG)(b) Public Sector Enterprises in the Agricultural Sector: Sub-Sector
Review, March 22, 1983 (Report No. 4079-MAG)(c) Budget and Financial Management for Agriculture, Working Paper,
1982.

- 89 -
marketing-costs and impede the development of a more flexible and efficientmarketing system. Overstaffing of extension services (MPARA/DVA, OCPGC)and parastatial agencies has aagmented the fixed costs of production andmarketing, placing a heavy burden on the Government budget: moreover theresultisg lack of sufficient funds to cover variable operational costs hasimpeded delivery of essential services to farmers, prevented effectivemonitoriag, and reduced productivity. The shortage of trained personnel inthe public sector to manage and service the numerous state enterprisescreated siace the mid-1970s has been an especially severe coastraint onexport growth. Low salary levels in the public sector have failed toattract well qualified commercial managers and staff, and local facilitiesand programs are inadequate to train the numbers of product specialistsneeded for both extension and marketing operations to sustain Madagascar'scompetitive capability in export tradiag.
6.20 Over the past two years, to reduce public expenditures andincrease foreign exchange earnings, the Government has taken initial stepsto address some of these problems. The reorganization of both MPARA and MCwhich is w under way reflects awareness of serious organizationalweaknesses. In the wake of these changes and the series of recentconsultants' reports for Goverament on prospects in specific markets andcommodity sectors, follow-up action is now required to formulate a viablelong-term plan for export development.
D. Conclusions
6.21 Institutional development issues are central to the task ofre-launching agricultural export growth. Governmnt policies favoringrapid expansion of public sector control over foreign trade placed aorganizational burden on the institutions involved which they have beenill-equipped to handle. This problem has contributed to the decliningvolume of exports and affected Madagascar's ability to operate efficientlyia world markets duriag a period of intense competition, rapidtechnological development and changing patterns of trade. The resourcesand commercial experience of the private sector have not been fullyutilized in support of Government policy. Institutional weaknesses must beaddressed and improved management practices must be sought in the processof planning for export expansion.
Organizational Constraints
6.22 Among the many organizational constraists which have beenidentified in the course of this review, the following warrant priorityattention:
(a) lack of an adequate statistical data base and informationsystem within Government for regular analysis of export cropresources, demand and price trends, and for exportdevelopment planning;

-90-
(b) fragmented institutional responsibilities withiu the exportcrops sub-sector, and lack of an effective medium forinter-ministerial coordination of export policy andoperations;
(c) lack of either a long-term plan of action to promote exportgrowth and d±versi.ication, or commodity-specificinter-sectoral plans for linkage of production with tradetargets;
(d) ill-defined objectives, outdated statutes and complexstructures of various agencies (including OCGGC, CaisseCAVAGI and trading parastatals), requiring in-depth reviewand rationalization;
(e) common problems within the concerned ministries, includingovercentralized direction, inadequate definition ofpriorities and lack of concentration on the key economicsectors, slow and cumbersome administrative procedures,overstaffing at lower levels but generally insufficientnumbers of well-trained and motivated technical staff, andscarce resources and facilities for effective supervisionand monitoring of operations;
(f) commoa problems within the semi-autonomous agencies (e.g.OCPGC, Caisse CAVAGI), including economic inefficienciesresulting from Government directives, poor managsueat, andgenerally inadequate financial control and auditingpractices;
(g) general isolatioa of government institutions from externalresearch and isformation on crop sector trends, economicissues, general and crop-specific technologicaldevelopments, and lack of facilities for refresher trainingand upgrading of staff competence; and
(h) inadequate mobilization of private sector financialresources, facilities and commercial competence toaccelerate export growth.
Organization Opportunities
6.23 The reorganization of MPARA, MC and other concerned ministrieswhich has been underway since 1983 shows promise of providing a new impetustowards export growth. Government policy pronouncements in 1984 have alsolaid new stress on export themes and suggest that a favorable politicalclimate may sow exist for reform of organizational structures andprocedures in this area. Simultaneously, however, this poses the risk thatorganizational changes may be decided and initiated even before clearlong-term goals are set. Givea Madagascar's recent history of recurrentshifts in Government policies and organizational structures, with sometimes

- 91 -
coafusing and unproductive consequences, this risk should be avoided, tothe exteat possible, in setting a new course for agricultural exportgrowth. For pereanial crops ia particular, the time-frame for investmentin crop research and new productive farming investments can beexceptionally long (10-15 years). It is thus important to identify clearlythe most promising crop options and developmeat strategies for long-termexport expansion before any fundamental restructuring of the sub-sectortakes place. Simultaneously long-term financial and human resource seedsshould be reviewed, and the scope for improved organization and masagementof existing export operations should be thoroughly evaluated. A period ofnot less than 12-18 months (coveriag approximately 1984-85) may thereforebe necessary to complete a long-term plan for developmeat of the exportcrop sub-sector, to strengthen basic infrastructure and services, and toimplement measures to remedy the most serious short-term constraints.

- 92 -
VII. Prospects for Development
A. General Situation Summary
Summary of Constraints
7.01 The principal constraints to expansion of export crop productionand revenues, reviewed in the preceding chapters, can be summarized asfollows:
(i) Economic and sector constraints:
- severe balance of payment difficulties, and associatedshortages of foreign exchange
- cutbacks in investment budgets and ougoing developmentoperations
- deteriorating and damaged infrastructure, includiag thetransport network, storage and marketing facilities
- shortage of vehicles, equipment a-d spare parts andbottlenecks in input supply for agriculture and industry
- stagnating agricultural production and trade
- declining volume of cash crop production and exports
- lack of priority and clear policy for development ofexport crop resources.
(ii) External market constraints
- slow growth or stagnating consumption in world marketsfor the principal export crops
- limited scope for increases in prices for main crops andslackening prices for cloves
- strong and increasiag market competition from majorproducer countries in markets for coffee and spices
- international regulatioa of the coffee market andassociated quota limitations
- weakened competitive position of Madagascar (decliningproduct quality, organizational deficieacies, inadequateservices, short-tern profit policies, limited range ofexploited export crops)

- 93 -
-iadequate mobilizatioa of resources and skills topromote exportable crops in new markets
(iii) Production constraints
- ecological factors a-d climatic risks
- lack of incentive pricing, input supplies and wagegoods, and associated lack of maintenance and investment
- competition between crops for land and seasonal labor
- low standards of on-farm technology in traditionalagriculture
- generally low yields and deteriorating product quality
- inadequate support from research and extension servicesand the marketing system
- weak and unreliable agricultural statistics
(iv) Marketing and processing constraints
- lack of a coherent marketing strategy
- inefficieat collection operations and distorted pricing
- inadequate and deteriorating road and portiafrastructure
- unproductive and iaeffective official controls onmarketing
- deficiencies In processing standards and quality costrolservices
- structural and administrative weaknesses in publicsector marketing and processing organizations
- underutilization of capacity and resources and generalneglect of the private sector
(v) pricing constraints
- disincentives and distortion of administered pricingsysteTs
- lack of a coherent development policy framework forpricing decisions

- 94 -
- lack of a sound technical methodology for price analysisand price setting
- inadequate mechaaisms for price review and consultation
- outdated statistics and weak administration of theStabilization Funds
- inadequate re-investmeat of Fund proceeds in developmeatprograms
- diversion of export crop revenues to parastatals, FNUPaad non-productive economic sectors
(vi) Institutional constraints
- inadequate Government statistical data aad informationsystems
- fragmentation of institutional responsibility for exportcrops
- lack of long-term and crop-specific development plans
- ill-defined objectives, complex structures andmanagement weaknesses of public sector ageacies
- organizational, staffing aad resource problems inconcerned ministries
- isolation of government institutions from externalresearch and information
- inadequate mobilizatioa of private sector resources
Summary of Action Undertaken
7.02 The Governmeut is acutely conscious of the fundamental problemsaffecting the economy in general and the agriculture sector in particular.Since 1981 various stabilization measures and policy adjustments have beenimplemented to deal with priority problems. In this context, the exportcrops sub-sector has increasingly been a focus of attestion and concern,and since 1982 the Government has sought ways to initiate a strong recoveryin crop production and trade.
7.03 The principal recovery measures aad recent eveats directly orindirectly affecting export crop developmeat isclude:

- 95 -
(i) Action relating to economic and sector issues:
- sharp reductios in imports of son-essentials
- policy of severe fiscal restraint
- various tax measures
- improved expenditure control system
- increases in tariffs of public enterprises
- reduction of consumer subsidies
- adjustment of exchange rate, depreciatioa of theMalagasy franc
- liberalization of domestic trade in rice and dry grains
- reorganizatioa of MPARA and MC
- revision of the public investment program
- concentration on rehabilitation of infrastructure andeconomic viability of priority enterprises
(ii) Action relating to external market issues:
- fulfilmeat of coffee contracts and improved rhythm ofcoffee exports in 1983/84
- fulfilment of coffee quotas to ICO countries
- investigation of other price stabilization models (e.g.Ivory Coast)
- commissioniag of ITC study os Malagasy comodity exportmarkets
- joint MC/ITC market prospection missions to six majorimporting countries (L981-82)
- joiat MC/ITC market prospection mission to Indian Oceancountries (1983)
- redefiaition of market and sector priorities within MC
- formulation of project to establish and equip a marketinformation center in MC, proposed for ICT/UNWDP support

- 96 -
(iii) Action relating to crop production issues:
initiation of FAO/UNDP-supported national agriculturalceasus to be undertakea in 1984/85
orgasization of National Coffee Symposium by OCPGC/BTM(1983)
formulation (19b4) of revised 5-year project for coffeerehabilitation in major producing areas, proposed forFAC/CCCE financing
- initiation (1983) of IDA-supported cotton developmentproject through HASYMA
- revisioa of rice production, marketing and pricingpolicy, and iacreased production in 1983/84
- initiation (1983) of action programs for reform of keyagricultural parastatals following joint PARA/1IDAreview of IDA sub-sector report
- review and revision of public investment program foragriculture (1984)
- initiation of FOFIFA technical cooperation agreementswith IRII aad IRAT (1981/82) and completion of ISNARreview and action plan for agricultural research (1983)
- organization of priority programs for fertilizer importand distribution
(iv) Action relatiag to internal marketing issues:
- reorganization of MC services (1984) and assignment ofhigher priority to developmeat of the domestic marketiagsystem
- initiation of IDA-supported Sixth Highway Project (1983)including rural roads rehabilitation and maintenancecomponent
- transfer of quality control and conditioning servicefrom MPAjA to MC to integrate export quality control(1984)
- provision of additional donor-financed vehicles andequipment for coffee collection in selected locations(1983)

- 97 -
- i-itiatioon of review of parastatal trading agencyresponsibilities and financing
- review of possibilities to strengthen mazketiag supportservices through the Stabilization Funds
- initiatiow of revised industrial investment code(1983/84)
(v) Action relating to price aduinistration constraints
- proposal to establish informal inter-ministerialcommission on prices
- proposal to initiate new system of price evaluation
- plans to improve reference indices for producer pricing
- proposed re-scheduling of ansual price reviews
- upward adjustments (1983/84) of guaranteed producerprices for coffee, vaidlia and black pepper aboveaverages for previous years
- Introduction of regional variants in official transportcharges (1983)
- initiation of simplified system for inter-agencyallocation of foreign exchange receipts and transfer oflevels (1981)
- completion of RINDRA audit on Caisse CAVAGI (1982) andinitiation of accounting improvements
(vi) Action relating to institutional constraints
- structural reorganization of key ministries (1983/84)and associated redefinitica of service priorities
- completion of SEMA-METRA report on MPARA organization,mnapower and services (1983)
- proposals for restructuration of OCPGC (scheduled for1984)
- initiation of service reorganization in MC
Outstanding Issues
7.04 The action now under way to foster economic recovery, and improveagricultural production and trade represents a promising beginsing towards

- 98 -
restoring growth in the export crops sub-sector. It also indicates thegeneral direction of current Government policies and apparent readiness totackle difficult problems under unfavorable conditions. Many of themeasures cited above may be expected in due course to alleviate certainconstraints identified in the present report. At best, however, theactions underway can only partially address the large number of identifiedproblems in the sub-sector, and few of the measures cited arecrop-specific.
7.05 There remains a series of important policy issues for earlyattention, among them: (a) lack of a long-term inter-sectoral strategy andaction plan for export crop development; (b) lack of crop-specificdevelopment strategies and action plans; (c) inadequate incentive policiesto promote production and marketing of cash crops; (d) inadequate systems,structures and services for export crop development; (e) inadequateincentives in the pricing systems; and (f) generally inadequate resourcesfor statistical information, economic analysis, planning and monitoring ofdevelopment operations in the sub-sector. These issues should be addressedas priorities in setting a framework for future export crop developmentwhich would be consistent also with Government's policy objectives for foodproduction.
B. Commodity Prospects and Scope for Development
7.06 Conclusions and recommendations arising from this review arepresented in the first instance for specific crops, and secondly (insection C) with regard to the export crops sub-sector as a whole. Thesituations for the five major crops reviewed - coffee, cloves, vanilla,pepper, and cocoa - are the main focus of comment. Possible courses ofaction with regard to other crops suitable for rehabilitation anddiversification are more briefly considered.
Coffee
7.07 Prospects. The problems for coffee development are the mosteconomically important and complex among the major crops, and the leastamenable to rapid solutions. Regardless of unpromising world marketprospects over the next few years, the dominance of coffee in the exporteconomy is such that Madagascar cannot afford to permit any further declinein its steadily weakening position. Numerous constraints have beenidentified, including: (i) low and inadequate producer prices, (ii) lowyields and deteriorating plantations, (iii) lack of incentives to maintainand improve the quality of harvested and processed coffee, (iv) heavydemands on farm labor and lack of mechanization, (v) lack of reliable inputsupply services and utilization, (vi) relatively ineffective extension andresearch services; (vii) inadequate crop collection and transportationservices, (viii) problems of stock and quality control, (ix) bottlenecks inexport administraiton, port handling and shipping, (x) pricing distortionsembodied in the 'differentiel', (xi) insufficient re-investment of coffeeprice stabilization scheme resources, (xii) over-taxing of the coffeeindustry and transfer of coffee earnings outside the sector, (xiii)anomalous institutional arrangements, and (xiv) miscellaneous organizationand management problems. At present, Madagascar exports only robusta

- 99 -
coffee and has not begun to exploit its potential for arabica coffeeexports. Agronomic and technological research should also be pursued onthe indigenous -mascaro coffea caffeine-free variety, on upgradingorganoleptic qualities of Malagasy coffees, and on the utilization ofby-products (e.g. coffee skins for fertilizer). Particular efforts areneeded to improve the efficiency of marketing circuits, and marketingmanagement by the Stabilization Funds and parastatal agencies. All aspectsof cost control and pricing should be reviewed in order to raise guaranteedproducer prices progressively to desirable incentive levels (i.e. about 50Xabove 1983/84 campaign prices).
7.08 Recommendations. Not all these reforms and adjustments could orshould take place simultaneously. It is recommended (see para. 2.21) thata three-pronged strategy for development be considered, comprising: (i)preparation of a short-term (1984-85) plan to improve current production,marketing and trading efficiency; (ii) preparation and implementation of amedium-term plan (1986-1990), to revitalize the coffee sector in order tocompete more effectively in world markets in a period of forecast increasesin world consumption, and (iii) preparation of a long-term plan (for the1990s) based on crop research and technological diversification. Themedium-term plan should probably have a strong production focus, but wouldbe based on inter-sectoral review of Madagascar's coffee industry. Itcould take as a reference point the proposed scope and content of thecoffee rehabilitation project being prepared for FAC/CCCE funding, butshould include in-depth review also of arabica coffee prospects; optimallyit should be completed over the next 12-18 months. Priority issues to beaddressed within the short-term (1984-85) plan would necessarily focus onpre-conditions for renewed investment, including (a) pricing policy andincentives, (b) the structure and mechanisms for price setting andadministration, (c) input supply and distribution, (d) transport andshipping bottlenecks to coffee exporting, (e) action to upgrade processingand quality control, and (f) improvements in organization, management andadministration.
Cloves
7.09 Prospects. The prospects for cloves are not promising. Inessence the situation is one of current and probably continuing over-supplyin Madagascar in the context of declining demand in Indonesia and only slowgrowth in lesser world markets. Given the long productive life (25-40years) of clove trees already planted and the exceptionally high currentstock levels of exportable cloves, Madagascar's resources for export ofcloves are likely in most years to be plentiful. Cloves are at present aprofitable crop for farmers, although harvested quantities are often belowpotential. Labor availability appears to be the only major productionconstraint. Crop quality, and in some instances processing standards,could be improved. Problems of crop collection, marketing and exportadministration are similar to, but far less serious than, for coffee. Inshort, cloves are not a priority crop for rehabilitation: the dominantproblem is the availability of export outlets.

- 100 -
7.10 Recommendations. The situation for cloves calls for a dualstrategy, comprising (a) production and price restraint, and (b) vigorousexploitation of available markets both for clove buds, and subsidiary cJoveproducts (oils and oleoresins). It is recommended (see para. 2.32) that(i) for the short-term (1984-85), a dynamic and flexible export marketingand pricing policy be adopted, and (ii) for the medium -term (1986-1990),an inter-sectoral promotion plan should be formulated to expandMadagascar's share of the global spice trade, including cloves anddiversified clove products. This could be completed over the next 12-18months. For the immediate future desirable action should focus on (a)active market promotion in target countries, (b) flexible export pricing tosecure entry into new markets, (c) unchanged producer prices, (d)utilization of Stabilization Fund resources to finance export marketdevelopment, (e) basic improvements to crop quality and storage, and (f)industrial and technological research to identify the scope for diversifiedproduct forms and industrial uses for subsidiary clove products.
Vanilla
7.11 Prospects. Demand growth is relatively stable but highlysensitive to prevailing export price levels and vulnerable to the greatercompetitive advantages of synthetic vanilla flavorings. There is also ahigh risk that Madagascar could lose its near-monopoly advantages as newproducer countries develop natural vanilla export capability. This wouldseverely threaten the profitability of vanilla for up to 70,000 traditionalvanilla growers. It therefore seems vital to undertake urgent action todeal with a range of production and promotion constraints. These include:(i) generally low and fluctuating crop yields, (ii) vulnerability toplant disease and cyclone damage, (iii) deficiencies in crop husbandry,(iv) lack of financial resources to sustain and apply crop research onimproved varieties and yields, (v) high labor demand coinciding with riceharvesting, (vi) lack of regular extension services, (v5i) somedeficiencies in quality control and marketing, (viii) decline of exporttrade promotion, (ix) lack of investment in technological and marketresearch to identify scope for product diversification. Because vanilla ishighly vulnerable to climatic conditions, alternative production locationsand opportunities for mixed cropping with crops providing protective cover(e.g. coconut) should be explored. GNIV has been a relatively effectiveassociation in maintaining standards for preparation, storage and export ofvanilla, but its potential as a medium for extension and productdiversification should be strengthened.
7.12 Recommendations. Early action is needed to restore andstrengthen vanilla production operations and research to secure moredependable levels of supply. Simultaneously market research and promotionare needed to diversify natural vanilla product uses and sustain long-termdemand. Additional investment in vanilla production is recommended, andcould be suitable for project support with a focus on (a) research andextension, (b) diversification of production areas and cropping systems,(c) technological, product development and market research, and (d)institutional support for GNIV. It is recommended that development

- 101 -
proposals be prepared duriag 1984-85, for financiag by the StabilizatioaFund with possible external support, with a view to implementatioa of amediuw-term (1986-1990) action plan.
Pepper
7.13 Prospects. The outlook is favorable for continued growth inworld markets for both black and green pepper, but Madagascar's prospectsdiffer between the two. In the black pepper sector, Malagasy producers arepoorly placed to compete. Production is unprofitable for small farmers whoaccount for over two-thirds of output, and is subject to aumerousconstraints. These include: (i) demand for labor intensive cultivation,(ii) seasonal competition with other crops, (iii) need for improved crophusbandry, (iv) lack of support from research and extension services, and(v) unattractive producer prices. Current and prospective market pricesallow negligible scope for raising producer prices to incentive levels, andblack pepper offers scaxt prospects for halting the decline in exportrevenues except under coaditions of plantatioa cultivation. Prospects forgreen pepper, which is not subject to price controls, are moreencouraging. Coatinued growth of exports and earnings are feasible. Themajor constraints are Ci) insufficient supplies, (ii) difficulties in cropcollection and transportation, and (iii) technical requirements forprocessing.
7.14 Recommendations. A development strategy for pepper should favorthe expansion and promotion of green pepper production and consolidation ofblack pepper production under ecosomically viable conditions. For greenpepper action is needed to improve extension, input supply and cropcollectioa services, and to encourage additional private sectorinvestment. For black pepper, fundamental policy changes are needed torestructure production aad trade on an economic basis. Removal ofmarketing and pricing controls and abolition of the price stabilizationscheme for black pepper are recommended for coasideration. These measureswould Ci) discourage uneconomic production, (ii) favor consolidation ofproduction in potentially viable plantation units, and (iii) reduce thecosts to Governmeat of price and trade administration at marginal cost totreasury earnings. Action by MPAXA/OCPGC should focus on raising cropyields through (i) supply of improved plant material, (ii) reduction ofplant disease, (iii) improved use of fertilizer, and (iv) improvedhusbandry techniques. A coherent strategy and action plan should becompleted as soon. as possible, to accelerate expassion of green pepperexports and restructuring of black pepper operations with effect from 1985.
Cocoa
7.15 Prospects. Despite generally unpromisixg world market and pricetreads, this crop offers some scope for increased production and exportearnings. At present Madagascar is a misor participant in the cocoatrade. Research, production and marketing have all suffered from neglect,and isvestment has been minimal. Nevertheless, with negligibleencouragement from Government, cocoa production by small farmers is

- 102 -
expanding, yields are moderate and there is apparent export demand forMalagasy cocoa varieties. The maia identified constraists to growthinclude: (i) inadequate maiatenaace of established large plantations, (ii)lack of investmest in research and development, (iii) unsatisfied demandfor improved plant material, (iv) inadequate knowledge of requisiteconditions for efficient production, marketiag and export, and (v)Madagascar's limited operational experience and influence in internationalmarkets for cocoa.
7.16 Recommendations. Various uncertainties coaceraing the overallstatus of curreat cocoa operatioas and prospects for development justify acautious approach to cocoa development. It is recommended that short-termaction (1984-85) should conceatrate on (i) carrying out a detailed study ofcocoa resources, production conditions, marketing chanaels, processiagoperations, costs and prices, and the scope for trade expansion, and (ii)maintaining and increasing support for varietal and yield improvementthrough OCPGC. Experience gained over the next 12-18 months would help toformulate a more precise cocoa strategy for the medium term (1986-1990).
Lesser Crops
7.17 Among the considerable range-of other crops which offer scope forincreased production and exports, this review has identified eightcommodities or commodity groups which lend themselves to further researchand development in the immediate future. These are:
Ca) sisalCb) butter beans ('pois du cap')Cc) coconut{d) cashewCe) cassavaCf) maize(g) various spices, and(h) tropical fruits
Conclusions and recommendations regarding possible courses of action onthese commoditaes are summarized below.
7.18 Sisal. This crop is well-established in Madagascar and is atraditional foreiga-exchange earner, but prospects for long-term growth areuncertain because of underlying processes of change affectiag demand,trading patterns and prices. Possibilities exist for Madagacar to competeeffectively among a limited number of producer countries is East Africa andLatin America. Ia the abseace of recent production and market researchreports on the Malagasy sisal industry, it is recommended that an in-depthstudy be undertaken during the 1984-85 period to identify prospects andpre-coaditioas for renewed growth and investment in the medium-term.

- 103 -
7.19 Butter Beans. The 'pois du cap' is a traditional crop exportedto specialized markets. Recent liberalization of trade should assist arevival of production and renewed export growth, but doubts existcoacerning the crop's vulnerability to insect damage and disease, internalmarketiag and export channels, the stability of export markets, and optimumconditions for economic production. 'Pois du cap' is particularlyimportant as a cash crop in western and southern regions and as analternative food crop in these areas. As for sisal, it is recommended thatin-depth studies be undertaken in 1984-85 to determine requirements forrehabilitatioa of productioa and the most suitable strategy for marketdevelopment.
7.20 Coconut. Production and long-term export possibilities for thiscrop have not beea sufficiently exploited. It is a versatile andprofitable crop for small farmers, well suited to east coast growing areas,and potentially a major resource for Madagascar's edible oil isdustry.Export markets for coconut products (especially copra and copracake) arestable aad expanding, and price prospects are favorable for long-termgrowth. Coconut productioa and trade is still is its infancy. It isrecommended for the short-term (1984-85) that the preseat pilot projectoperated by the Societe Sambava Voania be streagthened by traiaiag oftechnicians, development of hybrid seed gardeas and nurseries, aadincreased support for research and extension. Experience from this projectwill provide a basis for formulating a medium-term (1986-90) expansionprogram.
7.21 Cashew. This is also a versatile crop, well-established incertain areas of the north-west and north-east, undemanding on farm labor,and potentially of far-reaching economic importance as an anti-erosion cropresource. Madagascar's existing export market is small and specialized,comprisiag mainly unshelled nut exports to Iadia. Insufficient is known atthis stage concerning the economics of production and the scope for productand market diversification, given the extent of isternational competitionfrom East African and other producers. For the short-term (1984-85), it isrecommesded to undertake technical and economic pre-feasibility studies onproduction, processing and marketing requirements. These would help toestablish a framework for decision-making on medium-term strategy and thefeasibility of implementing a pilot development project.
7.22 Cassava. This is the second most important food crop inMadagascar, aa established source of traditional tapioca exports, and animportant potential resource for export diversification. Sustained growthof cassava processing has been severely affected in recent years by thebreakdown of transport infrastructure, input supply and distributionproblems, and lack of Investment. While crop production has significantlyincreased, processed output and exports have contracted. To reverse thissituation, a detailed study should be undertaken in 1984-85 on requirementsfor rehabilitation, upgrading of processing technology and marketiagorganization. Possible renewed investment in the mediumrterm should beexamined in the context of both export goals and national food policy.

- 104 -
7.23 Maize. This is another neglected crop, with considerablepoteatial for developmeat as a dual food crop and export. It could be aparticularly vital crop resource for highland areas, but appears adaptableto many regions in Madagascar. External demand exists, especially fromaccessible Indian Ocean markets, but has infrequently and only partiallybeen satisfied. It is recommended that maize be assigned high priority forfurther investigation. Research studies, which could be implemented in the1984-65 period, should be particularly comprehensive. Agronomic, economicand techmical issues should be simultaneously addressed, and a full reviewshould include consideration of crop varieties, farm economics, productionand marketiag requirements, pricing and trading constraints. These studiescould form the basis for a medium-term (1986-90) developmeat strategy.
7.24 Various Spices. The export potential for cinnamon, nutmeg,giager and a variety of spice products has so far been poorly exploited.As a major world producer of vanilla and cloves, and a lesser exporter ofpepper, Madagascar is well-equipped to compete more actively in the largeand growing global market for many spices. The general lack of iategrationof production and commerce ia Madagascar and the separation ofinstitutional responsibility for vamilla, cloves and pepper marketing a-dpriciag betweea different price stabilization boards appears to havehampered formulation of a national spice development policy. Onepossibility to be considered is the amalgamation of vanilla and clovesmaAagement within a broader National Spice Promotion Board. Anothei optionwould be to add responsibility for selected lesser spice products to anexisting Marketing Board (e.g. cianamon with cloves). It is recommendedthat over the 1984-85 period Government give full consideration to theseand other development possibilities, with a view to formulating a coherentinter-sectoral policy for expansion of the countryts spice trade.
7.25 Tropical Fruits. Madagascar's diversified climate and landresources offer considerable scope for long-term developmn-t of the fruitand vegetable export trade. Export of fruit and vegetables, however, is atechnologically and commercially demanding activity. The risks ininternational trading of perishables and-the intricacies of marketing andfreight handliag are such that public sector enterprises are generallyill-equipped to operate is this sector. To date private enterprise inMadagascar has had modest success iL supplying lychees and certain otherexotic fruits to European markets, and the scope of this trade could beconsiderably expanded over time. To exploit these possibilities, priorityaction would be needed to (i) rehabilitate national transportinfrastructure and international freight services, and (ii) elaborate aninvestment code which could attract the necessary capital for productionand market development. In the light of progress obtained in these areasover the 1984-85 period, it is recommended that plans be drawn up forsubsequent mediumrtcrm (1986-90) development of the fruits, flowers andvegetables crop sector.

- 105 -
C. Towards an Export Crop Development Strategy
7.26 Development planaing for specific crops should be reviewed in thebroader context of economic and sector development plans. For this reason,a recurrent theme of preceding chapters of this report has been the need toformulate a long-term inter-sectoral strategy and actioa plaa for thesub-sector, as well as appropriate institutional mechanisms forcoordiaation of development activities. Such a strategy should take intoaccount established goals of sational economic and social policy, andshould seek to elaborate mutually consistent objectives for production,marketing, priciag and trading policy in the sub-sector. Clear prioritiesshould be set, and aa action plan for implemeatation should fully recognizefinancial and institutional constraints, organizational difficulties andthe likely problems which may occur in implementation. In short, to beeffective, the action plan should be both feasible and manageable. It isproposed that elaboration of such a strategy and action plan should followGovernment/Bank review of the present report.
7.27 Critical elements of an export crop development strategy canalready be identified. The principal policy choices lie between expansion,rehabilitation and div.rsification, or a combiaation of these threeoptions. Furthermore a diversification policy may include diversificationof crops (varieties), products (form, grade and end-use), markets (targetcountries and consumer groups), and production areas (regional growingareas and local production sites). Each of these coasiderations applies tothe range of export commodities currently traded, and should be taken intoaccount in strategy formulation. Other key elements of an overallsub-sector strategy will involve: (a) recoaciliation of crop resources witheXternal market opportunities (b) the establishment of policy linkagesbetween production, isternal marketing, agro-industrial processing andpricing policy for specific crops, and (c) the coordination of information,research, extension, supply and promotion services. Finally, a coherentstrategy for the export crops sub-sector should take account of therelationships between external and domestic markets and prices, and betweencash crops and foodcrops, both at the level of the producer and in thecontext of national policy for the agriculture sector.
7.28 The main outliaes of a possible strategy and timeframe for exportcrop development emerge from this review. From a loag-term perspective,the three main export crops (coffee, cloves and vanilla) evidently offerlimited prospects for ecozomic growth. Long-term goals (for the 1990s andbeyond) must therefore focus primarily on regional, crop and productdiversification. Medium-term goals (1986-1990) should be set to assistdiversification and expansion. For the remainder of the 1980s, however,sustained growth in export crop earniags will depend heavily on theexisting major crops and on increased trade among established lessercrops. Short-term goals (1984-85) should therefore pave the way for thisprocess and should optimally focus on accelerating rehabilitation of majorcrop exports and market diversification, oa expaasion of lesser cropexports, and on preparation of a strategy and action plan for long-termdiversification and development. Recommendations in the previous section

- 106 -
(paras. 7.U7-7.25) suggest possible priority componeats of a long-termdiversification plan, and elements of crop-specific strategies.
7.29 Preparation of a long-term strategy and action plan will requireattention is the short-term also to the range of major outstanding issueswhich have been highlighted in this and preceding chapters. Among thepriorities for early actioa will be, inter alia, to:
(a) establish a co mmn resource base of statisticalinformation, surveys and studies relating to export crops,and make this material available to all concernedministries and agencies;
(b) improve manpower capability in appropriate institutions,particularly with regard to economic analysis, marketabalysis, development plasning and management;
(c) formulate and adopt appropriate pricing and inceativepolicies to promote efficient production, marketing andtrading of export crops;
td) initiate review and reform of institutional structures andservices;
Ce) accelerate improvement of basic marketing facilities andtransport infrastructure;
(f) enforce rigidly existing criteria for quality control ofexportable crops and their coaformity to export standards;adkd
(g) initiate measures to expand private sector initiatives,participation and isvestment ia the sub-sector.
7.30 The outline of a possible timetable for follow-up action to therecommendations of this report is provided in Annex 1.

-107-
AnnexMain Elements of an Action Plan
Proposed Iomediate Steps (1984)
- Review framework for preparation of long-term strategy and action planand establish inter-ministerial task force on export crops tocoordinate.
- Initiate improved information system, accuracy of statistics, quality ofanalysis.
- Analyse actual costs of production, marketing and export operations.
- Review crop-specific and relative price levels and cash/foodcrop pricerelationships.
- Review suitability of organizational structures and institutionalresponsibilities.
- Identify options for reducing bureaucratic controls and/or making.essential controls more effective.
- Mobilize MC and private sector resources to exploit current exportopport.nities (e.g. coffee in non-ICO countries; cloves; othersidentified)
- Complete short-term plan of action, 1984/85, including measures to:
Raise producer price for coffee (by 15-20%) in May 1984Implement emergency program to rehabilitate selected feeder roadsRe-orient existing extension program in priority zonesEnforce rigidly existing criteria for quality control, and reject allproduct below legislated standards
* Review rural market operations (organization of collection, prices)and paymentsIdentify priority crops for development under diversification programDecide options for restructuration of Stabilization FundsReview role, costs and benefits of the four parastatal tradingagencies (and alternatives to the 10% commission)
* Designate research institute responsibilities for specific crops. Complete inventory of crop handling requirements in the ports

- 108 -
Annexpage 2
Proposed Subsequent Steps (1985)
- Complete medium-term (1985-1990) Agricultural Export Development Plan,including regional and crop strategies and investment program.
- Prepare investment code to attract private capital for export cropdevelopment.
- Complete revision of statutes and reorganization of Stabilization Funds.
- Complete and implement a program to overhaul the quality control andinspection system.
- Rehabilitate and expand export crop research and post-harvest technologyprogram, including localized pilot projects.
- Initiate improved process for price setting (based on cost criteria,strategic goals and marketing priorities).
- Initiate manpower training program (including upgrading of extensionstaff and marketing management; training of agricultural economists andcommodity specialists).
- Implement reform of parastatal operations for export crops.
- Finalize program for rehabilitation of roads, bridges and ports.

- 109 -
Tabae 1. SflXMUE OF M(1 MAlN)TE ME= (c.if.) 1978-1982
NG mini (current pri) Ferae nqx_Lton
1978 1979 1960 1981 1982 1978 1979 1980 1981 1982
N1r-Food Coweanr goods 17.9 22.9 22.0 16.0 15.5 17.3 12.8 10.7 9.0 7.8Pbood Iports 15.0 17.7 18.7 27.7 46.1 14.5 9.9 9.1 15.6 23.2
Of wdhch: riee (8.9) (8.9) (11.7) (18.0) (38.0) (8.6) (5.0) (5.7) (10.1) (19.1)Energy 12.7 20.7 33.6 35.6 44.8 12.2 11.5 16.3 20.0 22.5Raw mterials 25.2 36.0 43.6 31.9 35.1 27.3 2D.0 21.2 17.9 17.7Capital goods 25.9 71.5 70.3 62.7 53.0 25.0 39.9 34.1 35.3 26.6CCher I^ports 3.91/ 10.5 17.8 4.0 4.3 3.7 5.9 8.6 2.2 2.2
Total MerdmodLse 103.5 179.3 2D6.0 177.9 198.8 100.0 100.0 100.0 100.0 100.0bports (ci.f.)
Source: DI, StatEstiques du azmmere Extiew de

- 110 -
Table 2. Sl'dUJCJRE OF ClNDTSE E3R (fo.b.) 1978-1982
ES BiUion (cuzrent pd.0m) Prceotaw Caqos±iti
1978 1979 1990 1981 l982 1978 1979 1980 1981 1982
AgrLzlbtural Proclcts 74.8 71.4 70.3 65.4 91.1 85.8 85.2 82.9 78.3 84.4
2iezf£&tured Goods 5.7 5.7 5.9 6.0 4.9 6.5 6.8 6.9 7.2 4.6
mineral Products 6.1 5.8 5.4 8.0 9.3 7.0 6.9 6.4 9.6 8.6of hich: Petrolem (1.4) (2.2) (1.4) (3.7) (5.6) (1.6) (2.6) (1.6) (4.4) (5.2)
Other EVxpots 0.6 0.9 3.2 4.1 2.6 0.7 1.1 3.8 4.9 2.4
87.2 83.8 84.8 83.5 107.9 100.0 100.0 100.0 100.0 100.0
Souce: IE, Satistieiyes du Edrce E&iczr d

- 111 -
Table 3. Value and Volume of Total Exports, 1960-1982
Year Tons FMG BiLUoz
1960 235,115 18.41961 246,012 19.1
1962 329,605 23.21963 304,030 20.21964 303,649 22.61965 287,345 22.61966 378,728 24.11967 489,402 25.71968 561,506 28.61969 592,419 29.11970 782,001 40.21971 700,593 40.81972 714,968 41.81973 731,741 44.7
1974 778,065 58.51975 631,658 64.61976 563,227 66.01977 457,745 82.91978 428,825 87.21979 404,170 83.81980 372,000 84.81981 1/ 302,605 83.5
1982 T/ 305,754 109.1
1/ Source: EIC

Table 4. IMadagacar Crop Produettes, 1.73-1982 (tonc)
19731/ 1974 197S 197t 1277 1978 1979 1960 19812/ 19822/Cereals Clalac
1,913,300 2,013,440 1,972,100 2,042,500 2,154,130 1,913,540 2,044,935 2,108,910 2,011,910 1,967,405 Paddy Wa.se 107,870 118,090 119,765 136,045 121,965 114,64S 116,440 127,570 320,656 112,855 HalfSotarh 610 1,150 2,305 ISO 300 530 1,090 J,000 1,280 1,315 Soriho
Pulses Llusueaussaals 35,675 33,800 30,650 41,165 34,695 36,675 40,915 38,415 35,570 34,600 Haricot$
lutter seasc 18,120 23,920 23,515 16,825 14,900 6,065 9,680 S,920 S,OOO 6,185 Pole du copOther fulece 1,860 3,340 6,070 S,560 1,935 3,710 0 0 0 0 Autree llguulaeueee
*eoto sad Tubers Tubirculeeotgr;acisePWtatos. 111,100 115,920 171,630 133,545 147,565 181,000 163,005 166,150 160,630 200,500 Peue de terIreC^eaava 1,174,790 1,264,175 1,309,335 1,389,665 1,412,220 1,594,450 1,569,000 1,653,665 1,670,070 1,741,980 HailocSweet Potatoes 246,355 265,370 279,300 412,300 386,445 324,960 364,545 373,255 398,175 363,430 Patates doucliTero 86,050 76,900 6S,250 84,110 56,950 72,210 15,875 79,62S 77,370 78,155 Saoajo (taro)
ladualttal 6 Culturfi.Export Crops ladustriellaa
Sugarcane 1,041,250 1,317,200 1,377,545 1,267,148 1,280,715 1,374,930 1,444,320 1,394,985 1,420,380 1,459,240 Coann i evertOrouadaute 38,060 40,040 41,790 54,195 46,580 34,015 40,220 39,075 32,930 33,950 kAch1dcaTobacco 5,940 3,610 4,255 3,967 3,117 3,097 3,400 2,920 4,160 4,180 TabacCottos 30,629 33,341 30,726 34,731 37,081 33,080 30,465 25,210 28,010 25,610 CotoSCoffee 73,880 80,960 83,560 78,930 68,380 78,200 61,565 79,880 83,460 79,735 Caft (vert)Cocoa 1,200 1,560 1,J80 1,557 1,202 1,530 1,690 1,690 1,855 1,655 Cacaopepper 2,520 2,820 2,950 4,860 2,865 2,500 2,545 2,755 2,955 2,460 PolvreVCIIlls 1,775 1,310 1,825 1,555 1,000 4,600 2,300 2,960 4,295 4,045 Vasille (Sachs)Cloves 4,305 17,815 4,500 12,930 1O,900 12,790 4,180 12,2S0 10,800 ISSOO Otrofie (clous)tuag 011 Secds 2,000 1,710 550 1,530 1,660 1,095 0 0 0 0 AlourttaaSisal 30,900 29,980 21,000 25,425 26,290 15,920 14,850 16,020 15,380 15,100 Sial
Vegetables AquaesGrose Deals 1,870 710 1,740 1,580 1,454 1,627 1,665 1,547 1,613 1,630 Haricot$ voltsCarrots 5,125 8,325 2,875 3,500 3,589 3,478 3, 30 4,261 4,528 4,670 CarottemTursips 980 1,055 200 130 191 192 244 241 168 160 NavetaOaioas 4,125 5,500 2,085 6,690 4,300 4,523 4,548 4,502 4,787 4,93s Ofi*oa.Caulitlower 1,050 1,080 688 463 480 530 535 535 57 110 Choux flouroToeutoe 11,875 11,205 2,618 2,870 3,896 3,746 7,712 8,644 6,195 10,485 Toaet.sCucu.bexa 1,055 1,375 607 615 5I8 510 715 575 645 580 CoacobresCabbage 1,160 1,390 6,215 5,390 6,853 6,721 6,504 8,707 10,179 10,320 ChouxWatererean 270 370 27S 135 236 231 749 754 651 895 Creacoas
PruIts Frutitnase 300,010 324,900 436,555 550,690 267,270 240,070 250,080 270,175 * 260,300 280,655 Unacoec
Citruc Frusta 80,475 90,610 81,400 64,615 78,365 79,745 59,100 56,860 59,435 56,025 AgrumesPtseapple. 51,230 53,800 73,865 38,535 43,380 45,745 48,395 53,230 45,175 S0,275 ArsacaPeached/Plum_ 11,145 10,680 4,860 6,470 11,790 12,680 13,370 0 0 0 Pfchae St prusesApricots 330 330 220 335 365 485 S10 650 710 78O AbrIcotaApples/Penrn 5,350 6,295 4,500 2,880 4,165 4,545 4,190 5,618 5,6S3 6,290 Posse. t polrecOrapes 2,665 3,290 2,515 4,580 4,630 4,060 7,970 8,920 8,070 8,420 Visdea (rcSaia1)
Lychee 58,340 31,760 37,875 23,625 16,645 26,550 25,740 31,950 32,815 34,555 Letchis
Voractry Products Produftt f4erantierRaffia 10,620 9,425 12,375 1,3120 7,74S 7,365 7,225 7,640 7,640 7,605 Reph-lPakh 1.440 410 520 110 385 265 385 430 430 535 Paka
TOTAL 5.4866324 6.011.912 6.248,131 6,331.456 6,269,612 6.256.842 6.461.327 6,627.494 6.559.767 6.627.155 TOTAL
1/ soumcu: Hislatire du DIvOloppeoent at de La R6toru Agretre2/ SOUJRCE INS11, HIC

Table 5, Hadagascer Exports of Agricultural Products &ad Hasufactured Agricultural Goods, 1973-1982 (toms)
19731/ 1974 1975 1976 1977 1978 1979 1980 19812/ 1982 2/AaIcturel Products Prodults agricale
Coff1tura1 --oducts 65,402 65,381 67,437 72,960 50,189 55,157 63,057 69,470 56,034 52,948 d fVasilla 720 l,353 858 1,101 1,713 1,459 437 410 652 1,061 Vacill1cloves 6,240 5,070 22,254 4,399 3,598 14,767 13,513 4,360 9,308 10,471 Girofle (cloves)Pepper 3,:40 2,898 4,095 3,943 3,748 2,153 2,570 3,069 1,440 2,130 PoivrsCocoa 1,046 1,139 1,246 1,653 1,57., 1,208 1,834 1,529 1,730 1,530 CacaoRice 6,276 6,532 4,547 4,397 2,483 1,127 1,059 1,464 1.781. 20 RigButter eares 19,097 19,790 16,476 14,865 12,078 8,608 7,635 3,708 330 2,029 Pole du capBaesass 6.557 7,015 4,487 5,767 4,196 5,501 4,360 2,268 1,335 423 esnanessisal 22,814 21,057 23,086 16,271 17,010 15,228 15,423 13,457 13,906 15,445 SisalRaffia 4,076 3,818 4,125 3,394 2,115 2,342 2,546 2,573 1,806 1,664 RAphiaiedicisal & Perfumery 1,272 1,496 1,596 . 1,492 1,363 690 878 947 306 876 Plants$ pourPlaet. partumarle & MIdacias
SUBTOTAL 157,092 160,741 162,320 137,399 108,506 116,273 122,852 113,823 93,926 93,243 SOUSTOTAL
Hasufactured ProduLts mamufacturisAgricultural Goodsfish 7,027 14,337 6,762 3,300 4,315 3,489 3,563 3,436 3,18? 3,679 PolssonMeat 12,825 10,855 5,351 3,857 4,126 4,544 5,977 7,105 2,111 967 Vi,sdoSugar 37,286 13,612 39,897 29,953 26,350 23,240 19,580 24,003 11,200 10,450 SucreHolssses 8,850 36,000 21,500 17,009 21,350 22,300 17,730 27,620 23,200 22,000 "SlaesTepioce 3,205 1,790 1,620 3,592 1,568 2,510 1,128 1,130 1,232 1,073 TapiocaCloves Oil 1,346 1,128 261 1,316 94A 1,056 929 726 699 680 Kessc. de gtrofleYIsaS Y1Sag OIl 28 24 19 21 26 18 17 12 18 0 Eassace de ylaag yls*gOil Cake 13,032 6,772 8,173 9,059 10,487 7,775 5,285 5,895 3,843 0 TourteauxCottos Thread/Fabrics 812 2,508 3,200 4,579 4,240 3,004 5,506 2,109 3,191 3,592 File G tissue de cotosRoaawood 1,108 2,794 385 891 0 2 219 0 55 0 3ai. brut des
palissanidre.
SUBTOTAL 65,667 64,628 75,055 66,420 64,969 59,905 50,394 61,495 43,438 37,795 SOUSTOTAL
TOTAL 222,759 225,369 237,375 203,819 173,475 176,178 173.246 175,318 137,364 131,038 TOTAL
Il SOURCEs INSRE, Statistiquea du Commerce Exterleur do Madagaecar2/ SOURCEs INSRE, HIC

Table 6. Hadagasecar exPorta of Alricultural Products sad Hasufactured Agricultural Goods, f.o.b., 1973-1982 (n0G million)
19731/ 1974 1975 1976 1977 1978 1979 1980 198,2/ 1982 2/
Amfricultural Product. rdlx*rolCoffee 13,330 15,600 14,073 28,326 40,456 36,583 38,074 45,110 29,693 32,045 VtfX
Vasilla 2,217 4,476 2,966 4,133 8,752 8,645 3,114 3,945 7,924 19,781 VasillaCloven 4,058 4,008 17,345 4,304 4,930 17,200 15,008 6,583 21,233 27,483 Girofle (clous)
Pepper 1,025 1,047 1,362 1,520 1,826 742 972 1,122 577 932 Poivre
Cocoa 238 418 332 561 1,130 757 1,116 677 692 635 Cacao
Nice 560 1,071 565 499 377 171 157 218 266 7 RixButter lease 815 1,643 1,225 1,134 1,105 1,157 781 587 58 549 Pole du tap
Bassao 227 249 200 302 247 337 252 151 60 25 lassoes
Sisal 1,552 2,546 2,134 1,242 1,497 1,209 1,744 1,711 1,813 2,242 Steel
RAffi 473 610 787 631 397 433 488 512 321 361 Raphia
Hedicinal * Perfumery 223 355 513 580 565 313 341 859 107 364 Plastes pourPlastu Parfu-rit & Kdidecia
SUBTOTAL 31,571 39,831 46,154 48,5169 67,613 72,812 69,059 68,790 68,465 92,222 SOUSTOTAL,
Manuf actured Prodults masufacturlsAgricultural GoodsFish 2,216 3,534 2,380 3,087 4,554 3,116 3,686 3,194 4,497 6,941 Poissos on crustauci
Nest 4,667 4,274 2,272 1,597 1,777 2,149 3,326 4,119 1,224 857 Viande A prep. de v.
Sugar 1,574 1,728 4,770 2,218 1,703 1,434 1,365 2,500 2,300 1,164 Sucre
Nolasse. 58 388 129 194 152 262 308 SOO 390 220 mIldsesI
Tapioca 207 139 145 330 163 228 147 157 184 56 Tmploae
Cloves 011 1,296 2,004 225 1,240 1,094 1,157 1,004 668 768 966 leagece de gIrofle F
Ytlec8 Yaag 011 131 145 106 129 200 144 125 87 111 0 Euseace de ylasg yaIng84
Oil Cake 451 224 166 234 378 243 163 179 178 0 Tourteaux I
Cotton Thread/Fabries 464 1,395 1,221 1,915 2,198 1,530 1,917 1,253 2,013 3,490 Fill & tissue de cotow
Wood/Paper 309 463 186 237 300 269 181 163 8 37 Sofs A ouvrages eapapier
SUBTOTAL 9,741 12,198 6,701 8,769 10,664 8,836 10,549 9,820 8,983 12,347 SOUSTOTAL
TOTAL 41,312 52,029 52.855 57.285 78,277 81,648 79.608 78.610 77,448 104,569 TOTAL
I/ SOURCE: INSRE, Statletiques du Coa rce Exterleur de Madagascar2/ SUNRCEt INSRE, HIC

Table 7: WORLD NOT tHPORTS OF COFFPE BY MAJOR REGIONSICOUNTRIES
Trend Crowth Rates1961 1965 1970 1975 1979 1961-1979 1961-1970 1970-1979
----- (Million 60 kg bags)…---------- -----------(Percent)----…-----
United Statee 22.4 21.2 19.4 19.6 18.5 -1.9 -1.7 -2.4EEC 12.4 14. 16.9 20.0.. 22.2 2.8 3.6 1.9Middle Europe 0.7 0.9 1.2 1.6 1.6 4.9 5.8 1.8North Europe 2.4 2.7 3.7 3.4 3.8 1.2 4.2 -0.7Soutih Europe 0.7 1.1 1.9 2.0 2.4 6.6 11.6 1.0Japan 0.3 0.3 1.4 1.8 2.9 15.0 21.6 7.4Other Industrial 1.5 1.7 2.0 2.4 2.3 1.8 2.8 0.17 I
Centrally Planned *EconomIes 1.3 1.7 2.7 3.2 3.1 5.5 9.0 1.7
Developing Countries 1.8 1.9 2.0 2.7 3.3 2.6 2.4 5.4
TOTAI. 43.5 45.3 51.2 56.7 60.1
World* 46.2 50.0 51.9 59.6 62.1 1.5 2.0 0.6
* World total taken from USDA to ensure consistency between production, export and producer stockdata in th¢ model.
Source: World Bank, Analysis of the World Coffee Market--Commodity Working Paper 07(September 1981) p. 7 from FAO Trade Tapes.

-116-
Table 8. Coffee- Prices, 1973-1982 (Actual), and 1983-1995 (Projected)
ICO Indicator Price, Other Mild Arabicas
Actual 1981 Constant $ Current $
cent/kg rentlb cent/kg cent/lb
1973 398 180.6 137 62.01974 567 257.3 146 66.21975 216 98.0 144 65.31976 463 210.0 315 143.21977 701 318.1 517 240.81978 413 187.4 359 165.91979 394 178.8 382 173.21980 328 148.8 343 155.61981 282 127.9 282 128.41982 315 142.9 309 140.1
Short-Term
1983 306 138.8 290 131.61984 306 138.8 300 136.11985 295 135.8 312 141.6
Long Run
1990 265 120.2 414 187.81995 315 142.9 658 298.5
Average
1960-1970 305 138.4 91 41.3
1/ SOURCE: World Bank Economic Analysis and Projections Department(January, 1984)

- 117 -
Table 9: Price Differences Between Ceatralsal and Other Kinds of Coffee
New York, June 1983
Arabicas (U.S.cents/lb) (U.S.cents/lb)
Kenya - AA. type +30 Uganda - 7Tanzania +18 Madagascar, Camerooa,Columbia UGG + 3 Ivory Coast - 8Brazil - 2.5 Sri Lanka, Liberia - 8Rwanda, Burundi, Ecuador, Brazilian Robusta - 9.5
Domixican Republic - 3 Indonesia EK-1 -10Indonesia 20/25 -17
a/ Guatemala, El Salvador, Mexico, Nicaragua, Costa Rica
SOURCE: T. Akiyana, Prospects of World Coffee Economy and TheirImplications on Produciag Countries (Draft Paper, World BankEconomic Analysis and Projections Department, Revised: October 24,1983) from interviews with coffee traders and various issues of"Complete Coffee Coverage', George Gordon Paton and Co.

- 118 -
.abl%: 10.
UEORTItIGC W.MBERS VITtTLF.D TO A BAS IC .7p10AIsta.r-3 =?-a u*iu&L-=roa-rquTA or 56;: XKLLottG-Ss
Shre of annual quotaSOars Of of all MmbeC3 entitled Anounc ot
annual qUota laftial to a bauiC quota each upvard andgiven in Anndx 3 annual aubject to quoca/price dcawnwrd quotaof tiw Ayrec-ar.c quota *djUwtsencs adjustmencs I/
qporting emgber CptrcencJ (60 kile bags) (percent) C60 kilo ba4si
TOTAL (vich Angola4an lhilipiPitc-) 52 939 600 100.00 2t 1 000 000 21
SOAL Cvichout AngolaaLd lbilippints) 100.00 5219 600 G
Colombian Kilds 20.12 10 466 344 19.94 199 398
Colombia 16.28 s "8 791 .16.13 161 312
Kenya 2.48 1 2S 086 2.46 24 578
Sazania 1.36 707 467 1.35 13 478
Other 2Eilds . 3.36 12 tS1 777 23.16 231 509
costA Rica 2.16 1123 623 2.14 21 407
Doinican Rep:b:ic 0.f5 494 186 0.94 9 415
Zado. 2.17 £128 825 2.15 21 506
El salvador 4.6 2 330 478 4.. 44 399
casaCenaa 23.47 1 105 080 344 34 389
loodeca a 1.49 775092 - 1.45 .14 767
Tudia 1.24 .645 043 1.23 12 289
lAnic 3.65 1895. 715 3.62 36 173
Nicaragua 1.25 665 651 1.27 . 12 685
P89mM New Cau-s-' 1.16 603 427 1.15 11 496
Peru 1.31 651 457 1.30 12 933
Brazilian and other Avabicas 33.45 17 100 557 33.15 331 505
5caai 30.82 16 037 6U3 30.55 305 540
thliopia 2.2 1 362 914 2.60 2S 965
tabustas 23.07 12-920 922 23.75 237 588
tedoresia 455 2 366 892 4.51 AS 093
0A~CA1 2/ ll.ff 6 221 544 11.835 118 529
Uganda 4.44 2 309 670 46.40 44 002
Zaie 2.12 11 02 816 2.10 21 010
lbilippiaaa 470 000 4f 0.89 8 954
Angola 450 000 5t 21 2
11 See paragraphs to of the decision21 Excludes Aniota inLCfL iL not *ubject co upward and downw.rd adjustuenee
EAcludes Hercers of COA.CAF exempc frou baaic quoCtJ; :th &annul quota of al1 2eberS of OAI.AF
is 6 915 030 ba;Cs (see 73Le 3)t See Annex 3 cf rZsc 1963 A4rw.enc
see documenc £5-2:39133 dated 14 July 1983
Source: ICO

- 119 -
Table 11.-~~~ ~~~ coyn Yt t763184
* ~ ~ ~ ~ ~ ~ ~ ~ ~vm mw YAmo aswazn i4 rAINtIA £I4ML 0 E'IhIU?qUOAS=A
(10 kile bags)
Q.aaterty qutu
annual Oct.-0... Jan.-MIatch *AriL-Juw July-Supc.t; Membe quta 1953 1914 1914 1914
- 1 (2) (3) te) (r5
SO.L 56 200 0c0 14 0L9 9g9 16 050 007 14 049 995 14 050 001
A. sub-CoCal: M be.eec eLed tO * tastc quWeL 53 633 06 OU IJ40d 270 13 LOS n1 13 405 270 13 408 270
Cete bian Milds 10C6 3&4 2 61 586 2616 587 2 U16 556 2 616 585
Cga1mi8 s 61 79t 2 III 191 2117 1914 2 117 198 2 117 197e78 1 290 014 322 521 322 522 321 5Z1 322 522Sam;i 107 467 174 567 176 861 176 $67 176 8U
0tlea Iilds 12 51277 3 037 4 3074 3 02 3 5 944 3 037 943
cost Rice 123 623 280 90 2P 905 280 906 210 905Dmsiacan lewiLic 694 1n 123 5L6 123 567 123 34 123 547friaet 1 125 825 252 206 282 206 2U 206 232 207UI Sal¶ded 2330 470 582 519 582620 5 52t9 542 20CustevaS 10S 01s0 '51 270 451 270 651 270 451 :70
oswer" 773 092 193 773 193 773 193 773 193 77tAia 645 043 161 261 141 261 161 261 161 260Hesien 1 895 715 474 679 474 079 674 67 47' 578Nicaragua r5 851 166 413 166 43. I"6 4*3 154 463laps NeW Gum. 503 427 150 $57 110 837 IS0 857 150 856isru 651 437 170 364 110 365 170 314 170 363
Brazil iseam OChet Arabica- 17 600 SS? 4 350 139 4350 14O 4 350 139 4 350 139
razil 1 037o 3 4 009 411 4009 411 4 009411 t 009 410aiepis 132 914 30 728 350 729 240 728 340 729
toEiata D613 4408 3..03 601 3403 603 3 403 601 3 403 603
hgela 450 000 112 500 112 30 112500 112 SOOZvio;eai.a 235 682 591723 591 723 39723 591 723
OACAI1I 6915 030 1 72 757 1 72 58 1 72 757 1 72 75UAilPPIS 470 000 117 500 117 500 117 500 117 50SUpuda 2 309 670 577 417 577 *1 577 417 577 418aiz I 102 815 27 704 25 704 275 704 375 704
5. 5j-e.c1~Member.expt rew astc qgpoSJi
OArJWr tunQ^I2 56 914 "1 726 41 731 641 726 6461 731
Sab-togal! Members cimoetint1T0 000 bSt Or Less 21(WiLhoUC OAW%£IJ 477 272 1 n19 317 its 319 119 317 119 319Cbm so 512 1U25 1RS 4 124 62J 12428Jeaic 17 467 4 36 * 467 4 37 4 366Malawi 33 38 5oh: 5842 54a2 5 142Nieria 73 6@s 1s 352 15 352 18 33Z2 18 352PaNama 55 5s 1is 4 1 U 16 464 14 463Sri La"k 5 053 13513 13 313 13 513 13 514TriSidad S" Tobago A 226 8 536 a S57 8 556 5 557ImaimL so 254 20 063 20 066 20 053 20 044Z -bae 78 14129 -19 532 19 19332 19 533
fub-cocat! kembr. *-qareiftonto than 19 UO io aXcs4VLCIo"c w-PIc") 2089442 522 409 5224 12 522409 522 12
b11via 109 759 27 40 27 a0 27 440 27 439bsm>di 450 000 112 500 112 5W 112 500 112 500Goines 100 317 25 079 25 o0 25 o0 25 080
;iti A1t 032 100 255 100 225 100 258 100 258Ubtci I" 294 32 573 32 574 32 573 32 57'
araguay 1011 U41 27 203 27 204 27 203 27 ZO(cua.d- 6.0 000 112 500 112 500 112 500 112 100
Sierra Lame 234 424 5L 656 5S 656 38 656 Ss 456,.il_ d 104 102 26 200 26 201 2520no 2 l0t
bC-e T he "Ogg _sw. g Che quatp rt-r. repre acmts 25 percan .1 eOA Cawr'.pemdifg Oatmal " cS Lmcolume (Ii
I1 ltade -i obers of OAMCt exp.c from bas qQeca--'3 Ibers at a-bjct ca to mcaty -uacas. The quarterLy quota ago .eicatedfource: ICO

- 120 -
Table 12. MADAGASCAR
Coffee Production and Exports
(tons of green coffee)
Year Production Exports
1973 73,880 65,4021974 80,980 65,3811975 83,560 67,4371976 78,930 72,9601977 68,380 50,1891978 78,200 55,1571979 81,565 63,0571980 79,880 69,4701981 83,460 56,0341982 79,735 11 52,9481983 81,855 XI 50,655 2/ 4,1984 80,100 3/ 52,254 -S /-
SOURCE: MPARA For production and INSRE for exports
I/ Unadjusted (in March 1984 MPARA reported an adjusted figure of 81)225)2/Provisional3/Estimated41Source: Central Bank

- 121 -
Table 13 COFEE
EXPORTS SY ICO EXPOPTISC MF-BCRS TO W0NU-EMlERSIASED ON CERTLFICrATs OF ORICI: S! PORLM I
JAhWCARY - oFCrIbER 1977 TO 1912
(in Thousande of SsiLE of 60 il.s)
-Oauar-De-ceber-
Exnorttnp. Mmber 1977 1973 1979 1910 1981 1982TOTAL 4~~~~~~-. 4,86 532 5,4 L. 54A 8.246 9.04-7*
A. Sub-Tot., A 393 5.284 5.646 6.*85 6.187 8.896Colo-btan iilde 616IT 7 I T1 1 1.062 TT .Colombia MI6 TM -.- 1 mur 902Kenya 99 60 37 53 164 366Tanzania 16 30 55 116 274 266Other Milds 901 9t7 1 237 1 182 I 974 2.815Costa Rica TE.-l1a J 26f 3 32Dominion Republic es 55 96 129 107 36Ecuador 105 205 248 166 112 486U Salvador 37 23 13 - 29 0
Ceatemla 27 6 29 S 260 706Ronduras 1 13 0 36 79 93ladia 434 415 484 740 625 606Mexico 19 25 236 38 62 233 /Nienragua - 4 2 28 183 asPapua 1ew Guinea - 0 0 3 186 1177eru 44 58 42 6 22 16Brazilian and
Other Arabicss 1.520 1 993 2.070 2.294 2 778 1.642Irazll 1 2I2 .. 1416 T13 T95LM 21.W732EthIeoia 278 362 324 343 212 110tobustas 1 682 1 758 1 56 1 U86 2 273 2.705Angola '6i.L4 i rJSl 240Indoneia 9 75 56 185 611 1.497OA0CA (485) (814) (764) (959) (1.184) (884)
Denl" 0 0 0 0 a 0Cameroos 0 0 5 46 46 169Crat. African Rep. 0 6 - - 0 0Conto 2 1 0 0 0 0CGbon 0 0 0 0 0 0Ivory Coast 340 717 632 693 816 588Msdaasecar 143 90 127 222 320 127Togo 0 0 0 0 0 0
Thllppl.s 0 a 0 2 6 2Uganda 247 252 161 152 38 62
=lire 25 4 12 4 *0 20
3. Sub-Total 2/ 93 Ss 94 63 59 131Arableam Ti I T T12NlYvi Tr 'a 32 BUT110 9 19 26 9 2 35taiti I - - 0 0 0Jamaice I - 2 - - 2Hales 0 0 0 0 0 0 'ri 0 0 0 0 0o
Pargsu a o 0 o 7 I5 15Rwanda 11 10 7 1 6 50Venezuela 0 0 0 a 0 0ZAb.bve 0 0 0 0 5 61obustis 55 17 27 27 31 39Ghana 0T- u- 0-GuInea t5 11 16 lo 6 3Lborla 0 1 1 2 18 32Nigeria 0 0 0 0 0 0Sierra lone 26 0 2 0 0 0Srtlanka 0 a 0 0 - 0Thailand 0 0 0 0 0 0Ttin.deda & Tobago 14 5 8 9 7 4
Motoe: txports to Ibnng Hong N ungary and Israel whIch ceased to be abers onOcMobLr 1. 1982. are Included In tht. table am exports to non_-mbers.
* Prelimtnary - lose than 50W bags.1 tsbers encttld to a basic quota.
Mesbers exempt from basic quotas.ExcIudag the quarters JuDy-September and October-December 1982 for which
Certificates of Origin in Foru X w%re not recelved: the reported export&to nos-meubor countries were 16.377 baots in the quarter July-Septemher1982 and 57.981 bAgs in the quarcer Oetober-0.cember 1912.
' Malaiw teportcd a sall vol.me of exports to non-euFhecr in the quarterOcrober-DO esher 1981. but no Certificates were received.
No Certificates of Origin In Foro S were received from Par*agua incoffee year 19l1J82.
Source: Internato*t,l Coffee Organizatlon tocument !fI 222/03. mareh 9.19E3.

- 122 -
Table 14. MADAGASCAR
Cloves Production and Exports
(tons of dried cloves)
Year Production Exports
1973 4,305 6,2401974 17,815 5,0701975 4,500 22,2541976 12,930 4,3991977 10,900 3,5981978 12,790 14,7671979 4,180 13,5131980 12,250 4,3601981 10,800 9,3081982 15,800 1/ 10,4711983 7,775 2/ 1,972 2/ 4/1984 10,730 I/ 6,500 S /
SOURCE: MPARA For production and INSRE for exports
I/ Unadjusted (in March 1984 MPARA reported an adjusted figure of 9,905)1/ Provisional3 Estimated4/ Source: Central Bank

-123-
Table 15. Indonesian Imports of Cloves (c.i.f.)
Year Weight 1/ Value 2/
1973 12,991 37,7011974 4,892 14,8961975 28,948 89,2761976 L0,291 41,5921977 3,787 14,3221978 9,791 49,3301979 10,993 68,0491980 9,510 60,9211981 14,492 120,117
1/ tons2/ USS'000
SOURCE: United Nations International Trade Statistics Handbook, Years 1974-1982.

-124-
Table 1.6.
1616 v ~~~ -I amI am1.aw 6.019 1.317 6.194. .7 1.17) 1713 S.433 1.07t 1.176 132.61
in. so za~~~~~~~~1 Go m" Ss in, n~ no go. e1gm.. 399 5.436 116 3.~~~~241 67W14 2.7 n4 2.56 1ST 4.
6~~. 1'u4.~~~~. 429a 3.06 no01 3572 361 2.46 "16I 2.13? Su 4.511111617 136 709 79 64* 63 6I 1 357 I' LO1 31 SAYS
96613.2.63. 16?~~~~" a"9 toy I 1 131 i23n 6 IV 1.6 ing a.m9611. IliUmm. 11 446 31 My126 5140 1.46 55 1.231% gas 1.4646
same.,. h.~~~~~~ 243a 1.176 291 3122 no1 1.3w 33 .e'11 an .1
1 G1. n 73 t6 16 a3 in9 1
cow 1314 26 LU51 61 291P 210 313s 43 36162 16v 624
1*411* 233 136 =1: n16 30 n1 13 361 as 17939 14 It 132 as 171 31 116 1e a71~PM% 71 126 66 413 42 362 a4 G3A 1 16?
m.m. 11~~~~~~~~O 64 1 419 00. 16 7. S"4 Go 29 206 42 no6 42 21 se 412 66 36*
VmwIm~~~~~~~~~S 11 9 1 us1 S do 3s 39 36 M6P
66WO .6A 6626 lAaI 1.4116 1.393 S 3417 7.167r 1.431 7.836 :.GM 10.731 5.267 I.66
iVNsed 8Nu On1 4.411 1.232 6.313 161 4, .69Ag 1.331 6.91 .4£4~~~~~Sm 9~~~~ 642 40 aIss is m 6 36
wor *k1m am jam16"6 1313 3.17 6to 1.363 1o ."S1 1.066 7.7216 769 .9
616 who 36~~~~~~~a 1n9 .. . S"16191 13~~~~~~~~A 14 4 42 WS1 lIj 34 11 5
UMyM AN Z&1ANC1Pe 3in 147 inI 112 1in 1*66 4 O,nuu 63 336 to1 110 73 bn 9 ON3 66 1M
Tmhula II~~~~~~~~ as 31 314 IS Si 64 36 no
lUnau 41 31 . .
14.rAm *4 A141pM& 1.32 12 .9 116 244I 6la 1.3 66 4.36
66314.S& *6d co*m an 1.1911 21 .11 31 .: I.'lS 2" *j3 37own, fto.? 16 63 j 141 131 LS11 13 an 9
*ap 196 SAM6 36 1.460 366 1.13i 33 an 1.134, 3361.81.6s ?.419 5.61 6.566 3.13 14.S.633 3 %9G 140 3
14 13 31 43 33 1 13 an iu
16142 f 6~~~~~~~.196 13.m21 Z.6w 27.4s A.64 116om sI.n117 4.233 3eemw
_ -ye, a " 3ow'k
r ft.a pw a1 JMel NJO
it magammeum bwagg .m doma oft was" u.lrmemoss, aelt7 1 a"1 .alu aI.
Source: Iuternational Trade Centre , Spices: A Survey of theWorld Market (1982) Table 10.
1I/ Excluding Indonesia

- 125 -
Table V.7. New York Spot Prices for Cloves and
radagascar Producer Prices
NomiFnal Actual ProducerMadagascar Producer Export Price as Z of
Origina/ Priceb/ Priced/ Export Price
1973 179 280 650.3 43.11974 260 320 790.6 40.51975 261 320 779.6 41.11976 295 320 977.8 32.71977 330 340 1,357.0 25.11978 325 340 1,16i.0 29.21979 385 385 ,11u.0 34.71980 440 395 1,510.0 26.21981 445 430 2,280.0 18.91982 530 435 2,790.0 15.61983 470 435 3,347.0 13.0
a/ New York Spot, U.S. cents per poundb/ World Bank International Price Index Deflatedct FMG per kiLogram
Source: USDA/FAS 1984 for New York spot; MC and Central Bank for domesticprices for export.

- 126 -
Table 18. MADAGASCAR
Vanilla Production and Exports
(tons of dry vanilla)
Year Production * Exports
1973 1,775 7201974 1,380 1,3531975 1,825 8581976 1,555 1,1011977 1,000 1,7131978 4,800 1,4591979 2,300 4371980 2,960 4101981 4,295 6521982 4,045 1/ 1,0611983 5,010 oo 1,033 21 4/1984 5,110 3 958 ,' J
SOURCE: MPAR& for production and INSRE for exports
1/ Unadjusted (in March 1984 MPARA reported an adjusted figure of 4,830)2/ Provisional3I Estimted4/ Source: Central Bank
..* Note: 1973-1976 official statistics on production are confusing. Forthese years production data are assumed to represent drYvanilla; all other production data (including 1977, whenproduction was well below average) are believed to representgreen vanilla (beans).

PI# aqz ;o &aAzDS V :sa2rdS '-ex-1ua apr.2.1 -EuorTeuzs2uI :Oznoc
- AMe t 30" lAnU is5pm mmi mI-"as eV pm~uam a -sp it al' I-tA
onP meg VW pe5mem ~MvPo spm .nImat GM so opnisma "uaf iserm:a an mGoal Alt .sute .
to -- T
406 - a 1u as at Ca . me R S
150t at Ott IL I 9 L 5 Ss so c leI I Unt.C SC UtW! es ingt oat Ole As tios -SP- - : - a : Ii : - ,I9, siqeavmueg
- - P S S - Ut £~~~~~~~~~~~~~ -455
a CT~~~~~~~~~~~~~~~'
at9 to mm £, so: es ot aso To em stpmlV maam ma..
sUG"Pc a see Sti in : FRArw.V., u"r I - ott *zt :ei I - nI
WM oc sri 00 art go OUV 6! enl at
etna P ut. I 01 ig. our oons CIV mpT ioT mmOW a t "oIt le.C at *V P Ss Ie is St
555 oa osc jest I Ii 9 65 5 iI3ML of Is I oft £1 ai Sim Sc oin St
45! U (IC~1 a1 P* ZI4 p I
at i ~~ ~~o M9 61 I a? I
anEL a 09 0 St 9 I
95C* Pt at t £*cV!" UP P9 IC.* 30 a,an wvSCL 0 P Ut "v0 lit i9 15 a WC isinJ
grat. Sct 115O 5K &gm GoIi 8 ml Iw I St 001 PtSU. 11 0"A Ut WC Ut Ct St 131 5
I 0 c £ I a I g I"
-n. -4.* - d-&a~
'6E Diq'il

- 128 -
Table 20. New York Spot Prices for Vanilla and Madagascar Producer Prices
1973-1983
Z ProducerNominal Price
Madagascar Producer Export of ExportOrigin a/ Price b/ Price c/ Price d/
Actual
1973 660-680 220 3,079 32.91974 675-700 240 3,308 33.41975 785-810 240 3,457 31.91976 900-950 250 4,300 26.71977 900-950 280 5,109 25.21978 1,043 305 5,925 23.71979 2,800-3,000 500 7,126 32.31980 5,500-6,500 600 9,621 28.71981 3,150 700 11,018 29.21982 2,800 700 18,664 17.31983 3,000-3,100 1,000 21,849 22;3
a/ New York spot, U.S. cents per poundb/ World Bank International Price Index Deflator based on averageci FMG per kilogramd/ Percent includes conversion from uncured green vanilla to dry vanilla
units
Source: USDA(FAS 1984 for New York spot; MC and Central Bank for domesticprices

- 129 -
Table 21. Madagascar: Pepper Productiom and Exports, 1973-1984
Year Productioa Exports
1973 2,520 3,7401974 2,820 2,8981975 2,950 4,0951976 4,860 3,9431977 2,865 3,7481978 2,500 2,1531979 2,545 2,5701980 2,755 3,0691981 2,955 1,4401982 2,4b0 I/ 2,1301983 3,385 T/ 3,230 2/ 4/1984 3,620 / 2,300 I/ 47
SOURCE: MPARA for productioa and INSRE for exports
1/ Unadjusted (in March 1984 MPARA reported aa adjusted figure of 3,160)2/ Provisional3/ Estlmated4/ Source: Ceatral Bask

130 -
TABLE 22: WORLD IMPORTS OF PEPPER, 1976-1980
197 1977 _7 1 _7 1_60-- ml~~~~~~~~~~~~~~~~~~~~~~~~~IG
mm O V g v Q '4 0Q ' 0 v
2.2 V.= 9o 6 26.a 5 4a"04 27.15 479.474 21 .11 72 .45 ".517 4402LU.1qim4aus jI 1.26 2.7 1. 241 1.43I 4a.6 *a2Im 4.5 1.52 3.6
D_355. 656 01.27 191 1.5?n 49 L.747 73 l4 492 1.43511440 6.19 IO." 6.625 16.110 4.6 16.444 ?.00 15.2ae 6.9 S4,7430.635. .. 2p. 9.m "."0 10.07 24a5 3.453 25.*4 12.461 20.240 10.447 25.2 o0Zfail 3.644 S.9 2.9223 6,977 3,an 7.42 2.472 7.422 2.4010 6.170-
1.691 U .422 1.637 4.00 1.6I5 4.1, 2.736 4.*43 1.45 2.a6United K0 6 4.35 1 7.2,5 2.427 3.1 2,534 9.406 S,.014 11.4n 2.99 6.572
_.a. awar 14.455 221032 1 S.19 17.6"7 23,190 3.443 12.072 33.962 12.220 37.u62
_.2J7 4.16 3.117 4.317 2.265 4.457 2.476 4.46, I. 4.409-ft1~~ .. .. .. .Main u~~.i;m eo 1 . ," z.i "5;s ,;
01131 mop. 5t.f7 10.192 7.019 1647 4,96 12.95i s.469 14.297 S.77 14.27
10.167* 612. 1.622 674 2.16? 900 2.403 921 2.22 1. 2.402r_almi 182 421 120 4n 125 .9 202 622 174 470
62wq 331 11 270 7" 300 M 2"9 820 202 a3sSpam 1.27 2.12 L.46 2.575 1.375 3.21 1.45 2.m 1.400 2.30good" no 1.71 "a 2.239 725 2.1L 7" L.95 794 2.e
72S 1. in on X. 72 2.2 so 2.110 S0 2.022Torso&a"& 2.27 2.27W 2.132 5.91 791 1.924 1.1 2.345 113 3.zm
36.4 a" loaa 3oem Ma.l5 49.032 21.072 07.51 33.56 71.795 33.096 63.04 M=12 749233
1Z0do 2.420 4.244 225 .1 2.529 5.77 2.260 4.s92 2.125 4.4355114 Dtmt 2.303 41. 5 26.477 54.2 2.5 59.67 27.240 49.414 32Za_ 56sAE966lXJ6 956 L.959 1.001 2.90 1.256 .4,0 1,.643 4451 2.11 6.- *a1a- 26 6s 23 75 59 S 1 DWA19 S72 "a 745 1.770 2 11 .0 1.745- 4-;'1- 7 4U 5U I. D 1 267 4 S 1 1 27 5 . .
36.4 c m m Middle441. 6.546 12.642 13.406 24.212 16,978 332. 16.564 27.55S 2U.919 26,94sat
Allow" a40 1 an S.09 7Z 6.Sa S.72' 9.3 17k 57, *. 3 *,2 u J3pmc 1.007 2.062 52 2.0on 1.652 .652 1.267 2.274 O.540 2.995ULoi J4mb J _MLIy-V 218 22 U 322 267 6U 223 442 2S1 '4
_ 636 2.791 4.543 2.9 6.777 2.6"7 S.S22 .506 6.491 4.4*. 7.7dm1444 90S 456 401 1.219 1.000 2.407 301 51 1343- 2.i2W0gm 50 129 .. iu .. i ."
Sa, 1.1005 3 an AG LAS t.9 I.31 2.iV1301 24a
.166443- 146 226 1a 316 34 534 so S3
-t611 197 276 230 292 54 202 26_mil A~I. 1.43 2.100 2.446 4.50 3.246 5.294 2.372 4.975 S.27 6.090
810 36p1Le 27 s 220 Go 56 1.045 525 6n 122 266
141 3.1 406 ocean" 5.153 *.,62 5.49 13.627 S5.1 12.621 5.W U20o1 S.40 11a.
_, zm.IV 30 1.3f9 44 92 537 1.346 S02 1.15 1.227 2.49jog" B3.900 *.545 4.504 1092 5.67 9.314 4.146 9.47 4.30 9.3
23.747 45.567 25.927 52.726 1.543 57.S7, 3.382 5 .713 24.243 2,506La.ta.1j*-1.102 1.776 1.238 2.445 L.017 2.423 1.042 2.132 1.000 2.000Dm 26m1a._' 150 240 1S7 24 17 42 1 21 172 11*
10L 91.95 152s251 97.44s 23.912 100.96 1.247 1.375 .227 L.274 U10l
5m ,Cme1ad by Z1eft £6 w Urn tim31t1146 pa1a12611of .145 mId..fa ad agim nowny. mod 11.645UR&" Umti.6 614i1aUsL 015105.
.1 1914418 .E1*D Id 34.6m55.bt Pleal yr 21 36rk - 20 Malch.Cl 11 tiaiIu .31 16.1.!I llCam Y.W1 Z al - 20 J_.3
71 Dm141aM PWMm. CO"lm. ChLL.. Sol 24pri*.1/ 3.11.61 baro 13446 la.mw g..w.iam IqmIiIty .44 wit vjs1j.)amori boda soomstdpar s _us.e 4ai

- 131 -
Table 23. New York Spot Prices for Pepper and
Madagascar Producer Prices
Nominal Actual ProducerNew York Producer Export Price as Z of
Year Spota/ Priceb/ Priceb/ Export Price
1973 58.0 150 - -1974 82.2 175 - -1975 89.4 175 - -1976 88.1 180 - -1977 115.1 190 - -1978 106.6 190 497 38.21979 106.5 200 378 52.91980 89.7 225 362 62.21981 84.3 225 401 56.11982 71.6 230 480 47.91983 72.7 235 396 59.3
a/ US cents per pound (black)b/ FMG per kilogram
SOURCE: USDA/FAS for New York spot, MC and Central Bank for domestic prices

- 132 -
Table 24: Production ad Export Volumes of Principal Zrport Crops(In ton. Iousne)
1978 1979 1980 1981 1982 1983 21
A. Production
Coffe (green) 78,200 81,565 79.880 83,460 79,735 81,100 CafE (vert)Cloves (drid) 12,790 4,180 12.250 10,800 15,800 6,000 Girofle (sec)VanifS (green) 11 4,800 2,300 2.960 4.295 4.045 3,200 Vanilla (en gousees)
(cuxed) 1,065 500 643 934 879 696 (coodItionSe)Pepper (black and green) 2,500 2,545 2,755 2,955 2,460 2,495 Poivre (noir at vert)Cocoa (dried) 1,530 1,690 1.690 l,8L4 1,655 1,765 Cacao (sac)Sisal 15,920 14,850 16,020 15,380 15,100 12,500 Simallutter bean. 8,065 9.680 5,920 5,000 6,185 8,900 Pois du cap
3. Exprt.
Coffee (green) 55,157 63.057 69,057 56,034 52,948 55,000 Caff (vert)Cloves (dried) 14,767 13.513 4,360 9.308 10,471 7.500 Girofle (sec)Vanilla (cured) 1,459 437 410 652 1,061 900 Vanill (corditionnie)Pepper (black) 2,400) 1.894 2,377 1.440) 1.711 2,200) Poivre (nolr)
(green) ) 676 692 ) 419 ) (vert)Cocos (drLed) 1,208 1.834 1,529 1,730 1,530 1,600 Cacao (sec)Sisal 1be22. 17,623 13,457 0 38906 15305 ,22500 S disa
ater b5a2 8.608 7,635 3,708 330 2,029 52,00 Pols du cap
1) ratio of green to cured - 4.6Z 1) rapport de gousse A conditionner 4.6Z2) 1983 projected 2) prEvisioa pour 1983
Provisional estimates (at October 1983) estimations provisoiras (en Octobre 1983)
SOURCES: Production - MPARA SOURCES: Production - NPARAEzports - INSRZ and Customs Exportations - INSRE et Douane

- 133 -
Table 25: Distribution of Farmtypes
(October 1983)
TOTAL AREA in HA AREA CULTIVATED BY: (in Z)
TOTAL TOTAL Small Small andCROP I Planted in traditional medium Plantationsl/
l production farmers I commerciall_ _ _ _ _ _ _ _ _ _ _ _ _ _ _ _ _ _ _ _ _ _ _ _ _ _ _ _ _ _ _ _ _ _ f a r m s_ _ _ _ _ _ _
EXPORT CROPS I I |
Coffee 220,000 2/ 210,000 85 10 5Cloves 110,000 73,000 60 23 17Vanilla 27,000 3/ 22,000 80 20 negligablePepper 6,120 '/ 5,500 90 3 7Cocoa 5/ 4,800 4,500 17 _ 83Sisal 19,000 n.a. 2 98Butter beans 7,500 7,500 100 _ _
FOOD CROPS
Rice 1,200,000 1,200,000 75 25 6/Cassava 350,000 350,000 98 1Groundnuts u.a. n.a. 100MaIze I 120,000 120,000 n.a. n.a.
TOTAL AGRICULTURE 3,000,000 2,900,000 83 2 |_---_-
SOURCES: MPARA; various reports; Bank mission estimates.
1) Including statefarus.2) Excludes an area in Mahajanga (about 6,000 ha: also excludes
arabica-coffee, produced on a smalI scale in the plateaux andLac-Alaotra areas (estimated: 5,000 ha).
3) Assumes an unproductive period of 2-4 years and a productiveperiod of 6-7 years. About 20Z is in the phase of replanting.
4) Assumes a replanting period of 8-10 years of production, and 3-4 yearunproductive period (the Stabilization Fund mentions 4,200 ha).
5) Small planters only recently started planting. Area is estimated,and will increase in future.
6) Area included in rice-schemes.

- 134 -
Table 26: Number of producers and farm size (1983)
Farm type Coffee I Vanille ICloves I Pepper I Cocoa__Cafe I Vanille iGirofles I Poivre I Cacao
Total area cultivated (ha) 220.000 27.000 110.000 6.120 4.800
1. small traitieoual 1 187.000 22.000 | 66.000 5.540 8002. smAlL commercial 22.000 5.000 25.000 180 -3. plantacion type 11.000 - 3/ 19.000 o 400 4.000
Total number of producers 350.000 70.000 80.000 | 60.000 2.000
1. small traditional 345.000 65.000 70.000 59.500 2.0002. small commercial 5.000 5.000 1/ 8.000 500 -3. plantation type 10-50 1 3 2.000 1 n.a.
Average farm size: 0.63 0.38 1.38 2/ 0.1 notl applicable
1. small traditional 0.5 0.34 0.9 0.1 0.402. small commerclal 4.5 1.0 3.1 0.4 -3. plantation type 50-2000 12.0 9.5 400 500-2000
Average number of labordays employed (per ha) 4/
1. sall traditional 50 40 not 30 302. small commercial 80 300 appropriate 60 803. plantation type 200 500 _ 200 200
1/ Small commercial farmer defined as a producer growing vanilla in pure stand owningabout 1000 plants. This average population is below standard.
2/ The definition of size is misleading because most small plantings are planted alongslopes or farm borders and often widely spaced. On the average farmers ow3 50-60trees.
31 Only one big producer of about 10-15 ha.4/ Rounded off estimated figures.
SOURCES: MPARA, OCGCP and various reports, synthesized by Bank mission.

- 135 -
Table 27: Participation of women in agricultural activities 1/(-of total labor)
Planting Maintenance Maintenance Harvesting Post Harvestingground cover crop _ __ _ activities
Coffee 30 30 50-100 65
Cloves - _ _ 50 80
Vanilla 50 50 75 2/ n.a.
Pepper 30 50 50 50 80
Cocoa 50-100 50-100 _ 50-80 50
Rice 3/ 50 50-100 50 100
1/ Clearing, land preparation, plant holes, drainage are carried out lOOX by men(these activities are not mentioned in the columns). On rare occasions womenassist with underbrush cutting.
2/ Fertilization of flowers is done 100% by women.S/ Rice in rizieres, tanety and tavy.
SOURCE: Bank mission estimates based on FAO study and local sources.

- 136 -
Table 28: Crop Establishment Data for Export Crops
Required A.ll-in costs Non-productive ProductiveLabor Days (FMG '000) period period
_ _ _ _ _ _ _ _ _ _ _ _ _ _ _ _ _ _p e r h a_ _ _ _ _ _ _ _ _ _ _ _ _ _ _ _ _ _ _ _ _ _ _
per perTotal Annum Total Annum Years Years
Cof'ee traditional 436 109 829 207 4 30Semi-commercial 330 110 521 174 3 30plaanatioa 198 66 310 103 3 30pruniag 1/ 145 20 270 40
Cloves average 461 66 514 73 7 30
Vanilla semi-commercial 662 220 860 287 3 7traditional 301 75 360 90 4 6
Pepper semi-commercial 622 155 723 181 4 12traditional 392 76 344 69 5 10
Cocoa pure stand 376 94 491 123 4 25with Banana 376 94 391 98 4 25
Coconut hybrids 115 38 81 27 3 25traditional plot 107 20 434 87 5 20
Lychees 6 25
CisnAMw 3 20
Nutmeg 6 25
Tea 4 50
Ylang-yang 5 20
Bananas 1 8
Sisal 2 6
Oil palm 3 20
Aleurites 5 25
Cashew 3 15
1/ each 6-8 years
Source: Bank Mission estimates

- 137 -
Table 29: Estimated Yields 1-of Principal Ecport Crops
(kg./ba
Under Estimated Es:imated1982 1977/78 improved levels in Potential
conditions provisional Productioncrop models
COFFEE AVERAGE 379 400 700pure stand 2,000small traditional farm 600 300small commercial farm 1000 450plantations 1500 800
nixed stands 300 600
VANILLA (dry) AVERAGE 150 210 300pure stand 750small farms 180 190bigger plantations 750 700
mixed stands 100 200
CLOVES AVERAGE 220 n.a. 2/ 550 700 21yOung poorly maintained 220young good maintained 360older plantings 500
PEPPER AVERAGE 440 500 1000pure stands 4000 3/
small farms 500 300plantations 1200 1000
mixed stands 300 500
COCOA AVERAGE 330 400 600 1200small farms 800 250plantations 1000 a.a.
mixed stands
SISAL 1100 1500 2000 n.a. n.a.
BUTTER BEANS 600 lOOO 1000 n.a. n.a.
1/ The average yields are the averages of all plantings of all ages. The optimal yieldsfor different production systems are based on the age at full maturity.
2/ Due to the production cycles, it is not useful to compare yields of two differentyears. Potential at average age of 25 years.
3/ Intensive cultivation.
SOURCE: ?PARA; bank mission estimates.

- 138 -
Table 30: Producer Prices for Export and Other Crops (Oct. 1983)
Product Delivered at Unit Price FMg
Coffee dried collection-point Kg. 280"prime triage" .. 5
Vanilla green beans 1,000Cloves cloves dried 435
budsdried stems 50-100oil liter 1,150
Pepper black dried Kg. 230fresh green . " 90
Cocoa fresh beans . 110dried beans 340
Copra trader " 160Sugar cane distillery ton 7,500
plantation " 9,500Sisal ex-factory Kg. 150Butter beans trader - 80Rice 1/ trader or parastatal
at harvest east coast 240post" " " _ 260minimum price 85
Cassava 2i dried trader 90starch ex-factory - 317tapioca - - 409
Sweet potato local market 3/ 30
I/ Rice prices are variable. Official producer prices are:85 FMg/Xg paddy
198 rice on farm240 u milled rice (36Z of wet stalk paddy).
Lowest retail rice price at October, 1983 was: FMg 200. Prices at farm-gatevary in east coast locations between FMG 100-360, depending on whether in surplusor deficit areas.
2/ Dried cassava (cosette) is a hypothetical price, since there is no strong marketcircuit.
3/ Thare is a weak market circuit only selling to a sensitive local market.

Table 31t Returnis Per Laborday on Form Production from Operation of Existing Farms, 1982-1983
CROP FARM-TYPE Average Producer Required Labor Gross .. R_ _urn pe Labor-dryYield Price Faily tIIred Hergin In per , in I in
per HA 5/ Produce family of local rice 1/taborday wage level /equivalent
Kg/HA FHG/Kg days/HA days/HA 000 FM40 Kg/lbd. FHO _ _ g 1.ice/lbd
Coffee traditional fare 300 280 57 SO 39 2,6 684 105 2*9(dried) 5e0i-co.mercial plot 450 280 27 109 -19 3.3 -703 nag. neg.
estate 800 280 - 211 -114 3.8 n.f n.e. noacloves young poorly meintained Vo 435 13 45 24 3,8 1,846 284 7.6(dried) young good maintained 360 435 30 60 64 4.0 2,133 284 8.9
older plote 500 435 31 S8 86 5,6 2,774 370 11.6clove oil 60 liters 1,150 12 62 13 0.8 1,083 144 4.5
vanilla semi-commercial plot 600 L,00o 160 330 324 1.2 1,600 240 7.5(green) tradittonal fare 190 1,000 173 43 147 1.- 850 130 3.5
pepper ie.i-co..ereal 1,000 230 111 55 103 6,0 128 124 3,9(dried black) traditional plot 300 230 57 35 40 3.3 702 108 21,9
cocoa smalL farmers plot 250 350 46 30 54 3,3 13174 181 4.9(dried)
sugar cane small farmera 2/ 40,000 7,5 38 112 138 266,7 3,105 414 12.9
rice Inundated rice 1,400 . 100 103 - 124 13.6 1 204 185 5.0(paddy) tanety (secondary forest) g 0OO 100 -79 - 40 10.1 506 78 2.1
tavy (ptfhry forest) 1,000 100 125 - so 8.0 640 99 2,7
eassava 3/ traditional In valleys 4,800 90 130 - 188 36.9 1,446 222 6.0(dried) traditional on Tanety 2,400 90 ItS - 65 20.9 565 87 2.4
eoconut 3/ small fare plot 2,000 160 73 120 129 10.4 1,767 272 7.4(copra)
sweet small former 6,000 30 80 - 116 75,- 1,450 273 6.0potatoes 4/(fresh)
1/ IKg rice assumed to be bought at local trader e 240 FM/kg 5/ Defined as receipts per ha. (average yield times producer
.L/ Average of plant cane + 4 ratoons. Cane for distillery price) less costs of hired labor and other inputs; renton land excluded.
I/ Hypothetical calculaticns 6/ Estimated at FMg 650 per day on a traditional farm and
4/ Only to local market FMg 750 on semi-commercial plots.
Source: Bank calculations based on available aource materiels Note; These costs are typical for any given farm type, but theyare not means. Variance in costs is very substantialfor any given farm type and crop.

= 140 -
Table 32: Prices of Farm Inputs(October 1983)
.1 Prices FMg
Unit Unsubsidized Subsidized
WAGESAt estate level (incl. social 8 hours 1,100 _charges) daysemi-commercial level 750 _traditional farm level _ 650 _
- _ - hour 85 _processing/casual/cottage work 70 _
SAL-ARIESCasual labor month 20,000 _specialized 30,000 _extensionist (vulgarisateur) - 50,000 _chef d'equipe extension 65,000 _
EQUIPMENTTractor plow 3 disc Unit 750,000 .60-80 HP Tractor - 3,000,000Sprayer 12,500Handsprayer _ 3,500 _Plow 30 kg 26,000 7,000Plow 35 kg 27,500 7,000Plow 45 kg 45,000 10,000Field distillery (cloves) 40,000 _Rotating hoe _ 6,200 _Harrow - 10,000 -2 wheel farm wagon - 1,000,000 _
TOOLSHoe - 2,000Machete (coupe-coupe) 3,000Transport baskets (soubique) 1,500Pruning knife 4,000Mats for coffee drying - 3,120
MATERIALS
Wire Kg 100 _Jute bag uni 800 _Baskets 1,000 _Plastic bags 50 Bucket 15 ltr. _ 3,000 _Mats _ 2,500 _

- 141 -
Table 32: Prices of Farm Inputs (continued)(October 1983)
llnsu_sPrices FMG
Unit Unsubsi_dized Subsidized
FERTTLIZERS 1 1Organic ton 3,300 t -
Potassium chlorate Kg 210 140Urea - 290 140Ammouium sulphate 1 180 120Ammonium phosphate - 210 140Natural rock phosphate 200 _NPK composites (average) - 210 140
CEEMICALS (average prices)Insecticides Kg 2,850 1,900Herbicide I 3,000 2,000Fongicide - 3,900 2,600Aldrin - 300 _
SERVICES XPruning of coffee Tree 50 25Land plowing cooperatives 9,000 1,250
- - individual farmers - 12,000 _- "estates 13,000 _
Harrowing cooperatives i 5,500 1,500Individual farmers 6,500 _estates - 9,500 _
Fertilizer spreading )coops. 5,400)ind.farmers - 6,400 _
Seeding )estates - 9,400 _
PLANTING MATERIALCoffee plant (from cuttings) Unit 200 100Clove plant _ 100 15Vanilla cutting - 25 -
Pepper cutting _ 15 -
Cocoa plant 200 -
Stakes (live) for shade - 15 -
Shade frees (plants) 50 -
Coconut nut (selected hybrid) U 215 -
(tall) _ 50 -
Cassava cutting 2 -
Banana-seed 25 -
Sugar cane-cuttings Ton 7,000Rice seeds Kg 260 -
Butter beans - 250 -
Pueraria (cover crop) - 150 -
Fruit trees seedlings Unit 100 -
grafted - 500 -
Sweet potatoes 100 Kg 350 -

- 142 -
Table 32: Prices of Farm Inputs (continued)(October 1983)
_________I |Prices FMG
__unit I Unsubsidized Subsidized I
(Estimated (OfficialI real cost) tariffs)1
: TRANSPORT
On good roads truck Ton/Km 100 75-- pick-up - 150 100
On bad roads trucks 2 200 100*. of pick-up - 250 150
Wood transport + 20Z %Tractor hiring for transport, Hour 4,500
coops.Ditto estates 2 6,500

- 143 -
Exportcrop Sub-sector Review
Table 33. Iports of Agicultural Chemicals(in tons/tonues)
1979 1980 1981 1982 1983
1. IMPORTS
N-fertilizers 9,868 10,595 4,447 233 61P-fertilizers - - - 130 6K-fertilizers 7,443 3,286 678 224 15Composite fertilizers 5,074 7,546 5,433 1,059 1,221
TOTAL FERTILIZERS 22,385 21,427 10,558 1,646 1,303
Insecticides 2,524 1,733 678 119 n.a.Herbicides 2,637 117 19 - n.a.Fungicides )Rodenticides 6 9 2 - _
TOTAL PESTICIDES 5,167 1,859 699 119 n.a.
2. SALES
Fertilizers:via CPAA n.a. 3,166 2,336 3,556 2,778direct via importer n.a. 246 9,033 20,444 5,775
TOTAL FERTILIZERS 3,412 11,369 24,000 8,553
TOTAL PESTICIDES n.a. 218 650 405 n.a.
Source: MPARA

Table 34. Price Structure for Coffee, 1975-1983
DI,RffAIEPf1A,1 E"M7AHATAVE
-~~~~~~~~~~~~par~~~~~~~~~ ------ ..tye)......P 0 S T LE S U u D IF F R EM?TI E L ",7/76 76/7/ 77/78 : 78/79 1 79/80 1 80/81 6 1/02 U2/83 a 83/84
1. Prix d'achat nu-bearule au produtoaur rendu & toun points d'achat *165.000 170.000 180.*000 180.000 ,185.000 215.000 250.000 a260.000 280.0002. Prime do pritrimsg - 5.0(jo 5.000o 5.000 5.000 5.000 5.000 5,0003. Rhaundration do colisot. ~~~~~~..ur 1. Fokontany - * 2.~~a500 2.700 2 500 2.500 2 500 2.500
(art. 3 du dicrst no7. du 17.5.78) 8.0 .oo 5w 50 .0i 7.0004. Marge de collocte (4 THQ/Kg) - ' -. 00 400.00.00 50u000005. Tranaport (matximuum 8 FN0/Kg) - , -8.01)0 8.000 10.000 15.000 21.000 35.125 * 39.24a06. Rlaun6ratian do collutot pour la Firaiaampokantany7 at Traritany-- - 10.000 1O.4U00 10.000 10.000 1CI.000 10.000
7. Prix d'achat nu-bascule rendu looalit6 port d'ombaLrquesmnt 3 - I - 2197.000 3 209.000 3 217.500 3 251.500 8 2939500 3 317.25 8343.740S. Main d'oeuvre at manuitention a 2.949 i 5.057 I 3.0370 3 .920 1 3.920 8 3.920 2 4.300 4.300 s 6.7939. Frals de calibrago 4.114 I 4.026 8 4.026 I 5.032 2 5.3'3502 I 4.000 8 6.ooo0 a 866510. Fraia de triaga 6.708 6.879 i 2.760 a 3.565 I s.s56'5 4.0000 i 4.hoo i 'a.400 2 6.178lie Agios de X % Ilan juaquli mine sous comtrat-coosiae8 I I I I I
(3 moia a our paste 7) (1) 3 3.403 i 3.506 4.063 I 4.321 1 5.030 1 5.839 1 0.430 8 * ¶4.61i1 t ¶9.,32812. Porto pour doaoicationt (oatiml. a a X aur priX d'aobat nu-beacule) I - 7.076 a 7.910 a 4.190 a .5.362 a 6.312 a ? 33 7.941 I 8.59313. Porto pour sous-produit (eatiami i I % dent G.N. 1,5 % et ::88
briaauwo 0,5 AS) juaqulA 11 6.600 a - I - I 4.527: -
14. Assurance 0,125 )d 1'an Jaaaqu'A ials noun contrat-oali5* a S I I (3,5 mois -0 364 our Pod ta 7) 2068 - - - a 768 79 928 1078? 116: 125
i5. Flaballage iA1,16 sacs par tonne base prix OAF do la PITIM + Frain I I IS I I Ide CAV A sagasin 2.966 I 3.055 8 3.055 3 4.000 a 4.600 g 4.600 8 4.600 1 4.740 8 6.622
16. Condittonnumant 8 1002I 1002I 1002I 1002I io 100 1002 1002 1002 100D
17. Prix loss mia*ian (Ste. des contrata-calaso) i 192.046 i 97.679 i 219.951 I 239.23i1 245.188 8 282.395 1 328.783 8 359.833 1 0OCI144 ,
1la. Contra £aarquatgm doe mospar deatinatlon I - a 200 t 200 : Z00 I 200 2 200 1 220 t 220 8 30019 18&un6aration due conod'it'ioneurs/atockeur taint forfaitaire 2 7.000 FH(VII - 2 5.000 1 7.000 I 7.000 I 7.500 2 8.7oo 3 6.500 -- 8.500 I 10.00020. Frais do foactionr..mant de l 3 gnntenna C.S.P*3. a - . 209) 200 2 100 I 100 I 100 1 ¶50 I 150 I 200
21- Poeage B.G.S. ~~~~~~~~~407* I 07 1 407. Bo 8078I$0 807'1 900 90goo3 95?22. Proviaion pour U IV basSe sur unecatimation de 2,5 % et %Ln priz de I I I 2 I I I8
rachat de 115 THU/Kg 8 2.076 8 -. 2.799 8 3.io6 i a
23. PRIX1 DE CkWMI0IJ AU. UPKIRATLURS I -56 '203.079 230.557 250.444 239 I292.002 1 38531.6.0I411.60i24. Coamonaga et msanutontion 60816 8J16 116 818l 818 1.0000 1.000 1.500a5. luprimi, timbre, connaiaseementa ' 10 00 100io 100w 108 100 ' 100 8iu 100' 13026. Commission do transit et honorairee agride en douanes 1.845 1.845 2.000 2.000 2.000 'R.0 2.00a0co 2.000 P.00027. Taxe de roulage 102~~~~~ ~ o~ 1028 12 1028 2 290 ago 350w 350 35027. Taxe de roulaas (2ACKR 1158 j`5 jir: 15 115 ij52 jj2 115 11529. Taga. daopdg (C2iANIC0111R) 2 010 0 00oo2 1002 M 1I ¶95 j95I j95 19539. Iiauranie mga(CiAn COSIAN) -E 2282 22 2284 272 272 272 27? 27231. Drouettago (CC2Al8C022ER3) -- 2 - 277 ' 277 277 277 92032. Deeaarl.age (C2IANcOMER) 8 -- -620'1 620' (.20 620' 62033. Drolt de sortie 19.000 19.000 19.:000 19.000 19.000 ' 19.000 190O 1 20 limo382. Pealeo sur droit de sortie 0,3 %'anuf pour le port deI
Horoantsstrn Uj,5 % £ 27 587 980 913 980 2546 57 5787 5735. F4%baCrquement tunrriag(1 95) 9090 .4 2.546 2.740 2.7,0' a.87735. T.aakeusmenint at nriou~ - P.H4. P.al. P.mH. P.M. P.M. P.21. * P
37. CLrtLfLco.t d'nriinjn (di.livronca at tLmbuage) 6200 - I - I - 3 - I - 22 -
38. Mag bAn6ficiaire i 1, ',. uur Iosi magunin .722 - --- 2 -I --
39. PRIX EUD UAilAts'Plo t aall~~22.a1o a aa6.8a5 a 254,051 i 273.938 1 280.0139 1 31U.992 s 365.279 i 396.329 *439.637
. 18,40 % * i"%49 *(U) K 7; 8,25 % 8,-15 I 4 ,2, 6. ,.!7 9,27 9, 27 %, 11,2. B olt TOT iSgSa.it
Source: Malagasy authorities 3 aoiati,.6% 3 soie W"~

oan 35: Prm Sbafr Clow 1b, 19715-.(pr metric tan)
EMl'L 11 Cll - "No(per tome 6triqu)
Nom m _nvgmom t1915/76 1916/17 1977/18 19v7/ 79/80 1/1 11/rn 19.a
1. Prix d'achat au preducteur rfndu a tous pointa devenete 320.MO0 340.000 340.000 385.000 395.000 430.000 435.000
2. Hlrge de collecte 6.000 6.000 6.000 6.000 6.000 6.0003. R&uEratton de collecte por Pw kontany, Firamis-
poontany et Flvwkdr p*ontany a 2,50 FM parkilo chacww (art. Nb. 2 du Dret No. 78-3 du17 mrs 1978) 7.500 )
4. RPmufiratlon de coUecte pouw Faritary a 5 FM par ) 25.000 25.000 25.000 25.000kilo (art. No. 2 du Dkcret ?b. 78&-3 du 17 mrs 1978) 5.00 )
5. Tramport: 8 FH0 per kilo (mdtux) 8.000 8.000 10.000 15.000 21.O0D 35.1256. Prix d'achat nu-bamcule rendu port d'ebarquut 320.0M0 354.000 366.500 426.000 441.000 432.000 501.1257. Hin d'oeuvre et lMztentLon 3.116 3.209 3.209 4.144 - M3M 3.920 4TD 4.38. Frals de triage 4.725 3.292 2.535 3.426 2.535 4.600 6.000 6.0009. Agios A l'm Jqu'A mime turw-itrat ca4sse
(3 mols aw pote 6) (1) 7.000 6.600 7.301 7.559 9.851 10.198 13.857 23.05210. Perte t d6chet et sma-produit (claus sa t6te,
antoufles, griffes 9.600 9.600 10.620 10.980 10.620 10.620 10.620 10.62011. bFllAg et mrFme et frats de CAF - Mb&min 8.112 8.420 8.589 86.89 9.877 9.877 9.900 9.9012. Dication en mtgasin sr 3 mis (4 w srnbucLe
poste 6) 12.800 12.800 14.160 14.660 17.040 17.640 19.280 20.045 A13. OnltlIoment 4.960 5.600 6.828 8.828 6.828 6.828 6.829 6.829 414. Prix log6 munasi (amme des postas 6 a 13) 371.043 369.521 407.242 424.686 485.960 504.035 552.786 581.87115. oDntre mrqu8e des own 200 200 200 200 200 220 22016. Frais fonctiosmunt 2616gu B.C.S.G. (Aitreu) _ 200 200 200 2Z0 200 200 20017. P*mxlratien des conditiooua-stoeems (tax fie) - 25.00 30W.0 30.000 30.000 40.000 40.000 40.00018. Pesge S.G.S. 648 648 648 648 648 648 800 80019. Prix de cessim aux opOrateure powr l'exportation 371.691 394.921 438.290 455.734 517.008 545.131 594.000 623.09120. Transport de inga in A quai 832 832W 82 - 1.000 14 T 021. Tmprln6s, Tlibtres et comneiseants 100 100 100 100 - 500 500 50022. Cuudslaon de transit et honorairme agr6ek en
douna (0.4A axr valeur imposable) 4.366 5.474 6.274 7.916 - 7.916 7.916 7.91623, Tau de rotlag. 104 104 104 104 - 520 520 52024. Pnge 104 104 104 104 - 104 104 10425. Dirrliig (almi r) - - - - - 139 690 69026. Mgaasue (amer) _ - - - - 220 220 22027. Droit de sortie 110.000 110.000 110.000 110.W00 - 110.000 110.000 110.00028. BOrettage - - 312 312 - 312 312 31229. Psise dounes 330 33D 33D 33 - 330 33030. I trquftn et arrlmga 1.067 1.067 1.067 1.067 - 2.125 2.500 2.50031. Tan conjoncturelle (15%) - - - - - - _32. Ihsge bifficiaire de l'eportatLeur 40.815 - - - - - -_33. PrLx 1B nzttn 529.40 513.58O 557.413 576.499 517.008 668.297 718.498 747.583
(1) 8,75X 8,25X 8,25X 8,25Z 9,25% 9,25X 11,5(1 18,4(X
Source: Malagasy authorities

Table 36. Price Structure for Vanilla, 1975-1983(per mietric ton)
Differentlel VAnille Pzdpatatian A 25% d'l,wu.ditdRe3iltt ina l4,6 Kg de vanilla v..ta
(par tonne md~trique) poutt Iinl Kg de vanilla pr4pggie
Paste i. £ c I I 6 1975 1976 a 1977 a 1976 2 1979 a I'IlO a 1981 a 191)2 a 93
1. -Achet vatt (4,6 Kg) ... ,...*...... 1.150 , .150 I 1.21a , 1.5611 2.300 , 2.7T60 , 3.220 * 3.220 4,6002. .. Tran,port dii veit (4,6 ~~~ . ss,2o 69 19 1992 115 230 230 ii3a
3. O Dihet 3 % dur posts . 34750 2 34,50 I 36,60 1 45,54 169 a i 96*601 9 6,608 I 3
4. -rtais de prdpsarlion at. ria.u.n.d,a.tion dupri- 3a 400 1 400 400 453 550 600 600 GM0
5,-pri voec avint freai fin.nclFsr at transpazt * 1.56.9,10 1.653,50 I.,795,60 1 2.032,54 2.914 3.507? 4.146,60 4,146,60 57611saroand£ A ............ 1.510 a 1.654 I - 2 2.914 I 3.5107 I - - I-
I. -Agias out fincnc.mant aaue..ns du. vect dui I 01.06 nu 31.10 (aOyconn. do tabiliestian 8II
* des fonds dtmempnunt dtabli. lo3 main t oure la I ISS
bus 4. de % Ilan enjoro de 10% de TUT1) (Poats 51 40,70 42,34 45,96 5 2,03 86,25 103,80 146,37 222.67 318.314,77w
7. - Prix de la vanilla pzipmrda VYRACO mu staed I produateur au ang4sin pr6pmtauat .... 1.635,17 a 1.695,64 a 11,841,56 * 2.014,57 a 3.000,25 a 3.610,80 a 4.292,97 S 4.369,27 8 6.146,36
errorndi I ............ 1.635 1.696 , 1.042 a 2.065 3.000 3.611 , 4.293 , 4.369 6,146
6, - Transport du VIRAC' ............... S 0 , 25 so 50 *so9. - Pslx dle 1vaynille ptolperie OVRAC' nU -
to. .:qemin schataul .......... .... a 1.110,64 * 1.ST I 2.100i a 3.020 32.616 s 4.343 I 4 419 6.196 ...... I -1.71 ?II lls 20100 111020 3.636 4,343 4.419 16.196
10 -Aaurai,cm too millmp%.dnbue o tin januuairl m"Venne itablia A 3 sois poor tanir campte a I de Ilechilannssent des entries an megdain) a ,4'07071,31361616523
% de paste 9 (2) .............. I ,407 7813 3 .6 6 22
II. - Riatourna an fivaur des callacthvitia di- aI cantralisits ............. .... 20 30 40 a I 1 115 I a i 115 a115 III
12. - C14saimart, mosmurags, ampequstegs ... 70 , T 70 70 a 0 I0~150 ' IO Iso13. - dichit S % sur pact. 5 ......... I 79,50 82,70 5 9,7is 101,62 1415,70 1075,.35 20 7,33 207,33 265,4014. - EabsIlleg ... 6.. .a ......... I O a 12? a 127 t 27 a 146,051 a IS 191 a 230 a 24?IS. - Prix de lo vanilla amball6su.a..... 1.894,67 a 2,021,1 1 2 .104,49 a 2.514,40 a 3.497,88 4,202.71 5.014,96 i 5,122,9 1 a 6,996,72
arrandi I .a.......... 1.695 a 2.021 2 1.114 a 2,514 a 3.496 4.203 a 5.015 a 5.123 a 6.99916. - Aglos do finencament de la rcdclt. antrs la a I
date dlouverture de la c,impagne du VRAC ataaa aaaaculls de la mise maui cantret-caice (1
miptiebui & fin janyler mayannae dltebls 'I 3 aaa aIaSamole pout tenir compte de l'dchelonn.ment aaaaaaaades apdr4tians d'achat) our la prix di Is
v7, n- lls dIelsa hmente d3) .............. e 41, a 44,46 46,04 ,553 a 080a 970 151,45 2.16,66 a301,66vanilla 1.936,~~~~~~~~~~I60 .0,6 a 2.3,4 2691 3.780 43000,09 S 166 45 5 356,66 7.300,66
a 69 2 :a a a 5.359 7.301arrandi It.........9372.066 2.3 .6 .9 0, 4.30 a 5.6
a a aalaaaa3a0IS. -RimunEratian dui conditianmhur-stocku.. 5 60 2 70 170 3210 325232 019. -Prixa de crasian sun apinaeiurs A l'axportstion a 2.095,60 a 2.225,64 a 1.402 a .2.739 a 3.849 4 4620 S .sla 5.111 a 7.601
anrondi A............2.096 2.226 2.402 2.739 3.649 4.620 5.610 5,711 7.601
(I) - 5 6 a 5 9,25 59,25 % it 11,40 %22,50 5
(21 - % 3 So 1,5 %o 1,5 %o 1, 5 fa 1,5 %a 1,5 %o 1.5 %o 1.5 %O 1, 5 %t
(3) O's, % 8,O 566 ,61 9,25 59725 % 12,1 % 14,95 9. 17,25 5Source: Mal.agasy authorit '~ AscurAnci (cf. poite 101
j3 .PIEaIBRE 1933

Tie 37. Prlce Stbst far IM*re , 1974-1983(pr metrte ton)
Mwi'm NMr (pw toomm .gr4m)
1974113 IJ14P O S T E 8 1976M 197718 197819 1979/8t & 191/
1975116 1981/lZ
1. Prix d'achlt au prod4:teuw 190.moD 19D0X0D 200.00M 225.wn 230.aoD2. thrge du collcteur 2.000 2.000 5.000 5.CX . 5.0003. Prals de transprt forfaltalre 3.000 3.C000 10.000 1OAi 20.0O(4. RbAunratlon de colecte des collectivltts
dicentralisles - 12.500 12.500 12.501 12.5005. Prix ren&u 1ort d'werquomnt I1D.ODD 185.000 195.000 207.500 227.500 252.50B 267.50o6. W1n d'oeuvre et Hmitentlon 2.694 2.775 2.775 2.775 2.775 2.775 2.7757. FPrte en triage at dessication 32 ar pocte 5 5.400 5.550 5.850 6.225 6.825 7.575 8.0258. bin d'nevre trage 4.969 5.118 5.118 5.118 5.118 5.111: 5.1I8
Aaswrance 1,25X 2259. (1) Aglsi x 2 I'm Jumqu'h mime mm contrat
calms molt 3 rots our poste 5 4.950 3.816 4.022 4.280 5.261 5.839 10.00410. hbllage 16,66 mcs par tame sar ba
prix FITU (double ac) 5.286 7.737 7.737 7.737 8.891 8.891t 8.89811. Prix lag m_gamin (Etablsmormnit caitrats-
calsse) 203.524 209.996 220.502 233.635 256.377 282.705 302.32012. Oontre wrquge des sacs pour clestilutln 200 200 20 200 7200 ' 22013. Rhmzkatlon des coditlanwer-etockears 7.00D 7.C00 7.00D 7.500 7.50M 7500 14. Prals de tncettannt doe l'anteme du BESP 200 20 200 2 200 20015. Prix do cessaio aux ophateurs a Itexpor-
tati n _ 217.396 227.902 241.035 264.277 290.605 310.24016. Cmdouwge et Hbmtentlon 560 650 816 816- 1.060 1.060 1.06017. Impr1im, Tilres, OGmajagant 500 500 500 500 50 500 50018. Pesage par la Socift& G&ale de 9SniUlice 450 450 450 807 8D7 80719. Ta1 de rolie- - - - -_ -20. Omssion tasit et hxoramres agrees en
dmones 2.800 2.800 2 . 2.0 2O 2.8)0 2.800 2.80021. Mgqasnqe _ _ 22. MWgs 113 113 113 113 113 113 11323. larrimge (oomr) _ _ _ _ 24. Aume Btalage _ .. _ _ _ 25. Sr.nttsag (Uwir) - - - - - -26. Drolt de sortie: 52 asu valw uImpoebla 12.860 17.342 17.342 17.342 17.342 17.342 17.34227. C ditilmat (starsrdLAstion 0,52
axw valeur izposable plum plomb et vacation) 1.558 2.o4 2 2.004 2.004 2.04 2D 2.00128. RwAse sax drolt de sortle 0.32 des postes
26 et 21 43 58 58 58 56 58 5829. FAbqint et arrbmg 713 713 713 713 713 713 713
PRDK FOB GARAIIS 222.691 242.026 252.698 265.831 289.674 316.002 335.677
(1) 2,752 2,06252 2,062'X 2,0(252 2,3125X 2,31252 3,742(3 soim) (3 moim) (3 wit) (3 mDis) (3 wait) (3 ols) (3 mois)
Bolt Bolt mo t molt solt8,252 Ilan 8,252 Ilan 9,252 I'o 9.252 V' a 14.952 l'm
So trce Nlap autlhwities

Table 38. Changes in Coffee Price Components, 1978-1983
(FMg/kg)
EVOLUTION DES COMPOSANTES CU PRIX Dll CAFE Y(FMg/kg)
_ . , . , _ . ~ ~ . .9
: : 1978 3 1979 : 1980 0 1981 : 1982 : 19831, Producer Purchase Price ---------- ---------- I------- ---------- :----------:----------: t.c-lt Plantctuv 180.0 : 185.0 s 215,0 : 250,0 : 260.0 a 280,0
2. Price to ProcessIng/Storage companies s : : sFrix do cession aux condition- : : : s : :jivurs/stockeurs : 209.0 : 217.5 : 252,5 : 293.5 : 317.6 : 343,73. Collectors' Marg~In a2.3,rlmuntration collecteurs 29,0 . 32.5 . 375 ' 43,5 57, 63 74. Prlce to Operator/Loading Agents (parast'ls) : :Prix de cession aux operateurs : 25004 : 253.8 : 292.0 : 338,6 : 369.9 : 411,65. Processing/Storage Companies' Margin 2 :
p.&i1iundration conditionneursJ / : a *stockeurs 4 44: 4 36A3 39.5 :451: 52.3 679 :6. Guaranteed FOB ptice Is V sP: Prix FOB garanti s 273,9 s 280,1 : 318.3 s 365,3 : 396#3 : 439,6 1:7. Operator/Loading Agents' Margin : : : :: Rrlmuneration. a valorem : s : a s
op6rateurs . 87#6 : 79,8 s 85#8 a 70.3 : 80,0: 112,4:8. Toa PyDet to eerator'ksfrt-* 2/T,Lal ieonopiureatA 0o opur us ' * lilt 106l : 112,1 1 97.0 : 106.4 . 140.4 '
:9, Actual FOB price (average) s s : : :Prix FCD rdalis (moyen) : 663,0 604,0 : 649.0 : 532.0 : 605,0: 850,010, Levy : : s : : :Prdl3vement : 301,5 s 244.9 .244.9 : 96.4 12 : 7298.0! Quuamn%fltiTstee,d, 4l Ts en tonnes : 49 290,0 S 63 117,0 : 45 015.0 a 56 034.0 S 52 948,0 : 32 593,03212. Value of Exports (Vtg millio s):! !Valour des exportations FMg mill.): 27 594.0 : 38 108.0 s 45 042.0 s 29 693.0 0 32 045.0 : 29 889,03113. Total levies (PM& millions)5
Pr316vement (7Mg millions) n 14 860.9 a 15 457,3 ' 16 986.3 t 5 401.7 * 6 814,4 s 9 712,7-3a~~ ~ ~~~ ~ ~ ~ ~~~~~~~~~~~~~~~~~~~~~~~~~~~~~~~~~~~ . S :
1/ Based on Price Structure for Tagatave- sur la base du diff4rentiel Tamatave2/ Loading agents' 10 commission, plus ad valorem costs of 2.33X on actual FOB priceCorninssionr de 102 aux opgrateurs chargeurs et frais ad valorem de 2,33% sur prix FOB realise3/ Part-year estimate at October 1983
Source: Official prire structures and trade data; Bank mission estimates

Table 39. Changes in Clove Price Components, 1978-1983
EVOLU'TION DES COMPOSANTES DU PRIX DU GIrOPLE
(FMag/kg)
1978 s 1979 i 1980 s 1981 : 1982 s 1983* . I …… . …… S ~~--- - - - - -- - --- -- - -- -- - - -- -~~~
1. Achat Planteur s3400 385.0 s 3951 : 43050 : 4:
2. Prix de cession aux condition- : s : :neurs/stockeurs a 366,5 : 426*0 : 441#0 : 482,0 : 501.1 :
: 3. Rdmun6ration collecteurs : : :(2 - 1) 26.5 s : 46.0 : 52,0 : 66,1 :
4. Prix de cession aux op6rateurs : 455,7 s 517,0 : 545,1 : 594,0 : 623.1 s ;: s : s s .: : 5. Rfmunfration des condition- : : :
neurs/stockeurs : 89.2 : 90 104.1 : 112,0 s 122D :s
; 6. Prix FOB garanti 576.5 517.0 s 668,3 s 718,5 : 747,6 :
7. Rtmun6ration ad valorem : :op6rateurs 03,22 % de 9) s 154,1 146,7 : 199,6 s 301,4 : 368.8 :
8. Total rdmunsration op6rateurs : : : : s(6 - 4 + 7) s 274.9 s 146,7 : 328 425.9 493.3 :
9. Prix FOB r6alis6 : 1 166#0 : 1 110,0 s 1 510.0 : 2 280,0 : 2 790.0 : 3 347.0 :
10. Pr6ldverwient (9 - 6 - 7) : 435,4 : 446,3 : 642.1 1 260.1 1 1 673.6 :
It. Quantit6s export6es (en tonnes): 14 767,0 s 13 492#0 : 4 360,0 : 10 308,0 : 10 471,0 * 1 833.01
12. Valeur des exportations(10 6 FPMG): 17 200,0: 14 978,0: 6 583,0: 21 133,00 27 482,00 6 414*0 g
13. Montant du pr6l0vement : : s: (106 FMG) : 6 429.6 : 6 021.5 : 2 799.6 : 12 988,0 : 17 524,0 : 0.
I/ Part-year estimate at October 1983
Source: Official price structures and trade data, Bank mission estimates

Table 40. Changes in Vanilla Price Components, 1978-1983
(FMg/kg)EVOLUTION DES COMPOSANTES DU PRIX DE LA VANILLE
(FMg/kg)
: : 1978 s 1979 : 1980 1 1981 : 1982 a 1983
I 1lchat Planteur (4,6 Kg vanille e l s s s :verr.e) : 1 0 s 2 300,0s 2 760,0s 3 2200: 3 220,0s 4 60.0:
* : 2. Prix de cession aux condition- : I :neatrs/stockeurs : 2 100,0 : 3 020*0 0 3 626,0 : 4 343,0 s 4 419,0 s 6 196,0 :
3. Rfntun6ratJOn Pr6parateurs 5 S82LA 720,0 : a 1 123,0 s 1 199,0 0 1 596.0:
4. Pri.x do- cession aux operateurs : 2 739,0 : 3 849,0 4 620,0 : 5 518.0 : 5 711.0 : 7 801.0
5. Rdmun6ration des condition- : s s s 2neurs/stockeurs 639, 8290 : 994,0 : 1 175.0 a 1 292.0 1 605,0 a
2 6. Prix FOB garanti : : : s
7. Rkmun6ration ad valorem :operateurs : s :
8. Total r6mundration operateurs : s : : : s
9. Prib: FOB rdalis: 5 925,0 : 7 126,0 : 9 621,0 : 11 018#0 : 18 664,0 : 21 849,0 0: 10. PrrdTvement : : s s : s :
11. Quantit6s export6es (en tonnes): 1 459,0 : 436,0 0 410#0 s 651.0 s 1 060,0 6 95 60 14: 12. Valeur des exportations , : 8 645,0 s 3 111 0 : 3 944,0 : 7 924.0 0 19 780.0 s 16 330,0 :: (106 FMG)s s 2 : : :: 13. Veleur du pr6l1vement t : s : s
1/ Part-year estimate at October 1983
Source: Official price structures and trade data; Bank mission estimates

Table 41. Changes in Black Pepper Price Components, 1978-1983(FMg/kg)
EVOLUTION DES COMPOSANTES DU PRIX DU POIVRE NOIR(FMg/kg)
*. . _
1978 a 1979 s 1980 a 1981 : 1982 a 1983 :
a 1. Achat Planteur : 190.0 : 200,0 s 225,0 a 225.0 : 230.0 as : .: S
2. Prix de cession aux condition-: a aneurs/stockeurs 207&5 : 227,5 s 252g5 : 252,5 : 267,5 a
s 3. Rdmun6ration collecteurs : : sa (2 - 1) a 17,5 27,5 275s 27.5 37.5 : a
4. Prix de cessioni aux opdrateurs a 241.0 a 264*3 : 290,6 a 290,6 ; 310&2
: 5. R6mun6ration des condition- a : :a neurs/stockeurs (4 - 2) 33.5 a 36,8 381 : 381 : 427 : : : : : . : : :a 6. Prix FOB garanti a 265,8 t 289,7 : 316.0 a 316,0 a 335,6 as
a 7. Rfnundration ad valorem : a : a : opdrateurs (13,22 % de 9) 65,7 s 50.0 : 47.9 : 53,0 a 63,5 a
a 8. Total r6mun6ration op6rateurs ; s : s :a (6 - 4 + 7) : 90 7543.3 7 :: :
9 9. Prix FOB rdalis6 : 497,0 a 378,0 : 362.0 a 401.0 : 480,0 a 3960 a
: 10. Pr6lavement (9 - 6 - 7) 165,5 3 s - 1i9 3 ,Q a 80,9 : :
: 11. Quantitds export4es (en tonnes): 1 556,0 a 1 893,0 0 2 404,0 : 1 44O,0 : 1 711.0 s 1 97b. 0k
a 12. Valeur des exportations(i06 FMG) 742,0 : 653,0 a 752.0 .577,0 697,0 : 832* 0t
a 13. Montant du pr6l6vetnent : aa (106 FMG) 259,2 : 72,5 : - : 46.1 : 138,4
1/ Part-year estimate at October 1983
Source: Official price structures and trade data; Bank mission estimates

- 152 -
Table 42. Stabilization Fund Receipts and Expenditures
(Fiscal Years 1979/80 - 1982/83)
(FMg millions)
1979/80 1980/81 1981/82 1982/83COFFEEReceipts from FNUP - 6,571.8 4,493.6 12,016.7
ExpendituresEquslization - - 99.1 -Interventions (Rural Roads) - 3,241.6 10,365.2 2,521.7OperatIons - 2,451.2 2,415.4 3,056.4(CSPC; FOFIFA; OCPGC; MPARA;SOAMA; Storage Charges)
CLOVESReceipts from FNUP - 8,741.5 4,518.0 6,955.5
ExpendituresInterventions (Rural Roads) - - 4,203.1 5.9Operations - 1,149.8 1,750.1 1,383.3
(BSPG; OCPGC, MPARA,Military Eng.; StorageCharges)
VANILLAReceipts from MNUP 1,698.5 1,267.8 1,592.3 9,057.8
ExpendituresInterventions:Rural Roads - 1,000.0 - -
Invest. Projects - - - 3,234.6Operations 13.2 28.0 18.8 30.7Storage Charges 16.1 13.8 318.8 668.1Invest. (FOFIFA) 13.7 9.9 9.9 13.3
PEPPER1979 1980 1981 1982
Reeiepts from FNUP 228.1 155.3 24.7 175.4
Equalization 6.3 - 38.4 26.0Interventions 31.9 64.6 18.0 74.1Operations 19.0 17.7 28.4 23.6Storage charges 1.8 45.8 28.1 45.4
Treasury - 156.3 - -
Source; MC and Stabilization Funds

153-
Table 43. FNUP Annual Receipts and Expenditures, 1979-82
(FMg millions)
1979 1980 1981 1982
FNUP Income 19,251 15.556 15.198 26.541
FNUP Expenditures -9,998 -30.343 -18.034 -6.211
Iavestmeat (RegionalUsiversity Ceaters) -2,000 -13,500
Equalization -2,391 -4,991 -8,452 -1,3U9
Stabilization FundOperations -1,927 -7,205 -2,502 -4,822
Goveramentlaterveatioms -3,680 -4,647 -7,000
Source: Cemntral Bank

154 -
Table 44. FNMP- Revenues, Expnses, and Investments - by Commodity
(1Mg)
zGrowth
1980/81 1981/82 1982/83 Rate
Vanilla
Revenues. 1,267,751,730 1,592,276,515 9,057,774,773 95.7Expenses 51,683,144 347,447,153 712,072,768 140.8Invest. 9,879,099 9,906,556 13,278,740 13.0Net Income 11 1,216.068,586 1,244,829,362 8,345,672,005 90.5Invest. as:Z of expenses 19.0 2.8 1.8 (54.4)Z of revenues 0.7 0.6 0.1 (47.7)Net Income as Z of 96.0 78.2 92.1Revenues
Coffee
Revenues 6,571,816,895 4,493,606,132 12,016,770,451 22.6Expenses 5,691,848,069 12,879,680,555 5,578,165,260 -Net Income: 879,968,826 (8,386,074,423) 6,438,605,221 94.0As Z of Revenues 13.0 ( ) 53.0 60.0
.. - Pepper
Revenues 155,295,308 24,666,274 175,407,091 4.1Expenses 284,447,956 112,932,063 169,124,476 (15.6)Net Income (129,149,648) (88,265,789) 6,2'32,543
Cloves
Revenues 8,741,534,101 4,518,000,080 6,955,519,922 (7.5)Expenses 1,149,786,123 5,953,316,189 1,389,146,812 6.5net Income 7,591,748,978 (1,435,316,109) 5,566,379,110 (9.7)
1/ Net Income - Revenues - Expenses
Source: Bank staff compilation from MC and Stabilizatioa Fund sources

Pipdrq 1.
WORLD RNp BRRZIL S COFFEE PRODUCTION
o 0
8- -8
W ~~~~~~~~~World
iO_j _J A*,.,,,,.o'~. World excluding Brazil 9
49 52 55 '58 61 6. , '70 '73 76
YER
Source: World Bank, Analysis of the World Coffea Knrket-Commodity Worling Paper #7
(June 1982) p. 35.4 v .

: ~~~~~~~~~~~~~~~~Figuire 2
RERL WORLD COFFEE PRICES f9ND WORLD STOCKS
(million bags)
300,0 - 150.0
Real World PrFi. (left scale)
250.0 125.0
200.0 100,0
World Stocks |
150.0 75.0
100.0 50.0
50,0 - w w w w | W -- 1 - ,- . _ g g _ 25.063 65 67 69 71 73 75 77 79 81
YCflR
la Detlatad by Bank's IPI (19784100)
Source: World Bank, Analysis of the World Coffee Harket--Commodity Working Paper #7- ~~~(June 1982) p. 3.

- 157 -
Figure 3.
COFFEE _(1981 CONSTANT 5 PRICES)
1948-81 ACTUfL; 1982-95 PROJECTED
.~~~~~~~n 1565 MD7 LC475 1980qm is 199 655
-: ~~~~~~~~~YEPRS_ EFLMME BY MMMMU-TRING UNIT VflLU URNI INDE
-Source: T. Akiyama, Impact of the International Coffee Agreement an the World Coffee
- ~~~~Economy (May 25, 1983) Figure 2.
cm. .~
.. ~ ~ ~ I~
.- ~~ ~ .~

Filiure 4s Ratio of Robusta to Avebics Prices -
Ratio
0.9- I 0.00.7 0.7
0.8 ~~~~~~~~~~~~~~08
* ~~0.5* l . .... ,- e60 ''0S S7; 72 7t4 7876 0 5e
Year
a/ Robuota Prices bra tlose of "Robustas, Ex-dock Rau York" (ICA)Arabic l1riceu are tltosa of "Other Mild Arbleas, Ex-dock New York" (ICA)
Sourcel T. Akiyama, Prospects of World Coffee Economy a,$ Their Implicationson Producing Countries (10/24/83) p. 12.
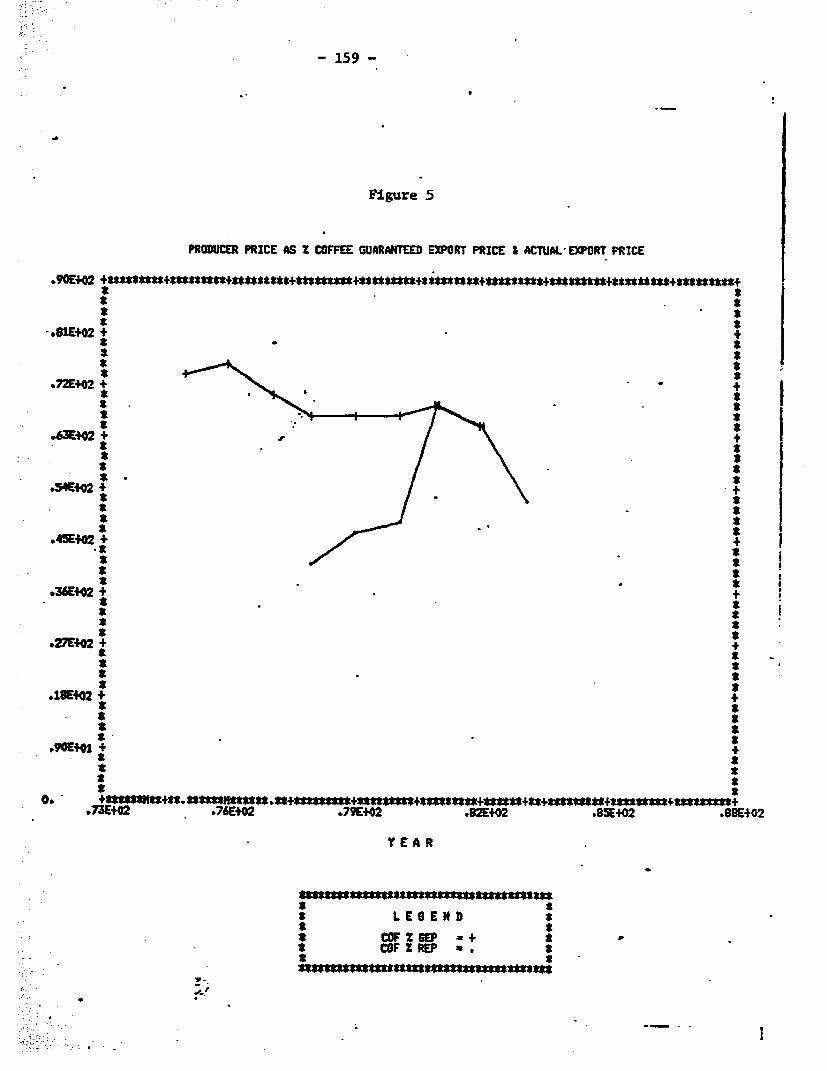
- 159 -
Figure 5
PRODUER PRICE AS x COFFEE GUARWA EXPORT PRICE I ACAL EXPORT PRICE
.90E+02 +nst*ss*+*tsmnnnnnnnt*t*.+ssntt*n+nusnn,*tss*nn+*s*nng.,sgmnsn+.s*"*s,sgn+,ansn+
.81E+02* 2
.72E+02 2
*+112 + +
045E+02 + '+
* *
.S36E+02 +_ 2
* *
* 2
.72E+02 + -+
.?3EtO2 .76Eff2 .79E+02 .82EO2 *85E+02 j88EtO2*E R
2* 2
2 2~~~~~~~~~~~CF2G ~~~* 2:FZ
2 WF Z REP X* *
.54Ef__ + . l2.2

- 160 -
Figure 6
PRODUCER PRICE AS Z CLOVES GUARANTEED EXPORT PRICE S ACTUAL EXPORT PRICE
.90E40 +*nn*4n3tl***nRttX$#+g*t2t*g#+flns*n t*fl*t*tannn*8422f*nf+*nh2**t+smtfnl+
: 81EfO2 + t* '*
02 t*
141E+02+ +
£_ *.'t 2 f*
i ~~ * '2
.CllE+02 + +
t2 t t
* ~ ~~ t
.2O- 02 + +
p K+2 $
V *7-2E+02 ~~~.75E+02 .78E+o2 .81E+02 W4+02 -87E*C2
E Y E A R
t ~~~L E 6 E N 9
R 2 2~~~~~~~~~~~M G
N S aOZ a t
*~~~ .S.tP t ... 40 + +$ * I~~~~~"* g
~~* S*~~~~~~~~~~~~~~~~~~~~~~~~~~~~~~~ .
-f.=;* .2..150 4

-161-
Figure 7
PRODUCER PRICE AS % VANILLA 6UARANTEED EPORT PRICE I ACTUAL EXPORT PRIC
t ** 8~~~~~~~~~~~~~~~~~~~~~~
.36E+02 + +
a.32E+02 + +
.28E+O2 _ + *~~~~~~ t
*> . . *.92E+02 + +
*~~~~~~~ ** 2
* t
.16E402 + +
.80EtOl + t
t. .* ** t
.24E+Oj + +
* *S S
*~ ~~~~~~ . t
.1 7+2E+0 +7E0 7E0 8E0 8E0 8E
* ~LEG END-*
* VAN % GEP * * (no GEP) 2* _~VAN Z REP a
:-- ~ **
; -
;* .5...
:= ~ ~ S.-.-820 + +. . . *

- 162 -
Figure 8
PRODUCER PRICE AS Z PEPPER GUARANTEED EXPORT PRICE I ACTUAL EXPORT PRICE
.90E+02 +$*t***sn+n*ns*in+nn*e***t+s**sintn+********a+*nt*ts*****t+* **ts+tn*n*ts +n*r*nG$t+ssnnnnt
t *
*81Et02 4 +2 *t *
.72E+02 + +
3 -.
C 4.3EI02 + B +
E ~* / 2
2 J.
.36EtO2 + 7E - *E2
E 3. *3
Et * A
C .4iEtO2 ++
_ £* *
.36E*tP2 + + * *
t *S tt *
* t* *S* *
*o.IO +* +tn*tst*u+un*+mnn**m#usn+ux+
: 7E+Q.7E0 eOtO 8Ei2.2Eo s9+2
*~~~ S *~~ m2E2s
*:: ~ ~ ~ ~ ~ ~ ~ ~ v , ~ ~~~~~~~ . S
.-. ~~~~~~~~ 'EZE =+ S
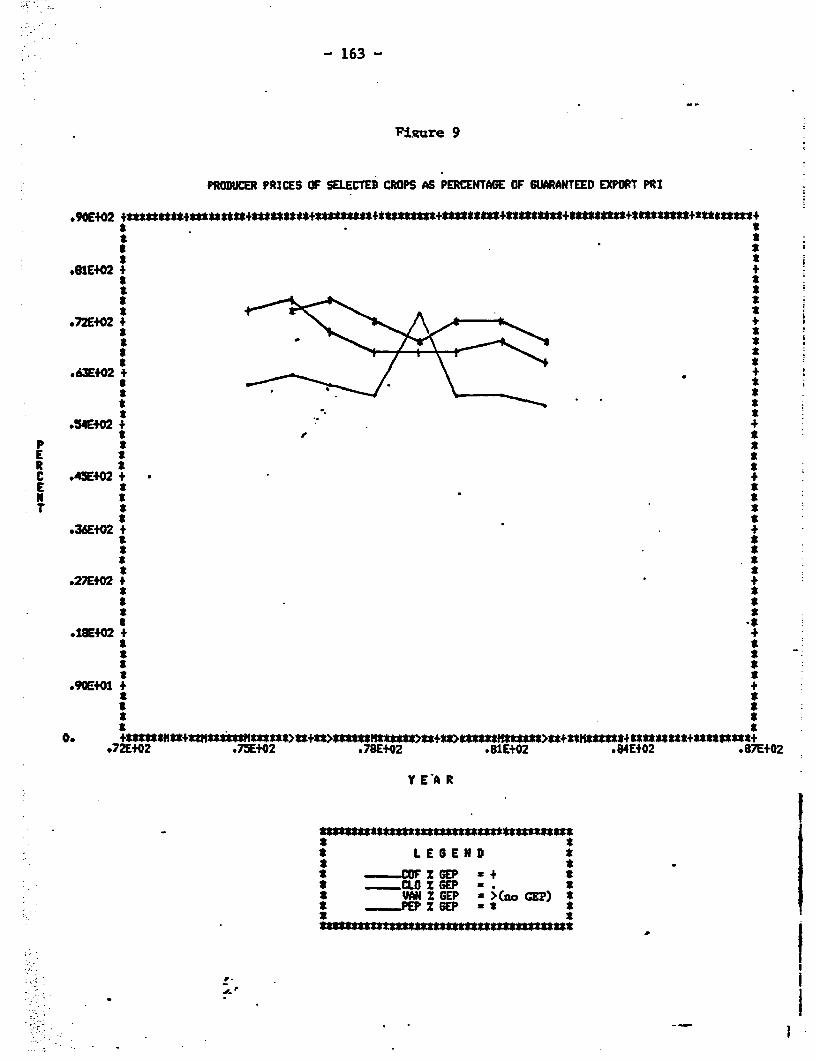
- 163 -
T'iRure 9
PRODUCER PRICES OF SELECTED CROPS AS PERCENTAGE OF GUARANTEED EXPORT PRI
*90Et02 t**f***+****t*t*22**+2*2 f***2****t+2*S2*222+2*2**+3*2*S*222+*tt****+*t*82 +* t
* *.91E402 + +
* 2
*72E+02 + +
*e3Et02 +
934Et02 t +
E t*
C .ff EtO2 t + E * *
.36EtO2 t '
_ *
**
.2SEI02 4 +
e *
18EtO2 + +
_* _
*90E+01 + +
.~~~ :. p ~ 92+2*7E0 7E0 &1+2.4+2 8702
Y E2 R
* 2nr Z GEP a tE 2 Z SEP -
N £ 2~~~~~~~~~~~AN2SP z (oCP
**______PEP X 6EP a
:~~~ ..~~~~ *
.- .2E0 . _ +

- 164 -
Fieure, 10
PRODUCER PRICES OF SELECTED CROPS AS PERCENTAGE OF ACTUAL EXPORT PRICES
- i
.72Et02 t +
64E02 + t
z 2 s * t
.4E402 + 4
g *
48DEtO2 + *p~~~
*2 +
**S2E902 + +
C .16E+02 +
ot
E 2~~~~~~~~~~~~~~ E I
t ~~~L E 6 E M D
N _F X REP t 2CLO 2-
a --. VN % REP a > s PEP Z REP *
.; ~ ~ .2~~~~~~~ _2
..... 0 + .4,.

- 165 -
Chart 1. Export Crop Marketing Circuit (1980)
Circuit des produits agricoles a l'exportation
Hode d'Intervention Circuit
Caisses produits et Producteursi
Ministare M.E.C.Fixation des prx- Apport des produits aux points d'achat
Fixation des prL (Fokontany)minimum garanti
Agent de Contr6le I Llecteurs (agrees)des collectivitesdgcentralisies - Achetent le produit
- Regroupent les achatsVersent les indemnites aux Collectivites.decentralisees
anaues : B.T.H. B.M.I. - BEnficient de prets de campagne (banque)B.C.R.M. Sont le plus souvent des agents des Societis
Prets de campagne Nationalisies
TransnDortl
- Assuri par les Collecteurs et le plus souventpar les Conditionneur -Stockeurs.
- Frais de transport inscrit au differentiel(prime unique)
lCndeitonneurs-Stockeursl(au port d'embarquement)
Banque prets de - Sociitis d'Etat commerciales (ou R participa-campagne (collecte) tion majoritaire d'Etat). Nantissement - Sociatis privees
Achatent le produit aux collecceurs
Role : USINAj1 - STOCKGE
Service du Nantissement des stocksCondicionnement Contr6le de qualiee
. Contratspar les Caisses Mise sous contrat Caisse des produits
A Antenne Caisse renre-sencee par Les C.s er les DEclaration hebdomadaire
: ~~S,., fl.

- 166 -
Chart 1.(cont'd)
'0p4rateurs-chargeurs
Auiorisation de vente Quatre Societes Nationalisies - Rosetransmise par les - SomacodisCaisses-vencilation - CoroiJes embarquements - Sice
avec monopole des operations d'embarquement.
- Achat des produits aux Conditionneur- gtockeurs(distockage)
Controle du Service - Mise A quai - chargementdu conditioinement
BFV, BTM, BEN : - Decompte des operations de ventescredits documentairesTr-sor - Reversement I la Caisse Compte Trfsor de la
diffirence entre prix FOB-realisation et prixFOB revient.
Ezpedition I
intervention du Hinistare de 1'Economie et du Commerce|Hinistare dansles ventes - Dfsigne les opdrgteurs-chargeurs
- Passe les contrats de vente (contrats pluri-annuels : cafe, girofle, po;vre)
- Dibloque les exportations(quantites -
destiuation)
- Delivre les autorisations de vente en liaisonavec les Caisses.
Source: Diagnostic Caisses de Stabilisation. Export Assistance International,Paris, March 1980.

Cheet 2. sz,oct Crops Karketing Calendar
January February Harch .pi1 Hay Jumo July August September October November December
COWPE'
Growing -- --
Harvest North - - -
Iarveet, South -
Processingi Farm - - -
Procesming, Conditioner-- .--...--
Marketing .. - - - _ _ - ' -
Exports. --- -_ - - -
CLOVES Y cuoAAe
GrowingHervest - -
processing: Farm ) - _Proeeosing, Conditioner )Marketing IExporta - _ -
VANILLA
Growing - 3Harvest: North -
Harvests South -
Proceesgs G arees Proce.singu Conditioner - - -
Marketings Green -
Marketing: ProseexedMarket lug 3 - -3----
Exports
PEPPER .-
Harvests Ho.si-b.Harvests East Coast - - - -
Processing --- ---
Marketing -
Exports
COCOA
Harvest - -
Processing: Direct - -
sale toI tFacory

- 168
Chart 3: List of Participants in Decision-Naking
- LISTE DES INTERVENANTS EN
FONCTION DES NIVEAUX DE DECISION
AU~~~A
\ .ayss I
- iticzme.~~~~zrs stockeurs X 'C'a 4
0 | \ | }t va | 3 4 § l 3R X Fv Ss, 3 1 :~~~~~~~~~~~~~~~~~ \
_ Paysas x X
0ondtaes scer . 'x
-, X~j X . X- x X x x x
- isses x @ @ 0
-md X 0 X
- Min. de la Prod. Agricole x X
- Min. des Tavauc Publics x x
- Minis redes Tranx x x
- Ministare du Plan an)
- Arteies etrie x x
- CoUectivites localas x x
- Minist?re des Finances ( )
- Barques Priies x x X
® PrinciiuE UXtexvenants
X Autras inbarvenants

IBRD 11ul2VAY 136
r . .- MADAGASCAR - IPRINCIPAL EXPORT CROPS AND TRANSPORT NErWORK
PRINCIPALES CULT7JRES DEXPORT ETRESEAU DES NSOR %a_d to64 VA"Y CRUS'
't4oe.pmruiwt cAoed. H.IIrtlI: ^ ~~~Abts swessemen: CV .tS mu3
Ac~ohew can"AI- -,- ;z stm. tiX
*___ .Notiona capital- . ''~~~~~~~~~~C" Ric ;&1< Ca "in cm-I-8<-. Roilh 0* : Ghf disft itd doww«l
C* Fatj1opprz.. coe!, __ Aaaoa. 0
i.eu do ft thec.-' -g.
PAwm. or rwv low- Sh_Akcep,r{eA> .: Pe to. .;J B _ E
£asfesdstdwetsra M4'Nac. - ~ -iw !ialt I 'C 4-t 44ia .C
4obo, -d-i
/t . ereEh P d Me
,i-fas dA NA / .
C i.124$bs t;$)°F~ -
Mahajangafg -*- 0 5 1 IS 200
// Ohominobe ,-- ,3r -_1 jt+- 8indrea
ton.ak.. -- -4 ;s>
-eam ow. ,emm. 'i R_
-ln Vit h..S 4 npi:-
an ew.S d _ < r ..
J ,S t -<=- A Toiol;;;a4. i g u
Ambeo..MDCSA
,~~~~~~~J oI -iXos S F 2 J !,,, f M ,A _F A I A R14 A Cm m
> tj W lji1> ,<-|( % M ananje,y g _~~~~~~~~Aftona
=- , -j . .!emb - I FianoUTN\
.__ . Antsir 2rAZCA-
_dn_r_s ~ ~ ~ ~ Taabnaro t I r"1aDAGAv-AR~~~niar
4er~~~~~~~~~~~~~~~~~~~IOMTR q, 30 IWIO 0