Genetic diversity among tropical maize inbred lines as ...
10
2010 AJCS 14(12):2010-2019 (2020) ISSN:1835-2707 doi: 10.21475/ajcs.20.14.12.1589 Genetic diversity among tropical maize inbred lines as revealed by SSR markers Maizura Abu Sin 1 , Ghizan Saleh 1 *, Nur Ashikin Psyquay Abdullah 2 and Pedram Kashiani 3 1 Department of Crop Science, Faculty of Agriculture, Universiti Putra Malaysia, 43400 Serdang, Selangor, Malaysia 2 Creepers Nursery, Spinney Hill, Addlestone KT15 1AD, United Kingdom 3 Department of Agricultural Science, Faculty of Technical and Vocational Education, Universiti Pendidikan Sultan Idris, 35900 Tanjung Malim, Perak, Malaysia *Corresponding author: [email protected] Abstract Genetic diversity and phenotypic superiority are important attributes of parental inbred lines for use in hybrid breeding programs. In this study, genetic diversity among 30 maize (Zea mays L.) inbred lines comprising of 28 introductions from the International Maize and Wheat Improvement Center (CIMMYT), one from Indonesia and a locally developed, were evaluated using 100 simple sequence repeat (SSR) markers, as early screening for potential parents of hybrid varieties. All markers were polymorphic, with a total of 550 unique alleles detected on the 100 loci from the 30 inbred lines. Allelic richness ranged from 2 to 13 per locus, with an average of 5.50 alleles (n a ). Number of effective alleles (n e ) was 3.75 per locus, indicating their high effectiveness in revealing diversity among inbred lines. Average polymorphic information content (PIC) was 0.624, with values ranging from 0.178 to 0.874, indicating high informativeness of the markers. High gene diversity was observed on Chromosomes 8 and 4, with high number of effective alleles, indicating their potential usefulness for QTL analysis. The UPGMA dendrogram constructed identified four heterotic groups within a similarity index of 0.350, indicating that these markers were able to group the inbred lines. The three- dimensional PCoA plot also supports the dendrogram grouping, indicating that these two methods complement each other. Inbred lines in different heterotic groups have originated from different backgrounds and population sources. Information on genetic diversity among the maize inbred lines are useful in developing strategies exploiting heterosis in breeding programs. Keywords: genetic distance; heterotic group; molecular estimation; polymorphism; SSR; Zea mays L. Abbreviations: CIMMYT_International Maize and Wheat Improvement Center; CML_CIMMYT Maize Lines; CTAB_cetyl trimethylammonium bromide; PCoA_Principal coordinate analysis; PCR_Polymerase chain reaction; PIC_Polymorphic information content; QTL_Quantitative trait loci; SSR_Simple sequence repeats; TE_Tris- ethylenediaminetetraacetic acid. Introduction In maize (Zea mays L.) hybrid breeding, success in the exploitation of heterosis depends on genetic diversity of the parental lines (Falconer and Mackay, 1996), as means to select lines that exhibit maximum heterosis without making all possible crosses among them (Makumbi et al., 2011). Lack of genetic diversity may lead to limitation in breeding progress and genetic advance from selection (Cornelious and Sneller, 2002; Onaga et al., 2012). Various approaches have been employed to examine genetic diversity and inter-relationship among crop genotypes including morpho-agronomic, pedigree, biochemical and DNA- based molecular means (Mohammadi and Prasanna, 2003; Govindaraj et al., 2014). A range of molecular tools has been successfully utilized for assessment of genetic diversity with good reliability. The most common being Restricted Fragment Length Polymorphisms (RFLPs), Amplified Fragment Length Polymorphisms (AFLPs), Random Amplified Polymorphic DNA (RAPD), Inter-Simple Sequence Repeats (ISSR) and Simple Sequence Repeats (SSRs). However, in the last decade, SSRs has been preferred because of the advantages offered. SSRs also known as microsatellites, are short run of tandemly repeated sequences, which are evenly distributed in the eukaryotic genome (Taramino and Tingey, 1996). Being co- dominant, SSRs markers are mainly employed in plant analysis due to their hyper variable nature, wide genome coverage, high reproducibility, reliability and discriminating ability, and ability to give high allelic variations (Ko et al., 2016), besides highly specific and polymorphic (Jones et al., 1997). Numerous studies have utilized SSR markers to assess genetic diversity and relationships among maize populations (Cömertpay et al., 2012; Aci et al., 2013; Nyaligwa et al., 2015; Shayanowako et al., 2018; Adeyemo and Omidiji, 2019). Li et al. (2006) studied 22 CIMMYT subtropical QPM and 24 Chinese inbred lines using 64 SSR markers and obtained two main clusters. Makumbi et al. (2011) studied diversity, heterosis and combining ability among 15 tropical maize lines using 32 SSR markers and found that most lines were grouped together among four clusters according to their pedigrees. Kanagarasu et al. (2013) utilized 10 SSR markers on 27 exotic and indigenous maize inbred lines and obtained five major clusters representing different heterotic groups. Singh et al. (2018) were able to differentiate 18 maize inbred lines into four heterotic groups using SSR markers, while Wende et al. (2013) found that separation of lines into distinct clusters was a result
-
Upload
khangminh22 -
Category
Documents
-
view
0 -
download
0
Transcript of Genetic diversity among tropical maize inbred lines as ...

2010
AJCS 14(12):2010-2019 (2020) ISSN:1835-2707 doi: 10.21475/ajcs.20.14.12.1589
Genetic diversity among tropical maize inbred lines as revealed by SSR markers
Maizura Abu Sin1, Ghizan Saleh1*, Nur Ashikin Psyquay Abdullah2 and Pedram Kashiani3
1Department of Crop Science, Faculty of Agriculture, Universiti Putra Malaysia, 43400 Serdang, Selangor, Malaysia 2Creepers Nursery, Spinney Hill, Addlestone KT15 1AD, United Kingdom
3Department of Agricultural Science, Faculty of Technical and Vocational Education, Universiti Pendidikan Sultan
Idris, 35900 Tanjung Malim, Perak, Malaysia *Corresponding author: [email protected] Abstract Genetic diversity and phenotypic superiority are important attributes of parental inbred lines for use in hybrid breeding programs. In this study, genetic diversity among 30 maize (Zea mays L.) inbred lines comprising of 28 introductions from the International Maize and Wheat Improvement Center (CIMMYT), one from Indonesia and a locally developed, were evaluated using 100 simple sequence repeat (SSR) markers, as early screening for potential parents of hybrid varieties. All markers were polymorphic, with a total of 550 unique alleles detected on the 100 loci from the 30 inbred lines. Allelic richness ranged from 2 to 13 per locus, with an average of 5.50 alleles (na). Number of effective alleles (ne) was 3.75 per locus, indicating their high effectiveness in revealing diversity among inbred lines. Average polymorphic information content (PIC) was 0.624, with values ranging from 0.178 to 0.874, indicating high informativeness of the markers. High gene diversity was observed on Chromosomes 8 and 4, with high number of effective alleles, indicating their potential usefulness for QTL analysis. The UPGMA dendrogram constructed identified four heterotic groups within a similarity index of 0.350, indicating that these markers were able to group the inbred lines. The three-dimensional PCoA plot also supports the dendrogram grouping, indicating that these two methods complement each other. Inbred lines in different heterotic groups have originated from different backgrounds and population sources. Information on genetic diversity among the maize inbred lines are useful in developing strategies exploiting heterosis in breeding programs. Keywords: genetic distance; heterotic group; molecular estimation; polymorphism; SSR; Zea mays L. Abbreviations: CIMMYT_International Maize and Wheat Improvement Center; CML_CIMMYT Maize Lines; CTAB_cetyl trimethylammonium bromide; PCoA_Principal coordinate analysis; PCR_Polymerase chain reaction; PIC_Polymorphic information content; QTL_Quantitative trait loci; SSR_Simple sequence repeats; TE_Tris- ethylenediaminetetraacetic acid. Introduction In maize (Zea mays L.) hybrid breeding, success in the exploitation of heterosis depends on genetic diversity of the parental lines (Falconer and Mackay, 1996), as means to select lines that exhibit maximum heterosis without making all possible crosses among them (Makumbi et al., 2011). Lack of genetic diversity may lead to limitation in breeding progress and genetic advance from selection (Cornelious and Sneller, 2002; Onaga et al., 2012). Various approaches have been employed to examine genetic diversity and inter-relationship among crop genotypes including morpho-agronomic, pedigree, biochemical and DNA-based molecular means (Mohammadi and Prasanna, 2003; Govindaraj et al., 2014). A range of molecular tools has been successfully utilized for assessment of genetic diversity with good reliability. The most common being Restricted Fragment Length Polymorphisms (RFLPs), Amplified Fragment Length Polymorphisms (AFLPs), Random Amplified Polymorphic DNA (RAPD), Inter-Simple Sequence Repeats (ISSR) and Simple Sequence Repeats (SSRs). However, in the last decade, SSRs has been preferred because of the advantages offered. SSRs also known as microsatellites, are short run of tandemly repeated sequences, which are evenly distributed in the
eukaryotic genome (Taramino and Tingey, 1996). Being co-dominant, SSRs markers are mainly employed in plant analysis due to their hyper variable nature, wide genome coverage, high reproducibility, reliability and discriminating ability, and ability to give high allelic variations (Ko et al., 2016), besides highly specific and polymorphic (Jones et al., 1997). Numerous studies have utilized SSR markers to assess genetic diversity and relationships among maize populations (Cömertpay et al., 2012; Aci et al., 2013; Nyaligwa et al., 2015; Shayanowako et al., 2018; Adeyemo and Omidiji, 2019). Li et al. (2006) studied 22 CIMMYT subtropical QPM and 24 Chinese inbred lines using 64 SSR markers and obtained two main clusters. Makumbi et al. (2011) studied diversity, heterosis and combining ability among 15 tropical maize lines using 32 SSR markers and found that most lines were grouped together among four clusters according to their pedigrees. Kanagarasu et al. (2013) utilized 10 SSR markers on 27 exotic and indigenous maize inbred lines and obtained five major clusters representing different heterotic groups. Singh et al. (2018) were able to differentiate 18 maize inbred lines into four heterotic groups using SSR markers, while Wende et al. (2013) found that separation of lines into distinct clusters was a result
2011
of prior selection of polymorphic SSR markers, showing high genetic distances. The objectives of the present study were to determine genetic diversity among 28 introduced tropical maize inbred lines obtained from the International Maize and Wheat Improvement Center (CIMMYT). One inbred line originated from Indonesia and one locally developed. We used SSR markers to assess genetic diversity among them and subsequently assign them into appropriate heterotic groups for potential use as parents in future maize hybrid breeding programs. These CIMMYT inbred lines have previously been identified phenotypically as potential parents for forage use. They have not been subjected to molecular diversity assessment in the past. Results Allelic variability and polymorphism All the 100 SSR markers utilized were found to be polymorphic, comprising of dinucleotide repeat motifs (63%), trinucleotide repeat motifs (18%), tetranucleotide repeat motifs (7%), and pentanucleotide repeat motifs (7%), while 5% were unidentified. Among the 2866 bands amplified, 550 were unique. The highest percentage of polymorphic bands (PPB) was obtained from SSR marker bnlg1444 (PPB = 43.33%) (Supplementary Table 1), which also revealed the highest number of alleles (13 alleles), with the dinucleotide type of repeat located in Bin 4.08, followed by SSR marker bnlg1917 (PPB = 40.00%) located in Bin 4.10, bnlg1152 (PPB = 40.00%) located in Bin 8.06 and umc1029 (PPB = 36.67%) located in Bin 7.04 (all were dinucleotide type of repeats). In contrast, the lowest PPB was obtained from nine SSR markers, namely umc1467 (a trinucleotide repeat motif in Bin 1.02), umc1604 (a trinucleotide repeat motif in Bin 2.08), umc1639 (a pentanucleotide repeat motif in Bin 3.10), umc1963 (an unspecific number repeat motif in Bin 4.04), umc2406 (a trinucleotide repeat motif in Bin 5.04), umc1348 (a dinucleotide repeat motif in Bin 5.05), umc1143 (a pentanucleotide repeat motif in Bin 6.00), umc1695 (a dinucleotide repeat motif in Bin 7.00) and umc1279 (a trinucleotide repeat motif in Bin 9.00), all having the same PPB value of 6.67. Results of the evaluation revealed high genetic variations, indicating that the inbred lines possessed high genetic variability. Allelic richness ranged from two alleles per locus (for SSR marker umc1467, umc1604, umc1639, umc1693, umc2406, umc1348, umc1143, umc1695 and umc1279) to 13 alleles per locus (for SSR marker bnlg1444), with a mean of 5.50 alleles per locus, while number of effective alleles per locus ranged from 1.25 to 8.67 alleles, with a mean of 3.75 alleles per locus. The highest number of effective bands per locus was obtained from SSR marker bnlg1444, with 8.67 alleles, followed by umc1278, with 8.53 alleles per locus and umc1031, with 8.45 effective alleles per locus. Average PIC value among the markers was 0.624, with values ranging from 0.178 (umc1639) to 0.874 (bnlg1444), where 77% of those values were higher than 0.500. This describes the usefulness of these markers in measuring genetic diversity among the inbred lines. Average observed homozygosity and heterozygosity among the inbred lines were 0.983 and 0.017, respectively. High homozygosity and low heterozygosity values are indications of the presence of Hardy-Weinberg disequilibrium caused by selfing and selection imposed on the inbred lines over generations, reducing heterozygosity among them. The SSR
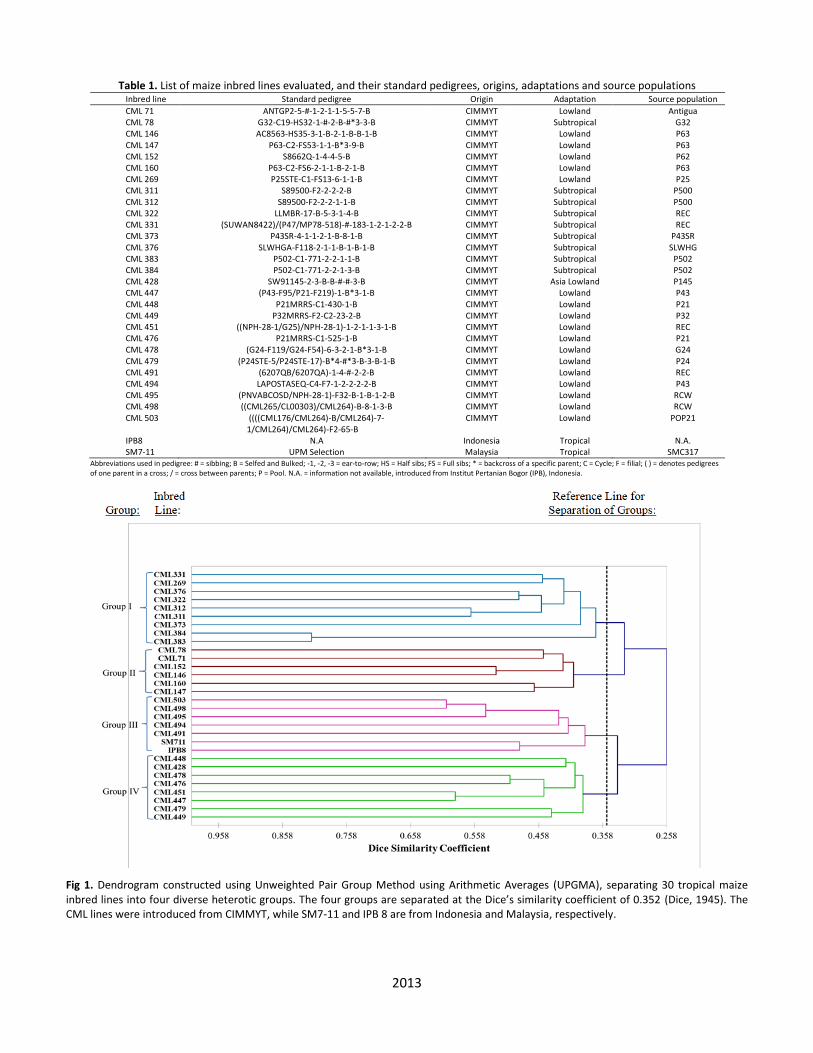
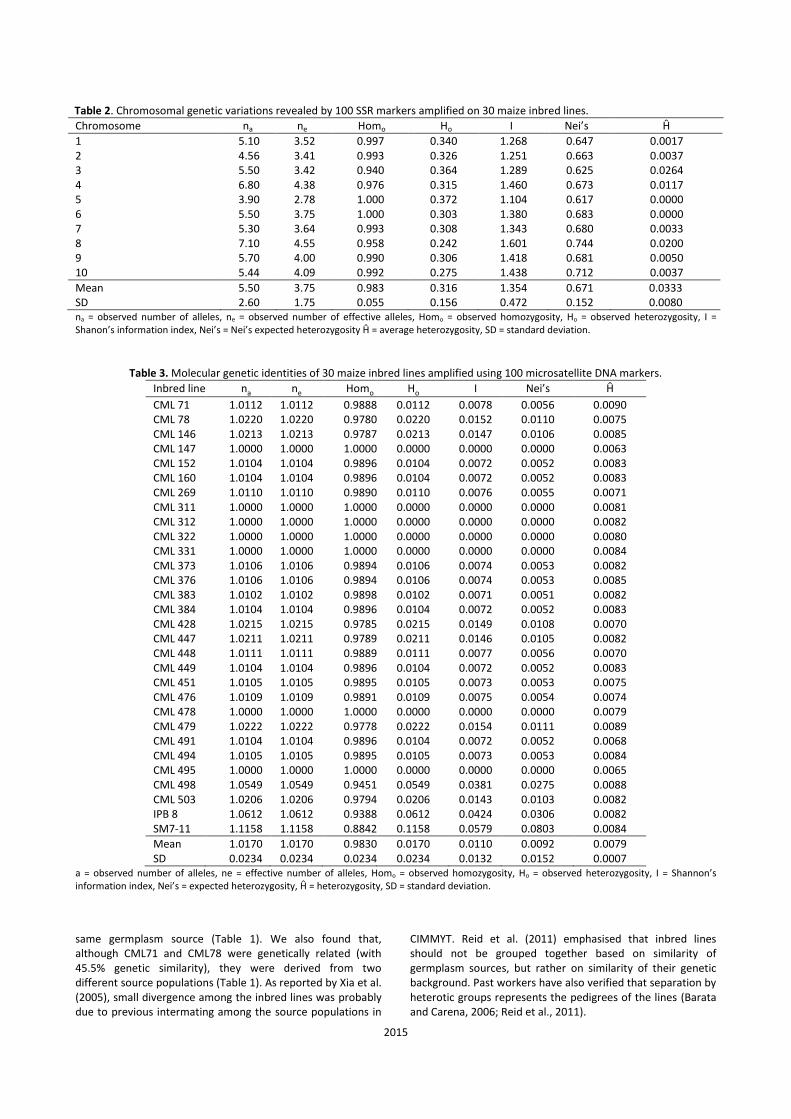
marker bnlg1444 was found to reveal the highest Shannon’s information index (I = 2.339) and highest Nei’s expected heterozygosity (Nei’s = 0.885) (Supplementary Table 1). In contrast, SSR marker umc1639 revealed the lowest Shannon’s Information Index (I = 0.349) and lowest Nei’s expected heterozygosity (Nei’s = 0.198). The average genetic diversity for the two SSR markers based on Shannon’s information index (I) and Nei’s gene diversity estimated were 1.354 and 0.671, respectively. The information on gene diversity from Shannon’s index and Nei’s gene diversity indicates high level of within-line genetic diversity. This information could be utilized to investigate diversity revealed by the 30 maize inbred lines studied. The high genetic differentiation (FST = 0.989) and low level of gene flow (NmF) (0.003) revealed manifestations of high efficiency of the SSR markers. Nine SSR markers were obtained from Chromosomes 2 and 10, 10 from Chromosomes 1, 4, 5, 6, 7, 8 and 9, and 12 from Chromosome 3. Information from each chromosome was calculated based on the alleles detected by the SSR markers. Results have shown that, on the average, Chromosome 8 had the highest allele number per locus (na) (7.10) and number of effective alleles (ne) (4.55), indicating that this chromosome had the richest gene diversity (Table 2). This was also reflected by the highest Nei’s expected heterozygosity (0.744) revealed by the chromosome, inferring its high genetic diversity. This is an evidence that this chromosome possessed the most diverse genes on the loci involved. Besides Chromosome 8, Chromosome 4 also showed high gene diversity, with observed number of alleles of 6.80 per locus and number of effective alleles of 4.38. In addition, Chromosomes 8 and 4 also had high Shannon’s information indices (1.601 and 1.460, respectively), and high Nei’s heterozygosity coefficients (0.744 and 0.673, respectively), further emphasizing their gene richness and informativeness. Genetic information of each of the inbred lines is presented in Table 3, which was subsequently used in the analysis on genetic similarities. Based on results of genetic identities of the 30 inbred lines studied, inbred line SM7-11, IPB 8 and CML498 were found to be the most heterogeneous, revealing high Nei’s heterozygosity estimates of 0.0803, 0.0306 and 0.0275, respectively. They also portrayed the highest number of alleles, number of effective alleles and Shannon’s information index (Table 3). In contrast, the least heterogeneous were inbred lines CML147, CML311, CML312, CML322, CML331, CML478 and CML495, revealing very low values for these genetic parameters. Genetic similarities among inbred lines for SSR loci A dendrogram established from similarity coefficients among the inbred lines using the UPGMA method is presented in Fig 1. Result of Mantel test giving cophenetic value of r = 0.818 is the evidence for the good agreement between result of the genetic similarity matrix and what is portrayed by the dendrogram. The cluster analysis has clearly separated the lines into different groups. Genetic similarities ranged from 0.114 (between CML 383 and CML 479) to 0.813 (between CML 383 and CML 384). At a vertical cut of 0.352 of Dice’s coefficient on the UPGMA dendrogram (Fig 1), four diverse groups were identified as follows: Group I represented by nine CIMMYT inbred lines, CML269, CML311, CML312, CML322, CML331, CML376, CML373, CML383 and CML384, with an average similarity coefficient of 0.369; Group II represented by six other CIMMYT inbred lines CML71, CML78, CML146, CML147, CML152 and CML160, with coefficient of 0.404;
2012
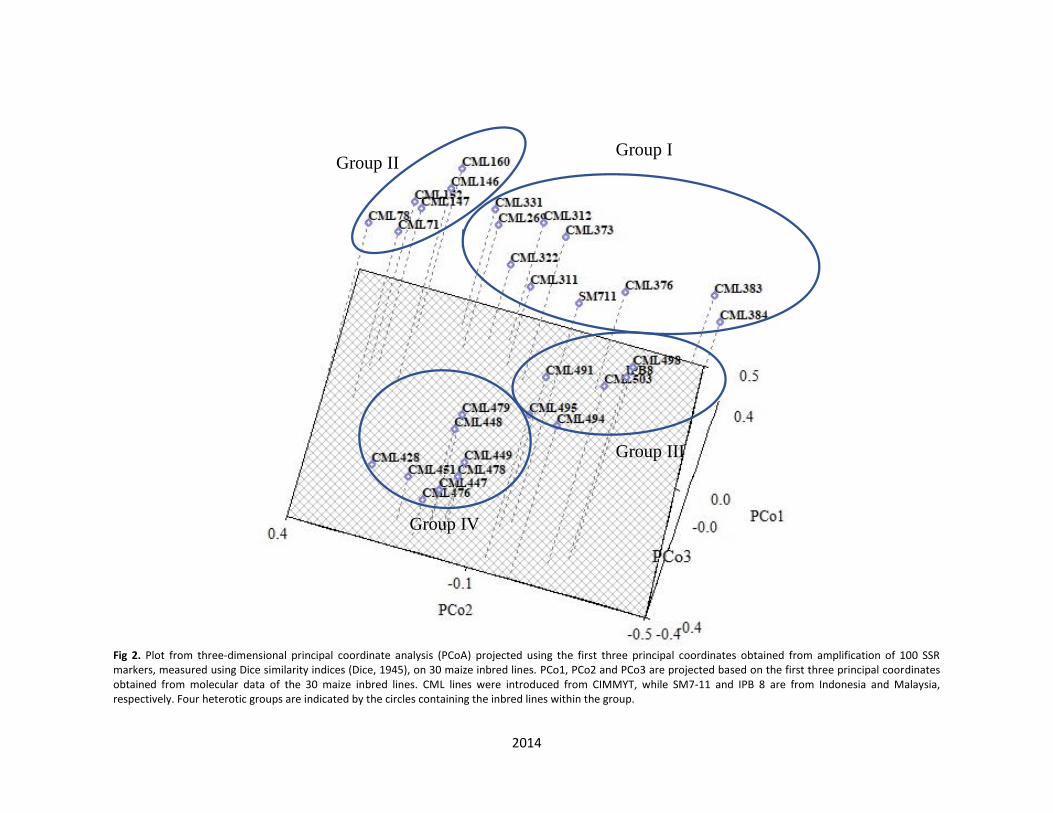
Group III consisted of five CIMMYT inbred lines, CML491, CML494, CML495, CML498 and CML503, the inbred line from Indonesia, IPB8, and the line from Malaysia, SM7-11, with coefficient of 0.386. Group IV comprised of eight CIMMYT inbred lines, CML428, CML448, CML447, CML449, CML451, CML476, CML478 and CML479), with an average similarity coefficient of 0.389. The most genetically similar inbred lines were CML383 (standard pedigree: P502-C1-771-2-2-1-1-B) and CML 384 (standard pedigree: P502-C1-771-2-2-1-3-B) placed in Group I, which were both originated from the same source population (P502), and with a related pedigree (CIMMYT Global Maize Program, 2015). The second highest similarity was shown between CML311 (standard pedigree: S89500-F2-2-2-2-B*5) and CML312 (standard pedigree: S89500-F2-2-2-1-1-B*5), which were also placed in Group I. As seen from the pedigrees, they were both originated from the same source population and shared 56.5% similarity based on the SSR markers. Although some inbred lines showed different pedigrees but were genetically related and grouped into the same cluster. Inbred line CML71 and CML78 were both developed from two different source populations (Antigua and G32, respectively) but were genetically related (0.455 of similarity coefficient), as they are placed in the same cluster. Based on the dendrogram established, Group IV consists of several lowland inbred lines developed from seven different population sources (P145, P43, P21, P32, REC, G24 and P24). Genetic distance by PCoA A three-dimensional principal coordinate analysis (PCoA) plot was constructed (Fig 2) to depict the distance among the maize inbred lines. Their distribution based on information from the PCoA were derived from the genetic distances from the three main component factors of the eigenvalues (data are not shown). Interestingly, it is clearly seen that the three-dimensional projection supports the dendrogram constructed by UPGMA grouping method (Fig 1), indicating that these two methods complement each other towards the group separation. The only obvious exception is that inbred line SM7-11 seems to fit in the cluster corresponding to Group I of the plot (Fig 2), not Group III as previously depicted in the dendrogram (Fig 1). Discussion A total of 2866 bands amplified by the 100 SSR markers distributed on 10 chromosomes. They were used as the basis of the analysis of genetic diversity among the 30 maize inbred lines. Among the polymorphic bands amplified, 550 alleles were considered adequate for the assessment. The extent of diversity was assessed using PIC, gene diversity and genetic distances. The presence of high polymorphism and high number of rare alleles were observed among these inbred lines, which is an explanation to the presence of high intra-group diversity, as described by Glaszmann et al. (2003). The magnitude of mean PIC value (0.624) was higher than that previously reported by Smith et al. (1997), which involved 58 maize inbred lines and four maize hybrids (PIC = 0.62). Sserumaga et al. (2014) reported (PIC = 0.61) on 42 tropical maize inbred lines; Senior et al. (1998) on 94 elite maize inbred lines (PIC = 0.59), Belalia et al. (2018) on 56 maize landraces (PIC = 0.57) and Nyaligwa et al. (2015) on 79 elite maize inbred lines (PIC = 0.51). However, lower values were reported by Li et al. (2006) from a study on 22 CIMMYT QPM maize inbred lines and 24 Chinese maize inbred lines (PIC =
0.66), Shayanowako et al. (2018) reported (PIC = 0.58) on 37 diverse maize genotypes and Adeyemo and Omidiji (2019) on 19 diverse maize varieties (PIC = 0.75). The high PIC values obtained is an indication of the high informativeness of the markers, as reflected by the scale proposed by Botstein et al. (1980), where PIC value of > 0.5 accounts for a highly informative marker, 0.5 > PIC > 0.25 for informative marker, and PIC ≤ 0.25 for a slightly informative marker. High estimates of PIC obtained were probably because primers with low discriminatory ability have been eliminated during the initial screening. The distribution of loci involved all the 10 chromosomes, representing the actual diversity of the inbred lines. The high level of polymorphism indicates that variations among the inbreds were considerably high, where exploitation of heterosis in hybrid crosses could be effective. Shiri et al. (2014) observed a high Nei’s expected heterozygosity (0.52) as well as a high Shannon’s information index (0.94) in their study on maize, supporting our findings. However, these values were lower than those reported by Xiang et al. (2010) and Belalia et al. (2018). Average number of alleles detected was 5.5 per locus, slightly lower than that reported from a previous study involving 86 white and 69 yellow lowland tropical CIMMYT maize inbred lines (7.4 alleles per SSR locus) (Xia et al., 2004), and that reported on 73 subtropical, 11 tropical highland and 10 tropical lowland CIMMYT maize inbred lines (7.2 alleles per SSR locus) (Xia et al., 2005). A lower level of allelic richness was found in the studied maize inbred lines, indicating that the use of a small number of inbred lines has contributed to the narrow gene diversity within the population. Average observed homozygosity and observed heterozygosity found on the inbred lines were slightly higher than that reported by Kashiani et al. (2012b) (Homo = 0.9396 and Ho = 0.0604). High gene variation in the chromosomes of the inbred lines studied showed that they possess the information required in genetic diversity. Similarly, result on genetic differentiation (F) indicates that there was a high genetic variability among the studied inbred lines. High F values revealed that a large portion of total genetic diversity could be attributed to the high genetic variation among the inbred lines. Previous workers have reported different values of observed F (Aci et al., 2013; Ferreira et al., 2018), depending on genetic materials assessed. Based on results of the individual genetic identities of the inbred lines, the high variation observed among the inbred lines was due to different pedigrees of these lines that originated from different breeding programs utilizing different source populations, giving a reflection that these inbred lines belong to different genetic groups. This diversity could be utilized to develop superior hybrid varieties with high level of heterosis by involving parental lines from different groups. It is interesting to note that the local inbred line SM7-11, and the one introduced from Indonesia IPB8, revealed high diversity among loci, probably due to the diverse sources involved in their development, making them more heterogeneous. From the dendrogram constructed based on SAHN clustering and from the three-dimensional PCoA projection, four heterotic groups were formed separating the inbred lines. Eight subtropical lines were clustered together in one group. Two of them (CML383 and CML384) were also found to be clustered in the same group in another study reported by Xia et al. (2005). These two highly related inbred lines had highest genetic similarity coefficient between them, because they have similar pedigrees, since they originated from the
2013
Table 1. List of maize inbred lines evaluated, and their standard pedigrees, origins, adaptations and source populations Inbred line Standard pedigree Origin Adaptation Source population
CML 71 ANTGP2-5-#-1-2-1-1-5-5-7-B CIMMYT Lowland Antigua CML 78 G32-C19-HS32-1-#-2-B-#*3-3-B CIMMYT Subtropical G32 CML 146 AC8563-HS35-3-1-B-2-1-B-B-1-B CIMMYT Lowland P63 CML 147 P63-C2-FS53-1-1-B*3-9-B CIMMYT Lowland P63 CML 152 S8662Q-1-4-4-5-B CIMMYT Lowland P62 CML 160 P63-C2-FS6-2-1-1-B-2-1-B CIMMYT Lowland P63 CML 269 P25STE-C1-FS13-6-1-1-B CIMMYT Lowland P25 CML 311 S89500-F2-2-2-2-B CIMMYT Subtropical P500 CML 312 S89500-F2-2-2-1-1-B CIMMYT Subtropical P500 CML 322 LLMBR-17-B-5-3-1-4-B CIMMYT Subtropical REC CML 331 (SUWAN8422)/(P47/MP78-518)-#-183-1-2-1-2-2-B CIMMYT Subtropical REC CML 373 P43SR-4-1-1-2-1-B-8-1-B CIMMYT Subtropical P43SR CML 376 SLWHGA-F118-2-1-1-B-1-B-1-B CIMMYT Subtropical SLWHG CML 383 P502-C1-771-2-2-1-1-B CIMMYT Subtropical P502 CML 384 P502-C1-771-2-2-1-3-B CIMMYT Subtropical P502 CML 428 SW91145-2-3-B-B-#-#-3-B CIMMYT Asia Lowland P145 CML 447 (P43-F95/P21-F219)-1-B*3-1-B CIMMYT Lowland P43 CML 448 P21MRRS-C1-430-1-B CIMMYT Lowland P21 CML 449 P32MRRS-F2-C2-23-2-B CIMMYT Lowland P32 CML 451 ((NPH-28-1/G25)/NPH-28-1)-1-2-1-1-3-1-B CIMMYT Lowland REC CML 476 P21MRRS-C1-525-1-B CIMMYT Lowland P21 CML 478 (G24-F119/G24-F54)-6-3-2-1-B*3-1-B CIMMYT Lowland G24 CML 479 (P24STE-5/P24STE-17)-B*4-#*3-B-3-B-1-B CIMMYT Lowland P24 CML 491 (6207QB/6207QA)-1-4-#-2-2-B CIMMYT Lowland REC CML 494 LAPOSTASEQ-C4-F7-1-2-2-2-2-B CIMMYT Lowland P43 CML 495 (PNVABCOSD/NPH-28-1)-F32-B-1-B-1-2-B CIMMYT Lowland RCW CML 498 ((CML265/CL00303)/CML264)-B-8-1-3-B CIMMYT Lowland RCW CML 503 ((((CML176/CML264)-B/CML264)-7-
1/CML264)/CML264)-F2-65-B CIMMYT Lowland POP21
IPB8 N.A Indonesia Tropical N.A. SM7-11 UPM Selection Malaysia Tropical SMC317
Abbreviations used in pedigree: # = sibbing; B = Selfed and Bulked; -1, -2, -3 = ear-to-row; HS = Half sibs; FS = Full sibs; * = backcross of a specific parent; C = Cycle; F = filial; ( ) = denotes pedigrees of one parent in a cross; / = cross between parents; P = Pool. N.A. = information not available, introduced from Institut Pertanian Bogor (IPB), Indonesia.
Fig 1. Dendrogram constructed using Unweighted Pair Group Method using Arithmetic Averages (UPGMA), separating 30 tropical maize inbred lines into four diverse heterotic groups. The four groups are separated at the Dice’s similarity coefficient of 0.352 (Dice, 1945). The CML lines were introduced from CIMMYT, while SM7-11 and IPB 8 are from Indonesia and Malaysia, respectively.
2014
Fig 2. Plot from three-dimensional principal coordinate analysis (PCoA) projected using the first three principal coordinates obtained from amplification of 100 SSR markers, measured using Dice similarity indices (Dice, 1945), on 30 maize inbred lines. PCo1, PCo2 and PCo3 are projected based on the first three principal coordinates obtained from molecular data of the 30 maize inbred lines. CML lines were introduced from CIMMYT, while SM7-11 and IPB 8 are from Indonesia and Malaysia, respectively. Four heterotic groups are indicated by the circles containing the inbred lines within the group.
Group II Group I
Group III
Group IV
2015
Table 2. Chromosomal genetic variations revealed by 100 SSR markers amplified on 30 maize inbred lines.
Chromosome na ne Homo Ho I Nei’s Ĥ
1 5.10 3.52 0.997 0.340 1.268 0.647 0.0017 2 4.56 3.41 0.993 0.326 1.251 0.663 0.0037 3 5.50 3.42 0.940 0.364 1.289 0.625 0.0264 4 6.80 4.38 0.976 0.315 1.460 0.673 0.0117 5 3.90 2.78 1.000 0.372 1.104 0.617 0.0000 6 5.50 3.75 1.000 0.303 1.380 0.683 0.0000 7 5.30 3.64 0.993 0.308 1.343 0.680 0.0033 8 7.10 4.55 0.958 0.242 1.601 0.744 0.0200 9 5.70 4.00 0.990 0.306 1.418 0.681 0.0050 10 5.44 4.09 0.992 0.275 1.438 0.712 0.0037
Mean SD
5.50 2.60
3.75 1.75
0.983 0.055
0.316 0.156
1.354 0.472
0.671 0.152
0.0333 0.0080
na = observed number of alleles, ne = observed number of effective alleles, Homo = observed homozygosity, Ho = observed heterozygosity, I = Shanon’s information index, Nei’s = Nei’s expected heterozygosity Ĥ = average heterozygosity, SD = standard deviation.
Table 3. Molecular genetic identities of 30 maize inbred lines amplified using 100 microsatellite DNA markers.
Inbred line na ne Homo Ho I Nei’s Ĥ
CML 71 1.0112 1.0112 0.9888 0.0112 0.0078 0.0056 0.0090 CML 78 1.0220 1.0220 0.9780 0.0220 0.0152 0.0110 0.0075 CML 146 1.0213 1.0213 0.9787 0.0213 0.0147 0.0106 0.0085 CML 147 1.0000 1.0000 1.0000 0.0000 0.0000 0.0000 0.0063 CML 152 1.0104 1.0104 0.9896 0.0104 0.0072 0.0052 0.0083 CML 160 1.0104 1.0104 0.9896 0.0104 0.0072 0.0052 0.0083 CML 269 1.0110 1.0110 0.9890 0.0110 0.0076 0.0055 0.0071 CML 311 1.0000 1.0000 1.0000 0.0000 0.0000 0.0000 0.0081 CML 312 1.0000 1.0000 1.0000 0.0000 0.0000 0.0000 0.0082 CML 322 1.0000 1.0000 1.0000 0.0000 0.0000 0.0000 0.0080 CML 331 1.0000 1.0000 1.0000 0.0000 0.0000 0.0000 0.0084 CML 373 1.0106 1.0106 0.9894 0.0106 0.0074 0.0053 0.0082 CML 376 1.0106 1.0106 0.9894 0.0106 0.0074 0.0053 0.0085 CML 383 1.0102 1.0102 0.9898 0.0102 0.0071 0.0051 0.0082 CML 384 1.0104 1.0104 0.9896 0.0104 0.0072 0.0052 0.0083 CML 428 1.0215 1.0215 0.9785 0.0215 0.0149 0.0108 0.0070 CML 447 1.0211 1.0211 0.9789 0.0211 0.0146 0.0105 0.0082 CML 448 1.0111 1.0111 0.9889 0.0111 0.0077 0.0056 0.0070 CML 449 1.0104 1.0104 0.9896 0.0104 0.0072 0.0052 0.0083 CML 451 1.0105 1.0105 0.9895 0.0105 0.0073 0.0053 0.0075 CML 476 1.0109 1.0109 0.9891 0.0109 0.0075 0.0054 0.0074 CML 478 1.0000 1.0000 1.0000 0.0000 0.0000 0.0000 0.0079 CML 479 1.0222 1.0222 0.9778 0.0222 0.0154 0.0111 0.0089 CML 491 1.0104 1.0104 0.9896 0.0104 0.0072 0.0052 0.0068 CML 494 1.0105 1.0105 0.9895 0.0105 0.0073 0.0053 0.0084 CML 495 1.0000 1.0000 1.0000 0.0000 0.0000 0.0000 0.0065 CML 498 1.0549 1.0549 0.9451 0.0549 0.0381 0.0275 0.0088 CML 503 1.0206 1.0206 0.9794 0.0206 0.0143 0.0103 0.0082 IPB 8 1.0612 1.0612 0.9388 0.0612 0.0424 0.0306 0.0082 SM7-11 1.1158 1.1158 0.8842 0.1158 0.0579 0.0803 0.0084
Mean 1.0170 1.0170 0.9830 0.0170 0.0110 0.0092 0.0079 SD 0.0234 0.0234 0.0234 0.0234 0.0132 0.0152 0.0007
a = observed number of alleles, ne = effective number of alleles, Homo = observed homozygosity, Ho = observed heterozygosity, I = Shannon’s information index, Nei’s = expected heterozygosity, Ĥ = heterozygosity, SD = standard deviation.
same germplasm source (Table 1). We also found that, although CML71 and CML78 were genetically related (with 45.5% genetic similarity), they were derived from two different source populations (Table 1). As reported by Xia et al. (2005), small divergence among the inbred lines was probably due to previous intermating among the source populations in
CIMMYT. Reid et al. (2011) emphasised that inbred lines should not be grouped together based on similarity of germplasm sources, but rather on similarity of their genetic background. Past workers have also verified that separation by heterotic groups represents the pedigrees of the lines (Barata and Carena, 2006; Reid et al., 2011).
2016
Assessment of genetic relationship among genetic materials is an important step in a crop breeding program as it would determine genetic diversity of the breeding populations or genotypes. Accurate assessment of genetic diversity in breeding programs would genetically identify the most diverse parental combinations in crosses to form hybrids or among segregating progenies for further utilization in breeding programs. Molecular markers are important and complemen-tary to evaluation of phenotypic traits in assessing genetic diversity and relationships among corn genotypes for efficient selection of parents in breeding programs (Nyaligwa et al., 2015). From the cluster analysis on the inbred lines, the subtropical and lowland lines were clearly grouped together according to their related pedigrees. With a very slight exception of line SM7-11, results of the PCoA and the cluster analysis were in good agreement with each other, and both were used in complement for interpreting the relationships among the inbred lines. The distribution of the inbred lines based on three-dimensional PCoA was derived from genetic distances among the three main component factors of the eigenvalues (26.56% of total genetic variance). As described by Messmer et al. (1992), the PCoA graph constructed from the first three eigenvectors, which accounted for more than 25% of the original variation in the populations. A high level of heterogeneity was reported among the studied inbred lines. Formation of four heterotic groups among the inbred lines explains their diverse genetic backgrounds at the DNA level, indicating their high potential for use in exploitation of heterosis. Cross combinations among inbred lines with diverse genetic backgrounds could produce high heterosis, resulting from favorable dominant gene effects and interactions in the progenies. Srdic et al. (2008) found that the magnitude of genetic distances revealed by SSR markers was in good agreement with the extent of specific combining ability in a serie of sweet corn inbred lines.
Materials and Methods
Plant materials
A total of 30 maize inbred lines adapted to the lowland subtropical and tropical environments were utilized in this study. Twenty-eight inbred lines were introduced from the International Maize and Wheat Improvement Center (CIMMYT), Mexico, one was introduced from Indonesia and the other was locally developed at Universiti Putra Malaysia (UPM) (Table 1).
DNA extraction and quantification
Young leaves from seedlings of one to two weeks old of each inbred line were collected separately for DNA extraction following the standard modified CTAB method described by Hoisington et al. (2005). DNA concentration was then measured using Thermoscientific NanoDrop 2000c spectrophotometer (Thermo scientific™, USA), following the standard protocol as outlined by Joseph (2010). The DNA extracted from each inbred line was diluted and suspended in TE (Tris-EDTA) buffer at the concentration of 40-60 ng/µl. The quality of DNA extracted was determined by running it on 0.5% agarose gel.
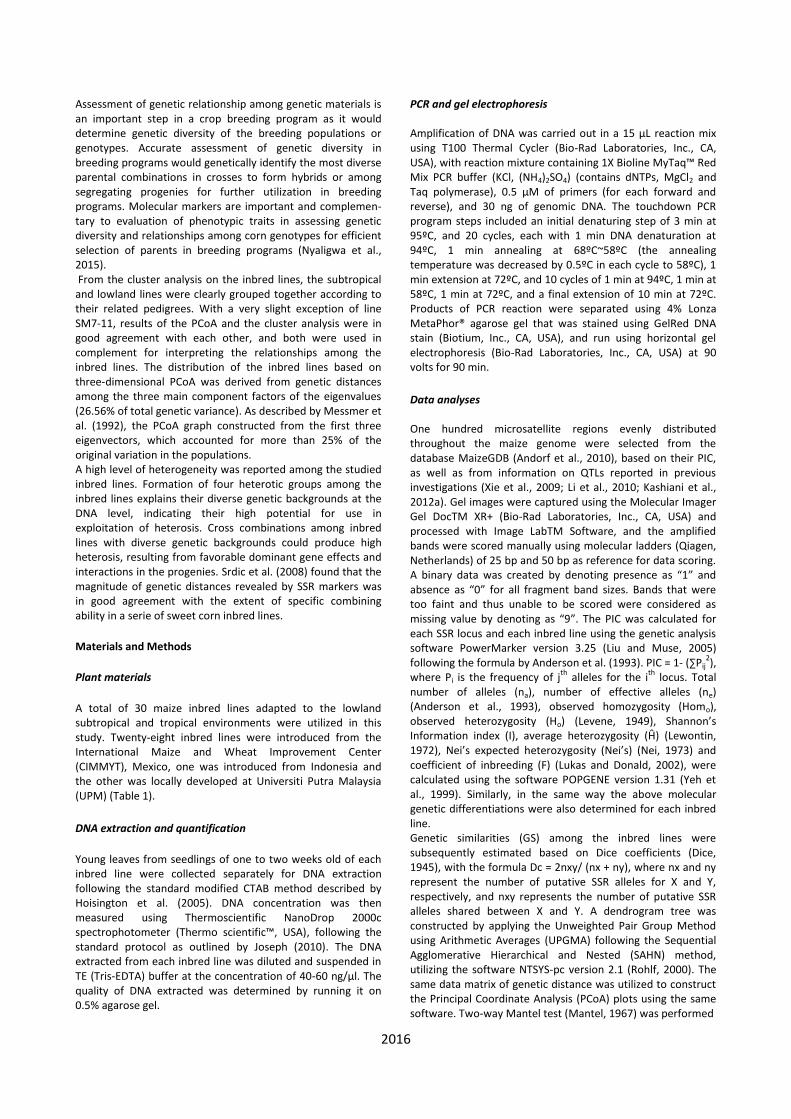
PCR and gel electrophoresis Amplification of DNA was carried out in a 15 μL reaction mix using T100 Thermal Cycler (Bio-Rad Laboratories, Inc., CA, USA), with reaction mixture containing 1X Bioline MyTaq™ Red Mix PCR buffer (KCl, (NH4)2SO4) (contains dNTPs, MgCl2 and Taq polymerase), 0.5 μM of primers (for each forward and reverse), and 30 ng of genomic DNA. The touchdown PCR program steps included an initial denaturing step of 3 min at 95ºC, and 20 cycles, each with 1 min DNA denaturation at 94ºC, 1 min annealing at 68ºC~58ºC (the annealing temperature was decreased by 0.5ºC in each cycle to 58ºC), 1 min extension at 72ºC, and 10 cycles of 1 min at 94ºC, 1 min at 58ºC, 1 min at 72ºC, and a final extension of 10 min at 72ºC. Products of PCR reaction were separated using 4% Lonza MetaPhor® agarose gel that was stained using GelRed DNA stain (Biotium, Inc., CA, USA), and run using horizontal gel electrophoresis (Bio-Rad Laboratories, Inc., CA, USA) at 90 volts for 90 min.
Data analyses One hundred microsatellite regions evenly distributed throughout the maize genome were selected from the database MaizeGDB (Andorf et al., 2010), based on their PIC, as well as from information on QTLs reported in previous investigations (Xie et al., 2009; Li et al., 2010; Kashiani et al., 2012a). Gel images were captured using the Molecular Imager Gel DocTM XR+ (Bio-Rad Laboratories, Inc., CA, USA) and processed with Image LabTM Software, and the amplified bands were scored manually using molecular ladders (Qiagen, Netherlands) of 25 bp and 50 bp as reference for data scoring. A binary data was created by denoting presence as “1” and absence as “0” for all fragment band sizes. Bands that were too faint and thus unable to be scored were considered as missing value by denoting as “9”. The PIC was calculated for each SSR locus and each inbred line using the genetic analysis software PowerMarker version 3.25 (Liu and Muse, 2005) following the formula by Anderson et al. (1993). PIC = 1- (∑Pij
2),
where Pi is the frequency of jth
alleles for the ith
locus. Total number of alleles (na), number of effective alleles (ne) (Anderson et al., 1993), observed homozygosity (Homo), observed heterozygosity (Ho) (Levene, 1949), Shannon’s Information index (I), average heterozygosity (Ĥ) (Lewontin, 1972), Nei’s expected heterozygosity (Nei’s) (Nei, 1973) and coefficient of inbreeding (F) (Lukas and Donald, 2002), were calculated using the software POPGENE version 1.31 (Yeh et al., 1999). Similarly, in the same way the above molecular genetic differentiations were also determined for each inbred line. Genetic similarities (GS) among the inbred lines were subsequently estimated based on Dice coefficients (Dice, 1945), with the formula Dc = 2nxy/ (nx + ny), where nx and ny represent the number of putative SSR alleles for X and Y, respectively, and nxy represents the number of putative SSR alleles shared between X and Y. A dendrogram tree was constructed by applying the Unweighted Pair Group Method using Arithmetic Averages (UPGMA) following the Sequential Agglomerative Hierarchical and Nested (SAHN) method, utilizing the software NTSYS-pc version 2.1 (Rohlf, 2000). The same data matrix of genetic distance was utilized to construct the Principal Coordinate Analysis (PCoA) plots using the same software. Two-way Mantel test (Mantel, 1967) was performed
2017
to construct the matrix of correlation for comparison between genetic distance and genetic similarity among the genotypes for 1000 permutations.
Conclusion
The SSR markers utilized in this study were able to reveal high variations among the maize inbred lines. Assignment of inbred lines into four heterotic groups was in close agreement with the genetic background of their source populations. Most SSR markers that showed high polymorphism were dinucleotide SSR markers. They revealed high percentage of polymorphic bands. The markers used were also identified as having high polymorphic information content and high gene diversity. Chromosome 8 revealed high gene diversity with a high number of effective alleles, indicating the presence of diverse genes on its loci in the inbred lines. Therefore, they can be used to identify QTLs for useful traits including yield. Since the CIMMYT inbred lines had previously been identified phenotypically as good potential parents for forage utilization, the high genetic diversity revealed by the SSR markers could be utilized for development of superior forage hybrid varieties in the future work of exploiting heterosis.
Acknowledgments
The authors wish to thank the Malaysian Ministry of Science, Technology and Innovation (MOSTI), for the financial support to undertake this research under the Agro-Biotechnology Institute (ABI) Initiative (Project Grant No. 10-05-ABI-AB035). The authors also wish to thank the International Maize and Wheat Improvement Centre (CIMMYT), Mexico for their generosity in supplying seeds of the maize inbred lines.
References
Aci MM, Revilla P, Morsli A, Djemel A, Belalia N, Kadri Y, Khelifi-Saloui M, Ordás B, Khelifi L (2013) Genetic diversity in Algerian maize (Zea mays L.) landraces using SSR markers. Maydica 58:304-310.
Adeyemo OA, Omidiji O (2019) Genetic diversity and population structure of farmers' maize varieties (Zea mays L.) from three selected states in Nigeria using SSR markers and their relationship with standard hybrids. Ife J Sci. 21:261-275.
Anderson JA, Churchill GA, Autrique JE, Tanksley SD, Sorrells ME (1993) Optimizing parental selection for genetic linkage maps. Genome. 36:181-186.
Andorf CM, Lawrence CJ, Harper LC, Schaeffer ML, Campbell DA, Sen TZ (2010) The locus lookup tool at MaizeGDB: Identification of genomic regions in maize by integrating sequence information with physical and genetic maps. Bioinformatics. 26:434-436.
Barata C, Carena MJ (2006) Classification of North Dakota maize inbred lines into heterotic groups based on molecular and testcross data. Euphytica. 151:339-349.
Belalia N, Antonio L, Abderrahmane D, Abdelkader M, Antonio M, Concetta LMK, Lakhdar K, Francesco S
(2018) Analysis of genetic diversity and population
structure in Saharan maize (Zea mays L.) populations using phenotypic traits and SSR markers. Genet Resour Crop Evol. 66:243–257.
Botstein D, White RL, Skolnick M, Davis RW (1980) Construction of genetic linkage map in man using restricted fragment length polymorphism. Am J Hum Genet. 23:314-331.
CIMMYT Global Maize Program (2015) CIMMYT Maize Lines (CMLs) - Pedigree and Characterization Data. hdl:11529/10246, CIMMYT Research Data & Software Repository Network, V10. International Maize and Wheat Improvement Center, Mexico.
Cömertpay G, Baloch FS, Kilian B, Ülger AC, Özkan H (2012) Diversity assessment of Turkish maize landraces based on fluorescent labeled SSR markers. Plant Mol Biol Rep. 30:261-274.
Cornelious BK, Sneller CH (2002) Yield and molecular diversity of soybean lines derived from crosses of northern and southern elite parents. Crop Sci. 42:642-647.
Dice LR (1945) Measures of the amount of ecologic association between species. Ecology. 26:297-302.
Falconer DS, Mackay TFC (1996) Introduction to quantitative genetics. Pearson/Prenctice Hall, New York, NY, USA.
Ferreira F, Carlos AS, Carlos M, Freddy M (2018) SSR-based genetic analysis of sweet corn inbred lines using artificial neural networks. Crop Breed Appl Biotechnol. 18:309-313.
Glaszmann JC, Grivet L, Courtois B, Noyer JL, Luce C, Jacquot M, Albar L, Ghesquière A, Second G (2003) Asian rice. In: Hamon P, Seguin M, Perrier X, Glaszmann JC (eds) Genetic diversity of cultivated tropical plants. Science Publishers and CIRAD, Enfield, USA. p.77-98.
Govindaraj M, Vetriventhan M, Srinivasan M (2014) Importance of genetic diversity assessment in crop plants and its recent advances: An overview of its analytical perspectives. Genet Res Int. 2015:1-14.
Hoisington D, Khairallah M, González-Léon D (2005) Laboratory protocols. CIMMYT Applied Molecular Genetics Laboratory Publication, (3rd edn), CIMMYT, Mexico.
Jones CJ, Edwards KJ, Castiglione S, Winfield MO (1997) Reproducibility testing of RAPD, AFLP and SSR markers in plants by a network of European laboratories. Mol Breed. 3:381-390.
Joseph LJ (2010) Setting up a laboratory. In: Weiss RE, Refetoff (eds) Diagnosis of endocine disorders. Academic Press, London, UK. p.303-314.
2018
Kanagarasu S, Nallathambi G, Ganesan K, Kannan S, Shobhana V, Senthil N (2013) Determination of genetic polymorphism among indigenous and exotic maize inbreds using microsatellite markers. Afr J Biotechnol. 12:5723-5728.
Kashiani P, Saleh G, Panandam JM, Abdullah NAP, Selamat A (2012a) Dermacation of informative chromosomes in tropical sweet corn inbred lines using microsatellite DNA markers. Genet Mol Biol. 35:614-621.
Kashiani P, Saleh G, Panandam JM, Abdullah NAP, Selamat A (2012b). Molecular characterization of tropical sweet corn inbred lines using microsatellite markers. Maydica. 57:154-163.
Ko WR, Sa KJ, Roy NS, Choi HJ, Lee JK (2016) Analysis of the genetic diversity of super sweet corn inbred lines using SSR and SSAP markers. Genet Mol Res. 15:1-3.
Levene H (1949) On a matching problem arising in genetics. Ann Math Stat. 20:91-94.
Lewontin RC (1972) Testing the theory of natural selection. Nature. 236:181-182.
Li M, Guo X, Zhang M, Wang X, Zhang G, Tian Y, Wang Z (2010) Mapping QTLs for grain yield and yield components under high and low phosporus treatments in maize (Zea mays L.). Plant Sci. 178:454-462.
Li MS, Li XH, Salvi S, Tuberosa R, Yuan LX, Rotondo F, Bai L, Zhang SH (2006) Genetic relationships among CIMMYT subtropical QPM and Chinese maize inbred lines based on SSRs. Maydica. 51:543-549.
Liu K, Muse SV (2005) PowerMarker: Integrated analysis environment for genetic marker data. Bioinformatics. 21:2128-2129.
Lukas FK, Donald MW (2002) Inbreeding effects in wild populations. Trends Ecol Evol. 17:230-241.
Makumbi D, Betrán JF, Bänziger M, Ribaut JM (2011) Combining ability, heterosis and genetic diversity in tropical maize (Zea mays L.) under stress and non-stress conditions. Euphytica. 180:143-162.
Mantel NA (1967). The detection of disease clustering and a generalized regression approach. Cancer Res. 27:209-220.
Messmer MM, Melchinger AE, Boppenmaier J, Herrmann RG, Brunklaus-Jung E (1992) RFLP analyses of early-maturing European maize germplasm: I. Genetic diversity among flint and dent inbred lines. Theor Appl Genet. 83:1003-1012.
Mohammadi SA, Prasanna BM (2003) Analysis of genetic diversity in crop plants-salient statistical tools and considerations. Crop Sci. 43:1235-1248.
Nei M (1973) Analysis of gene diversity in subdivided populations. Proc Natl Acad Sci USA. 70:3321-3323.
Nyaligwa L, Hussein S, Amelework B, Ghebrehiwot H (2015) Genetic diversity analysis of elite maize inbred lines of diverse sources using SSR markers. Maydica. 60:1-8.
Onaga G, Edema R, Asea G (2012) Tolerance of rice germplasm to iron toxicity stress and the relationship between tolerance, Fe2+, P and K content in the leaves and roots. Arch Agron Soil Sci. 59:213-219.
Reid LM, Xiang K, Zhu X, Baum BR, Molnar SJ (2011) Genetic diversity analysis of Canadian maize inbred lines based on pedigree and simple sequence repeat markers. Can J Plant Sci. 91:651-661.
Rohlf F (2000) NTSYS-pc: Numerical taxonomy and multivariate analysis system (2.10 edn). Exeter Publishing Ltd, New York, USA.
Senior MJL, Murphy JP, Goodman MM, Stuber CW (1998) Utility of SSRs for determining genetic similarity and relationships in maize using an agarose gel system. Crop Sci. 38:1088-1098.
Shayanowako AIT, Shimelis H, Laing MD, Mwadzingeni L (2018) Genetic diversity of maize genotypes with variable resistance to Striga asiatica based on SSR markers. Cereal Research Communications. 46:1-11.
Shiri MR, Choukan R, Aliyevc RT (2014) Study of genetic diversity among maize hybrids using SSR markers and morphological traits under two different irrigation conditions. Crop Breed J. 4:65-72.
Singh P, Sharma VK, Kumar P (2018) Microsatellite marker dependent genetic divergence assessment within and among heterotic groups of tropical maize inbred lines. Maydica. 63:1-13.
Smith JSC, Chin ECL, Shu H, Smith OS, Wall SJ, Senior ML, Mitchell SE, Kresovish S, Ziegle J (1997) An evaluation of the utility of SSR loci as molecular markers in maize (Zea mays L.): Comparisons with data from RFLPS and pedigree. Theor Appl Genet. 95:163-173.
Srdic J, Nikolic A, Pajic Z (2008) SSR markers in characterization of sweet corn inbred lines. Genetika. 40:169-177.
Sserumaga JP, Makumbi D, Ji H, Njoroge K, Muthomi JW, Chemining'wa GN, Si-myung L, Asea G, Kim H (2014) Molecular characterization of tropical maize inbred lines using microsatellite DNA markers. Maydica. 59:267-274.
Taramino G, Tingey S (1996) Simple sequence repeats for germplasm analysis and mapping in maize. Genome. 39:277-287.
2019
Wende A, Shimelis H, Derera J, Mosisa W, Danson J, Laing MD (2013) Genetic interrelationships among medium to late maturing tropical maize inbred lines using selected SSR markers. Euphytica. 191:269-277.
Xia XC, Reif JC, Hoisington DA, Melchinger AE, Frisch M, Warburton ML (2004) Genetic diversity among CIMMYT maize inbred lines investigated with SSR markers: I. Lowland tropical maize. Crop Sci. 44:2230-2237.
Xia XC, Reif JC, Melchinger AE, Frisch M, Hoisington DA, Beck D, Picley K, Warburton ML (2005) Genetic diversity among CIMMYT maize inbred lines investigated with SSR markers: II. Subtropical, Tropical Midaltitude and Highland mazie inbred lines and their relationships with elite U.S. and European maize. Crop Sci. 45:2573-2582.
Xiang K, Yang KC, Pan GT, Reid LM, Li WT, Zhu X, Zhang ZM (2010) Genetic diversity and classification of maize landraces from China's Sichuan Basin based on agronomic traits, quality traits, combining ability and SSR markers. Maydica. 55: 85-93.
Xie HL, Ji HQ, Liu ZH, Tian GW, Wang CL, Hu YM, Tang JH (2009) Genetic basis of nutritional content of stover in maize under low nitrogen conditions. Euphytica. 165:185-193.
Yeh FC, Yang RC, Boyle T (1999) Popgene: Microsoft windows-based freeware for population genetic analysis, Release 1.31, University of Alberta, Edmonton, Canada.