Expression of Dehydrin Gene in Maize Inbred Lines ...
132
-
Upload
khangminh22 -
Category
Documents
-
view
0 -
download
0
Transcript of Expression of Dehydrin Gene in Maize Inbred Lines ...
327
�������� ���� ����������� �������
IntroductionOne of the strategies for increasing maize production
is improvement of the germplasm for resistance to bioticand abiotic stresses. The biotic factors to be consideredinclude drought, cold and salty and acidic soil. The role ofdrought as a biotic stress is well-known: it severely affectsphysiological and biochemical systems in the maize plantand reduces yield.
Dehydrin (DHN, LEA-D11) is adissolvable proteinwhich is often synthesized in plants under droughtconditions. It has important functions such as toleranceof water loss and low air humidity and regulation of ABAconcentration in plant cells (Ceccardi et al. 1994). Therefore,the presence of the dhn1 gene and its expression in theform of the DHN1 protein was determined to evaluatevariability for drought resistance among 40 inbred maizelines of Vietnam.
Materials and Methods
Materials
- Forty maize inbred lines from the National MaizeResearch Institute of Vietnam.
- A pCR 2.1 plasmid of E. coli DH-5a was used in theRecombination Protein Lab of the College of Sciencesof the Vietnam National University ((VNU).
Methods
- The maize DNA genome was isolated following themethod of Saghai-Maroof et al. (1984). The dehydrin1gene was amplified through PCR using specific primerpairs ZM1 and ZM2 (Close et al. 1989). The PCRproducts were electrophoresed on 1% agarose gelstained with ethidium bromide and detected with aUV transilluminator.
- The PCR products were cloned using the method ofSambrook et al. (2001)
- The DNA fragments were sequenced following theCEQ-8000 system of Beckman Coulter. The dehydringene sequences were then aligned with thosepublished and maintained in the Gene Bank.
- The total protein was extracted from maize embryosusing the method of Ceccardi et al. (1994). Proteinconcentration was assessed by the Lowry method.The protein was then electrophoresed on apolyacrylamide gel.
Expression of Dehydrin Gene in Maize Inbred LinesfromVietnam
Doan Thi Bich Thao1, Phan Tuan Nghia2, Bui Manh Cuong1 and Nguyen Van Truong1*
1. National Maize Research Institute, Dan Phuong, Hanoi, Vietnam.2. Vietnam National University, Thanh Xuan, Hanoi, Vietnam.* Corresponding author: [email protected] or [email protected]
Abstract. The protein dehydrin (DHN, LEA-D11) is often synthesized under drought conditions. It plays a role inimportant functions including tolerance of water loss and low air humidity and in the regulation of ABA concentrationin plant cells. To determine the presence of the dhn1 gene in the maize germplasm of Vietnam, young leaves of 40maize inbred lines, H1 to H40, were subjected to genomic studies, in which the DNA was extracted and the dhn1gene amplified through PCR. The results showed that the dhn1 gene encoding for the protein dehydrin 1 was presentin 30 of the lines. The band was clearer in H1 and H36, which were subsequently cloned. The size of the amplifiedgene sequence of H1 was found to be 599 bp and that of H36, 597 bp. The dhn1 gene of H1 and H36 had 99.99%and 99.66% homology with the sequence published in the Gene Bank (accession number AM495895). Moreover, thegene sequences of H1 and H36 had an intron region of 124 and 121 bp. To determine the presence of the DHN1protein in the maize lines of Vietnam, embryos of H36 were subjected to protein extraction from which the DHN1protein was purified. The extracted protein solution, after temperature shock and centrifuging, was first purifiedusing an ion-exchange chromatography column (CM-52) and then a gel column, Sephadex G-75. SDS-polyacrylamideelectrophoresis showed that the purified protein had a molecular weight equal to 22 kDa. This was reconfirmedthrough an immunoblotting procedure by detecting the protein with a DHN1 antibody.
Key words: Dehydrin1 protein, dehydrin1 gene, drought-tolerant, inbred line, maize
328
������� �� �� ����� ������� ����� ���������������
- The extracted protein was first purified through ion-exchange chromatography using a CM-52 column firstand then a gel column������������ ���
- The Western blot method was used to detect andconfirm DHN 1 with a DHN 1 antibody.
Results and Discussion
Cloning the dehydrin gene of 40 maize inbredlines
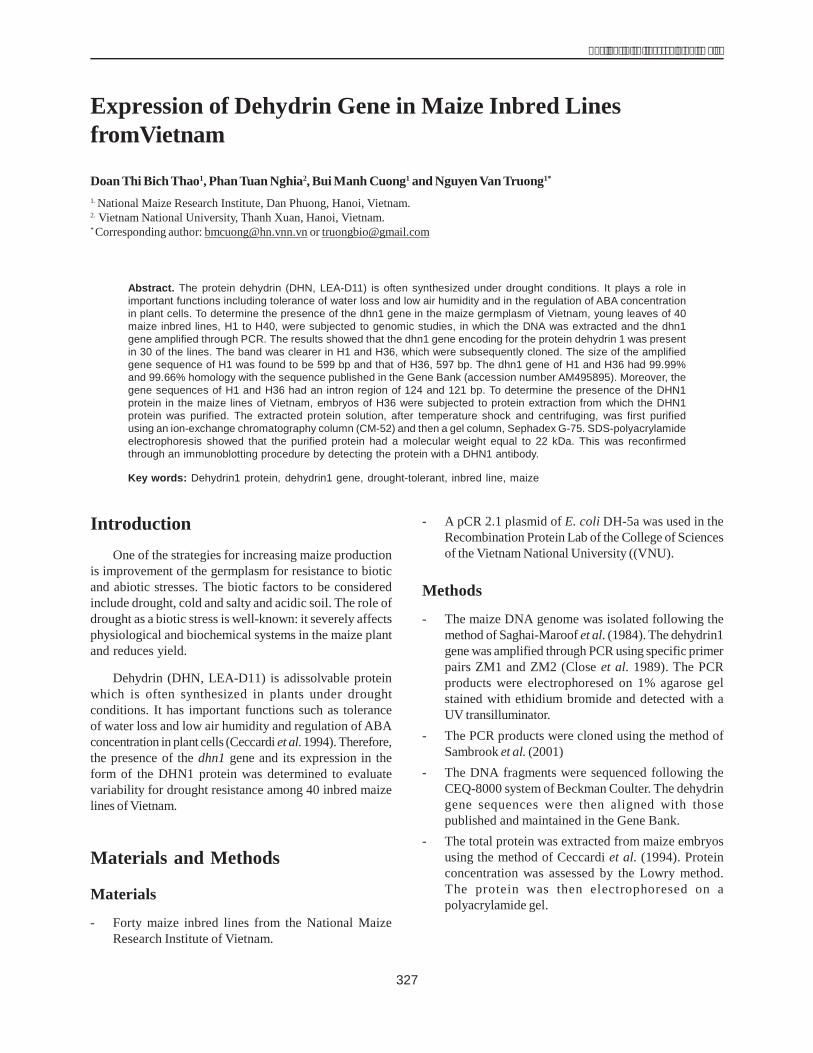
The total DNA genome of 40 maize inbred lines wasused as the template to amplify dhn1 in PCR. The results,presented in Figure 1, show the presence of dhn1 in 30lines (H1, H2, H3, H4, H5, H6, H7, H8, H9, H10, H12, H13,H14, H15, H16, H17, H22, H24, H25, H28, H29, H31, H32,H34, H35, H36, H37, H38, H39, H40) and its absence in therest of the lines (H18, H19, H20, H21, H26, H27, H33, H11,H23,H30).
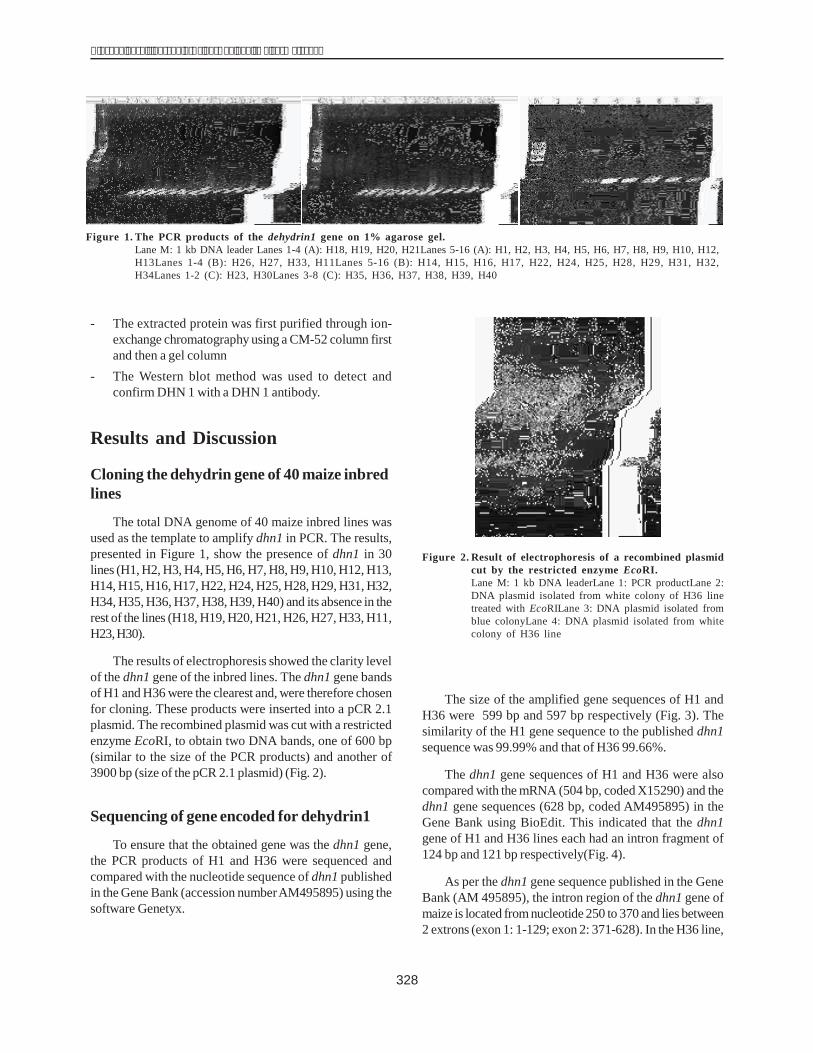
The results of electrophoresis showed the clarity levelof the dhn1 gene of the inbred lines. The dhn1 gene bandsof H1 and H36 were the clearest and, were therefore chosenfor cloning. These products were inserted into a pCR 2.1plasmid. The recombined plasmid was cut with a restrictedenzyme EcoRI, to obtain two DNA bands, one of 600 bp(similar to the size of the PCR products) and another of3900 bp (size of the pCR 2.1 plasmid) (Fig. 2).
Sequencing of gene encoded for dehydrin1
To ensure that the obtained gene was the dhn1 gene,the PCR products of H1 and H36 were sequenced andcompared with the nucleotide sequence of dhn1 publishedin the Gene Bank (accession numberAM495895) using thesoftware Genetyx.
The size of the amplified gene sequences of H1 andH36 were 599 bp and 597 bp respectively (Fig. 3). Thesimilarity of the H1 gene sequence to the published dhn1sequence was 99.99% and that of H36 99.66%.
The dhn1 gene sequences of H1 and H36 were alsocompared with the mRNA (504 bp, coded X15290) and thedhn1 gene sequences (628 bp, coded AM495895) in theGene Bank using BioEdit. This indicated that the dhn1gene of H1 and H36 lines each had an intron fragment of124 bp and 121 bp respectively(Fig. 4).
As per the dhn1 gene sequence published in the GeneBank (AM 495895), the intron region of the dhn1 gene ofmaize is located from nucleotide 250 to 370 and lies between2 extrons (exon 1: 1-129; exon 2: 371-628). In the H36 line,
Figure 1. The PCR products of the dehydrin1 gene on 1% agarose gel.Lane M: 1 kb DNA leader Lanes 1-4 (A): H18, H19, H20, H21Lanes 5-16 (A): H1, H2, H3, H4, H5, H6, H7, H8, H9, H10, H12,H13Lanes 1-4 (B): H26, H27, H33, H11Lanes 5-16 (B): H14, H15, H16, H17, H22, H24, H25, H28, H29, H31, H32,H34Lanes 1-2 (C): H23, H30Lanes 3-8 (C): H35, H36, H37, H38, H39, H40
Figure 2. Result of electrophoresis of a recombined plasmidcut by the restricted enzyme EcoRI.Lane M: 1 kb DNA leaderLane 1: PCR productLane 2:DNA plasmid isolated from white colony of H36 linetreated with EcoRILane 3: DNA plasmid isolated fromblue colonyLane 4: DNA plasmid isolated from whitecolony of H36 line
329
����� � ���� ����������� �������
theexon 1 is located from nucleotide 1 to 220 and exon 2from nucleotide 342 to 597; and the intron is flanked by thetwo exons just as in the dhn1 gene in the Gene Bank; itssize is 221 bp (from base pair 121 to 341). The intron regionin H1 has the same structure as in H36 and the Gene Bank,but its size is 124 bp and longer than the intron fragment inH36 three nucleotides (CTT). These nucleotides areinserted at nucleotide 253-256. The first extron of the H1line is located from nucleotide 1 to 228 and the secondfrom 453 to 599. The intron region in plants often has ahigh percentage of theAT component (60%) and a GT-AGcutting sequence at the two ends of the intron region(Locrkovic et al. 2000). Accordingly, the intron regions ofH1 (124 bp) and H36 (121 bp) were found to have a highpercentage ofAT, 64.48% and 64.46%, respectively. Theyalso have a GT-AG cutting sequence at their ends. Theseresults allow us to conclude that these intron regions areindeed introns of the dhn1 gene in maize.
Extraction of total protein from maize embryo
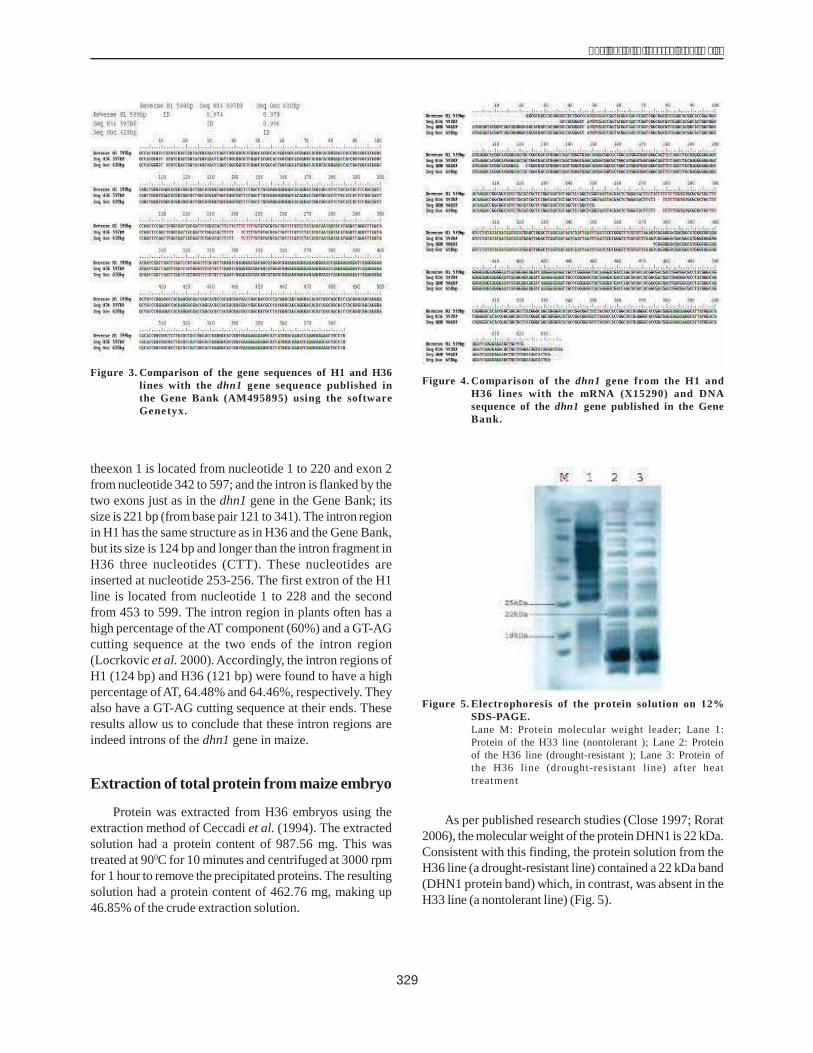
Protein was extracted from H36 embryos using theextraction method of Ceccadi et al. (1994). The extractedsolution had a protein content of 987.56 mg. This wastreated at 900C for 10 minutes and centrifuged at 3000 rpmfor 1 hour to remove the precipitated proteins. The resultingsolution had a protein content of 462.76 mg, making up46.85% of the crude extraction solution.
As per published research studies (Close 1997; Rorat2006), the molecular weight of the protein DHN1 is 22 kDa.Consistent with this finding, the protein solution from theH36 line (a drought-resistant line) contained a 22 kDa band(DHN1 protein band) which, in contrast, was absent in theH33 line (a nontolerant line) (Fig. 5).
Figure 3. Comparison of the gene sequences of H1 and H36lines with the dhn1 gene sequence published inthe Gene Bank (AM495895) using the softwareGenetyx.
Figure 4. Comparison of the dhn1 gene from the H1 andH36 lines with the mRNA (X15290) and DNAsequence of the dhn1 gene published in the GeneBank.
Figure 5. Electrophoresis of the protein solution on 12%SDS-PAGE.Lane M: Protein molecular weight leader; Lane 1:Protein of the H33 line (nontolerant ); Lane 2: Proteinof the H36 line (drought-resistant ); Lane 3: Protein ofthe H36 line (drought-resistant line) after heattreatment
330
������� �� �� ����� ������� ����� ���������������
Primary purification of DHN1 protein withion-exchange chromatography using a CM-52 column
To purify DHN1, the extracted solution was passedover a CM-52 (size 3 x 10 cm) column preequilibrated with25 mM MES buffer (pH = 6) and 20 mM NaCl under whichconditions all dehydrin is bound. Protein separation wasachieved by increasing the concentration of NaCl from 20mM to 600 mM. Fractions of 2 ml were collected on ice.The protein collected from different fractions was assessedfor DHN1 concentration at 280 nm (A280).
The results showed single-protein peaks at fractions22-36. This meant that the crude protein solution was notmuch different from the heat-treated solution in terms ofthe electric charge. To estimate the efficiency ofchromatography using a CM-52 column, the protein fromfractions 22-36 (with an equivalent NaCl concentration of200-300 mM) was collected, condensed and analyzed on12% SDS-PAGE. The protein content thus determined was36.23 mg, making up 3.68% of the crude protein solution.
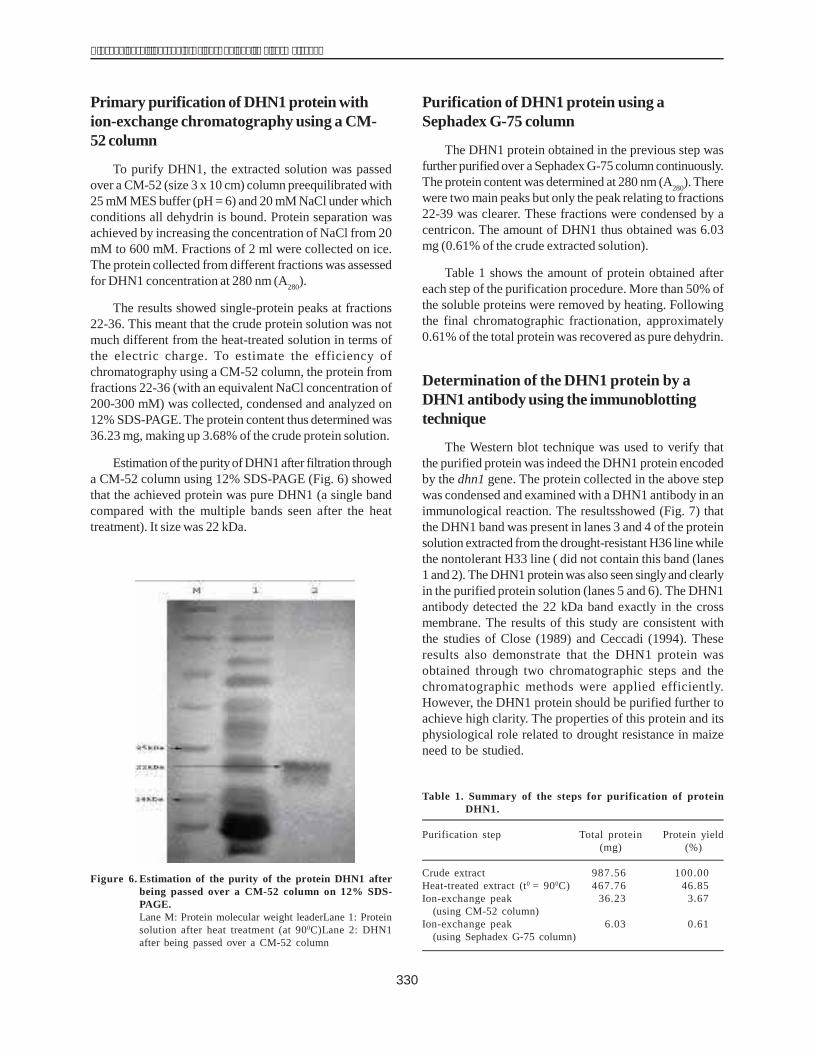
Estimation of the purity of DHN1 after filtration througha CM-52 column using 12% SDS-PAGE (Fig. 6) showedthat the achieved protein was pure DHN1 (a single bandcompared with the multiple bands seen after the heattreatment). It size was 22 kDa.
Purification of DHN1 protein using aSephadex G-75 column
The DHN1 protein obtained in the previous step wasfurther purified over a Sephadex G-75 column continuously.The protein content was determined at 280 nm (A280). Therewere two main peaks but only the peak relating to fractions22-39 was clearer. These fractions were condensed by acentricon. The amount of DHN1 thus obtained was 6.03mg (0.61% of the crude extracted solution).
Table 1 shows the amount of protein obtained aftereach step of the purification procedure. More than 50% ofthe soluble proteins were removed by heating. Followingthe final chromatographic fractionation, approximately0.61% of the total protein was recovered as pure dehydrin.
Determination of the DHN1 protein by aDHN1 antibody using the immunoblottingtechnique
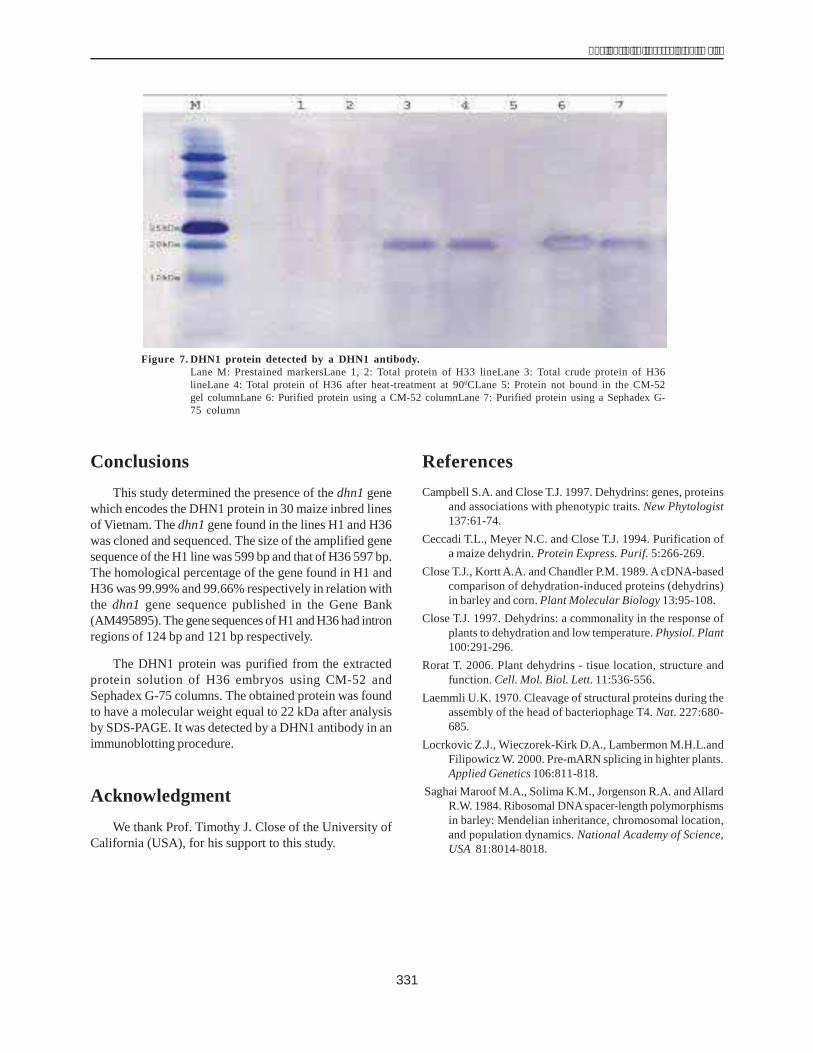
The Western blot technique was used to verify thatthe purified protein was indeed the DHN1 protein encodedby the dhn1 gene. The protein collected in the above stepwas condensed and examined with a DHN1 antibody in animmunological reaction. The resultsshowed (Fig. 7) thatthe DHN1 band was present in lanes 3 and 4 of the proteinsolution extracted from the drought-resistant H36 line whilethe nontolerant H33 line ( did not contain this band (lanes1 and 2). The DHN1 protein was also seen singly and clearlyin the purified protein solution (lanes 5 and 6). The DHN1antibody detected the 22 kDa band exactly in the crossmembrane. The results of this study are consistent withthe studies of Close (1989) and Ceccadi (1994). Theseresults also demonstrate that the DHN1 protein wasobtained through two chromatographic steps and thechromatographic methods were applied efficiently.However, the DHN1 protein should be purified further toachieve high clarity. The properties of this protein and itsphysiological role related to drought resistance in maizeneed to be studied.
Figure 6. Estimation of the purity of the protein DHN1 afterbeing passed over a CM-52 column on 12% SDS-PAGE.Lane M: Protein molecular weight leaderLane 1: Proteinsolution after heat treatment (at 900C)Lane 2: DHN1after being passed over a CM-52 column
Table 1. Summary of the steps for purification of proteinDHN1.
Purification step Total protein Protein yield(mg) (%)
Crude extract 987.56 100.00Heat-treated extract (t0 = 900C) 467.76 46.85Ion-exchange peak 36.23 3.67
(using CM-52 column)Ion-exchange peak 6.03 0.61
(using Sephadex G-75 column)
331
����� � ���� ����������� �������
ConclusionsThis study determined the presence of the dhn1 gene
which encodes the DHN1 protein in 30 maize inbred linesof Vietnam. The dhn1 gene found in the lines H1 and H36was cloned and sequenced. The size of the amplified genesequence of the H1 line was 599 bp and that of H36 597 bp.The homological percentage of the gene found in H1 andH36 was 99.99% and 99.66% respectively in relation withthe dhn1 gene sequence published in the Gene Bank(AM495895). The gene sequences of H1 and H36 had intronregions of 124 bp and 121 bp respectively.
The DHN1 protein was purified from the extractedprotein solution of H36 embryos using CM-52 andSephadex G-75 columns. The obtained protein was foundto have a molecular weight equal to 22 kDa after analysisby SDS-PAGE. It was detected by a DHN1 antibody in animmunoblotting procedure.
AcknowledgmentWe thank Prof. Timothy J. Close of the University of
California (USA), for his support to this study.
ReferencesCampbell S.A. and Close T.J. 1997. Dehydrins: genes, proteins
and associations with phenotypic traits. New Phytologist137:61-74.
Ceccadi T.L., Meyer N.C. and Close T.J. 1994. Purification ofa maize dehydrin. Protein Express. Purif. 5:266-269.
Close T.J., Kortt A.A. and Chandler P.M. 1989. A cDNA-basedcomparison of dehydration-induced proteins (dehydrins)in barley and corn. Plant Molecular Biology 13:95-108.
Close T.J. 1997. Dehydrins: a commonality in the response ofplants to dehydration and low temperature. Physiol. Plant100:291-296.
Rorat T. 2006. Plant dehydrins - tisue location, structure andfunction. Cell. Mol. Biol. Lett. 11:536-556.
Laemmli U.K. 1970. Cleavage of structural proteins during theassembly of the head of bacteriophage T4. Nat. 227:680-685.
Locrkovic Z.J., Wieczorek-Kirk D.A., Lambermon M.H.L.andFilipowicz W. 2000. Pre-mARN splicing in highter plants.Applied Genetics 106:811-818.
Saghai Maroof M.A., Solima K.M., Jorgenson R.A. and AllardR.W. 1984. Ribosomal DNAspacer-length polymorphismsin barley: Mendelian inheritance, chromosomal location,and population dynamics. National Academy of Science,USA 81:8014-8018.
Figure 7. DHN1 protein detected by a DHN1 antibody.Lane M: Prestained markersLane 1, 2: Total protein of H33 lineLane 3: Total crude protein of H36lineLane 4: Total protein of H36 after heat-treatment at 900CLane 5: Protein not bound in the CM-52gel columnLane 6: Purified protein using a CM-52 columnLane 7: Purified protein using a Sephadex G-75 column
332
������� �� �� ����� ������� ����� ���������������
IntroductionThe two major thrusts of the Philippines government
in agriculture are food security and global competitiveness.As an initial step toward this goal, the Department ofAgriculture has identified key production areas for selectedcrops, and launched a program to sustain self-sufficiencyin rice and corn with a target national production of atleast 12 million t and 7 million t, respectively. However, inregions where farmers largely depend on rainfall as a sourceof water or in areas without supplemental irrigation, yieldreduction may range from 10% to 75% (Logro�� ���Lothrop 1996). In fact, under severe water-deficit stress,corn yield may even be zero corn. The El Ni����������that hit the country particularly in 1990 and 1991 causedcrop damage worth P3.2 billion and P2.1 billion, respectively(DAReport 1994). Total corn losses due to drought in 1992amounted to P2.1 billion, affecting about 281 349 ha.
Normal rainfall in the Philippines ranges from 1000 mmto 5000 mm. Drought occurs in an area when rainfall iserratic or falls below 1000 mm or when there is almost norain during the normal growing season. When waterbecomes available, water-deficit stress is relieved but otherfactors limiting plant growth assume a greater role, such
as soil nutrient availability/utilization. Nitrogen is the fourthmost abundant nutrient in plants, and an essentialcomponent of proteins, nucleic acids, hormoneschlorophyll and primary and secondary metabolites. Ingeneral, plants obtain the bulk of their nitrogen from thesoil in the form of either nitrate or ammonium. However,supply of nitrogen in the soil is limited (Power 1990) andplants must compete with soil microorganisms for it. As aresult, nitrogen is often a limiting nutrient for plants inboth natural and agricultural ecosystems.
The occurrence of water and nitrogen stress mayincrease, due partly to global changes, partly to thedisplacement of corn to more difficult productionenvironments by higher-value crops and partly to thedecline in soil organic matter which may result in reductionof soil fertility and water-holding capacity. At the microlevel, fertility and water availability vary greatly in farmers1fields. This means that a single variety must be able towithstand a wide range of drought stress and nitrogenavailability �������������������������������������tropics than in the higher input fields of the temperateareas. In order to maximize grain yield under conditions ofnonlimiting and limiting water supply, it is equally importantto select corn genotypes with high nitrogen-use efficiencyunder such environments.
Development of A Rapid Screening Technique for HighNitrogen-Use Efficiency in Maize in Normal and DroughtEnvironments
Apolonio M. Ocampo1, Eureka Teresa M. Ocampo1, Maribel L.Agtarap1, Jonathan C. Descalsota1, Consorcia E.Rea��2 and Primitivo JoseA. Santos1
1.Institute of Plant Breeding (IPB), Crop Science Cluster, College of Agriculture2. Institute of Statistics, College of Arts and Sciences, University of the Philippines Los Ba������������������ !"#�$�����������
Abstract. The damage to corn production due to drought caused by the El Ni�������������������� ���������������1990 to 1992 was estimated to be as much as PhP 3.2 billion. Such large losses can be avoided by developingvarieties with the ability to produce relatively high yields under water-limited conditions. To produce good yields,varieties must also be able to absorb and utilize nutrients efficiently, especially nitrogen. Experiments were conductedusing different levels of nitrogen fertilizer (0, 60 and 120 kg N ha-1) and different water stress conditions (irrigatedand nonirrigated). Corn seedlings were grown for 3-4 weeks in the greenhouse in trays using a sand culture. Fieldexperiments were then conducted in Laguna and Ilocos Norte using selected genotypes to measure their grainyields and validate the results of the greenhouse experiments. Genotypes with seedlings that have greater shootlength, shoot weight, root length, root weight, total N uptake and total dry matter yield after drought treatment werefound to give better grain yields and to have higher nitrogen-use efficiency potential when grown under intermediatewater stress in the field. These genotypes were identified asCML 8, P6-1-3, (P6-1-3 x CML 337), (CML 8 x CBR/PDC2-5-2-4-5) for white corn and SMCE, (95-6 x Pi 23), (CLOO 331 x Pi 23) for yellow corn. A protocol for rapidgreenhouse screening at the seedling stage is presented here. The performance of these drought-tolerant F1hybrids will be validated on-farm before recommendation for variety release.
Key words: Corn genotypes, water stress, nitrogen-use efficiency, drought, diallel
333
����� � ���� ����������� �������
The general objective of this study was to increase(by 10%) corn production in the Philippines throughselection of genotypes with high nitrogen-use efficiencyunder normal as well as water-limiting conditions withemphasis on the development of a rapid screeningtechnique for high nitrogen-use efficiency for corn innormal and drought environments.
Materials and Methods
Greenhouse screening
Experiments were conducted in the greenhouse at theInstitute of Plant Breeding (IPB) using the sand culturetechnique to evaluate the nitrogen-use efficiency (NUE)and productive efficiency of applied nitrogen (PENA) ofwhite and yellow maize inbreds and diallel crosses. Thewater regimes were designated as irrigated and limitingwater. The nitrogen levels were (a) control (no added N);(b) 60 kg N ha-1; and (c) 120 kg N ha-1. Phosphorus andpotassium fertilizer in the form of solophos (0-18-0) andmuriate of potash (0-0-60) were added at the rate of 120 kgha-1. The entries were grown at field capacity under bothwater regimes. To effect the drought treatment, water waswithheld 7 days after seedling emergence.
A split-split-plot design in an RCB with two replicationswas used with the water regime as the main plot, N level asthe subplot and the variety as the sub-subplot. Each mainplot used styrofor trays containing 17 kg of sand previouslyanalyzed for nutrient composition and water-holdingcapacity. Seeds were drilled into 35 cm rows to serve assub-subplots. Twelve entries were initially evaluated perset-up but as the project progressed more were screened.Nutrients were added at sowing time. Equal volumes ofwater were used to irrigate the different treatments atplanting to allow seed germination and seedlingestablishment. One week after germination, irrigation waswithheld in the drought and recovery treatments. Visualratings were made and soil moisture status was monitored.Plant sampling for N analysis commenced when visibledifferences were observed among the entries (leaf rolling).The entries were evaluated for the rate of recovery afterresumption of watering. Plant samples were collected whendifferences due to rewatering became visible among theentries. Dry matter accumulation (shoot and root dryweights), shoot and root length and nitrogen contents ofthe plants were determined. N-efficient genotypes areentries with the ability to produce a high total dry matteryield, high plant N-accumulation and rapid root and shootgrowth.
Field trials
To verify and validate the results obtained from thesand culture, field experiments were conducted at Lagunaand Ilocos Norte using the following levels of N: noaddition of N (control), 70 kg ha-1 and 140 kg ha-1 underwater-limiting and normal water regimes. Phosphorus andpotassium were applied at the rate of 120 kg ha-1 in all theplots. The recommended cultural management for corn wasadopted except N-fertilization. The experiment was laid outusing a randomized complete block design (RCBD) in asplit-split plot with the water regime as the main plot, Nlevel as the subplot and the variety as the sub-subplot.Five to eight potentially drought-tolerant and susceptiblewhite and yellow corn genotypes were tested separately.To effect the drought treatment, water was withheld onemonth after planting, and resumption of watering was doneto field capacity at the grain-filling stage. The sample plotsor harvest area consisted of the three inner rows in thefive-row plots which served as the basic experimental unit.Soil samples were collected for moisture and N analyses.
Samples were collected at physiological maturity forN analysis, dry matter accumulation, grain yield and itscomponents. N-use efficient (NUE) genotypes and thosewith high PENA were identified. Comparison was donebetween the morphological and physiological traits ofplants grown in the greenhouse and their yield performancein the field to determine whether genotype response underfield conditions would be similar to genotype response insand culture. Moreover, the responses of the genotypesat seedling stage were compared with their responses atmaturity. As the ability of a plant to recover rapidly fromstress is an important drought-tolerance mechanism, theentries were evaluated visually for the rate of recoveryafter resumption of watering.
Results and DiscussionInitial soil characteristicsThe sand used in the
greenhouse experiment had a strongly acidic reaction (pH6.90), very low nitrogen content (0.009 %) and highphosphorus (25 ppm) and potassium (0.50 cmol(+) kg-1)levels. The Cervantes clay loam soil used in the fieldexperiments at Piddig in Ilocos Norte had a moderatelyacidic reaction (pH 5.95), medium nitrogen content (0.155%), high available P (16.75 ppm) and K (0.65 cmol(+) kg-1)content. The Alipit clay soil used in the field experimentsat Bay, Laguna had a moderately acidic reaction (pH 5.90),lownitrogen content (0.116%), high available P (18.47 ppm)and very high K (1.70 cmol(+) kg-1) content. To mask thepossible effect that may be caused by the problems of P
334
������� �� �� ����� ������� ����� ���������������
and K availability to plants in the experiment, 120 kg eachof these two nutrients were added to the soil at planting.
Greenhouse results
The greenhouse experiments involving white andyellow corn inbreds and diallel crosses were conducted todetermine the plant parameters that could be used in thedevelopment of a rapid screening technique that will limitthe number of entries to be tested in the field for grainyield determination and verification trials underwaterlimiting conditions.
Based on the data obtained from the experiments, theparameters that showed significant differences acrosstreatments (water regime, nitrogen levels and varieties) wereshoot length, shoot weight, root length, root weight, totalN uptake and total dry matter weight. The soil moisturecontent after drought imposition based on oven dry weightwas 3.74 % while the moisture content of irrigated sandwas 9.34%. The moisture content of sand at field capacityis 6-12% while at permanent wilting point it is 2-6 % (Hansenet al. 1980).
Field verification trial under normal andwater-limiting conditions
Promising drought-tolerant white and yellow corngenotypes which showed good performance in thegreenhouse and those susceptible to water stress weretested under field conditions during the dry croppingseason at Ilocos Norte and Laguna to see whether theywould produce similar results. One month after droughtimposition, soil sampling was done to determine the amountof soil moisture in the field. The moisture content of plotsunder drought treatment decreased from 29.09% at 5 weeksafter planting (WAP) to 19.31% at 9 WAP which coincidedwith the grain-filling stage. The moisture content for a clayloam soil at field capacity is 23-31% while for permanentwilting point it is 11-15% (Hansen et al. 1980). At thismoisture level, the plants were under moisture stress. Cornplants undergo water stress prior to the flowering stagewhich is the most crucial time for the plant to producegrains. After this stage, the corn plants were irrigated toinduce recovery.
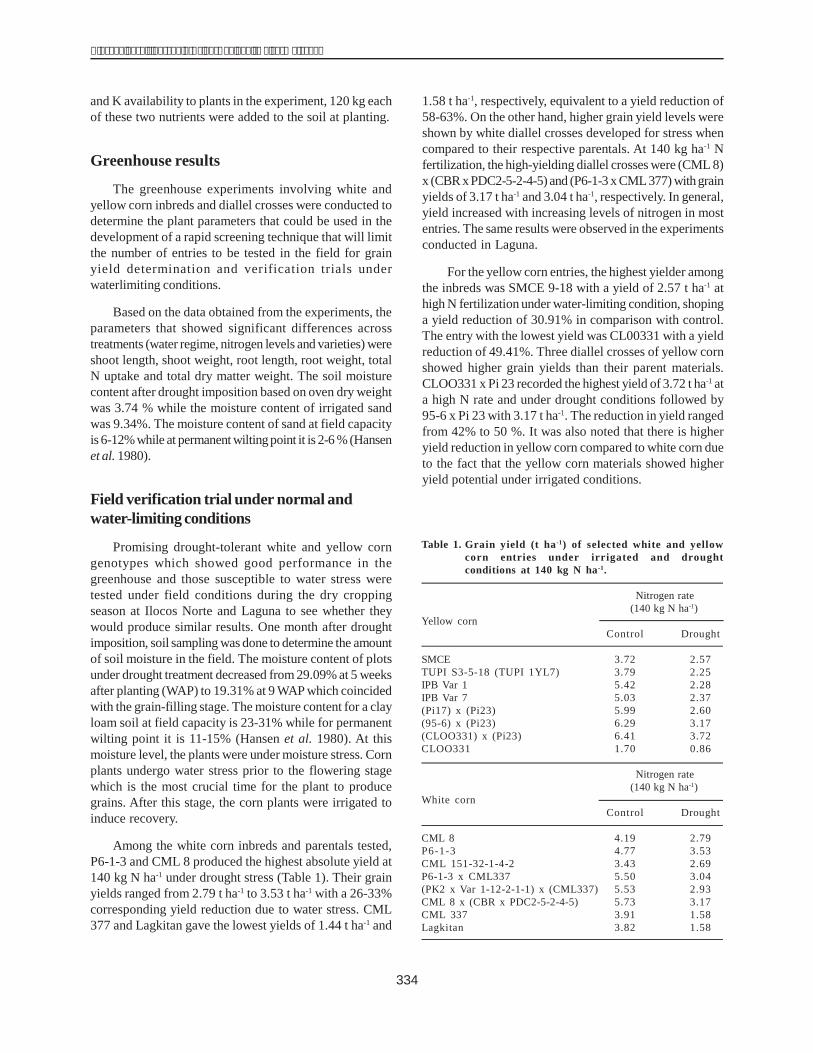
Among the white corn inbreds and parentals tested,P6-1-3 and CML 8 produced the highest absolute yield at140 kg N ha-1 under drought stress (Table 1). Their grainyields ranged from 2.79 t ha-1 to 3.53 t ha-1 with a 26-33%corresponding yield reduction due to water stress. CML377 and Lagkitan gave the lowest yields of 1.44 t ha-1 and
1.58 t ha-1, respectively, equivalent to a yield reduction of58-63%. On the other hand, higher grain yield levels wereshown by white diallel crosses developed for stress whencompared to their respective parentals. At 140 kg ha-1 Nfertilization, the high-yielding diallel crosses were (CML 8)x (CBR x PDC2-5-2-4-5) and (P6-1-3 x CML377) with grainyields of 3.17 t ha-1 and 3.04 t ha-1, respectively. In general,yield increased with increasing levels of nitrogen in mostentries. The same results were observed in the experimentsconducted in Laguna.
For the yellow corn entries, the highest yielder amongthe inbreds was SMCE 9-18 with a yield of 2.57 t ha-1 athigh N fertilization under water-limiting condition, shopinga yield reduction of 30.91% in comparison with control.The entry with the lowest yield was CL00331 with a yieldreduction of 49.41%. Three diallel crosses of yellow cornshowed higher grain yields than their parent materials.CLOO331 x Pi 23 recorded the highest yield of 3.72 t ha-1 ata high N rate and under drought conditions followed by95-6 x Pi 23 with 3.17 t ha-1. The reduction in yield rangedfrom 42% to 50 %. It was also noted that there is higheryield reduction in yellow corn compared to white corn dueto the fact that the yellow corn materials showed higheryield potential under irrigated conditions.
Table 1. Grain yield (t ha-1) of selected white and yellowcorn entries under irrigated and droughtconditions at 140 kg N ha-1.
Nitrogen rate(140 kg N ha-1)
Yellow cornControl Drought
SMCE 3.72 2.57TUPI S3-5-18 (TUPI 1YL7) 3.79 2.25IPB Var 1 5.42 2.28IPB Var 7 5.03 2.37(Pi17) x (Pi23) 5.99 2.60(95-6) x (Pi23) 6.29 3.17(CLOO331) x (Pi23) 6.41 3.72CLOO331 1.70 0.86
Nitrogen rate(140 kg N ha-1)
White cornControl Drought
CML 8 4.19 2.79P6-1-3 4.77 3.53CML 151-32-1-4-2 3.43 2.69P6-1-3 x CML337 5.50 3.04(PK2 x Var 1-12-2-1-1) x (CML337) 5.53 2.93CML 8 x (CBR x PDC2-5-2-4-5) 5.73 3.17CML 337 3.91 1.58Lagkitan 3.82 1.58
335
����� � ���� ����������� �������
In testing for the correlation of grain yield obtainedfrom the field with the parameters used in the greenhousefor white corn, correlation coefficients greater than 80%were obtained for parameters like shoot length, shootweight, root length, root weight, total dry matter weight,shoot N and total N uptake under the water-stressedcondition. The test of correlation for yellow corn, however,showed correlation coefficients less than 50% for rootweight and root length while the rest of the parametershad correlation coefficients greater than 80%.
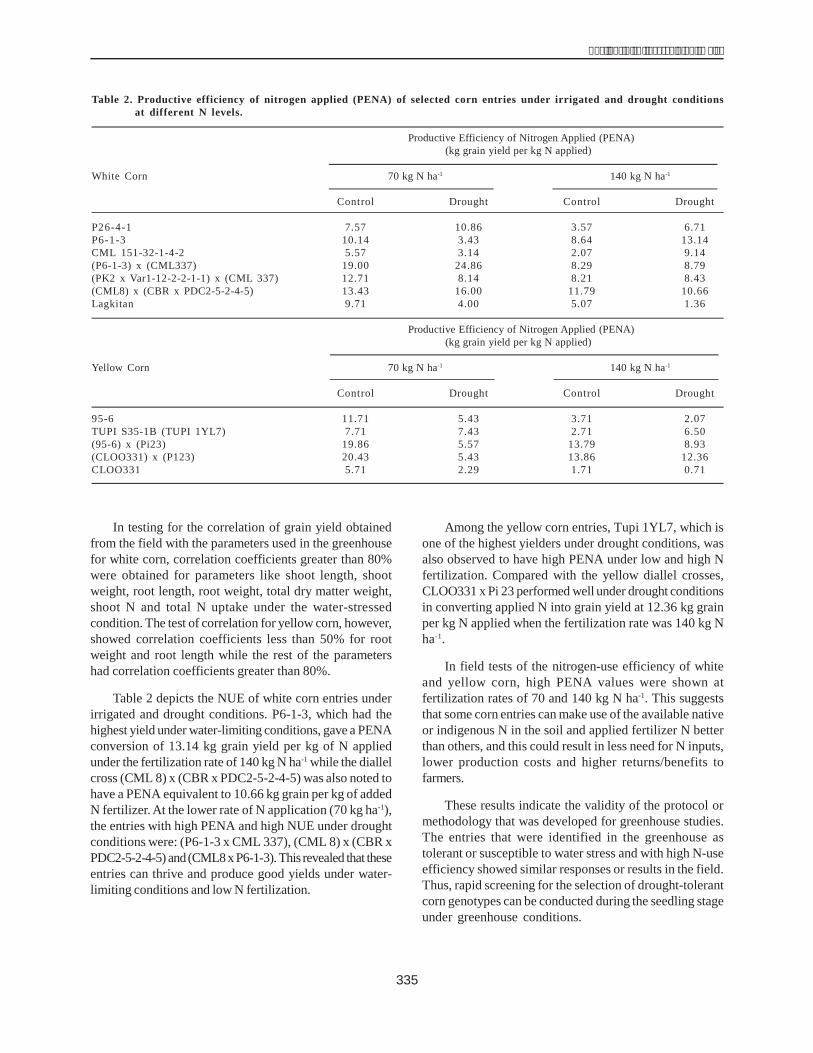
Table 2 depicts the NUE of white corn entries underirrigated and drought conditions. P6-1-3, which had thehighest yield under water-limiting conditions, gave a PENAconversion of 13.14 kg grain yield per kg of N appliedunder the fertilization rate of 140 kg N ha-1 while the diallelcross (CML 8) x (CBR x PDC2-5-2-4-5) was also noted tohave a PENA equivalent to 10.66 kg grain per kg of addedN fertilizer. At the lower rate of N application (70 kg ha-1),the entries with high PENA and high NUE under droughtconditions were: (P6-1-3 x CML 337), (CML 8) x (CBR xPDC2-5-2-4-5) and(CML8 x P6-1-3). This revealed that theseentries can thrive and produce good yields under water-limiting conditions and low N fertilization.
Among the yellow corn entries, Tupi 1YL7, which isone of the highest yielders under drought conditions, wasalso observed to have high PENA under low and high Nfertilization. Compared with the yellow diallel crosses,CLOO331 x Pi 23 performed well under drought conditionsin converting applied N into grain yield at 12.36 kg grainper kg N applied when the fertilization rate was 140 kg Nha-1.
In field tests of the nitrogen-use efficiency of whiteand yellow corn, high PENA values were shown atfertilization rates of 70 and 140 kg N ha-1. This suggeststhat some corn entries can make use of the available nativeor indigenous N in the soil and applied fertilizer N betterthan others, and this could result in less need for N inputs,lower production costs and higher returns/benefits tofarmers.
These results indicate the validity of the protocol ormethodology that was developed for greenhouse studies.The entries that were identified in the greenhouse astolerant or susceptible to water stress and with high N-useefficiency showed similar responses or results in the field.Thus, rapid screening for the selection of drought-tolerantcorn genotypes can be conducted during the seedling stageunder greenhouse conditions.
Table 2. Productive efficiency of nitrogen applied (PENA) of selected corn entries under irrigated and drought conditionsat different N levels.
Productive Efficiency of Nitrogen Applied (PENA)(kg grain yield per kg N applied)
White Corn 70 kg N ha-1 140 kg N ha-1
Control Drought Control Drought
P26-4-1 7.57 10.86 3.57 6.71P6-1-3 10.14 3.43 8.64 13.14CML 151-32-1-4-2 5.57 3.14 2.07 9.14(P6-1-3) x (CML337) 19.00 24.86 8.29 8.79(PK2 x Var1-12-2-2-1-1) x (CML 337) 12.71 8.14 8.21 8.43(CML8) x (CBR x PDC2-5-2-4-5) 13.43 16.00 11.79 10.66Lagkitan 9.71 4.00 5.07 1.36
Productive Efficiency of Nitrogen Applied (PENA)(kg grain yield per kg N applied)
Yellow Corn 70 kg N ha-1 140 kg N ha-1
Control Drought Control Drought
95-6 11.71 5.43 3.71 2.07TUPI S35-1B (TUPI 1YL7) 7.71 7.43 2.71 6.50(95-6) x (Pi23) 19.86 5.57 13.79 8.93(CLOO331) x (P123) 20.43 5.43 13.86 12.36CLOO331 5.71 2.29 1.71 0.71
336
������� �� �� ����� ������� ����� ���������������
Conclusions and RecommendationsThe different objectives of this work were answered
by conducting greenhouse and field experiments involvingyellow and white corn genotypes and several developeddiallel crosses. The greenhouse experiments were able todetermine the parameters that could be used for thedevelopment of a rapid screening technique for theselection of genotypes with strong potential for high N-use efficiency under water-limiting conditions. Plantparameters such as shoot length, shoot weight, root length,root weight, total N uptake and total dry matter weightwere found to significantly affect the growth of corngenotypes under water stress conditions. This was verifiedby the field experiment which showed that the identifiedpotentially tolerant and susceptible entries and those withhigh N-use efficiency under water-limiting conditions inthe greenhouse also correspond to the best and leastperforming corn genotypes, respectively, in the fieldexperiment. Based on greenhouse and field experiments,the corn genotypes which possessed potential droughttolerance and high N-use efficiency were P6-1-3 and (CML8)x(CBRxPDC2-5-2-4-5) forwhitecornand (CLOO331xPi23) and (95-6 x Pi23) for yellow corn. The generation ofdiallel crosses that was initiated and the results obtainedshowed good promise in the development of these materialsin terms of higher grain yield and high N-use efficiencyunder water-limiting conditions.
ReferencesDavis J.G. and Quick J.S. 1998. Nutrient management, cultivar
development and selection of strategies to optimize water-use efficiency in nutrient use in crop production. RengelZ. (ed.). The Haworth Press, Inc.
Fitter A.H. 1991. Characteristics and functions of root systemsin plant roots: the hidden half. New York, USA: Dekker.
Fitter A.H., Strickland T.R., Harvey M.L. and G.W. Wilson.1991. Architectural analyses of plant root systems. 1.Architectural correlates of exploitation efficiency. NewPhytologist 118(3):375-382.
Hansen V.E, Israelsen O.W. and Stringham G.E. 1980. Irrigationprinciples and practices. 4th edition. New York, USA:Wiley.
Logro��%�������������&�'�#(()�*������+����������low nitrogen on maize production in Asia. InDevelopingdrought and low N-tolerant maize: proceedings of asymposium, March 25-29, 1996, CIMMYT, El Batan,Mexico. Edmeades G.O., Banzinger M., Mickelson H.R.and Pena-Valdivia C.B. (eds.). D.F., Mexico: CIMMYT.
Lynch J. 1998. In: Nutrient use in crop production. TheHaworth Press, Inc.
Lynch J. 1995. Root architecture and plant productivity. PlantPhysiology 109(1):7-13.
Power J.F. 1990. Role of moisture stress in plant nutritionalfunctions. In: Crop as enhancers of nutrient use. BaligarV.C. and Duncan R.R. (eds.). San Diego, California, USA:Academic Press, Inc.
337
����� � ���� ����������� �������
IntroductionAround 50% of the maize crop grown in tropical regions
including South East Asia is reported to be affected bydrought stress and low N, causing significant yieldreductions (Eck 1984). Maize planted continuously undermonoculture rapidly depletes soil nitrogen. Dry soilconditions can restrict the transformation of soil nutrientsinto available ions and decrease the availability of mobileions to roots. On the other hand, economic constraintsoften restrict farmers from applying the recommendedfertilizer dosages. Under such conditions, the best choicefor farmers is to grow varieties that are tolerant of low soilnitrogen.
Budiarti et al. (2004) reported that yield is a quantitativecharacter that is significantly affected by environmentalfactors; so other characters having functional relations(for instance, yield components) with yield need to bepredicted for ascertaining their contribution to overall yieldvariance.
Path coefficient analysis is a statistical tool that isused to indicate the quality relations between predictorvariables and responsive variables in a path diagram basedon experimental results. The advantage of path analysis isthat it can divide coefficient correlations into theircomponents. The components of path coefficients measurethe direct effect of predictor variables and other
components, and the indirect effect of predictor variablesthrough other predictor variables (Samonte et al. 1998;Board et al. 1999).
Path coefficient analysis has been widely used in plantbreeding to determine the relationship between yield andyield-attributing traits. This helps the breeder in identifyingcharacteristics that are useful in making an effectiveselection (Samonte et al. 1998; Muhammad et al. 2003).
This study was aimed at obtaining information aboutthe relationship between the yield and yield componentsof the Maros Synthetic First-Cycle Population Family(MRSS-1 C0) under optimal and deficient N conditions.
Materials and MethodsThe genetic materials used in this study were S1 family
maize seed of Maros synthetic (MRSS-1 C0). Thecomparison varieties were Bisma, Bisi-2, SATP-1 (S2) C6and family S0. The fertilizer used was urea. Carbofuran 3Gwas used to prevent infestation of corn pests.
The field experiment was carried out at theexperimental farm in Muneng, Probolinggo, East Java,Indonesia. It was conducted under two environments: lowN (N0) with addition of 50 kg urea ha-1, and high N withaddition of 300 kg urea ha-1. In each environment, the field
Path Analysis of Yield and Yield Components of SyntheticMaros FirstCycle Population (MRSS-1 C0) under Low N
FatmawatiandA.M.AdnanIndonesia Cereal Research Institute (ICERI), Jl. Dr. Ratulangi No. 274Telp. 0411 371 016, 371 529, Fax 0411 371 961, Maros 90514, South Sulawesi, Indonesia.E-mail: [email protected]
Abstract. Around 50% of the maize crop grown in tropical regions including South East Asia suffers significant yieldpenalties due to drought stress and low nitrogen. Continuous monoculture of maize exhausts soil nitrogen rapidly.Furthermore, economic constraints often restrict farmers from applying the recommended fertilizers. Under suchconditions, the best choice for farmers is to grow varieties with tolerance for low nitrogen. This study was aimed atmeasuring the correlation between the yield and yield components of the maize Synthetic Maros First Cycle (MRSS-1 C0) population under optimum and low N conditions. The experiment was conducted in the Muneng experimentalfarm, Probolinggo, East Java, Indonesia. The experimental material consisted of 200 S1 families in four sets plantedunder optimum (recommended fertilizer: 300 kg urea ha-1) and low N (50 kg urea ha-1) conditions. Bisma, Bisi-2, SATP-1 (S2) C6 and S0 families were used as controls in these sets. All experimental sets were replicated two times. Thedata were subjected to correlation and path analyses, which revealed that plant height and wet peeling weight wereeffective parameters correlating with yield under low N conditions.
Key words: Path analysis, Maros synthetic population, low N.
338
������� �� �� ����� ������� ����� ���������������
was divided into four sets and four controls. Each set wasplanted with 50 S1 families. Every set was replicated twice.
Computation of path analysis was done by the matrixmethod, and the following characters were considered: X1= tasseling; X2 = silking; X3 = harvested plant; X4 =sterilized plant; X5 = harvested ear; X6 = wet peeling; X7 =water content; X8 = dry shelling weight; X9 = weight of1000 grain; X10 = plant height; X11 = ear height; X12 = earlength; X13 = ear diameter; and X14 = number of ear rows.
According to Singh and Chaudary (1979) the relationamong parameters is based on the relation between thecoefficient of correlation (r) and the path coefficient (p), asfollows:
Rx1y= px1y + rx1x2px3y + rx1x4px4y + ...+rx1x13px13yRx2y=rx2x1px1y+px2y+rx2x3px3y+������������Rx3y=rx3x1px1y+rx3x2px3y+px3y+�������������Rx13y=rx13x1px1y+rx13x2px13y+rx13x3px13y+������
By the matrix modelA= B.C and calculating the matrixinverse B, the path coefficient can be computed by C = B-
1.A.
Results and DiscussionThe selection of 14 characters as independent
variables to assess their effect on maize yield componentsunder low N conditions was based on the understanding
that the vegetative parts of a plant, particularly leaves,play an important role in different metabolic activities.Besides, it is known that both vegetative and generativecharacters are directly linked to yield components.(Miftahorachman et al. 1992).
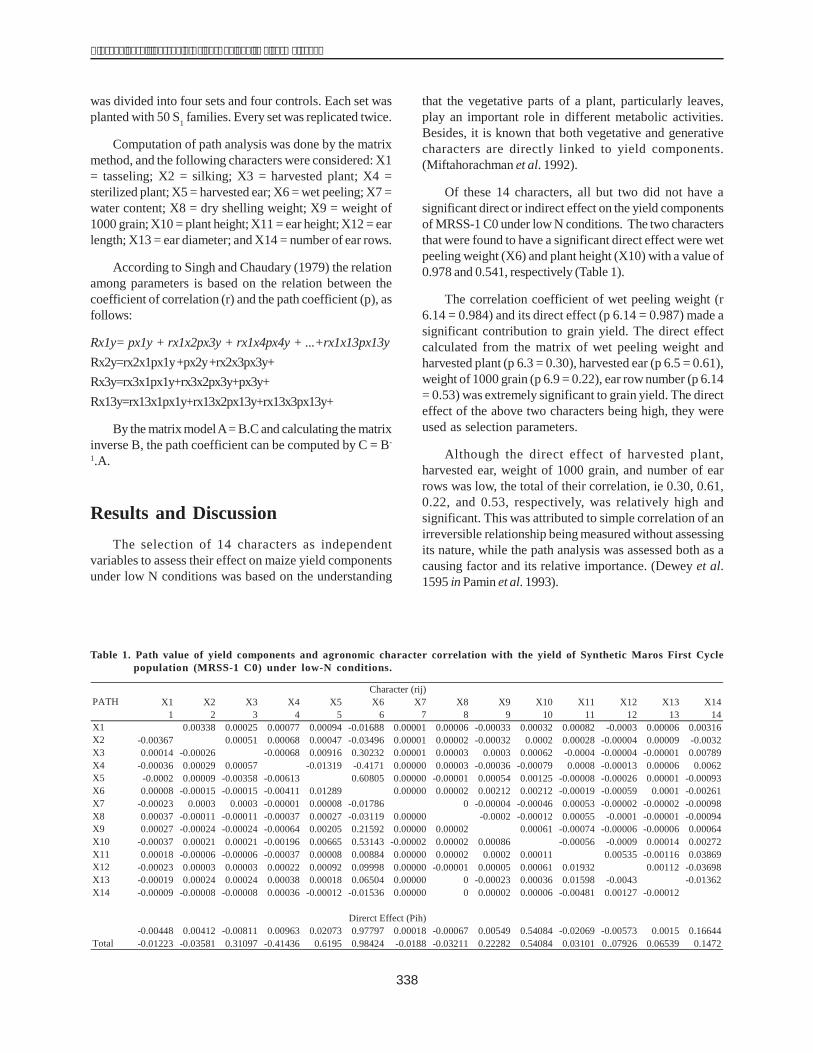
Of these 14 characters, all but two did not have asignificant direct or indirect effect on the yield componentsof MRSS-1 C0 under low N conditions. The two charactersthat were found to have a significant direct effect were wetpeeling weight (X6) and plant height (X10) with a value of0.978 and 0.541, respectively (Table 1).
The correlation coefficient of wet peeling weight (r6.14 = 0.984) and its direct effect (p 6.14 = 0.987) made asignificant contribution to grain yield. The direct effectcalculated from the matrix of wet peeling weight andharvested plant (p 6.3 = 0.30), harvested ear (p 6.5 = 0.61),weight of 1000 grain (p 6.9 = 0.22), ear row number (p 6.14= 0.53) was extremely significant to grain yield. The directeffect of the above two characters being high, they wereused as selection parameters.
Although the direct effect of harvested plant,harvested ear, weight of 1000 grain, and number of earrows was low, the total of their correlation, ie 0.30, 0.61,0.22, and 0.53, respectively, was relatively high andsignificant. This was attributed to simple correlation of anirreversible relationship being measured without assessingits nature, while the path analysis was assessed both as acausing factor and its relative importance. (Dewey et al.1595 in Pamin et al. 1993).
Table 1. Path value of yield components and agronomic character correlation with the yield of Synthetic Maros First Cyclepopulation (MRSS-1 C0) under low-N conditions.
Character (rij)PATH X1 X2 X3 X4 X5 X6 X7 X8 X9 X10 X11 X12 X13 X14
1 2 3 4 5 6 7 8 9 10 11 12 13 14X1 0.00338 0.00025 0.00077 0.00094 -0.01688 0.00001 0.00006 -0.00033 0.00032 0.00082 -0.0003 0.00006 0.00316X2 -0.00367 0.00051 0.00068 0.00047 -0.03496 0.00001 0.00002 -0.00032 0.0002 0.00028 -0.00004 0.00009 -0.0032X3 0.00014 -0.00026 -0.00068 0.00916 0.30232 0.00001 0.00003 0.0003 0.00062 -0.0004 -0.00004 -0.00001 0.00789X4 -0.00036 0.00029 0.00057 -0.01319 -0.4171 0.00000 0.00003 -0.00036 -0.00079 0.0008 -0.00013 0.00006 0.0062X5 -0.0002 0.00009 -0.00358 -0.00613 0.60805 0.00000 -0.00001 0.00054 0.00125 -0.00008 -0.00026 0.00001 -0.00093X6 0.00008 -0.00015 -0.00015 -0.00411 0.01289 0.00000 0.00002 0.00212 0.00212 -0.00019 -0.00059 0.0001 -0.00261X7 -0.00023 0.0003 0.0003 -0.00001 0.00008 -0.01786 0 -0.00004 -0.00046 0.00053 -0.00002 -0.00002 -0.00098X8 0.00037 -0.00011 -0.00011 -0.00037 0.00027 -0.03119 0.00000 -0.0002 -0.00012 0.00055 -0.0001 -0.00001 -0.00094X9 0.00027 -0.00024 -0.00024 -0.00064 0.00205 0.21592 0.00000 0.00002 0.00061 -0.00074 -0.00006 -0.00006 0.00064X10 -0.00037 0.00021 0.00021 -0.00196 0.00665 0.53143 -0.00002 0.00002 0.00086 -0.00056 -0.0009 0.00014 0.00272X11 0.00018 -0.00006 -0.00006 -0.00037 0.00008 0.00884 0.00000 0.00002 0.0002 0.00011 0.00535 -0.00116 0.03869X12 -0.00023 0.00003 0.00003 0.00022 0.00092 0.09998 0.00000 -0.00001 0.00005 0.00061 0.01932 0.00112 -0.03698X13 -0.00019 0.00024 0.00024 0.00038 0.00018 0.06504 0.00000 0 -0.00023 0.00036 0.01598 -0.0043 -0.01362X14 -0.00009 -0.00008 -0.00008 0.00036 -0.00012 -0.01536 0.00000 0 0.00002 0.00006 -0.00481 0.00127 -0.00012
Direrct Effect (Pih)-0.00448 0.00412 -0.00811 0.00963 0.02073 0.97797 0.00018 -0.00067 0.00549 0.54084 -0.02069 -0.00573 0.0015 0.16644
Total -0.01223 -0.03581 0.31097 -0.41436 0.6195 0.98424 -0.0188 -0.03211 0.22282 0.54084 0.03101 0..07926 0.06539 0.1472
339
����� � ���� ����������� �������
ConclusionsEntries being selected for tolerance to N deficiency
have to be assessed under N deficiency conditions. Wetpeeling weight and plant height can be used as selectiontraits for high-yielding capacity under N-deficiencyconditions.
ReferencesEck H.V. 1984. Irrigated corn yield response to nitrogen and
water Agron. J. 76:421-428.Board J.E., Kang M.S. and Harville B.G. 1999. Path analysis of
the yield formation process for late-planted soyabean.Agron J. 91:128-135.
Budiarti S.G., Rizki Y.R., and Kusumo Y.W.E. 2004. Analisiskoefisien lintas beberapa sifat pada plasma nutfah gandum(Triticum aestivum L.)
Mohammadi S.A., Prasanna B.M. and Singh N.N. 2003.Sequential path model for determining interrelationshipsamong grain yield and related characters in maize. CropScience 43:1690-1697.
Samonte S.O.P.B., Wilson L.T. and McClung A.M. 1998. Pathanalysis of yield and yield-related traits of fifteen diverserice genotypes. Crop Science 38:1130-1136
Miftahorrachman, Tampake H. and Rompas T. 1992. Analisissidik lintas (path analysis) karakter vegetatif dan generatifpada kelapa dalam Palu. Buletin Balitka. No. 16 hal 24.
Singh R.K. and Chaudary B.D. 1979. Biometrical methods inquantitative genetic analysis. Revised edition. New Delhi,India: Kalyani Publishers.
340
������� �� �� ����� ������� ����� ���������������
IntroductionOne of the most important limitations to maize
production in arid and semiarid regions is soil and watersalinity. Salinity affects about one billion ha of land in theworld and 320 million ha in Asia (Khan and Weber 2006).In Iran, more than 18 million ha are affected by salinity(Koochaki 2007). Mass et al. (1983) reported that therelative salt tolerance of maize may increase at differentstages of growth without a significant decrease in yield.Kostandi and Soliman (1992) found that despite grain yielddecrease with salinity increase, using salty water especiallyduring the late stages of growth is advisible. Jamaly et al.(2003) reported that maize is tolerant of salinity at thegermination stage. Hoffman et al. (1993) showed that thethreshold of tolerance to salinity in maize plants is 3.7 dsm-1. Levay and Bauder (2002) evaluated 16 species of forageplants for salt tolerance in 2002 and found that the mosttolerant species were tall fescue, slender wheatgrass, altai,wheatgrass, sorghum and maize, in that order. Cuevas(2003) evaluated the response of maize inbred lines tosalinity and found that the inbred lines pi-21 and pi-31were more tolerant due to the increased activation of the
nitrate reductase enzyme. Zarandi et al. (2007) evaluated27 hybrids of grain corn at electrical conductivity (EC) of8.5 ds m-1. The salt-tolerant hybrids were BC504, OSSK373,G-3337, G-54190, KSC301, KSC250 and NS540. El-lakanyand Russel (1971) reported positive and significantcorrelation between inbred line traits and their hybrids�performances. Gama and Hallauer (1977) reported nosignificant correlation between inbred line traits and theyield of their test crosses, but there were indications thatphenotypic selection for inbred line traits would be useful.
The objectives of our study were: (i) screening of maizegenotypes (inbred lines and hybrids) for salt tolerance inthe greenhouse and the field; and (ii) evaluation of saltstress effects on morphological traits, yield and yieldcomponents of different maize genotypes.
Materials and MethodThe greenhouse and field study was conducted at the
Center of Agricultural Research and Natural Resources ofKhorasan Razavi Province in northeastern Iran (59 �38���
Screening of Salt-Tolerant Grain Maize (Zea mays L.)Genotypes under Saline Conditions
SaeedKhavariKhorasani1,HadiKhazaee2 andMohammadMohammadi3
1. Assistant professor, Center of Agricultural Research and Natural Resources of Khorasan Razavi Province,P.O. Box 91735-488, Mashhad, Iran. E-mail: [email protected]
2. Scientific staff, Center of Agricultural Research and Natural Resources of Khorasan Razavi Province.3. Research scholar, Center of Agricultural Research and Natural Resources of Khorasan Razavi Province.
Abstract. This study was conducted to determine the response of maize genotypes under saline conditions at theCenter of Agricultural Research and Natural Resources of Khorasan Razavi Province, Mashhad, Iran in 2007. Forty-two genotypes (20 inbred lines and 22 hybrids) were first tested in the greenhouse in four complete randomizeddesigns under four irrigation treatments with different salinity levels [i electrical conductivity = 4 ds m-1, 8 ds m-1, 12ds m-1and 1 ds m-1 ( control)]. The germination percentage, dried weight of plants and the vigor index were recordedseparately. In the field experiment, 46 genotypes (23 inbred lines and 23 hybrids) were planted in two randomizedcomplete block designs with 3 replications in two fields (the Mashhad and Neyshabour agricultural research stationswith saturated-paste electrical conductivity of 5.9 ds m-1 and 8 ds m-1, respectively). The evaluated traits wereanthesis and silking time, anthesis��������� ���������������������������������������������������������������������length, kernel number, number of rows per ear, kernel number per row, kernel depth and 1000-kernel weight. Theresults showed no significant differences among the salt stress treatments for germination percentage, althoughthe vigor index of plants was affected by higher levels of salt (8 ds m-1 and 12 ds m-1). The results of the fieldexperiment in Mashhad showed that saline conditions had nonfavorable effects on the maize genotypes, especiallythe inbred lines. The single-cross hybrids KE72012/1-12 ����������� !""����# $�$�����������������%&%%����-
1, 7.66 t ha-1 and 7.22 t ha-1 respectively. The inbred line KE72012/1-12 had the highest grain yield of 1.722 t ha-1. Thehybrid ETH-M24 and the inbred line OH43/1-42 recorded the lowest grain yields. In Neyshabour, many of the inbredlines and hybrids were removed due to high salinity; therefore, statistical analysis was not possible.
Key words: Salt stress, electrical conductivity, inbred line, hybrid, grain yield, maize (Zea mays L.)

341
����� � ���� ����������� �������
36 �16������������������������������� �!!��"�����"�##���2007. In the greenhouse, 42 genotypes (20 inbred linesand 22 hybrids) were evaluated in four complete randomizeddesigns (CRD) under four irrigation treatments withdifferent salinity levels [(ECW = 4, 8, 12 ds m-1, and 1ds m-1
(control)]. In each CRD design, 40 seeds of each genotypewere planted in sand in 2 pots (as 2 replications). Thegermination percentage, dried weight of plants and thevigor index were recorded separately. The vigor index (VI)was calculated (Maguire 1962; Abdul-Baki and Anderson1973) as
Vigor index (VI) = dry weight of plants (g) � germinationpercentage
In the field, 46 genotypes (23 inbred lines and 23hybrids) were planted in two randomized complete blockdesigns with 3 replications in two fields (at the agriculturalresearch stations at Abbas-abad in Mashhad and at Feiz-abad in Neyshabour). The electrical conductivity ofsaturated paste (ECe) and water (ECW) were 5.9 ds m-1 and6 ds m-1 in Mashhad and 10.5 ds m-1 and 8 ds m-1 inNeyshabour, respectively. Each genotype was planted in2 rows of 3 m length with 0.75 m distance between rows.Plant density for the early-maturity genotypes was 85 000plants ha-1 and for mid- and late-maturity genotypes 75000 plants ha-1. The evaluated traits were anthesis andsilking time, anthesis-silking interval (ASI), plant height,ear height, physiological maturity, grain yield, ear length,kernel number, number of rows per ear, kernel number perrow, kernel depth and 1000-kernel weight. The salinityvariation and chemical characteristics of the soil weredetermined before planting and after harvest. Analysis ofvariance (ANOVA) and Pearson�$� $�!#�� �����#�%���$between yield and related traits were done by SAS (version8.1). Means of the measured traits were compared byDuncan�$�!&#%�#��������%�$%$�
Results and DiscussionThe results of the greenhouse experiments showed
no significant differences among the salt stress treatmentsfor the germination rate (Table 1; Fig. 1), while the vigorindex of plants was affected by the higher rates (8 ds m-1
and 12 ds m-1) of salinity (Table 1). In the first germinationcount (7th day after planting at 25 �C), many of thegenotypes were found to have a low germination rate atEC 8 ds m-1 and 12 ds m-1 due to high salinity, while in thesecond count (3 weeks after planting) the germination ratewas higher and normal. Jamaly et al. (2003) had reportedthat maize is tolerant to salinity during the germinationstage. Our findings conformed to this pattern.
Despite the nonsignificance of salinity effects ongermination percentage, salt stress had very significanteffects on dried weight and vigor index (Table 1).Comparison of the means for the vigor index showed thatthe higher levels of salinity (8 ds m-1 and 12 ds m-1) led to asevere decrease in the vigor index (Fig. 2). Results ofANOVA for the field experiments showed significantdifferences for all of the measured traits at the Abbas-abad, Mashhad research station (Tables 2 and 3). Saltstress had greater effect on inbred lines than hybrids. Itled to a decrease in vegetative growth especially plantheight and ear height, delay in flowering, increase in theASI and decrease in grain yield and yield components.The single-cross hybrids KE72012/1-12 '�(������(�) **and ZP434 recorded grain yields of 7.77 t ha-1, 7.66 t ha-
1and 7.22 t ha-1 respectively whereas inbred line KE72012/1-12 yielded 1.722 t ha-1, ie, the highest. The hybrid ETH-M24 (2.894 t ha-1) and the inbred line OH43/1-42 (279.8kgha-1) gave the lowest yields under saline conditions.KE72012/1-12 is one of the elite inbred lines for salt stressconditions due to its good performance alone and incombination with K2331. Also, the inbred lines K3640/5and K19 were superior in terms of grain yield under salt
Figure 1. Effects of salt stress on vegetative growth of maizevar. KSC500.
Table 1. Results of ANOVA for seed germination, dry weightof plantlets and vigor index of maize genotypes.
Means of squareSOV Df
Vigor Dry weight Germinationindex of plants (g) (%)
Salt stress (s) 3 243 389.270** 47.092** 6.503ns
Salt/replication 4 9909.197 0.523 4.253Genotypes (G) 41 261 716.442** 20.818** 165.673**S '�+ 42 124 38.001** 1.024* 8.946**Error 245 7612.365 0.767 3.704Total 335 27.92 21.35 13.76

342
������� �� �� ����� ������� ����� ���������������
stress conditions. At Neyshabour station many of theinbred lines and hybrids were removed due to high salinity;therefore, statistical analysis of variance was not possible.Salinity had undesired effects on the vegetative andgenerative growth stages of plants. The maximum (166.7cm) and minimum (65.27 cm) of plant height belonged tothe hybrid B73 '�(�,� ���� %��� ��-���� #���� (����.�respectively.
The hybrids L105 '�(�,�����/�* �� K74/1 with 18.67cm and 17.60 cm length respectively had the longest ears.The inbred line L105 (with 14.65 cm) was the best for earlength.The maximum(261.7 g) and minimum(86.67 g) 1000-kernel weight was recorded by SC704 (hybrid) and K18(inbred line), respectively. Hoffman et al.s (1983) foundthat higher levels of salinity (more than 3.7 ds m-1) led to adecrease in the 300-kernel weight and grain yield. Ourresults support that finding. The new early-maturing Iranian
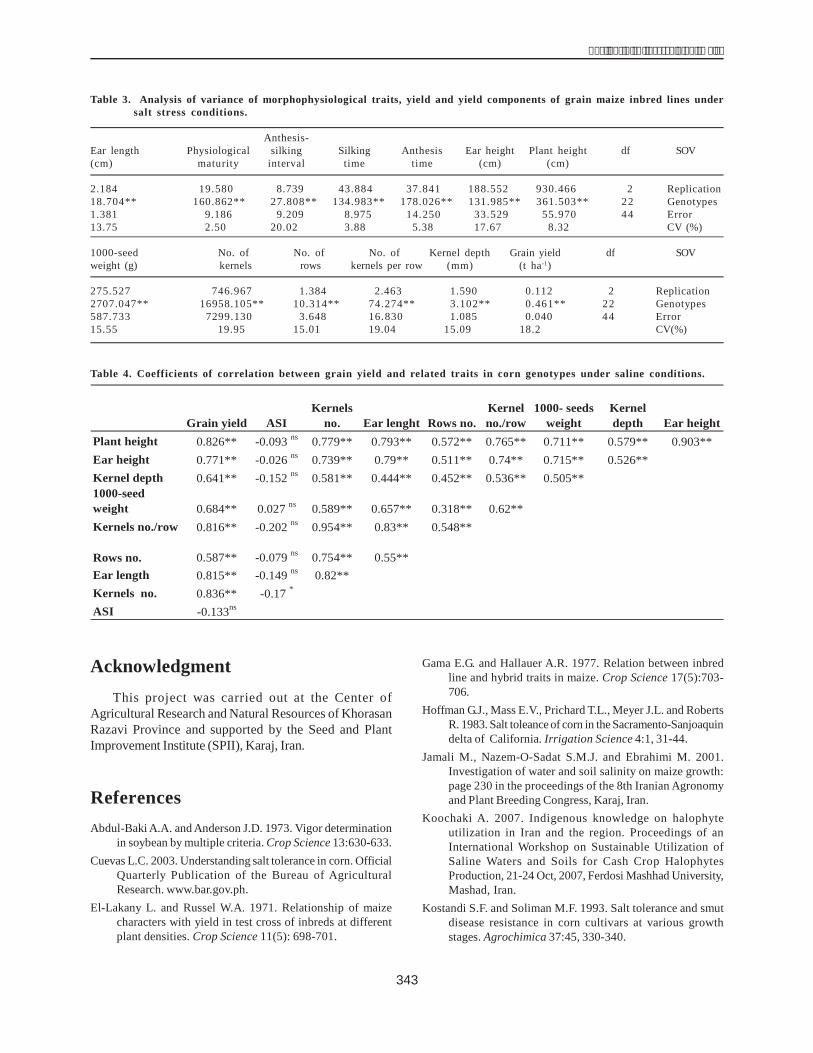
hybrid KSC400 had the most number of kernels per row(39.07), but the most number of rows per ear was found inthe hybrid B73 '�(01.���2���#���$%��&!-����"����$���*�and number of kernels per row (10.33) were recorded bythe inbred lines MO17 and OH43/1-42, respectively. Theearliest and late-maturing inbred lines were S61 and K1264/1, taking 107 and 133 days from planting to physiologicalmaturity, respectively. The highest anthesis-silking interval(ASI) was 12.62 days recorded by the K2816 inbred line.Najafi and Pooran (2000) reported that water salinityincreased ASI by about 4-5 days. Simple coefficients ofcorrelation between yield and agronomical traits like plantheight (r = 0.826**), ear height (r = 0.771**), 1000-kernelweight (r = 0.684**), kernel depth (r =0.641**), number ofkernels per row (r = 0.816**), number of of rows (r = 0.587)and ear length (r = 0.815**) were strongly positive but thecorrelation between ASI and other traits was negative andnonsignificant (r = -0.133) (Table 4).
Table 2. Analysis of variance of morphophysiological traits, yield and yield components of grain maize hybrids under saltstress conditions.
Anthesis-Ear length Physiological silking Silking Anthesis Ear height Plant height df SOV(cm) maturity interval time time (cm) (cm)
0.4.3 2.261 16.362 7.870 105.319 24.422 17.928 2 Replication11.751** 118.401* 7.292* 91.953** 50.968** 431.45** 706.731** 22 Genotypes2.030 53.367 3.696 9.324 10.198 30.068 49.145 44 Error9.82 6.14 20.58 4.45 5.12 9.33 5 CV (%)
1000-seed No. of No. of No. of Kernel depth Grain yield df SOVweight (g) kernels rows kernels per row (mm) (t ha-1)
2052.334 3099.838 0.025 7.523 6.744 4.236 2 Replication2874.509** 24907.269** 6.877** 75.560** 4.212** 7.380** 22 Genotypes997.682 5259.537 1.066 13.055 2.127 1.459 44 Error14.35 14.78 6.65 11.47 16.28 17.12 CV (%)
Effects of Salt Stress on Vigor Index ofMaize Genotypes
bb
aa
200
250
300
350
400
1 4 8 12
Electrical Conductivity (ds/m)
Vig
orIn
dex
Effects of Salt Stress on Seed Germination ofMaize Genotypes
aaaa
707580859095
100
1 4 8 12
Electrical Conductivity (ds/m)
Ger
min
atio
n(%
)
Figure 2. Effects of salt stress on seed germination and vigor index of maize genotypes, 2007.
343
����� � ���� ����������� �������
AcknowledgmentThis project was carried out at the Center of
Agricultural Research and Natural Resources of KhorasanRazavi Province and supported by the Seed and PlantImprovement Institute (SPII), Karaj, Iran.
ReferencesAbdul-Baki A.A. and Anderson J.D. 1973. Vigor determination
in soybean by multiple criteria. Crop Science 13:630-633.Cuevas L.C. 2003. Understanding salt tolerance in corn. Official
Quarterly Publication of the Bureau of AgriculturalResearch. www.bar.gov.ph.
El-Lakany L. and Russel W.A. 1971. Relationship of maizecharacters with yield in test cross of inbreds at differentplant densities. Crop Science 11(5): 698-701.
Gama E.G. and Hallauer A.R. 1977. Relation between inbredline and hybrid traits in maize. Crop Science 17(5):703-706.
Hoffman G.J., Mass E.V., Prichard T.L., Meyer J.L. and RobertsR. 1983. Salt toleance of corn in the Sacramento-Sanjoaquindelta of California. Irrigation Science 4:1, 31-44.
Jamali M., Nazem-O-Sadat S.M.J. and Ebrahimi M. 2001.Investigation of water and soil salinity on maize growth:page 230 in the proceedings of the 8th Iranian Agronomyand Plant Breeding Congress, Karaj, Iran.
Koochaki A. 2007. Indigenous knowledge on halophyteutilization in Iran and the region. Proceedings of anInternational Workshop on Sustainable Utilization ofSaline Waters and Soils for Cash Crop HalophytesProduction, 21-24 Oct, 2007, Ferdosi Mashhad University,Mashad, Iran.�
Kostandi S.F. and Soliman M.F. 1993. Salt tolerance and smutdisease resistance in corn cultivars at various growthstages. Agrochimica 37:45, 330-340.
Table 3. Analysis of variance of morphophysiological traits, yield and yield components of grain maize inbred lines undersalt stress conditions.
Anthesis-Ear length Physiological silking Silking Anthesis Ear height Plant height df SOV(cm) maturity interval time time (cm) (cm)
2.184 19.580 8.739 43.884 37.841 188.552 930.466 2 Replication18.704** 160.862** 27.808** 134.983** 178.026** 131.985** 361.503** 22 Genotypes1.381 9.186 9.209 8.975 14.250 33.529 55.970 44 Error13.75 2.50 20.02 3.88 5.38 17.67 8.32 CV (%)
1000-seed No. of No. of No. of Kernel depth Grain yield df SOVweight (g) kernels rows kernels per row (mm) (t ha-1)
275.527 746.967 1.384 2.463 1.590 0.112 2 Replication2707.047** 16958.105** 10.314** 74.274** 3.102** 0.461** 22 Genotypes587.733 7299.130 3.648 16.830 1.085 0.040 44 Error15.55 19.95 15.01 19.04 15.09 18.2 CV(%)
Table 4. Coefficients of correlation between grain yield and related traits in corn genotypes under saline conditions.
Grain yield ASIKernels
no. Ear lenght Rows no.Kernelno./row
1000- seedsweight
Kerneldepth Ear height
Plant height 0.826** -0.093 ns 0.779** 0.793** 0.572** 0.765** 0.711** 0.579** 0.903**Ear height 0.771** -0.026 ns 0.739** 0.79** 0.511** 0.74** 0.715** 0.526**Kernel depth 0.641** -0.152 ns 0.581** 0.444** 0.452** 0.536** 0.505**1000-seedweight 0.684** 0.027 ns 0.589** 0.657** 0.318** 0.62**Kernels no./row 0.816** -0.202 ns 0.954** 0.83** 0.548**
Ear length 0.815** -0.149 ns 0.82**Kernels no. 0.836** -0.17 *
ASI -0.133ns
0.55**Rows no. 0.587** -0.079 ns 0.754**
344
������� �� �� ����� ������� ����� ���������������
Levay A. and Bauder J. 2002. Screening for salt tolerant foragespecies. Plant Growth Center, Montana State University,USA.
Maguire J.D. 1962. Speed of germination aid in selection andevaluation for seedling emergence and vigor. Crop Science2:176-177.
Mass E.V., Hoffman G.L., Chaba G.D., Poss J.A. and ShannonM.C. 1983. Salt sensitivity of corn at various growthstages. Irrigation Science 4:1, 45-47.
Najafi E. and Pooran M. 2001. Investigation of effects of 4water salinity treats on 5 maize cultivars in Eshtehard,Karaj, Iran. Page 263 in proceedings of the 8th IranianAgronomy and Plant Breeding Congress, Karaj,Iran.Zarandi S., Chokan R., and Bihamta M.R. 2008.Response of commercial grain maize hybrids to salt stress.Proceedings of the 10th National Genetics Congress, IranMedical Science University, Tehran, Iran, 10-14 June,2008.
345
����� � ���� ����������� �������
IntroductionDrought stress is the most widespread abiotic
constraint to maize production in the tropics, where thecrop is mostly grown under rainfed conditions in marginalproduction environments. Loss of maize grain productiondue to drought may reach up to 24 million t per year in thetropics, equivalent to 17% of production under well-watered conditions (Edmeades et al. 1999). In Thailand,drought is a priority constraint to maize production in manyagroecological zones, occurring almost every year(Eskasingh et al. 2004). Maize can be affected by stress atany stage (Grant et al. 1989). Reduction of water availabilitydown to permanent wilting point during preflowering,flowering and postflowering stages reduced grain yieldby 25%, 50% and 21% respectively (Denmead and Shaw1960). Therefore, breeders need to develop maize genotypeswhich cantolerate water stress (Betran et al. 1996). Geneticvariations are the basis of genetic improvement in anycrop. Crossing diverse inbred lines can provide sufficientgenetic variability from which to make an effective selectionfor desirable traits. Identifying parents that will combinewell and produce productive progenies mainly dependson gene action. Information on quantitative traits in termsof general and specific combining ability effects for a setof parents can be obtained from diallel analysis. TheNakhon Sawan Field Crops Research Center (NSFCRC)
Maize Breeding Program has collaborated with CIMMYTon maize research and development for many years, anddeveloped a number of inbreds through different breedingprocedures (Grudloyma et al. 2005). In the present study,different sources of tropical late yellow inbreds werecrossed in a diallel mating system to determine theircombining ability and compare the performance ofpromising hybrids under water stress conditions.
Materials and MethodThe study was conducted atNSFCRC in Tak Fa,
Thailand during 2006-2007. A set of 10 tropical lateyellowmaize inbreds were crossed in a diallel mating systemwith nonreciprocal cross (Table 1). The seed of 45 F1s weresown in separate trials under no-water-stress (WW)conditions in the rainy and late rainy seasons of 2006 andunder water stress (WS) in the summer season of 2007. Arandomized complete block design was used with threereplications. Each plot consisted of two rows 5.0 m longwith an interrow spacing of 0.75 m and intrarow spacing of0.20 m. Plant density was approximately 66 000 plants ha-1.The WS experiment was subjected to irrigation withdrawalto achieve severe drought stress during flowering(irrigation was stopped from the 9th leaf stage to two weeksafter mid-flowering). The WW condition received weeklyirrigation. Soil analyses of testing sites indicated a pH of
Combining Ability of Drought-Tolerant Maize Inbred Lines
Pichet Grudloyma, S. Thaitad, K. Papintu and S. KaewtienNakhon Sawan Field Crops Research Center, Takfa, Nakhon Sawan 60190, Thailand.E-mail: [email protected]
Abstract. Ten tropical maize inbreds were crossed in a diallel mating system to determine the combining ability andcompare the performance of the hybrids. Forty-five crosses were evaluated in separate trials for grain yield (GY),grain moisture content (MC) and kernel weight (KW) under water stress (WS) and no-water-stress (WW) conditionsat Tak Fa, Nakhon Sawan Field Crops Research Center, Thailand during 2006-2007. A randomized complete blockdesign was used with three replications. Water stress was managed by irrigation withdrawal, thereby achievingsevere drought stress during the flowering stage. The no-water-stress condition received weekly irrigation. TheGriffing (1956) method 4 showed that general combining ability (GCA) was significant for all the traits measured.Under the WS condition, GCA was more important than specific combining ability (SCA) for GY. Nei 452004 (0.603t ha-1), Nei 452026 (0.470 t ha-1) and Nei 452008 (0.323 t ha-1 ) had high GCA, which indicated that these inbredswould give high-yielding hybrids. High-yielding combinations including Nei 452008 ��'���$!�"�(�)$&!*����-1), Nei452008 ��'���$!�"�*�)$&"*����-1) and Nei 452004 ��'���$��"�(�)$&""����-1) also had high SCA. Under the WWcondition, GCA and SCA were significant. Nei 452017 (0.535 t ha-1), Nei 452004 (0.478 t ha-1), Nei 452026 (0.468 t ha-
1) and Nei 452008 (0.383 t ha-1) had high GCA. Nei 452004 also had high GCA for KW under WS and WW conditions.Nei 452026 was a parent of the three highest combinations with high positive SCA, including Nei 452026 (9.46 t ha-
1), Nei 452017 (9.41 t ha-1) and Nei 452029 (9.05 t ha-1). Considering the GCA and SCA effects for GY, Nei 452026,Nei 452008 and Nei 452004 represented good inbred lines for developing drought-tolerant hybrids.
Key words: Drought, maize, stress, combining ability, general combining ability, specific combining ability

346
������� �� �� ����� ������� ����� ���������������
7.3, organic matter content 2.87%, available P (Bray II) 61ppm and exchangeable K 166 ppm. One hundred and fiftykg ha-1 of N fertilizer was applied to each experiment.
Data collection and statistical analysis
Days from planting to anthesis (AD) and silking (SD)were calculated as per the date on which 50% of the plantshad begun shedding pollen or had silks emering from thehusk. The anthesis-silking interval (ASI) was obtained bysubtracting AD from SD. Grain yield (GY), expressed at15.0% moisture content (MC), was obtained from shelled
grain. The 100-kernel weight (KW) was obtained from 100kernels weight. The drought index (DI) was the ratio ofyield under stress to that under the no-stress condition,relative to the ratio of the mean yield of all the genotypesunder stress conditions to that under no-stress conditions.Analyses of variance were performed using the MSTATprocedure. Combining ability studies for GY, KW and MCwere conducted following the Griffing (1956)method 4 model1.
Results and DiscussionAnalyses of variance indicated significantly different
effects due to genotype for all of the traits measured. Dueto error variances of WW experiments were havinghomogeneity, they were combined before their combiningability was estimated. In this case, the degree of freedom(df) of variance was 220. Under WS conditions, the generalcombining ability (GCA) effect was more important thanthe specific combining ability (SCA) effect for GY. Nei452004 (0.603 tha-1),Nei452026(0.470 tha-1) andNei452008(0.323 t ha-1) were good combiners with positive GCA(Table2). It indicated that they would give high-yielding drought-tolerant hybrids. In contrast, Nei 452017 (-0.718 t ha-1), Nei452030 (-0.365 t ha-1) and Nei 412019 (-0.387 t ha-1) werepoor combiners with negative GCA. For grain moisturecontent, Nei452019 (2.358%), Nei 452004 (1.109%) and Nei452008 (2.703%) had positive GCA while Nei 452017 (-5.732%) and Nei 452029 (-0.834%) had negative GCA. Fourinbreds, Nei 412019 (0.980 g), Nei 452004 (5.951 g), Nei452010 (2.897g) and Nei452019 (1.474 g),gavehigh positiveGCA for KW. Under the WW treatment, GCA and SCAeffects were both significant. Nei 452017 (0.535 t ha-1), Nei452004 (0.478 tha-1),Nei452026(0.468 tha-1) andNei452008
Table 1. Pedigree and grain texture type of ten inbreds.
Name Pedigree Grain texture
Nei 412019 DK 888-14-1-2-1-BBBBB Orange yellow,semiflint
Nei 452004 KS 23(S)C2-190-1-2-1- Orange yellow,BBBBB semiflint
Nei 452008 Pio.3003-3-2-B-3-1-4-BBB Orange yellow,flint
Nei 452010 Exp.9477-35-2-B-1-2-1- Orange yellow,BBB semiflint
Nei 452017 (SW5(S)C3S2-76-2-4-1x Orange yellow,(GHC2S2-18-1-1-1)- flintB-B-4-1-BBB
Nei 452019 C-5134064-17-3-B-2-1-1- Orange yellow,BBB semiflint
Nei 452026 C-5124001-57-1-B-1-1-3- Orange yellow,BBB semiflint
Nei 452029 LY-AL-TOL(S) C1-22-2-2- Orange yellow,BBBBB flint
Nei 452030 NS-DR(S2)C1-60-1-4- Orange yellow,BBBBB flint
Nei 452031 SW1(RRS)C2-458-1-3-1-2- Orange yellow,BBBB flint
Table 2. Estimates of GCA effects for grain yield, moisture content and kernel weight of maize inbred lines under waterstress and no-water-stress conditions, 2006-2007.
Water stress No-water-stressInbred line
Grainyield Moisturecontent Kernel weight Grainyield Moisturecontent Kernel weight
Nei 412019 -0.387** 2.358** 0.980** -0.382** 0.750** 0.079Nei 452004 0.603** 1.109* 5.951** 0.478** 0.067 5.524**Nei 452008 0.323* 2.703** -0.849* 0.383** 1.438** -1.089**Nei 452010 0.170 0.459 2.897** -0.563** -0.306* 0.822**Nei 452017 -0.718** -5.752** -4.574** 0.535** -2.119** -0.015Nei 452019 0.234 -0.687 1.474** -0.486** -0.864** 1.213**Nei 452026 0.470** 0.381 -2.317** 0.468** 0.190 -2.893**Nei 452029 -0.180 -0.834* -1.522** -0.105 0.580** -1.020**Nei 452030 -0.365** 0.229 -2.662** -0.340** 0.630** -3.803**Nei 452031 -0.150 0.034 0.622 0.041 -0.368* 1.181**se[g(i)] 0.136 0.434 0.364 0.069 0.141 0.269se[g(i) - g(j)] 0.203 0.647 0.542 0.103 0.211 0.402
* Significant at 0.05 probability level. ** Significant at 0.01 probability level.
347
����� � ���� ����������� �������
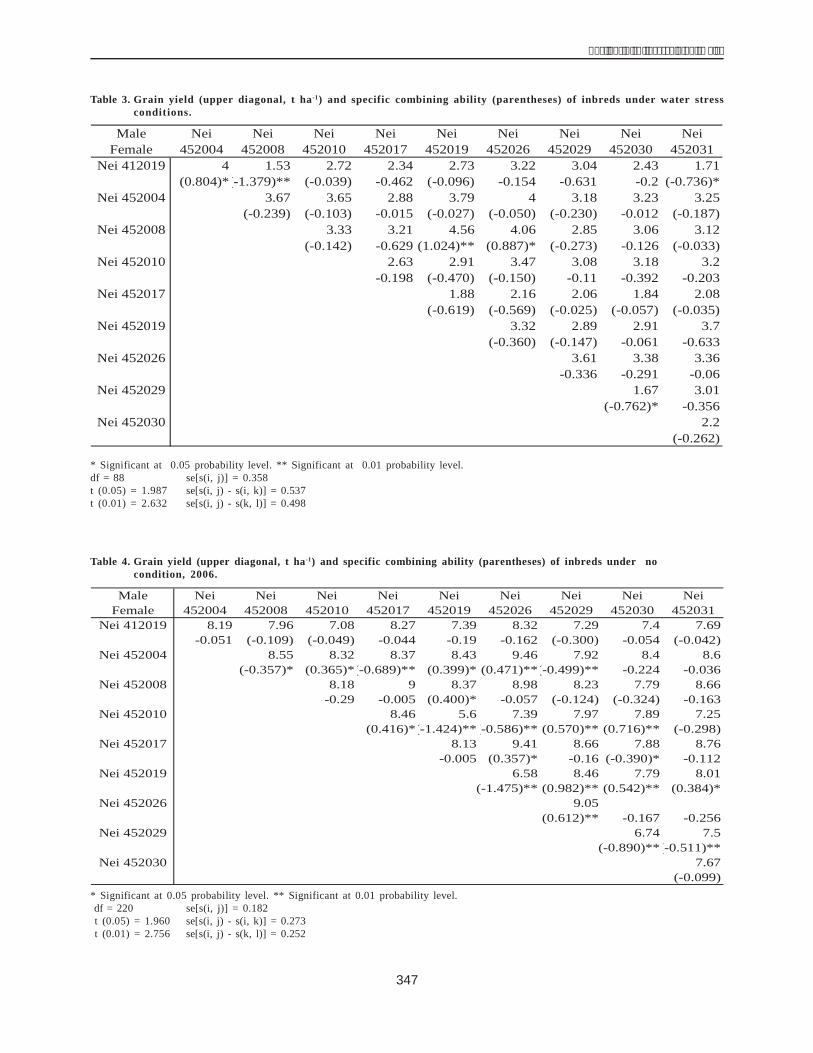
Table 3. Grain yield (upper diagonal, t ha-1) and specific combining ability (parentheses) of inbreds under water stressconditions.
Male Nei Nei Nei Nei Nei Nei Nei Nei NeiFemale 452004 452008 452010 452017 452019 452026 452029 452030 452031
Nei 412019 4 1.53 2.72 2.34 2.73 3.22 3.04 2.43 1.71(0.804)*(-1.379)** (-0.039) -0.462 (-0.096) -0.154 -0.631 -0.2 (-0.736)*
Nei 452004 3.67 3.65 2.88 3.79 4 3.18 3.23 3.25(-0.239) (-0.103) -0.015 (-0.027) (-0.050) (-0.230) -0.012 (-0.187)
Nei 452008 3.33 3.21 4.56 4.06 2.85 3.06 3.12(-0.142) -0.629 (1.024)** (0.887)* (-0.273) -0.126 (-0.033)
Nei 452010 2.63 2.91 3.47 3.08 3.18 3.2-0.198 (-0.470) (-0.150) -0.11 -0.392 -0.203
Nei 452017 1.88 2.16 2.06 1.84 2.08(-0.619) (-0.569) (-0.025) (-0.057) (-0.035)
Nei 452019 3.32 2.89 2.91 3.7(-0.360) (-0.147) -0.061 -0.633
Nei 452026 3.61 3.38 3.36-0.336 -0.291 -0.06
Nei 452029 1.67 3.01(-0.762)* -0.356
Nei 452030 2.2(-0.262)
* Significant at 0.05 probability level. ** Significant at 0.01 probability level.df = 88 se[s(i, j)] = 0.358t (0.05) = 1.987 se[s(i, j) - s(i, k)] = 0.537t (0.01) = 2.632 se[s(i, j) - s(k, l)] = 0.498
Table 4. Grain yield (upper diagonal, t ha-1) and specific combining ability (parentheses) of inbreds under no����������condition, 2006.
Male Nei Nei Nei Nei Nei Nei Nei Nei NeiFemale 452004 452008 452010 452017 452019 452026 452029 452030 452031
Nei 412019 8.19 7.96 7.08 8.27 7.39 8.32 7.29 7.4 7.69-0.051 (-0.109) (-0.049) -0.044 -0.19 -0.162 (-0.300) -0.054 (-0.042)
Nei 452004 8.55 8.32 8.37 8.43 9.46 7.92 8.4 8.6(-0.357)* (0.365)*(-0.689)** (0.399)* (0.471)**(-0.499)** -0.224 -0.036
Nei 452008 8.18 9 8.37 8.98 8.23 7.79 8.66-0.29 -0.005 (0.400)* -0.057 (-0.124) (-0.324) -0.163
Nei 452010 8.46 5.6 7.39 7.97 7.89 7.25(0.416)*(-1.424)**(-0.586)** (0.570)** (0.716)** (-0.298)
Nei 452017 8.13 9.41 8.66 7.88 8.76-0.005 (0.357)* -0.16 (-0.390)* -0.112
Nei 452019 6.58 8.46 7.79 8.01(-1.475)** (0.982)** (0.542)** (0.384)*
Nei 452026 9.05(0.612)** -0.167 -0.256
Nei 452029 6.74 7.5(-0.890)**(-0.511)**
Nei 452030 7.67(-0.099)
* Significant at 0.05 probability level. ** Significant at 0.01 probability level.df = 220 se[s(i, j)] = 0.182t (0.05) = 1.960 se[s(i, j) - s(i, k)] = 0.273t (0.01) = 2.756 se[s(i, j) - s(k, l)] = 0.252
348
������� �� �� ����� ������� ����� ���������������
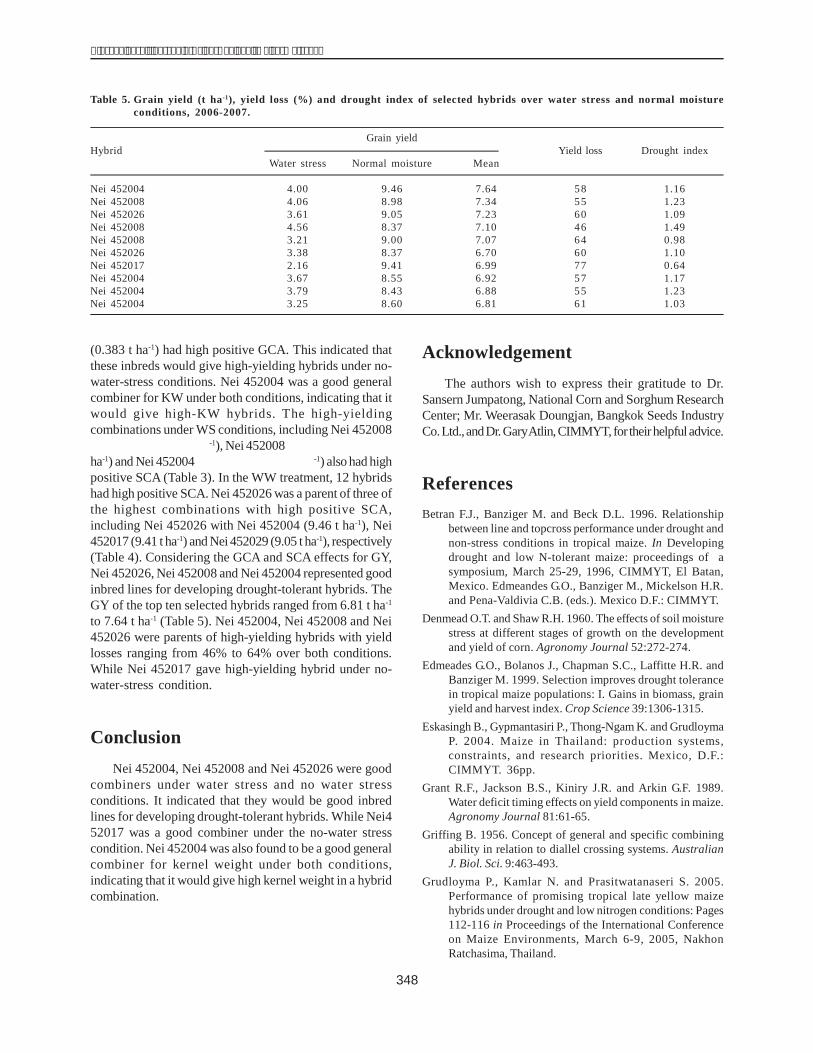
(0.383 t ha-1) had high positive GCA. This indicated thatthese inbreds would give high-yielding hybrids under no-water-stress conditions. Nei 452004 was a good generalcombiner for KW under both conditions, indicating that itwould give high-KW hybrids. The high-yieldingcombinations under WS conditions, including Nei 452008'�����1 �*�,��1� ��%���-1), Nei 452008'�����1 �*����1�*��%ha-1) and Nei 452004'�����1��*�,��1�**�%���-1) also had highpositive SCA (Table 3). In the WW treatment, 12 hybridshad high positive SCA. Nei 452026 was a parent of three ofthe highest combinations with high positive SCA,including Nei 452026 with Nei 452004 (9.46 t ha-1), Nei452017 (9.41 t ha-1) and Nei 452029 (9.05 t ha-1), respectively(Table 4). Considering the GCA and SCA effects for GY,Nei 452026, Nei 452008 and Nei 452004 represented goodinbred lines for developing drought-tolerant hybrids. TheGY of the top ten selected hybrids ranged from 6.81 t ha-1
to 7.64 t ha-1 (Table 5). Nei 452004, Nei 452008 and Nei452026 were parents of high-yielding hybrids with yieldlosses ranging from 46% to 64% over both conditions.While Nei 452017 gave high-yielding hybrid under no-water-stress condition.
ConclusionNei 452004, Nei 452008 and Nei 452026 were good
combiners under water stress and no water stressconditions. It indicated that they would be good inbredlines for developing drought-tolerant hybrids. While Nei452017 was a good combiner under the no-water stresscondition. Nei 452004 was also found to be a good generalcombiner for kernel weight under both conditions,indicating that it would give high kernel weight in a hybridcombination.
AcknowledgementThe authors wish to express their gratitude to Dr.
Sansern Jumpatong, National Corn and Sorghum ResearchCenter; Mr. Weerasak Doungjan, Bangkok Seeds IndustryCo.Ltd.,andDr.GaryAtlin,CIMMYT, for theirhelpfuladvice.
ReferencesBetran F.J., Banziger M. and Beck D.L. 1996. Relationship
between line and topcross performance under drought andnon-stress conditions in tropical maize. In Developingdrought and low N-tolerant maize: proceedings of asymposium, March 25-29, 1996, CIMMYT, El Batan,Mexico. Edmeandes G.O., Banziger M., Mickelson H.R.and Pena-Valdivia C.B. (eds.). Mexico D.F.: CIMMYT.
Denmead O.T. and Shaw R.H. 1960. The effects of soil moisturestress at different stages of growth on the developmentand yield of corn. Agronomy Journal 52:272-274.
Edmeades G.O., Bolanos J., Chapman S.C., Laffitte H.R. andBanziger M. 1999. Selection improves drought tolerancein tropical maize populations: I. Gains in biomass, grainyield and harvest index. Crop Science 39:1306-1315.
Eskasingh B., Gypmantasiri P., Thong-Ngam K. and GrudloymaP. 2004. Maize in Thailand: production systems,constraints, and research priorities. Mexico, D.F.:CIMMYT. 36pp.
Grant R.F., Jackson B.S., Kiniry J.R. and Arkin G.F. 1989.Water deficit timing effects on yield components in maize.Agronomy Journal 81:61-65.
Griffing B. 1956. Concept of general and specific combiningability in relation to diallel crossing systems. AustralianJ. Biol. Sci. 9:463-493.
Grudloyma P., Kamlar N. and Prasitwatanaseri S. 2005.Performance of promising tropical late yellow maizehybrids under drought and low nitrogen conditions: Pages112-116 in Proceedings of the International Conferenceon Maize Environments, March 6-9, 2005, NakhonRatchasima, Thailand.
Table 5. Grain yield (t ha-1), yield loss (%) and drought index of selected hybrids over water stress and normal moistureconditions, 2006-2007.
Grain yieldHybrid Yield loss Drought index
Water stress Normal moisture Mean
Nei 452004 '����� 1 �*�� 4.00 9.46 7.64 58 1.16Nei 452008 '����� 1 �*�� 4.06 8.98 7.34 55 1.23Nei 452026 '����� 1 �*�, 3.61 9.05 7.23 60 1.09Nei 452008 '����� 1 �*�, 4.56 8.37 7.10 46 1.49Nei 452008 '����� 1 �*�0 3.21 9.00 7.07 64 0.98Nei 452026 '����� 1 �*�* 3.38 8.37 6.70 60 1.10Nei 452017 '����� 1 �*�� 2.16 9.41 6.99 77 0.64Nei 452004 '����� 1 �**3 3.67 8.55 6.92 57 1.17Nei 452004 '����� 1 �*�, 3.79 8.43 6.88 55 1.23Nei 452004 '����� 1 �*�� 3.25 8.60 6.81 61 1.03
349
����� � ���� ����������� �������
IntroductionDrought in 1990-1993 caused the most devastating
damage to corn production in the past 26 years in thePhilippines. Production loss was estimated at 478 000 tand valued at PhP 2.1 billion. It led to a shortage in thelocal corn supply and caused an increase in prices oflivestock feeds and meat and poultry products. Then in1997-1998 the occurrence of El Ni4����&$�����$����"����%decrease in corn production. Yellow corn yield from thedry-season crop declined by 37%����#�����%���������#�fell by 27%, thereby decreasing production by 42% and38%, respectively.
Development of drought-tolerant varieties is one wayto increase grain production and minimize losses due todrought. However, field screening is difficult due totyphoons during the rainy season and sometimes duringthe dry season. A rapid screening method like the sandculture technique makes evaluation of corn genotypespossible even during wet/rainy season, therebyhasteningbreeding work.
Materials and MethodThe greenhouse screening was conducted during the
rainy season of 2006 at the Physiology Division of theInstitute of Plant Breeding, University of the Philippines
Los Ba4�$�� /��&���� 5��#����$��6� %�%�#� �"� �1� ����genotypes (Table 1) were considered for evaluation. Theexperiment was laid out in a split-split plot in a randomizedcomplete block design (RCBD) with three replications. Themain plot factor was the water level (W1 = irrigated; W2 =drought-imposed) while the subplot factor was thenitrogen level (N1 = 0 kg N ha-1, N2 = 120 kg N ha-1). Areplicate comprised of 4 trays which contained 24 corngenotypes. These genotypes were designated as the sub-subplot factor and were randomized as per the tray.
The sand culture technique, which uses sand placedin styrofoam trays as the growth medium, was used toevaluate the performance of the 24 corn genotypes in termsof nitrogen-use efficiency and plant dry matter underirrigated and drought conditions (Fig. 1). The fertilizersused were urea (46-0-0) for nitrogen, solophos (0-18-0) forphosphorus and muriate of potash (0-0-60) for potassium.Urea was dissolved in such a way that each corn entrywould receive 10mL of the assigned nutrient solutionequivalent to the intended N rate. Solophos and muriate ofpotash were mixed with the sand before planting. The sandin all trays was irrigated to field capacity after planting.Drought stress was imposed one week after seedlingestablishment while the control plants received watercontinuously. Data on NUE and total plant weight, lateroven dried, were taken after the imposition of the watertreatment. The data gathered was analyzed using theanalysis of variance for split-split plots in an RCBD.
Screening of Corn Genotypes for Drought Tolerance Usingthe Sand Culture Technique
VillamorA. Ladia Jr.,Artemio M. Salazar andApolonio M. OcampoInstitute of Plant Breeding ��)�����������)#&$%����7589)�)���)�##�����"�6����&#%&���University of the Philippines Los Ba4�$��:5/8���)�##�����/�$�8�4�$��/��&����5��#����$���!��#;�[email protected]
Abstract. Drought is a major constraint to corn production in the Philippines. Production loss in 1990-93 wasestimated at 478 000 t and valued at PhP 2.1 billion. It resulted in a shortage in the local supply and caused anincrease in prices of livestock feeds and meat and poultry products. Development of drought-tolerant varieties is oneway to increase grain production and minimize losses due to drought. The objective of this study was massscreening and evaluation of corn genotypes for drought tolerance under greenhouse conditions. Sand culture, arapid screening method for corn genotypes against drought stress, was used in this experiment. The top-performinggenotypes identified in terms of plant dry matter production were CML 453, CML 172, ARMP THAI 16 and CA 03116.These genotypes will be validated on-farm and recommended for consideration in generating populations with anemphasis on drought tolerance. Our study also showed that screening corn germplasm using the sand culturetechnique is effective. Evaluation could thus be done even during the rainy season, which would help hastenbreeding work.
Key words: Corn genotypes, drought tolerance, sand culture technique
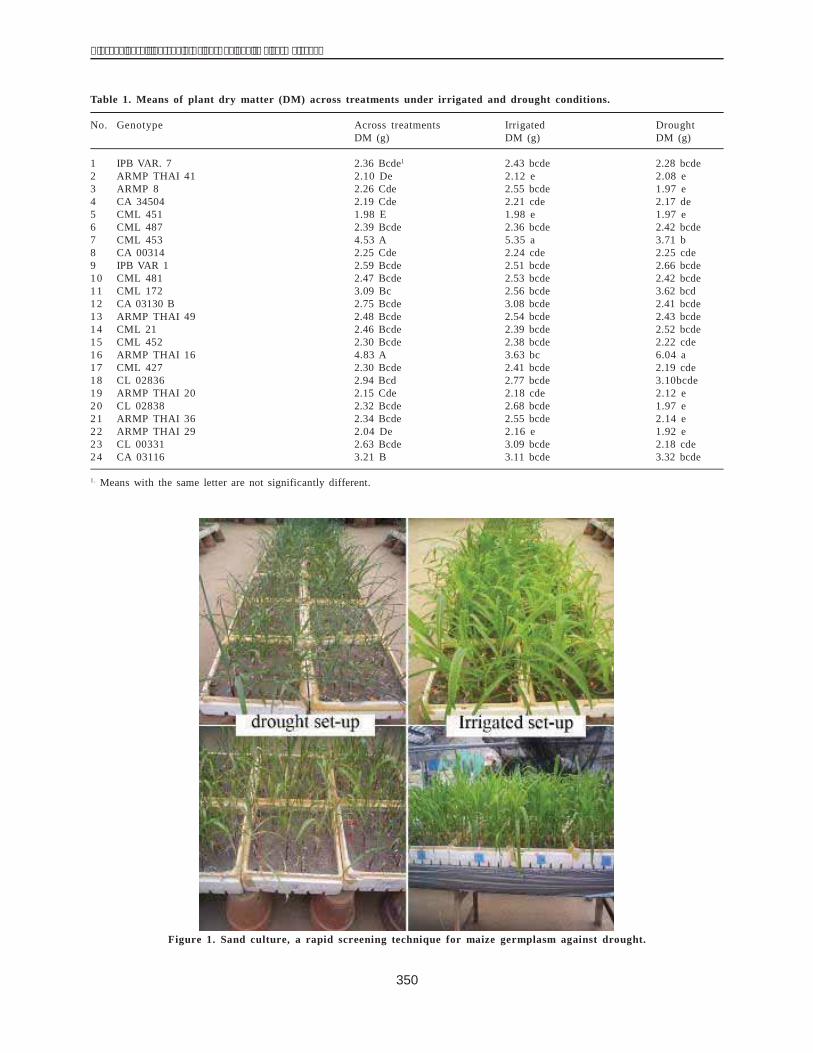
350
������� �� �� ����� ������� ����� ���������������
Table 1. Means of plant dry matter (DM) across treatments under irrigated and drought conditions.
No. Genotype Across treatments Irrigated DroughtDM (g) DM (g) DM (g)
1 IPB VAR. 7 2.36 Bcde1 2.43 bcde 2.28 bcde2 ARMP THAI 41 2.10 De 2.12 e 2.08 e3 ARMP 8 2.26 Cde 2.55 bcde 1.97 e4 CA 34504 2.19 Cde 2.21 cde 2.17 de5 CML 451 1.98 E 1.98 e 1.97 e6 CML 487 2.39 Bcde 2.36 bcde 2.42 bcde7 CML 453 4.53 A 5.35 a 3.71 b8 CA 00314 2.25 Cde 2.24 cde 2.25 cde9 IPB VAR 1 2.59 Bcde 2.51 bcde 2.66 bcde10 CML 481 2.47 Bcde 2.53 bcde 2.42 bcde11 CML 172 3.09 Bc 2.56 bcde 3.62 bcd12 CA 03130 B 2.75 Bcde 3.08 bcde 2.41 bcde13 ARMP THAI 49 2.48 Bcde 2.54 bcde 2.43 bcde14 CML 21 2.46 Bcde 2.39 bcde 2.52 bcde15 CML 452 2.30 Bcde 2.38 bcde 2.22 cde16 ARMP THAI 16 4.83 A 3.63 bc 6.04 a17 CML 427 2.30 Bcde 2.41 bcde 2.19 cde18 CL 02836 2.94 Bcd 2.77 bcde 3.10bcde19 ARMP THAI 20 2.15 Cde 2.18 cde 2.12 e20 CL 02838 2.32 Bcde 2.68 bcde 1.97 e21 ARMP THAI 36 2.34 Bcde 2.55 bcde 2.14 e22 ARMP THAI 29 2.04 De 2.16 e 1.92 e23 CL 00331 2.63 Bcde 3.09 bcde 2.18 cde24 CA 03116 3.21 B 3.11 bcde 3.32 bcde
1. Means with the same letter are not significantly different.
Figure 1. Sand culture, a rapid screening technique for maize germplasm against drought.

351
����� � ���� ����������� �������
Results and DiscussionAnalysis of variance showed that there was a highly
significant interaction between the levels of water andgenotypes in terms of plant dry matter (DM). Also, themain effects of nitrogen and genotype were found to behighly significant, indicating the existence of widevariability among the genotypes. However, there were nosignificant differences for the different treatments in termsof N-use efficiency (NUE). Regardless of nitrogen andwater levels, the top ten genotypes in terms of DMproduction wereARMP THAI 16 (4.83 g), CML 453 (4.53g), CA03116 (3.21 g), CML172 (3.09 g), CL02836 (2.94 g),CA03130 B (2.75 g), CL00331 (2.63 g), IPB Var 1 (2.59 g),ARMP THAI 49 (2.48 g) and CML 481 (2.47 g). GenotypeCML 451 hadthe lowest DM value of 1.98 g. Under theirrigated treatment, CML453 (5.35 g),ARMPTHAI 16 (3.63g) and CA 03116 (3.11 g) were the top performers.GenotypesARMPTHAI 16, CML453, CA03116 and CML172 were also the top performers under the drought set-up. In other words, these four genotypes were able toproduce a high amount of dry matter even in the presenceof drought stress.
The genotypes exhibiting high plant dry matter underdrought conditions like ARMP THAI 16, CML 453, CA03116 and CML 172 are therefore recommended forconsideration in generating populations with emphasis ondrought tolerance. It should be noted, however, that thetop-performing genotypes identified in this study must bevalidated on-farm. Our study shows that screening of corngenotypes using the sand culture technique is effectiveand allows evaluation of genotypes even during the rainyseason.
ReferencesBanziger M. and Lafitte H.R. 1997. Efficiency of secondary
traits for improving maize for low-N target environments.Crop Science 37:1110-1117.
Banziger M., Edmeades G.O., Beck B. and Bellon M. 2000.Breeding for drought and nitrogen stress tolerance in maize:from theory to practice. Mexico, D.F.: CIMMYT.
Ludlow M.M. and Muchow R.C. 1990. A critical evaluation oftraits for improving crop yields in water-limitedenvironments. Advanced Agronomy 43:107-153.
Sarobol E., Chowchong S. and Lim-Aroon S. 2005. Agronomicpractices for stress tolerance in grain crops: pages 1-6 inproceedings of the International Conference on MaizeAdaptation to Marginal Environments, March 6-9, 2005,Nakhon Ratchasima, Thailand.
352
������� �� �� ����� ������� ����� ���������������
IntroductionSilage maize is the most important source of livestock
feed as it is rich in nutrition. It is cultivated over almost 3million hm2 in China. However, it is severely constrainedby drought, which is the crop�$�!�$%� �!��%��%� �-��%��stress factor. Over 70% of China�$������"��#�$������""��%��by drought, suffering a production loss of over 15 millionteach year. The hilly region of southwestern China isfrequently and severely affected by seasonal drought.According to data pertaining to the period 1951-1995, thefrequency of droughts in the spring, summer and middlesummer was 58%, 76% and 67% respectively. In the hillyregion of Sichuan, this was 89%, 92% and 62%,respectively. The year 2006 saw Sichuan being affected bythe most serious drought since the foundation of thePeople�$�<�&-#����"�)������2��������%������!���#�$$�"��!it reached RMB 12.57 billion, the loss to agriculture beingRMB 10.8 billion. The corn crop is particularly seriouslyaffected by drought in China.When drought occurs,farmers take recourse to silage maize in China. Therefore,there is a need to build a reliable quantitative and research-based indicator system to identify drought resistance insilage maize. A coefficient of drought tolerance is the keyelement in this effort.
Under drought conditions, solar energy utilizationthrough photosynthesis decreases. Drought also playsan important role in the aging of plant organs. Aging firstmanifests itself in the leaves, which turn yellow (Yuan etal. 2002). The aging of the root system (including the stem)is a sign of the aging of the whole plant (Shen 2001). The
key indices influencing drought tolerance in silage maizeunder conditions of drought stress in the hilly regionshave not been worked out yet. Our study aims at identifyingthe key tolerance indices influencing yield of silage maize,and at providing a reliable theoretical basis for drought-resistance breeding in illy, arid and similar areas. Towardthis objective, we carried out diallel crossing, as per theGriffing method 2, of six inbred lines of drought-resistantsilage maize.
Materials and MethodThe six silage maize inbred lines chosen for this study
had different drought-resistance characteristics (Table 1).Match two groups of Griffing diallel crossing patters, inwhich orthogonal F1 combination with number of a =p*(p+1)/2 = 6*96+1) = 21 and add parents. They were sownin an experimental field in Jianyang in Sichuan provincewhere there is a Water Saving Key Lab. The experimenthad three replications on plots in a random design. Theexperimental plots had four rows of 320 cm each with aspacing of 67 cm. Fifteen plants were planted within eachrow, giving a density of 4800 plants per hm2.
The experiment consisted of two treatments: plotssubjected to drought stress and plots supplied irrigation.The plots in the drought-stress treatment were rainfed andgiven one irrigation of 30 cubic meters. The plots in theirrigation treatment were rainfed too but given fiveirrigations at the seedling stage, elongating stage, earlydifferentiating stage and milk-ripe stage. The total irrigation
Screening for Drought-Resistance Key Indices and GeneticResearch in Silage Maize
He Wen-zhu, LiuYong-hong� ���������������������Crop Research Institute, Sichuan Academy ofAgriculture Science, Sichuan, Chengdu 610066, China.
Abstract. By using six silage maize inbred lines with different drought-tolerance characteristics in diallel crossing asper the Griffing method 2, we determined that the key indexes for drought-resistance coefficients of kernel yield arethe root cap ratio, leaf area, chlorophyll content and rate of photosynthesis, that have an established regressionequation of the drought coefficients of kernel yield from path analysis. We also estimated the general combiningability (GCA), special combining ability (SCA) and other relevant genetic parameters of the material. The resultsshow that GCA is obviously higher than SCA for the five characteristics and that the genetic accumulating effect isdominant. The hB
2 (%) for the rate of photosynthesis was 93.07% at most, and the hN2 (%) for the grain yield drought
index was 18.62% at most. The drought-resistance coefficients of kernel yield are more effective when selected inan earlier generation.
Key words: Silage maize, drought tolerance, key indices, genetic laws
353
����� � ���� ����������� �������
dosage per mu (a measurement of area) was 150 cubicmetres, each irrigation being of 30 cubic metres. The waterdosage was precisely controlled with a drip irrigationsystem. Recommended cultivation practices for silage maizewere followed.
Sampling. We sampled 10 plants from each treatedsampling area to carry out tests for the chosencharacteristics
Sampling schedule. Recordings of the leaf area,chlorophyll content and photosynthetic rate were taken atthe spinning stage; other indicators were measured at theharvest stage.
Measurement of chlorophyll content. We directlymeasured the chlorophyll content of each treated spikeleaf with a Spad apparatus made in Japan.
Separating samples. The collected samples werecleaned and the root, stem, green leaves, yellow leavesand ears were separated. Their gross weight was recorded.
Fixing, drying and weighing. The samples (root, stem,green leaves, yellow leaves and ears) were fixed in water at105=)�"�����#"������&������%�����������%�0*>3*=)�"����>�days till their weight remained stable. The plant organswere weighed with an electronic balance of 0.0001definition.
Indicator-measuring methods. The photosyntheticrate (Pn) was measured using a BAU photosyntheticsystem. Measurement of the leaf area was done as per themethod of Zhang (1992). The drought index (DI) of yieldswas calculated as per (Fu et al. 2003)
(Ya/YM)/Ya[CK]/Ym[CK]
in which Ya and Ym represent the yields of the twotreatments, drought-stress and irrigated conditions,respectively; and Ya[CK] and Ym[CK]] represent the yieldsof the two treatments involving Chuandan 13 (a kind ofseed) used as control.
Index-calculating methods. The following relationswere used:
� root/top = root dry weight/soil-above dry weight
� ear/dry matter = fruit and are dry weight/whole plantdry weight
� stem/leaf = stem/whole leaf dry weight
� green leaf/yellow leaf = green leaf dry weight/yellowleaf dry weight
� green leaf/dry matter = green leaf dry weight/wholeplant dry matter weight
� stem/dry matter = stem dry matter weight/whole plantdry matter weight
� root/dry matter = root dry matter weight/whole plantdry matter weightData processing. The data was analyzed on the
DPS8.01 platform.
Statistical analysis
First, multiple regression analysis was done using thekernel drought-resistance coefficients as the targetcharacters and comparing the importance of each characterindex to corn drought resistance. Then, a covarianceanalysis was performed on the screened key drought-resistance indices according to model I/model II designedin random groups. The significance of differences wasrecorded. Lastly, the combining abilities of model I/modelII were determined by the Griffing method 4. Further, thegenetic parameters of the group were estimated on thisbasis.
Results
Path analysis of drought-resistance keyindicators
The efficiency of silage maize drought resistancedepends on several characters acting together. But overall,it should be measured in terms of the drought-resistancecoefficients of kernel yield. After we did the stepwiseregression analysis on leaf area (X1), ear/dry matter ratio(X2), root cap ratio (X3), stem/leaf ratio (X4), stem/wholeplant dry matter ratio (X5), chlorophyll content (X6), rate ofphotosynthesis (X7), green leaf/yellow leaf ratio (X8), greenleaf/whole plant dry matter ratio (X9), root/whole plant drymatter ratio (X10) and the drought-resistance coefficientsof drought-treated kernel yield (Y), we foundthat (Fig. 1) ifwe estimate Y with a linear regression equation, the linearrelation is clear (R = 0.9316), and its value can reach 86.79%.This shows that leaf area, root cap ratio, chlorophyll contentand photosynthetic rate are the main component factorsof drought-resistance coefficients of kernel yield. Theregression equation was as follows:
Y = 1.376 + 0.000036X1+ 5.872X3���������6�������7
The analysis shows that both X1 and X3 are positivedirect actions in which the root cap ratio (P0.3 = 0.850) is the
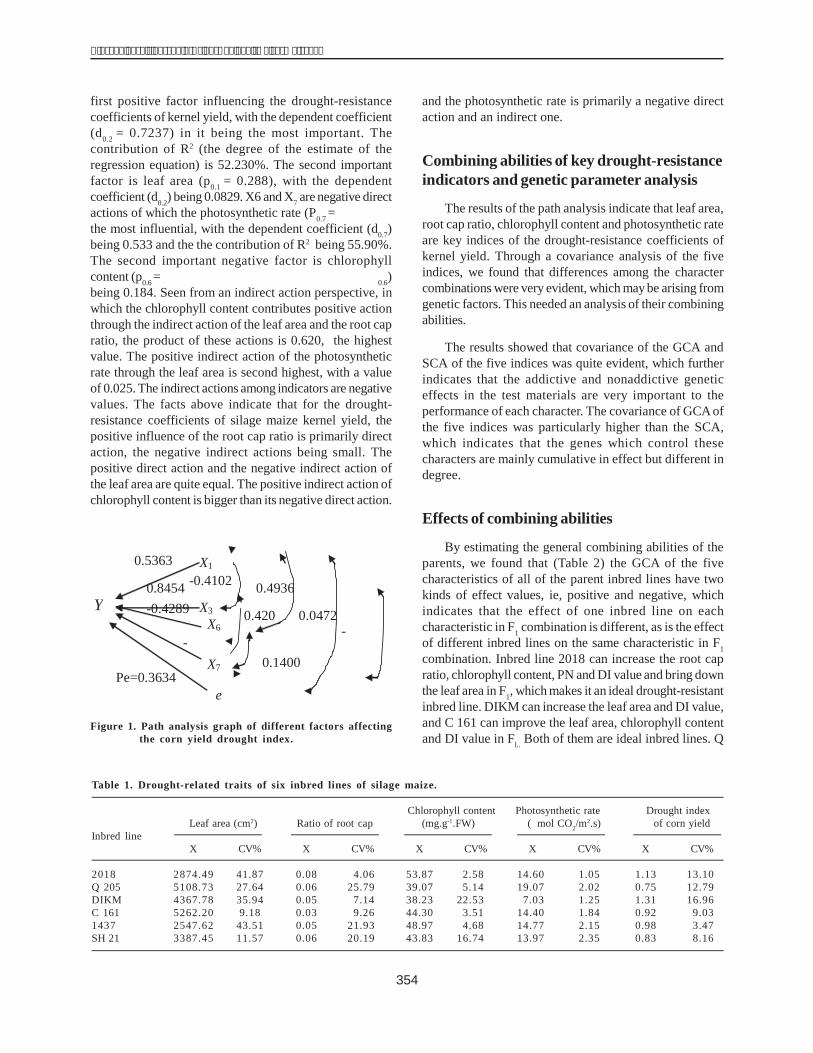
354
������� �� �� ����� ������� ����� ���������������
first positive factor influencing the drought-resistancecoefficients of kernel yield, with the dependent coefficient(d0.2 = 0.7237) in it being the most important. Thecontribution of R2 (the degree of the estimate of theregression equation) is 52.230%. The second importantfactor is leaf area (p0.1 = 0.288), with the dependentcoefficient (d0.2) being 0.0829. X6 and X7 are negative directactions of which the photosynthetic rate (P0.7 = �������� the most influential, with the dependent coefficient (d0.7)being 0.533 and the the contribution of R2 being 55.90%.The second important negative factor is chlorophyllcontent (p0.6 = �����������������������������������������0.6)being 0.184. Seen from an indirect action perspective, inwhich the chlorophyll content contributes positive actionthrough the indirect action of the leaf area and the root capratio, the product of these actions is 0.620, the highestvalue. The positive indirect action of the photosyntheticrate through the leaf area is second highest, with a valueof 0.025. The indirect actions among indicators are negativevalues. The facts above indicate that for the drought-resistance coefficients of silage maize kernel yield, thepositive influence of the root cap ratio is primarily directaction, the negative indirect actions being small. Thepositive direct action and the negative indirect action ofthe leaf area are quite equal. The positive indirect action ofchlorophyll content is bigger than its negative direct action.
and the photosynthetic rate is primarily a negative directaction and an indirect one.
Combining abilities of key drought-resistanceindicators and genetic parameter analysis
The results of the path analysis indicate that leaf area,root cap ratio, chlorophyll content and photosynthetic rateare key indices of the drought-resistance coefficients ofkernel yield. Through a covariance analysis of the fiveindices, we found that differences among the charactercombinations were very evident, which may be arising fromgenetic factors. This needed an analysis of their combiningabilities.
The results showed that covariance of the GCA andSCA of the five indices was quite evident, which furtherindicates that the addictive and nonaddictive geneticeffects in the test materials are very important to theperformance of each character. The covariance of GCA ofthe five indices was particularly higher than the SCA,which indicates that the genes which control thesecharacters are mainly cumulative in effect but different indegree.
Effects of combining abilities
By estimating the general combining abilities of theparents, we found that (Table 2) the GCA of the fivecharacteristics of all of the parent inbred lines have twokinds of effect values, ie, positive and negative, whichindicates that the effect of one inbred line on eachcharacteristic in F1 combination is different, as is the effectof different inbred lines on the same characteristic in F1combination. Inbred line 2018 can increase the root capratio, chlorophyll content, PN and DI value and bring downthe leaf area in F1, which makes it an ideal drought-resistantinbred line. DIKM can increase the leaf area and DI value,and C 161 can improve the leaf area, chlorophyll contentand DI value in Fl.. Both of them are ideal inbred lines. Q
Figure 1. Path analysis graph of different factors affectingthe corn yield drought index.
0.5363
0.8454-0.4289
Pe=0.3634
-0.4102
X6
X7
X3
X1
0.420
0.1400
0.4936
-0.0472
-
e
Y
Table 1. Drought-related traits of six inbred lines of silage maize.
Chlorophyll content Photosynthetic rate Drought indexLeaf area (cm2) Ratio of root cap (mg.g-1.FW) (�mol CO2/m2.s) of corn yield
Inbred lineX CV% X CV% X CV% X CV% X CV%
2018 2874.49 41.87 0.08 4.06 53.87 2.58 14.60 1.05 1.13 13.10Q 205 5108.73 27.64 0.06 25.79 39.07 5.14 19.07 2.02 0.75 12.79DIKM 4367.78 35.94 0.05 7.14 38.23 22.53 7.03 1.25 1.31 16.96C 161 5262.20 9.18 0.03 9.26 44.30 3.51 14.40 1.84 0.92 9.031437 2547.62 43.51 0.05 21.93 48.97 4.68 14.77 2.15 0.98 3.47SH 21 3387.45 11.57 0.06 20.19 43.83 16.74 13.97 2.35 0.83 8.16
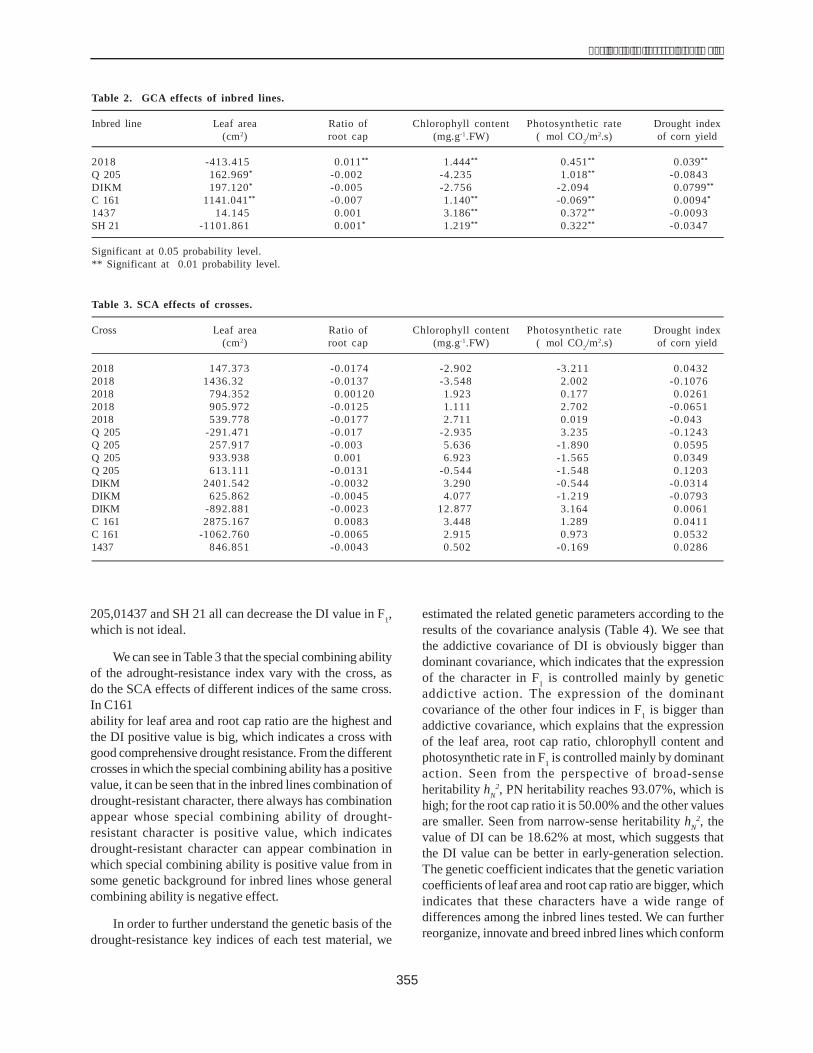
355
����� � ���� ����������� �������
205,01437 and SH 21 all can decrease the DI value in F1,which is not ideal.
We can see in Table 3 that the special combining abilityof the adrought-resistance index vary with the cross, asdo the SCA effects of different indices of the same cross.In C161 �������������������������� ���� ��������� !����"ability for leaf area and root cap ratio are the highest andthe DI positive value is big, which indicates a cross withgood comprehensive drought resistance. From the differentcrosses in which the special combining ability has a positivevalue, it can be seen that in the inbred lines combination ofdrought-resistant character, there always has combinationappear whose special combining ability of drought-resistant character is positive value, which indicatesdrought-resistant character can appear combination inwhich special combining ability is positive value from insome genetic background for inbred lines whose generalcombining ability is negative effect.
In order to further understand the genetic basis of thedrought-resistance key indices of each test material, we
estimated the related genetic parameters according to theresults of the covariance analysis (Table 4). We see thatthe addictive covariance of DI is obviously bigger thandominant covariance, which indicates that the expressionof the character in F1 is controlled mainly by geneticaddictive action. The expression of the dominantcovariance of the other four indices in F1 is bigger thanaddictive covariance, which explains that the expressionof the leaf area, root cap ratio, chlorophyll content andphotosynthetic rate in F1 is controlled mainly by dominantaction. Seen from the perspective of broad-senseheritability hN
2, PN heritability reaches 93.07%, which ishigh; for the root cap ratio it is 50.00% and the other valuesare smaller. Seen from narrow-sense heritability hN
2, thevalue of DI can be 18.62% at most, which suggests thatthe DI value can be better in early-generation selection.The genetic coefficient indicates that the genetic variationcoefficients of leaf area and root cap ratio are bigger, whichindicates that these characters have a wide range ofdifferences among the inbred lines tested. We can furtherreorganize, innovate and breed inbred lines which conform
Table 2. GCA effects of inbred lines.
Inbred line Leaf area Ratio of Chlorophyll content Photosynthetic rate Drought index(cm2) root cap (mg.g-1.FW) (�mol CO2/m2.s) of corn yield
2018 -413.415 0.011** 1.444** 0.451** 0.039**
Q 205 162.969* -0.002 -4.235 1.018** -0.0843DIKM 197.120* -0.005 -2.756 -2.094 0.0799**
C 161 1141.041** -0.007 1.140** -0.069** 0.0094*
1437 14.145 0.001 3.186** 0.372** -0.0093SH 21 -1101.861 0.001* 1.219** 0.322** -0.0347
Significant at 0.05 probability level.** Significant at 0.01 probability level.
Table 3. SCA effects of crosses.
Cross Leaf area Ratio of Chlorophyll content Photosynthetic rate Drought index(cm2) root cap (mg.g-1.FW) (�mol CO2/m2.s) of corn yield
2018 ��#� �$ 147.373 -0.0174 -2.902 -3.211 0.04322018 ��%&'( 1436.32 -0.0137 -3.548 2.002 -0.10762018 ��)� �*� 794.352 0.00120 1.923 0.177 0.02612018 �� ��� 905.972 -0.0125 1.111 2.702 -0.06512018 ��+,�� 539.778 -0.0177 2.711 0.019 -0.043Q 205 ��%&'( -291.471 -0.017 -2.935 3.235 -0.1243Q 205 ��)��*� 257.917 -0.003 5.636 -1.890 0.0595Q 205 �� ��� 933.938 0.001 6.923 -1.565 0.0349Q 205 ��+,�� 613.111 -0.0131 -0.544 -1.548 0.1203DIKM ��)� �*� 2401.542 -0.0032 3.290 -0.544 -0.0314DIKM �� ��� 625.862 -0.0045 4.077 -1.219 -0.0793DIKM ��+,�� -892.881 -0.0023 12.877 3.164 0.0061C 161 �� ��� 2875.167 0.0083 3.448 1.289 0.0411C 161 ��+,�� -1062.760 -0.0065 2.915 0.973 0.05321437 ��+,�� 846.851 -0.0043 0.502 -0.169 0.0286
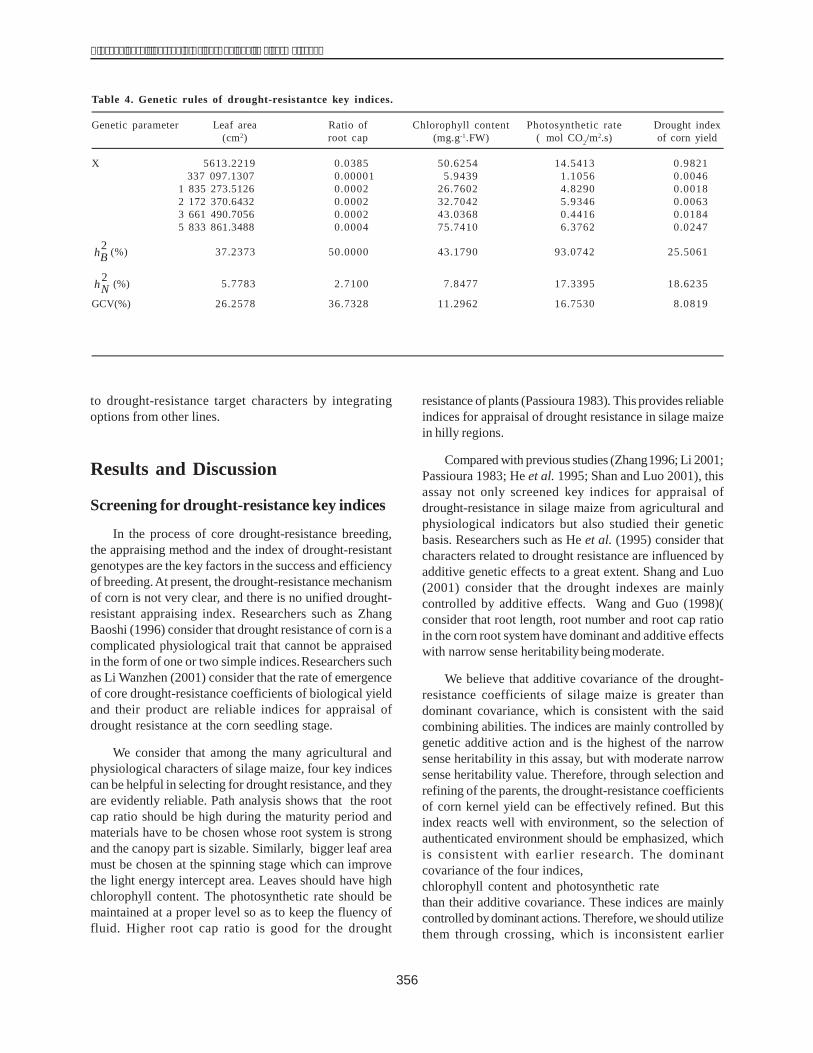
356
������� �� �� ����� ������� ����� ���������������
to drought-resistance target characters by integratingoptions from other lines.
Results and Discussion
Screening for drought-resistance key indices
In the process of core drought-resistance breeding,the appraising method and the index of drought-resistantgenotypes are the key factors in the success and efficiencyof breeding.At present, the drought-resistance mechanismof corn is not very clear, and there is no unified drought-resistant appraising index. Researchers such as ZhangBaoshi (1996) consider that drought resistance of corn is acomplicated physiological trait that cannot be appraisedin the form of one or two simple indices.Researchers suchas Li Wanzhen (2001) consider that the rate of emergenceof core drought-resistance coefficients of biological yieldand their product are reliable indices for appraisal ofdrought resistance at the corn seedling stage.
We consider that among the many agricultural andphysiological characters of silage maize, four key indicescan be helpful in selecting for drought resistance, and theyare evidently reliable. Path analysis shows that the rootcap ratio should be high during the maturity period andmaterials have to be chosen whose root system is strongand the canopy part is sizable. Similarly, bigger leaf areamust be chosen at the spinning stage which can improvethe light energy intercept area. Leaves should have highchlorophyll content. The photosynthetic rate should bemaintained at a proper level so as to keep the fluency offluid. Higher root cap ratio is good for the drought
resistance of plants (Passioura 1983). This provides reliableindices for appraisal of drought resistance in silage maizein hilly regions.
Compared with previous studies (Zhang1996; Li 2001;Passioura 1983; He et al. 1995; Shan and Luo 2001), thisassay not only screened key indices for appraisal ofdrought-resistance in silage maize from agricultural andphysiological indicators but also studied their geneticbasis. Researchers such as He et al. (1995) consider thatcharacters related to drought resistance are influenced byadditive genetic effects to a great extent. Shang and Luo(2001) consider that the drought indexes are mainlycontrolled by additive effects. Wang and Guo (1998)(consider that root length, root number and root cap ratioin the corn root system have dominant and additive effectswith narrow sense heritability being moderate.
We believe that additive covariance of the drought-resistance coefficients of silage maize is greater thandominant covariance, which is consistent with the saidcombining abilities. The indices are mainly controlled bygenetic additive action and is the highest of the narrowsense heritability in this assay, but with moderate narrowsense heritability value. Therefore, through selection andrefining of the parents, the drought-resistance coefficientsof corn kernel yield can be effectively refined. But thisindex reacts well with environment, so the selection ofauthenticated environment should be emphasized, whichis consistent with earlier research. The dominantcovariance of the four indices, ��������-����-��������-�����chlorophyll content and photosynthetic rate �� � �!�""�-than their additive covariance. These indices are mainlycontrolled by dominant actions. Therefore, we should utilizethem through crossing, which is inconsistent earlier
Table 4. Genetic rules of drought-resistantce key indices.
Genetic parameter Leaf area Ratio of Chlorophyll content Photosynthetic rate Drought index(cm2) root cap (mg.g-1.FW) (�mol CO2/m2.s) of corn yield
X 5613.2219 0.0385 50.6254 14.5413 0.9821337 097.1307 0.00001 5.9439 1.1056 0.0046
1 835 273.5126 0.0002 26.7602 4.8290 0.00182 172 370.6432 0.0002 32.7042 5.9346 0.00633 661 490.7056 0.0002 43.0368 0.4416 0.01845 833 861.3488 0.0004 75.7410 6.3762 0.0247
2�Bh (%) 37.2373 50.0000 43.1790 93.0742 25.5061
2�Nh (%) 5.7783 2.7100 7.8477 17.3395 18.6235
GCV(%) 26.2578 36.7328 11.2962 16.7530 8.0819

357
����� � ���� ����������� �������
research. It is the result of selecting different crosses ordifferent ecological conditions, or it is the result of adeviation in experimental result due to different droughtintensity.
Our study indicates that in order to obtain better kernelyield of silage maize under drought stress, we must fullyconsider the reaction among genes. We also need to payattention to the selection of the parents. What needs to beemphasized is that the same cross has different geneticeffects for different indices. Therefore, quantitative heredityof the core drought resistance needs further detailedresearch, o as to determine its regularity and provideguidance for drought-resistance breeding or drought-resistance genetic improvement.
ReferencesKuche C. 1999. Assessment on the raising value of beef cattle
and cow from different crossing silage maize. ForeignAnimal Husbandry Science and Technology 26(4):15-18.
Edmeades G.O. 1993. Causes for silk delay in a lowland tropicalmaize population.Crop Science 33(5):1029-1035.
Yang F.Y. 2004. Climate condition assessment for maizeproduction: Pages 73-79 in China Climate ImpactAssessment. Beijing: Meteorology Press.
2000.48-52�China Agricultural Statistics from AgriculturalDepartment. Beijing: ChinaAgricultural Press, 2000. P:48-52.
Drought in Sichuan in 2006 from the Disaster Relief office ofSichuan[M], Chengdu: Sichuan science and technologypress. 2006. P:5-6.
Li Y. 1993. Assessing method and indexes of plant drought-resistance�Agricultural Research in Drought Regions11:91-99.
Lidon F.C��� ������� ���������� � � et al. 2001. Photo-inhibition in Chilling Stressed Wheat and Maize.Photosynthetic 39(2):161-166.
Yuan Z., PanA. and Jian Z. 2002. Senescence delay characteristicsof transgenic vegetables. Journal of Plant Physiology andMolecular Biology 28(5):379-384.
Shen C. 2001. Plant Senescence Physiology and MolecularBiology. Beijing, China: China Agricultural Press.
Zhang X. 1992. Physiological research methods of plants.Beijing, China: China Agricultural Press.
Fu F., Zhou S. and Rong Y. 2003. Multiple regression analysisof the drought-resistant indexes of corn. Crops Journal3:468-472.
Tang Q. and Feng M. 2002. Practical statistic analysis and itsDPS Data Processing System]. Beijing: Science Press.
Gao Z. 1986. Quantitative genetics�� �������� �������University Press.
Zhang B., Xu S. and Song F. 1996. Research on the assessingmethod of the drought-resistant genes of corn and itsindexes��Corn Science 3:19-22.
Li W., Fu F. and Yuan Z. 2001. Research on the AssessingMethod of the Drought Resistance of Corn on Seedlingstage. Southwest Agricultural Journal 3:29-32.
Passioura J.,B. 1983. Roots and drought resistance. AgriculturalWater Management 7:265-280.
He S., Yan Q. and Song G. 1995. Selection of the drought genesand species characters of corn. Corn Science 3(2):18-20.
Shan J. and Luo S. 2001. Genetic analysis of kernel yield anddrought-resistant indices of corn in condition of waterinsufficiency�Science and Technology of Agriculture6:17-19.
Wang Z., Li X. and Guo Q. 1998. Drought-Resistant Heritageand Breeding of Corn��Corn Science 3:9-13.
358
������� �� �� ����� ������� ����� ���������������
IntroductionDrylands account for 20.27% (14.9 million ha) of total
farm land in Indonesia (BPS 2006). The eastern part ofIndonesia has the largest area affected by drought,including East and West Nusa Tenggara (NTT, NTB) andSoutheast Maluku where rainfall is low. Total rainfall duringthe rainy season in these regions varies from 500 mm to1100 mm. Erratic rainfall and high variability in soil fertilitycause wide yield variability across years and locations.The grain yield loss suffered due to drought during theflowering and seed-filling stages is about 25%. Further,there is variability of yield losses among genotypes withina crop (Dahlan et al. 1996). In NTT for instance themaximum yield of maize (opv.Arjuna) under dry conditionswas 2.0 t ha-1 (Yasin et al. 1990). Edmeades et al. (1992)reported that in developing countries yield losses per yearunder drought conditions could go up to 60%.
Anoman-1, a white-grain variety from a CIMMYTpopulation (Tuxpeno Sequia cycle 6) was released in 2005in Indonesia after improvement by one cycle to C7. S1families were generated at ICERI, Maros and screeningwas done at two sites to select families with droughttolerance. Some morpho-phenotypic traits of this varietwere observed during experiments conducted for the releaseof the variety. Trials of the selected families were carriedout in target areas, particularly in the eastern part ofIndonesia like NTT, NTB and Southest Maluku. In thisarea, farmers commonly use white maize as their staple
food. The objective of this paper was to study some morho-phenotypic traits like means of variables, deviation ofmeans, heritability and simple correlation of the traits.
Morpho-phenotypic Traits
The experiment was conducted in a randomizedcomplete block design with three replications for evt, anda simple lattice design with two replications for selectedsuperior families in South Sulawesi (Bajeng, Jeneponto)and East Java (Muneng-Probolinggo). The climate of theexperimental farm was of the type E3, ie, 3-5 wet monthswithrainfall >100 mm per month (Oldeman dan Darmiyati1977). Germplasm was selected from the populationTuxpeno Sequia C6 to improve families by S1 to recombineafter screening under water stress conditions. The droughttreatment involved stoppage of water from the tasselingstage (50 days) until harvesting time. The normal watertreatment had normal supply of water until harvest. Theselected families�����������������������������������per the drought index formula of Edmeades et al. (1992).The means ( �!� �������� �"������ (#x), coefficient ofvaritaion (cv) and heritability (h2) of morpho-phenotypictraits were recorded and their simple coefficient ofcorrelation (r) was computed by
r = [$%iyi-($%i)($&i)/n]/?'$%i2-($%i)
2/n-($&i2)($&i)
2/n].
The test of significance used degrees freedom (df) = n-2(Gomez and Gomez 1984).
Study of Morpho-Phenotypic Traits of Grain White Anoman-1under Drought Conditions
M Yasin HG.Arifuddin, Ismail, and Fransiskus MisiICERI, Maros, Indonesia.
Abstract. Drought in Indonesia is a universal abiotic stress condition. Anoman-1 (Tuxpeno sequia-C7), a white-grain, open-pollinated variety (OPV), was selected for its drought tolerance during the critical flowering stage andsuccessfully released in Indonesia in 2006. Anoman-1 was improved one cycle from a CIMMYT population. Somemorpho-phenotypic traits of this variety such as means (+,� ����������� -�.���� ���� �����-���� )�,�� �������� ��� ��means (/x,) and coefficient heritability (h2) of Anoman-1 were studied under normal and drought stress conditions.Two sets of experiments were conducted: (1) under normal water availability conditions at the Bajeng and Munengexperimental farms;�����)�,������.������������������������������.����)0�������������,&�1�������������.that Anoman-1 yielded a maximum of 152.0% more under normal water condictions than drought conditions. Theproblem of rolling leaves under drought conditions was scored 3.52. There were significant differences relating tothe anthesis-silking interval (ASI): it was six days under drought conditions, and three days under normal waterconditions. As regards reaction to major diseases, the two locations had the similar scores for maydis leaf blight andrust. The yield of Anoman-1 had a positive correlation to ear height, tasseling and silking under drought conditions.
Key words: Drought, correlation, Anoman-1
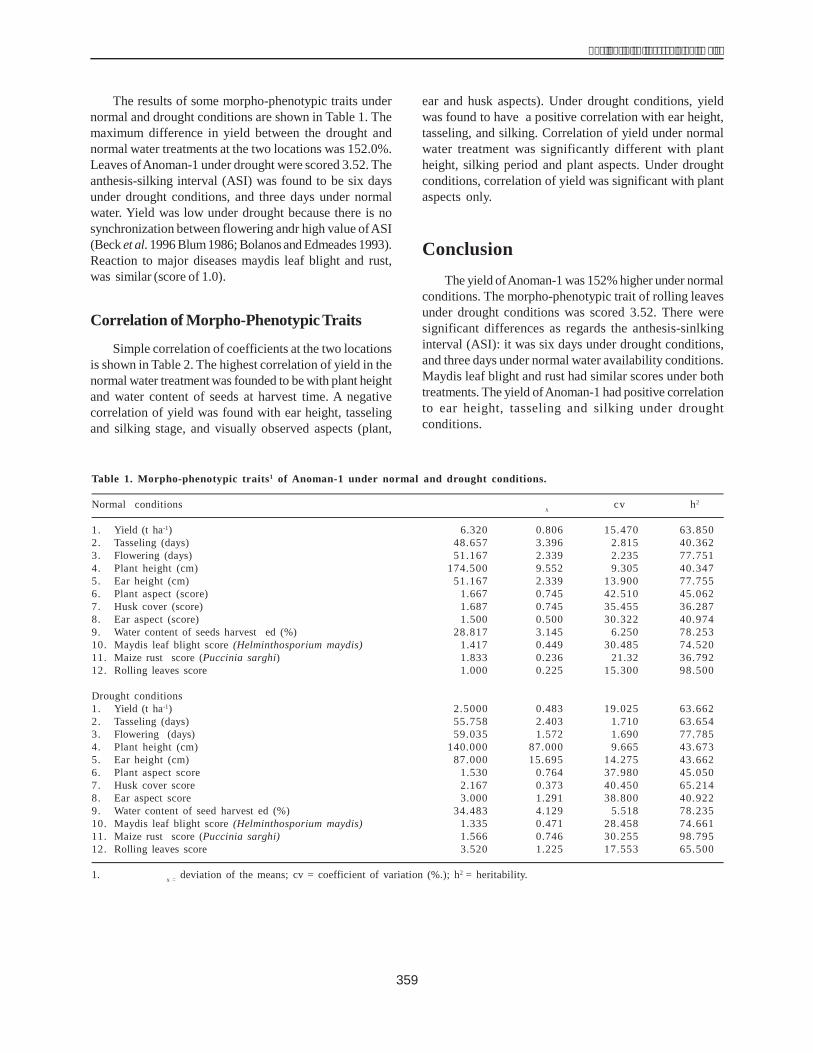
359
����� � ���� ����������� �������
The results of some morpho-phenotypic traits undernormal and drought conditions are shown in Table 1. Themaximum difference in yield between the drought andnormal water treatments at the two locations was 152.0%.Leaves ofAnoman-1 under drought were scored 3.52. Theanthesis-silking interval (ASI) was found to be six daysunder drought conditions, and three days under normalwater. Yield was low under drought because there is nosynchronization between flowering andr high value ofASI(Beck et al. 1996 Blum 1986; Bolanos and Edmeades 1993).Reaction to major diseases maydis leaf blight and rust,was similar (score of 1.0).
Correlation of Morpho-Phenotypic Traits
Simple correlation of coefficients at the two locationsis shown in Table 2. The highest correlation of yield in thenormal water treatment was founded to be with plant heightand water content of seeds at harvest time. A negativecorrelation of yield was found with ear height, tasselingand silking stage, and visually observed aspects (plant,
ear and husk aspects). Under drought conditions, yieldwas found to have a positive correlation with ear height,tasseling, and silking. Correlation of yield under normalwater treatment was significantly different with plantheight, silking period and plant aspects. Under droughtconditions, correlation of yield was significant with plantaspects only.
ConclusionThe yield ofAnoman-1 was 152% higher under normal
conditions. The morpho-phenotypic trait of rolling leavesunder drought conditions was scored 3.52. There weresignificant differences as regards the anthesis-sinlkinginterval (ASI): it was six days under drought conditions,and three days under normal water availability conditions.Maydis leaf blight and rust had similar scores under bothtreatments. The yield ofAnoman-1 had positive correlationto ear height, tasseling and silking under droughtconditions.
Table 1. Morpho-phenotypic traits1 of Anoman-1 under normal and drought conditions.
Normal conditions #x cv h2
1. Yield (t ha-1) 6.320 0.806 15.470 63.8502. Tasseling (days) 48.657 3.396 2.815 40.3623. Flowering (days) 51.167 2.339 2.235 77.7514. Plant height (cm) 174.500 9.552 9.305 40.3475. Ear height (cm) 51.167 2.339 13.900 77.7556. Plant aspect (score) 1.667 0.745 42.510 45.0627. Husk cover (score) 1.687 0.745 35.455 36.2878. Ear aspect (score) 1.500 0.500 30.322 40.9749. Water content of seeds harvest ed (%) 28.817 3.145 6.250 78.25310. Maydis leaf blight score (Helminthosporium maydis) 1.417 0.449 30.485 74.52011. Maize rust score (Puccinia sarghi) 1.833 0.236 21.32 36.79212. Rolling leaves score 1.000 0.225 15.300 98.500
Drought conditions1. Yield (t ha-1) 2.5000 0.483 19.025 63.6622. Tasseling (days) 55.758 2.403 1.710 63.6543. Flowering (days) 59.035 1.572 1.690 77.7854. Plant height (cm) 140.000 87.000 9.665 43.6735. Ear height (cm) 87.000 15.695 14.275 43.6626. Plant aspect score 1.530 0.764 37.980 45.0507. Husk cover score 2.167 0.373 40.450 65.2148. Ear aspect score 3.000 1.291 38.800 40.9229. Water content of seed harvest ed (%) 34.483 4.129 5.518 78.23510. Maydis leaf blight score (Helminthosporium maydis) 1.335 0.471 28.458 74.66111. Maize rust score (Puccinia sarghi) 1.566 0.746 30.255 98.79512. Rolling leaves score 3.520 1.225 17.553 65.500
1. � (�)���*� #x = deviation of the means; cv = coefficient of variation (%.); h2 = heritability.
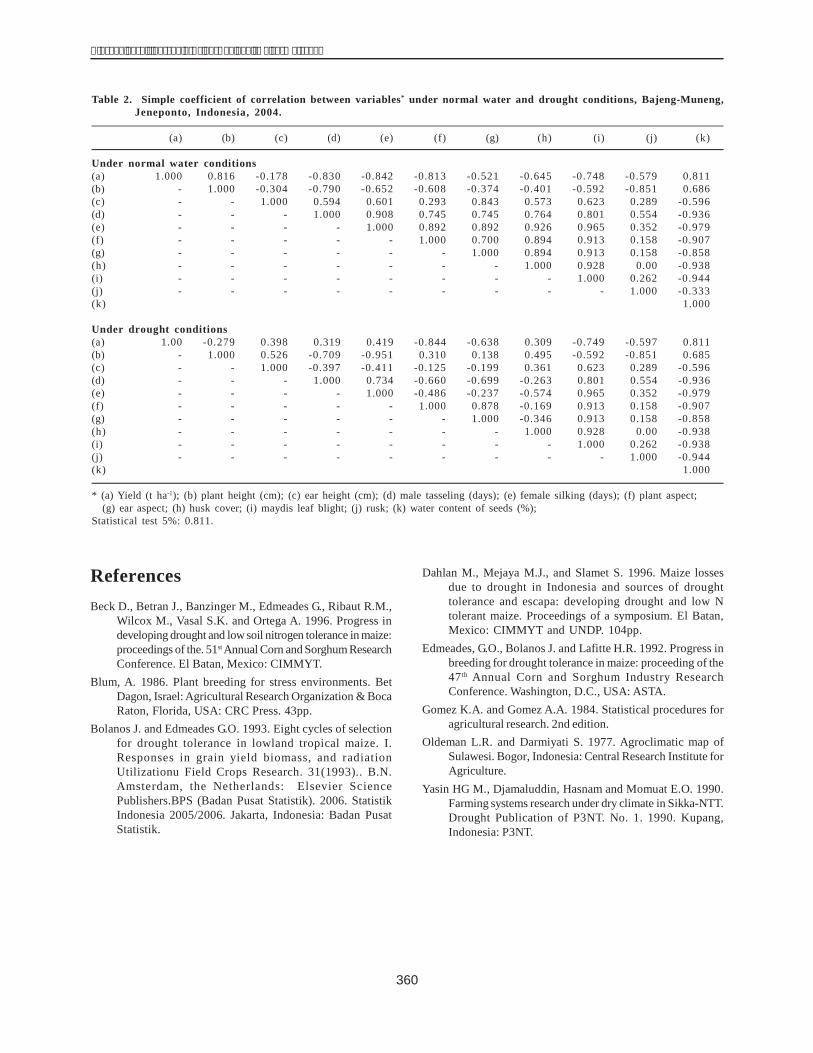
360
������� �� �� ����� ������� ����� ���������������
ReferencesBeck D., Betran J., Banzinger M., Edmeades G., Ribaut R.M.,
Wilcox M., Vasal S.K. and Ortega A. 1996. Progress indeveloping drought and low soil nitrogen tolerance in maize:proceedings of the. 51st Annual Corn and Sorghum ResearchConference. El Batan, Mexico: CIMMYT.
Blum, A. 1986. Plant breeding for stress environments. BetDagon, Israel: Agricultural Research Organization & BocaRaton, Florida, USA: CRC Press. 43pp.
Bolanos J. and Edmeades G.O. 1993. Eight cycles of selectionfor drought tolerance in lowland tropical maize. I.Responses in grain yield biomass, and radiationUtilizationu Field Crops Research. 31(1993).. B.N.Amsterdam, the Netherlands: Elsevier SciencePublishers.BPS (Badan Pusat Statistik). 2006. StatistikIndonesia 2005/2006. Jakarta, Indonesia: Badan PusatStatistik.
Dahlan M., Mejaya M.J., and Slamet S. 1996. Maize lossesdue to drought in Indonesia and sources of droughttolerance and escapa: developing drought and low Ntolerant maize. Proceedings of a symposium. El Batan,Mexico: CIMMYT and UNDP. 104pp.
Edmeades, G.O., Bolanos J. and Lafitte H.R. 1992. Progress inbreeding for drought tolerance in maize: proceeding of the47th Annual Corn and Sorghum Industry ResearchConference. Washington, D.C., USA: ASTA.
Gomez K.A. and Gomez A.A. 1984. Statistical procedures foragricultural research. 2nd edition.
Oldeman L.R. and Darmiyati S. 1977. Agroclimatic map ofSulawesi. Bogor, Indonesia: Central Research Institute forAgriculture.
Yasin HG M., Djamaluddin, Hasnam and Momuat E.O. 1990.Farming systems research under dry climate in Sikka-NTT.Drought Publication of P3NT. No. 1. 1990. Kupang,Indonesia: P3NT.
Table 2. Simple coefficient of correlation between variables* under normal water and drought conditions, Bajeng-Muneng,Jeneponto, Indonesia, 2004.
(a) (b) (c) (d) (e) (f) (g) (h) (i) (j) (k)
Under normal water conditions(a) 1.000 0.816 -0.178 -0.830 -0.842 -0.813 -0.521 -0.645 -0.748 -0.579 0.811(b) - 1.000 -0.304 -0.790 -0.652 -0.608 -0.374 -0.401 -0.592 -0.851 0.686(c) - - 1.000 0.594 0.601 0.293 0.843 0.573 0.623 0.289 -0.596(d) - - - 1.000 0.908 0.745 0.745 0.764 0.801 0.554 -0.936(e) - - - - 1.000 0.892 0.892 0.926 0.965 0.352 -0.979(f) - - - - - 1.000 0.700 0.894 0.913 0.158 -0.907(g) - - - - - - 1.000 0.894 0.913 0.158 -0.858(h) - - - - - - - 1.000 0.928 0.00 -0.938(i) - - - - - - - - 1.000 0.262 -0.944(j) - - - - - - - - - 1.000 -0.333(k) 1.000
Under drought conditions(a) 1.00 -0.279 0.398 0.319 0.419 -0.844 -0.638 0.309 -0.749 -0.597 0.811(b) - 1.000 0.526 -0.709 -0.951 0.310 0.138 0.495 -0.592 -0.851 0.685(c) - - 1.000 -0.397 -0.411 -0.125 -0.199 0.361 0.623 0.289 -0.596(d) - - - 1.000 0.734 -0.660 -0.699 -0.263 0.801 0.554 -0.936(e) - - - - 1.000 -0.486 -0.237 -0.574 0.965 0.352 -0.979(f) - - - - - 1.000 0.878 -0.169 0.913 0.158 -0.907(g) - - - - - - 1.000 -0.346 0.913 0.158 -0.858(h) - - - - - - - 1.000 0.928 0.00 -0.938(i) - - - - - - - - 1.000 0.262 -0.938(j) - - - - - - - - - 1.000 -0.944(k) 1.000
* (a) Yield (t ha-1); (b) plant height (cm); (c) ear height (cm); (d) male tasseling (days); (e) female silking (days); (f) plant aspect;(g) ear aspect; (h) husk cover; (i) maydis leaf blight; (j) rusk; (k) water content of seeds (%);
Statistical test 5%: 0.811.
361
����� � ���� ����������� �������
Maize Pathology in Asia: Opportunities and Challenges forBreeding Disease-Resistant Maize
George MahukuGlobal Maize Program, International Maize and Wheat Improvement Center (CIMMYT),Km. 45 Carr. Mexico-Veracruz. Col El Batan. Texcoco-Edo Mexico, Mexico CP 56130.
Abstract. More than 12% of maize productivity is lost to diseases annually in Asia. Sources of resistance to severalimportant diseases have been identified in advanced CIMMYT germplasm but the genetics of resistance is poorlyunderstood. Disease resistance in maize is reported to be conditioned by both major (qualitative) genes and minor(quantitative) genes or quantitative trait loci (QTL). To date, 437 quantitative disease resistance loci or dQTL, 17major resistance genes and 25 resistance gene analogs (RGAs) associated with resistance to 11 maize diseaseshave been described in a few of these sources. QTL mapping studies conducted in maize thus far have providedinformation on the genetic architecture of disease resistance including the number, location and action of chromosomalsegments conditioning the trait. The availability of the maize genome sequence offers new opportunities for adetailed understanding of the organization and architecture of disease resistance, fine mapping of QTL, validatingcandidate genes and identifying effective molecular markers to improve disease resistance. However, full exploitationof genomic approaches and information to develop and release maize cultivars more resilient to diseases will only bepossible through (i) a deeper integration of genomic approaches with conventional breeding methodologies; (ii) acapacity to reliably and accurately phenotype diseases on a large scale; and (iii) a sound multidisciplinary knowledgeof the biochemical and physiological processes determining crop yield and its stability under different disease stressregimes. A major emphasis for the Asian region will have to include the collaborative evaluation of promising sourcesof resistance for specific traits using standardized protocols that would allow harmonization of disease phenotypicdata for use in identifying the most promising resistance genes, validating molecular markers liked to effective dQTLand major resistance genes and incorporation of the most promising sources in improvement activities.
IntroductionThe importance of maize to sustainable development
cannot be overstated. With a production of 0.78 billion t in2007, and providing approximately 12% of the caloriesconsumed worldwide, maize is the most important staplefood crop in the world (FAO 2007; http://faostat.fao.org/).Maize is utilized as food for human consumption, as feedfor livestock and as a raw material in industry (FAO 1992).Recent projections indicate that by 2020, global maizedemand will increase by 50% (IFPRI 2008; Pingali andPandey 2001). The increase will be acute inAsia where it isexpected to rise by 87% from 162 million t in 1995 to 303million t in 2020 (IFPRI 2000). Rising incomes, populationgrowth, urbanization and expanding energy demand arethe fators responsible for much of this increase. Rapideconomic growth and increased consumer purchasingpower are shifting food demand away from traditionalstaples and toward higher-value foods like meat and dairyproducts. This dietary shift is leading to increased demandfor grains used to feed livestock (Wada et al. 2008).
The increasing diversion of maize toward biofuelproduction (especially in the USA, currently the largestmaize exporter, where 30% of maize production will gotoward ethanol in 2008) rather than into world food and
feed markets (IFPRI 2008) means that Asia cannot rely onimports. The growing demand for maize in Asia will haveto be met through accelerated production at home, eitherthrough an augmentation of crop area or increasedadoption and use of high-yielding varieties. As land islimited in most countries, increased production will haveto come from adoption of new technologies. Efforts toreduce maize losses due to disease through adoption ofresistant crop varieties, pesticides and other culturalpractices offer tremendous opportunities for increasingand stabilizing maize productivity. This paper aims athighlighting opportunities and challenges of using hostresistance to manage maize diseases and identifies someresearchable areas to alleviate losses due to diseases.
Economic Importance of Diseases inMaize Production
Diseases are important constraints to maize productionin Asia. Losses from disease vary according to disease,occurrence, environmental conditions, host genotype andtime (growth stage of the crop) of infection. Loss estimatesin Asia have been put at around 12% (Table 1) but actuallosses can be as high as 80%. For example, in 1987, an
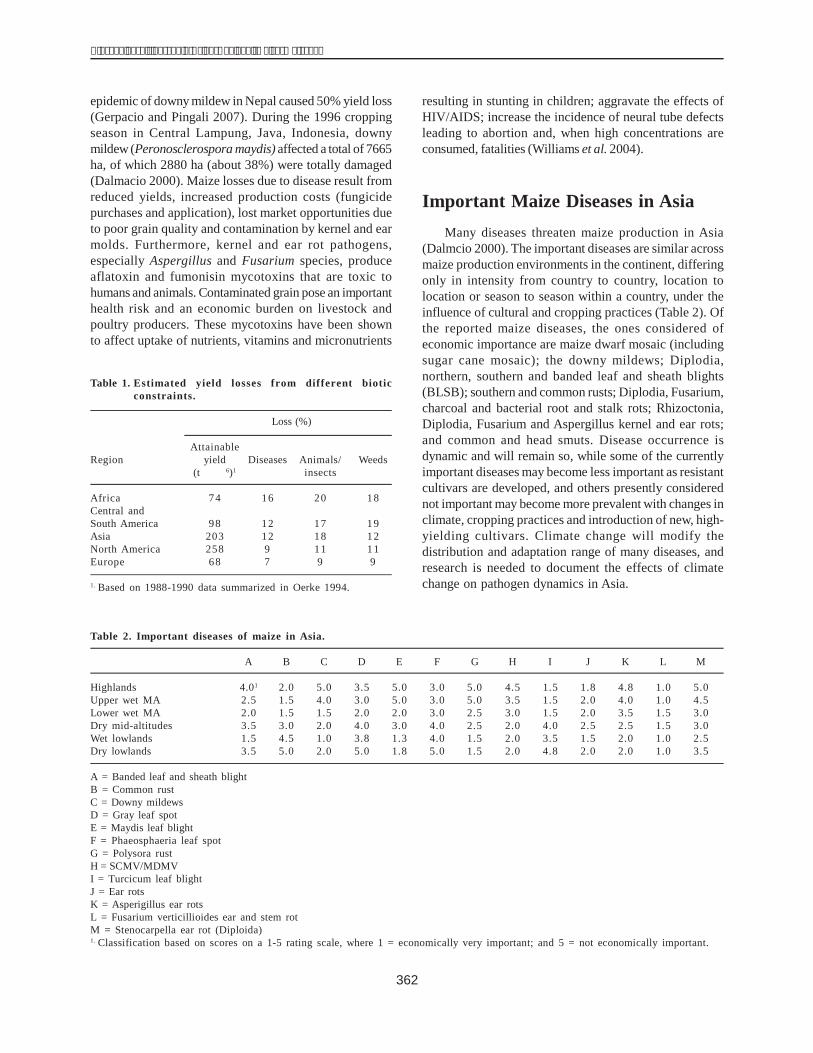
362
������� �� �� ����� ������� ����� ���������������
epidemic of downy mildew in Nepal caused 50% yield loss(Gerpacio and Pingali 2007). During the 1996 croppingseason in Central Lampung, Java, Indonesia, downymildew (Peronosclerospora maydis) affected a total of 7665ha, of which 2880 ha (about 38%) were totally damaged(Dalmacio 2000). Maize losses due to disease result fromreduced yields, increased production costs (fungicidepurchases and application), lost market opportunities dueto poor grain quality and contamination by kernel and earmolds. Furthermore, kernel and ear rot pathogens,especially Aspergillus and Fusarium species, produceaflatoxin and fumonisin mycotoxins that are toxic tohumans and animals. Contaminated grain pose an importanthealth risk and an economic burden on livestock andpoultry producers. These mycotoxins have been shownto affect uptake of nutrients, vitamins and micronutrients
resulting in stunting in children; aggravate the effects ofHIV/AIDS; increase the incidence of neural tube defectsleading to abortion and, when high concentrations areconsumed, fatalities (Williams et al. 2004).
Important Maize Diseases in AsiaMany diseases threaten maize production in Asia
(Dalmcio 2000). The important diseases are similar acrossmaize production environments in the continent, differingonly in intensity from country to country, location tolocation or season to season within a country, under theinfluence of cultural and cropping practices (Table 2). Ofthe reported maize diseases, the ones considered ofeconomic importance are maize dwarf mosaic (includingsugar cane mosaic); the downy mildews; Diplodia,northern, southern and banded leaf and sheath blights(BLSB); southern and common rusts; Diplodia, Fusarium,charcoal and bacterial root and stalk rots; Rhizoctonia,Diplodia, Fusarium and Aspergillus kernel and ear rots;and common and head smuts. Disease occurrence isdynamic and will remain so, while some of the currentlyimportant diseases may become less important as resistantcultivars are developed, and others presently considerednot important may become more prevalent with changes inclimate, cropping practices and introduction of new, high-yielding cultivars. Climate change will modify thedistribution and adaptation range of many diseases, andresearch is needed to document the effects of climatechange on pathogen dynamics in Asia.
Table 2. Important diseases of maize in Asia.
A B C D E F G H I J K L M
Highlands 4.01 2.0 5.0 3.5 5.0 3.0 5.0 4.5 1.5 1.8 4.8 1.0 5.0Upper wet MA 2.5 1.5 4.0 3.0 5.0 3.0 5.0 3.5 1.5 2.0 4.0 1.0 4.5Lower wet MA 2.0 1.5 1.5 2.0 2.0 3.0 2.5 3.0 1.5 2.0 3.5 1.5 3.0Dry mid-altitudes 3.5 3.0 2.0 4.0 3.0 4.0 2.5 2.0 4.0 2.5 2.5 1.5 3.0Wet lowlands 1.5 4.5 1.0 3.8 1.3 4.0 1.5 2.0 3.5 1.5 2.0 1.0 2.5Dry lowlands 3.5 5.0 2.0 5.0 1.8 5.0 1.5 2.0 4.8 2.0 2.0 1.0 3.5
A = Banded leaf and sheath blightB = Common rustC = Downy mildewsD = Gray leaf spotE = Maydis leaf blightF = Phaeosphaeria leaf spotG = Polysora rustH = SCMV/MDMVI = Turcicum leaf blightJ = Ear rotsK = Asperigillus ear rotsL = Fusarium verticillioides ear and stem rotM = Stenocarpella ear rot (Diploida)1. Classification based on scores on a 1-5 rating scale, where 1 = economically very important; and 5 = not economically important.
Table 1. Estimated yield losses from different bioticconstraints.
Loss (%)
AttainableRegion yield Diseases Animals/ Weeds
(t �� ��6)1 insects
Africa 74 16 20 18Central andSouth America 98 12 17 19Asia 203 12 18 12North America 258 9 11 11Europe 68 7 9 9
1. Based on 1988-1990 data summarized in Oerke 1994.
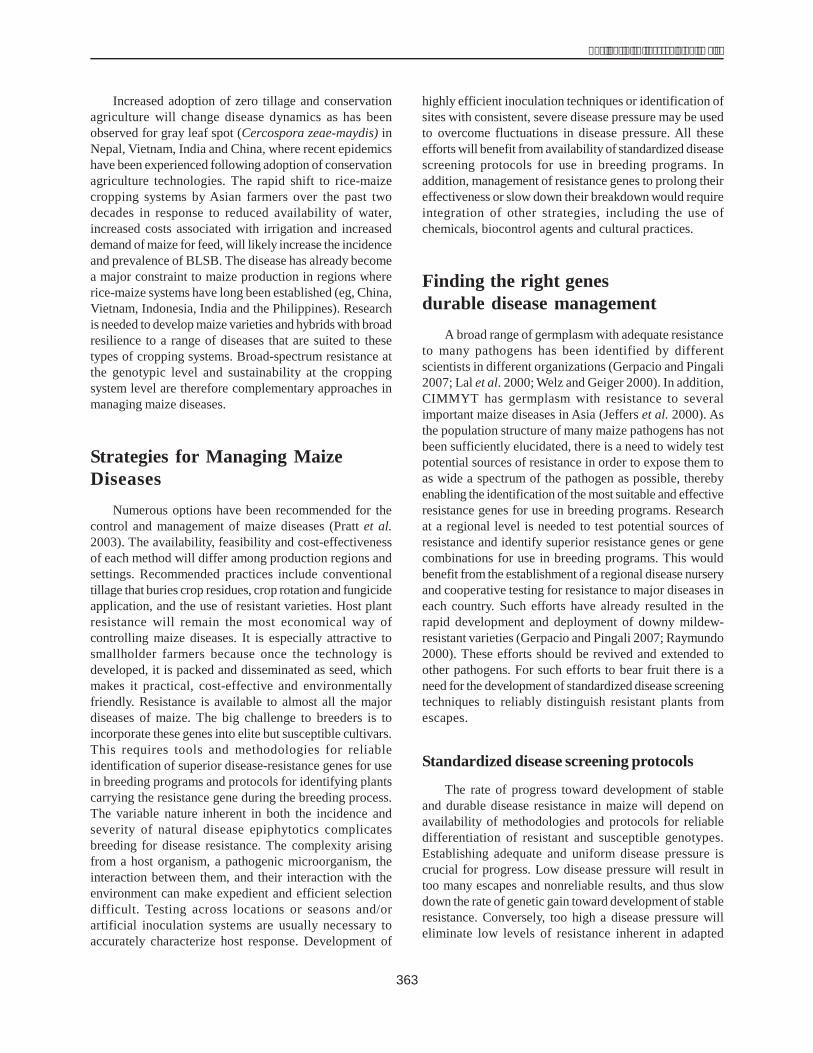
363
����� � ���� ����������� �������
Increased adoption of zero tillage and conservationagriculture will change disease dynamics as has beenobserved for gray leaf spot (Cercospora zeae-maydis) inNepal, Vietnam, India and China, where recent epidemicshave been experienced following adoption of conservationagriculture technologies. The rapid shift to rice-maizecropping systems by Asian farmers over the past twodecades in response to reduced availability of water,increased costs associated with irrigation and increaseddemand of maize for feed, will likely increase the incidenceand prevalence of BLSB. The disease has already becomea major constraint to maize production in regions whererice-maize systems have long been established (eg, China,Vietnam, Indonesia, India and the Philippines). Researchis needed to develop maize varieties and hybrids with broadresilience to a range of diseases that are suited to thesetypes of cropping systems. Broad-spectrum resistance atthe genotypic level and sustainability at the croppingsystem level are therefore complementary approaches inmanaging maize diseases.
Strategies for Managing MaizeDiseases
Numerous options have been recommended for thecontrol and management of maize diseases (Pratt et al.2003). The availability, feasibility and cost-effectivenessof each method will differ among production regions andsettings. Recommended practices include conventionaltillage that buries crop residues, crop rotation and fungicideapplication, and the use of resistant varieties. Host plantresistance will remain the most economical way ofcontrolling maize diseases. It is especially attractive tosmallholder farmers because once the technology isdeveloped, it is packed and disseminated as seed, whichmakes it practical, cost-effective and environmentallyfriendly. Resistance is available to almost all the majordiseases of maize. The big challenge to breeders is toincorporate these genes into elite but susceptible cultivars.This requires tools and methodologies for reliableidentification of superior disease-resistance genes for usein breeding programs and protocols for identifying plantscarrying the resistance gene during the breeding process.The variable nature inherent in both the incidence andseverity of natural disease epiphytotics complicatesbreeding for disease resistance. The complexity arisingfrom a host organism, a pathogenic microorganism, theinteraction between them, and their interaction with theenvironment can make expedient and efficient selectiondifficult. Testing across locations or seasons and/orartificial inoculation systems are usually necessary toaccurately characterize host response. Development of
highly efficient inoculation techniques or identification ofsites with consistent, severe disease pressure may be usedto overcome fluctuations in disease pressure. All theseefforts will benefit from availability of standardized diseasescreening protocols for use in breeding programs. Inaddition, management of resistance genes to prolong theireffectiveness or slow down their breakdown would requireintegration of other strategies, including the use ofchemicals, biocontrol agents and cultural practices.
Finding the right genes ������������durable disease management
A broad range of germplasm with adequate resistanceto many pathogens has been identified by differentscientists in different organizations (Gerpacio and Pingali2007; Lal et al. 2000; Welz and Geiger 2000). In addition,CIMMYT has germplasm with resistance to severalimportant maize diseases in Asia (Jeffers et al. 2000). Asthe population structure of many maize pathogens has notbeen sufficiently elucidated, there is a need to widely testpotential sources of resistance in order to expose them toas wide a spectrum of the pathogen as possible, therebyenabling the identification of the most suitable and effectiveresistance genes for use in breeding programs. Researchat a regional level is needed to test potential sources ofresistance and identify superior resistance genes or genecombinations for use in breeding programs. This wouldbenefit from the establishment of a regional disease nurseryand cooperative testing for resistance to major diseases ineach country. Such efforts have already resulted in therapid development and deployment of downy mildew-resistant varieties (Gerpacio and Pingali 2007; Raymundo2000). These efforts should be revived and extended toother pathogens. For such efforts to bear fruit there is aneed for the development of standardized disease screeningtechniques to reliably distinguish resistant plants fromescapes.
Standardized disease screening protocols
The rate of progress toward development of stableand durable disease resistance in maize will depend onavailability of methodologies and protocols for reliabledifferentiation of resistant and susceptible genotypes.Establishing adequate and uniform disease pressure iscrucial for progress. Low disease pressure will result intoo many escapes and nonreliable results, and thus slowdown the rate of genetic gain toward development of stableresistance. Conversely, too high a disease pressure willeliminate low levels of resistance inherent in adapted
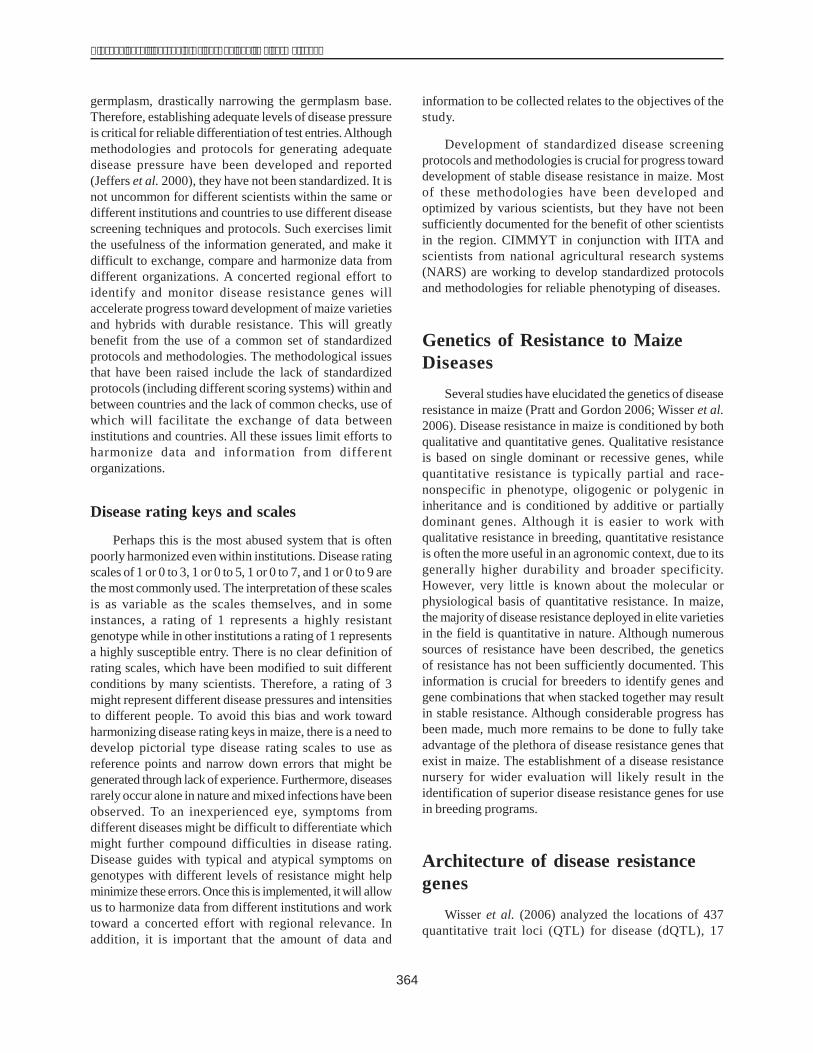
364
������� �� �� ����� ������� ����� ���������������
germplasm, drastically narrowing the germplasm base.Therefore, establishing adequate levels of disease pressureis critical for reliable differentiation of test entries.Althoughmethodologies and protocols for generating adequatedisease pressure have been developed and reported(Jeffers et al. 2000), they have not been standardized. It isnot uncommon for different scientists within the same ordifferent institutions and countries to use different diseasescreening techniques and protocols. Such exercises limitthe usefulness of the information generated, and make itdifficult to exchange, compare and harmonize data fromdifferent organizations. A concerted regional effort toidentify and monitor disease resistance genes willaccelerate progress toward development of maize varietiesand hybrids with durable resistance. This will greatlybenefit from the use of a common set of standardizedprotocols and methodologies. The methodological issuesthat have been raised include the lack of standardizedprotocols (including different scoring systems) within andbetween countries and the lack of common checks, use ofwhich will facilitate the exchange of data betweeninstitutions and countries. All these issues limit efforts toharmonize data and information from differentorganizations.
Disease rating keys and scales
Perhaps this is the most abused system that is oftenpoorly harmonized even within institutions. Disease ratingscales of 1 or 0 to 3, 1 or 0 to 5, 1 or 0 to 7, and 1 or 0 to 9 arethe most commonly used. The interpretation of these scalesis as variable as the scales themselves, and in someinstances, a rating of 1 represents a highly resistantgenotype while in other institutions a rating of 1 representsa highly susceptible entry. There is no clear definition ofrating scales, which have been modified to suit differentconditions by many scientists. Therefore, a rating of 3might represent different disease pressures and intensitiesto different people. To avoid this bias and work towardharmonizing disease rating keys in maize, there is a need todevelop pictorial type disease rating scales to use asreference points and narrow down errors that might begenerated through lack of experience. Furthermore, diseasesrarely occur alone in nature and mixed infections have beenobserved. To an inexperienced eye, symptoms fromdifferent diseases might be difficult to differentiate whichmight further compound difficulties in disease rating.Disease guides with typical and atypical symptoms ongenotypes with different levels of resistance might helpminimize these errors. Once this is implemented, it will allowus to harmonize data from different institutions and worktoward a concerted effort with regional relevance. Inaddition, it is important that the amount of data and
information to be collected relates to the objectives of thestudy.
Development of standardized disease screeningprotocols and methodologies is crucial for progress towarddevelopment of stable disease resistance in maize. Mostof these methodologies have been developed andoptimized by various scientists, but they have not beensufficiently documented for the benefit of other scientistsin the region. CIMMYT in conjunction with IITA andscientists from national agricultural research systems(NARS) are working to develop standardized protocolsand methodologies for reliable phenotyping of diseases.
Genetics of Resistance to MaizeDiseases
Several studies have elucidated the genetics of diseaseresistance in maize (Pratt and Gordon 2006; Wisser et al.2006). Disease resistance in maize is conditioned by bothqualitative and quantitative genes. Qualitative resistanceis based on single dominant or recessive genes, whilequantitative resistance is typically partial and race-nonspecific in phenotype, oligogenic or polygenic ininheritance and is conditioned by additive or partiallydominant genes. Although it is easier to work withqualitative resistance in breeding, quantitative resistanceis often the more useful in an agronomic context, due to itsgenerally higher durability and broader specificity.However, very little is known about the molecular orphysiological basis of quantitative resistance. In maize,the majority of disease resistance deployed in elite varietiesin the field is quantitative in nature. Although numeroussources of resistance have been described, the geneticsof resistance has not been sufficiently documented. Thisinformation is crucial for breeders to identify genes andgene combinations that when stacked together may resultin stable resistance. Although considerable progress hasbeen made, much more remains to be done to fully takeadvantage of the plethora of disease resistance genes thatexist in maize. The establishment of a disease resistancenursery for wider evaluation will likely result in theidentification of superior disease resistance genes for usein breeding programs.
Architecture of disease resistancegenes
Wisser et al. (2006) analyzed the locations of 437quantitative trait loci (QTL) for disease (dQTL), 17
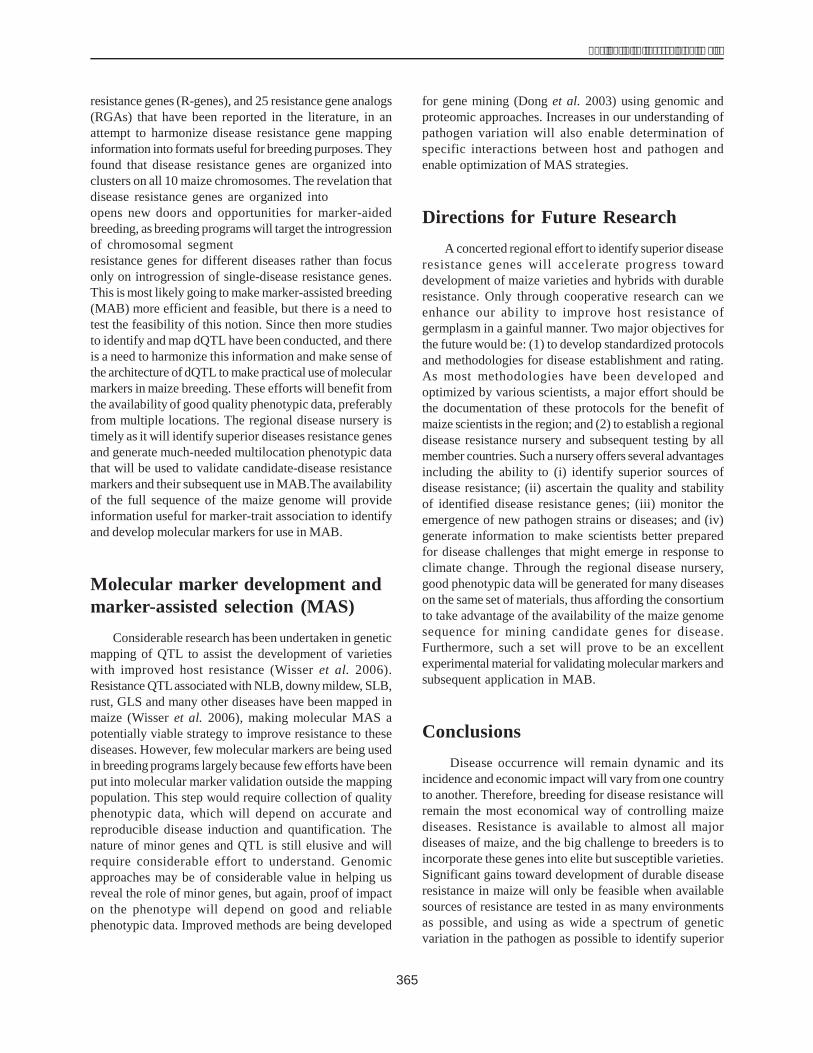
365
����� � ���� ����������� �������
resistance genes (R-genes), and 25 resistance gene analogs(RGAs) that have been reported in the literature, in anattempt to harmonize disease resistance gene mappinginformation into formats useful for breeding purposes. Theyfound that disease resistance genes are organized intoclusters on all 10 maize chromosomes. The revelation thatdisease resistance genes are organized into ����� ����opens new doors and opportunities for marker-aidedbreeding, as breeding programs will target the introgressionof chromosomal segment ����� ����� ����� ������ ��resistance genes for different diseases rather than focusonly on introgression of single-disease resistance genes.This is most likely going to make marker-assisted breeding(MAB) more efficient and feasible, but there is a need totest the feasibility of this notion. Since then more studiesto identify and map dQTL have been conducted, and thereis a need to harmonize this information and make sense ofthe architecture of dQTL to make practical use of molecularmarkers in maize breeding. These efforts will benefit fromthe availability of good quality phenotypic data, preferablyfrom multiple locations. The regional disease nursery istimely as it will identify superior diseases resistance genesand generate much-needed multilocation phenotypic datathat will be used to validate candidate-disease resistancemarkers and their subsequent use in MAB.The availabilityof the full sequence of the maize genome will provideinformation useful for marker-trait association to identifyand develop molecular markers for use in MAB.
Molecular marker development andmarker-assisted selection (MAS)
Considerable research has been undertaken in geneticmapping of QTL to assist the development of varietieswith improved host resistance (Wisser et al. 2006).Resistance QTLassociated with NLB, downy mildew, SLB,rust, GLS and many other diseases have been mapped inmaize (Wisser et al. 2006), making molecular MAS apotentially viable strategy to improve resistance to thesediseases. However, few molecular markers are being usedin breeding programs largely because few efforts have beenput into molecular marker validation outside the mappingpopulation. This step would require collection of qualityphenotypic data, which will depend on accurate andreproducible disease induction and quantification. Thenature of minor genes and QTL is still elusive and willrequire considerable effort to understand. Genomicapproaches may be of considerable value in helping usreveal the role of minor genes, but again, proof of impacton the phenotype will depend on good and reliablephenotypic data. Improved methods are being developed
for gene mining (Dong et al. 2003) using genomic andproteomic approaches. Increases in our understanding ofpathogen variation will also enable determination ofspecific interactions between host and pathogen andenable optimization of MAS strategies.
Directions for Future ResearchA concerted regional effort to identify superior disease
resistance genes will accelerate progress towarddevelopment of maize varieties and hybrids with durableresistance. Only through cooperative research can weenhance our ability to improve host resistance ofgermplasm in a gainful manner. Two major objectives forthe future would be: (1) to develop standardized protocolsand methodologies for disease establishment and rating.As most methodologies have been developed andoptimized by various scientists, a major effort should bethe documentation of these protocols for the benefit ofmaize scientists in the region; and (2) to establish a regionaldisease resistance nursery and subsequent testing by allmember countries. Such a nursery offers several advantagesincluding the ability to (i) identify superior sources ofdisease resistance; (ii) ascertain the quality and stabilityof identified disease resistance genes; (iii) monitor theemergence of new pathogen strains or diseases; and (iv)generate information to make scientists better preparedfor disease challenges that might emerge in response toclimate change. Through the regional disease nursery,good phenotypic data will be generated for many diseaseson the same set of materials, thus affording the consortiumto take advantage of the availability of the maize genomesequence for mining candidate genes for disease.Furthermore, such a set will prove to be an excellentexperimental material for validating molecular markers andsubsequent application in MAB.
ConclusionsDisease occurrence will remain dynamic and its
incidence and economic impact will vary from one countryto another. Therefore, breeding for disease resistance willremain the most economical way of controlling maizediseases. Resistance is available to almost all majordiseases of maize, and the big challenge to breeders is toincorporate these genes into elite but susceptible varieties.Significant gains toward development of durable diseaseresistance in maize will only be feasible when availablesources of resistance are tested in as many environmentsas possible, and using as wide a spectrum of geneticvariation in the pathogen as possible to identify superior

366
������� �� �� ����� ������� ����� ���������������
sources of disease resistance. A paradigm shift fromthinking locally to regionally is necessary for cooperativeevaluation of potential sources of resistance. This can onlybe feasible through the use of standardized diseasescreening protocols and methodologies, includingcommon checks, to allow consolidation and harmonizationof data. Recent developments in biotechnology offer anopportunity to harness molecular markers to speed theintrogression of resistance genes into elite materials.However, this requires quality phenotypic data for markertrait validation. Setting up a regional nursery offers theopportunity to collect such data and to facilitate validationof potential molecular markers and their subsequent use inMAB. Shared responsibility in the face of limited resourceswill allow us to generate more information that will bringabout significant gains in our quest to use host resistanceto durably manage maize diseases than single institutionswould achieve alone.
ReferencesDalmacio S. 2000. Importance of and growing concerns for maize
diseases in theAsian region. Pages 267-276 in Proceedingsof the Seventh Asian Regional Maize Workshop,PCARRD, Los Ba����������� � ���������������������Vasal S.K., Ceniceros F.G. and Ming F.X. (eds.).
Dong Q., Roy L., Freeling M., Walbot V. and Brendel V. 2003.ZmDB, an integrated data base for maize genome research.Nucleic Acids Research 31:244-247.
Gerpacio R.V. and Pingali P.L. 2007. Tropical and subtropicalmaize in Asia: production systems, constraints andresearch priorities. Mexico, D.F.: CIMMYT.
Jeffers D., Cordova H., Vasal S.K., Srinivasan G., Beck D. andBarandiaran M. 2000. Status in breeding for resistance tomaize disease at CIMMYT. Pages 257-266 in Proceedingsof the Seventh Asian Regional Maize Workshop,PCARRD, Los Ba����������� � ���������������������Vasal S.K., Ceniceros F.G. and Ming F.X. (eds.).
von Braun J. 2008. Rising food prices. http://www.ifpri.org/themes/foodprices/foodprices.asp.
Lal S., DeLeon C., Saxena V.K., Singh S.B., Singh N.N. andVasal S.K. 2000. Maize stalk rot complexes: innovativebreeding approaches. Pages 290-306 in Proceedings of theSeventh Asian Regional Maize Workshop, PCARRD, Los
Ba����� ������ � ���������������������������� !� ��Ceniceros F.G. and Ming F.X. (eds.).
Gulati A. and Dixon J. 2007 Maize in Asia: changing marketsand incentives. Mexico D.F.: CIMMYT/IFAD/IFPRI.
Pingali P.L. and Pandey S. 2001. Meeting world maize needs:technological opportunities and priorities for the publicsector. CIMMYT 1999-2000: world maize facts andtrends. Pingali P.L. (ed.). Mexico, D.F.: CIMMYT.
Pratt R.C. and Gordon S.G. 2006. Breeding for resistance tomaize foliar pathogens. Plant Breeding Reviews 27:119-173.
Pratt R., Gordon S., Lipps P., Asea G., Bigirwa G. and Pixley K.2003. Use of IPM in the control of multiple diseases inmaize: strategies for selection of host resistance. AfricanCrop Science Journal 11(3):189-198.
Raymundo A.D. 2000. Downy mildew of maize in Asia: newperspective in resistance breeding. Pages 277-283 inProceedings of the Seventh Asian Regional MaizeWorkshop, PCARRD, Los Ba����� ������ � ��������23-27, 1998. Vasal S.K., Ceniceros F.G. and Ming F.X.(eds.).
Sharma R.C., DeLeon C. and Singh N.N. 2000. Banded leaf andsheath blight of maize ������������� ������ ���� ����efforts. Pages 284-288 in Proceedings of the Seventh AsianRegional Maize Workshop, PCARRD, Los Ba����� �� Philippines, Feb 23-27, 1998. Vasal S.K., Ceniceros F.G.and Ming F.X. (eds.).
Wada N., Fena C. and Gulati A. 2008. Introduction and overview.Pages 1-75 in Maize in Asia: changing markets andincentives. Gulati A. and Dixon J. (eds.). AcademicFoundation.
Welz H.G. and Geiger H.H. 2000. Genes for resistance tonorthern corn leaf blight in diverse maize populations.Plant Breeding 119:1-14.
Williams J.H., Phillips T.D., Jolly P.E., Stiles J.K, Jolly C.M.and Aggarwal D. 2004. Human aflatoxicosis in developingcountries: a review of toxicology, exposure, potential healthconsequences and interventions. Am. J. Clin. Nutr.80:1106-1122.
Wisser R.J., Balint-Kurti P.J. and Nelson R.J. 2006. The geneticarchitecture of disease resistance in maize: a synthesis ofpublished studies. Phytopathology 96:120-129.
Orke E.C., Dehne H.W., Schonbeck F. and Webber A. 1994.Crop production and crop protection: estimated losses inmajor food and cash crops. Amsterdam, the Netherlands:Elsevier.
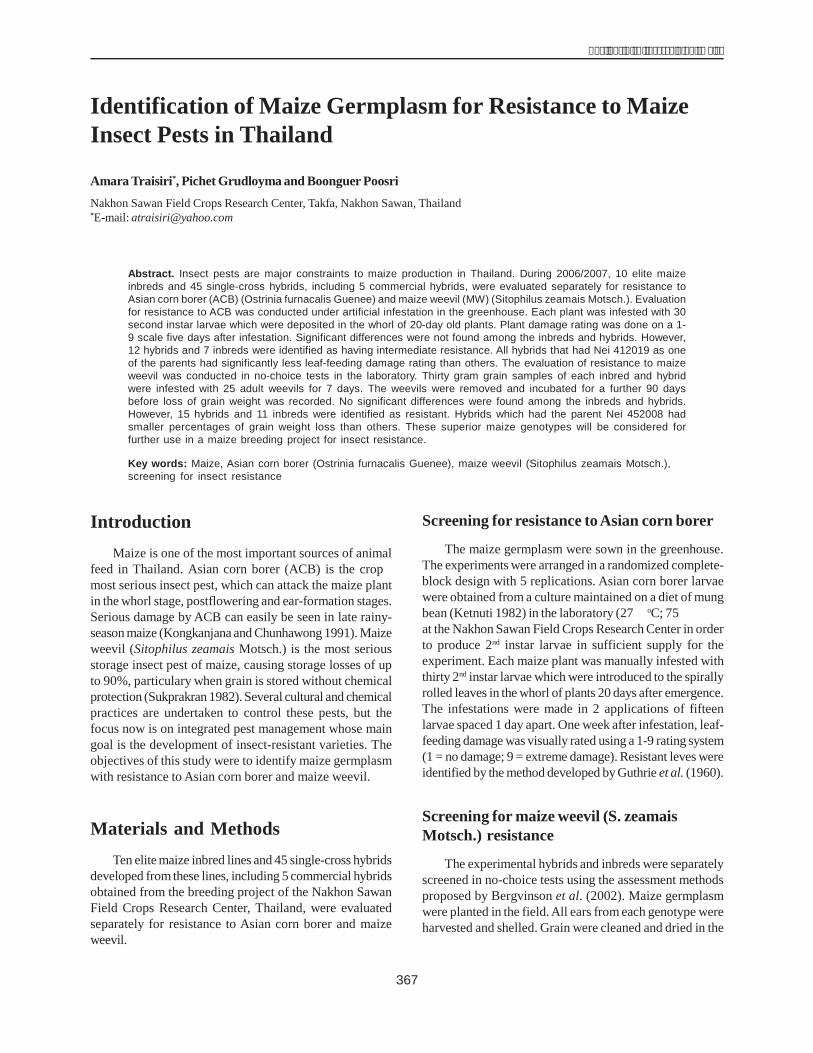
367
����� � ���� ����������� �������
IntroductionMaize is one of the most important sources of animal
feed in Thailand. Asian corn borer (ACB) is the crop��most serious insect pest, which can attack the maize plantin the whorl stage, postflowering and ear-formation stages.Serious damage by ACB can easily be seen in late rainy-season maize (Kongkanjana and Chunhawong 1991). Maizeweevil (Sitophilus zeamais Motsch.) is the most seriousstorage insect pest of maize, causing storage losses of upto 90%, particulary when grain is stored without chemicalprotection (Sukprakran 1982). Several cultural and chemicalpractices are undertaken to control these pests, but thefocus now is on integrated pest management whose maingoal is the development of insect-resistant varieties. Theobjectives of this study were to identify maize germplasmwith resistance to Asian corn borer and maize weevil.
Materials and MethodsTen elite maize inbred lines and 45 single-cross hybrids
developed from these lines, including 5 commercial hybridsobtained from the breeding project of the Nakhon SawanField Crops Research Center, Thailand, were evaluatedseparately for resistance to Asian corn borer and maizeweevil.
Screening for resistance to Asian corn borer
The maize germplasm were sown in the greenhouse.The experiments were arranged in a randomized complete-block design with 5 replications. Asian corn borer larvaewere obtained from a culture maintained on a diet of mungbean (Ketnuti 1982) in the laboratory (27��oC; 75�������at the Nakhon Sawan Field Crops Research Center in orderto produce 2nd instar larvae in sufficient supply for theexperiment. Each maize plant was manually infested withthirty 2nd instar larvae which were introduced to the spirallyrolled leaves in the whorl of plants 20 days after emergence.The infestations were made in 2 applications of fifteenlarvae spaced 1 day apart. One week after infestation, leaf-feeding damage was visually rated using a 1-9 rating system(1 = no damage; 9 = extreme damage). Resistant leves wereidentified by the method developed by Guthrie et al. (1960).
Screening for maize weevil (S. zeamaisMotsch.) resistance
The experimental hybrids and inbreds were separatelyscreened in no-choice tests using the assessment methodsproposed by Bergvinson et al. (2002). Maize germplasmwere planted in the field. All ears from each genotype wereharvested and shelled. Grain were cleaned and dried in the
Identification of Maize Germplasm for Resistance to MaizeInsect Pests in Thailand
Amara Traisiri*, Pichet Grudloyma and Boonguer PoosriNakhon Sawan Field Crops Research Center, Takfa, Nakhon Sawan, Thailand*E-mail: [email protected]
Abstract. Insect pests are major constraints to maize production in Thailand. During 2006/2007, 10 elite maizeinbreds and 45 single-cross hybrids, including 5 commercial hybrids, were evaluated separately for resistance toAsian corn borer (ACB) (Ostrinia furnacalis Guenee) and maize weevil (MW) (Sitophilus zeamais Motsch.). Evaluationfor resistance to ACB was conducted under artificial infestation in the greenhouse. Each plant was infested with 30second instar larvae which were deposited in the whorl of 20-day old plants. Plant damage rating was done on a 1-9 scale five days after infestation. Significant differences were not found among the inbreds and hybrids. However,12 hybrids and 7 inbreds were identified as having intermediate resistance. All hybrids that had Nei 412019 as oneof the parents had significantly less leaf-feeding damage rating than others. The evaluation of resistance to maizeweevil was conducted in no-choice tests in the laboratory. Thirty gram grain samples of each inbred and hybridwere infested with 25 adult weevils for 7 days. The weevils were removed and incubated for a further 90 daysbefore loss of grain weight was recorded. No significant differences were found among the inbreds and hybrids.However, 15 hybrids and 11 inbreds were identified as resistant. Hybrids which had the parent Nei 452008 hadsmaller percentages of grain weight loss than others. These superior maize genotypes will be considered forfurther use in a maize breeding project for insect resistance.
Key words: Maize, Asian corn borer (Ostrinia furnacalis Guenee), maize weevil (Sitophilus zeamais Motsch.),screening for insect resistance
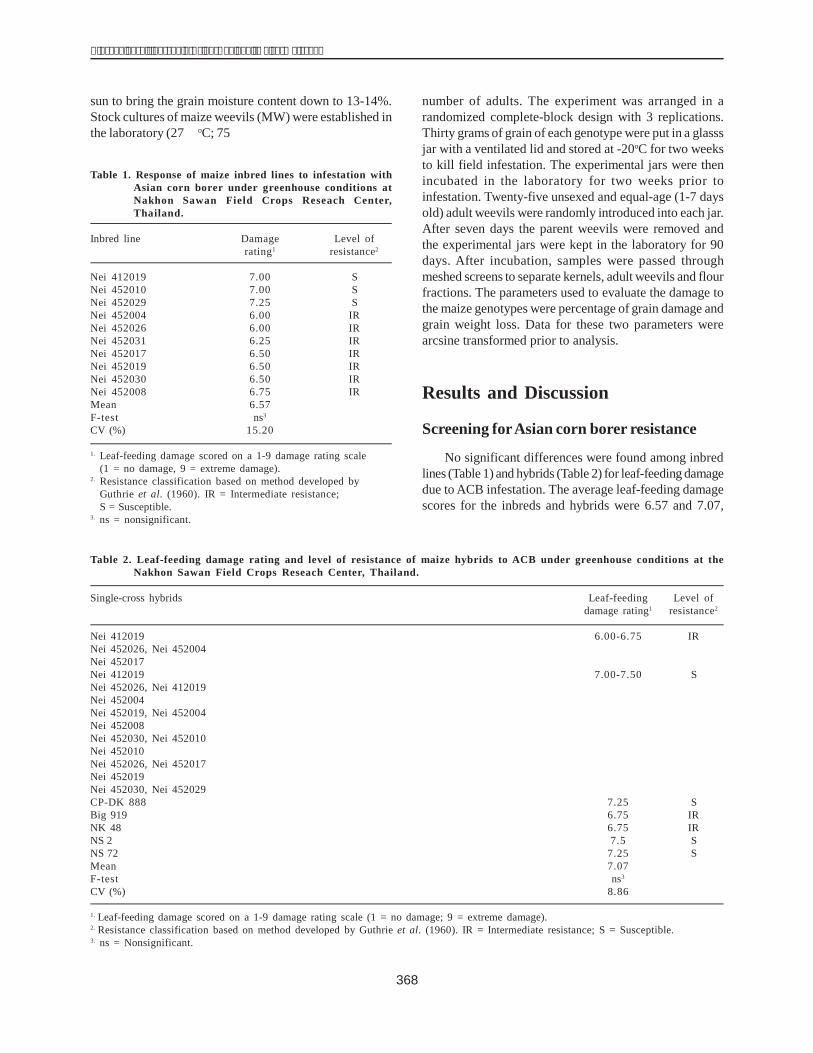
368
������� �� �� ����� ������� ����� ���������������
sun to bring the grain moisture content down to 13-14%.Stock cultures of maize weevils (MW) were established inthe laboratory (27��oC; 75��������������� ��������� ��
number of adults. The experiment was arranged in arandomized complete-block design with 3 replications.Thirty grams of grain of each genotype were put in a glasssjar with a ventilated lid and stored at -20oC for two weeksto kill field infestation. The experimental jars were thenincubated in the laboratory for two weeks prior toinfestation. Twenty-five unsexed and equal-age (1-7 daysold) adult weevils were randomly introduced into each jar.After seven days the parent weevils were removed andthe experimental jars were kept in the laboratory for 90days. After incubation, samples were passed throughmeshed screens to separate kernels, adult weevils and flourfractions. The parameters used to evaluate the damage tothe maize genotypes were percentage of grain damage andgrain weight loss. Data for these two parameters werearcsine transformed prior to analysis.
Results and Discussion
Screening forAsian corn borer resistance
No significant differences were found among inbredlines (Table 1) and hybrids (Table 2) for leaf-feeding damagedue to ACB infestation. The average leaf-feeding damagescores for the inbreds and hybrids were 6.57 and 7.07,
Table 1. Response of maize inbred lines to infestation withAsian corn borer under greenhouse conditions atNakhon Sawan Field Crops Reseach Center,Thailand.
Inbred line Damage Level ofrating1 resistance2
Nei 412019 7.00 SNei 452010 7.00 SNei 452029 7.25 SNei 452004 6.00 IRNei 452026 6.00 IRNei 452031 6.25 IRNei 452017 6.50 IRNei 452019 6.50 IRNei 452030 6.50 IRNei 452008 6.75 IRMean 6.57F-test ns3
CV (%) 15.20
1. Leaf-feeding damage scored on a 1-9 damage rating scale(1 = no damage, 9 = extreme damage).
2. Resistance classification based on method developed byGuthrie et al. (1960). IR = Intermediate resistance;S = Susceptible.
3. ns = nonsignificant.
Table 2. Leaf-feeding damage rating and level of resistance of maize hybrids to ACB under greenhouse conditions at theNakhon Sawan Field Crops Reseach Center, Thailand.
Single-cross hybrids Leaf-feeding Level ofdamage rating1 resistance2
Nei 412019 ��� �� ��������� ������� � ��� �� �����!��� �� ����� � ��� �� �����!��� ��������� � 6.00-6.75 IRNei 452026, Nei 452004 ��� �� ����"���� �� ������� ��� �� ����"���� ��������� ��� �� ����"��Nei 452017 ��� �� ����"���� �� ����� � ��� �� �����#��� �� �����#� ��� �� ����"�Nei 412019 ��� �� ��������� ������� � ��� �� ��������� �� ����� � ��� �� ����� ��� ������� � � 7.00-7.50 SNei 452026, Nei 412019 ��� �� ����� ��� �� ����� � ��� �� ����"���� ������� � ��� �� ����"��Nei 452004 ��� �� ��������� ��������� ��� �� ��������� �� ������� ��� �� �����!��� ��������� �Nei 452019, Nei 452004 ��� �� ����"���� �� ������� ��� �� ��������� ��������� ��� �� �����!�Nei 452008 ��� �� ����� ��� ��������� ��� �� �����#��� �� ������� ��� �� ����� ��� ��������� �Nei 452030, Nei 452010 ��� �� �����!��� �� ������� ��� �� ����� ��� ��������� ��� �� �����#�Nei 452010 ��� �� ����� ��� ��������� ��� �� ����"���� �� �����!� ��� �� ����� ��� �������!� �Nei 452026, Nei 452017 ��� �� ����� ��� �� �����!� ��� �� ����"���� ������� � ��� �� ����� �Nei 452019 ��� �� ����"���� ������� � ��� �� ����"���� �� �����#� ��� �� ����� ��� �������#� �Nei 452030, Nei 452029 ��� �� ����"���� �� ����� � ��� �� ����"���� �� ����"�� ��� �� ����"�CP-DK 888 7.25 SBig 919 6.75 IRNK 48 6.75 IRNS 2 7.5 SNS 72 7.25 SMean 7.07F-test ns3
CV (%) 8.86
1. Leaf-feeding damage scored on a 1-9 damage rating scale (1 = no damage; 9 = extreme damage).2. Resistance classification based on method developed by Guthrie et al. (1960). IR = Intermediate resistance; S = Susceptible.3. ns = Nonsignificant.
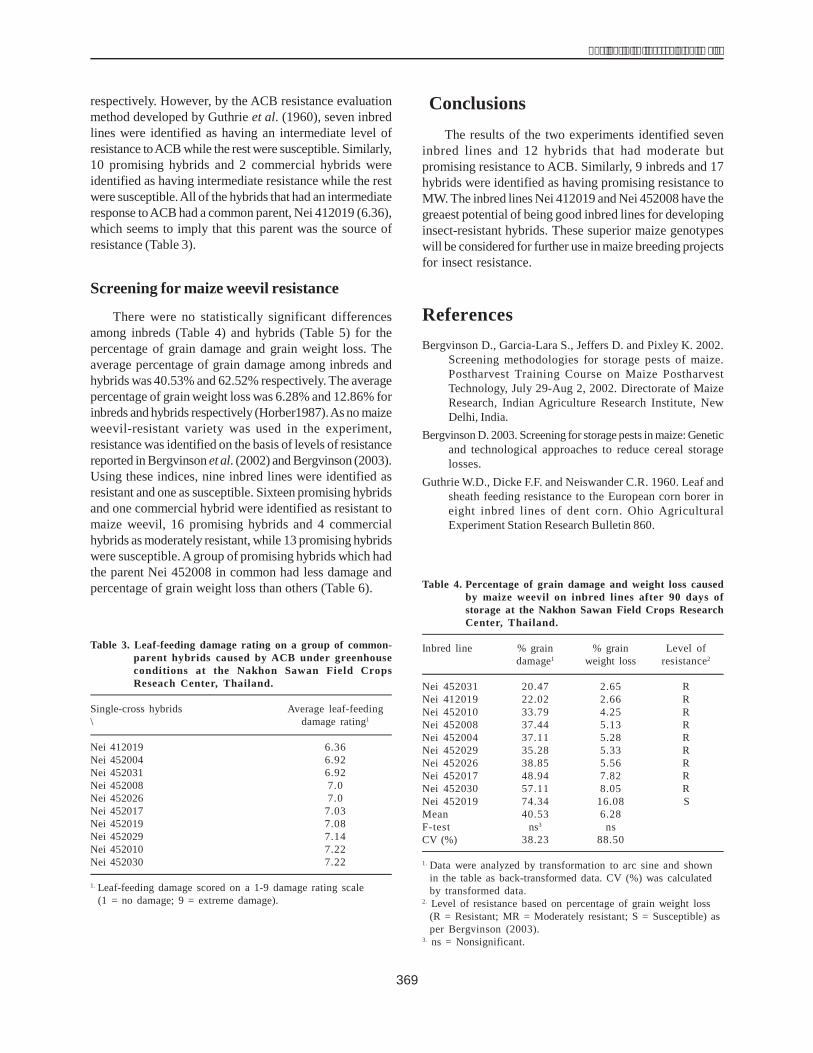
369
����� � ���� ����������� �������
respectively. However, by the ACB resistance evaluationmethod developed by Guthrie et al. (1960), seven inbredlines were identified as having an intermediate level ofresistance toACB while the rest were susceptible. Similarly,10 promising hybrids and 2 commercial hybrids wereidentified as having intermediate resistance while the restwere susceptible.All of the hybrids that had an intermediateresponse toACB had a common parent, Nei 412019 (6.36),which seems to imply that this parent was the source ofresistance (Table 3).
Screening for maize weevil resistance
There were no statistically significant differencesamong inbreds (Table 4) and hybrids (Table 5) for thepercentage of grain damage and grain weight loss. Theaverage percentage of grain damage among inbreds andhybrids was 40.53% and 62.52% respectively. The averagepercentage of grain weight loss was 6.28% and 12.86% forinbreds and hybrids respectively (Horber1987).As no maizeweevil-resistant variety was used in the experiment,resistance was identified on the basis of levels of resistancereported in Bergvinson et al. (2002) and Bergvinson (2003).Using these indices, nine inbred lines were identified asresistant and one as susceptible. Sixteen promising hybridsand one commercial hybrid were identified as resistant tomaize weevil, 16 promising hybrids and 4 commercialhybrids as moderately resistant, while 13 promising hybridswere susceptible.Agroup of promising hybrids which hadthe parent Nei 452008 in common had less damage andpercentage of grain weight loss than others (Table 6).
Table 3. Leaf-feeding damage rating on a group of common-parent hybrids caused by ACB under greenhouseconditions at the Nakhon Sawan Field CropsReseach Center, Thailand.
Single-cross hybrids Average leaf-feeding\ damage rating1
Nei 412019 �� � ��� �� 6.36Nei 452004 �� � ��� �� 6.92Nei 452031 �� � ��� �� 6.92Nei 452008 �� � ��� �� 7.0Nei 452026 �� � ��� �� 7.0Nei 452017 �� � ��� �� 7.03Nei 452019 �� � ��� �� 7.08Nei 452029 �� � ��� �� 7.14Nei 452010 �� � ��� �� 7.22Nei 452030 �� � ��� �� 7.22
1. Leaf-feeding damage scored on a 1-9 damage rating scale(1 = no damage; 9 = extreme damage).
Table 4. Percentage of grain damage and weight loss causedby maize weevil on inbred lines after 90 days ofstorage at the Nakhon Sawan Field Crops ResearchCenter, Thailand.
Inbred line % grain % grain Level ofdamage1 weight loss resistance2
Nei 452031 20.47 2.65 RNei 412019 22.02 2.66 RNei 452010 33.79 4.25 RNei 452008 37.44 5.13 RNei 452004 37.11 5.28 RNei 452029 35.28 5.33 RNei 452026 38.85 5.56 RNei 452017 48.94 7.82 RNei 452030 57.11 8.05 RNei 452019 74.34 16.08 SMean 40.53 6.28F-test ns3 nsCV (%) 38.23 88.50
1. Data were analyzed by transformation to arc sine and shownin the table as back-transformed data. CV (%) was calculatedby transformed data.
2. Level of resistance based on percentage of grain weight loss(R = Resistant; MR = Moderately resistant; S = Susceptible) asper Bergvinson (2003).
3. ns = Nonsignificant.
ConclusionsThe results of the two experiments identified seven
inbred lines and 12 hybrids that had moderate butpromising resistance to ACB. Similarly, 9 inbreds and 17hybrids were identified as having promising resistance toMW. The inbred lines Nei 412019 and Nei 452008 have thegreaest potential of being good inbred lines for developinginsect-resistant hybrids. These superior maize genotypeswill be considered for further use in maize breeding projectsfor insect resistance.
ReferencesBergvinson D., Garcia-Lara S., Jeffers D. and Pixley K. 2002.
Screening methodologies for storage pests of maize.Postharvest Training Course on Maize PostharvestTechnology, July 29-Aug 2, 2002. Directorate of MaizeResearch, Indian Agriculture Research Institute, NewDelhi, India.
Bergvinson D. 2003. Screening for storage pests in maize: Geneticand technological approaches to reduce cereal storagelosses.
Guthrie W.D., Dicke F.F. and Neiswander C.R. 1960. Leaf andsheath feeding resistance to the European corn borer ineight inbred lines of dent corn. Ohio AgriculturalExperiment Station Research Bulletin 860.
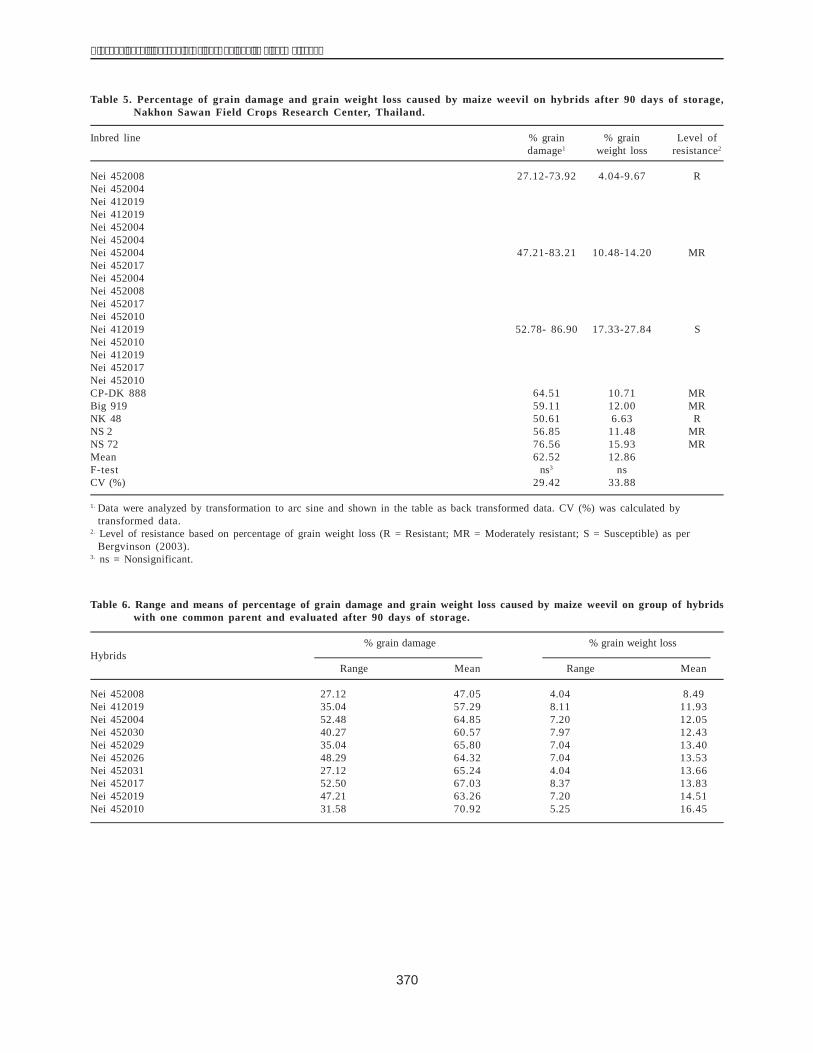
370
������� �� �� ����� ������� ����� ���������������
Table 6. Range and means of percentage of grain damage and grain weight loss caused by maize weevil on group of hybridswith one common parent and evaluated after 90 days of storage.
% grain damage % grain weight lossHybrids
Range Mean Range Mean
Nei 452008 �� $ � ��� ��� 27.12 �� #�% # 47.05 4.04 �� ��%� 8.49Nei 412019 �� $ � ��� ��� 35.04 �� �"%�� 57.29 8.11 �� ��%"! 11.93Nei 452004 �� $ � ��� ��� 52.48 �� �"%�� 64.85 7.20 �� ��%�� 12.05Nei 452030 �� $ � ��� ��� 40.27 �� �"%�� 60.57 7.97 �� ��%!! 12.43Nei 452029 �� $ � ��� ��� 35.04 �� ��% � 65.80 7.04 �� ��%�! 13.40Nei 452026 �� $ � ��� ��� 48.29 �� �"%�� 64.32 7.04 �� ��%! 13.53Nei 452031 �� $ � ��� ��� 27.12 �� �#% � 65.24 4.04 �� ��%�! 13.66Nei 452017 �� $ � ��� ��� 52.50 �� ��% � 67.03 8.37 �� ��%! 13.83Nei 452019 �� $ � ��� ��� 47.21 �� ��% � 63.26 7.20 �� �!%�� 14.51Nei 452010 �� $ � ��� ��� 31.58 �� �#% � 70.92 5.25 �� �!%�� 16.45
Table 5. Percentage of grain damage and grain weight loss caused by maize weevil on hybrids after 90 days of storage,Nakhon Sawan Field Crops Research Center, Thailand.
Inbred line % grain % grain Level ofdamage1 weight loss resistance2
Nei 452008 ��� �� ����"���� �� ������� ��� �� ��������� �� �����#� ��� �� ����� � 27.12-73.92 4.04-9.67 RNei 452004 ��� �� ����� ��� �� ����"�� ��� �� ����"���� �� ������� ��� �� ����"��Nei 412019 ��� �� ��������� �� ������� ��� �� ����� ��� �� ����� � ��� �� ����� �Nei 412019 ��� �� �����!��� �� ������� ��� �� ����"���� �� ������� ��� �� �����!�Nei 452004 ��� �� �����#��� �� ����� � ��� �� �����#��� �� ����� � ��� �� ����� �Nei 452004 ��� �� ������Nei 452004 ��� �� ��������� �� ����� � ��� �� ����"���� �� �����#� ��� �� ����"�� 47.21-83.21 10.48-14.20 MRNei 452017 ��� �� ����"���� �� ������� ��� �� ��������� �� ������� ��� �� ����"��Nei 452004 ��� �� ����"���� �� ����� � ��� �� ����"���� �� ����� � ��� �� �����#�Nei 452008 ��� �� ����� ��� �� ����� � ��� �� ����"���� �� ������� ��� �� �����#�Nei 452017 ��� �� ����"���� �� �����!� ��� �� ����� ��� �� ����� � ��� �� ����� �Nei 452010 ��� �� �����!��� �� ����� � ��� �� ������Nei 412019 ��� �� ��������� �� �����!� ��� �� ����� ��� �� ������� ��� �� ����� � 52.78- 86.90 17.33-27.84 SNei 452010 ��� �� ����� ��� �� ������� ��� �� �����!��� �� ������� ��� �� �����#�Nei 412019 ��� �� ����"���� �� ����� � ��� �� ����"���� �� �����#� ��� �� ����"��Nei 452017 ��� �� �����#��� �� ����� � ��� �� ����"���� �� ������� ��� �� ����"��Nei 452010 ��� �� ����� CP-DK 888 64.51 10.71 MRBig 919 59.11 12.00 MRNK 48 50.61 6.63 RNS 2 56.85 11.48 MRNS 72 76.56 15.93 MRMean 62.52 12.86F-test ns3 nsCV (%) 29.42 33.88
1. Data were analyzed by transformation to arc sine and shown in the table as back transformed data. CV (%) was calculated bytransformed data.
2. Level of resistance based on percentage of grain weight loss (R = Resistant; MR = Moderately resistant; S = Susceptible) as perBergvinson (2003).
3. ns = Nonsignificant.
371
����� � ���� ����������� �������
Horber E. 1987. Methods to detect and evaluate resistance inmaize to grain insects in the field and in storage. Pages140-150 in Toward insect-resistant maize for the ThirdWorld: proceedings of the International Symposium onMethodologies for Developing Host Plant Resistance toMaize Insects. Mihm J.A. (ed.). CIMMYT, Mexico, 9-14 March 1987.
Ketunuti U. 1982. (In Thai.) Entomopathogenic viruses incontrolling insect pests. Pages 147-156 in Bioloical controlof insect pests for sustainable agriculture. Bangkok,Thailand: Department of Agriculture, Ministry ofAgriculture and Cooperatives. ISBN 974-7624-08-7. (InThai.)
Kongkanjana A. and Choonhawong W. 1991. (In Thai.) Insectpests in maize and economic field crops. Sixth TrainingCourse on Insect Pests and Management, June 19-28,1991, Entomology and Zoology Division, Department ofAgriculture.
Sukprakran C., Nualvatana K. and Pulsawat P. 1982. (In Thai.)Screening test of some grain protectant insecticides toprevent corn seed from Sitophilus zeamais Motsch.Annualreport. Stored Product Insect Research Group, Divisionof Entomology and Zoology, Department of Agriculture.
372
������� �� �� ����� ������� ����� ���������������
IntroductionMaize (Zea mays L.) is attacked by a number of insect
pests in India. Mathur (1987) observed that over 250 insectspecies are associated with maize in field and storageconditions. Of these, 74 have only appeared recently andabout a dozen are of potential economic importance (Mathur1992). Lepidopteran pests, particularly stem borers, aremajor constraints to productivity and are of economicimportance in most maize-growing countries around theworld. Of these, the maize stem borer, Chilo partellus(Swinhoe), is an important pest. Yield losses of 24.3-36.3%have been estimated due to it (Chatterji et al. 1969). It hasbeen shown that the feeding, growth and development ofC. partellus larvae depend on both the physical andchemical characteristics of the host plant (Khan et al. 2006;van den Berg 2006) as is reflected by their performance onresistant cultivars of maize compared to susceptible ones(Dass andAggarwal 1993). Different control measures havebeen recommended against this pest. Cultural practiceslike intercropping, balanced fertilization, appropriate plantpopulation density and use of least susceptible varietieshave been effective in its management. Insects haveselective preferences of the host plant, plant age, site andtime of oviposition to give their progeny a better chanceof survival. Eggs and neonate larvae remain exposed tonatural enemies and hence are vulnerable during thesestages. It is, therefore, easy to manage the population of
this pest at this stage by use of biological and chemicalpesticides. Thus information on the ovipositionalpreferences of C. partellus can be used in the managementof this pest in the egg stage.
Materials and MethodsChilo partellus larvae were collected by splitting
infested maize stalks obtained from the field. They werereared on cut pieces of maize stems (7.5 cm long) tillpupation. Pupae thus collected were kept in glass rearingjars (10 cm��������%�&���� � � �� ���� �������$��'( )�Female) were transferred to oviposition jars kept at 27o��oCas per the method described by Siddiqui et al. (1977). Egg-laying was examined on alternate days and portions ofbutter paper containing the egg mass were cut andincubated at 27o��oC. Live moths were again transferred tofresh egg-laying jars and kept in the BOD for further egg-laying. The eggs thus obtained served as a nucleus for themass rearing of C. partellus on an artificial diet in thelaboratory. To study the ovipositional behavior of C.partellus on maize and its intercrops, maize hybrid Bio-9681 along with five intercrops (groundnut, cowpea,soybean, green gram and black gram) were sown in a nethouse covered with a nylon mesh during the kharif (rainyseason) of 2006. Fifteen days after sowing (DAS), 21 pairsof laboratory-reared, one-day-old C. partellus moths were
Reduction of Chilo partellus Egg Load through Intercropingin Maize
Pradyumn Kumar*, Shivnand Naikwadi, J.C. Sekhar and Sain DassDirectorate of Maize Research, Pusa Campus, New Delhi 110012, India.*E-mail: [email protected]
Abstract. Studies on the ovipositional behavior of Chilo partellus (Swinhoe) in maize agroecosystems were conductedduring the kharif (rainy season) of 2006 in the entomology unit of the Directorate of Maize Research, IndianAgricultural Research Institute (IARI), New Delhi, India. In order to determine the influence of intercropping onoviposition, five crops �������������� ��������������������������������������������������� ������������hybrid Bio-9681. The number of eggs laid per maize plant was lowest when maize was intercropped with cowpea,and highest when intercropped with soybean followed by black gram, groundnut and green gram. Conversely, theaverage number of eggs per plant on cowpea was highest while soybean plants did not attract females foroviposition. Likewise, the least number of egg patches was observed on maize plants in maize-cowpea intercroppingand the most in maize-soybean intercropping. On the other hand, the maximum number of egg patches per plantwere observed on cowpea intercropped with maize followed by groundnut, green gram and black gram. The plantheight of the intercrop influenced the oviposition of C. partellus moths: there were significant differences in thenumber of eggs laid on maize at different heights. The tallest plants of cowpea attracted C. partellus moths to lay themaximum number of eggs per plant but no such relation was observed in the other crops. Chilo partellus egg loadwas considerably reduced on maize when it was intercropped with cowpea.
Key words: Maize, Chilo partellus, oviposition, intercrops
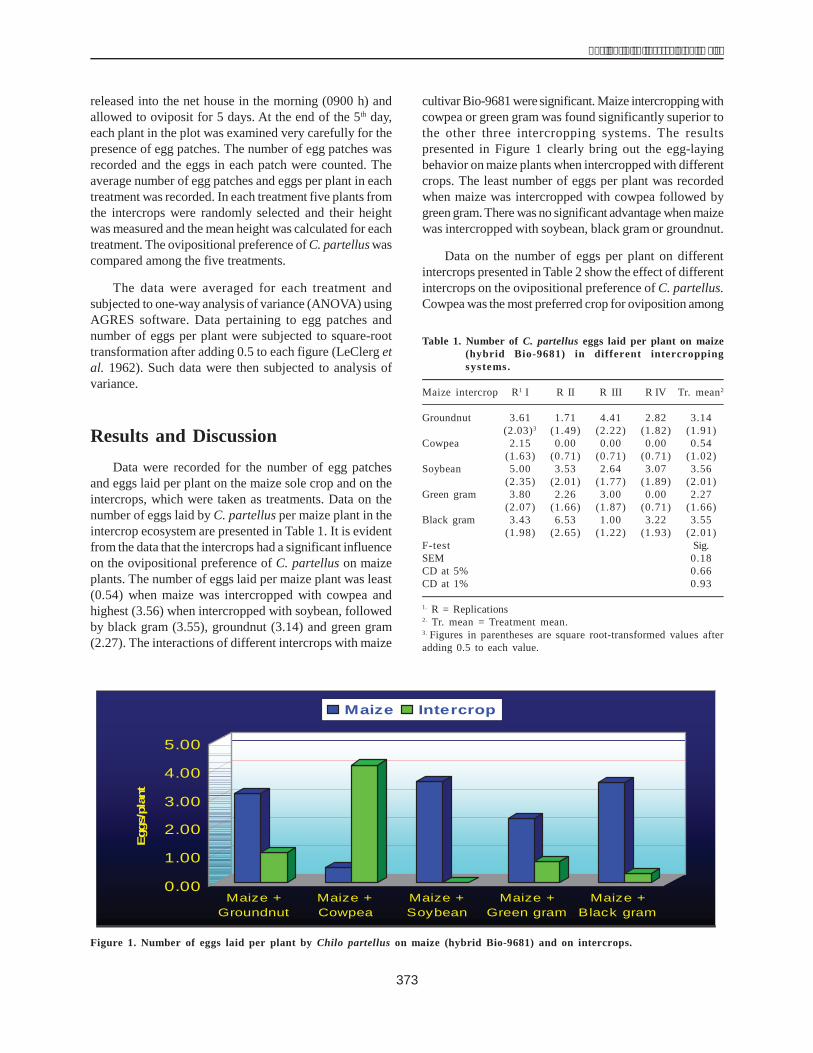
373
����� � ���� ����������� �������
released into the net house in the morning (0900 h) andallowed to oviposit for 5 days. At the end of the 5th day,each plant in the plot was examined very carefully for thepresence of egg patches. The number of egg patches wasrecorded and the eggs in each patch were counted. Theaverage number of egg patches and eggs per plant in eachtreatment was recorded. In each treatment five plants fromthe intercrops were randomly selected and their heightwas measured and the mean height was calculated for eachtreatment. The ovipositional preference of C. partellus wascompared among the five treatments.
The data were averaged for each treatment andsubjected to one-way analysis of variance (ANOVA) usingAGRES software. Data pertaining to egg patches andnumber of eggs per plant were subjected to square-roottransformation after adding 0.5 to each figure (LeClerg etal. 1962). Such data were then subjected to analysis ofvariance.
Results and DiscussionData were recorded for the number of egg patches
and eggs laid per plant on the maize sole crop and on theintercrops, which were taken as treatments. Data on thenumber of eggs laid by C. partellus per maize plant in theintercrop ecosystem are presented in Table 1. It is evidentfrom the data that the intercrops had a significant influenceon the ovipositional preference of C. partellus on maizeplants. The number of eggs laid per maize plant was least(0.54) when maize was intercropped with cowpea andhighest (3.56) when intercropped with soybean, followedby black gram (3.55), groundnut (3.14) and green gram(2.27). The interactions of different intercrops with maize
cultivar Bio-9681 were significant. Maize intercropping withcowpea or green gram was found significantly superior tothe other three intercropping systems. The resultspresented in Figure 1 clearly bring out the egg-layingbehavior on maize plants when intercropped with differentcrops. The least number of eggs per plant was recordedwhen maize was intercropped with cowpea followed bygreen gram. There was no significant advantage when maizewas intercropped with soybean, black gram or groundnut.
Data on the number of eggs per plant on differentintercrops presented in Table 2 show the effect of differentintercrops on the ovipositional preference of C. partellus.Cowpea was the most preferred crop for oviposition among
Table 1. Number of C. partellus eggs laid per plant on maize(hybrid Bio-9681) in different intercroppingsystems.
Maize intercrop R1 I R II R III R IV Tr. mean2
Groundnut 3.61 1.71 4.41 2.82 3.14(2.03)3 (1.49) (2.22) (1.82) (1.91)
Cowpea 2.15 0.00 0.00 0.00 0.54(1.63) (0.71) (0.71) (0.71) (1.02)
Soybean 5.00 3.53 2.64 3.07 3.56(2.35) (2.01) (1.77) (1.89) (2.01)
Green gram 3.80 2.26 3.00 0.00 2.27(2.07) (1.66) (1.87) (0.71) (1.66)
Black gram 3.43 6.53 1.00 3.22 3.55(1.98) (2.65) (1.22) (1.93) (2.01)
F-test Sig.SEM� 0.18CD at 5% 0.66CD at 1% 0.93
1. R = Replications2. Tr. mean = Treatment mean.3. Figures in parentheses are square root-transformed values afteradding 0.5 to each value.
0.00
1.00
2.00
3.00
4.00
5.00
Egg
s/pl
ant
Maize +Groundnut
Maize +Cowpea
Maize +Soybean
Maize +Green gram
Maize +Black gram
Maize Intercrop
Figure 1. Number of eggs laid per plant by Chilo partellus on maize (hybrid Bio-9681) and on intercrops.
374
������� �� �� ����� ������� ����� ���������������
the five intercrops. The average number of eggs per planton cowpea was 4.15 while in contrast soybean plants didnot attract C. partellus females for oviposition. The otherexperimental intercrops, ie, groundnut, green gram and blackgram, received 1.06, 0.74 and 0.33 eggs per plantrespectively.
Data presented in Table 3 reveal a similar trend in thecase of the number of egg patches per plant laid on maizewhen intercropped with different crops. The least numberof egg patches per maize plant (0.02) was observed in themaize-cowpea intercrop and the most (0.17) in the maize-soybean intercrop. The number of egg patches per maizeplant in both maize-groundnut and maize-black gram
intercropping were 0.13. The maize-green gramintercropping had relatively fewer egg patches per plant,ie, 0.08. Maize-cowpea intercropping showed a positiveeffect in reducing the number of egg patches laid by C.partellus on maize and differed significantly from all theother treatments (Fig. 2).
Data on the number of egg patches per plant laid onthe crops that were intercropped with maize showed theovipositional preference of C. partellus (Table 4). Themaximum number of egg patches per plant were observedon cowpea (0.16) followed by groundnut (0.06), green gram(0.03) and black gram (0.01). Soybean plants were notpreferred for oviposition by C. partellus. The number
0.00
0.04
0.08
0.12
0.16
0.20
Egg
patc
hes/
plan
t
Maize +Groundnut
Maize +Cowpea
Maize +Soybean
Maize +Green gram
Maize +Black gram
Maize Intercrop
Figure 2. Number of egg patches laid per plant by C. partellus on maize and on intercrops.
Table 2. Number of eggs laid per plant by Chilo partelluswhen maize is intercropped with different crops.
Treatment R1 I R II R III R IV Tr. mean2
Groundnut 2.37 0.00 0.00 1.89 1.06(1.69)3 (0.71) (0.71) (1.55) (1.25)
Cowpea 4.75 2.78 5.40 3.68 4.15(2.29) (1.81) (2.43) (2.04) (2.16)
Soybean 0.00 0.00 0.00 0.00 0.00(0.71) (0.71) (0.71) (0.71) (0.71)
Green gram 0.00 1.13 0.00 1.85 0.74(0.71) (1.27) (0.71) (1.53) (1.12)
Black gram 1.31 0.00 0.00 0.00 0.33(1.35) (0.71) (0.71) (0.71) (0.91)
F test Sig.SEM� 0.13CD at 5% 0.54CD at 1% 0.76
1. R = Replication.2. Tr. mean = Treatment mean.3. Figures in parentheses are square root transformed values afteradding 0.5 to each value.
Table 3. Number of egg patches per plant laid on maize byC. partellus when intercropped with different crops.
Treatment R1 I R II R III R IV Tr. mean2
Groundnut 0.15 0.07 0.18 0.12 0.13(0.81)3 (0.76) (0.82) (0.79) (0.79)
Cowpea 0.08 0.00 0.00 0.00 0.02(0.76) (0.71) (0.71) (0.71) (0.72)
Soybean 0.20 0.20 0.14 0.13 0.17(0.84) (0.84) (0.80) (0.80) (0.82)
Green gram 0.13 0.07 0.13 0.00 0.08(0.80) (0.75) (0.80) (0.71) (0.76)
Black gram 0.13 0.23 0.08 0.09 0.13(0.79) (0.85) (0.76) (0.77) (0.80)
F-test SigSEM� 0.01CD at 5% 0.04CD at 1% 0.06
1. R = Replication.2. Tr. mean = Treatment mean.3. Figures in parentheses are square-root transformed valuesafter adding 0.5 to each value.
375
����� � ���� ����������� �������
varied significantly with the intercrop, ranging from 0.00per plant in soybean to 0.16 in cowpea.
Among the five crops intercropped with maize, theirheights at 15 DAS significantly differed from each otherexcept soybean and black gram. The maximum height of33.50 cm was for cowpea followed by 30.90 cm, 28.38 cm,28.08 cm, 19.40 cm for green gram, black gram, soybeanand groundnut respectively (Table 5; Fig. 3). Plant heightsof the intercrops had a direct influence on the ovipositionof C. partellus moths in terms of significant differences inthe number of eggs laid on intercrops at different heights(Fig. 3). The tallest crop, cowpea, received the highestnumber of eggs per plant (Table 2) but no correlation wasnoticed when observed in other intercrops. Though taller
crops attracted more moths for oviposition, this was notthe case for soybean.
Our study was aimed at identifying suitable crops thatcould be intercropped with maize to reduce the C. partellusegg load on the maize crop. Intercrops influence theoviposition in many ways: they compete for ovipositionwith the main crop; they mask the main crop, thus limitingthe access of females. The search for a suitable host alsomight require excessive energy and time, which might affectthe rate of reproduction. Furthermore, expenditure ofenergy may increase mortality among the population, thusreducing the adult numbers that reach the intercroppedhost plant compared with host plants grown inmonoculture.
The importance of intercropping as a method forcontroling stem borers in sorghum and maize has beenreported (Amoako-Atta and Omolo 1983;Ampong-Nyarkoet al. 1994; Skovgaard et al. (1996); Ayisi et al. 2001;
Table 4. Number of egg patches laid per plant by C. partelluson different crops when intercropped with maize.
Treatment R1 I R II R III R IV Tr. mean2
Groundnut 0.13 0.00 0.00 0.11 0.06(0.79)3 (0.71) (0.71) (0.78) (0.75)
Cowpea 0.25 0.07 0.20 0.13 0.16(0.87) (0.76) (0.84) (0.79) (0.81)
Soybean 0.00 0.00 0.00 0.00 0.00(0.71) (0.71) (0.71) (0.71) (0.71)
Green gram 0.00 0.06 0.00 0.05 0.03(0.71) (0.75) (0.71) (0.74) (0.73)
Black gram 0.05 0.00 0.00 0.00 0.01(0.74) (0.71) (0.71) (0.71) (0.72)
F-test Sig.SEM� 0.01CD at 5% 0.04CD at 1% 0.06
1. R = Replication.2. Tr. Mean = Treatment mean.3. Figures in parentheses are square-root transformed valuesafter adding 0.5 to each value.
0.00
1.00
2.00
3.00
4.00
5.00
Groundnut cowpea Soybean Green gram Black Gram
Eg
gs
/p
l
0.00
10.00
20.00
30.00
40.00
He
igh
tin
Eggs/plant Height in cm
Figure 3. Effect of the height of intercrops on the oviposition preference of C. partellus.
Table 5. Mean plant height (cm) of different intercropswhen sown with maize.
Treatment R1 I R II R III R IV Tr. mean2
Groundnut 18.80 19.70 19.20 19.90 19.40Cowpea 34.80 32.30 33.40 33.50 33.50Soybean 28.00 28.10 29.00 27.20 28.08Green gram 31.60 31.20 30.10 30.70 30.90Black gram 28.70 27.70 28.50 28.60 28.38F-test Sig.SEM� 0.36CD at 5% 1.13CD at 1% 1.59
1. R = Replication.2. Tr. mean = Treatment mean.
376
������� �� �� ����� ������� ����� ���������������
Ndemah et al. 2003). Among the five crops intercroppedwith maize for this study, cowpea was preferred most by C.partellus for oviposition, as was evident from the numberof eggs laid per cowpea plant (4.15). The females exhaustedtheir eggs on cowpea, and, consequently, the egg load onmaize plants was reduced substantially (0.54 eggs perplant). This finding is in variance with Paets et al. (1997),who studied the influence of intercropping on theabundance, distribution and parasitism of C. partellus andC. orichalcociliellus in maize. They did not observe asignificant difference in the number of egg batches perplant between the treatments, and batches were randomlydistributed on both cowpea and maize plants. Maluleke etal. (2005) studied C. partellus incidence in sole-culturemaize and in maize/lablab intercropping. They observedthat stem borer infestation was more severe in sole-culturemaize than maize in the maize/lablab intercrop. Kwesi et al.(1994) also recorded a reduction in C. partellus incidencein sorghum when intercropped with cowpea. Jiang et al.(2006), while studying the effect of mixed-cropping systemscontaining maize, sorghum, millet and beans on infestationof stem borers, found that systems containing the nonhostbean were more efficient in reducing pest densities thanthose with millet or sorghum only. In our study,intercropping reduced the oviposition load of C. partellusto varying degrees on maize.
Heavy egg-laying on cowpea may be primarily becauseof the preference of C. partellus for cowpea, but the heightof cowpea plants may also be responsible for masking themaize plant, thus compelling the females to unload theireggs on cowpea. The pest also laid some eggs ongroundnut (1.06 eggs per plant). Soybean, green gram andblack gram may not be suitable crops to be intercroppedwith maize.
Cowpea can be gainfully intercropped with maize asthe heavy egg-laying on it, ie, a nonhost crop, reduces thechances of neonate larvae emerging from egg patches toreach the maize plant. These research findings may beuseful to both farmers and scientists as a way of reducingdamage from C. partellus.
AcknowledgementWe thank Dr. Meenu Agarwal for rendering technical
help for this study.
ReferencesAmoako-Atta B. and Omolo E.O. 1983. Yield losses caused by
stem/pod-borer complex within maize-cowpea-sorghumintercropping systems in Kenya. Insect Sci. Appl. 4:39-46.
Ampong-Nyarko K., Reddy K.V.S, Saxena K.N. and SeshuR.K.V. 1994. Chilo partellus (Swinhoe) (Lep.: Pyralidae)oviposition on nonhosts: a machanism for reduced pestincidence in intercropping. Acta Ecologica 15(4):469-475.
Ayisi K.K., Mposi M.S. and van den Berg J. 2001. Grain yieldresponse and C. partellus infestation in diverse sorghum-cowpea intercrop arrangements. S. Afr. J. Plant Soil. 18:39-41.
Chatterji S.M., Young W.R., Sharma G.C., Sayi I.V., ChahaiB.S., Khare B.P., Rathore Y.S., Panwar V.P.S. and SiddiquiK.H. 1969. Estimation of loss in yield of maize due toinsect pests with special reference to borers. Indian Journalof Entomology 31(2):109-115.
Dass S. and Aggarwal H.C. 1993. Growth of Chilo partellus(Swinhoe) on different maize cultivars. Insect Sci. Appl.14:267-272.
Jiang N., Songa J.M., Schulthess F. and Omwega C. 2006. Therole of intercropping different cereal species in controllinglepidopteran stem borers on maize in Kenya. J. App.Ento.:40-49.
Khan Z.R., Midega C.A.O., Hutter N.J., Wilkins R.M. andWadhams L.J. 2006. Assessment of the potential of Napiergrass (Pennisetum purpureum) varieties as trap plants formanagement of Chilo partellus. Ent. Exp. Applic. 119:15-22.
Ampong-Nyarko K.,�! ����* ��+� ,%-%���+��� *%.%and�!/ ���%�� �%�* �������������� ���� ������0���sorghum and cowpea by intercropping. EntomologiaExperimentalis et Applicata 179-184.
LeClerg E.L., Leonard W.H. and Clark A.G. 1962. Field plottechnique. Minnesota, USA: Burgess Publishing Co.
Maluleke M.H., Addo-Bediako A. and Ayisi K.K. 2005.Influence of maize/lablab intercropping on lepidopterousstem borer infestation in maize. J. of Econ Ent. 98(2):384-388.
Mathur L.M.L. 1987. Bibliography of maize pests in India.New Delhi, India: AICRP, Indian Agricultural ResearchInstitute.
Mathur L.M.L. 1992. Insect pest management and its future inIndian maize programme: proceedings of the EleventhInternational Congress of Entomology, June 27-July 4,1992, Bejing, China.
Ndemah R., Schulthess F., Korie S., Borgemeister C., PoehlingH.M. and Cardwell K.F. 2003. Factors affecting infestationof the stalk borer Busseola fusca (Lepidoptera: Noctuidae)on maize in the forest zone of Cameroon with specialreference to scelionid egg parasitoids. Env. Ent. 32:51-60.
377
����� � ���� ����������� �������
Paets P, Ekbom B. and Skovgaard H. 1997. Influence ofintercropping on the abundance, distribution andparasitism of Chilo spp (Lepidoptera: Pyralidae) eggs.Bul. of Ent. Res. 87(5):507-513.
Siddiqui K.H., Sarup P., Panwar V.P.S. and Marwaha K.K. 1977.Evolution of base ingredients to formulate artificial dietfor the mass rearing of Chilo partellus (Swinhoe). J. Ent.Res. 2(2):117-131.
Skovgaard H., Paets P. and Ekbom B. 1996. Influence ofintercropping on the abundance, distribution andparasitism of Chilo spp. (Lepidoptera: Pyralidae) eggs.Bul. of Ent. Res. 87(5):507-513.
van den Berg J. 2006. Oviposition preference and larval survivalof Chilo partellus (Lepidoptera: Pyralidae) on Napier grass(Pennisetum purpureum) trap crops. Int. J. Pest Manage.52�$��:39-44.
378
������� �� �� ����� ������� ����� ���������������
IntroductionThe Philippines is ranked 13th among countries
cultivating GM crops over 50 000 ha or more (James 2007).Bt corn is grown over more than 300 000 ha in the country.The Philippines was the first country in Asia to formulatebiosafety rules and regulations for GM crops in whichInsect Resistance Management is a major component.Insect Resistance Management (IRM) refers to thedeployment of a combination of strategies designed toreduce the risk of the target insect (in this case Asian cornborer) developing resistance to the product (Bt corn). Arefuge-plus-high-dosage strategy is recommended for IRMof most varieties of transgenic insecticide corn (Andow etal. 2000;Andow and Hutchinson 1998;Alstad and Andow1996). This paper is aimed at documenting and sharing thePhilippines experience in IRM.
Biosafety Regulations on GMOs
In 1987, an ad hoc committee on biosafety was set updrawing participation from the University of the PhilippinesLos Ba������� �1�� �����(�*�� �* � ���1������� �$1**1�
and the Department of Agriculture. The committeerecommended:
o creation of a National Committee on Biosafetyo formulation of national policies and guidelines on
biosafetyThe National Committee on Biosafety of the
Philippines was created in 1990 by an executive order (430S of 1990). It is an interagency body (with the participationof the Department of Health, the Department of Scienceand Technology, the Department of Agriculture and theDepartment of Environment and Natural Resources) withfour scientists and two community representatives. Thecommittee is replicated at various institutions such as theUniversity of the Philippines Los Ba���� ������Institutional Biosafety Committees. This committee
o issues guidelines (for experimental use);o conducts risk assessments with the Scientific and
Technical Review Committee (STRP); ando evaluates risks related to Potentially Harmful Exotic
Species (PHES).
Insect Resistance Management: the Philippines Experience
B.F. Cayabyab1*, W.R. Cuaterno2, E.P.Alcantara3, S.C. Halos4, J.M. Belen1 and M. Salazar5
1. National Crop Protection Center ��2���3�� ������2(��� ��&��4 ���+������ �3��(����� ��5���6�����2�(( � �Laguna 4031, the Philippines
2. Bureau of Plant Industry, San Andres, Malate, Manila, the Philippines3. Institute of Biotechnology, University of the Philippines Los Ba���4. Department of Agriculture, Biotechnology Advisory Team, Quezon City, the Philippines5. Institute of Plant Breeding, University of the Philippines Los Ba���*E-mail: [email protected]
Abstract. Bt corn is cultivated over about 300 000 ha in the Philippines, which ranks 13th among countriescultivating genetically modified (GM) crops over 50 000 ha or more. The Philippines was the first country in Asia toformulate biosafety rules and regulations on GM crops. Insect Resistance Management (IRM) is a major componentof the measures prescribed by the Philippines government governing the cultivation of GM crops such as Bt corn. Inthis paper, we present an outline of the cooperative endeavors relating to Bt corn taken up by technology developers(Monsanto, Pioneer, Syngenta and academic institutions), regulators, farmers and scientists. So far, there has beenno observed development of resistance by from Asian corn borer to Bt corn. The country������������������������services of the IRM Technical Advisory Team of the Department of Agriculture of the Government of the Philippines.This strategy has been incorporated into the requirements stipulated for the continued commercialization of Bt corn(MON 810) by Monsanto. Soon, RR soybean, Bt cotton, PRSV-resistant papaya, vitamin A-fortified rice and Bteggplant will be commercially available in the country.
Key words: Bt corn, Insect Resistance Management, Philippines, Asian corn borer
AO: Administrative Order, DA: Department of Agriculture, DENR: Department of Environment and Natural Resources,DOH: Department of Health, DOST: Department of Science and Technology, EO: Executive Order, MemorandumCircular, SO: Special Order
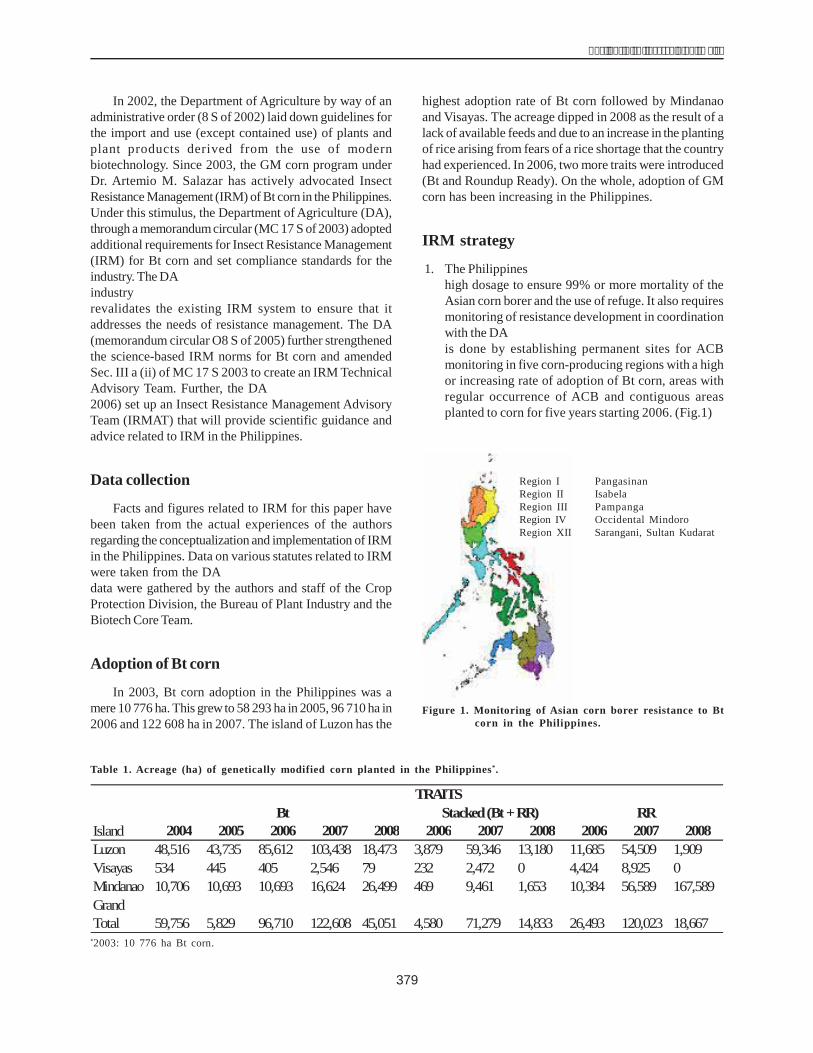
379
����� � ���� ����������� �������
In 2002, the Department of Agriculture by way of anadministrative order (8 S of 2002) laid down guidelines forthe import and use (except contained use) of plants andplant products derived from the use of modernbiotechnology. Since 2003, the GM corn program underDr. Artemio M. Salazar has actively advocated InsectResistance Management (IRM) of Bt corn in the Philippines.Under this stimulus, the Department of Agriculture (DA),through a memorandum circular (MC 17 S of 2003) adoptedadditional requirements for Insect Resistance Management(IRM) for Bt corn and set compliance standards for theindustry. The DA���6� �����3(���1�����+�$631���������industry�������(��� �7����1*'��������� 4� 7����revalidates the existing IRM system to ensure that itaddresses the needs of resistance management. The DA(memorandum circular O8 S of 2005) further strengthenedthe science-based IRM norms for Bt corn and amendedSec. III a (ii) of MC 17 S 2003 to create an IRM TechnicalAdvisory Team. Further, the DA����� ��(��� �$!�!���2006) set up an Insect Resistance Management AdvisoryTeam (IRMAT) that will provide scientific guidance andadvice related to IRM in the Philippines.
Data collection
Facts and figures related to IRM for this paper havebeen taken from the actual experiences of the authorsregarding the conceptualization and implementation of IRMin the Philippines. Data on various statutes related to IRMwere taken from the DA������4 ����8�� ����%�9� (�data were gathered by the authors and staff of the CropProtection Division, the Bureau of Plant Industry and theBiotech Core Team.
Adoption of Bt corn
In 2003, Bt corn adoption in the Philippines was amere 10 776 ha. This grewto 58 293 ha in 2005, 96 710 ha in2006 and 122 608 ha in 2007. The island of Luzon has the
highest adoption rate of Bt corn followed by Mindanaoand Visayas. The acreage dipped in 2008 as the result of alack of available feeds and due to an increase in the plantingof rice arising from fears of a rice shortage that the countryhad experienced. In 2006, two more traits were introduced(Bt and Roundup Ready). On the whole, adoption of GMcorn has been increasing in the Philippines.
IRM strategy
1. The Philippines��1*'���� �+����6�����������(� ��high dosage to ensure 99% or more mortality of theAsian corn borer and the use of refuge. It also requiresmonitoring of resistance development in coordinationwith the DA���1*'�3����'�� � ���: �%�:���is done by establishing permanent sites for ACBmonitoring in five corn-producing regions with a highor increasing rate of adoption of Bt corn, areas withregular occurrence of ACB and contiguous areasplanted to corn for five years starting 2006. (Fig.1)
Table 1. Acreage (ha) of genetically modified corn planted in the Philippines*.
TRAITS
Island 2004 2005 2006 2007 2008 2006 2007 2008 2006 2007 2008Luzon 48,516 43,735 85,612 103,438 18,473 3,879 59,346 13,180 11,685 54,509 1,909Visayas 534 445 405 2,546 79 232 2,472 0 4,424 8,925 0Mindanao 10,706 10,693 10,693 16,624 26,499 469 9,461 1,653 10,384 56,589 167,589GrandTotal 59,756 5,829 96,710 122,608 45,051 4,580 71,279 14,833 26,493 120,023 18,667
Bt Stacked(Bt+RR) RR
*2003: 10 776 ha Bt corn.
Figure 1. Monitoring of Asian corn borer resistance to Btcorn in the Philippines.
Region I PangasinanRegion II IsabelaRegion III PampangaRegion IV Occidental MindoroRegion XII Sarangani, Sultan Kudarat
380
������� �� �� ����� ������� ����� ���������������
2. The IRM strategy also monitors industry compliancewith biosafety norms and provides support to relatedresearch studies and capability-building efforts bythe participating agencies. Compliance is ensured bysubmission of Bt adoption reports at the municipallevel every two months; submission of reports relatingto IRM awareness training programs, and submissionof reports on industry��� ���( � ������� ��� �� enhanced IRM plan.
3. Another part of the IRM strategy is to educate allstakeholders in collaboration with the DA, theUniversity of the Philippines Los Ba����� �� �;.��Biotechnology Advisory Team, BPI, NGOs (BiotechCoalition of the Philippines) and the technologydevelopers (Monsanto, Syngenta, Pioneer). Thisinvolves organizing IRM awareness training programsfor farmers and seminars on IRM for DA/RCPCpersonnel involved in IRM
4. The strategy also includes mitigating measures suchas planting 80% Bt corn and 20% non-Bt corn and itsisolines over 200 ha of continguous area and placinga cap on sales in areas with 95% adoption rate.
5. Another part of the IRM strategy is to hold regularreviews of the IRM strategy by IRMAT and otherstakeholders.
Industry������������ �����
1. Monitoring adoption by determining the physicalareas in each municipality
2. Focused ACB resistance monitoring activities in Btcorn-growing areas which may possibly reach thecontiguous 200 ha zone due to continuous corncropping.
3. Increasing the frequency of reporting Bt adoptionfrom seasonally to bimonthly.
4. Deploying other Bt genes with a different mode ofaction
5. Mitigating measure such as deployment of nonBt cornfor about 1 month following Bt corn adoption of 80%for two consecutive seasons
6. Educating distributors, financiers, dealers andfarmers on IRM:
� Establishment of linkages with agriculturaltraining institutes and local government units todisseminate information on IRM to farmers
� Updating IRM modules as new informationbecomes available
Research and development activities takenup
Crop life/Technology developers1. Baseline population susceptibility2. Alternate-host and biology of ACB and its alternate-
host preferences3. IPM relating to ACB, predator population and ACB
damage on Bt and isohybrids4. Insect biodiversity for flying insects5. Developmental period, mating period and
ovipositional preference of ACB in some yellow cornvarieties
PBS-BBI-USAID-supported projects1. Investigation of secondary ecological effects of Bt
corn in the Philippines. Alcantara et al. (2004-2009),Institute of Biotechnology, University of thePhilippines Los Ba���%
2. Post-commercialization monitoring of Asian cornborer (Ostrinia furnacalis Guenee) resistance to Btcorn in the Philippines and the impact of pollendispersal on nontarget Lepidoptera. Cayabyab et al.(2006-2009) NCPC-CPC, University of the PhilippinesLos Ba���%
3. Ecosystems approach in the assessment of the impactsof herbicide-tolerant corn on wild biodiversity inselected areas in Luzon, the Philippines. C.I.Villamor(2005-2009).The concerns that need to be addressed are: (1)
farmers���� ����92 seeds of RR and stacked corn; (2) needfor an accurate method of estimating adoption rates; (3)farmers������� ���� ������<���=��<��<<��������4����>(4) continuing IRM education of farmers; and (5) need forsensitive methods of detecting resistance.
ConclusionCommercial use of Bt corn in the Philippines is
increasing. An Insect Resistance Management (IRM)strategy is needed to prolong the benefits of thistechnology. Current concerns related to IRM needimmediate attention. The cooperation of all stakeholdersis a prerequisite for successful IRM in the Philippines.
381
����� � ���� ����������� �������
AcknowledgementWe acknowledge the sponsorship of the Department
of Agriculture, the Indonesian Agency for AgriculturalResearch and Development (IAARD), the Government ofSouth Sulawesi, the International Maize and WheatImprovement Center (CIMMYT) and the IndonesianCereals Research Institute (ICERI). The support of theUniversity of the Philippines Los Ba�������36!<661<USAID is also gratefully acknowledged. We are alsothankful to Ms. Alice G. Aquino for the layout andpreparation of this paper.
ReferencesAlstad D.M. and Andow D.A. 1996. Implementing management
of insect resistance to transgenic crops. Ag. Biotech NewsInfo 8:177-181.
Andow D.A. and Hutchinson W.D. 1998. Bt corn resistancemanagement. Pages 19-66 in Now and news: series newplants to save a natural control. Miller M. and Rissler J.(eds.). Cambridge, Ma, USA: Union of Secured Scientists.
Andow D.A., Olsen D.M., Hellmich R.L., Alstad D.N. andHutchinson W.D. 2000. Frequency of resistance to Bacillusthuringiensis toxin Cry1Ab in Iowa population of cornborer (Lepidoptera: Crambidae). J. Econ. Ent. 93(1):26-30.
James C. 2007. Global strategies of commercialized biotechcrops: brief no. 37. Ithaca, N.Y., USA: ISAA.
382
������� �� �� ����� ������� ����� ���������������
IntroductionMaize production in Indonesia has grown 1.78% per
year, and is projected to reach 12.1 million t in 2009 (BPS2003). One of the strategies for maize development inIndonesia is to increase grain quality, which is dependenton both yield and postharvest handling and storage. Themaize weevil Sitophilus zeamais Motschulsky (Coleoptera:Curculionidae) is the main storage pest of maize (Dobie etal. 1984).Adult weevils mate and deposit eggs in the grainand the larvae emerge to feed on the grain.
Yield losses in storage vary from country to country.In Mexico, 30% yield loss after six months of storage hasbeen reported (Bergvinson 2002). Yield losses caused bymaize weevil in Indonesia are significant. Grain damagewas as high as 85% and weight loss about 17% after storagefor six months in Maros, southern Indonesia (Tandiabang1998). Such heavy losses make insect control strategiesimperative. Use of resistant varieties is one such strategy.The discovery of QPM maize types with the Opaque-2mutant gene, which changes the protein composition andincreases the lysine and tryptophan content, has openeda new perspective for use of maize in human nutrition.However, the soft endosperm of QPM maize may result inhuge damage and loss due to the maize weevil.
It has been reported that the chemical content andphysical characteristics of maize grain influence theoviposition behavior and development of the maize weevil(Jorge 1981). Phenolic acid as a biochemical component ofmaize grain has been correlated with resistance to maizeweevil (Serratos et al. 1987). The purpose of our study
was to measure the phenolic acid content in nine QPMlines and relate it to maize weevil resistance.
Materials and MethodsOur study was conducted at the entomology and
phytophatology laboratory of the Bogor AgricultureInstitute, Indonesia during April-Nov 2003.
Mass rearing of maize weevils
Before mass rearing, the weevils have to be separatedby gender. Species identification was done on the basis ofthe aedeagus and the �Y� shape (Fig. 1), and sexidentification was based on rostral characterictics (Dobieet al.1984; Hidayat et al. 1996; Reddy et al. 1951) (Fig. 2).
About 250 adult maize weevils were put in a jar whichcontained 2 litters of maize, and kept for one week for theinsects to deposit their eggs. The adults were then removedleaving the maize seeds in place for the eggs to developinto adults. Emerging adults of uniform age were used inthe study.
Maize grain preparation
The grain used in this study came from 11 varieties/lines: S99TL YQ-AB, S99TL YQ GH-AB, S99TL YQ-A,Tomegium 8565, S99TL WQ-A, S99TL WQ-AB, S00TLWQ-F/D,ACROSS 8762,POZARICA8563, Sukmaraga andBisma, the latter two being controls. The grain were put in
Effect of Phenolic Acid of QPM Maize Lines on Resistance toMaize Weevil
AndiTenrirawe and J. TandiabangIndonesian Cereal Research Institute, Maros, Indonesia.
Abstract. The objective of this research was to measure the effect of the phenolic acid content of nine QualityProtein Maize (QPM) lines on resistance to the maize weevil (Sitophilus zeamais). The QPM lines tested were S99TLYQ-AB, S99TL YQ GH-AB, S99TL YQ-A, Tomeguin 8565, S99TL WQ-A, S99TL WQ-AB, S99TL WQ (F/D), ACROSS8762 and POZARICA 8563. The varieties Sukmaraga and Bisma were included as resistant and susceptible controls,respectively. Chemical analysis was done on the QPM lines to measure their phenolic acid content. Grain of eachQPM line were infested with the maize weevil. The results indicated that four lines [ACROSS 8762, POZARICA,S99TL WQ-AB and S99TL WQ (F/D)] which had high phenolic acid content had high levels of resistance to maizeweevil.
Key words: Phenolic acid, quality protein maize, Sitophilus zeamais
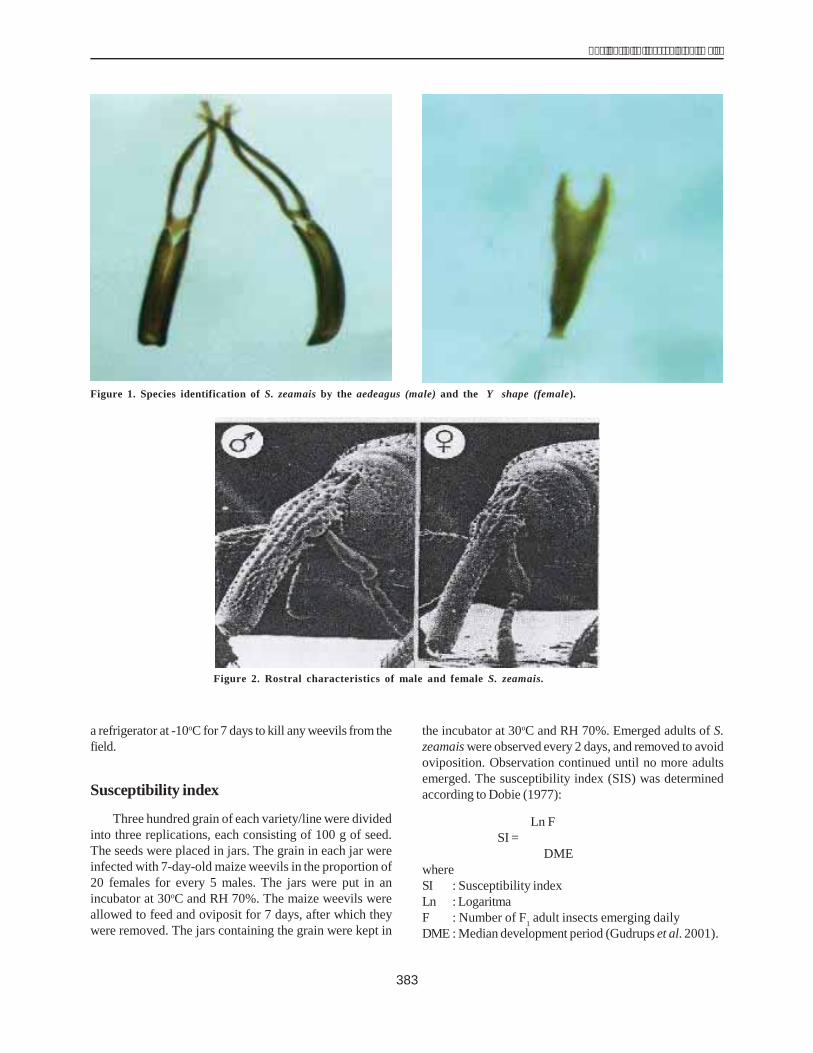
383
����� � ���� ����������� �������
a refrigerator at -10oC for 7 days to kill any weevils from thefield.
Susceptibility index
Three hundred grain of each variety/line were dividedinto three replications, each consisting of 100 g of seed.The seeds were placed in jars. The grain in each jar wereinfected with 7-day-old maize weevils in the proportion of20 females for every 5 males. The jars were put in anincubator at 30oC and RH 70%. The maize weevils wereallowed to feed and oviposit for 7 days, after which theywere removed. The jars containing the grain were kept in
the incubator at 30oC and RH 70%. Emerged adults of S.zeamais were observed every 2 days, and removed to avoidoviposition. Observation continued until no more adultsemerged. The susceptibility index (SIS) was determinedaccording to Dobie (1977):
Ln F �����SI =������
DMEwhereSI : Susceptibility indexLn : LogaritmaF : Number of F1 adult insects emerging dailyDME : Median development period (Gudrups et al. 2001).
Figure 1. Species identification of S. zeamais by the aedeagus (male) and the �Y� shape (female).
Figure 2. Rostral characteristics of male and female S. zeamais.
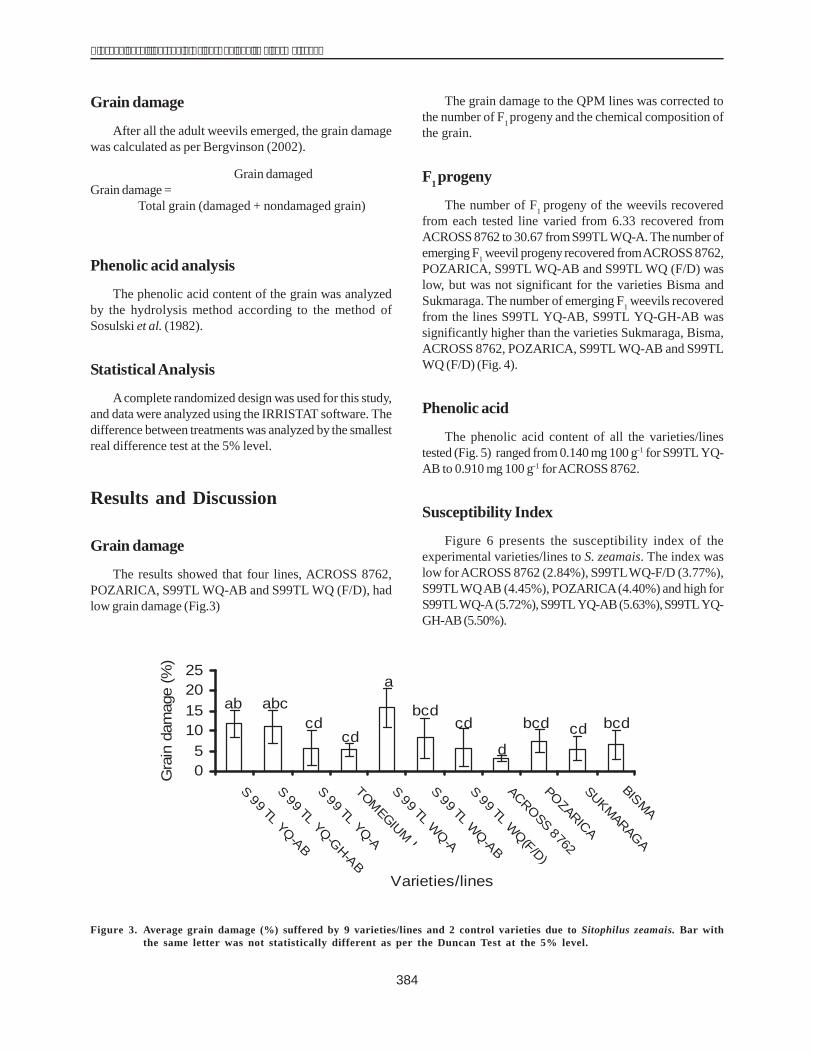
384
������� �� �� ����� ������� ����� ���������������
Grain damage
After all the adult weevils emerged, the grain damagewas calculated as per Bergvinson (2002).
Grain damagedGrain damage = ��������������������
Total grain (damaged + nondamaged grain)
Phenolic acid analysis
The phenolic acid content of the grain was analyzedby the hydrolysis method according to the method ofSosulski et al. (1982).
StatisticalAnalysis
Acomplete randomized design was used for this study,and data were analyzed using the IRRISTAT software. Thedifference between treatments was analyzed by the smallestreal difference test at the 5% level.
Results and Discussion
Grain damage
The results showed that four lines, ACROSS 8762,POZARICA, S99TL WQ-AB and S99TL WQ (F/D), hadlow grain damage (Fig.3)
The grain damage to the QPM lines was corrected tothe number of F1 progeny and the chemical composition ofthe grain.
F1progeny
The number of F1 progeny of the weevils recoveredfrom each tested line varied from 6.33 recovered fromACROSS 8762 to 30.67 from S99TL WQ-A. The number ofemerging F1 weevil progeny recovered fromACROSS 8762,POZARICA, S99TL WQ-AB and S99TL WQ (F/D) waslow, but was not significant for the varieties Bisma andSukmaraga. The number of emerging F1 weevils recoveredfrom the lines S99TL YQ-AB, S99TL YQ-GH-AB wassignificantly higher than the varieties Sukmaraga, Bisma,ACROSS 8762, POZARICA, S99TL WQ-AB and S99TLWQ (F/D) (Fig. 4).
Phenolic acid
The phenolic acid content of all the varieties/linestested (Fig. 5) ranged from 0.140 mg 100 g-1 for S99TL YQ-AB to 0.910 mg 100 g-1 forACROSS 8762.
Susceptibility Index
Figure 6 presents the susceptibility index of theexperimental varieties/lines to S. zeamais. The index waslow forACROSS 8762 (2.84%), S99TLWQ-F/D (3.77%),S99TLWQAB (4.45%), POZARICA(4.40%) and high forS99TLWQ-A(5.72%),S99TLYQ-AB (5.63%),S99TLYQ-GH-AB (5.50%).
Figure 3. Average grain damage (%) suffered by 9 varieties/lines and 2 control varieties due to Sitophilus zeamais. Bar withthe same letter was not statistically different as per the Duncan Test at the 5% level.
05
10152025
S99 TL
YQ-AB
S99 TL
YQ-GH-AB
S99 TL
YQ-A
TOMEGIUM
I
S99 TL
WQ-A
S99 TL
WQ-AB
S99 TL
WQ(F/D)
ACROSS8762
POZARICA
SUKMARAGA
BISMA
Varieties/lines
Gra
inda
mag
e(%
)
ab abccd
cd
a
bcdcd
d
bcd cd bcd
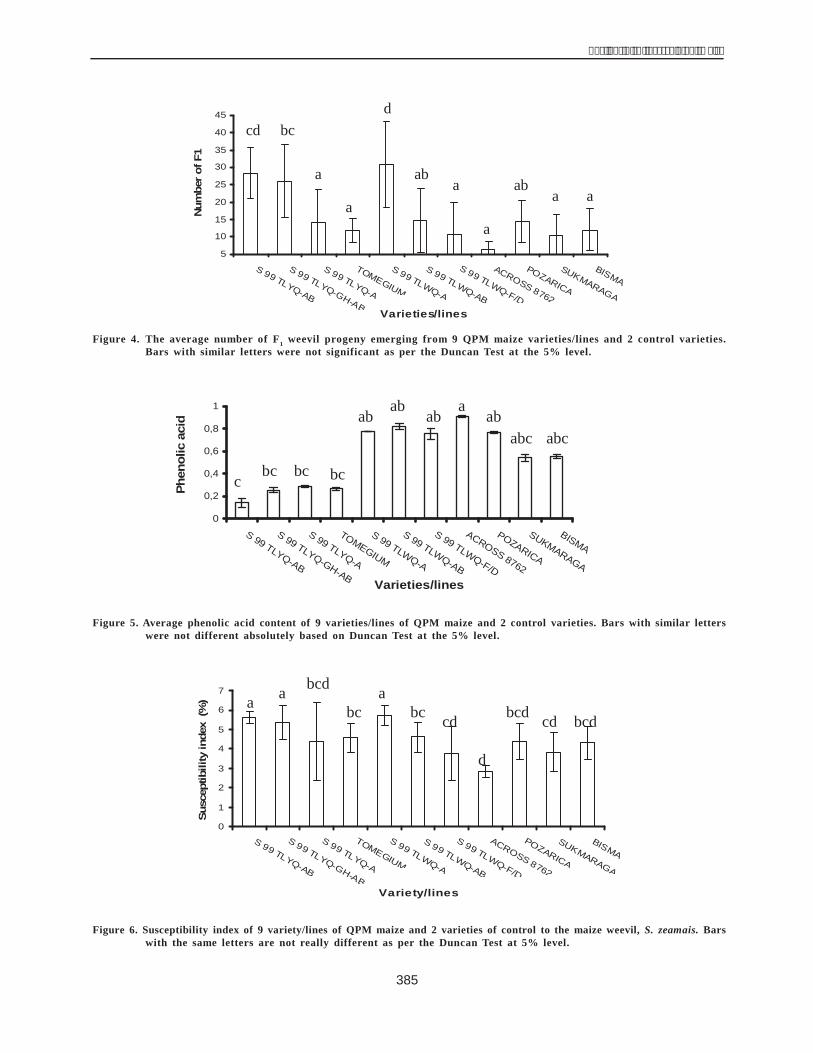
385
����� � ���� ����������� �������
Figure 4. The average number of F1 weevil progeny emerging from 9 QPM maize varieties/lines and 2 control varieties.Bars with similar letters were not significant as per the Duncan Test at the 5% level.
5
10
15
20
25
30
35
40
45
S 99 TLYQ-AB
S 99 TLYQ-GH-AB
S 99 TLYQ-A
TOMEGIUM
S 99 TLWQ-A
S 99 TLWQ-AB
S 99 TLWQ-F/D
ACROSS 8762
POZARICA
SUKMARAGA
BISMA
Varieties/lines
Num
ber
ofF1
cd
a
d
aab
a
a
aba
a
bc
Figure 5. Average phenolic acid content of 9 varieties/lines of QPM maize and 2 control varieties. Bars with similar letterswere not different absolutely based on Duncan Test at the 5% level.
0
0,2
0,4
0,6
0,8
1
S 99 TLYQ-AB
S 99 TLYQ-GH-AB
S 99 TLYQ-A
TOMEGIUM
S 99 TLWQ-A
S 99 TLWQ-AB
S 99 TLWQ-F/D
ACROSS 8762
POZARICA
SUKMARAGA
BISMA
Varieties/lines
Phe
nolic
acid
bc bcbcc
abab
aba
ababc abc
0
1
2
3
4
5
6
7
S 99 TLYQ-AB
S 99 TLYQ-GH-AB
S 99 TLYQ-A
TOMEGIUM
S 99 TLWQ-A
S 99 TLWQ-AB
S 99 TLWQ-F/D
ACROSS 8762
POZARICA
SUKMARAGA
BISMA
Variety/lines
Sus
cept
ibili
tyin
dex
(%)
bc
bcdaa abc
d
bcd bcdcdcd
Figure 6. Susceptibility index of 9 variety/lines of QPM maize and 2 varieties of control to the maize weevil, S. zeamais. Barswith the same letters are not really different as per the Duncan Test at 5% level.
386
������� �� �� ����� ������� ����� ���������������
DiscussionThe results reveal that the QPM lines had low grain
damage, fewer F1 weevil progenies, high phenolic acidcontent and a low susceptibility index. Grain hardness isthe main factor in the beginning of maize weevil infestation(Seshagiri 1953). Hardness of the maize grain is influencedby the phenolic acid content in the seed: the higher thephenolic acid content, the harder the grain. So ovipositionby female weevils was low in lines with higher phenolicacid content (Classen 1990). The harder the grain, the moredifficult it is for the female weevil to penetrate the grain tooviposit eggs. Hard grain lead to lower numbers of weevilprogeny and, therefore, less grain damage. Thesusceptibility index is a factor of the number of F1 progenyemerging and the developing period of the maize weevil.Lines with low SI have lower numbers of emerging progenywith a longer developing period. Arnason et al. (1994)reported that maize genotypes resistant to maize weevilhave a high concentration of diferulic acid compared tosusceptible maize genotypes.
The phenolic acid compound found in the aleurm layerof the cell wall of the maize grain probably acts as anantibiotic factor which retards development and causeshigh mortality in the larvae (Panda and Gundev 1955;Cuthbert et al. 1974; Arnason et al. 1977).
ConclusionFour of the nine varieties/lines of QPM maize tested
showed high levels of resistance to the maize weevil. TheseincludedACROSS 8762, POZARICA, S99TLWQ-AB andS99TL WQ (F/D). The susceptibility index of these lineswas significantly different from that of the susceptible lines.The susceptibility index of the four QPM lines was in therange of 2.84-4.59%, while the susceptibility index of thesusceptible lines reached 5.72%. The internal factorpossessed by QPM lines which contributes to the lowersusceptibility to S. zeamais is phenolic acid. The higherthe content of phenolic acid, the more resistant the lineswere to S. zeamais attack.
ReferencesArnason J.T. et al. 1994. Variation in resistance of Mexican
landraces of maize to maize weevil Sitophilus zeamais inrelation in taxonomic and biochemical parameters.Euphytica 74:227-236.
BPS. 2003. Statistika Indonesia.Bergvinson D. 2002. Major insect pests of maize in storage.
Postharvest training manual. Mexico, D.F.: CIMMYT.Classen D. 1990. Correlation of phenolic acid content of maize
to resistance to Sitophilus zeamais, the maize weevil, inCIMMYT������� ����J. Chem. Ecol. 16:301-315.
Cuthbert Jr. F.P., Fery R.L. and Chambliss O.L. 1974.Mechanisms of resistance. In Host-plant resistance toinsects. Panda N. and Gurdev S.K. (eds.). Oxford, UK:CAB International & Los Ba������ �� ������������� ��Rice Research Institute.
Dobie P., Haines C.P., Hodges R.J., Prevet P.F. and Rees D.P.1984. Insects and arachnids of tropical stored products:their biology and identification. (Training manual).
Gudrups I., Sien F., Jennifer G.K., Nilsa A.B.P. and OrchardJ.E. 2001. A comparison of two methods of assessment ofmaize varietal resistance to maize weevil Sitophilus zeamaisMotschulsky and the influence of kernel hardness andsize on susceptibility. Journal of Stored Product Research37:187-202.
Hidayat P., Ffrench-Constant R. and Phillips T.W. 1996.Molecular and morphological characters discriminatebetween Sitophilus oryzae and S. zeamais Motschulsky(Coleoptera: Curculionidae) and confirm reproductiveisolation. Ann. Entomol. Soc. Am. 89(5):645-652.
Jorge M.D. 1981. The effect of density on the survival anddevelopment of Sitophilus zeamais in different varieties.Plant Protection News.
Panda N. and Gundev S.K. 1995. Host-plant resistance to insects.Oxford, UK: CAB International & Los Ba������ �� ����International Rice Research Institute.
Reddy D.B. 1951. Determination of sex in rice and granaryweevils (Coleoptera: Curculionidae). Journal of EconomicEntomology 37:435-439.
Serratos J.A. 1987. The factors contributing to resistance ofexotic maize population to maize weevil Sitophiluszeamais. J. Chem. Ecol. 13:751-762.
Seshagiri R.D. 1953. The breeding of S. zeamais in rice. IndianJournal of Entomology 15:157-159.
Sosulski F., Krygier K. and Hogge L. 1982. Free esteriried andbound phenolic acids. 3 compositions of phenolic acids incereal and potato flour. J. Agric. Food Chem. 30:337-341.
Tandiabang J. 1998. Kehilangan hasil jagung oleh kumbang bubukSitophilus zeamais pada berbagai umur simpan dan wadahpenyimpanan. Hasil Penelitian Hama dan Penyakit. BalaiPenelitian Tanaman Jagung dan Serealia. Badan Penelitiandan Pengembangan Pertanian.
387
����� � ���� ����������� �������
IntroductionStenocarpella (= Diplodia) fungi on corn can cause
stalk rot, ear rot and leaf blight diseases. These diseasesare important in the Philippines (Stevens and Celino 1931;Dalmacio and Lozano 1987) and Indonesia (Semangun1991), and are widely distributed (Shurtleff 1980; Semangun1991; Morant et al. 1993).
One of the important Stenocarpella species is S.macrospora. This fungus attacks the leaf blades and leafsheaths of corn. The infected areas appear water-soakedto yellowish at first and later become brown when the tissueis killed by the fungus (Eddins 1930; Llano and Schieber1980). The disease may appear on any part of the bladeand sheath, although the latter is most often infected atthe base. Lesions on the blade are irregular and elongatein shape, and may coalesce and form dead spots two inchesin length and half an inch in width. The spots usually beara few scattered pycnidia (Eddins 1930). Leaf blight withpycnidia is a diagnostic sign of leaf blight caused by S.macrospora (Dalmacio and Lozano 1987a). S. macrosporaalso attacks the ears and stalks of corn (Eddins 1930). Thedisease is most severe on leaves approaching maturityand is very destructive on ears (Llano and Schieber 1980).
It was reported in 1976 that S. macrospora leaf disease ofcorn could be serious and was a threat to extensive cornplantings in the United States (Latterell et al. 1976). Thisdisease is occasionally found in the mountain areas of thesouthern states of the United States (White 1999). Leafblight and ear rot of corn caused by S. macrospora havealso become major biotic constraints to corn cultivation inthe mid-altitude ecologies of Nigeria (Olatinwo et al. 1999).
In the Philippines, it was noted that S. macrosporaassociated with leaf blight and ear rot on corn could be athreat to corn production because the incidence of thesetwo diseases was commonly observed and causedsubstantial damage in a major corn-growing area inMindanao. The fungus also caused ear rot reaching ashigh as 20% in some farmers��� ���� ��!����������(Dalmacio and Lozano 1987a; 1987b). It is a big problem inseed-production fields in the cooler areas of Mindanaowhere losses as high as 40% have been reported. Much ofthe available literature on Stenocarpella documentsmethodologies for screening stalk and ear rots, especiallyfor S. maydis which does not incite leaf blight. On theother hand, literature regarding S. macrospora, the causeof leaf blight on corn, is still limited, even though it hasbeen mentioned that stalk and ear infection by S.
Resistance of Corn Cultivars/Lines from Indonesia and thePhilippines to Stenocarpella Leaf Blight (Stenocarpellamacrospora)
SutoyoAssessment Institute for Agricultural Technology (AIAT/BPTP) - Central Java, Indonesia.E-mail: [email protected]; [email protected]
Abstract. Stenocarpella macrospora on corn can cause leaf blight, ear rot and stalk rot. These diseases aredistributed worldwide and are important in the Philippines and Indonesia. In the Philippines, it was noted that S.macrospora associated with leaf blight and ear rot on corn could be a threat to corn production because incidenceof these two diseases had caused substantial damage in a major corn-growing area in Mindanao. Stenocarpella leafblight symptoms are similar to blights caused by Helminthosporium turcicum (northern corn leaf blight) and someresearchers have difficulty in differentiating one from the other. We studied the resistance of 37 corn cultivars/linesfrom Indonesia and the Philippines to Stenocarpella leaf blight. An isolate having a high degree of virulence selectedfrom major corn-growing areas in the Philippines was used for inoculation. The fungus was cultured on oatmeal agarfor pycnidial production. The resulting suspension was adjusted to a concentration of 2 �� ��5 conidia mL-1 andinoculated with a hand-held sprayer. After inoculation, the plants were covered with plastic bags for 20 hours. Thetrial was arranged in a completely randomized design with three replications. The observed disease severitypercentage and infection rate showed that the cultivar Tiniguib-Bukidnon Visca 8762-N was highly resistant to thedisease as it had the lowest disease severity percentage and the lowest apparent infection rate (r = 0.0388). Theother resistant lines included Bisma (S1)C1, Bisma (S1)C0, Gumarang, Pioneer 3023, Red Batuan Visca 8866,Senorita, Bisma (S2)C1, Bukidnon-Mixed and Wisanggeni.
Key words: corn cultivars/lines, leaf blight, Stenocarpella macrospora
388
������� �� �� ����� ������� ����� ���������������
macrospora appears to be highly dependent upon leafinfection, and that adequate leaf blight phase resistanceshould greatly minimize damage by the disease (Dalmacioand Lozano 1987a). However, no study has focused onresistance to S. macrospora leaf blight. This study,therefore, was undertaken to identify resistance toStenocarpella leaf blight in corn germplasm from Indonesiaand the Philippines.
Materials and Method
Collection and planting of test plants
Thirty-seven corn populations ����� ��� ����� �� Indonesia, 12 from the Philippines and 2 hybrid lines(Pioneer 3023 and Pioneer 3012) from the Pioneer OverseasCorporation identified as resistant and susceptible controls��!��������� �� �� ������"��#��� �� ��!������������ ���screen house at the Department of Plant Pathology,University of the Philippines Los Ba����#������������each population were sown in a pot of size 6 containingsterilized soil, and 6 g of complete fertilizer was applied,half at sowing and a half at 3 weeks after sowing. Beforeinoculation, stands were thinned to 2 plants in each potwhich served as a replication. Three weeks after sowing,the plants were sprayed with a conidial suspension of S.macrospora at a concentration of 2 ����5 conidia mL-1.
Source of culture
Isolate Sm-14 isolated from a leaf sample taken fromPoblacion, Dangcagan, Bukidnon province in thePhilippines and which showed the highest degree ofvirulence compared to 18 other isolates, was used in thestudy.
Preparation and inoculation of leaf blight
To produce conidia, a 5-mm diameter plug of myceliumfrom a 5-to-6-day-old culture was placed at the center ofan agar plate containing 15 mL oatmeal agar with 2 dropsof 25% lactic acid (Alovera 2001). The plates were incubatedat room temperature and under continuous light for 30days to allow abundant production of pycnidia. Cultureswith pycnidia were macerated using a Waring blender andfiltered through two layers of muslin cloth to remove theagar medium. The resulting suspension was adjusted to aconcentration of 2 ����5 conidia per mL-1. Awetting agent,Tween-20, was added to the suspension at the rate of 1drop per 200 mL. The plants were inoculated with a hand-
held sprayer delivering a fine mist of the inoculum. Afterinoculation, the plants were covered with plastic bags for20 hours to provide favorable conditions for diseasedevelopment. The plants were watered daily and thesurrounding area sprayed with water using a fine nozzlethree to four times a day to provide adequate humidity.The experiment was arranged in a completely randomizeddesign with three replications.
Disease severity
Disease severity was initially assessed one week afterinoculation and at one-week intervals thereafter for fiveweeks. Disease severity was recorded at the seventh leafas good symptoms appeared only then. Rating was doneby establishing lesion-size categories and counting thenumber of lesions in each category, starting from the firstweek up to the fifth week after inoculation at one week-intervals. The lesion-size categories that frequentlyappeared were 0.5 ���� ��������$� �����$� ��������� �4 ���$� �����$������ ��#����������� ����!������������to percentage diseased leaf area by considering the leafarea of the assessed leaf after it was fully extended. Thedisease severity percentage for each leaf sample wascalculated using the following equation.
Percent disease severity =
whereXi = lesion-size categoriesYi = number of lesions in each lesion-size categoryLa = area of the seventh leaf
The apparent infection rate (r) was calculated usingVander Plank����%��� ��&'���������(��)*�+�
1 x2 x1r = (���+�&,�e�����-��,�e�����+
t2 ���1 1 ��.2 1 ��.1
wherer = apparent rate of infectiont1 = initial time of disease observationt2 = final time of disease observationlog e = natural logarithmx1 = percent disease severity at t1x2 = percent disease severity at t2
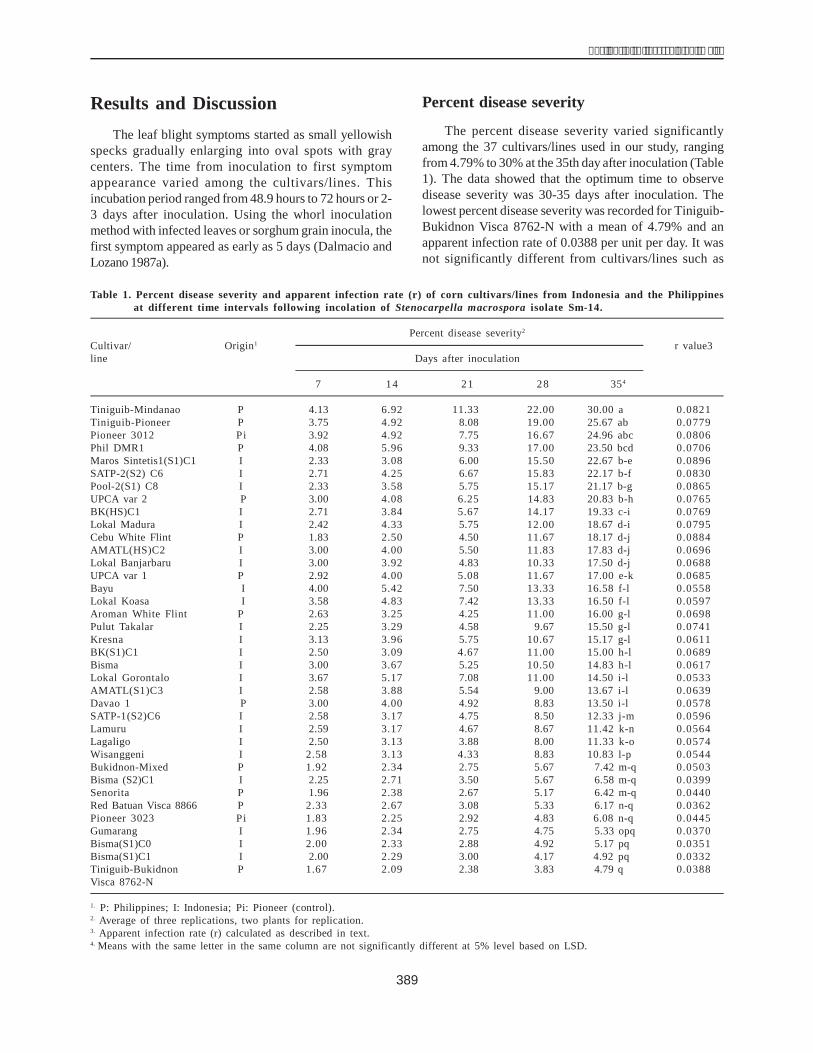
389
����� � ���� ����������� �������
Results and DiscussionThe leaf blight symptoms started as small yellowish
specks gradually enlarging into oval spots with graycenters. The time from inoculation to first symptomappearance varied among the cultivars/lines. Thisincubation period ranged from 48.9 hours to 72 hours or 2-3 days after inoculation. Using the whorl inoculationmethod with infected leaves or sorghum grain inocula, thefirst symptom appeared as early as 5 days (Dalmacio andLozano 1987a).
Percent disease severity
The percent disease severity varied significantlyamong the 37 cultivars/lines used in our study, rangingfrom 4.79% to 30% at the 35th day after inoculation (Table1). The data showed that the optimum time to observedisease severity was 30-35 days after inoculation. Thelowest percent disease severity was recorded for Tiniguib-Bukidnon Visca 8762-N with a mean of 4.79% and anapparent infection rate of 0.0388 per unit per day. It wasnot significantly different from cultivars/lines such as
Table 1. Percent disease severity and apparent infection rate (r) of corn cultivars/lines from Indonesia and the Philippinesat different time intervals following incolation of Stenocarpella macrospora isolate Sm-14.
Percent disease severity2
Cultivar/ Origin1 r value3line Days after inoculation
7 14 21 28 354
Tiniguib-Mindanao P 4.13 6.92 11.33 22.00 30.00 a 0.0821Tiniguib-Pioneer P 3.75 4.92 8.08 19.00 25.67 ab 0.0779Pioneer 3012 Pi 3.92 4.92 7.75 16.67 24.96 abc 0.0806Phil DMR1 P 4.08 5.96 9.33 17.00 23.50 bcd 0.0706Maros Sintetis1(S1)C1 I 2.33 3.08 6.00 15.50 22.67 b-e 0.0896SATP-2(S2) C6 I 2.71 4.25 6.67 15.83 22.17 b-f 0.0830Pool-2(S1) C8 I 2.33 3.58 5.75 15.17 21.17 b-g 0.0865UPCA var 2 P 3.00 4.08 6.25 14.83 20.83 b-h 0.0765BK(HS)C1 I 2.71 3.84 5.67 14.17 19.33 c-i 0.0769Lokal Madura I 2.42 4.33 5.75 12.00 18.67 d-i 0.0795Cebu White Flint P 1.83 2.50 4.50 11.67 18.17 d-j 0.0884AMATL(HS)C2 I 3.00 4.00 5.50 11.83 17.83 d-j 0.0696Lokal Banjarbaru I 3.00 3.92 4.83 10.33 17.50 d-j 0.0688UPCA var 1 P 2.92 4.00 5.08 11.67 17.00 e-k 0.0685Bayu I 4.00 5.42 7.50 13.33 16.58 f-l 0.0558Lokal Koasa I 3.58 4.83 7.42 13.33 16.50 f-l 0.0597Aroman White Flint P 2.63 3.25 4.25 11.00 16.00 g-l 0.0698Pulut Takalar I 2.25 3.29 4.58 9.67 15.50 g-l 0.0741Kresna I 3.13 3.96 5.75 10.67 15.17 g-l 0.0611BK(S1)C1 I 2.50 3.09 4.67 11.00 15.00 h-l 0.0689Bisma I 3.00 3.67 5.25 10.50 14.83 h-l 0.0617Lokal Gorontalo I 3.67 5.17 7.08 11.00 14.50 i-l 0.0533AMATL(S1)C3 I 2.58 3.88 5.54 9.00 13.67 i-l 0.0639Davao 1 P 3.00 4.00 4.92 8.83 13.50 i-l 0.0578SATP-1(S2)C6 I 2.58 3.17 4.75 8.50 12.33 j-m 0.0596Lamuru I 2.59 3.17 4.67 8.67 11.42 k-n 0.0564Lagaligo I 2.50 3.13 3.88 8.00 11.33 k-o 0.0574Wisanggeni I 2.58 3.13 4.33 8.83 10.83 l-p 0.0544Bukidnon-Mixed P 1.92 2.34 2.75 5.67 7.42 m-q 0.0503Bisma (S2)C1 I 2.25 2.71 3.50 5.67 6.58 m-q 0.0399Senorita P 1.96 2.38 2.67 5.17 6.42 m-q 0.0440Red Batuan Visca 8866 P 2.33 2.67 3.08 5.33 6.17 n-q 0.0362Pioneer 3023 Pi 1.83 2.25 2.92 4.83 6.08 n-q 0.0445Gumarang I 1.96 2.34 2.75 4.75 5.33 opq 0.0370Bisma(S1)C0 I 2.00 2.33 2.88 4.92 5.17 pq 0.0351Bisma(S1)C1 I 2.00 2.29 3.00 4.17 4.92 pq 0.0332Tiniguib-Bukidnon P 1.67 2.09 2.38 3.83 4.79 q 0.0388Visca 8762-N
1. P: Philippines; I: Indonesia; Pi: Pioneer (control).2. Average of three replications, two plants for replication.3. Apparent infection rate (r) calculated as described in text.4. Means with the same letter in the same column are not significantly different at 5% level based on LSD.
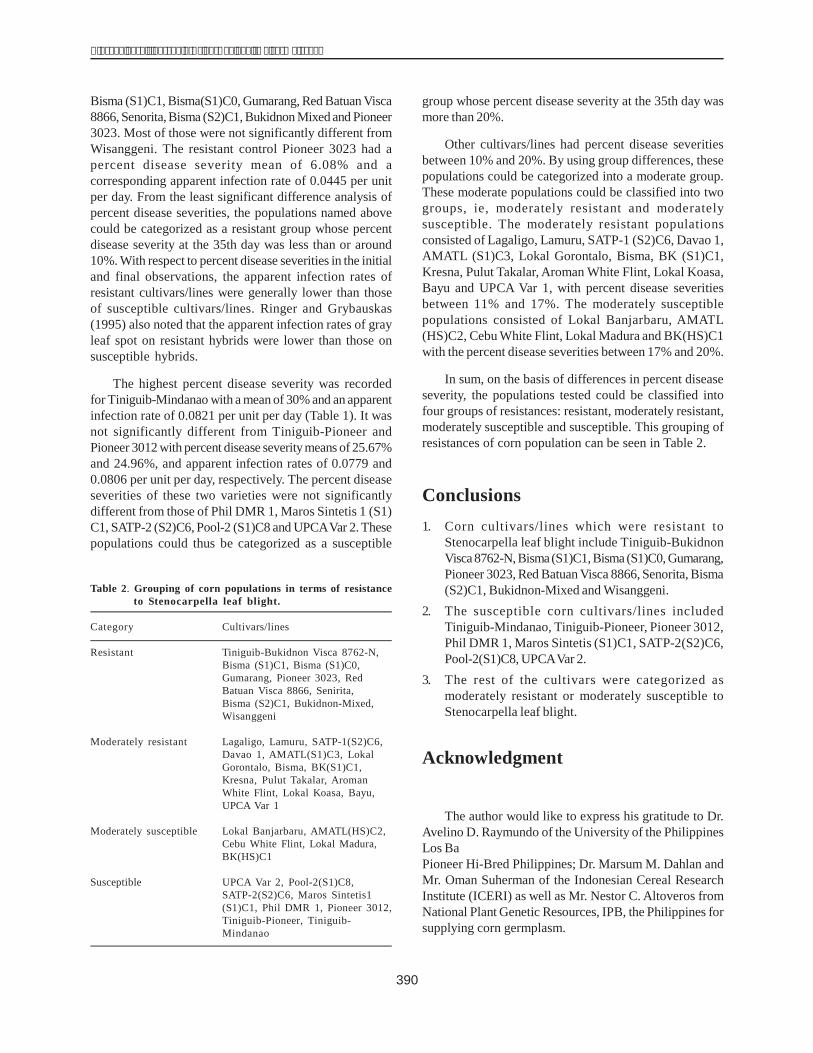
390
������� �� �� ����� ������� ����� ���������������
Bisma (S1)C1, Bisma(S1)C0, Gumarang, Red Batuan Visca8866, Senorita, Bisma (S2)C1, Bukidnon Mixed and Pioneer3023. Most of those were not significantly different fromWisanggeni. The resistant control Pioneer 3023 had apercent disease severity mean of 6.08% and acorresponding apparent infection rate of 0.0445 per unitper day. From the least significant difference analysis ofpercent disease severities, the populations named abovecould be categorized as a resistant group whose percentdisease severity at the 35th day was less than or around10%. With respect to percent disease severities in the initialand final observations, the apparent infection rates ofresistant cultivars/lines were generally lower than thoseof susceptible cultivars/lines. Ringer and Grybauskas(1995) also noted that the apparent infection rates of grayleaf spot on resistant hybrids were lower than those onsusceptible hybrids.
The highest percent disease severity was recordedfor Tiniguib-Mindanao with a mean of 30% and an apparentinfection rate of 0.0821 per unit per day (Table 1). It wasnot significantly different from Tiniguib-Pioneer andPioneer 3012 with percent disease severity means of 25.67%and 24.96%, and apparent infection rates of 0.0779 and0.0806 per unit per day, respectively. The percent diseaseseverities of these two varieties were not significantlydifferent from those of Phil DMR 1, Maros Sintetis 1 (S1)C1, SATP-2 (S2)C6, Pool-2 (S1)C8 and UPCAVar 2. Thesepopulations could thus be categorized as a susceptible
group whose percent disease severity at the 35th day wasmore than 20%.
Other cultivars/lines had percent disease severitiesbetween 10% and 20%. By using group differences, thesepopulations could be categorized into a moderate group.These moderate populations could be classified into twogroups, ie, moderately resistant and moderatelysusceptible. The moderately resistant populationsconsisted of Lagaligo, Lamuru, SATP-1 (S2)C6, Davao 1,AMATL (S1)C3, Lokal Gorontalo, Bisma, BK (S1)C1,Kresna, Pulut Takalar, Aroman White Flint, Lokal Koasa,Bayu and UPCA Var 1, with percent disease severitiesbetween 11% and 17%. The moderately susceptiblepopulations consisted of Lokal Banjarbaru, AMATL(HS)C2, Cebu White Flint, Lokal Madura and BK(HS)C1with the percent disease severities between 17% and 20%.
In sum, on the basis of differences in percent diseaseseverity, the populations tested could be classified intofour groups of resistances: resistant, moderately resistant,moderately susceptible and susceptible. This grouping ofresistances of corn population can be seen in Table 2.
Conclusions1. Corn cultivars/lines which were resistant to
Stenocarpella leaf blight include Tiniguib-BukidnonVisca 8762-N, Bisma(S1)C1, Bisma (S1)C0, Gumarang,Pioneer 3023, Red Batuan Visca 8866, Senorita, Bisma(S2)C1, Bukidnon-Mixed and Wisanggeni.
2. The susceptible corn cultivars/lines includedTiniguib-Mindanao, Tiniguib-Pioneer, Pioneer 3012,Phil DMR 1, Maros Sintetis (S1)C1, SATP-2(S2)C6,Pool-2(S1)C8, UPCAVar 2.
3. The rest of the cultivars were categorized asmoderately resistant or moderately susceptible toStenocarpella leaf blight.
Acknowledgment
The author would like to express his gratitude to Dr.Avelino D. Raymundo of the University of the PhilippinesLos Ba������� ����,,��� ��/�0���!� ������0� �� ��Pioneer Hi-Bred Philippines; Dr. Marsum M. Dahlan andMr. Oman Suherman of the Indonesian Cereal ResearchInstitute (ICERI) as well as Mr. Nestor C. Altoveros fromNational Plant Genetic Resources, IPB, the Philippines forsupplying corn germplasm.
Table 2. Grouping of corn populations in terms of resistanceto Stenocarpella leaf blight.
Category Cultivars/lines
Resistant Tiniguib-Bukidnon Visca 8762-N,Bisma (S1)C1, Bisma (S1)C0,Gumarang, Pioneer 3023, RedBatuan Visca 8866, Senirita,Bisma (S2)C1, Bukidnon-Mixed,Wisanggeni
Moderately resistant Lagaligo, Lamuru, SATP-1(S2)C6,Davao 1, AMATL(S1)C3, LokalGorontalo, Bisma, BK(S1)C1,Kresna, Pulut Takalar, AromanWhite Flint, Lokal Koasa, Bayu,UPCA Var 1
Moderately susceptible Lokal Banjarbaru, AMATL(HS)C2,Cebu White Flint, Lokal Madura,BK(HS)C1
Susceptible UPCA Var 2, Pool-2(S1)C8,SATP-2(S2)C6, Maros Sintetis1(S1)C1, Phil DMR 1, Pioneer 3012,Tiniguib-Pioneer, Tiniguib-Mindanao
391
����� � ���� ����������� �������
ReferencesAlovera R.B. 2001. Effect of environmental factors on
Stenocarpella macrospora (Earle) Sutton and disease-yieldloss relationship as affected by the site of inoculation andinoculum concentration in corn (Zea mays L.).Unpublished Ph.D. thesis. University of the PhilippinesLos Ba������,���1�,����
Dalmacio S.C. and Lozano G.P. 1987a. Note: leaf blight, ear rotand stalk rot of corn caused by Diplodia macrosporaEarle in the Philippines. Philipp. Phytopathol. 23:22-23.
Dalmacio S.C. and Lozano G.P. 1987b. Diplodia macrospora: athreat to corn production in the Philippines. Philipp.Phytopathol. 23:28 (Abstract).
Eddins A.H. 1930. Dry rot of corn caused by Diplodiamacrospora Earle. Phytopathology 20:439-448.
Latterell F.M., Rossi A.E. and Moreno M. 1976. Diplodiamacrospora: a potentially serious pathogen of corn in theU.S.? Proc. Am. Phytopathol. Soc. 3:228 (Abstract).
Latterell F.M. and Rossi A.E. 1983. Stenocarpella macrospora(= Diplodia macrospora) and S. maydis (= D. maydis)compared as pathogens of corn. Plant Dis. 67:725-729.
Llano A. and Schieber E. 1980. Diplodia macrospora of corn inNicaragua. Plant Dis. 67:747.
Morant M.A., Warren H.L. and von Qualen S.K. 1993. Asynthetic medium for mass production of pycnidiosporesof Stenocarpella species. Plant Dis. 77:424-426.
Olatinwo R., Cardwell K., Menkir A., Deadman M. and JulianA. 1999. Inheritance of resistance to Stenocarpellamacrospora (Earle) ear rot of maize in the mid-altitudezone of Nigeria. European J. Plt. Pathol. 105:535-543.
Ringer C.E. and Grybauskas A.P. 1995. Infection cyclecomponents and disease progress of gray leaf spot onfield corn. Plant Dis. 79:24-28.
Semangun H. 1991. Crop diseases in Indonesia. (In Indonesian)Gadjah Mada University Press.
Shurtleff M.C. 1980. Compendium of corn diseases. 2nd edn.St. Paul, Minnesota, USA: American PhytopathologicalSociety. 105pp
Stevens F.L. and Celino M.S. 1931. Two diseases caused byDiplodia. Philipp. Agric. 20:370-374.
Vander Plank J.E. 1963. Plant diseases: epidemics and control.New York, USA: Academic Press. 349pp
White D.G. 1999. Compendium of corn diseases. 3rd edn. St.Paul, Minnesota, USA: American PhytopathologicalSociety. 78pp.
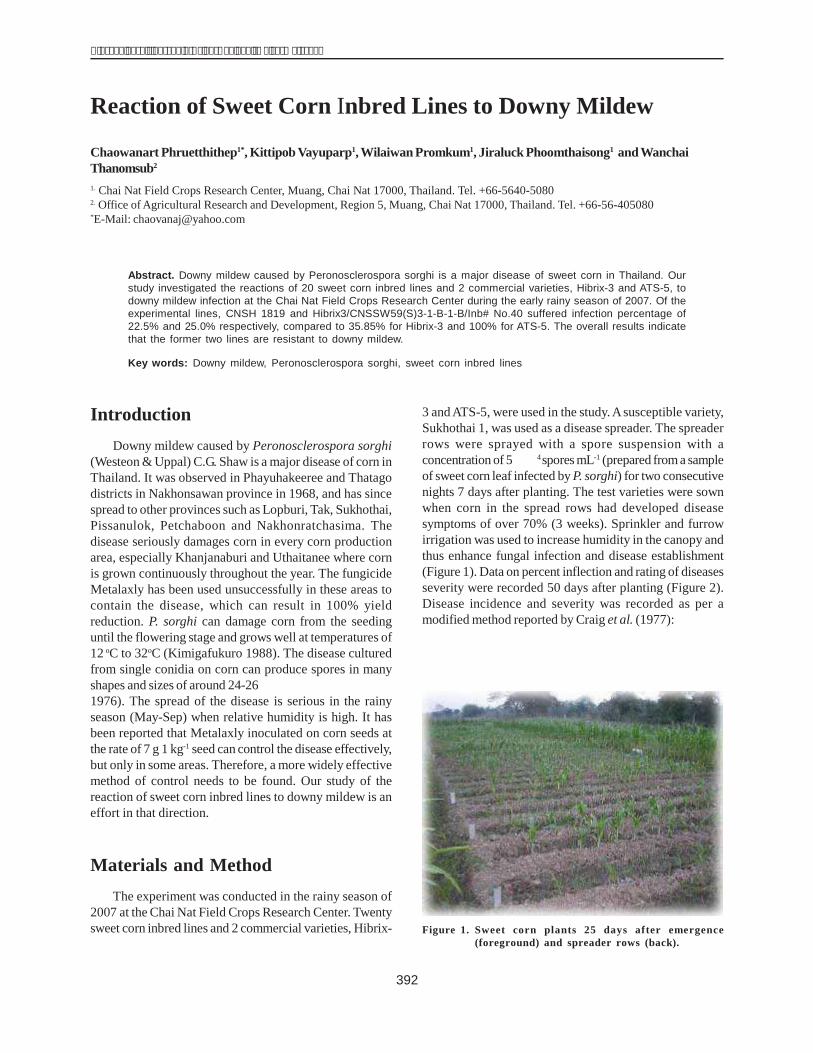
392
������� �� �� ����� ������� ����� ���������������
IntroductionDowny mildew caused by Peronosclerospora sorghi
(Westeon & Uppal) C.G. Shaw is a major disease of corn inThailand. It was observed in Phayuhakeeree and Thatagodistricts in Nakhonsawan province in 1968, and has sincespread to other provinces such as Lopburi, Tak, Sukhothai,Pissanulok, Petchaboon and Nakhonratchasima. Thedisease seriously damages corn in every corn productionarea, especially Khanjanaburi and Uthaitanee where cornis grown continuously throughout the year. The fungicideMetalaxly has been used unsuccessfully in these areas tocontain the disease, which can result in 100% yieldreduction. P. sorghi can damage corn from the seedinguntil the flowering stage and grows well at temperatures of12 oC to 32oC (Kimigafukuro 1988). The disease culturedfrom single conidia on corn can produce spores in manyshapes and sizes of around 24-26 ����-��� �����&��� ���1976). The spread of the disease is serious in the rainyseason (May-Sep) when relative humidity is high. It hasbeen reported that Metalaxly inoculated on corn seeds atthe rate of 7 g 1 kg-1 seed can control the disease effectively,but only in some areas. Therefore, a more widely effectivemethod of control needs to be found. Our study of thereaction of sweet corn inbred lines to downy mildew is aneffort in that direction.
Materials and MethodThe experiment was conducted in the rainy season of
2007 at the Chai Nat Field Crops Research Center. Twentysweet corn inbred lines and 2 commercial varieties, Hibrix-
3 and ATS-5, were used in the study. Asusceptible variety,Sukhothai 1, was used as a disease spreader. The spreaderrows were sprayed with a spore suspension with aconcentration of 5 ����4spores mL-1 (prepared from a sampleof sweet corn leaf infected by P. sorghi) for two consecutivenights 7 days after planting. The test varieties were sownwhen corn in the spread rows had developed diseasesymptoms of over 70% (3 weeks). Sprinkler and furrowirrigation was used to increase humidity in the canopy andthus enhance fungal infection and disease establishment(Figure 1). Data on percent inflection and rating of diseasesseverity were recorded 50 days after planting (Figure 2).Disease incidence and severity was recorded as per amodified method reported by Craig et al. (1977):
Reaction of Sweet Corn Inbred Lines to Downy Mildew
Chaowanart Phruetthithep1*, Kittipob Vayuparp1, Wilaiwan Promkum1, Jiraluck Phoomthaisong1 and WanchaiThanomsub2
1. Chai Nat Field Crops Research Center, Muang, Chai Nat 17000, Thailand. Tel. +66-5640-50802. Office of Agricultural Research and Development, Region 5, Muang, Chai Nat 17000, Thailand. Tel. +66-56-405080*E-Mail: [email protected]
Abstract. Downy mildew caused by Peronosclerospora sorghi is a major disease of sweet corn in Thailand. Ourstudy investigated the reactions of 20 sweet corn inbred lines and 2 commercial varieties, Hibrix-3 and ATS-5, todowny mildew infection at the Chai Nat Field Crops Research Center during the early rainy season of 2007. Of theexperimental lines, CNSH 1819 and Hibrix3/CNSSW59(S)3-1-B-1-B/Inb# No.40 suffered infection percentage of22.5% and 25.0% respectively, compared to 35.85% for Hibrix-3 and 100% for ATS-5. The overall results indicatethat the former two lines are resistant to downy mildew.
Key words: Downy mildew, Peronosclerospora sorghi, sweet corn inbred lines
Figure 1. Sweet corn plants 25 days after emergence(foreground) and spreader rows (back).
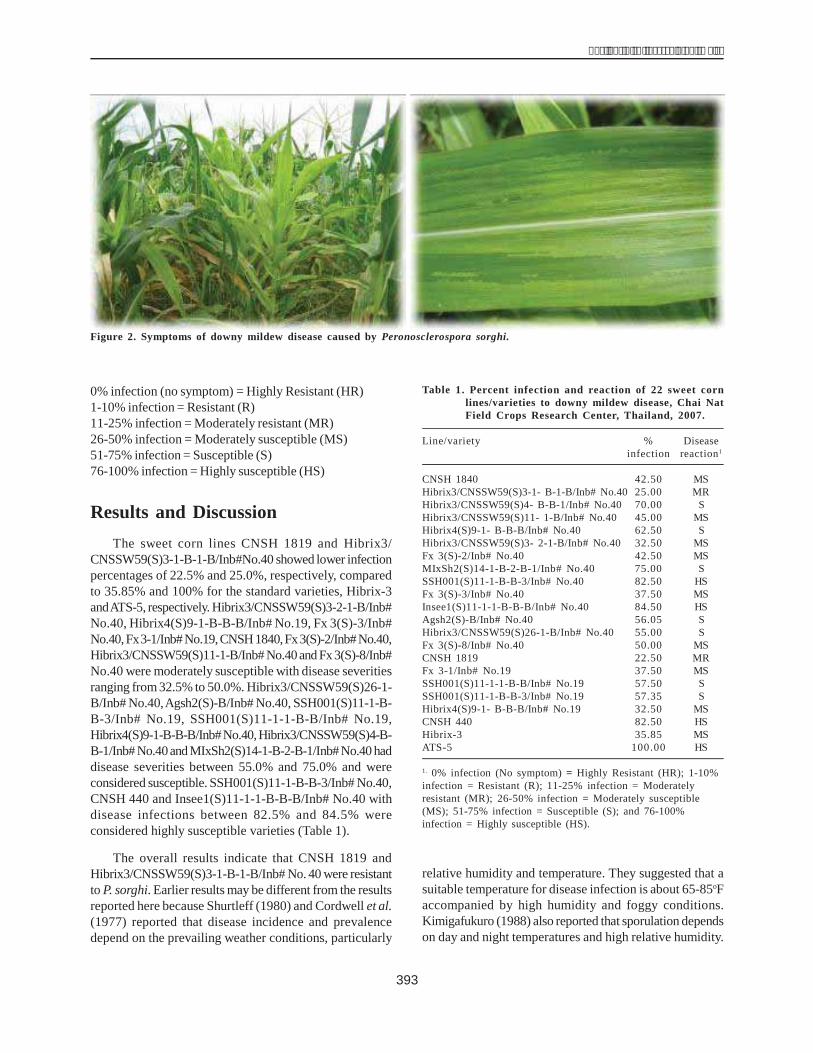
393
����� � ���� ����������� �������
0% infection (no symptom) = Highly Resistant (HR)1-10% infection = Resistant (R)11-25% infection = Moderately resistant (MR)26-50% infection = Moderately susceptible (MS)51-75% infection = Susceptible (S)76-100% infection = Highly susceptible (HS)
Results and DiscussionThe sweet corn lines CNSH 1819 and Hibrix3/
CNSSW59(S)3-1-B-1-B/Inb#No.40 showed lower infectionpercentages of 22.5% and 25.0%, respectively, comparedto 35.85% and 100% for the standard varieties, Hibrix-3andATS-5, respectively. Hibrix3/CNSSW59(S)3-2-1-B/Inb#No.40, Hibrix4(S)9-1-B-B-B/Inb# No.19, Fx 3(S)-3/Inb#No.40,Fx3-1/Inb# No.19,CNSH1840,Fx3(S)-2/Inb# No.40,Hibrix3/CNSSW59(S)11-1-B/Inb# No.40 and Fx 3(S)-8/Inb#No.40 were moderately susceptible with disease severitiesranging from 32.5% to 50.0%. Hibrix3/CNSSW59(S)26-1-B/Inb# No.40,Agsh2(S)-B/Inb# No.40, SSH001(S)11-1-B-B-3/Inb# No.19, SSH001(S)11-1-1-B-B/Inb# No.19,Hibrix4(S)9-1-B-B-B/Inb#No.40,Hibrix3/CNSSW59(S)4-B-B-1/Inb# No.40 and MIxSh2(S)14-1-B-2-B-1/Inb# No.40 haddisease severities between 55.0% and 75.0% and wereconsidered susceptible. SSH001(S)11-1-B-B-3/Inb# No.40,CNSH 440 and Insee1(S)11-1-1-B-B-B/Inb# No.40 withdisease infections between 82.5% and 84.5% wereconsidered highly susceptible varieties (Table 1).
The overall results indicate that CNSH 1819 andHibrix3/CNSSW59(S)3-1-B-1-B/Inb# No. 40 were resistantto P. sorghi. Earlier results may be different from the resultsreported here because Shurtleff (1980) and Cordwell et al.(1977) reported that disease incidence and prevalencedepend on the prevailing weather conditions, particularly
relative humidity and temperature. They suggested that asuitable temperature for disease infection is about 65-85oFaccompanied by high humidity and foggy conditions.Kimigafukuro (1988) also reported that sporulation dependson day and night temperatures and high relative humidity.
Table 1. Percent infection and reaction of 22 sweet cornlines/varieties to downy mildew disease, Chai NatField Crops Research Center, Thailand, 2007.
Line/variety % Diseaseinfection reaction1
CNSH 1840 42.50 MSHibrix3/CNSSW59(S)3-1- B-1-B/Inb# No.40 25.00 MRHibrix3/CNSSW59(S)4- B-B-1/Inb# No.40 70.00 SHibrix3/CNSSW59(S)11- 1-B/Inb# No.40 45.00 MSHibrix4(S)9-1- B-B-B/Inb# No.40 62.50 SHibrix3/CNSSW59(S)3- 2-1-B/Inb# No.40 32.50 MSFx 3(S)-2/Inb# No.40 42.50 MSMIxSh2(S)14-1-B-2-B-1/Inb# No.40 75.00 SSSH001(S)11-1-B-B-3/Inb# No.40 82.50 HSFx 3(S)-3/Inb# No.40 37.50 MSInsee1(S)11-1-1-B-B-B/Inb# No.40 84.50 HSAgsh2(S)-B/Inb# No.40 56.05 SHibrix3/CNSSW59(S)26-1-B/Inb# No.40 55.00 SFx 3(S)-8/Inb# No.40 50.00 MSCNSH 1819 22.50 MRFx 3-1/Inb# No.19 37.50 MSSSH001(S)11-1-1-B-B/Inb# No.19 57.50 SSSH001(S)11-1-B-B-3/Inb# No.19 57.35 SHibrix4(S)9-1- B-B-B/Inb# No.19 32.50 MSCNSH 440 82.50 HSHibrix-3 35.85 MSATS-5 100.00 HS
1. 0% infection (No symptom) = Highly Resistant (HR); 1-10%infection = Resistant (R); 11-25% infection = Moderatelyresistant (MR); 26-50% infection = Moderately susceptible(MS); 51-75% infection = Susceptible (S); and 76-100%infection = Highly susceptible (HS).
Figure 2. Symptoms of downy mildew disease caused by Peronosclerospora sorghi.
394
������� �� �� ����� ������� ����� ���������������
ReferencesCardwell K.F., Schulthess F., Ndemah R. and Ngoko Z. 1977. A
systems approach to assess crop health and maize yieldlosses due to pests and diseases in Cameroon. Agriculture,Ecosystems & Environment 65(1):33-47.
Craig A., Bockholt J., Frederiksen R.A. and Zuber M.S. 1977.Reaction of important corn inbred lines toPeronosclerospora sorghi. Plant Dis. Reptr. 61:563-564.
Kimigafukuro T. 1988. Effect of temperature and relativehumidity on the infection of maize with downy mildew.Extension-ASPAC Food and Fertilizer Technology Center.No.283.
Pupipat U. 1976. Corn downy mildew research at KasetsartUniversity. Kasetsart Journal 10:106-110.
Shurtleff M.C. 1980. Compendium of corn diseases. St. Paul,Minnesota, USA: American Phytopathological Society.105pp.
395
����� � ���� ����������� �������
IntroductionCorn (Zea mays L.) is one of the most important food
crops grown throughout ythe world in temperate,subtropical and tropical zones wherever rainfall or irrigationis adequate (Shurtleff 1980). Most of the area sown to corn(58%) is in developing countries; of this, approximately 50million ha are in the tropics, mainly at low elevations.However, about two-thirds of the world������� ���������in developed countries where climates are almost entirelytemperate. There are large differences in yield betweendeveloped and developing countries.
In some Asian countries, including Indonesia and thePhilippines, corn is the second most important cereal cropafter rice. Although grown principally for animal feed, it isalso a staple food crop for human consumption, particularlyin Mexico and other Central and SouthAmerican countries,Africa andAsia (Shurtleff 1980).
In Indonesia, the demand for corn as food and feed issteadily increasing (Swastika et al. 2001). While more than70% of the corn produced in the country is consumed asfood (CBS 1999), development of the crop has in recentyears taken an orientation toward agribusiness. This hasresulted in high-frequency cultivation of corn, especiallyin the newer areas. Given the availability of host plants,this in turn has led to the emergence of insect pests andpathogens that formerly had not been dominant.
Corn is one of the most important food crops in CentralSulawesi Province, including the two districts of PaluValley, Donggala and Palu. Of the two, Donggala has themore extensive corn sown area.Adistrict of 10 471.71 km2,Donggala lies between 0.3oN and 2.2 oS latitudes and119.45oE and 121.45oE longitudes. The temperature rangesfrom 20oC to 25oC at night and 34oC and 37oC at noon. Theaverage relative humidity ranges from 64% to 85% withyearly rainfall of1,500-3,000 mmexcept in Palu Valley whichonly receives 600-800 mm. Palu Valley is known as an off-season area due to the climatic conditions. Nevertheless,many crops can be sown all the year round because of theavailability of irrigation.
All parts of the corn plant are susceptible to a widevariety of diseases which can reduce the yield and qualityof its products. So far there has been no completelyeffective measure available for control of corn diseases.However, losses can be minimized by following certainrecommended practices. It is imperative therefore forfarmers to be aware of corn diseasess and the factorsinfluencing their severity. Downy mildew is endemicthroughout Indonesia and is the most important productionconstraint of corn. The severity of damage varies,depending on varietal tolerance and agroclimaticconditions (ICERI 2008).
The aim of this study was to determine the major corndiseases affecting corn in Palu Valley and identify methodsfor their control.
Major Corn Diseases in Palu Valley of Indonesia and TheirControl
Amran Muis1*, Syahrir Pakki2 and Nurnina Nonci1
1. Assessment Institute for Agricultural Technology, Central Sulawesi, Indonesia.2. Tungro Disease Research Station.*E-mail: [email protected]
Abstract. Diseases cause loss of corn production in Palu Valley in Central Sulawesi, Indonesia. They reduce thevalue and quality of the grain and may increase the harvesting costs when the affected plants lodge. A survey wasconducted during the crop season of 2007 to identify the major diseases affecting corn in Palu Valley, especially inDonggala district. Based on these observations, seven major diseases and two pathogens infecting ear/seeds ofcorn were identified. These were downy mildew (Peronosclerospora maydis), maydis leaf blight (Bipolaris maydis),banded leaf and sheath blight (Rhizoctonia solani), polysora rust (Puccinia polysora), curvularia leaf spot (Curvularialunata), bacterial stalk rot (Erwinia chrysantemi pv. Zeae), common smut (Ustilago maydis), aspergillus ear rot(Aspergillus plavus) and gray ear rot (Physalospora zeae). Among them, the most important corn diseases in PaluValley are downy mildew, maydis leaf blight, polysora rust, banded leaf and sheath blight and aspergillus ear rot.
Key words: Palu Valley, corn diseases
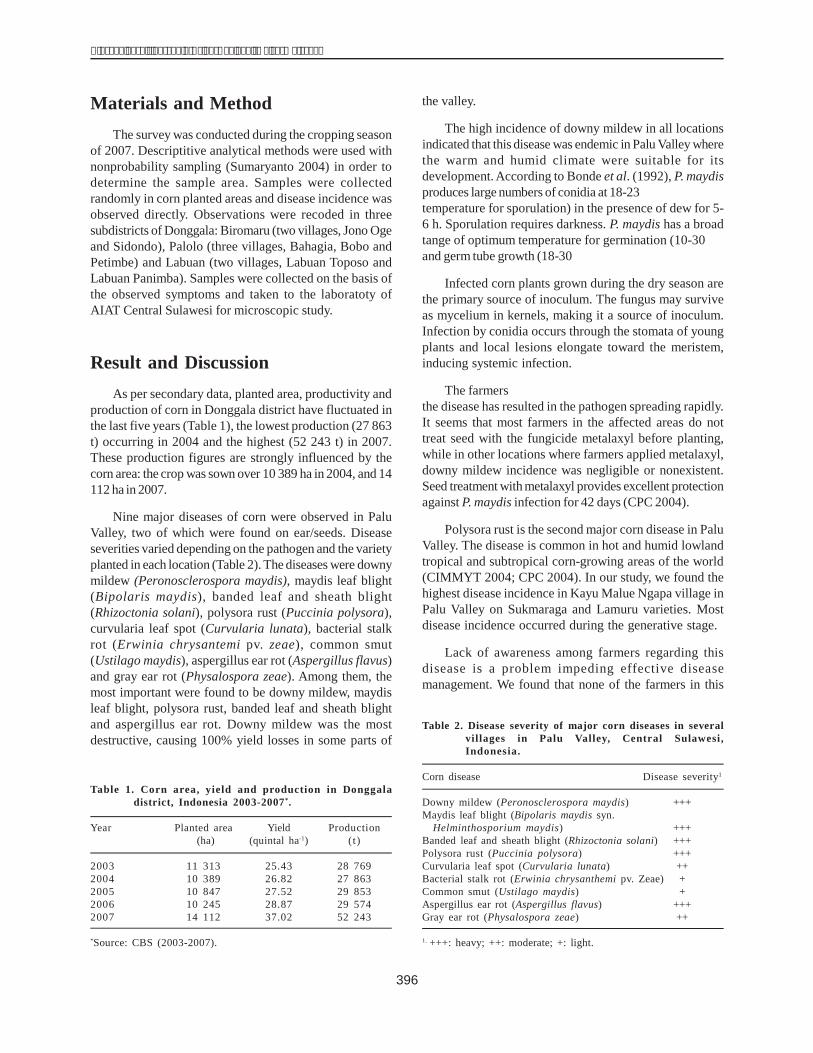
396
������� �� �� ����� ������� ����� ���������������
Materials and MethodThe survey was conducted during the cropping season
of 2007. Descriptitive analytical methods were used withnonprobability sampling (Sumaryanto 2004) in order todetermine the sample area. Samples were collectedrandomly in corn planted areas and disease incidence wasobserved directly. Observations were recoded in threesubdistricts of Donggala: Biromaru (two villages, Jono Ogeand Sidondo), Palolo (three villages, Bahagia, Bobo andPetimbe) and Labuan (two villages, Labuan Toposo andLabuan Panimba). Samples were collected on the basis ofthe observed symptoms and taken to the laboratoty ofAIAT Central Sulawesi for microscopic study.
Result and DiscussionAs per secondary data, planted area, productivity and
production of corn in Donggala district have fluctuated inthe last five years (Table 1), the lowest production (27 863t) occurring in 2004 and the highest (52 243 t) in 2007.These production figures are strongly influenced by thecorn area: the crop was sown over 10 389 ha in 2004, and 14112 ha in 2007.
Nine major diseases of corn were observed in PaluValley, two of which were found on ear/seeds. Diseaseseverities varied depending on the pathogen and the varietyplanted in each location (Table 2). The diseases were downymildew (Peronosclerospora maydis), maydis leaf blight(Bipolaris maydis), banded leaf and sheath blight(Rhizoctonia solani), polysora rust (Puccinia polysora),curvularia leaf spot (Curvularia lunata), bacterial stalkrot (Erwinia chrysantemi pv. zeae), common smut(Ustilago maydis), aspergillus ear rot (Aspergillus flavus)and gray ear rot (Physalospora zeae). Among them, themost important were found to be downy mildew, maydisleaf blight, polysora rust, banded leaf and sheath blightand aspergillus ear rot. Downy mildew was the mostdestructive, causing 100% yield losses in some parts of
the valley.
The high incidence of downy mildew in all locationsindicated that this disease was endemic in Palu Valley wherethe warm and humid climate were suitable for itsdevelopment. According to Bonde et al. (1992), P. maydisproduces large numbers of conidia at 18-232��&������ � temperature for sporulation) in the presence of dew for 5-6 h. Sporulation requires darkness. P. maydis has a broadtange of optimum temperature for germination (10-302�+and germ tube growth (18-302�+�
Infected corn plants grown during the dry season arethe primary source of inoculum. The fungus may surviveas mycelium in kernels, making it a source of inoculum.Infection by conidia occurs through the stomata of youngplants and local lesions elongate toward the meristem,inducing systemic infection.
The farmers������ �"���(�!��,�����!����������the disease has resulted in the pathogen spreading rapidly.It seems that most farmers in the affected areas do nottreat seed with the fungicide metalaxyl before planting,while in other locations where farmers applied metalaxyl,downy mildew incidence was negligible or nonexistent.Seed treatment with metalaxyl provides excellent protectionagainst P. maydis infection for 42 days (CPC 2004).
Polysora rust is the second major corn disease in PaluValley. The disease is common in hot and humid lowlandtropical and subtropical corn-growing areas of the world(CIMMYT 2004; CPC 2004). In our study, we found thehighest disease incidence in Kayu Malue Ngapa village inPalu Valley on Sukmaraga and Lamuru varieties. Mostdisease incidence occurred during the generative stage.
Lack of awareness among farmers regarding thisdisease is a problem impeding effective diseasemanagement. We found that none of the farmers in this
Table 1. Corn area, yield and production in Donggaladistrict, Indonesia 2003-2007*.
Year Planted area Yield Production(ha) (quintal ha-1) (t)
2003 11 313 25.43 28 7692004 10 389 26.82 27 8632005 10 847 27.52 29 8532006 10 245 28.87 29 5742007 14 112 37.02 52 243
*Source: CBS (2003-2007).
Table 2. Disease severity of major corn diseases in severalvillages in Palu Valley, Central Sulawesi,Indonesia.
Corn disease Disease severity1
Downy mildew (Peronosclerospora maydis) +++Maydis leaf blight (Bipolaris maydis syn.
Helminthosporium maydis) +++Banded leaf and sheath blight (Rhizoctonia solani) +++Polysora rust (Puccinia polysora) +++Curvularia leaf spot (Curvularia lunata) ++Bacterial stalk rot (Erwinia chrysanthemi pv. Zeae) +Common smut (Ustilago maydis) +Aspergillus ear rot (Aspergillus flavus) +++Gray ear rot (Physalospora zeae) ++
1. +++: heavy; ++: moderate; +: light.
397
����� � ���� ����������� �������
area understood the strategies for managing the disease.So far, there no varieties have been identified withresistance to polysora rust in Palu Valley. According toCPC (2004), use of resistant maize hybrids is the mostfeasible means of controlling polysora rust. Ahypersensitive type of resistance, conditioned by a singledominant gene, was highly effective in preventing yieldloss and eliminated sporulation of secondary inoculum.However, races of P. polysora existed that limited theirwider use. Slow rusting, a general form of resistance thatresults in a reduced rate of disease development withoutseverely affecting the rust population, effectivelycontrolled rust inAfrica in the 1950s (Bailey et al. 1987).
According to CPC (2004), the disease can becontrolled by chemicals. Foliar sprays and seed dressingwith chemicals effectively delayed appearance of the rustand increased yield in the wet season in Nigeria. Theapplication of fungicides including oxycarboxin,pyracarbolid, tridemorph and triforine satisfactorilyprevented infection by southern and common rust inTaiwan. Oxycarboxin and pyracarbolid had curativeefficacy because they inhibited the development ofpustules and killed uredia in the lesions.
Maydis leaf blight (B. maydis) infection occurs fromthe seedling to generative stage of corn plant. This diseasewas found in all corn-sown areas in Palu Valley, the highestincidence being in the rainy season. The development ofsouthern corn leaf blight is favored by high temperaturesand prolonged periods of high humidity (CPC 2004;CYMMIT 2004). Spore production was higher at 302������at 22.52�����$2���!�����������!�����������"��� � �"and infrared radiation. Relative humidity and wind speedalso affect the release of conidia (CPC 2004). Farmerscontrol the disease with foliar fungicide application.Nevertheless, according to CPC (2004), cultural controland sanitary methods such as destroying or burying thecrop residue can be beneficial. Lower levels of diseasewere observed in plowed plots than in tillage systems inwhich more the crop residue had been left on the surface.The germination of spores exposed on the soil surfacewas significantly greater than that of buried spores.Continuous maize culture increased the severity of thedisease.
Banded leaf and sheath blight (BLSB) caused by R.solani is another important corn disease in Palu Valley.Infected plants were found in all study locations, and itseemed that higher disease incidence occurred during therainy rather than the dry season. BLSB of corn has becomeincreasingly severe and economically important in severalcountries of Asia (Sharma 2002). The use of chemicals tomanage BLSB in corn is limited and has adverse ecological
implications, while the use of resistant varieties has notprogressed much because of the limited host geneticvariability for resistance to R. solani (Sharma et al. 2002).One of the effective means of control against BLSB isbiological control using Bacillus subtilis and the fungicidecaptan as seed treatment and foliar sprays with thefungicide validamycin (Muis and Quimio 2006).
The other corn diseases found in Palu Valley such ascurvularia leaf spot (C. lunata), bacterial stalk rot (E.chrysantemi pv. zeae) and common smut (Ustilago maydis)were considered minor because their disease incidencewas low. Curvularia leaf spot can be controlled by usingbisdithane or dithane fungicides, and bacterial stalk rot byremoving the infected plants or using streptomycinbactericide and common smut by removing infected plants.
Our survey also noted two diseases that infected theear: aspergillus ear rot (A. plavus) and gray ear rot (P. zeae).Most of the disease incidence was found in stored corn.Of the two, A. flavus is considered an important ear/kerneldisease of corn. It is a member of a group of fungi knownas storage fungi which cause deterioration of grain or seedsof plant species stored when seed moisture content is inthe range 13-20% (Christensen and Meronuck 1986 in CPC2004). It also produces aflatoxin in the infected seeds whichcan cause death or symptoms of toxicity when ingestedby animals or humans (Diener et al. 1987). Aflatoxincontamination is of major economic importance in cotton,maize, groundnut and tree nuts due to the infection ofseeds in the field, but it may also develop in seeds andgrain of other crop species when they are improperly stored(Diener et al. 1987). Surveys throughout the worldemphasize the enormous problem presented by aflatoxinto human health and to the economics of crop production(CPC 2004). So far, there have been no single controlmeasure taken by farmers in Palu Valley to control A. flavus.Montes-Belmont and Carvajal (2008) reported that essentialoils of Cinnamonum zeylanicum (cinnamon), Menthapiperita (peppermint), Ocimum basilicum (basil),Origanum vulgate (origanum), Teloxys ambrosioides (theflavoring herb epazote), Syzygium aromaticum (clove) andThymus vulgaris (thyme) caused a total inhibition of fungaldevelopment in maize kernels. Thymol and o-methoxycinnamaldehyde significantly reduced maize graincontamination. The optimal dosage for protection of maizevaried from 3% to 8%. Combinations of C. zeylanicumwith the remaining oils gave efficient control. A residualeffect of C. zeylanicum was detected after 4 weeks of kerneltreatment. No phytotoxic effect on germination and corngrowth was detected with any of these oils. Aflatoxincontamination of corn can be reduced by using thenonaflatoxigenic A. flavus (CT3 and K49) (Abbas et al.2006).
398
������� �� �� ����� ������� ����� ���������������
ConclusionsThe corn diseases found in Palu Valley were downy
mildew (Peronosclerospora maydis, maydis leaf blight(Bipolaris maydis), banded leaf and sheath blight(Rhizoctonia solani), polysora rust (Puccinia polysora),curvularia leaf spot (Curvularia lunata), bacterial stalkrot (Erwinia chrysantemi pv. zeae), common smut(Ustilago maydis), aspergillus ear rot (Aspergillus plavus),and gray ear rot (Physalospora zeae). The most importantcorn diseases in Palu Valley are downy mildew, maydis leafblight, polysora rust, banded leaf and sheath blight, andaspergillus ear rot.
There is no single completely effective measure forcontrolling all corn diseases. However, losses can beminimized by following certain recommended practices.Corn diseases can be controlled by using disease-resistanthybrids or by applying fungicides to the seed. Otherpractices such as spraying plants with fungicide, adjustingsoil fertility with fertilizers, and maintaining good drainagemay also be used with certain diseases and in certaincircumstances. Incorporating genetic resistance intoagronomically desirable hybrids seems to be the mostefficient and permanent means of controlling corndiseases. The treatment of seed corn with a fungicide eitherin a dust or slurry, may control seed rots and seedlingdiseases, but will control no other disease. Crop rotationand destruction of diseased plant parts have beensuggested as control measures for certain plant diseases.
ReferencesAbbas H.K, Robert M.Z., Bruns H.A. and Abel C.A. 2006.
Biocontrol of aflatoxin in corn by inoculation withnonaflatoxigenic Aspergillus flavus isolates. BiocontrolScience and Technology 16(5):437-449.
Bonde M.R., Peterson G.L., Kenneth R.G., Vermeulen H.D.,Sumartini and Bustaman M. 1992. Effect of temperatureon conidial germination and systemic infection of maizeby Peronosclerospora species. Phytopathology 82:104-109.
Bailey B.A., Schuh W., Frederiksen R.A., Bockholt A.J. andSmith J.D. 1987. Identification of slow-rusting resistanceto Puccinia polysora in maize inbreds and single crosses.Plant Disease 71(6):518-521.
CBS (Central Bureau of Statistics Indonesia). 1999. StatisticsIndonesia. http://www.bps.go.id/. Nov 20, 2008.
CPC (Crop Protection Compendium). 2004. Oxford,Wallingford, UK: CAB International.
Diener U.L., Cole R.J., Sanders T.H., Payne G.A., Lee L.S. andKlich M.A. 1987. Epidemiology of aflatoxin formationby Aspergillus flavus. Annual Review of Phytopathology25:249-270.
ICERI (Indonesian Cereals Research Institute). 2008.Technology innovation supporting maize production.Indonesian Center for Food Research and Development.32pp.
Montes-Belmont and Carvajal M. 2008. Control of Aspergillusflavus in maize with plant essential oils and theircomponents. INIST-CNRS. http://cat.inist.fr/?aModele=afficheN&cpsidt=2242179. Nov 25, 2008.
Muis A. and Quimio A.J. 2006. Biological control of bandedleaf and sheath blight disease (Rhizoctonia solani Kuhn)in corn with formulated Bacillus subtilis BR23. Indon. J.Agric. Sci. 7(1):1-7.
Shurtleff M.C. 1980. Compendium of corn diseases. 2nd edn.St. Paul, Minnesota, USA: American PhytopathologicalSociety. 105pp
Sumaryanto. 2004. Survey and farm record keeping. PelatihanAnalisa Finansial dan Ekonomi bagi Pembangunan Sistemdan Usahatani Agribisnis Wilayah, 29 Nov-9 Dec 2004.Pusat Penelitian dan Pengembangan Sosial EkonomiPertanian.
Swastika D.K.S., Sudana W. and Hendayana R. 2001. Thecharacteristics of maize production system in Indonesia.Country report presented in the Fourth Annual Workshopof the Asian Maize Socioeconomic Working Group,Kathmandu, Nepal, 4-8 June 2001.37pp.

399
����� � ���� ����������� �������
IntroductionSheath blight caused by Rhizoctonia solani is an
important disease of maize. R. solani infects the lowersheath, then spreads upward to the ears and can causesignificant losses of harvested maize. This disease is foundin many corn farms in southern Sulawesi and eastern Java(Rahamma et al. 1999; Soenartiningsih et al. 2006).
R. solani can also attack plants other than maize suchas peanut, mung bean, soybean and sorghum. This diseasecan be controlled by pulling the infected plants, but thatcan be quite expensive when the number is large. It canalso be controlled with fungicide, but this strategy isconsidered harmful to the environment.
Arbuscular mycorrhizae (AM) increase nutrient uptakeby roots and thus aid plant growth (Stribley 1998).Mycorrhizal association has been proposed as an optionin the management of soilborne pathogens (Perrin 1990).Association withAM fungi can lead to increased resistancedue to the production of certain compounds such as phenol.Plants infected by mycorrhizae are often less colonized bypathogens and show reduced disease incidence. Thepresent research was carried out to study the effect ofinoculating corn with AM fungi Glomus sp andAcaulospora mellea on sheath blight incidence, rootinfection of mycorrhizae and spore density.
Materials and MethodThe experiment was a three-factorial experiment
arranged in a randomized complete design. The first factorof the experiment comprised the variety Wisanggeni and
the line GM 30; the second was inoculation withmycorrhizae (Glomus sp and A. mellea); and the third wasthe inoculum quantity (weight) of mycorrhizae (10 g, 20 gand 30 g). Each treatment had three replications. Prior touse, the soil was fumigated with methyl bromide, placed inpots (5 kg soil per pot) and fertilized with urea 25 mg, KCl25 mg and SP 36 12.5 mg per pot.
The inoculum of AM fungi, ie, Glomus sp and A.mellea, consisting of soil, root and spores (10_20 sporesper gram of soil), was applied around the roots of maizeseedlings at planting time. The R. solani pathogen wasgrown on potato dextrose agar incubated in a moist chamber(temperature 20_25oC) for 15 days after isolation. One gramof the culture containing mycelia and young developingsclerotia were used for inoculation around the lower sheathat 30 days after planting.
Assessment of infection
The effect of AM fungal symbiosis on diseasedevelopment and severity was assessed 10_50 days afterinoculation of R. solani. The rate of intensity of infectionwas determined as per the following formula:
3�&�����+I = ��������������
V ��4whereI = Intensity of infectionn = Number of plants in each infection categoryv = Scale value of each infection categoryV = Scale value of the highest infection categoryN = Number of observed plants
Use of Arbuscular Mycorrhizae in Control of Sheath Blight(Rhizoctonia solani) on Maize
SoenartiningsihIndonesian Cereal Research Institute (ICERI), Maros, Indonesia.
Abstract. Sheath blight is a major disease of maize caused by Rhizoctonia solani. Arbuscular mycorrhizal (AM)fungi have have been reported to have the capacity to increase maize tolerance to the sheath blight infestation. A potculture experiment was designed to study the effects of inoculation of maize by AM fungi (Glomus sp and Acaulosporamellea) on the development of sheath blight. The results indicated that inoculation with the AM fungi decreasedsheath blight incidence. The decrease in intensity ranged from 21.9% to 40.8%. Inoculation of R. solani also reducedthe percentage root infection and the number of spores produced by the mycorrhizae. The intensity of sheath blightwas highest in plants inoculated with R. solani only but less in plants treated with R. solani plus mycorrhizae.
Key words: Glomus sp, Acaulospora mellea, Rhizoctonia solani
400
������� �� �� ����� ������� ����� ���������������
Percentage root colonization by mycorrhizae
The extent of mycorrhizal colonization was assessedby recording the percentage of root pieces infected afterclearing. The roots were cut into 1 cm pieces, and 100 rootsegments were examined. The percentage of mycorrhizalinfection was calculated using the following formula(Kormanik et al. 1980).
No. of roots with infection��������������������
No. of roots observed
Isolation of mycorrhizal spores
Spores were isolated from the rhizosphere soil by wet-sieving and decanting (Gerdeman and Nicolson 1963). Thespore density was calculated by direct count andrepresented as the number of spores 100 g-1 soil.
Results and Discussion
Intensity of sheath blight disease
The intensity of sheath blight of plants inoculatedwith mycorrhizae was significantly lower than that of
noninoculated plants (Table 1). Inoculation with 10-30 g ofAM fungi decreased sheath blight intensity by as muchas 24.90_37.43 % in the Wisanggeni variety and the GM 30line while in noninoculated maize AM fungal infectionranged from 42.19_47.67% after 50 days of inoculation byR solani. The average reduction in intensity of sheathblight ranged from 21.9% to 40.8%.
Increased tolerance of sheath blight in general issupposed to be the main effect of arbuscular mycorrhizaeon the host plant. Furthermore, as also reported by Asconand Barea (1996), AM association can reduce damagecaused by soilborne plant pathogens. The ability of AMsymbiosis to enhance resistance or tolerance in roots isnot equal for the different AM fungi so far tested.
Percentage of root infection of mycorrhiza
Table 2 presents the percentage of root infection bymycorrhiza in plants that were inoculated with R. solani aswell as AM fungi as compared with plants that wereinoculated with only mycorrhizae. Plants inoculated withmycorrhizae only showed higher mycorrhizal root infectionthan plants that received both mycorrhizae and R. solani.The presence of R. solani suppresses mycorrhizal infectionof the root. Reduction in root infection by Glomus sp andA. mellea due to R. solani ranged from 18.24% to 36.95%
Table 1. Intensity1 of sheath blight on Wisanggeni and GM 30 corn varieties inoculated with Glomus sp and A. mellea atvarious inoculum weights.
Variety/Lines
Mycorrhizalinoculumweight (g)
Wisanggeni Glomus sp . 0 8.77 a 19.81 a 29.90 a 37.74 ab 42.19 a10 3.42 c 6.85 d 13.44 d 21.49 c 32.95 bc20 0.00 d 1.23 e 7.36 e 13.50 d 24.90 c30 0.00 d 2.17 e 6.92 e 11.58 d 25.16 c
A. mellea 0 9.22 a 20.60 a 30.80 a 38.95 ab 44.72 a10 7.04 b 8.30 de 16.43 cd 26.43 c 35.11 b20 0.53 d 4.38 ef 10.69 d 19.84 cd 27.43 c30 0.00 d 3.42 ef 10.55 e 15.43 d 26.80 c
GM 30 Glomus sp . 0 11.11 a 22.22 a 28.56 a 40.19 a 45.90 a10 8.71 ab 11.85 d 18.29 cd 24.96 c 35.12 b20 0.55 d 4.36 ef 13.44 d 16.31 d 27.85 c30 0.17 d 3.42 ef 11.70 de 17.54 d 28.13 c
A. mellea 0 11.76 a 21.89 a 30.75 a 41.70 a24.83 c
47.67 a
10 6.04 b 11.51 d 20.16 c 18.28 cd 37.43 b20 1.23 d 4.39 ef 15.43 cd 17.37 d 29.70 c30 0.00 d 2.17 f 10.75 e 29.31 c
Treatment Intensity of sheath blight disease (%)Mycorrhizal 10 days 20 days 30 days 40 days 50 days
after inoculated R.solani
1. Values within the same column followed by the same letter are not significantly different as per Duncan��� �� ��� ���,�� ����� &$�+�
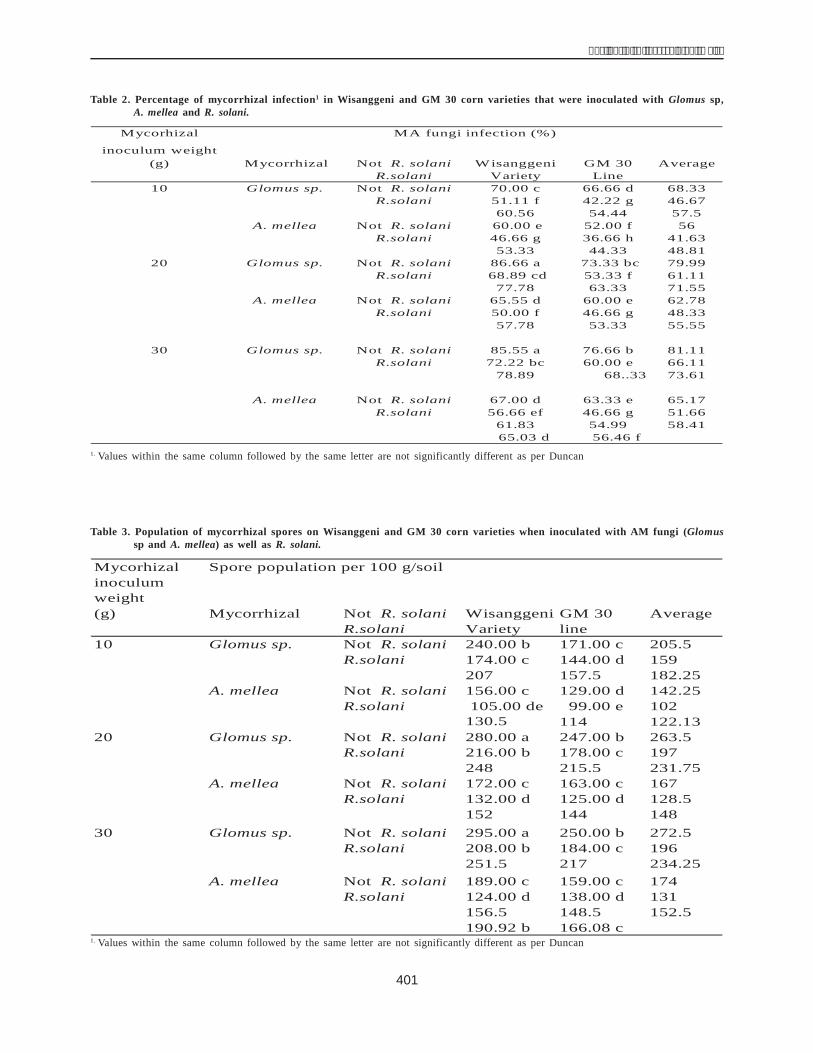
401
����� � ���� ����������� �������
Table 2. Percentage of mycorrhizal infection1 in Wisanggeni and GM 30 corn varieties that were inoculated with Glomus sp,A. mellea and R. solani.
Mycorhizal
inoculum weight(g) Not R. solani Wisanggeni GM 30
R.solani Variety LineNot R. solani 70.00 c 66.66 d 68.33
R.solani 51.11 f 42.22 g 46.6760.56 54.44 57.5
Not R. solani 60.00 e 52.00 f 56R.solani 46.66 g 36.66 h 41.63
53.33 44.33 48.81Not R. solani 86.66 a 73.33 bc 79.99
R.solani 68.89 cd 53.33 f 61.1177.78 63.33 71.55
Not R. solani 65.55 d 60.00 e 62.78R.solani 50.00 f 46.66 g 48.33
57.78 53.33 55.55
Not R. solani 85.55 a 76.66 b 81.11R.solani 72.22 bc 60.00 e 66.11
78.89 68..33 73.61
Not R. solani 67.00 d 63.33 e 65.17R.solani 56.66 ef 46.66 g 51.66
61.83 54.99 58.4165.03 d 56.46 f
20 Glomus sp.
A. mellea
30 Glomus sp.
A. mellea
MA fungi infection (%)
Mycorrhizal Average
10 Glomus sp.
A. mellea
1. Values within the same column followed by the same letter are not significantly different as per Duncan��� �� ��� ���,�� ����� &$�+�
Table 3. Population of mycorrhizal spores on Wisanggeni and GM 30 corn varieties when inoculated with AM fungi (Glomussp and A. mellea) as well as R. solani.
Mycorhizalinoculumweight(g) Mycorrhizal Not R. solani Wisanggeni GM 30 Average
R.solani Variety line10 Glomus sp. Not R. solani 240.00 b 171.00 c 205.5
R.solani 174.00 c 144.00 d 159207 157.5 182.25
A. mellea Not R. solani 156.00 c 129.00 d 142.25R.solani 105.00 de 99.00 e 102
130.5 114 122.1320 Glomus sp. Not R. solani 280.00 a 247.00 b 263.5
R.solani 216.00 b 178.00 c 197248 215.5 231.75
A. mellea Not R. solani 172.00 c 163.00 c 167R.solani 132.00 d 125.00 d 128.5
152 144 14830 Glomus sp. Not R. solani 295.00 a 250.00 b 272.5
R.solani 208.00 b 184.00 c 196251.5 217 234.25
A. mellea Not R. solani 189.00 c 159.00 c 174R.solani 124.00 d 138.00 d 131
156.5 148.5 152.5190.92 b 166.08 c
Spore population per 100 g/soil
1. Values within the same column followed by the same letter are not significantly different as per Duncan��� �� ��� ���,�� ����� &$�+�
402
������� �� �� ����� ������� ����� ���������������
for the Wisanggeni variety, and from 26.68% to 57.88% forthe GM 30 line.
R. solani significantly reduced the percentage of rootlength colonization by the AM fungi. This indicates thatR. solani had a negative effect on mycorrhizal colonization(Morandi et al. 2002).
Mycorrhizal spores
Observations on spore population indicated that inmaize plants inoculated with Glomus sp and A. mellea, themycorrhizal spore population was higher than in plantsthat received both mycorrhizal and R. solani inocula (Table3). This indicates that the presence of R. solani reducedthe number of mycorrhizal spores significantly. In thecombined treatment (mycorrhizae + R. solani) themycorrhizal spore population was lower by 29.62-52.41%for Wisanggeni and by 15.21-38.76% for GM 30.
ConclusionsInoculation with Glomus sp and A. mellea decreased
sheath blight disease intensity by 21.9%, 37.7% and 40.8% respectively. Inoculation of maize plants with mycorrhizaonly ������ ������! ��� ����� �������� "���� 5����well as R. solani �� ��!���� ,���� "���� 5�� ����population and root infection, because the presence of R.solani suppresses mycorrhizal infection and sporeformation.
AcknowledgementWe thank Prof. Dr.Ambarwati H. Tjokrosoedarmo and
Prof. Dr. Nursamsi Pusposendjoyo of the faculty ofAgricultural Gadjah Mada University. We are also gratefulto Dr. John Bacobaon of the Indonesian Coffee and CocoaResearch Institute for his time and suggestions.
ReferencesAscon A. and Barea J.M. 1999. Arbuscular mycorrhizae and
biological control of soilborne plant pathogens: an overviewof the mechanism involved. Mycorrhizae 6:457-464.
Gerdemann J.W. and Nicolson T.H. 1963. Spores ofmycorrhizal endogone species extracted from soil by wet-sieving and decanting. Trans Br. Mycol. Soc. 46:235-244.
Kormanik P.P., Bryan W.C. and Schultz R.C. 1980. Proceduresand equipment for staining large numbers of plant rootsamples for endomycorrhizal assay. Can. J. Microbiol.26:536-538.
Perrin R. 1990. Interaction between mycorrhizae and diseasecaused by soilborne fungi. Soil Use Manag. 6:189-195
Morandi D., Gollote A. and Comporota P. 2002. Influence ofan arbuscular mycorrhizal fungus on the interaction ofbinucleate Rhizoctonia species with Myc+ and Myc. pearoot. Mycorrhizae 12:97-102.
Rahamma S., Kontong S. and Talanca A.H. 1999. Evaluasibeberapa varietas jagung terhadap penyakit busuk pelepah(R. solani). Hasil penelitian hama dan penyakit. BadanPenelitian dan Pengembangan Pertanian. Balai PenelitianTanaman Jagung dan Serealia Lainnya. (Evaluation of somecorn varieties to sheath blight disease. Research Institutefor Maize and Other Cereals).
Soenartiningsih,Ambarwati H., Nursamsi P. and Baon J.B. 2006.The effect of arbuscular mycorrhizal fungi on thedevelopment of sheath blight on maize plants in the field.Indonesian Journal of Biosfera 23 (2):86-91.
Stribley D.P. 2000. Mycorrhizal associations and theirsignificance. Pages 85-101 in Onion and allied crops. II.Agronomy, biotic interaction, pathology and cropprotection. Ravinovich H.D. and Brewster J.L. (eds.). BocaRaton, Florida, USA: CRC Press.
403
����� � ���� ����������� �������
IntroductionFarmers usually plant maize in the early rainy season,
so harvest is done under high rainfall conditions. Thisaffects the moisture content of the grain. If not driedimmediately after harvest, high moisture content (32-35%)in the cob (ear) can stimulate the growth of Aspergillusflavus, and also result in a high proportion (up to 15%) ofbroken seed at shelling (Tastra et al. 1990). Broken seedsare a good medium for A. flavus growth. The fungusproduces aflatoxin in the seed. Echardi (1986) reported thatwhen 100% broken yellow hybrid maize seeds andcomposite seeds were stored for four days at roomtemperature (30oC), the aflatoxin content was 42 ppb and26 ppb, respectively. According to the Food andAgriculture Organisation (FAO), the maximum permissiblelimit for aflatoxin in maize grain is 30 ppb (Beti and Ginting1993). According to Hamilton (1986) and Wilson (1978),food contaminated by aflatoxin (>30 ppb) can cause deadlychronic diseases. Drying the grain is therefore imperativeto prevent A. flavus infection. Purwadaria (1988) reportedthat drying the grain to decrease moisture content to 5.2-15.2% at harvest improved maize seed quality and quantityin Indonesia.
Maize grain can be dried in sunlight or by using adrying machine. Farmers in Indonesia dry maize grain bythe roadside or in the household yard on a mat (83%), oron a concrete floor (6.8%) or by using a dryer (0.03%)(Subandi and Manwan 1990). Furthermore, Sarasutha et
al. (2001) reported that farmers tend to dry the cobs bycutting the maize stem above the ear, opening the huskand then keeping the maize on the stalk to dry. Anothermethod used is to hang the cobs from the attic of thehouse. These drying methods, however, leave the cobssusceptible to seedborne fungal infections.
The aim of our study was to identify drying methodsthat minimize the risk of A. flavus infection.
MethodThe study was conducted in Tenilo in Gorontalo
Provice of Indonesia in 2005. We collected 500 g samplesof maize seed and subjected them to the following dryingtreatments.
P1 Maize plant kept in the field until 7 days ofphysiological maturity � harvest � peeling � sun-drying of the cob to decrease moisture content to 15-17%.
P2 Ears harvested after 7 days of physiological maturity� peeling � drying the cob to 15-17% moisturecontent in a dryer.
P3 Ears harvested after 7 days of physiological maturity� peeling � piling the cob for 3 days � shelling �drying the seeds in a dryer to 15-17% moisture content.
Effect of Several Drying Methods on Infection of Maize byAspergillus flavus in Gorontalo, Indonesia
A. HarisTalanca, I.U. Firmansyah and W. WakmanIndonesian Cereal Research Institute, Maros, Indonesia.
Abstract. Postharvest processing of maize can affect the quality of seed. If harvested maize has high moisturecontent and is not dried immediately, the chances of infection by the fungal pathogen Aspergillus flavus are veryhigh. The fungus produces a mycotoxin that affects seed quality. Seed with high aflatoxin content can cause livercancer in humans and adversely affect milk quality in animals. This study was conducted at the Indonesian CerealResearch Institute (ICERI) laboratory in 2005 to test the effect of seven different seed-drying methods (P1-P7) on A.flavus infection. Five hundred gram samples of maize seed were taken from each of these seven seed-dryingtreatments. Then 100 seeds of each were put in 10 sterile petriplates with wet filter paper, 10 seeds to everypetriplate. The experiment was arranged in a randomized complete design, with seven treatments and 10 replications.The study was aimed at identifying drying methods that reduce A. flavus infection and maintain seed quality. Theresults indicated that the rates of A. flavus infection varied among the different drying treatments. Comulation ofcobs after harvest for three and five days before drying stimulated the growth of A. flavus, and reduced thegermination ability of the seeds. Cobs that were dried immediately following harvest resulted had low A. flavusinfection and high germination ability.
Key words: Postharvest, A. flavus, aflatoxin, seed, corn
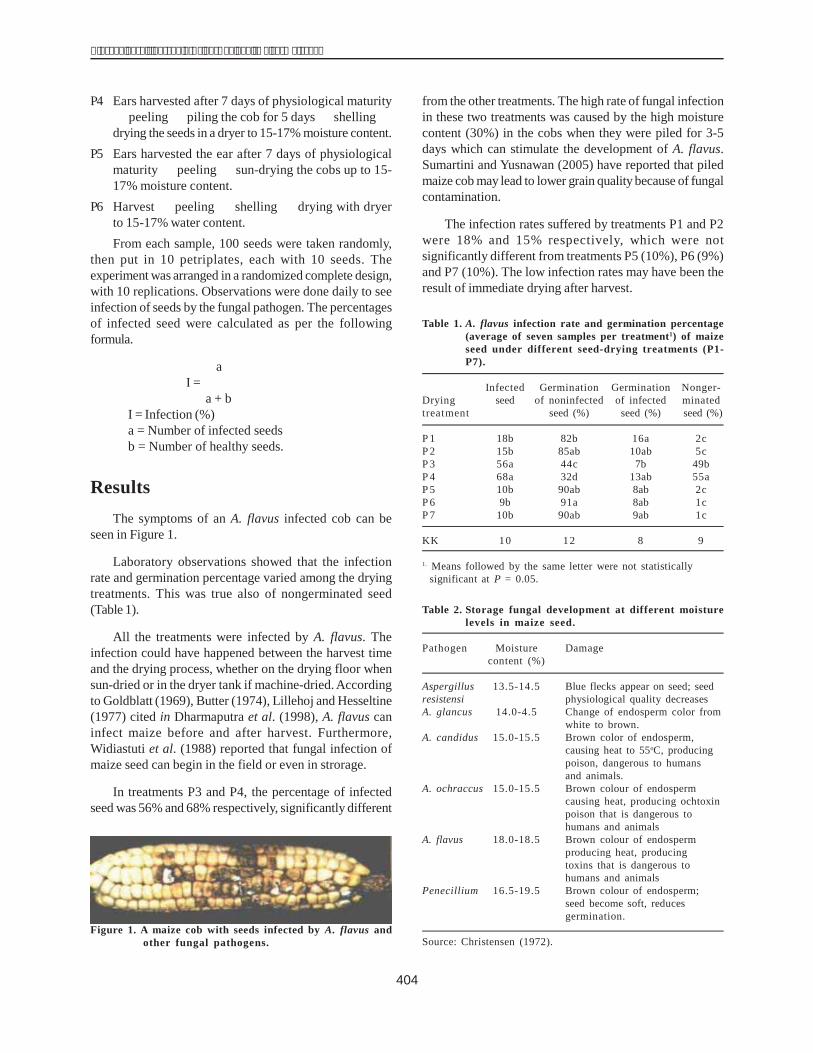
404
������� �� �� ����� ������� ����� ���������������
P4 Ears harvested after 7 days of physiological maturity� peeling � piling the cob for 5 days � shelling �drying the seeds in a dryer to 15-17% moisture content.
P5 Ears harvested the ear after 7 days of physiologicalmaturity � peeling � sun-drying the cobs up to 15-17% moisture content.
P6 Harvest � peeling � shelling � drying with dryerto 15-17% water content.From each sample, 100 seeds were taken randomly,
then put in 10 petriplates, each with 10 seeds. Theexperiment was arranged in a randomized complete design,with 10 replications. Observations were done daily to seeinfection of seeds by the fungal pathogen. The percentagesof infected seed were calculated as per the followingformula.
aI = ������������
a + bI = Infection (%)a = Number of infected seedsb = Number of healthy seeds.
ResultsThe symptoms of an A. flavus infected cob can be
seen in Figure 1.
Laboratory observations showed that the infectionrate and germination percentage varied among the dryingtreatments. This was true also of nongerminated seed(Table 1).
All the treatments were infected by A. flavus. Theinfection could have happened between the harvest timeand the drying process, whether on the drying floor whensun-dried or in the dryer tank if machine-dried. Accordingto Goldblatt (1969), Butter (1974), Lillehoj and Hesseltine(1977) cited in Dharmaputra et al. (1998), A. flavus caninfect maize before and after harvest. Furthermore,Widiastuti et al. (1988) reported that fungal infection ofmaize seed can begin in the field or even in strorage.
In treatments P3 and P4, the percentage of infectedseed was 56% and 68% respectively, significantly different
from the other treatments. The high rate of fungal infectionin these two treatments was caused by the high moisturecontent (30%) in the cobs when they were piled for 3-5days which can stimulate the development of A. flavus.Sumartini and Yusnawan (2005) have reported that piledmaize cob may lead to lower grain quality because of fungalcontamination.
The infection rates suffered by treatments P1 and P2were 18% and 15% respectively, which were notsignificantly different from treatments P5 (10%), P6 (9%)and P7 (10%). The low infection rates may have been theresult of immediate drying after harvest.
Figure 1. A maize cob with seeds infected by A. flavus andother fungal pathogens.
Table 1. A. flavus infection rate and germination percentage(average of seven samples per treatment1) of maizeseed under different seed-drying treatments (P1-P7).
Infected Germination Germination Nonger-Drying seed of noninfected of infected minatedtreatment seed (%) seed (%) seed (%)
P 1 18b 82b 16a 2cP 2 15b 85ab 10ab 5cP 3 56a 44c 7b 49bP 4 68a 32d 13ab 55aP 5 10b 90ab 8ab 2cP 6 9b 91a 8ab 1cP 7 10b 90ab 9ab 1c
KK 10 12 8 9
1. Means followed by the same letter were not statisticallysignificant at P = 0.05.
Table 2. Storage fungal development at different moisturelevels in maize seed.
Pathogen Moisture Damagecontent (%)
Aspergillus 13.5-14.5 Blue flecks appear on seed; seedresistensi physiological quality decreasesA. glancus 14.0-4.5 Change of endosperm color from
white to brown.A. candidus 15.0-15.5 Brown color of endosperm,
causing heat to 55oC, producingpoison, dangerous to humansand animals.
A. ochraccus 15.0-15.5 Brown colour of endospermcausing heat, producing ochtoxinpoison that is dangerous tohumans and animals
A. flavus 18.0-18.5 Brown colour of endospermproducing heat, producingtoxins that is dangerous tohumans and animals
Penecillium 16.5-19.5 Brown colour of endosperm;seed become soft, reducesgermination.
Source: Christensen (1972).
405
����� � ���� ����������� �������
Moisture content is a factor that affects fungaldevelopment. At a moisutre content of 20% or more,development of the fungus is fast; in contrast, at a watercontent <13%, fungal growth is slow (Table 2).
Conclusions
� Piling of cobs after harvest and late drying canstimulate development of A. flavus.
� Drying immediately after harvest with a dryer or underthe sun can prevent development of A. flavusinfection.
ReferencesBeti J.A. and Ginting. 1993. Permasalahan aflatoksin pada jagung
dan pengendaliannya. Simposium Penelitian TanamanPangan III. Puslitbangtan. Balai Penelitian Tanaman PanganMalang.
Christensen C.M. 1972. Microflora and seed deterioration. Pages59-93 in Viability of seeds. Roberts E.H. (ed.). Chapmanand Hall.
Dharmaputra O.S., Suryaputra and Wakman W. 1998.Penanganan pascapanen serangan serangga dan cendawanserta kontaminasi aflatoksin pada jagung. Prosiding danLokakarya Nasional Jagung. Badan Litbang Pertanian.P.594-604.
Echandi R.Z. 1986. The relationship between aflatoxinformation and kernel damage in Costa Rica maize. Pages51-57 in Aflatoxins in maize: proceedings of a workshop,El Batan, Mexico.
Hamilton P.B. 1986. Aflatoxicosis in farm animals. Pages 51-57in Aflatoxins in maize: proceedings of workshop, El Batan,Mexico.
Paz R.R., Tiongson R.L., Dayanghirang D.D. and RodriquesA.C. 1989. Control of aflatoxin in Philippines Maize.Pages 89-109 in Grain postharvest research anddevelopment: priorities for the nineties. Proceedings ofthe Twelfth ASEAN Seminar on Grain PostharvestTechnology. Naebanij J.O. (ed.).
Purwadaria H.K. 1988. Technology penanganan pascapanenjagung. Buku Pegangan. Deptan. FAO, UNDP.
Sarasutha I.G.P., Sinuseng Y., Margaretha S.L., Wakman W.,Arief R.,Abidin B.B. and Firmansyah I.U. 2001. Teknologipasca panen jagung dan sorgum. Laporan Hasil PenelitianKelti Fisiologi Hasil.
Subandi and Manwan I. 1990. Penelitian dan teknologipeningkatan produksi jagung di Indonesia. Pusat Penelitiandan Tanaman Pangan. Laporan Khusus Pus/04/90.
Sumartini and Yusnawan E. 2005. Upaya menghambatperkembangan Aspergillus flavus pada kacang tanah. JurnalPenelitian dan Pengembangan Pertanian. Badan Penelitiandan Pengembangan Pertanian. Deptan. 24(3):109-112.
Tastra I.K., Ginting E. and Merx R. 1990. Determination of theoptimum moisture content for shelling maize using localshellers. Internal technical report. ATA272/NRC-MARIF.
Widiastuti, Maryan R., Blanky B.J., Salfina and Stoth D.R.1988. Corn as a source of mycotoxin in Indonesia poultryfunds and the effectivenes of visual examination fordetection of contamination mycopathologies.
Wilson B.J. 1978. Hazards of mycotoxin to public health.Journal of food Protection 41:375-384.
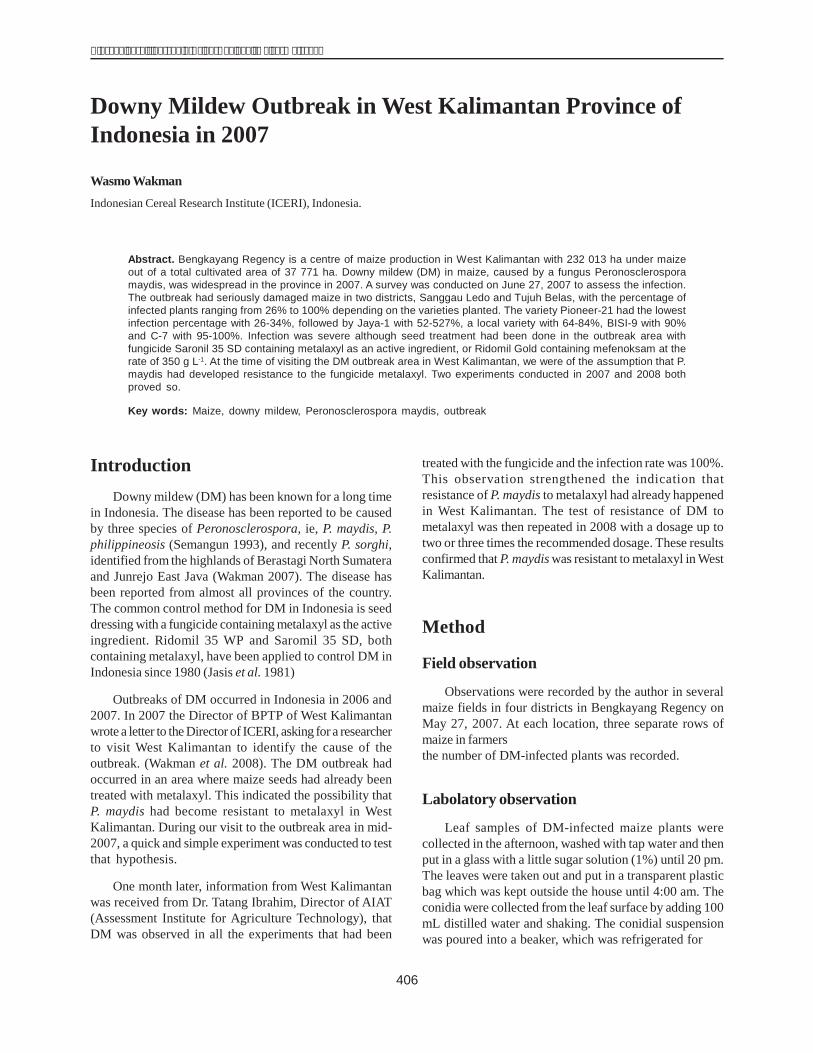
406
������� �� �� ����� ������� ����� ���������������
IntroductionDowny mildew (DM) has been known for a long time
in Indonesia. The disease has been reported to be causedby three species of Peronosclerospora, ie, P. maydis, P.philippineosis (Semangun 1993), and recently P. sorghi,identified from the highlands of Berastagi North Sumateraand Junrejo East Java (Wakman 2007). The disease hasbeen reported from almost all provinces of the country.The common control method for DM in Indonesia is seeddressing with a fungicide containing metalaxyl as the activeingredient. Ridomil 35 WP and Saromil 35 SD, bothcontaining metalaxyl, have been applied to control DM inIndonesia since 1980 (Jasis et al. 1981)
Outbreaks of DM occurred in Indonesia in 2006 and2007. In 2007 the Director of BPTP of West Kalimantanwrote a letter to the Director of ICERI, asking for a researcherto visit West Kalimantan to identify the cause of theoutbreak. (Wakman et al. 2008). The DM outbreak hadoccurred in an area where maize seeds had already beentreated with metalaxyl. This indicated the possibility thatP. maydis had become resistant to metalaxyl in WestKalimantan. During our visit to the outbreak area in mid-2007, a quick and simple experiment was conducted to testthat hypothesis.
One month later, information from West Kalimantanwas received from Dr. Tatang Ibrahim, Director of AIAT(Assessment Institute for Agriculture Technology), thatDM was observed in all the experiments that had been
treated with the fungicide and the infection rate was 100%.This observation strengthened the indication thatresistance of P. maydis to metalaxyl had already happenedin West Kalimantan. The test of resistance of DM tometalaxyl was then repeated in 2008 with a dosage up totwo or three times the recommended dosage. These resultsconfirmed that P. maydis was resistant to metalaxyl in WestKalimantan.
Method
Field observation
Observations were recorded by the author in severalmaize fields in four districts in Bengkayang Regency onMay 27, 2007. At each location, three separate rows ofmaize in farmers��� ����!������(������������ �����������the number of DM-infected plants was recorded.
Labolatory observation
Leaf samples of DM-infected maize plants werecollected in the afternoon, washed with tap water and thenput in a glass with a little sugar solution (1%) until 20 pm.The leaves were taken out and put in a transparent plasticbag which was kept outside the house until 4:00 am. Theconidia were collected from the leaf surface by adding 100mL distilled water and shaking. The conidial suspensionwas poured into a beaker, which was refrigerated for 6��
Downy Mildew Outbreak in West Kalimantan Province ofIndonesia in 2007
Wasmo WakmanIndonesian Cereal Research Institute (ICERI), Indonesia.
Abstract. Bengkayang Regency is a centre of maize production in West Kalimantan with 232 013 ha under maizeout of a total cultivated area of 37 771 ha. Downy mildew (DM) in maize, caused by a fungus Peronosclerosporamaydis, was widespread in the province in 2007. A survey was conducted on June 27, 2007 to assess the infection.The outbreak had seriously damaged maize in two districts, Sanggau Ledo and Tujuh Belas, with the percentage ofinfected plants ranging from 26% to 100% depending on the varieties planted. The variety Pioneer-21 had the lowestinfection percentage with 26-34%, followed by Jaya-1 with 52-527%, a local variety with 64-84%, BISI-9 with 90%and C-7 with 95-100%. Infection was severe although seed treatment had been done in the outbreak area withfungicide Saronil 35 SD containing metalaxyl as an active ingredient, or Ridomil Gold containing mefenoksam at therate of 350 g L-1. At the time of visiting the DM outbreak area in West Kalimantan, we were of the assumption that P.maydis had developed resistance to the fungicide metalaxyl. Two experiments conducted in 2007 and 2008 bothproved so.
Key words: Maize, downy mildew, Peronosclerospora maydis, outbreak
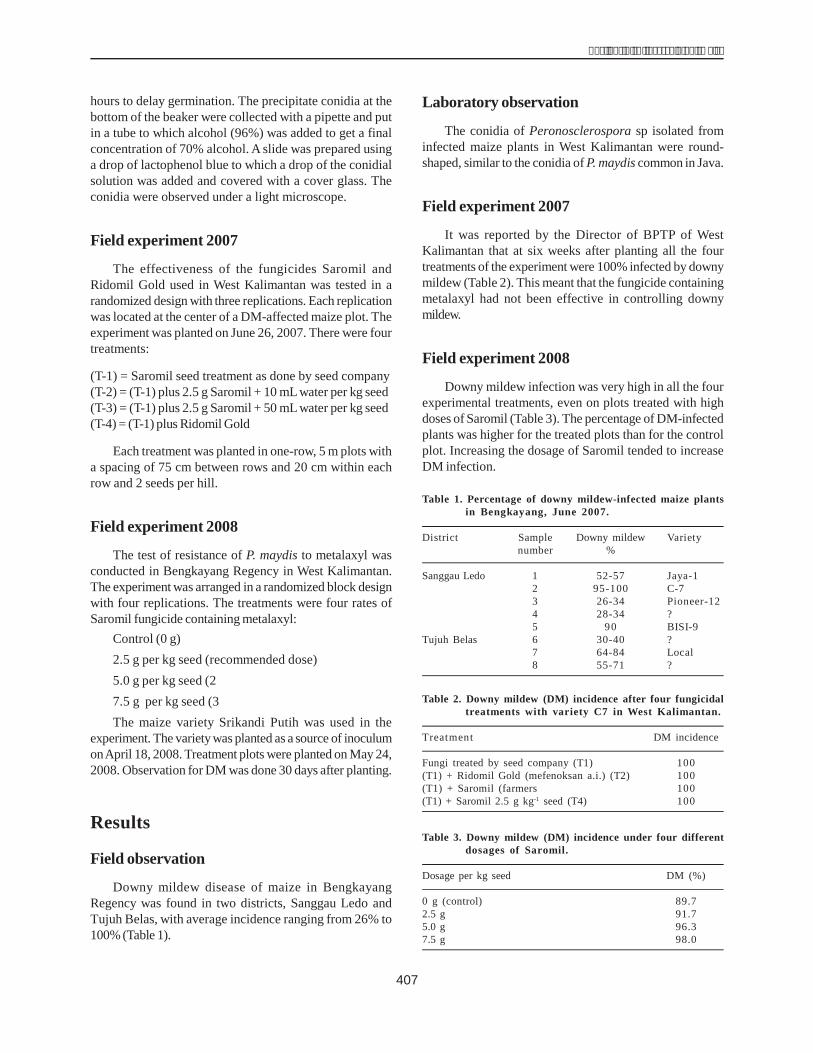
407
����� � ���� ����������� �������
hours to delay germination. The precipitate conidia at thebottom of the beaker were collected with a pipette and putin a tube to which alcohol (96%) was added to get a finalconcentration of 70% alcohol. A slide was prepared usinga drop of lactophenol blue to which a drop of the conidialsolution was added and covered with a cover glass. Theconidia were observed under a light microscope.
Field experiment 2007
The effectiveness of the fungicides Saromil andRidomil Gold used in West Kalimantan was tested in arandomized design with three replications. Each replicationwas located at the center of a DM-affected maize plot. Theexperiment was planted on June 26, 2007. There were fourtreatments:
(T-1) = Saromil seed treatment as done by seed company(T-2) = (T-1) plus 2.5 g Saromil + 10 mL water per kg seed(T-3) = (T-1) plus 2.5 g Saromil + 50 mL water per kg seed(T-4) = (T-1) plus Ridomil Gold
Each treatment was planted in one-row, 5 m plots witha spacing of 75 cm between rows and 20 cm within eachrow and 2 seeds per hill.
Field experiment 2008
The test of resistance of P. maydis to metalaxyl wasconducted in Bengkayang Regency in West Kalimantan.The experiment was arranged in a randomized block designwith four replications. The treatments were four rates ofSaromil fungicide containing metalaxyl:� Control (0 g)� 2.5 g per kg seed (recommended dose)� 5.0 g per kg seed (2 ����� ���������+� 7.5 g per kg seed (3 ����� ���������+
The maize variety Srikandi Putih was used in theexperiment. The variety was planted as a source of inoculumonApril 18, 2008. Treatment plots were planted on May 24,2008. Observation for DM was done 30 days after planting.
Results
Field observation
Downy mildew disease of maize in BengkayangRegency was found in two districts, Sanggau Ledo andTujuh Belas, with average incidence ranging from 26% to100% (Table 1).
Laboratory observation
The conidia of Peronosclerospora sp isolated frominfected maize plants in West Kalimantan were round-shaped, similar to the conidia of P. maydis common in Java.
Field experiment 2007
It was reported by the Director of BPTP of WestKalimantan that at six weeks after planting all the fourtreatments of the experiment were 100% infected by downymildew (Table 2). This meant that the fungicide containingmetalaxyl had not been effective in controlling downymildew.
Field experiment 2008
Downy mildew infection was very high in all the fourexperimental treatments, even on plots treated with highdoses of Saromil (Table 3). The percentage of DM-infectedplants was higher for the treated plots than for the controlplot. Increasing the dosage of Saromil tended to increaseDM infection.
Table 1. Percentage of downy mildew-infected maize plantsin Bengkayang, June 2007.
District Sample Downy mildew Varietynumber %
Sanggau Ledo 1 52-57 Jaya-12 95-100 C-73 26-34 Pioneer-124 28-34 ?5 90 BISI-9
Tujuh Belas 6 30-40 ?7 64-84 Local8 55-71 ?
Table 2. Downy mildew (DM) incidence after four fungicidaltreatments with variety C7 in West Kalimantan.
Treatment DM incidence
Fungi treated by seed company (T1) 100(T1) + Ridomil Gold (mefenoksan a.i.) (T2) 100(T1) + Saromil (farmers�� ����� ���+� &#�+ 100(T1) + Saromil 2.5 g kg-1 seed (T4) 100
Table 3. Downy mildew (DM) incidence under four differentdosages of Saromil.
Dosage per kg seed DM (%)
0 g (control) 89.72.5 g 91.75.0 g 96.37.5 g 98.0
408
������� �� �� ����� ������� ����� ���������������
ConclusionsThe downy mildew outbreak on maize in 2007 was
found mainly in two districts, Sanggau Ledo and TujuhBelas of Bengkayang Regency, in West Kalimantan.Disease incidence was intense in areas where the seedhad been treated with fungicide, indicating that P. maydishad become resistant to fungicides containing metalaxylas the active ingredient.Arapid field experiment conductedin 2007 and a resistance test done in 2008 both showedthat P. maydis has become resistant to fungicides containingmetalaxyl in West Kalimantan.
ReferencesSemangun H. 1993. Food crop diseases in Indonesia. (In
Indonesian). Gadjah Mada University Prees. 449ppJasis, Alimuso S. and Hamid. 1981. Some results of DM disease
control of maize during 1979-1981. (In Indonesian) Paperpresented at the VI National Congress of IndonesianPhytopathological Society, May 11-13, Bukittinggi,Indonesia.
Wakman W. 2007. Distribution of three identifiedPeronosclerospora sp, the causal agents of downy mildewdisease of maize in Indonesia: pages 202-203 in proceedingsof the Third Asian Conference on Plant Pathology. Aug20-24, Yogyakarta, Indonesia.
Wakman W., Talanca A.H., Surtikanti and Asri. 2008.Observation of DM disease on maize in Primatani area inBengkayang Regency, West Kalimantan Province, June26-27, 2007. Weekly seminar, ICERI. May 5, 2008.
409
����� � ���� ����������� �������
IntroductionA number of insect pests are associated with maize in
Indonesia. Baco and Tandiabang (1988) reported that 50insect species attack the crop, some of them important,causing serious damage. Rejesus and Javier (1985) andTeetes et al. (1983) also reported similar results in otherAsian countries. One of the most important of these pestsis theAsian corn borer (ACB; Ostrinia furnacalis).Annualmaize yield loss caused by insect pests in developingcountries was reported to be 30% (Berger 1962), and this ismainly caused byACB, ear borer and army worm.
The egg parasite of theAsian corn borer and ear boreris Trichogramma evanescens (Nonci et al. 2000; Gonzalesand Cadapan 2001; Javier et al. 2001), while the pathogensfound to be effective in controlling the larvae of ACB andear borer are Beauveria bassiana (Bals) and Metarrhiziumanisopliae (Metch) (Supriyatin 1993; Yasin et al. 2000;Baco 2000). Information about the occurrence of thesenatural enemies of insect pests in the maize productionarea of Central Sulawesi is limited.Against this context, weconducted an experiment to understand the speciescomposition and status of maize pests in Donggala districtof Central Sulawesi.
Materials and MethodThe experiment was conducted (May-Aug 2007) in
farmers�� � ���� ��������� �,��� �� ���������� ��� �����Donggala: Jono Oge and Sidondo villages in Biromarusubdistrict; Bahagia, Petimbe and Bobo in Palolo; andLabuan Toposo and Labuan Panimba in Labuan. Sampleswere collected from 0.25-1 ha maize plots, including 50samples from each location, 10 samples from every cornerand 10 samples from the middle of the plots.
Observation on insect pest species and their naturalenemies was done visuallyby using a sweep net. Thecollected insect eggs were kept in a petri dish containingwet filter paper and labeled. Larvae were placed in plasticboxes (7 cm in diamter; 8 cm height) and also labeled. Thelarvae were fed corn stalks. The parasited pests wereobserved under a microscope at the AIAT laboratory withthe help of identification guides by Teetes et al. (1983),Ortega (1987) and van der Laan (1981). Observations weredone daily and the species and number of parasites wererecorded and identified using the identification guides.
Maize Pest Status and Their Natural Enemies in MaizeProduction Area of Donggala, Central Sulawesi, Indonesia
AsniArdjanhar,Amran Muis and Nurnina NonciAssessment Institute for Agricultural Technology (AIAT), Central Sulawesi, Indonesia.*E-mail: [email protected]
Abstract. This experiment was aimed at understanding the species composition and status of maize pests inDonggala district of Central Sulawesi province in Indonesia in order to identify an appropriate control strartegy andmake location-specific IPM recommendations. Observations were recorded in seven villages in three subdistricts on0.5-1 ha plots of farmers������������������� !���"��#$�%��������&��������������������&������������������ ����$The results showed that the maize pests found in Donggala were almost the same as elsewhere in terms ofstructure, infection and distribution. The most important of the maize insect pests were Ostrinia furnacalis Guenee,Helicoverpa armigera Boddie and Atherigana sp. The second rung of important pests were Dalbulus maidis Delongand Walcott, Rhopalosiphum maidis Fitch and Nezara viridula L. Another pest, Nicentrites testaceipes, was alsofound in high numbers. The other maize pests found were not important. These were Spodoptera litura F., Plusiacalsites Esp., Lamprosema indicata F., Locusta migratoria and Valanga sp. Their natural enemies were predators andparasites. There were 12 species of predators found in our survey: Menochilus sexmaculatus, Scymnus sp,Epilachna sp, Coccinella transversali, Ophinea sp, Rodolia, Chrysopa, Euborellia annulata and Lycosa pseudoannulata.One species of larval parasite was found from the order/family Hymenoptera/Ichneumonidae. We also found thategg parasites were more effective in controlling O. furnacalis population compared with larval parasites. Thepercentage of egg mass of O. furnacalis parasited was 96% in all locations.
Key words: Maize pests, natural enemies, species composition
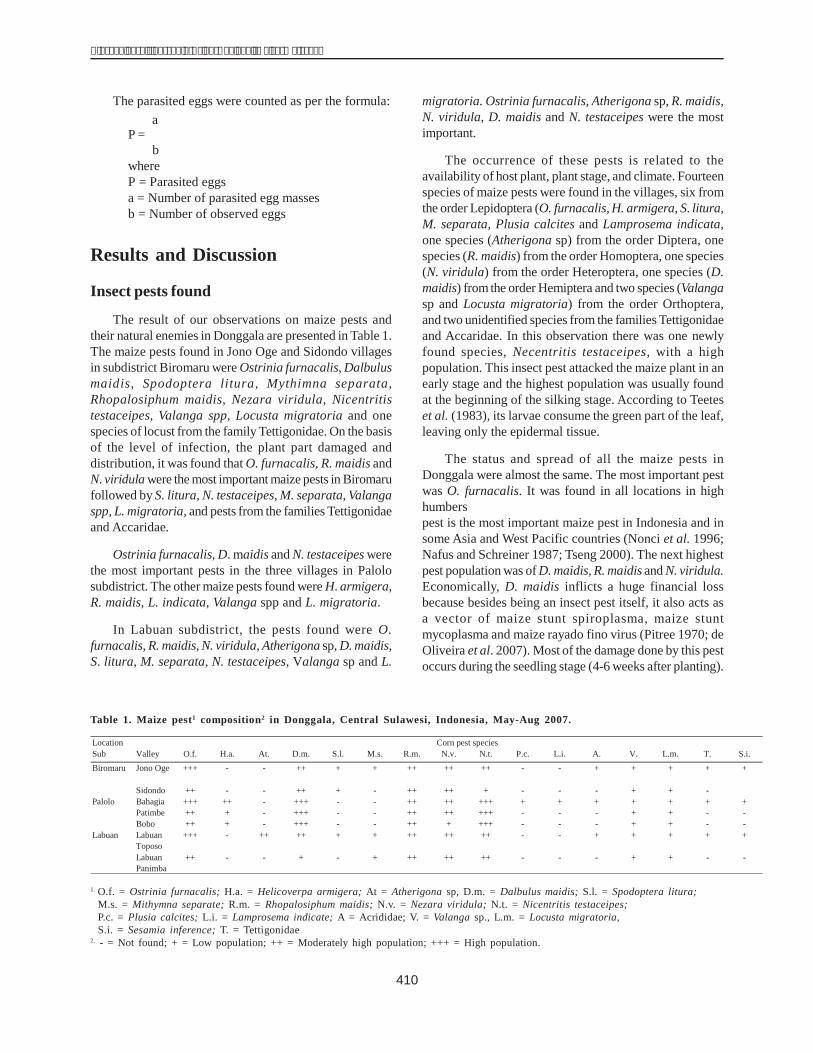
410
������� �� �� ����� ������� ����� ���������������
The parasited eggs were counted as per the formula:a
P =��������b
whereP = Parasited eggsa = Number of parasited egg massesb = Number of observed eggs
Results and Discussion
Insect pests found
The result of our observations on maize pests andtheir natural enemies in Donggala are presented in Table 1.The maize pests found in Jono Oge and Sidondo villagesin subdistrict Biromaru were Ostrinia furnacalis, Dalbulusmaidis, Spodoptera litura, Mythimna separata,Rhopalosiphum maidis, Nezara viridula, Nicentritistestaceipes, Valanga spp, Locusta migratoria and onespecies of locust from the family Tettigonidae. On the basisof the level of infection, the plant part damaged anddistribution, it was found that O. furnacalis, R. maidis andN. viridula were the most important maize pests in Biromarufollowed by S. litura, N. testaceipes, M. separata, Valangaspp, L. migratoria, and pests from the families Tettigonidaeand Accaridae.
Ostrinia furnacalis, D. maidis and N. testaceipes werethe most important pests in the three villages in Palolosubdistrict. The other maize pests found were H. armigera,R. maidis, L. indicata, Valanga spp and L. migratoria.
In Labuan subdistrict, the pests found were O.furnacalis, R. maidis, N. viridula, Atherigona sp, D. maidis,S. litura, M. separata, N. testaceipes, Valanga sp and L.
migratoria. Ostrinia furnacalis, Atherigona sp, R. maidis,N. viridula, D. maidis and N. testaceipes were the mostimportant.
The occurrence of these pests is related to theavailability of host plant, plant stage, and climate. Fourteenspecies of maize pests were found in the villages, six fromthe order Lepidoptera (O. furnacalis, H. armigera, S. litura,M. separata, Plusia calcites and Lamprosema indicata,one species (Atherigona sp) from the order Diptera, onespecies (R. maidis) from the order Homoptera, one species(N. viridula) from the order Heteroptera, one species (D.maidis) from the order Hemiptera and two species (Valangasp and Locusta migratoria) from the order Orthoptera,and two unidentified species from the families Tettigonidaeand Accaridae. In this observation there was one newlyfound species, Necentritis testaceipes, with a highpopulation. This insect pest attacked the maize plant in anearly stage and the highest population was usually foundat the beginning of the silking stage. According to Teeteset al. (1983), its larvae consume the green part of the leaf,leaving only the epidermal tissue.
The status and spread of all the maize pests inDonggala were almost the same. The most important pestwas O. furnacalis. It was found in all locations in highhumbers ����������,�������-7��� �����������������#� �pest is the most important maize pest in Indonesia and insome Asia and West Pacific countries (Nonci et al. 1996;Nafus and Schreiner 1987; Tseng 2000). The next highestpest population was of D. maidis, R. maidis and N. viridula.Economically, D. maidis inflicts a huge financial lossbecause besides being an insect pest itself, it also acts asa vector of maize stunt spiroplasma, maize stuntmycoplasma and maize rayado fino virus (Pitree 1970; deOliveira et al. 2007). Most of the damage done by this pestoccurs during the seedling stage (4-6 weeks after planting).
Table 1. Maize pest1 composition2 in Donggala, Central Sulawesi, Indonesia, May-Aug 2007.
1. O.f. = Ostrinia furnacalis; H.a. = Helicoverpa armigera; At = Atherigona sp, D.m. = Dalbulus maidis; S.l. = Spodoptera litura;M.s. = Mithymna separate; R.m. = Rhopalosiphum maidis; N.v. = Nezara viridula; N.t. = Nicentritis testaceipes;P.c. = Plusia calcites; L.i. = Lamprosema indicate; A = Acrididae; V. = Valanga sp., L.m. = Locusta migratoria,S.i. = Sesamia inference; T. = Tettigonidae
2. - = Not found; + = Low population; ++ = Moderately high population; +++ = High population.
SubDi i
Valley O.f. H.a. At. D.m. S.l. M.s. R.m. N.v. N.t. P.c. L.i. A. V. L.m. T. S.i.Biromaru Jono Oge +++ - - ++ + + ++ ++ ++ - - + + + + +
Sidondo ++ - - ++ + - ++ ++ + - - - + + -Palolo Bahagia +++ ++ - +++ - - ++ ++ +++ + + + + + + +
Patimbe ++ + - +++ - - ++ ++ +++ - - - + + - -Bobo ++ + - +++ - - ++ + +++ - - - + + - -
Labuan LabuanToposo
+++ - ++ ++ + + ++ ++ ++ - - + + + + +
LabuanPanimba
++ - - + - + ++ ++ ++ - - - + + - -
Location Corn pest species
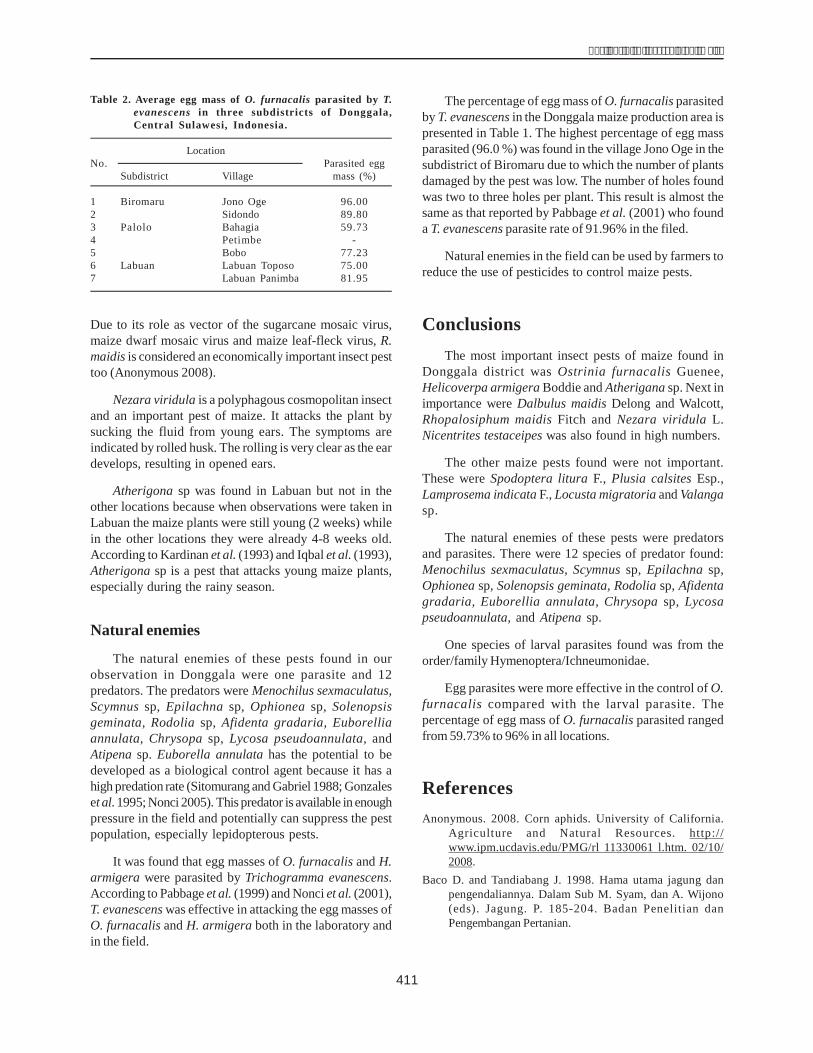
411
����� � ���� ����������� �������
Due to its role as vector of the sugarcane mosaic virus,maize dwarf mosaic virus and maize leaf-fleck virus, R.maidis is considered an economically important insect pesttoo (Anonymous 2008).
Nezara viridula is a polyphagous cosmopolitan insectand an important pest of maize. It attacks the plant bysucking the fluid from young ears. The symptoms areindicated by rolled husk. The rolling is very clear as the eardevelops, resulting in opened ears.
Atherigona sp was found in Labuan but not in theother locations because when observations were taken inLabuan the maize plants were still young (2 weeks) whilein the other locations they were already 4-8 weeks old.According to Kardinan et al. (1993) and Iqbal et al. (1993),Atherigona sp is a pest that attacks young maize plants,especially during the rainy season.
Natural enemies
The natural enemies of these pests found in ourobservation in Donggala were one parasite and 12predators. The predators were Menochilus sexmaculatus,Scymnus sp, Epilachna sp, Ophionea sp, Solenopsisgeminata, Rodolia sp, Afidenta gradaria, Euborelliaannulata, Chrysopa sp, Lycosa pseudoannulata, andAtipena sp. Euborella annulata has the potential to bedeveloped as a biological control agent because it has ahigh predation rate (Sitomurang and Gabriel 1988; Gonzaleset al. 1995; Nonci 2005). This predator is available in enoughpressure in the field and potentially can suppress the pestpopulation, especially lepidopterous pests.
It was found that egg masses of O. furnacalis and H.armigera were parasited by Trichogramma evanescens.According to Pabbage et al. (1999) and Nonci et al. (2001),T. evanescens was effective in attacking the egg masses ofO. furnacalis and H. armigera both in the laboratory andin the field.
The percentage of egg mass of O. furnacalis parasitedby T. evanescens in the Donggala maize production area ispresented in Table 1. The highest percentage of egg massparasited (96.0 %) was found in the village Jono Oge in thesubdistrict of Biromaru due to which the number of plantsdamaged by the pest was low. The number of holes foundwas two to three holes per plant. This result is almost thesame as that reported by Pabbage et al. (2001) who founda T. evanescens parasite rate of 91.96% in the filed.
Natural enemies in the field can be used by farmers toreduce the use of pesticides to control maize pests.
ConclusionsThe most important insect pests of maize found in
Donggala district was Ostrinia furnacalis Guenee,Helicoverpa armigera Boddie and Atherigana sp. Next inimportance were Dalbulus maidis Delong and Walcott,Rhopalosiphum maidis Fitch and Nezara viridula L.Nicentrites testaceipes was also found in high numbers.
The other maize pests found were not important.These were Spodoptera litura F., Plusia calsites Esp.,Lamprosema indicata F., Locusta migratoria and Valangasp.
The natural enemies of these pests were predatorsand parasites. There were 12 species of predator found:Menochilus sexmaculatus, Scymnus sp, Epilachna sp,Ophionea sp, Solenopsis geminata, Rodolia sp, Afidentagradaria, Euborellia annulata, Chrysopa sp, Lycosapseudoannulata, and Atipena sp.
One species of larval parasites found was from theorder/family Hymenoptera/Ichneumonidae.
Egg parasites were more effective in the control of O.furnacalis compared with the larval parasite. Thepercentage of egg mass of O. furnacalis parasited rangedfrom 59.73% to 96% in all locations.
ReferencesAnonymous. 2008. Corn aphids. University of California.
Agriculture and Natural Resources. http://www.ipm.ucdavis.edu/PMG/rl 11330061 l.htm. 02/10/2008.
Baco D. and Tandiabang J. 1998. Hama utama jagung danpengendaliannya. Dalam Sub M. Syam, dan A. Wijono(eds). Jagung. P. 185-204. Badan Penelitian danPengembangan Pertanian.
Table 2. Average egg mass of O. furnacalis parasited by T.evanescens in three subdistricts of Donggala,Central Sulawesi, Indonesia.
LocationNo. Parasited egg
Subdistrict Village mass (%)
1 Biromaru Jono Oge 96.002 Sidondo 89.803 Palolo Bahagia 59.734 Petimbe -5 Bobo 77.236 Labuan Labuan Toposo 75.007 Labuan Panimba 81.95
412
������� �� �� ����� ������� ����� ���������������
Dinas Pertanian, Perkebunan dan Peternakan Provinsi SulawesiTengah. 2004. Statistik Peternakan Sulawesi Tengah.
Dinas Pertanian, Perkebunan dan Peternakan Provinsi SulawesiTengah. 2005. Statistik Peternakan Sulawesi Tengah.
Baco D. 2000. Potensi agen hayati untuk pengendalian penggerekjagung, Ostrinia furnacalis Guenee. Seminar jati diri.Balitjas. 23 Agustus 2000. 12 hal.
Berger J. 1962. Maize production and the manuring of maize.Series no. 5. Geneva, Switzerland: Centre d�8�������l�95������$��
Gonzales P.G., Javier P.A. and Rejesus B.M. 1995. Dispersalof Euborellia annulata (Fabricius) (Dermaptera:Anisolabidae) in corn fields. Philipp. Ent. 9(6):587-604.
Gonzales P.G. and Cadapan E.P. 2001. Trichogramma parasitoid.Los Ba������ �� �����4�� ������������� ���������University of the Philippines Los Ba�������
Iqbal, Kardinan A. and Harnoto. 1993. Pengendalian lalat Bibitpada Jagung. Prosiding Simposium Penelitian tanamanPangan III Puslitbangtan. Pp 1113-1118.
Javier P.A., Dayoen-Abellon C. and Rejesus B.M. 1993. Studieson the life history of earwigs predatory to the Asian cornborer O. furnacalis (Guenee). Philippines Journal of Science122(4):357-376.
Javier P.A., Gonzales P.G. and Rosales A.M. 2001. Precedureof monitoring Asian corn borer egg masses and damage.Los Ba������ �� �����4�� ������������� ���������University of the Philippines Los Ba�������
Kardinan A., Harnoto, Setiyadi P. and Setiyono R.T. 1993.Ketahanan beberapa galir dan varietas jagung terhadap hamalalat bibit Atherigona spp. Risalah Hasil PenelitianTanaman Pangan. 3:41-46. Balittan Bogor.
Nafus D.M. and Schreiner I.H. 1987. Location of Ostriniafurnacalis Guenee. eggs and larvae on wet corn in relationto plant growth. Journal of Econ. Entomol. 84(2):411-416.
Nonci N., Tandiabang J., Masmawati and Muis A. 1996.Kehilangan hasil oleh penggerek jagung O. furnacalispada berbagai stadia tanaman jagung. Hasil penelitianHama/Penyakit. 1995/1996. BAlitjas Maros. Hal:27-33.
Nonci N., Tandiabang J., Masmawati and Muis A. 2000.Inventarisasi Musuh Alami Penggerek Batang Jagung (O.furnacalis) di Sentra Produksi Sulawesi Selatan. PeneltianPertanian. Pusat Penelitian Tanaman Pangan. Hal: 38-49.
Nonci N., Pabbage M.S. and Baco D. 2001. KeefektifanTrichogramma evanescens dalam mengendalikanpenggerek batang jagung O. furnacalis. Laporan tahunanPenelitian Hama dan Penyakit, Balitjas, 2000.
Nonci N. 2005. Biology and intrinsic growth rate of earwig(Euborellia annulata F). Indonesian Journal of AgriculturalScience 6(2): 2005.
de Oliveira C.M., Lopes J.R.S., Camargo L.E.A., FungaroM.H.P. and Nault L.R. 2007. Genetic diversity inpopulations of Dalbulus maidis (Delong and Wolcott)(Hemiptera: Cicadellidae) from distant localities in Brazilassessed by RADP-PCR markers. EnviromentalEntomology 36(1):204-212.
Ortega A.C. 1986. Insect pests of maize: a guide for fieldidentification. Mexico, D.F.: CIMMYT. 106pp
Pabbage M.S., Nonci N. and Baco D. 1999. EfektivitasTrichogramma evanescens pada berbagai umur telurpenggerek batang jagung O. furnacalis. Laporan TahunanPenelitian hama dan Penyakit. Balitjas, 2000.
Pabbage M.S., Nonci N. and Baco D. 2001. KeefektivitasTrichogrammaoidea bachtera fumata dalam mengendalikanpenggerek tongkol jagung (Helicoverpa armigera) di lapang.Laporan Tahunan Penelitian Hama dan Penyakit., Balitjas,2002.
Pitree H.N. 1970. Observations on the life cycle of Dalbulusmaidis on three plant species. JSTOR: FloridaEntomological Society 53(1):33-37.
Rejesus B.M. and Javier P.A. 1985. Detasseling technique forthe control of corn borer (O. furnacalis). Philipp. Ent.6(3):287-306.
Situmorang J. and Gabril B.P. 1988. Biology of two species ofpredatory earwigs Nala lividipis (Dufour) (Dermaptera:Labiduridea) and Euborellia annulata (Fabricius)(Dermaptera: Carconophoridae). Philipp. Ent. 7(3) 215-238.
Supriyatin. 1993. Pengendalian hama Tanaman Palawija secarabiologis. Simposium Tanaman Pangan III. Jakarta/Bogor.23-25 Agustus 1993. 10pp.
Teetes G.L., Seshu Reddy K.V., Leushner K. and House L.R.1983. Sorgum insect identification handbook. 121pp.
Tseng C.T. 1008. Use of Trichogramma ostriniae(Hymenoptera: Trichogrammatidae) to control the Asiancorn borer O. furnacalis (Lepidoptera: Pyralidae): pages340-356 in proceedings of the Seventh Asian RegionalMaize Workshop, Los Ba������ �� �����:�����-�7�1998.
van der Laan P.A. 1981. Pests of crops in Indonesia. Jakarta,Indonesia: Ichtiar Baru Van Hoeve. 701pp.
Yasin M., Masmawati, Talanca A.H., Masud S. and Baco D.2000. Pengendalian ulat grayak pada tanaman jagungmenggunakan metarrhizium anisopliae dan carbofuran dilanrang, Sidrap. Sulawesi Selatan. Laporan TahunanPenelitian Hama dan Penyakit. Balitjas 2001.
413
����� � ���� ����������� �������
IntroductionSouthern corn rust, caused by Puccinia polysora
Underw., has enormous destructive potential onsusceptible maize hosts. P. polysora generally infects maizeleaves at the preflowering stage. It then forms numerouspustules as the plant develops. The disease becomessevere and the leaf and sheath tissues are killed, resultingin the plant becoming prematurely desiccated. Severeinfection of southern corn rust occurrs in the late rainyseason in warm and high humidity conditions. In Thailand,southern corn rust generally has been regarded as a majorpathogen of maize. The first recorded rust epidemic inThailand was in 1956 but the destruction was not severe.In 1984, it was reported that maize-growing areas in NakhonRatchasema province suffered severe losses because ofcorn rust on sweet corn susceptible hybrids, especiallyinbred lines (Pupiphat 1986). Raid et al. (1998) andRodriguez-Ardon et al. (1980) reported that southern rustcaused yield losses of approximately 39-45% onsusceptible maize hybrids.
Ullstrup (1965) identified a single dominant gene, Rpp9,from a SouthAfrican introduction (PT 186208) that conferredresistance to P. polysora race PP9, isolated in Indiana. Futrellet al. (1975) identified another source of single-generesistance to race PP9, but the relationship of this gene toRpp9 was not investigated.
Scott et al. (1984) studied the inheritance of resistancefound in lines from four populations. He reported that oneor two gene models with varying degrees of dominancewere used to explain the resistance. Zummo (1998) reporteda variation of disease symptoms, ie, pustule incidence,tumescence and sporulation among maize genotypesexhibiting components of partial resistance. The objectiveof this study was to determine the inheritance of resistanceto southern corn rust in Thailand using generation meansanalysis.
Materials and Methods
Population development
Inbred line Nei 9202 from the Department ofAgriculture (DOA), Tzi 15 from IIGA and Kei 0306 fromKasetsart University (KU) were used as the resistantparents (P1) and inbred lines Nei 9008 and Nei 432001 fromDOA and Ki 11 from KU as the susceptible parents (P2).Nine crosses were made: Nei 9202 ��4� �)��;��4� �)�����Nei432001,Nei9202��< �����#5 ��$���4� �)��;��#5 ��$���4� 432001, Tzi 15��< �����<� ����*���4� �)��;��<� ����*���4� 432001 and Kei 0306 ��< �����#���:1 fromthese nine crosseswere self-pollinated and also backcrossed to both parentsto obtain the F2, BC1 and BC2 generations. Six generationsof each cross with resistance control NSX022031, Suwan
Inheritance of Resistance to Southern Corn Rust in Maize
Suriphat Thaitad1, Wasana Wongyai2, Pichet Grudloyma1, Sansern Jampatong3 and Narong Singhaburaudom4
1. Nakhon Sawan Field Crops Research Center, Tak-Fa, Nakhon Sawan 60190, Thailand2. Department of Agronomy, Faculty of Agriculture, Kasetsart University, Bangkok 10900, Thailand3. National Corn and Sorghum Research Center, IICRD, Kasetsart University, Pak Chong, Nakhon Ratchasima 30320, Thailand4. Department of Plant Pathology, Faculty of Agriculture, Kasetsart University, Bangkok 10900
Abstract. The inheritance of resistance to southern corn rust in maize caused by Puccinia polysora Underw. wasstudied in nine crosses of three resistant inbreds and three susceptible inbreds. The resistant inbreds were Nei9202, Tzi 15 and Kei 0306. The susceptible inbreds were Nei 9008, Nei 432001 and Ki 11. Generation mean analysiswas employed to study the gene action of rust resistance. Six generations of each cross including the female parent(P1), the male parent (P2), F1, F2 and backcross progenies to both parents (BC1 and BC2) were grown in August 2004at the National Corn and Sorghum Research Center, Pakchong district in Nakhon Ratchasima province of Thailand.Occurrences of rust on leaves at 80 days after planting were investigated under natural inoculums. The resultsrevealed that additive gene action for rust resistance was dominant in most of the crosses. However, the epistaticeffect was found in some crosses. Resistance to southern corn rust was controlled by dominant genes. The typeof gene effect involved complete, partial and absence of dominance depending on the level of resistance of theparents. Kei 0306, the resistant inbred, gave higher levels of resistance to southern corn rust in F1, F2, BC1 and BC2generations. Thus, this inbred would have potential for breeding resistance to southern corn rust in maize.
Key words: Maize, southern corn rust, inheritance
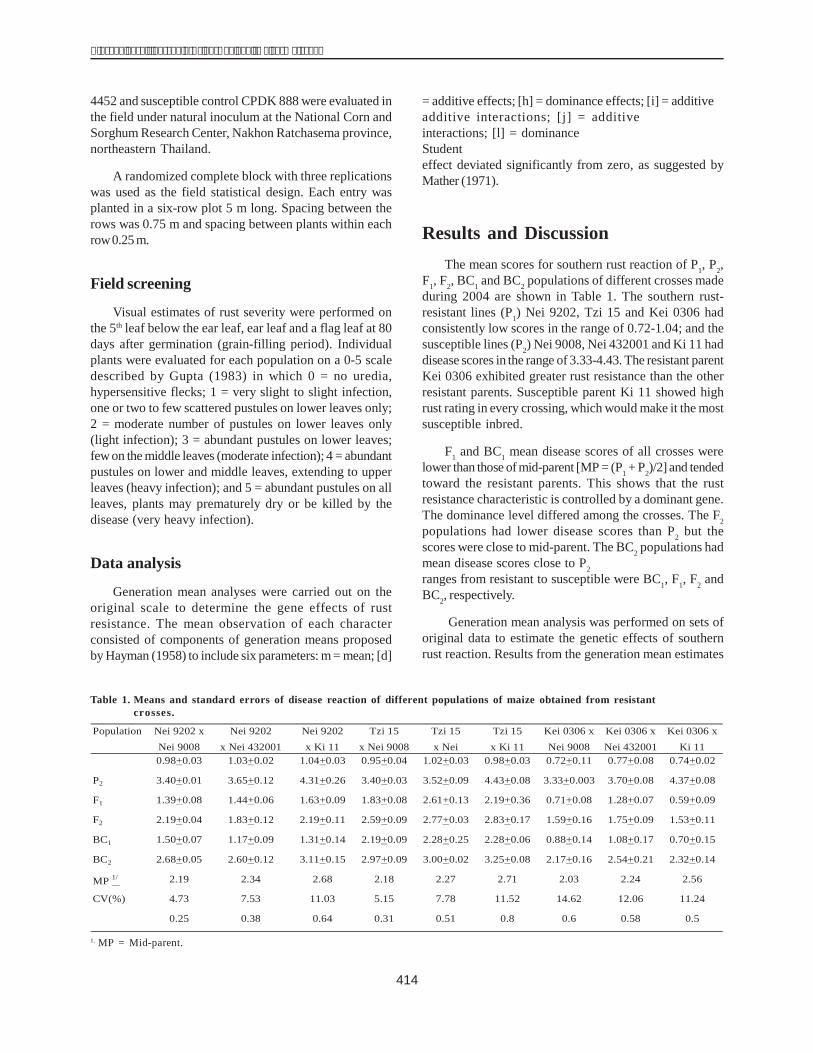
414
������� �� �� ����� ������� ����� ���������������
4452 and susceptible control CPDK 888 were evaluated inthe field under natural inoculum at the National Corn andSorghum Research Center, Nakhon Ratchasema province,northeastern Thailand.
A randomized complete block with three replicationswas used as the field statistical design. Each entry wasplanted in a six-row plot 5 m long. Spacing between therows was 0.75 m and spacing between plants within eachrow0.25 m.
Field screening
Visual estimates of rust severity were performed onthe 5th leaf below the ear leaf, ear leaf and a flag leaf at 80days after germination (grain-filling period). Individualplants were evaluated for each population on a 0-5 scaledescribed by Gupta (1983) in which 0 = no uredia,hypersensitive flecks; 1 = very slight to slight infection,one or two to few scattered pustules on lower leaves only;2 = moderate number of pustules on lower leaves only(light infection); 3 = abundant pustules on lower leaves;few on the middle leaves (moderate infection); 4 = abundantpustules on lower and middle leaves, extending to upperleaves (heavy infection); and 5 = abundant pustules on allleaves, plants may prematurely dry or be killed by thedisease (very heavy infection).
Data analysis
Generation mean analyses were carried out on theoriginal scale to determine the gene effects of rustresistance. The mean observation of each characterconsisted of components of generation means proposedby Hayman (1958) to include six parameters: m = mean; [d]
= additive effects; [h] = dominance effects; [i] = additive �additive interactions; [j] = additive �� � �����interactions; [l] = dominance ��� ������ ������� ���Student����-�����!���� �"����������!������������,���effect deviated significantly from zero, as suggested byMather (1971).
Results and DiscussionThe mean scores for southern rust reaction of P1, P2,
F1, F2, BC1 and BC2 populations of different crosses madeduring 2004 are shown in Table 1. The southern rust-resistant lines (P1) Nei 9202, Tzi 15 and Kei 0306 hadconsistently low scores in the range of 0.72-1.04; and thesusceptible lines (P2) Nei 9008, Nei 432001 and Ki 11 haddisease scores in the range of 3.33-4.43. The resistant parentKei 0306 exhibited greater rust resistance than the otherresistant parents. Susceptible parent Ki 11 showed highrust rating in every crossing, which would make it the mostsusceptible inbred.
F1 and BC1 mean disease scores of all crosses werelower than those of mid-parent [MP = (P1 + P2)/2] and tendedtoward the resistant parents. This shows that the rustresistance characteristic is controlled by a dominant gene.The dominance level differed among the crosses. The F2populations had lower disease scores than P2 but thescores were close to mid-parent. The BC2 populations hadmean disease scores close to P2����������#���,������ �ranges from resistant to susceptible were BC1, F1, F2 andBC2, respectively.
Generation mean analysis was performed on sets oforiginal data to estimate the genetic effects of southernrust reaction. Results from the generation mean estimates
Table 1. Means and standard errors of disease reaction of different populations of maize obtained from resistant �� ����������crosses.
Nei 9202 x Nei 9202 Nei 9202 Tzi 15 Tzi 15 Tzi 15 Kei 0306 x Kei 0306 x Kei 0306 xNei 9008 x Nei 432001 x Ki 11 x Nei 9008 x Nei x Ki 11 Nei 9008 Nei 432001 Ki 110.98+0.03 1.03+0.02 1.04+0.03 0.95+0.04 1.02+0.03 0.98+0.03 0.72+0.11 0.77+0.08 0.74+0.02
P2 3.40+0.01 3.65+0.12 4.31+0.26 3.40+0.03 3.52+0.09 4.43+0.08 3.33+0.003 3.70+0.08 4.37+0.08
F1 1.39+0.08 1.44+0.06 1.63+0.09 1.83+0.08 2.61+0.13 2.19+0.36 0.71+0.08 1.28+0.07 0.59+0.09
F2 2.19+0.04 1.83+0.12 2.19+0.11 2.59+0.09 2.77+0.03 2.83+0.17 1.59+0.16 1.75+0.09 1.53+0.11
BC1 1.50+0.07 1.17+0.09 1.31+0.14 2.19+0.09 2.28+0.25 2.28+0.06 0.88+0.14 1.08+0.17 0.70+0.15
BC2 2.68+0.05 2.60+0.12 3.11+0.15 2.97+0.09 3.00+0.02 3.25+0.08 2.17+0.16 2.54+0.21 2.32+0.14
MP 1/ 2.19 2.34 2.68 2.18 2.27 2.71 2.03 2.24 2.56
CV(%) 4.73 7.53 11.03 5.15 7.78 11.52 14.62 12.06 11.24
0.25 0.38 0.64 0.31 0.51 0.8 0.6 0.58 0.5
Population
1. MP = Mid-parent.
415
����� � ���� ����������� �������
for southern rust resistance are presented in Table 2. Therewere significant differences among their generations ofeach cross. The results indicated highly significant additive(d) gene effect for southern rust resistance in all crosses.Interaction of the gene was not found in Nei 9202 and Kei0306 donor parents, while additive ��� �����,����������(j) was responsible in generation involving Tzi 15 donorparent such as Tzi 15 ��4� �)��;�&��;)6���***), Tzi 15 ��4� 432001 (1.066��$�*) and Tzi 15 ��< ����&��$�6����*).
ConclusionsRust resistance was inherited through additive gene
action playing a role in increasing rust resistance. However,the epistatic effect was found in some crosses. Resistanceto southern corn rust was controlled by a dominant gene.The type of gene effect involved complete, partial and nodominance depending on the level of resistance of theparents. Kei 0306, the resistant inbred, gave the highestlevels of resistance to southern corn rust in F1, F2, BC1 andBC2 generations. Thus, this inbred would have potentialfor breeding resistance to southern corn rust in maize.
ReferencesFutrell M.C., Hooker A.L. and Scott G.E. 1975. Resistance in
maize to corn rust controlled by a single dominant gene.Crop Science 15:597-599.
Gupta U. 1983. Techniques of scoring for resistance diseases ofmaize. New Delhi, India: All-India Coordinated MaizeImprovement Project, Indian Agriculture ResearchInstitute.
Hayman B.I. 1958. The separation of epistatic from additiveand dominance variation in generation means. Hered.12:371-390.
Mather K. and Jinks J.L. 1971. Biometrical genetics. Ithaca,New York, USA: Cornell University Press.
Pupiphat U. 1986. Corn and sorghum diseases in Thailand.Bangkok, Thailand: Department of Agriculture.
Raid R.N., Pennypacker S.P. and Stevenson R.E. 1988.Characterization of Puccinia polysora epidemic inPennsylvania and Maryland. Phytopathology 78:579-585.
Rodriguez-Ardon R., Scott G.E. and King B.S. 1980. Maizeyield losses caused by southern corn rust. Crop Science20:812-814.
Scott G.E., King S.B. and Armour J.W. 1984. Inheritance ofresistance to southern corn rust in maize populations.Crop Science 24:265-267.
Ullstrup A.J. 1965. Inheritance and linkage of a gene determiningresistance in maize to an American race of Pucciniapolysora. Phytopathology 55:425-428.
Zummo N. 1988. Components contributing to partial resistancein maize to Puccinia polysora. Plant Dis. 72:157-160.
Table 2. Estimates1 of gene effects and standard errors for resistance to southern rust in nine crosses.
Crosses m d h i j lNei 9202 x Nei 9008 2.59+0.24** -1.21+0.01** 0.22 -0.16 0.06+0.17 -0.39Nei 9202 x Nei 432001 2.12+0.56** -1.31+0.06** 0.82 0.22+0.56 0.06 0.56Nei 9202 x Ki 11 2.60+0.61** -1.64+0.13** 0.9 0.08+0.60 0.16 0.67Tzi 15 x Nei 9008 2.22+0.44** -1.23+0.03** 1.89+1.04 0.4 0.89+0.26** -2.27+0.64*Tzi 15 x Nei 432001 2.79+0.51** -1.25+0.05** 0.10+1.52 -0.01 1.06+0.50* 0.76Tzi 15 x Ki 11 2.97+0.72** -1.73+0.04** 0.24+1.55 0.46 1.51+0.21* 0.06Kei 0306 x Nei 9008 2.29+0.77** -1.31+0.05** 0.61 0.51 0.03+0.44 0.71Kei 0306 x Nei 432001 2.00+0.67** -1.47+0.06** 1.56 0.24+0.67 0.01+0.56 0.73
Kei 0306 x Ki 11 2.64+0.59** -1.82+0.04** -0.88 0.51 0.39+0.41 0.33+0.94
1. * and ** indicate significance at 0.05 and 0.01 probability levels, respectively.
416
������� �� �� ����� ������� ����� ���������������
IntroductionTurcicum leaf blight (TLB) is a major foliar disease
throughout the world causing significant losses (Adipalaet al. 1993) where high humidity, low temperature andcloudy weather conditions prevail. The disease is causedby Exserohilum turcicum (Pass.) Leonard and Suggs. InIndia the disease is prevalent in the Himalayan region duringthe rainy season, in peninsular India during both rainyand postrainy seasons and in the plains of eastern India,particularly Bihar, during the postrainy season. Some majormaize-growing regions in the states of Bihar, Karnataka,Maharashtra and Andhra Pradesh have been noted asendemic areas for the disease, which reduced grain yieldsdrastically (Kachapur and Hegde 1988; Harlapur et al. 2000).
At the hot-spot location chosen for this study, allpredisposing conditions for disease appearance anddevelopment prevail and make it difficult to manage thedisease during the cropping season. Maize is the secondmost important cereal crop after rice in Meghalaya state ofIndia and disease management is purely dependant uponresistant sources. Nonavailability of easy and effectivetechniques makes it difficult for plant breeders to locate
resistant sources from the pool of populations/genotypes.Among the existing techniques of inoculation, thehypodermic method is better but it is tedious and causesinjury to plants, thereby attracting secondary infection bymold and bacteria. Hence, the present study was conductedwith the objective of finding a better technique forinoculation under field conditions.
Materials and Method
Selection of genotypes
CM 202 was selected for a comparative study of thethree existing methods, ie, hypodermic, suspension andwhole infected leaf powder (WILP) with the treatment ofactual lesion powder (ALP). The best result of thecomparison study was refined at the hot-spot location(Barapani, Meghalaya, India; 1000 m msl) with threegenotypes, CM 202 (established susceptible control) RCM1-2 (local susceptible control) and CM 104 (establishedresistant control). These three genotypes were used forsingle as well as repeat inoculation.
A Simple and High Throughput Technique for FieldInoculation of Exserohilum turcicum in Maize
Ram Dutta1*, Satish Chandra1, S.V. Ngachan1, P.H. Zaidi2, Sangam Lal3
1. ICAR Research Complex for NEH Region, Umiam 793 103, Meghalaya, India2. Global Maize Program, CIMMYT International and Asian Regional Maize Program, ICRISAT Campus,
Patancheru 502 324, Hyderabad, India3. Directorate of Maize Research, Indian Agricultural Research Institute, New Delhi 110 012, India*E-mail: [email protected]; [email protected]
Abstract. Turcicum leaf blight (TLB) is a major disease that causes losses up to 98% in cool and humid conditions.Disease management depends upon resistant sources. However, nonavailability of a foolproof technique makes itdifficult to locate resistant sources. Among the existing techniques, the hypodermic method is better but tedious, andcauses injury to plants. To find a better alternative technique for inducing field infection, a modified treatment ofactual lesion powder was compared with existing methods in glasshouse conditions with a susceptible control (CM202). The treatment was tested in the field for refinement at a hot-spot location (Barapani, Meghalaya, India; 1000 mmsl). Infected leaves were collected from a TLB-affected maize field and actual lesion area was collected. Thecollected portions of leaves were dried in the shade and pulverized. Two pinches of powder were applied in thecentral whorl at four growth stages from 2-3 to 5-6 leaf. Both single and repeated applications were tried with twosusceptible controls, RCM 1-2 (local) and CM 202 and a resistant control, CM 104. Powder applied at various stagesof growth had a significant difference. However, repeat application of powder had no significant difference fromsingle application. Final disease data were recorded on an individual plant basis at the silk drying stage. Powderapplied at the 3-4 leaf stage was found effective in inducing field infection abundantly, reaching the score of 5.0 (ona 1-5 rating scale). Hence, a single application of powder collected from the lesion area and applied to maize leafwhorls at the 3-4 leaf stage was found sufficient to induce a full field infection.
Keywords: Inoculation, technique, Exserohilum turcicum, maize
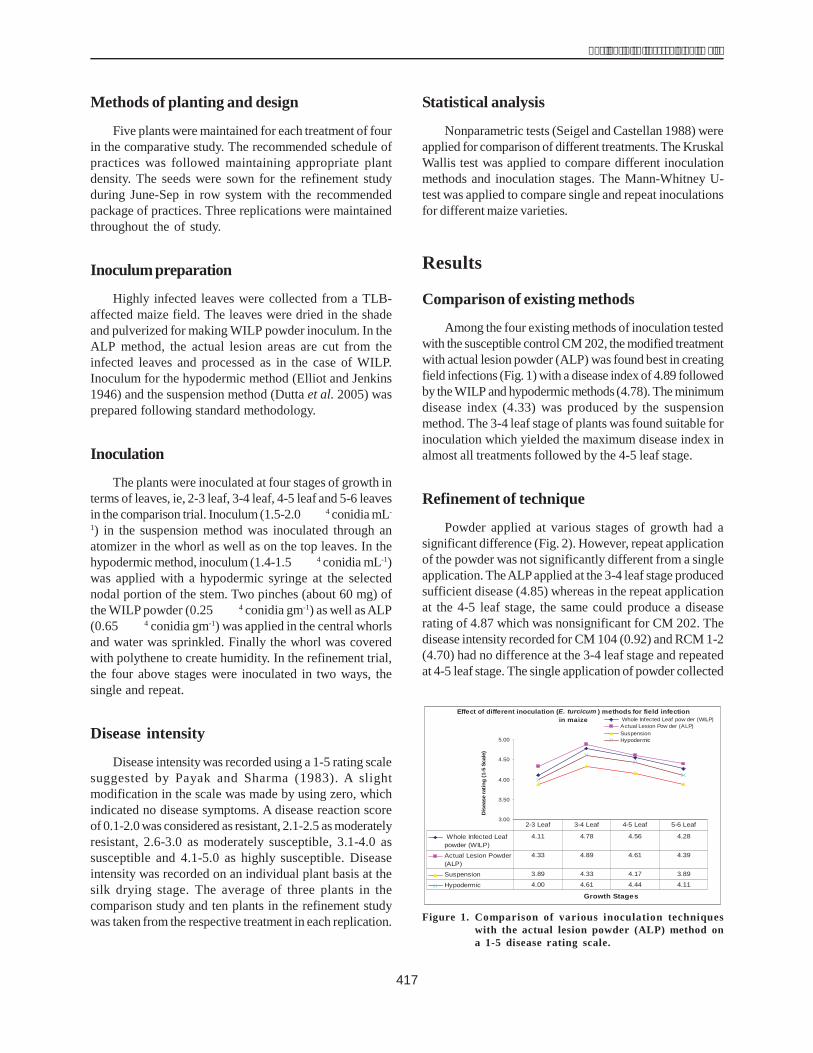
417
����� � ���� ����������� �������
Methods of planting and design
Five plants were maintained for each treatment of fourin the comparative study. The recommended schedule ofpractices was followed maintaining appropriate plantdensity. The seeds were sown for the refinement studyduring June-Sep in row system with the recommendedpackage of practices. Three replications were maintainedthroughout the of study.
Inoculum preparation
Highly infected leaves were collected from a TLB-affected maize field. The leaves were dried in the shadeand pulverized for making WILP powder inoculum. In theALP method, the actual lesion areas are cut from theinfected leaves and processed as in the case of WILP.Inoculum for the hypodermic method (Elliot and Jenkins1946) and the suspension method (Dutta et al. 2005) wasprepared following standard methodology.
Inoculation
The plants were inoculated at four stages of growth interms of leaves, ie, 2-3 leaf, 3-4 leaf, 4-5 leaf and 5-6 leavesin the comparison trial. Inoculum (1.5-2.0 ����4 conidia mL-
1) in the suspension method was inoculated through anatomizer in the whorl as well as on the top leaves. In thehypodermic method, inoculum (1.4-1.5 ����4 conidia mL-1)was applied with a hypodermic syringe at the selectednodal portion of the stem. Two pinches (about 60 mg) ofthe WILP powder (0.25 ����4 conidia gm-1) as well as ALP(0.65 ����4 conidia gm-1) was applied in the central whorlsand water was sprinkled. Finally the whorl was coveredwith polythene to create humidity. In the refinement trial,the four above stages were inoculated in two ways, thesingle and repeat.
Disease intensity
Disease intensity was recorded using a 1-5 rating scalesuggested by Payak and Sharma (1983). A slightmodification in the scale was made by using zero, whichindicated no disease symptoms. A disease reaction scoreof 0.1-2.0 was considered as resistant, 2.1-2.5 as moderatelyresistant, 2.6-3.0 as moderately susceptible, 3.1-4.0 assusceptible and 4.1-5.0 as highly susceptible. Diseaseintensity was recorded on an individual plant basis at thesilk drying stage. The average of three plants in thecomparison study and ten plants in the refinement studywas taken from the respective treatment in each replication.
Statistical analysis
Nonparametric tests (Seigel and Castellan 1988) wereapplied for comparison of different treatments. The KruskalWallis test was applied to compare different inoculationmethods and inoculation stages. The Mann-Whitney U-test was applied to compare single and repeat inoculationsfor different maize varieties.
Results
Comparison of existing methods
Among the four existing methods of inoculation testedwith the susceptible control CM 202, the modified treatmentwith actual lesion powder (ALP) was found best in creatingfield infections (Fig. 1) with a disease index of 4.89 followedby the WILP and hypodermic methods (4.78). The minimumdisease index (4.33) was produced by the suspensionmethod. The 3-4 leaf stage of plants was found suitable forinoculation which yielded the maximum disease index inalmost all treatments followed by the 4-5 leaf stage.
Refinement of technique
Powder applied at various stages of growth had asignificant difference (Fig. 2). However, repeat applicationof the powder was not significantly different from a singleapplication. TheALP applied at the 3-4 leaf stage producedsufficient disease (4.85) whereas in the repeat applicationat the 4-5 leaf stage, the same could produce a diseaserating of 4.87 which was nonsignificant for CM 202. Thedisease intensity recorded for CM 104 (0.92) and RCM 1-2(4.70) had no difference at the 3-4 leaf stage and repeatedat 4-5 leaf stage. The single application of powder collected
Effect of different inoculation (E. turcicum ) methods for field infectionin maize
3.00
3.50
4.00
4.50
5.00
Growth Stages
Dis
ease
ratin
g(1
-5Sc
ale)
Whole Infected Leaf pow der (WILP)Actual Lesion Pow der (ALP)SuspensionHypodermic
Whole Infected Leafpowder (WILP)
4.11 4.78 4.56 4.28
Actual Lesion Powder(ALP)
4.33 4.89 4.61 4.39
Suspension 3.89 4.33 4.17 3.89
Hypodermic 4.00 4.61 4.44 4.11
2-3 Leaf 3-4 Leaf 4-5 Leaf 5-6 Leaf
Figure 1. Comparison of various inoculation techniqueswith the actual lesion powder (ALP) method ona 1-5 disease rating scale.
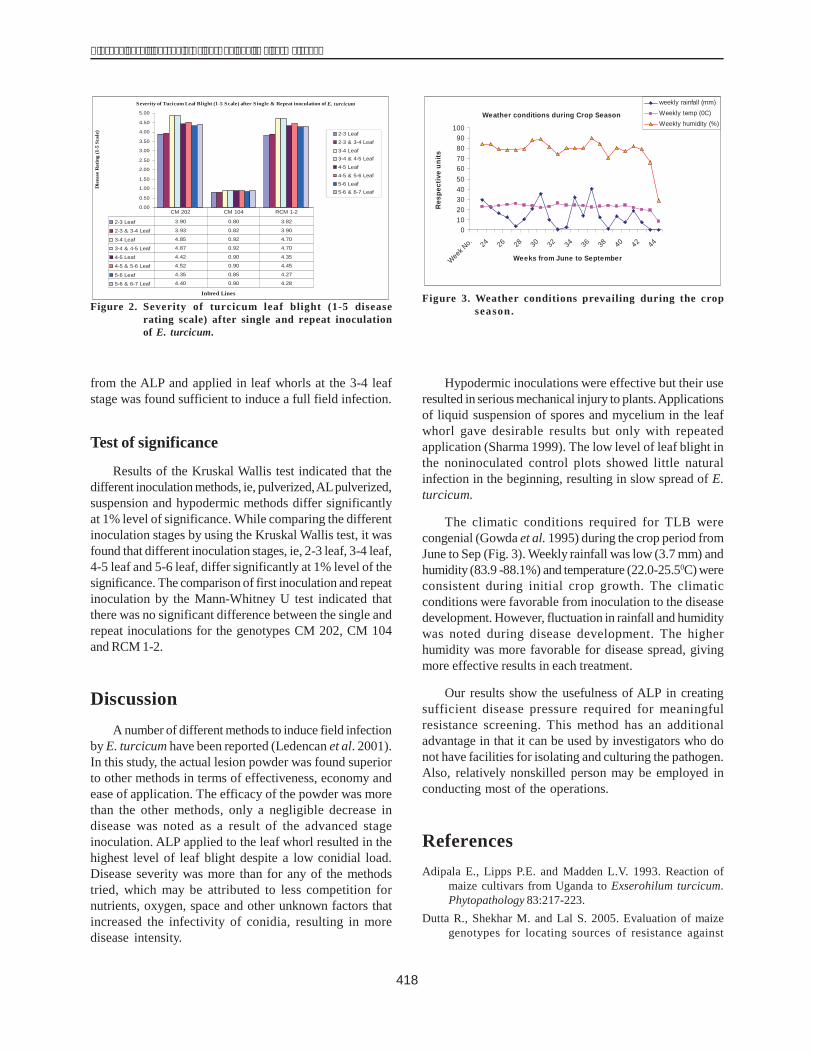
418
������� �� �� ����� ������� ����� ���������������
from the ALP and applied in leaf whorls at the 3-4 leafstage was found sufficient to induce a full field infection.
Test of significance
Results of the Kruskal Wallis test indicated that thedifferent inoculation methods, ie, pulverized,ALpulverized,suspension and hypodermic methods differ significantlyat 1% level of significance. While comparing the differentinoculation stages by using the Kruskal Wallis test, it wasfound that different inoculation stages, ie, 2-3 leaf, 3-4 leaf,4-5 leaf and 5-6 leaf, differ significantly at 1% level of thesignificance. The comparison of first inoculation and repeatinoculation by the Mann-Whitney U test indicated thatthere was no significant difference between the single andrepeat inoculations for the genotypes CM 202, CM 104and RCM 1-2.
DiscussionA number of different methods to induce field infection
by E. turcicum have been reported (Ledencan et al. 2001).In this study, the actual lesion powder was found superiorto other methods in terms of effectiveness, economy andease of application. The efficacy of the powder was morethan the other methods, only a negligible decrease indisease was noted as a result of the advanced stageinoculation. ALP applied to the leaf whorl resulted in thehighest level of leaf blight despite a low conidial load.Disease severity was more than for any of the methodstried, which may be attributed to less competition fornutrients, oxygen, space and other unknown factors thatincreased the infectivity of conidia, resulting in moredisease intensity.
Hypodermic inoculations were effective but their useresulted in serious mechanical injury to plants.Applicationsof liquid suspension of spores and mycelium in the leafwhorl gave desirable results but only with repeatedapplication (Sharma 1999). The low level of leaf blight inthe noninoculated control plots showed little naturalinfection in the beginning, resulting in slow spread of E.turcicum.
The climatic conditions required for TLB werecongenial (Gowda et al. 1995) during the crop period fromJune to Sep (Fig. 3). Weekly rainfall was low (3.7 mm) andhumidity (83.9 -88.1%) and temperature (22.0-25.50C) wereconsistent during initial crop growth. The climaticconditions were favorable from inoculation to the diseasedevelopment. However, fluctuation in rainfall and humiditywas noted during disease development. The higherhumidity was more favorable for disease spread, givingmore effective results in each treatment.
Our results show the usefulness of ALP in creatingsufficient disease pressure required for meaningfulresistance screening. This method has an additionaladvantage in that it can be used by investigators who donot have facilities for isolating and culturing the pathogen.Also, relatively nonskilled person may be employed inconducting most of the operations.
ReferencesAdipala E., Lipps P.E. and Madden L.V. 1993. Reaction of
maize cultivars from Uganda to Exserohilum turcicum.Phytopathology 83:217-223.
Dutta R., Shekhar M. and Lal S. 2005. Evaluation of maizegenotypes for locating sources of resistance against
Severity of Tucicum Leaf Blight (1-5 Scale) after Single & Repeat inoculation of E. turcicum
0.00
0.50
1.00
1.50
2.00
2.50
3.00
3.50
4.00
4.50
5.00
Inbred Lines
Dis
ease
Rat
ing
(1-5
Scal
e) 2-3 Leaf2-3 & 3-4 Leaf3-4 Leaf3-4 & 4-5 Leaf4-5 Leaf4-5 & 5-6 Leaf5-6 Leaf5-6 & 6-7 Leaf
2-3 Leaf 3.90 0.80 3.82
2-3 & 3-4 Leaf 3.93 0.82 3.90
3-4 Leaf 4.85 0.92 4.70
3-4 & 4-5 Leaf 4.87 0.92 4.70
4-5 Leaf 4.42 0.90 4.35
4-5 & 5-6 Leaf 4.52 0.90 4.45
5-6 Leaf 4.35 0.85 4.27
5-6 & 6-7 Leaf 4.40 0.90 4.28
CM 202 CM 104 RCM 1-2
Weather conditions during Crop Season
0102030405060708090
100
Week No. 24 26 28 30 32 34 36 38 40 42 44
Weeks from June to September
Res
pect
ive
un
its
weekly rainfall (mm)Weekly temp (0C)Weekly humidity (%)
Figure 3. Weather conditions prevailing during the cropseason.Figure 2. Severity of turcicum leaf blight (1-5 disease
rating scale) after single and repeat inoculationof E. turcicum.
419
����� � ���� ����������� �������
turcicum leaf blight of maize in India. Indian Phytopathlogy58(1): 67-70.
Elliott C. and Jenkin M.T. 1946. Helminthosporium turcicumblight of corn. Phytopathology 36:660-666.
Gowda K.T.P., Shetty H.S., Gowda B.J. and Lal S. 1995.Incidence of leaf blight [Exserohilum turcicum (Pass.)Leonard and Suggs] of maize in relation to meteorologicalfactors. Mysore Journal of Agricultural Sciences 29(1):31-35.
Harlapur S.I., Wali M.C., Anahosur K.H. and Muralikrishna S.2000.Areport on survey and surveillance of maize diseasesin northern Karnataka. Karnataka Journal of AgriculturalSciences 13:750-751.
Kachapur M.R. and Hegde R.K. 1988. Studies on turcicumblight of maize (Zea mays L.) caused by Exserohilumturcicum (Pass.) Leonard & Suggs with special referenceto crop loss assessment. Plant Pathology Newsletter 6(1-2):33-35.
Ledencan T., Jurkovic D., Simic D. and Palaversic B. 2001.Comparison between two methods of maize leaf infectionwith Exserohilum turcicum. Cereal-ResearchCommunications 29(3/4):429-433.
Payak M.M. and Sharma R.C. 1983. Disease rating scales inmaize in India. Pages 1-4 in Techniques of scoring forresistance to important diseases of maize. New Delhi,India: All India Coordinated Maize Improvement Project,Indian Agricultural Research Institute.
Seigel S. and Castellan (Jr.) and John N. 1988. Nonparametricstatistics for the behavioral sciences. New York, USA:McGraw-Hill Book Company.
Sharma R.C. 1999. Maydis leaf blight of maize. Pages 45-50 inTraining manual on maize protection technology. NewDelhi, India: Directorate of Maize Research.
420
������� �� �� ����� ������� ����� ���������������
IntroductionOne of the causes of damage to and weight loss of
food material, especially grain, during storage is storagepests such as Sitophilus zeamais (Motschulsky). The maizeweevil (S. zeamais) is a beetle belonging to theCurculionidae family. It has a characteristic snout or rostrumprojecting from the front of the head. The S. zeamais pestis about 2.5-4 mm long and is identified by its distinctiveyellow to orange colouration on the wing covers.According to Kartasapoetra (1987), the form of the S.zeamais imago�������� ���,�! �����������#���! �,�����expand finely, so that they are capable of flight.
The egg, larval and pupal stages of the weevil occurin the kernels and are rarely seen. Feeding is done withinthe grain kernel, and adults bore exit holes to emerge.Females drill a tiny hole in the grain kernel, deposit an eggin the cavity and then plug the hole with a gelatinoussecretion. The egg hatches into a young larva which borestoward the center of the kernel, feeds, grows and pupatesthere. New adults bore emergence holes from the inside,then leave to mate and begin a new generation. The adultsfake death by drawing their legs close to the body, fallingand remaining still when disturbed. The larvae only developat temperatures above 132�� &�����==�,������>��,� ��!��gov.au).
Sitophilus zeamais is a serious pest of stored grain.
They develop inside whole grain kernels as small, white,wrinkled, grub-like larvae. There generally are no externalsigns that the larvae have been feeding and growing insidethe seed until after about one month when the adult weevilschew through the seed coat and emerge. They arefrequently regarded as primary pests of grain since theyare able to infest otherwise nondamaged grain. Infestationscan result in reduction in weight and quality of grain as aresult of the larvae feeding on the endosperm. Both larvaeand adults feed on grain. Temperatures may be attainedwhich actually kill the insects. Weevil-damaged grain canbe readily recognized by the presence of large exit holes.
Weevil infestation may start in the field. Varieties withpoor husk-covering properties are vulnerable to initialinfestation (Giles and Ashman 1971). The main focus ofimprovement in maize breeding programs has traditionallybeen increased yield and field pest resistance. Sincevarieties are rarely assessed for resistance to stored-product pests, introduction of improved varieties has oftenbeen accompanied by increased susceptibility to stored-product pests (Kossou et al. 1993).
According to Pabbage et al. (1990), the percentage ofgrain weight loss after 6 months of storage can reach 80.3%when kept in a plastic bag.
The aim of this study was to evaluate the resistanceresponse of maize germplasm to infestation by S. zeamais.
Response of Maize Germplasm to Maize Weevil Sitophiluszeamais Motsch. (Coleoptera: Curculionidae)
Surtikanti,Azrai and M.S. PabbageIndonesian Cereal Research Institute, Indonesia
Abstract. The maize weevil, Sitophilus zeamais Motsch., is the most important insect pest of stored products in theworld including Indonesia. More than 50% grain damage has been reported for nontreated maize during storage onaccount of this pest. This study was conducted to evaluate the resistance response of maize germplasm to maizeweevil infestation. A total of 44 lines/varieties, obtained from a maize breeding project, were examined by the Pestand Disease Laboratory of the Indonesian Cereal Research Institute (ICERI) in Maros, Indonesia during May-Sep2007. Samples of each line/variety (25 g) were infested with 10 adults of 1-7 days old Sitophilus zeamais for 10days. Each experiment was arranged in a randomized complete block design with three replications. We recordedthe total number of adult maize weevils emerged, percentage of grain damage and weight loss at 90 days afterstorage. The result indicated that 9 lines/varieties were resistant to maize weevil with a percentage of damageranging from 1.51% to 9.84%. These lines were Bualemo, Holotaupi, Lagaligo, Trunen B, MLG-5216, ACROSS8365,VIH-2, GM-26 and CIMCALI97ACHAPIASA3.
Key words: Maize, maize weevil, germplasm
421
����� � ���� ����������� �������
Materials and MethodThis experiment was conducted at the Pest and
Disease Laboratory of ICERI during May-Sep 2007. Thegrain samples were first stored in a freezer at �*2C for 14days to remove (kill) any field infestations (live insects oreggs) by weevils or any other pests. A total of 44accessions of maize germplasm were tested using themethod described by Dobie (1974). Samples of 25 g eachwere stored in 150 mL plastic pots with screen ventilation.The samples were infested with 10 adults of S. zeamais (1-7 days old). After an oviposition period of 10 days, theweevils were removed. The samples were then leftundisturbed under the experimental conditions until F1adults started to emerge about 30 days later. The emergingadults were removed daily and counted until all the F1adults had emerged. The experiment was arranged in arandomized complete design with three replications.
When no more maize weevils emerged, the damagedand healthy grain were counted and their weight wasrecorded. The percentage of grain damage was calculatedas per the formula:
number of damaged grainPercentage of = ��������� ���������.�����grain damage total number of grain
The grain weight loss percentage was calculated bythe following formula according to Heines (1980):
(U ��4�+���&0���4�+Percentage of = ��������������������������grain weight loss U (Nd + Nu)
U = weight of healthy grainNd = number damaged grainD = weight of damaged grainNu = number of healthy grain
Results and DiscussionThe percentage of grain damaged (Table 1) by S.
zeamais in 44 maize accessions ranged from 1.51%(Bualemo) to 51.67% (Panyipatan). The number of S.zeamais emerged adults were 1-5 for five of the 44accessions, 7-14 for 15 accessions, 15-30 for 13 accessions,31-58 adults for 6 accessions and 60-104 adults for 5accessions.
There were 9 accessions with grain damage less than10%: Bualemo, Holotaupi (2.31%), Lagaligo (6%), TrunenB(6.05%), MLG-5216 (6.51%),Across 8365 (8.09%), Vih-2
(9.14%), GM-26 (9.53%)and Cimcali97Achapiasa3 (9.84%).Sixteen accessions had grain damage percentages in therange of e?��������?�����?�� ���� �,�����,����� ��?���to d?���� ����������� ������ ��?��������?>��� ��$accessions. There was one accession with damage morethan 50%. Dobie (1974) had reported that the susceptibilityof a variety depends upon the number of eggs laid and thesubsequent survival and growth of the larvae and pupae.
The percentage of grain weight loss due to S. zeamaisin the 44 accessions ranged from 0% (MLG-5216) to 6.20%(Panyipatan). Grain weight loss was 0-2% for 25 accessions,e?�-��������������� �����?�->������!������� �����?>-5% for three accessions and e?$-����!������� ���
According to Kim et al. (1988), the external coat ofstructured maize kernel material can represent the primaryfactor of resilience to situating of maize weevil eggs. Kernelsize is more important in determining resistance to S.zeamais with large kernels appearing to show greaterresistance than smaller ones (Gudrups et al. 2001). Theresistance of stored maize to pests has been attributed toa number of factors including kernel hardness (Dobie 1974;Serratos et al. 1987), kernel size and texture (Kossou et al.1993), phenolic content (Arnason et al. 1994). Accordingto Tipping et al. (1989), the resistance factors wereprincipally influenced by general combining ability andmaternal effects were not expressed in the F1 generation ofmaize weevil.
The kernel color (Table 1) does not affect kerneldamage, percentage of weight loss and number of S.zeamais emerged adults. Resistance to maize weevil isclassified by percentage of kernel damage, weight lossand the number of S. zeamais emerged adults. Resistantmaize accessions had kernel damage percentage less than5%, weight loss less than 1% and 1-3 S. zeamais emergedadults. Intermediate varieties had 6-d?$���(������� �,��less than 4% weight loss and e?�-�?$��� ��,���������Susceptible varieties had a percentage of kernel damageless than 50%, weight loss of more than 4% and more than50 emerged adults.
ConclusionsThe varieties Lagaligo and Holotaupi showed more
resistance to maize weevil than the other accessionsevaluated. The number of S. zeamais emerged adults wassmall for both varieties (3 for Lagaligo and 1 for Holotaupi)with low grain damage of 6% for Lagaligo and 2.31% forHolotaupi and a low percentage of grain weight loss of0.32% and 0.26%, respectively.

422
������� �� �� ����� ������� ����� ���������������
CIR/14/CIR and Panyipatan were the most susceptibleto S. zeamais, the number of maize weevils for each varietywas 66 and 77 adults respectively. Grain damage was 30.33%for CIR/14/CIR and 51.67% for Panyipatan, and percentageof grain weight loss was 5.87% and 6.20%, respectively.
ReferencesArnason J.T., Baum B., Gale J., Lambert J.D.H., Bergvinson
D., Philog@���A�B�C���!�������B�9���D � �B������B�!�D.C. 1994. Variation in resistance of Mexican landraces of
maize to maize weevil Sitophilus zeamais in relation totaxonomic and biochemical parameters. Euphytica 74:227-236.
Dobie P. 1974. Laboratory assessment of the inherentsusceptibility of maize varieties to harvest pest infestationby Sitophilus zeamais Motsch. (Coleoptera:Curculionidae). Journal of Stored Products Research10:183-187.
Giles P.H. and Ashman F. 1971. Astudy of preharvest infestationof maize to Sitophilus zeamais Motsch. (Coleoptera:Curculionidae) in the Kenya Highlands. Journal ofStored Product Research 7:69-83.
Table 1. Percentage of grain damage, grain weight loss and number of adult maize weevils (S. zeamais) after 90 days ofinfestation of 44 maize accessions, Maros, Indonesia, 2007.
No. Lines/varieties Color Sitophilus zeamais Damaged grain (%) Grain weight loss (%)
1 Bualemo White 1 1.51 4.132 Holotaupi Yellow 1 2.31 0.263 Lagaligo Yellow 3 6 0.324 SW-89A-121 White 4 12.41 0.975 MLG-5216 Brown 4 6.51 -16 Cimcali97ACHAPIASA3 Yellow 7 9.84 0.597 Palakka White 7 13.66 0.988 GM-26 Yellow 8 9.53 1.459 Trunen B Yellow 10 6.05 0.2910 Pakelo White 10 20.12 1.9611 L.Poso White 10 13.36 0.9212 P.Marisa Yellow 10 10.59 0.7713 MLG-5073 Brown 10 13.95 1.3914 Penjalinan White 10 13.09 0.4215 Srikandi Kuning-1 White 11 19.75 1.4316 MLG-5194 Yellow 11 12.59 1.0317 GM-27 White 11 14.96 1.9118 MR-14 White 12 16.77 1.3619 L.Palopo Yellow 14 22.98 2.8520 MLG-5215 White 14 13.93 2.7921 Dalo-dalo Brown 15 12.36 1.4522 S99TLWQ-AB Yellow 17 28.09 2.3423 Sinematiali Yellow 18 21.52 2.2224 Permadi Brown 19 21.45 2.6725 L.Blora White 19 12.36 1.4526 Milo Pulo Yellow 19 23.06 2.4227 Harapan Baru Yellow 20 15.27 1.7528 MLG-5226 Yellow 23 19.11 1.829 MLG-5064 White 24 23.25 2.930 MR-10 Yellow 24 23.14 4.5431 Kalipare White 27 23.38 2.3532 MLG-5200 Yellow 28 17.62 1.2733 Tempx Trop YDQ White 29 24.44 2.5534 Obatama=Across 8363 Yellow 31 36.34 1.0735 Across 8365 Yellow 33 8.09 1.2636 VIH-2 Violet 34 9.14 1.4237 Leinasi Kuning Yellow 42 35.29 2.9238 Jawa Kuning Yellow 56 20.69 3.0639 CIR-3-3-1 Yellow 58 23.61 2.5740 Hideradab Yellow 60 39.73 4.2241 CIR/14/CIR Yellow 66 30.33 5.8742 Leinasi Putih Yellow 72 35.72 2.8743 Panyipatan White 77 51.67 6.244 L.Kusa Mixture 104 27.38 3.08
423
����� � ���� ����������� �������
Gudrups I., Floyd S.F., Kling J.G., Nila A., Bosque-Perez N.A.and Orchard J.E. 2001. A comparison of two methods ofassessment of maize varietal resistance to maize weevil,Sitophilus zeamais Motschulsky, and the influence ofkernel hardness and size on susceptibility. Journal of StoredProducts Research 37:287-302.
Heines C.P. 1980. Loss assessment methods. Biotrop secondon pest stored products. May 19-June 28. Bogor,Indonesia. 7pp
Kartasapoetra A.G. 1987. Hama Hasil Tanaman Dalam Gudang.Penerbit Bina Aksara, Jakarta. 145 pp
Kim S.K., Brewbaker J.L. and Hallmet A.R. 1988. Insect anddisease resistance from tropical maize for use in temperatehybrids: pages 194-226 in proceedings of the 43rd AnnualCorn Sorghum Research Conference.
Kossou D.K., Mareck J.H. and Bosque-P@��5�4�9�� �))��Comparison of improved and local maize varieties in theRepublic of Benin with emphasis on susceptibility toSitophilus zeamais Motschulsky. Journal of StoredProducts Research 29:333-343.
Pabbage M.S., Saenong S. and Baco D. 1990. Pengaruh WadahPenyimpanan Benih Jagung dan Pirimifos Metil TerhadapPopulasi Sitophilus zeamais dan Viabilitas Benih.AGRIKAM, 5(2): 62 ��7��
Serratos J.A., Arnason J.T., Nozzolillo C., Lambert J.D.H.,Philog@���A�B�C���:������?���0�� ����<��������(�1��Atkinson J. and Morand P. 1987. Factors contributing toresistance of exotic maize populations to maize weevilSitophilus zeamais. Journal of Chemical Ecology 3:751-762.
Tipping P.W., Cornelius P.L., Legg D.E., Poneleit C.G. andRodriguez J.G. 1989. Inheritance of resistance in wholekernel maize to ovipositison by the maize weevil(Coleoptera: Curculionidae). J. Econ. Entomol. 82(5):1466-1469.
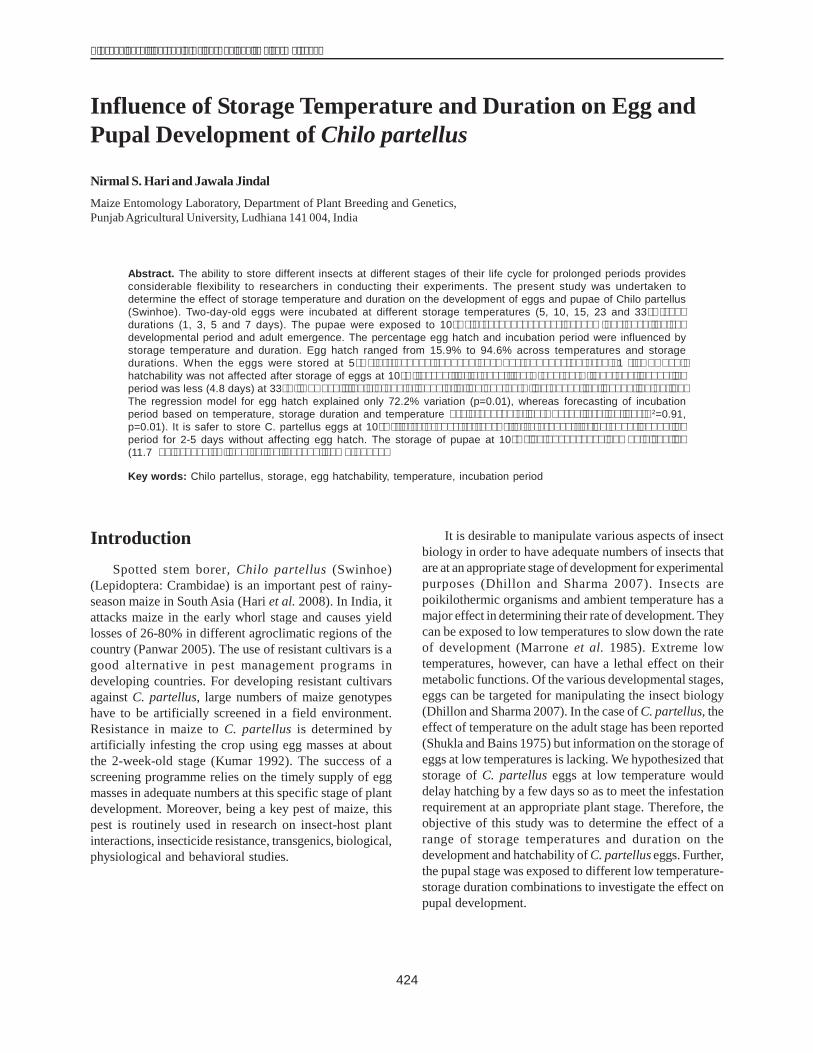
424
������� �� �� ����� ������� ����� ���������������
IntroductionSpotted stem borer, Chilo partellus (Swinhoe)
(Lepidoptera: Crambidae) is an important pest of rainy-season maize in South Asia (Hari et al. 2008). In India, itattacks maize in the early whorl stage and causes yieldlosses of 26-80% in different agroclimatic regions of thecountry (Panwar 2005). The use of resistant cultivars is agood alternative in pest management programs indeveloping countries. For developing resistant cultivarsagainst C. partellus, large numbers of maize genotypeshave to be artificially screened in a field environment.Resistance in maize to C. partellus is determined byartificially infesting the crop using egg masses at aboutthe 2-week-old stage (Kumar 1992). The success of ascreening programme relies on the timely supply of eggmasses in adequate numbers at this specific stage of plantdevelopment. Moreover, being a key pest of maize, thispest is routinely used in research on insect-host plantinteractions, insecticide resistance, transgenics, biological,physiological and behavioral studies.
It is desirable to manipulate various aspects of insectbiology in order to have adequate numbers of insects thatare at an appropriate stage of development for experimentalpurposes (Dhillon and Sharma 2007). Insects arepoikilothermic organisms and ambient temperature has amajor effect in determining their rate of development. Theycan be exposed to low temperatures to slow down the rateof development (Marrone et al. 1985). Extreme lowtemperatures, however, can have a lethal effect on theirmetabolic functions. Of the various developmental stages,eggs can be targeted for manipulating the insect biology(Dhillon and Sharma 2007). In the case of C. partellus, theeffect of temperature on the adult stage has been reported(Shukla and Bains 1975) but information on the storage ofeggs at low temperatures is lacking. We hypothesized thatstorage of C. partellus eggs at low temperature woulddelay hatching by a few days so as to meet the infestationrequirement at an appropriate plant stage. Therefore, theobjective of this study was to determine the effect of arange of storage temperatures and duration on thedevelopment and hatchability of C. partellus eggs. Further,the pupal stage was exposed to different low temperature-storage duration combinations to investigate the effect onpupal development.
Influence of Storage Temperature and Duration on Egg andPupal Development of Chilo partellus
Nirmal S. Hari and Jawala JindalMaize Entomology Laboratory, Department of Plant Breeding and Genetics,Punjab Agricultural University, Ludhiana 141 004, India
Abstract. The ability to store different insects at different stages of their life cycle for prolonged periods providesconsiderable flexibility to researchers in conducting their experiments. The present study was undertaken todetermine the effect of storage temperature and duration on the development of eggs and pupae of Chilo partellus(Swinhoe). Two-day-old eggs were incubated at different storage temperatures (5, 10, 15, 23 and 33'()� ���durations (1, 3, 5 and 7 days). The pupae were exposed to 10'(� ���� "� ���� *� ����� �� �+������ ��� ������ ��developmental period and adult emergence. The percentage egg hatch and incubation period were influenced bystorage temperature and duration. Egg hatch ranged from 15.9% to 94.6% across temperatures and storagedurations. When the eggs were stored at 5'(� ���� ,-� ����� ���� ����� ���� �������� .�*$/ 0*$01)$� 1���&��hatchability was not affected after storage of eggs at 10'(�.�+�� �����#�����)��*'(�����--'($�%����������������period was less (4.8 days) at 33'($�1���&�����������������������*���������*'(������������������������ �����$The regression model for egg hatch explained only 72.2% variation (p=0.01), whereas forecasting of incubationperiod based on temperature, storage duration and temperature ���������������������2����������&�� .�2=0.91,p=0.01). It is safer to store C. partellus eggs at 103(�.����- *�����)�����*3(�.����- #�����)� �� ��������� ���������period for 2-5 days without affecting egg hatch. The storage of pupae at 10'(� ���������� ��&��� ������ �����(11.7��*$*� ����)������� ��������� ����� ���������$
Key words: Chilo partellus, storage, egg hatchability, temperature, incubation period
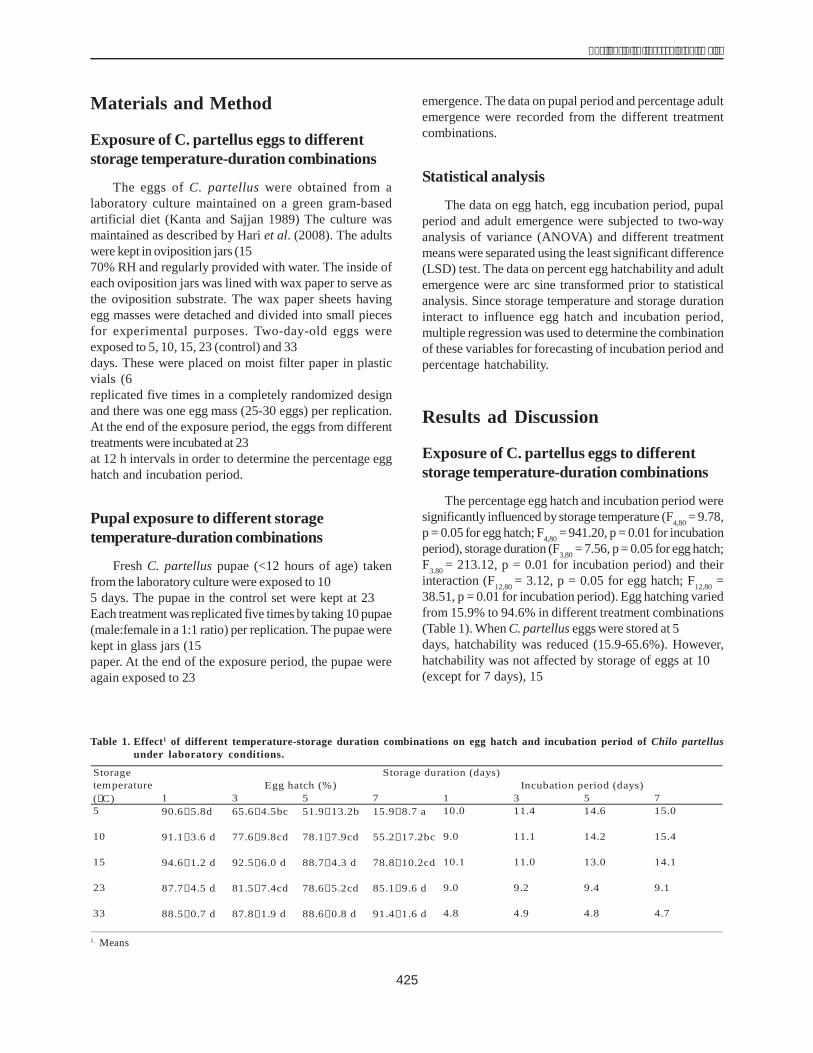
425
����� � ���� ����������� �������
Materials and Method
Exposure of C. partellus eggs to differentstorage temperature-duration combinations
The eggs of C. partellus were obtained from alaboratory culture maintained on a green gram-basedartificial diet (Kanta and Sajjan 1989) The culture wasmaintained as described by Hari et al. (2008). The adultswere kept in oviposition jars (15 ������ �� �+������6�2�����70% RH and regularly provided with water. The inside ofeach oviposition jars was lined with wax paper to serve asthe oviposition substrate. The wax paper sheets havingegg masses were detached and divided into small piecesfor experimental purposes. Two-day-old eggs wereexposed to 5, 10, 15, 23 (control) and 33E�����������$�����7days. These were placed on moist filter paper in plasticvials (6 ��>�� �� �+��8���� ����� ����� � ��� ��!��replicated five times in a completely randomized designand there was one egg mass (25-30 eggs) per replication.At the end of the exposure period, the eggs from differenttreatments were incubated at 232���#����,,��!�����.� ���at 12 h intervals in order to determine the percentage egghatch and incubation period.
Pupal exposure to different storagetemperature-duration combinations
Fresh C. partellus pupae (<12 hours of age) takenfrom the laboratory culture were exposed to 10E����������5 days. The pupae in the control set were kept at 232��Each treatment was replicated five times by taking 10 pupae(male:female in a 1:1 ratio) per replication. The pupae werekept in glass jars (15 ������ �� �+� ����! ��� ���� ���paper. At the end of the exposure period, the pupae wereagain exposed to 232���������������� "�������������
emergence. The data on pupal period and percentage adultemergence were recorded from the different treatmentcombinations.
Statistical analysis
The data on egg hatch, egg incubation period, pupalperiod and adult emergence were subjected to two-wayanalysis of variance (ANOVA) and different treatmentmeans were separated using the least significant difference(LSD) test. The data on percent egg hatchability and adultemergence were arc sine transformed prior to statisticalanalysis. Since storage temperature and storage durationinteract to influence egg hatch and incubation period,multiple regression was used to determine the combinationof these variables for forecasting of incubation period andpercentage hatchability.
Results ad Discussion
Exposure of C. partellus eggs to differentstorage temperature-duration combinations
The percentage egg hatch and incubation period weresignificantly influenced by storage temperature (F4,80 = 9.78,p = 0.05 for egg hatch; F4,80 = 941.20, p = 0.01 for incubationperiod), storage duration (F3,80 = 7.56, p = 0.05 for egg hatch;F3,80 = 213.12, p = 0.01 for incubation period) and theirinteraction (F12,80 = 3.12, p = 0.05 for egg hatch; F12,80 =38.51, p = 0.01 for incubation period). Egg hatching variedfrom 15.9% to 94.6% in different treatment combinations(Table 1). When C. partellus eggs were stored at 52�����F�days, hatchability was reduced (15.9-65.6%). However,hatchability was not affected by storage of eggs at 102�(except for 7 days), 152��������2���G�������������!���
Table 1. Effect1 of different temperature-storage duration combinations on egg hatch and incubation period of Chilo partellusunder laboratory conditions.
1 3 5 7 1 3 5 75 90.6�5.8d 65.6�4.5bc 51.9�13.2b 15.9�8.7 a 10.0 6������ 11.4 6������ 14.6 6����,� 15.0 6������
10 91.1�3.6 d 77.6�9.8cd 78.1�7.9cd 55.2�17.2bc 9.0 6 ������� 11.1 6���>�� 14.2 6�����, 15.4 6���*�
15 94.6�1.2 d 92.5�6.0 d 88.7�4.3 d 78.8�10.2cd 10.1 6������ 11.0 6������ 13.0 6������ 14.1 6�����,
23 87.7�4.5 d 81.5�7.4cd 78.6�5.2cd 85.1�9.6 d 9.0 6 ������ 9.2 6 ������� 9.4 6������ 9.1 6�������
33 88.5�0.7 d 87.8�1.9 d 88.6�0.8 d 91.4�1.6 d 4.8 6 ������ 4.9 6 ������ 4.8 6������ 4.7 6������
Storagetemperature(�C)
Storage duration (days)Egg hatch (%) Incubation period (days)
1. Means 6� !8/� �����! ��� � �������� ������� ���� � ,� � ����"� � �������� &1!0� ����+�
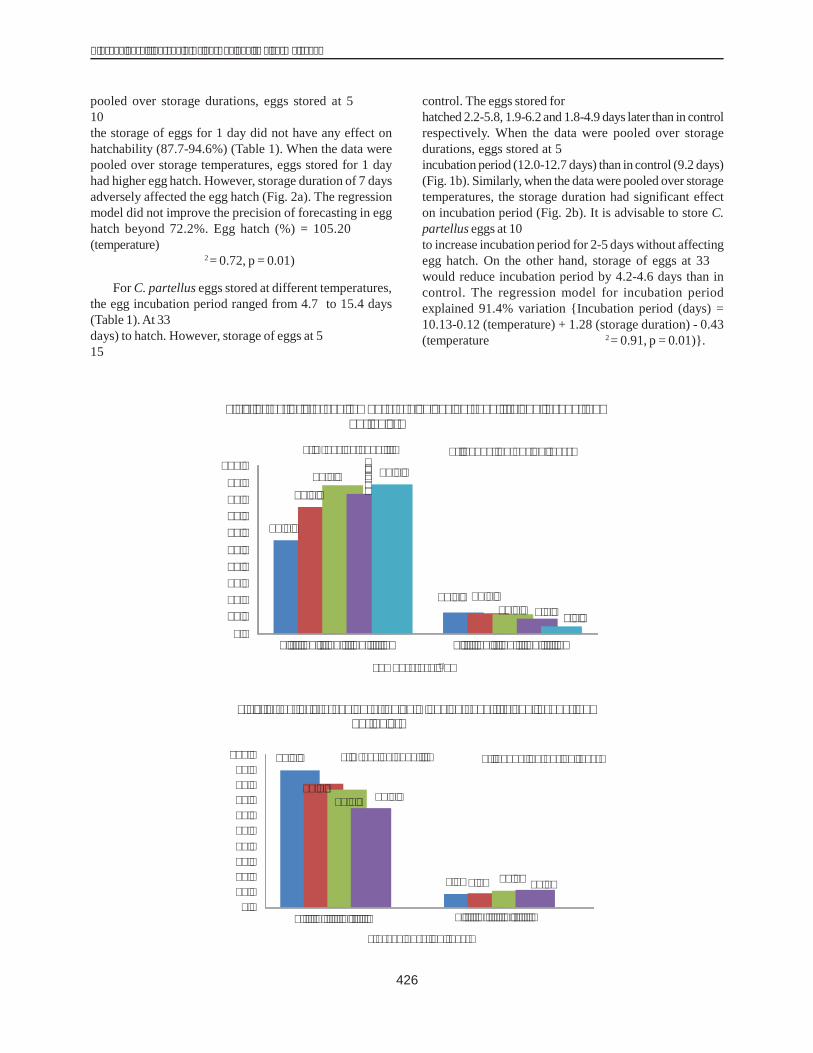
426
������� �� �� ����� ������� ����� ���������������
pooled over storage durations, eggs stored at 52�� ���102������!��,,�������&: ,����+��9��� ���������� ����������the storage of eggs for 1 day did not have any effect onhatchability (87.7-94.6%) (Table 1). When the data werepooled over storage temperatures, eggs stored for 1 dayhad higher egg hatch. However, storage duration of 7 daysadversely affected the egg hatch (Fig. 2a). The regressionmodel did not improve the precision of forecasting in egghatch beyond 72.2%. Egg hatch (%) = 105.20 ����*�(temperature) �����;��&����,������� �+�H���>��&�� ��������������,������� �+�&C2= 0.72, p = 0.01)
For C. partellus eggs stored at different temperatures,the egg incubation period ranged from 4.7 to 15.4 days(Table 1).At 332��������,,���(�� ,� � ����"������ ��&I$days) to hatch. However, storage of eggs at 52�����2�����152�� ������������� ������ ����� ��!����� ������! ��
control. The eggs stored for F����"�����$2�����2�������$2�hatched 2.2-5.8, 1.9-6.2 and 1.8-4.9 days later than in controlrespectively. When the data were pooled over storagedurations, eggs stored at 52�����2�������$2������� ,���incubation period (12.0-12.7 days) than in control (9.2 days)(Fig. 1b). Similarly, when the data were pooled over storagetemperatures, the storage duration had significant effecton incubation period (Fig. 2b). It is advisable to store C.partellus eggs at 102��&����-$���"�+����$2��&����-7���"�+to increase incubation period for 2-5 days without affectingegg hatch. On the other hand, storage of eggs at 332�would reduce incubation period by 4.2-4.6 days than incontrol. The regression model for incubation periodexplained 91.4% variation {Incubation period (days) =10.13-0.12 (temperature) + 1.28 (storage duration) - 0.43(temperature ������,������� �+�&C2= 0.91, p = 0.01)}.
������
����
�����
�� ��
������
�����
�������������� ����������������������
�����
��������������������������������
����������� ��� ������������� ������������������������������ ����� �� ������ ������
��������������������� ����������������!����"���#�
��������������������������������
$�%��!���!��"�&�
���� ����
������
������
�������������������������
����������� ��� ���������� �� �������������������������������� ����� �� ������ ������
������������������
�������������!����"���#�
���������������������������
'��!������!������"���#�
������
����
������
����
���
����
������
�����
�������������� ����������������������
����� ��������������������� ����������������!����"���#�
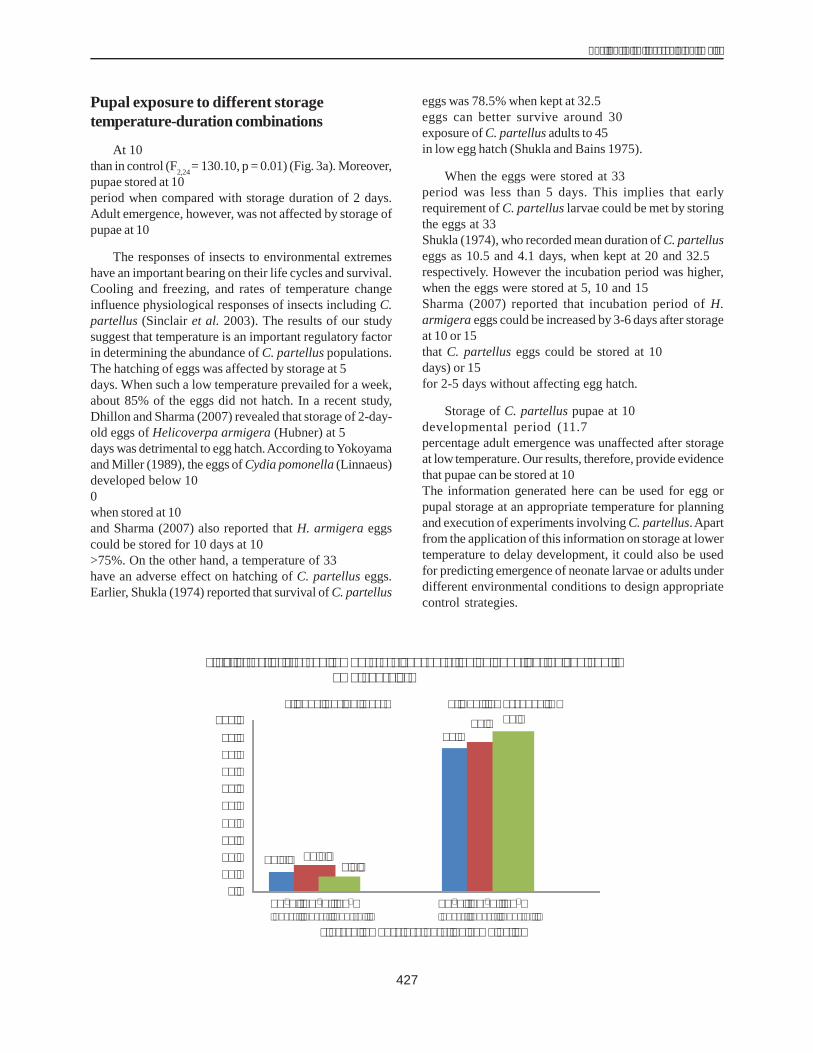
427
����� � ���� ����������� �������
Pupal exposure to different storagetemperature-duration combinations
At 102������������������ ,��������� �������� �than in control (F2,24= 130.10, p = 0.01) (Fig. 3a). Moreover,pupae stored at 102�����$���"������,������������ ����period when compared with storage duration of 2 days.Adult emergence, however, was not affected by storage ofpupae at 102��&: ,����+�
The responses of insects to environmental extremeshave an important bearing on their life cycles and survival.Cooling and freezing, and rates of temperature changeinfluence physiological responses of insects including C.partellus (Sinclair et al. 2003). The results of our studysuggest that temperature is an important regulatory factorin determining the abundance of C. partellus populations.The hatching of eggs was affected by storage at 52�����F�days. When such a low temperature prevailed for a week,about 85% of the eggs did not hatch. In a recent study,Dhillon and Sharma (2007) revealed that storage of 2-day-old eggs of Helicoverpa armigera (Hubner) at 52�����F$days was detrimental to egg hatch.According to Yokoyamaand Miller (1989), the eggs of Cydia pomonella (Linnaeus)developed below 102������������,,��� �������������,����02������>���"�������������"��,,�������!��������������when stored at 102��&�.��������7���"�+������$2���0� �and Sharma (2007) also reported that H. armigera eggscould be stored for 10 days at 102��! ������������ �"��>75%. On the other hand, a temperature of 332��� ����have an adverse effect on hatching of C. partellus eggs.Earlier, Shukla (1974) reported that survival of C. partellus
eggs was 78.5% when kept at 32.52���J��� ���� 5�������eggs can better survive around 302���J!������ ���exposure of C. partellus adults to 452�������������������in low egg hatch (Shukla and Bains 1975).
When the eggs were stored at 332��� ���� ������ �period was less than 5 days. This implies that earlyrequirement of C. partellus larvae could be met by storingthe eggs at 332���#� ������"���������������� �� �,���Shukla (1974), who recorded mean duration of C. partelluseggs as 10.5 and 4.1 days, when kept at 20 and 32.52�respectively. However the incubation period was higher,when the eggs were stored at 5, 10 and 152���0� ��KSharma (2007) reported that incubation period of H.armigera eggs could be increased by 3-6 days after storageat 10 or 152���:� ������������� ����� ,�� ���� �� ���� ����that C. partellus eggs could be stored at 102�� &����-$days) or 152��&����-7���"�+����������� ������ ����� �for 2-5 days without affecting egg hatch.
Storage of C. partellus pupae at 102�� ������������developmental period (11.7��$�$� ��"�+��J!�����percentage adult emergence was unaffected after storageat low temperature. Our results, therefore, provide evidencethat pupae can be stored at 102�������"������� ��,�����The information generated here can be used for egg orpupal storage at an appropriate temperature for planningand execution of experiments involving C. partellus.Apartfrom the application of this information on storage at lowertemperature to delay development, it could also be usedfor predicting emergence of neonate larvae or adults underdifferent environmental conditions to design appropriatecontrol strategies.
�����
����
������
���
�����
����
�������������� ����������������������
�����
����&�������&�����&"���#��"����#��"&���!�����
����������� ��� ����������������� ������ �� ����������� ������������������ ������ ������
���*�������!����"���#� ���+������%�!������"��
'��!������%��!���!�<��!��������%��������
����&�������&�����&"���#��"����#��"&���!�����
428
������� �� �� ����� ������� ����� ���������������
ReferencesDhillon M.K. and Sharma H.C. 2007. Effect of storage
temperature and duration on viability of eggs ofHelicoverpa armigera (Lepidoptera: Noctuidae). Bulletinof Entomological Research 97:55-59.
Hari N.S., Jindal J., Malhi N.S. and Khosa J.K. 2008. Effect ofadult nutrition and insect density on the performance ofspotted stem borer, Chilo partellus in laboratory cultures.Journal of Pest Science 81:23-27.
Kanta U. and Sajjan S.S. 1989. Formulation of an improvedartificial diet for the mass rearing of Chilo partellus(Swinhoe). Journal of Insect Science 2:98-102.
Kumar H. 1992. Oviposition, larval arrest and establishment ofChilo partellus (Swinhoe) (Lepidoptera: Pyralidae) onmaize genotypes during anthesis. Bulletin of EntomologicalResearch 82:355-60.
Panwar V.P.S. 2005. Management of maize stalk borer Chilopartellus (Swinhoe) in maize. Pages 324-375 in Stresseson maize in the tropics. Zaidi P.H. and Singh N.N. (eds.)New Delhi, India: Directorate of Maize Research.
Shukla K.K. 1974. Effect of temperature, humidity and food onthe development and survival of Chilo partellus (Swinhoe).Unpublished M.Sc. thesis, Punjab Agricultural University,Ludhiana.
Shukla K.K. and Bains S.S. 1975. Effect of short exposures tohigh temperatures on the survival, fecundity and eggviability of Chilo partellus (Swinhoe). Indian Journal ofEcology 2:183-85.
Sinclair B.J., Vernon P., Klok C.J. and Chown S.L. 2003. Insectsat low temperatures: an ecological perspective. Trends inEcology and Evolution 18:257-62.
Yokoyama V.Y. and Miller G.T. 1989. Response of codling mothand oriental fruit moth (Lepidoptera: Tortricidae)immatures to low-temperature storage of stone fruits.Journal of Economic Entomology 82:1152-56.

429
����� � ���� ����������� �������
IntroductionMaize is infested by 139 insects at different stages of
crop growth. Among them only stem borers are a majorproblem and require insecticidal intervention. Losses dueto Chilo partellus (Swinhoe) during the rainy season rangefrom 26.7% to 80.4%. Losses due to Sesamia inferensWalker range from 25.7% to 78.9% during the postrainyseason (winter) in different agroclimatic regions of India(Chatterjee et al. 1969). Several workers have reported theuse of insecticides for controlling borers. In general,farmers use endosulfan spray or carbofuran granules forcontrolling these pests. To minimize or avoid usinginsecticides, the egg parasitoid Trichogramma chilonis isan ideal alternative in managing stem borers at the eggstage itself. It is cost-efficient, environmentally safe andsocially acceptable.
MethodOur experiments were conducted in farmers��� ���� �
Andhra Pradesh during the kharif (rainy) seasons of 2004/05 2005/06 and 2006/07 for managing the maize stalk borerChilo partellus and during rabi (postrainy) season of 2006/07 for managing the pink stem borer, Sesamia inferens(Table 1). The trial consisted of two treatments each plantedover a 0.40 ha area in farmers��� �����#���� ��������� ���consisted of the farmers������� ������������������T. chilonis,an egg parasitoid, was released in the field by pinning eggcards to the under side of leaves. The egg cards weredistributed uniformly in the field at the rata of 3 per 0.40 ha.The farmers spray endosulfan 35 EC at 3 mL L-1 of water
10-15 days after germination. Data on the number of plantsinfested, number of dead hearts formed and grain yield inthe two treatments were recorded.
Results and DiscussionData on percentage of plants infested and dead hearts
formed and grain yield (Table 1) indicated that release of T.chilonis effectively controlled the borer in the egg stageitself compared to the farmers�� ����� ��� �� ����" �,endosulfan. During the rainy season of 2004/05 thepercentage of plants infested and dead hearts formed inthe egg parasitoid-released fields was 8.61% as opposedto 13.99% plants infested and 2.23% dead hearts formed inthe farmers������� ���! �������49��*��>���� �����?�� ��" ��varied from 1262 kg in the former treatment to 1002 kg inthe latter per 0.40 ha area. In the rainy season of 2005 theBH 2187 cultivar recorded 24.11% plants infested and 8.26%dead hearts in the farmers������� ��������� �����,� �������*�and 6.6% respectively in the egg parasitoid-released field.The trials were conducted with four cultivars in the rainyseason of 2006 and two cultivars in the postrainy seasonof 2006. The percentage of plants infested and dead heartsin the four cultivars planted in the rainy season variedfrom 6.60% to 17.71% and 0.10% to 7.64% respectively inthe egg parasitoid-released fields as against 10.38-20.67%and 0.10-7.64% respectively in the farmers�� ����� ��treatment. For the four cultivars in the farmers������� ���grain yield ranged from 2375 kg to 3310 kg in the eggparasitoid-released fields and from 2190 kg to 3164 kg inthe farmers������� ���� �����?�� ��" ���!�����*-�;$�(,� ��in the egg parasitoid-released fields than in the farmers�practice endosulfan-sprayed fields in the 2006 rainy season.
Egg Parasitoid Trichogramma chilonis in the Management ofMaize Stem Borers
J.C. Sekhar1, Pradyumn Kumar1, M.Anuradha2, Sujay Rakshit1 and Sain Dass1
1. Directorate of Maize Research, Pusa Campus, New Delhi 110 012, India2. Maize Research Center, Rajendranagar, Hyderabad 50 030, IndiaE-mail:[email protected]
Abstract. These experiments were conducted in farmers�� ������� ���!������4������� ���� ��� ������ ������� ������(rainy season) in 2004/05, 2005/06 and 2006/07 to manage maize stalk borer Chilo partellus and during rabi(postrainy season) in 2006/07 to manage the pink stem borer, Sesamia inferens. The first treatment consited offarmers�� ������$��������������%���������������������������� ������������������������������������� ����������cards to the under side of leaves uniformly in the field at the rate of 3 egg cards per 0.40 ha. We found that the eggparasitoid Trichogramma chilonis can be used effectively in managing stem borers C. partellus and S. inferensinfestation in maize irrespective of the cultivars grown.
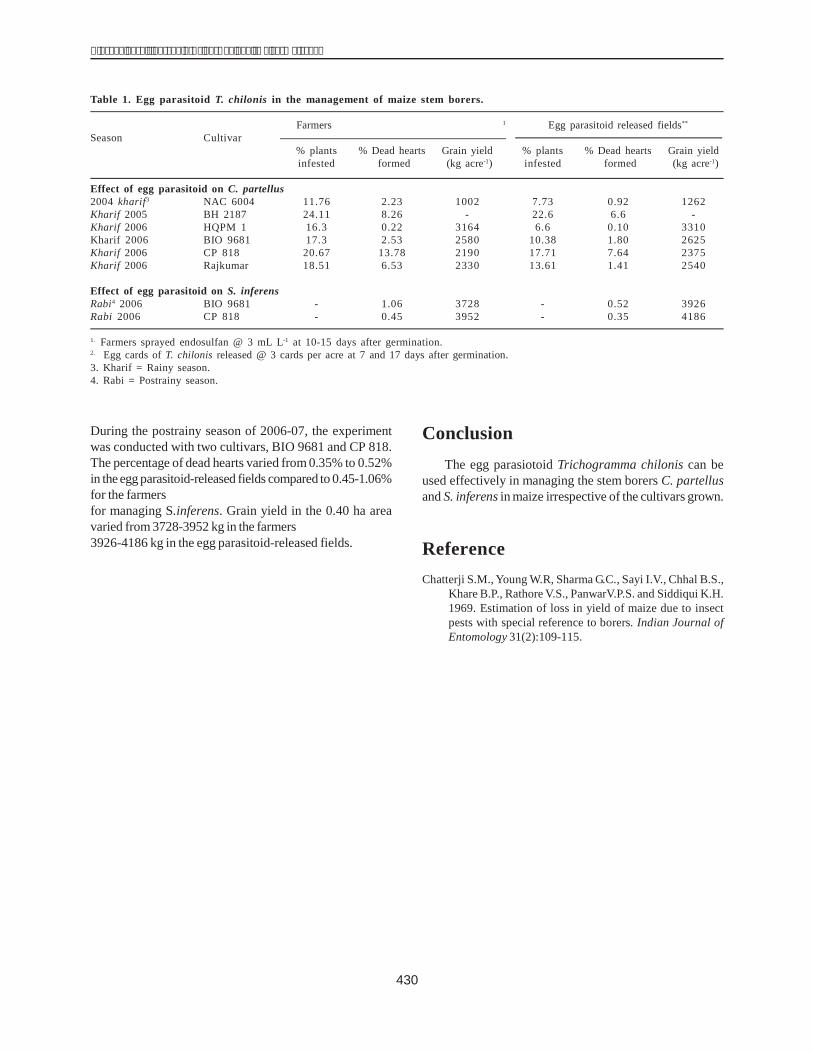
430
������� �� �� ����� ������� ����� ���������������
During the postrainy season of 2006-07, the experimentwas conducted with two cultivars, BIO 9681 and CP 818.The percentage of dead hearts varied from 0.35% to 0.52%in the egg parasitoid-released fields compared to 0.45-1.06%for the farmers��� ����!� ��������� ��������������������"for managing S.inferens. Grain yield in the 0.40 ha areavaried from 3728-3952 kg in the farmers������� ��������� 3926-4186 kg in the egg parasitoid-released fields.
ConclusionThe egg parasiotoid Trichogramma chilonis can be
used effectively in managing the stem borers C. partellusand S. inferens in maize irrespective of the cultivars grown.
ReferenceChatterji S.M., Young W.R, Sharma G.C., Sayi I.V., Chhal B.S.,
Khare B.P., Rathore V.S., PanwarV.P.S. and Siddiqui K.H.1969. Estimation of loss in yield of maize due to insectpests with special reference to borers. Indian Journal ofEntomology 31(2):109-115.
Table 1. Egg parasitoid T. chilonis in the management of maize stem borers.
Farmers������� �������������-����"���� ���1 Egg parasitoid released fields**
Season Cultivar% plants % Dead hearts Grain yield % plants % Dead hearts Grain yieldinfested formed (kg acre-1) infested formed (kg acre-1)
Effect of egg parasitoid on C. partellus2004 kharif3 NAC 6004 11.76 2.23 1002 7.73 0.92 1262Kharif 2005 BH 2187 24.11 8.26 - 22.6 6.6 -Kharif 2006 HQPM 1 16.3 0.22 3164 6.6 0.10 3310Kharif 2006 BIO 9681 17.3 2.53 2580 10.38 1.80 2625Kharif 2006 CP 818 20.67 13.78 2190 17.71 7.64 2375Kharif 2006 Rajkumar 18.51 6.53 2330 13.61 1.41 2540
Effect of egg parasitoid on S. inferensRabi4 2006 BIO 9681 - 1.06 3728 - 0.52 3926Rabi 2006 CP 818 - 0.45 3952 - 0.35 4186
1. Farmers sprayed endosulfan @ 3 mL L-1 at 10-15 days after germination.2. Egg cards of T. chilonis released @ 3 cards per acre at 7 and 17 days after germination.3. Kharif = Rainy season.4. Rabi = Postrainy season.
431
����� � ���� ����������� �������
IntroductionInsects attack maize throughout the cropping cycle,
and the major insect pests attacking maize are the spottedstem borer Chilo partellus (Swinhoe) and the pink stemborer Sesamia inferens Walker. The former attacks the cropthroughout India during the kharif (rainy) season whilethe later is restricted in peninsular India during the rabi(winter) season. The losses primarily due to S. inferens inrabi range from 25.7% to 78.9% (Chatterjee et al. 1969).Keeping in view the needs of resource-poor farmers andthe ecological consequences of chemical control, there isa need to develop maize germplasm with moderate levelsof resistance to insect pests.
Materials and MethodThis study was conducted to identify CIMMYT Maize
Lines (CMLs) and their hybrid combinations with the leastsusceptibility to pink stem borer under artificial infestationin field conditions. The study included two trials. The firstinvolved 28 inbred lines with two resistant controls,Winpink 4 (resistant control 1), CM 500 (resistant control2) and one susceptible control, CM 300. The second trial
was comprised of 45 yellow single crosses and Winpink 5(resistant control 1), CM 500 (resistant control 2) and CM300 (susceptible control). All these inbreds and singlecrosses were obtained from the CIMMYT India program.The resistant and susceptible controls are locally adaptedinbred lines. The trials were planted in a randomized blockdesign with two replications in rows of 2.5 m with inter-and intrarow spacing of 75 cm and 20 cm, respectively. Thetrials were conducted during rabi 2005/06 at the WinterNursery Experimental Farm, Hyderabad. Ten to twelveneonate larvae of pink stem borer were introduced into thewhorl of plants using a larval dispenser. Four weeks afterinfestation, plants were scored for leaf injury rating (LIR)on a 9-point scale .The LIR scores were subjected tostatistical analyses using the statistical software WindostatVersion 8.0, and differences among the means werecompared at P = 0.05.
Results and DiscussionData on the LIR of 28 inbred lines and 45 crosses
screened against S. inferens are presented in Table 1 andTable 2. The lines and crosses were grouped into fourcategories based on their LIR: (i) Highly resistant: LIR less
Differential Response of CMLs and Their HybridCombinations to Pink Borer Sesamia inferense Walker
J.C. Sekhar1, Pradyumn Kumar1, Sujay Rakshit1, Mehrajuddin3, M.Anuradha2 and Sain Dass1
1. Directorate of Maize Research, Pusa Campus, New Delhi 110 012, India2. Maize Research Centre, Rajendranagar, Hyderabad 500 030, India3. ARMP-CIMMYT India, ICRISAT, Patancheru, Hyderabad, IndiaE-mail: [email protected]
Abstract. Two field experiments were conducted to identify CIMMYT Maize Lines (CMLs) and their hybrid combinationswith the least susceptibility to pink stem borer under artificial infestation in the field. The first trial comprised of 28inbred lines with two resistant checks, Winpink 4 (resistant control 1), CM 500 (resistant control 2), and onesusceptible control, CM 300. The second trial was comprised of 45 yellow single crosses and Winpink 5 (resistantcontrol 1), CM 500 (resistant control 2) and CM 300 (susceptible control). The lines and crosses were separated intofour categories on the basis of the leaf injury rating (LIR): (i) Highly resistant: LIR less than the resistant controls; (ii)Moderately resistant: LIR more than resistant control 2 and less than 5.0; (iii) Susceptible: LIR above 5.0 and less thanthe susceptible control, CM 300; and (iv) Highly susceptible: LIR above the susceptible control. Of the 28 linesscreened, 4 were found to be moderately resistant. CML 421 recorded an of 4.4, which was followed by CA03141(4.60), CA03120 (4.60) and CA00106 (4.75). The crosses CML 429 ��(�5�6#6�."$6�)�����(�5�6"����(�5�6#��."$#�)were found to be highly resistant. As many as 38 crosses were found to be moderately resistant, recording an LIRof less than 5.0. Three crosses CML 427 ��(�5�6#��.*$-�)�(�5�6"*���(�5�6"/�.*$0�)�����(�5�6"*���(�5�6"0�.*$#�)were susceptible, recording an LIR less than the susceptible control CM 300 (6.20). Overall, the screening trialsindicated that the inbred lines CML 421, CA0 3141, CA00106 and CA03120 and single crosses CML 429 ��(�5�6#6CML 421 ��(�5�6#�����������������&������������������ ��������������������������������� ������$
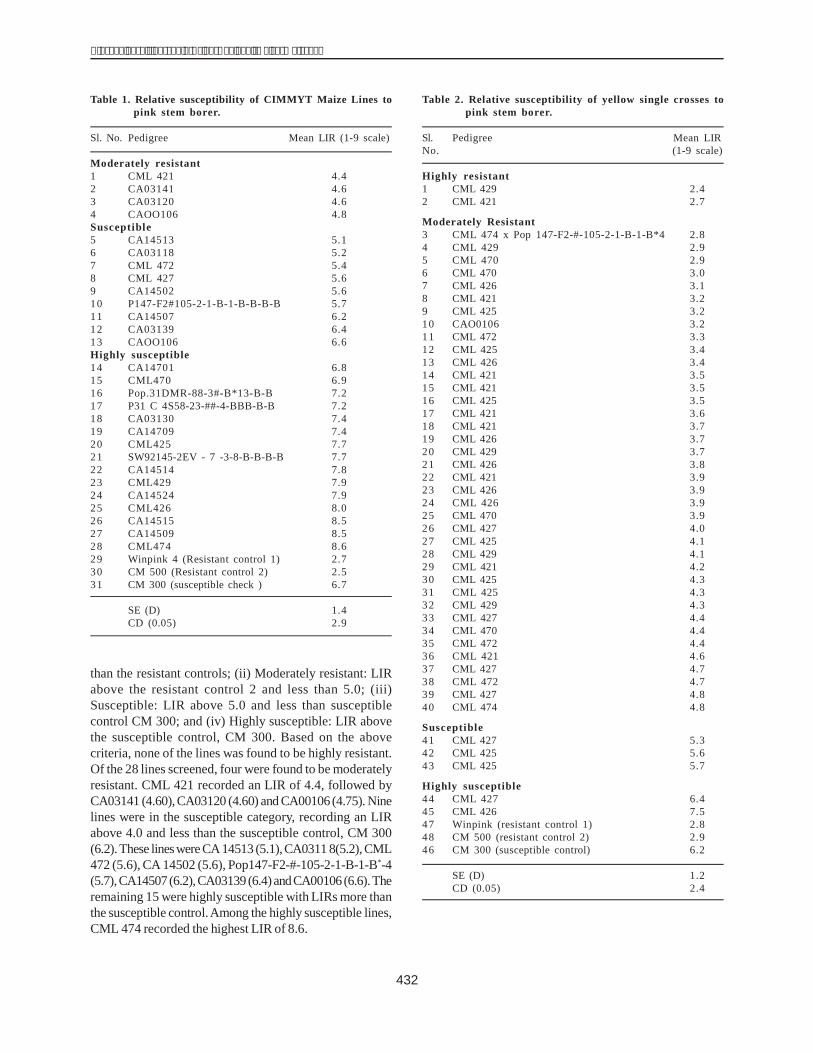
432
������� �� �� ����� ������� ����� ���������������
than the resistant controls; (ii) Moderately resistant: LIRabove the resistant control 2 and less than 5.0; (iii)Susceptible: LIR above 5.0 and less than susceptiblecontrol CM 300; and (iv) Highly susceptible: LIR abovethe susceptible control, CM 300. Based on the abovecriteria, none of the lines was found to be highly resistant.Of the 28 lines screened, four were found to be moderatelyresistant. CML 421 recorded an LIR of 4.4, followed byCA03141 (4.60),CA03120 (4.60) and CA00106 (4.75). Ninelines were in the susceptible category, recording an LIRabove 4.0 and less than the susceptible control, CM 300(6.2). These lineswere CA14513 (5.1),CA0311 8(5.2), CML472 (5.6), CA 14502 (5.6), Pop147-F2-#-105-2-1-B-1-B*-4(5.7),CA14507 (6.2),CA03139 (6.4) andCA00106 (6.6).Theremaining 15 were highly susceptible with LIRs more thanthe susceptible control.Among the highly susceptible lines,CML 474 recorded the highest LIR of 8.6.
Table 1. Relative susceptibility of CIMMYT Maize Lines topink stem borer.
Sl. No. Pedigree Mean LIR (1-9 scale)
Moderately resistant1 CML 421 4.42 CA03141 4.63 CA03120 4.64 CAOO106 4.8Susceptible5 CA14513 5.16 CA03118 5.27 CML 472 5.48 CML 427 5.69 CA14502 5.610 P147-F2#105-2-1-B-1-B-B-B-B 5.711 CA14507 6.212 CA03139 6.413 CAOO106 6.6Highly susceptible14 CA14701 6.815 CML470 6.916 Pop.31DMR-88-3#-B*13-B-B 7.217 P31 C 4S58-23-##-4-BBB-B-B 7.218 CA03130 7.419 CA14709 7.420 CML425 7.721 SW92145-2EV - 7 -3-8-B-B-B-B 7.722 CA14514 7.823 CML429 7.924 CA14524 7.925 CML426 8.026 CA14515 8.527 CA14509 8.528 CML474 8.629 Winpink 4 (Resistant control 1) 2.730 CM 500 (Resistant control 2) 2.531 CM 300 (susceptible check ) 6.7
SE (D) 1.4CD (0.05) 2.9
Table 2. Relative susceptibility of yellow single crosses topink stem borer.
Sl. Pedigree Mean LIRNo. (1-9 scale)
Highly resistant1 CML 429 ���D1� >7> 2.42 CML 421 ���D1� >7� 2.7
Moderately Resistant3 CML 474 x Pop 147-F2-#-105-2-1-B-1-B*4 2.84 CML 429 �� ����>7-:�-L-��$-�-�-A--AM> 2.95 CML 470 �� ����>7-:�-L-��$-�-�-A-�-AM> 2.96 CML 470 ���D1� >7� 3.07 CML 426 ���D1� >7> 3.18 CML 421 ���D1� >7� 3.29 CML 425 ���D1� >7� 3.210 CAO0106 �� ��� �>7-:�-L-��$-�-�-A--AM> 3.211 CML 472 ���D1� >7> 3.312 CML 425 ���9N���* 3.413 CML 426 ���9NN��* 3.414 CML 421 ���D1� >�7 3.515 CML 421 ���D1� >7> 3.516 CML 425 ���D1� >�7 3.517 CML 421 ���D1� >�$ 3.618 CML 421 ���D1� >�) 3.719 CML 426 ���D1� >�7 3.720 CML 429 ���D1� >7� 3.721 CML 426 ���D1� >�) 3.822 CML 421 ���D1� >�* 3.923 CML 426 ���D1� >7� 3.924 CML 426 �� ����>7-:�-L-��$-�-�-A-�-AM> 3.925 CML 470 ���D1� >7> 3.926 CML 427 ���D1� >7> 4.027 CML 425 ���D1� >7> 4.128 CML 429 ���D1� >7� 4.129 CML 421 ���9NN��* 4.230 CML 425 ���D1� >7� 4.331 CML 425 �� ���� �>7-:�-L-�� �$-�-�-A-�-AM> 4.332 CML 429 ���9NN��* 4.333 CML 427 ���9NN��* 4.434 CML 470 ���9NN��* 4.435 CML 472 ���9N���* 4.436 CML 421 �� ����>7-:�-L-��$-�-�-A-�-AM> 4.637 CML 427 ���D1� >�) 4.738 CML 472 ����� �>7-:�-L-��$-�-�-A-�-AM> 4.739 CML 427 ���D1� >7� 4.840 CML 474 ���9NN��* 4.8
Susceptible41 CML 427 ���D1� >7� 5.342 CML 425 ���D1� >�) 5.643 CML 425 ���D1� >�* 5.7
Highly susceptible44 CML 427 �� ��� �>7-:�-L-��$-�-�-A--AM> 6.445 CML 426 ���D1� >7� 7.547 Winpink (resistant control 1) 2.848 CM 500 (resistant control 2) 2.946 CM 300 (susceptible control) 6.2
� SE (D) 1.2� CD (0.05) 2.4
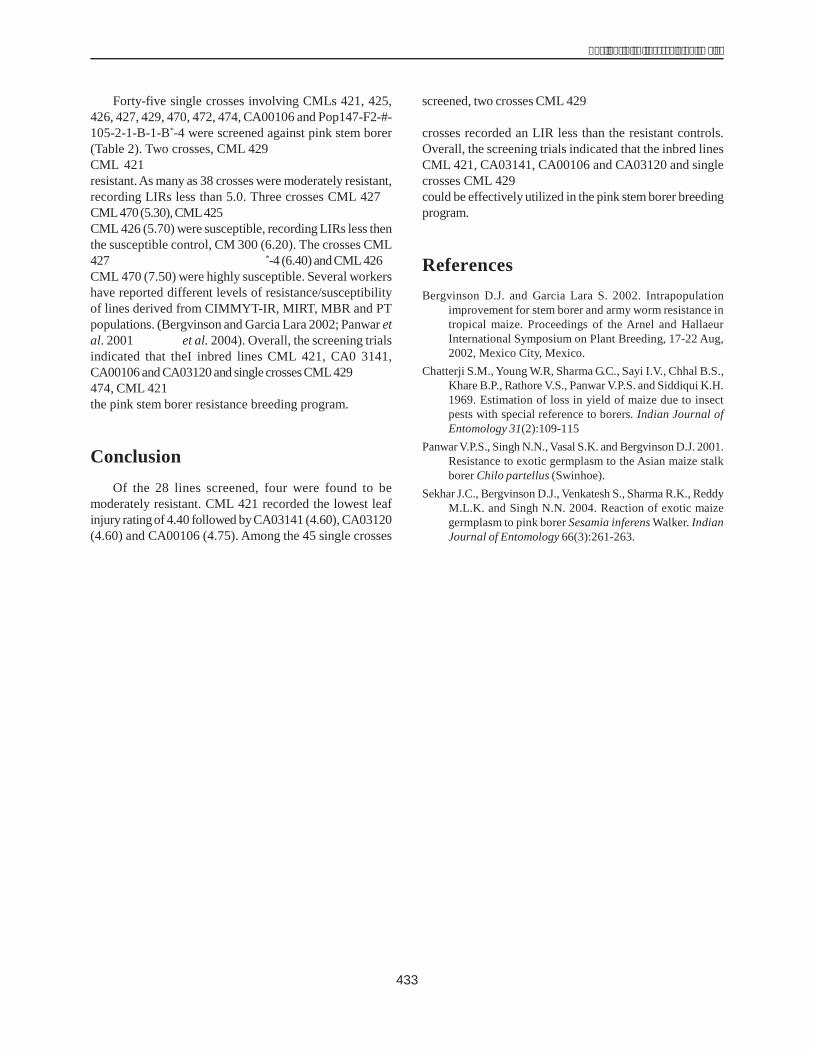
433
����� � ���� ����������� �������
Forty-five single crosses involving CMLs 421, 425,426, 427, 429, 470, 472, 474, CA00106 and Pop147-F2-#-105-2-1-B-1-B*-4 were screened against pink stem borer(Table 2). Two crosses, CML 429 ���D1�>7>�&��>�+����CML 421 ���D1�>7�� &��7�+�!���� ����� ������ ,�"resistant.As many as 38 crosses were moderately resistant,recording LIRs less than 5.0. Three crosses CML 427 �CML470(5.30),CML425���D1�>�)�&$�*�+������D1�>�$��CML 426 (5.70) were susceptible, recording LIRs less thenthe susceptible control, CM 300 (6.20). The crosses CML427�����>7-:�-L-��$-�-�-A-�-A*-4 (6.40) and CML 426�CML 470 (7.50) were highly susceptible. Several workershave reported different levels of resistance/susceptibilityof lines derived from CIMMYT-IR, MIRT, MBR and PTpopulations. (Bergvinson and Garcia Lara 2002; Panwar etal. 2001�/�!�(����et al. 2004). Overall, the screening trialsindicated that theI inbred lines CML 421, CA0 3141,CA00106 and CA03120 and single crosses CML429���D1474, CML 421 ���D1�>7��������������� ��"��� 5��� �the pink stem borer resistance breeding program.
ConclusionOf the 28 lines screened, four were found to be
moderately resistant. CML 421 recorded the lowest leafinjury rating of 4.40 followed byCA03141 (4.60), CA03120(4.60) and CA00106 (4.75). Among the 45 single crosses
screened, two crosses CML 429 ���D1�>7>������D1�>�����D1�>7��!��������������� ,�"���� �������#������!crosses recorded an LIR less than the resistant controls.Overall, the screening trials indicated that the inbred linesCML 421, CA03141, CA00106 and CA03120 and singlecrosses CML 429 ���D1�>7>������D1�>������D1�>7�could be effectively utilized in the pink stem borer breedingprogram.
ReferencesBergvinson D.J. and Garcia Lara S. 2002. Intrapopulation
improvement for stem borer and army worm resistance intropical maize. Proceedings of the Arnel and HallaeurInternational Symposium on Plant Breeding, 17-22 Aug,2002, Mexico City, Mexico.
Chatterji S.M., Young W.R, Sharma G.C., Sayi I.V., Chhal B.S.,Khare B.P., Rathore V.S., Panwar V.P.S. and Siddiqui K.H.1969. Estimation of loss in yield of maize due to insectpests with special reference to borers. Indian Journal ofEntomology 31(2):109-115
Panwar V.P.S., Singh N.N., Vasal S.K. and Bergvinson D.J. 2001.Resistance to exotic germplasm to the Asian maize stalkborer Chilo partellus (Swinhoe).
Sekhar J.C., Bergvinson D.J., Venkatesh S., Sharma R.K., ReddyM.L.K. and Singh N.N. 2004. Reaction of exotic maizegermplasm to pink borer Sesamia inferens Walker. IndianJournal of Entomology 66(3):261-263.
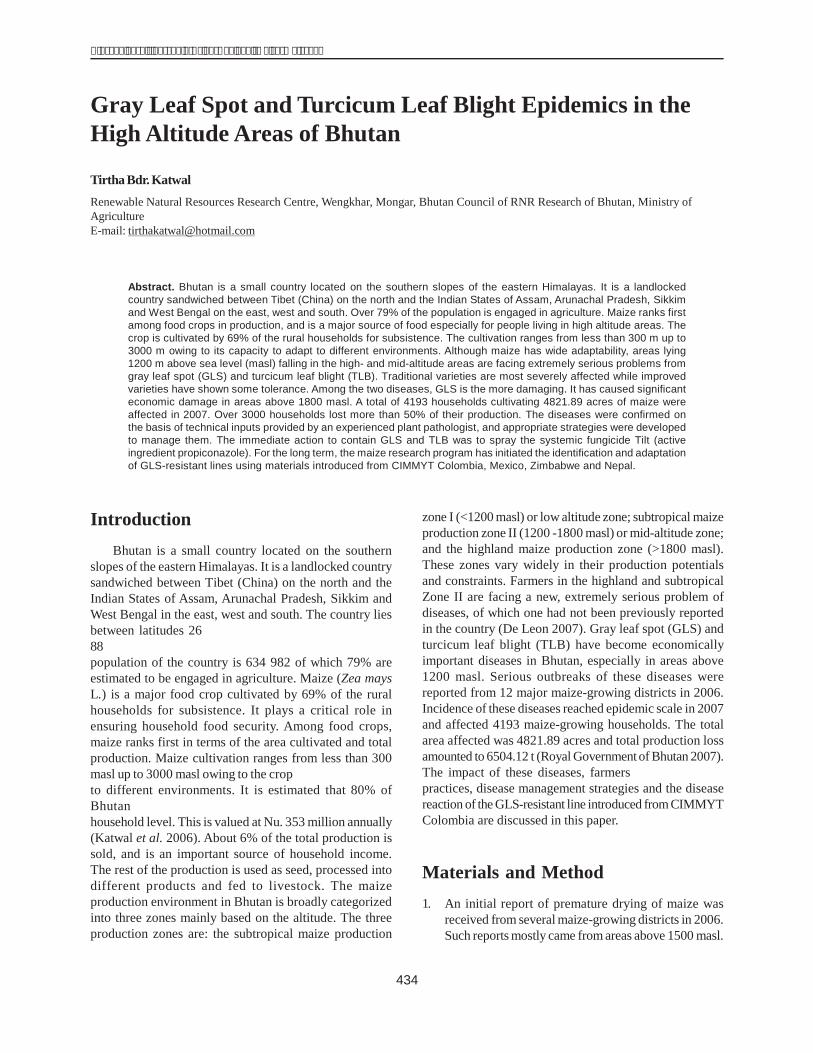
434
������� �� �� ����� ������� ����� ���������������
IntroductionBhutan is a small country located on the southern
slopes of the eastern Himalayas. It is a landlocked countrysandwiched between Tibet (China) on the north and theIndian States of Assam, Arunachal Pradesh, Sikkim andWest Bengal in the east, west and south. The country liesbetween latitudes 262>$O4������;2��O4������ �, �����882>$�8�����)�2��O8�����������������������;��)>��%�( ��#��population of the country is 634 982 of which 79% areestimated to be engaged in agriculture. Maize (Zea maysL.) is a major food crop cultivated by 69% of the ruralhouseholds for subsistence. It plays a critical role inensuring household food security. Among food crops,maize ranks first in terms of the area cultivated and totalproduction. Maize cultivation ranges from less than 300masl up to 3000 masl owing to the crop�������� �"��������to different environments. It is estimated that 80% ofBhutan��� ���� � 5�� ������ �� �� ���� ��� ��� ���household level. This is valued at Nu. 353 million annually(Katwal et al. 2006). About 6% of the total production issold, and is an important source of household income.The rest of the production is used as seed, processed intodifferent products and fed to livestock. The maizeproduction environment in Bhutan is broadly categorizedinto three zones mainly based on the altitude. The threeproduction zones are: the subtropical maize production
zone I (<1200 masl) or low altitude zone; subtropical maizeproduction zone II (1200 -1800 masl) or mid-altitude zone;and the highland maize production zone (>1800 masl).These zones vary widely in their production potentialsand constraints. Farmers in the highland and subtropicalZone II are facing a new, extremely serious problem ofdiseases, of which one had not been previously reportedin the country (De Leon 2007). Gray leaf spot (GLS) andturcicum leaf blight (TLB) have become economicallyimportant diseases in Bhutan, especially in areas above1200 masl. Serious outbreaks of these diseases werereported from 12 major maize-growing districts in 2006.Incidence of these diseases reached epidemic scale in 2007and affected 4193 maize-growing households. The totalarea affected was 4821.89 acres and total production lossamounted to 6504.12 t (Royal Government of Bhutan 2007).The impact of these diseases, farmers��������������"practices, disease management strategies and the diseasereaction of the GLS-resistant line introduced from CIMMYTColombia are discussed in this paper.
Materials and Method1. An initial report of premature drying of maize was
received from several maize-growing districts in 2006.Such reports mostly came from areas above 1500 masl.
Gray Leaf Spot and Turcicum Leaf Blight Epidemics in theHigh Altitude Areas of Bhutan
Tirtha Bdr. KatwalRenewable Natural Resources Research Centre, Wengkhar, Mongar, Bhutan Council of RNR Research of Bhutan, Ministry ofAgricultureE-mail: [email protected]
Abstract. Bhutan is a small country located on the southern slopes of the eastern Himalayas. It is a landlockedcountry sandwiched between Tibet (China) on the north and the Indian States of Assam, Arunachal Pradesh, Sikkimand West Bengal on the east, west and south. Over 79% of the population is engaged in agriculture. Maize ranks firstamong food crops in production, and is a major source of food especially for people living in high altitude areas. Thecrop is cultivated by 69% of the rural households for subsistence. The cultivation ranges from less than 300 m up to3000 m owing to its capacity to adapt to different environments. Although maize has wide adaptability, areas lying1200 m above sea level (masl) falling in the high- and mid-altitude areas are facing extremely serious problems fromgray leaf spot (GLS) and turcicum leaf blight (TLB). Traditional varieties are most severely affected while improvedvarieties have shown some tolerance. Among the two diseases, GLS is the more damaging. It has caused significanteconomic damage in areas above 1800 masl. A total of 4193 households cultivating 4821.89 acres of maize wereaffected in 2007. Over 3000 households lost more than 50% of their production. The diseases were confirmed onthe basis of technical inputs provided by an experienced plant pathologist, and appropriate strategies were developedto manage them. The immediate action to contain GLS and TLB was to spray the systemic fungicide Tilt (activeingredient propiconazole). For the long term, the maize research program has initiated the identification and adaptationof GLS-resistant lines using materials introduced from CIMMYT Colombia, Mexico, Zimbabwe and Nepal.
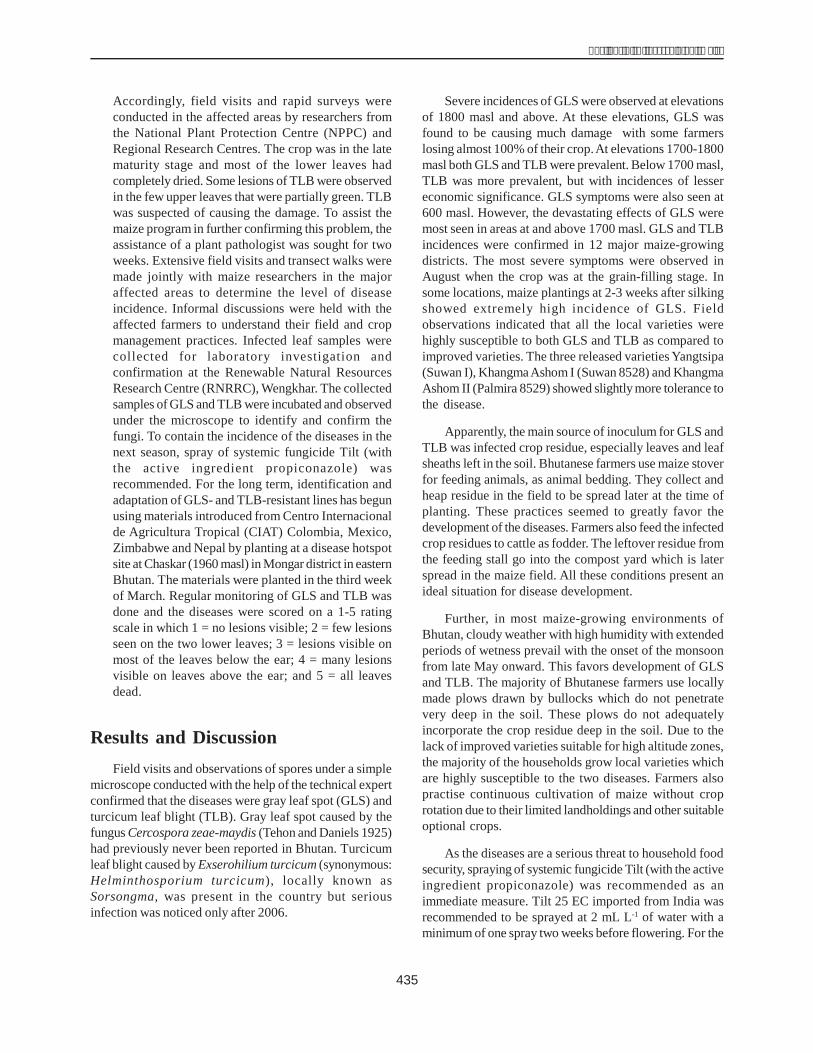
435
����� � ���� ����������� �������
Accordingly, field visits and rapid surveys wereconducted in the affected areas by researchers fromthe National Plant Protection Centre (NPPC) andRegional Research Centres. The crop was in the latematurity stage and most of the lower leaves hadcompletely dried. Some lesions of TLB were observedin the few upper leaves that were partially green. TLBwas suspected of causing the damage. To assist themaize program in further confirming this problem, theassistance of a plant pathologist was sought for twoweeks. Extensive field visits and transect walks weremade jointly with maize researchers in the majoraffected areas to determine the level of diseaseincidence. Informal discussions were held with theaffected farmers to understand their field and cropmanagement practices. Infected leaf samples werecollected for laboratory investigation andconfirmation at the Renewable Natural ResourcesResearch Centre (RNRRC), Wengkhar. The collectedsamples of GLS and TLB were incubated and observedunder the microscope to identify and confirm thefungi. To contain the incidence of the diseases in thenext season, spray of systemic fungicide Tilt (withthe active ingredient propiconazole) wasrecommended. For the long term, identification andadaptation of GLS- and TLB-resistant lines has begunusing materials introduced from Centro Internacionalde Agricultura Tropical (CIAT) Colombia, Mexico,Zimbabwe and Nepal by planting at a disease hotspotsite at Chaskar (1960 masl) in Mongar district in easternBhutan. The materials were planted in the third weekof March. Regular monitoring of GLS and TLB wasdone and the diseases were scored on a 1-5 ratingscale in which 1 = no lesions visible; 2 = few lesionsseen on the two lower leaves; 3 = lesions visible onmost of the leaves below the ear; 4 = many lesionsvisible on leaves above the ear; and 5 = all leavesdead.
Results and DiscussionField visits and observations of spores under a simple
microscope conducted with the help of the technical expertconfirmed that the diseases were gray leaf spot (GLS) andturcicum leaf blight (TLB). Gray leaf spot caused by thefungus Cercospora zeae-maydis (Tehon and Daniels 1925)had previously never been reported in Bhutan. Turcicumleaf blight caused by Exserohilium turcicum (synonymous:Helminthosporium turcicum), locally known asSorsongma, was present in the country but seriousinfection was noticed only after 2006.
Severe incidences of GLS were observed at elevationsof 1800 masl and above. At these elevations, GLS wasfound to be causing much damage with some farmerslosing almost 100% of their crop.At elevations 1700-1800masl both GLS and TLB were prevalent. Below 1700 masl,TLB was more prevalent, but with incidences of lessereconomic significance. GLS symptoms were also seen at600 masl. However, the devastating effects of GLS weremost seen in areas at and above 1700 masl. GLS and TLBincidences were confirmed in 12 major maize-growingdistricts. The most severe symptoms were observed inAugust when the crop was at the grain-filling stage. Insome locations, maize plantings at 2-3 weeks after silkingshowed extremely high incidence of GLS. Fieldobservations indicated that all the local varieties werehighly susceptible to both GLS and TLB as compared toimproved varieties. The three released varieties Yangtsipa(Suwan I), KhangmaAshom I (Suwan 8528) and KhangmaAshom II (Palmira 8529) showed slightly more tolerance tothe disease.
Apparently, the main source of inoculum for GLS andTLB was infected crop residue, especially leaves and leafsheaths left in the soil. Bhutanese farmers use maize stoverfor feeding animals, as animal bedding. They collect andheap residue in the field to be spread later at the time ofplanting. These practices seemed to greatly favor thedevelopment of the diseases. Farmers also feed the infectedcrop residues to cattle as fodder. The leftover residue fromthe feeding stall go into the compost yard which is laterspread in the maize field. All these conditions present anideal situation for disease development.
Further, in most maize-growing environments ofBhutan, cloudy weather with high humidity with extendedperiods of wetness prevail with the onset of the monsoonfrom late May onward. This favors development of GLSand TLB. The majority of Bhutanese farmers use locallymade plows drawn by bullocks which do not penetratevery deep in the soil. These plows do not adequatelyincorporate the crop residue deep in the soil. Due to thelack of improved varieties suitable for high altitude zones,the majority of the households grow local varieties whichare highly susceptible to the two diseases. Farmers alsopractise continuous cultivation of maize without croprotation due to their limited landholdings and other suitableoptional crops.
As the diseases are a serious threat to household foodsecurity, spraying of systemic fungicide Tilt (with the activeingredient propiconazole) was recommended as animmediate measure. Tilt 25 EC imported from India wasrecommended to be sprayed at 2 mL L-1 of water with aminimum of one spray two weeks before flowering. For the
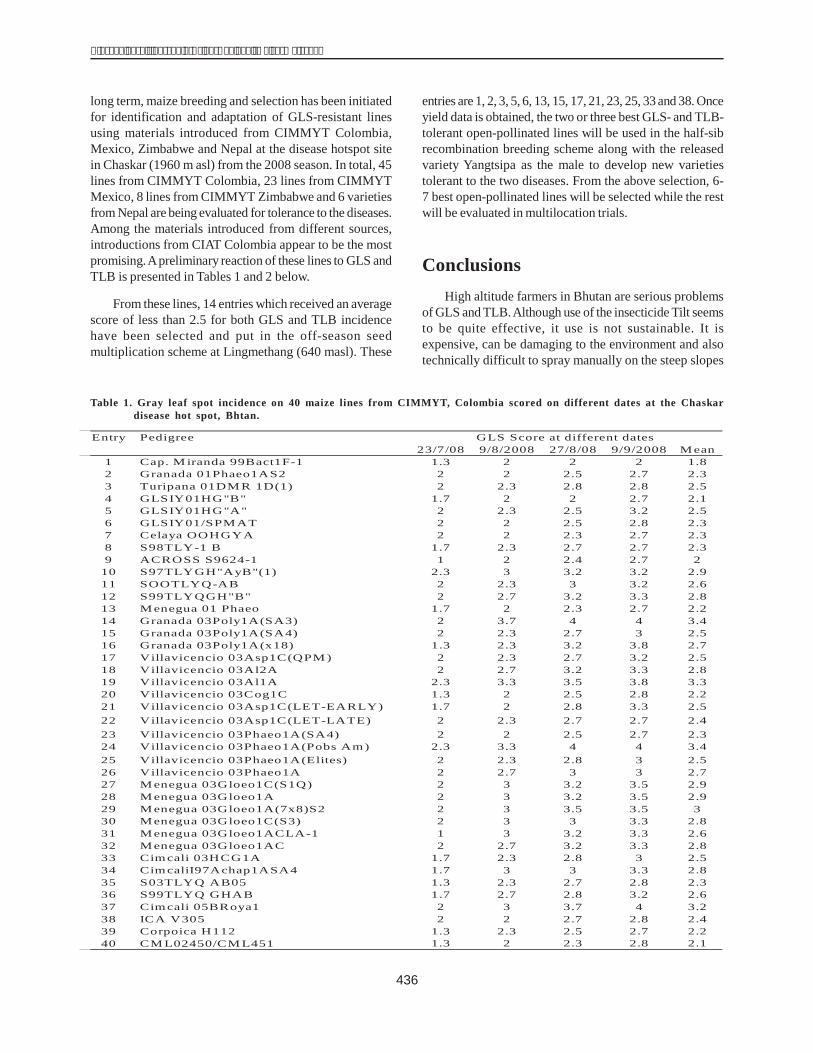
436
������� �� �� ����� ������� ����� ���������������
long term, maize breeding and selection has been initiatedfor identification and adaptation of GLS-resistant linesusing materials introduced from CIMMYT Colombia,Mexico, Zimbabwe and Nepal at the disease hotspot sitein Chaskar (1960 m asl) from the 2008 season. In total, 45lines from CIMMYT Colombia, 23 lines from CIMMYTMexico, 8 lines from CIMMYT Zimbabwe and 6 varietiesfrom Nepal are being evaluated for tolerance to the diseases.Among the materials introduced from different sources,introductions from CIAT Colombia appear to be the mostpromising.Apreliminary reaction of these lines to GLS andTLB is presented in Tables 1 and 2 below.
From these lines, 14 entries which received an averagescore of less than 2.5 for both GLS and TLB incidencehave been selected and put in the off-season seedmultiplication scheme at Lingmethang (640 masl). These
entries are 1, 2, 3, 5, 6, 13, 15, 17, 21, 23, 25, 33 and 38. Onceyield data is obtained, the two or three best GLS- and TLB-tolerant open-pollinated lines will be used in the half-sibrecombination breeding scheme along with the releasedvariety Yangtsipa as the male to develop new varietiestolerant to the two diseases. From the above selection, 6-7 best open-pollinated lines will be selected while the restwill be evaluated in multilocation trials.
ConclusionsHigh altitude farmers in Bhutan are serious problems
of GLS and TLB.Although use of the insecticide Tilt seemsto be quite effective, it use is not sustainable. It isexpensive, can be damaging to the environment and alsotechnically difficult to spray manually on the steep slopes
Table 1. Gray leaf spot incidence on 40 maize lines from CIMMYT, Colombia scored on different dates at the Chaskardisease hot spot, Bhtan.
23/7/08 9/8/2008 27/8/08 9/9/2008 M ean1 Cap. M iranda 99Bact1F-1 1.3 2 2 2 1.82 Granada 01Phaeo1AS2 2 2 2.5 2.7 2.33 Turipana 01DM R 1D(1) 2 2.3 2.8 2.8 2.54 GLSIY01HG"B" 1.7 2 2 2.7 2.15 GLSIY01HG"A" 2 2.3 2.5 3.2 2.56 GLSIY01/SPM AT 2 2 2.5 2.8 2.37 Celaya OOHGYA 2 2 2.3 2.7 2.38 S98TLY-1 B 1.7 2.3 2.7 2.7 2.39 ACROSS S9624-1 1 2 2.4 2.7 2
10 S97TLYGH"AyB"(1) 2.3 3 3.2 3.2 2.911 SOOTLYQ-AB 2 2.3 3 3.2 2.612 S99TLYQGH"B" 2 2.7 3.2 3.3 2.813 M enegua 01 Phaeo 1.7 2 2.3 2.7 2.214 Granada 03Poly1A(SA3) 2 3.7 4 4 3.415 Granada 03Poly1A(SA4) 2 2.3 2.7 3 2.516 Granada 03Poly1A(x18) 1.3 2.3 3.2 3.8 2.717 Villavicencio 03Asp1C(QPM ) 2 2.3 2.7 3.2 2.518 Villavicencio 03Al2A 2 2.7 3.2 3.3 2.819 Villavicencio 03Al1A 2.3 3.3 3.5 3.8 3.320 Villavicencio 03Cog1C 1.3 2 2.5 2.8 2.221 Villavicencio 03Asp1C(LET-EARLY) 1.7 2 2.8 3.3 2.522 Villavicencio 03Asp1C(LET-LATE) 2 2.3 2.7 2.7 2.423 Villavicencio 03Phaeo1A(SA4) 2 2 2.5 2.7 2.324 Villavicencio 03Phaeo1A(Pobs Am) 2.3 3.3 4 4 3.425 Villavicencio 03Phaeo1A(Elites) 2 2.3 2.8 3 2.526 Villavicencio 03Phaeo1A 2 2.7 3 3 2.727 M enegua 03Gloeo1C(S1Q) 2 3 3.2 3.5 2.928 M enegua 03Gloeo1A 2 3 3.2 3.5 2.929 M enegua 03Gloeo1A(7x8)S2 2 3 3.5 3.5 330 M enegua 03Gloeo1C(S3) 2 3 3 3.3 2.831 M enegua 03Gloeo1ACLA-1 1 3 3.2 3.3 2.632 M enegua 03Gloeo1AC 2 2.7 3.2 3.3 2.833 Cimcali 03HCG1A 1.7 2.3 2.8 3 2.534 CimcaliI97Achap1ASA4 1.7 3 3 3.3 2.835 S03TLYQ AB05 1.3 2.3 2.7 2.8 2.336 S99TLYQ GHAB 1.7 2.7 2.8 3.2 2.637 Cimcali 05BRoya1 2 3 3.7 4 3.238 ICA V305 2 2 2.7 2.8 2.439 Corpoica H112 1.3 2.3 2.5 2.7 2.240 CM L02450/CM L451 1.3 2 2.3 2.8 2.1
Entry Pedigree GLS Score at different dates
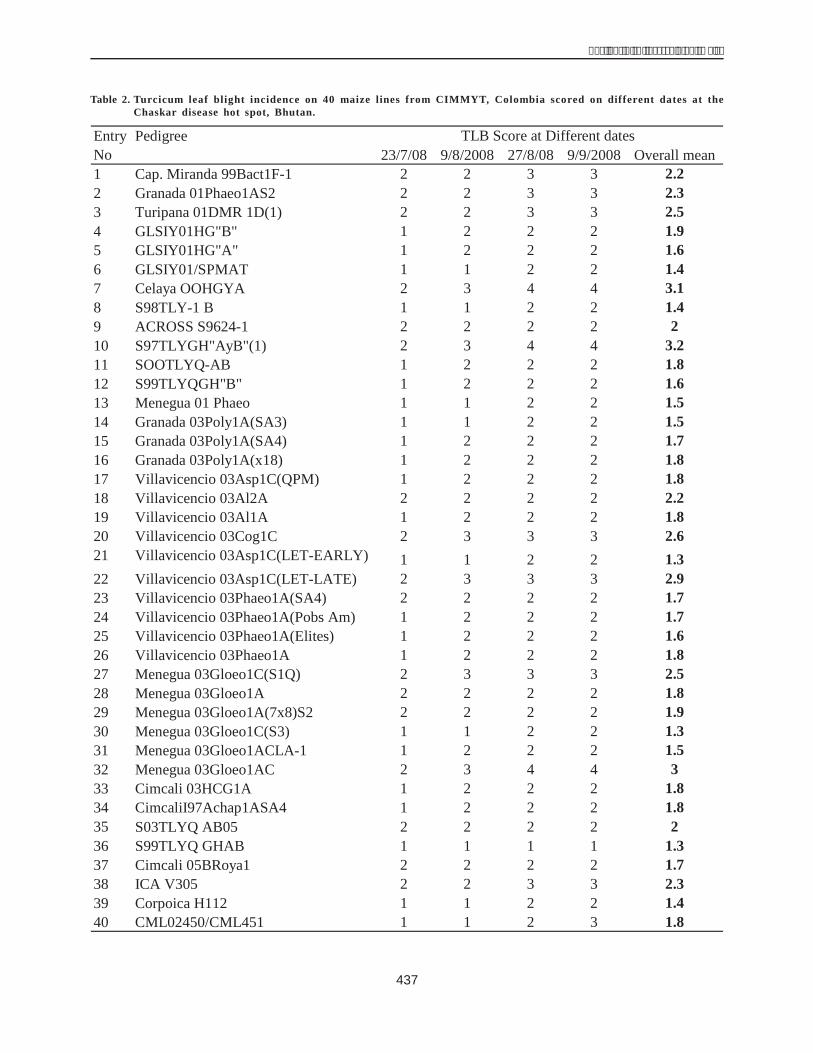
437
����� � ���� ����������� �������
Table 2. Turcicum leaf blight incidence on 40 maize lines from CIMMYT, Colombia scored on different dates at theChaskar disease hot spot, Bhutan.
23/7/08 9/8/2008 27/8/08 9/9/2008 Overall mean1 Cap. Miranda 99Bact1F-1 2 2 3 3 2.22 Granada 01Phaeo1AS2 2 2 3 3 2.33 Turipana 01DMR 1D(1) 2 2 3 3 2.54 GLSIY01HG"B" 1 2 2 2 1.95 GLSIY01HG"A" 1 2 2 2 1.66 GLSIY01/SPMAT 1 1 2 2 1.47 Celaya OOHGYA 2 3 4 4 3.18 S98TLY-1 B 1 1 2 2 1.49 ACROSS S9624-1 2 2 2 2 210 S97TLYGH"AyB"(1) 2 3 4 4 3.211 SOOTLYQ-AB 1 2 2 2 1.812 S99TLYQGH"B" 1 2 2 2 1.613 Menegua 01 Phaeo 1 1 2 2 1.514 Granada 03Poly1A(SA3) 1 1 2 2 1.515 Granada 03Poly1A(SA4) 1 2 2 2 1.716 Granada 03Poly1A(x18) 1 2 2 2 1.817 Villavicencio 03Asp1C(QPM) 1 2 2 2 1.818 Villavicencio 03Al2A 2 2 2 2 2.219 Villavicencio 03Al1A 1 2 2 2 1.820 Villavicencio 03Cog1C 2 3 3 3 2.621 Villavicencio 03Asp1C(LET-EARLY) 1 1 2 2 1.322 Villavicencio 03Asp1C(LET-LATE) 2 3 3 3 2.923 Villavicencio 03Phaeo1A(SA4) 2 2 2 2 1.724 Villavicencio 03Phaeo1A(Pobs Am) 1 2 2 2 1.725 Villavicencio 03Phaeo1A(Elites) 1 2 2 2 1.626 Villavicencio 03Phaeo1A 1 2 2 2 1.827 Menegua 03Gloeo1C(S1Q) 2 3 3 3 2.528 Menegua 03Gloeo1A 2 2 2 2 1.829 Menegua 03Gloeo1A(7x8)S2 2 2 2 2 1.930 Menegua 03Gloeo1C(S3) 1 1 2 2 1.331 Menegua 03Gloeo1ACLA-1 1 2 2 2 1.532 Menegua 03Gloeo1AC 2 3 4 4 333 Cimcali 03HCG1A 1 2 2 2 1.834 CimcaliI97Achap1ASA4 1 2 2 2 1.835 S03TLYQ AB05 2 2 2 2 236 S99TLYQ GHAB 1 1 1 1 1.337 Cimcali 05BRoya1 2 2 2 2 1.738 ICA V305 2 2 3 3 2.339 Corpoica H112 1 1 2 2 1.440 CML02450/CML451 1 1 2 3 1.8
EntryNo
Pedigree TLB Score at Different dates

438
������� �� �� ����� ������� ����� ���������������
where most of the maize crop is grown in Bhutan. Themost sustainable option appears to be the use of resistantvarieties. Therefore, there is an urgent need to test anddevelop resistant varieties. This could only be achievedthrough technical guidance and support from the globaland regional maize programs.
AcknowledgementI am grateful to the Council of RNR Research of Bhutan
of the Ministry of Agriculture and the Royal Governmentof Bhutan for allowing me to participate in the 10th AsianRegional Maize Workshop by making funds available fromthe RNR Research Systems Support Project funded bySDC Helvetas. I am also grateful to CIMMYT for acceptingmy paper.
ReferencesDe Leon C. 2007. Report of Activities and Recommendations
on a Consultancy to Bhutan, 12-26 Aug, 2007, RNRResearch Centre, Bajo, Wangdiphodrang, Bhutan. Bhutan:Council of RNR Research of Bhutan.
Royal Government of Bhutan. 2007. Report on gray leaf spotand turcicum leaf blight outbreak in maize. Thimphu,Bhutan: Department of Agriculture, Ministry ofAgriculture, Royal Government of Bhutan.
Katwal T.B., Dem P., Chhetri G.B., Bockel L. and Punjabi M.2006. Maize commodity chain analysis: a workingdocument. Thimphu, Bhutan: Department of Agriculture,Ministry of Agriculture, Royal Government of Bhutan.
Bhtan poral: http://www.bhutan.gov.bt/government/abt_geography.php-
439
����� � ���� ����������� �������
IntroductionSpecial corn is a kind of maize having certain superiority
such as Quality Protein Maize (QPM) where its endospermcontains higher protein quality compared to normal corn.The quality protein maize can improve nutrient value ofbabies and their mothers (Vasal, 1994; Pixley and Bjarnason,1993). In several African countries, corn flour of QPM ismade as babies������!� �� �� �������������"� ������ �SouthAmerica named Tortilas (Sproule et. al, 2002).
In Indonesia, the quality protein maize is also improvedto support national programs i.e. food diversity and foodsafety. ICERI researcher had improved and evaluatedseveral QPM genotypes. One of evaluated QPM that hadbeen conducted was its resistance to the major corn pestsparticularly seedling fly.
Seedling fly (Atherigona sp.) is one of the bioticfactors causing unsteadiness of maize production inIndonesia. It could damage corn plantation up to 100%(Kalshoven, 1981; CPC, 2001). The efforts to control thispest involve the use of egg parasitoid like Trichogrammaspp., change of planting time, crop rotation, and applicationof insecticides. But the use of the resistant variety is moreeffective and efficient in controlling this pest.
The study of resistance evaluation of the QPM maizegenotypes is a part of the technology components to create
the resistant variety to seedling fly. The study aimed toevaluate the resistance of QPM maize genotypes toseedling fly.
Material and MethodsThe research was carried out on Muneng Experimental
Farm, Probolinggo, East Java from August till December2006. Fifty two genotypes of S2-S4 white and yellow QPMmaize including Srikandi Putih-1 as resistant check andBayu as susceptible check for the white QPM maizegenotypes and Srikandi Kuning-1 as resistant check andLamuru as susceptible check for the yellow QPM maizegenotypes were evaluated and arranged on simple latticedesign 10 x 10 with 2 replications. Each genotype wastreated by matalaksil and carbofuran to prevent downymildew disease and pest infestation and planted on 2.5 mof single row plot. Planting distance was 75 cm x 20 cmwith two seeds/hill, and then remained one plant per hill at3 weeks after planting. About two weeks before plantingthe evaluated genotypes, the susceptible variety wasplanted as border crop and seedling fly infestation sourceto the evaluated genotypes. Parameters observed wereinfestation (percentage of infestation (%) indicatedresistance level of QPM genotypes), plant height (cm),and ear height (cm). Percentage of infestation wasdetermined by formula, as fallow:
Resistance evaluation of quality protein maize (QPM)genotypes to seedling fly (Atherigona sp.)
A.M.AdnanandYasinHG.Indonesian Cereals Research Institute (ICeRI), Jln. Dr. Sam Ratulangi, no. 274, Maros, South Sulawesi, Indonesia. 90514,E-mail: [email protected]
Abstract. Seedling fly (Atherigona sp.) is one of the biotic factors causing unsteadiness of maize production inIndonesia. The use of the resistant variety is more effective and efficient in controlling this pest. The study ofresistance evaluation of the QPM genotypes is a part of the technology components to create the resistant varietyto seedling fly. The study aimed to evaluate the resistance of QPM genotypes to seedling fly. The research wascarried out on Muneng Experimental Farm, Probolinggo, East Java from August till December 2006. Fifty genotypesof white and yellow QPM genotypes including Srikandi Putih-1 as resistant check and Bayu as susceptible check forthe white QPM genotypes and Srikandi Kuning-1 as resistant check and Lamuru as susceptible check for the yellowQPM maize genotypes were evaluated and arranged on simple lattice design 10 x 10 with 2 replications. The resultshowed that 4 of white QPM genotypes had 0% of infestation i.e. MSQ-P1(S1)-C1-11, MSQ-P1(S1)-C1-12, MSQ-P1(S1)-C1-44, and MSQ-P1(S1)-C1-45, while Srikandi Putih-1 as resistant check and Bayu as susceptible checkhad 0% and 20% of infestation, respectively, and 3 of yellow QPM genotypes i.e. MSQ-K1(S1)-C1-16, MSQ-K1(S1)-C1-35, and MSQ-K1(S1)-C1-50 had 0% of infestation.
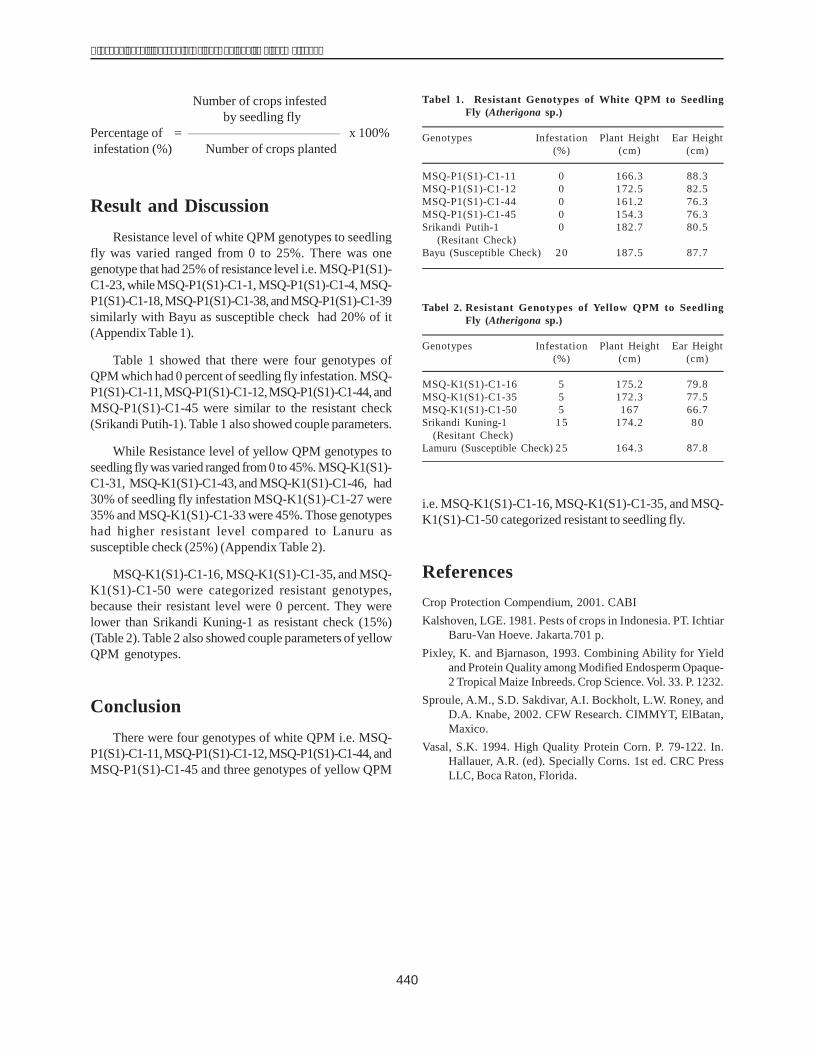
440
������� �� �� ����� ������� ����� ���������������
Number of crops infestedby seedling fly
Percentage of = x 100%infestation (%) Number of crops planted
Result and DiscussionResistance level of white QPM genotypes to seedling
fly was varied ranged from 0 to 25%. There was onegenotype that had 25% of resistance level i.e. MSQ-P1(S1)-C1-23, while MSQ-P1(S1)-C1-1, MSQ-P1(S1)-C1-4, MSQ-P1(S1)-C1-18,MSQ-P1(S1)-C1-38, and MSQ-P1(S1)-C1-39similarly with Bayu as susceptible check had 20% of it(Appendix Table 1).
Table 1 showed that there were four genotypes ofQPM which had 0 percent of seedling fly infestation. MSQ-P1(S1)-C1-11,MSQ-P1(S1)-C1-12,MSQ-P1(S1)-C1-44, andMSQ-P1(S1)-C1-45 were similar to the resistant check(Srikandi Putih-1). Table 1 also showed couple parameters.
While Resistance level of yellow QPM genotypes toseedling fly was varied ranged from 0 to 45%. MSQ-K1(S1)-C1-31, MSQ-K1(S1)-C1-43, and MSQ-K1(S1)-C1-46, had30% of seedling fly infestation MSQ-K1(S1)-C1-27 were35% and MSQ-K1(S1)-C1-33 were 45%. Those genotypeshad higher resistant level compared to Lanuru assusceptible check (25%) (Appendix Table 2).
MSQ-K1(S1)-C1-16, MSQ-K1(S1)-C1-35, and MSQ-K1(S1)-C1-50 were categorized resistant genotypes,because their resistant level were 0 percent. They werelower than Srikandi Kuning-1 as resistant check (15%)(Table 2). Table 2 also showed couple parameters of yellowQPM genotypes.
ConclusionThere were four genotypes of white QPM i.e. MSQ-
P1(S1)-C1-11,MSQ-P1(S1)-C1-12,MSQ-P1(S1)-C1-44, andMSQ-P1(S1)-C1-45 and three genotypes of yellow QPM
i.e. MSQ-K1(S1)-C1-16, MSQ-K1(S1)-C1-35, and MSQ-K1(S1)-C1-50 categorized resistant to seedling fly.
ReferencesCrop Protection Compendium, 2001. CABIKalshoven, LGE. 1981. Pests of crops in Indonesia. PT. Ichtiar
Baru-Van Hoeve. Jakarta.701 p.Pixley, K. and Bjarnason, 1993. Combining Ability for Yield
and Protein Quality among Modified Endosperm Opaque-2 Tropical Maize Inbreeds. Crop Science. Vol. 33. P. 1232.
Sproule, A.M., S.D. Sakdivar, A.I. Bockholt, L.W. Roney, andD.A. Knabe, 2002. CFW Research. CIMMYT, ElBatan,Maxico.
Vasal, S.K. 1994. High Quality Protein Corn. P. 79-122. In.Hallauer, A.R. (ed). Specially Corns. 1st ed. CRC PressLLC, Boca Raton, Florida.
Tabel 1. Resistant Genotypes of White QPM to SeedlingFly (Atherigona sp.)
Genotypes Infestation Plant Height Ear Height(%) (cm) (cm)
MSQ-P1(S1)-C1-11 0 166.3 88.3MSQ-P1(S1)-C1-12 0 172.5 82.5MSQ-P1(S1)-C1-44 0 161.2 76.3MSQ-P1(S1)-C1-45 0 154.3 76.3Srikandi Putih-1 0 182.7 80.5
(Resitant Check)Bayu (Susceptible Check) 20 187.5 87.7
Tabel 2. Resistant Genotypes of Yellow QPM to SeedlingFly (Atherigona sp.)
Genotypes Infestation Plant Height Ear Height(%) (cm) (cm)
MSQ-K1(S1)-C1-16 5 175.2 79.8MSQ-K1(S1)-C1-35 5 172.3 77.5MSQ-K1(S1)-C1-50 5 167 66.7Srikandi Kuning-1 15 174.2 80
(Resitant Check)Lamuru (Susceptible Check) 25 164.3 87.8
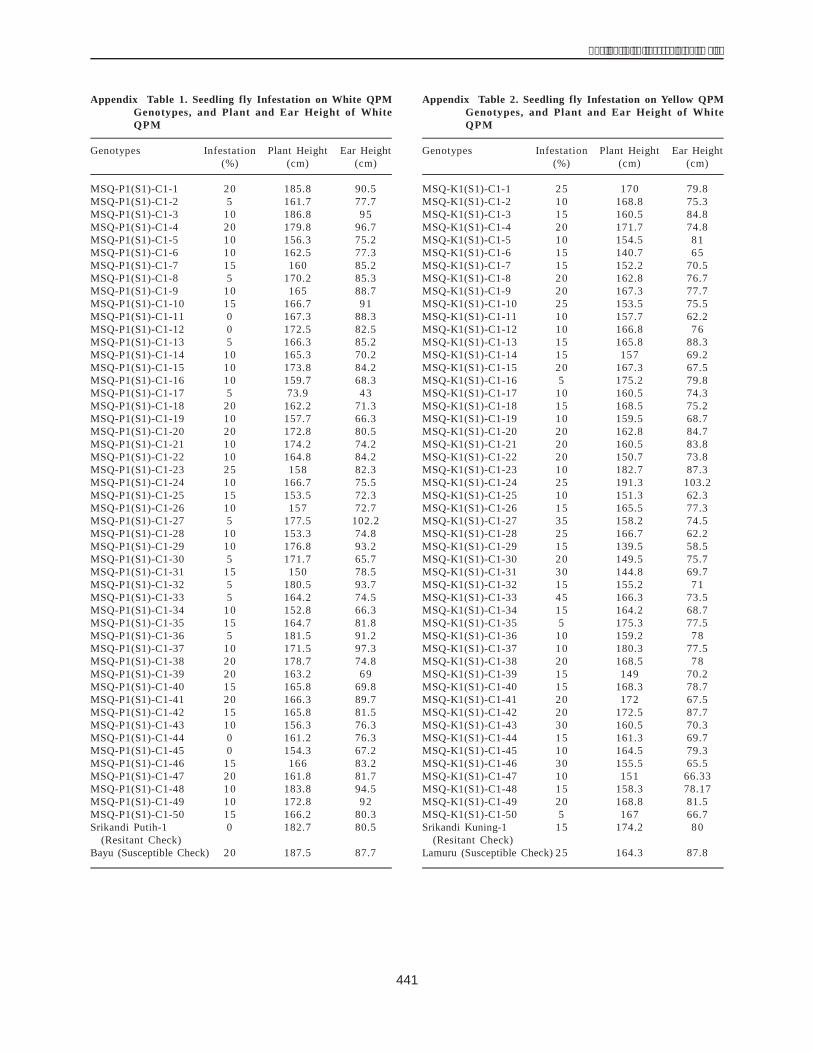
441
����� � ���� ����������� �������
Appendix Table 1. Seedling fly Infestation on White QPMGenotypes, and Plant and Ear Height of WhiteQPM
Genotypes Infestation Plant Height Ear Height(%) (cm) (cm)
MSQ-P1(S1)-C1-1 20 185.8 90.5MSQ-P1(S1)-C1-2 5 161.7 77.7MSQ-P1(S1)-C1-3 10 186.8 95MSQ-P1(S1)-C1-4 20 179.8 96.7MSQ-P1(S1)-C1-5 10 156.3 75.2MSQ-P1(S1)-C1-6 10 162.5 77.3MSQ-P1(S1)-C1-7 15 160 85.2MSQ-P1(S1)-C1-8 5 170.2 85.3MSQ-P1(S1)-C1-9 10 165 88.7MSQ-P1(S1)-C1-10 15 166.7 91MSQ-P1(S1)-C1-11 0 167.3 88.3MSQ-P1(S1)-C1-12 0 172.5 82.5MSQ-P1(S1)-C1-13 5 166.3 85.2MSQ-P1(S1)-C1-14 10 165.3 70.2MSQ-P1(S1)-C1-15 10 173.8 84.2MSQ-P1(S1)-C1-16 10 159.7 68.3MSQ-P1(S1)-C1-17 5 73.9 43MSQ-P1(S1)-C1-18 20 162.2 71.3MSQ-P1(S1)-C1-19 10 157.7 66.3MSQ-P1(S1)-C1-20 20 172.8 80.5MSQ-P1(S1)-C1-21 10 174.2 74.2MSQ-P1(S1)-C1-22 10 164.8 84.2MSQ-P1(S1)-C1-23 25 158 82.3MSQ-P1(S1)-C1-24 10 166.7 75.5MSQ-P1(S1)-C1-25 15 153.5 72.3MSQ-P1(S1)-C1-26 10 157 72.7MSQ-P1(S1)-C1-27 5 177.5 102.2MSQ-P1(S1)-C1-28 10 153.3 74.8MSQ-P1(S1)-C1-29 10 176.8 93.2MSQ-P1(S1)-C1-30 5 171.7 65.7MSQ-P1(S1)-C1-31 15 150 78.5MSQ-P1(S1)-C1-32 5 180.5 93.7MSQ-P1(S1)-C1-33 5 164.2 74.5MSQ-P1(S1)-C1-34 10 152.8 66.3MSQ-P1(S1)-C1-35 15 164.7 81.8MSQ-P1(S1)-C1-36 5 181.5 91.2MSQ-P1(S1)-C1-37 10 171.5 97.3MSQ-P1(S1)-C1-38 20 178.7 74.8MSQ-P1(S1)-C1-39 20 163.2 69MSQ-P1(S1)-C1-40 15 165.8 69.8MSQ-P1(S1)-C1-41 20 166.3 89.7MSQ-P1(S1)-C1-42 15 165.8 81.5MSQ-P1(S1)-C1-43 10 156.3 76.3MSQ-P1(S1)-C1-44 0 161.2 76.3MSQ-P1(S1)-C1-45 0 154.3 67.2MSQ-P1(S1)-C1-46 15 166 83.2MSQ-P1(S1)-C1-47 20 161.8 81.7MSQ-P1(S1)-C1-48 10 183.8 94.5MSQ-P1(S1)-C1-49 10 172.8 92MSQ-P1(S1)-C1-50 15 166.2 80.3Srikandi Putih-1 0 182.7 80.5
(Resitant Check)Bayu (Susceptible Check) 20 187.5 87.7
Appendix Table 2. Seedling fly Infestation on Yellow QPMGenotypes, and Plant and Ear Height of WhiteQPM
Genotypes Infestation Plant Height Ear Height(%) (cm) (cm)
MSQ-K1(S1)-C1-1 25 170 79.8MSQ-K1(S1)-C1-2 10 168.8 75.3MSQ-K1(S1)-C1-3 15 160.5 84.8MSQ-K1(S1)-C1-4 20 171.7 74.8MSQ-K1(S1)-C1-5 10 154.5 81MSQ-K1(S1)-C1-6 15 140.7 65MSQ-K1(S1)-C1-7 15 152.2 70.5MSQ-K1(S1)-C1-8 20 162.8 76.7MSQ-K1(S1)-C1-9 20 167.3 77.7MSQ-K1(S1)-C1-10 25 153.5 75.5MSQ-K1(S1)-C1-11 10 157.7 62.2MSQ-K1(S1)-C1-12 10 166.8 76MSQ-K1(S1)-C1-13 15 165.8 88.3MSQ-K1(S1)-C1-14 15 157 69.2MSQ-K1(S1)-C1-15 20 167.3 67.5MSQ-K1(S1)-C1-16 5 175.2 79.8MSQ-K1(S1)-C1-17 10 160.5 74.3MSQ-K1(S1)-C1-18 15 168.5 75.2MSQ-K1(S1)-C1-19 10 159.5 68.7MSQ-K1(S1)-C1-20 20 162.8 84.7MSQ-K1(S1)-C1-21 20 160.5 83.8MSQ-K1(S1)-C1-22 20 150.7 73.8MSQ-K1(S1)-C1-23 10 182.7 87.3MSQ-K1(S1)-C1-24 25 191.3 103.2MSQ-K1(S1)-C1-25 10 151.3 62.3MSQ-K1(S1)-C1-26 15 165.5 77.3MSQ-K1(S1)-C1-27 35 158.2 74.5MSQ-K1(S1)-C1-28 25 166.7 62.2MSQ-K1(S1)-C1-29 15 139.5 58.5MSQ-K1(S1)-C1-30 20 149.5 75.7MSQ-K1(S1)-C1-31 30 144.8 69.7MSQ-K1(S1)-C1-32 15 155.2 71MSQ-K1(S1)-C1-33 45 166.3 73.5MSQ-K1(S1)-C1-34 15 164.2 68.7MSQ-K1(S1)-C1-35 5 175.3 77.5MSQ-K1(S1)-C1-36 10 159.2 78MSQ-K1(S1)-C1-37 10 180.3 77.5MSQ-K1(S1)-C1-38 20 168.5 78MSQ-K1(S1)-C1-39 15 149 70.2MSQ-K1(S1)-C1-40 15 168.3 78.7MSQ-K1(S1)-C1-41 20 172 67.5MSQ-K1(S1)-C1-42 20 172.5 87.7MSQ-K1(S1)-C1-43 30 160.5 70.3MSQ-K1(S1)-C1-44 15 161.3 69.7MSQ-K1(S1)-C1-45 10 164.5 79.3MSQ-K1(S1)-C1-46 30 155.5 65.5MSQ-K1(S1)-C1-47 10 151 66.33MSQ-K1(S1)-C1-48 15 158.3 78.17MSQ-K1(S1)-C1-49 20 168.8 81.5MSQ-K1(S1)-C1-50 5 167 66.7Srikandi Kuning-1 15 174.2 80
(Resitant Check)Lamuru (Susceptible Check) 25 164.3 87.8
442
������� �� �� ����� ������� ����� ���������������
IntroductionMaize is a cereal holding important role in fulfilling
feed and food need in the world. The maize demand eitherthe world or Indonesia always increases. USDA (2007)reported that production, consumption, and world maizestock were 706,236 MT, 680,472 MT, and 125,914 MT,respectively. Meanwhile, national maize production andconsumption of maize were 6,500 MT and 7,200 MT,respectively. Based on the data, the Indonesiangovernment and farmers have to be attempted to improvethe maize production.
In 2007, Indonesian government proclaimed three foodcrop priority i.e. rice, maize, and soybean which are expectedself sufficient until 2015, so that they can fulfill nationaldemand. Particularly, maize was expected self-sufficient in2007 with production target as many as 13.54 million ton(Biro Perencanaan Departemen Pertanian, 2006).
Nevertheless, the target can not sometimes be accieveddue to abiotic and biotic constraints. The most abioticconstraint is low availablity of soil nutrient and the bioticcontraint is weeds, diseases, and pests (Subandi et al,1988). One of the maize pests isAsian corn borer (Ostriniafurnacalis) and its damage could be up to 80% of yieldlosses.
Several practices to control this insect pest havealready been utilized. The most popular farmer�������� ��
is the use of insecticides. Unfortunately, these havenegative impact not only on the environment but on humanbeings as well.
One control practice to control this pest that does notcause negative environmental effect is the use of biologicalcontrol agents such as parasite, fungi, virus, nematode orpredator. The predator as a biological control agent hasseveral advantages. These advantages are: 1) non-polluting meaning that the use of predator isenvironmentally safe and acceptable; 2) in application, itcan be combined with other bio-control agents; and 3)easy to mass produce. Earwig (Euborellia annulata) isone of predators that can be applied as biological controlagent against O. furnavalis. The objective of this studywas to give information about earwig as the promisingbiological control agent against Asian corn borer. Thispaper is a review of several studies carried out byresearchers of Indonesian Cereals Research Institute(ICERI).
Biology of Earwig
Study of earwig biology has been conducted inLaboratory of Pests and Diseases, Indonesian CerealsResearch Institute (ICERI), Maros, South Sulawesi since2004. The study results carried out by ICERI researchesexplained that the female adult of E. annulata laid its eggsin colony with oval shape and white color (Fig. 1).
Earwig (Euborellia annulata) as the promising biologicalcontrol agent against asian corn borer
A.M.Adnan1) andM. Taufik2)
1)Indonesian Cereals Research Institute (ICERI), Jln. Dr. Sam Ratulangi, no. 274, Maros, South Sulawesi, Indonesia. 90514,E-mail: [email protected]
2)Departement of Pests and Plant Diseases, Faculty of Agriculture, University of Haluoleo, Kendari, South East Sulawesi
Abstract. Maize is a cereal holding important role in fulfilling feed and food need in the world. The maize demandeither the world or Indonesia always increase. Therefore, Indonesian government and farmers attempt to improvetheir maize production. Nevertheless, the maize pests (Asian Corn Borer, Ostrinia furnacalis) often become constraintfactor to maintained. O. Furnacalis damage could be up to 80% of yield losses. However, this pest can be controledby utilizing natural enemy. The objective of this study was to give information about earwig as the promisingbiological control agent against Asian corn borer. This paper is a review of several studies carried out by researchersof Indonesian Cereals Research Institute (ICERI) The results reported that the use of alterntive diet such as the dogbiscuit gave significant effect to the development of this natural enemy and earwig gave significant effect incontroling Asian Corn Borer (ACB). It can be concluded that E. annulata promises as biological contol agent becauseof easy to understand biology, easy to mass produce, and effective to control ACB.
Keywords : Earwig, Promising Bio-control Agent, Asian Corn Borer
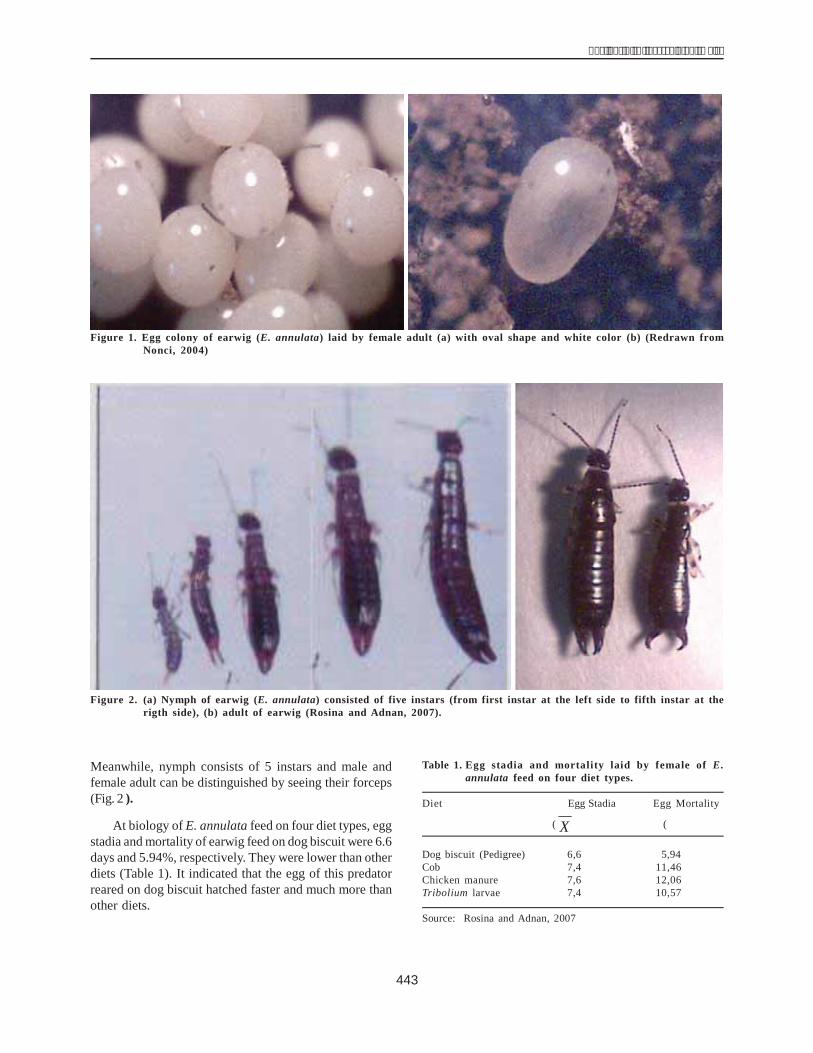
443
����� � ���� ����������� �������
Table 1. Egg stadia and mortality laid by female of E.annulata feed on four diet types.
Diet Egg Stadia Egg Mortality
( X 6� !0��0�"�+ (6�!0���+
Dog biscuit (Pedigree) 6,6 6� ��;) 5,94 6� ��7;Cob 7,4 6� ��;) 11,46 6� ���;Chicken manure 7,6 6� ��$$ 12,06 6� $�;)Tribolium larvae 7,4 6� ��$$ 10,57 6� >���
Source: Rosina and Adnan, 2007
Figure 1. Egg colony of earwig (E. annulata) laid by female adult (a) with oval shape and white color (b) (Redrawn fromNonci, 2004)
Meanwhile, nymph consists of 5 instars and male andfemale adult can be distinguished by seeing their forceps(Fig. 2 ).
At biology of E. annulata feed on four diet types, eggstadia and mortality of earwig feed on dog biscuit were 6.6days and 5.94%, respectively. They were lower than otherdiets (Table 1). It indicated that the egg of this predatorreared on dog biscuit hatched faster and much more thanother diets.
Figure 2. (a) Nymph of earwig (E. annulata) consisted of five instars (from first instar at the left side to fifth instar at therigth side), (b) adult of earwig (Rosina and Adnan, 2007).
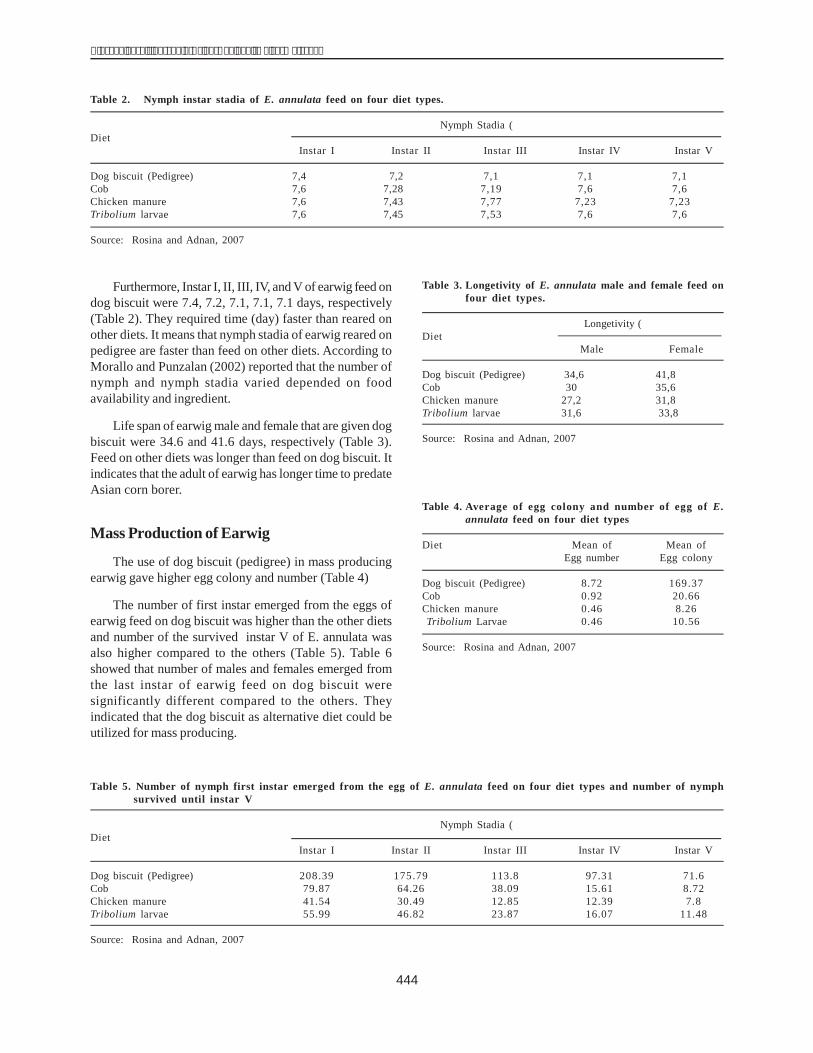
444
������� �� �� ����� ������� ����� ���������������
Furthermore, Instar I, II, III, IV, and V of earwig feed ondog biscuit were 7.4, 7.2, 7.1, 7.1, 7.1 days, respectively(Table 2). They required time (day) faster than reared onother diets. It means that nymph stadia of earwig reared onpedigree are faster than feed on other diets. According toMorallo and Punzalan (2002) reported that the number ofnymph and nymph stadia varied depended on foodavailability and ingredient.
Life span of earwig male and female that are given dogbiscuit were 34.6 and 41.6 days, respectively (Table 3).Feed on other diets was longer than feed on dog biscuit. Itindicates that the adult of earwig has longer time to predateAsian corn borer.
Mass Production of Earwig
The use of dog biscuit (pedigree) in mass producingearwig gave higher egg colony and number (Table 4)
The number of first instar emerged from the eggs ofearwig feed on dog biscuit was higher than the other dietsand number of the survived instar V of E. annulata wasalso higher compared to the others (Table 5). Table 6showed that number of males and females emerged fromthe last instar of earwig feed on dog biscuit weresignificantly different compared to the others. Theyindicated that the dog biscuit as alternative diet could beutilized for mass producing.
Table 3. Longetivity of E. annulata male and female feed onfour diet types.
Longetivity (6�!0��0�"�+Diet
Male Female
Dog biscuit (Pedigree) 34,6 6� )�$� 41,8 6� ���*�Cob 30 6� ����* 35,6 6� �����Chicken manure 27,2 6� ���7$ 31,8 6� �����Tribolium larvae 31,6 6� ���$� 33,8 6� )�;;
Source: Rosina and Adnan, 2007
Table 4. Average of egg colony and number of egg of E.annulata feed on four diet types
Diet Mean of Mean ofEgg number Egg colony
Dog biscuit (Pedigree) 8.72 169.37Cob 0.92 20.66Chicken manure 0.46 8.26Tribolium Larvae 0.46 10.56
Source: Rosina and Adnan, 2007
Table 2. Nymph instar stadia of E. annulata feed on four diet types.
Nymph Stadia (6� !0��0�"�+Diet
Instar I Instar II Instar III Instar IV Instar V
Dog biscuit (Pedigree) 7,4 6� ��$$ 7,2 6� ��* 7,16��*; 7,16��*; 7,16��*$Cob 7,6 6� ��$$ 7,28 6� ���; 7,196���$ 7,66��>� 7,66���;Chicken manure 7,6 6� ��$$ 7,43 6� ���$ 7,776��)� 7,236��;� 7,236��7*Tribolium larvae 7,6 6� ��$$ 7,45 6� ���) 7,536��7� 7,66��;7 7,66��;�
Source: Rosina and Adnan, 2007
Table 5. Number of nymph first instar emerged from the egg of E. annulata feed on four diet types and number of nymphsurvived until instar V
Nymph Stadia (6� !0��0�"�+Diet
Instar I Instar II Instar III Instar IV Instar V
Dog biscuit (Pedigree) 208.39 175.79 113.8 97.31 71.6Cob 79.87 64.26 38.09 15.61 8.72Chicken manure 41.54 30.49 12.85 12.39 7.8Tribolium larvae 55.99 46.82 23.87 16.07 11.48
Source: Rosina and Adnan, 2007
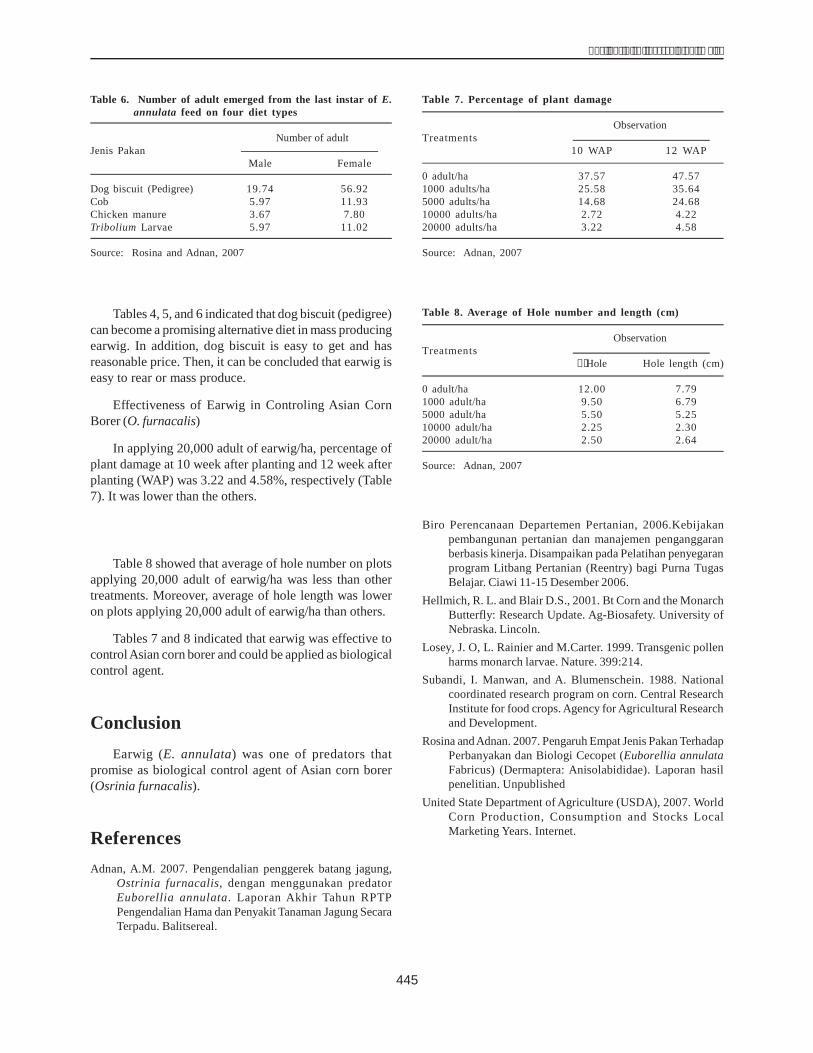
445
����� � ���� ����������� �������
Tables 4, 5, and 6 indicated that dog biscuit (pedigree)can become a promising alternative diet in mass producingearwig. In addition, dog biscuit is easy to get and hasreasonable price. Then, it can be concluded that earwig iseasy to rear or mass produce.
Effectiveness of Earwig in Controling Asian CornBorer (O. furnacalis)
In applying 20,000 adult of earwig/ha, percentage ofplant damage at 10 week after planting and 12 week afterplanting (WAP) was 3.22 and 4.58%, respectively (Table7). It was lower than the others.
Table 8 showed that average of hole number on plotsapplying 20,000 adult of earwig/ha was less than othertreatments. Moreover, average of hole length was loweron plots applying 20,000 adult of earwig/ha than others.
Tables 7 and 8 indicated that earwig was effective tocontrolAsian corn borer and could be applied as biologicalcontrol agent.
ConclusionEarwig (E. annulata) was one of predators that
promise as biological control agent of Asian corn borer(Osrinia furnacalis).
ReferencesAdnan, A.M. 2007. Pengendalian penggerek batang jagung,
Ostrinia furnacalis, dengan menggunakan predatorEuborellia annulata. Laporan Akhir Tahun RPTPPengendalian Hama dan Penyakit Tanaman Jagung SecaraTerpadu. Balitsereal.
Biro Perencanaan Departemen Pertanian, 2006.Kebijakanpembangunan pertanian dan manajemen penganggaranberbasis kinerja. Disampaikan pada Pelatihan penyegaranprogram Litbang Pertanian (Reentry) bagi Purna TugasBelajar. Ciawi 11-15 Desember 2006.
Hellmich, R. L. and Blair D.S., 2001. Bt Corn and the MonarchButterfly: Research Update. Ag-Biosafety. University ofNebraska. Lincoln.
Losey, J. O, L. Rainier and M.Carter. 1999. Transgenic pollenharms monarch larvae. Nature. 399:214.
Subandi, I. Manwan, and A. Blumenschein. 1988. Nationalcoordinated research program on corn. Central ResearchInstitute for food crops. Agency for Agricultural Researchand Development.
Rosina and Adnan. 2007. Pengaruh Empat Jenis Pakan TerhadapPerbanyakan dan Biologi Cecopet (Euborellia annulataFabricus) (Dermaptera: Anisolabididae). Laporan hasilpenelitian. Unpublished
United State Department of Agriculture (USDA), 2007. WorldCorn Production, Consumption and Stocks LocalMarketing Years. Internet.
Table 6. Number of adult emerged from the last instar of E.annulata feed on four diet types
Number of adultJenis Pakan
Male Female
Dog biscuit (Pedigree) 19.74 56.92Cob 5.97 11.93Chicken manure 3.67 7.80Tribolium Larvae 5.97 11.02
Source: Rosina and Adnan, 2007
Table 7. Percentage of plant damage
ObservationTreatments
10 WAP 12 WAP
0 adult/ha 37.57 47.571000 adults/ha 25.58 35.645000 adults/ha 14.68 24.6810000 adults/ha 2.72 4.2220000 adults/ha 3.22 4.58
Source: Adnan, 2007
Table 8. Average of Hole number and length (cm)
ObservationTreatments
��Hole Hole length (cm)
0 adult/ha 12.00 7.791000 adult/ha 9.50 6.795000 adult/ha 5.50 5.2510000 adult/ha 2.25 2.3020000 adult/ha 2.50 2.64
Source: Adnan, 2007
446
������� �� �� ����� ������� ����� ���������������
IntroductionThe use of fungi B. bassiana as biological control
agent of corn pests have been excessively done especiallyfor corn borer and earworm. This fungus can suppresscorn borer with mortality up to 84% (Bing and Lewis, 1993).In Maros, South Sulawesi, application of B. bassiana oncorn plant with concentration 5 x 10⁷ conidia/ml, interval 2days/week/month was effective to suppress corn borerinfestation and much better compared to use of carbofuranwith concentration 3% (application dosage 5.33 kg/h), aswell as it increased 80.7% of yield (Surtikanti, et. al., 1997).
Yasin, et. al. (1997) found that inoculation of B.bassiana with concentration 5 x 10⁵, 5 x 10⁶, and 5 x 10⁷
conidia/ml was effective to control corn borer larvae.Utilization of this fungus as one of IPM componentsbecome more important because several study resultsreported that B. bassiana was useful to hold back cornpests in the field.
According to Steinhaus (1967), the fungus B. bassianawas successful to infect insect pests. This fungus infectedtarget insect through cuticle, mouth, insect digestive andrespiration system. B.bassiana is easy to culture, simplymass production without sophisticated tool and relativelycheaper to culture (Soehardjan and Sudarmadji, 1993).
Favorable Factor for Fungus Growth
Three components i.e. pathogen, environment, andfood are the factor influencing white muscardine growth.The environmental factors affected are temperature,humidity, and light intensity. For temperature factor, B.bassiana can be growth at 20 ����oC with optimal growth23 ���$oC. Critical temperature that can hamper is 5oC and35oC and the fungus will die at 50oC. The optimal relativehumidity for fungus development is 70 ��������D������ ��and Khachatourians (1978) reported that B. bassiana gavehigher mortality of coffee borer at 98% relative humidity
Perspective performance of the entomopathogenic fungi,Beauveria bassiana, as an integrated pest management (IPM)component in corn pest handling
M.Yasin SaidandA.M.AdnanIndonesian Cereals Research Institute (ICERI), Jln. Dr. Sam Ratulangi, no. 274, Maros, South Sulawesi, Indonesia. 90514 ,E-mail: [email protected]
Abstract. The use of fungi B. bassiana as biological control agent of corn pests have been excessively doneespecially for corn borer and earworm. This fungus can suppress corn borer with mortality up to 84%. Threecomponents i.e. pathogen, environment, and food are the factor influencing white muscardine growth.Entomopathogenic fungi B. bassiana is ecto- and endoparasite. Spore or conidia of this fungus infects target insectthrough cuticle, mouth, insect digestion and respiratory. Stroage effect to fungal germination showed that viabilityabove 90% noticed on 2, 3 month storage, 12 days storage on PDA media and on corn media. Virulent test of severalB. bassiana isolates (Bb-1, Bb-3, Bb-6, Bb-7, Bb-23, Bb-24, Bb-27, Bb-30, Bb-31, Bb-32, Bb33, Bb-34, Bb36, Bb-40,Bb-41, Bb-46, Bb-47, Bb-90, Bb-51, and Bb-52) revealed difference of mortality range of corn borer. 100% ofmortality is noticed on isolates Bb-27, Bb-32, and Bb-34, mortality 80 ��/�1��������������7� "-�7� "6�7� -��7� 31, Bb-36, and Bb-46, and the others are ranged 60 �� #�1$� %��� ��������� ������ ��������� ��� ��� ���������treatment, existence of B. bassiana hyphae in root and stalk just seemed on month V ��8������������ �������������on month VI ��8��$�9����������������������������������� ��������������������8����������������&����������:��8���������������������:����8�����������$�!������&�����#�;!��������������������������&������������������&��������2, 3, 4, and 5 were significantly different to control. on observation bore number per stalk and tassel damage perplanting, all of concentrations were significantly different to control at either 7 or 9 WAP. Similarly on observation ofbore number/plant, drill length, and ear length, all of examined concentrations were significantly different to control,but on yield inspection, only concentration 5 x 10⁷ conidia/ml was significantly different to control. The result aboveindicated the promising potency of B. bassiana especially in controlling corn borer by selecting strain having highvirulence (Bb-27, Bb-31, and Bb-34) with concentration 5 x 10⁷ conidia/ml. it is preferably applied at egg laying periodof O. furnacalis (3 WAP, further application is 2 week interval). The achieved application result is better, if therelative humidity under plant canopy is <70%. The chance of B. bassiama applied as seed treatment can suppressinfestation of corn borer due to endophyt characteristic possessed by it.
Keywords: Perspective Performance, B. bassiana, Corn Pest Handling
447
����� � ���� ����������� �������
compared to at 0%, 50%, and 75%. In directed sunlightcondition, conidia or spore of white muscardine can onlysurvive 1 ������"���#����� � ���������������� �� sunlight can survive longer and has high viability.
Killing Mechanism of The Fungus To TargetInsect
Entomopathogenic fungi B. bassiana is ecto- andendoparasite. Spore or conidia of this fungus infects targetinsect through cuticle, mouth, insect digestion andrespiratory (Tanada and Kaya, 1983). Its spore penetratescuticle layer between head capsule and thorax, as well asamong body segments. Initial mechanism is started bydeveloping spore, it, then, forms hyphae and releasesenzyme chitinase, protease, and lipase that helpdisentangling insect cuticle. Penetration period is for 12 �24 hours. Mycelia grow in epidermis, then spread to a wholebody. The infected insect is signed by slow movement,motionless, and dead. The insect body becomemummification and is blanket by white hyphae.
Results of B. bassiana studytechnology
Storage Effect to B. bassiana Pathogenicity
Stroage effect to fungal germination showed thatviability above 90% noticed on 2, 3 month storage, 12 days
storage on PDA media and on corn media. The observationresult of conidia number seemed that the number of conidiabefore stored reached density 88 x 106 conidia/ml. After 1month storage, its density arrived at 99.2 x 10⁶ conidia/ml.Increasing of conidia number on treatments 2, 3, 4, 5, 6, 7,8, and 9 is same (108 x 106 conidia/ml). Pathogenicity ofthis fungus on observations 2, 4, 6, and 8 days afterinfection (DAI) is relatively low (0.00 ��$7�77�+�������observations 10 and 12 DAI, pathogenecity increases upto 96.67% (Table 1).
Virulent Test of Several B. bassiana Isolates
Virulent test of several B. bassiana isolates (Bb-1, Bb-3, Bb-6, Bb-7, Bb-23, Bb-24, Bb-27, Bb-30, Bb-31, Bb-32,Bb33, Bb-34,Bb36, Bb-40, Bb-41,Bb-46,Bb-47, Bb-90, Bb-51, and Bb-52) revealed difference of mortality range ofcorn borer. 100% of mortality is noticed on isolates Bb-27,Bb-32, and Bb-34, mortality 80 ��)��� �������������A�-���Bb-24, Bb-30, Bb-31, Bb-36, and Bb-46, and the others areranged 60 ��7����N��,�� ��� ���������!� ��� ������ ���>90% of viability is detected on treatment of alginate pelletstorage duration 2 months and the others are rangedbetween 50 and 80%. On mortality test, alginate pelletstorage duration 2 months is able to eradicate larva 83 �97%, while mortality on alginate pellet storage duration 4and 6 months is noticed 43 - 83%. The study result showedthat B. bassiana isolates Bb-27, Bb-32, and Bb-34 havehigh virulence (Table 2).
Table 1. Viability and Conidia Number of B. bassiana, and Mortality of Ostrinia furnacalis at 2, 4, 6, 8, 10, and 12 DAI
Observation (DAI)Treatments Viability Number of
(%) conidia/ml 2 4 6 8 10 12
Mortality (%)
1 90.60ab 99.2 x 10⁶ 16.67a 26.67a 36.67a 50.77a 73.33ab 93.33ab2 98.83ab 108 x 106 13.33ab 20.00a 33.33a 50.75a 70.00ab 90.00bc3 90.51b 108 x 106 13.33ab 20.00a 30.00ab 48.85a 66.67b 83.33bc4 90.37b 108 x 106 6.67abc 13.33ab 26.67ab 37.22b 50.00c 76.67cd5 81.79c 108 x 106 3.33bc 6.67bc 16.67b 30.79bc 33.33d 60.00d6 62.02d 108 x 106 3.33bc 3.33bc 6.67c 23.85cd 20.00e 26.67e7 46.30e 108 x 106 0.00c 0.00c 0.00d 15.17de 16.67ef 23.33e8 40.00f 108 x 106 0.00c 0.00c 0.00d 6.49e 10.00f 13.33e9 95.00a 108 x 106 20.00a 26.67a 36.67a 48.85a 80.70a 96.67a10 94.50ab 108 x 106 16.67a 23.33a 36.67a 50.77a 76.67ab 96.67a
Means with the same letter in the column are not significantly different at 5% level of significance by DMRTDAI = Days After Infection1 = 1 month storage 4 = 4 month storage 7 = 7 month storage2 = 2 month storage 5 = 5 month storage 8 = 8 month storage3 = 3 month storage 6 = 6 month storage 9 = 12 days storage on PDA10 = 12 days storage on maize mediaSource : Yasin et. al., (2000)
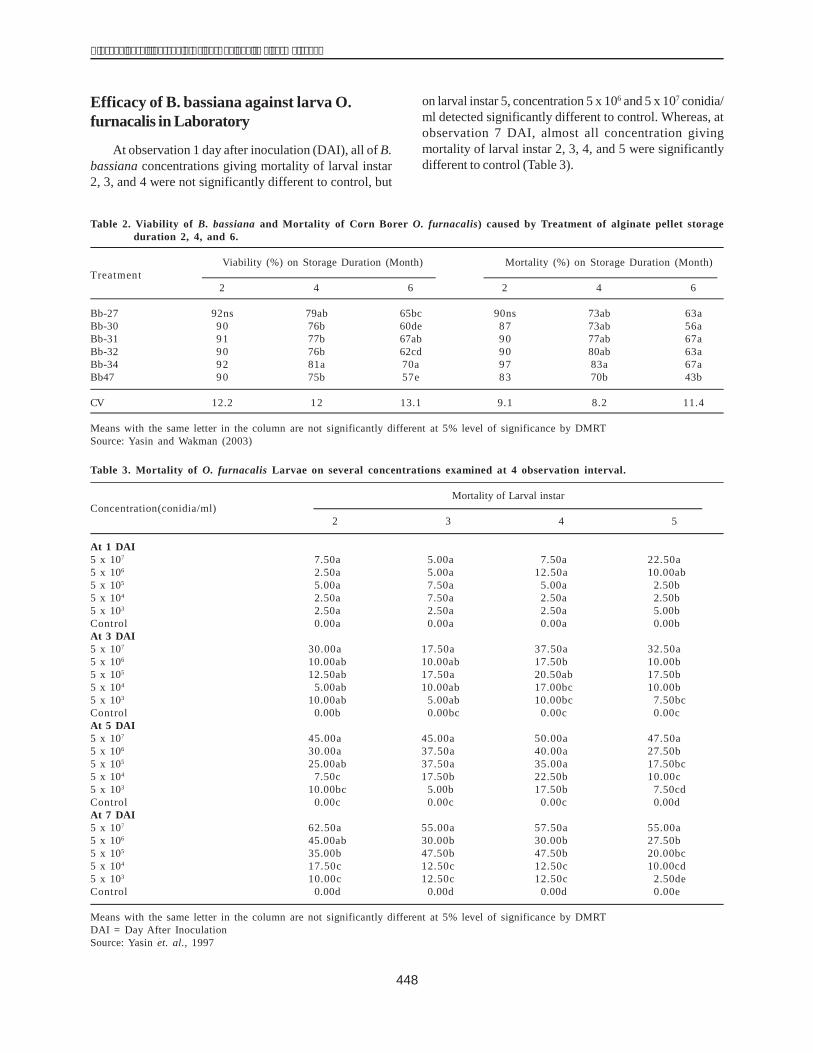
448
������� �� �� ����� ������� ����� ���������������
Table 2. Viability of B. bassiana and Mortality of Corn Borer O. furnacalis) caused by Treatment of alginate pellet storageduration 2, 4, and 6.
Viability (%) on Storage Duration (Month) Mortality (%) on Storage Duration (Month)Treatment
2 4 6 2 4 6
Bb-27 92ns 79ab 65bc 90ns 73ab 63aBb-30 90 76b 60de 87 73ab 56aBb-31 91 77b 67ab 90 77ab 67aBb-32 90 76b 62cd 90 80ab 63aBb-34 92 81a 70a 97 83a 67aBb47 90 75b 57e 83 70b 43b
CV 12.2 12 13.1 9.1 8.2 11.4
Means with the same letter in the column are not significantly different at 5% level of significance by DMRTSource: Yasin and Wakman (2003)
Table 3. Mortality of O. furnacalis Larvae on several concentrations examined at 4 observation interval.
Mortality of Larval instarConcentration(conidia/ml)
2 3 4 5
At 1 DAI5 x 107 7.50a 5.00a 7.50a 22.50a5 x 106 2.50a 5.00a 12.50a 10.00ab5 x 105 5.00a 7.50a 5.00a 2.50b5 x 104 2.50a 7.50a 2.50a 2.50b5 x 103 2.50a 2.50a 2.50a 5.00bControl 0.00a 0.00a 0.00a 0.00bAt 3 DAI5 x 107 30.00a 17.50a 37.50a 32.50a5 x 106 10.00ab 10.00ab 17.50b 10.00b5 x 105 12.50ab 17.50a 20.50ab 17.50b5 x 104 5.00ab 10.00ab 17.00bc 10.00b5 x 103 10.00ab 5.00ab 10.00bc 7.50bcControl 0.00b 0.00bc 0.00c 0.00cAt 5 DAI5 x 107 45.00a 45.00a 50.00a 47.50a5 x 106 30.00a 37.50a 40.00a 27.50b5 x 105 25.00ab 37.50a 35.00a 17.50bc5 x 104 7.50c 17.50b 22.50b 10.00c5 x 103 10.00bc 5.00b 17.50b 7.50cdControl 0.00c 0.00c 0.00c 0.00dAt 7 DAI5 x 107 62.50a 55.00a 57.50a 55.00a5 x 106 45.00ab 30.00b 30.00b 27.50b5 x 105 35.00b 47.50b 47.50b 20.00bc5 x 104 17.50c 12.50c 12.50c 10.00cd5 x 103 10.00c 12.50c 12.50c 2.50deControl 0.00d 0.00d 0.00d 0.00e
Means with the same letter in the column are not significantly different at 5% level of significance by DMRTDAI = Day After InoculationSource: Yasin et. al., 1997
Efficacy of B. bassiana against larva O.furnacalis in Laboratory
At observation 1 day after inoculation (DAI), all of B.bassiana concentrations giving mortality of larval instar2, 3, and 4 were not significantly different to control, but
on larval instar 5, concentration 5 x 10⁶ and 5 x 10⁷ conidia/ml detected significantly different to control. Whereas, atobservation 7 DAI, almost all concentration givingmortality of larval instar 2, 3, 4, and 5 were significantlydifferent to control (Table 3).
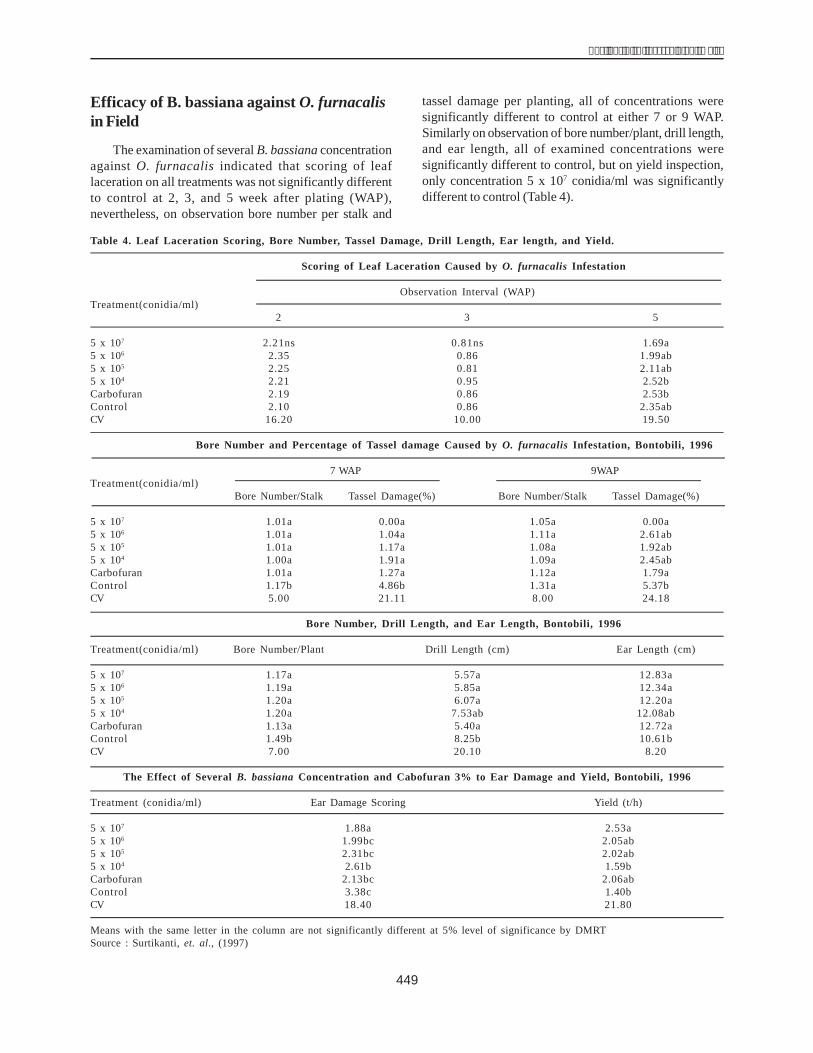
449
����� � ���� ����������� �������
Efficacy of B. bassiana against O. furnacalisin Field
The examination of several B. bassiana concentrationagainst O. furnacalis indicated that scoring of leaflaceration on all treatments was not significantly differentto control at 2, 3, and 5 week after plating (WAP),nevertheless, on observation bore number per stalk and
tassel damage per planting, all of concentrations weresignificantly different to control at either 7 or 9 WAP.Similarly on observation of bore number/plant, drill length,and ear length, all of examined concentrations weresignificantly different to control, but on yield inspection,only concentration 5 x 10⁷ conidia/ml was significantlydifferent to control (Table 4).
Table 4. Leaf Laceration Scoring, Bore Number, Tassel Damage, Drill Length, Ear length, and Yield.
Scoring of Leaf Laceration Caused by O. furnacalis Infestation
Observation Interval (WAP)Treatment(conidia/ml)
2 3 5
5 x 10⁷ 2.21ns 0.81ns 1.69a5 x 106 2.35 0.86 1.99ab5 x 105 2.25 0.81 2.11ab5 x 104 2.21 0.95 2.52bCarbofuran 2.19 0.86 2.53bControl 2.10 0.86 2.35abCV 16.20 10.00 19.50
Bore Number and Percentage of Tassel damage Caused by O. furnacalis Infestation, Bontobili, 1996
7 WAP 9WAPTreatment(conidia/ml)
Bore Number/Stalk Tassel Damage(%) Bore Number/Stalk Tassel Damage(%)
5 x 10⁷ 1.01a 0.00a 1.05a 0.00a5 x 106 1.01a 1.04a 1.11a 2.61ab5 x 105 1.01a 1.17a 1.08a 1.92ab5 x 104 1.00a 1.91a 1.09a 2.45abCarbofuran 1.01a 1.27a 1.12a 1.79aControl 1.17b 4.86b 1.31a 5.37bCV 5.00 21.11 8.00 24.18
Bore Number, Drill Length, and Ear Length, Bontobili, 1996
Treatment(conidia/ml) Bore Number/Plant Drill Length (cm) Ear Length (cm)
5 x 10⁷ 1.17a 5.57a 12.83a5 x 106 1.19a 5.85a 12.34a5 x 105 1.20a 6.07a 12.20a5 x 104 1.20a 7.53ab 12.08abCarbofuran 1.13a 5.40a 12.72aControl 1.49b 8.25b 10.61bCV 7.00 20.10 8.20
The Effect of Several B. bassiana Concentration and Cabofuran 3% to Ear Damage and Yield, Bontobili, 1996
Treatment (conidia/ml) Ear Damage Scoring Yield (t/h)
5 x 10⁷ 1.88a 2.53a5 x 106 1.99bc 2.05ab5 x 105 2.31bc 2.02ab5 x 104 2.61b 1.59bCarbofuran 2.13bc 2.06abControl 3.38c 1.40bCV 18.40 21.80
Means with the same letter in the column are not significantly different at 5% level of significance by DMRTSource : Surtikanti, et. al., (1997)
450
������� �� �� ����� ������� ����� ���������������
ConclusionThe result above indicated the promising potency of
B. bassiana especially in controlling corn borer by selectingstrain having high virulence (Bb-27, Bb-31, and Bb-34) withconcentration 5 x 10⁷ conidia/ml. Because B. bassianarequires time in developing before killing larvae, it ispreferably applied at egg laying period of O. furnacalis (3WAP, further application is 2 week interval). The achievedapplication result is better, if the relative humidity underplant canopy is <70%.
ReferencesBing, L.A. and L.C. Lewis, 1993. Occurrence of The
Entomopathogenic B. bassiana Vuill in Different TillageRegimes and Zea mays and Virulence Toward O. nubilalis.Agric. Ecosystem and Environtment.
Marcandier, S, and G.G. Khachatourians, 1978. Susceptibilityof migratory grasshopper, M e l a n o p h u ssanguinepes (Feb) (Orthoptera : Acrididae) to Beauveriaspp. (Bals) Vuillemin (Hyphomycetes). Influence ofrelative humidity. J. Canadian Entomologist 119 (10):901-907.
Soehardjan and Sudarmadji, 1993. Pemanfaatan Organisme MikroSebagai Bioinsektisida di Negara Sedang Berkembang.Jurnal Penelitian dan Pengembangan Pertanian. Vol XIINo. 1. Pusat Penelitian Perkebunan Bogor
Surtikanti, Soenartiningsih, M. Yasin, dan D. Baco, 1997.Effektivitas Cendawan B. bassiana Vuill Terhadap O.furnacalis Guenee di Lapangan. Hasil Penelitian Hamadan Penyakit Tahun 1996/1997. Badan Litbang Pertanian.Balai Penelitian Tanaman Jagung dan Serealia.
Steinhaus, A.E. 1967. Insect Microbiology. Hafner PublishingCompany. New York.
Tanada Y. and H.K. Kaya. 1993. Insect Phathology. Academic.Press. Inc. Harcourt Brace Jovanovich Publ. San Diego.
Yasin, M., Soenartiningsih, Surtikanti, dan D. Baco. 1997Pengendalian Hama Penggerek Batang Jagung O. furnacalisdengan Cendawan B. bassiana Vuill. Hasil Penelitian Hamadan Penyakit Tahun 1996/1997. Badan Libang Pertanian.Balai Penelitian Tanaman Jagung dan Serealia Lain.
Yasin, M., S. Mas�����9�J��#�����������0��A�������������,����Lama Penyimpanan Cendawan B. bassiana dalamPengendalian Penggerek Batang Jagung O. furnacalis. HasilPenelitian Hama dan Penyakit Tahun 2000. Badan LibangPertanian. Balai Penelitian Tanaman Jagung dan SerealiaLain.
Yasin, M., dan Wakman, 2003. Pembuatan Pellet AlginatBeauveria bassiana Vuill dan Pemanfaatannya dalamPengendalian Penggerek Batang Jagung. Hasil PenelitianHama dan Penyakit Tahun 2003. Badan Libang Pertanian.Balai Penelitian Tanaman Jagung dan Serealia Lain.
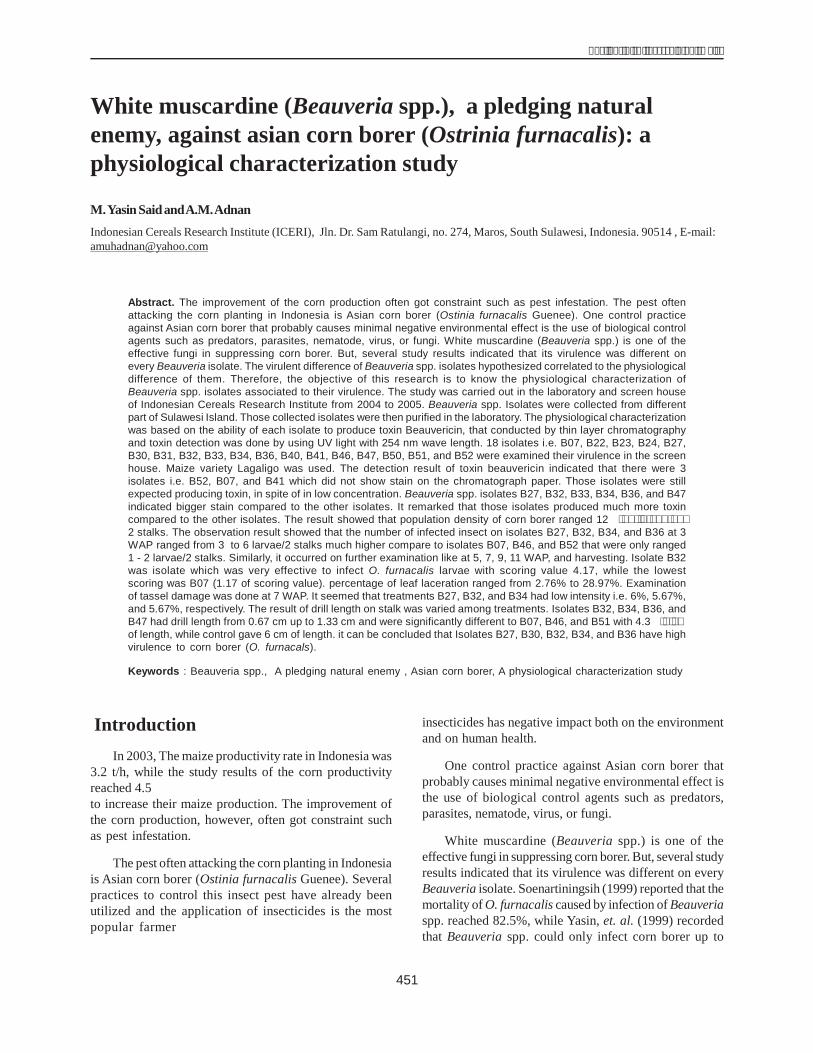
451
����� � ���� ����������� �������
IntroductionIn 2003, The maize productivity rate in Indonesia was
3.2 t/h, while the study results of the corn productivityreached 4.5 ��;����=���#���������������� ���������������to increase their maize production. The improvement ofthe corn production, however, often got constraint suchas pest infestation.
The pest often attacking the corn planting in Indonesiais Asian corn borer (Ostinia furnacalis Guenee). Severalpractices to control this insect pest have already beenutilized and the application of insecticides is the mostpopular farmer��� ����� ����P���������"�� ���� ���� �
insecticides has negative impact both on the environmentand on human health.
One control practice against Asian corn borer thatprobably causes minimal negative environmental effect isthe use of biological control agents such as predators,parasites, nematode, virus, or fungi.
White muscardine (Beauveria spp.) is one of theeffective fungi in suppressing corn borer. But, several studyresults indicated that its virulence was different on everyBeauveria isolate. Soenartiningsih (1999) reported that themortality of O. furnacalis caused by infection of Beauveriaspp. reached 82.5%, while Yasin, et. al. (1999) recordedthat Beauveria spp. could only infect corn borer up to
White muscardine (Beauveria spp.), a pledging naturalenemy, against asian corn borer (Ostrinia furnacalis): aphysiological characterization study
M.Yasin SaidandA.M.AdnanIndonesian Cereals Research Institute (ICERI), Jln. Dr. Sam Ratulangi, no. 274, Maros, South Sulawesi, Indonesia. 90514 , E-mail:[email protected]
Abstract. The improvement of the corn production often got constraint such as pest infestation. The pest oftenattacking the corn planting in Indonesia is Asian corn borer (Ostinia furnacalis Guenee). One control practiceagainst Asian corn borer that probably causes minimal negative environmental effect is the use of biological controlagents such as predators, parasites, nematode, virus, or fungi. White muscardine (Beauveria spp.) is one of theeffective fungi in suppressing corn borer. But, several study results indicated that its virulence was different onevery Beauveria isolate. The virulent difference of Beauveria spp. isolates hypothesized correlated to the physiologicaldifference of them. Therefore, the objective of this research is to know the physiological characterization ofBeauveria spp. isolates associated to their virulence. The study was carried out in the laboratory and screen houseof Indonesian Cereals Research Institute from 2004 to 2005. Beauveria spp. Isolates were collected from differentpart of Sulawesi Island. Those collected isolates were then purified in the laboratory. The physiological characterizationwas based on the ability of each isolate to produce toxin Beauvericin, that conducted by thin layer chromatographyand toxin detection was done by using UV light with 254 nm wave length. 18 isolates i.e. B07, B22, B23, B24, B27,B30, B31, B32, B33, B34, B36, B40, B41, B46, B47, B50, B51, and B52 were examined their virulence in the screenhouse. Maize variety Lagaligo was used. The detection result of toxin beauvericin indicated that there were 3isolates i.e. B52, B07, and B41 which did not show stain on the chromatograph paper. Those isolates were stillexpected producing toxin, in spite of in low concentration. Beauveria spp. isolates B27, B32, B33, B34, B36, and B47indicated bigger stain compared to the other isolates. It remarked that those isolates produced much more toxincompared to the other isolates. The result showed that population density of corn borer ranged 12 ���/����&��� ��2 stalks. The observation result showed that the number of infected insect on isolates B27, B32, B34, and B36 at 3WAP ranged from 3 to 6 larvae/2 stalks much higher compare to isolates B07, B46, and B52 that were only ranged1 - 2 larvae/2 stalks. Similarly, it occurred on further examination like at 5, 7, 9, 11 WAP, and harvesting. Isolate B32was isolate which was very effective to infect O. furnacalis larvae with scoring value 4.17, while the lowestscoring was B07 (1.17 of scoring value). percentage of leaf laceration ranged from 2.76% to 28.97%. Examinationof tassel damage was done at 7 WAP. It seemed that treatments B27, B32, and B34 had low intensity i.e. 6%, 5.67%,and 5.67%, respectively. The result of drill length on stalk was varied among treatments. Isolates B32, B34, B36, andB47 had drill length from 0.67 cm up to 1.33 cm and were significantly different to B07, B46, and B51 with 4.3 ��*���of length, while control gave 6 cm of length. it can be concluded that Isolates B27, B30, B32, B34, and B36 have highvirulence to corn borer (O. furnacals).
Keywords : Beauveria spp., A pledging natural enemy , Asian corn borer, A physiological characterization study
452
������� �� �� ����� ������� ����� ���������������
62.5%. Endang and Yohanes (2000) examined four ofBeauveria isolates from the same host (H. hampei) butdifferent isolate source locations. The results of their studyshowed that Beauveria gave different respond to the H.hampei larvae. Similarly, Feng and Johnson (1990) reportedthat every Beauveria spp. isolate had different killing abilityto the target pest. The virulent difference of Beauveriaspp. isolates hypothesized correlated to the physiologicaldifference of them. Therefore, the objective of this researchis to know the physiological characterization of Beauveriaspp. isolates associated to their virulence.
Materials and Methods
Date and Place
The study was carried out in the laboratory and screenhouse of Indonesian Cereals Research Institute from 2004to 2005.
Collection of Beauveria spp. Isolates
Beauveria spp. Isolates were collected from differentpart of Sulawesi Island. Those collected isolates were thenpurified in the laboratory. The purification was done byisolating the fungus from the hosts. The fungus was thenput in 100 ml of dH2O. The isolate suspension was dilutedup to 10-5. It was cultured on PDA, then incubated for 48hours. The emerged single colony was transferred to theother PDA. All of isolates were used in physiology andvirulence study.
Physiological Characterization of Beauveriaspp. Isolates
The physiological characterization was based on theability of each isolate to produce toxin Beauvericin. Thepurified isolates was cultured on the liquid Czapex Dox +Yeast Media for 7 days with room temperature and withoutlight. 0.75 ml of Filtrat sample was poured in Erlenmeyerand mixed with 0.5 ml of methanol : chloroform solvent (2 :1 v/v), then centrifuged for 10 minutes 1000 rpm.Supernatant was air dried on block heater with temperature40oC, then added 100 Q����� ������������� ������(2 : 1 v/v). 20 Q����� ���!��������������������� ��chromatograph paper (type 60 F254 Merck, Darmstadt,Germany). The carrier soluble was used chloroform :methanol : acetate ethyl (18 : 1 : 1). Chromatography wasdone for 5 minutes or until the carrier soluble reached 1 cmfrom up border of paper, then the paper was got by forcepsand air dried. Toxin detection was done by using UV light
with 254 nm wave length. The purified beuvericin toxinwas utilized as standard (Sigma, Germany).
Virulence Test of Beauveria spp. Isolates inScreen House
18 isolates i.e.B07, B22, B23, B24, B27,B30, B31, B32,B33,B34,B36,B40, B41,B46,B47, B50,B51, and B52 wereexamined their virulence in the screen house. The 18isolates were selection results of 52 isolates found.
Pail (volume 9 gallons) was fulfilled 10 kg of soil, thenplanted maize (variety lagaligo). Each pail was planted 2crops. The use of fertilizer with dosage 200 kg/h urea, 100kg/h SP36, and 100 kg/h KCl was done instantly afterplanting and 100 kg/h urea was given at 5 weeks afterplanting (WAP). At 1 WAP, the Beauveria spp. suspensionwith concentration 106 conidia/ml and dosage 50 ml/pailwas sprayed on the plant.
At 2 WAP, 20 new emerged larvae of O. furnacaliswere infested and put on the rolled leaf. The plant andlarvae were covered by gauze cloth. Leaf laceration causedby O. furnacalis was examined at 3 and 5 WAP, tasseldamage was observed at 7 and 9 WAP, while examinationof hole number per stalk was done at 9 and 11 WAP.Observation of bore length was done at harvesting, andthe number of infected larvae was inspected at 3, 5, 7, 9,and 11 WAP. Each isolate as treatment was replicated 3times so that number of pail utilized was 54 buckets. Leaflaceration valued by scoring 1 to 9 based on Guthrie et. al.(1980), as fallows at table 1.
Tassel damage counted by formula, as fallows:
aP = 100%
a + bP = Percentage of Tassel Damagea = Amount of Infested Tasselb = Amount of No Infested Tassel
Table 1. Scoring Value of Leaf Laceration Caused By CornBorer
Score Value (%)
1 02 1 �� ��3 11 �� ��4 21 �� ��5 31 �� >�6 41 �� $�7 51 �� *�8 61 �� 7�9 71 - 100
453
����� � ���� ����������� �������
Result and Discussion
Physiological Characterization of Beauveriaspp. Isolates
The detection result of toxin beauvericin indicated thatthere were 3 isolates i.e. B52, B07, and B41 which did notshow stain on the chromatograph paper. Those isolateswere still expected producing toxin, in spite of in lowconcentration (Fig 1.). The other 15 isolates produced toxinbeauvericin with varied concentration remarked by thepresence of the stain appearance difference onchromatograph paper, and which was parallel with standardstain position. Beauveria spp. isolates B27, B32, B33, B34,B36, and B47 indicated bigger stain compared to the otherisolates. It remarked that those isolates produced muchmore toxin compared to the other isolates. According toTanada and Kaya (1983) and Riyanto and Santoso (1981),Beauveria spp. produced not only toxin beauvericin butalso secondary metabolic i.e. beauverolide, bassianolide,isorolide, ocsalat acid, and color substance. Riyanto andSantoso (1991) proposed that toxin beauvericin damagedcell membrane structure and caused death of insect.Beauvericin also injured the main function of hemolymph,caused the change of cell nucleic and influenced cellmovement in the cell row (Tanada and Kaya, 1983). The
result indicated that there was significant correlationbetween mortality of O. furnacalis larvae and toxinproduced. Beauveria spp. isolates producing much moretoxin such as B32, B34, B36, etc. have high ability to killlarvae. Fungus Beauveria spp. formed toxin beauvericinon culture media and host insect. If beauvericin issucceeded to extract, purified, and then applied on insectpest, it can caused death of the insect. According to Groveand Pople (1980), beauvericin was too effective to controlA. agepty larvae. While according to Tanada and Kaya(1983), beauvericin produced from culture media and if itwas inoculated on silkworm, it will damage the main functionof hemolymph. Fig. 1 showed that Beauveria spp. besidesproduced mycotoxin beauvericin, also generated othersecondary metabolic. Kind of secondary metabolic wasnot detected yet, because of unavailability of standard.
Virulence Test of Beauveria spp. Isolates inScreen House
The result showed that population density of cornborer ranged 12 ���)����������������(���9����G9������plant sprayed by isolate suspensions (B27, B30 and B32)had population density 12 ��������������������(�� ���lower compared to other isolates such as B07, B41, andB52 with population density 17 larvae per 2 stalks, while
Figure 1. Production of Toxin Beauvericin of Several Beauveria spp. Isolates on Liquid Czapek Media. Bigger stain on theHPLC paper, higher toxin concentration produced by each of Beauveria spp. isolates.
454
������� �� �� ����� ������� ����� ���������������
population density on control reached 19 larvae per 2 stems.(Table 2). At 5 WAP, the population density on eachtreatment was increasingly varied.At treatments B30, B32,B34, and B36, it was lower i.e. 4 ��)� �����=�� ���(��meanwhile, B07, B22, and B46 gave population density ofO. furnacalis 16 larvae/2 stalks. At 7 WAP, isolates B32,B34, and B36 had lower density around 8 ��)������=�����(�and they were significantly different to B07, B46, and B51).The others had 18 ��������������������(�����������,���up to 24 larvae/2 stems.
Similarly, it occurred on further observation such as at9 and 11 WAP. The density difference of every treatmentsoccurred, probably because of the virulent difference ofeach isolate. Isolates B32, B34, and B36 were proved havinghighest killing ability in the laboratory test. The highvirulence of those probably caused by those onesespecially B32 and B34 have faster sporulation ability, aswell as other characteristics such as toxin production andother compound playing role in killing insect
Lower density on isolates B27, B32, B34, and B36 wasappeared because of higher insect death caused byinfection of Beauveria spp. The observation result showedthat the number of infected insect on isolates B27, B32,B34, and B36 at 3 WAP ranged from 3 to 6 larvae/2 stalks
much higher compare to isolates B07, B46, and B52 thatwere only ranged 1 -2 larvae/2 stalks. Similarly, it occurredon further examination like at 5, 7, 9, 11 WAP, and harvesting(Table 3). Based on Table 3, Isolate B32 was isolate whichwas very effective to infect O. furnacalis larvae withscoring value 4.17, while the lowest scoring was B07 (1.17of scoring value).
This study also observed leaf laceration caused byinfestation of O. furnacalis. At 3 WAP, percentage of leaflaceration ranged from 2.76% to 28.97%. The treatmentsgetting lowest infestation were appeared at isolates B27,B32, and B34 wit intensity 3.40%, 3.23, and 2.76%,respectively (Table 4). Meanwhile, Beauveria spp. isolatessowed highest intensity were seemed at isolates B07, B46,and B52 with 17.67%, 22.50%, and 18.53% of intensity,respectively. Intensity on control was up to 28.17%.. At 5WAP, the plant sprayed Beauveria spp. isolates had leaflaceration varied from 9.5% to 32.33%, and control hadbeen up to 53.33%. Based on the data, amount of the oneisolates utilized were effective to control corn borer. Thetreatments of Beauveria spp. isolates having low leafdamage were B27, B32, B34, and B36 with intensity 11.17%,9.5%, 10.50%, and 10.67%, respectively. Low leaf damagewas probably caused by low population density of cornborer larvae.
Table 2. Population Density of O. furnacalis Larvae per 2 Stalks on Effectiveness Study of Several Beauveria spp. Isolates.ICeRI Secreen House, Maros.
Observation ( WAP )Isolates Score Means
3 5 7 9 11
B 07 (Aphids) 17 ab 16 ab 18 c 24 b 10 c 2,2B 22 (Aphids) 16 ab 15 ab 16 cd 18 bcd 8 c 2,7B 23 (O.furnacalis) 16 ab 12 b 14 d 16 cd 9 c 3B 24 (O.furnacalis) 15 ab 11 b 12 ef 17 bcd 12 c 3,7B 27 (O.furnacalis) 12 b 11 b 8 e 12 de 3 d 3,7B 30 (O.furnacalis) 13 ab 8 c 12 d 20 bc 8 c 3,2B 31 (H. armigera) 16 ab 12 b 14 de 14 c 6 c 3B 32 (O.furnacalis) 12 b 4 d 8 e 12 de 3 d 4,1B 33 (N. lugens) 17 ab 14 ab 14 f 18 bcd 18 ab 2,5B 34 (O.furnacalis) 15 ab 9 c 8 e 10 de 12 c 3,6B 36 (O.furnacalis) 14 ab 8 c 9 e 12 de 8 c 2,7B 40 (H. armigera) 15 ab 13 ab 12 e 20 bc 14 b 3B 41 (N. virescens) 17 ab 13 ab 10 e 18 bcd 12 c 2,1B 46 (O.rhinoceros) 18 ab 16 ab 20 b 22 bc 10 c 3B 47 (O.furnacalis) 15 ab 11 ab 10 e 8 e 9 d 3B 50 (H. armigera) 15 ab 12 b 12 ef 16 de 14 b 3B 51 (O.furnacalis) 17 ab 15 ab 18 c 24 b 16 ab 3,9B 52 (N. lugens) 17 ab 14 ab 16 cd 12 de 10 c 2,3Control 19 a 18 a 24 a 30 a 21 a 1
CV (%) 21,1 24,10 17,20 23,90 25,7
Means with the same letter in the column are not significantly different at 5% level of significance by DMRTWAP = Week After Planting
455
����� � ���� ����������� �������
Table 3. The Amount of O. furnacalis Larvae infected Beauveria Spp. per 2 Stalks on Effectiveness Study of SeveralBeauveria spp. Isolates. ICeRI Secreen House, Maros.
Observation ( WAP )Isolates Score Means
3 5 7 9 11
B 07 (Aphids) 2 cde 2 bc 2 cd 2 de 2 de 1,17B 22 (Aphids) 3 bc 2 bc 3 bc 3 cd 2 de 2B 23 (O.furnacalis) 4 abc 3 ab 4 abc 4 cd 3 cd 3,72B 24 (O.furnacalis) 4 abc 3 ab 4 abc 5 bc 5 bc 3,88B 27 (O.furnacalis) 6 a 5:00 AM 6 a 7 ab 6 ab 3,5B 30 (O.furnacalis) 5 ab 4 ab 5 ab 6 bc 6 ab 2,42B 31 (H. armigera) 4 abc 4 ab 5 ab 5 bc 6 ab 3,08B 32 (O.furnacalis) 6 a 5:00 AM 6 a 8:00 AM 8:00 AM 4,17B 33 (N. lugens) 3 bcd 2 bc 3 bc 5 b 5 bc 2,42B 34 (O.furnacalis) 5 ab 5:00 AM 6 a 7 ab 7 ab 3,25B 36 (O.furnacalis) 5 ab 4 ab 5 ab 6 ab 6 ab 3,25B 40 (H. armigera) 4 abc 2 bc 4 abc 4 c 2 de 2,47B 41 (N. virescens) 3 bcd 2 bc 3 bc 3 cd 2 de 2,17B 46 (O.rhinoceros) 1 de 2 bc 2 cd 2 de 2 de 1,42B 47 (O.furnacalis) 4 abc 3 ab 4 abc 5 bc 4 cd 2,72B 50 (H. armigera) 4 abc 3 ab 4 abc 5 bc 3 cd 2,63B 51 (O.furnacalis) 3 bcd 2 bc 2 cd 2 de 1 e 2,58B 52 (N. lugens) 2 cde 2 bc 2 cd 2 de 2 de 1,5Control 0 e 0 c 0 d 0 e 0 e 1
CV (%) 24,3 26,2 33,9 30,5 33,2
Means with the same letter in the column are not significantly different at 5% level of significance by DMRTWAP = Week After Planting
Table 4. Percentage of Leaf Laceration caused by O. furnacalis Larvae on Effectiveness Study of Several Beauveria spp.Isolates. ICeRI Secreen House, Maros.
Observation (WAP) Score Observation (WAP) ScoreIsolates Means Isolates Means
3 5 3 5
B 07 (Aphids) 17,67 c 30,83 b 2,5 B 36 (O.furnacalis) 3,90 e 10,67 d 4,5B 22 (Aphids) 11,83 d 29,90 bc 3,25 B 40 (H. armigera) 8,00 d 20,00 c 3,5B 23 (O.furnacalis) 9,67 d 20,67 c 3,5 B 41 (N. virescens) 11,87 d 25,67 bc 3,5B 24 (O.furnacalis) 9,23 d 22,33 c 3,5 B 46 (O.rhinoceros) 22,50 b 32,33 b 2B 27 (O.furnacalis) 3,40 e 11,17 d 3,5 B 47 (O.furnacalis) 10,17 d 23,00 c 3,5B 30 (O.furnacalis) 5,50 e 12,33 d 4,5 B 50 (H. armigera) 11,00 d 23,00 c 3,5B 31 (H. armigera) 8,33 d 20,67 c 4,5 B 51 (O.furnacalis) 13,87 d 27,00 bc 3,25B 32 (O.furnacalis) 3,23 e 9,50 d 3,5 B 52 (N. lugens) 18,53 c 29,20 bc 2,75B 33 (N. lugens) 8,23 d 26,00 c 4,5 Control 28,17 a 53,53 a 1B 34 (O.furnacalis) 2,76 e 10,50 d 4,5
CV (%) 15,2 16,9 15,2 16,9
Means with the same letter in the column are not significantly different at 5% level of significance by DMRTWAP = Week After Planting
Observation of bore number was done at 9 and 11WAP. Based on the study result at 9 WAP, the number ofbores formed were ranged from 1 to 5 hole per stalks (Table5). Low number of bores was found at isolates B23, B27,B30, B32, B34, and B36 with 1 hole/stalk of each isolate.High number of bore occurred at treatments B07, B46, B51,and B52 with 3 holes/stalk of each isolate. At 11 WAP,
several examined isolates were effective to control cornborer, it seemed by low number of bores. Those meantisolates were B07, B32, and B36 with each isolate 1 hole/stalk, while control had 6 holes/stalk.
According to Nafus and Schreiner (1987), larval instarI up to III of O. furnacalis feed on still young rolled leaf or
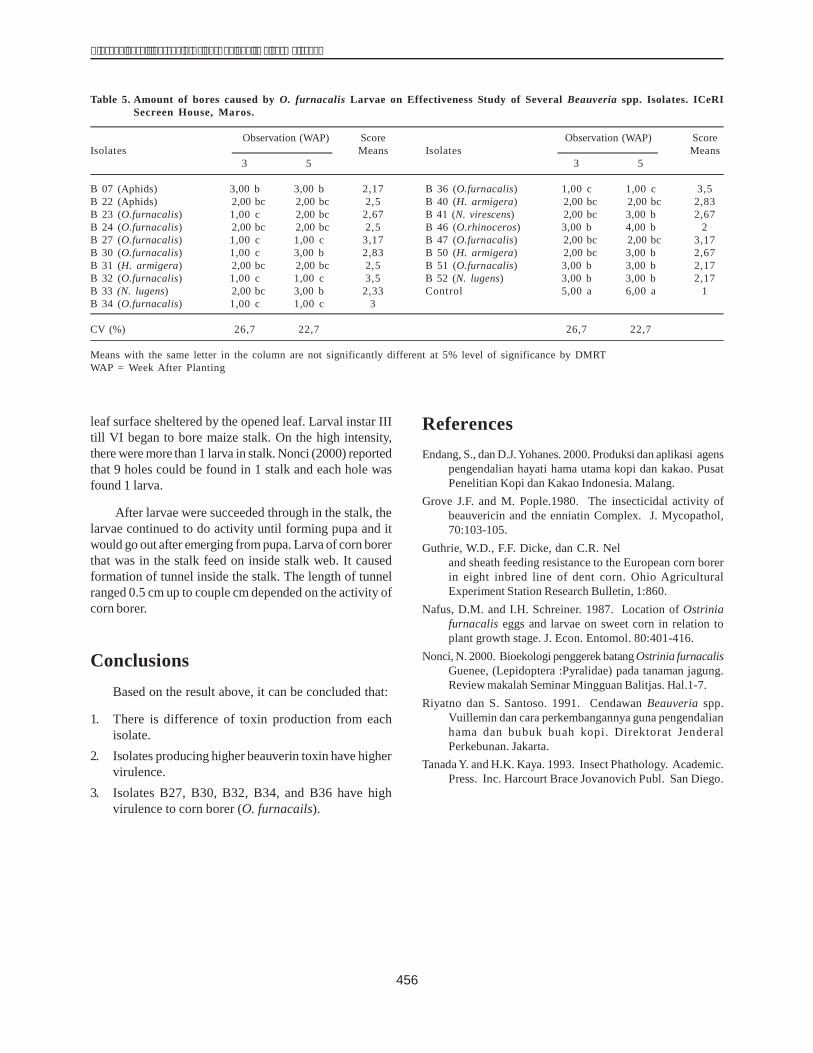
456
������� �� �� ����� ������� ����� ���������������
leaf surface sheltered by the opened leaf. Larval instar IIItill VI began to bore maize stalk. On the high intensity,there were more than 1 larva in stalk. Nonci (2000) reportedthat 9 holes could be found in 1 stalk and each hole wasfound 1 larva.
After larvae were succeeded through in the stalk, thelarvae continued to do activity until forming pupa and itwould go out after emerging from pupa. Larva of corn borerthat was in the stalk feed on inside stalk web. It causedformation of tunnel inside the stalk. The length of tunnelranged 0.5 cm up to couple cm depended on the activity ofcorn borer.
ConclusionsBased on the result above, it can be concluded that:
1. There is difference of toxin production from eachisolate.
2. Isolates producing higher beauverin toxin have highervirulence.
3. Isolates B27, B30, B32, B34, and B36 have highvirulence to corn borer (O. furnacails).
ReferencesEndang, S., dan D.J. Yohanes. 2000. Produksi dan aplikasi agens
pengendalian hayati hama utama kopi dan kakao. PusatPenelitian Kopi dan Kakao Indonesia. Malang.
Grove J.F. and M. Pople.1980. The insecticidal activity ofbeauvericin and the enniatin Complex. J. Mycopathol,70:103-105.
Guthrie, W.D., F.F. Dicke, dan C.R. Nel��!��������)*���1���and sheath feeding resistance to the European corn borerin eight inbred line of dent corn. Ohio AgriculturalExperiment Station Research Bulletin, 1:860.
Nafus, D.M. and I.H. Schreiner. 1987. Location of Ostriniafurnacalis eggs and larvae on sweet corn in relation toplant growth stage. J. Econ. Entomol. 80:401-416.
Nonci, N. 2000. Bioekologi penggerek batang Ostrinia furnacalisGuenee, (Lepidoptera :Pyralidae) pada tanaman jagung.Review makalah Seminar Mingguan Balitjas. Hal.1-7.
Riyatno dan S. Santoso. 1991. Cendawan Beauveria spp.Vuillemin dan cara perkembangannya guna pengendalianhama dan bubuk buah kopi. Direktorat JenderalPerkebunan. Jakarta.
Tanada Y. and H.K. Kaya. 1993. Insect Phathology. Academic.Press. Inc. Harcourt Brace Jovanovich Publ. San Diego.
Table 5. Amount of bores caused by O. furnacalis Larvae on Effectiveness Study of Several Beauveria spp. Isolates. ICeRISecreen House, Maros.
Observation (WAP) Score Observation (WAP) ScoreIsolates Means Isolates Means
3 5 3 5
B 07 (Aphids) 3,00 b 3,00 b 2,17 B 36 (O.furnacalis) 1,00 c 1,00 c 3,5B 22 (Aphids) 2,00 bc 2,00 bc 2,5 B 40 (H. armigera) 2,00 bc 2,00 bc 2,83B 23 (O.furnacalis) 1,00 c 2,00 bc 2,67 B 41 (N. virescens) 2,00 bc 3,00 b 2,67B 24 (O.furnacalis) 2,00 bc 2,00 bc 2,5 B 46 (O.rhinoceros) 3,00 b 4,00 b 2B 27 (O.furnacalis) 1,00 c 1,00 c 3,17 B 47 (O.furnacalis) 2,00 bc 2,00 bc 3,17B 30 (O.furnacalis) 1,00 c 3,00 b 2,83 B 50 (H. armigera) 2,00 bc 3,00 b 2,67B 31 (H. armigera) 2,00 bc 2,00 bc 2,5 B 51 (O.furnacalis) 3,00 b 3,00 b 2,17B 32 (O.furnacalis) 1,00 c 1,00 c 3,5 B 52 (N. lugens) 3,00 b 3,00 b 2,17B 33 (N. lugens) 2,00 bc 3,00 b 2,33 Control 5,00 a 6,00 a 1B 34 (O.furnacalis) 1,00 c 1,00 c 3
CV (%) 26,7 22,7 26,7 22,7
Means with the same letter in the column are not significantly different at 5% level of significance by DMRTWAP = Week After Planting