Design and Optimization of Recombinant Antibodies Directed ...
Upload
independentCategory
view
1download
0
0 0 0 1 0 1 0 1 1 1 0 0 1 0 1 01 1 0 0 1 0 1 0 0 1 1 1 0 1 0 00 1 0 1 0 1 0 0 0 1 0 1 0 0 1 10 0 1 1 0 0 1 1 1 0 1 0 1 0 1 0 01 0 1 0 1 0 1 0 0 0 1 1 0 0 1 1 00 1 0 1 0 0 0 1 0 1 1 0 0 1 0 0 00 1 0 1 0 0 0 1 0 1 0 1 1 0 1 0 0 11 1 1 0 0 1 0 0 0 1 0 1 1 0 0 0 0 11 0 1 0 1 0 0 1 0 1 0 1 0 1 0 1 0 00 0 0 1 0 1 0 1 1 1 0 0 1 0 1 01 1 0 0 1 0 1 0 0 1 1 1 0 1 0 00 1 0 1 0 1 0 0 0 1 0 1 0 0 1 11 0 1 0 1 0 1 0 0 0 1 1 0 0 1 1 00 1 0 1 0 0 0 1 0 1 1 0 0 1 0 0 0
NeuroinformaticsNeuroinformaticsISSN 1539–2791 Volume 1 • Number 4 • 2003
Editors
Giorgio A. Ascoli
Erik De Schutter
David N. Kennedy
IN THIS ISSUE
Public Resources
WebQTLComplex Trait Analysis
EMAP and EMAGE
Complex Trait Analysis
Genetic Correlates ofGene Expression
Image-Centric Databases
Cell Centered Database
C57BL/6J Mouse Brain Atlas
Commentary
Human
aJourn
als.co
m
Sear
ch, R
ead, a
nd Downlo
ad
NI 1-4_cover 9/24/03, 10:58 AM1

NeuroinformaticsCopyright ©Humana Press Inc.All rights of any nature whatsoever are reserved.ISSN 1539-2791/03/343–358/$25.00
Original Article
343
*Address to which all correspondence and reprint requests should be sent. E-mail: [email protected]
Genetic Correlates of Gene Expression in Recombinant Inbred Strains
A Relational Model System to Explore NeurobehavioralPhenotypes
Elissa J. Chesler,*,1 Jintao Wang,2 Lu Lu,1 Yanhua Qu,1 Kenneth F. Manly,2
and Robert W.Williams1
1Department of Anatomy and Neurobiology, Center for Genomics and Bioinformatics, University of Tennessee Health Science Center, Memphis TN; 2 Molecular and Cellular Biology, Roswell ParkCancer Institute, Buffalo, NY
AbstractFull genome sequencing, high-density geno-
typing, expanding sets of microarray assays, andsystematic phenotyping of neuroanatomical andbehavioral traits are producing a wealth of dataon the mouse central nervous system (CNS).These disparate resources are still poorly inte-grated. One solution is to acquire these datausing a common reference population of iso-genic lines of mice, providing a point of inte-gration between the data types. Recombinantinbred (RI) mice, derived through inbreeding ofprogeny from an inbred cross, are a powerfultool for complex trait mapping and analysis ofthe challenging phenotypes of neuroscientificinterest. These isogenic RI lines are a retrievablegenetic resource that can be repeatedly studiedusing a wide variety of assays. Diverse data setscan be related through fixed and knowngenomes, using tools such as the interactive web-based system for complex trait analysis,www.WebQTL.org. In this report, we demon-
strate the use of WebQTL to explore complexinteractions among a wide variety of traits—from mRNAtranscripts to the impressive behav-ioral and pharmacological variation among RIstrains. The relational approach exploiting acommon set of strains facilitates study of mul-tiple effects of single genes (pleiotropy) withouta priori hypotheses required. Here we demon-strate the power of this technique through genet-ic correlation of gene expression with a databaseof neurobehavioral phenotypes collected inthese strains of mice through more than 20 yearsof experimentation. By repeatedly studying thesame panel of mice, early data can be re-exam-ined in light of technological advances unfore-seen at the time of their initial collection.
Index Entries: Behavioral genetics; genetic cor-relation analysis; relational databases; QTLmap-ping; recombinant inbred mice; oligonucleotidemicroarray.
05/Chesler343-358F 10/2/03 1:22 PM Page 343

344 _____________________________________________________________________________Chesler et al.
Neuroinformatics _______________________________________________________________ Volume 1, 2003
IntroductionWith the advent of new genomic technolo-
gies, including tremendous advances insequence availability and mining, SNP geno-typing, and gene microarray analysis, there hasbeen a major push toward large-scale geneticstudies of brain function. The potential of theseemerging approaches has been embraced withexcitement and a shift in focus in behavioralgenetics away from the behavioral traits them-selves, toward the study of biological “sub-phe-notypes” has been advocated (Hamer, 2002).Ideally, a bioinformatic bridge can combine theachievements of decades of systems levelresearch in the field with the large volumes ofgenome-era data for non-reductionist systemslevel analysis. High-throughput expressionprofiling, gene network analysis, functionalbrain imaging, and other integrative methodsgreatly enhance our understanding of mecha-nisms behind genetic mediation of behavior,but association of genetic factors with behav-iorally relevant constructs must remain central.However, a platform for integration of behav-ioral genetics results with data from recentgenomic technology is required. Studies typi-cally carried out in isolated experimentally bredpopulations, or in mice of obscure/non-extantgenetic backgrounds render findings difficultto incorporate with rapidly accumulatingknowledge of genome structure. In contrast,data collected in recombinant inbred strainscan be used in a relational fashion while retain-ing interesting genetic diversity and utility forgenetic mapping.
Historically, recombinant inbred strainshave allowed significant advances in behav-ioral genetics because these mice have fixedgenomes. They can be repeatedly tested withno molecular analysis necessary because geno-types of known genetic markers are alreadystored in a database. This facilitates economi-cally efficient genetic mapping (Belknap, 1998)and allows genetic dissection of traits that are
highly variable or that require separate con-trol groups. Using recombinant inbred mice,data can be cumulatively aggregated from dif-ferent laboratories studying widely varyingtraits without any prior hypothesis motivat-ing their simultaneous analysis. With a rela-tional approach, data from all projects usingthese same mice can be assembled, resultingin a powerful community resource.
The mouse phenome project (Paigen andEppig, 2000) is an excellent example of a com-munity-wide collaborative resource for thecumulative use of data from mice of a fixedgenetic background. Trait data spanning therange of morphological, physiological, life his-tory, and behavioral traits are aggregated formulti-trait analysis in four sets of inbredstrains. For behavior genetics, the inclusion ofwild-derived strains has been a challenge asthese mice, particularly CAST/Ei, are often notamenable to the testing conditions (Le Roy etal., 1998).
Though phenotypic means analyses of thestandard inbred strains provide an ideal plat-form for relational studies, they are of limitedutility as a mapping panel for genetic dissec-tion of complex traits because of their smallnumbers, and complex, often unknown genet-ic backgrounds (Chesler et al., 2001; Darvasi,2001). In typical mapping studies, the pair ofinbred strains with the most extreme pheno-types are crossed, generating hundreds ofunique recombinant progeny that must be indi-vidually phenotyped and genotyped. Data col-lected in the individuals cannot be aggregatedacross studies. The recombinant progeny ofseveral of these common crosses have beeninbred for many generations. In contrast to datafrom the unique individual progeny of theexperimental cross, many genetically identicalmice can be phenotyped and genotypedrepeatedly. These mice have all the advantagesof retrievability and relational databasing ofexperimental data that standard inbred strains
05/Chesler343-358F 10/2/03 1:22 PM Page 344

Volume 1, 2003 _______________________________________________________________ Neuroinformatics
Genetic Correlates of Gene Expression _________________________________________________________345
have, but also have sufficient statistical power(though less than that of an experimental cross)for genetic mapping.
The BXD recombinant inbred strain set hasbeen assayed on a few hundred phenotypes,with over 250 literature reports since 1979(PubMed, http://www.ncbi.nlm.nih.gov[1/24/03]). Since their earliest use in behav-ioral genetics (Crabbe et al., 1983), they havebeen evaluated on a vast array of neurobe-havioral assays. This notably includes a largebody of traits pertaining to alcoholism (Crabbeet al., 1994), leading to the identification of sev-eral quantitative trait loci determining sus-ceptibility to these traits. Since the earliest ofthese mapping studies, new genotyperesources have become available (Williams etal., 2001a), allowing much higher precisionthan was previously possible. As a result, earlychallenges faced by RI analysis, such as thedetection of mirror loci (two loci possessingidentical genotype strain distribution patternsin different regions of the genome) are nowmuch more easily avoided.
Microarrays allow simultaneous quantifi-cation of steady-state abundance of thousandsof transcript mRNAs and are often describedas a massively parallel analysis of gene expres-sion. In addition to mapping of susceptibilityloci determining gene expression (see Wang etal., current issue), microarray assays in the RImice can be used for genetic correlation analy-sis of gene expression with any other trait eval-uated in these strains.
Genetic correlations determine the degreeof shared genetic mediation of traits, i.e., thedegree to which two traits are associated withthe same biological substrates in geneticallysimilar individuals. Using platforms for geneexpression data collection that can be usedcumulatively, e.g., Affymetrix oligonucleotidearrays, in a genetically retrievable resource, thegenetic correlation of thousands of gene expres-sion traits with hundreds of behavioral traits
can be performed. Successful use of individ-ual transcript correlations from our AffymetrixGene Expression database (Hitzemann et al.,2003) and other individual transcript expres-sion levels (Kirstein et al., 2002; Janowsky etal., 2001) with neurobehavioral phenotypes hasbeen demonstrated.
Presently, we have assembled a database ofphenotypes obtained in the BXD recombinantinbred strain set through review of the litera-ture and personal communication with theauthors (notably John C. Crabbe at OregonHealth Sciences University). Using theWebQTL (Wang et al., current issue) interfaceas a platform for genetic correlation analysis,users can re-map each of these traits usingadvanced high-density genotypes, and per-form genetic correlation analysis with geneexpression obtained in these same strains. Thisresource facilitates the integration of noveltechnologies for genome-wide analysis, andtheir deployment in this historically importantstrain set, allowing us to reach back into theliterature to identify genetic bases for the neu-roscientific phenotypes that are the ultimatetarget of study.
MethodsStrains,Animals, Sex, and Age
Female mice from the C57BL/6J, DBA/2J,F1(C57BL/6J × DBA/2J) and 30 RI strains wereused in this study and another concurrent map-ping study. In the majority of cases, we pooledtissues from sets of three animals of the samestrain prior to isolation of mRNA. Mice werebred at the University of Tennessee, Universityof Memphis, and University of Alabama atBirmingham from stock originally obtainedfrom the Jackson Laboratory (Bar Harbor, ME).Mice were maintained at 20–24°C on a 14/10hlight-dark cycle in pathogen-free colonies. Mostanimals were fed a 5% fat Agway Prolab 3000rat and mouse chow. Female mice were grouphoused three to six per cage in separate colonies.
05/Chesler343-358F 10/2/03 1:22 PM Page 345
346 _____________________________________________________________________________Chesler et al.
Neuroinformatics _______________________________________________________________ Volume 1, 2003
TissuesAnimals were killed by cervical dislocation
and brains were removed immediately. Freshbrains were immersed in RNAlater for 2–3 dat 4°C before dissection and extraction of RNA.The cerebellum and olfactory bulbs were cutfree of the remainder of the brain as describedin Airey et al. (2001) and Williams (2001b). Thebrainstem was cut at the level of the inferiorcolliculus and pons. The tissue sample that wewill refer to as a forebrain more accurately con-sists of the forebrain (including subcorticalstructures) minus the olfactory bulb, and themidbrain and hindbrain removed. Tissues fromthree mice of each strain were processed togeth-er to extract total RNAusing RNASTAT-60 andRNAlater according to the manufacturer’s pro-tocol. RNA quality and purity was assessedusing an Agilent Bioanalyzer 2100 to assess rel-
ative quantities of 18s and 28s rRNA, the pres-ence of DNA contamination, and evidence ofRNAdegradation. Using a Spectromax UV-visspectrophotometer, the 260/280 nMabsorbance ratio was determined to evaluateDNA:RNA ratio and to detect protein con-tamination. Over 95% of samples were of suf-ficient quality to generate cDNAs and cRNAs.cRNAs probes were prepared and hybridizedto U74Av2 microarrays at Genome Explor-ations Inc. (Memphis, TN; www.genome-explorations.com) according to standardAffymetrix protocols. Technical variancebetween arrays is substantial even using theAffymetrix platform, and replication canreduce the relative impact of this variation.Thus, we used multiple (three to five) genechips for each strain as replicates, each con-taining a pool of samples.
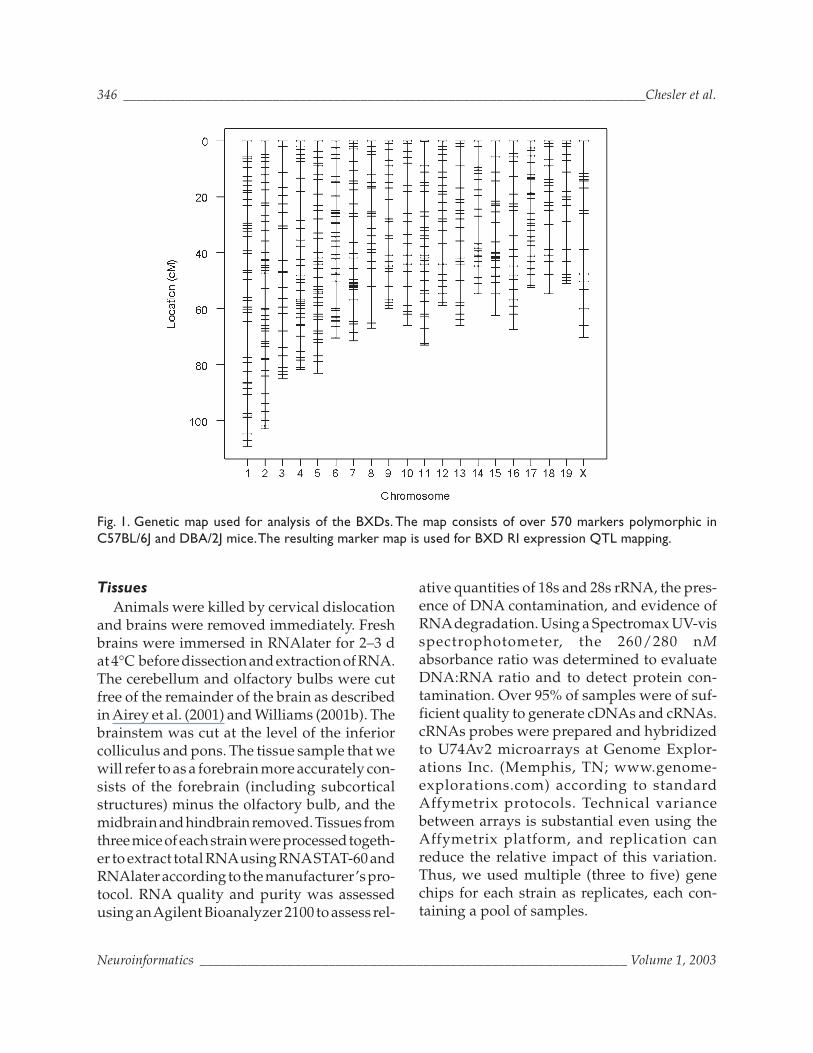
Fig. 1. Genetic map used for analysis of the BXDs. The map consists of over 570 markers polymorphic inC57BL/6J and DBA/2J mice.The resulting marker map is used for BXD RI expression QTL mapping.
05/Chesler343-358F 10/2/03 1:22 PM Page 346

Volume 1, 2003 _______________________________________________________________ Neuroinformatics
Genetic Correlates of Gene Expression _________________________________________________________347
Microarray Data Generation and Preprocessing
Affymetrix DAT and CEL output files wereprocessed using Affymetrix MicroarrayAnalysis Suite 5.0 and dChip 1.0 (Wong et al.,2001). dChip was used to assess the quality ofmicroarray data through model-based assess-ment of outliers. Microarrays that were iden-tified as strong outliers were excluded fromthe data set if they did not meet two criteria:1) The correlation of the chip data sets (MAS5.0 signal) is greater than 0.9 with other mem-bers of the same brain tissue-type arrays; 2)The percentage of outliers detected usingdChip is less than 5%; the percentage of dChip“present calls” is greater than 30%. Customdatabases for all probe sets and for individualprobe cells were assembled using FileMakerPro with incorporated genome informationabout each gene and RNA samples.
Statistical Analysis
The probe set MAS 5.0 expression signal wastransformed by log2 (X+1) and standardized toan array mean of 8.0 and variance of 2. Thistransformation is a computationally efficientmeans of reducing the between array variance,though it assumes a constant total level of geneexpression across chips. Statistical analysis,data processing, and visualization were per-formed using Microsoft Excel, SYSTAT (SYS-TAT Software Inc., Richmond, CA), MATLAB(Mathworks), Data Desk 6.1.1 (DataDescription, Inc., Ithaca NY; www.datade-scription.com), and SAS (The SAS Institute,Cary, NC).
Genotype Database and Genetic Map
Genotypic data have been assembled byongoing genotyping efforts (Williams et al.,2001). By screening genome sequence datafor novel polymorphisms, many new BXDmarkers are being added to the BXD map(Fig. 1). See updates at http://webqtl.org/
BXDGeno.html. Physical marker positions inmegabases (MB) are determined by searchingthe most recent public assembly of the mousegenome.
Recombination position is determined bylinkage analysis based on the rate of recombi-nations between markers. This has resulted inthe construction of a high-density genetic map(Fig. 1) from which studies of genotype-phe-notype associations for quantitative trait locusdetection are performed.
This high-density map has been incorpo-rated into WebQTL (Wang et al., 2003).
Literature Review
The construction of the BXD published phe-notype database was largely based on aMedline search for “BXD” and “recombinantinbred mice.” Unpublished results and addi-tional sources were identified by personal com-munications with several of the authors of thesestudies who have also participated in the sub-mission of new and revised trait data. All dataare available in a Filemaker Pro database(www.nervenet.org) that contains links toPubMed for direct access to the original refer-ence, and have also been incorporated inWebQTL. In the event that data were not tab-ulated but presented graphically, a verniercaliper was used to estimate trait means in eachstrain. The assembly of this database is an ongo-ing effort that will increase in value with com-munity input.
Genetic Correlation Analysis
Pearson’s product moment correlations orSpearman’s rank correlations were used toobtain correlations between published BXDphenotypes and the 12,422 gene expressiontraits measured on the Affymetrix arrays.Normal probability plots of each phenotypeallow the user to determine whether theassumptions of normality may be met by eachphenotype. Scatterplots, linked from the cor-
05/Chesler343-358F 10/2/03 1:22 PM Page 347
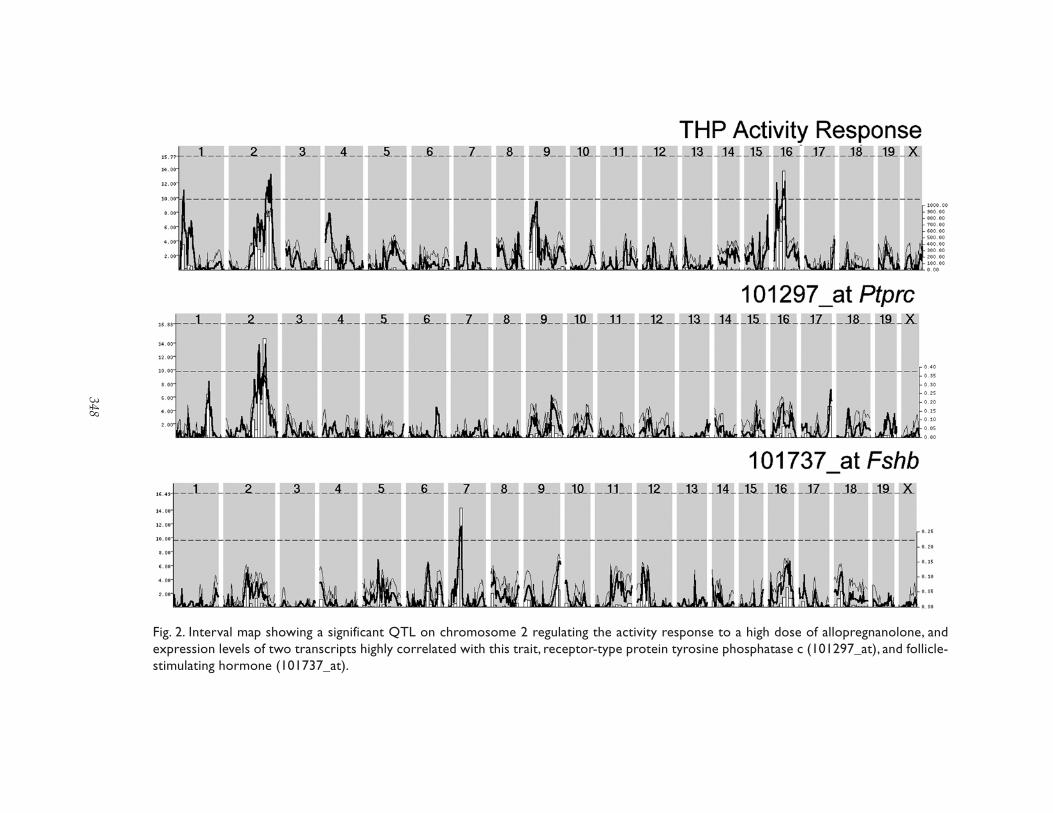
Fig. 2. Interval map showing a significant QTL on chromosome 2 regulating the activity response to a high dose of allopregnanolone, andexpression levels of two transcripts highly correlated with this trait, receptor-type protein tyrosine phosphatase c (101297_at), and follicle-stimulating hormone (101737_at).
348
05/Chesler343-358F 10/2/03 1:22 PM Page 348

Volume 1, 2003 _______________________________________________________________ Neuroinformatics
Genetic Correlates of Gene Expression _________________________________________________________349
relation display, allow visual assessment of thelinearity of the relationship. P-values were cal-culated from Fishers R-Z transformation, andcontrol of the false discovery rate is imple-mented to guard against the high potentialType I error rate due to multiple testing. Allanalyses can be performed at www.webqtl.org.
Results
WebQTL (Wang et al., 2003) allows full textsearching for traits of interest. The user maystart with a search for either a transcript orbehavioral trait of interest (Fig. 2), or by enter-ing novel trait data for comparison with pre-viously published traits.
Interval mapping of the traits can be per-formed in WebQTL using recently developedhigh-density genotype resources (Fig. 3). Afew examples are illustrated in Figs. 2 and 3.
Genetic Correlations and TranscriptionRegulatory Quantitative Trait Loci
The activity response to a high dose of THP(allopregnanolone) is regulated by a sugges-tive quantitative trait locus (QTL) on chromo-some 2 and two other suggestive QTLs, one onproximal chromosome 9 and proximal chro-mosome 16 (Fig. 2; Palmer et al., 2002).Mapping the QTL locations of several of thecorrelated transcripts shows that some mayshare a common genetic mediation, e.g., thereceptor protein tyrosine phosphatase, Ptprc(101297_at). It should be noted that this asso-ciation may be spurious, i.e., that the strain dis-tribution pattern of the trait values are similar,and thus they map to roughly the same loca-tions. Other highly correlated transcriptsincluding FSHb (101737_at) do not have regu-latory QTLs in these regions (Fig. 2). These cor-relations may indicate an important role forthese genes in the trait, for example, that high-er levels of FSH may alter plasma progesteronelevels and thus affect brain neurosteroid metab-
olism. Indeed, the FSHb gene is located in theregulatory region for the THP-induced activi-ty response.
Genetic Correlations by Position
Querying the Published Phenotypes for theterm “seizure” results in the retrieval of sev-eral types of seizures: high pressure-induced(Plomin et al., 1991), audiogenic (Neumannand Seyfried, 1990), spontaneous and drug-withdrawal handling-induced convulsion(Buck et al., 1997), and cocaine-inducedseizures (Hain et al., 2000). Each of these traitswas re-mapped using an interval mapping pro-cedure with our high-density genotype map(Fig. 3). A significant QTL was identified onchromosome 17 for high pressure-inducedseizures, whereas the audiogenic seizures havecommon mediation by a locus on chromosome12 (Neumann and Seyfried, 1990). Running agenetic correlation of this trait with geneexpression, sorted by position, reveals thatmany major histocompatibilty 2 transcripts arecorrelated with high pressure seizures, all ofwhich map to chromosome 17. Though theseproteins have been related to seizure, the resultof correlation analysis is associative, and notnecessarily causal. Thus, such a finding mightbe explained by a genetic difference in process-es resulting in elevated type I HLA levels,which also causes seizures, for example, glialscar formation (Beach et al., 1995). An alterna-tive explanation is that this cluster of genes isregulated by a cis-acting locus on chromosome17, which might be tightly linked to the locusregulating seizure phenotypes, such as theGABA B-1 receptor (Probe Set 102170_at), alsoon chromosome 17 and correlated with theseizure phenotype. Alternatively, a gene noton the Affymetrix array, linked to these regionsmay be involved in the phenotype. These canbe explored directly through WebQTLvia linksfrom the interval map graphic display output.The human mGLuR4 gene, linked to both
05/Chesler343-358F 10/2/03 1:22 PM Page 349

Fig. 3. Interval maps for eight published seizure phenotypes, showing different loci regulating high-pressure seizure, audiogenic seizure, han-dling induced convulsion,pentylenetetrazol-induced seizures,ethanol withdrawal effects on handling induced convulsions,and clonic cocaine-induced seizure.
350
05/Chesler343-358F 10/2/03 1:22 PM Page 350

Volume 1, 2003 _______________________________________________________________ Neuroinformatics
Genetic Correlates of Gene Expression _________________________________________________________351
GABAbR1 and the major histocompatibilitycomplex has also been shown to be involvedin epilepsy (Wong et al., 2001). Several non-mutually exclusive hypotheses for chromo-some 17 candidate genes are thus supportedby mapping data, by transcription QTL analy-sis, by gene expression correlations, and by theliterature, all of which are amenable to furthertesting.
Correlations Among PublishedPhenotypes and Gene Expression
Even in the absence of a strong QTL, genet-ic correlation analysis can reveal genes that
have expression levels associated with a par-ticular phenotype. The lack of a statisticallysignificant genetic locus mediating the traitdoes not preclude the existence of genetic vari-ation in the trait and association with geneexpression. The corticosterone response toethanol in females (Roberts et al., 1995) waschosen for this illustration because gene expres-sion measurements were performed in females.This trait correlates highly with similar meas-urements obtained in males, and interesting-ly, with Bacillus Calmette-Guerin (BCG)-induced anergy and mossy fiber measurementsin the hippocampus (Fig. 4).
Fig. 4. Results from correlation of published phenotypes with the corticosterone response to ethanol.
05/Chesler343-358F 10/2/03 1:22 PM Page 351
352 _____________________________________________________________________________Chesler et al.
Neuroinformatics _______________________________________________________________ Volume 1, 2003
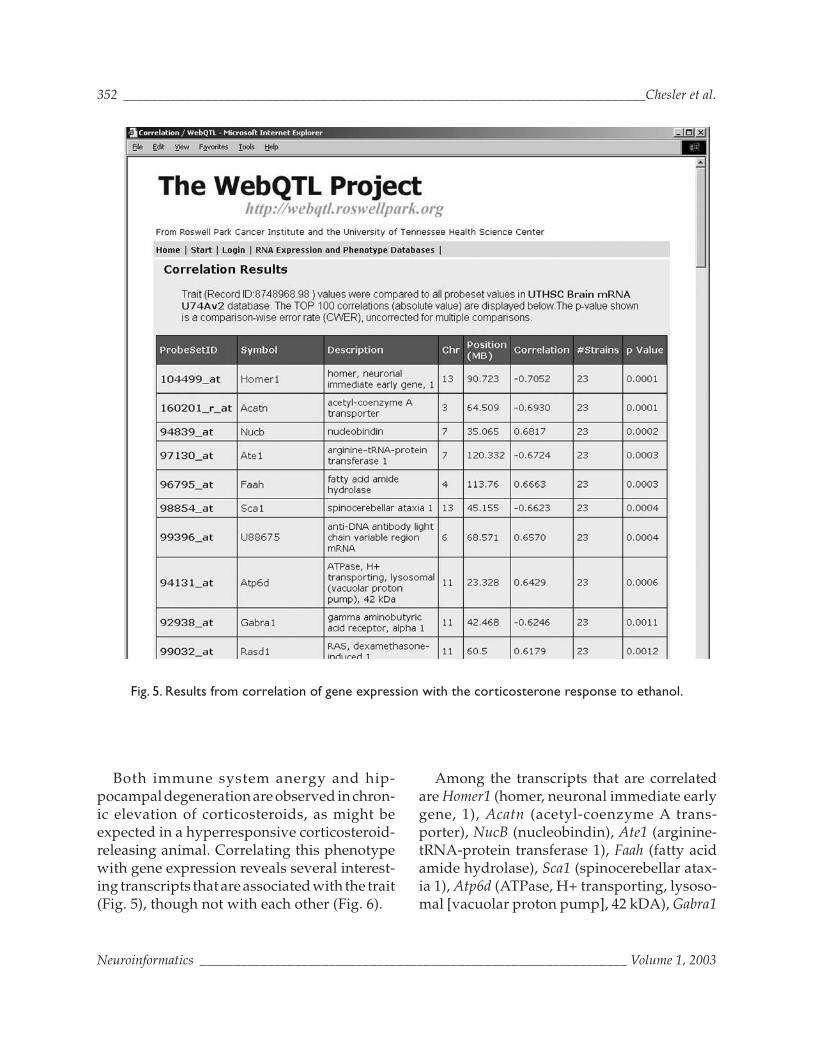
Both immune system anergy and hip-pocampal degeneration are observed in chron-ic elevation of corticosteroids, as might beexpected in a hyperresponsive corticosteroid-releasing animal. Correlating this phenotypewith gene expression reveals several interest-ing transcripts that are associated with the trait(Fig. 5), though not with each other (Fig. 6).
Among the transcripts that are correlatedare Homer1 (homer, neuronal immediate earlygene, 1), Acatn (acetyl-coenzyme A trans-porter), NucB (nucleobindin), Ate1 (arginine-tRNA-protein transferase 1), Faah (fatty acidamide hydrolase), Sca1 (spinocerebellar atax-ia 1), Atp6d (ATPase, H+ transporting, lysoso-mal [vacuolar proton pump], 42 kDA), Gabra1
Fig. 5. Results from correlation of gene expression with the corticosterone response to ethanol.
05/Chesler343-358F 10/2/03 1:22 PM Page 352

Volume 1, 2003 _______________________________________________________________ Neuroinformatics
Genetic Correlates of Gene Expression _________________________________________________________353
(gamma amino-butyric acid receptor, α1), andRasd1 (Ras, dexamethasone-induced 1).
Gene-to-Gene Correlations
Gene-to-gene correlations can be performedusing WebQTLand can be quite useful in reveal-ing pathway members. Performing a genetic
correlation of the trait Bag5 expression to thegene expression database reveals large num-bers of oxidative stress and apoptosis-relatedtranscripts. Several hundred of the correlationsare greater than 0.6 and less than –0.6, andinclude many apoptosis-related transcripts,oxidation-related mitochondrial transcripts,
Fig. 6. Scatterplot matrix of expression levels of known genes on the Affymetrix array and the corticosteroneresponse to ethanol. Each circle represents the x–y plotted strain means for a pair of traits.The best-fit least-squares regression line through the points is indicated. Frequency histograms of trait values are representedalong the diagonal.Though each gene correlates with the phenotype (first column of plots), expression is notnecessarily correlated between genes (e.g., Sca1 and Homer1).
05/Chesler343-358F 10/2/03 1:22 PM Page 353

354 _____________________________________________________________________________Chesler et al.
Neuroinformatics _______________________________________________________________ Volume 1, 2003
peroxidases and ionotropic receptor proteins,and ion channel proteins which suggest genet-ic differences in excitatory oxidative stress.
DiscussionIn this report, we demonstrate a new web-
based interface for the study of genetic corre-lations in recombinant inbred mice. Theevaluation of trait-to-trait relationships ingenetically identical mice allows the study ofpleiotropic effects—regulation of multipletraits by single genes. Ordinary neurogeneticinquiry focuses on single-gene to single-traithypotheses, with occasional forays into epis-tasis and multiple trait mapping. In contrast,this resource allows identification of novelassociations between traits, including thou-sands of transcript expression levels. It is ourhope that this becomes a true communityresource, and that users submit trait data fol-lowing instructions found from the databaseinfo link (http://www.webqtl.org/PublishDB.html).
The interpretations of genetic correlationsare many, and this resource can be importantin generation of mechanistic hypotheses froma variety of sources. The association of phe-notypes using a family-means approach ingenetically identical mice can indicate sharedgenetic mediation of phenotypes, and directidentification of some of the associated genesis possible. Using positional information aboutthe transcripts, support for candidate genesunderlying QTLs can be evaluated based ontheir association with traits. It should be notedthat such information is not exclusionary, norare expression differences an obligatory resultof trait-relevant polymorphisms. While genet-ic correlations can indicate a causal relation-ship between gene expression and other traits,the relationship may also be due to shared asso-ciation of the two correlated traits with a thirdvariable, for example, shared linkage to a mark-er-strain distribution pattern, common envi-
ronment, or technical influences. Despite thesecaveats to the interpretation of genetic corre-lation results, this synthesis of data, made pos-sible only because of the fixed and definablestatus of recombinant inbred mice, providesmuch useful information about potentialpleiotropic effects of segregating polymor-phisms.
Genetic correlation analysis of gene expres-sion and previously published phenotypes cannow be performed using the WebQTL inter-face. This resource allows complex trait map-ping and features links to existingbioinformatics resources, including locus linkfor further exploration of gene specific infor-mation, PubMed for published phenotyperelated information, and UCSC GenomeBrowser links for locus-specific information.The environment allows integration of exist-ing molecular genetic information with traitdata of a global organismic scope.
Using the relationships between genotype,gene expression, and behavior in three data-bases created in the same recombinant inbredstrain set, advances in genome analysis tech-nology have been applied to the reanalysis oftraits that have been historically importantfoundations in neuroscientific research.Directly building on these early achievementsis possible by using bioinformatics approach-es to pull together newly developed resourcesand tools with the wide body of previousresults in the field. As complete genomesequences in both of these strains become avail-able, the exact locations of SNPs, which maybe responsible for these phenotypic differences,will be determined. Large-scale proteomicmethods can also be applied to these strain sets.
In contrast to other approaches involvingoutbred mice and experimental mapping cross-es bred for individual experiments, mice offixed genotypes facilitate the evaluation oftraits under a variety of conditions. The influ-ence of testing environment has been dramat-
05/Chesler343-358F 10/2/03 1:22 PM Page 354
Volume 1, 2003 _______________________________________________________________ Neuroinformatics
Genetic Correlates of Gene Expression _________________________________________________________355
ically demonstrated by Crabbe and colleagues,testing inbred mice on several widely usedbehavioral assays in three different laborato-ries (Crabbe et al., 1999). While this has beenpessimistically viewed by some to indicate thelack of generalizability of behavioral assess-ment in mice, it has also effectively empha-sized the ability to examine the stability of traitsacross environments using inbred strains.Though the combination of data across labo-ratories might result in both false positive andfalse negative correlations of traits, the studyof traits in multiple environments in geneti-cally similar mice presents us with a uniqueability to evaluate genes by environment inter-actions. Highly heritable behaviors such aslocomotor activity are strongly correlateddespite their study in multiple laboratories,whereas less heritable traits, such as ethanolwithdrawal effects, are not as strongly corre-
lated. By mining inbred strain data assembledthrough relational data models, archival datasets spanning long periods have been usedtogether for identification of the particular lab-oratory influences on behavioral traits (Chesleret al., 2002 a,b).
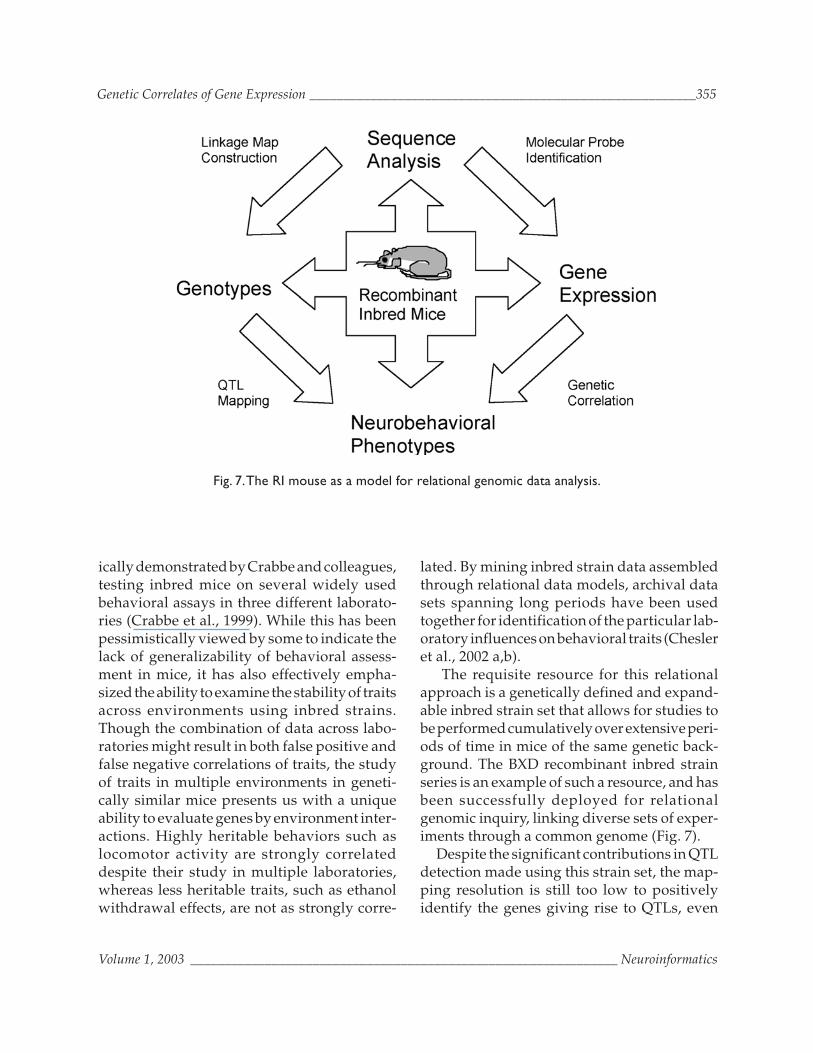
The requisite resource for this relationalapproach is a genetically defined and expand-able inbred strain set that allows for studies tobe performed cumulatively over extensive peri-ods of time in mice of the same genetic back-ground. The BXD recombinant inbred strainseries is an example of such a resource, and hasbeen successfully deployed for relationalgenomic inquiry, linking diverse sets of exper-iments through a common genome (Fig. 7).
Despite the significant contributions in QTLdetection made using this strain set, the map-ping resolution is still too low to positivelyidentify the genes giving rise to QTLs, even
Fig. 7.The RI mouse as a model for relational genomic data analysis.
05/Chesler343-358F 10/2/03 1:22 PM Page 355

356 _____________________________________________________________________________Chesler et al.
Neuroinformatics _______________________________________________________________ Volume 1, 2003
with improved marker maps. The addition ofmore BXD strains is in progress, and willincrease resolution approx two- to threefold.Development of an even more refined, genet-ically diverse, high-sample size, high-resolu-tion strain set has been suggested (Threadgillet al., 2002). A recent proposal by the complextrait consortium for a community-wide recom-binant inbred cross derived from 8-progeni-tors (www.complextrait.org) may result in amapping panel with 1024 genetically retriev-able inbred strains with adequate power formapping and analysis of epistatic effects(Vogel, 2003). The power of this proposed strainset would increase the resolution of QTL map-ping to levels amenable to cloning of QTLs.While the relational approach described herecan be extended to newly developed or expand-ed recombinant inbred strain sets, the earlypublished phenotype data itself will be morechallenging to directly incorporate. However,its value in the design of future studies shouldnot be underestimated. Historical data canserve to select a subset of these strains for analy-sis, chosen to maximize resolution in theregions of suggestive linkage identified in ear-lier studies. Transcript level data might also bea point of integration for phenotypic data fromnew and old strains, allowing users to gener-ate predictive hypotheses about gene expres-sion correlates with neurobehavioral traits.
WebQTL provides a structure for associa-tion of these diverse sources of data all tiedtogether by a shared genome. The use of aninternet-based collaborative data-mining toolwill facilitate communication of researchresults, not just via data sharing and rapidonline publicizing of results, but in the abilityto engage in on-the-fly assessment of the inter-face of new findings with previous research.Thus, novel results can be immediately evalu-ated in the context of previous research in thefield, leading to multiplicative integration ofthe growing body of findings in mousegenomics.
Acknowledgments
The authors gratefully acknowledge Dr. JohnCrabbe for curating the many traits studied byresearchers at Oregon Health SciencesUniversity, and Mary Kathleen Sullivan for herassistance in compiling the database. This workis a human brain project funded jointly by theNIMH, NIDA, and NSF (P20-MH62009 to KFMand RW), and is also supported by INIAgrantsVOIAA13499 and V24AA13513 and theWilliam and Dorothy Dunavant Endowmentin Pediatrics.
ReferencesAirey, D. C., Lu, L., Williams, R. W. (2001) Genetic
control of the mouse cerebellum: identificationof quantitative trait loci modulating size andarchitecture. J. Neurosci. 21, 5099–5109.
Beach, T. G., Woodhurst, W. B., MacDonald, D. B.,Jones, M. W. (1995) Reactive microglia in hip-pocampal sclerosis associated with human tem-poral lobe epilepsy. Neurosci. Lett. 191, 27–30.
Belknap, J. K. (1998). Effect of within-strain samplesize on QTLdetection and mapping using recom-binant inbred mouse strains. Behav. Genet. 28,29–38.
Buck, K. J., Metten, P., Belknap, J. K., Crabbe, J. C.(1997) Quantitative trait loci involved in genet-ic predisposition to acute alcohol withdrawal inmice. J. Neurosci. 17, 3946–3955.
Chesler, E. J., Wilson, S. G., Lariviere, W. R.,Rodriguez-Zas, S. L., Mogil, J. S. (2002a)Influences of laboratory environment on behav-ior. Nat. Neurosci. 5, 1101–1102.
Chesler, E. J., Wilson, S. G., Lariviere, W. R.,Rodriguez-Zas, S. L., Mogil, J. S. (2002b)Indentification and ranking of genetic and lab-oratory environment factors influencing a behav-ioral trait, thermal nociception, viacomputational analysis of a large datta archive.Neurosci. Biohav. Rev. 26, 907–923.
Chesler, E. J., Rodriguez-Zas, S. L., Mogil, J. S. (2001)In silico mapping of mouse quantitative trait loci.Science. 294, 2423.
Crabbe, J. C., Belknap, J. K., Buck, K. J., Metten, P.(1994) Use of recombinant inbred strains forstudying genetic determinants of responses toalcohol. Alcohol. Suppl. 2, 67–71.
05/Chesler343-358F 10/2/03 1:22 PM Page 356

Volume 1, 2003 _______________________________________________________________ Neuroinformatics
Genetic Correlates of Gene Expression _________________________________________________________357
Crabbe, J. C., Kosobud, A., Young, E. R., Janowsky,J. S. (1983) Polygenic and single-gene determi-nation of responses to ethanol in BXD/Ty recom-binant inbred mouse strains. Neurobehav.Toxicol. Teratol. 5, 181–187.
Crabbe, J. C., Wahlsten, D., Dudek, B. C. (1999)Genetics of mouse behavior: interactions withlaboratory environment. Science 284, 1670–1672.
Darvasi, A. (2001) In silico mapping of mouse quan-titative trait loci. Science 294, 2423.
Hain, H. S., Crabbe, J. C., Bergeson, S.E., Belknap,J. K. (2000) Cocaine-induced seizure thresholds:quantitative trait loci detection and mapping intwo populations derived from the C57BL/6 andDBA/2 mouse strains. J. Pharmacol. Exp. Ther.293, 180–187.
Hamer, D. (2002) Genetics. Rethinking behaviorgenetics. Science 298, 71–72.
Hitzemann, R., Hitzemann, B., Rivera, S., et al.(2003) Dopamine D2 Receptor binding, Drd2Expression and the number of dopamine neu-rons in the BXD recombinant inbred series:Genetic relationships to alcohol and other drugrelated phenotypes. Alc. Clin. Exp. Res. 27, 1–11.
Janowsky, A., Mah, C., Johnson, R. A., et al. (2001)Mapping genes that regulate density ofdopamine transporters and correlated behaviorsin recombinant inbred mice. J. Pharmacol. Exp.Ther. 298, 634–643.
Kirstein, S.L., Davidson, K.L., Ehringer, M.A.,Sikela, J.M., Erwin, V.G., Tabakoff, B. (2002)Quantitative trait loci affecting initial sensitivi-ty and acute functional tolerance to ethanol-induced ataxia and brain cAMPsignaling in BXDrecombinant inbred mice. J. Pharmacol. Exp.Ther. 302, 1238–1245.
Le Roy, I., Roubertoux, P.L., Jamot, L., et al. (1998)Neuronal and behavioral differences betweenMus musculus domesticus (C57BL/6JBy) andMus musculus castaneus (CAST/Ei). Behav.Brain Res. 95, 135–142.
Neumann, P.E., Seyfried, T. N. (1990) Mapping oftwo genes that influence susceptibility to audio-
genic seizures in crosses of C57BL/6J andDBA/2J mice. Behav. Genet. 20, 307–323.
Paigen, K., Eppig, J. T. (2000) A mouse phenomeproject. Mamm Genome. 11, 715–717.
Palmer A. A., Miller M. N., McKinnon C. S., PhillipsT. J. (2002) Sensitivity to the locomotor stimulanteffects of ethanol and allopregnanolone is influ-enced by common genes. Behav. Neurosci. 116,126–127.
Plomin, R., McClearn, G.E., Gora-Maslak, G.,Neiderhiser, J.M. (1991) Use of recombinantinbred strains to detect quantitative trait lociassociated with behavior. Behav. Genet. 21,99–116.
Roberts, A. J., Phillips, T. J., Belknap, J. K., Finn, D.A., Keith, L. D. (1995) Genetic analysis of the cor-ticosterone response to ethanol in BXD recom-binant inbred mice. Behav. Neurosci. 109,1199–1208.
Threadgill, D. W., Hunter, K. W., Williams, R. W.(2002) Genetic dissection of complex and quan-titative traits: from fantasy to reality via a com-munity effort. Mamm. Gen. 13, 175–178.
Vogel, G. (2003) Genetics. Scientists dream of 1001complex mice. Science 301, 456–457.
Wang, J., Williams, R. W., and Manly, K. F. (2003)WebQTL: Web-based complex trait analysis.Neuroinformatics 1, 299–308.
Williams, R. W., Gu, J., Qi, S., Lu, L. (2001a) Thegenetic structure of recombinant inbred mice:high-resolution consensus maps for complextrait analysis. Genome Biol. 2, RESEARCH0046.
Williams, R. W., Airey, D. C., Kulkarni, A., Zhou,G., Lu, L. (2001b) Genetic dissection of the olfac-tory bulbs of mice: QTLs on four chromosomesmodulate bulb size. Behav. Genet. 31, 61–77.
Wong, C. G, Scherer, S. W., Snead, O. C. 3rd,Hampson, D. R. (2001) Localization of the humanmGluR4 gene within an epilepsy susceptibilitylocus(1). Brain Res. Mol. Brain Res. 87, 109–116.
05/Chesler343-358F 10/2/03 1:22 PM Page 357

05/Chesler343-358F 10/2/03 1:22 PM Page 358
Copyright © 2022 FDOKUMEN