Genome Wide Analysis of Inbred Mouse Lines Identifies a ...
10
Bopp, S.E.R. et al. (2010) Genome wide analysis of inbred mouse lines identifies a locus containing Ppar-γ as contributing to enhanced malaria surviva. PLoS ONE, 5 (5). e10903. ISSN 1932-6203 http://eprints.gla.ac.uk/42639/ Deposited on: 10 January 2012 Enlighten – Research publications by members of the University of Glasgow http://eprints.gla.ac.uk
-
Upload
khangminh22 -
Category
Documents
-
view
0 -
download
0
Transcript of Genome Wide Analysis of Inbred Mouse Lines Identifies a ...
Bopp, S.E.R. et al. (2010) Genome wide analysis of inbred mouse lines identifies a locus containing Ppar-γ as contributing to enhanced malaria surviva. PLoS ONE, 5 (5). e10903. ISSN 1932-6203 http://eprints.gla.ac.uk/42639/ Deposited on: 10 January 2012
Enlighten – Research publications by members of the University of Glasgow http://eprints.gla.ac.uk
Genome Wide Analysis of Inbred Mouse Lines Identifies aLocus Containing Ppar-c as Contributing to EnhancedMalaria SurvivalSelina E. R. Bopp1*., Vandana Ramachandran1,2., Kerstin Henson1,3, Angelina Luzader3, Merle
Lindstrom3, Muriel Spooner3, Brian M. Steffy4, Oscar Suzuki4, Chris Janse5, Andrew P. Waters6, Yingyao
Zhou3, Tim Wiltshire4, Elizabeth A. Winzeler1,3
1 Department of Cell Biology, The Scripps Research Institute, La Jolla, California, United States of America, 2 Institute of Medical Biology, Singapore, Singapore, 3 The
Genomics Institute of the Novartis Foundation, La Jolla, California, United States of America, 4 Department of Pharmacotherapy and Experimental Therapeutics, University
of North Carolina School of Pharmacy, Chapel Hill, North Carolina, United States of America, 5 Leiden University Medical Center, Leiden, Netherlands, 6 Glasgow
Biomedical Research Centre, University of Glasgow, Glasgow, United Kingdom
Abstract
The genetic background of a patient determines in part if a person develops a mild form of malaria and recovers, ordevelops a severe form and dies. We have used a mouse model to detect genes involved in the resistance or susceptibilityto Plasmodium berghei malaria infection. To this end we first characterized 32 different mouse strains infected with P.berghei and identified survival as the best trait to discriminate between the strains. We found a locus on chromosome 6 bylinking the survival phenotypes of the mouse strains to their genetic variations using genome wide analyses such ashaplotype associated mapping and the efficient mixed-model for association. This new locus involved in malaria resistancecontains only two genes and confirms the importance of Ppar-c in malaria infection.
Citation: Bopp SER, Ramachandran V, Henson K, Luzader A, Lindstrom M, et al. (2010) Genome Wide Analysis of Inbred Mouse Lines Identifies a Locus ContainingPpar-c as Contributing to Enhanced Malaria Survival. PLoS ONE 5(5): e10903. doi:10.1371/journal.pone.0010903
Editor: Denise L. Doolan, Queensland Institute of Medical Research, Australia
Received February 17, 2010; Accepted May 5, 2010; Published May 28, 2010
Copyright: � 2010 Bopp et al. This is an open-access article distributed under the terms of the Creative Commons Attribution License, which permitsunrestricted use, distribution, and reproduction in any medium, provided the original author and source are credited.
Funding: EAW was supported by the W.M. Keck Foundation (www.wmkeck.org). The funders had no role in study design, data collection and analysis, decisionto publish, or preparation of the manuscript.
Competing Interests: The authors have declared that no competing interests exist.
* E-mail: [email protected]
. These authors contributed equally to this work.
Introduction
Malaria infection by Plasmodium falciparum causes a variety of
symptoms ranging from mild to severe. Previous studies suggest
that the host genetic background plays an important role in
susceptibility or resistance to severe malaria. Co-evolution of host
and parasite has led to a wide variation of host-factors that
influence the outcome of the infection. Alleles associated with
sickle cell anemia, thalassemias, glucose-6-phosphate dehydroge-
nase deficiency, certain HLA haplotypes as well as allelic variants
in the tumor necrosis factor cytokine and the CD36 scavenger
receptor are all associated with resistance or susceptibility to
malaria [1,2,3,4,5] and are found at higher frequencies in
populations historically at risk for developing malaria.
In addition, several linkage studies using rodent malaria models
related control of parasite levels in P. chabaudi infections to different
malaria resistance quantitative trait loci (QTLs) (char1-10) on
various chromosomes [6,7,8,9,10,11,12,13]. Studies with P. yoelii
confirmed the char1 locus on chromosome 9 [14]. In addition, five
loci have been associated with the development of experimental
cerebral malaria (ECM) in P. berghei infections (berr1–5, cmsc and
a locus on chromosome 18)[15,16,17,18,19] and one locus with
malaria liver stage susceptibility (belr1) [20].
Traditional QTL analyses, typically an F2 cross, involving mice
of two different parental origins are labor intensive and usually
identify loci with dozens or hundreds of gene candidates. This is
largely due to the limited genetic resolution of an F2 cross, unless
large numbers of mice are used, and the fact that standard F2
crosses do not interrogate all of the available genetic and
phenotypic variance in the mouse genome. On the other hand
inbred mouse strains can be used to survey a wider array of
phenotypic and genotypic differences. The inbred mouse strains
are genetically identical within a strain largely as a result of
breeding to homozygosity. As most are descended from relatively
few progenitor lines they share haplotypes with one another. The
haplotype structure of each of these strains has now been
determined using dense sets of single nucleotide polymorphisms
(SNPs) [21,22]. Performing a phenotypic strain survey across
inbred lines and then correlating phenotypic variations with the
identified shared haplotype patterns or the SNPs directly, it is
possible to map the genetic basis of a trait to a physical location
in silico, in a process termed haplotype associated mapping
(HAM) [23,24] or efficient mixed-model for association (EMMA)
mapping [25].
We used a lethal murine malaria model with P. berghei ANKA, a
rodent malaria parasite. We infected mice from 32 different strains
and measured various parameters such as body temperature,
sequestration and survival. HAM and EMMA analysis were used
to map the locus underlying survival after P. berghei infection in 32
different inbred mouse strains. The newly identified locus on
PLoS ONE | www.plosone.org 1 May 2010 | Volume 5 | Issue 5 | e10903
chromosome 6 (berghei resistance locus 6, berr6) consists of only two
genes and is thus much smaller than those identified with standard
crosses.
There are very few complex traits that have been assayed in such
a great number of strains and this is the first time a locus for malaria
susceptibility has been identified with such a large-scale study. The
strength of this analysis lies in the reduction of the normally large
regions containing several hundred genes identified by conventional
genetic analysis of a F2 cross to very narrow peaks with only a few
possible gene candidates. In addition, we have generated a library of
malaria-related phenotypes for uncharacterized mouse strains.
Results
Characterization of P. berghei ANKA infection in 32different mouse strains
To identify genes involved in resistance or susceptibility to P.
berghei infections we analyzed body temperature, schizont-load in
organs, and survival in eight mice (four females and four males)
from each of 32 inbred mouse strains. A list of the mouse strains
with their group association and statistical analyses for all
quantified phenotypes are summarized in Table S1.
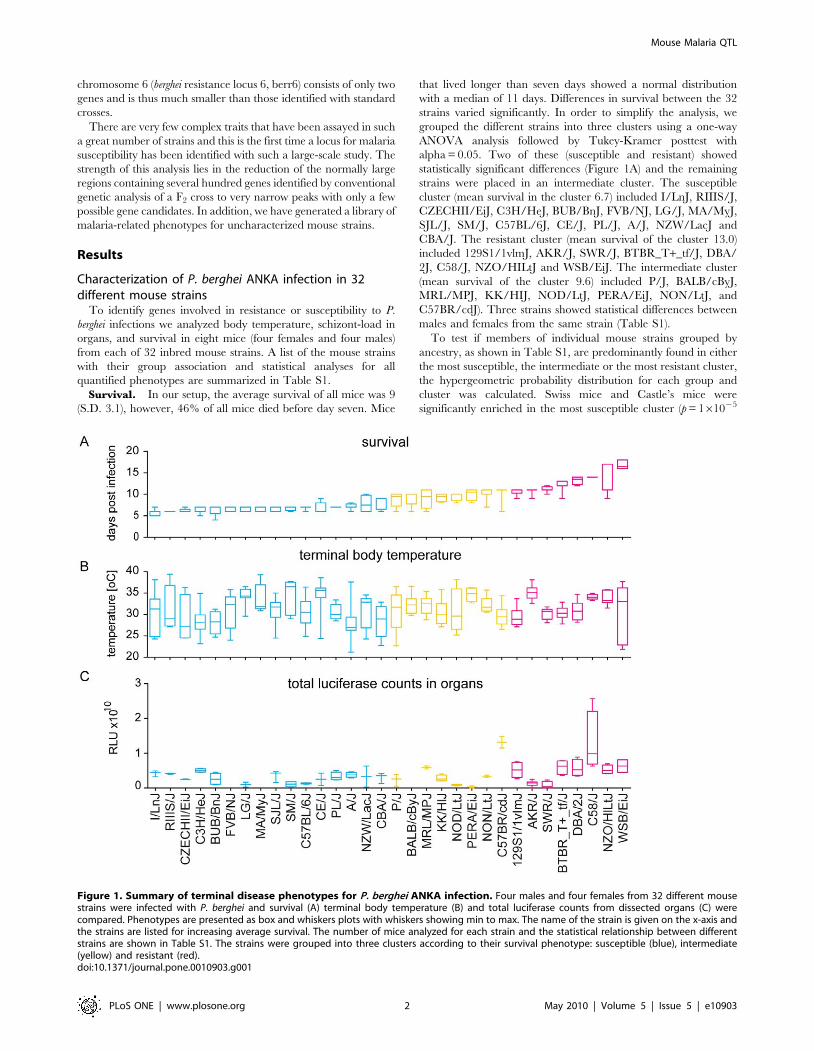
Survival. In our setup, the average survival of all mice was 9
(S.D. 3.1), however, 46% of all mice died before day seven. Mice
that lived longer than seven days showed a normal distribution
with a median of 11 days. Differences in survival between the 32
strains varied significantly. In order to simplify the analysis, we
grouped the different strains into three clusters using a one-way
ANOVA analysis followed by Tukey-Kramer posttest with
alpha = 0.05. Two of these (susceptible and resistant) showed
statistically significant differences (Figure 1A) and the remaining
strains were placed in an intermediate cluster. The susceptible
cluster (mean survival in the cluster 6.7) included I/LnJ, RIIIS/J,
CZECHII/EiJ, C3H/HeJ, BUB/BnJ, FVB/NJ, LG/J, MA/MyJ,
SJL/J, SM/J, C57BL/6J, CE/J, PL/J, A/J, NZW/LacJ and
CBA/J. The resistant cluster (mean survival of the cluster 13.0)
included 129S1/1vlmJ, AKR/J, SWR/J, BTBR_T+_tf/J, DBA/
2J, C58/J, NZO/HILtJ and WSB/EiJ. The intermediate cluster
(mean survival of the cluster 9.6) included P/J, BALB/cByJ,
MRL/MPJ, KK/HIJ, NOD/LtJ, PERA/EiJ, NON/LtJ, and
C57BR/cdJ). Three strains showed statistical differences between
males and females from the same strain (Table S1).
To test if members of individual mouse strains grouped by
ancestry, as shown in Table S1, are predominantly found in either
the most susceptible, the intermediate or the most resistant cluster,
the hypergeometric probability distribution for each group and
cluster was calculated. Swiss mice and Castle’s mice were
significantly enriched in the most susceptible cluster (p = 161025
Figure 1. Summary of terminal disease phenotypes for P. berghei ANKA infection. Four males and four females from 32 different mousestrains were infected with P. berghei and survival (A) terminal body temperature (B) and total luciferase counts from dissected organs (C) werecompared. Phenotypes are presented as box and whiskers plots with whiskers showing min to max. The name of the strain is given on the x-axis andthe strains are listed for increasing average survival. The number of mice analyzed for each strain and the statistical relationship between differentstrains are shown in Table S1. The strains were grouped into three clusters according to their survival phenotype: susceptible (blue), intermediate(yellow) and resistant (red).doi:10.1371/journal.pone.0010903.g001
Mouse Malaria QTL
PLoS ONE | www.plosone.org 2 May 2010 | Volume 5 | Issue 5 | e10903
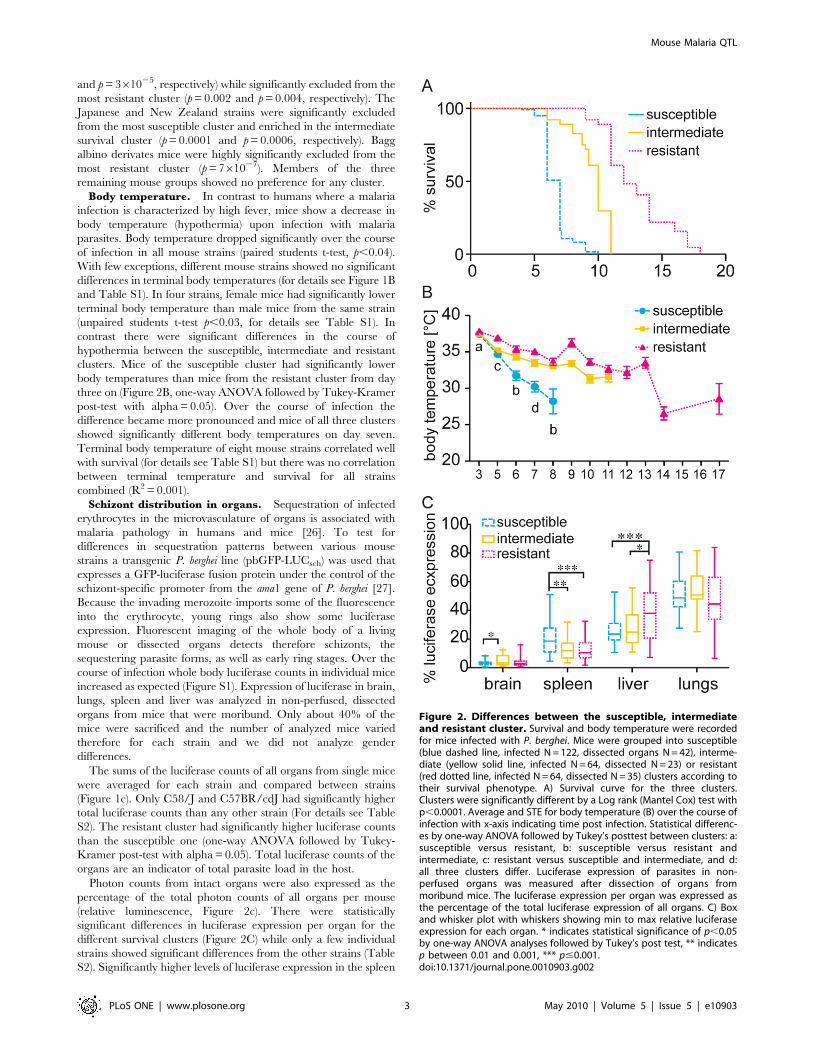
and p = 361025, respectively) while significantly excluded from the
most resistant cluster (p = 0.002 and p = 0.004, respectively). The
Japanese and New Zealand strains were significantly excluded
from the most susceptible cluster and enriched in the intermediate
survival cluster (p = 0.0001 and p = 0.0006, respectively). Bagg
albino derivates mice were highly significantly excluded from the
most resistant cluster (p = 761027). Members of the three
remaining mouse groups showed no preference for any cluster.
Body temperature. In contrast to humans where a malaria
infection is characterized by high fever, mice show a decrease in
body temperature (hypothermia) upon infection with malaria
parasites. Body temperature dropped significantly over the course
of infection in all mouse strains (paired students t-test, p,0.04).
With few exceptions, different mouse strains showed no significant
differences in terminal body temperatures (for details see Figure 1B
and Table S1). In four strains, female mice had significantly lower
terminal body temperature than male mice from the same strain
(unpaired students t-test p,0.03, for details see Table S1). In
contrast there were significant differences in the course of
hypothermia between the susceptible, intermediate and resistant
clusters. Mice of the susceptible cluster had significantly lower
body temperatures than mice from the resistant cluster from day
three on (Figure 2B, one-way ANOVA followed by Tukey-Kramer
post-test with alpha = 0.05). Over the course of infection the
difference became more pronounced and mice of all three clusters
showed significantly different body temperatures on day seven.
Terminal body temperature of eight mouse strains correlated well
with survival (for details see Table S1) but there was no correlation
between terminal temperature and survival for all strains
combined (R2 = 0.001).
Schizont distribution in organs. Sequestration of infected
erythrocytes in the microvasculature of organs is associated with
malaria pathology in humans and mice [26]. To test for
differences in sequestration patterns between various mouse
strains a transgenic P. berghei line (pbGFP-LUCsch) was used that
expresses a GFP-luciferase fusion protein under the control of the
schizont-specific promoter from the ama1 gene of P. berghei [27].
Because the invading merozoite imports some of the fluorescence
into the erythrocyte, young rings also show some luciferase
expression. Fluorescent imaging of the whole body of a living
mouse or dissected organs detects therefore schizonts, the
sequestering parasite forms, as well as early ring stages. Over the
course of infection whole body luciferase counts in individual mice
increased as expected (Figure S1). Expression of luciferase in brain,
lungs, spleen and liver was analyzed in non-perfused, dissected
organs from mice that were moribund. Only about 40% of the
mice were sacrificed and the number of analyzed mice varied
therefore for each strain and we did not analyze gender
differences.
The sums of the luciferase counts of all organs from single mice
were averaged for each strain and compared between strains
(Figure 1c). Only C58/J and C57BR/cdJ had significantly higher
total luciferase counts than any other strain (For details see Table
S2). The resistant cluster had significantly higher luciferase counts
than the susceptible one (one-way ANOVA followed by Tukey-
Kramer post-test with alpha = 0.05). Total luciferase counts of the
organs are an indicator of total parasite load in the host.
Photon counts from intact organs were also expressed as the
percentage of the total photon counts of all organs per mouse
(relative luminescence, Figure 2c). There were statistically
significant differences in luciferase expression per organ for the
different survival clusters (Figure 2C) while only a few individual
strains showed significant differences from the other strains (Table
S2). Significantly higher levels of luciferase expression in the spleen
Figure 2. Differences between the susceptible, intermediateand resistant cluster. Survival and body temperature were recordedfor mice infected with P. berghei. Mice were grouped into susceptible(blue dashed line, infected N = 122, dissected organs N = 42), interme-diate (yellow solid line, infected N = 64, dissected N = 23) or resistant(red dotted line, infected N = 64, dissected N = 35) clusters according totheir survival phenotype. A) Survival curve for the three clusters.Clusters were significantly different by a Log rank (Mantel Cox) test withp,0.0001. Average and STE for body temperature (B) over the course ofinfection with x-axis indicating time post infection. Statistical differenc-es by one-way ANOVA followed by Tukey’s posttest between clusters: a:susceptible versus resistant, b: susceptible versus resistant andintermediate, c: resistant versus susceptible and intermediate, and d:all three clusters differ. Luciferase expression of parasites in non-perfused organs was measured after dissection of organs frommoribund mice. The luciferase expression per organ was expressed asthe percentage of the total luciferase expression of all organs. C) Boxand whisker plot with whiskers showing min to max relative luciferaseexpression for each organ. * indicates statistical significance of p,0.05by one-way ANOVA analyses followed by Tukey’s post test, ** indicatesp between 0.01 and 0.001, *** p#0.001.doi:10.1371/journal.pone.0010903.g002
Mouse Malaria QTL
PLoS ONE | www.plosone.org 3 May 2010 | Volume 5 | Issue 5 | e10903
were associated with susceptible strains while significantly higher
expression in the liver was associated with resistance. For statistical
details of the individual strains see Table S2. Overall the luciferase
expression was lowest in the brain, with intermediate mice
displaying higher luciferase expression than susceptible mice,
and highest in the lungs with no statistical differences between the
clusters. In agreement with the findings above, there was a
moderate negative correlation between survival and relative
luciferase expression in the spleen and a positive correlation
between survival and relative luciferase expression in the liver
(R2 = 0.14 and R2 = 0.18, respectively). Correlation for relative
luciferase expression in the remaining organs compared to
survival, and all organs compared to terminal body temperature
was low (R2.0.06).
In comparing the outcome of all the different phenotypic
analyses, survival clearly showed the most robust discrimination
between the different strains and pedigree groups (Figure 1).
Therefore, survival was used as trait in the following analyses of
the underlying genotype.
Genome wide analyses identify a locus linked to hostsurvival on chromosome 6
To link the survival phenotypes of the different inbred mouse
strains to their genotype, two different genome wide analysis
methods were used. The haplotype associated mapping (HAM)
algorithm uses ANOVA to calculate the strength of genetic
associations between an input phenotype and the ancestral
haplotype structure (as inferred using a local window of three
adjacent single nucleotide polymorphisms (SNPs) across the
genome). A weighted bootstrap method is used to detect
association peaks conditional on the population structure in the
mouse diversity panel. At each genetic locus, the association score
is represented as the negative log10-transformed P value. A score
of –Log10P = 6 is a maximal score resultant from 106 permutations
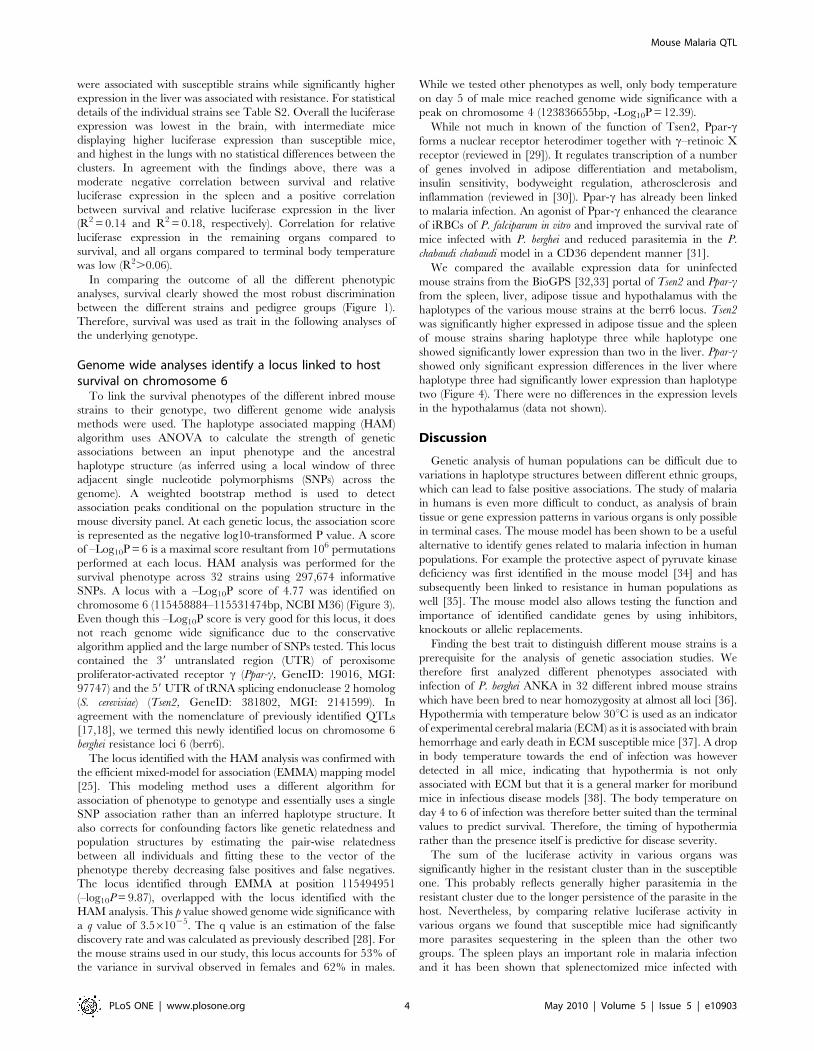
performed at each locus. HAM analysis was performed for the
survival phenotype across 32 strains using 297,674 informative
SNPs. A locus with a –Log10P score of 4.77 was identified on
chromosome 6 (115458884–115531474bp, NCBI M36) (Figure 3).
Even though this –Log10P score is very good for this locus, it does
not reach genome wide significance due to the conservative
algorithm applied and the large number of SNPs tested. This locus
contained the 39 untranslated region (UTR) of peroxisome
proliferator-activated receptor c (Ppar-c, GeneID: 19016, MGI:
97747) and the 59 UTR of tRNA splicing endonuclease 2 homolog
(S. cerevisiae) (Tsen2, GeneID: 381802, MGI: 2141599). In
agreement with the nomenclature of previously identified QTLs
[17,18], we termed this newly identified locus on chromosome 6
berghei resistance loci 6 (berr6).
The locus identified with the HAM analysis was confirmed with
the efficient mixed-model for association (EMMA) mapping model
[25]. This modeling method uses a different algorithm for
association of phenotype to genotype and essentially uses a single
SNP association rather than an inferred haplotype structure. It
also corrects for confounding factors like genetic relatedness and
population structures by estimating the pair-wise relatedness
between all individuals and fitting these to the vector of the
phenotype thereby decreasing false positives and false negatives.
The locus identified through EMMA at position 115494951
(–log10P = 9.87), overlapped with the locus identified with the
HAM analysis. This p value showed genome wide significance with
a q value of 3.561025. The q value is an estimation of the false
discovery rate and was calculated as previously described [28]. For
the mouse strains used in our study, this locus accounts for 53% of
the variance in survival observed in females and 62% in males.
While we tested other phenotypes as well, only body temperature
on day 5 of male mice reached genome wide significance with a
peak on chromosome 4 (123836655bp, -Log10P = 12.39).
While not much in known of the function of Tsen2, Ppar-cforms a nuclear receptor heterodimer together with c–retinoic X
receptor (reviewed in [29]). It regulates transcription of a number
of genes involved in adipose differentiation and metabolism,
insulin sensitivity, bodyweight regulation, atherosclerosis and
inflammation (reviewed in [30]). Ppar-c has already been linked
to malaria infection. An agonist of Ppar-c enhanced the clearance
of iRBCs of P. falciparum in vitro and improved the survival rate of
mice infected with P. berghei and reduced parasitemia in the P.
chabaudi chabaudi model in a CD36 dependent manner [31].
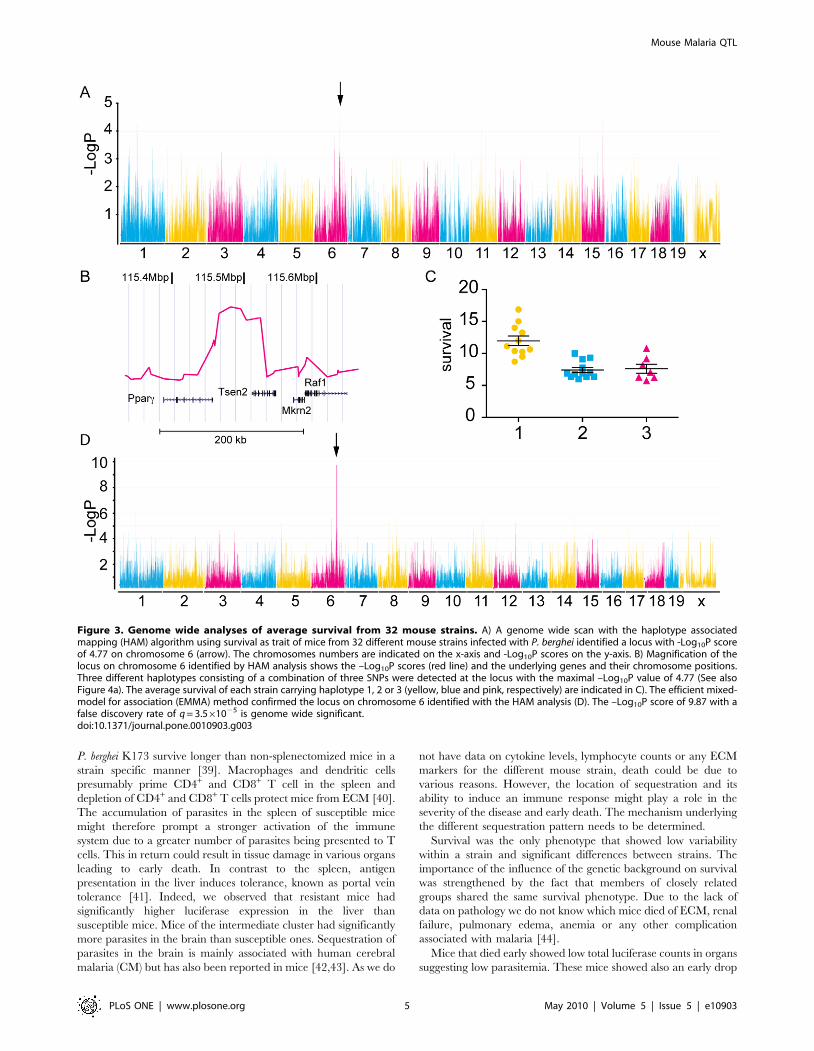
We compared the available expression data for uninfected
mouse strains from the BioGPS [32,33] portal of Tsen2 and Ppar-cfrom the spleen, liver, adipose tissue and hypothalamus with the
haplotypes of the various mouse strains at the berr6 locus. Tsen2
was significantly higher expressed in adipose tissue and the spleen
of mouse strains sharing haplotype three while haplotype one
showed significantly lower expression than two in the liver. Ppar-cshowed only significant expression differences in the liver where
haplotype three had significantly lower expression than haplotype
two (Figure 4). There were no differences in the expression levels
in the hypothalamus (data not shown).
Discussion
Genetic analysis of human populations can be difficult due to
variations in haplotype structures between different ethnic groups,
which can lead to false positive associations. The study of malaria
in humans is even more difficult to conduct, as analysis of brain
tissue or gene expression patterns in various organs is only possible
in terminal cases. The mouse model has been shown to be a useful
alternative to identify genes related to malaria infection in human
populations. For example the protective aspect of pyruvate kinase
deficiency was first identified in the mouse model [34] and has
subsequently been linked to resistance in human populations as
well [35]. The mouse model also allows testing the function and
importance of identified candidate genes by using inhibitors,
knockouts or allelic replacements.
Finding the best trait to distinguish different mouse strains is a
prerequisite for the analysis of genetic association studies. We
therefore first analyzed different phenotypes associated with
infection of P. berghei ANKA in 32 different inbred mouse strains
which have been bred to near homozygosity at almost all loci [36].
Hypothermia with temperature below 30uC is used as an indicator
of experimental cerebral malaria (ECM) as it is associated with brain
hemorrhage and early death in ECM susceptible mice [37]. A drop
in body temperature towards the end of infection was however
detected in all mice, indicating that hypothermia is not only
associated with ECM but that it is a general marker for moribund
mice in infectious disease models [38]. The body temperature on
day 4 to 6 of infection was therefore better suited than the terminal
values to predict survival. Therefore, the timing of hypothermia
rather than the presence itself is predictive for disease severity.
The sum of the luciferase activity in various organs was
significantly higher in the resistant cluster than in the susceptible
one. This probably reflects generally higher parasitemia in the
resistant cluster due to the longer persistence of the parasite in the
host. Nevertheless, by comparing relative luciferase activity in
various organs we found that susceptible mice had significantly
more parasites sequestering in the spleen than the other two
groups. The spleen plays an important role in malaria infection
and it has been shown that splenectomized mice infected with
Mouse Malaria QTL
PLoS ONE | www.plosone.org 4 May 2010 | Volume 5 | Issue 5 | e10903
P. berghei K173 survive longer than non-splenectomized mice in a
strain specific manner [39]. Macrophages and dendritic cells
presumably prime CD4+ and CD8+ T cell in the spleen and
depletion of CD4+ and CD8+ T cells protect mice from ECM [40].
The accumulation of parasites in the spleen of susceptible mice
might therefore prompt a stronger activation of the immune
system due to a greater number of parasites being presented to T
cells. This in return could result in tissue damage in various organs
leading to early death. In contrast to the spleen, antigen
presentation in the liver induces tolerance, known as portal vein
tolerance [41]. Indeed, we observed that resistant mice had
significantly higher luciferase expression in the liver than
susceptible mice. Mice of the intermediate cluster had significantly
more parasites in the brain than susceptible ones. Sequestration of
parasites in the brain is mainly associated with human cerebral
malaria (CM) but has also been reported in mice [42,43]. As we do
not have data on cytokine levels, lymphocyte counts or any ECM
markers for the different mouse strain, death could be due to
various reasons. However, the location of sequestration and its
ability to induce an immune response might play a role in the
severity of the disease and early death. The mechanism underlying
the different sequestration pattern needs to be determined.
Survival was the only phenotype that showed low variability
within a strain and significant differences between strains. The
importance of the influence of the genetic background on survival
was strengthened by the fact that members of closely related
groups shared the same survival phenotype. Due to the lack of
data on pathology we do not know which mice died of ECM, renal
failure, pulmonary edema, anemia or any other complication
associated with malaria [44].
Mice that died early showed low total luciferase counts in organs
suggesting low parasitemia. These mice showed also an early drop
Figure 3. Genome wide analyses of average survival from 32 mouse strains. A) A genome wide scan with the haplotype associatedmapping (HAM) algorithm using survival as trait of mice from 32 different mouse strains infected with P. berghei identified a locus with -Log10P scoreof 4.77 on chromosome 6 (arrow). The chromosomes numbers are indicated on the x-axis and -Log10P scores on the y-axis. B) Magnification of thelocus on chromosome 6 identified by HAM analysis shows the –Log10P scores (red line) and the underlying genes and their chromosome positions.Three different haplotypes consisting of a combination of three SNPs were detected at the locus with the maximal –Log10P value of 4.77 (See alsoFigure 4a). The average survival of each strain carrying haplotype 1, 2 or 3 (yellow, blue and pink, respectively) are indicated in C). The efficient mixed-model for association (EMMA) method confirmed the locus on chromosome 6 identified with the HAM analysis (D). The –Log10P score of 9.87 with afalse discovery rate of q = 3.561025 is genome wide significant.doi:10.1371/journal.pone.0010903.g003
Mouse Malaria QTL
PLoS ONE | www.plosone.org 5 May 2010 | Volume 5 | Issue 5 | e10903
in body temperature. These are signs normally associated with
ECM but in the absence of further evaluation we cannot be
certain. Resistant mice died with higher total luciferase counts
suggesting high parasitemia. Body temperature dropped in
resistant mice towards the end of infection. It is tempting to
speculate that these mice did not die due to ECM but rather
hyper-parasitemia. The intermediate cluster shows a similar course
of body temperature as the resistant mice but their total luciferase
counts are more similar to the susceptible mice. It is possible that
mice of the intermediate cluster died due to complications other
than ECM or hyper-parasitemia. In addition we found different
organ specific relative luciferase counts between the three clusters
suggesting that the location of sequestration might influence the
outcome of infection. Some strains showed interesting divergence
Figure 4. Haplotype distribution at berr6 locus and expression analysis of Ppar-c and Tsen2 haplotypes. The HAM analysis is based onthe formation of haplotypes consisting of three consecutive SNPs. The compositions of haplotypes at different positions at the berr6 locus areindicated for each mouse strain (A). Each haplotype is indicated by a number and labeled in a different color. The mouse strains are listed accordingto their survival. –Log10P values for each position are indicated and the haplotypes with the highest score are framed. B) Expression patterns of Tsen2(upper panel) and Ppar-c (lower panel) from different mouse strains were compared in adipose tissue, spleen and liver. The relative expression levels(y-axis) for each mouse strain were grouped and colored according to their haplotype at the locus with the highest –Log10P value (A). Significantlydifferent expression levels were detected in all tissues for Tsen2 but only in the liver for Ppar-c. Scatter dot plots with the mean and the standard errorfor the expression of Tsen2 and Ppar-c haplotypes. * indicates statistical significance of p,0.05 by one-way ANOVA analyses followed by Tukey’s posttest, ** indicates p between 0.01 and 0.001, *** p#0.001.doi:10.1371/journal.pone.0010903.g004
Mouse Malaria QTL
PLoS ONE | www.plosone.org 6 May 2010 | Volume 5 | Issue 5 | e10903
from their survival cluster indicating possibly new phenotypes.
AKR/J mice of the resistant cluster survived on average 11 days,
had low total luciferase counts, and a small drop in body
temperature.
Even though different mouse strains might die due to different
pathological reasons, we mapped survival to a new locus on
chromosome 6, (berr6) between Ppar-c and Tsen2 using genome
wide analysis such as HAM and EMMA. While the peak was
detected with both analysis methods, it reached genome wide
significance only with the EMMA method. The HAM analysis
uses a more conservative approach and does not take the genetic
relatedness of the strains into account. The haplotype conferring
resistance is shared between unrelated mouse groups whereas the
more closely related Swiss mice and Castle’s mice predominantly
share the susceptible haplotypes. Ppar-c expression is differentially
regulated in various tissues with highest expression in adipose
tissue and it regulates expression of many genes including CD36.
The innate immune response plays a major role in the clearance of
infected erythrocytes and controlling progression to fatal disease
[45]. Signaling through pattern-recognition receptors such as Toll-
like receptor 2 (TLR2) and TLR9 and scavenger receptor CD36
on macrophages induce the release of proinflammatory cytokines.
On the observation that macrophage CD36 helped control
replication of blood stage parasites and enhanced survival of the
host, Kain and his group hypothesized that ‘‘pharmacological
modulation of innate immunity through pathways involving CD36
and related pattern recognition receptors might increase parasite
clearance, modify deleterious host inflammatory responses to
infection, and improve outcome’’ [31]. As CD36 transcription is
regulated by Ppar-c and its co-receptor and Ppar-c agonists have
already been approved for the treatment of Type 2 diabetes, the
authors tested the effect of rosiglitazone on malaria infection.
Indeed, rosiglitazone protected mice from ECM and reduced
parasite levels in P. chabaudi chabaudi infections in a CD36
dependent manner [31]. The same authors investigated the effect
of rosiglitazone on pf-glycosylphosphatidylinositol induced TLR2
signaling through JNK, ERK1/2 and p38 leading to the
degradation of IkBa, a precursor of NF-kB. Rosiglitazone
inhibited phosphorylation of JNK, ERK1/2 and p38 and IkBadegradation in a dose dependant manner [31]. In a phase I/II trial
rosiglitazone was given to patients with uncomplicated malaria
and increased parasite clearance and a reduced inflammatory
response to the infection were observed [46].
In addition, different alternative splicing variants of Ppar-c exist
and variations in the 59 UTR affect translational efficiency [47].
Numerous genetic variations in human Ppar-c are present and have
been linked to insulin resistance and adipocyte differentiation
(reviewed in [48]). Few links have been made between diabetes and
malaria so far even though sequestered parasites have been found in
adipose tissues of human, monkeys and mice [27,49,50,51].
C57BL/6J-ob/ob mice are a model for Type 2 diabetes and obesity.
These mice were protected from ECM and survived significantly
longer than wild-type mice when infected with P. berghei [52]. The
same mice lowered blood glucose levels upon injection of inositol
phosphoglycans from P. yoelii [53]. Although hypoglycaemia rather
than hyperglycaemia is associated with malaria, similar genes might
play a role in the regulation of blood glucose levels.
Tsen2, the gene downstream of Ppar-c, is a tRNA splicing
endonuclease, which catalyzes the first step in RNA splicing by
removing introns. We observed haplotype specific expression
patterns for Ppar-c and Tsen2 strengthening the fact that the
expression of these genes are based on different haplotypes in the
UTR and these in turn could play a role in the variable outcome
of the malaria infection in various mouse strains. These data
together strengthen the importance of Ppar-c in malaria infection
and makes it a likely target for the intervention of CM. Tsen2
might also play a role either in concert with Ppar-c or alone.
Because the probability scores in the HAM analysis are based in
part on the number of strains sharing the phenotype, some of the
smaller peaks on other chromosomes may prove to be equally
important. For example, we found two minor peaks on
chromosome 11 with a -Log10P score of 4.08 and 3.96 that flank
the char8 locus [10]. QTL analyses of crosses between other
susceptible and resistant mouse strains provide additional evidence
for the importance of multiple genes in P. berghei infection
[15,16,17,18].
In sum, we have generated a vast amount of phenotypic data for
32 mouse strains infected with malaria. Only a few inbred strains
have been characterized before and the available data for these
new strains allows scientists to choose the strain best suited for
their research. Without conducting expensive crosses, we have
mapped survival to a new locus on chromosome 6 by using a
combination of HAM and EMMA and our data support the
importance of Ppar-c in malaria infection. Future studies will be
needed to define the role of Ppar-c and Tsen2 in infection and
association studies in malaria endemic regions might reveal
protective or susceptible polymorphisms in human populations.
Materials and Methods
Ethic StatementAll animal experiments were approved by the Institutional
Animal Care and Use Committee (IACUC) and conducted in
agreement with the NIH policy.
MiceThe 32 inbred strains used were purchased from The Jackson
Laboratories (JAX): 129S1/SvlmJ, AKR/J, BALB/cByJ, BALB/
cByJ, BTBRT+tf/J, BUB/BnJ, C3H/HeJ, C57BL/6J, C57BR/
cdJ, C58/J, CBA/J, CE/J, DBA/2J, FVB/NJ, I/LnJ, KK/HIJ,
LG/J, MA/MyJ, MRL/MpJ, NOD/LtJ, NON/LtJ, NZO/
HILtJ, NZW/LacJ, P/J, PL/J, RIIIS/J, SJL/J, SM/J, SWR/J
and the three wild-derived inbred strains: WSB/EiJ, PERA/EiJ,
CZECHII/EiJ. Eight to twelve week old mice were used in
the study. Mice were housed in a pathogen free facility at the
Genomics Institute of the Novartis Research Foundation (GNF)
and all experiments were approved by the Institutional Animal
Care and Use Committee (IACUC) and conducted in agreement
with the NIH policy.
Infection and parasitesThe Plasmodium berghei ANKA strain PbGFP–LUCSCH [54] was
used for all infections. This strain expresses a GFP-luciferase fusion
protein under the schizont specific promoter of the P. berghei ama1
gene. The fusion protein is expressed in the schizont stage but also
in the very early ring stage. Parasites from frozen stocks of this
strain were propagated and maintained in BALB/cByJ mice. Four
female and four male mice of each strain were infected
intraperitoneally with 16106-parasitized red blood cells obtained
from a donor mouse. The parasites were preserved in Alsever’s
solution containing 10% glycerol and stored in liquid nitrogen.
Measurement of body temperatureWe used Bio Medic Data Systems, Inc. (BMDS) implantable
microchip system, specifically the DAS-5002 Notebook System and
the IPTT-300 Implantable Programmable Temperature Tran-
sponders, to identify and record body temperature from each
mouse. The DAS-5002 Notebook System is a portable hand-held
Mouse Malaria QTL
PLoS ONE | www.plosone.org 7 May 2010 | Volume 5 | Issue 5 | e10903
reader-programmer used to program and scan BMDS temperature
microchips. Thus, body temperature can be collected from each
animal with the use of the BMDS hand-held wand while the animal
is in its own cage without any need for restraint. The chips are
placed under the skin with a 16-gauge needle placement device.
Rodents may be lightly anesthetized with isoflurane to minimize any
undue movement during the chip implantation procedure.
Visualization and quantification of luciferase activity inwhole bodies and dissected organs of infected animals
Luciferase activity in mice were visualized through the imaging
of whole bodies or dissected organs by using an intensified- charge-
coupled device (I-CCD) photon counting video camera of the in
vivo Imaging system (IVIS 100, Xenogen). The animals were
anesthetized by isoflurane and injected intraperitoneally with D-
luciferin dissolved in PBS (100 mg/kg of body weight). Animals
were kept anesthetized and measurements were done between 2 to
4 min after injection with D-luciferin. Bioluminescence imaging
was acquired with a 15 cm FOV (field of view), a medium binning
factor and exposure times of 10–60 s. Individual organs were
obtained by dissection of animals without perfusion and placed in
a Petri dish and imaged with a 10 cm FOV, a medium binning
factor, and exposure times between 10–60 s. Measurements were
done using fixed time and region-of-interest settings with the
programs LIVING IMAGE (Xenogen) and IGOR-PRO (Wave-
metrics). Relative photon counts and intact organs were related to
the total photon counts of all the organs.
Haplotype Associated Mapping (HAM) and efficientmixed-model association (EMMA)
The detailed algorithm underlying the Haplotype Association
Mapping (HAM) method [23,24] and the efficient mixed-model
for association (EMMA) mapping model [25] have been previously
described
Briefly, the SNPster software forms haplotypes from three-SNP
windows based on SNP data available for the mouse diversity
panel, MDP [55]. These inferred haplotypes are used as factors to
calculate F statistics by ANOVA with various input traits. In this
study average survival was used as trait.
The EMMA algorithm is based on the mixed-model where the
pair-wise relatedness between all individuals is estimated and then
fitted to the vector of the phenotype thereby decreasing false
positive and false negatives. EMMA is available as an R package
implementation (http://mouse.cs.ucla.edu/emma/index.html).
Statistical analysisOne-way analysis of variance (ANOVA) followed by Tukey-
Kramer posttest (alpha = 0.05) and two-tailed Pearson correlations
were performed in GraphPad Prism. T test and hyper-geometric
probability distributions were calculated in Excel. The proportion
of variance explained by the locus was calculated in R by fitting
the phenotypes against the genotypes to a linear model.
Supporting Information
Figure S1 Visualization of luciferase expression in living mice
and dissected organs. Mice were infected with Plasmodium berghei
ANKA strain PbGFP-LUCSCH that expresses a GFP-luciferase
fusion protein under the schizont specific promoter of the P. berghei
ama1 gene. Anesthetized mice were injected with D-luciferin and
kept under anesthesia during the measurement. Luciferase activity
in mice as visualized by using an I-CCD video camera. Rainbow
images show the relative level of luciferase activity ranging from
low (blue), to medium (green), to high (yellow, red). Note that the
time of exposure and the total photon counts are different between
different days. Whole body images of DBA/2J females throughout
the infection starting on day 3 (A), to day 10 (B), to day 14 (C)
where the mice were euthanized and the organs dissected and
measured (D).
Found at: doi:10.1371/journal.pone.0010903.s001 (8.58 MB TIF)
Table S1 Summary of phenotypes and statistics. The mouse
strains were grouped according to their ancestry [62]. The average
and standard deviation for survival, terminal parasitemia and
terminal body temperature are indicated for all mice of a strain
combined as well as divided by sex. The number of mice (N)
analyzed per experiment is indicated. Strains that showed
statistically significant differences by un-paired students t-test are
colored in red. The relative luciferase expression in various organs
(brain, spleen, lung and liver) and the total luciferase expression of
the sum of organs are shown for each strain but not divided by sex
due to the small numbers of mice analyzed by strain. Correlations
for the various mouse strains between different traits were calculated
in Prism and correlations in green are statistically significant.
Found at: doi:10.1371/journal.pone.0010903.s002 (0.04 MB
XLS)
Table S2 Matrix for ANOVA analysis for Figure 1 and Figure 2
C. A) One-way ANOVA analyses were calculated for survival,
total luciferase counts and terminal body temperature for each
strain compared to another. B) One-way ANOVA analyses were
calculated for luciferase expression in spleen, liver lungs and brain
of all mouse strains. Statistical significant differences between
strains are indicated.
Found at: doi:10.1371/journal.pone.0010903.s003 (0.03 MB
XLS)
Acknowledgments
We would like to thank Neekesh V. Dharia for statistical and
computational assistance and A. Taylor Bright and for careful reading of
the manuscript.
Author Contributions
Conceived and designed the experiments: SEB VR TW EAW. Performed
the experiments: SEB VR KH AL MNL MLS BS. Analyzed the data: SEB
VR OS YZ TW EAW. Contributed reagents/materials/analysis tools: CJJ
APW TW. Wrote the paper: SEB VR EAW.
References
1. McGuire W, Hill AV, Allsopp CE, Greenwood BM, Kwiatkowski D (1994)
Variation in the TNF-alpha promoter region associated with susceptibility to
cerebral malaria. Nature 371: 508–510.
2. Allison AC (1954) Protection afforded by sickle-cell trait against subtertian
malareal infection. Br Med J 1: 290–294.
3. Flint J, Hill AV, Bowden DK, Oppenheimer SJ, Sill PR, et al. (1986) High
frequencies of alpha-thalassaemia are the result of natural selection by malaria.
Nature 321: 744–750.
4. Ruwende C, Khoo SC, Snow RW, Yates SN, Kwiatkowski D, et al. (1995)
Natural selection of hemi- and heterozygotes for G6PD deficiency in Africa by
resistance to severe malaria. Nature 376: 246–249.
5. Frodsham AJ, Hill AVS (2004) Genetics of infectious diseases. Hum Mol Genet
13: R187–194.
6. Hernandez-Valladares M, Naessens J, Gibson JP, Musoke AJ, Nagda S, et al.
(2004) Confirmation and dissection of QTL controlling resistance to malaria in
mice. Mamm Genome 15: 390–398.
7. Foote SJ, Burt RA, Baldwin TM, Presente A, Roberts AW, et al. (1997) Mouse
loci for malaria-induced mortality and the control of parasitaemia. Nat Genet
17: 380–381.
8. Burt RA, Baldwin TM, Marshall VM, Foote SJ (1999) Temporal expression of
an H2-linked locus in host response to mouse malaria. Immunogenetics 50:
278–285.
Mouse Malaria QTL
PLoS ONE | www.plosone.org 8 May 2010 | Volume 5 | Issue 5 | e10903
9. Fortin A, Cardon LR, Tam M, Skamene E, Stevenson MM, et al. (2001)
Identification of a new malaria susceptibility locus (Char4) in recombinant
congenic strains of mice. Proc Natl Acad Sci U S A 98: 10793–10798.
10. Hernandez-Valladares M, Rihet P, ole-MoiYoi OK, Iraqi FA (2004) Mapping of
a new quantitative trait locus for resistance to malaria in mice by a comparative
mapping approach with human Chromosome 5q31-q33. Immunogenetics 56:
115–117.
11. Min-Oo G, Fortin A, Pitari G, Tam M, Stevenson MM, et al. (2007) Complex
genetic control of susceptibility to malaria: positional cloning of the Char9 locus.
J Exp Med 204: 511–524.
12. Fortin A, Belouchi A, Tam MF, Cardon L, Skamene E, et al. (1997) Genetic
control of blood parasitaemia in mouse malaria maps to chromosome 8. Nat
Genet 17: 382–383.
13. Burt RA, Marshall VM, Wagglen J, Rodda FR, Senyschen D, et al. (2002) Mice
that are congenic for the char2 locus are susceptible to malaria. Infect Immun
70: 4750–4753.
14. Ohno T, Ishih A, Kohara Y, Yonekawa H, Terada M, et al. (2001)
Chromosomal mapping of the host resistance locus to rodent malaria
(Plasmodium yoelii) infection in mice. Immunogenetics 53: 736–740.
15. Ohno T, Nishimura M (2004) Detection of a new cerebral malaria susceptibility
locus, using CBA mice. Immunogenetics 56: 675–678.
16. Nagayasu E, Nagakura K, Akaki M, Tamiya G, Makino S, et al. (2002)
Association of a determinant on mouse chromosome 18 with experimental
severe Plasmodium berghei malaria. Infect Immun 70: 512–516.
17. Bagot S, Campino S, Penha-Goncalves C, Pied S, Cazenave PA, et al. (2002)
Identification of two cerebral malaria resistance loci using an inbred wild-
derived mouse strain. Proc Natl Acad Sci U S A 99: 9919–9923.
18. Campino S, Bagot S, Bergman ML, Almeida P, Sepulveda N, et al. (2005)
Genetic control of parasite clearance leads to resistance to Plasmodium berghei
ANKA infection and confers immunity. Genes Immun 6: 416–421.
19. Berghout J, Min-Oo G, Tam M, Gauthier S, Stevenson MM, et al. (2009)
Identification of a novel cerebral malaria susceptibility locus (Berr5) on mouse
chromosome 19. Genes Immun.
20. Goncalves LA, Almeida P, Mota MM, Penha-Goncalves C (2008) Malaria Liver
Stage Susceptibility Locus Identified on Mouse Chromosome 17 by Congenic
Mapping. PLoS ONE 3: e1874.
21. Frazer KA, Eskin E, Kang HM, Bogue MA, Hinds DA, et al. (2007) A sequence-
based variation map of 8.27 million SNPs in inbred mouse strains. Nature 448:
1050–1053.
22. Yang H, Bell TA, Churchill GA, Pardo-Manuel de Villena F (2007) On the
subspecific origin of the laboratory mouse. Nat Genet 39: 1100–1107.
23. Pletcher MT, McClurg P, Batalov S, Su AI, Barnes SW, et al. (2004) Use of a
dense single nucleotide polymorphism map for in silico mapping in the mouse.
PLoS Biol 2: e393.
24. McClurg P, Janes J, Wu C, Delano DL, Walker JR, et al. (2007) Genomewide
association analysis in diverse inbred mice: power and population structure.
Genetics 176: 675–683.
25. Kang HM, Zaitlen NA, Wade CM, Kirby A, Heckerman D, et al. (2008)
Efficient control of population structure in model organism association mapping.
Genetics 178: 1709–1723.
26. Jacobs R, Warren M (1967) Sequestration of schizonts in the deep tissues of mice
infected with chloroquine-resistant Plasmodium berghei. Trans R Soc Trop
Med Hyg 61: 273–275.
27. Franke-Fayard B, Janse CJ, Cunha-Rodrigues M, Ramesar J, Buscher P, et al.
(2005) Murine malaria parasite sequestration: CD36 is the major receptor, but
cerebral pathology is unlinked to sequestration. Proc Natl Acad Sci U S A 102:
11468–11473.
28. Storey JD, Tibshirani R (2003) Statistical significance for genomewide studies.
Proc Natl Acad Sci U S A 100: 9440–9445.
29. Stunnenberg HG (1993) Mechanisms of transactivation by retinoic acid
receptors. Bioessays 15: 309–315.
30. Lehrke M, Lazar MA (2005) The many faces of PPARgamma. Cell 123:
993–999.
31. Serghides L, Patel SN, Ayi K, Lu Z, Gowda DC, et al. (2009) Rosiglitazone
Modulates the Innate Immune Response to Plasmodium falciparum Infection
and Improves Outcome in Experimental Cerebral Malaria. The Journal of
Infectious Diseases 199: 1536–1545.
32. Wu C, Orozco C, Boyer J, Leglise M, Goodale J, et al. (2009) BioGPS: an
extensible and customizable portal for querying and organizing gene annotationresources. Genome Biology 10: R130.
33. Lattin J, Schroder K, Su A, Walker J, Zhang J, et al. (2008) Expression analysis
of G protein-coupled receptors in mouse macrophages. Immunome Res 4: 5.34. Min-Oo G, Fortin A, Tam MF, Nantel A, Stevenson MM, et al. (2003) Pyruvate
kinase deficiency in mice protects against malaria. Nat Genet 35: 357–362.35. Ayi K, Min-Oo G, Serghides L, Crockett M, Kirby-Allen M, et al. (2008)
Pyruvate Kinase Deficiency and Malaria. N Engl J Med 358: 1805–1810.
36. Beck JA, Lloyd S, Hafezparast M, Lennon-Pierce M, Eppig JT, et al. (2000)Genealogies of mouse inbred strains. Nat Genet 24: 23–25.
37. Curfs JH, Schetters TP, Hermsen CC, Jerusalem CR, van Zon AA, et al. (1989)Immunological aspects of cerebral lesions in murine malaria. Clin Exp Immunol
75: 136–140.38. Kort WJ, Hekking-Weijma JM, TenKate MT, Sorm V, VanStrik R (1998) A
microchip implant system as a method to determine body temperature of
terminally ill rats and mice. Lab Anim 32: 260–269.39. Eling WM (1980) Role of spleen in morbidity and mortality of Plasmodium
berghei infection in mice. Infect Immun 30: 635–641.40. Hermsen C, van de Wiel T, Mommers E, Sauerwein R, Eling W (1997)
Depletion of CD4+ or CD8+ T-cells prevents Plasmodium berghei induced
cerebral malaria in end-stage disease. Parasitology 114 (Pt 1): 7–12.41. Watanabe T, Kudo M, Chiba T, Wakatsuki Y (2008) Molecular mechanisms of
portal vein tolerance. Hepatol Res 38: 441–449.42. Kaul DK, Nagel RL, Llena JF, Shear HL (1994) Cerebral Malaria in Mice:
Demonstration of Cytoadherence of Infected Red Blood Cells and Micro-rheologic Correlates. Am J Trop Med Hyg 50: 512–521.
43. Hearn J, Rayment N, Landon DN, Katz DR, de Souza JB (2000)
Immunopathology of Cerebral Malaria: Morphological Evidence of ParasiteSequestration in Murine Brain Microvasculature. Infect Immun 68: 5364–5376.
44. Cordeiro RS, Cunha FQ, Filho JA, Flores CA, Vasconcelos HN, et al. (1983)Plasmodium berghei: physiopathological changes during infections in mice. Ann
Trop Med Parasitol 77: 455–465.
45. Stevenson MM, Riley EM (2004) Innate immunity to malaria. Nat RevImmunol 4: 169–180.
46. Boggild AK, Krudsood S, Patel SN, Serghides L, Tangpukdee N, et al. (2009)Use of Peroxisome Proliferator’AeActivated Receptor Œ$ Agonists as
Adjunctive Treatment for Plasmodium falciparum Malaria: A Randomized,Double’AeBlind, Placebo’AeControlled Trial. Clinical Infectious Diseases 49:
841–849.
47. McClelland S, Shrivastava R, Medh JD (2009) Regulation of TranslationalEfficiency by Disparate 5’ UTRs of PPARgamma Splice Variants. PPAR Res
2009: 193413.48. Jeninga EH, Gurnell M, Kalkhoven E (2009) Functional implications of genetic
variation in human PPAR[gamma]. Trends in Endocrinology & Metabolism 20:
380–387.49. Wilairatana P, Riganti M, Puchadapirom P, Punpoowong B, Vannaphan S,
et al. (2000) Prognostic significance of skin and subcutaneous fat sequestration ofparasites in severe falciparum malaria. Southeast Asian J Trop Med Public
Health 31: 203–212.50. Miller LH, Fremount HN, Luse SA (1971) Deep Vascular Schizogony of
Plasmodium Knowlesi in Macaca Mulatta: Distribution in Organs and
Ultrastructure of Parasitized Red Cells. Am J Trop Med Hyg 20: 816–824.51. Miller LH (1969) Distribution of Mature Trophozoites and Schizonts of
Plasmodium Falciparum in the Organs of Aotus Trivirgatus, the Night Monkey.Am J Trop Med Hyg 18: 860–865.
52. Robert V, Bourgouin C, Depoix D, Thouvenot C, Lombard M-N, et al. (2008)
Malaria and obesity: obese mice are resistant to cerebral malaria. MalariaJournal 7: 81.
53. Elased KM, Gumaa KA, de Souza JB, Rahmoune H, Playfair JHL, et al. (2001)Reversal of Type 2 Diabetes in Mice by Products of Malaria Parasites: II. Role
of Inositol Phosphoglycans (IPGs). Molecular Genetics and Metabolism 73:
248–258.54. Franke-Fayard B, Trueman H, Ramesar J, Mendoza J, van der Keur M, et al.
(2004) A Plasmodium berghei reference line that constitutively expresses GFP ata high level throughout the complete life cycle. Molecular and Biochemical
Parasitology 137: 23.55. Bogue MA, Grubb SC (2004) The Mouse Phenome Project. Genetica 122:
71–74.
Mouse Malaria QTL
PLoS ONE | www.plosone.org 9 May 2010 | Volume 5 | Issue 5 | e10903


![Straight Lines Slides [Compatibility Mode]](https://static.fdokumen.com/doc/165x107/6316ee6071e3f2062906978b/straight-lines-slides-compatibility-mode.jpg)