Fronts and Shear Lines
226
Fronts and Shear Lines Michel Davison and José Gálvez WPC International Desks 2020
-
Upload
khangminh22 -
Category
Documents
-
view
1 -
download
0
Transcript of Fronts and Shear Lines
Fronts and
Shear Lines
Michel Davison and José Gálvez
WPC International Desks
2020
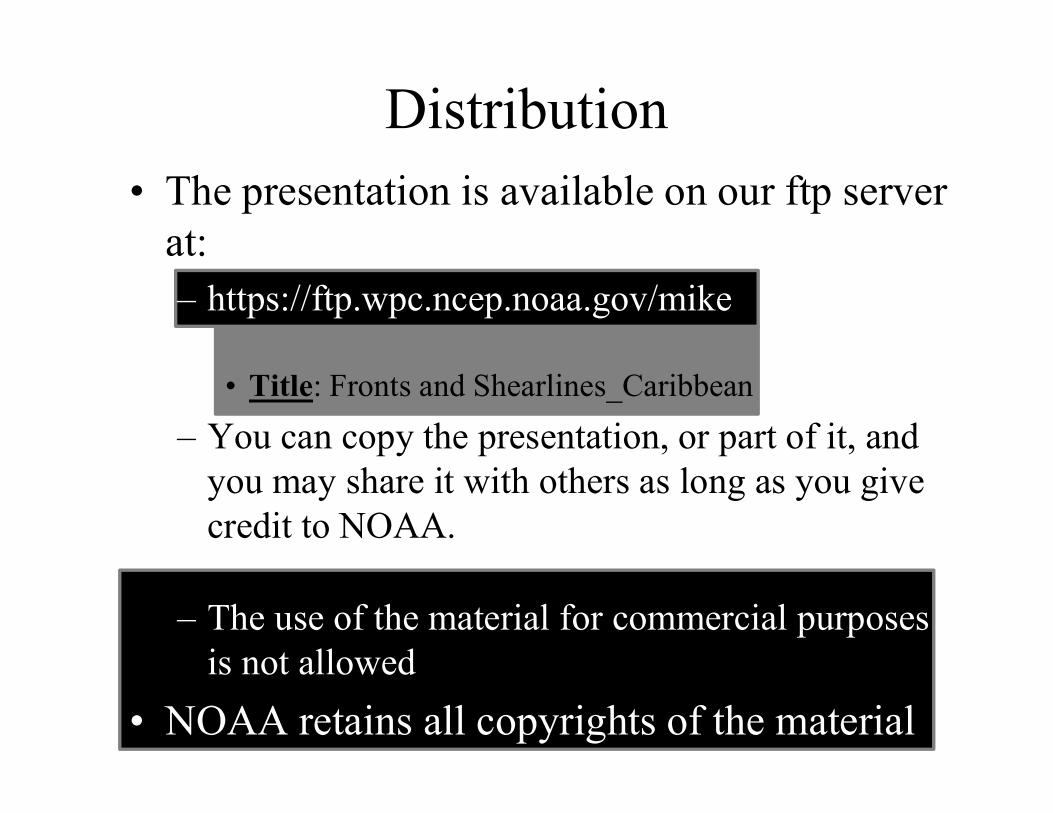
Distribution• The presentation is available on our ftp server
at: – https://ftp.wpc.ncep.noaa.gov/mike
• Title: Fronts and Shearlines_Caribbean
– You can copy the presentation, or part of it, and you may share it with others as long as you give credit to NOAA.
– The use of the material for commercial purposes is not allowed
• NOAA retains all copyrights of the material
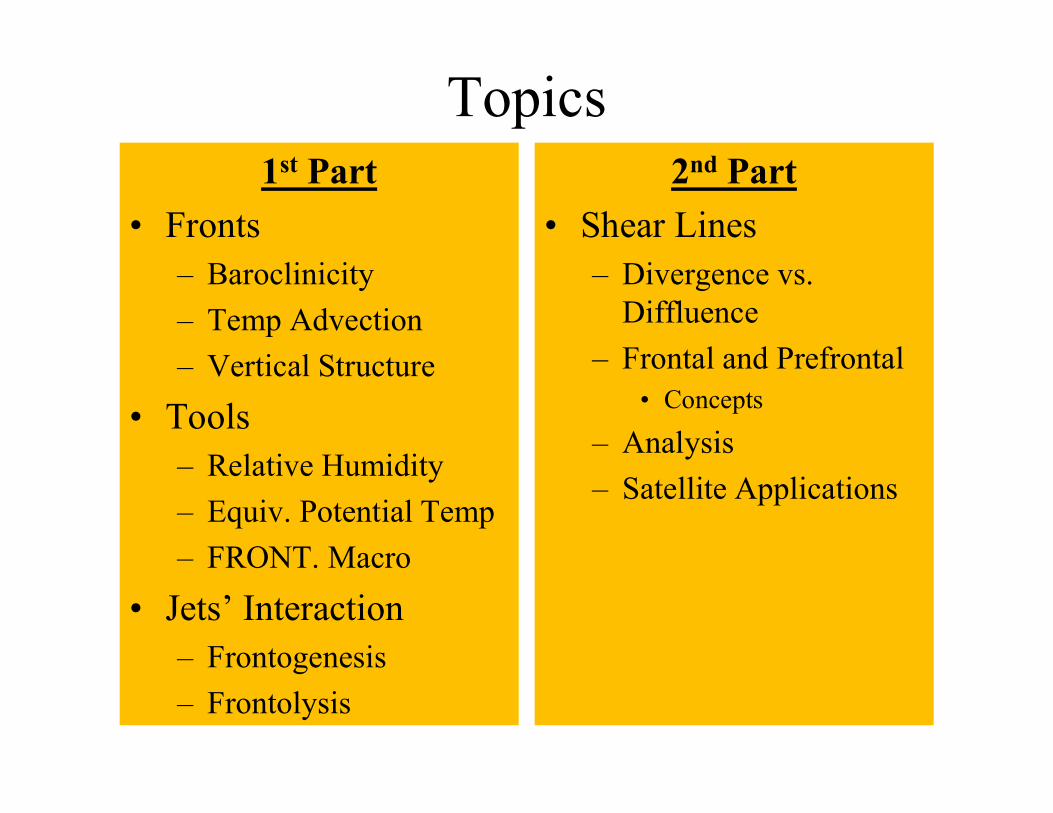
Topics1st Part
• Fronts– Baroclinicity
– Temp Advection
– Vertical Structure
• Tools– Relative Humidity
– Equiv. Potential Temp
– FRONT. Macro
• Jets’ Interaction– Frontogenesis
– Frontolysis
2nd Part
• Shear Lines– Divergence vs.
Diffluence
– Frontal and Prefrontal• Concepts
– Analysis
– Satellite Applications

Rules• Your participation is required
– Partake of the poll questions to assess your understanding of the material
• Questions?? – Use the chat box to send a text message(s)
– Bernie, Jose and Kathy will be monitoring• They will answer and/or identify questions of
common interest.
Surface Fronts
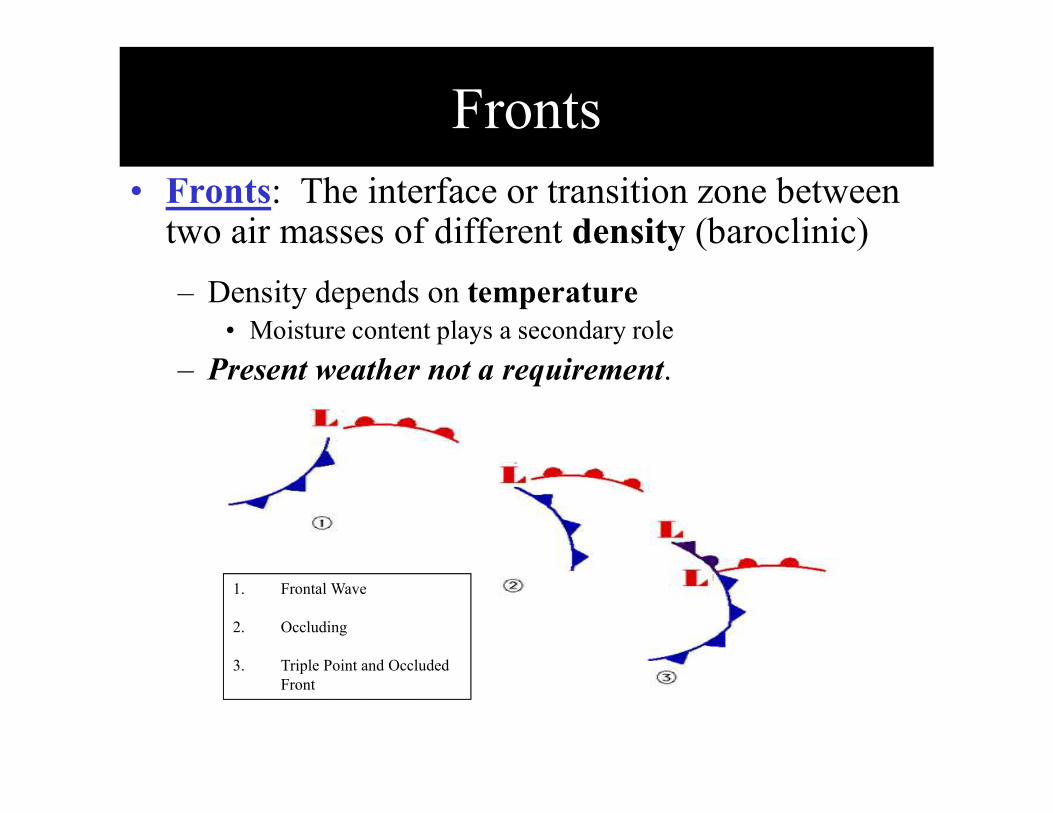
Fronts• Fronts: The interface or transition zone between
two air masses of different density (baroclinic)
– Density depends on temperature• Moisture content plays a secondary role
– Present weather not a requirement.
1. Frontal Wave
2. Occluding
3. Triple Point and Occluded Front

Baroclinic Boundaries
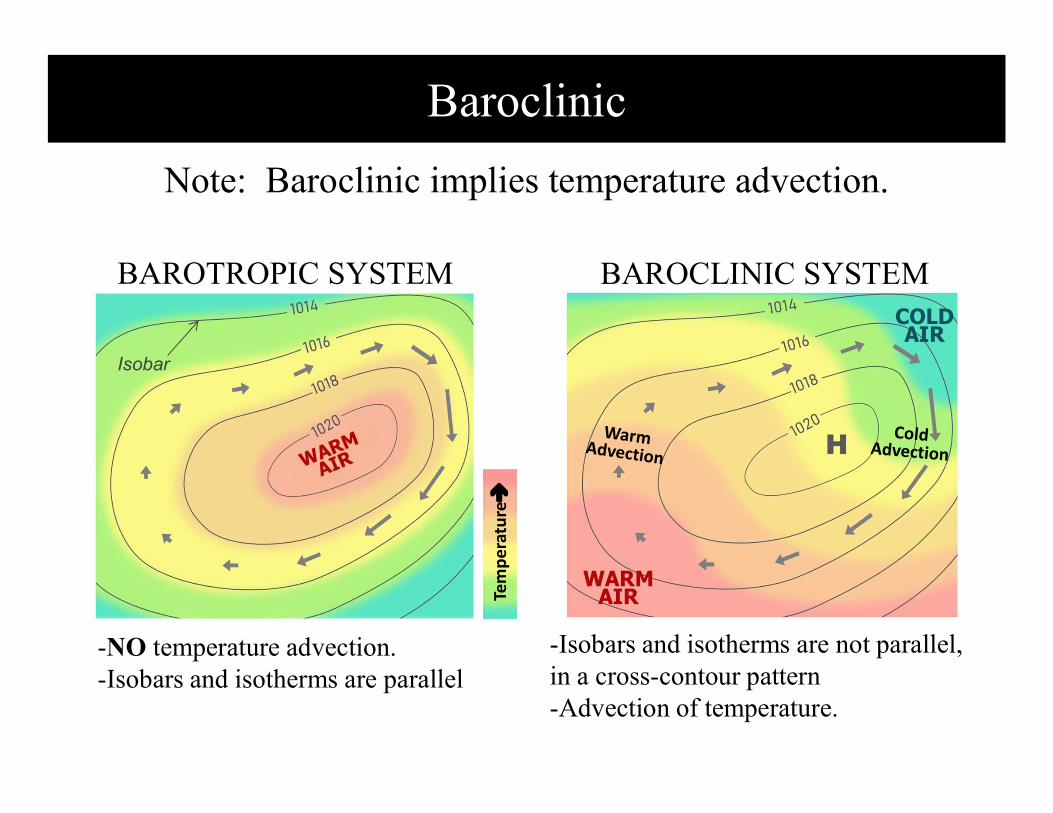
Baroclinic
Note: Baroclinic implies temperature advection.
BAROTROPIC SYSTEM BAROCLINIC SYSTEM
-NO temperature advection.-Isobars and isotherms are parallel
-Isobars and isotherms are not parallel, in a cross-contour pattern-Advection of temperature.
COLDAIR
Isobar
WARMAIRTe
mpe
rature
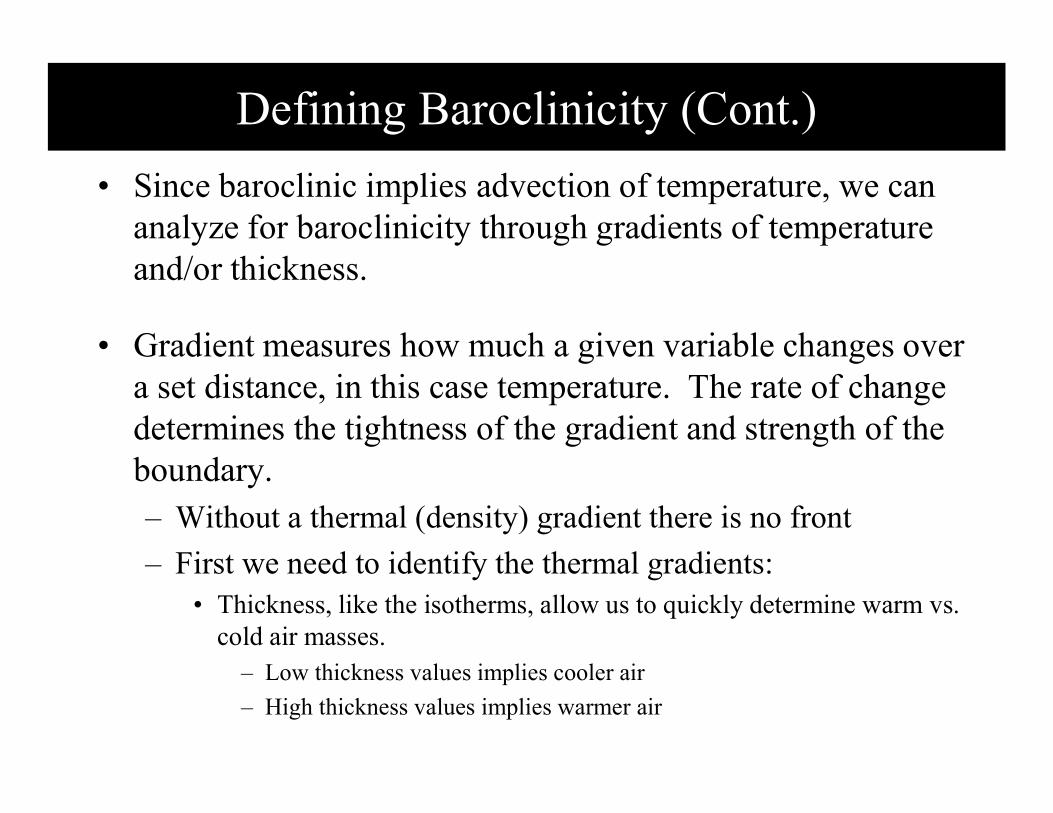
• Since baroclinic implies advection of temperature, we can analyze for baroclinicity through gradients of temperature and/or thickness.
• Gradient measures how much a given variable changes over a set distance, in this case temperature. The rate of change determines the tightness of the gradient and strength of the boundary. – Without a thermal (density) gradient there is no front
– First we need to identify the thermal gradients:• Thickness, like the isotherms, allow us to quickly determine warm vs.
cold air masses. – Low thickness values implies cooler air
– High thickness values implies warmer air
Defining Baroclinicity (Cont.)
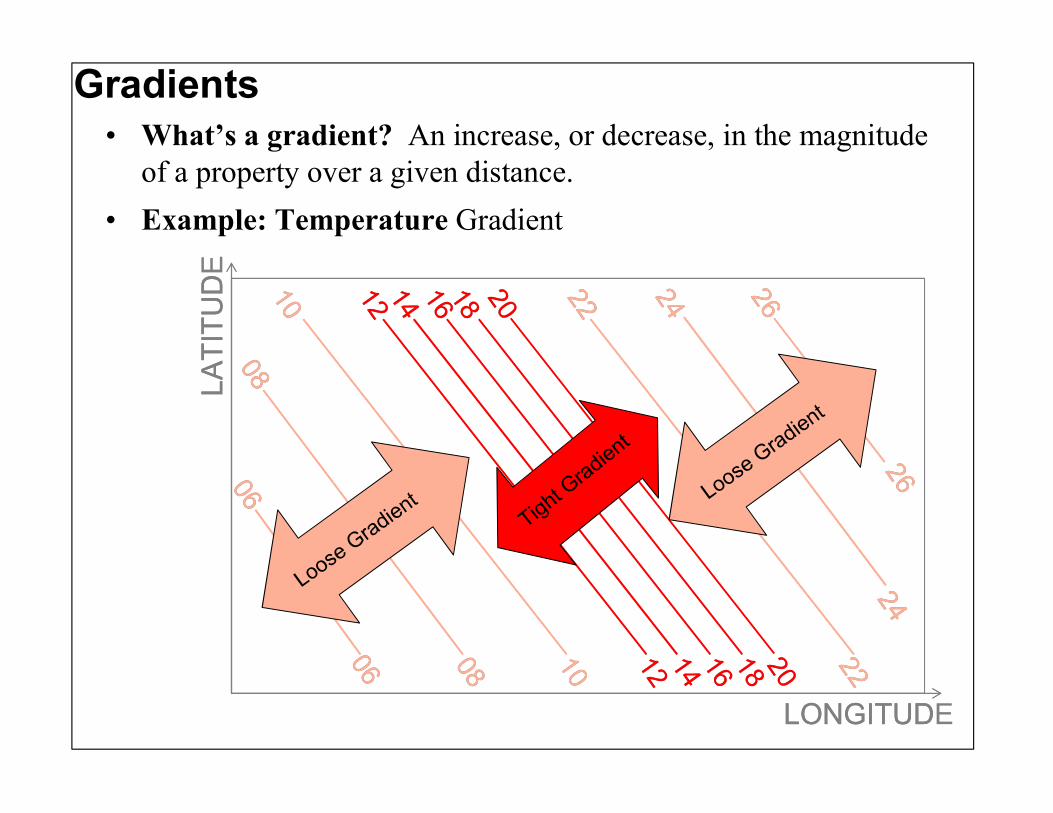
Gradients• What’s a gradient? An increase, or decrease, in the magnitude
of a property over a given distance.
• Example: Temperature Gradient
LONGITUD
LA
TIT
UD
LONGITUDE
LA
TIT
UD
E
LowerThickness
GreaterThickness
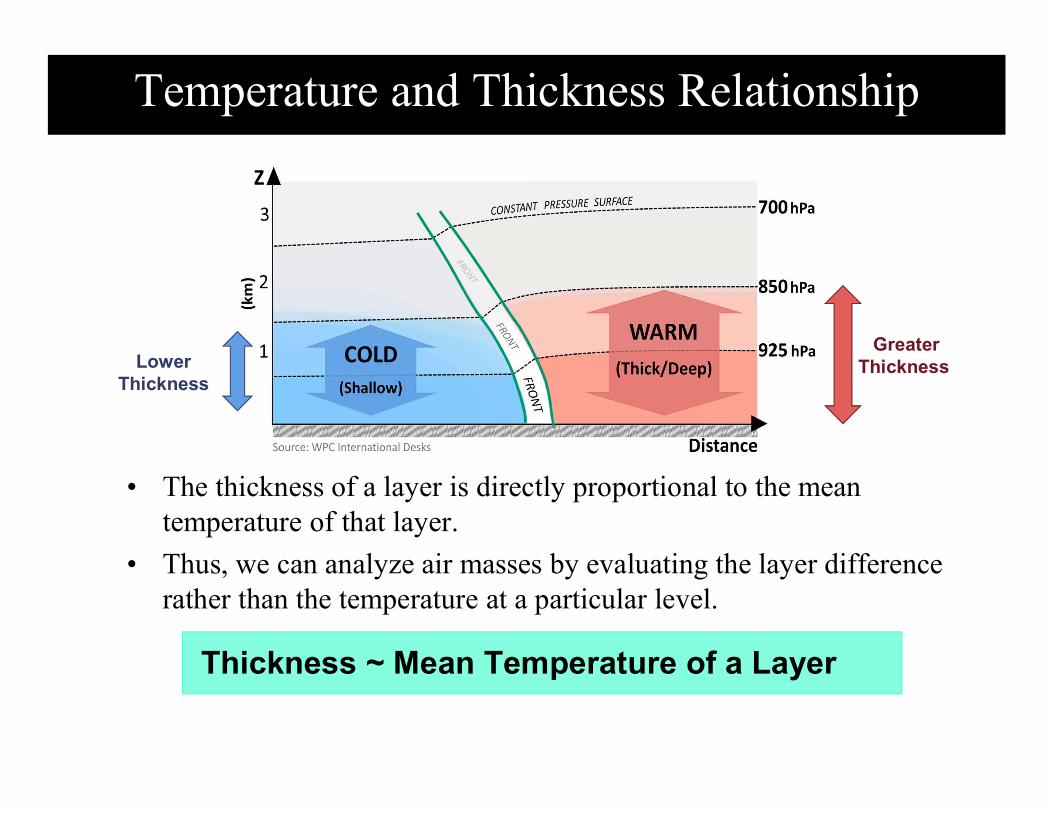
Thickness ~ Mean Temperature of a Layer
Temperature and Thickness Relationship
• The thickness of a layer is directly proportional to the mean temperature of that layer.
• Thus, we can analyze air masses by evaluating the layer difference rather than the temperature at a particular level.
Why use thickness instead of temperature?
• Provides a feel for vertical structure– Depth of the layer
• Reduces the diurnal/nocturnal temperature variability due to heating/cooling in the boundary layer– Acts as an “equalizer”
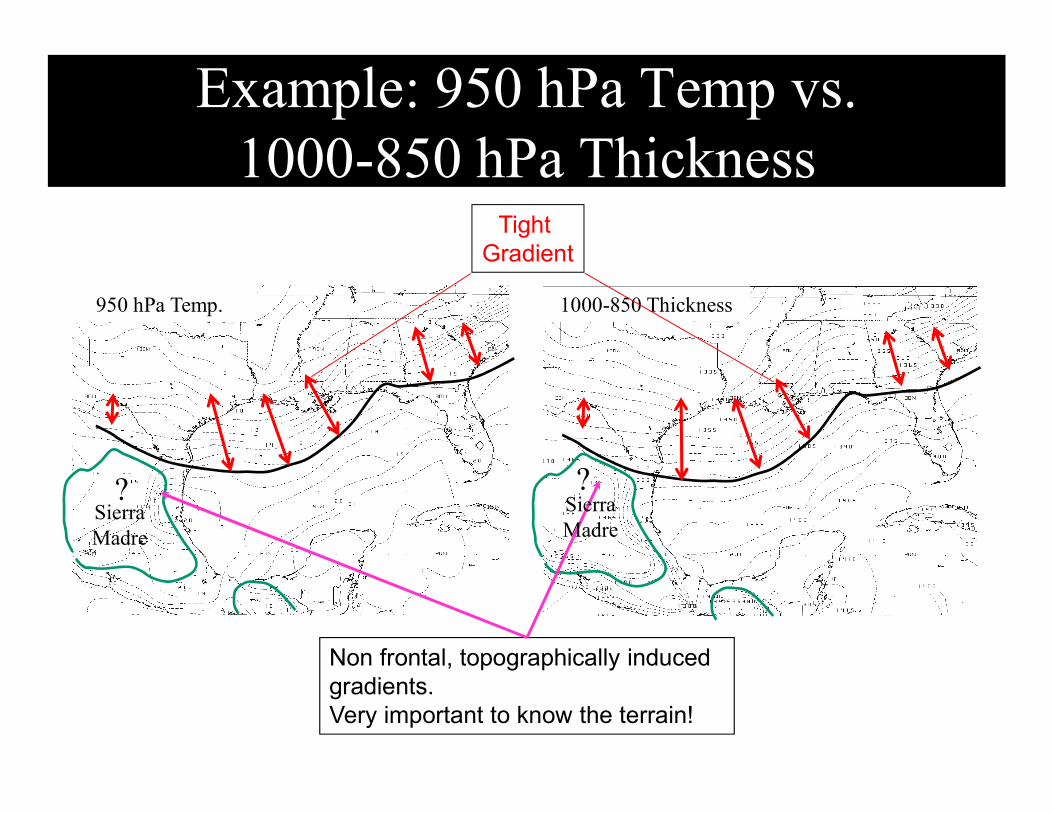
Example: 950 hPa Temp vs. 1000-850 hPa Thickness
950 hPa Temp. 1000-850 Thickness
Tight Gradient
Non frontal, topographically induced gradients.Very important to know the terrain!
SierraMadre
SierraMadre
? ?
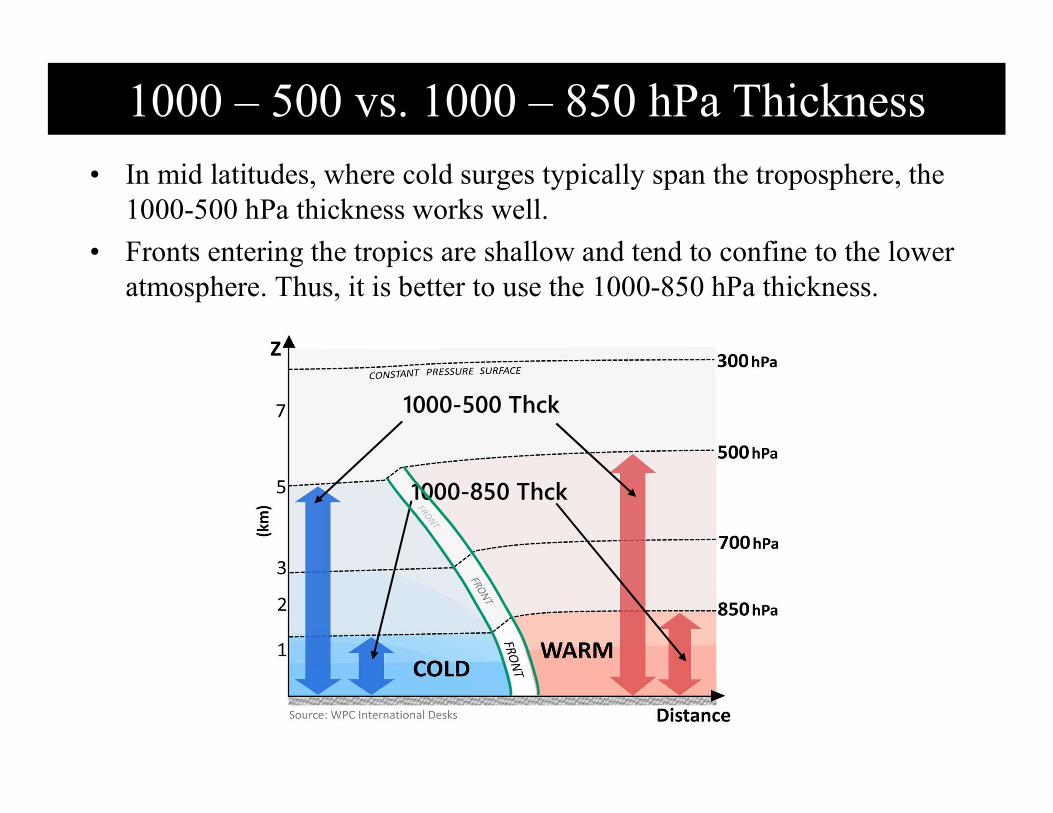
• In mid latitudes, where cold surges typically span the troposphere, the 1000-500 hPa thickness works well.
• Fronts entering the tropics are shallow and tend to confine to the lower atmosphere. Thus, it is better to use the 1000-850 hPa thickness.
1000 – 500 vs. 1000 – 850 hPa Thickness
1000-500 Thck
1000-850 Thck
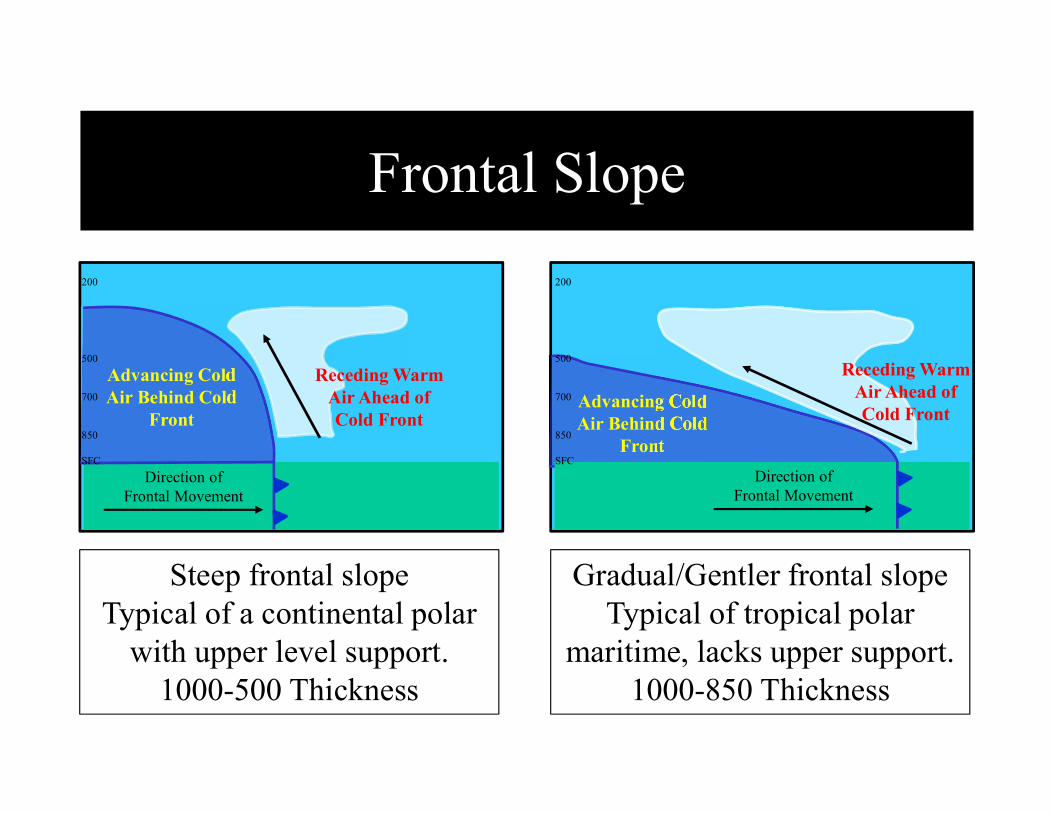
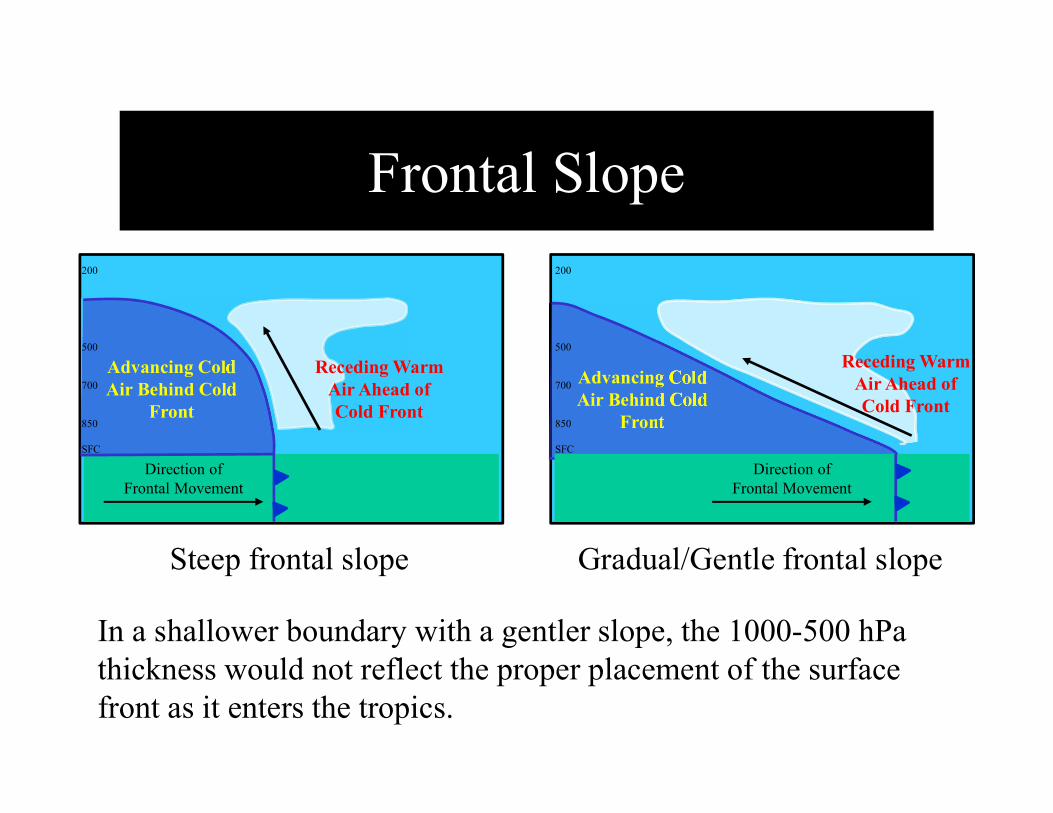
Frontal Slope
Advancing Cold Air Behind Cold
Front
Receding Warm Air Ahead of Cold Front
Direction of Frontal Movement
Direction of Frontal Movement
Advancing Cold Air Behind Cold
Front
Receding Warm Air Ahead of Cold Front
Steep frontal slopeTypical of a continental polar
with upper level support.1000-500 Thickness
Gradual/Gentler frontal slopeTypical of tropical polar
maritime, lacks upper support.1000-850 Thickness
200
500
700
850
SFC
200
500
700
850
SFC
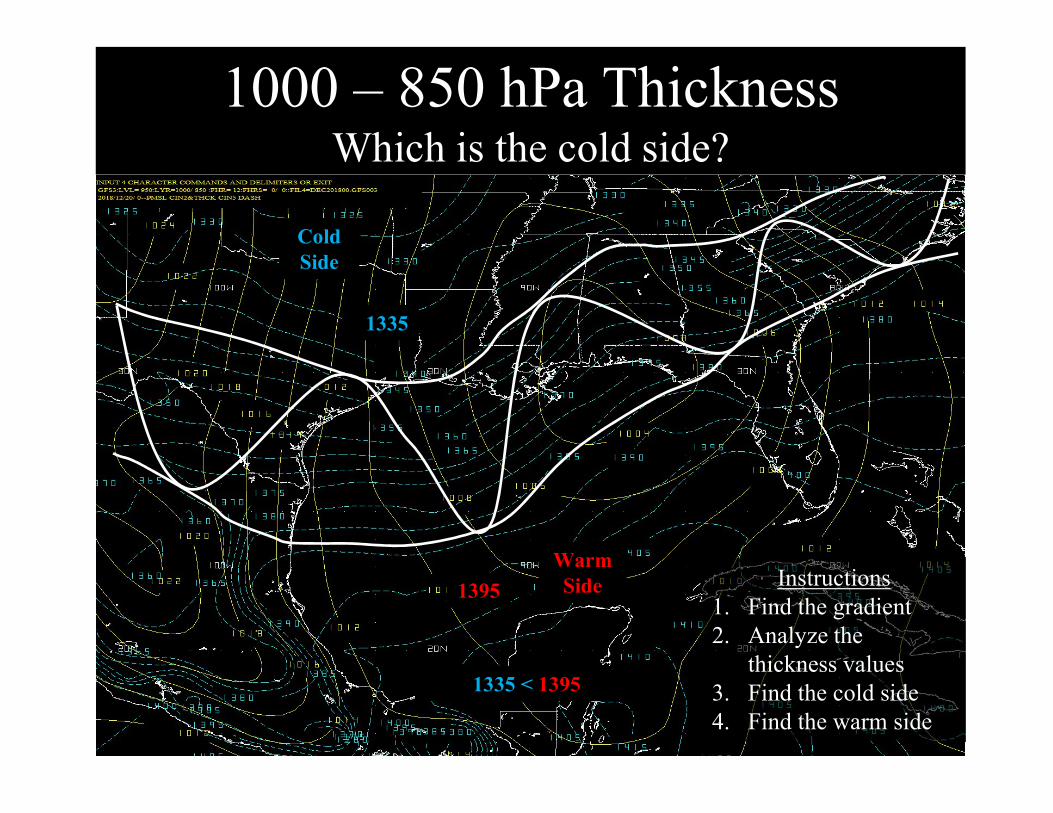
1000 – 850 hPa ThicknessWhich is the cold side?
1395
1335 < 1395
ColdSide
WarmSide Instructions
1. Find the gradient2. Analyze the
thickness values3. Find the cold side4. Find the warm side
1335
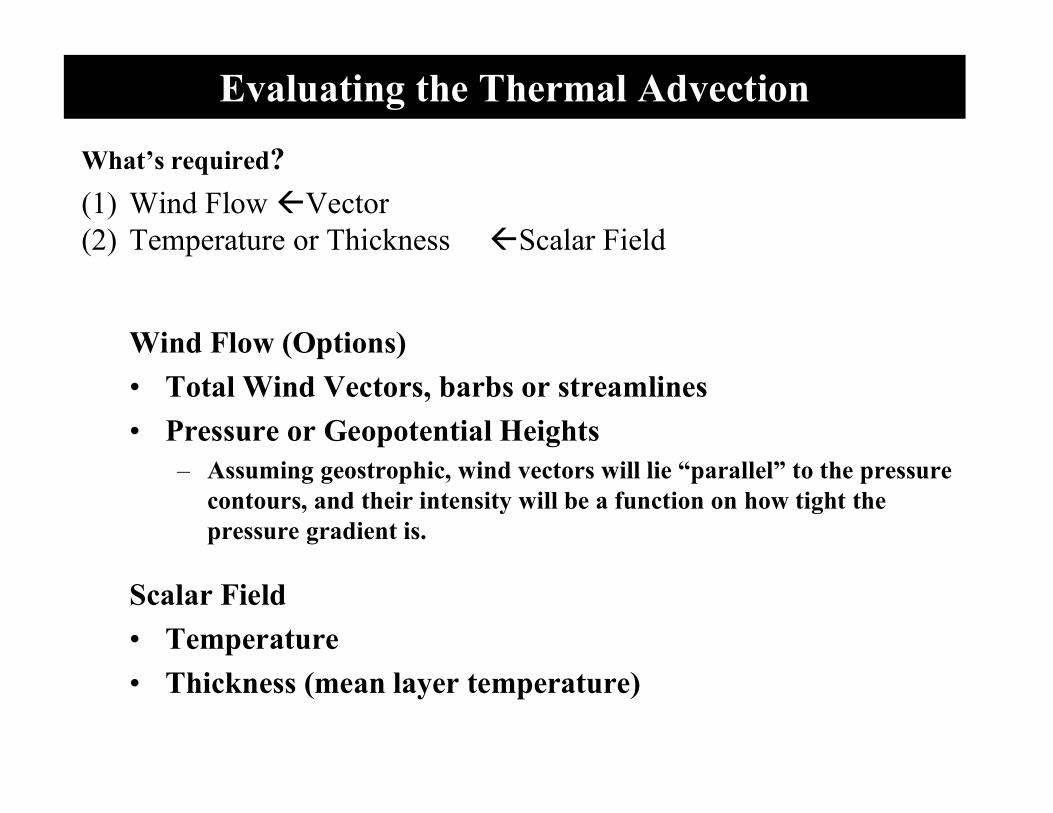
Evaluating the Thermal Advection
What’s required?
(1) Wind Flow Vector(2) Temperature or Thickness Scalar Field
Wind Flow (Options)
• Total Wind Vectors, barbs or streamlines
• Pressure or Geopotential Heights– Assuming geostrophic, wind vectors will lie “parallel” to the pressure
contours, and their intensity will be a function on how tight the pressure gradient is.
Scalar Field
• Temperature
• Thickness (mean layer temperature)
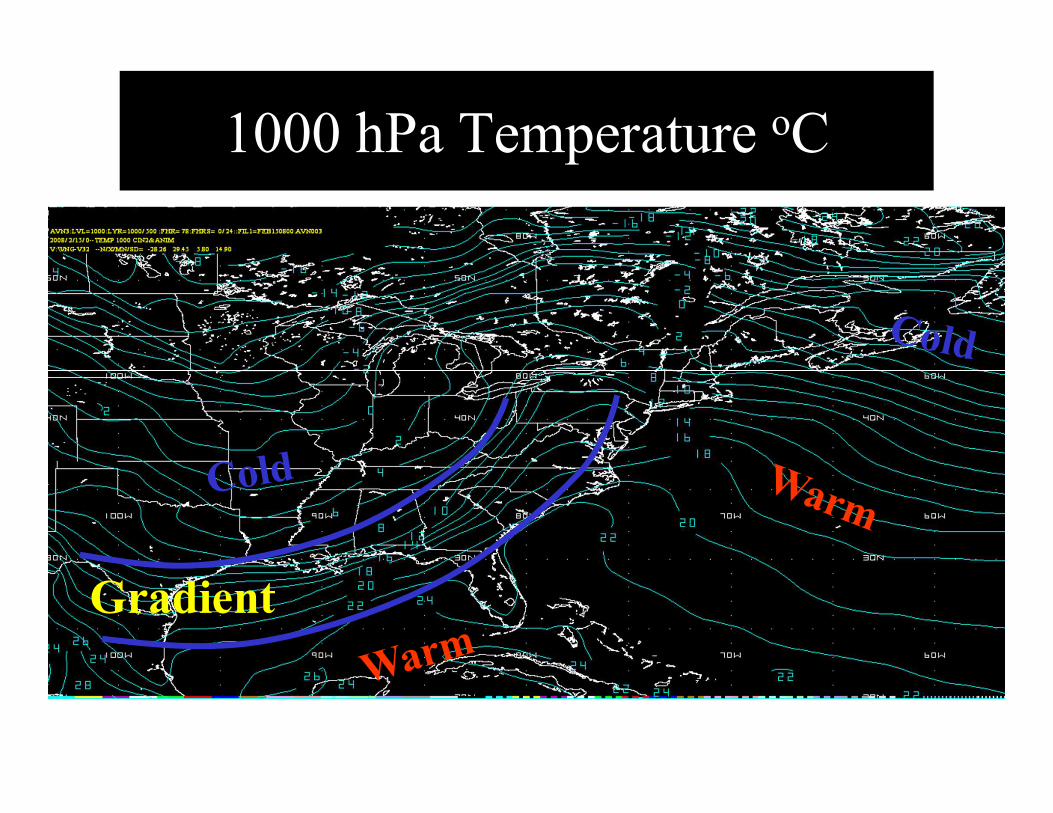
1000 hPa Temperature oC
Gradient
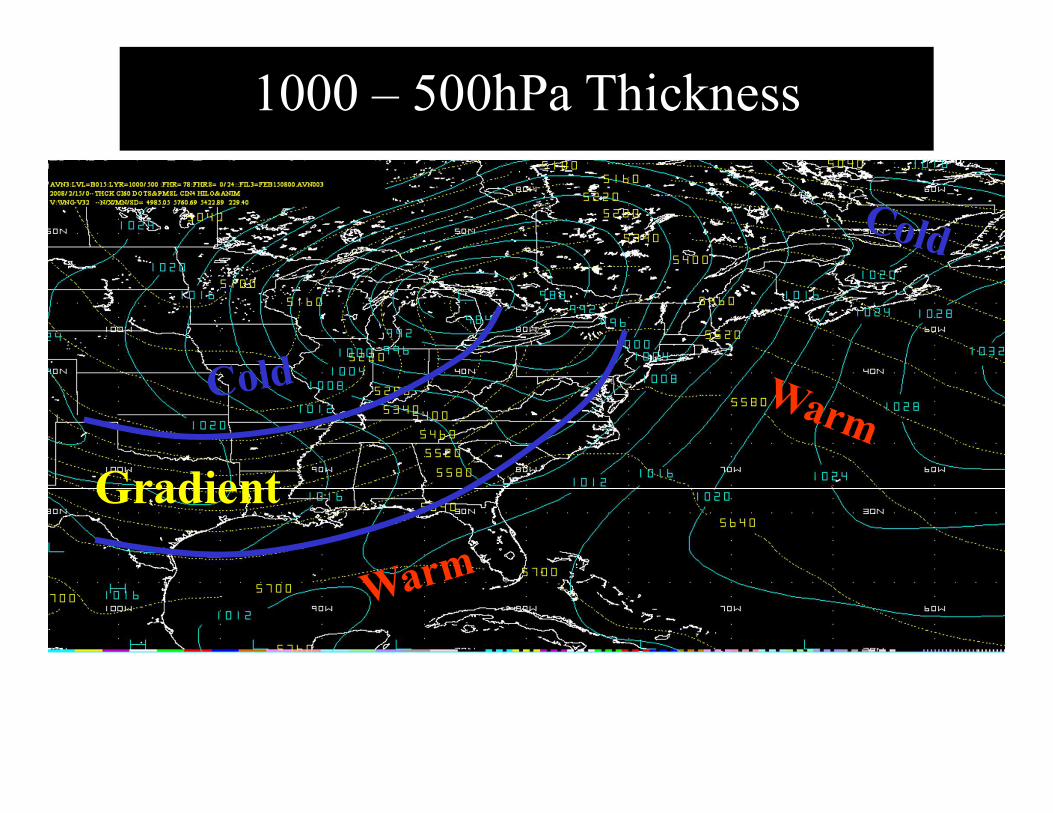
1000 – 500hPa Thickness
Gradient
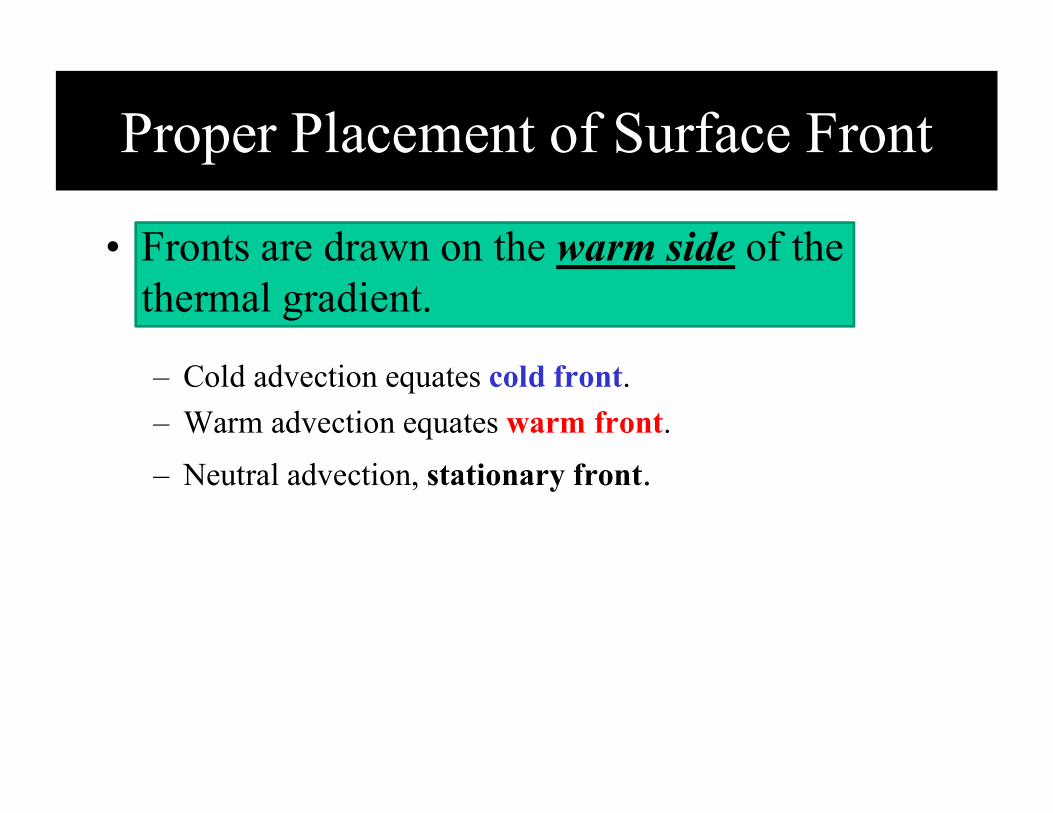
Proper Placement of Surface Front
• Fronts are drawn on the warm side of the thermal gradient.
– Cold advection equates cold front.
– Warm advection equates warm front.
– Neutral advection, stationary front.
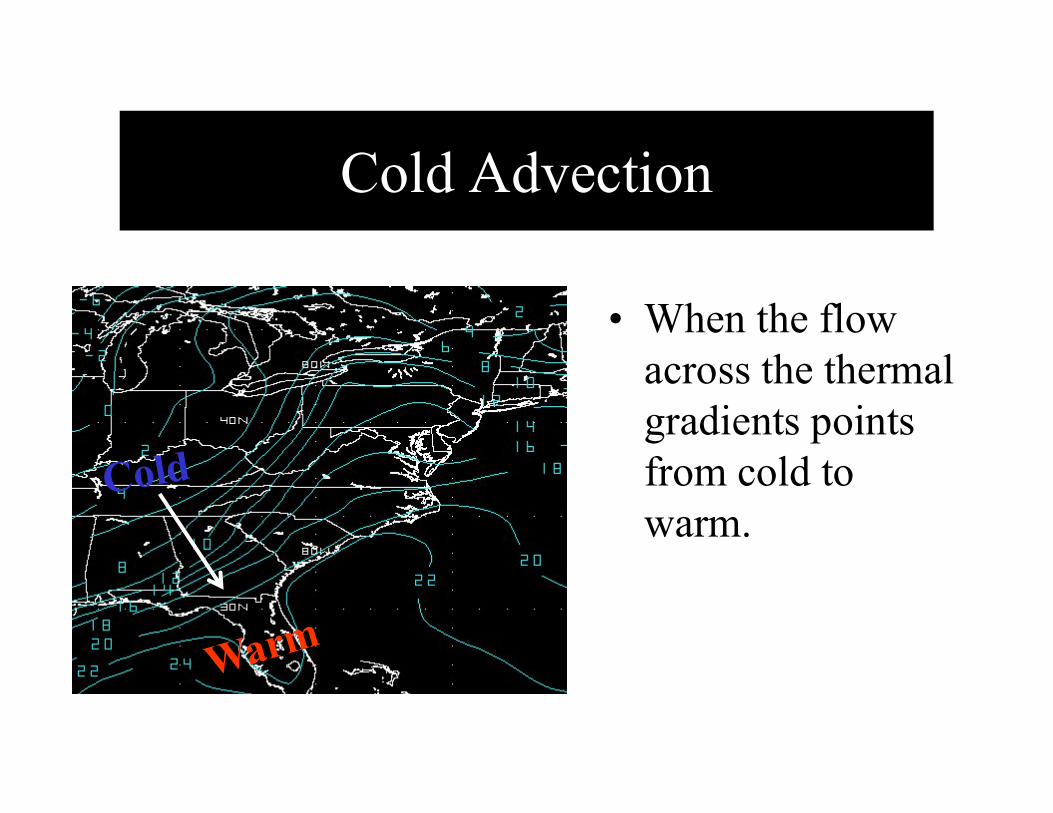
Cold Advection
• When the flow across the thermal gradients points from cold to warm.
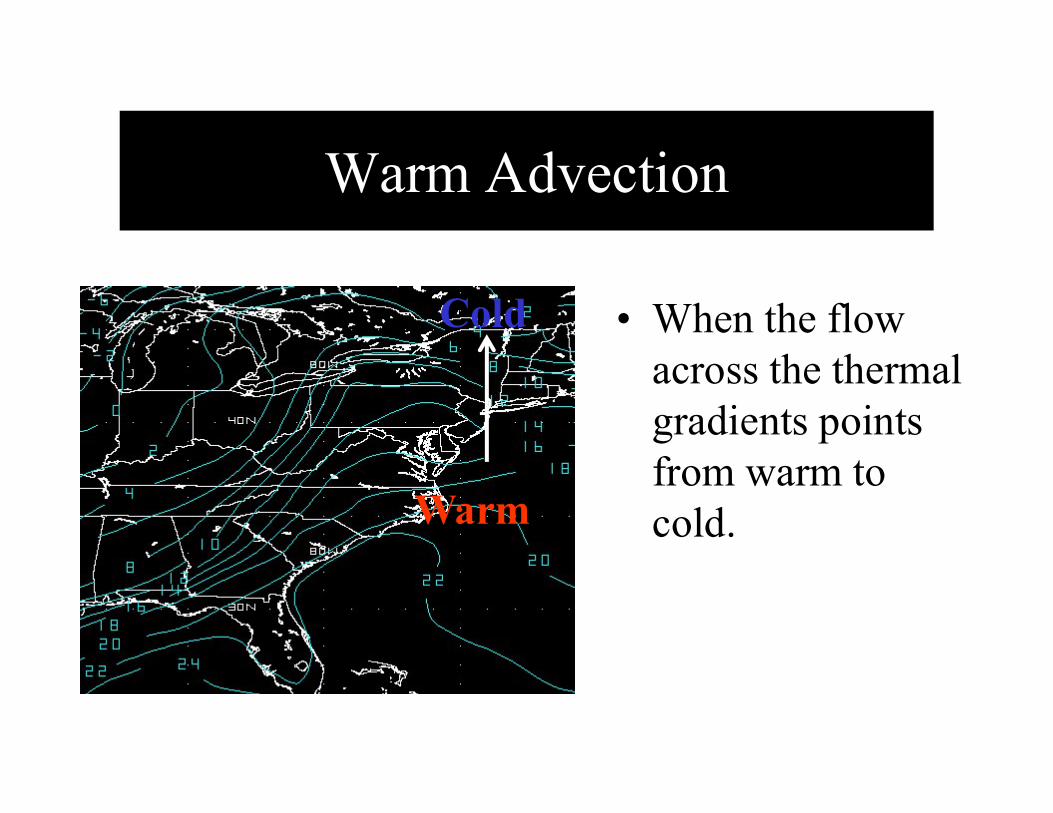
Warm Advection
• When the flow across the thermal gradients points from warm to cold.
Cold
Warm
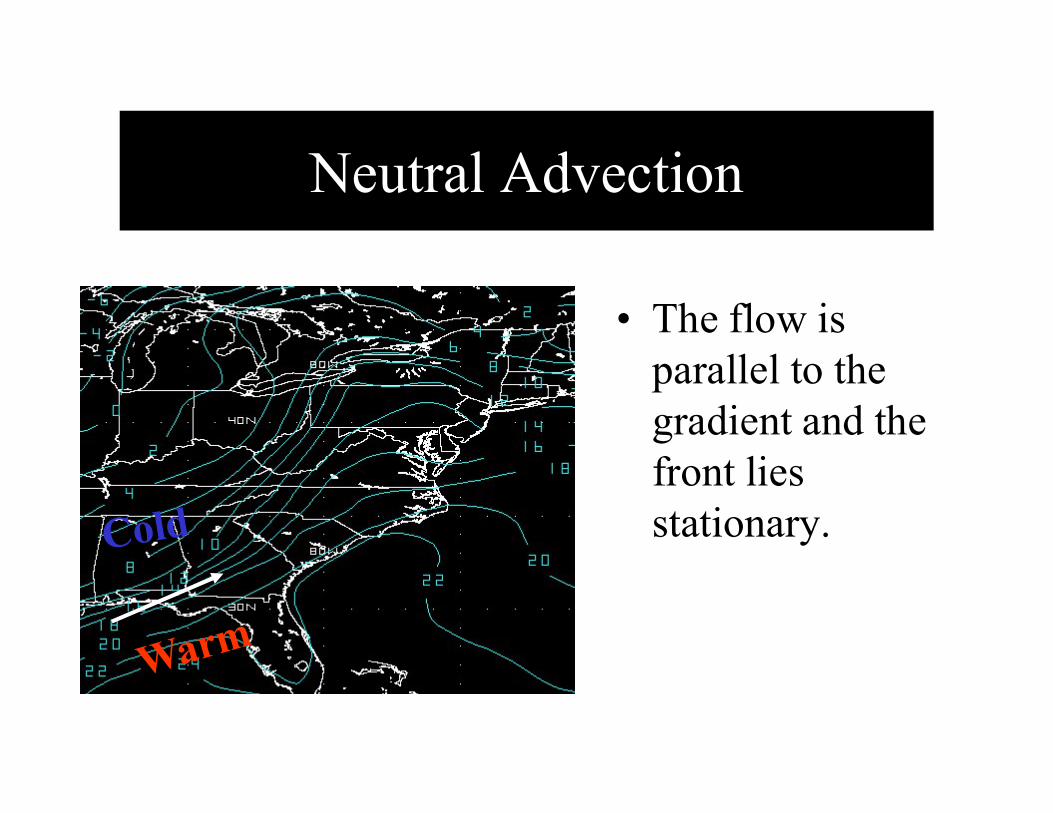
Neutral Advection
• The flow is parallel to the gradient and the front lies stationary.

Thickness and Streamlines: Temperature AdvectionPoll 1
Instructions:Where indicated, using the flow with respect to the thickness gradient determine if the advection is:- Cold (C)- Warm (W)- Neutral (N)Write it down to complete the online poll
A
B
CD
E
Example: “A”Westerly flow points from warm to cold. The advection is: Warm
Coded as = A:W
F
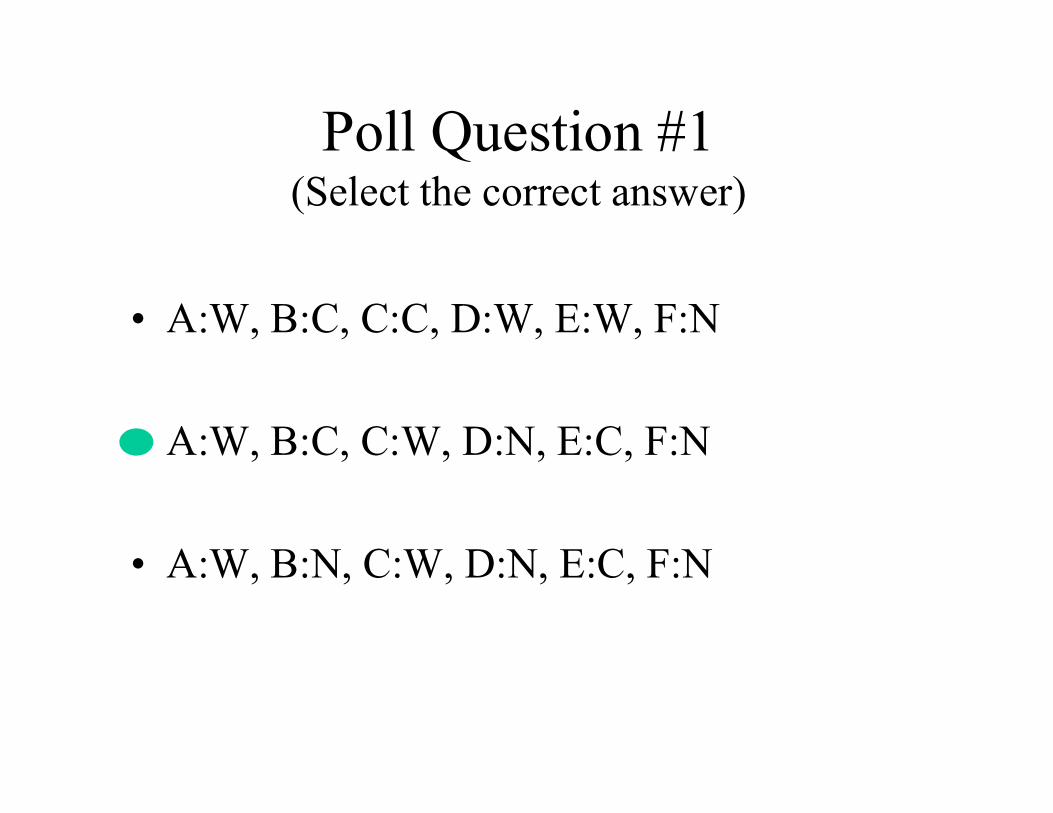
Poll Question #1(Select the correct answer)
• A:W, B:C, C:C, D:W, E:W, F:N
• A:W, B:C, C:W, D:N, E:C, F:N
• A:W, B:N, C:W, D:N, E:C, F:N
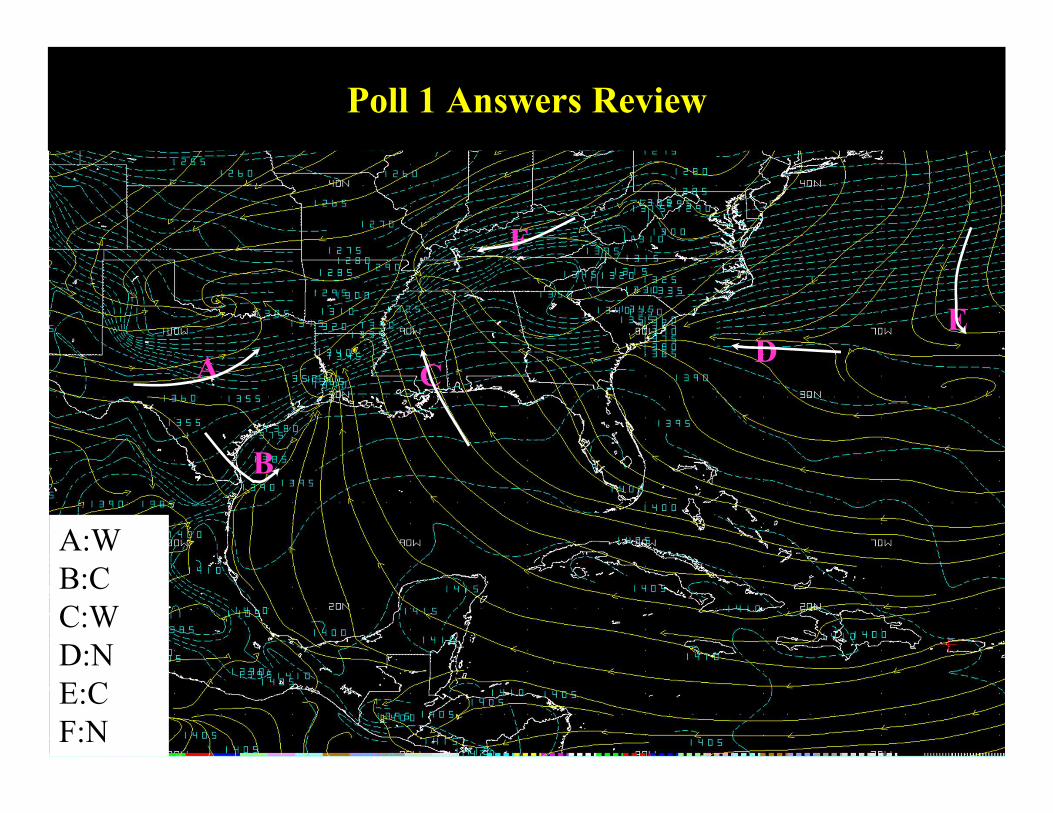
A:WB:CC:WD:NE:CF:N
A
B
CD
E
F
Poll 1 Answers Review
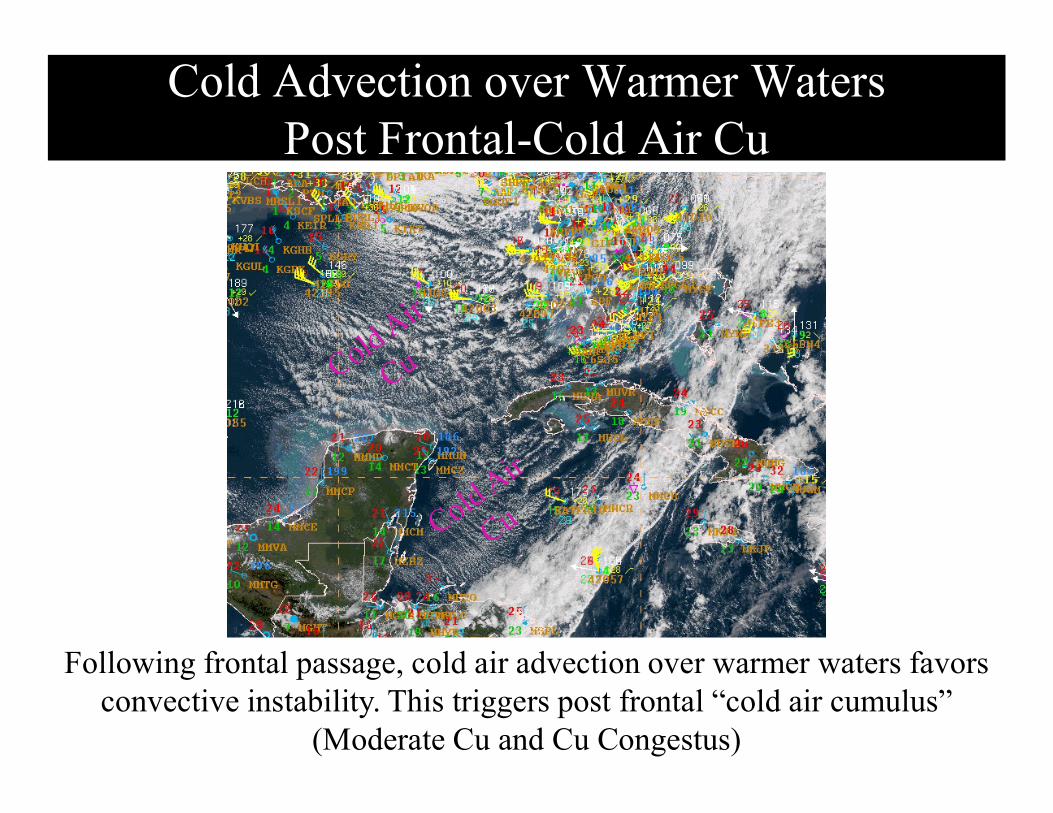
Cold Advection over Warmer WatersPost Frontal-Cold Air Cu
Following frontal passage, cold air advection over warmer waters favors convective instability. This triggers post frontal “cold air cumulus”
(Moderate Cu and Cu Congestus)
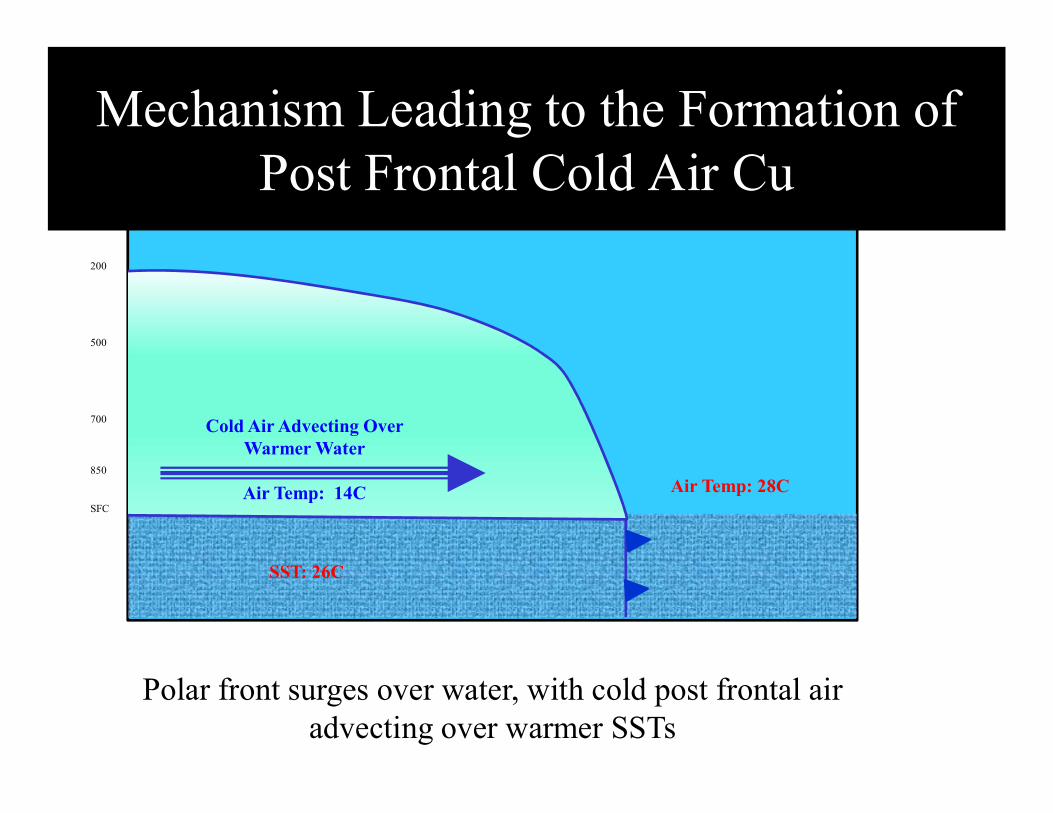
SST: 26C
Cold Air Advecting Over Warmer Water
Air Temp: 14C
Polar front surges over water, with cold post frontal air advecting over warmer SSTs
200
500
700
850
SFC
Air Temp: 28C
Mechanism Leading to the Formation of Post Frontal Cold Air Cu
200
500
700
850
SFC
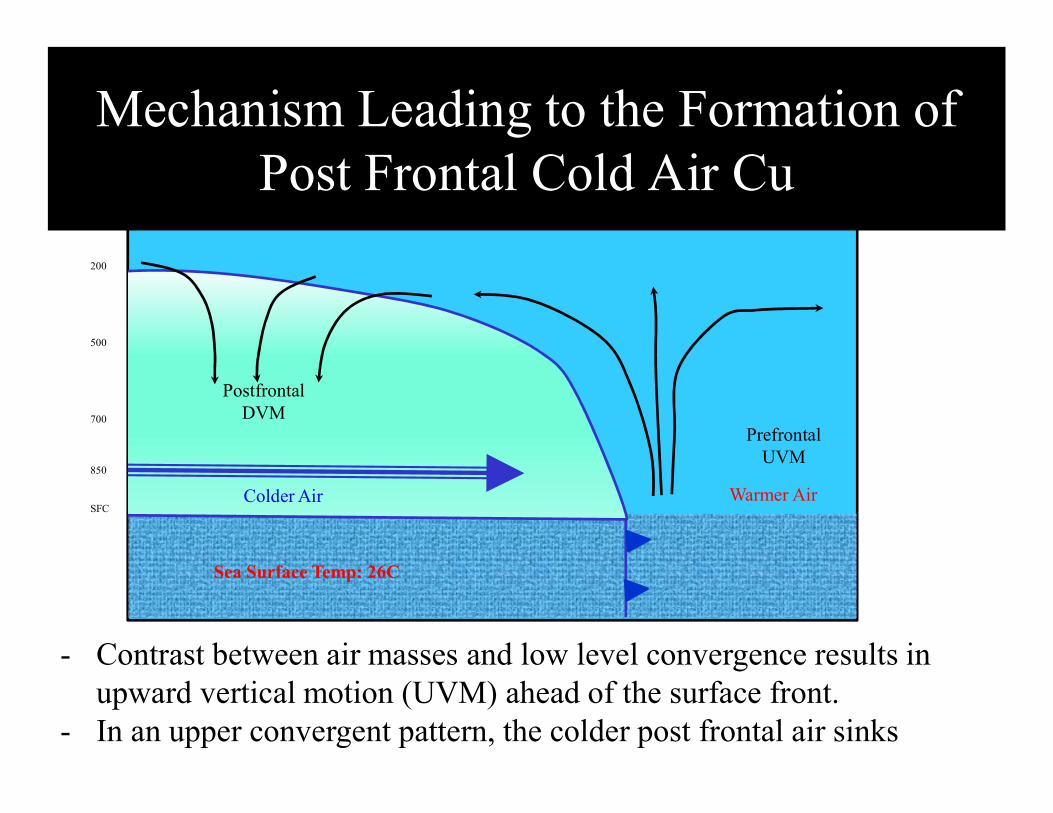
Prefrontal UVM
Postfrontal DVM
- Contrast between air masses and low level convergence results in upward vertical motion (UVM) ahead of the surface front.
- In an upper convergent pattern, the colder post frontal air sinks
Sea Surface Temp: 26C
Colder Air Warmer Air
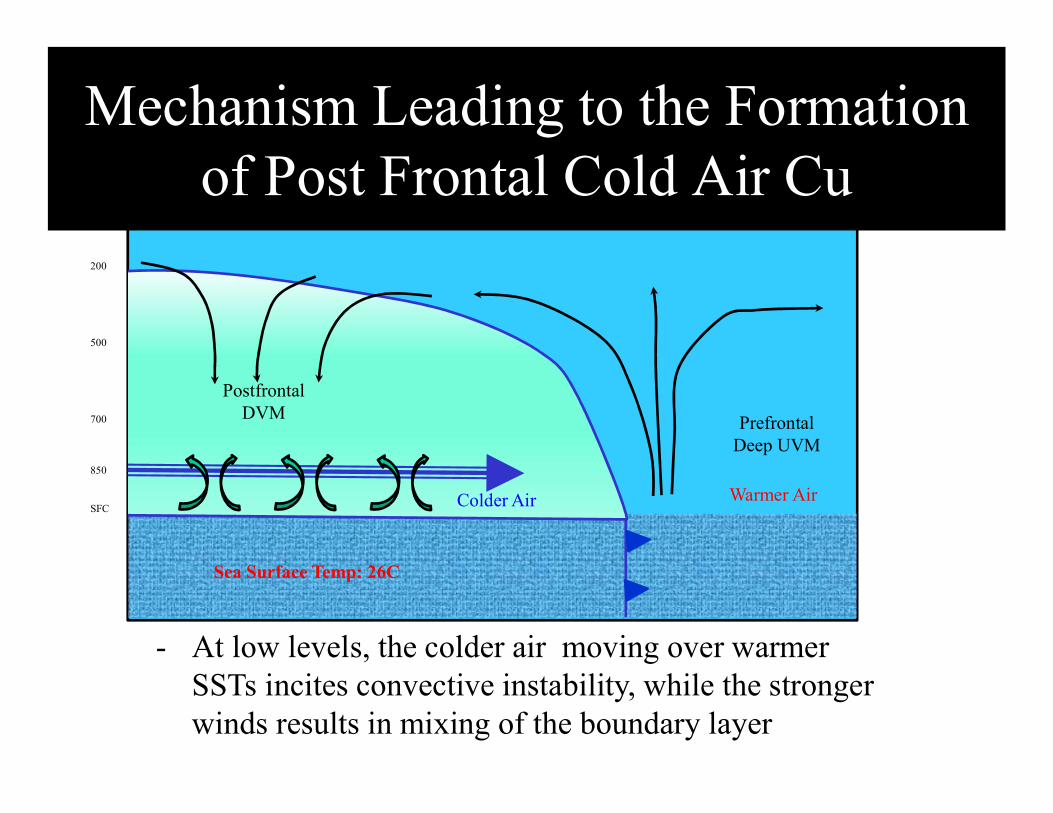
Mechanism Leading to the Formation of Post Frontal Cold Air Cu
200
500
700
850
SFC
Prefrontal Deep UVM
Postfrontal DVM
- At low levels, the colder air moving over warmer SSTs incites convective instability, while the stronger winds results in mixing of the boundary layer
Sea Surface Temp: 26C
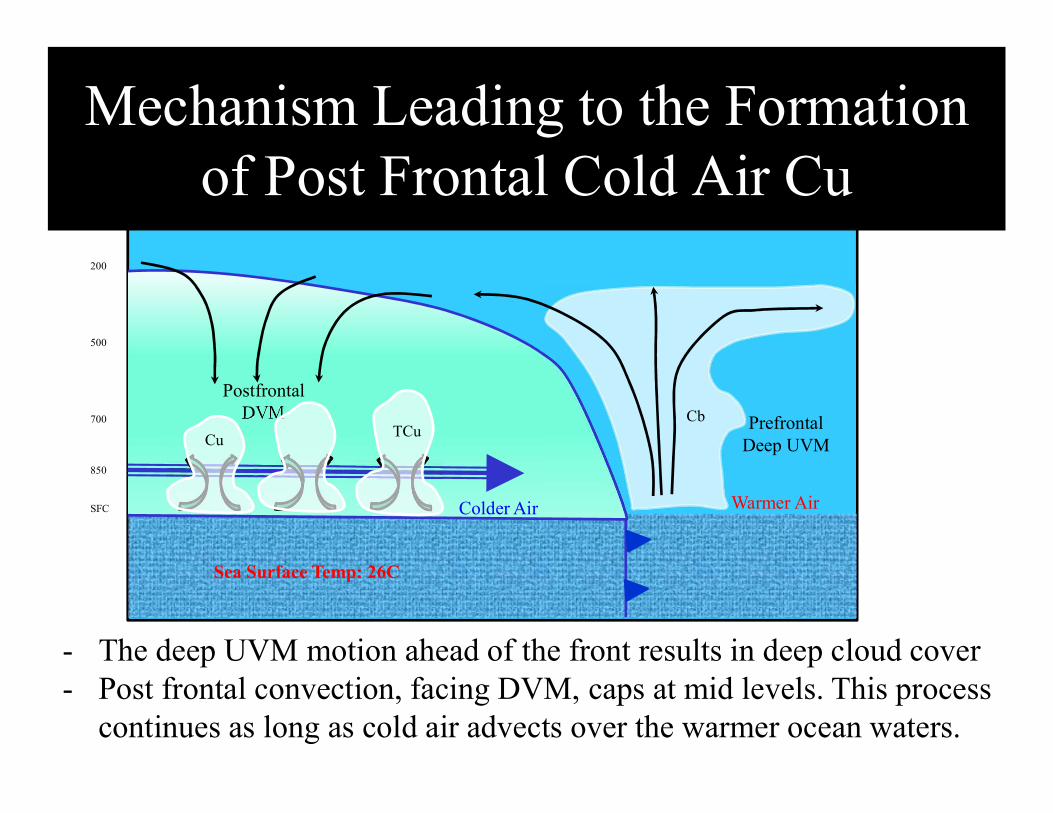
Mechanism Leading to the Formation of Post Frontal Cold Air Cu
Colder Air Warmer Air
200
500
700
850
SFC
Prefrontal Deep UVM
Postfrontal DVM
- The deep UVM motion ahead of the front results in deep cloud cover- Post frontal convection, facing DVM, caps at mid levels. This process
continues as long as cold air advects over the warmer ocean waters.
Sea Surface Temp: 26C
Mechanism Leading to the Formation of Post Frontal Cold Air Cu
Colder Air Warmer Air
TCuCu
Cb
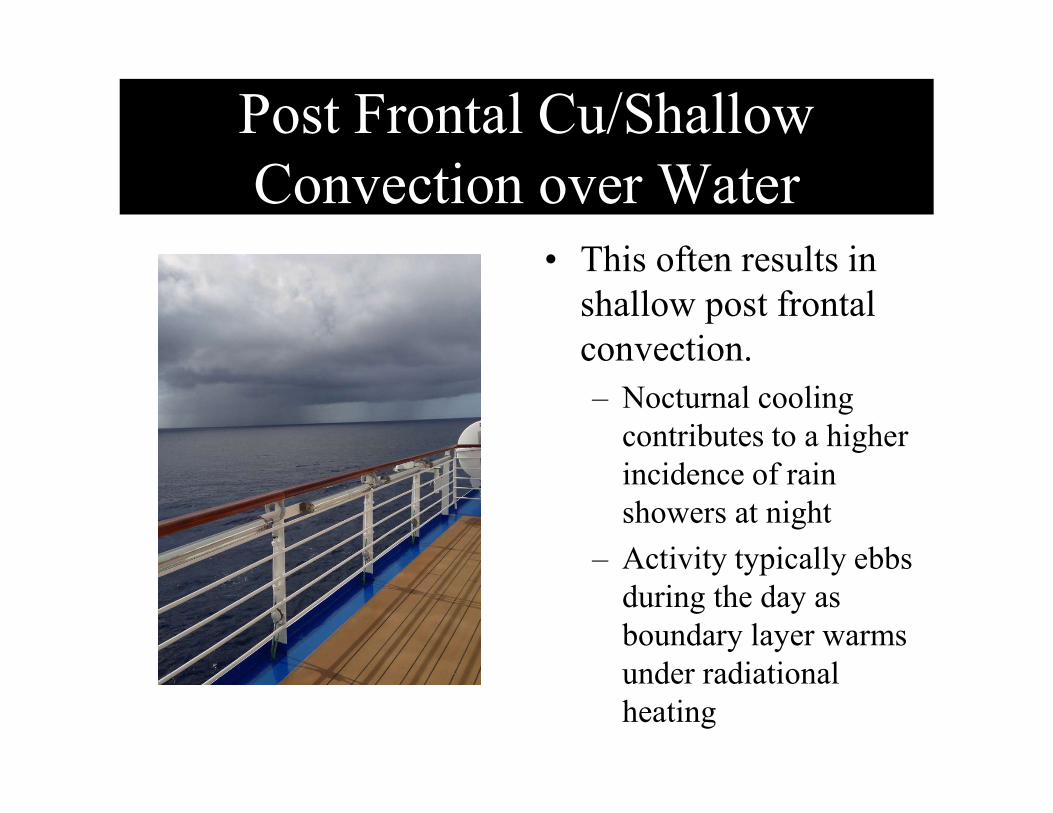
Post Frontal Cu/Shallow Convection over Water
• This often results in shallow post frontal convection.– Nocturnal cooling
contributes to a higher incidence of rain showers at night
– Activity typically ebbs during the day as boundary layer warms under radiational heating

Frontal Analysis
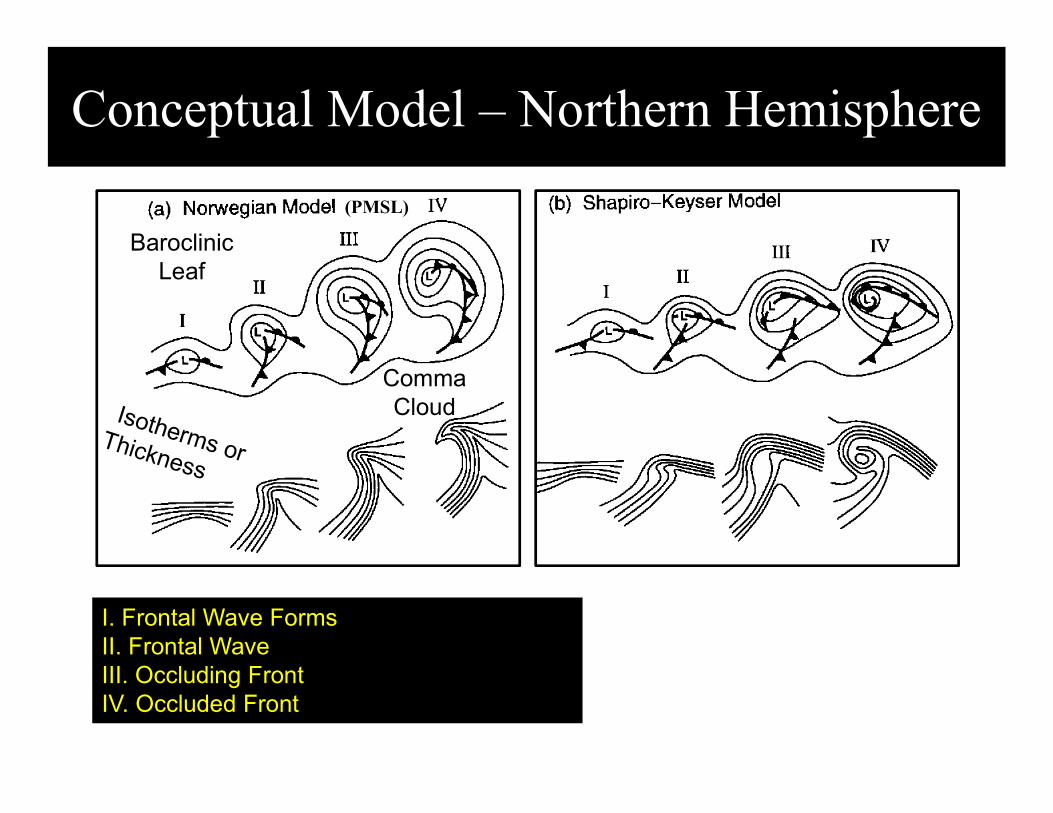
I. Frontal Wave FormsII. Frontal WaveIII. Occluding FrontIV. Occluded Front
Baroclinic Leaf
Comma Cloud
(PMSL)
Conceptual Model – Northern Hemisphere
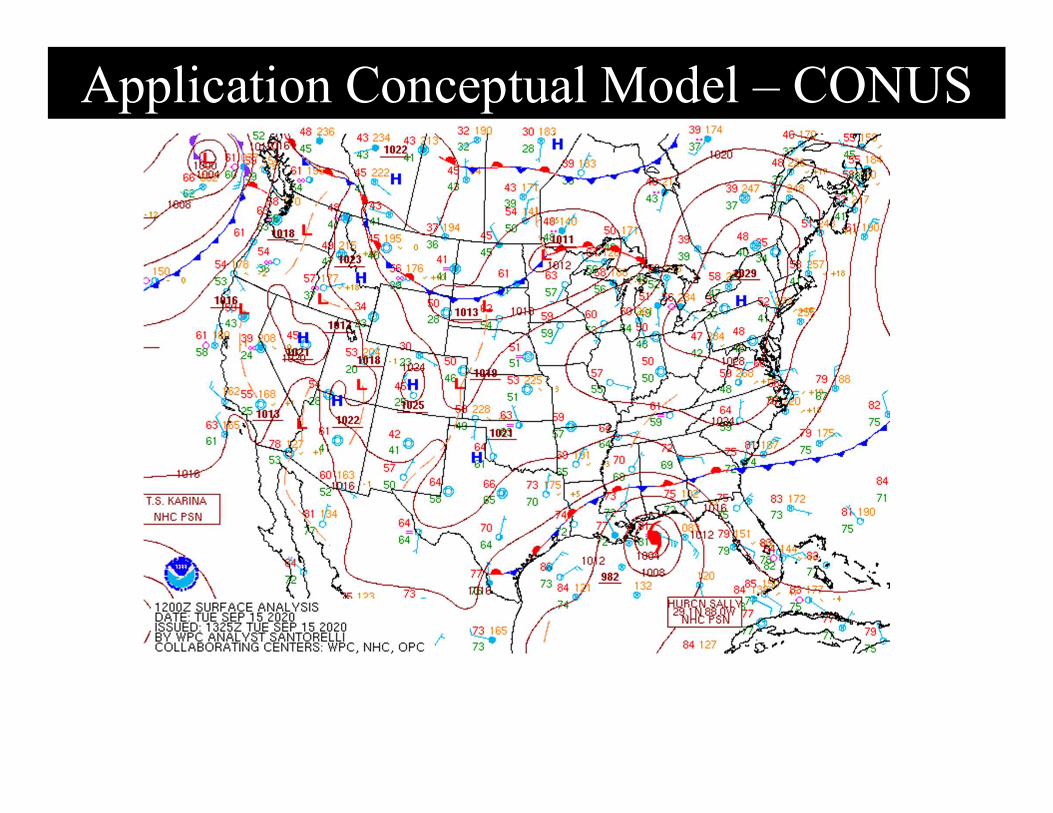
Application Conceptual Model – CONUS
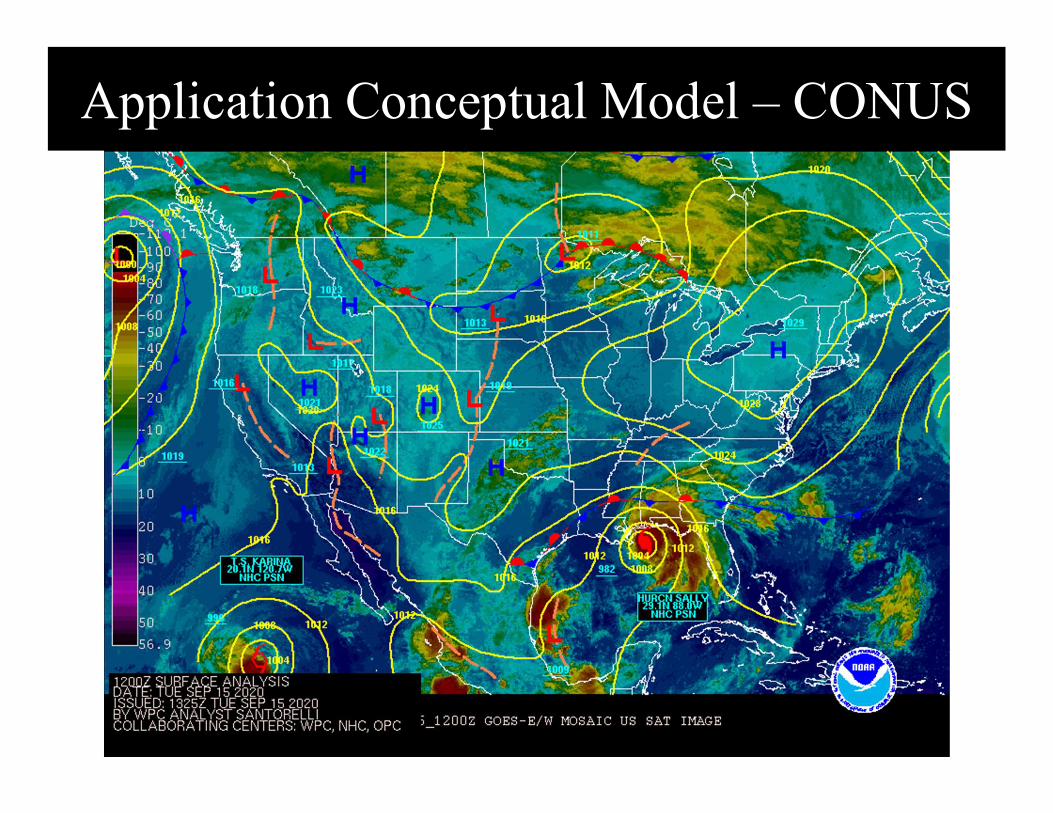
Application Conceptual Model – CONUS
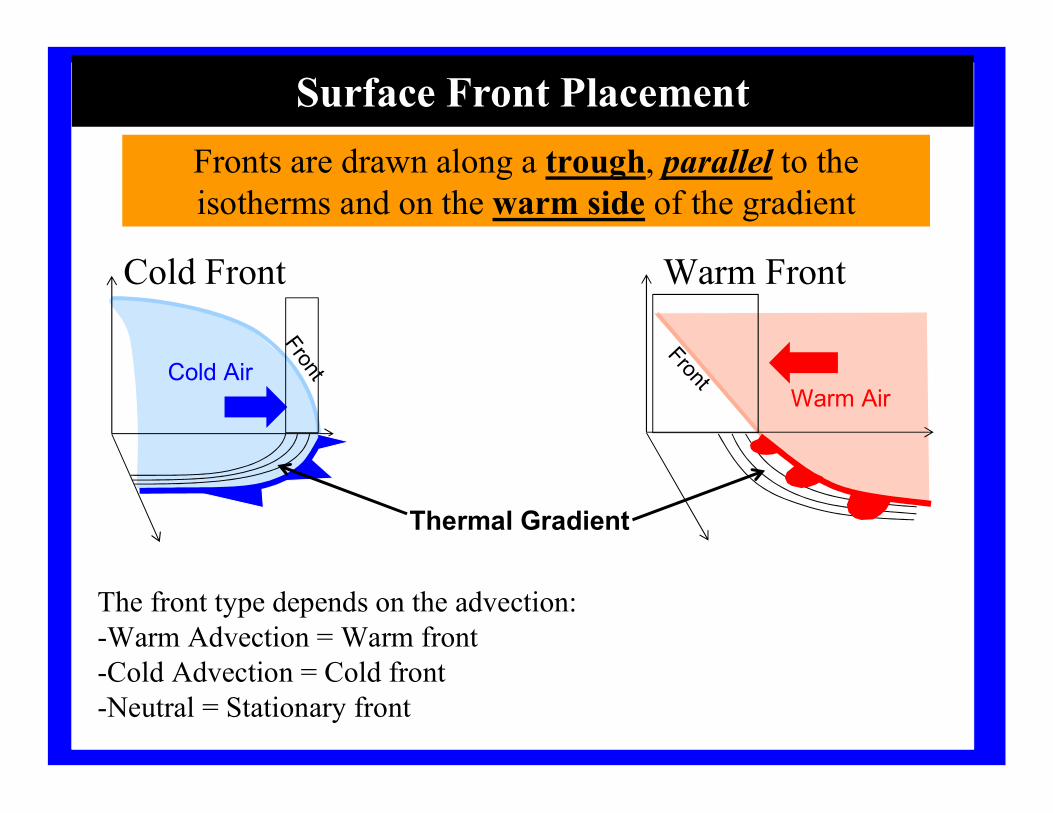
Cold Front Warm Front
Cold AirWarm Air
Fronts are drawn along a trough, parallel to the isotherms and on the warm side of the gradient
Thermal Gradient
Surface Front Placement
The front type depends on the advection:-Warm Advection = Warm front-Cold Advection = Cold front-Neutral = Stationary front
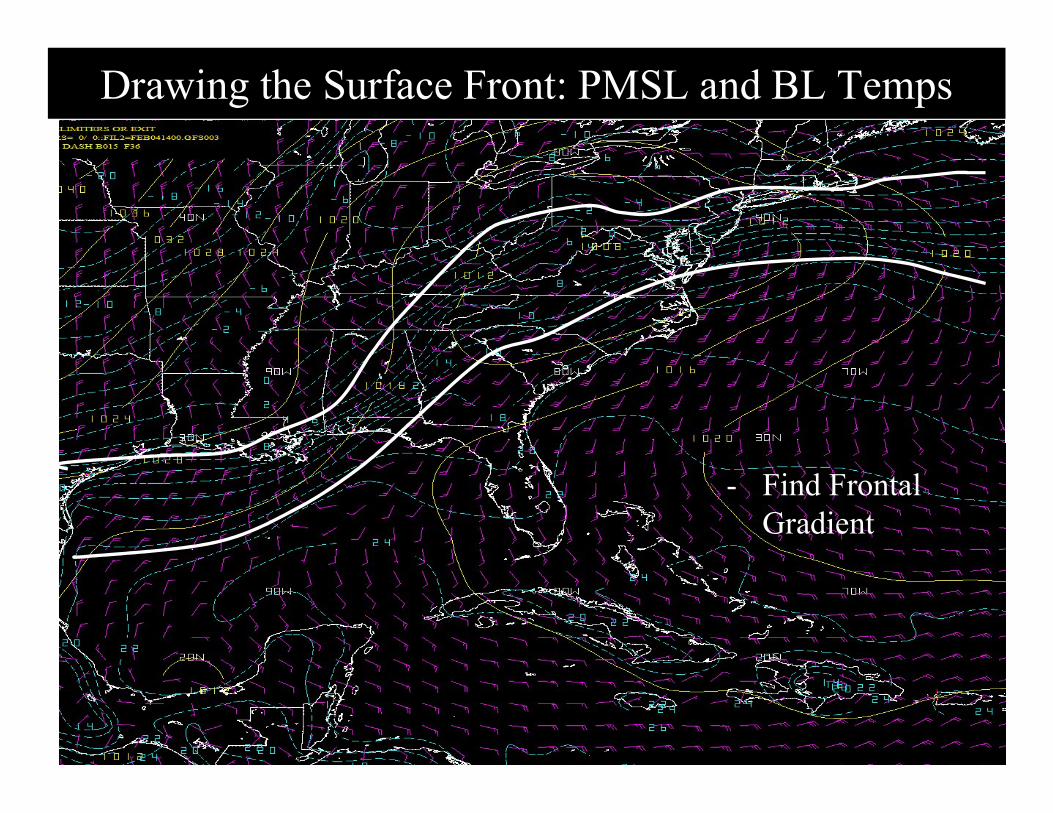
Drawing the Surface Front: PMSL and BL Temps
- Find Frontal Gradient
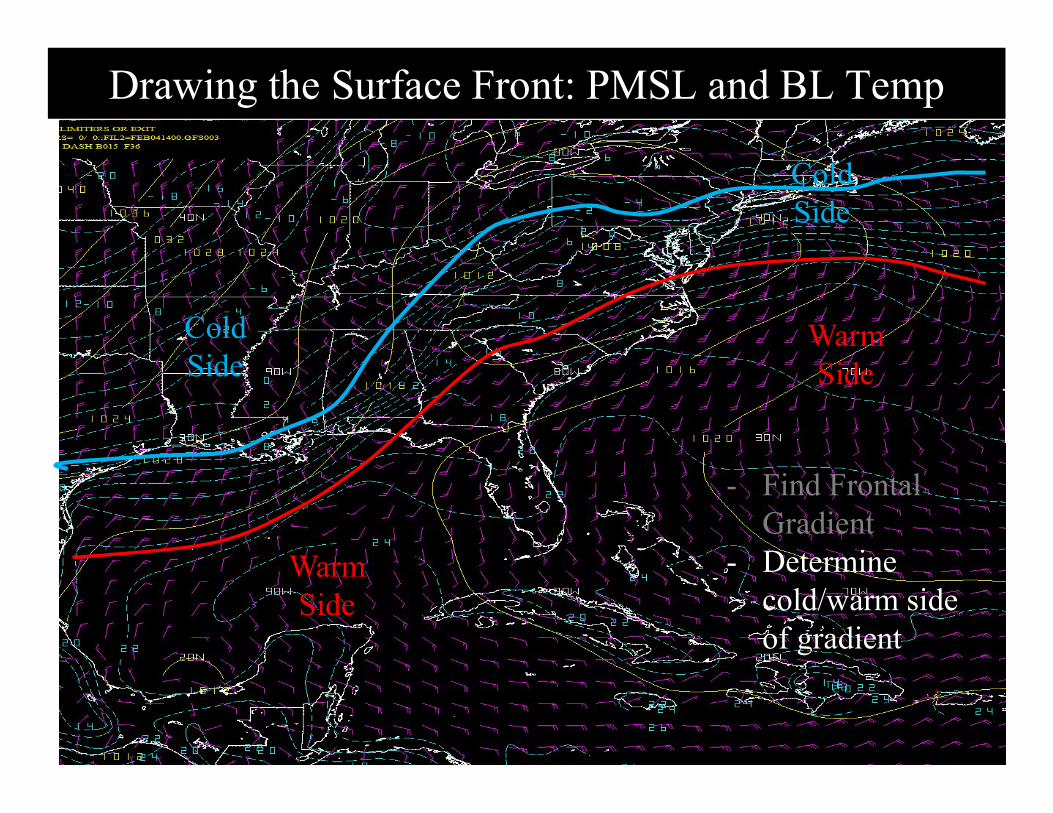
Drawing the Surface Front: PMSL and BL Temp
Cold Side
Cold Side
Warm Side
Warm Side
- Find Frontal Gradient
- Determine cold/warm side of gradient
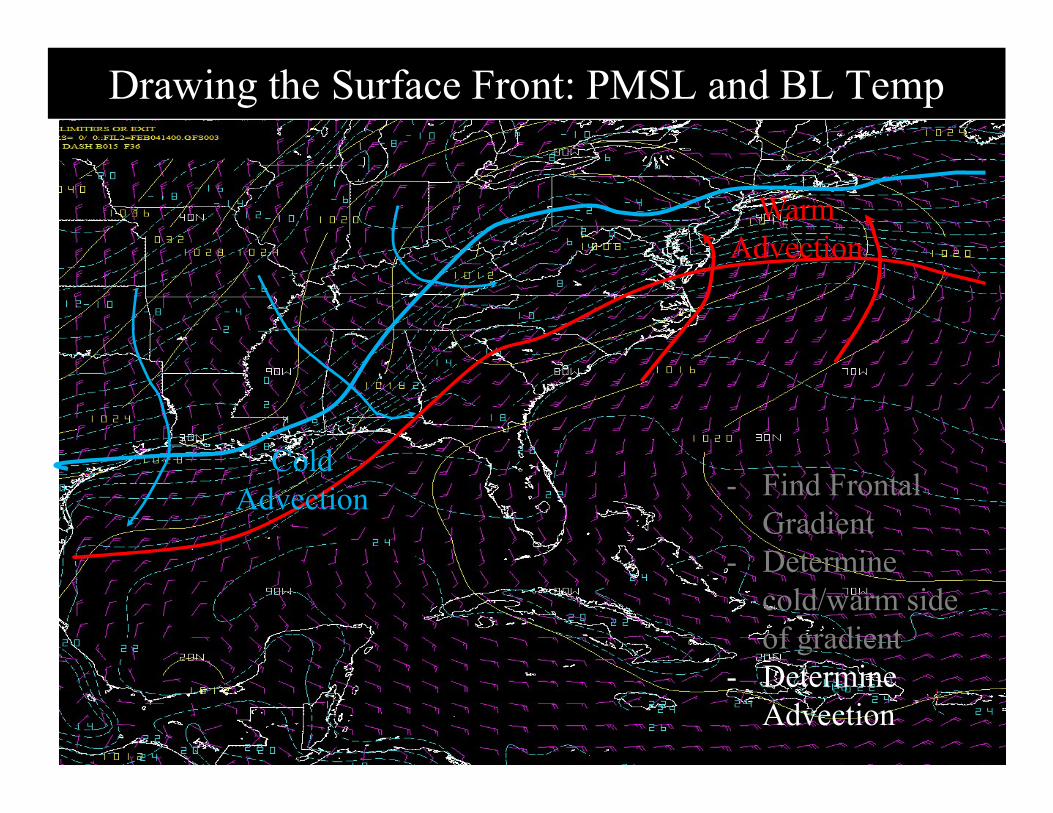
Drawing the Surface Front: PMSL and BL Temp
- Find Frontal Gradient
- Determine cold/warm side of gradient
- Determine Advection
Cold Advection
Warm Advection
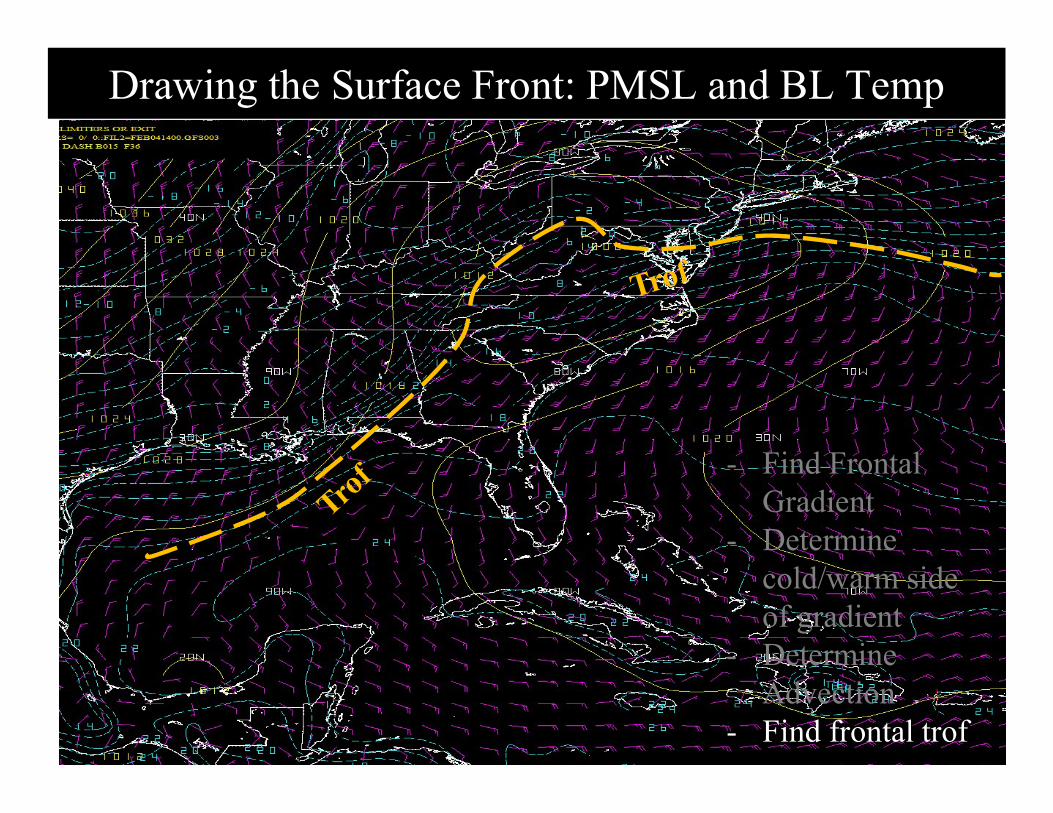
Drawing the Surface Front: PMSL and BL Temp
- Find Frontal Gradient
- Determine cold/warm side of gradient
- Determine Advection
- Find frontal trof
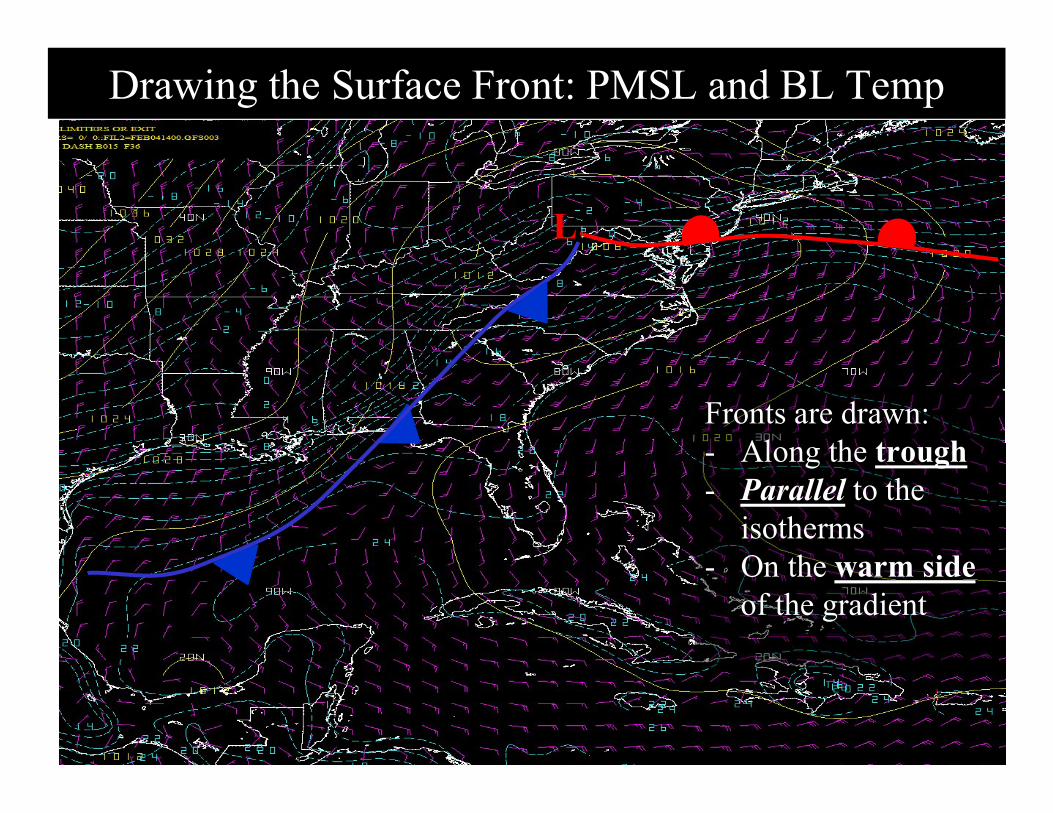
Drawing the Surface Front: PMSL and BL Temp
Fronts are drawn:- Along the trough- Parallel to the
isotherms- On the warm side
of the gradient
L
Poll Question #2(Select all that apply)
• Fronts separate air masses of different density
• Barotropic implies temperature advection
• Baroclinic implies temperature advection
• Shallow boundary in the tropics, use the 1000-850 thickness
• Shallow boundary in the tropics, use the 1000-500 thickness
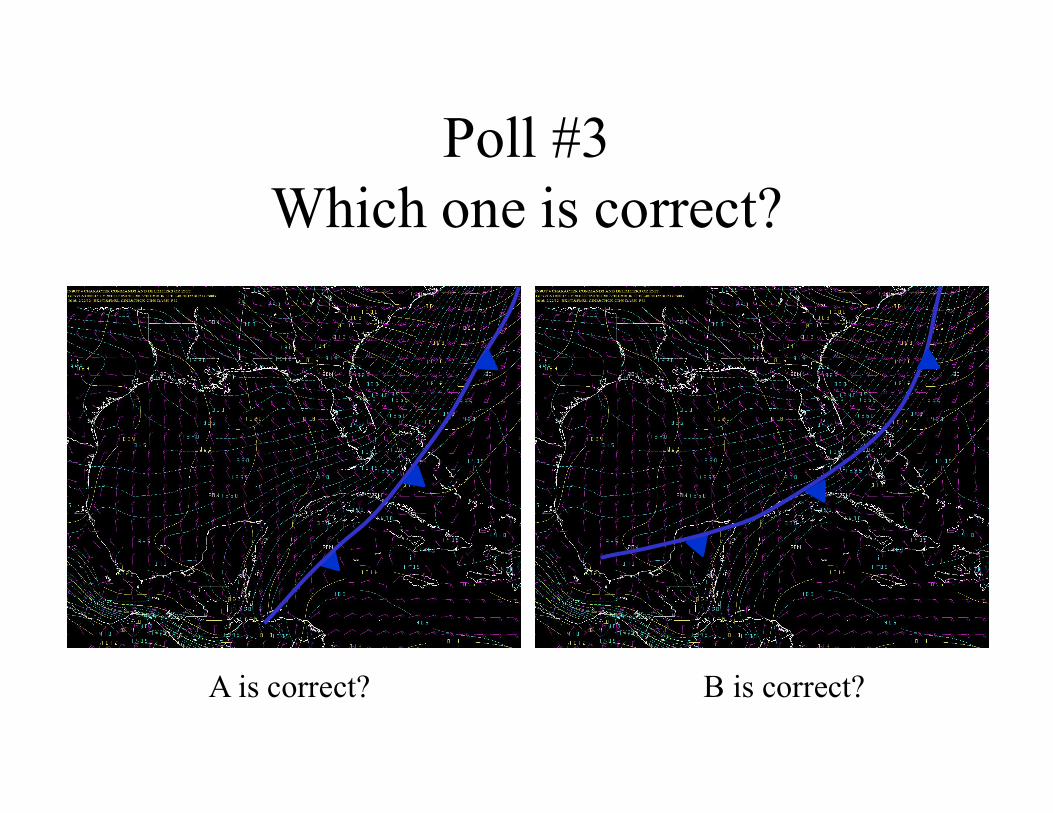
Poll #3Which one is correct?
A is correct? B is correct?

Poll Question #3(Select one)
• A is correct
• B is correct
• Both are incorrect
• Both are correct
• Not enough information to determine
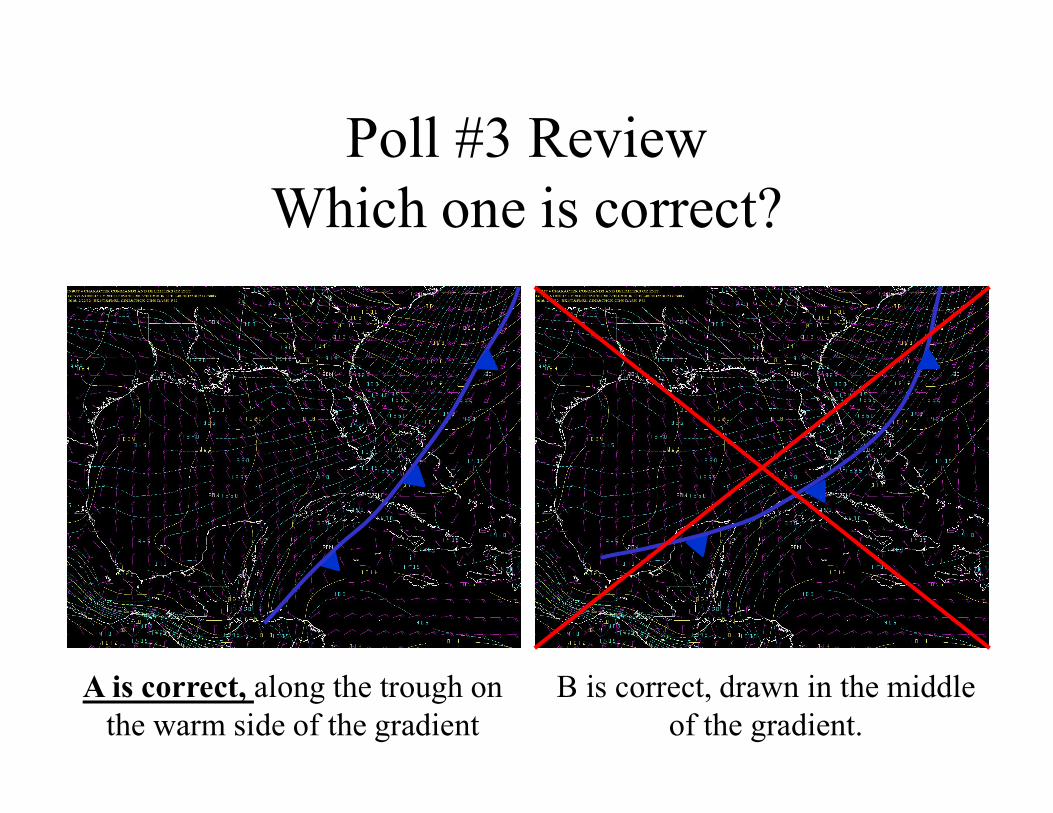
Poll #3 ReviewWhich one is correct?
A is correct, along the trough on the warm side of the gradient
B is correct, drawn in the middle of the gradient.
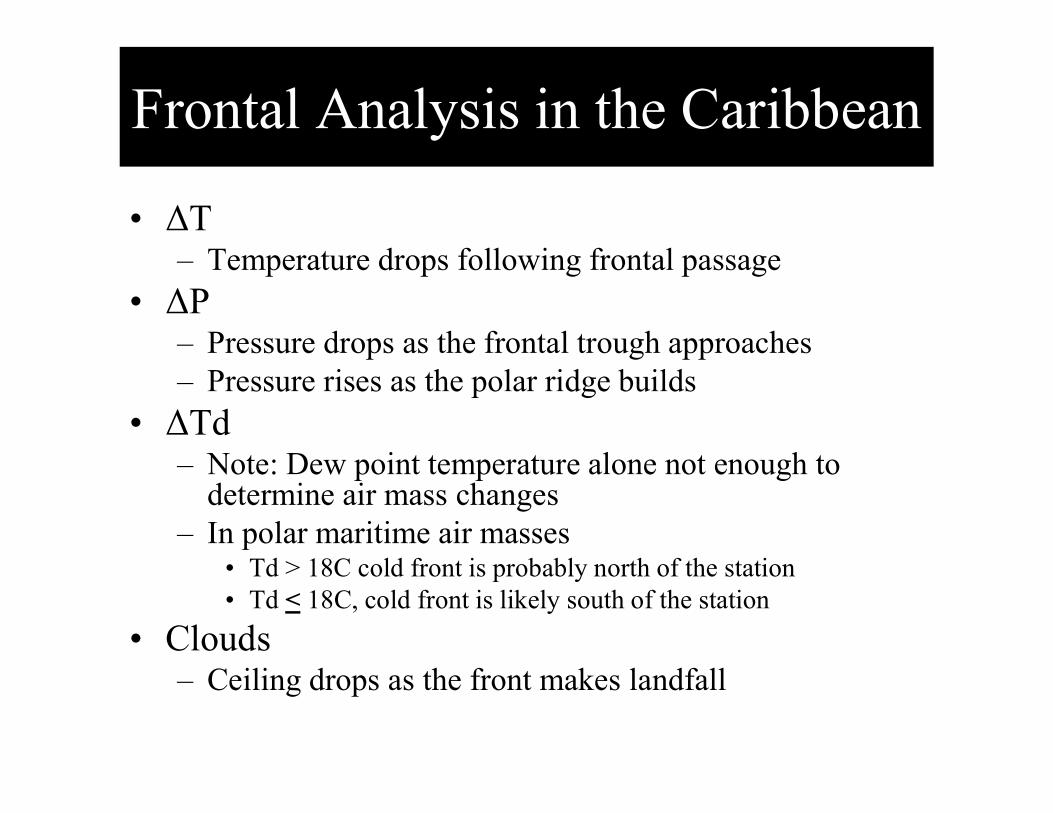
• ΔT– Temperature drops following frontal passage
• ΔP– Pressure drops as the frontal trough approaches– Pressure rises as the polar ridge builds
• ΔTd– Note: Dew point temperature alone not enough to
determine air mass changes– In polar maritime air masses
• Td > 18C cold front is probably north of the station• Td < 18C, cold front is likely south of the station
• Clouds– Ceiling drops as the front makes landfall
Frontal Analysis in the Caribbean
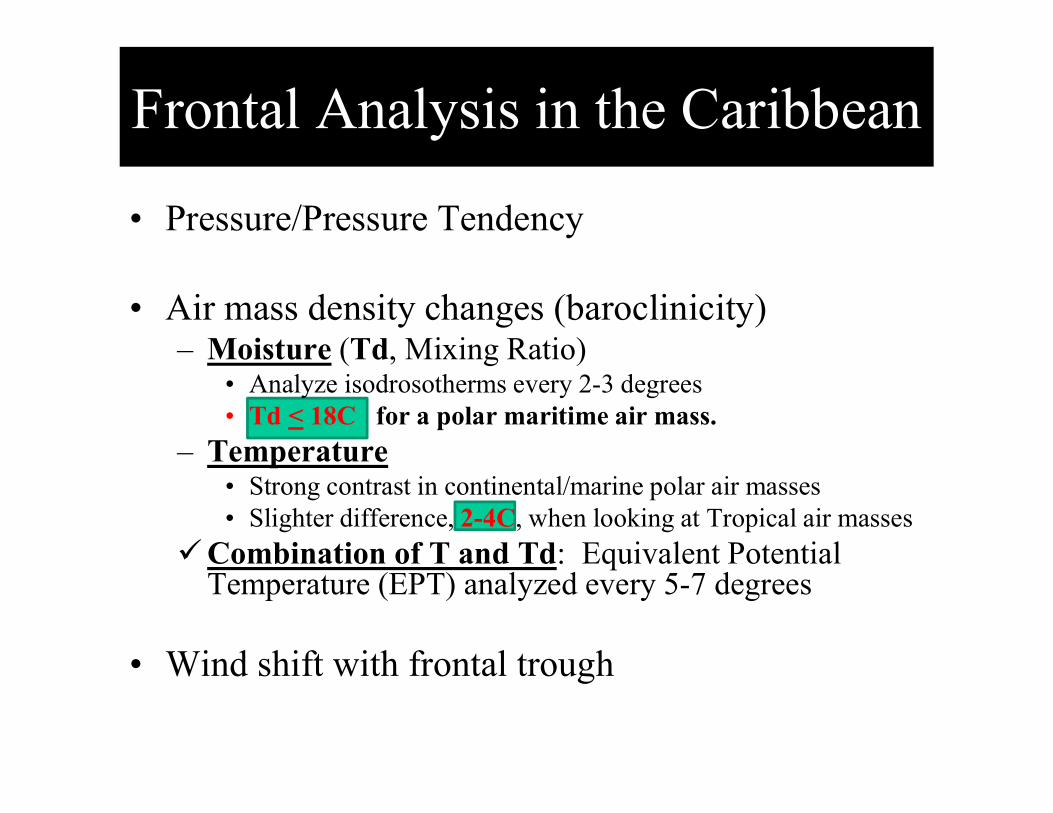
Frontal Analysis in the Caribbean
• Pressure/Pressure Tendency
• Air mass density changes (baroclinicity)– Moisture (Td, Mixing Ratio)
• Analyze isodrosotherms every 2-3 degrees• Td < 18C for a polar maritime air mass.
– Temperature• Strong contrast in continental/marine polar air masses• Slighter difference, 2-4C, when looking at Tropical air masses
Combination of T and Td: Equivalent Potential Temperature (EPT) analyzed every 5-7 degrees
• Wind shift with frontal trough
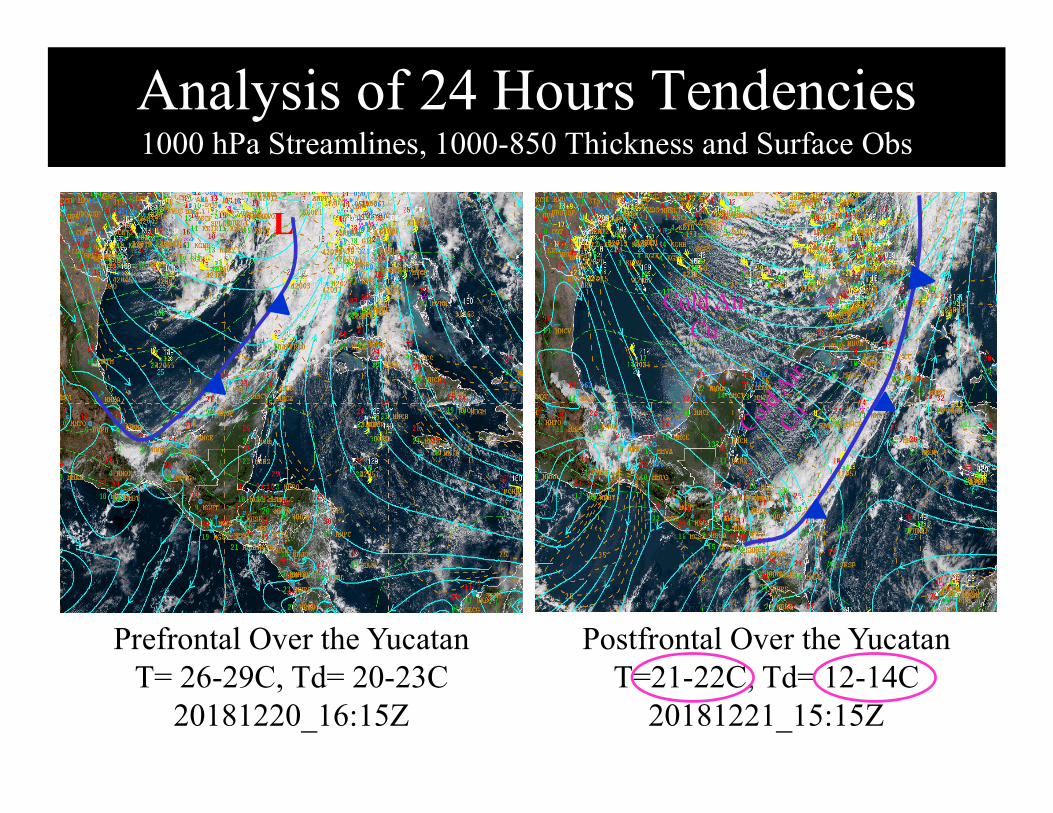
Analysis of 24 Hours Tendencies1000 hPa Streamlines, 1000-850 Thickness and Surface Obs
Prefrontal Over the YucatanT= 26-29C, Td= 20-23C
20181220_16:15Z
Postfrontal Over the YucatanT=21-22C, Td= 12-14C
20181221_15:15Z
L
Cold Air Cu
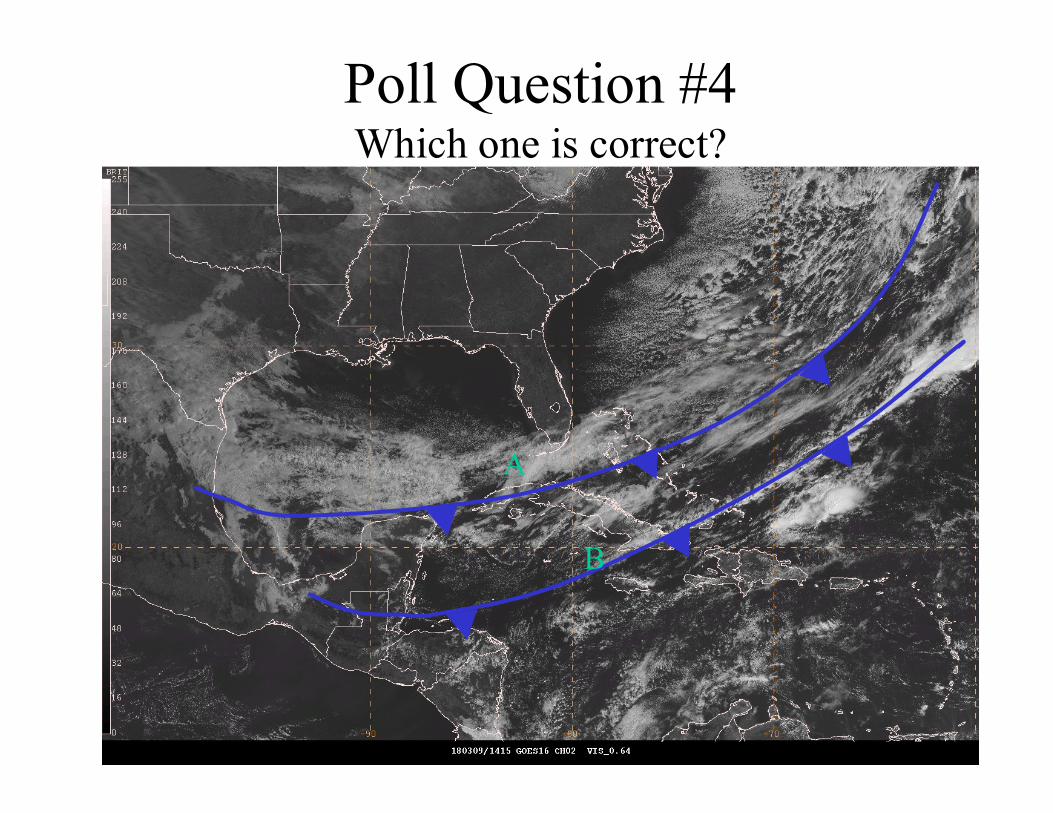
Poll Question #4Which one is correct?
A
B
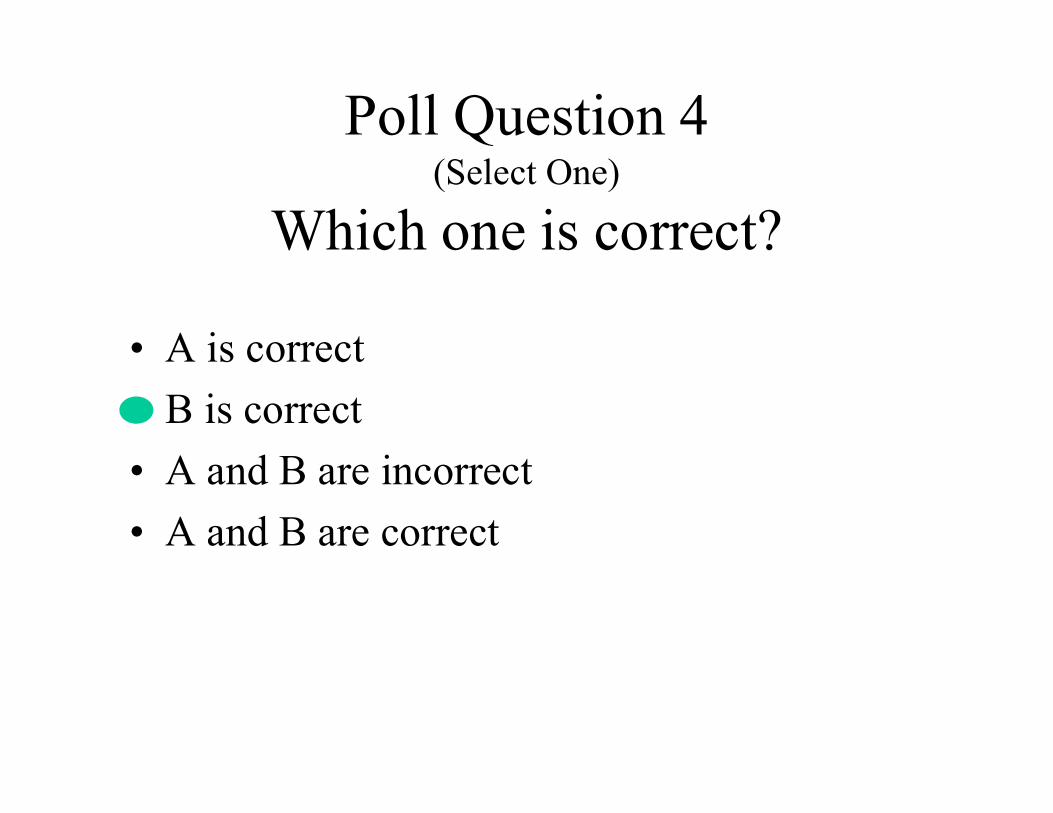
Poll Question 4(Select One)
Which one is correct?
• A is correct
• B is correct
• A and B are incorrect
• A and B are correct
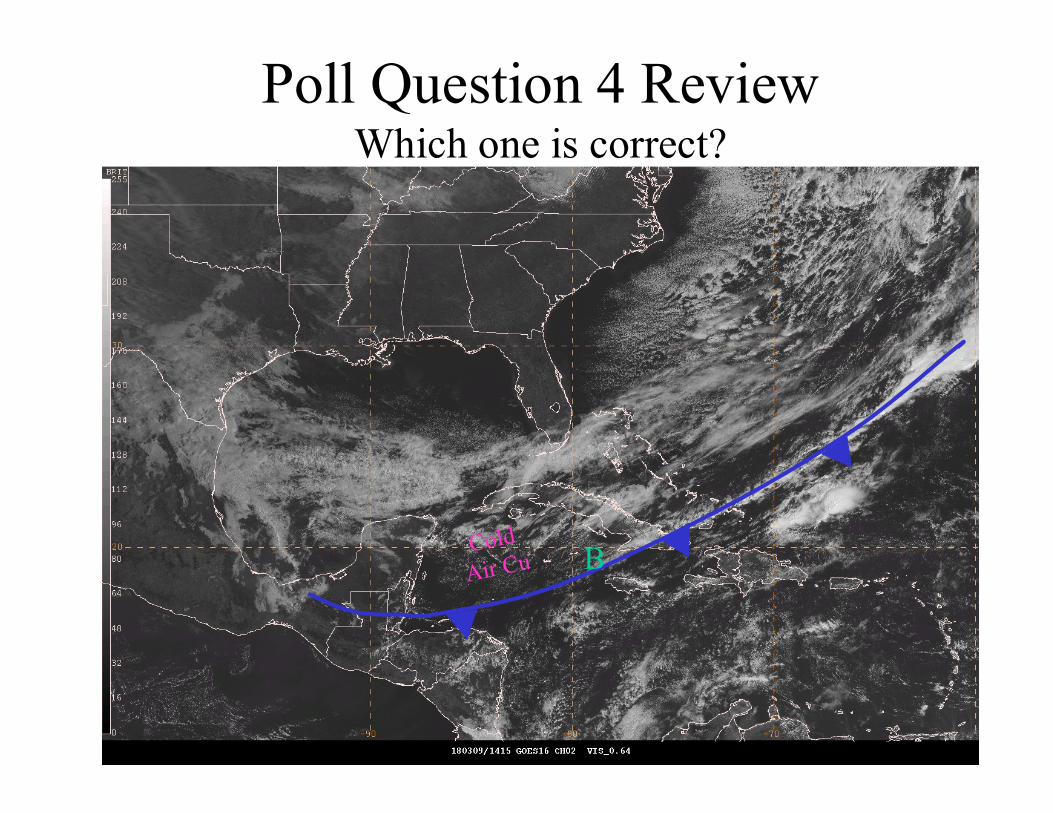
Poll Question 4 ReviewWhich one is correct?
B

Vertical Structure of a Front
1000-500 hPa Thickness
vs.
1000-850 hPa Thickness
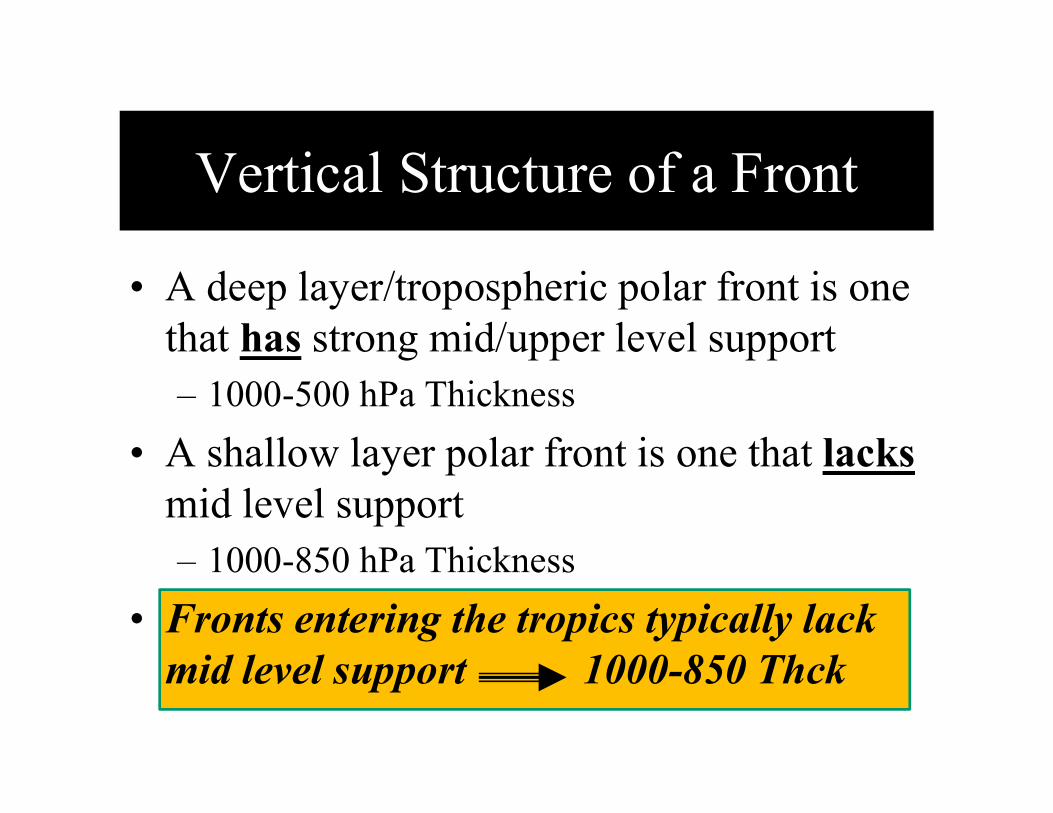
• A deep layer/tropospheric polar front is one that has strong mid/upper level support– 1000-500 hPa Thickness
• A shallow layer polar front is one that lacksmid level support– 1000-850 hPa Thickness
• Fronts entering the tropics typically lack mid level support 1000-850 Thck
Vertical Structure of a Front
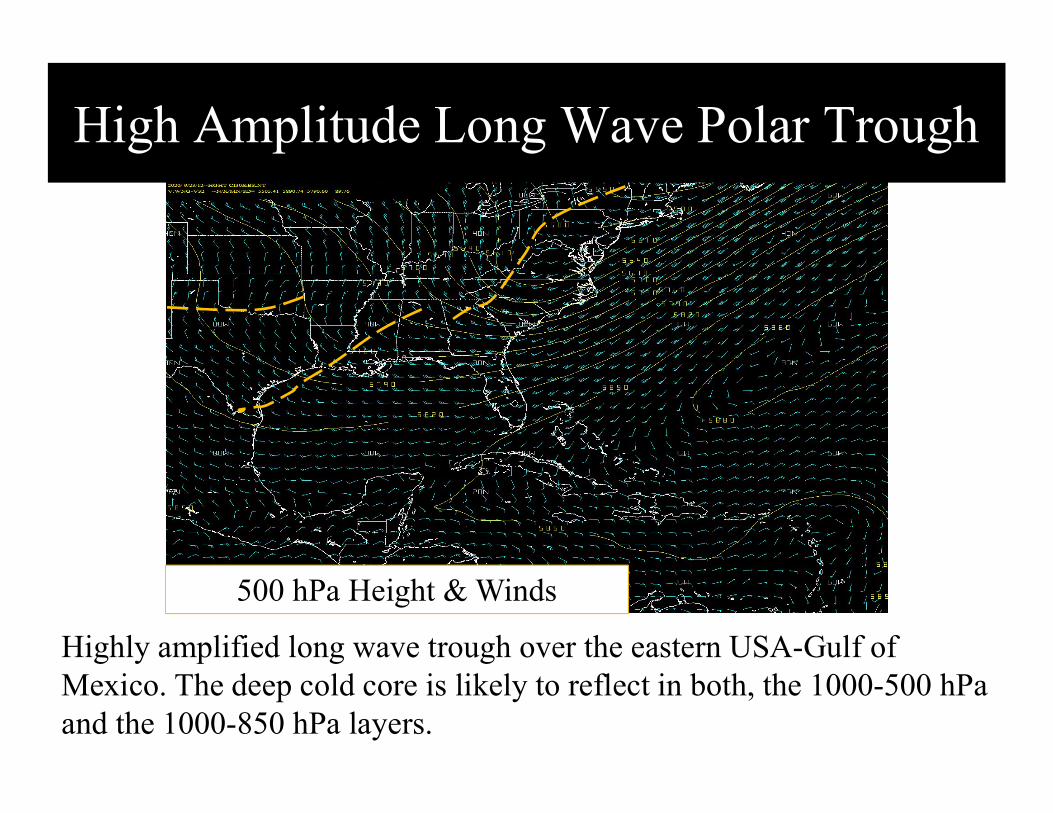
500 hPa Height & Winds
Highly amplified long wave trough over the eastern USA-Gulf of Mexico. The deep cold core is likely to reflect in both, the 1000-500 hPa and the 1000-850 hPa layers.
High Amplitude Long Wave Polar Trough
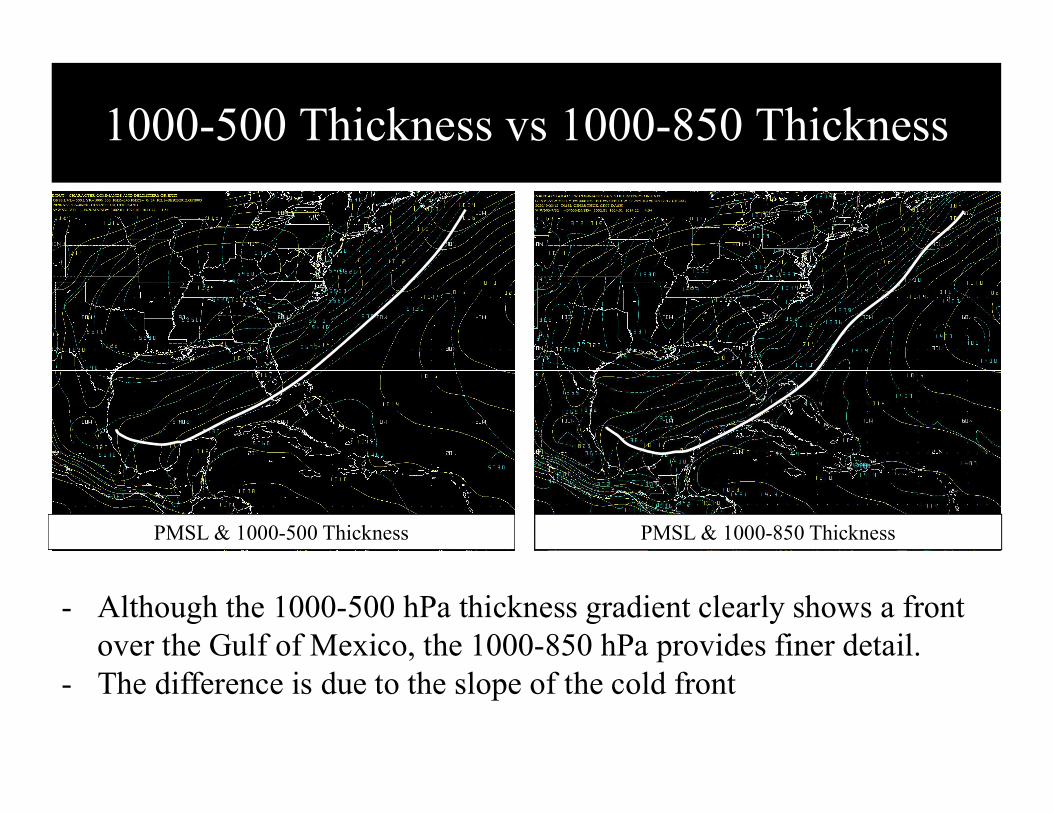
1000-500 Thickness vs 1000-850 Thickness
- Although the 1000-500 hPa thickness gradient clearly shows a front over the Gulf of Mexico, the 1000-850 hPa provides finer detail.
- The difference is due to the slope of the cold front
PMSL & 1000-500 Thickness PMSL & 1000-850 Thickness
Frontal Slope
Advancing Cold Air Behind Cold
Front
Receding Warm Air Ahead of Cold Front
Direction of Frontal Movement
Direction of Frontal Movement
Advancing Cold Air Behind Cold
Front
Receding Warm Air Ahead of Cold Front
Steep frontal slope Gradual/Gentle frontal slope
200
500
700
850
SFC
200
500
700
850
SFC
In a shallower boundary with a gentler slope, the 1000-500 hPa thickness would not reflect the proper placement of the surface front as it enters the tropics.
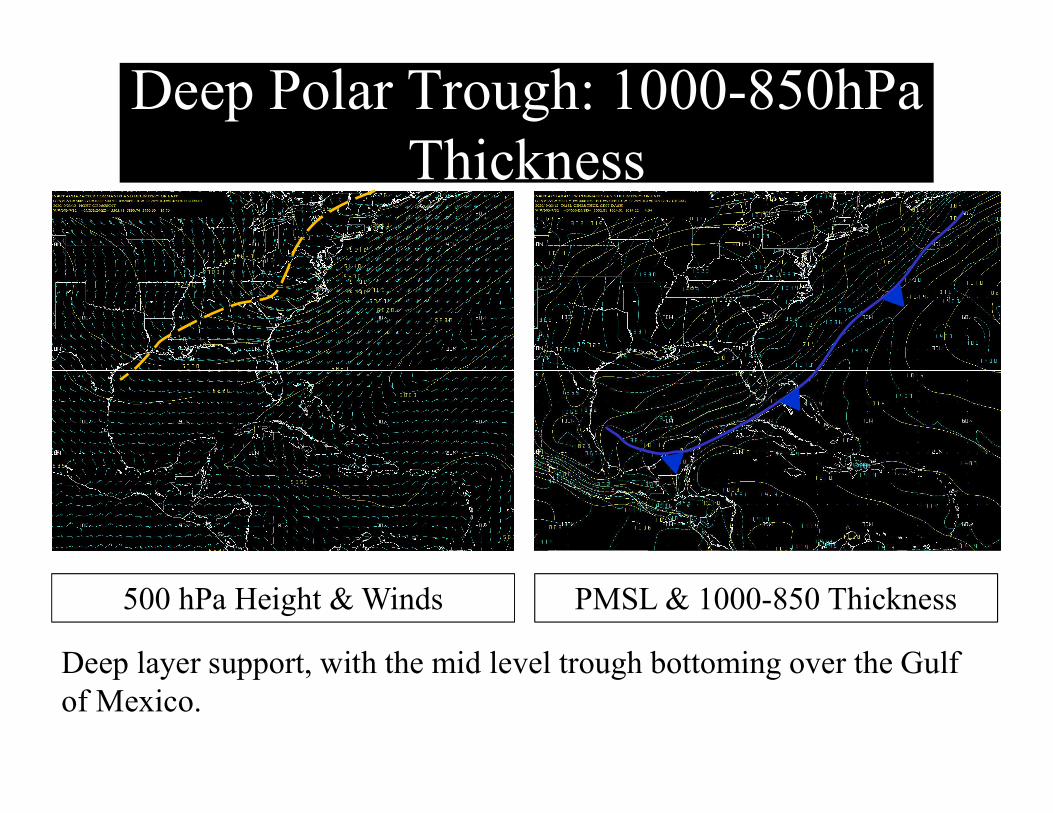
Deep Polar Trough: 1000-850hPa Thickness
500 hPa Height & Winds PMSL & 1000-850 Thickness
Deep layer support, with the mid level trough bottoming over the Gulf of Mexico.
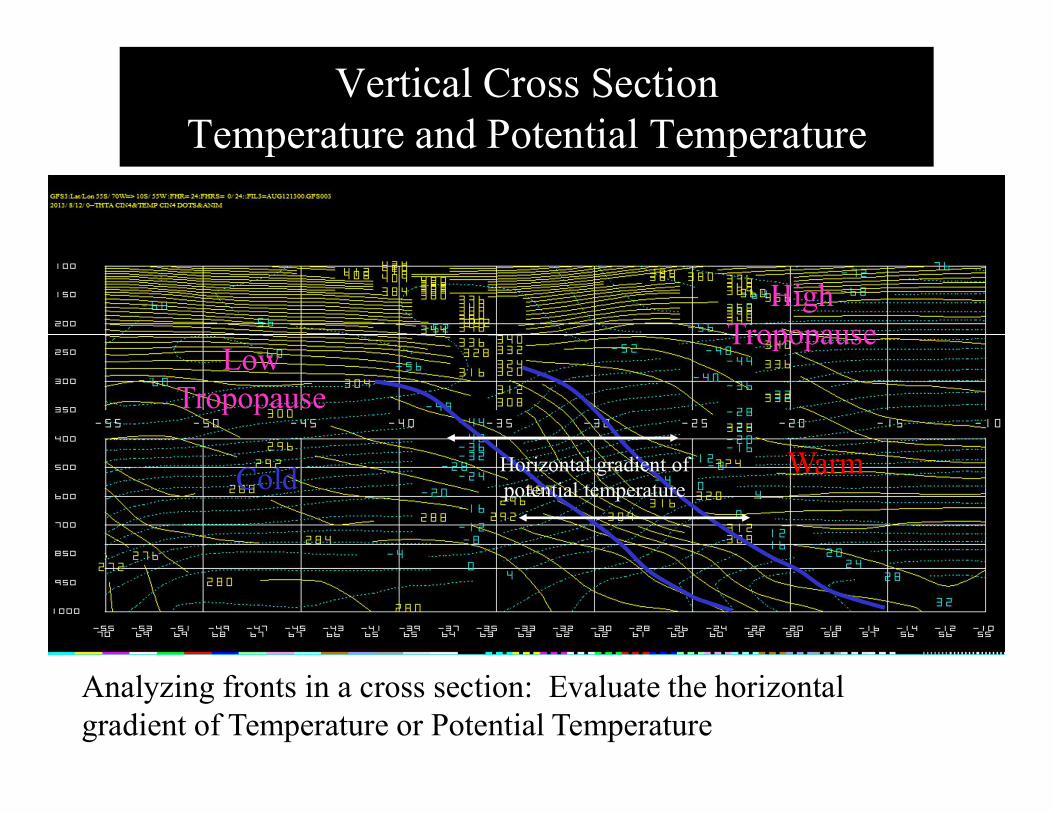
Vertical Cross SectionTemperature and Potential Temperature
Analyzing fronts in a cross section: Evaluate the horizontal gradient of Temperature or Potential Temperature
High Tropopause
Low Tropopause
WarmColdHorizontal gradient of potential temperature
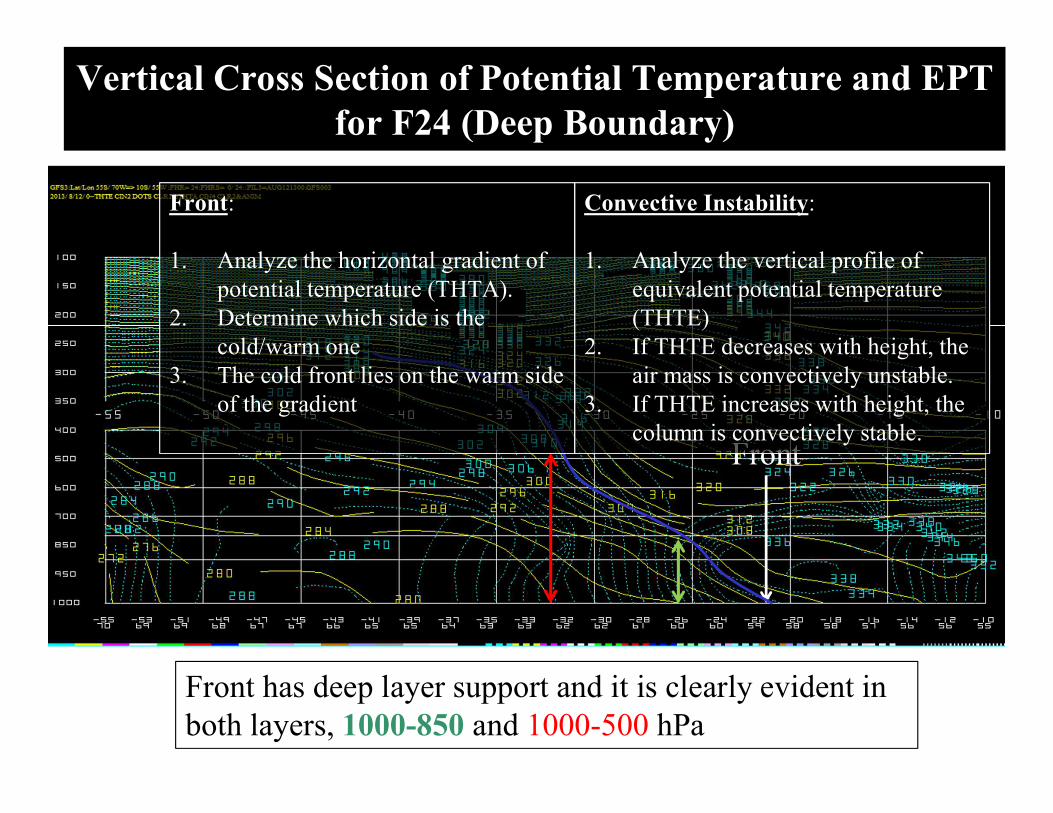
Vertical Cross Section of Potential Temperature and EPT for F24 (Deep Boundary)
Front
Front has deep layer support and it is clearly evident in both layers, 1000-850 and 1000-500 hPa
Convective Instability:
1. Analyze the vertical profile of equivalent potential temperature (THTE)
2. If THTE decreases with height, the air mass is convectively unstable.
3. If THTE increases with height, the column is convectively stable.
Front:
1. Analyze the horizontal gradient of potential temperature (THTA).
2. Determine which side is the cold/warm one
3. The cold front lies on the warm side of the gradient
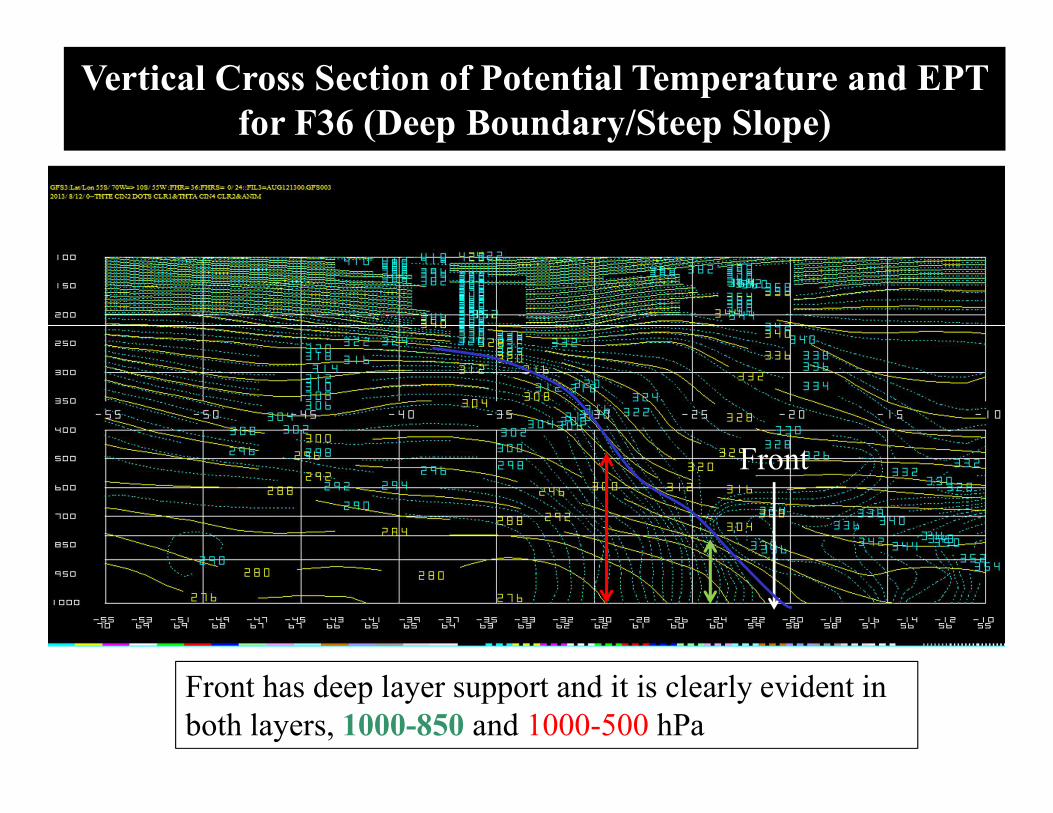
Vertical Cross Section of Potential Temperature and EPT for F36 (Deep Boundary/Steep Slope)
Front
Front has deep layer support and it is clearly evident in both layers, 1000-850 and 1000-500 hPa
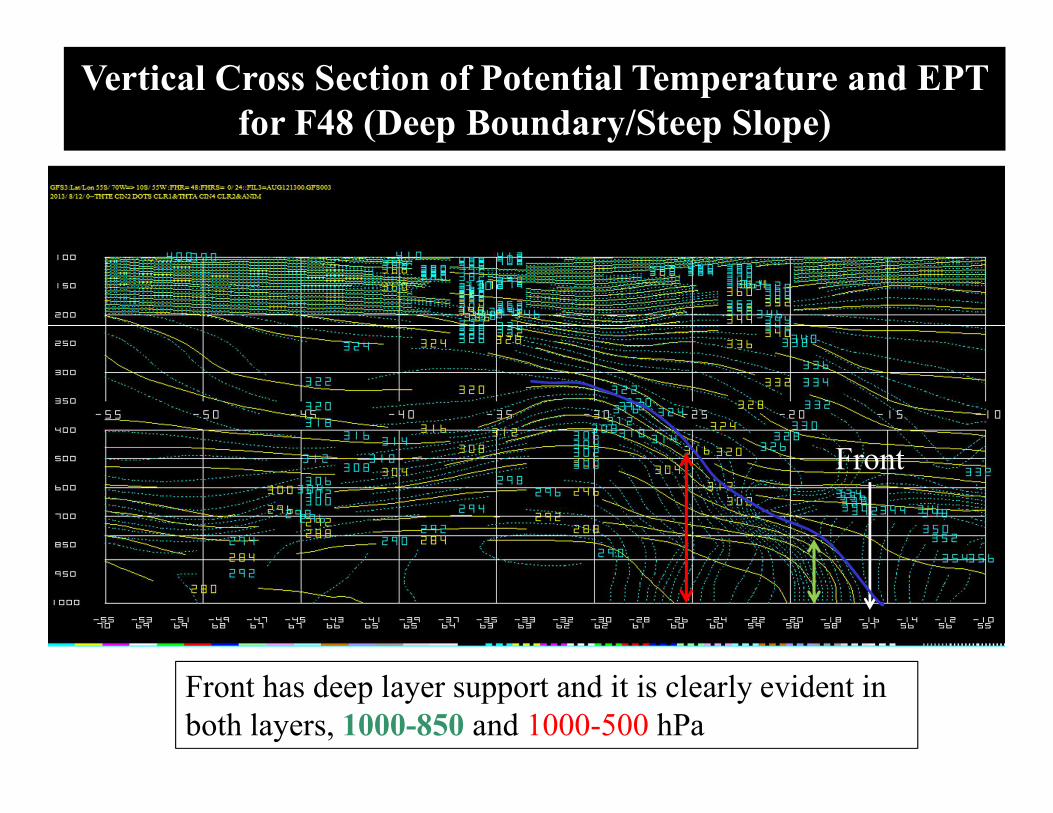
Vertical Cross Section of Potential Temperature and EPT for F48 (Deep Boundary/Steep Slope)
Front
Front has deep layer support and it is clearly evident in both layers, 1000-850 and 1000-500 hPa
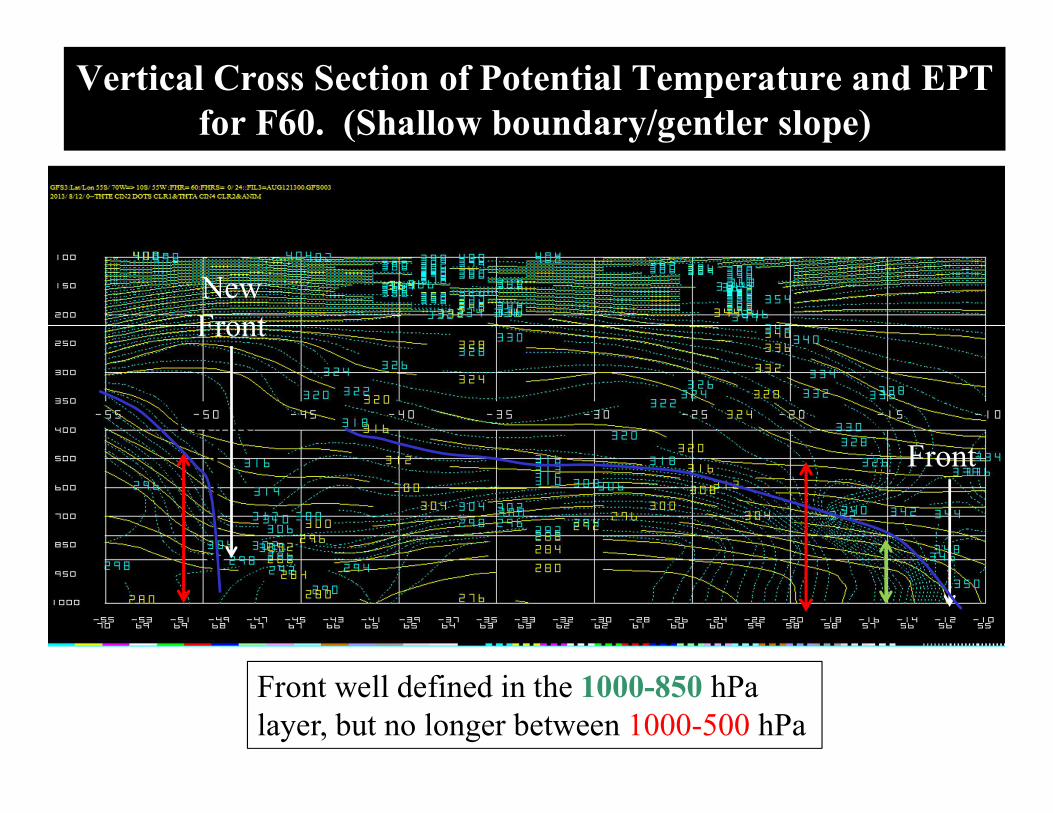
Vertical Cross Section of Potential Temperature and EPT for F60. (Shallow boundary/gentler slope)
FrontFrente
Front well defined in the 1000-850 hPa layer, but no longer between 1000-500 hPa
NewFront
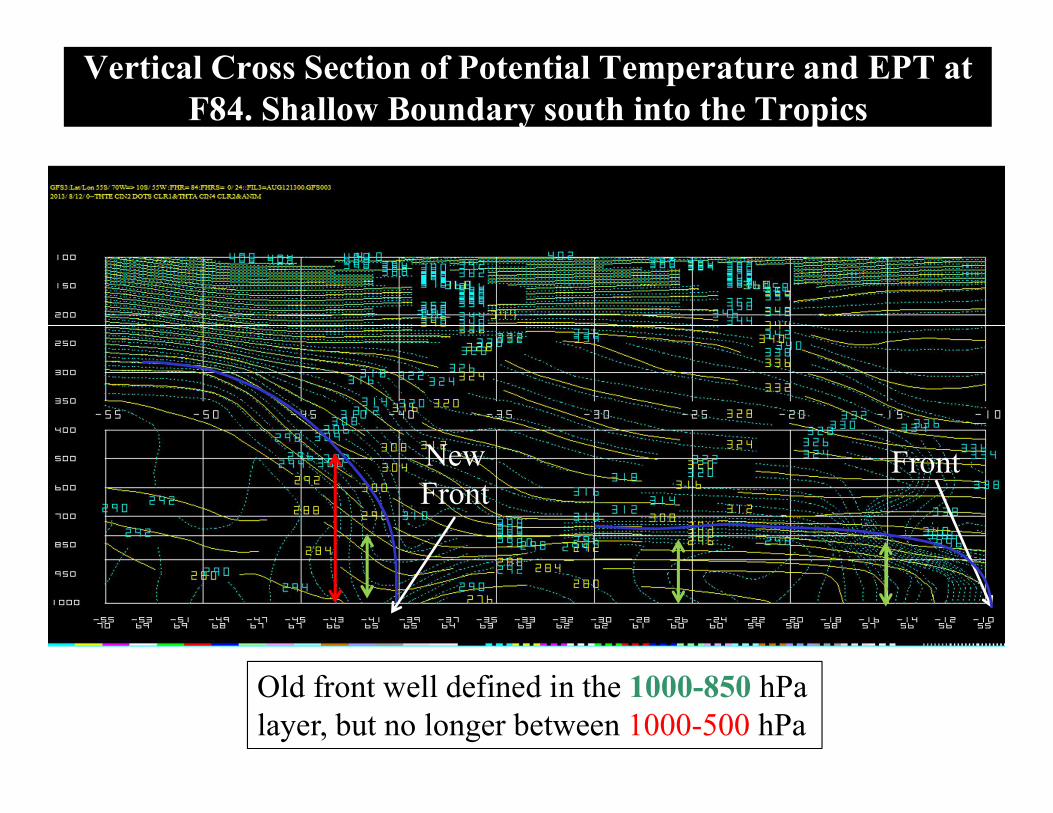
Vertical Cross Section of Potential Temperature and EPT at F84. Shallow Boundary south into the Tropics
FrontNew Front
Old front well defined in the 1000-850 hPa layer, but no longer between 1000-500 hPa
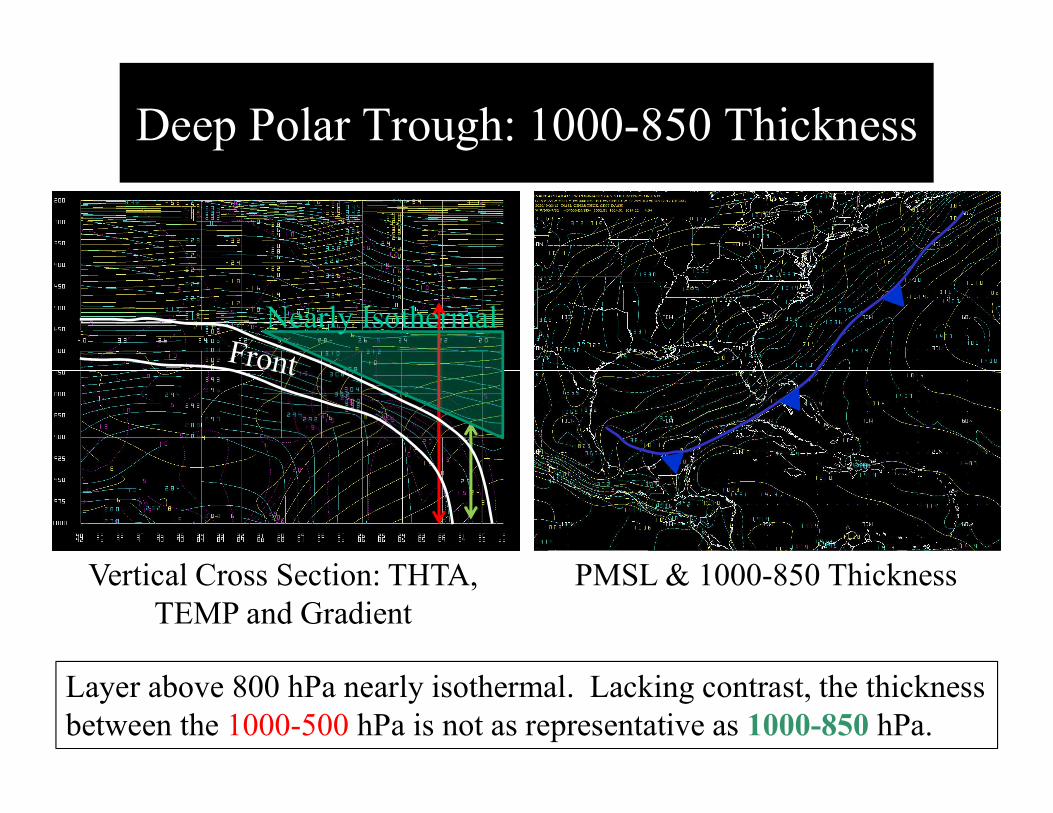
Deep Polar Trough: 1000-850 Thickness
Vertical Cross Section: THTA, TEMP and Gradient
PMSL & 1000-850 Thickness
Nearly Isothermal
Layer above 800 hPa nearly isothermal. Lacking contrast, the thickness between the 1000-500 hPa is not as representative as 1000-850 hPa.
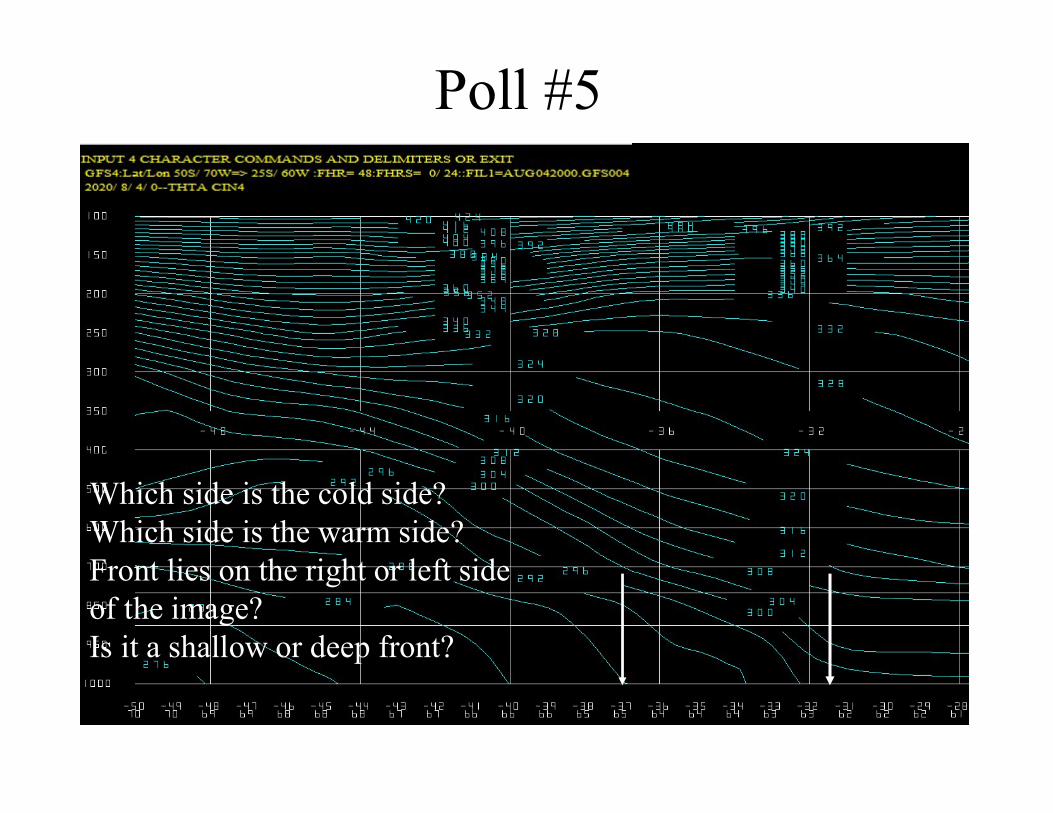
Poll #5
¿?Which side is the cold side?Which side is the warm side?Front lies on the right or left side of the image?Is it a shallow or deep front?
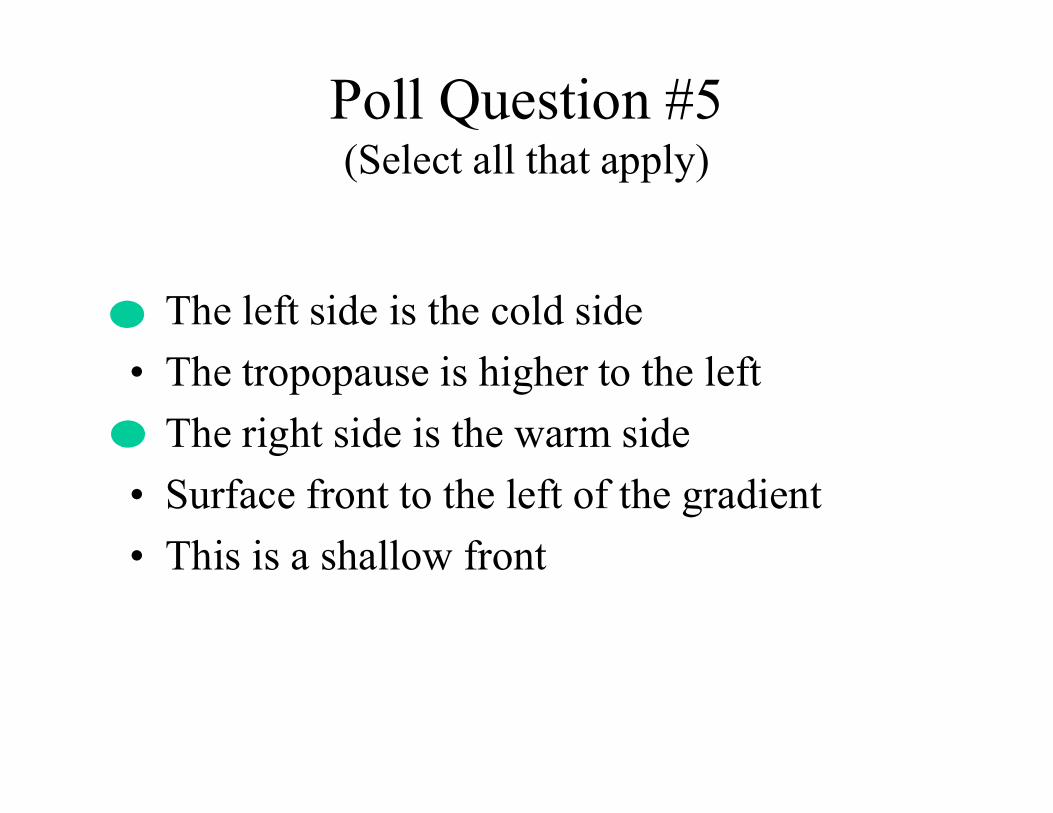
Poll Question #5(Select all that apply)
• The left side is the cold side
• The tropopause is higher to the left
• The right side is the warm side
• Surface front to the left of the gradient
• This is a shallow front
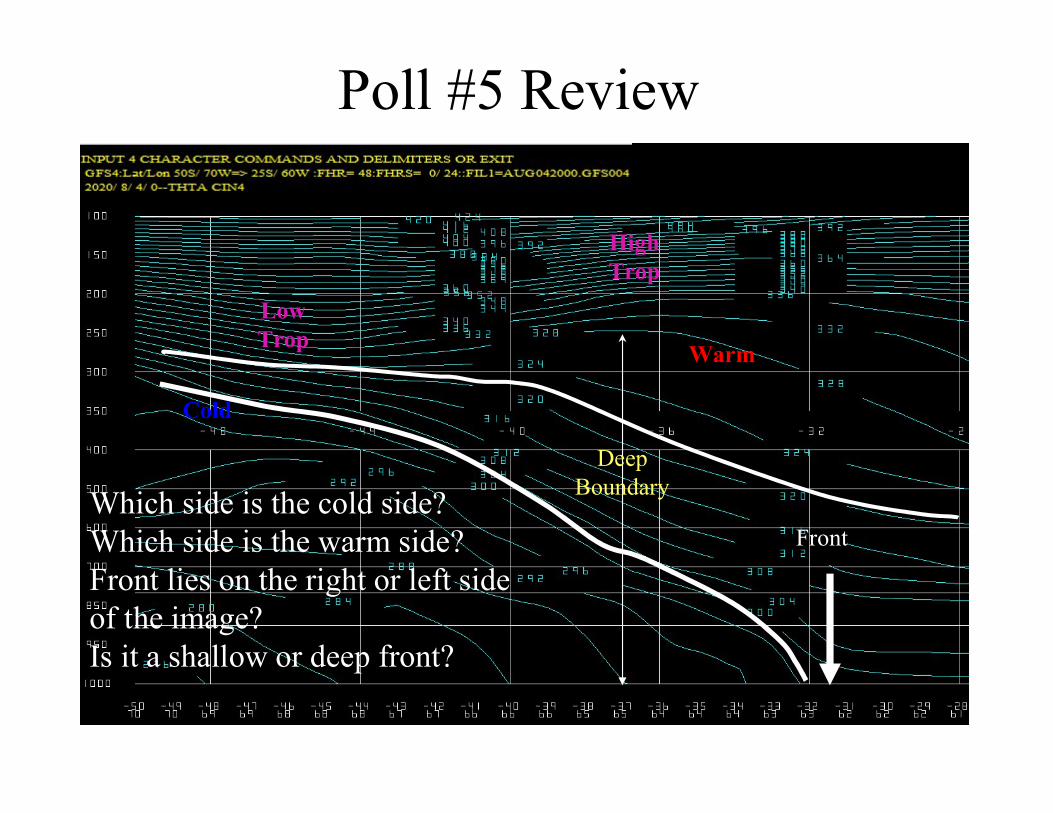
Poll #5 Review
Which side is the cold side?Which side is the warm side?Front lies on the right or left side of the image?Is it a shallow or deep front?
Cold
Warm
HighTrop
DeepBoundary
LowTrop
Front

Analysis Tools
Analysis Tools
• Mean Layer Relative Humidity
• Equivalent Potential Temperature (EPT)
• “FRONT” Macro
• Mean Layer Relative Humidity– The mean layer relative humidity between the surface and
500 hPa
– RH tells us how close to saturation• Does not quantify moisture content
– Typically, RH 60% or greater for significant cloud cover
– Quasi-conservative property• As the front propagates, moisture propagates with it.
Mean Layer Relative Humidity
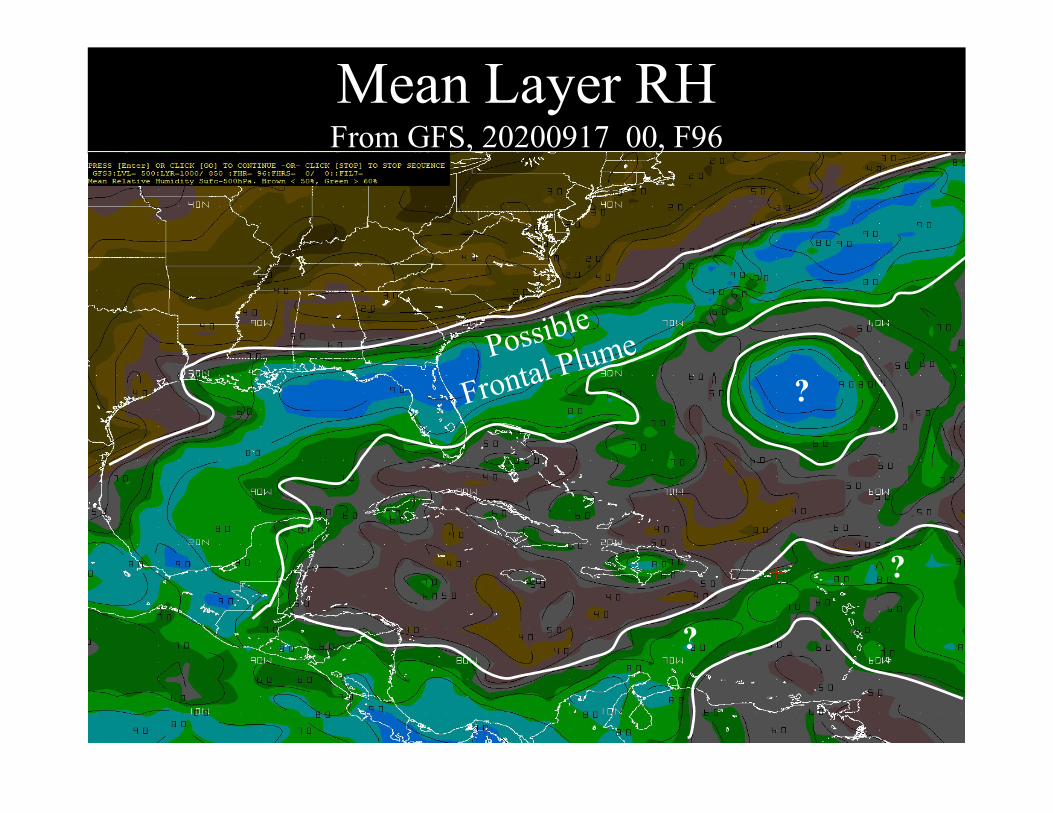
Mean Layer RHFrom GFS, 20200917_00, F96
?
?
?
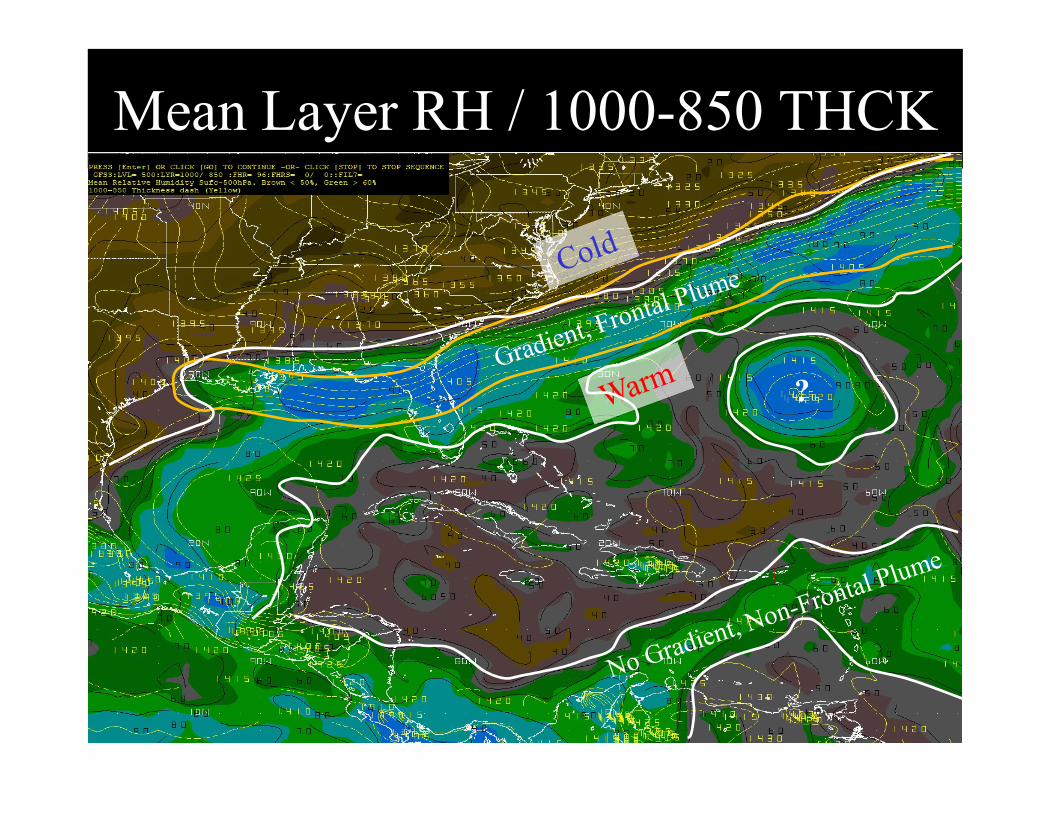
Mean Layer RH / 1000-850 THCK
?
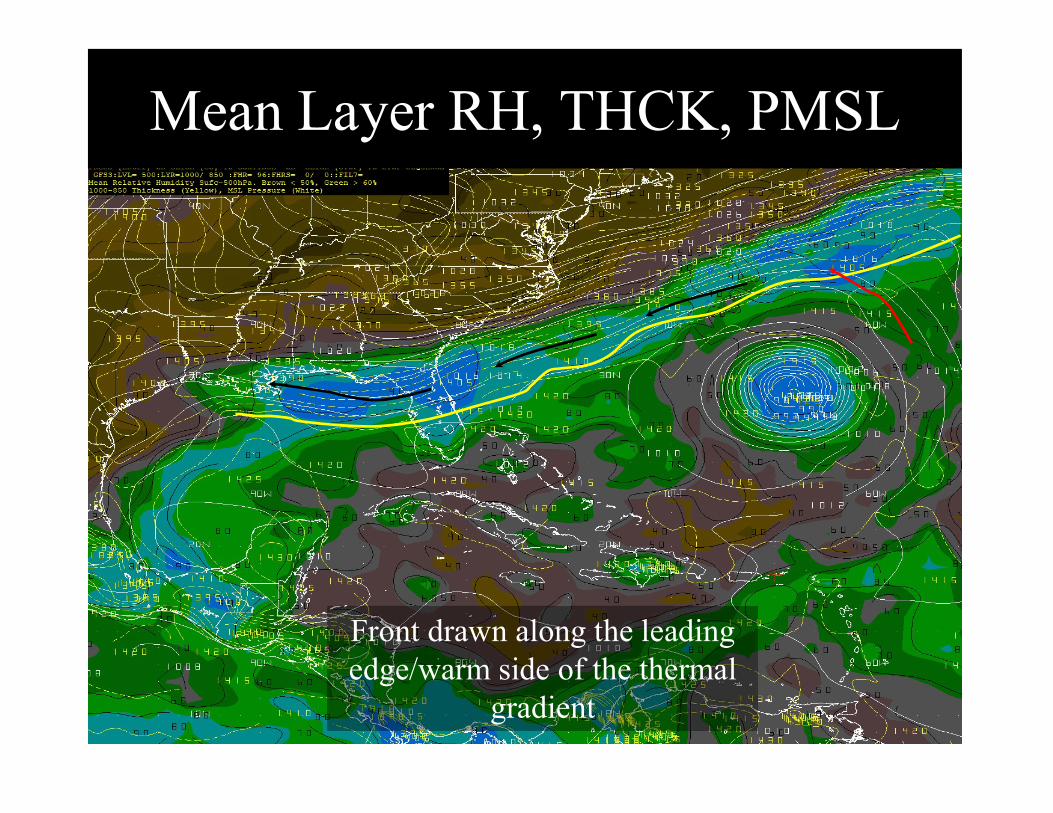
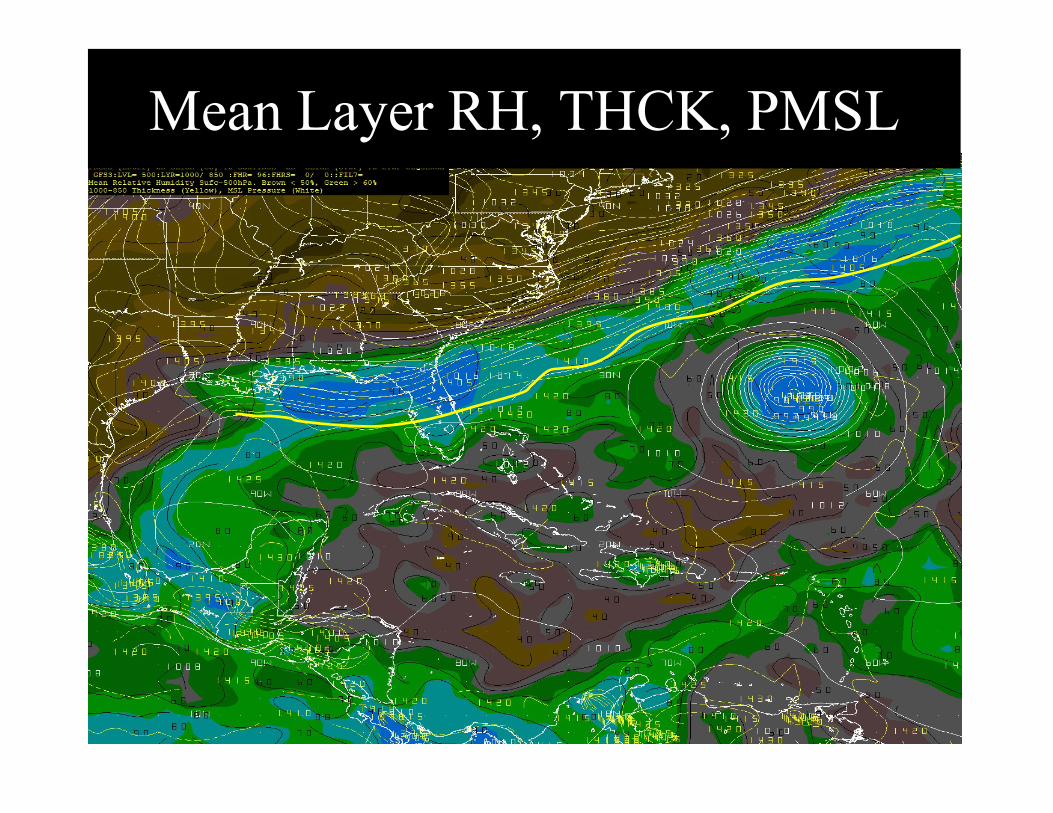
Mean Layer RH, THCK, PMSL
Front drawn along the leading edge/warm side of the thermal
gradient
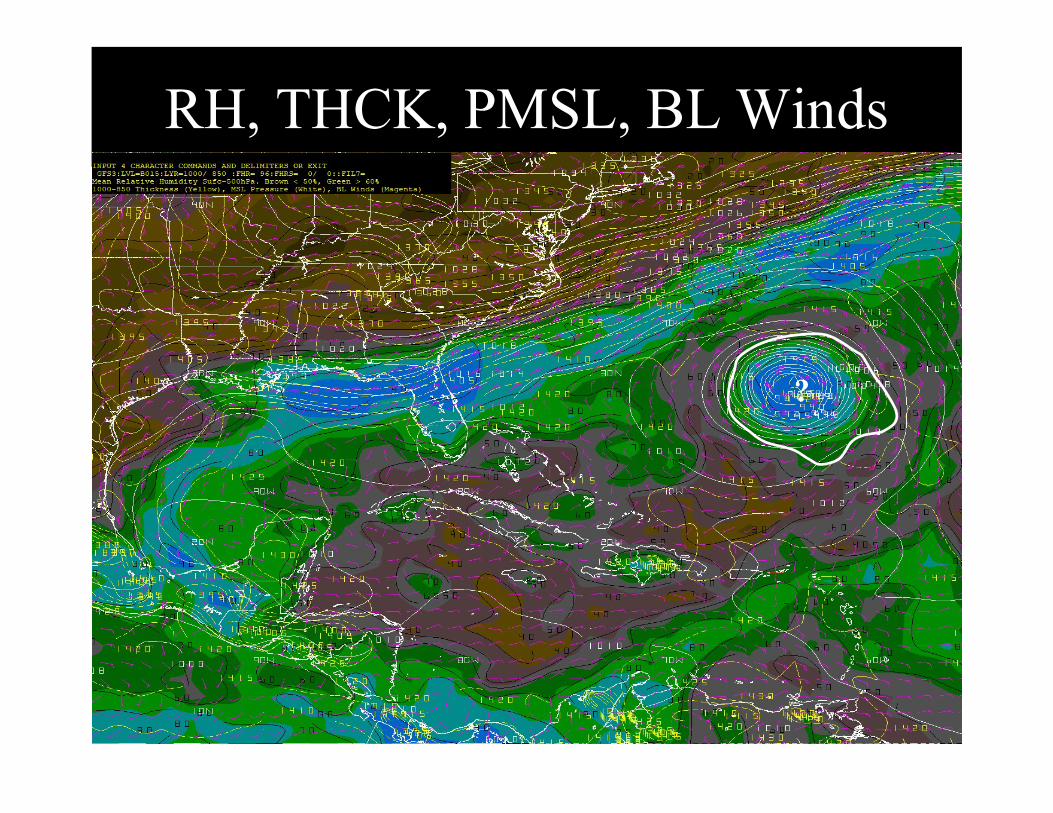
RH, THCK, PMSL, BL Winds
?
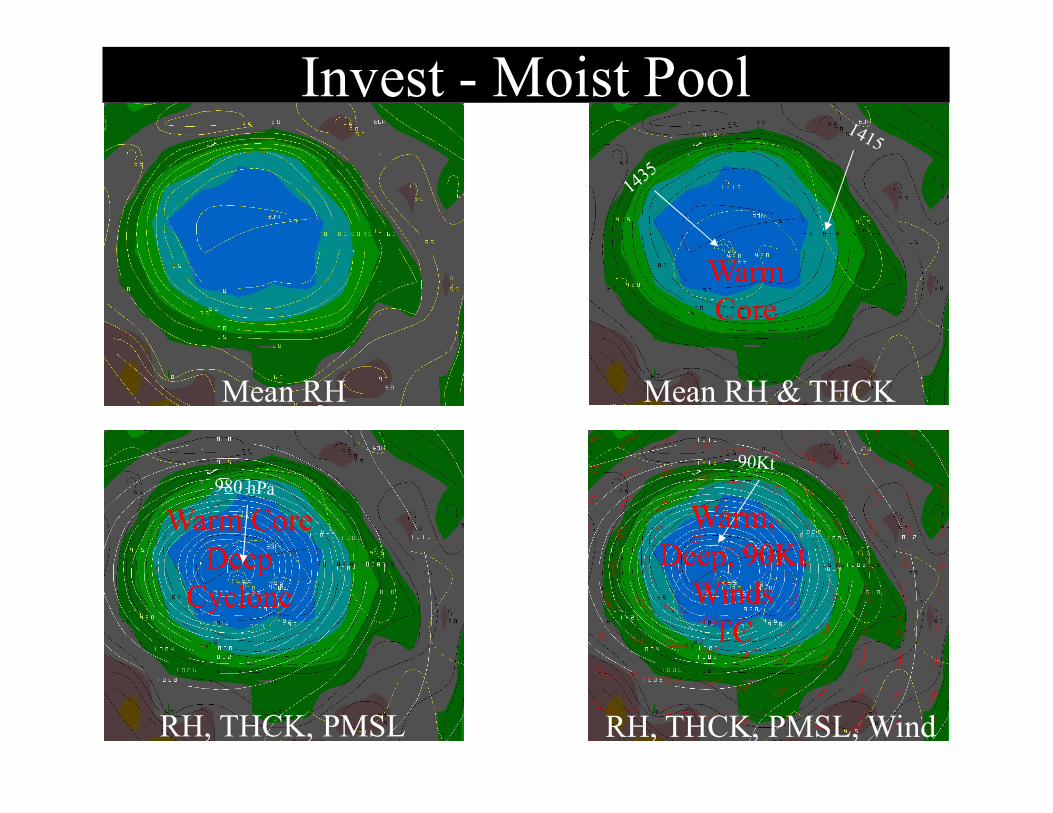
Invest - Moist Pool
Mean RH Mean RH & THCK
Warm Core
RH, THCK, PMSL RH, THCK, PMSL, Wind
Warm CoreDeep
Cyclone
Warm, Deep, 90Kt
WindsTC
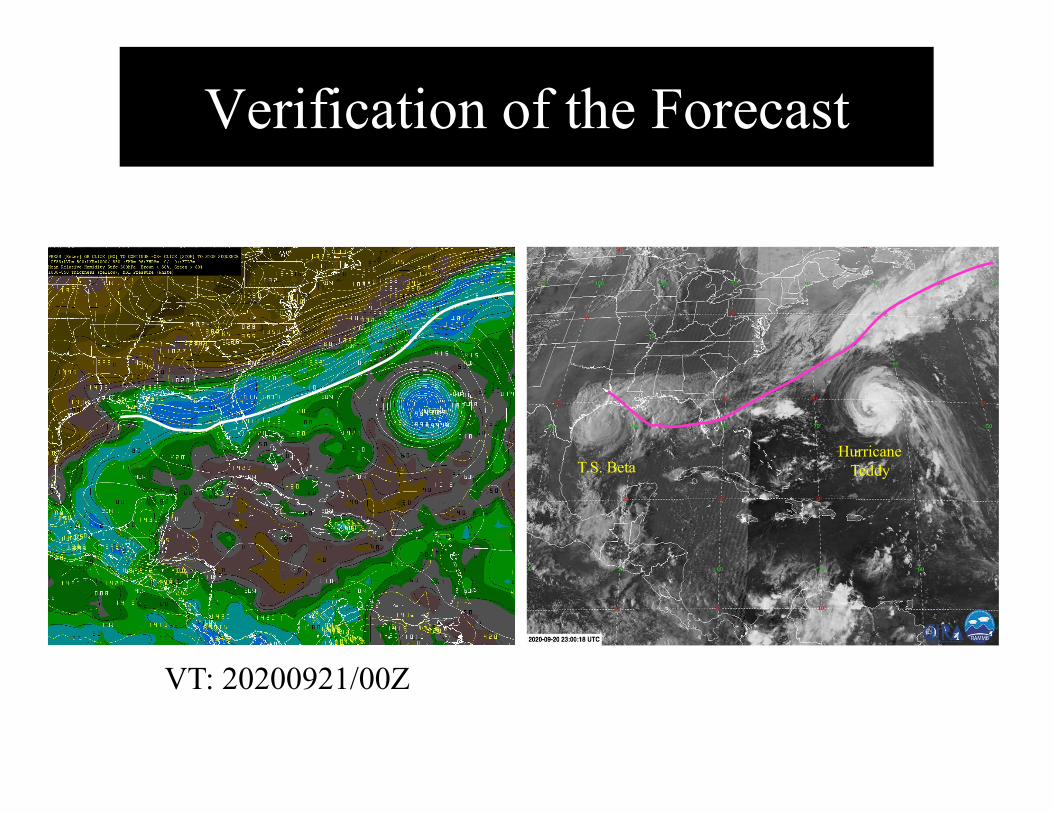
Verification of the Forecast
Hurricane TeddyT.S. Beta
VT: 20200921/00Z
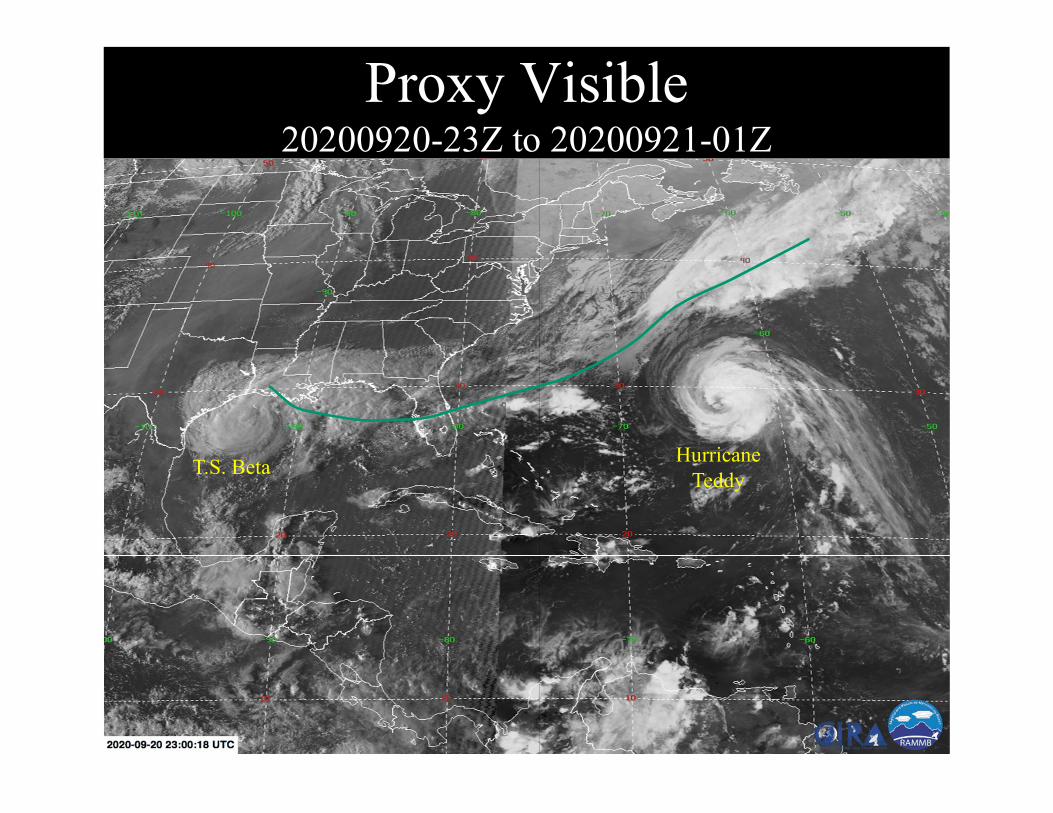
Proxy Visible 20200920-23Z to 20200921-01Z
Hurricane Teddy
T.S. Beta
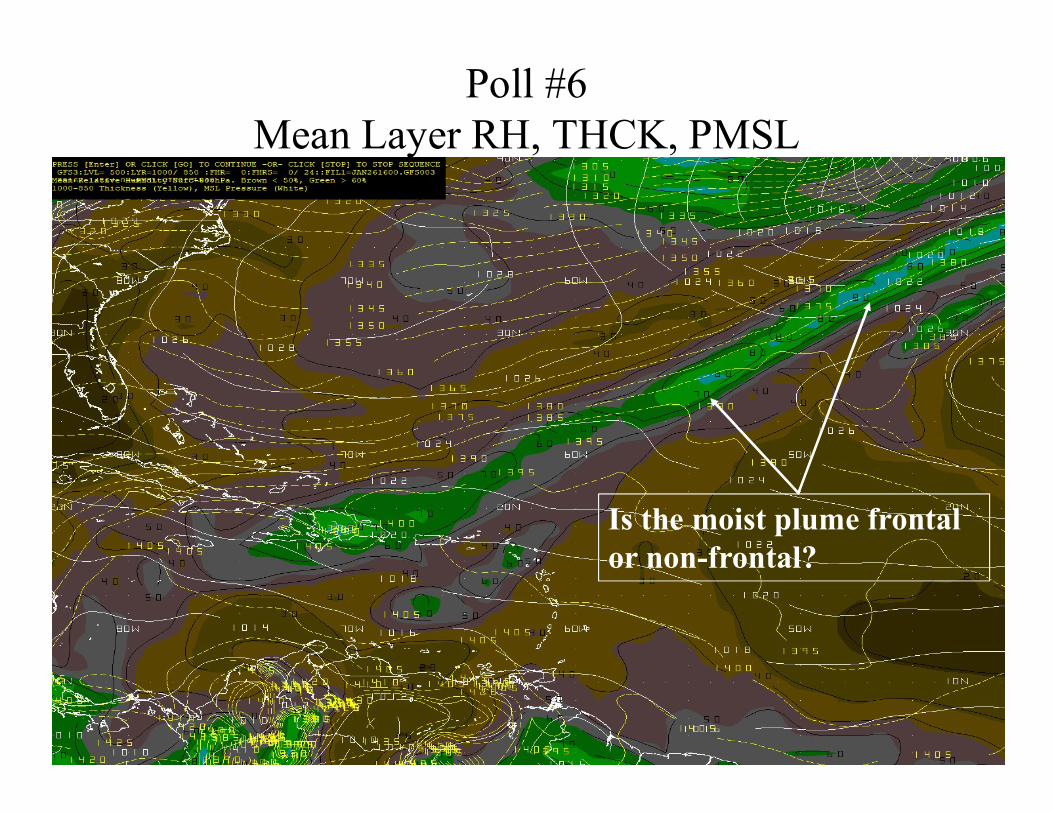
Poll #6Mean Layer RH, THCK, PMSL
Is the moist plume frontal or non-frontal?
Poll #6Is the moist plume frontal or non-frontal
(Select one)
• It is frontal
• It is non-frontal
• Cannot be determined
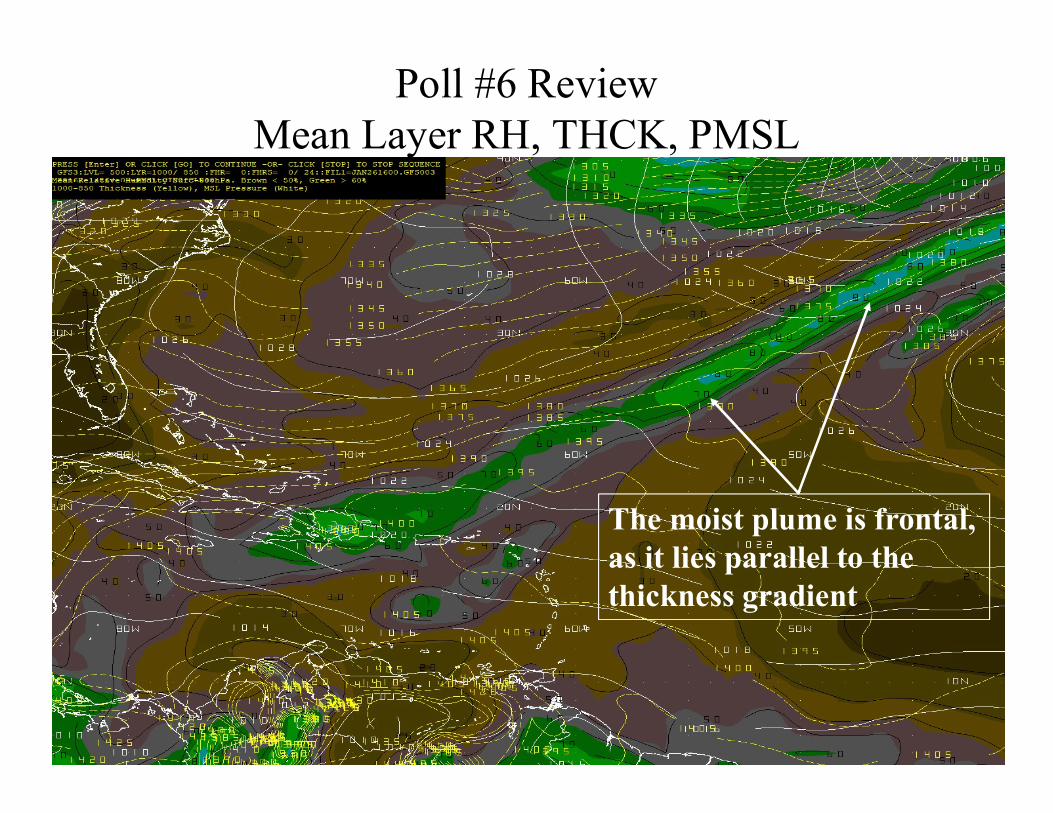
Poll #6 ReviewMean Layer RH, THCK, PMSL
The moist plume is frontal, as it lies parallel to the thickness gradient
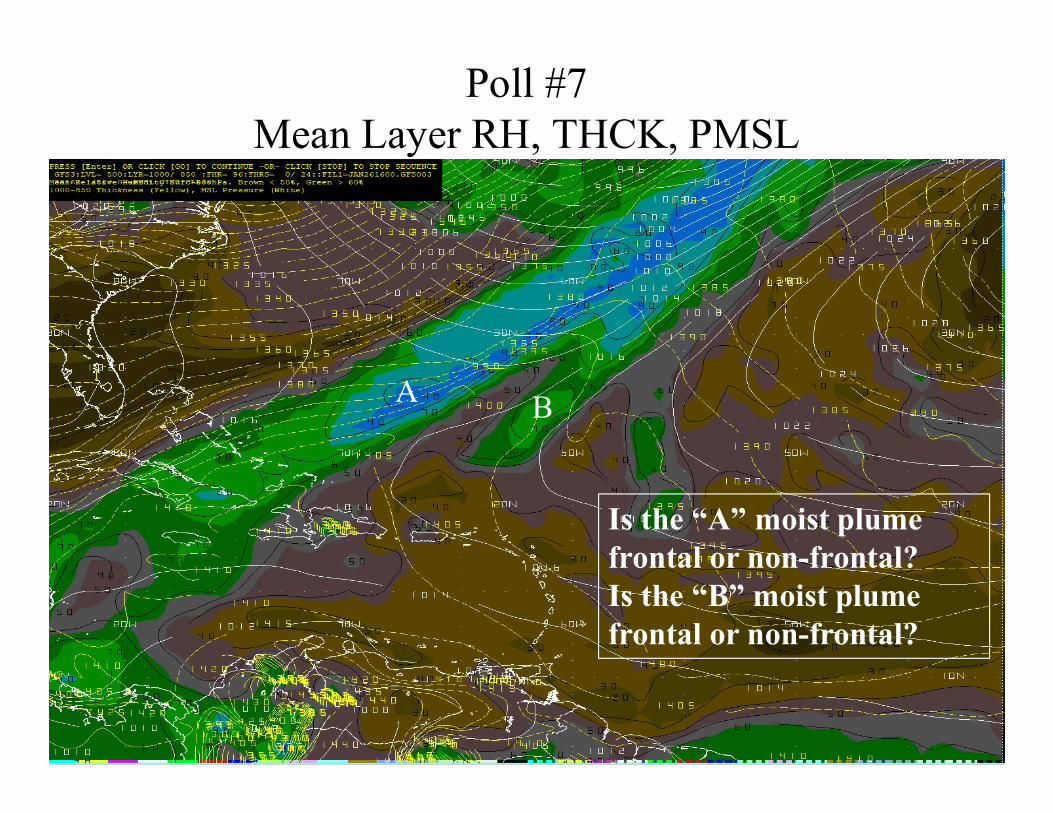
Poll #7Mean Layer RH, THCK, PMSL
A B
Is the “A” moist plume frontal or non-frontal?Is the “B” moist plume frontal or non-frontal?
Poll #7(Select one)
• “A” is frontal, “B” is non-frontal
• “A” is non-frontal, “B” is frontal
• “A” and “B” are frontal
• “A” and “B” are non-frontal
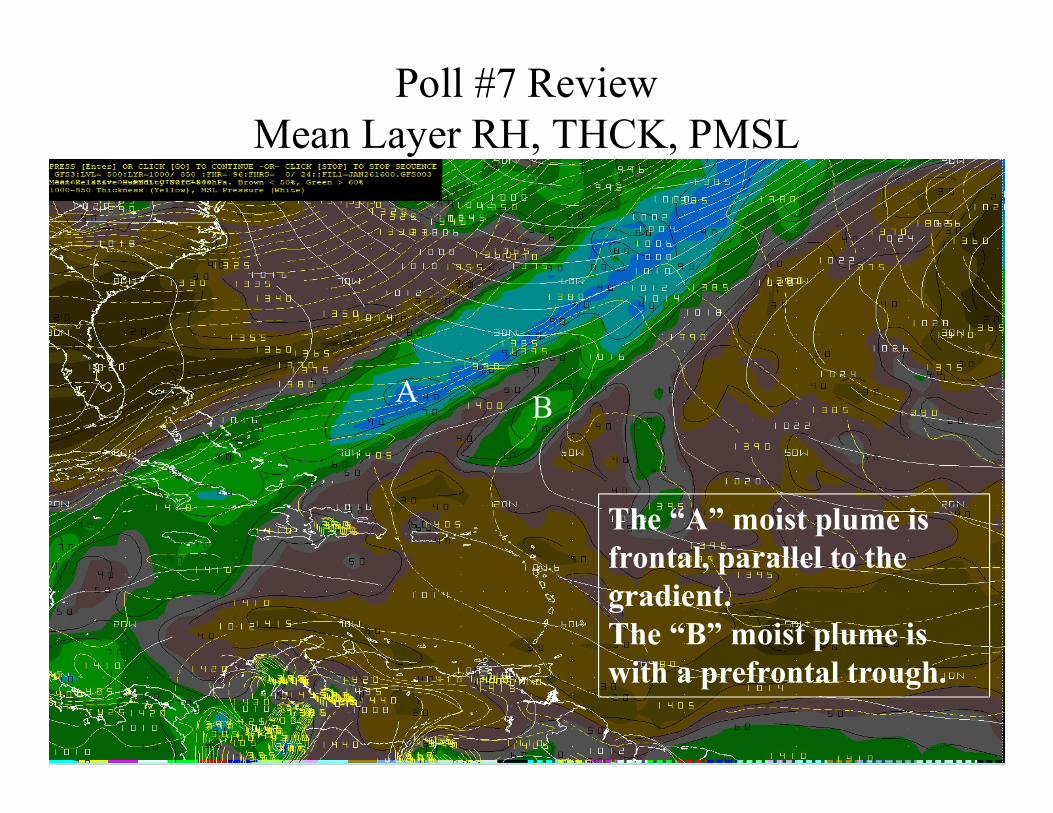
Poll #7 ReviewMean Layer RH, THCK, PMSL
A B
The “A” moist plume is frontal, parallel to the gradient.The “B” moist plume is with a prefrontal trough.
Equivalent Potential Temperature(EPT)
The secret to tropical weather forecasting
Equivalent Potential Temperature (EPT)
• Temperature of a parcel of air when you add the latent heat released during condensation to the sensible temperature of the parcel at constant pressure (1000 hPa)
– It depends on the moisture content and actual temperature of the parcel
• If T held constant, EPT then varies as a function of the moisture content of the parcels
• Could we use EPT to determine baroclinicity?
– Yes as long as EPT is a function of both T and Td.
– No if EPT is solely a function of Td, with T held constant
EPT
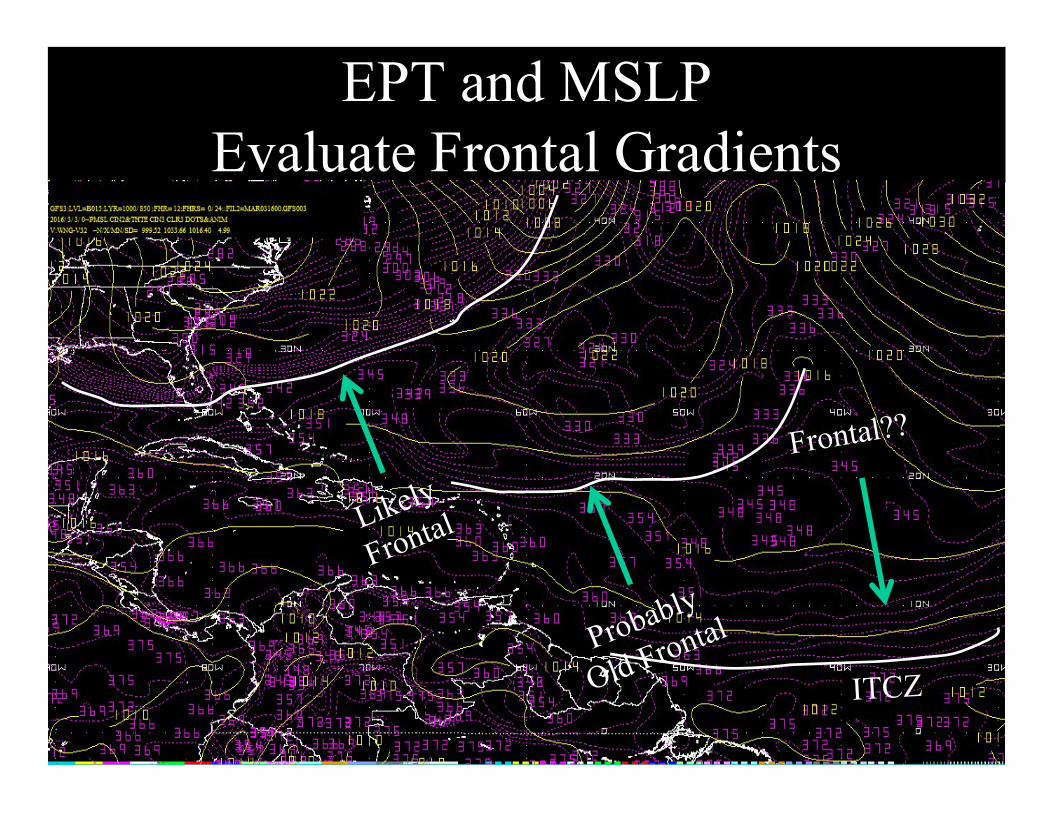
EPT and MSLPEvaluate Frontal Gradients
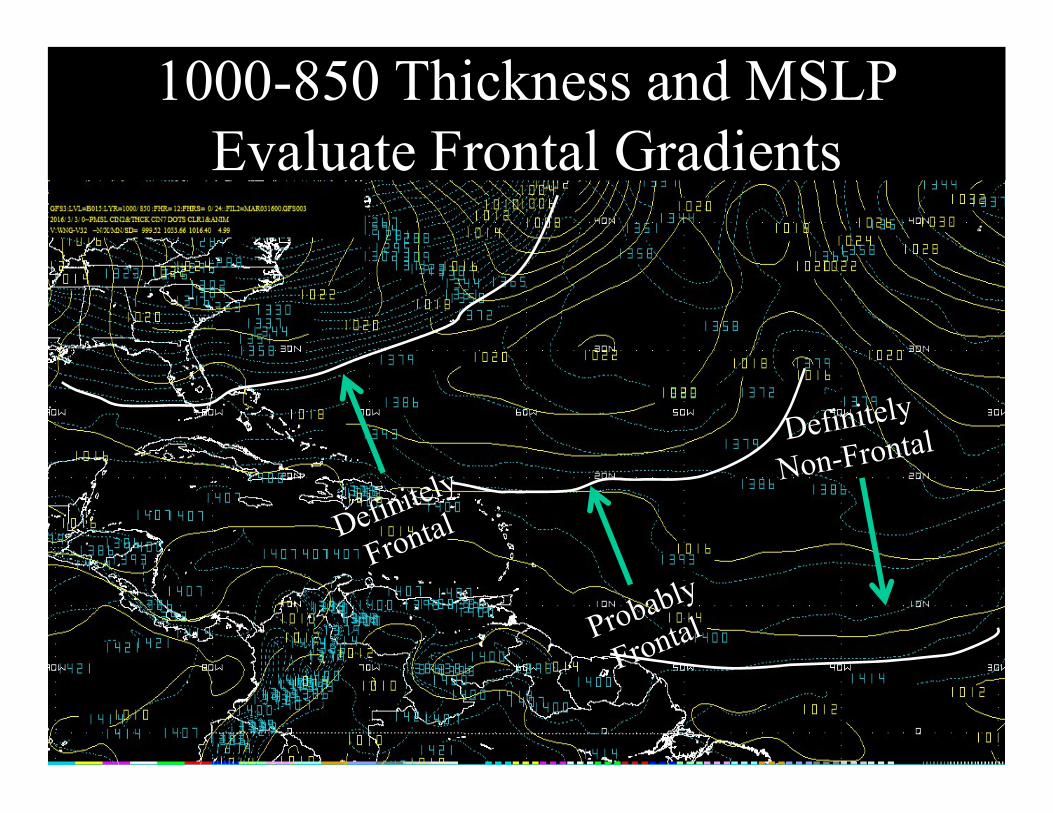
1000-850 Thickness and MSLPEvaluate Frontal Gradients
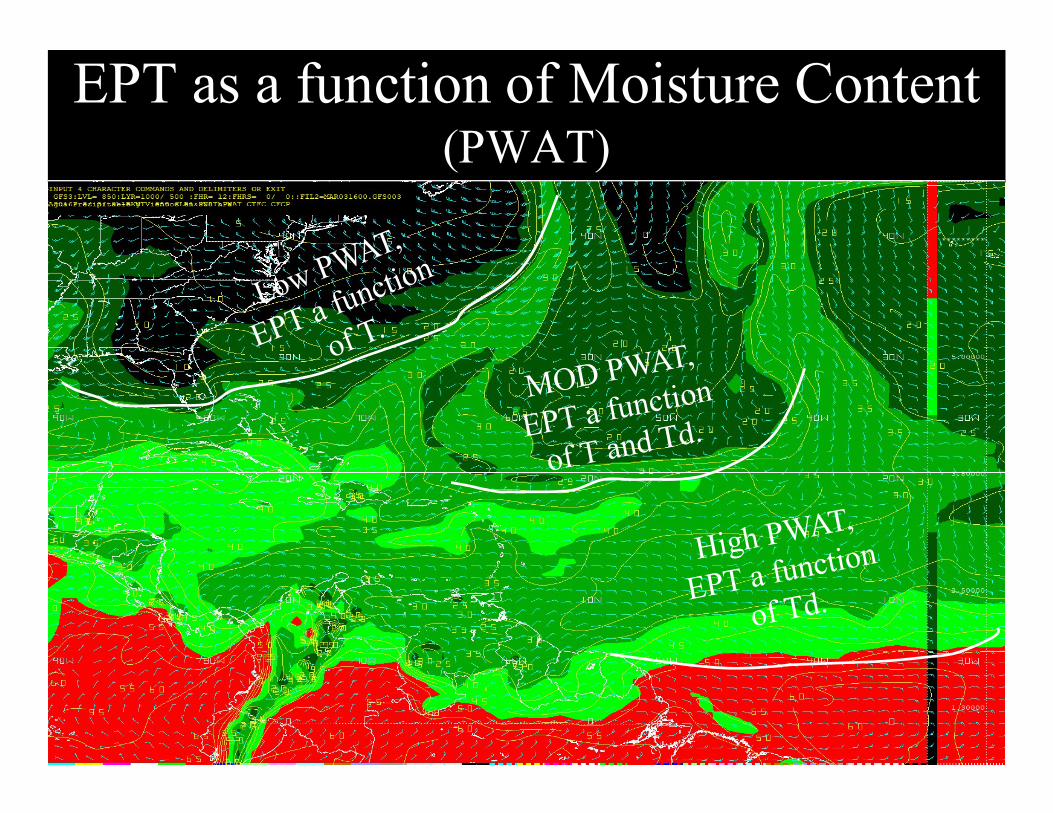
EPT as a function of Moisture Content (PWAT)
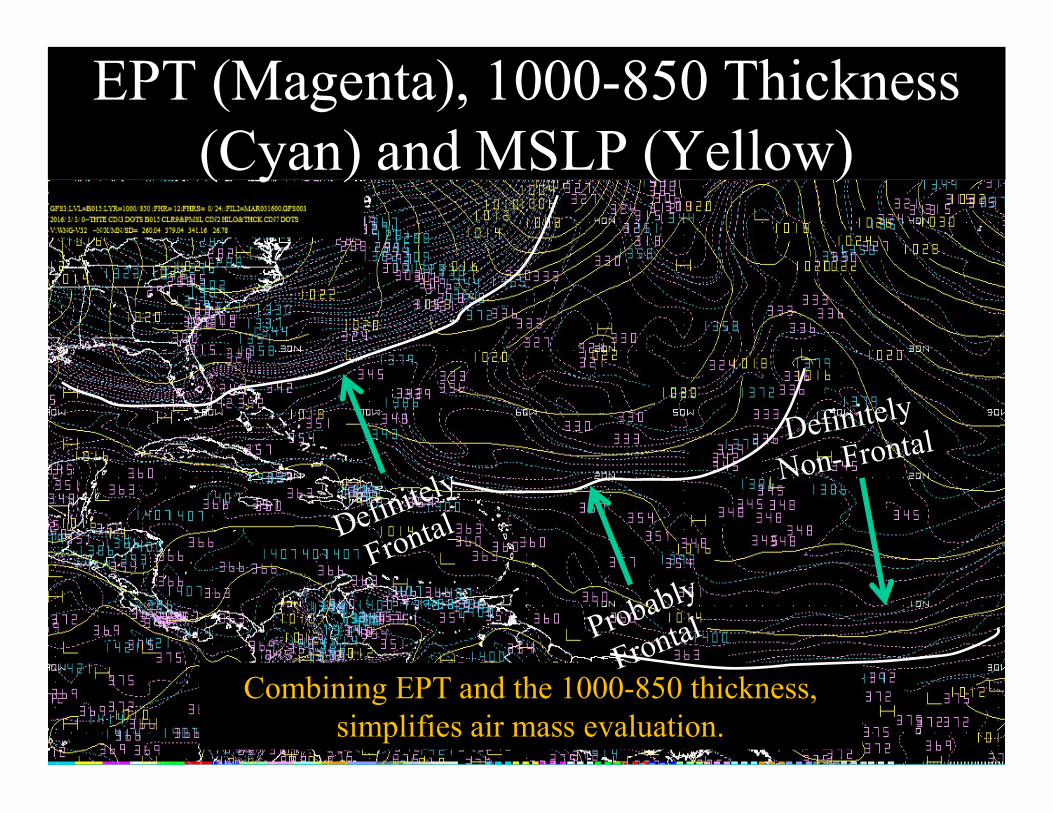
EPT (Magenta), 1000-850 Thickness (Cyan) and MSLP (Yellow)
Combining EPT and the 1000-850 thickness, simplifies air mass evaluation.
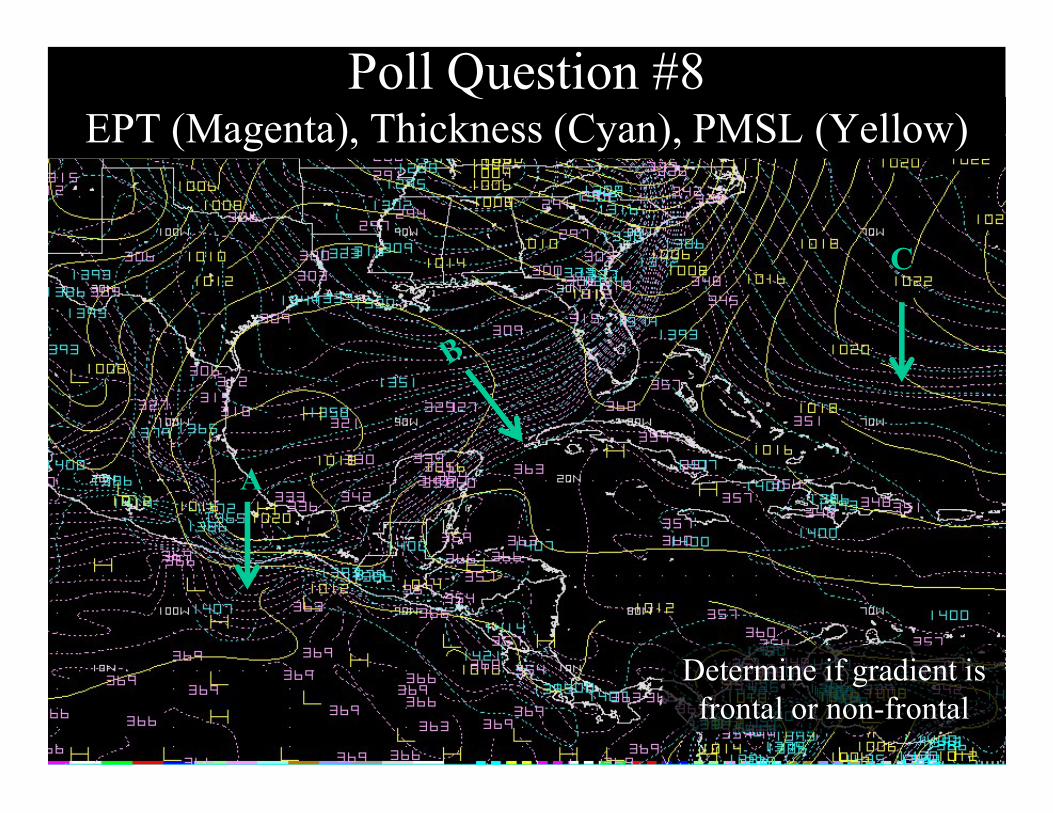
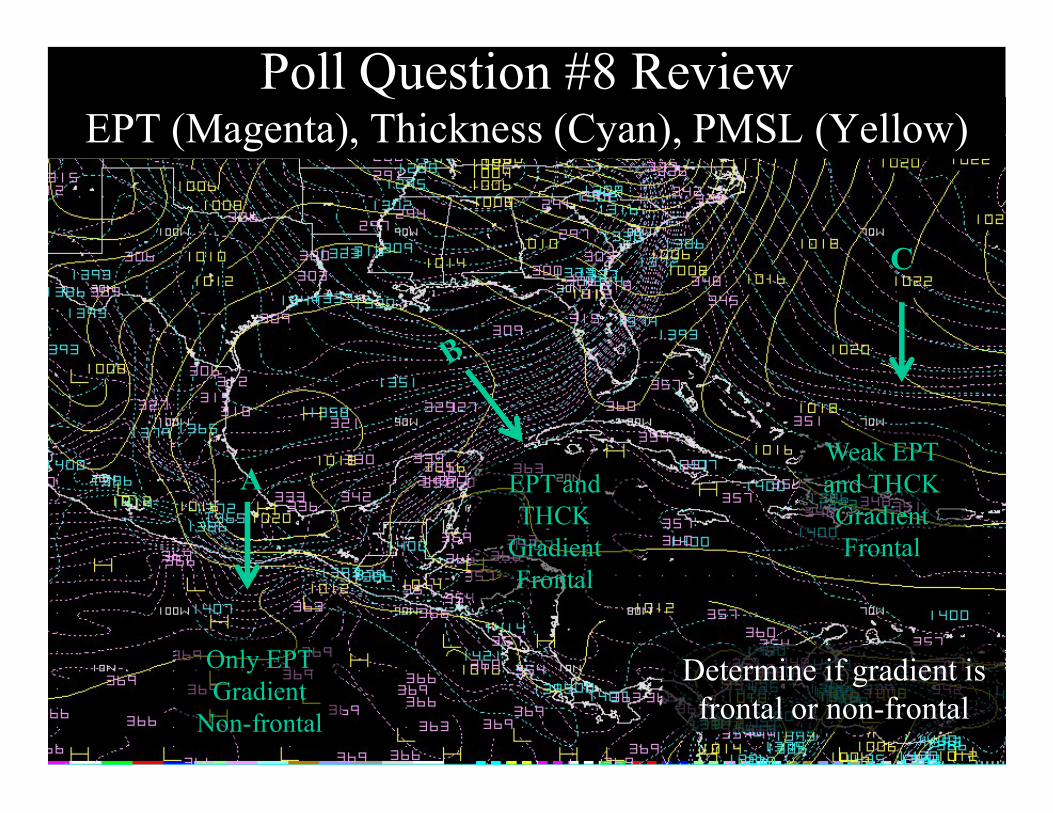
Poll Question #8EPT (Magenta), Thickness (Cyan), PMSL (Yellow)
A
C
Determine if gradient is frontal or non-frontal
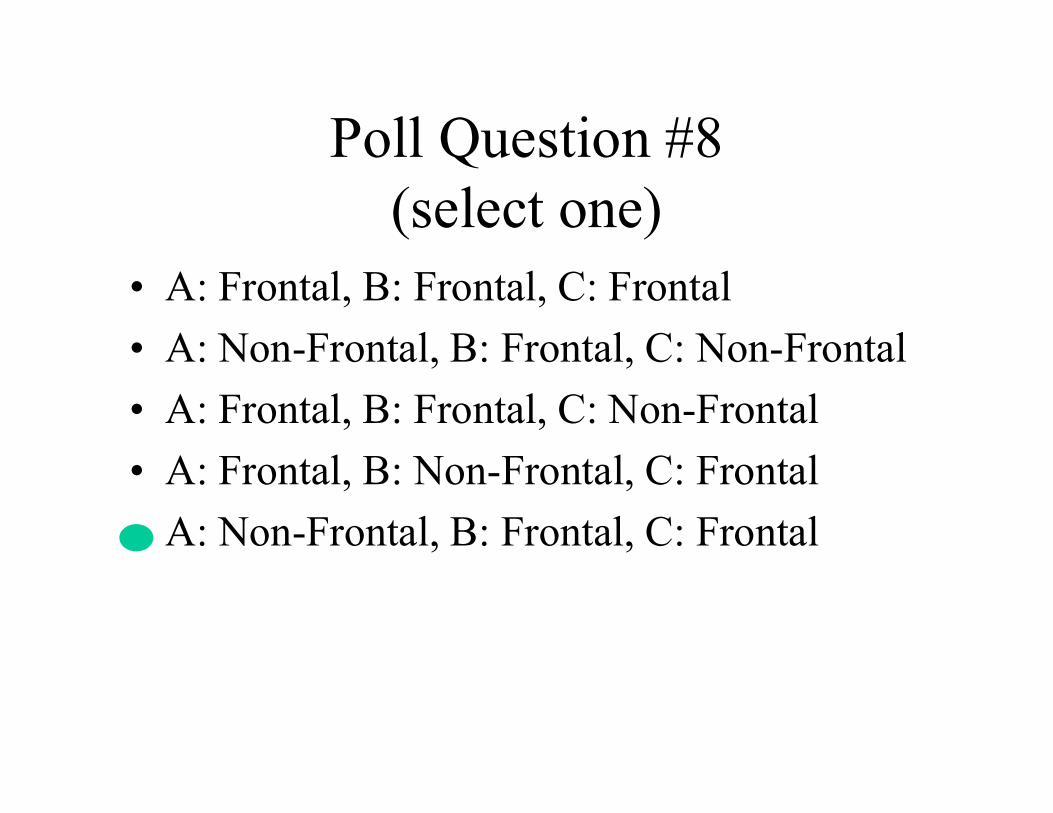
Poll Question #8(select one)
• A: Frontal, B: Frontal, C: Frontal
• A: Non-Frontal, B: Frontal, C: Non-Frontal
• A: Frontal, B: Frontal, C: Non-Frontal
• A: Frontal, B: Non-Frontal, C: Frontal
• A: Non-Frontal, B: Frontal, C: Frontal
Poll Question #8 ReviewEPT (Magenta), Thickness (Cyan), PMSL (Yellow)
A
C
Determine if gradient is frontal or non-frontal
Only EPT Gradient
Non-frontal
EPT and THCK
GradientFrontal
Weak EPT and THCKGradientFrontal
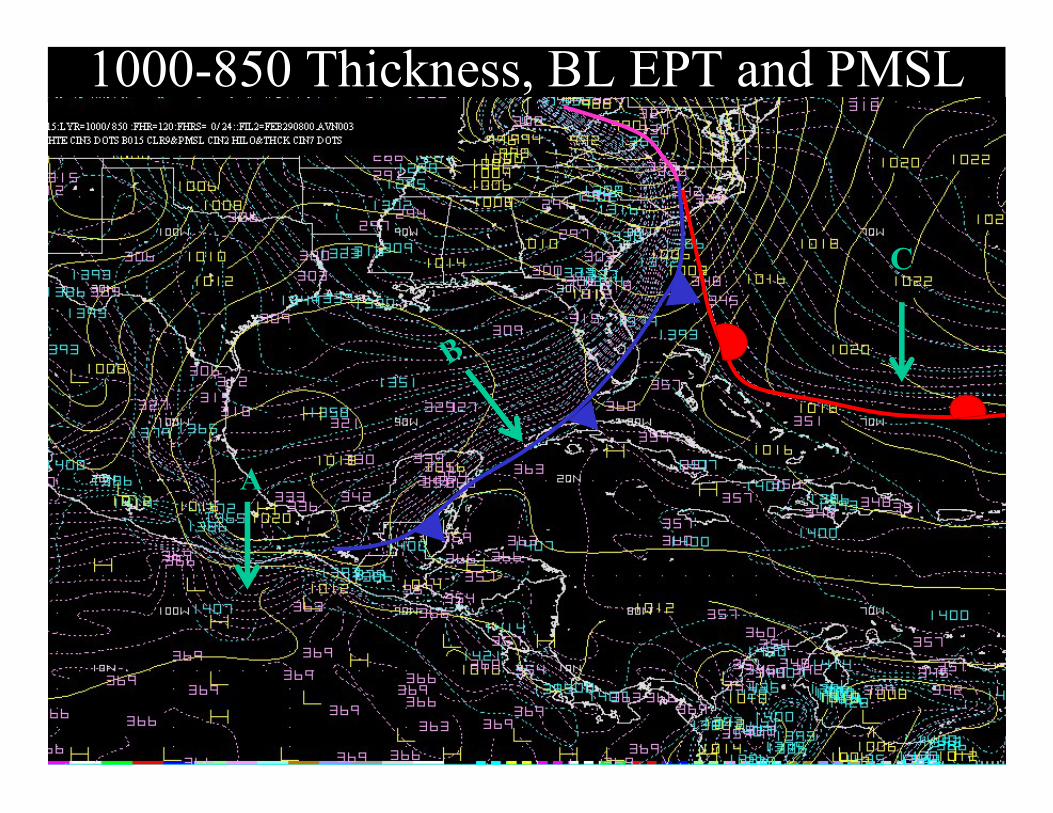
1000-850 Thickness, BL EPT and PMSL
A
C
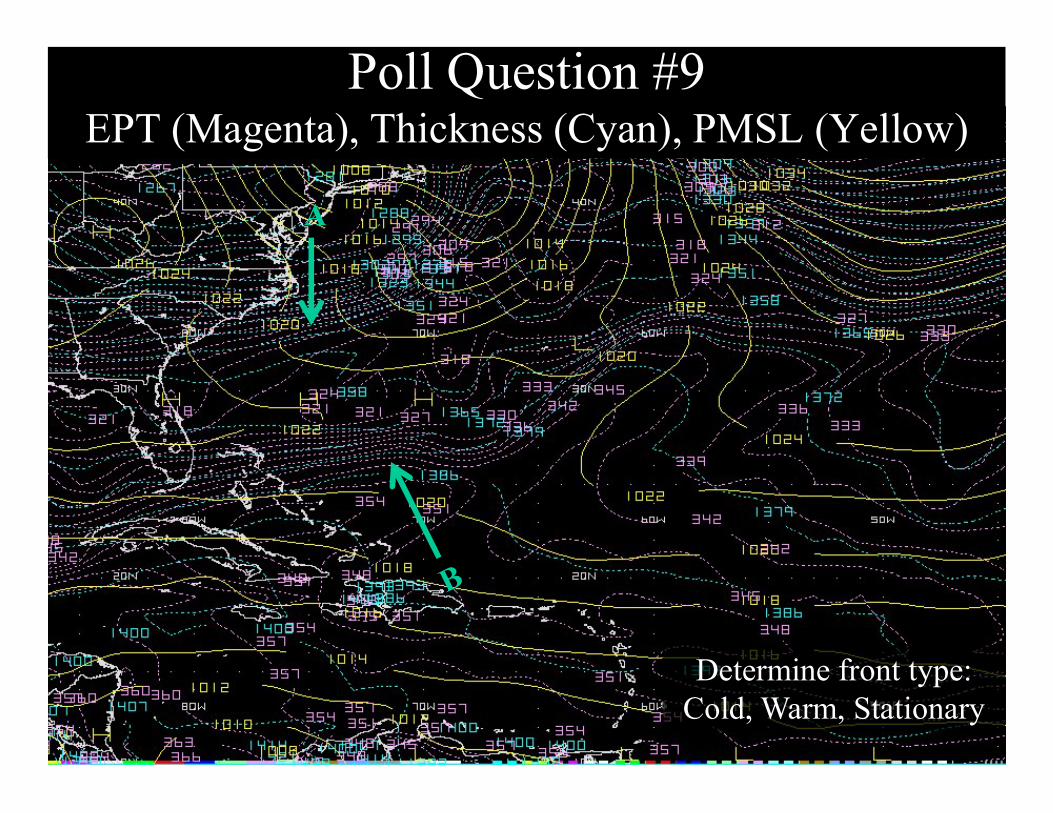
Poll Question #9EPT (Magenta), Thickness (Cyan), PMSL (Yellow)
Determine front type:Cold, Warm, Stationary
A
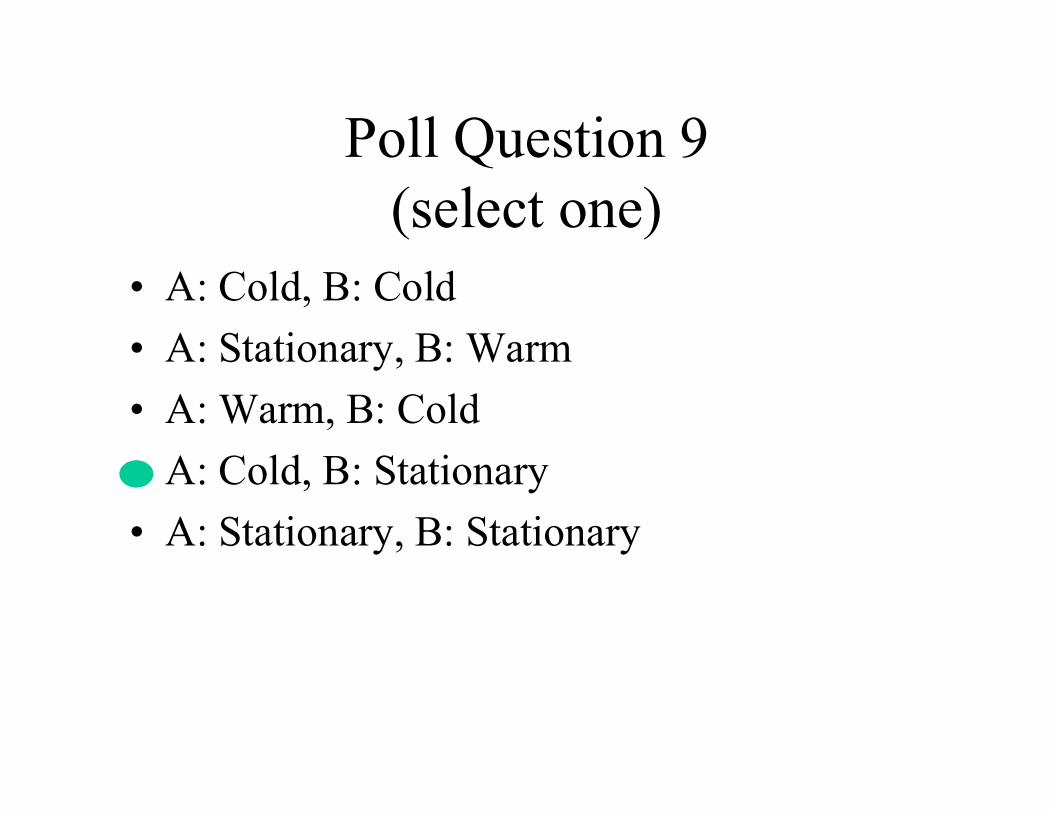
Poll Question 9(select one)
• A: Cold, B: Cold
• A: Stationary, B: Warm
• A: Warm, B: Cold
• A: Cold, B: Stationary
• A: Stationary, B: Stationary
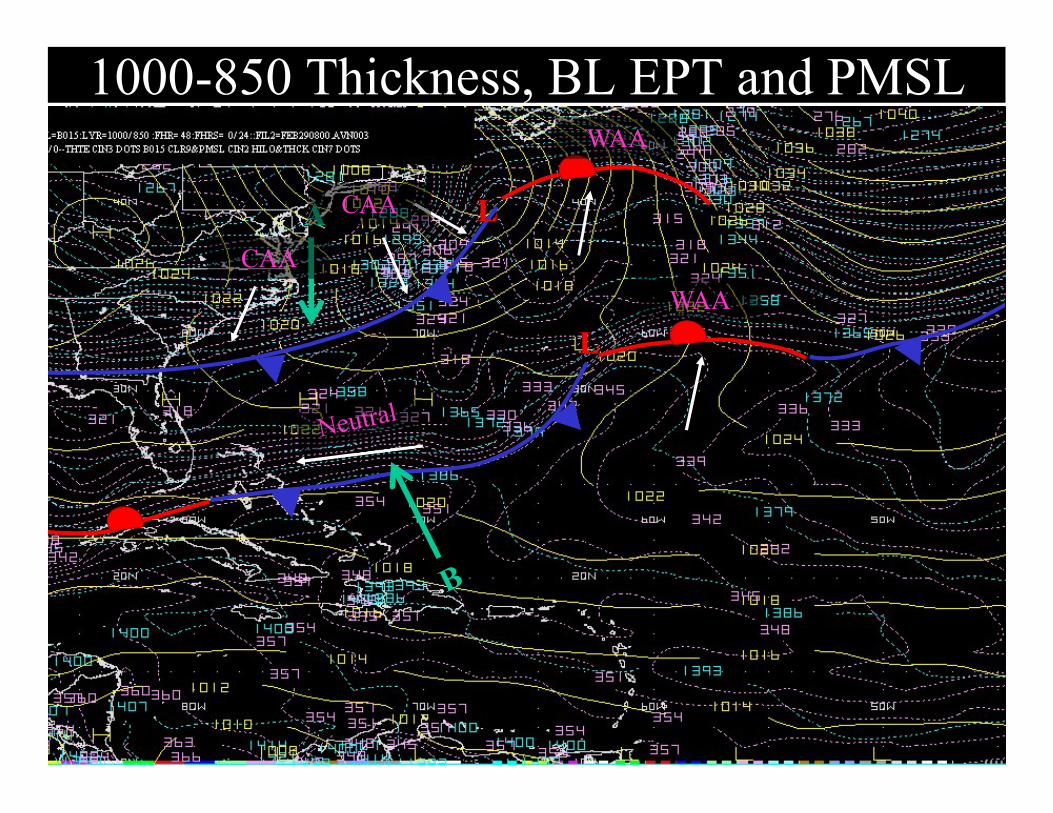
1000-850 Thickness, BL EPT and PMSL
L
L
ACAA
CAA
WAA
WAA
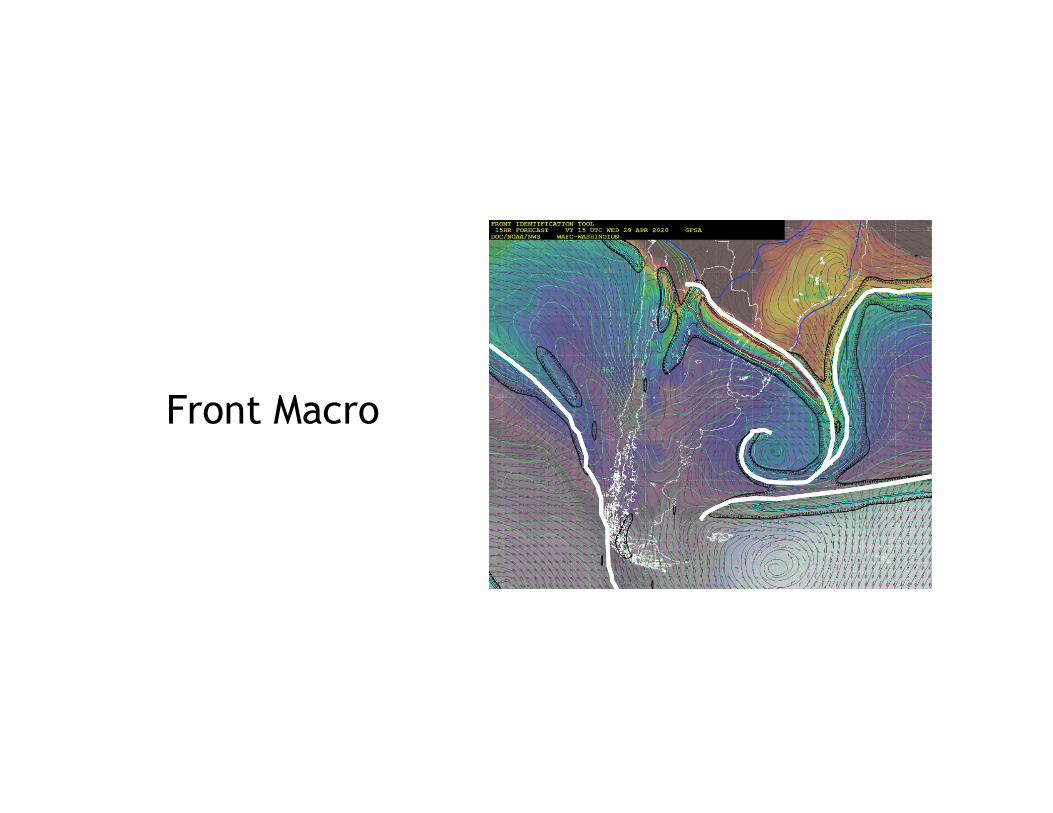
Front Macro
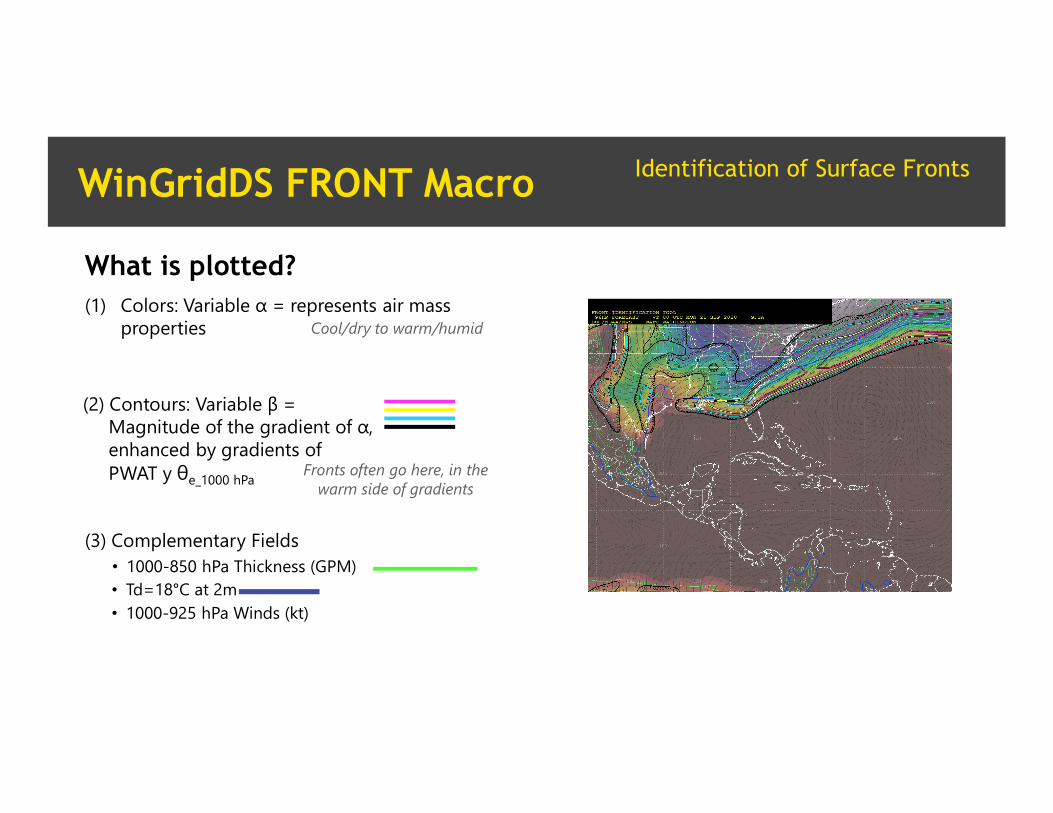
What is plotted?
(3) Complementary Fields• 1000-850 hPa Thickness (GPM)
• 1000-925 hPa Winds (kt)• Td=18°C at 2m
(1) Colors: Variable α = represents air mass properties
WinGridDS FRONT Macro Identification of Surface Fronts
(2) Contours: Variable β = Magnitude of the gradient of α, enhanced by gradients of PWAT y θe_1000 hPa
Fronts often go here, in the warm side of gradients
Cool/dry to warm/humid
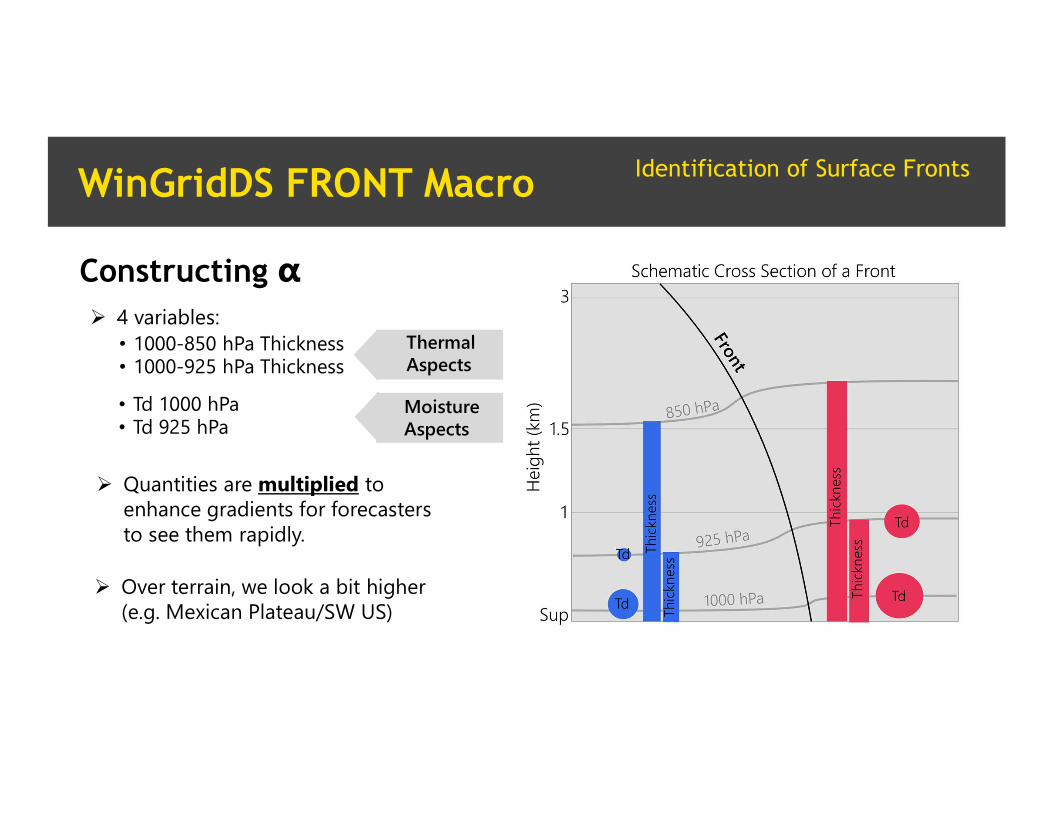
Constructing α
• 1000-850 hPa Thickness• 1000-925 hPa Thickness
Thermal Aspects
Quantities are multiplied to enhance gradients for forecasters to see them rapidly.
• Td 1000 hPa• Td 925 hPa
Moisture Aspects
4 variables:
Over terrain, we look a bit higher (e.g. Mexican Plateau/SW US)
WinGridDS FRONT Macro Identification of Surface Fronts
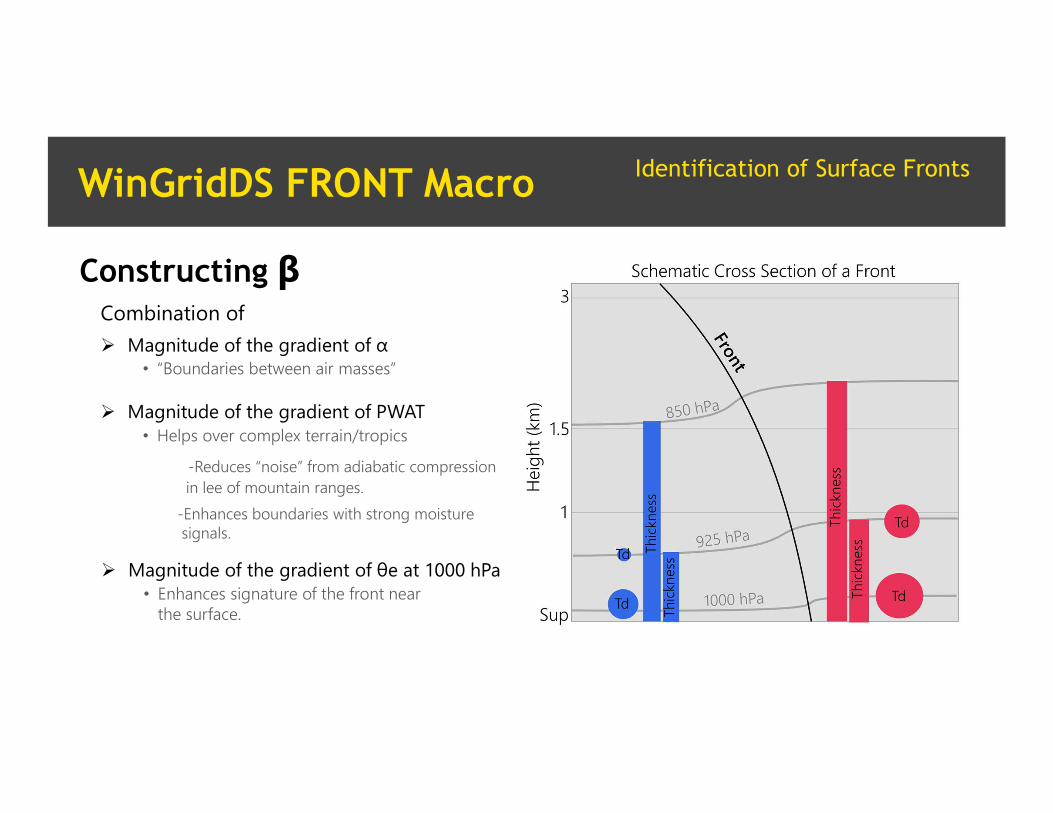
Magnitude of the gradient of PWAT
Magnitude of the gradient of α
Magnitude of the gradient of θe at 1000 hPa
Combination of
• “Boundaries between air masses”
• Helps over complex terrain/tropics
-Reduces “noise” from adiabatic compression in lee of mountain ranges.
-Enhances boundaries with strong moisture signals.
• Enhances signature of the front near the surface.
WinGridDS FRONT Macro Identification of Surface Fronts
Constructing β
Mean Layer RH, THCK, PMSL
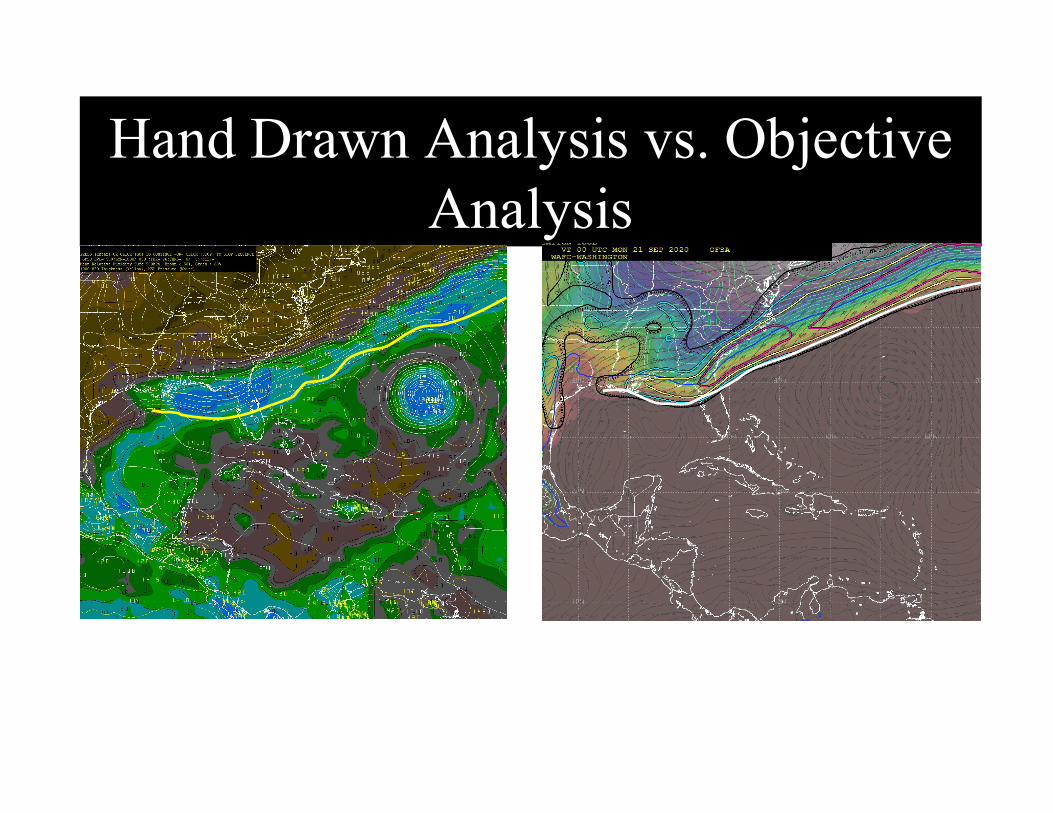
Hand Drawn Analysis vs. Objective Analysis
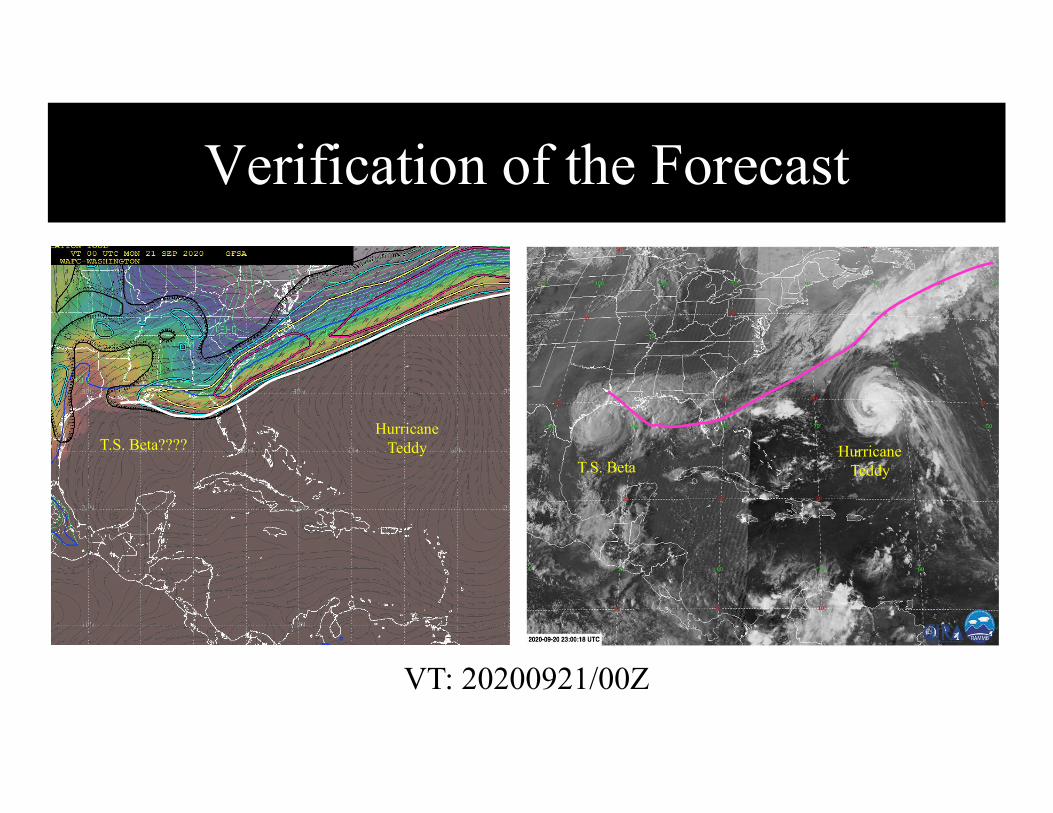
Verification of the Forecast
Hurricane TeddyT.S. Beta
VT: 20200921/00Z
Hurricane TeddyT.S. Beta????

Interaction of Upper Level Jets with Surface Fronts
Subtropical Jet and Polar Front Interaction
• The question is, what interaction, if any, a subtropical jet can have with polar fronts over the Caribbean Basin?– Polar fronts are accompanied by polar jets– Subtropical Fronts??
• Only in the marine layer
• Ageostrophic circulation around an upper level jet can help sustain the baroclinic environment along a polar front as it pushes south into the Basin. – The jet aloft, with its indirect ageostrophic circulation, will sustain
the temperature gradient
• Although the Polar Front limits to low levels of the atmosphere as it enters the basin, the symbiotic interaction with subtropical jet helps sustains this feature.
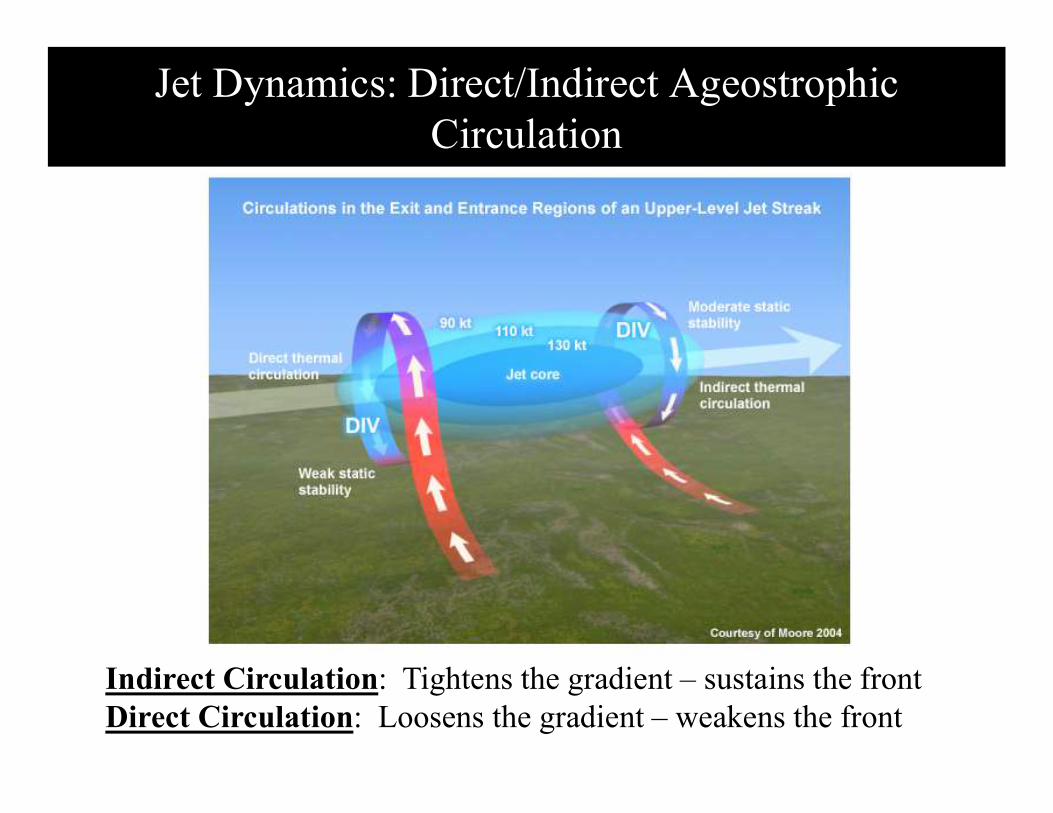
Jet Dynamics: Direct/Indirect Ageostrophic Circulation
Indirect Circulation: Tightens the gradient – sustains the frontDirect Circulation: Loosens the gradient – weakens the front
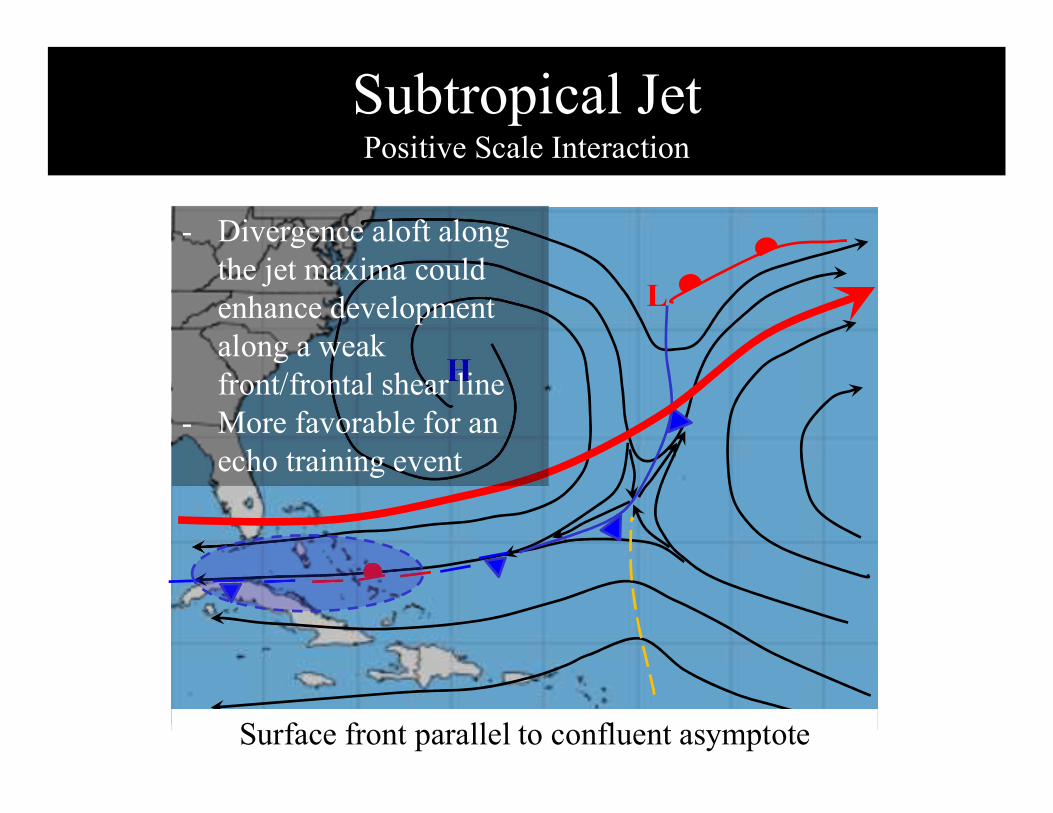
Subtropical JetPositive Scale Interaction
H
L
Surface front parallel to confluent asymptote
- Divergence aloft along the jet maxima could enhance development along a weak front/frontal shear line
- More favorable for an echo training event
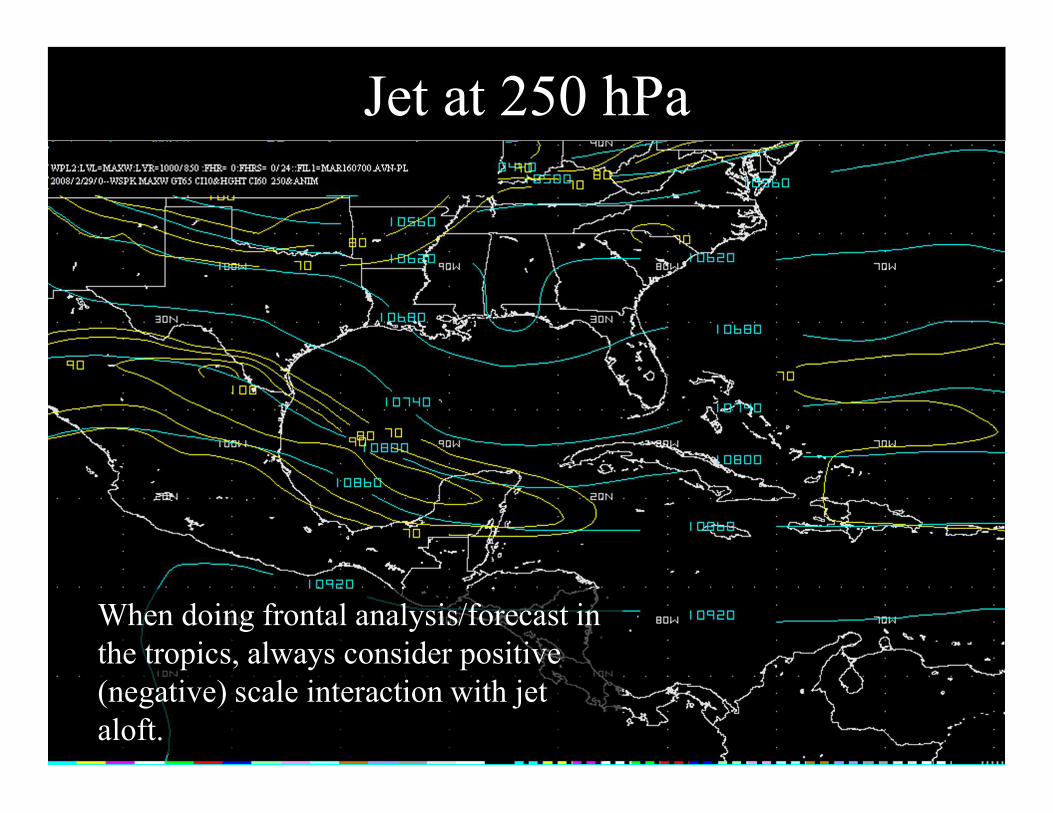
Jet at 250 hPa
When doing frontal analysis/forecast in the tropics, always consider positive (negative) scale interaction with jet aloft.

Frontolysis
• As long as the jet aloft remains, the gradient will hold and the surface front will remain
• Frontolysis: The gradient will slacken as the jet weakens or pulls away.
• If you have a jet aloft, don’t kill the front!
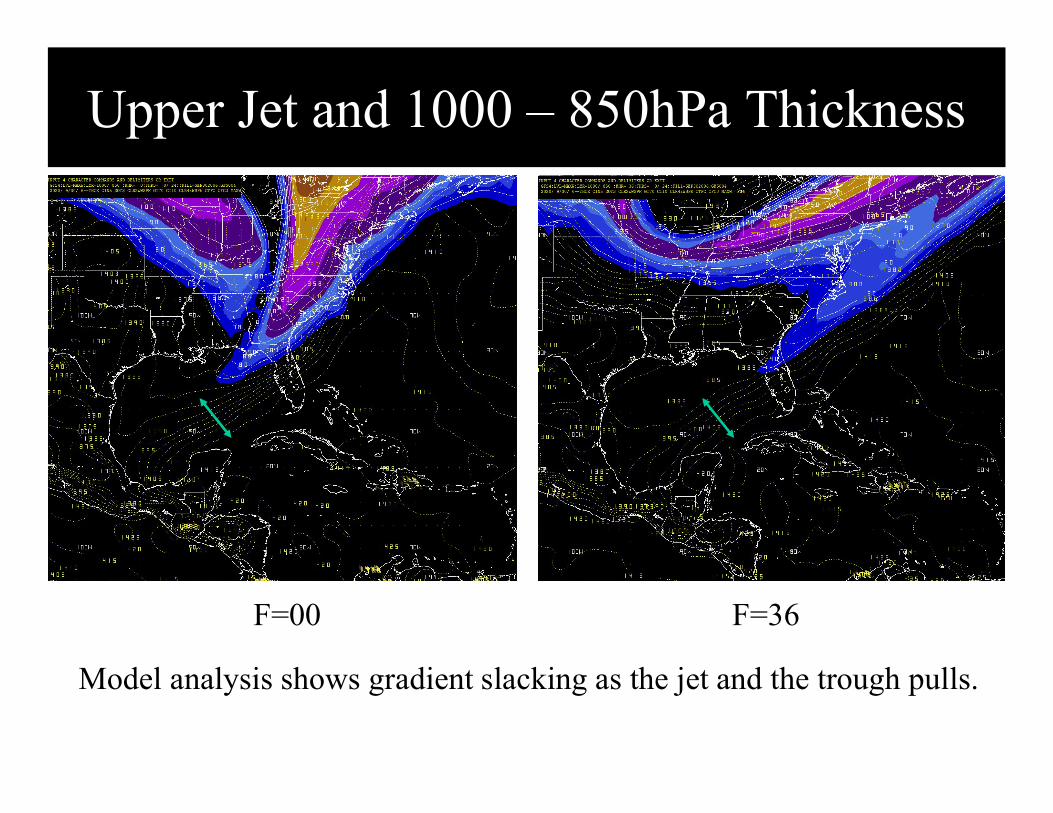
Upper Jet and 1000 – 850hPa Thickness
F=00 F=36
Model analysis shows gradient slacking as the jet and the trough pulls.
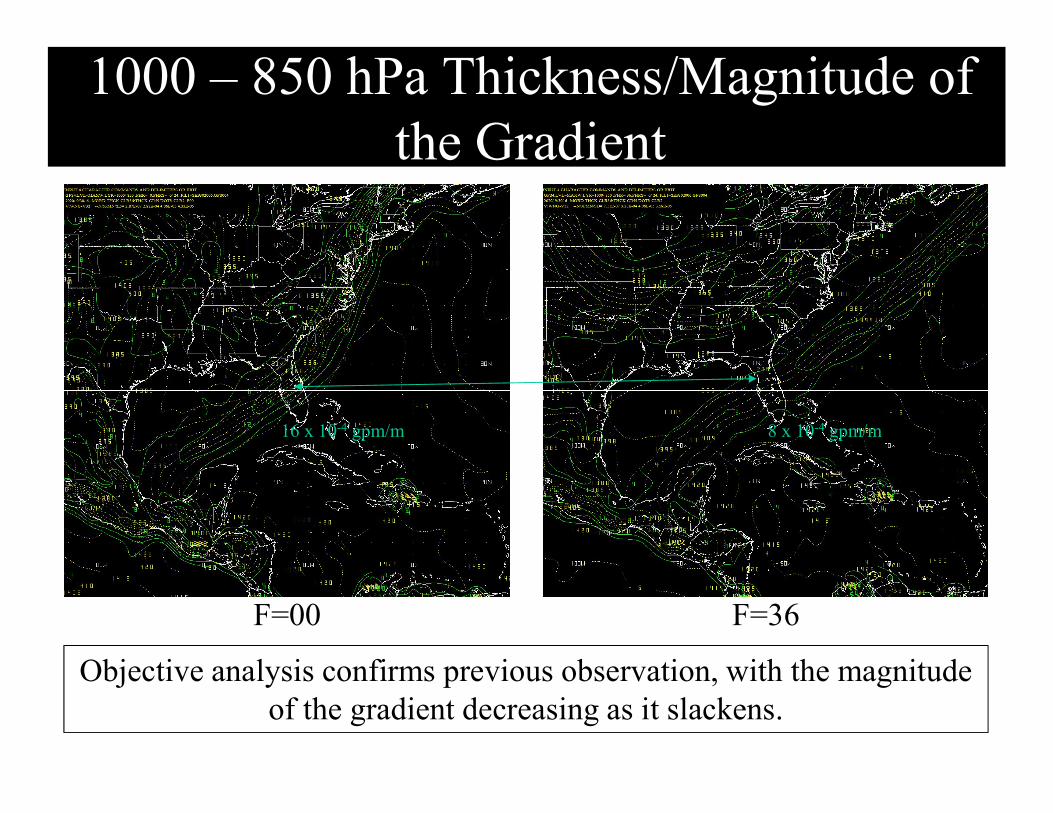
1000 – 850 hPa Thickness/Magnitude of the Gradient
F=00 F=36
Objective analysis confirms previous observation, with the magnitude of the gradient decreasing as it slackens.
16 x 10-4 gpm/m 8 x 10⁻⁴ gpm/m
Cold Air Advection (CAA)
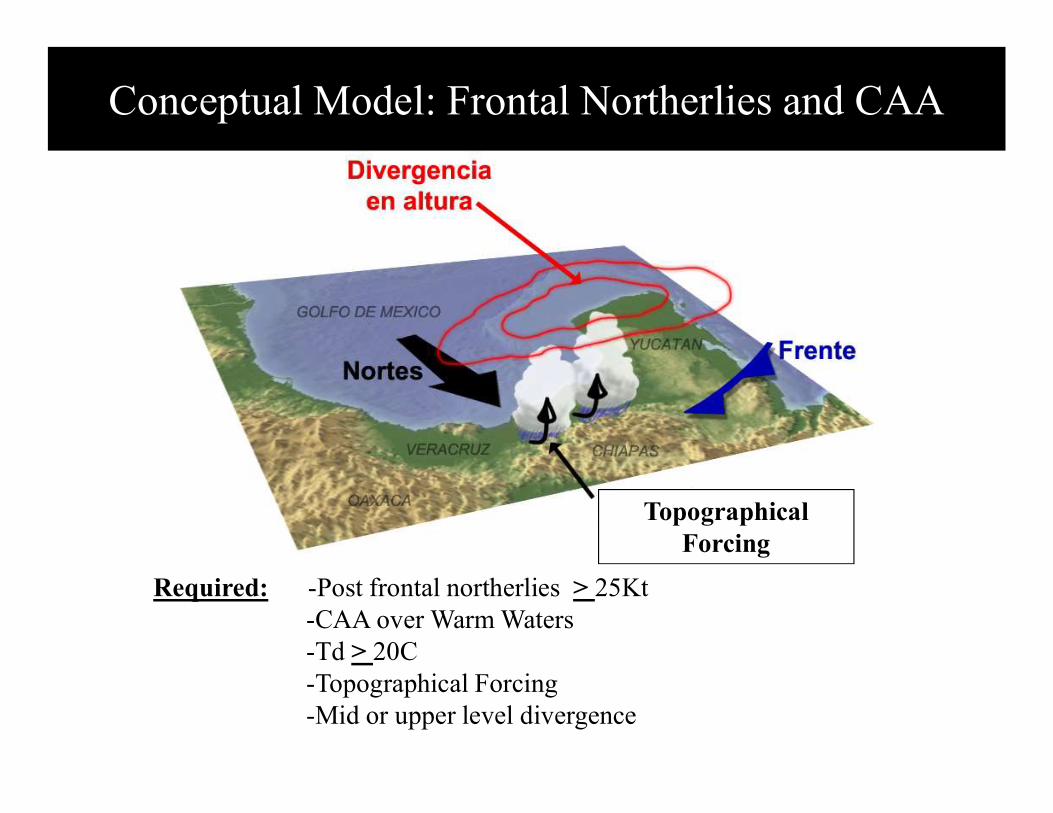
Conceptual Model: Frontal Northerlies and CAA
Required: -Post frontal northerlies > 25Kt-CAA over Warm Waters-Td > 20C-Topographical Forcing-Mid or upper level divergence
Topographical Forcing
Cold Air Advection
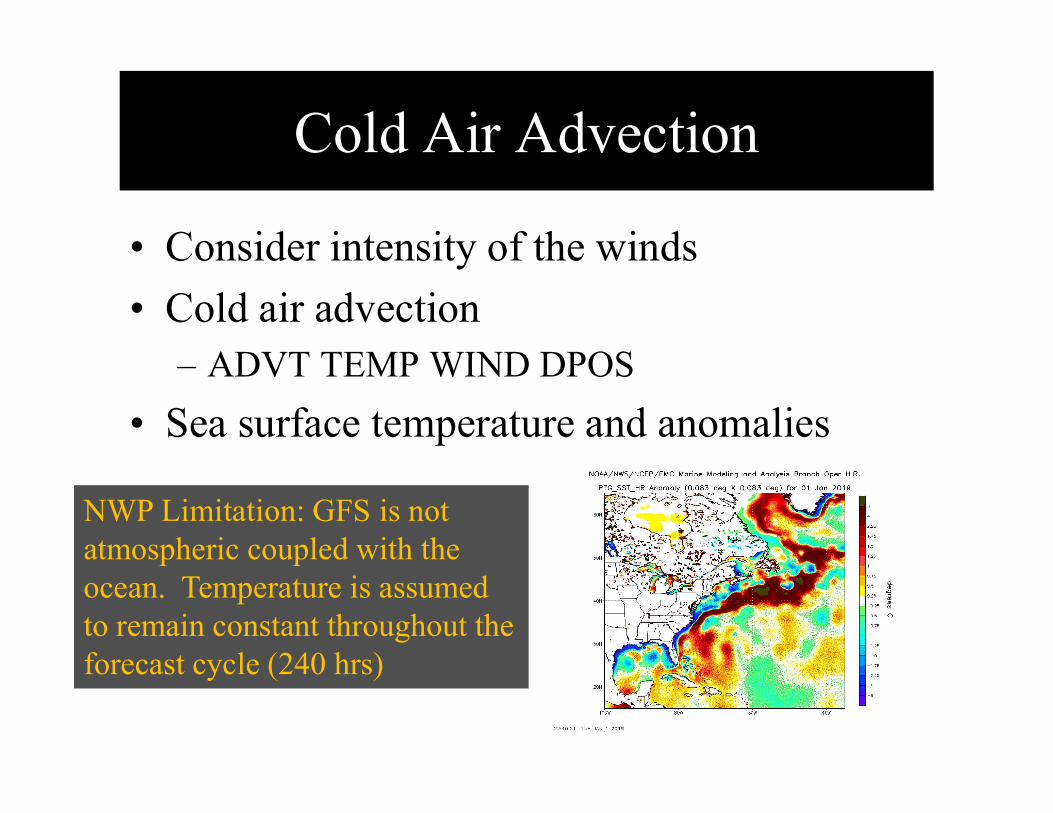
• Consider intensity of the winds
• Cold air advection– ADVT TEMP WIND DPOS
• Sea surface temperature and anomalies
NWP Limitation: GFS is not atmospheric coupled with the ocean. Temperature is assumed to remain constant throughout the forecast cycle (240 hrs)
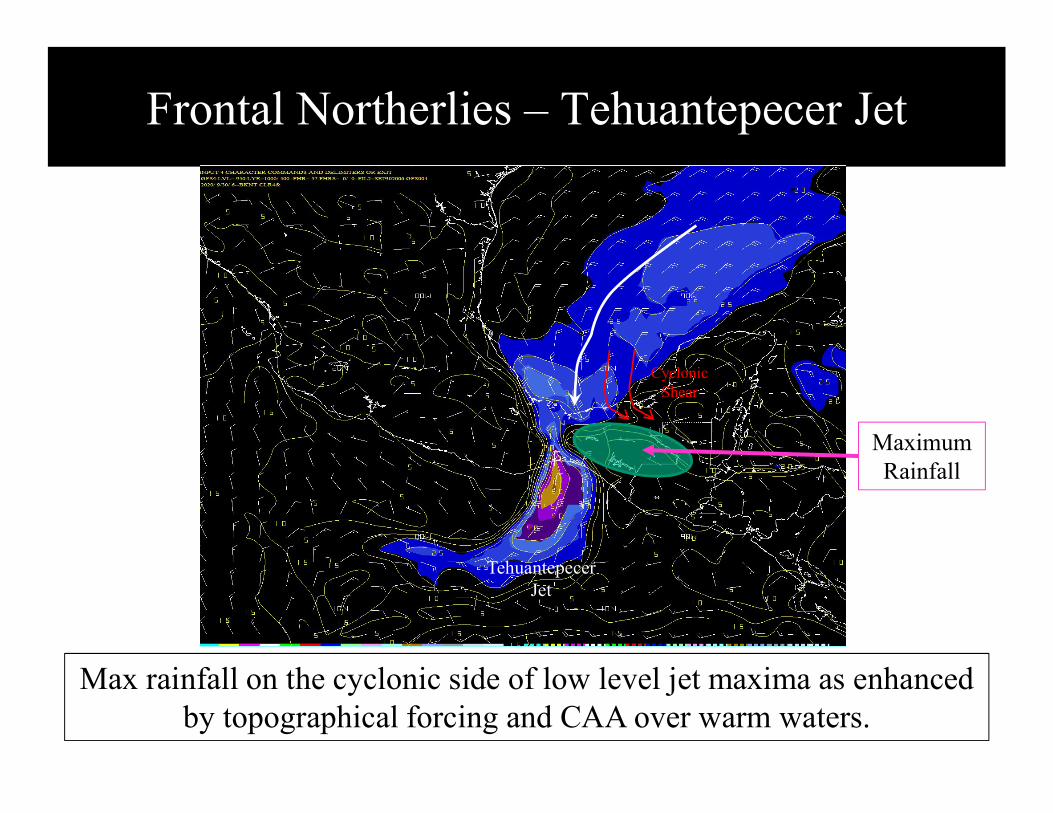
Frontal Northerlies – Tehuantepecer Jet
Max rainfall on the cyclonic side of low level jet maxima as enhanced by topographical forcing and CAA over warm waters.
Cyclonic Shear
Maximum Rainfall
TehuantepecerJet
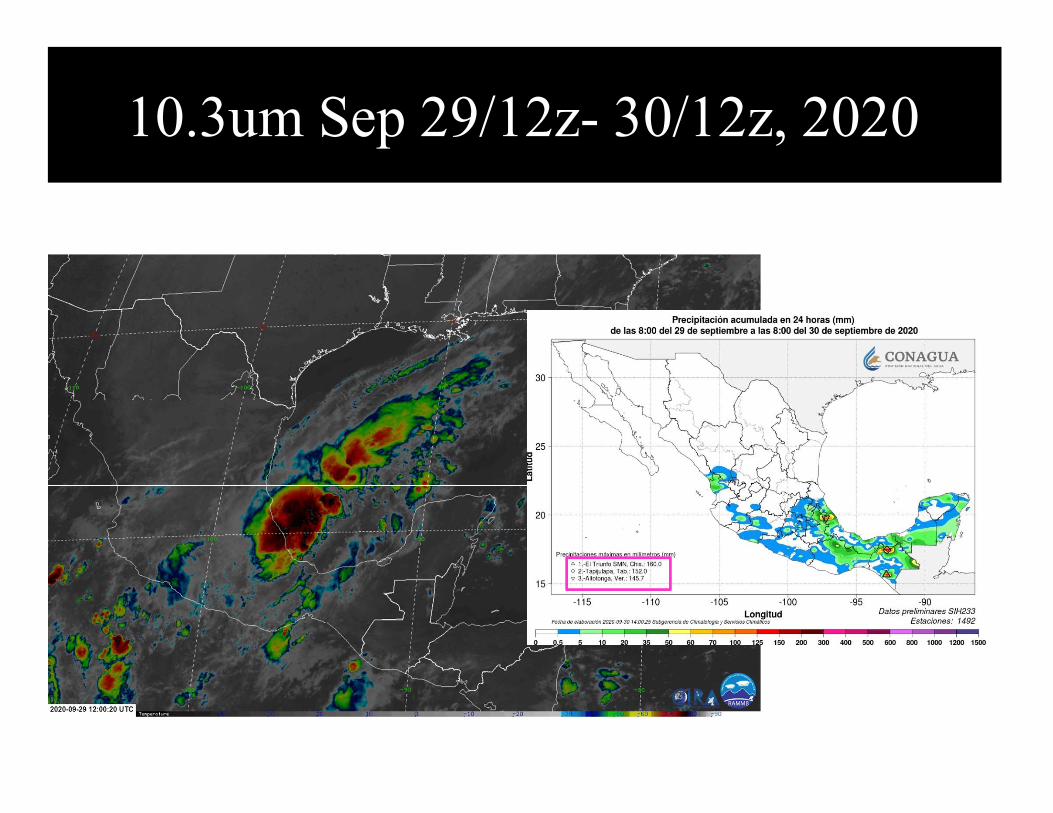
10.3um Sep 29/12z- 30/12z, 2020
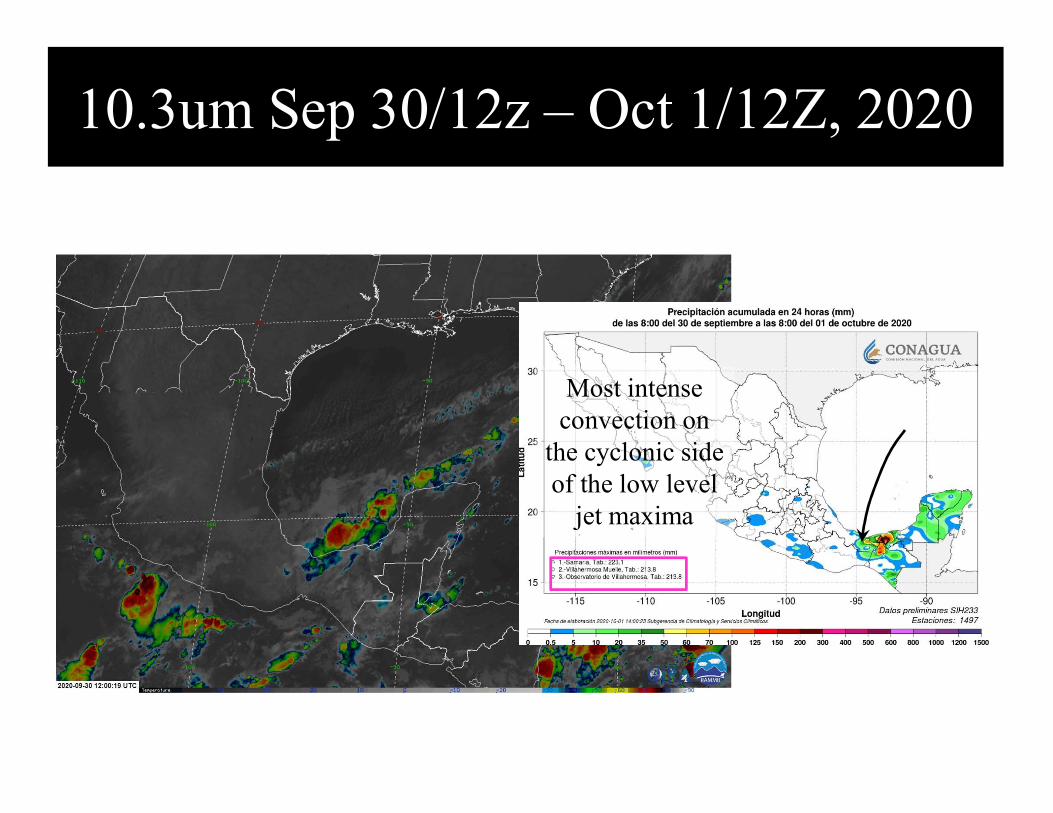
10.3um Sep 30/12z – Oct 1/12Z, 2020
Most intense convection on
the cyclonic side of the low level
jet maxima
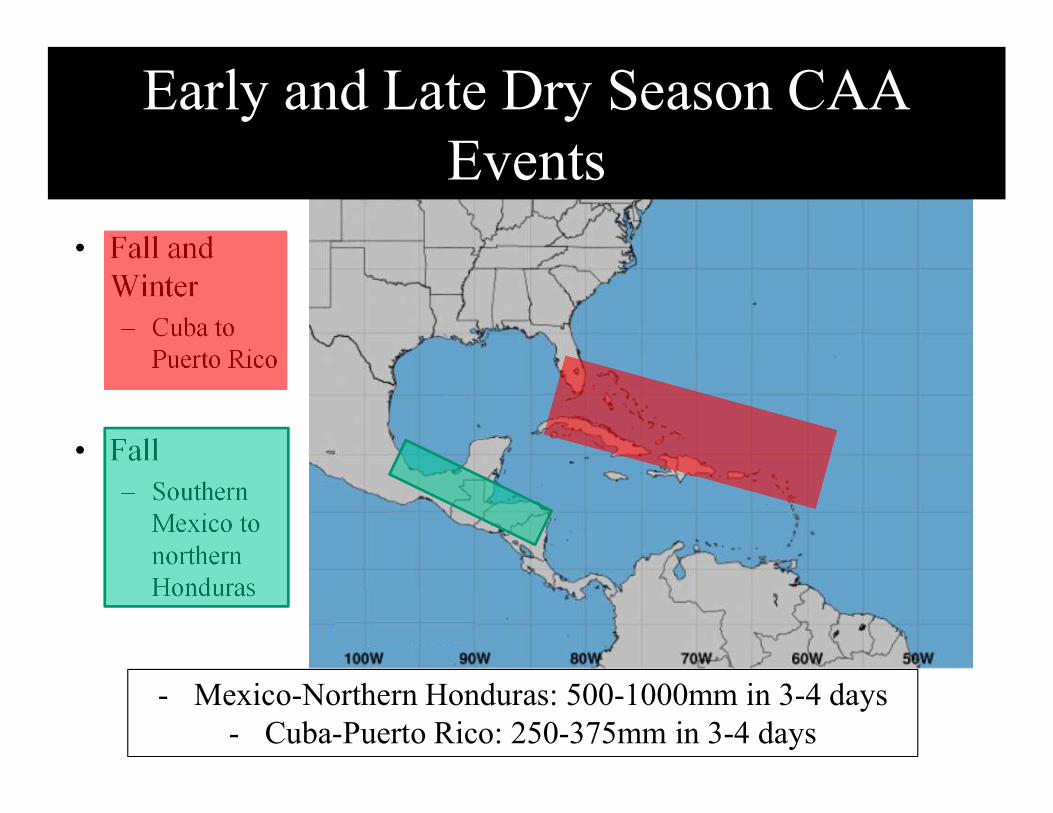
• Fall and Winter– Cuba to
Puerto Rico
• Fall– Southern
Mexico to northern Honduras
Early and Late Dry Season CAAEvents
- Mexico-Northern Honduras: 500-1000mm in 3-4 days- Cuba-Puerto Rico: 250-375mm in 3-4 days
121
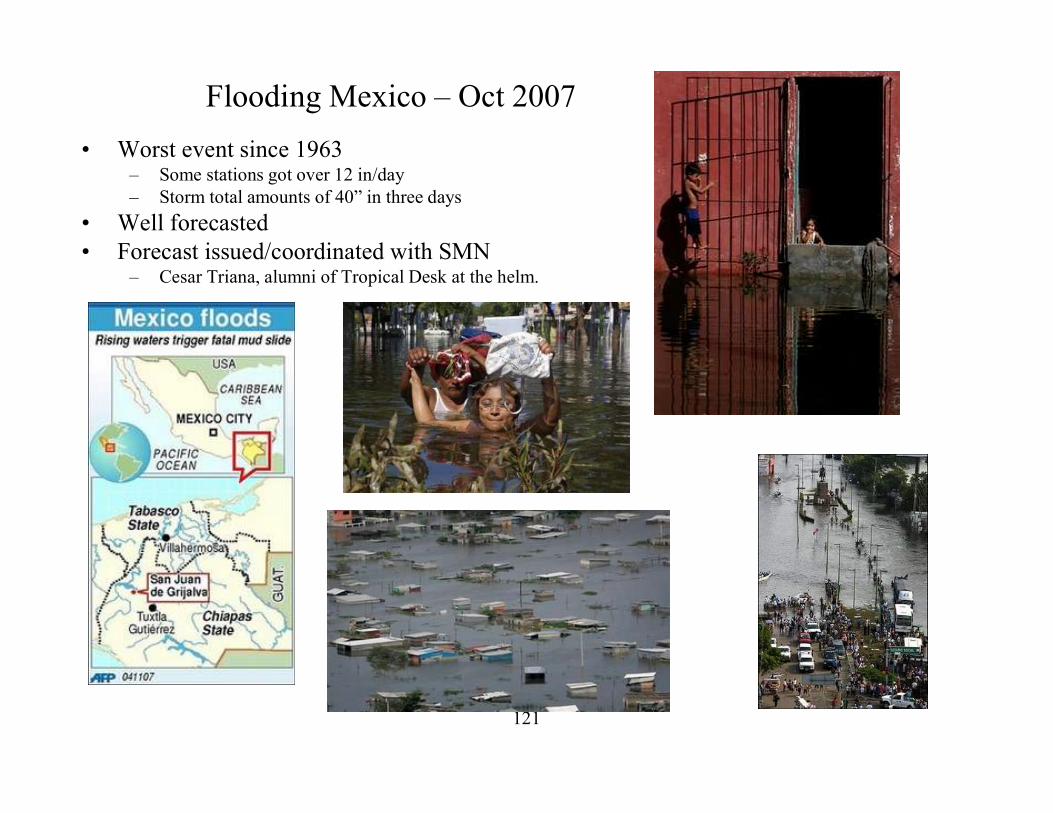
Flooding Mexico – Oct 2007
• Worst event since 1963– Some stations got over 12 in/day– Storm total amounts of 40” in three days
• Well forecasted • Forecast issued/coordinated with SMN
– Cesar Triana, alumni of Tropical Desk at the helm.
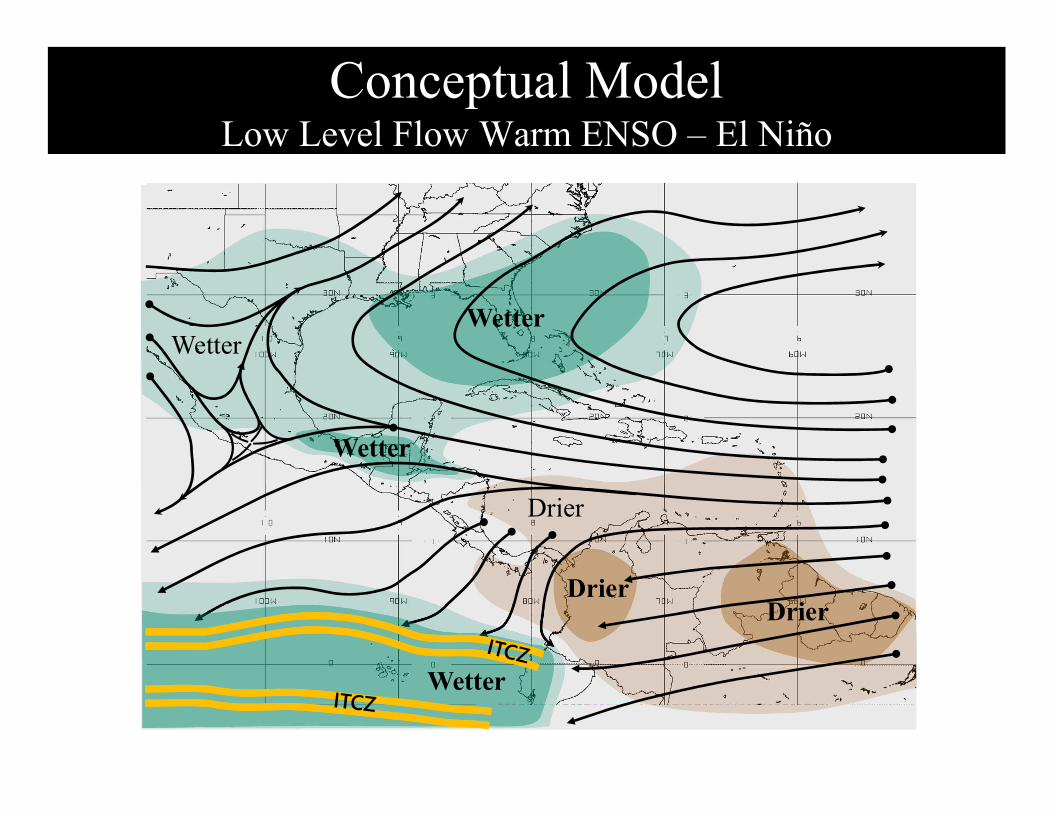
Conceptual ModelLow Level Flow Warm ENSO – El Niño
Drier
WetterWetter
DrierDrier
Wetter
Wetter
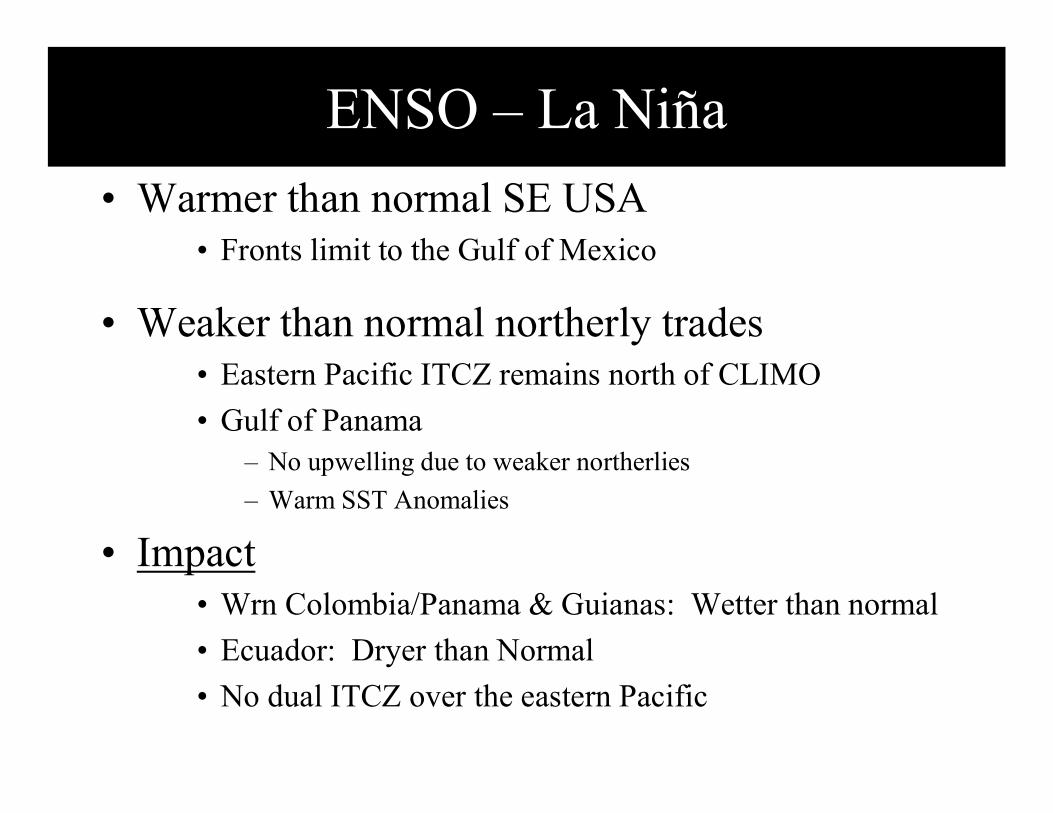
ENSO – La Niña
• Warmer than normal SE USA• Fronts limit to the Gulf of Mexico
• Weaker than normal northerly trades• Eastern Pacific ITCZ remains north of CLIMO
• Gulf of Panama– No upwelling due to weaker northerlies
– Warm SST Anomalies
• Impact• Wrn Colombia/Panama & Guianas: Wetter than normal
• Ecuador: Dryer than Normal
• No dual ITCZ over the eastern Pacific
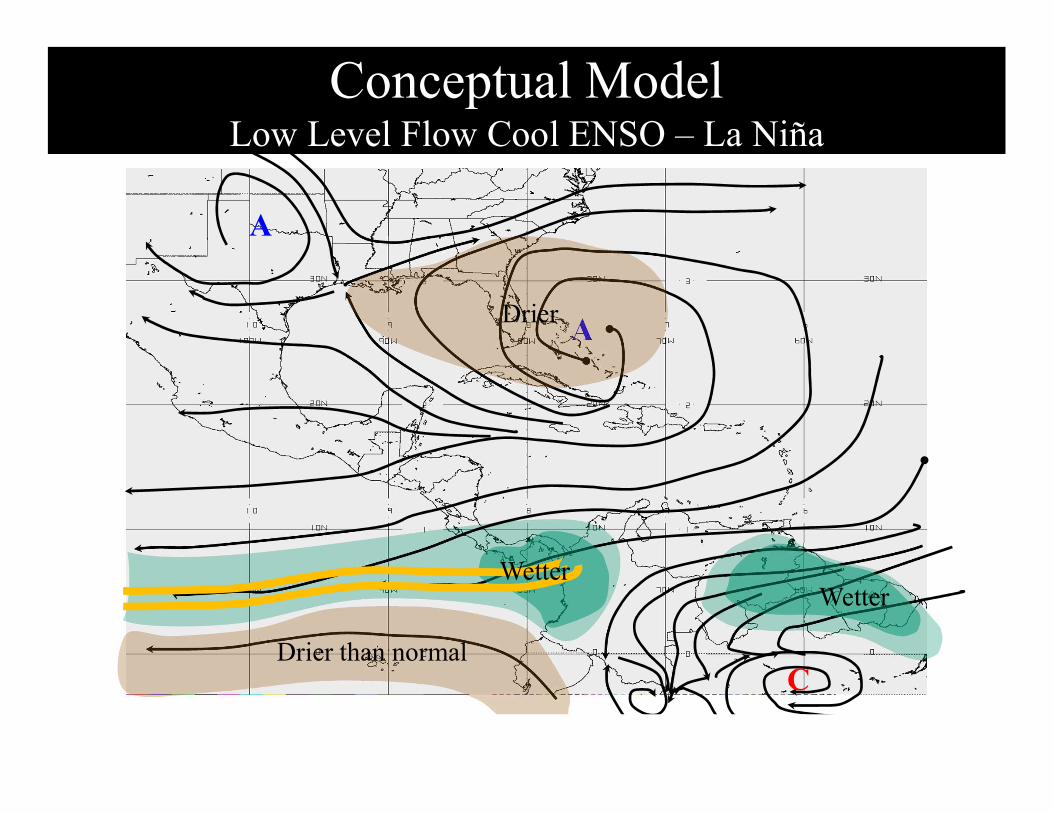
Conceptual ModelLow Level Flow Cool ENSO – La Niña
A
A
CDrier than normal
Wetter
Drier
Wetter
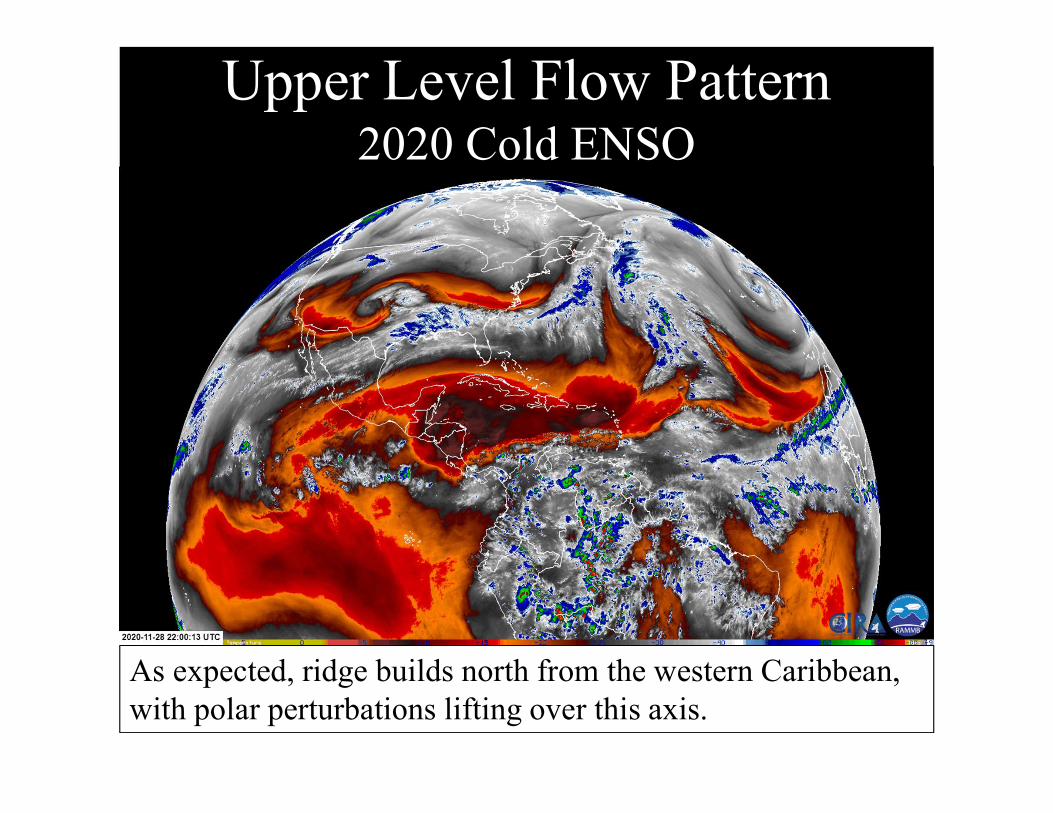
Upper Level Flow Pattern2020 Cold ENSO
As expected, ridge builds north from the western Caribbean, with polar perturbations lifting over this axis.

End Part I
Questions?

Shear Lines
Part II
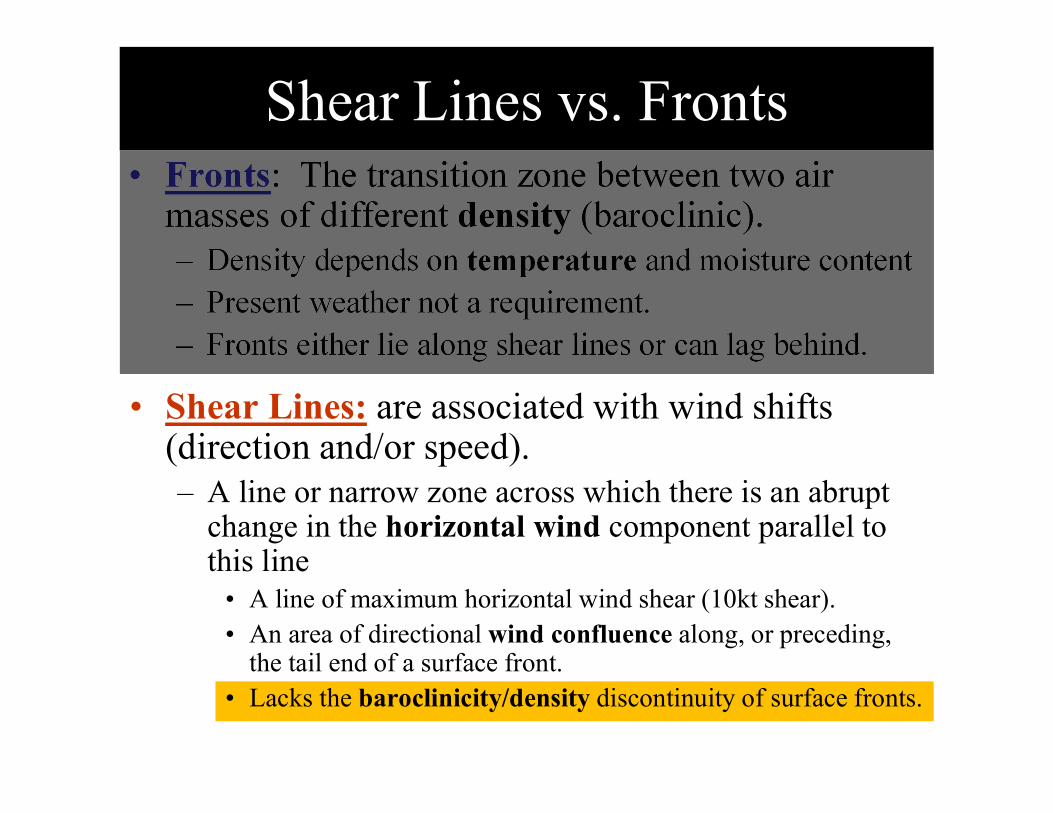
Shear Lines vs. Fronts• Fronts: The transition zone between two air
masses of different density (baroclinic).– Density depends on temperature and moisture content– Present weather not a requirement.– Fronts either lie along shear lines or can lag behind.
• Shear Lines: are associated with wind shifts (direction and/or speed).– A line or narrow zone across which there is an abrupt
change in the horizontal wind component parallel to this line
• A line of maximum horizontal wind shear (10kt shear). • An area of directional wind confluence along, or preceding,
the tail end of a surface front.• Lacks the baroclinicity/density discontinuity of surface fronts.
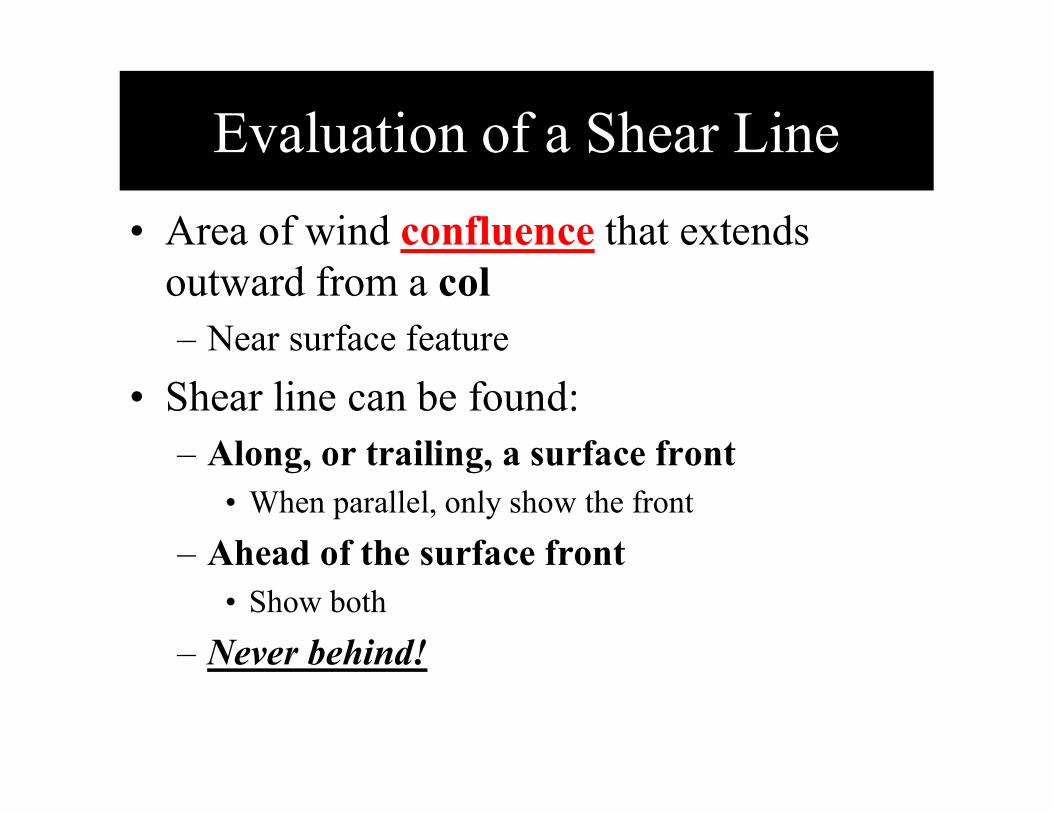
Evaluation of a Shear Line
• Area of wind confluence that extends outward from a col– Near surface feature
• Shear line can be found:– Along, or trailing, a surface front
• When parallel, only show the front
– Ahead of the surface front• Show both
– Never behind!
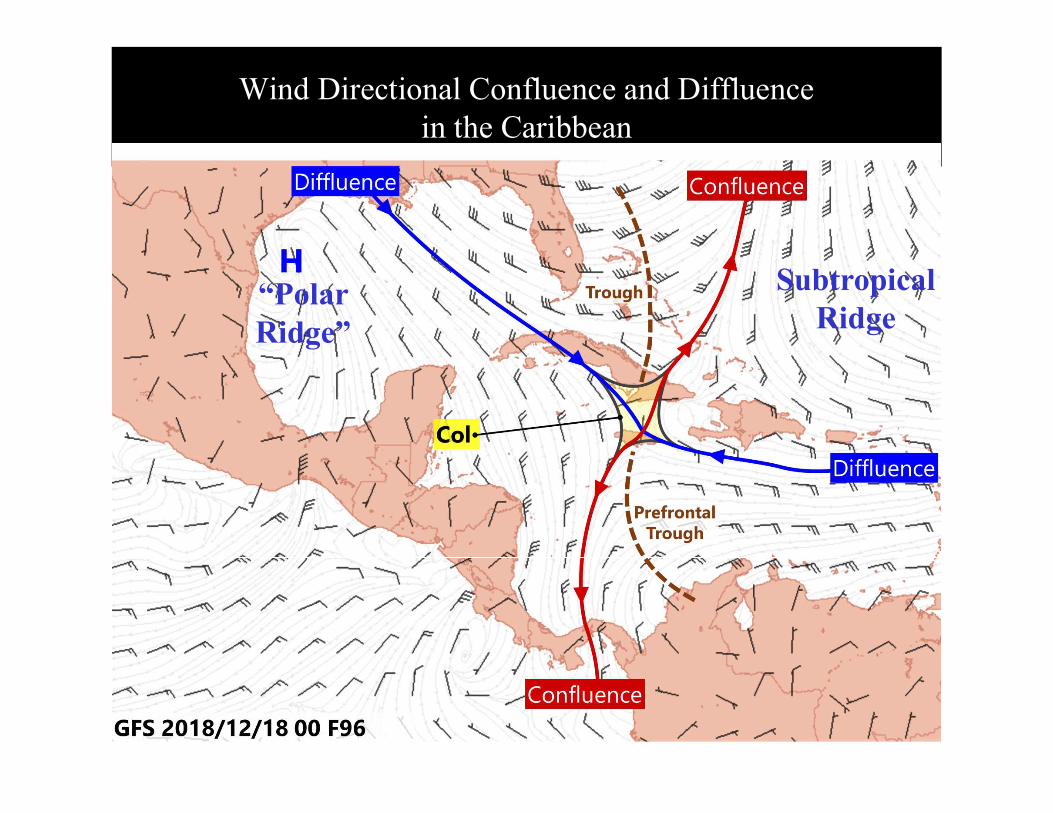
Wind Directional Confluence and Diffluence in the Caribbean
“Polar Ridge”
Subtropical Ridge
Wind Divergence
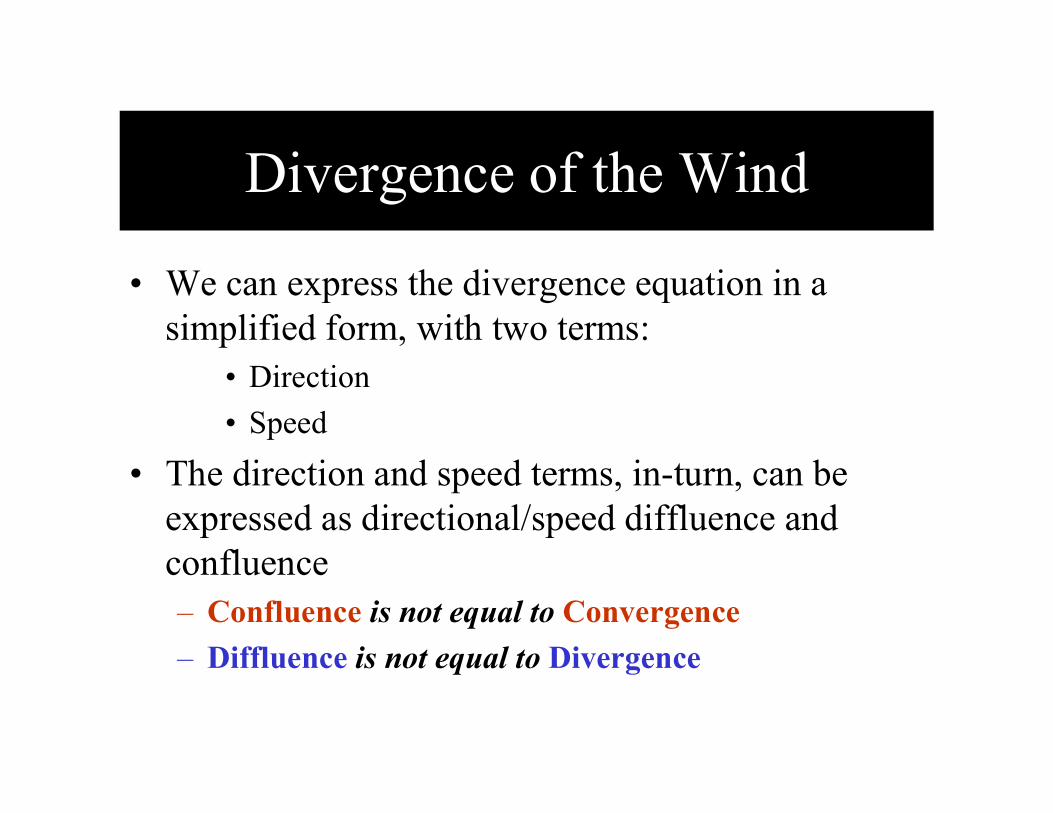
Divergence of the Wind
• We can express the divergence equation in a simplified form, with two terms:
• Direction
• Speed
• The direction and speed terms, in-turn, can be expressed as directional/speed diffluence and confluence– Confluence is not equal to Convergence
– Diffluence is not equal to Divergence

Divergence (Cont.)
• Divergence/convergence calculations need to take into account the direction and speed terms.– This is done through objective analysis
• Streamline analysis is a subjectivetechnique, and it only shows directional diffluence and confluence.– It does not show convergence/divergence
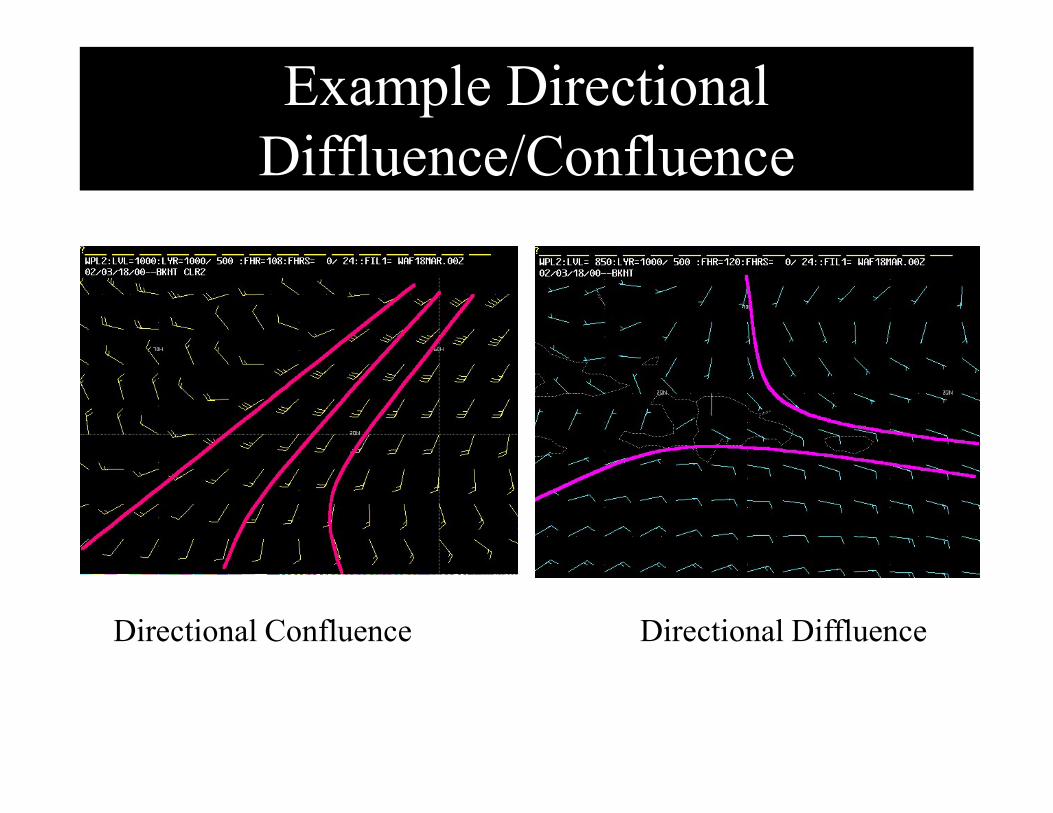
Example Directional Diffluence/Confluence
Directional Confluence Directional Diffluence
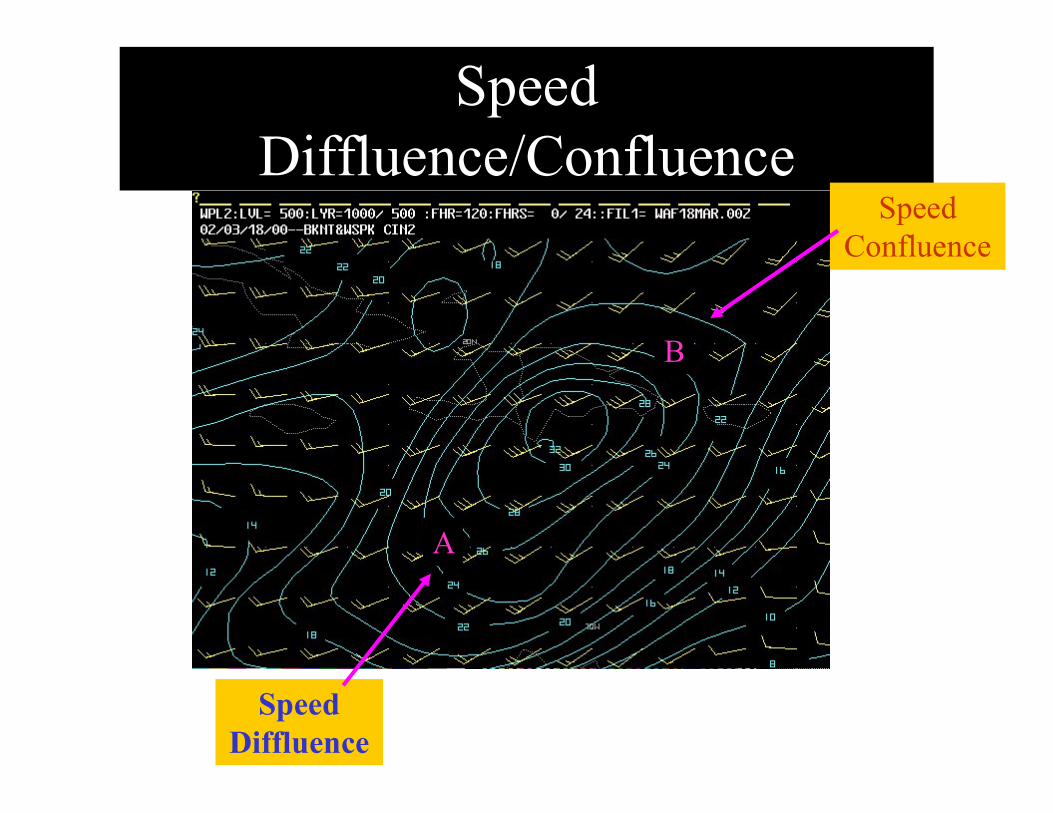
Speed Diffluence/Confluence
Speed Diffluence
Speed Confluence
A
B

Poll Question #10(Select all that apply)
• Streamline analysis considers the speed and directional terms
• Streamline analysis only considers the direction
• Diffluence equals divergence
• Diffluence equals convergence
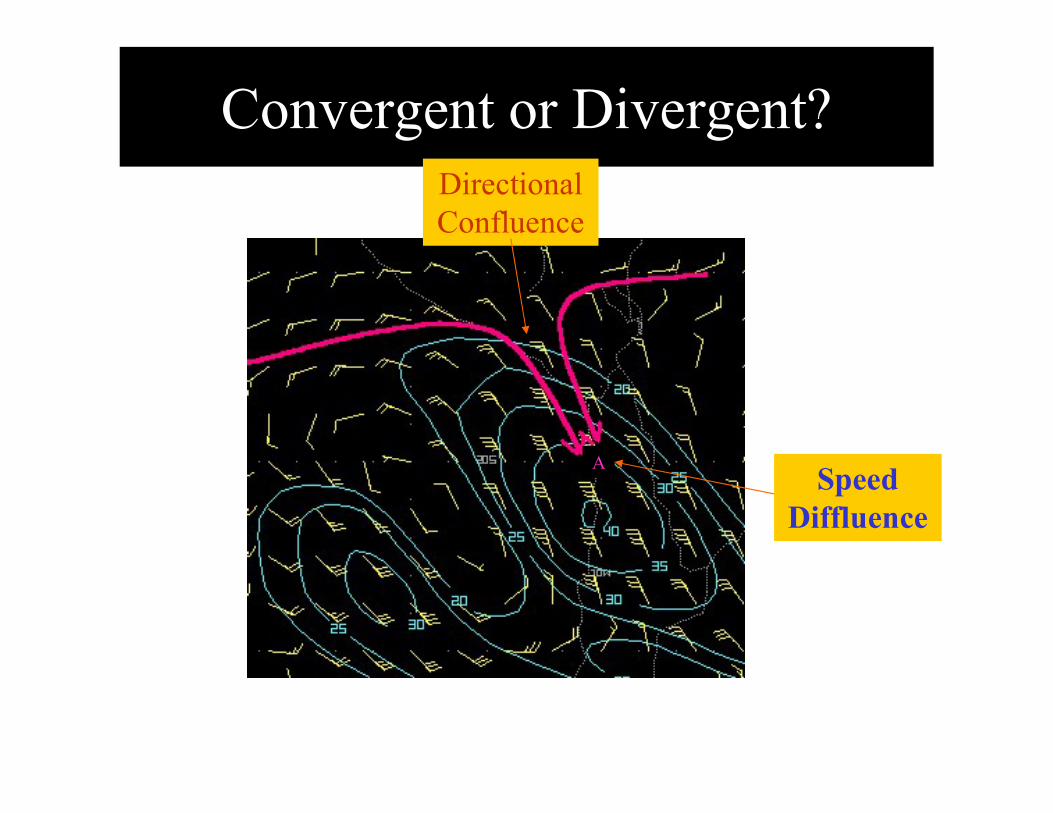
Convergent or Divergent?
A
Directional Confluence
Speed Diffluence
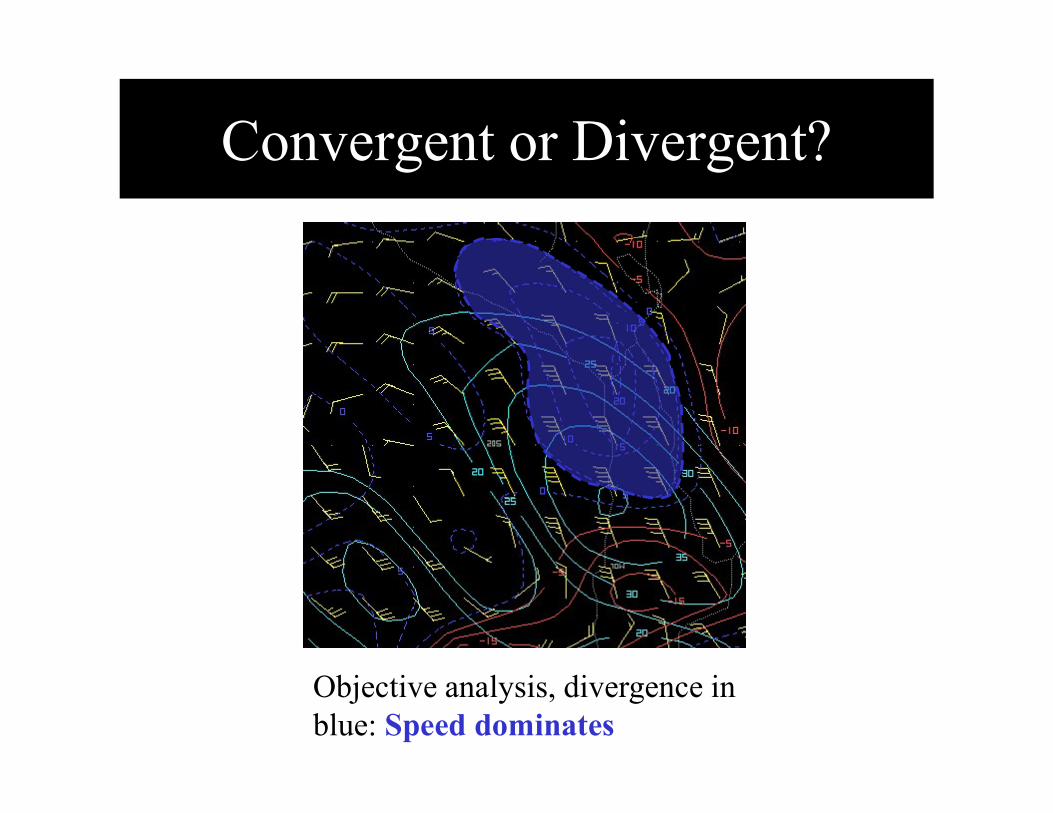
Convergent or Divergent?
Objective analysis, divergence in blue: Speed dominates
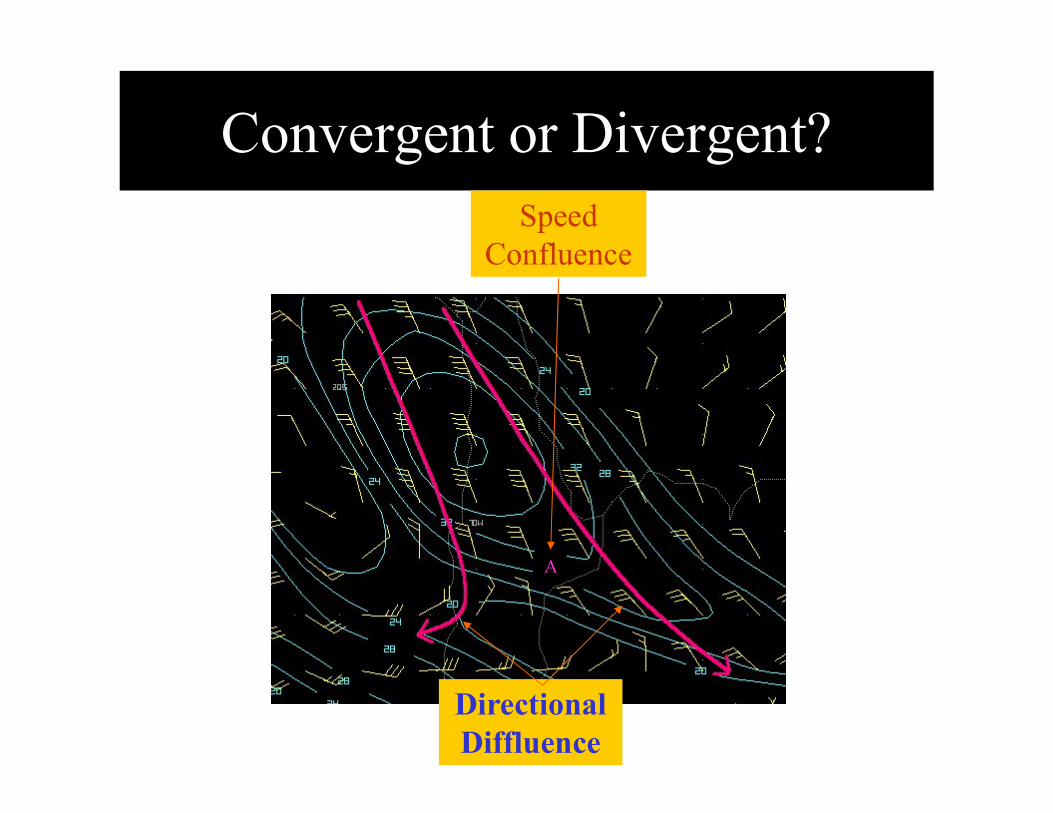
Convergent or Divergent?
A
Directional Diffluence
Speed Confluence
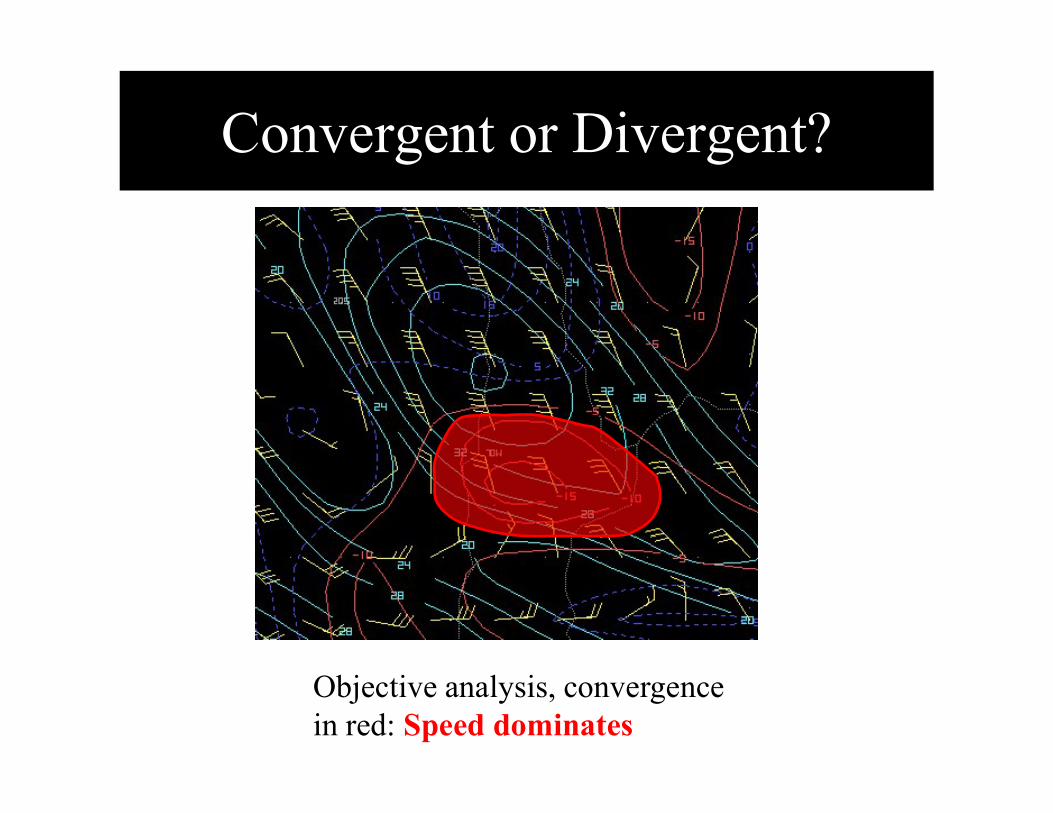
Convergent or Divergent?
Objective analysis, convergence in red: Speed dominates
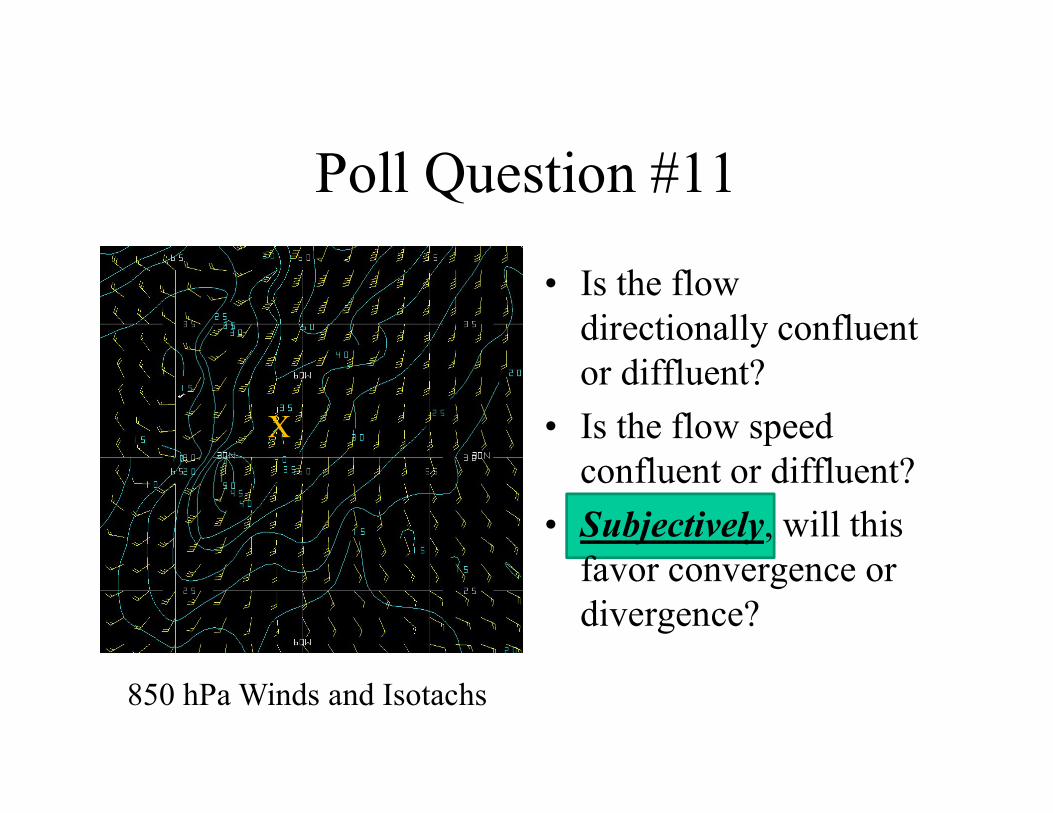
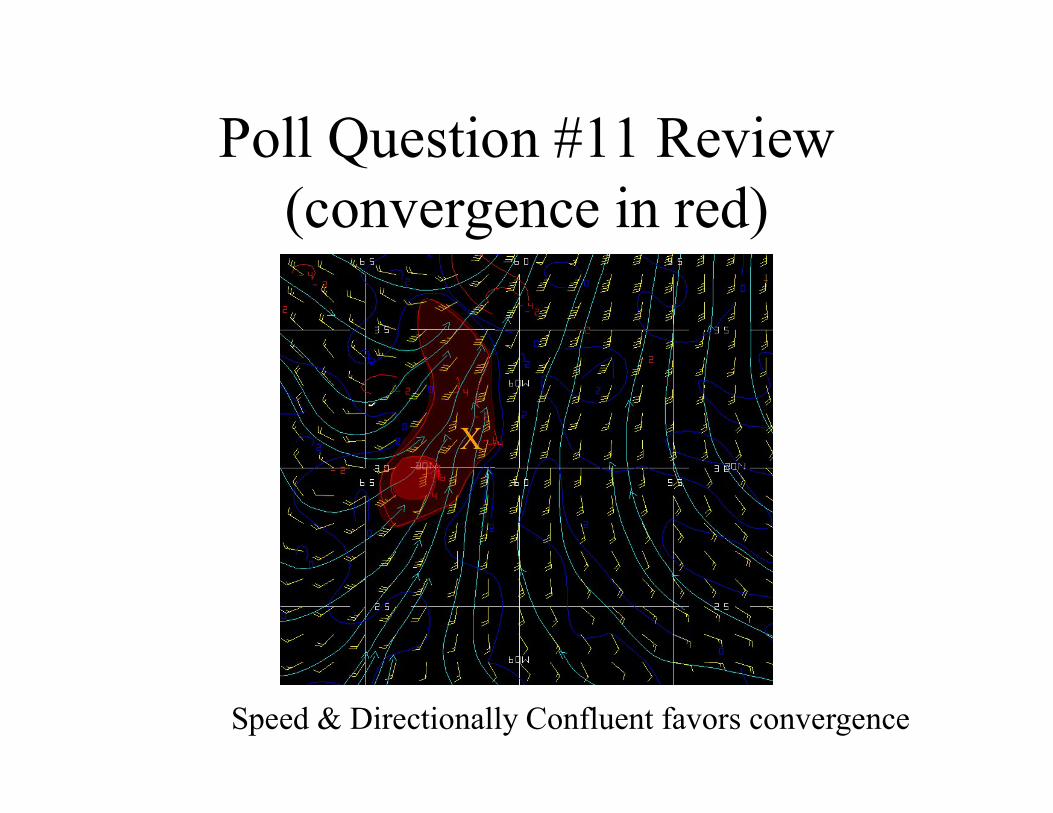
Poll Question #11
• Is the flow directionally confluent or diffluent?
• Is the flow speed confluent or diffluent?
• Subjectively, will this favor convergence or divergence?
X
850 hPa Winds and Isotachs
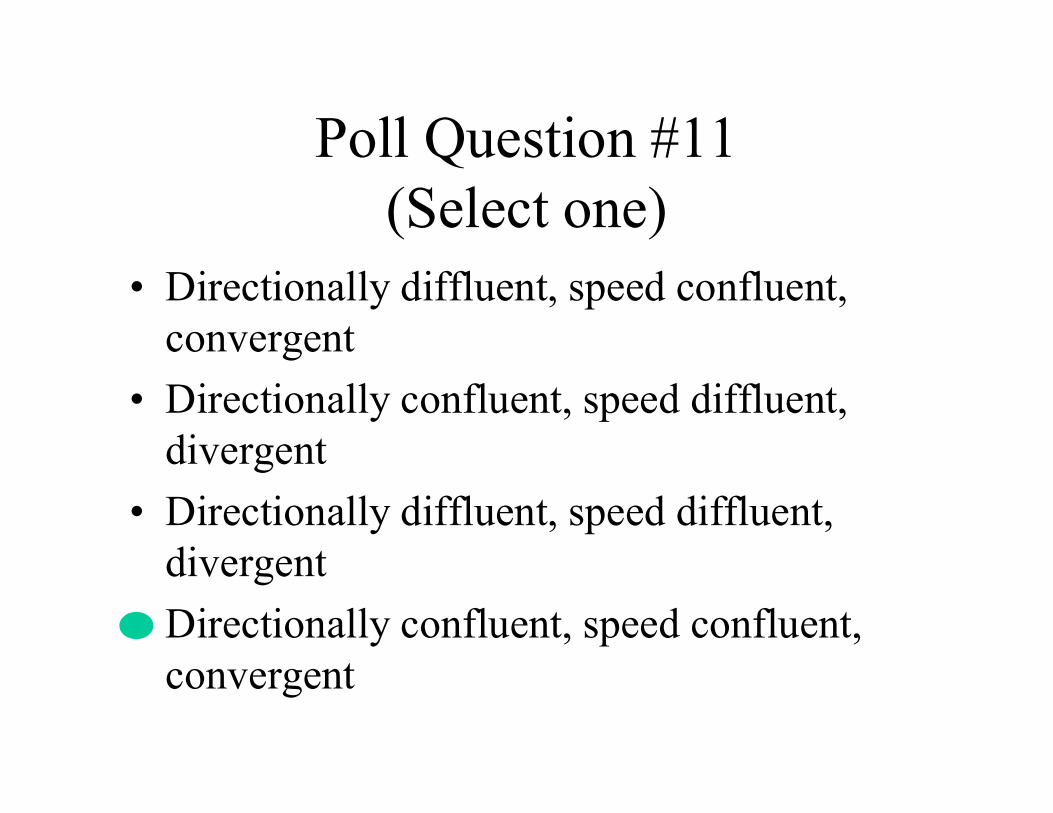
Poll Question #11(Select one)
• Directionally diffluent, speed confluent, convergent
• Directionally confluent, speed diffluent, divergent
• Directionally diffluent, speed diffluent, divergent
• Directionally confluent, speed confluent, convergent
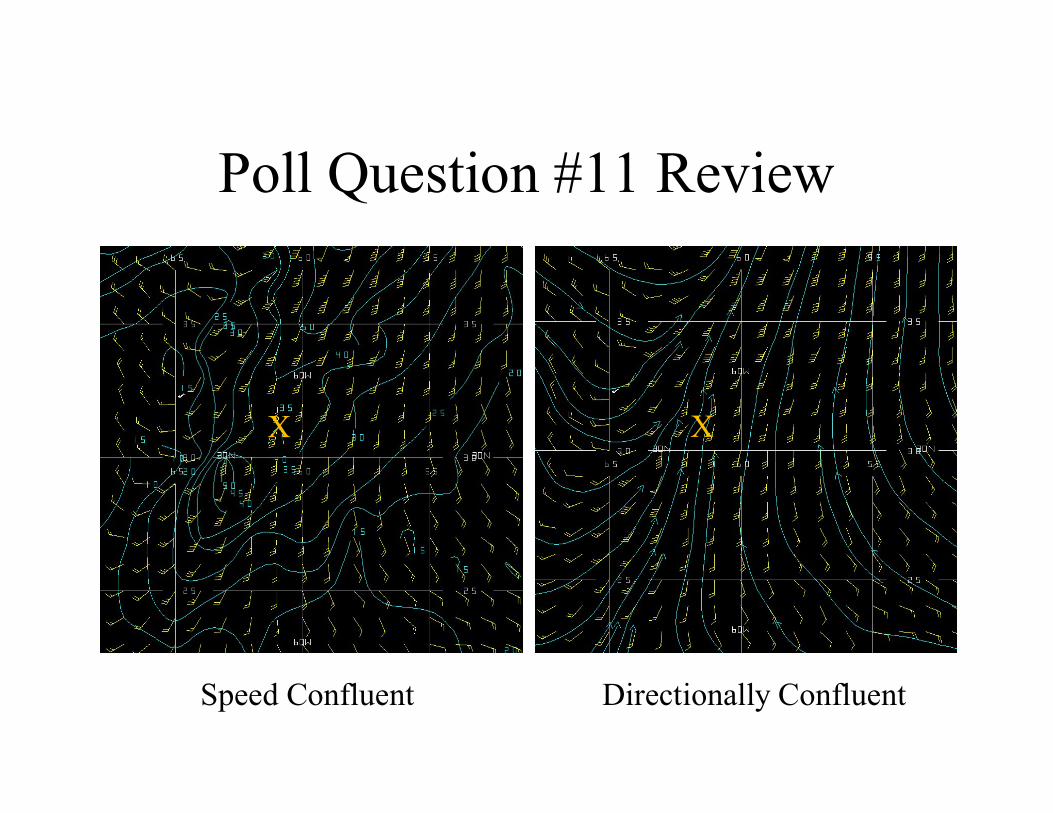
Poll Question #11 Review
X
Speed Confluent Directionally Confluent
X
Poll Question #11 Review(convergence in red)
Speed & Directionally Confluent favors convergence
X
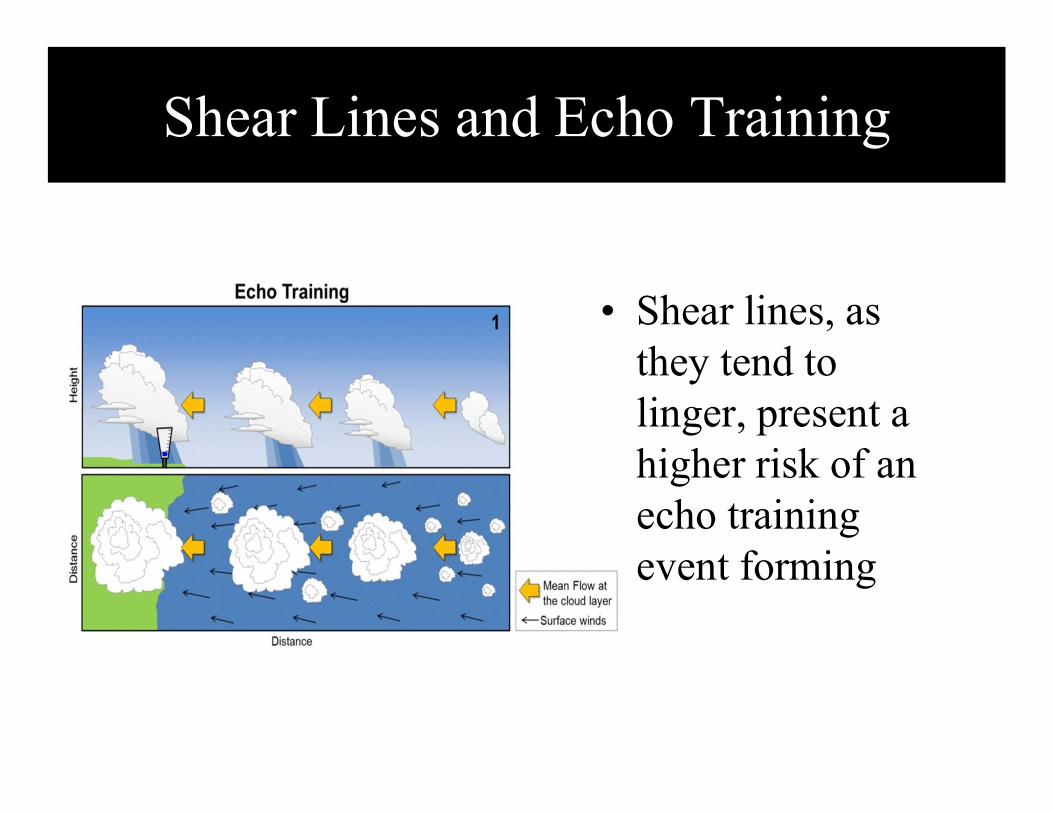
Shear Lines and Echo Training
• Shear lines, as they tend to linger, present a higher risk of an echo training event forming
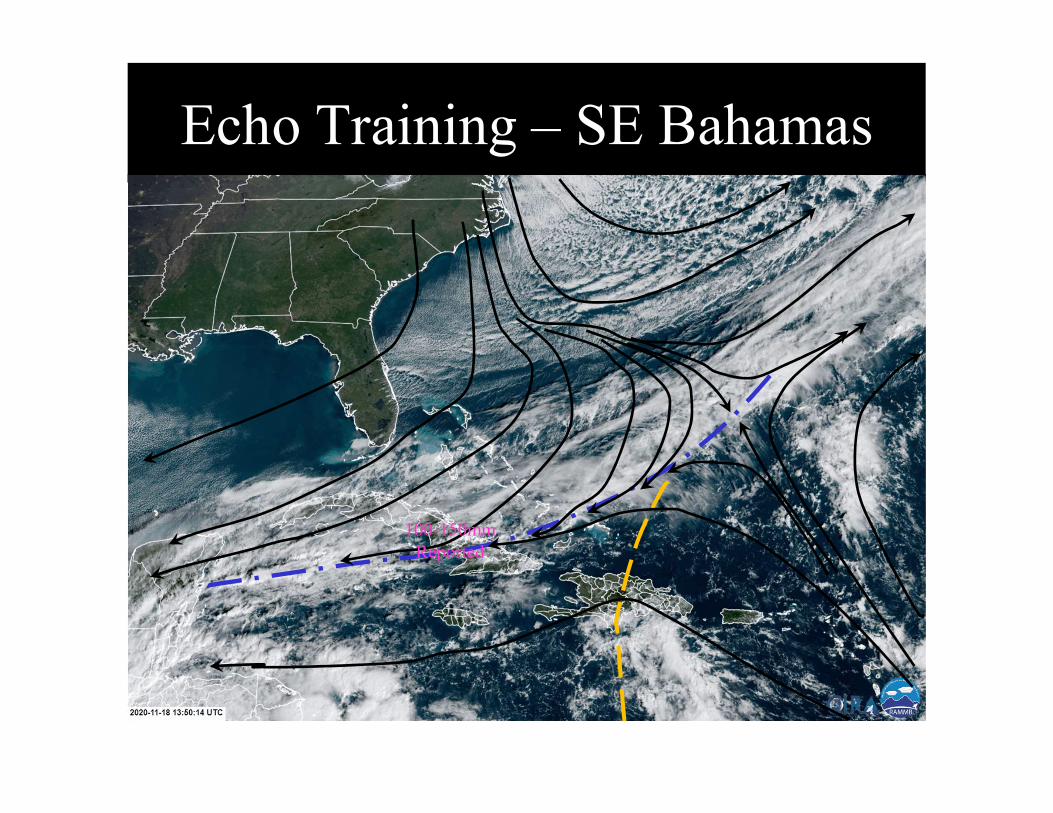
Echo Training – SE Bahamas
100-150mm Reported
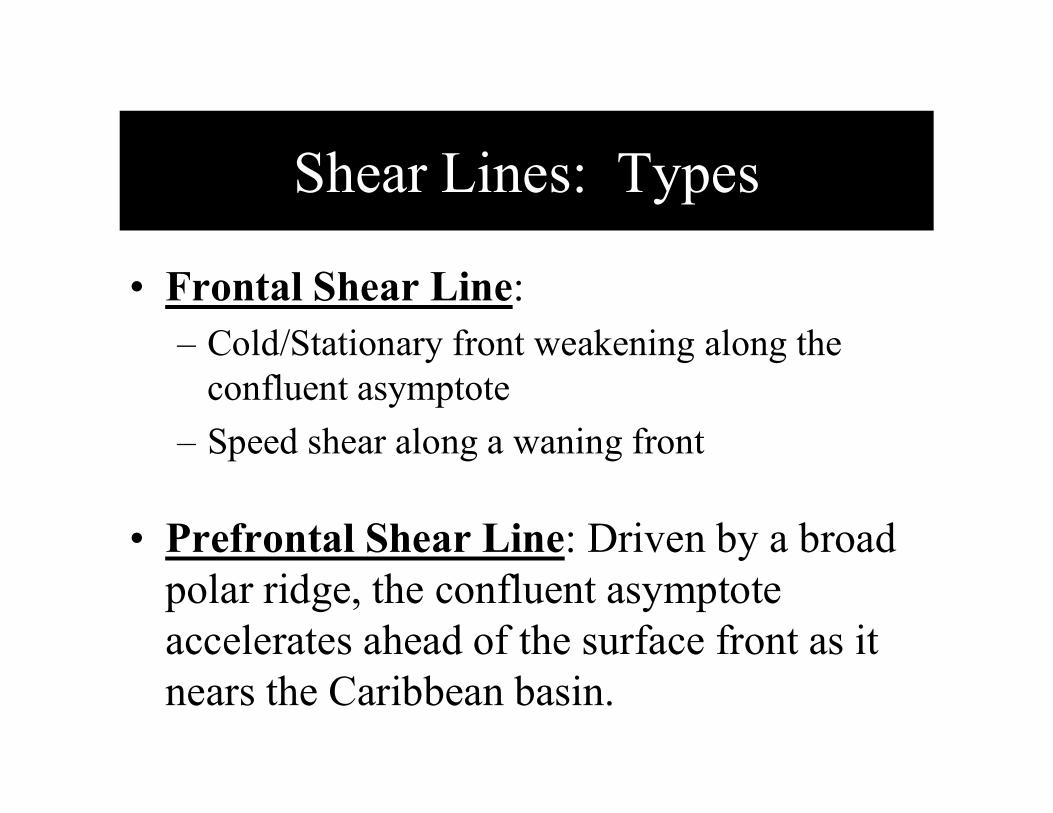
Shear Lines: Types
• Frontal Shear Line: – Cold/Stationary front weakening along the
confluent asymptote
– Speed shear along a waning front
• Prefrontal Shear Line: Driven by a broad polar ridge, the confluent asymptote accelerates ahead of the surface front as it nears the Caribbean basin.
Frontal Shear Line
Wind Confluence Induced

Evolution of a Frontal Shear LineFront parallel to confluent asymptote
H
L
PrefrontalTrough
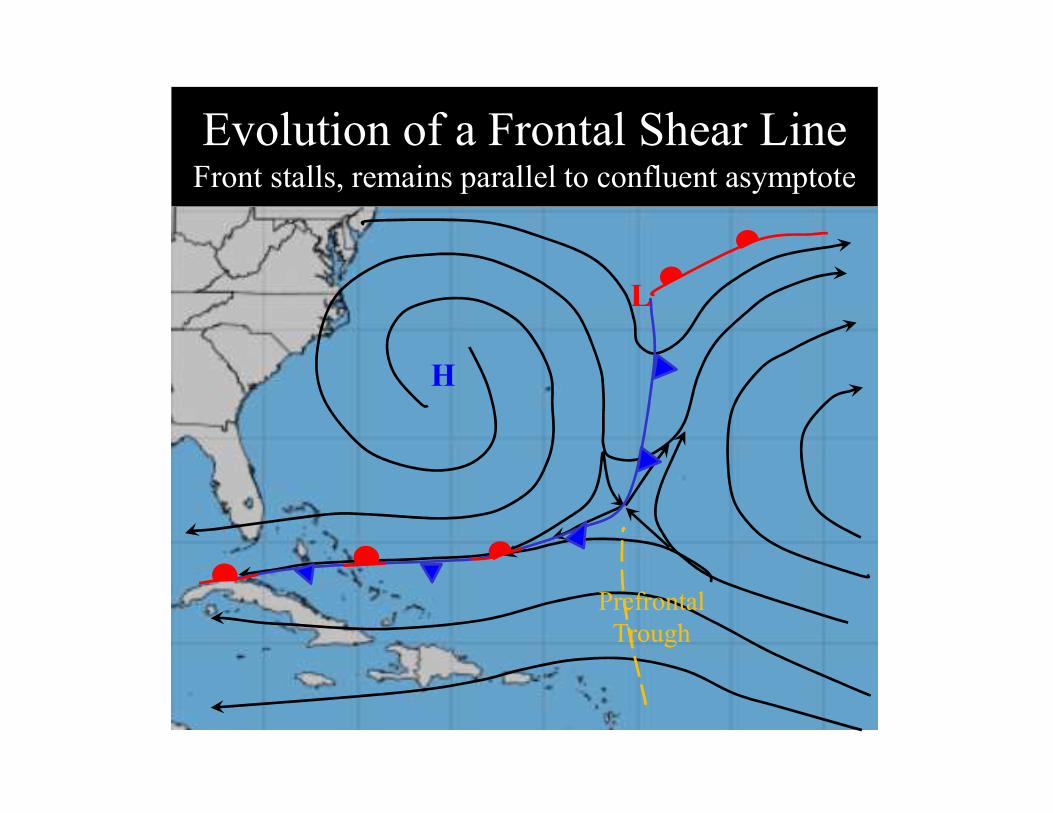
Evolution of a Frontal Shear LineFront stalls, remains parallel to confluent asymptote
H
L
PrefrontalTrough
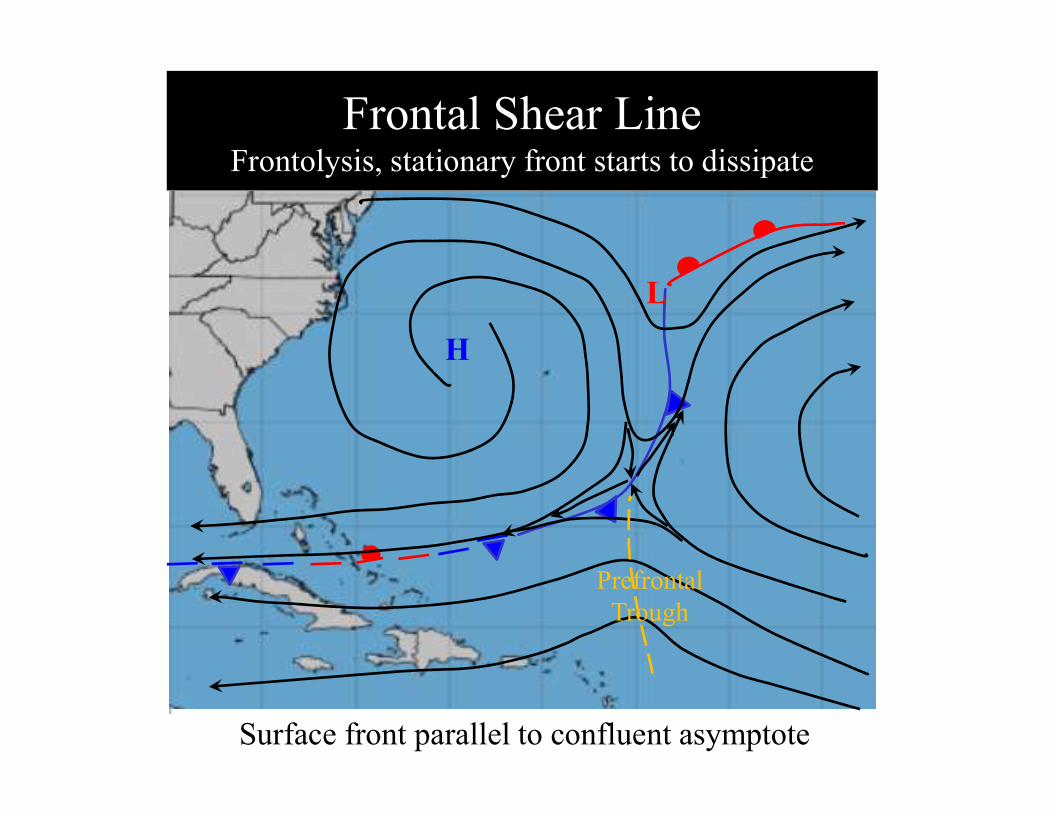
Frontal Shear LineFrontolysis, stationary front starts to dissipate
L
Surface front parallel to confluent asymptote
H
PrefrontalTrough
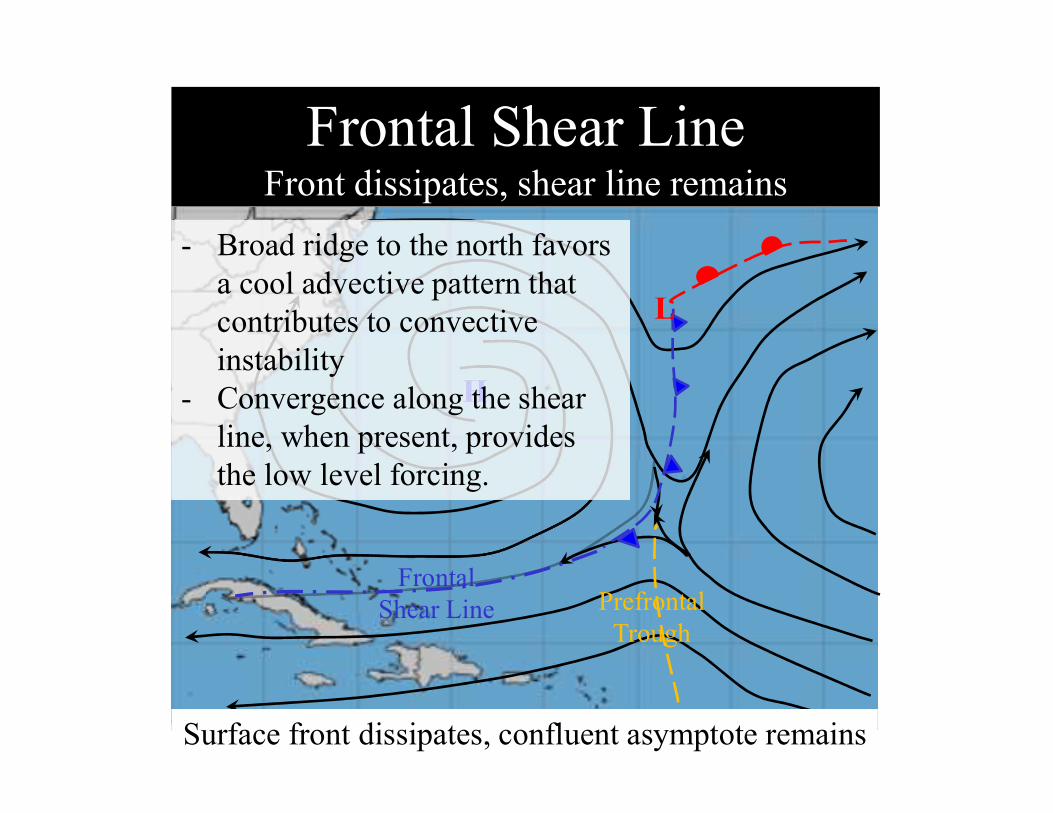
Frontal Shear LineFront dissipates, shear line remains
H
L
Surface front dissipates, confluent asymptote remains
- Broad ridge to the north favors a cool advective pattern that contributes to convective instability
- Convergence along the shear line, when present, provides the low level forcing.
FrontalShear Line Prefrontal
Trough
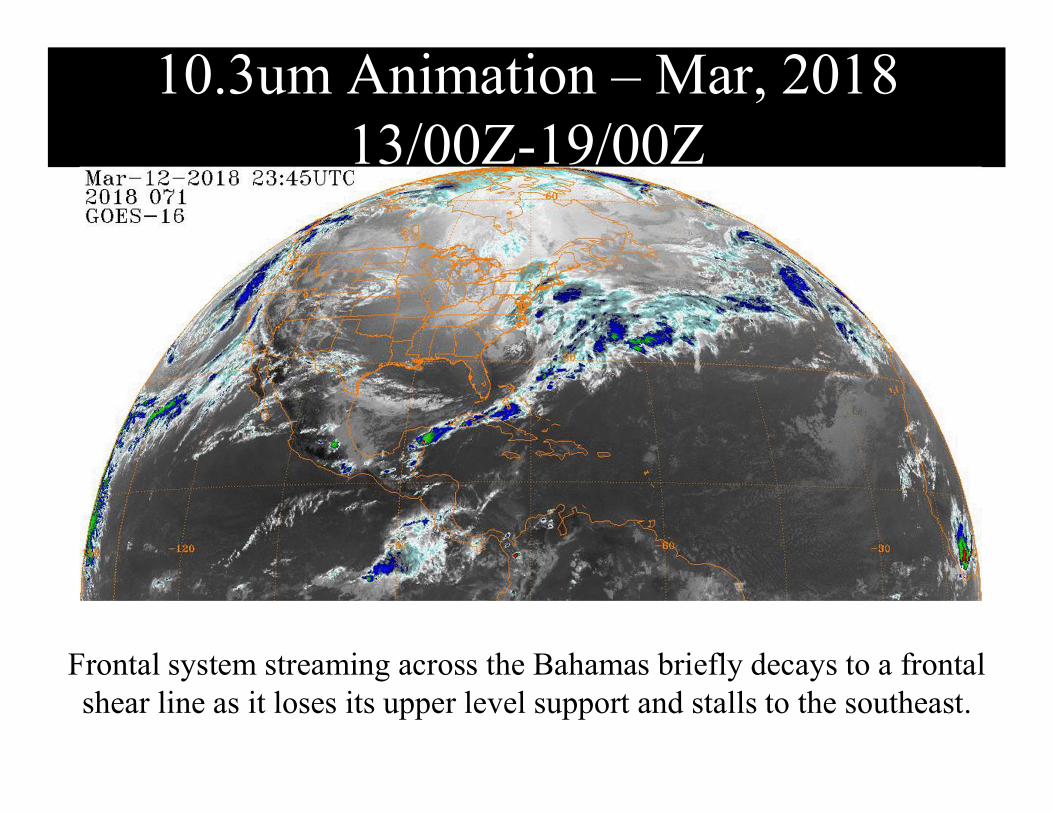
10.3um Animation – Mar, 2018 13/00Z-19/00Z
Frontal system streaming across the Bahamas briefly decays to a frontal shear line as it loses its upper level support and stalls to the southeast.
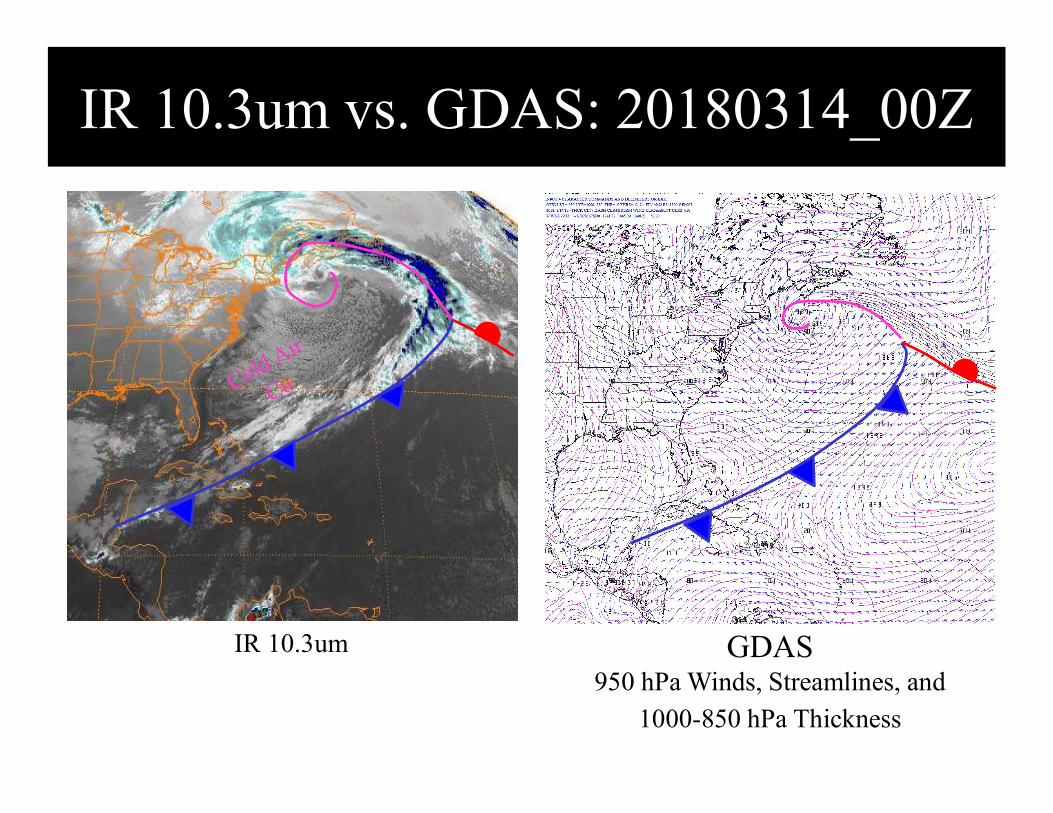
IR 10.3um vs. GDAS: 20180314_00Z
IR 10.3um GDAS950 hPa Winds, Streamlines, and
1000-850 hPa Thickness
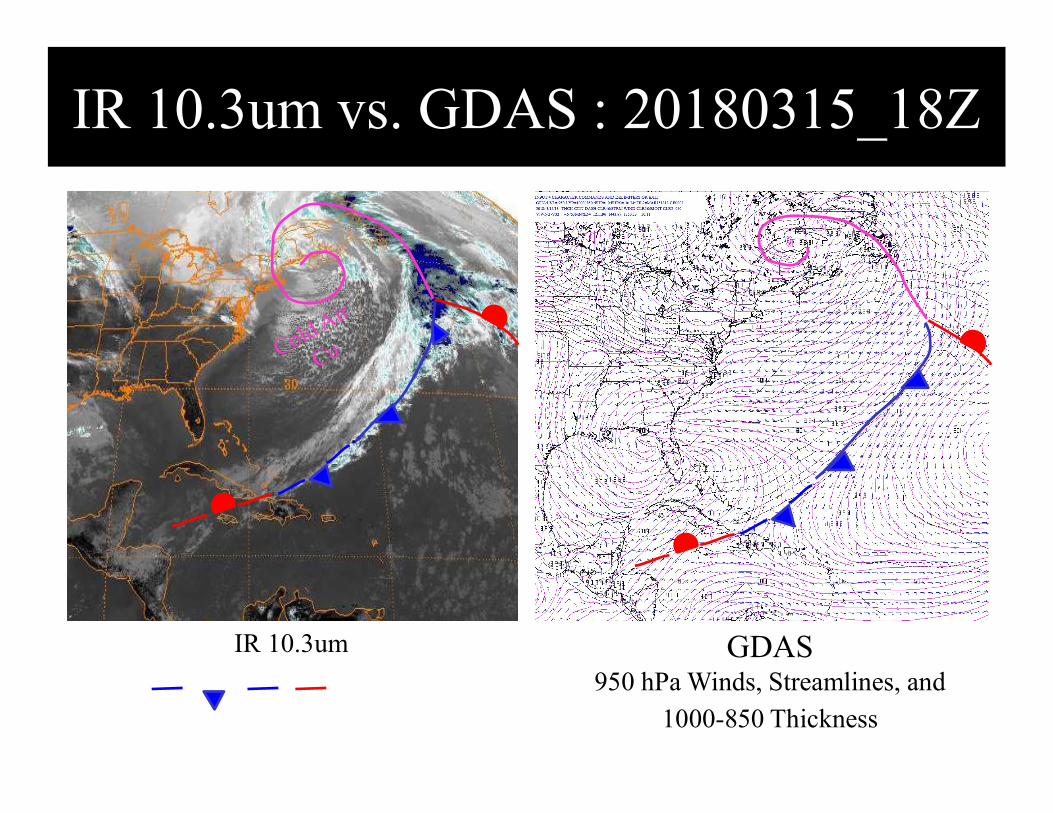
IR 10.3um vs. GDAS : 20180315_18Z
IR 10.3um GDAS950 hPa Winds, Streamlines, and
1000-850 Thickness
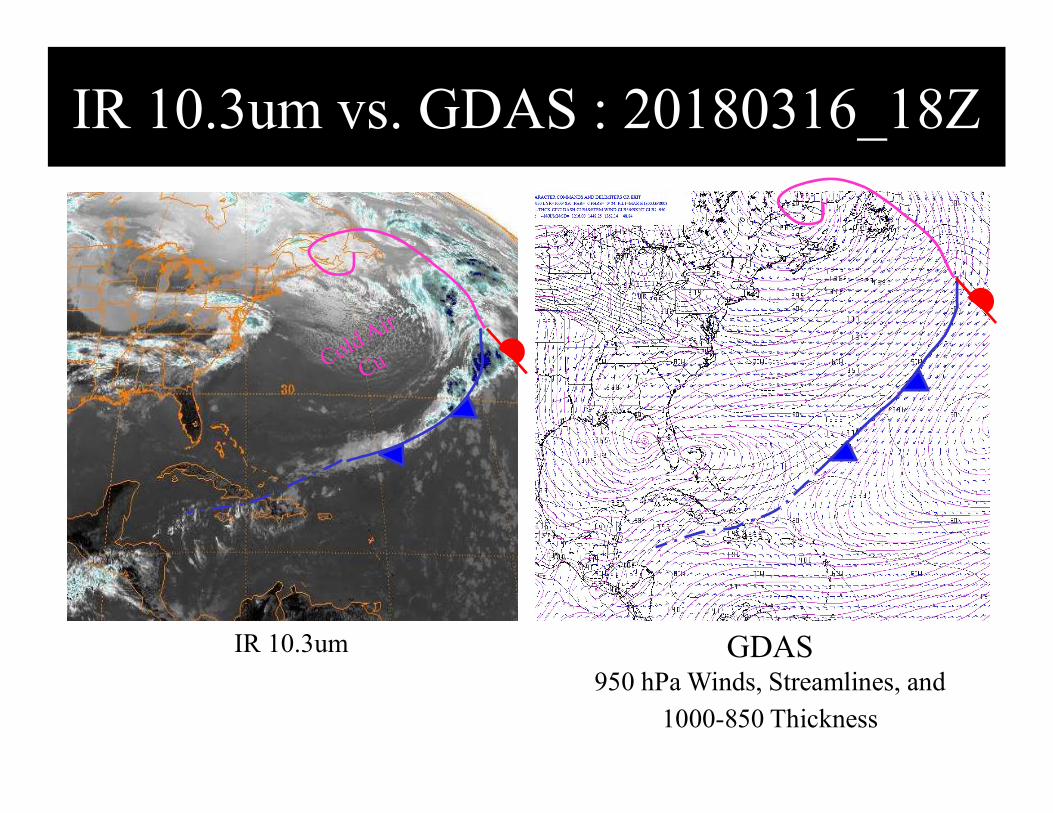
IR 10.3um vs. GDAS : 20180316_18Z
IR 10.3um GDAS950 hPa Winds, Streamlines, and
1000-850 Thickness
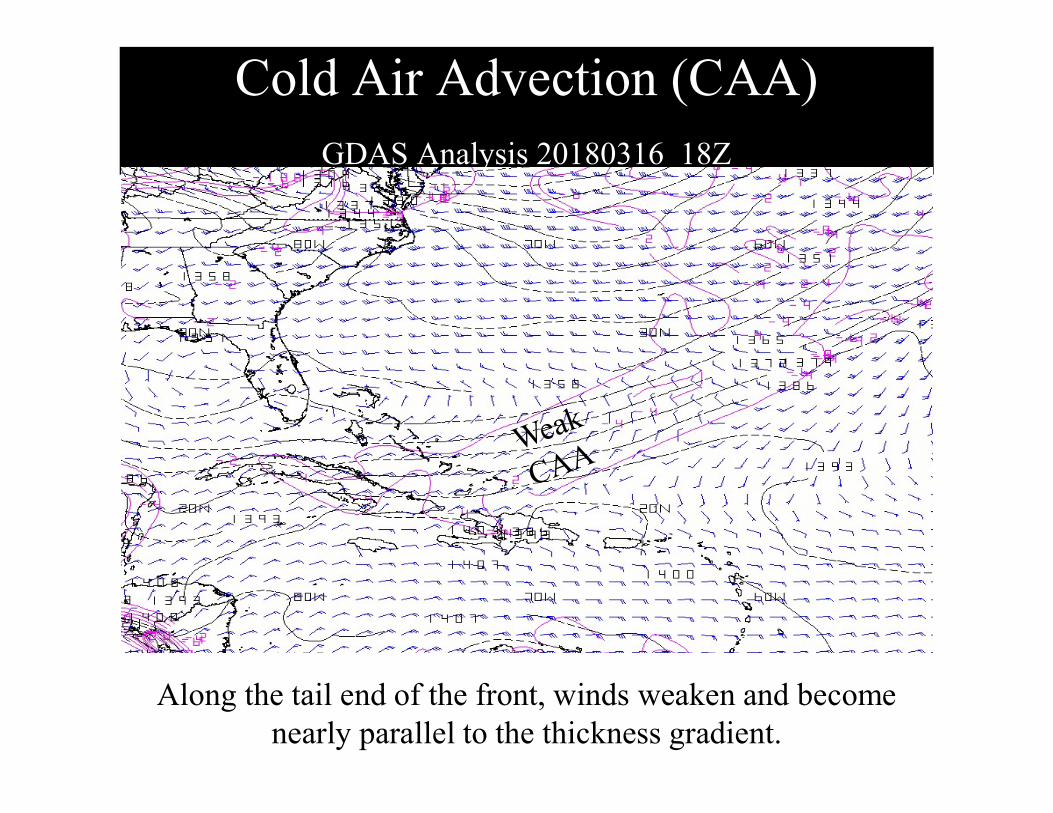
Cold Air Advection (CAA) GDAS Analysis 20180316_18Z
Along the tail end of the front, winds weaken and become nearly parallel to the thickness gradient.
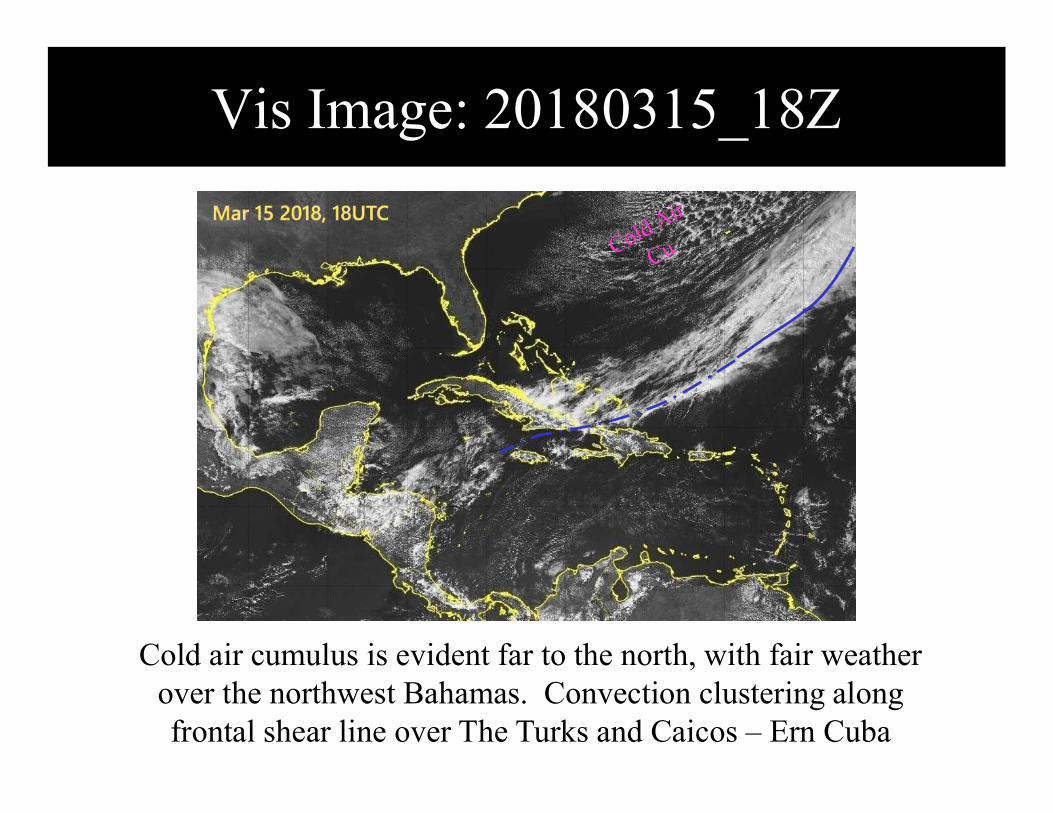
Vis Image: 20180315_18Z
Cold air cumulus is evident far to the north, with fair weather over the northwest Bahamas. Convection clustering along frontal shear line over The Turks and Caicos – Ern Cuba
Frontal Shear Line
Speed Shear Induced
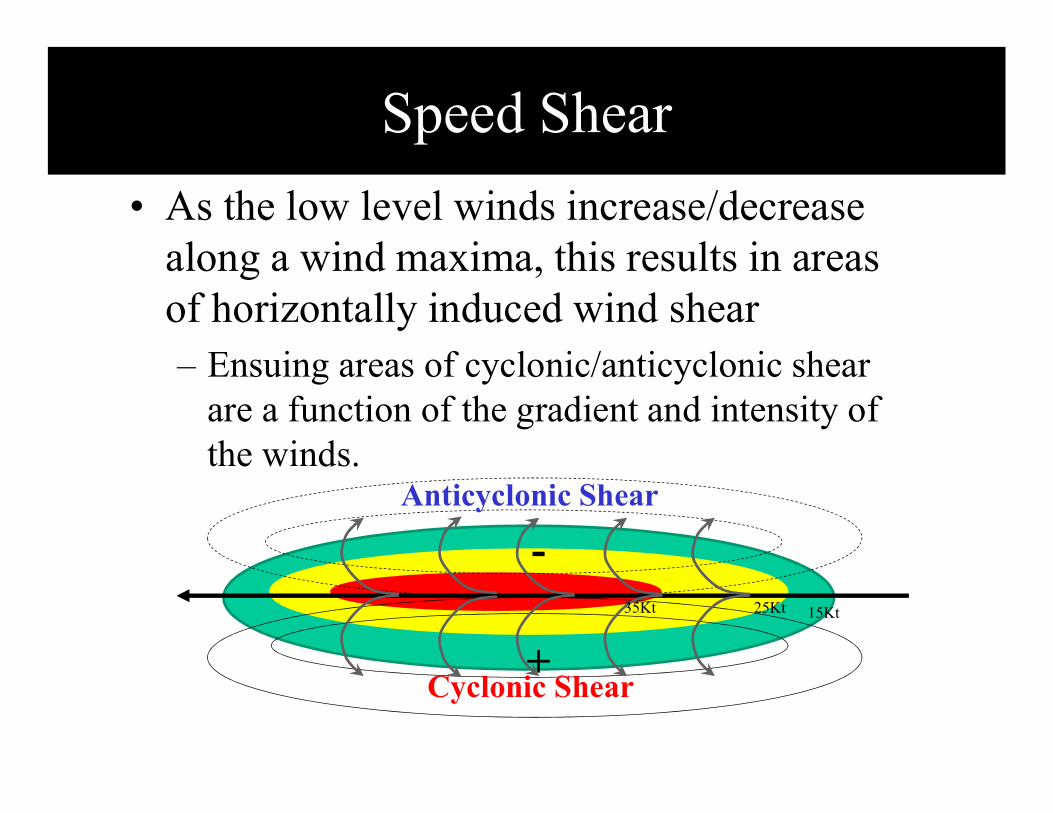
Speed Shear
• As the low level winds increase/decrease along a wind maxima, this results in areas of horizontally induced wind shear– Ensuing areas of cyclonic/anticyclonic shear
are a function of the gradient and intensity of the winds.
+
-Anticyclonic Shear
Cyclonic Shear
15Kt25Kt35Kt
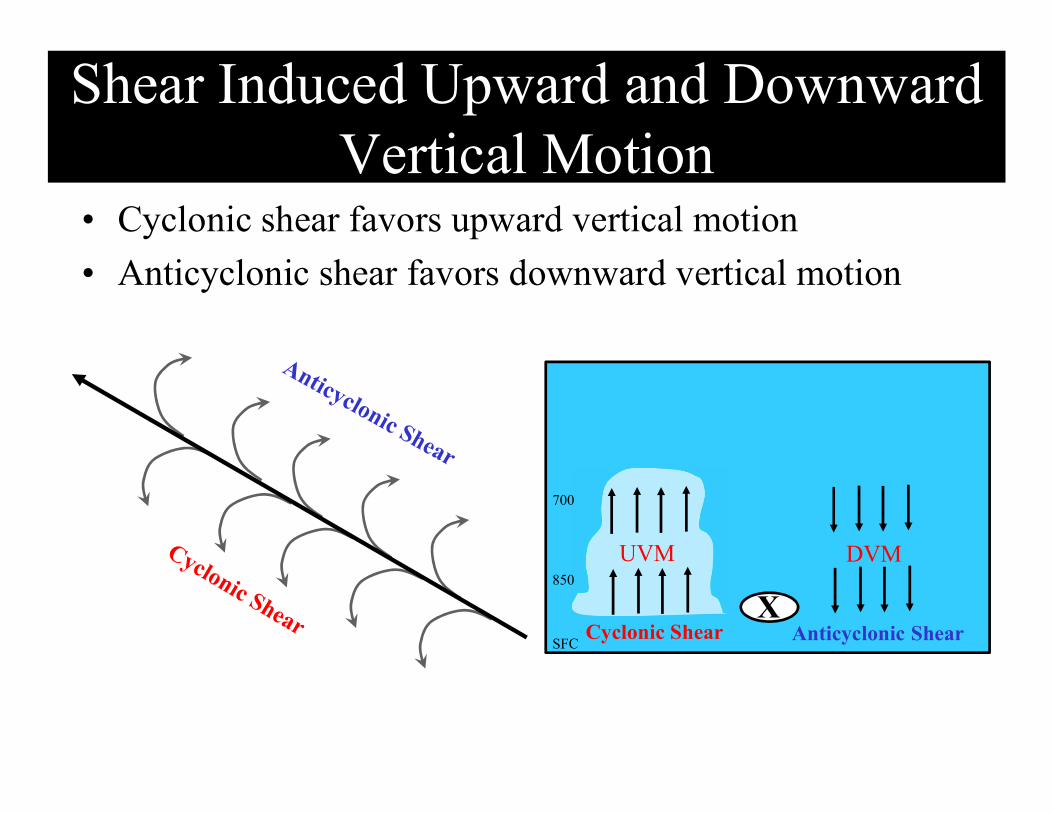
Shear Induced Upward and Downward Vertical Motion
• Cyclonic shear favors upward vertical motion
• Anticyclonic shear favors downward vertical motion
XAnticyclonic ShearCyclonic Shear
UVM DVM
SFC
850
700
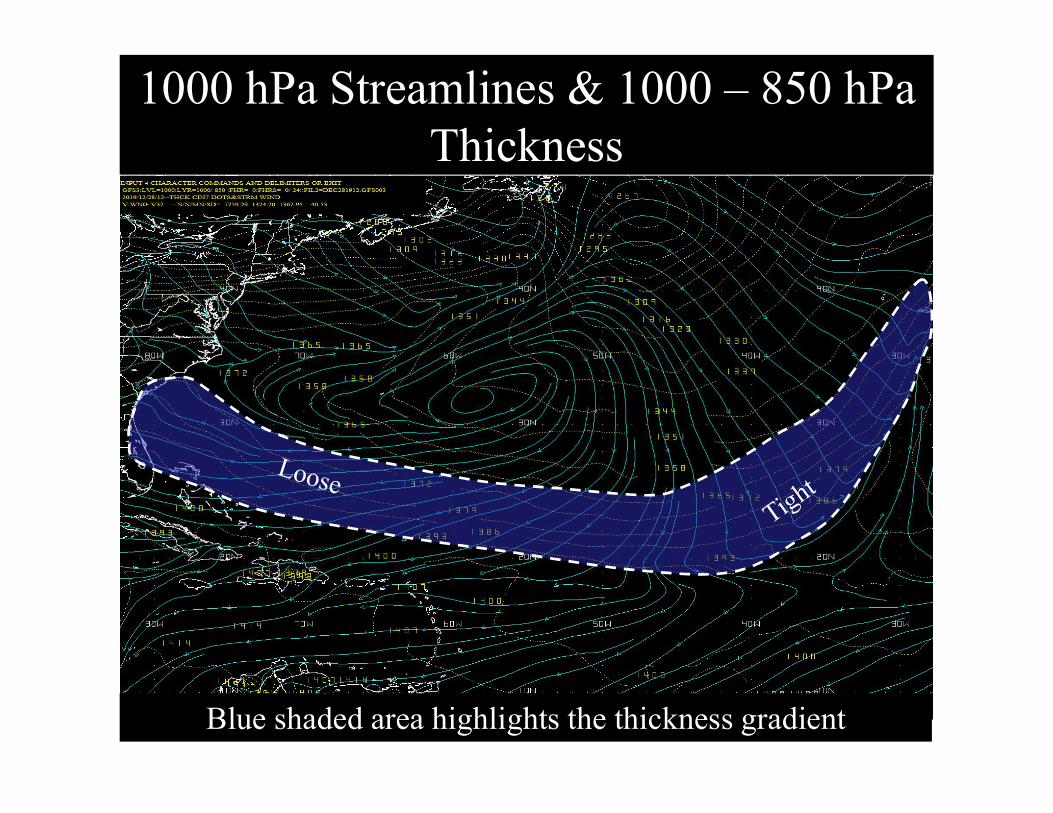
1000 hPa Streamlines & 1000 – 850 hPa Thickness
Blue shaded area highlights the thickness gradient
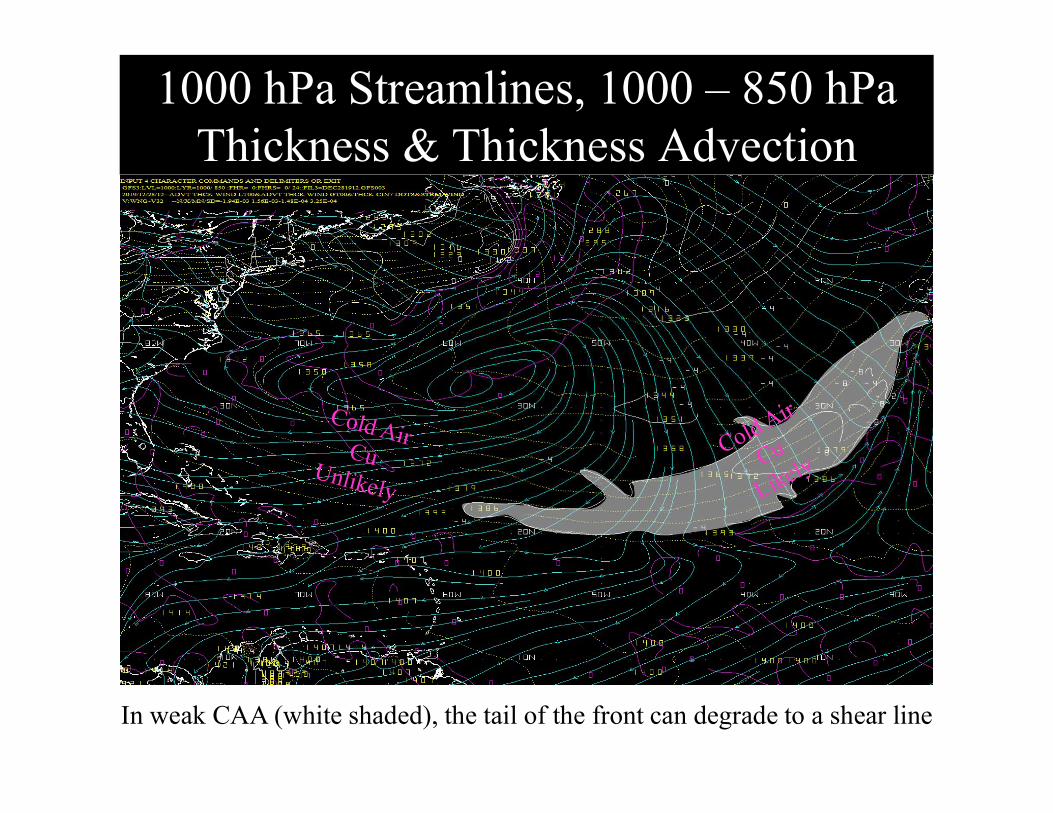
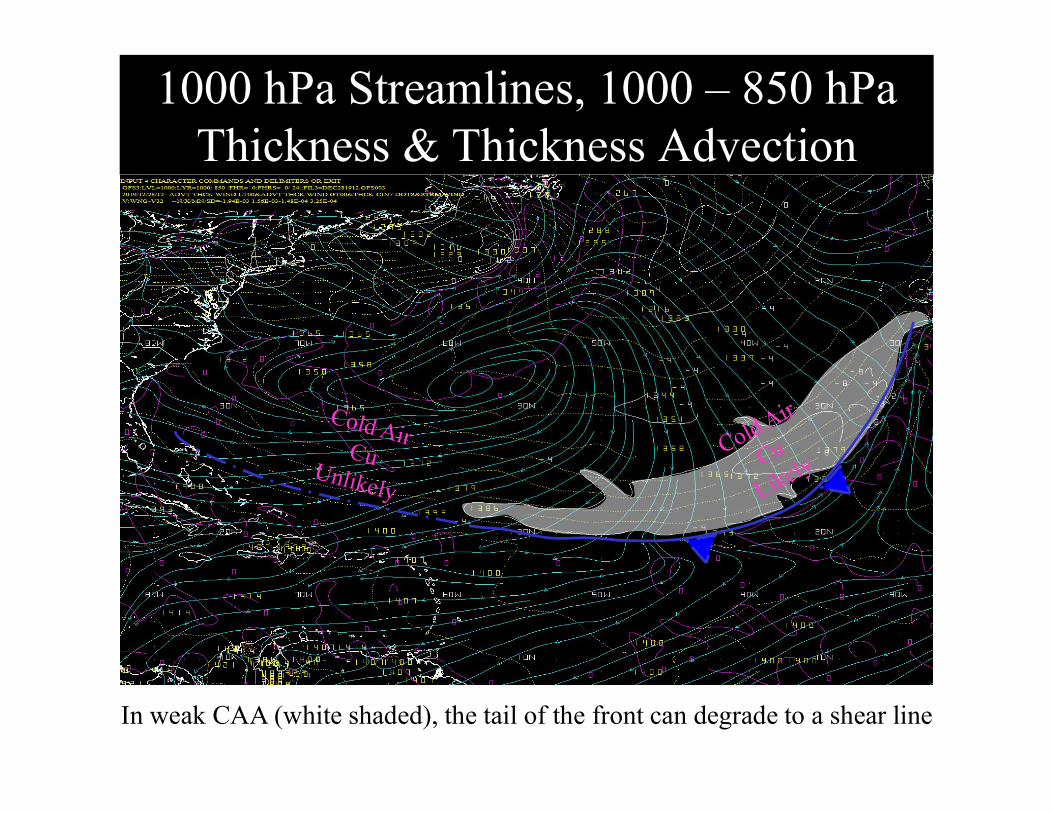
1000 hPa Streamlines, 1000 – 850 hPa Thickness & Thickness Advection
In weak CAA (white shaded), the tail of the front can degrade to a shear line
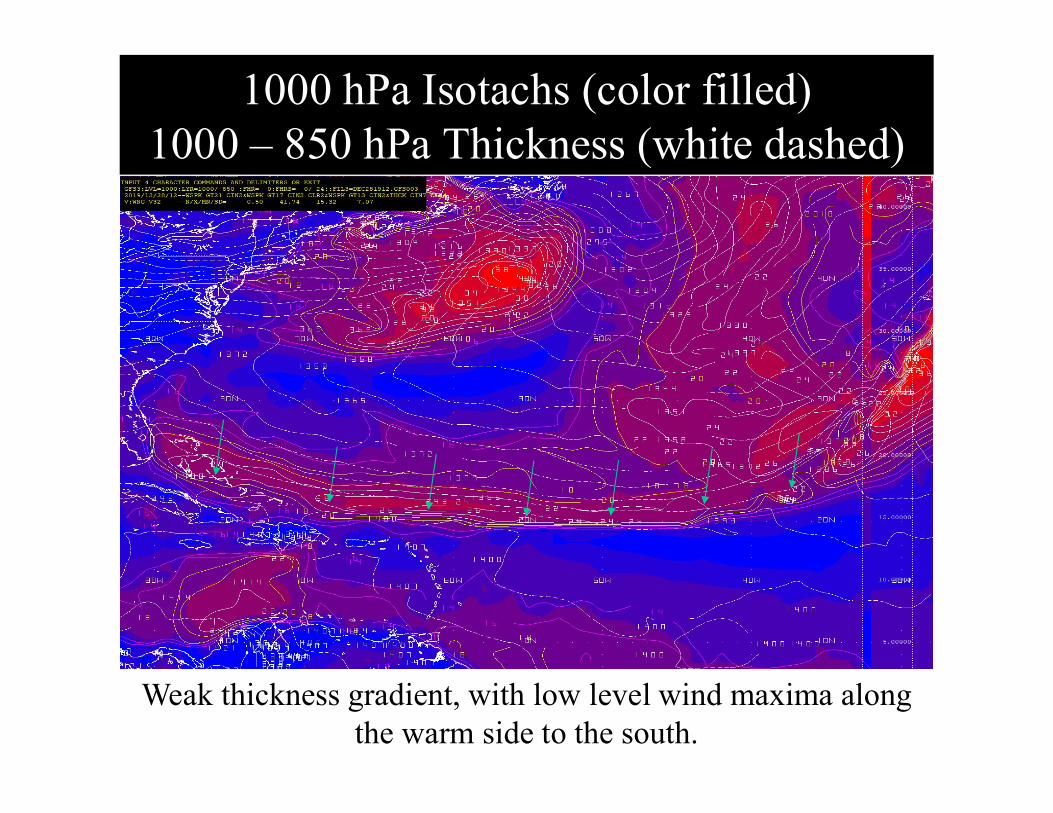
1000 hPa Isotachs (color filled) 1000 – 850 hPa Thickness (white dashed)
Weak thickness gradient, with low level wind maxima along the warm side to the south.
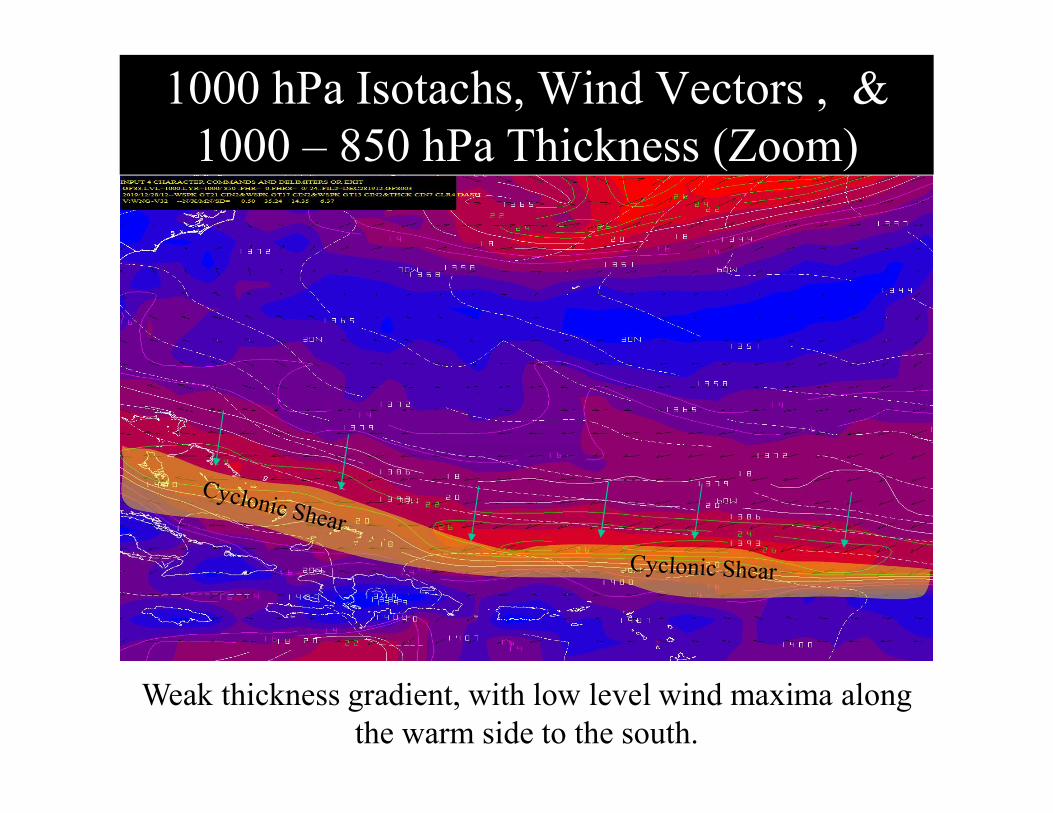
1000 hPa Isotachs, Wind Vectors , & 1000 – 850 hPa Thickness (Zoom)
Weak thickness gradient, with low level wind maxima along the warm side to the south.
1000 hPa Streamlines, 1000 – 850 hPa Thickness & Thickness Advection
In weak CAA (white shaded), the tail of the front can degrade to a shear line
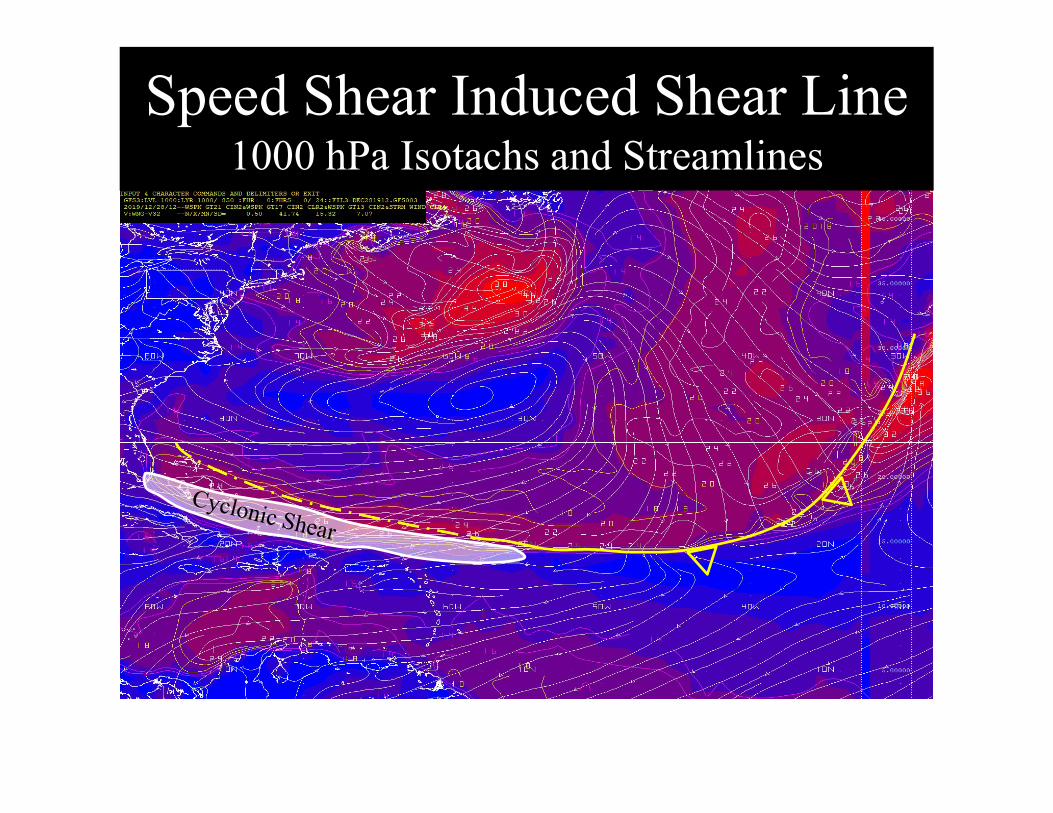
Speed Shear Induced Shear Line1000 hPa Isotachs and Streamlines
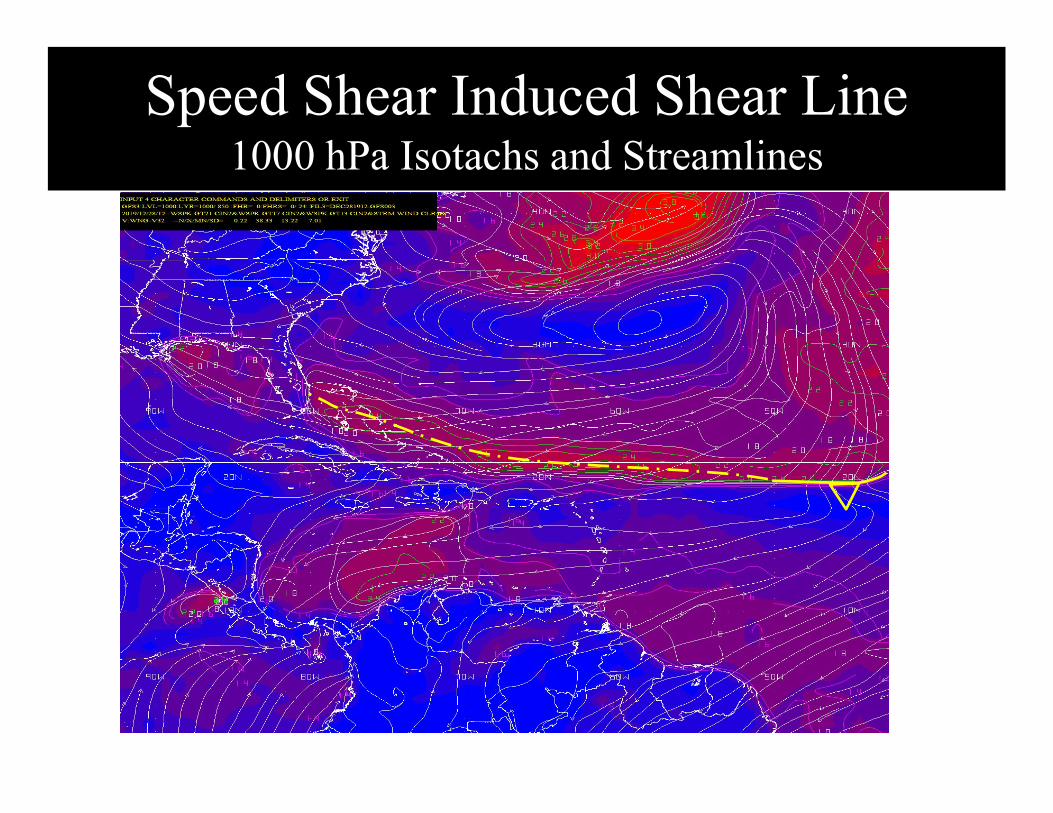
Speed Shear Induced Shear Line1000 hPa Isotachs and Streamlines
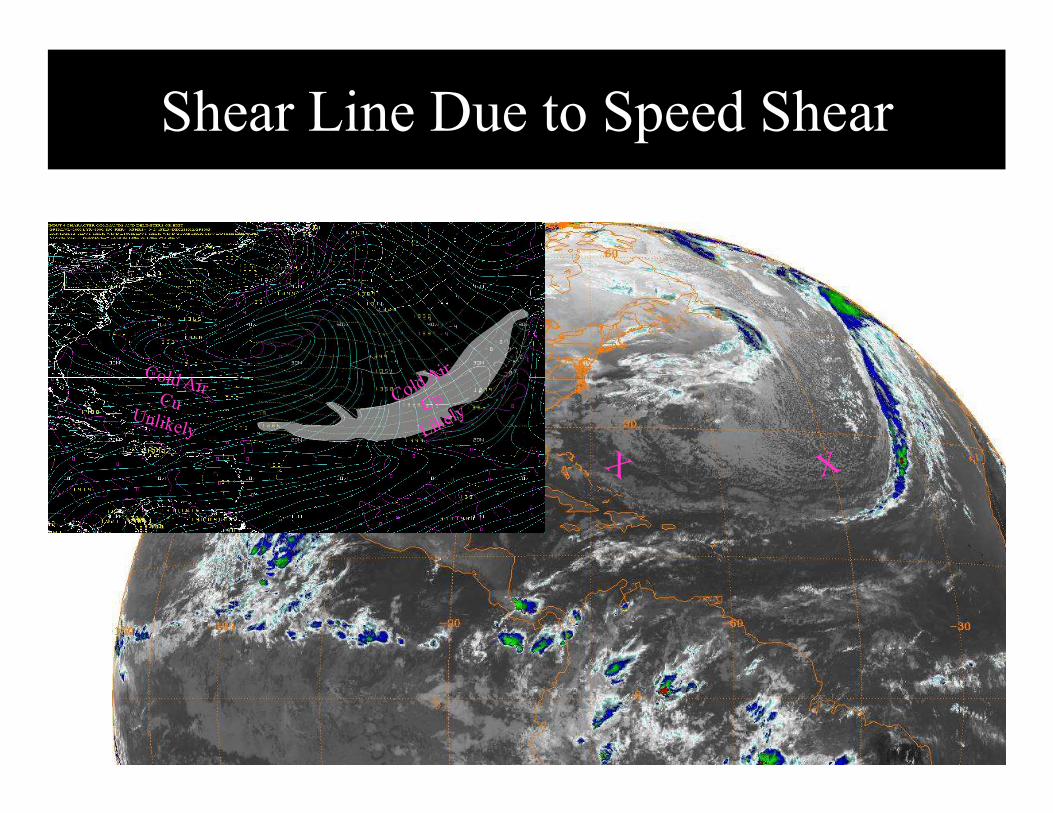
Shear Line Due to Speed Shear
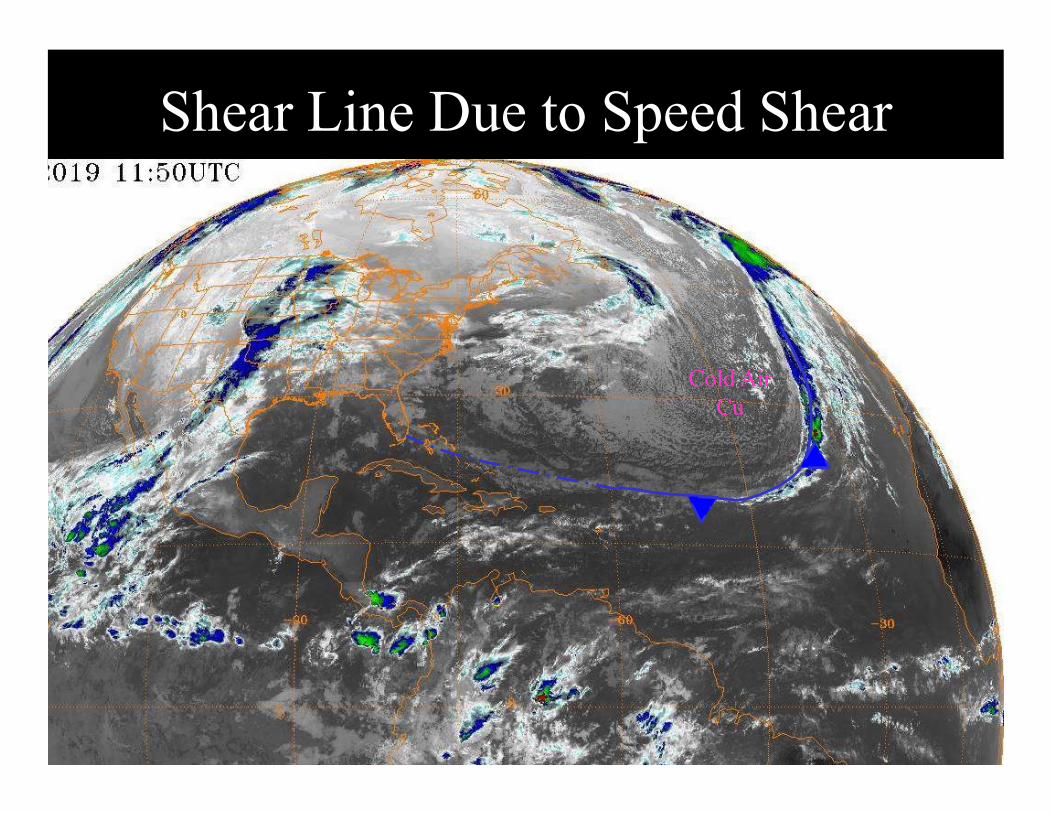
Shear Line Due to Speed Shear
Cold Air Cu
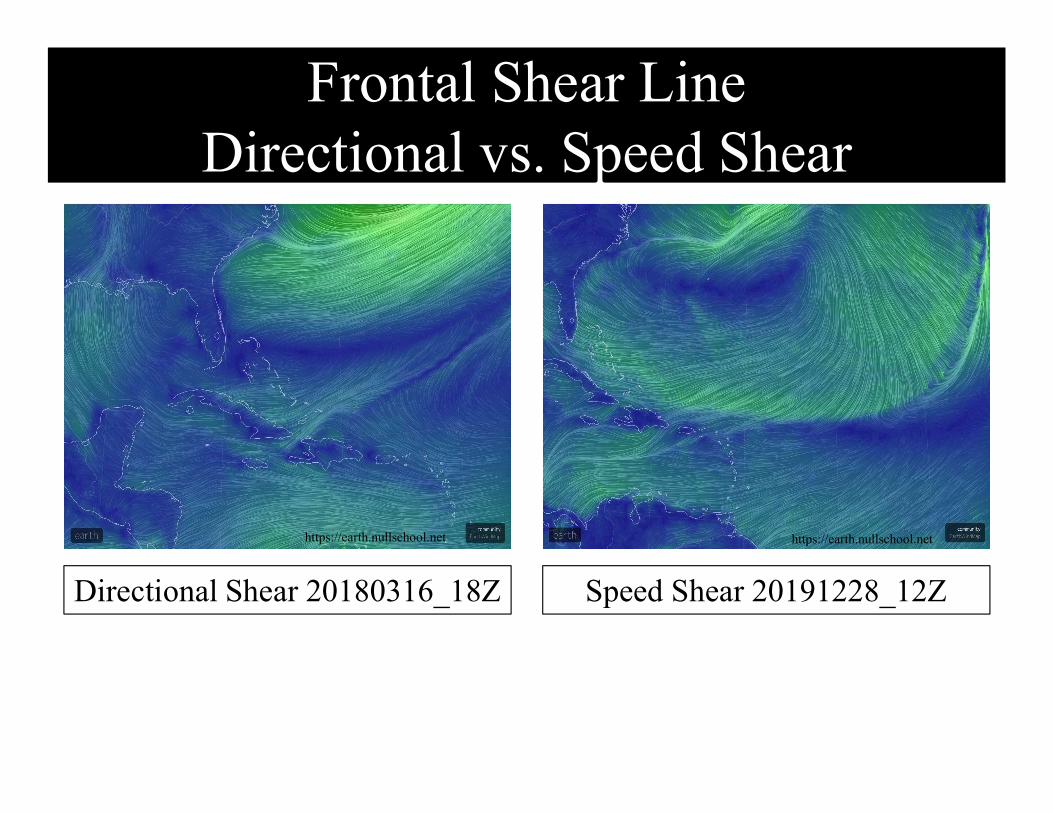
Frontal Shear LineDirectional vs. Speed Shear
Directional Shear 20180316_18Z Speed Shear 20191228_12Z
https://earth.nullschool.net https://earth.nullschool.net
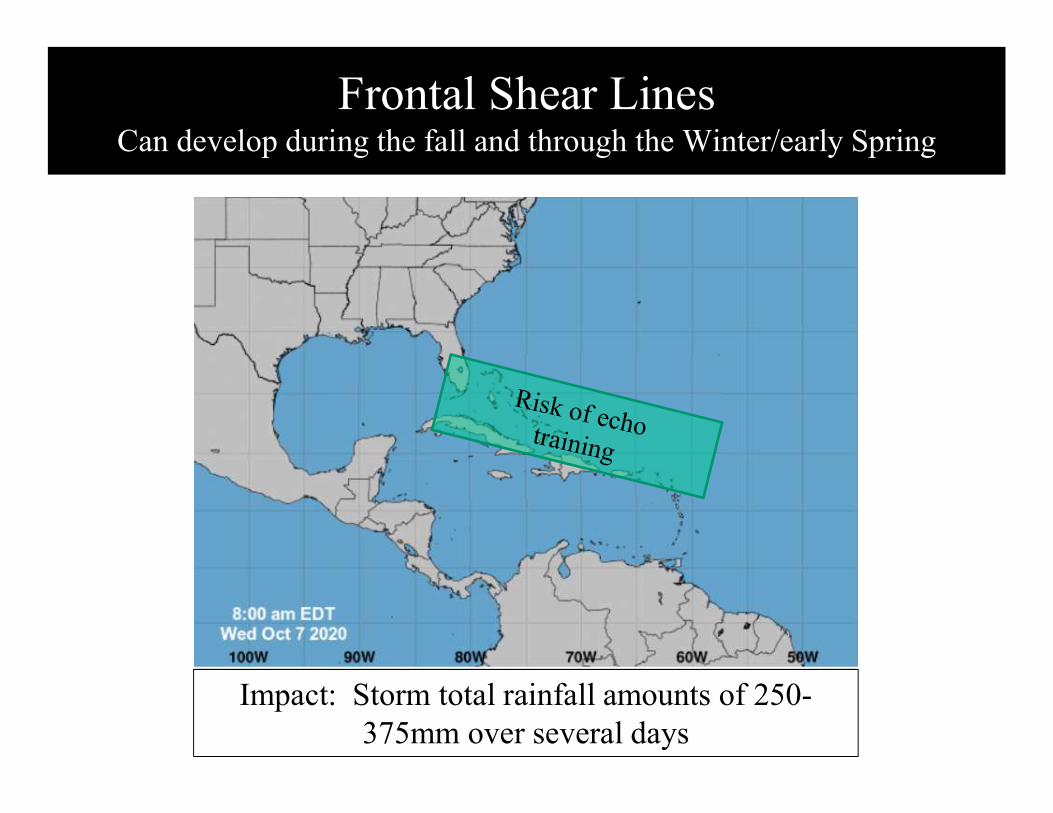
Frontal Shear LinesCan develop during the fall and through the Winter/early Spring
Impact: Storm total rainfall amounts of 250-375mm over several days
Prefrontal Shear Line
Typical Progression
and
Evolution
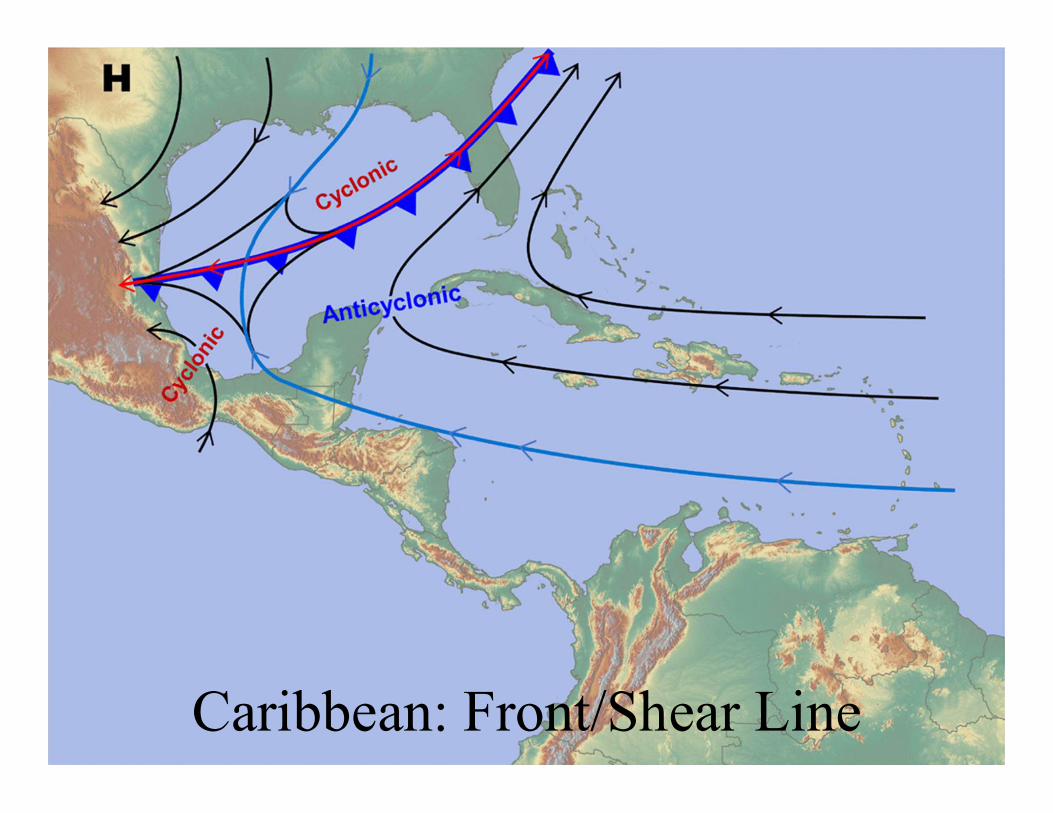
Caribbean: Front/Shear Line
At t+0 the front and shear line are parallel. Only show the front
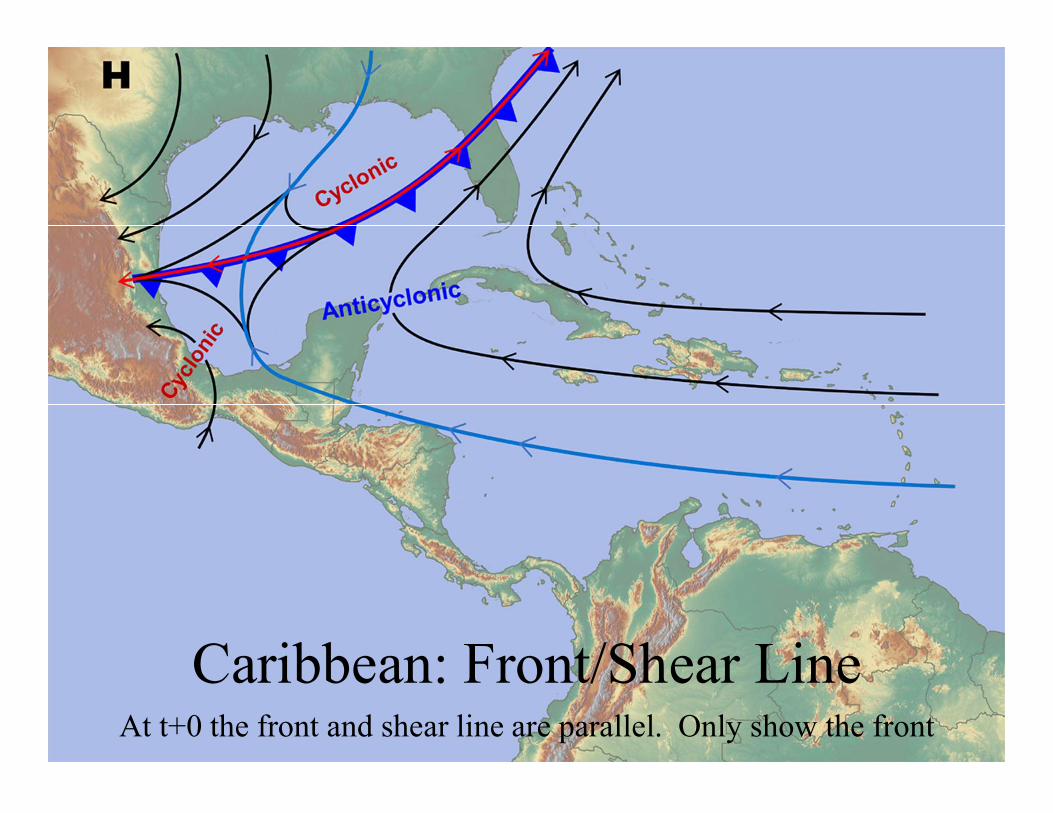
Caribbean: Front/Shear Line
At t+x, the front lags the shear line, show both.
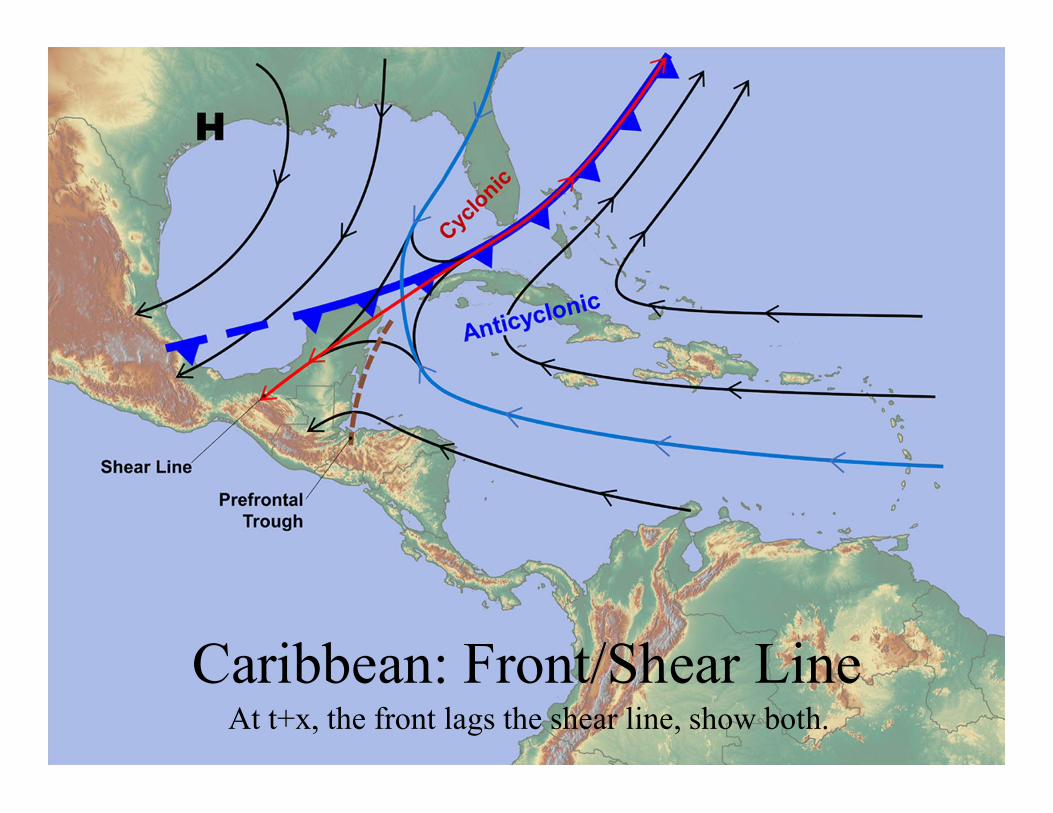
Caribbean: Front/Shear Line
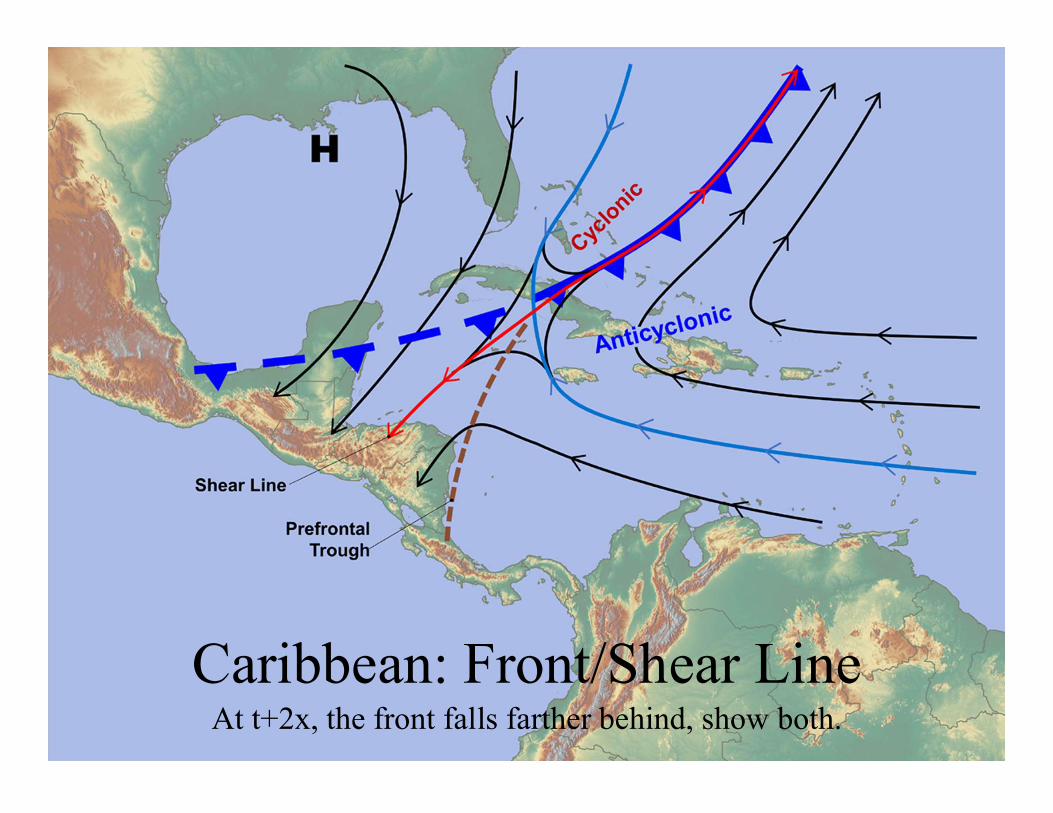
At t+2x, the front falls farther behind, show both.
Caribbean: Front/Shear Line
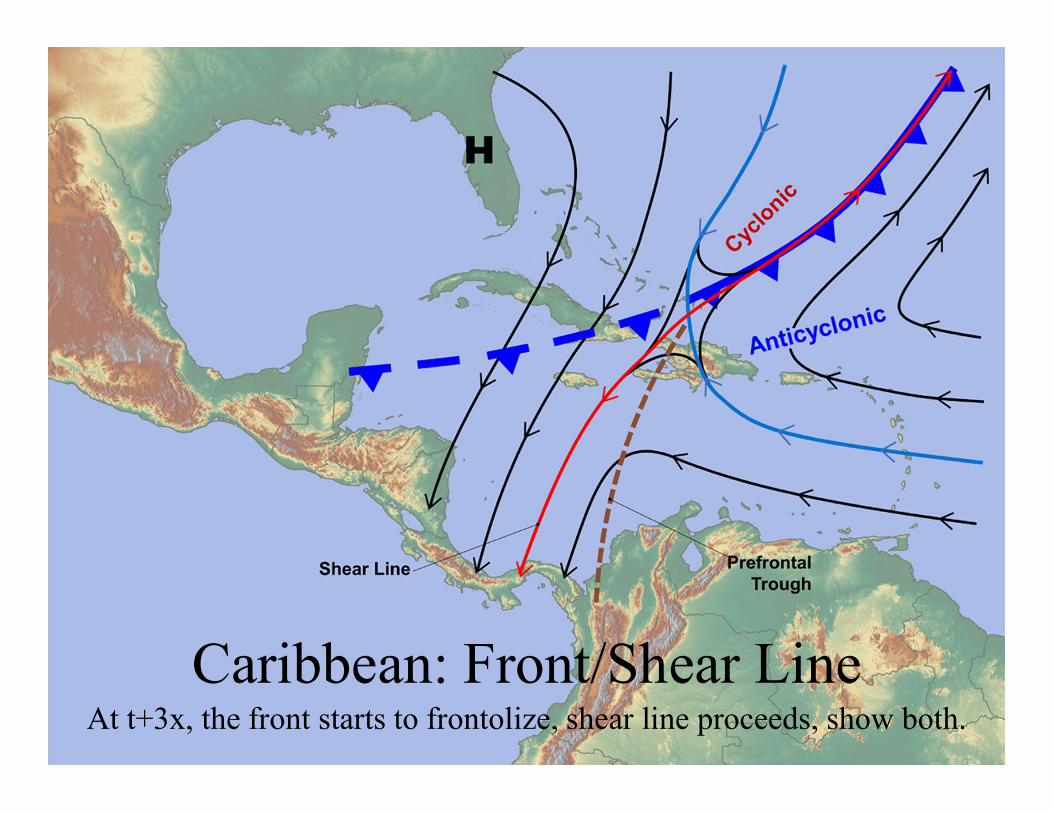
At t+3x, the front starts to frontolize, shear line proceeds, show both.
Caribbean: Front/Shear Line
When to stop showing the front?
• When the surface observation no longer show density difference across the old boundary.– Temperature contrast
– Td starts to increase
• Consider– Upper Jet Support
– Presence (lack) of cold air cumulus

Prefrontal Shear Line Basinwide Impact
Impact: Storm total rainfall amounts of 250-500 mm over 36-48 hours (topo forcing and warm SSTs)
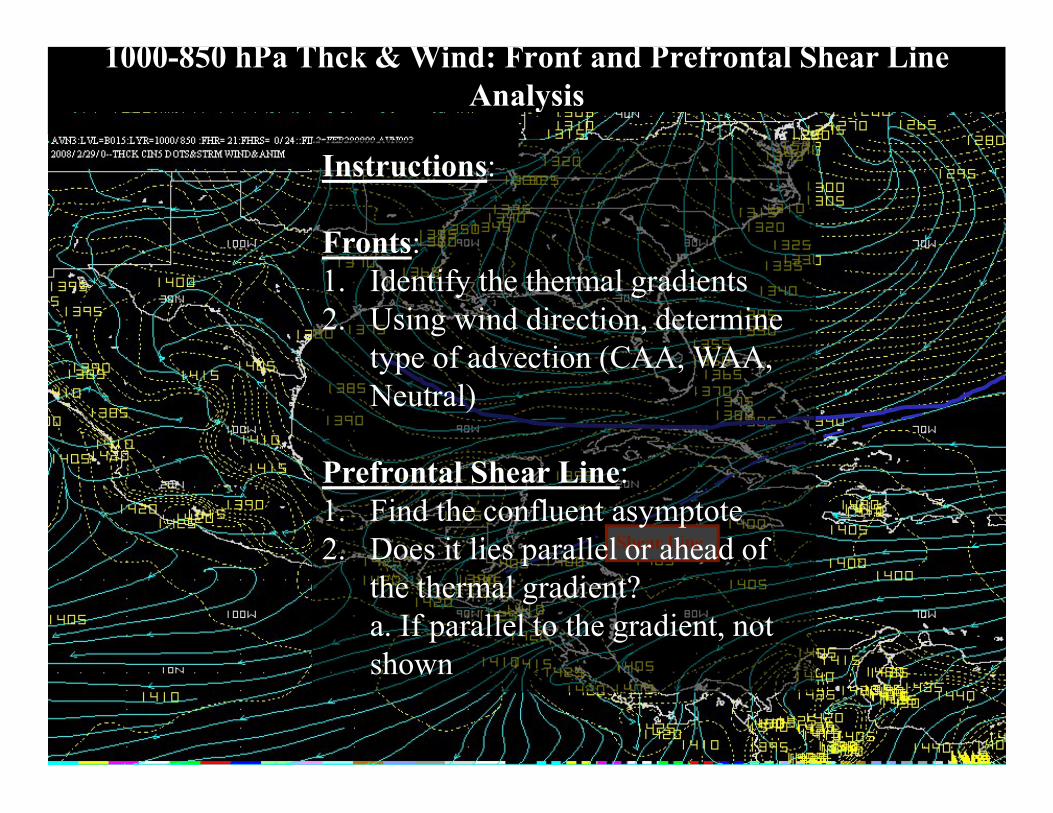
1000-850 hPa Thck & Wind: Front and Prefrontal Shear Line Analysis
Shear Line
Instructions:
Fronts:1. Identify the thermal gradients2. Using wind direction, determine
type of advection (CAA, WAA, Neutral)
Prefrontal Shear Line:1. Find the confluent asymptote2. Does it lies parallel or ahead of
the thermal gradient? a. If parallel to the gradient, not shown
Satellite Applications
Differentiating between a front and a frontal shear line.
Where is the Front?
• Present weather conditions can be a poor indicator of where the front is in the tropics.
– Weather is a function of moisture convergence and instability
– Although we often see active convection in association with polar fronts, having present weather is not a requirement
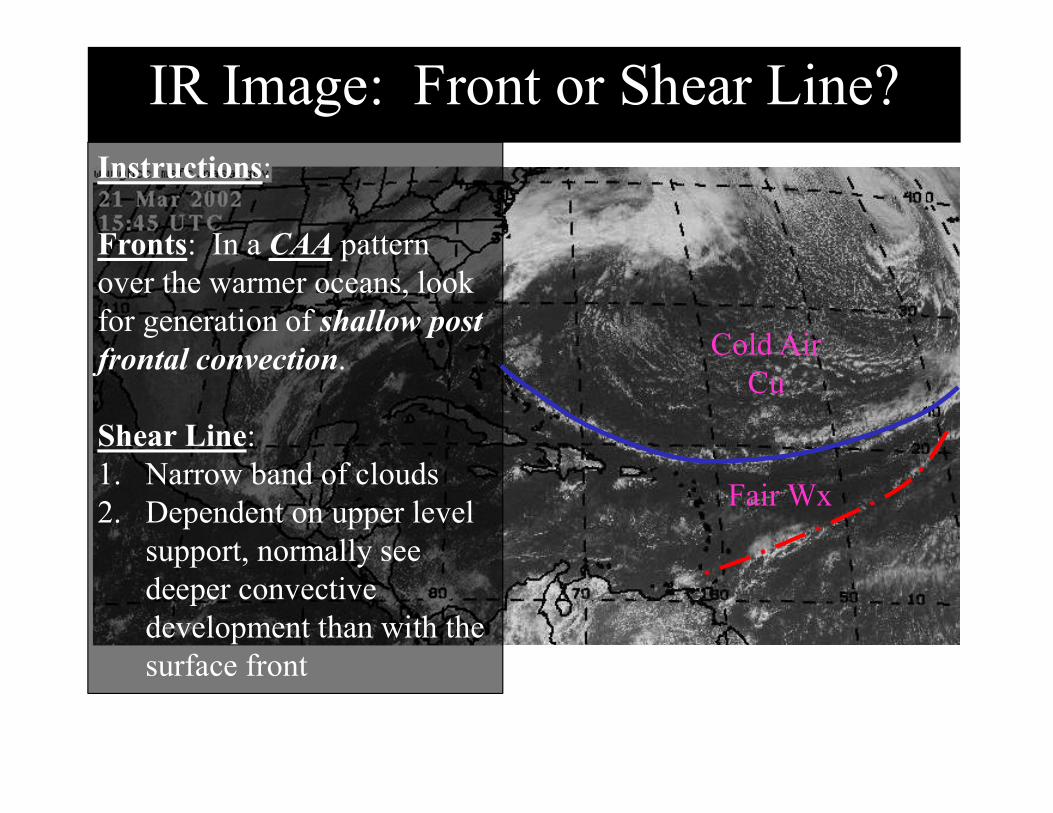
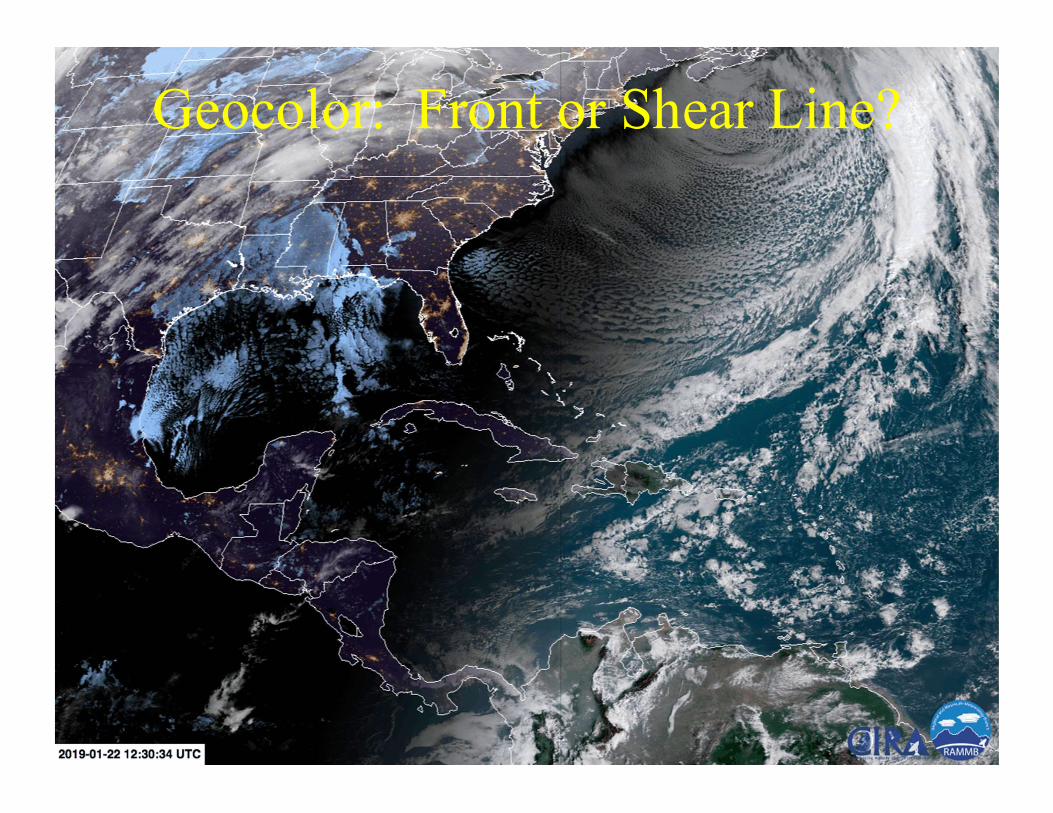
IR Image: Front or Shear Line?
Cold Air Cu
Instructions:
Fronts: In a CAA pattern over the warmer oceans, look for generation of shallow post frontal convection.
Shear Line: 1. Narrow band of clouds2. Dependent on upper level
support, normally see deeper convective development than with the surface front
Fair Wx
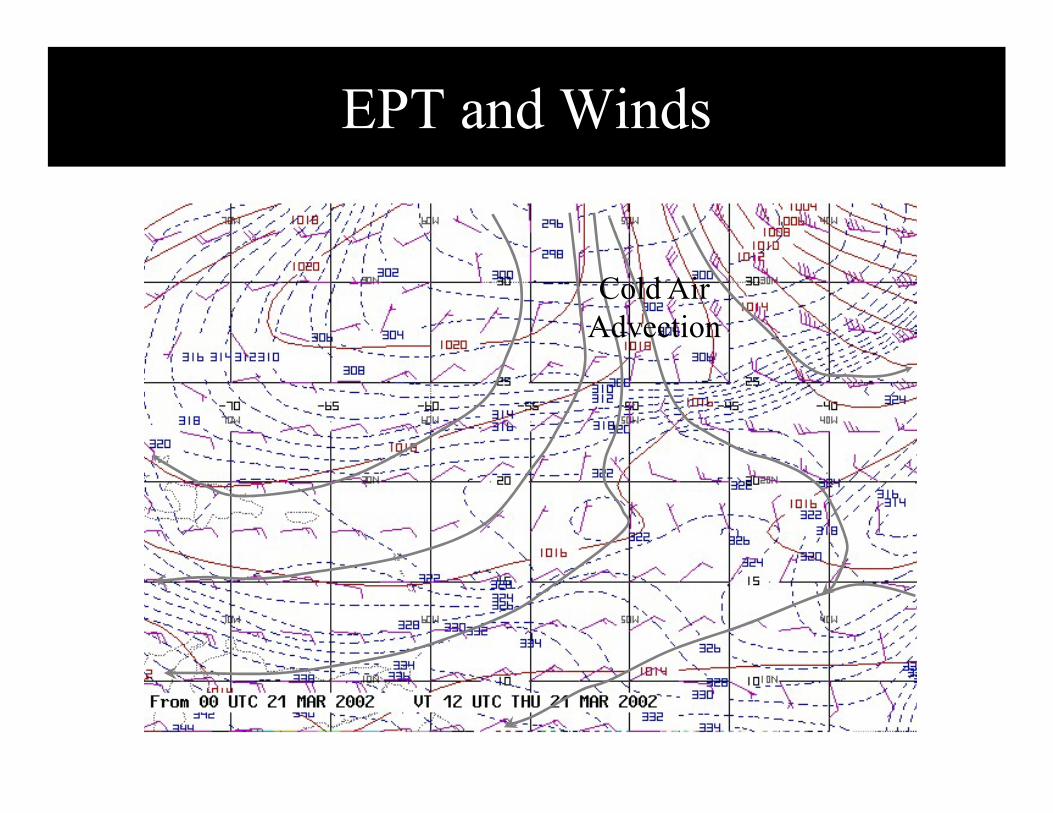
EPT and Winds
Cold Air Advection
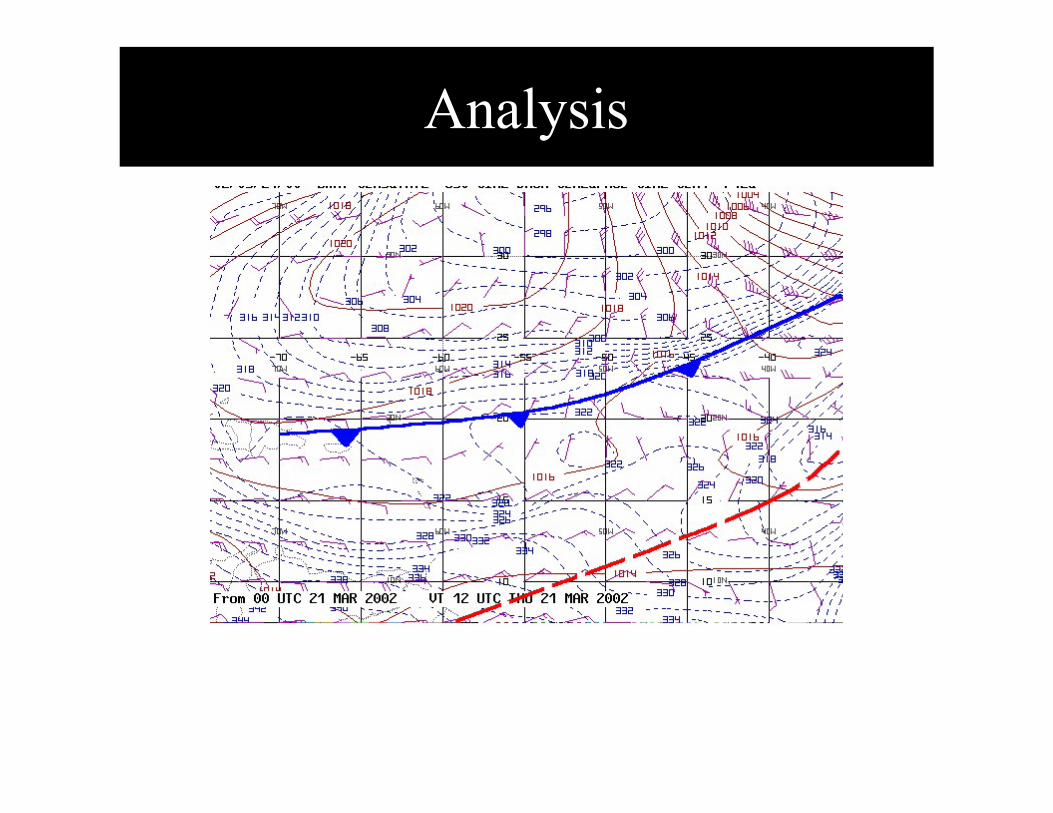
Analysis
Geocolor: Front or Shear Line?
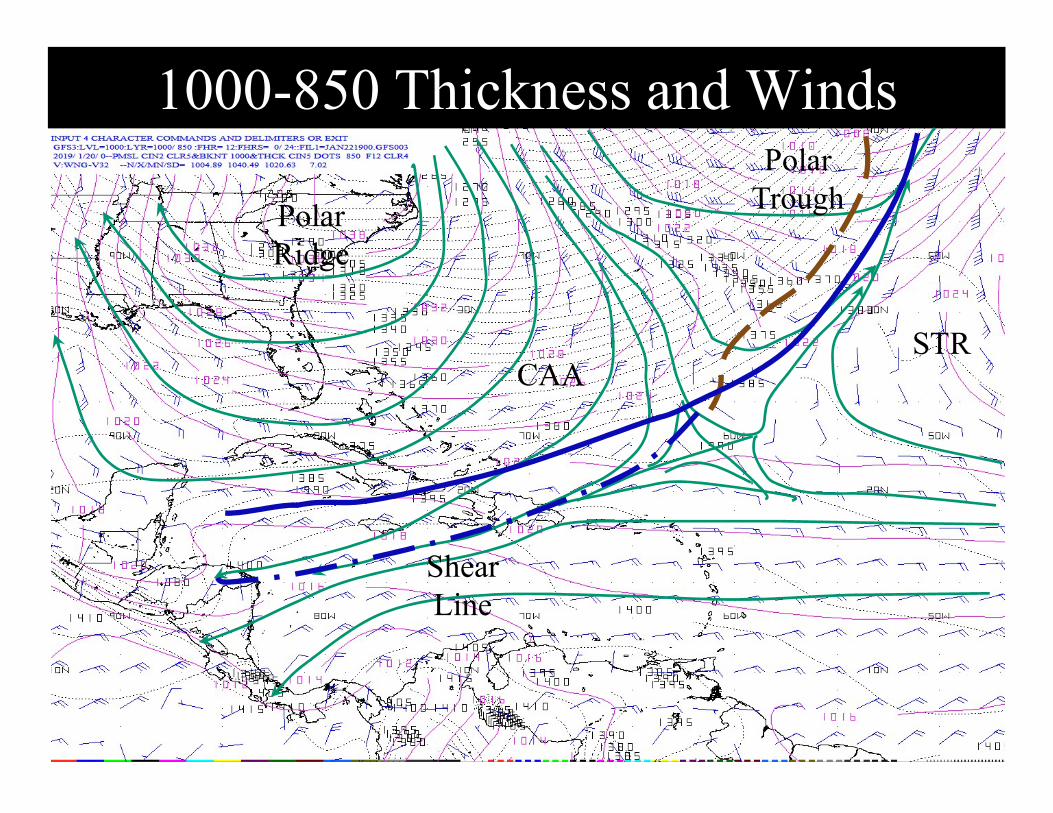
1000-850 Thickness and Winds
CAA
PolarRidge
STR
PolarTrough
ShearLine
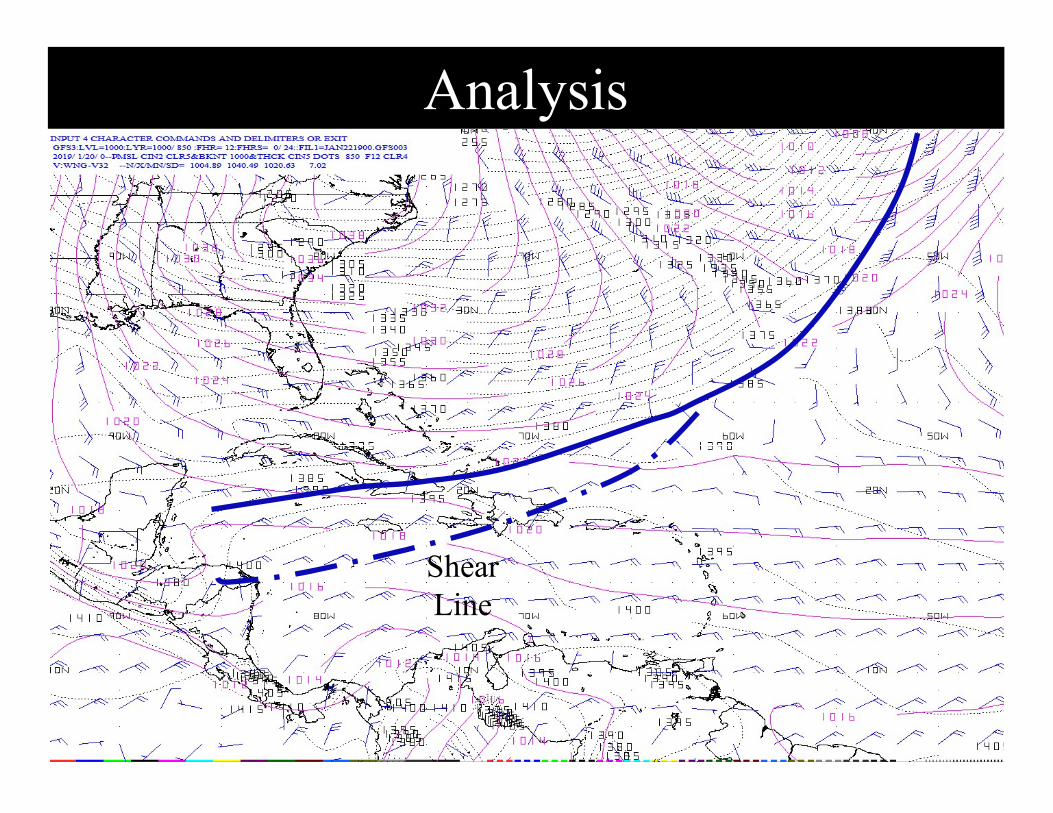
Analysis
ShearLine
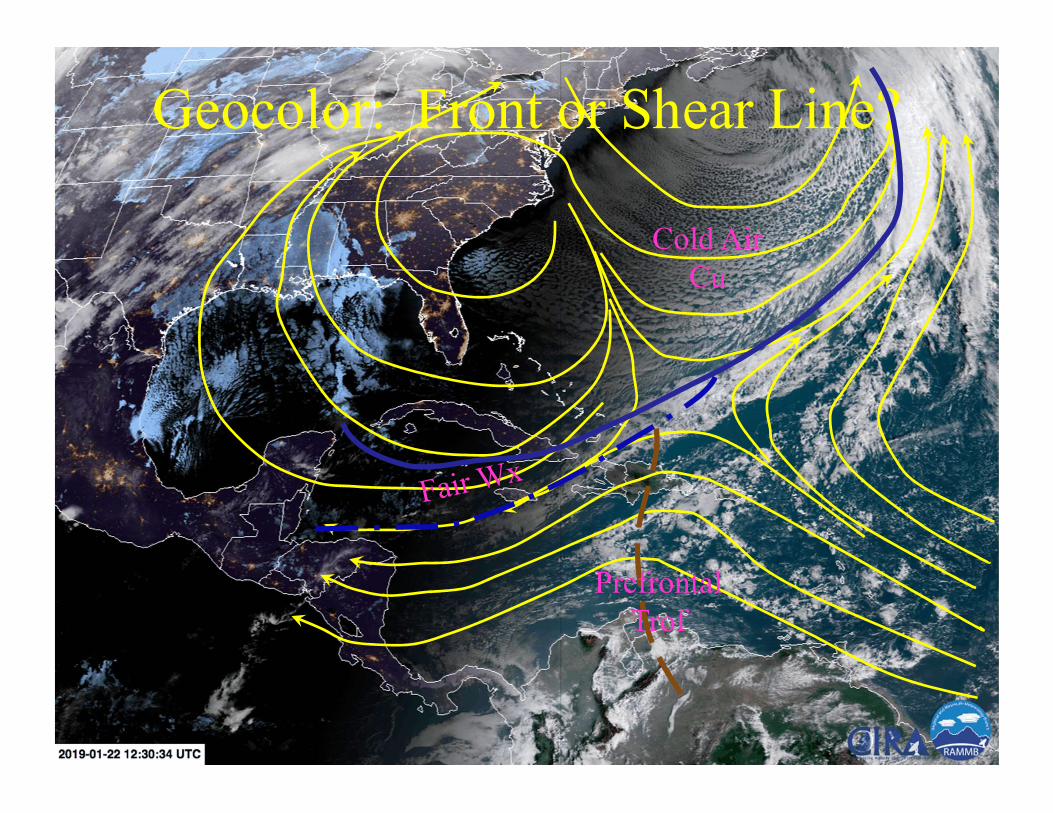
Geocolor: Front or Shear Line?
Cold Air Cu
Prefrontal Trof

Where is the Weather?
Weather with Fronts and Shear Lines
• Where is the weather?– Front, Shear Line, Prefrontal Trough?
• The weather is where the moisture converges.
• Typically along the shear line– Or between the prefrontal trough and the shear line
• Since this is where the weather is most active, some analysts can confuse the shear line with the front.
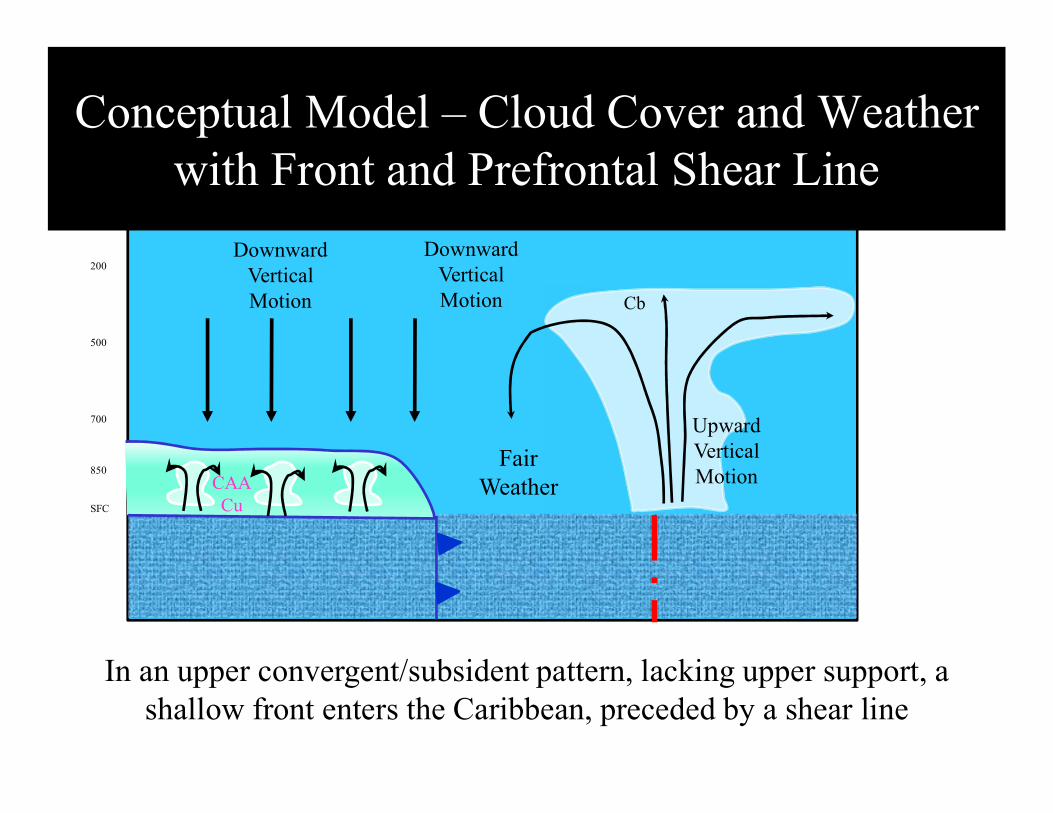
In an upper convergent/subsident pattern, lacking upper support, a shallow front enters the Caribbean, preceded by a shear line
200
500
700
850
SFC
Conceptual Model – Cloud Cover and Weather with Front and Prefrontal Shear Line
FairWeatherCAA
Cu
Cb
Downward VerticalMotion
Upward VerticalMotion
Downward VerticalMotion
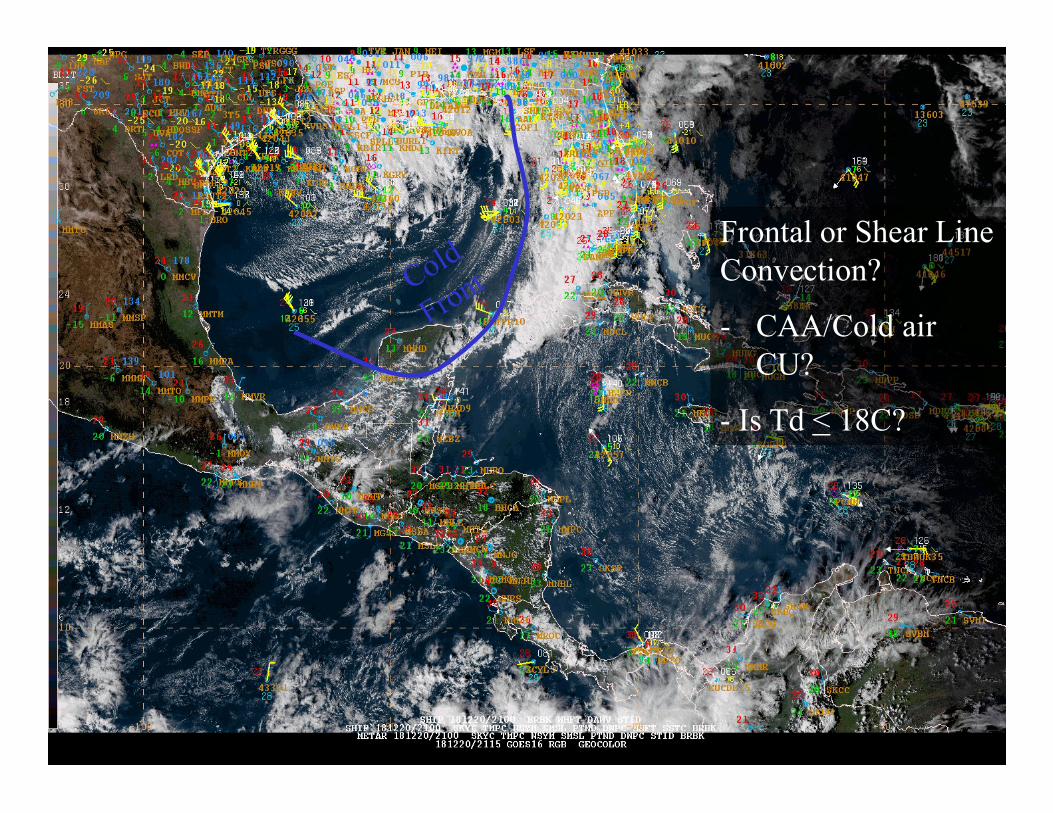
Frontal or Shear Line Convection?
- CAA/Cold air CU?
- Is Td < 18C?
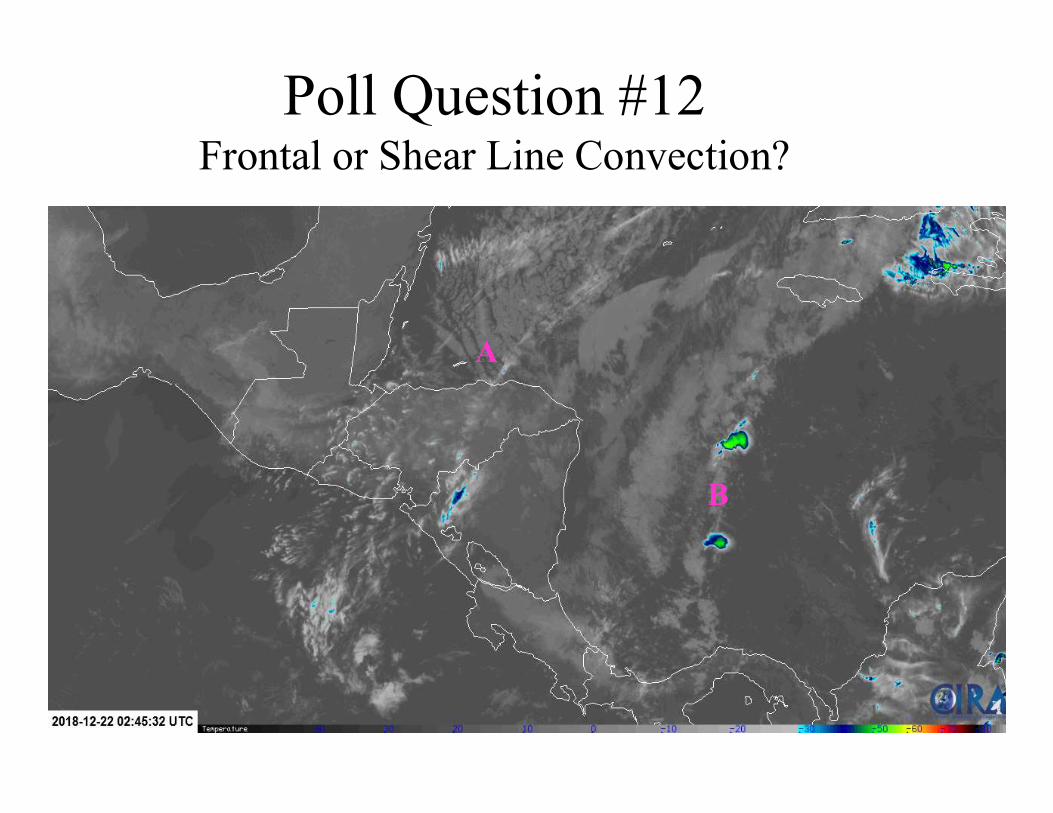
Poll Question #12Frontal or Shear Line Convection?
A
B
Poll Question #12(select one)
• A: Frontal, B: Frontal
• A: Shear line, B: Shear Line
• A: Shear Line, B: Frontal
• A: Frontal, B: Shear Line
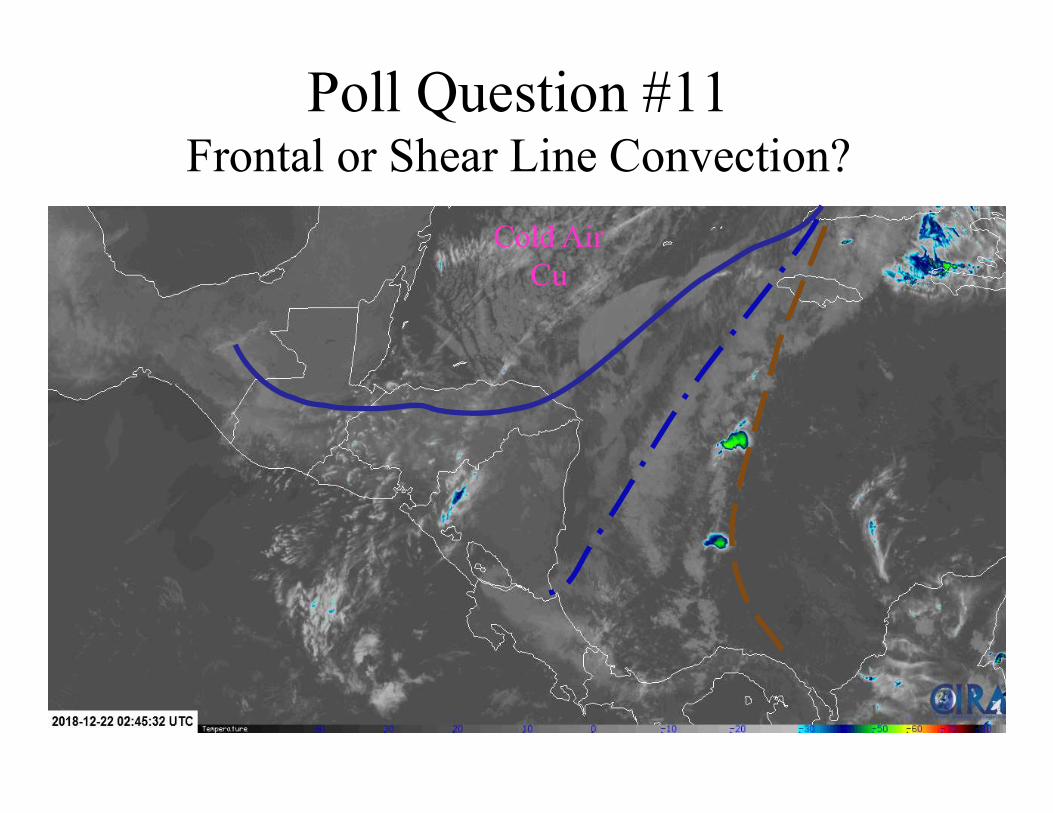
Poll Question #11Frontal or Shear Line Convection?
Cold Air Cu
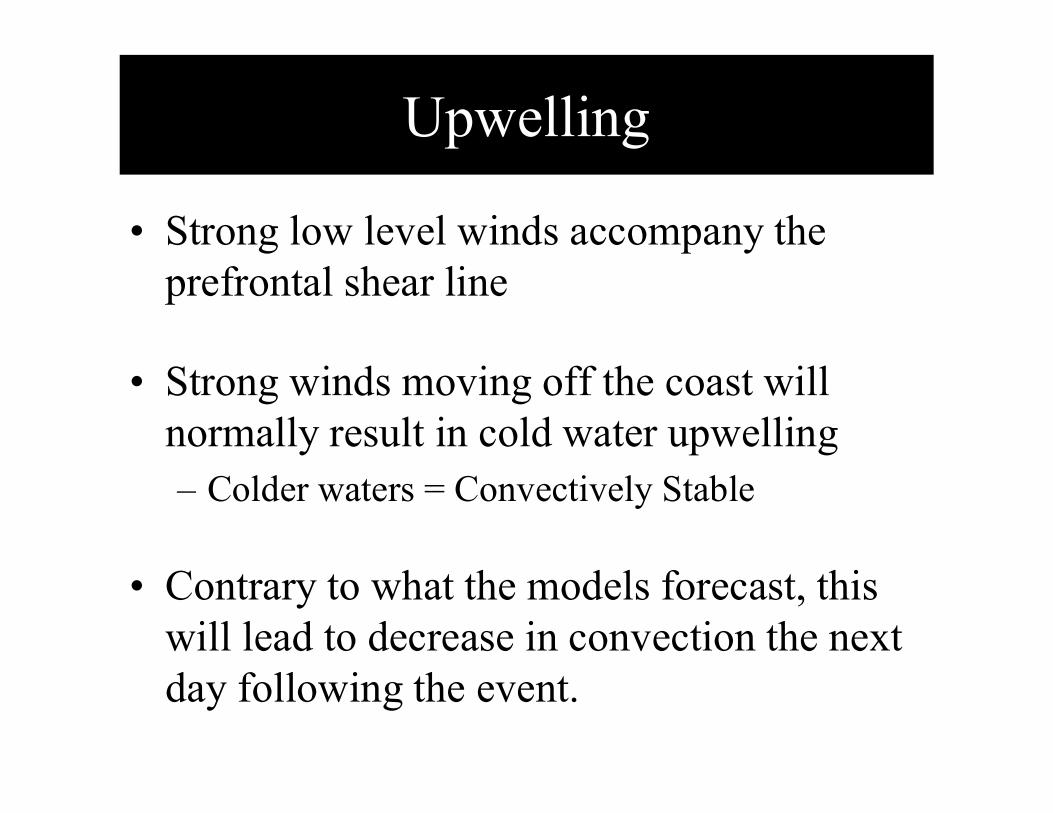
Upwelling
• Strong low level winds accompany the prefrontal shear line
• Strong winds moving off the coast will normally result in cold water upwelling– Colder waters = Convectively Stable
• Contrary to what the models forecast, this will lead to decrease in convection the next day following the event.
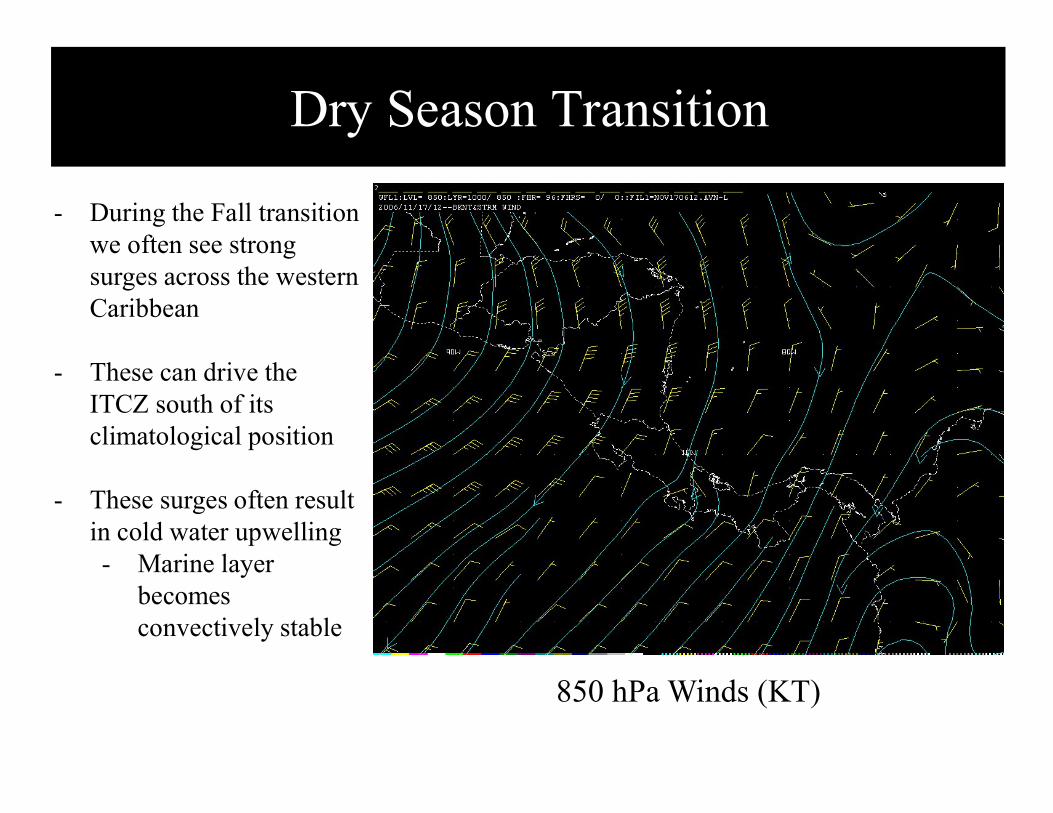
Dry Season Transition
- During the Fall transition we often see strong surges across the western Caribbean
- These can drive the ITCZ south of its climatological position
- These surges often result in cold water upwelling- Marine layer
becomes convectively stable
850 hPa Winds (KT)
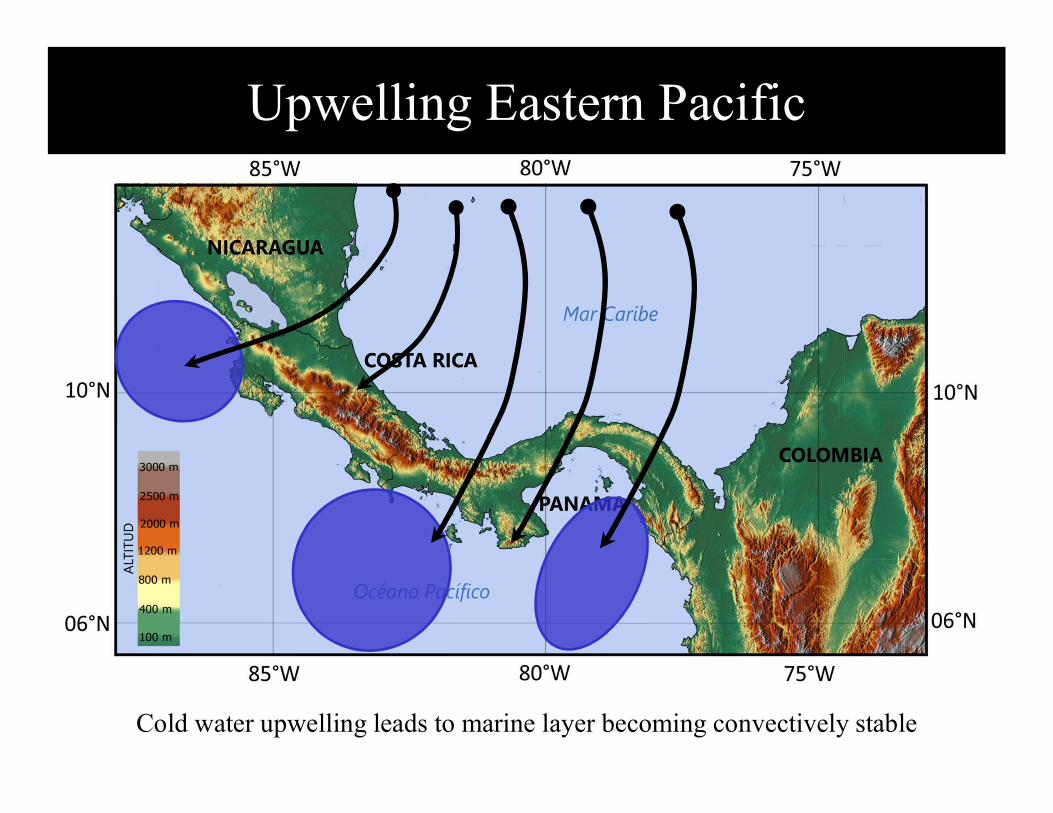
Upwelling Eastern Pacific
Cold water upwelling leads to marine layer becoming convectively stable
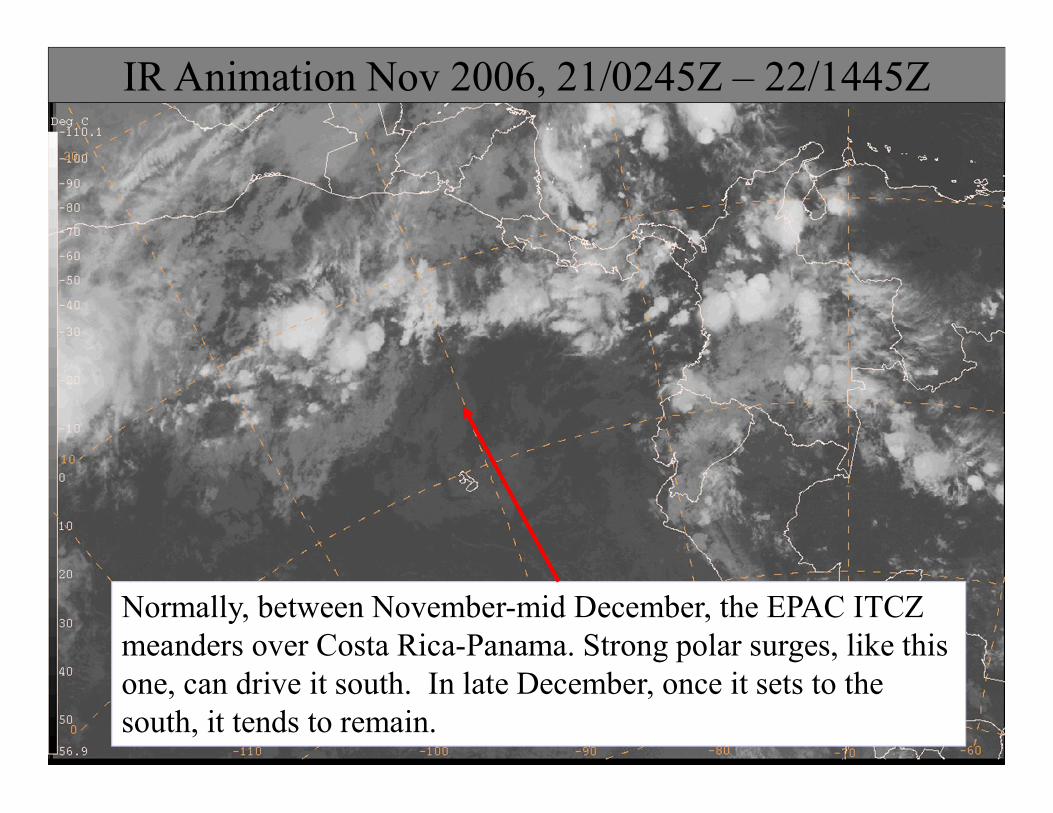
Normally, between November-mid December, the EPAC ITCZ meanders over Costa Rica-Panama. Strong polar surges, like this one, can drive it south. In late December, once it sets to the south, it tends to remain.
IR Animation Nov 2006, 21/0245Z – 22/1445Z
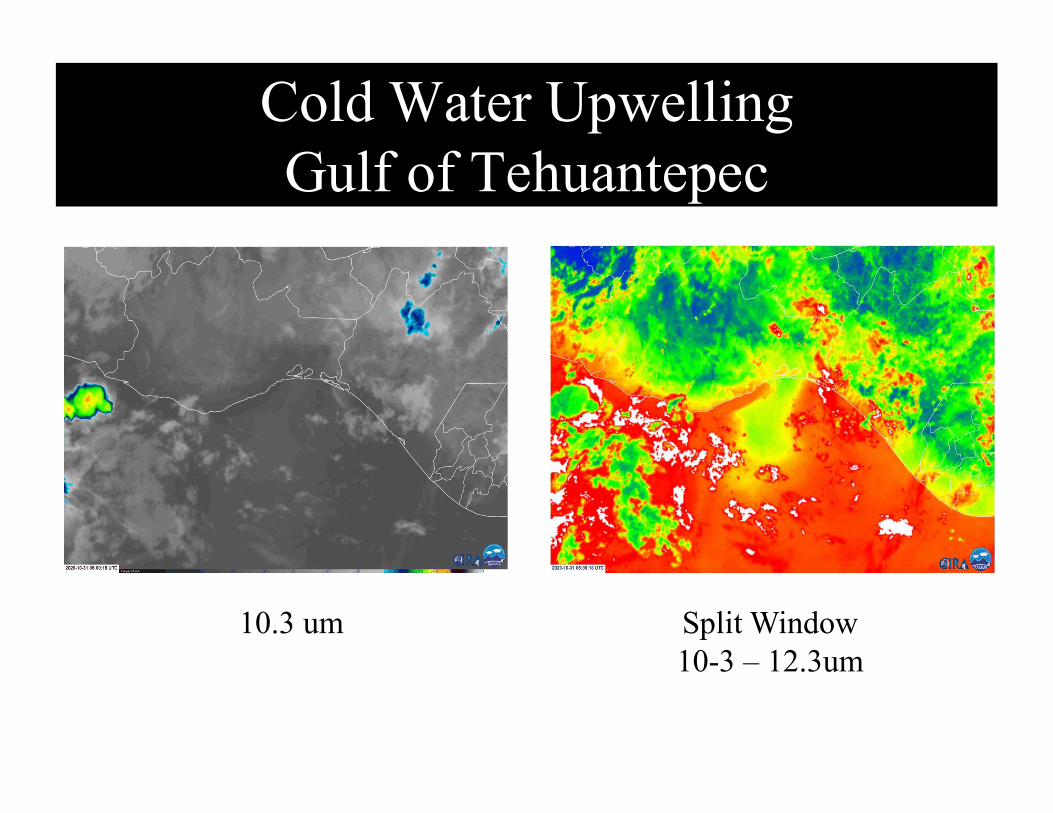
Cold Water UpwellingGulf of Tehuantepec
10.3 um Split Window10-3 – 12.3um
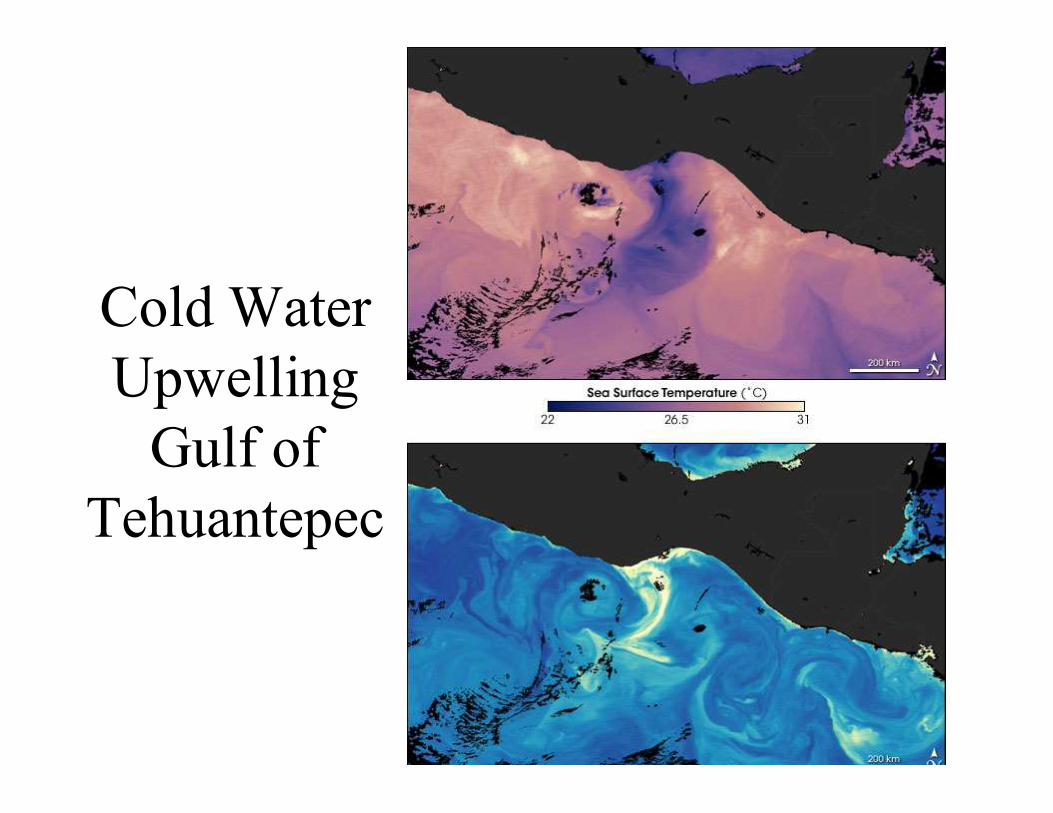
Cold Water Upwelling
Gulf of Tehuantepec
Questions?
Case Study – December 1999
Poll Question #13
Focus of the Analysis SE Caribbean
Poll Question #13The weather over northern Venezuela is due to:
(select all that apply)
• Frontal Convection
• Shear line / echo training pattern
• ITCZ
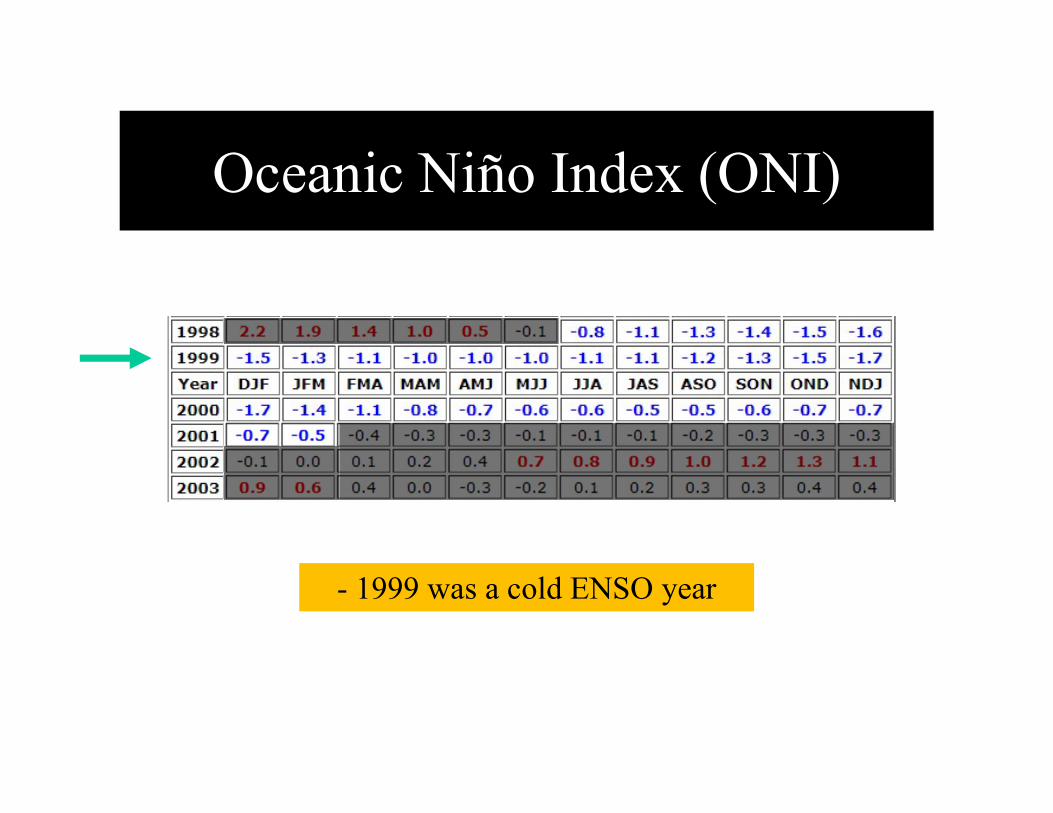
Oceanic Niño Index (ONI)
- 1999 was a cold ENSO year

Conceptual ModelLow Level Flow Cool ENSO – La Niña
A
A
CDrier than normal
Wetter
Drier
Wetter
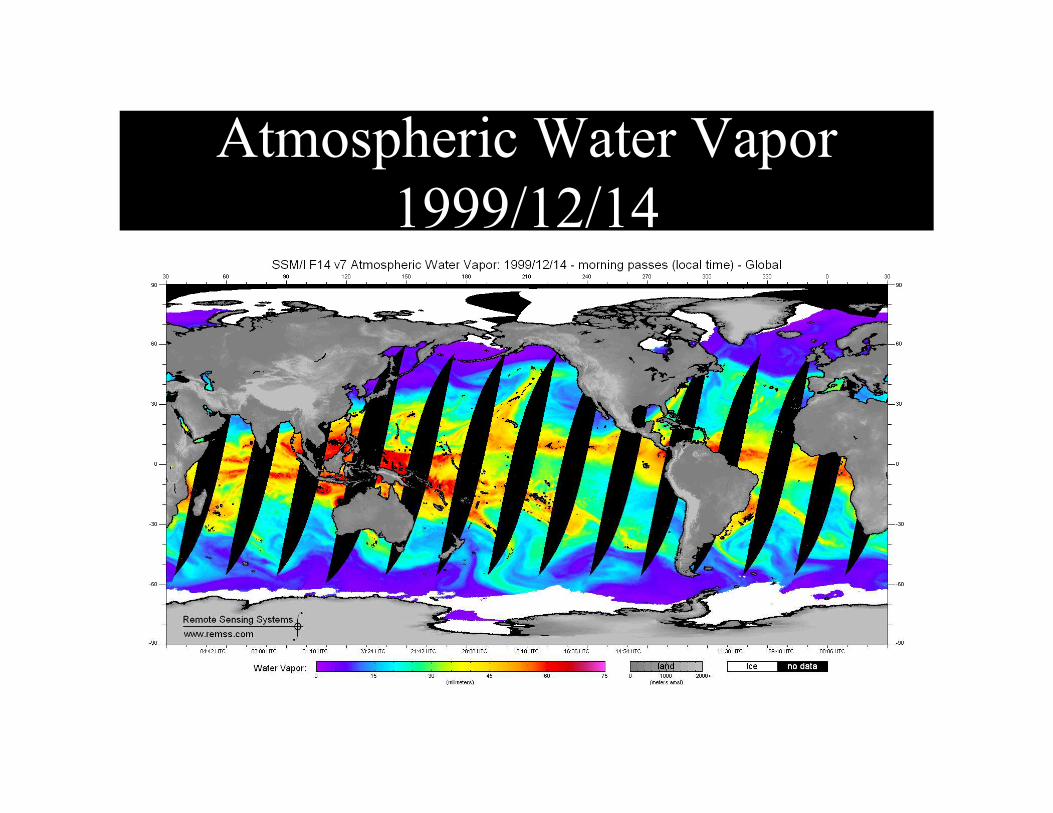
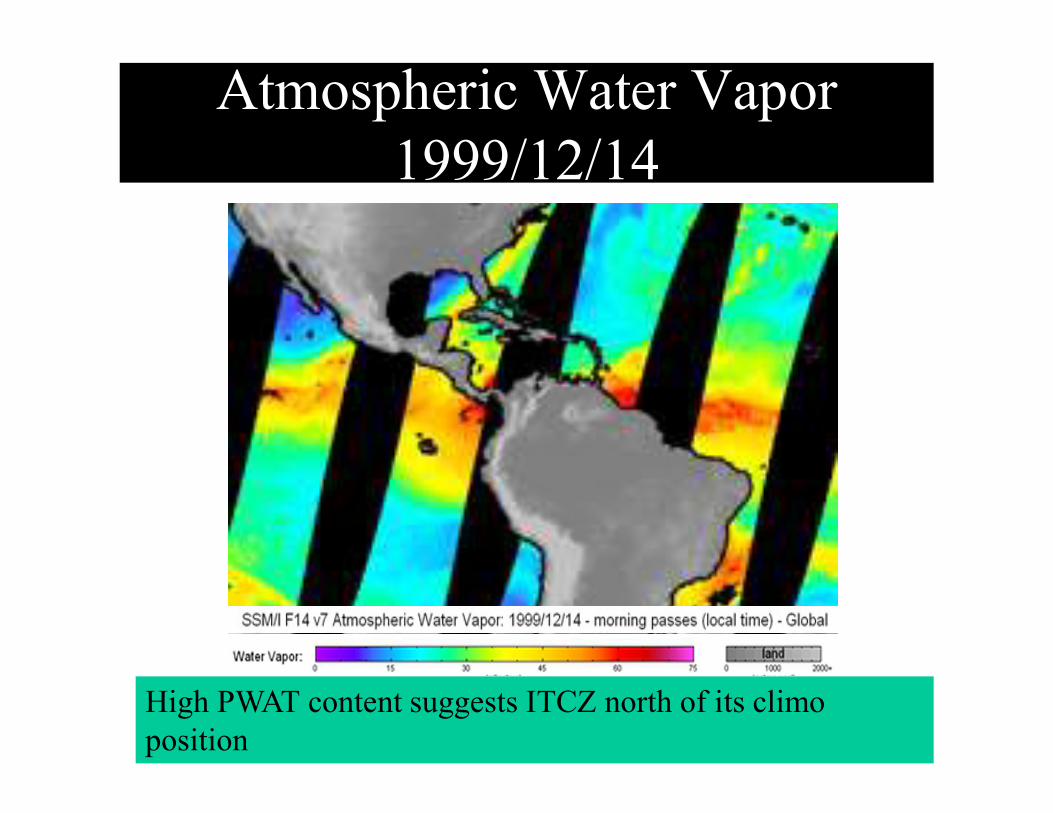
Atmospheric Water Vapor1999/12/14
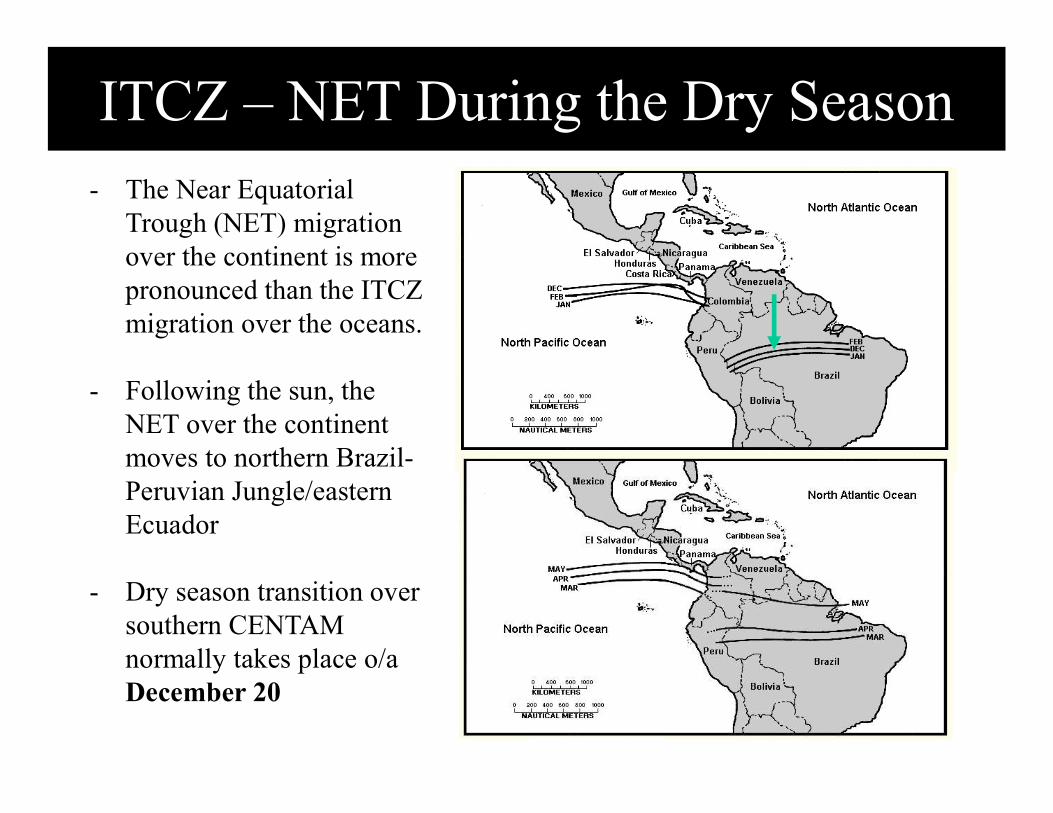
ITCZ – NET During the Dry Season- The Near Equatorial
Trough (NET) migration over the continent is more pronounced than the ITCZ migration over the oceans.
- Following the sun, the NET over the continent moves to northern Brazil-Peruvian Jungle/eastern Ecuador
- Dry season transition over southern CENTAMnormally takes place o/a December 20
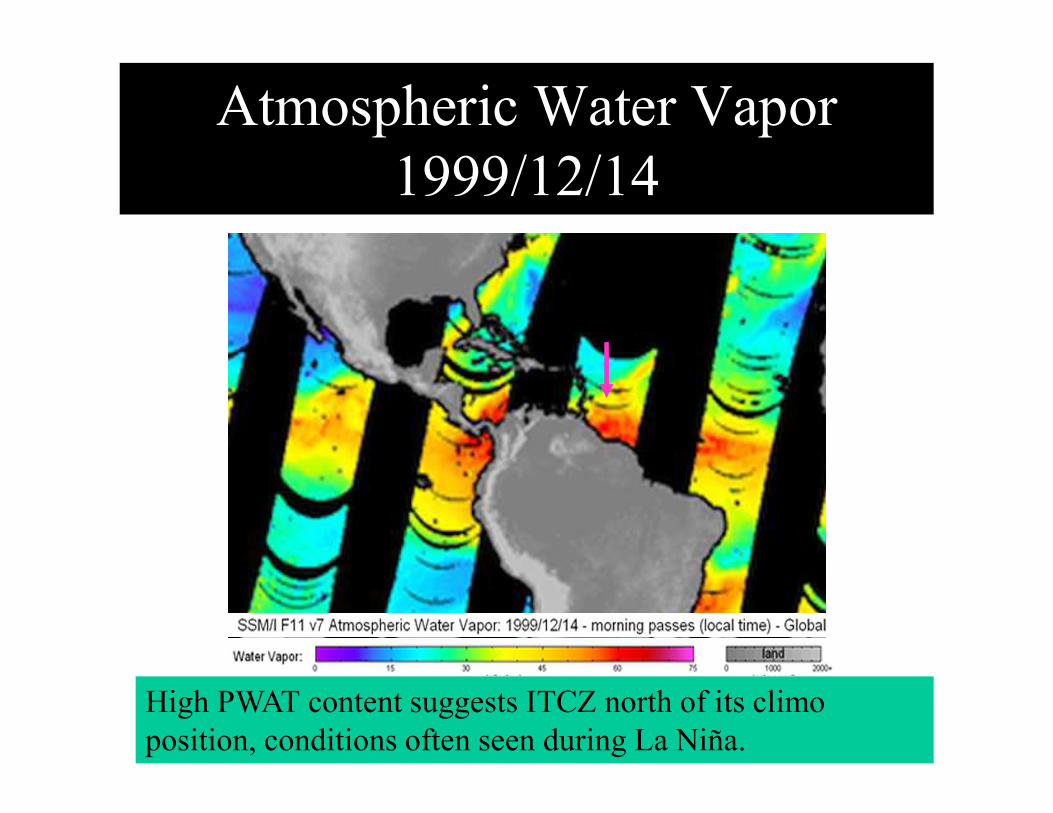
Atmospheric Water Vapor1999/12/14
High PWAT content suggests ITCZ north of its climoposition, conditions often seen during La Niña.
Atmospheric Water Vapor1999/12/14
High PWAT content suggests ITCZ north of its climoposition
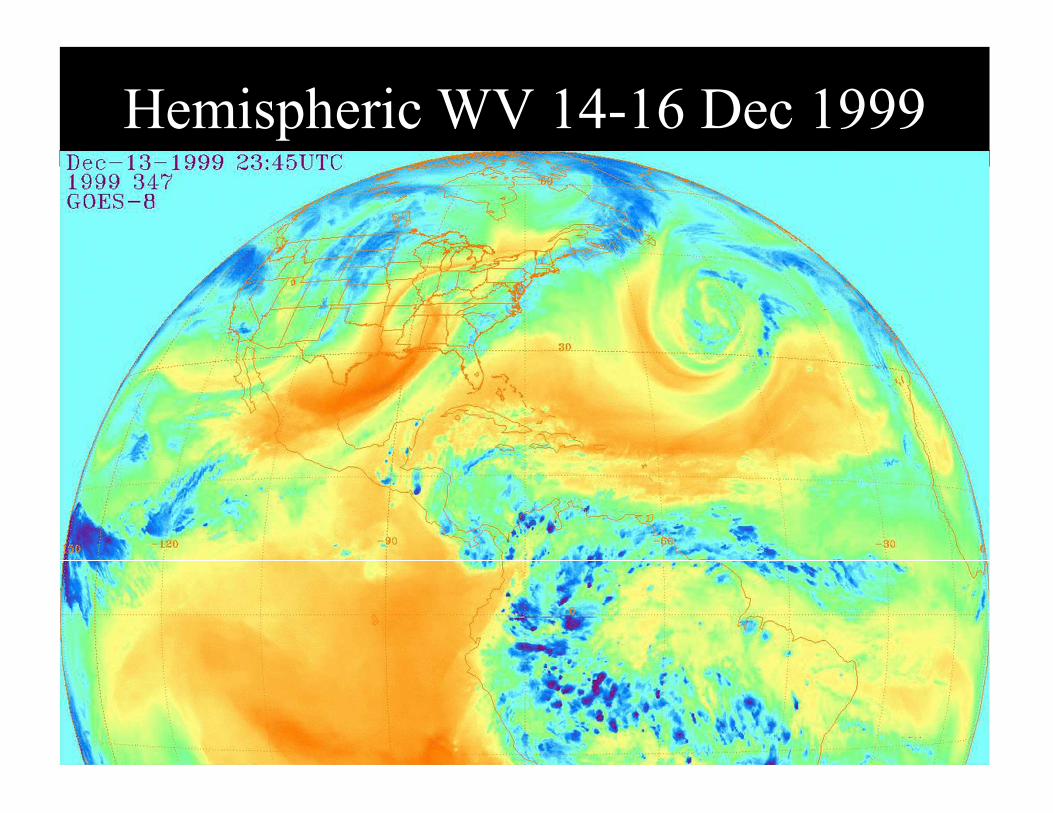
Hemispheric WV 14-16 Dec 1999
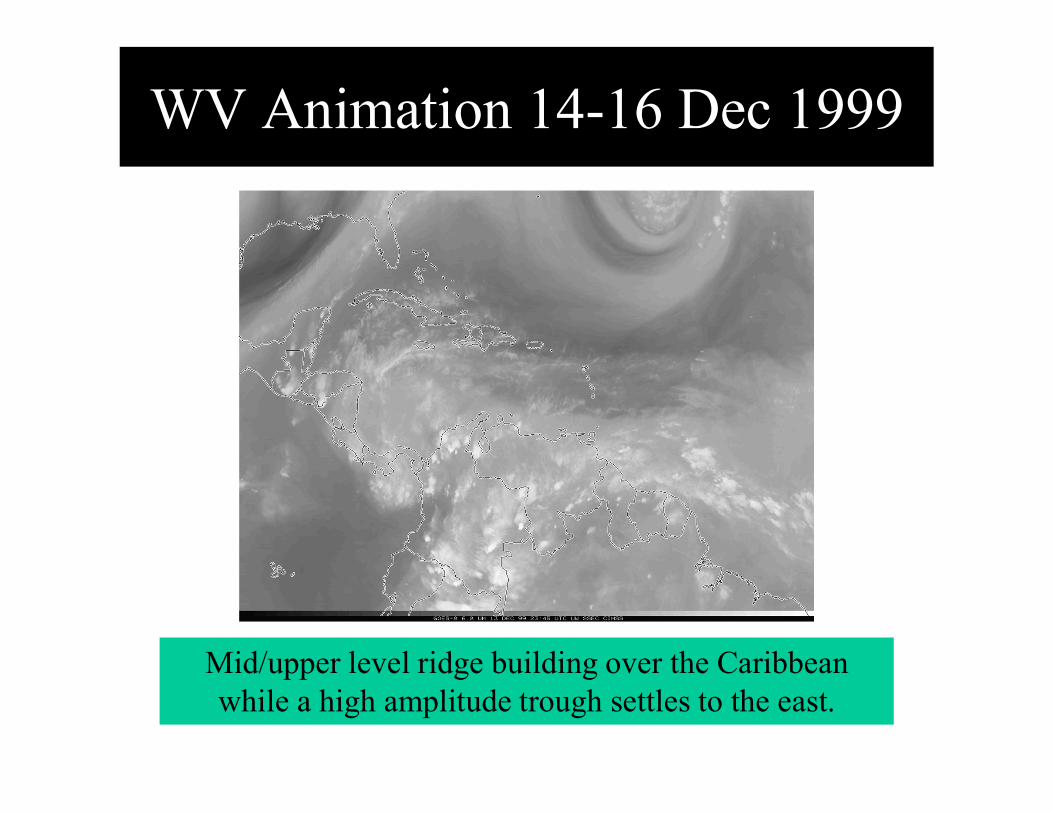
WV Animation 14-16 Dec 1999
Mid/upper level ridge building over the Caribbean while a high amplitude trough settles to the east.
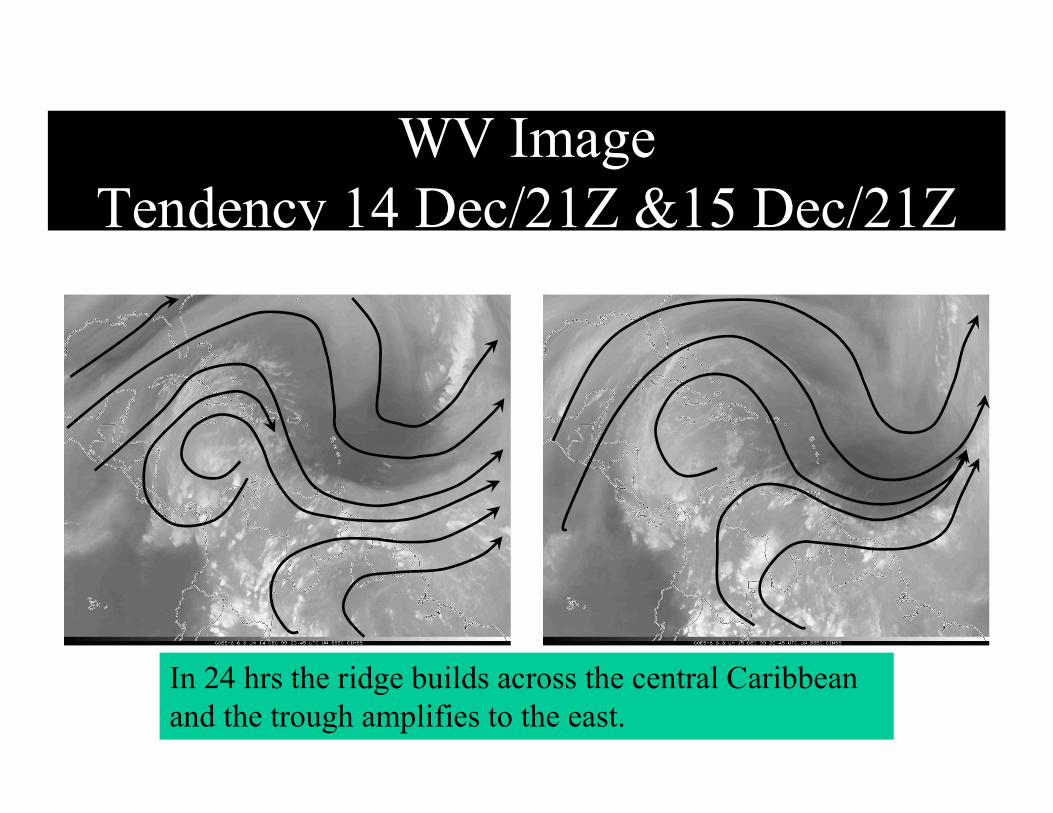
WV ImageTendency 14 Dec/21Z &15 Dec/21Z
In 24 hrs the ridge builds across the central Caribbean and the trough amplifies to the east.
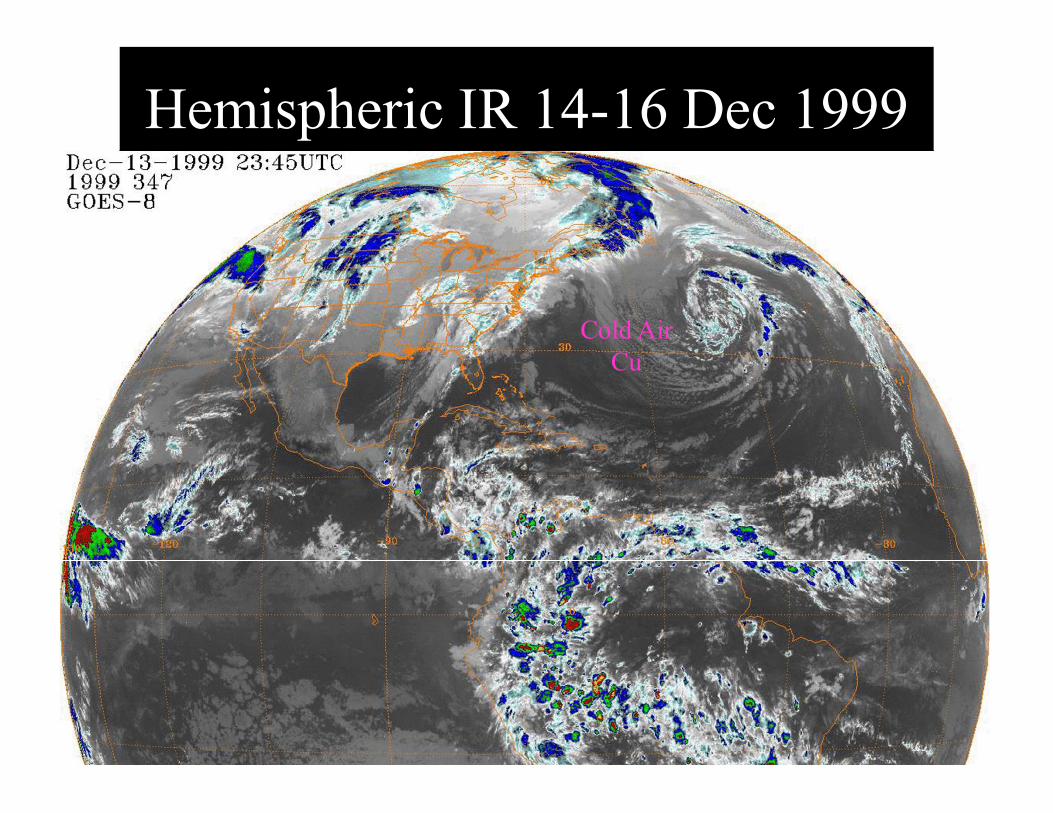
Hemispheric IR 14-16 Dec 1999
Cold Air Cu
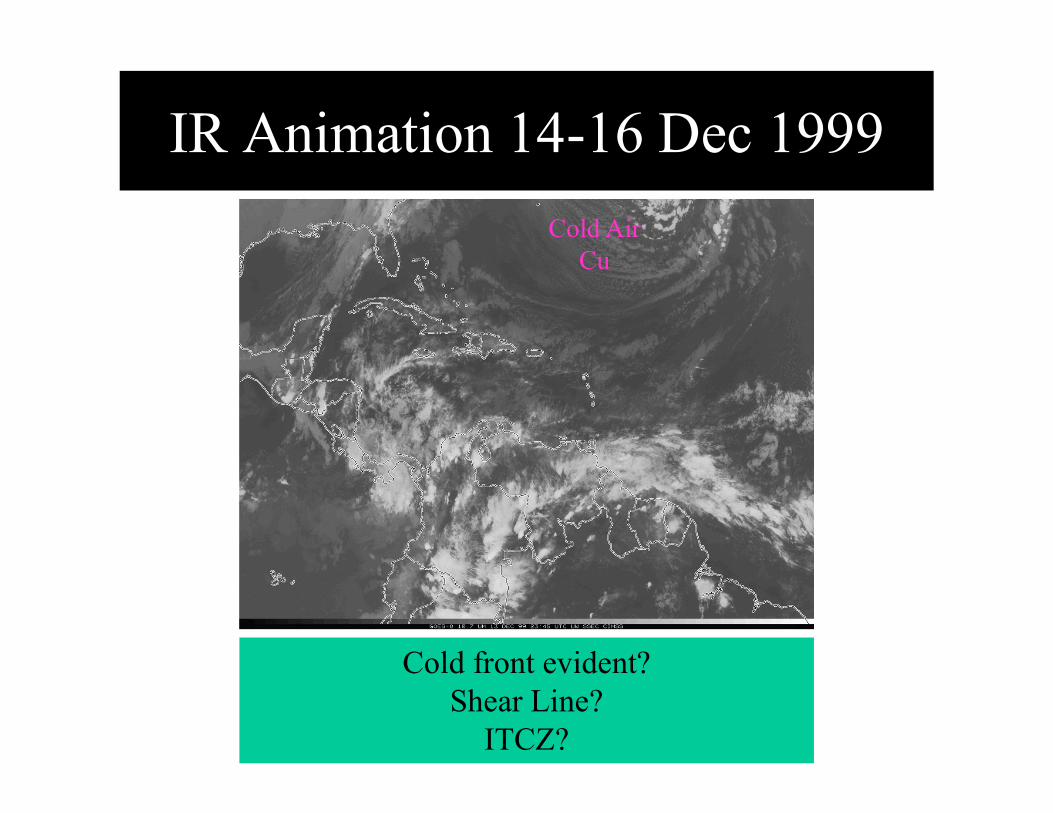
IR Animation 14-16 Dec 1999
Cold Air Cu
Cold front evident? Shear Line?
ITCZ?
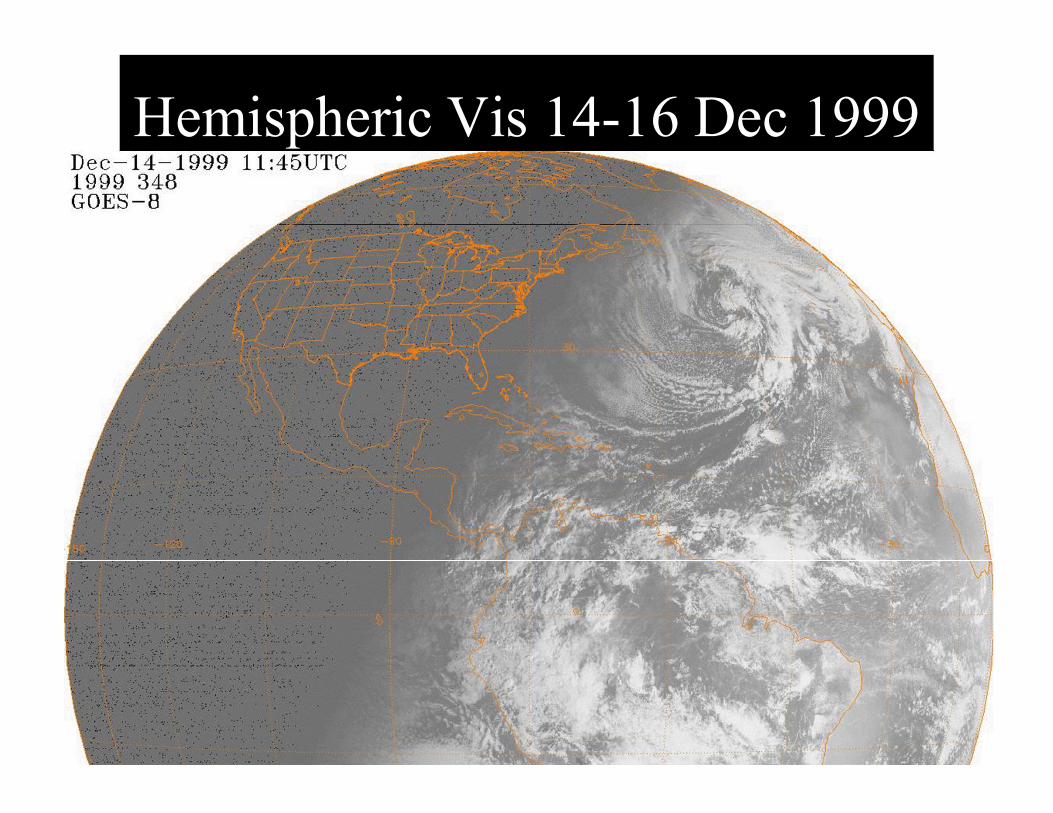
Hemispheric Vis 14-16 Dec 1999
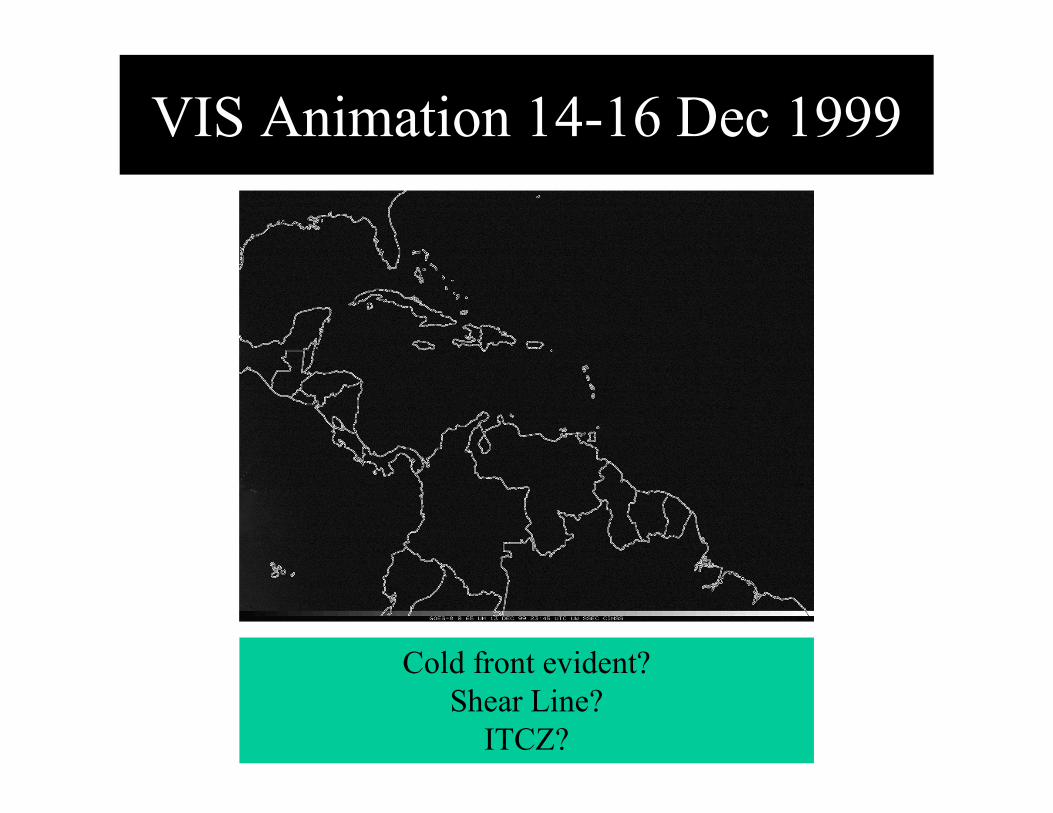
VIS Animation 14-16 Dec 1999
Cold front evident? Shear Line?
ITCZ?
Poll Question #13The weather over northern Venezuela is due to:
(select all that apply)
• Frontal Convection
• Shear line / echo training pattern
• ITCZ
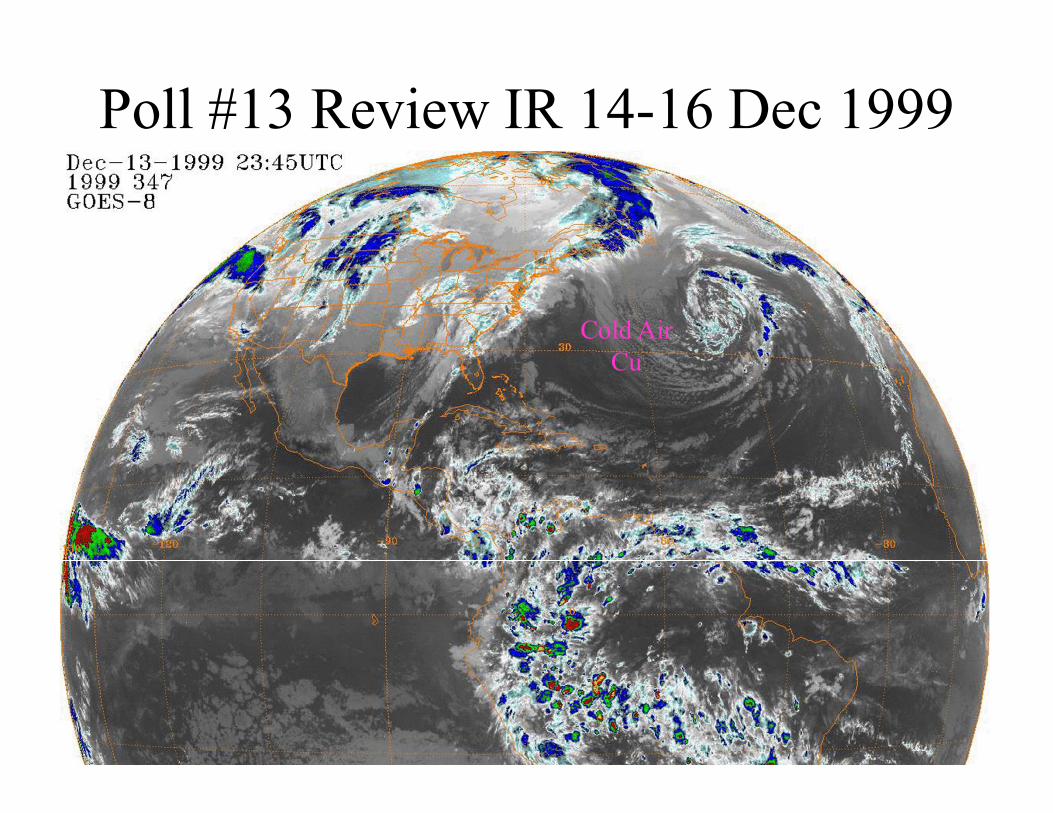
Poll #13 Review IR 14-16 Dec 1999
Cold Air Cu
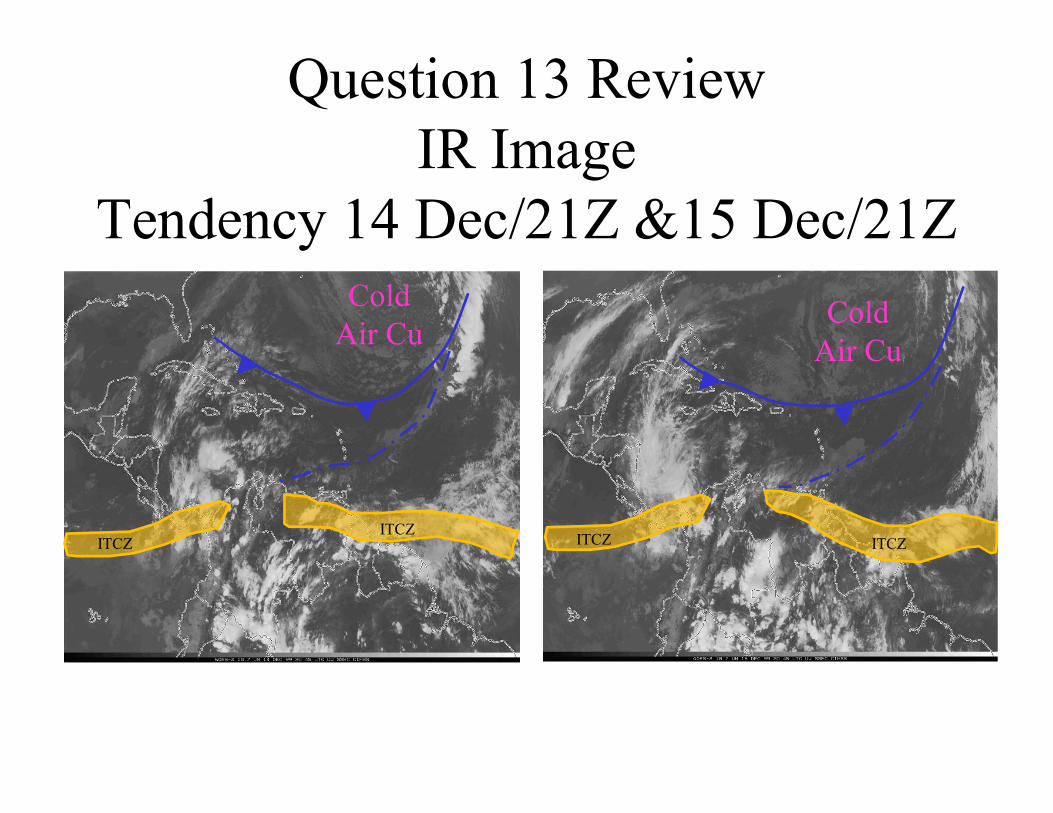
Question 13 ReviewIR Image
Tendency 14 Dec/21Z &15 Dec/21ZCold
Air CuCold
Air Cu
ITCZITCZ
ITCZ ITCZ
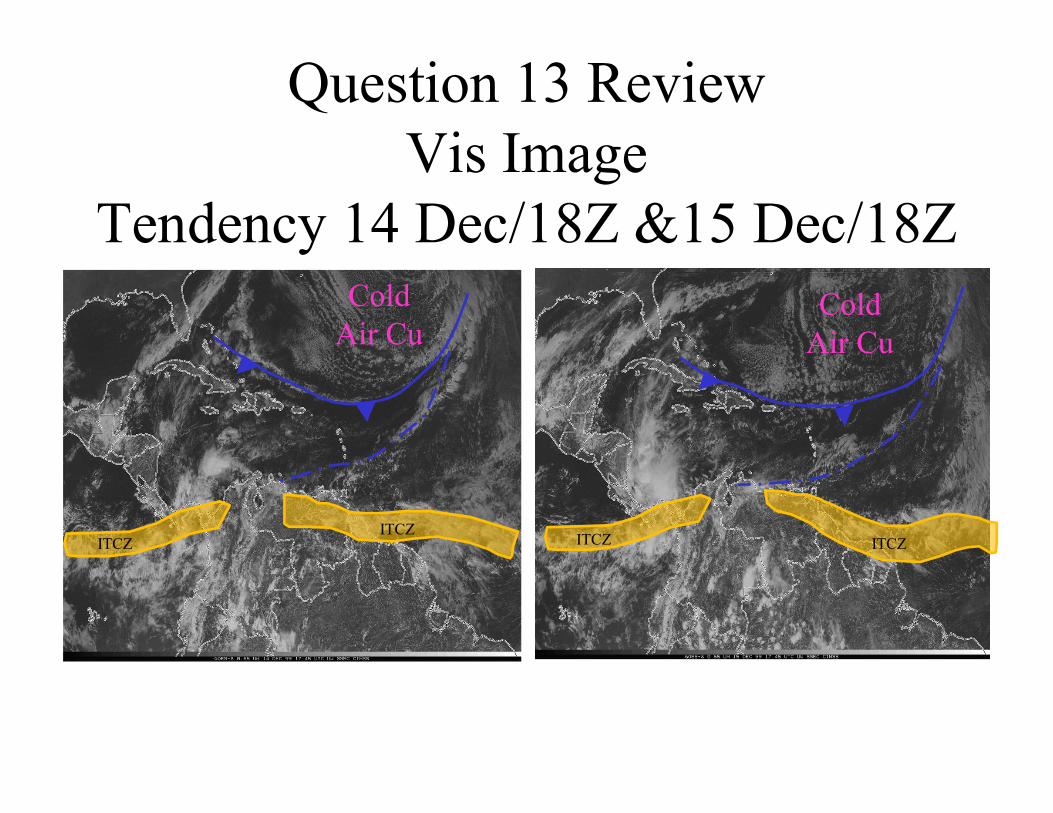
Question 13 ReviewVis Image
Tendency 14 Dec/18Z &15 Dec/18ZCold
Air CuCold
Air Cu
ITCZITCZ
ITCZ ITCZ
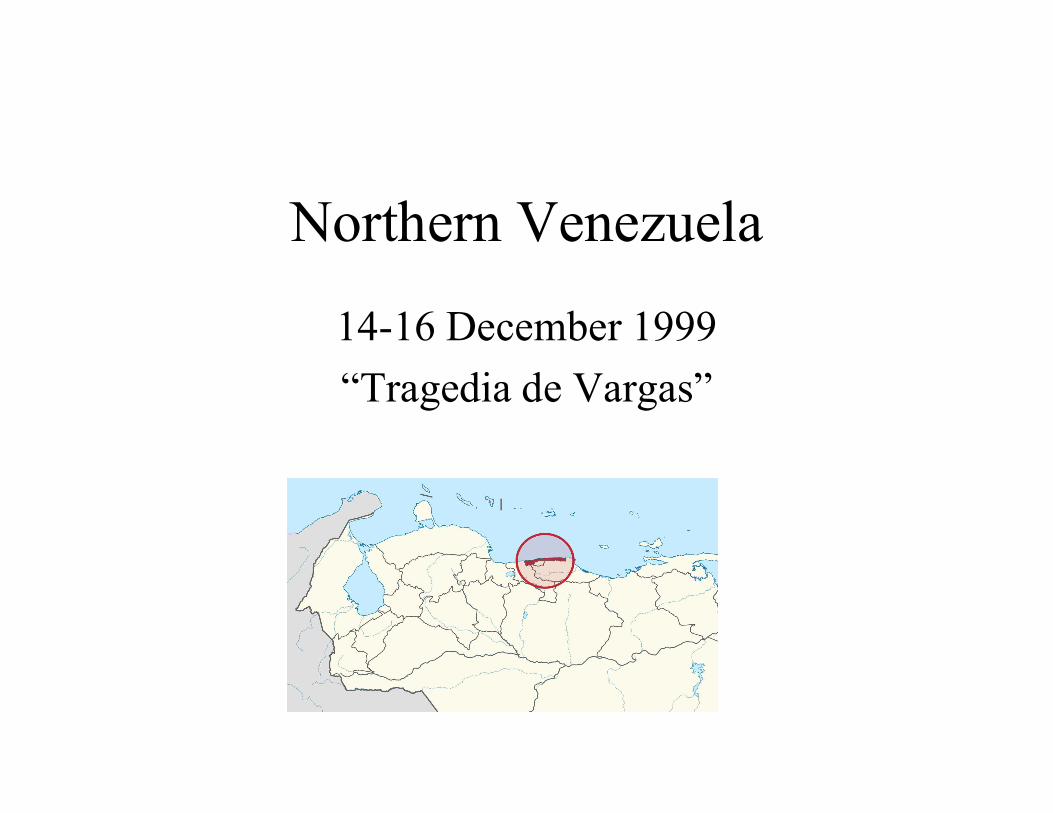
Northern Venezuela
14-16 December 1999
“Tragedia de Vargas”
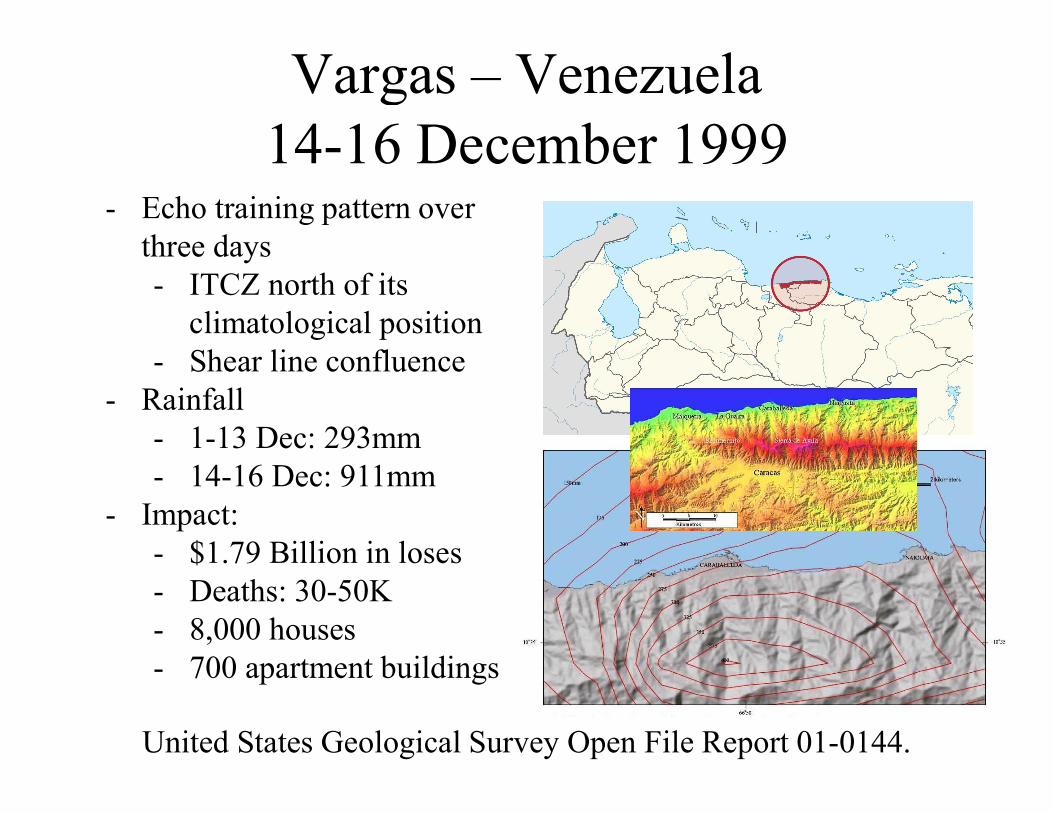
Vargas – Venezuela14-16 December 1999
- Echo training pattern over three days- ITCZ north of its
climatological position- Shear line confluence
- Rainfall- 1-13 Dec: 293mm- 14-16 Dec: 911mm
- Impact:- $1.79 Billion in loses- Deaths: 30-50K- 8,000 houses- 700 apartment buildings
United States Geological Survey Open File Report 01-0144.
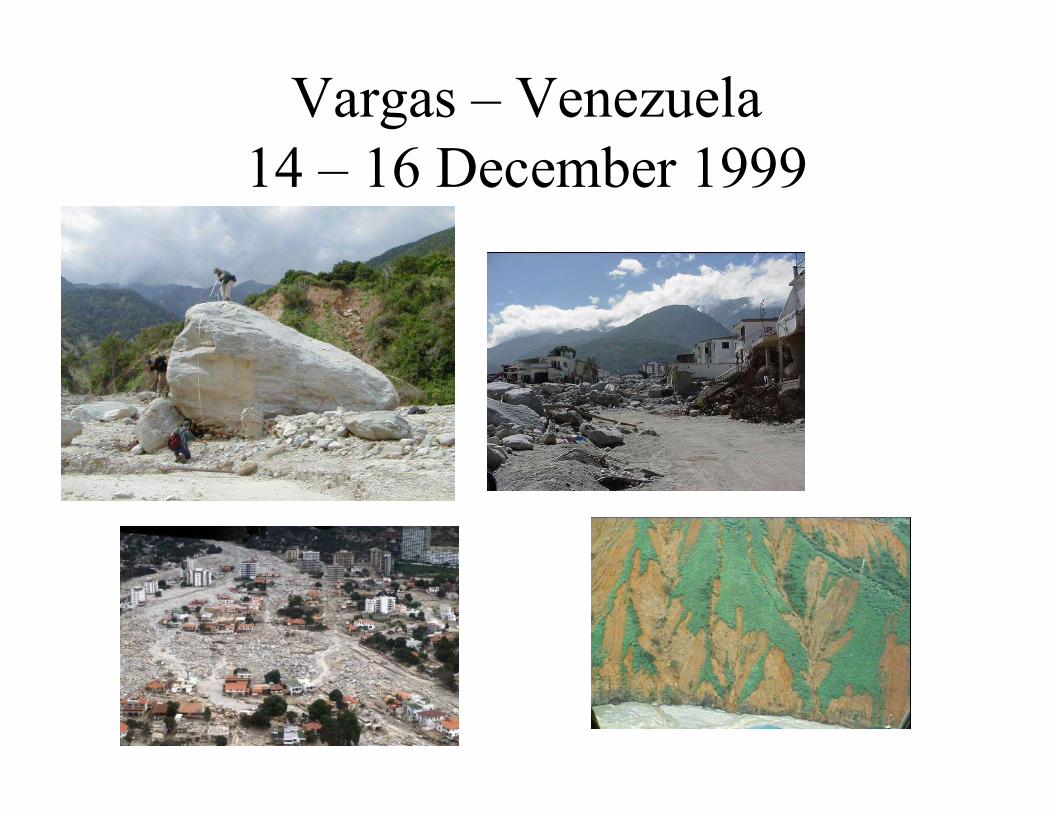
Vargas – Venezuela14 – 16 December 1999