
Climatology of extratropical cyclones over the South American–southern oceans sector

1
1
MODULATION OF CONVECTION
IN THE SOUTHWESTERN AMAZON BASIN
BY EXTRATROPICAL STATIONARY FRONTS
Thomas M. Rickenbach1
Rosana Nieto Ferreira2
Jeffrey Halverson1
Maria A. F. Silva Dias3
1Joint Center for Earth Systems Technology
University of Maryland, Baltimore County
NASA GSFC Mesoscale Processes Branch
Greenbelt, Maryland 20771 USA
2Goddard Earth Sciences and Technology Center
University of Maryland, Baltimore County
NASA GSFC Climate and Radiation Branch
Greenbelt, Maryland 20771 USA
3Institute of Astronomy and Geophysics
University of São Paulo
São Paulo, Brazil
Conditionally accepted, Journal of Geophysical Research, LBA Special Issue
Revised 19 June 2001
Corresponding author address: Dr. Thomas M. Rickenbach, Code 912, NASA Goddard Space FlightCenter, Greenbelt, Maryland, 20771 USA. Email: [email protected]

2
2
Abstract
Regimes of lower tropospheric northwesterly wind observed in southwestern Amazônia
during the Tropical Rainfall Measuring Mission Large-scale Biosphere Atmosphere
(TRMM-LBA) field campaign were shown to be local manifestations of stationary
frontal systems that extended into the deep Tropics along the South Atlantic Convergence
Zone ('SACZ' regime). Frontal systems were transient and were confined to the
subtropics during the interim periods of easterly and weak westerly flow ('non-SACZ'
regime). Observations from surface-based radar in TRMM-LBA suggested that
mesoscale convective systems in the SACZ regime were significantly larger in areal
coverage, with weaker rainfall intensity and weaker vertical development of the
convective cells. The diurnal variation of rain intensity and rain areal coverage generally
showed afternoon maxima for both regimes, but with important differences suggesting
explosive convective cell growth in the non-SACZ regime and the dominance of
nocturnal stratiform rain processes in the SACZ regime. These results had implications
for the parameterization (in general circulation models) of sub-grid scale convective
processes in Amazônia in terms of the large-scale flow, and for improving precipitation
and latent heating retrieval from space-borne platforms such as the TRMM satellite.
3
3
1. Introduction
The recent TRMM-LBA (Tropical Rainfall Measuring Mission Large-scale Biosphere
Atmosphere) WET-AMC (Wet season Amazon Mesoscale Campaign) field campaign
(hereafter TRMM-LBA) in the Brazilian state of Rondônia from January - February 1999
provided a detailed view of mesoscale convection over the southwestern Amazon Basin
during austral summer [Silva Dias et al. 2001a]. A primary goal of this experiment was to
integrate our understanding of the hydrological cycle in Amazônia, from the synoptic
scale to the scale of individual convective systems. The present study addressed the
relationship between variability of the synoptic-scale flow patterns over South America
and changes in the local mesoscale properties of convection in southwestern Amazônia.
These mesoscale properties included precipitation intensity, rainfall areal coverage,
convective cell versus stratiform rainfall fraction, and vertical reflectivity structure. We
will show that distinct regimes in the low-level wind direction (westerly versus easterly)
over the TRMM-LBA were influenced by the penetration of circulations associated with
stationary fronts into the deep Tropics. Important differences in the mesoscale properties
of convective systems were noted for these regimes. These results suggested that one of
the goals of the TRMM program, latent heating retrieval based on cloud-resolving model
simulations [Olson et al. 1999], should account for this variability. Another application of
this study will be to improve the parameterization of subgrid-scale convective processes
(over tropical South America) with respect to the large-scale flow in global or regional
scale models.
Aside from the strong diurnal cycle of rainfall, previous studies have suggested that
convective variability over Amazônia is modulated by extratropical baroclinic wave
activity. Liebmann et al. [1999] studied summertime (December-February, hereafter DJF)
variability of convection over South America and adjoining portions of the Atlantic
Ocean using a 17-season long record of outgoing longwave radiation (OLR, a proxy for
deep convection). They found that the OLR variance in the southwestern and central
Amazon Basin was dominated by timescales of 2-30 days, with strong peaks in the OLR
spectrum at 9 and 12 days. Liebmann et al. [1999] associated these spectral peaks with

4
4
the modulation of convection by strong mid-latitude cold fronts that often penetrate into
tropical latitudes. Along the eastern slope of the Andes Mountains, baroclinic waves
produce intrusions of cold air into the tropics that organized synoptic scale bands of deep
convection moving equatorward along the frontal boundary [Garreaud, 2000]. Ahead of
these fronts, low-level northwesterly flow extends from the tropics into the mid-latitudes.
Even though these systems occur all year round, tropical convection along these frontal
boundaries is strongest during austral summer, when low-level convergence is embedded
in a conditionally unstable environment [Garreaud, 2000]. Low frequency variability,
such as that associated with the 30-60 day Madden-Julian oscillation (MJO), appeared to
be of secondary importance compared to the influence of higher frequency phenomena.
In fact, Zhau and Weare [1994] suggested that the strong diurnal variability of Amazon
convection damped lower frequency variability in that region.
During the summertime, fronts often become stationary for several days over the
southeast Brazilian coast, producing a synoptic scale feature known as the South Atlantic
Convergence Zone (SACZ). Individual SACZ episodes may last for about one week, and
were composed of one or several mid-latitude cold fronts that intrude into the Tropics and
become stationary over southeastern Brazil. Previous studies have suggested that the
mean climatological position of the SACZ was determined by the Amazon basin
convection [Figueroa et al. 1995, Ferreira et al. 2001]. On the other hand, the strong
intraseasonal and interannual variability of the position and strength of the SACZ were
caused by variations in baroclinic wave activity that originate in the extratropical Pacific
Ocean [Liebmann et al. 1999]. A link between variability in the SACZ and the
intraseasonal oscillation was suggested by the presence of 30-60 day peaks in OLR
variability in the SACZ shown in Liebmann et al. [1999]. This link was made possible by
the existence of a Rossby wave-guide in the Pacific Ocean [Casarin and Kousky 1986,
Grimm and Silva Dias 1995, and Nogues-Paegle and Mo 1997].
Nogues-Paegle and Mo [1997] discussed the anticorrelation between a well-defined
SACZ and precipitation in the subtropical plains of Argentina. When the SACZ was
present, moisture transport from the Tropics was diverted eastward, away from the

5
5
Argentina plains and toward southeastern Brazil, along the stationary frontal zone
associated with the SACZ. This eastward shift in moisture transport during SACZ periods
was thought to be related to an eastward displacement of the South American low-level
jet, away from its typical position along the eastern foothills of the Andes Mountains
[Marengo et al. 2001].
These studies suggested that modulations in the South American low-level jet by
baroclinic systems may provide a connection between the SACZ and convection in
tropical South America. The goal of this paper is to show that changes in the statistical
properties of mesoscale convection in southwestern Amazônia were linked to low-level
northwesterly flow (related to the low-level jet) associated with a well-established SACZ.
The size, rain intensity, fraction of convective cell precipitation and vertical structure of
the convection in the southwestern Amazon Basin, were strongly influenced by the
degree to which stationary frontal systems (the SACZ) penetrated equatorward. Section 2
briefly describes the TRMM-LBA experiment and the data used in this study. Local wind
regimes in the TRMM-LBA region are discussed in Section 3 and are related to large-
scale flow features and patterns of large scale cloudiness. In Section 4, statistics and time
series from an analysis of convective systems observed by radar in southwestern
Amazônia are related to the wind regimes. Section 5 concludes with a discussion of how
oscillations in wind direction (associated with the establishment of the SACZ) may lead
to distinct regimes of mesoscale convection.
2. Data
A network of radar and sounding, instrumentation (Figure 1) operated continuously
during the TRMM-LBA field campaign, from mid-January to the end of February 1999
(Silva Dias et al. [2001a] provided details of all components of the experiment). Two
ground-based scanning Doppler radars, the NASA/NOAA TOGA C-band radar and the
NCAR SPOL polarimetric S-band radar, sampled the internal precipitation structure,
rainfall intensity, and radial velocity of precipitation systems. This study focused on
statistics of radar reflectivity from the TOGA radar. The local variation of tropospheric

6
6
winds was estimated from radiosonde data taken from the Abracos site, several
kilometers west of the TOGA radar location (see Halverson et al. [2001] for details).
Radiosondes were launched at Abracos nominally every three hours.
Data from the TOGA radar were used to produce cartesian volumes (1 km x 1 km x 1km
spacing) of radar reflectivity, extending to a circular area of radius 130km centered on the
radar. Reflectivity data was corrected for time-dependent calibration shifts, based on
intercomparisons with the TRMM satellite precipitation radar [Anagnostou et al. 2001].
Non-meteorological echoes associated with anomalous propagation, range aliasing, and
ground clutter were removed with a semi-automated method based on a radial velocity
mask [Kulie et al. 1999]. These reflectivity volumes were used to produce time series of
precipitation areal coverage and relative rainfall intensity at ten-minute intervals at a
height of 2km above ground level. An algorithm to separate convective cells from the
more homogeneous regions of stratiform rainfall1 [Steiner et al. 1995, Rickenbach and
Rutledge 1998] was applied to the reflectivity field. Mean vertical profiles of radar
reflectivity were determined for convective and stratiform portions of the reflectivity
field. An empirical relationship between radar reflectivity and rainfall, derived from
surface drop-size distribution data [Tokay et al. 2001], was used to convert reflectivity to
an estimate of areal-mean precipitation rate at 2 km height. Rainfall areal coverage was
defined as the area covered by reflectivity values of at least 10 dBZ (nominally 0.5 mm
hr-1). There is much uncertainty in rainfall retrieval from C-band radar data due to
attenuation, beam filling errors, and limited measurements of the distribution of
precipitation particle sizes. For this reason, only relative variations in the rainfall time
series will be emphasized in this work.
In order to examine the cloudiness distribution over South America, a three-hour global
infrared data set (14 km resolution), was obtained from the Global Hydrology Resource
Center (GHRC) at the Global Hydrology and Climate Center. We extracted a subset of
1 It is important to distinguish between the convective cell and stratiform portions of mesoscale
precipitation systems. The relative amount of rainfall from each component is related to the evolution of the
system and to the manner in which latent heat is distributed in the troposphere [Houze, 1989].

7
7
the global array of infrared brightness temperatures over South America to examine the
presence and motion of mid-latitude baroclinic systems and to produce composite maps
of infrared cloudiness.
Data from the NASA Data Assimilation Office (DAO) GEOS-2 data assimilation system
reanalysis [Chen et al. 1999] was used to establish the large-scale flow features over
South America during TRMM-LBA. This DAO reanalysis is a data assimilation
simulation carried out at a horizontal resolution of 2.0° latitude by 2.5° longitude. The
upper air analysis incorporated data from rawinsondes, dropwindsondes, aircraft winds,
cloud-tracked winds, and satellite-derived thicknesses. The DAO simulations did not
assimilate soundings taken as a part of the TRMM-LBA field campaign, and thus
provided an independent estimate of the local wind field.
3. Local and large scale wind regimes
In this section, we explored relationships between wind regimes observed locally at the
Abracos site and the large-scale circulation patterns over South America. In particular,
we focused on the effect of stationary mid-latitude frontal systems on local wind
variation in the TRMM-LBA region. The local wind regimes were illustrated with
sounding data from the Abracos pasture site, near the TOGA radar. The large-scale flow
was represented by the DAO reanalysis.
3.1 Local wind regimes
Sounding data from Abracos were used to construct time series of the zonal and
meridional wind components (Figure 2). Gaps in the time series of up to one day were
filled with linear interpolation of surrounding data points. A significant feature of the
zonal wind time series (Figure 2a) was alternating periods of westerly (shaded) and
easterly winds in the lower and middle troposphere. Most conspicuous were two periods
(each nearly one week long) of sustained westerly winds in mid January and late
February, separated by about 40 days. Westerly flow in these periods extended from the

8
8
surface to the upper troposphere. In the intervening periods, winds were generally
easterly in the mid troposphere with variable winds below 900 mb. The exception was a
period in late January and early February where weak westerly winds extended to the
mid-troposphere, though not as well defined as the other two westerly periods. The
meridional wind field (Figure 2b) in general was northerly in the lower troposphere and
southerly (shaded) in the upper troposphere. Notable exceptions included alternating
periods of southerly and northerly winds in the upper troposphere in early February.
The zonal component of the wind was used to define wind regime periods, for the
purpose of composite analysis, in the following way. A westerly regime was defined
when westerly winds extended from the surface to 800 mb for at least three consecutive
days. The interim periods were defined as easterly regimes. Two major and one minor
westerly wind episodes were characterized by a deep layer of westerly winds extending
from the surface to at least 400 mb. The first major westerly wind period (hereafter
referred to as W1) began on 14 January and lasted until January 19 (Figure 2a). A second,
weaker, episode of westerly winds (W2) occurred from 29 January through 8 February.
The other major westerly wind episode (W3) began on February 22 and ended on March
1 (DAO reanalysis data suggested that W3 continued through the first week of March,
however the regime definitions were limited to the availability of radar data). In general,
the onset of westerly winds occurred in the lower troposphere and extended upward with
time. During the interim periods, low-level easterly winds (E1: 11-14 January; E2: 19-29
January; E3: 8-22 February) prevailed in the mid-troposphere. These regime periods are
listed in Table 1.
To summarize, the overall pattern of wind variability was one of alternating periods of
northwesterly and northeasterly winds in the lower troposphere. In general, upper
tropospheric winds were southeasterly, except during E2 where the flow was
southwesterly. These local wind regimes were very similar to wind time series extracted
from the DAO reanalysis over the TRMM-LBA region [Herdies et al. 2001]. Since the
TRMM-LBA sounding data were not assimilated into the DAO reanalysis, the sounding
data provided an independent check that the DAO reanalysis captured the local wind
9
9
variations in the TRMM-LBA region and lent credence to the DAO composite analysis
shown in the next section.
3.2 Large scale circulation and stationary fronts
In this section, we present evidence that the two strong westerly wind periods (W1 and
W3) were local manifestations of continental scale circulation variability, due to
stationary fronts (associated with the SACZ) extending into the Tropics. Composites of
DAO winds at 850 mb and 200 mb, infrared cloud patterns, and observations of frontal
positions were used to support this hypothesis.
Observations of the movement of baroclinic frontal zones during TRMM-LBA were
reported in the Brazilian Space Agency's Monthly Climate Bulletin [Climanálise 1999].
Cold fronts typically propagated northeastward in succession along the southeastern
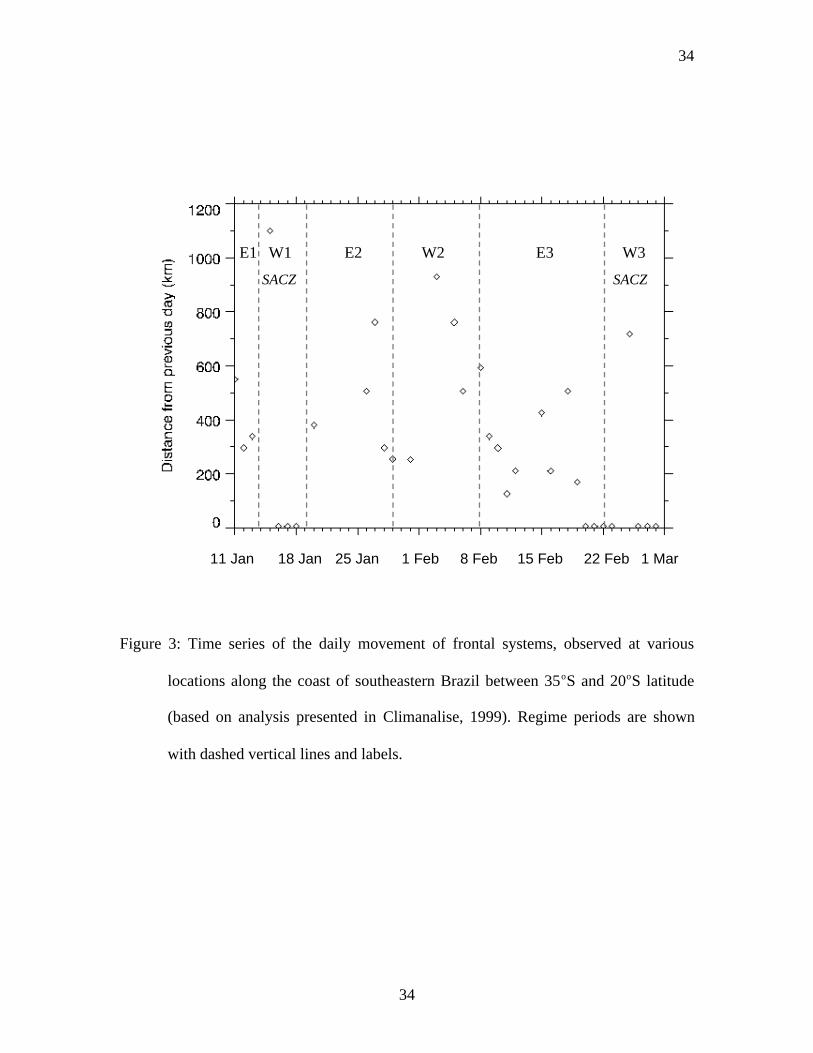
Brazilian coast, extending into the interior of the continent. Shown in Figure 3 is a time
series of the distance traveled by individual frontal systems each day during the TRMM-
LBA period, as observed by stations along the coast, based on data provided in
Climanálise [1999]. Each frontal system was readily identified by animations of the
infrared cloudiness imagery used in this study. Values of zero indicated that the front was
stationary for that day. Figure 3 showed that the occurrence of stationary fronts for
several consecutive days coincided remarkably with the two strong westerly wind periods
(W1 and W3) in the TRMM-LBA region. This suggested a relationship between the
strong local westerly flow in southwest Amazônia and stationary extratropical frontal
systems that extend into the Tropics. Based on discussion in Section 1, the presence of
fronts that become stationary over southeast Brazil for several days is a hallmark of the
SACZ. We will therefore refer to the combination of W1 and W3 as the 'SACZ' period,
and the easterly regimes (E1, E2, and E3) combined with the weak westerly regime (W2)
as the 'non-SACZ' period (Table 1). At this point it is worth stating that the results shown
in the next sections were not very sensitive to whether W2 was included in the non-
SACZ period, so that the contrast between SACZ and non-SACZ regimes was similar to
the contrast between easterly and westerly flow regimes.

10
10
In order to explore the relationship between the establishment of the SACZ and the local
strong westerly wind periods, composites of the DAO reanalysis winds were produced
for the SACZ and non-SACZ periods. In both composites, lower tropospheric (850 mb)
easterly winds associated with the South Atlantic High extended across the Amazon
Basin. The SACZ composite (Fig. 4) revealed a strong 850 mb northwesterly flow feature
emanating from the deep Tropics into the mid-latitudes that passed through and east of
the TRMM-LBA region. The main axis of the northwesterly flow extended from
southwestern Amazônia to the southeast and entered the Atlantic Ocean in the vicinity of
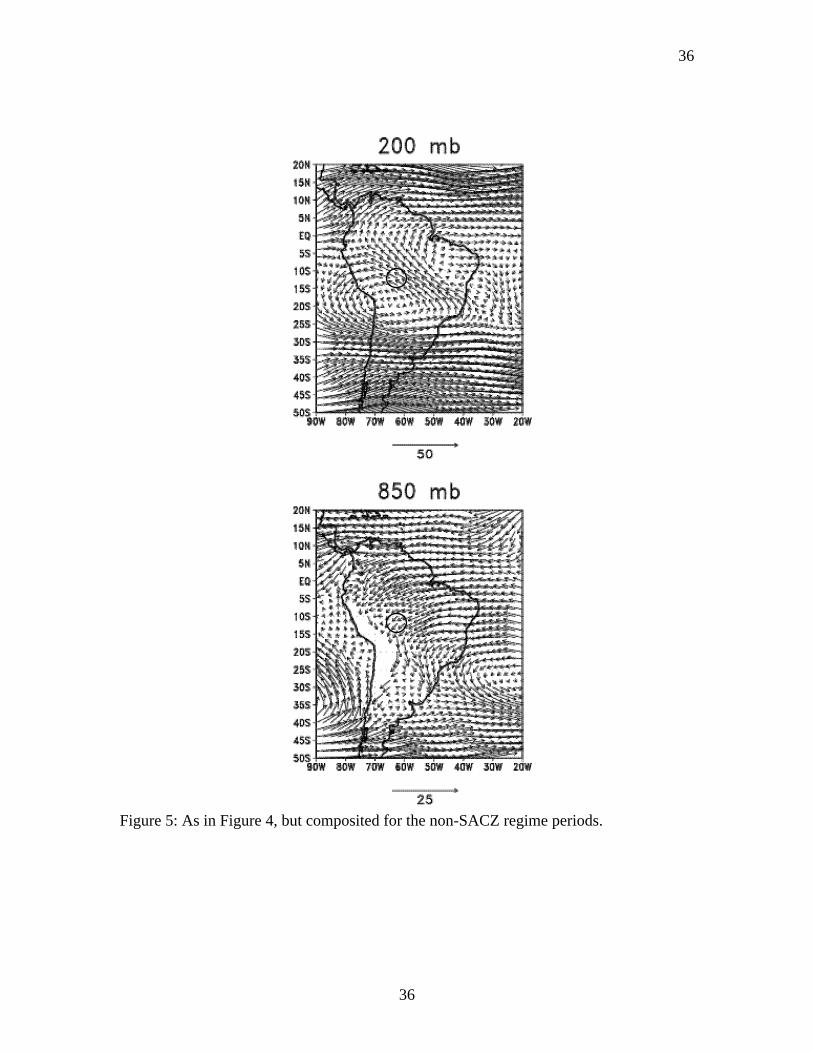
25oS, 50oW (near the city of São Paulo, Brazil). In contrast, the non-SACZ composite
(Figure 5) showed tropical easterlies extending through the TRMM-LBA area to the
foothills region, so that the northwesterly flow was restricted to the Andes foothills.
Blocking of the low-level flow by the mountains tended to produce northwesterly winds
along the foothill region east of the Andes [Gandu and Geisler 1991]. However, at 20oS
latitude the SACZ composite low-level northerly jet was displaced nearly 1500 km
eastward of its position in the non-SACZ composite. This change in position of the low-
level northerly jet had important consequences for the hydrological balance over South
America as discussed in Herdies et al. [2001]. The 850 mb wind composites were
consistent with local wind observations at the Abracos site.
In both composites the dominant feature at 200 mb was the Bolivian High, centered near
20oS, a well-known feature of the summer circulation over South America [Silva Dias et
al. 1983]. The circulation around the Bolivian High produced southeasterly winds over
the central and western Amazon basin which dominated the upper-level flow in the
TRMM-LBA region, consistent with the sounding data. When compared to its
counterpart in the SACZ composite, the non-SACZ composite Bolivian High had a more
clearly defined closed circulation, and was shifted poleward by about 5o. The non-SACZ
composite revealed a well-defined upper-level trough over Northeast Brazil. This was
possibly due to the presence of stronger upper-level anticyclonic shear in the non-SACZ

11
11
composite2. In the SACZ composite a weaker upper-level trough was located over the
Atlantic Ocean, and did not extend equatorward of 15oS latitude.
At this point, some discussion on the distinction between the weak westerly wind period
(W2) and the SACZ regime (W1 and W3) is useful. The DAO wind composite for W2
(not shown) also contained the northwesterly flow branch extending poleward from the
deep tropics. However, the W2 and SACZ wind composites differed in two important
regards. First, northwesterly flow in W2 was restricted to the foothills of the Andes,
mainly west of the TRMM-LBA area, and did not extend into the interior. Second, the
200 mb trough over NE Brazil was a closed cyclonic circulation which propagated
westward during the first week of February in the W2 DAO and cloudiness fields. The
local signature of these propagating cyclones may be seen in the meridional winds from
the Abracos sounding data (Figure 2b). The winds in the upper troposphere shifted from
southerly to northerly between 4 Feb and 7 Feb, consistent with the westward
propagation of an upper-level cyclonic circulation. The convergence on the leading edge
of these travelling upper-level cyclones have been shown to suppress the occurrence of
deep convection as they travel westward [Kousky and Gan 1981], which may have
inhibited the establishment of a stationary front during W2.
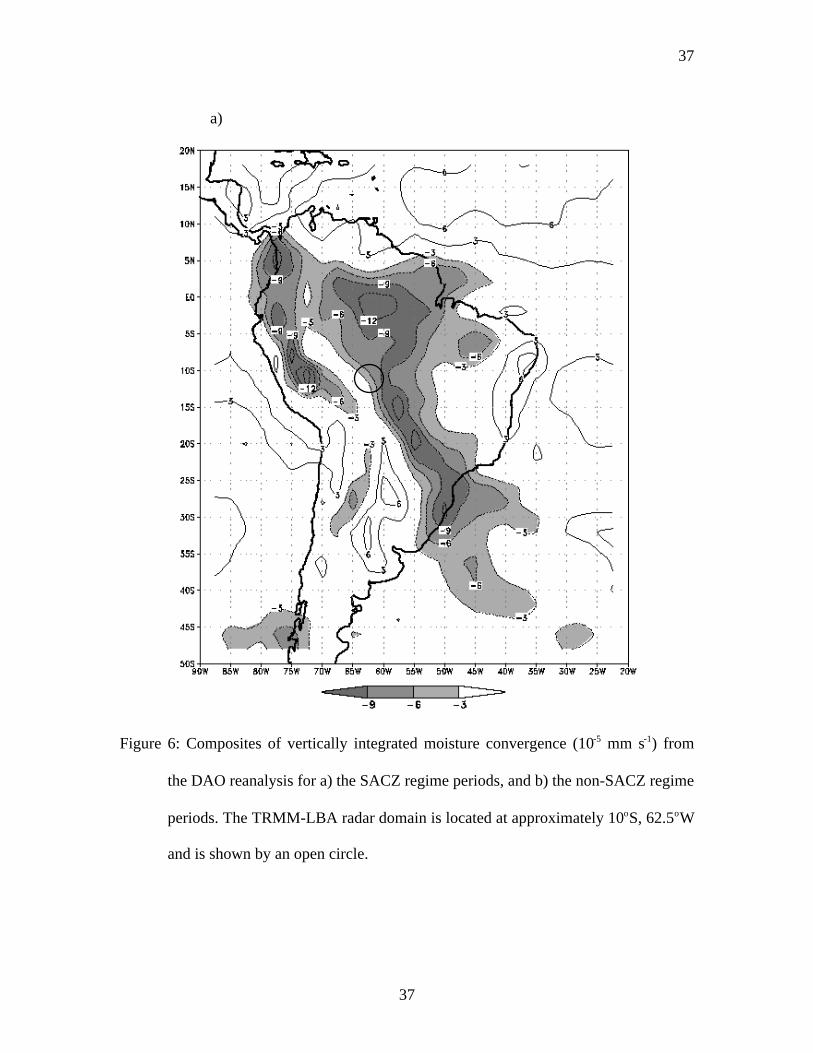
The northwesterly flow in the SACZ composites appeared to serve as a conduit for
moisture transport out of the Tropics along the SACZ. This was illustrated by the SACZ
and non-SACZ composites of vertically integrated moisture convergence, taken from the
DAO reanalysis (Figure 6). The main axis of moisture convergence in the SACZ
composite extended from the deep Tropics southeastward to the Atlantic Ocean, and
corresponded to the location of the northwesterly flow branch. This feature was not
present in the non-SACZ composite, suggesting that tropical moisture did not extend into
2 These upper tropospheric cyclones form near the core of the South Atlantic mid oceanic trough and
propagate northwestward toward Northeast Brazil [Kousky and Gan 1981]. They can be thought of as
extrusions of high potential vorticity midlatitude air into the tropics through a Rossby wave breaking
process that involves trough thinning in regions of enhanced anticyclonic wind shear [Thorncroft et al.
1993].

12
12
the subtropics. A northwest-southeast oriented elongated region of low-level
convergence, responsible for the vertically integrated moisture convergence, was a
characteristic signature of the SACZ [Kodama, 1992].
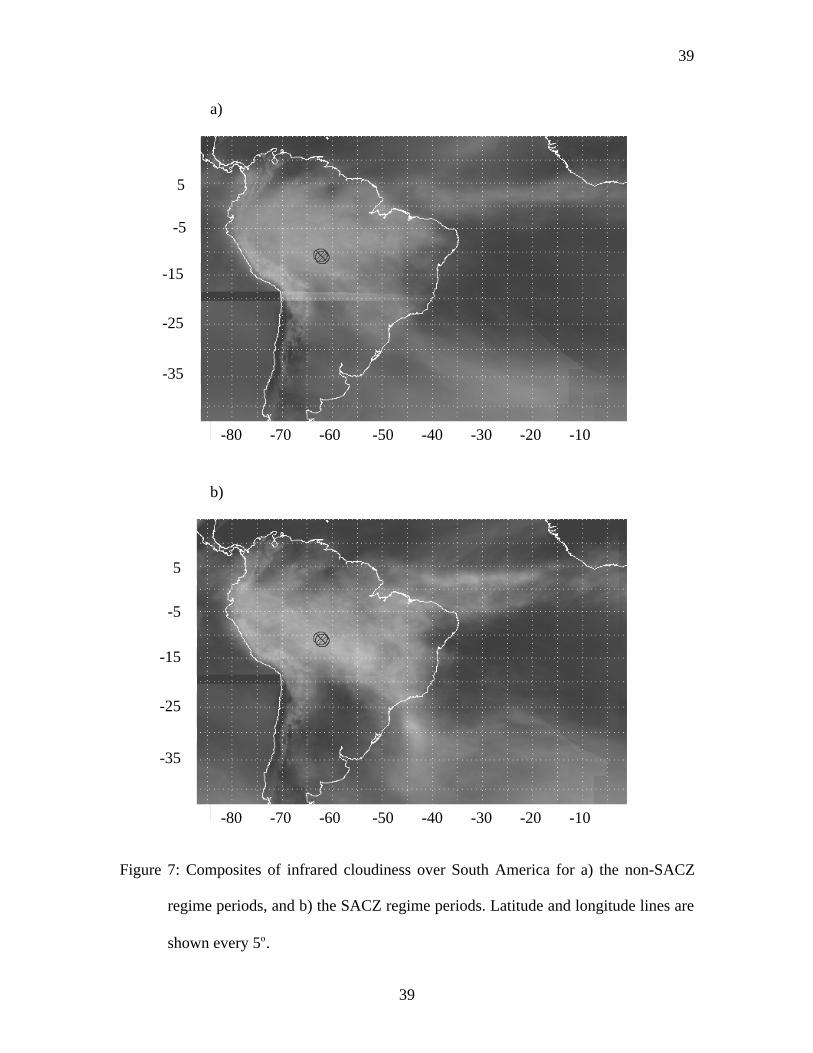
Composites of infrared cloudiness (Figure 7) provided further, independent evidence that
the northwesterly flow feature was associated with the SACZ. The cloudiness composite
for the SACZ regime showed a mass of deep cloud extending southeastward out of the
Tropics and into the Atlantic Ocean. This cloud band was collocated with the axis of
northwesterly flow and moisture convergence from the DAO composites. The non-SACZ
composite also contained a weak but similarly located cloud feature. However, animation
of infrared cloud imagery as well as the propagation of frontal systems shown in Figure 3
showed that frontal systems were in fact present in the non-SACZ regime, as suggested
by Figure 7a. The distinction was that these fronts were not stationary, and did not
penetrate as deeply into the tropical regions compared to the SACZ regime stationary
fronts. This interpretation was supported by the observation that the cloud band extending
into the Atlantic Ocean in the non-SACZ composite was nearly detached from the
tropical cloud mass, at about 15o latitude.
In summary, the DAO wind and moisture convergence composites, daily frontal
propagation, and infrared cloudiness patterns supported the hypothesis that the strong
westerly wind periods in the TRMM-LBA region were local manifestations of stationary
frontal systems associated with the SACZ which penetrated into the deep Tropics. In the
presence of stationary frontal regions characteristic of the SACZ, northwesterly low-level
winds were produced in southwestern Amazônia along the frontal zone. The non-SACZ
regime (generally easterly winds) represented periods when baroclinic systems were
transient and did not penetrate into the Tropics. Next, we examine how mesoscale
convection in the TRMM-LBA region responded to these regimes.

13
13
4. Radar rainfall statistics
It was argued in the previous section that stationary frontal systems penetrating into the
Tropics led to regimes of strong northwesterly flow in the TRMM-LBA region, with
easterly or weak westerly winds in the interim. In this section, we explore how mesoscale
convection in southwestern Amazônia responded to these regimes. A priori, modulations
in precipitation intensity and areal coverage, convective and stratiform fractions of
precipitation, vertical structure, and the diurnal variation of rainfall, might be expected in
oscillating wind regimes, assuming different thermodynamic properties of the flow
source region and different shear profiles. For example, in the tropical western Pacific,
the vertical structure and organization of convection responded to changes in
tropospheric moisture and wind shear through one cycle of the intraseasonal oscillation
[DeMott and Rutledge 1998, Rickenbach and Rutledge 1998]. Flow reversal associated
with the establishment of the monsoon trough in Darwin, Australia led to weak
convective systems dominated by stratiform rain in an oceanic regime of low convective
available potential energy [Williams et al. 1992].
We employed surface-based radar data collected during TRMM-LBA to illustrate
distinctions in morphology and precipitation of mesoscale convection for the SACZ and
non-SACZ regimes. Other parallel studies focused on changes in stability, boundary layer
thermodynamics, shear and airflow source properties [Halverson et al. 2001, Betts et al.
2001, Williams et al., 2001, Cifelli et al. 2001].
4.1 Rainfall and areal coverage time series
Shown in Figure 8 was a time series of conditional rainfall rate (TOGA radar) from mid-
January to the end of February. Conditional rainfall rate was defined as the rainfall rate at
a height of 2 km, normalized by the raining area, and thus was a measure of the areally
averaged rain intensity. Spectral analysis of the rainfall time series (not shown) revealed

14
14
strong diurnal variability, with no clear signal at lower frequencies. In order to examine
longer time scale variations, a Fourier decomposition was performed to remove
variability of less than eight days (the result is shown as the thick solid curve in Figure 8).
Eight days corresponded to the average length of each individual wind regime period.
The filtered time series strongly suggested that each of the three westerly wind events
were associated with relative minima in rainfall intensity. The minima were particularly
evident during W1 and W3 (the SACZ regime), while higher rainfall intensities occurred
during the easterly wind periods. Application of the Student T-test showed that the mean
rainfall intensity was significantly different for the SACZ and non-SACZ regimes with a
confidence level of greater than 99%.
Time series of the fraction of the radar’s area covered by rainfall (Figure 9) revealed that
mesoscale convective systems were, on average, larger during the SACZ periods (with a
confidence level greater than 99%). The low frequency variability corresponded well to
that of rainfall intensity. Mesoscale convective systems that occurred during SACZ
periods were larger but had weaker rain intensity than those of non-SACZ periods.
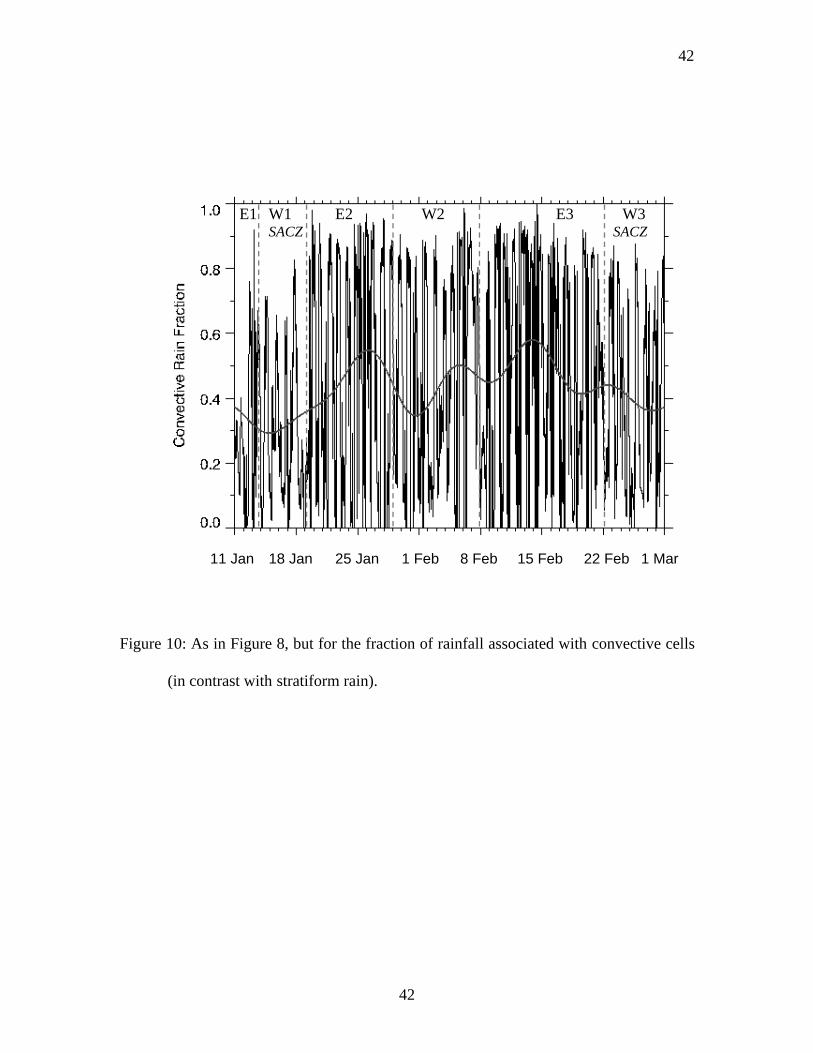
Similar variability may be seen in the time series of convective rainfall fraction (Figure
10), which was defined as the fraction of the total rainfall associated with convective
cells by the convective - stratiform partitioning technique (Section 2). Higher values of
convective rain fraction indicated more rainfall associated with convective cells
compared to lighter and more uniform stratiform rain. The strong diurnal oscillation was
a consequence of the evolution of mesoscale convective systems, beginning as isolated
convective cells in the late morning and transitioning to stratiform rainfall late in the day
(see Section 4.3). As with conditional rainrate, the association of low convective rain
fractions with the SACZ periods was very clear (greater than 99% confidence level).
These observations showed that mesoscale systems in the SACZ regime were larger, but
had weaker rainfall intensity and less convective rainfall than non-SACZ regime systems.
The mean rain intensity, rain area, and the convective versus stratiform partition of these
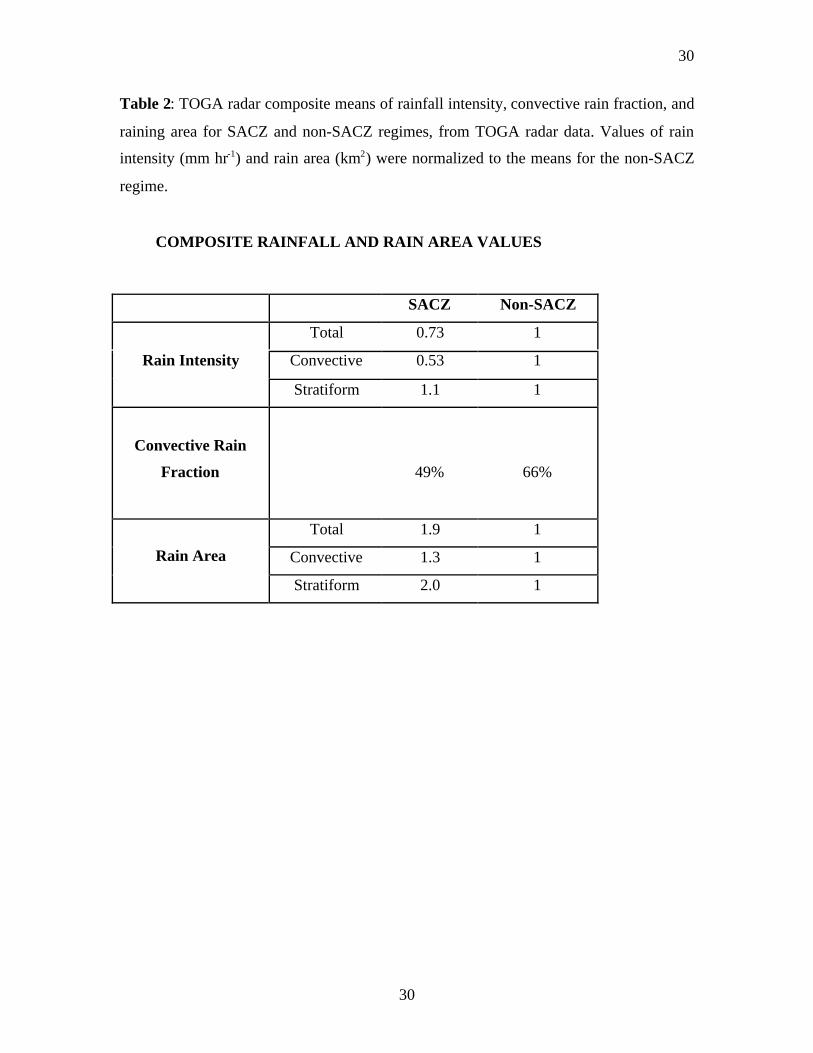
quantities for the SACZ and non-SACZ regimes were summarized in Table 2. The
average total (convective and stratiform combined) rainfall intensity for the SACZ

15
15
regime was 27% lower compared to the non-SACZ regime. Note that the convective
rainfall intensity was 47% lower in the SACZ regime, while the stratiform rainfall
intensity was slightly (10%) higher. This observation suggested that the difference in
rainfall intensity was primarily due to differences in convective cell processes during
SACZ periods. This conclusion was supported by the lower mean convective rainfall
fraction for the SACZ period (49%), compared to 66% for the non-SACZ period.
Mesoscale convective systems were, on average, nearly twice as large in areal coverage
during SACZ periods, mostly associated with larger stratiform rain areal coverage.
Conditions in the SACZ regime clearly favored large, widespread mesoscale convective
systems comprised of broad stratiform rain and weak convection. Systems in the non-
SACZ regime were smaller, with more intensely precipitating convective cells, associated
with propagating squall lines [Cifelli et al. 2001, Silva Dias et al. 2001b].
4.2 Vertical reflectivity structure
The mean profile of radar reflectivity with height provides insight as to the intensity of
convective updrafts and microphysical processes in mesoscale convective systems [Szoke
et al. 1986, Yuter and Houze 1995]. Vertical reflectivity profiles were calculated for the
SACZ and non-SACZ regime. Mean profiles were constructed after converting dBZ to
linear reflectivity factor for each volume, limiting the analysis to below the vertical level
(about 13 km) where the areal coverage of echo was at least 15% of the echo coverage at
a height of 2 km (based on Yuter and Houze [1995]). Separate profiles were constructed
for convective and stratiform portions of the echo pattern based on the convective -
stratiform partition at a vertical level of 2 km.
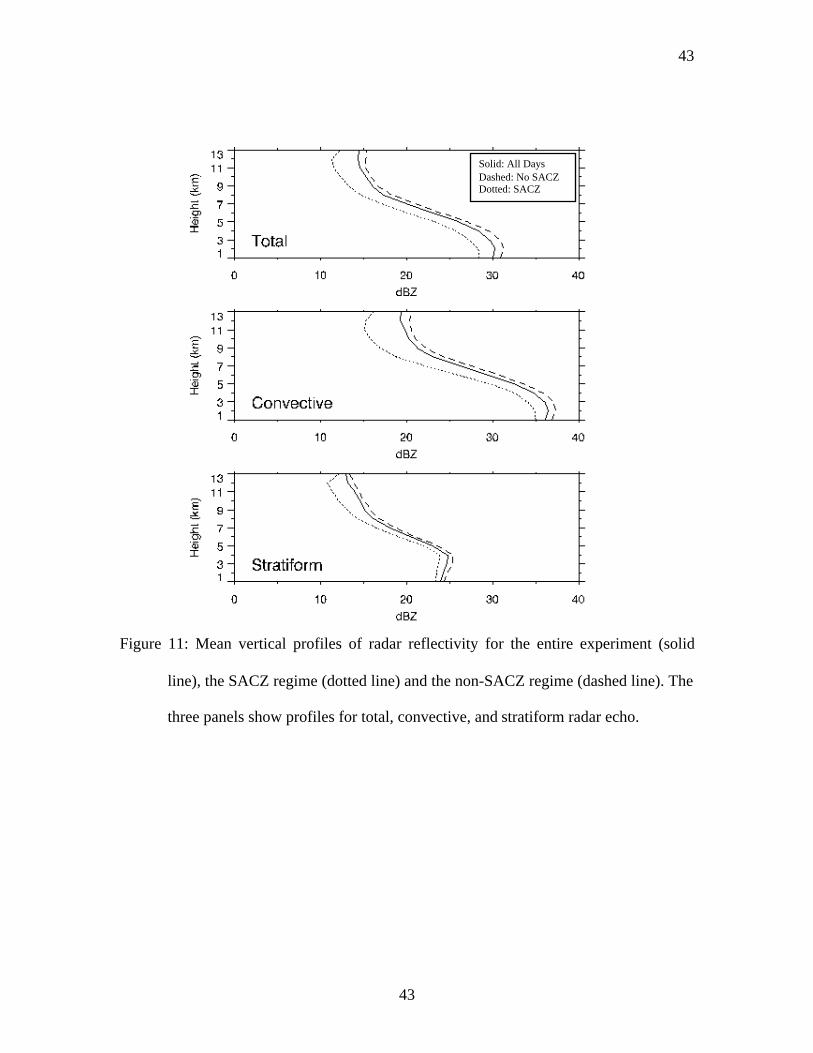
The mean reflectivity values for the SACZ regime were lower at all vertical levels than
that for the non-SACZ regime (Figure 11). The difference between SACZ versus non-
SACZ mean values increased with height in the mixed-phase region of the echo, above
the nominal 0oC level of 4.5 km, for convective, stratiform, and total echo areas. This
difference was largest in the convective portion of the systems at upper levels, with a
maximum difference of 5 dBZ at a height of 11 km (difference in mean values were

16
16
significant to greater than a 99% confidence level). Below the 0oC level, reflectivity
differences (1-3 dBZ) were roughly constant with height.
These results suggested that the production of condensate in convective cells in the upper
troposphere was enhanced in the non-SACZ regime compared to the SACZ regime. This
conclusion was consistent with the findings by Petersen et al. [2001] of higher lightning
frequency (which is tied to greater ice mass in the mixed phase region of the convective
cells) in the easterly wind (non-SACZ) regimes during TRMM-LBA. Cifelli et al. [2001]
found larger vertical updraft speeds in the upper troposphere in easterly regime
convective systems compared to westerly regime systems in TRMM-LBA, consistent
with the present result. The non-SACZ regime was characterized by larger values of
convective available potential energy compared to the SACZ regime, with a capping
inversion 1-2 km above the surface [Halverson et al. 2001], consistent with more
explosive convection, stronger vertical drafts, and higher condensate mass in the upper
troposphere.
4.3 Diurnal composites
Composites of the diurnal variation of rainfall intensity and precipitation areal coverage
(Figures 12 and 13) provided further insight into the differences in mesoscale convection
for the SACZ and non-SACZ regimes. The diurnal composites were partitioned by
convective and stratiform components, as discussed earlier. Both regimes were typified
by a sharp increase in rainfall intensity between 1000 and 1200 local time, all in the
convective component of rainfall. The increase was faster and larger in the non-SACZ
regime, consistent with the explosive convective growth implied by the vertical
reflectivity profiles shown in Section 4.2, and the strong updrafts of a non-SACZ
(easterly) regime case [Cifelli et al. 2001]. The maximum rainfall occurred between about
1500 and 1700 local time in each regime. The timing of the diurnal cycle was generally
consistent with a 17 year record (1979-1996) of rain gauge data at Ji Parana (the TRMM-
LBA region) presented in Liebmann et al. [1998], and to a preliminary analysis of rain
gauge data during TRMM-LBA (B. Fisher, personal communication).
17
17
The stratiform rain intensity displayed a weak early evening maximum (2100 local time)
in the non-SACZ regime. This observation may reflect the several-hour time delay
between peak convective rain rate and the peak in stratiform rain area, typical of the life
cycle of organized squall line systems [McAnelly and Cotton 1989]. As convection
decayed, the stratiform area increased after local midnight (Figure 13). It was not clear
whether this was due to the life cycle effect, since there were two nocturnal squall line
systems (15 February and 18 February) that may have contributed to the increase in
stratiform rain area. In contrast, the stratiform rain intensity of the SACZ regime
remained constant throughout the day and night, and actually exceeded the convective
rain intensity at night. This suggested that the nocturnal maximum in stratiform areal
coverage, also present in the SACZ regime, may have been due to a nocturnal resurgence
of stratiform due to mechanisms independent of convective cells, such as radiative or
large scale dynamical processes. There were at times field observations of weak but
extensive nocturnal stratiform precipitation events, with no obvious convective source,
which formed after local midnight and persisted into the morning hours. Conspicuous
events occurred on 18 January, between 2 - 5 February, and between 24-26 February, all
during westerly periods. These nocturnal stratiform events had characteristics of shallow
stratocumulus drizzle. Detailed case studies should shed more light on the mechanisms of
the complex features present in the diurnal variation of precipitation.
5. Conclusions
The alternating regimes of low-level easterly and westerly winds observed locally over
southwestern Amazônia were related to large-scale changes in the circulation patterns
over South America. Distinct westerly wind events in the lower troposphere observed
during the TRMM-LBA field campaign were suggested to be local manifestations of
baroclinic wave influence into tropical latitudes during the summer season. The strong
low-level northwesterly winds observed during mid-January and late-February 1999 was
a local signature of northwesterly flow along a stationary frontal zone that defined the
South Atlantic Convergence Zone. Drawing upon the scenario presented by Garreaud

18
18
[2000], the northwesterly flow ahead of frontal zones transported moist air from the
equatorial Amazon Basin southeastward into the subtropics. This pattern was clearly
demonstrated in the large-scale patterns of circulation, moisture convergence, and
cloudiness during the SACZ periods. In contrast, the northwesterly flow branch during
non-SACZ periods was weaker in magnitude and remained outside of the deep tropics,
poleward of 15o south latitude. This suggested that baroclinic waves extended much
deeper into tropical latitudes, with stationary frontal zones penetrating the interior of
Amazonia during the SACZ periods. The non-SACZ periods were characterized by
frontal systems that were transient and did not extend into the Tropics.
These contrasting large-scale flow patterns had important consequences for mesoscale
convection in southwestern Amazônia. In the TRMM-LBA region, mesoscale convective
systems during the SACZ regime produced 27% less rainfall, mainly due to weaker
convective rain intensity, but were on average twice as large in area compared to systems
in the non-SACZ regime. Time series of these parameters indicated a remarkable
correspondence with the wind regimes. Differences in the profiles of radar reflectivity in
the upper portion of convective cells suggested that the non-SACZ environment was
more conducive to stronger convective updrafts in the upper troposphere. Diurnal
variation of rain intensity and rain area suggested explosive growth of afternoon
convection in the non-SACZ regime. The diurnal results for the SACZ regime hinted at
the possibility that the large-scale environment, not convective processes, enhanced the
stratiform rain process at night. Furthermore, Petersen et al. [2001] suggested that the
relationship between mesoscale convection and flow regime shown here appeared to be
present in other years, implying a more general result.
Other studies of TRMM-LBA convection were consistent with these observations,
though the physical mechanisms for differences in mesoscale convection were not clear.
Petersen et al. [2001] presented observations of significantly higher lightning flash rates
(indicative of enhanced vertical intensity of convection) during the non-SACZ (easterly)
regimes, while Cifelli et al. [2001] showed that updrafts in a non-SACZ (easterly) regime
convective system were much stronger than an SACZ (westerly) regime counterpart.

19
19
Another study pointed to differences in the thermodynamic environment between the
regimes [Halverson et al. 2001]. They suggested that dry mid-level air, present in easterly
flow, introduced convective inhibition into the thermodynamic profile that, given
sufficient boundary layer moisture and a triggering mechanism, led to explosive
convection. As low-level wind direction alternated between westerly and easterly, the
concentrations of cloud condensation nuclei changed, with "cleaner" low-level air in
westerly regimes leading to less condensate in the upper portions of convective clouds
and weaker electrification [Williams et al. 2001]. Mesoscale circulations associated with
elevated topography west of the TRMM-LBA area may have provided a favored region
for the formation of mesoscale convective systems [Laurent et al. 2001]. Boundary layer
evolution differed significantly between forest and pasture regions [Silva Dias et al.
2001a]. These studies implied that as the low-level flow direction reversed,
thermodynamic properties of the source air and mesoscale circulations associated with
topography or land-type contrasts could lead to changes in the mesoscale organization of
convection. We further speculate that fundamentally different tropospheric shear profiles
in each regime may have played a role. For example, during the westerly regime, the
motion of convective systems was opposite to the upper tropospheric flow. This might
lead to large system-relative displacements between condensate ejected from convective
cells and the location of new cell growth, resulting in large precipitation areal coverage.
The differences in mesoscale convection in the SACZ and non-SACZ regimes in
southwestern Amazônia was reminiscent of the contrast between "monsoon period"
versus "break period" wet-season convection in Darwin, Australia near the maritime
continent [Williams et al. 1992]. In Darwin, the establishment of the monsoon trough
brought oceanic air (low convective available potential energy) over Northern Australia,
resulting in widespread stratiform rainfall with weak embedded convection compared to
the intense squall lines of the break period. In Amazônia, the South Atlantic Convergence
Zone, with the associated penetration of mid-latitude stationary frontal circulations into
the Tropics, was the analog to the monsoon trough in Darwin, responsible for periodic
low-level flow reversals. The present study suggested that, in southwestern Amazônia,
the flow direction reversal in the SACZ regime led to precipitation characteristics similar

20
20
to that of the Darwin monsoon regime. The northwesterly SACZ regime flow may have
tapped air with "oceanic" characteristics from the forested interior of the Amazon Basin
[Williams et al. 2001], resulting in convection with properties like those of the Darwin
monsoon. However, the large-scale control on these regimes was quite different. While
flow regimes in Darwin were modulated by the position of the monsoon trough,
baroclinic systems controlled the flow regimes in southwestern Amazônia.
These results may be used as guidance for improving parameterization of sub-grid scale
convective processes associated with wet-season Amazon Basin convection in terms of
the large-scale flow in general circulation models. Furthermore, the large difference in
mesoscale convective system structure for different synoptic regimes at a single tropical
continental location has implications for the improvement of precipitation and latent
heating retrieval from the TRMM satellite.
21
21
ACKNOWLEDGEMENTS
This project was funded by a NASA Tropical Rainfall Measuring Mission (TRMM) grant
(NAG5-9816) and by a direct award under NASA Research announcement NRA 98-
MTPE-01 (Large-scale Biosphere Atmosphere Project). We wish to acknowledge helpful
discussions with many TRMM and LBA scientists, particularly Drs. Alan Betts, Dennis
Boccippio, Robert Cifelli, George Kiladis, Jose Marengo, Mr. Andrew Negri, Drs. Walt
Petersen, and Earle Williams. We thank Dr. Dirceu Herdies of the Brazilian Space
Agency's Center for Weather Prediction and Climate Studies (CPTEC-INPE) for
insightful discussions and help with the DAO reanalysis products. Thanks also to Mr.
David Wolff of the TRMM Satellite Validation Office for help with the radar data
processing and quality control. The NASA Seasonal to Interannual Prediction Project
(NSIPP) is acknowledged for part of the computer resources used in this study.
Geostationary satellite data was obtained from the Global Hydrology Resource Center
(GHRC) at the Global Hydrology and Climate Center, Huntsville, Alabama, USA, and
Dr. Carlos Morales aided in working with this data set.

22
22
REFERENCES
Anagnostou, E. N., C. A. Morales, and T. Dinku, The use of TRMM precipitation radar
observations in determining ground radar calibration biases, J. Atmos. Ocean.
Tech., 18, 616-628, 2001.
Casarin, D. P., and V. E. Kousky, Anomalias de precipitação no sul do Brasil e variações
na circulação atmosférica, Rev. Bras. Meteor.,1, 83-90, 1986.
Chen, M. H., R. B. Rood, and J. Joiner, Assimilating TOVS humidity into the GEOS-2
data assimilation system, J. Climate, 12, 2983-2995, 1999.
Cifelli, R., W. A. Petersen, L. D. Carey, and S. A. Rutledge, Radar observations of the
kinematic, microphysical and precipitation characteristics of two MCSs in
TRMM-LBA, J. Geophys. Rev., accepted (this issue), 2001.
Climanálise, Boletim de monitoramento e análise climática, vol. 14, # 1, 2. Available
from Centro de Previsão de Tempo e Estudos Climáticos, Rodovia Presidente
Dutra, km 240 SPRJ, 12630-000, Cachoeira Paulista - SP, Brasil, (or on the web
at http://www.cptec.inpe.br/products/climanalise/capa1.html), 1999.
Demott, C. A. and S. A. Rutledge, The vertical structure of TOGA COARE convection.
Part II: modulating influences and implications for diabatic heating, J. Atmos.
Sci., 55, 2748-2762.
Ferreira, R. N., M. Suarez, and S. Nigam, Effects of Amazon convection and baroclinic
waves on the South Atlantic Convergence Zone, Submitted to J. Atmos. Sci.,
accepted, 2001.
23
23
Figueroa, S. N., Satyamurty, P., and Silva Dias, P. L. D., Simulations of the summer
circulation over the South-American region with an ETA-coordinate model, J.
Atmos. Sci., 52, 1573-1584, 1995.
Gandu, A. W., and J. E. Geisler, A primitive equations model study of the effect of
topography on the summer circulation over tropical South America, J. Atmos. Sci.,
48, 1822-1836, 1992.
Garreaud, R. D., Cold air incursions over subtropical South America: mean structure and
dynamics, Mon. Wea. Rev., 128, 2544-2559, 2000.
Garreaud, R. D., and J. M. Wallace, Summertime incursions of midlatitude air into
subtropical and tropical South America, Mon. Wea. Rev., 126, 2713-2733, 1998.
Grimm, A. M., and P. L. Silva Dias, Analysis of tropical-extratropical interactions with
influence functions of a barotropic model, J. Atmos.
Sci., 52, 3538-3555, 1995.
Halverson, J. B., T. M. Rickenbach, H. Pierce, B. Roy, and E. Williams, Kinematic and
moisture environments of convective systems during TRMM-LBA, Mon. Wea.
Rev., submitted, 2001.
Herdies, D. L., A. da Silva, and M. A. F. Silva Dias, The bi-modal pattern of the
summertime circulation over South America, J. Geophys. Rev., submitted, 2001.
Houze, R. A., Jr., Observed structure of mesoscale convective systems and implications
for large-scale heating, Q. J. R. Meteorol. Soc., 115, 435-461, 1989.
Kodama, Y.-M., Large-scale features of subtropical convergence zones (the Baiu frontal
zone , the SPCZ, and the SACZ). Part I: Characteristics of subtropical frontal
zones, J. Meteor. Soc. Japan, 70, 813-835, 1992.

24
24
Kousky, V. E. and M. A. Gan, Upper tropospheric cyclonic vortices in the tropical South
Atlantic, Tellus., 33, 538-551, 1981.
Kulie, M. S., M. Robinson, D. Marks, B. Ferrier, D. Rosenfeld, and D. B. Wolff,
Operational processing of ground validation data for the Tropical Rainfall
Measuring Mission, Preprints, AMS 29th Conference on Radar Meteorology,
Montreal, Quebec, Canada, 736-739, 1999.
Laurent, H., L. A. T. Machado, C. A. Morales, and L. Durieux, Characteristics of the
Amazonian mesoscale convective systems observed from satellite and radar
during the WETAMC/LBA experiment, J. Geophys. Rev., accepted (this issue),
2001.
Liebmann, B., J. A. Marengo, J. D. Glick, V. E. Kousky, I. Wainer, and O Massambani,
A comparison of rainfall, outgoing longwave radiation, and divergence over the
Amazon Basin, J. Climate, 11, 2898-2909, 1998.
Liebmann, B., G. N. Kiladis, J. A. Marengo, T. Ambrizzi, and J. D. Glick,, Submonthly
convective variability over South America and the South Atlantic Convergence
zone, J. Climate, 12, 1877-1891, 1999.
Marengo, J., B. Liebmann, V. Kousky, L. Filizola and I. Wainer, Onset and end of the
rainy season in the Brazilian Amazon Basin, J. Climate, 14, 833-852, 2001.
McAnelly, R. L. and W. R. Cotton, The precipitation life cycle of mesoscale convective
complexes over the central United States, Mon. Wea. Rev., 117, 784-807, 1989.
Nogues-Paegle, J. N., and K. C. Mo, Alternating wet and dry conditions over South
America during summer, Mon. Wea. Rev., 125, 279-291, 1997.

25
25
Olson, W. S., C. D. Kummerow, Y. Hong, and W.-K. Tao, Atmospheric latent heating
distributions in the Tropics derived from satellite passive microwave radiometer
measurements. J. Appl. Meteor., 38, 633-664.
Petersen, W. A., S. W. Nesbitt, R. J. Blakeslee, R. Cifelli, P. Hein, and S. A. Rutledge,
TRMM observations of convective regimes in the Amazon, J. Climate, accepted,
2001.
Rickenbach, T. M. and S. A. Rutledge, Convection in TOGA COARE: Horizontal scale,
morphology and rainfall production, J. Atmos. Sci., 55, 2715-2729, 1998.
Silva Dias, M. A. F., S. Rutledge, P. Kabat, P. L. Silva Dias, C. Nobre, G. Fisch, A. J.
Dolman, E. Zipser, M. Garstang, A. Manzi, J. D. Fuentes, H. Rocha, J. Marengo,
A. Plana-Fattori, L. Sa, R. Alvala, M. O. Andreae, P. Artaxo, R. Gielow, and L.
Gatti, Clouds and rain processes in a biosphere atmosphere interaction context in
the Amazon Region, J. Geophys. Rev., accepted (this issue), 2001a.
Silva Dias, M. A. F., W. Petersen, P. L. Silva Dias, R. Cifelli, A. K. Betts, M. Longo, A.
M. Gomes, G. F. Fisch, M. A. Lima, M. A. Antonio, and R. I. Albrecht, A case
study of convective organization into precipitating lines in southwest Amazon
during the WETAMC and TRMM-LBA, , J. Geophys. Rev., accepted (this issue),
2001b.
Silva Dias, P. L., W. H. Schubert, and M. DeMaria, Large-scale response of the tropical
atmosphere to transient convection, J. Atmos. Sci., 40, 2689-2707, 1983.
Steiner, M., R. A. Houze Jr., and S. E. Yuter, Climatological characterization of three-
dimensional storm structure from operational radar and rain gauge data, J. Appl.
Meteorol., 34, 1978-2007, 1995.

26
26
Szoke, E. J., E. J. Zipser, and D. P. Jorgensen, A radar study of convective cells in
mesoscale systems in GATE. Part I: Vertical profile statistics and comparison
with hurricanes, J. Atmos. Sci., 43, 182-197, 1986.
Thorncroft, C. D., B. J. Hoskins, and M. E. McIntyre, Two paradigms of baroclinic life-
cycle behaviour, Q. J. R. Meteorol. Soc., 119, 17-55, 1993.
Tokay, A., W. Krajewski, and A. Perreira Filho, Measurements of drop size distribution
in southwest Amazon region, J. Geophys. Rev., accepted (this issue), 2001.
Williams, E., D. Rosenfeld, N. Madden, J. Gerlach, L. Atkinson, N. Dunnemann, G.
Frostrom, N. Gears, M. Antonio, B. Biazon, R. Camargo, H. Franoa, A. Gomes,
M. Lima, R. Machado, S. Manhaes, L. Nachtigall, H. Piva, W. Quintiliano, L.
Machado, P. Artaxo, G. Roberts, N. Renno, R. Blakeslee, J. Bailey, D. Boccippio,
A. Betts, T. Rickenbach, J. Halverson, D. Roy, J. Fuentes, and E. Avelino, The
Green Ocean over the Amazon: Implications for cloud electrification, J. Geophys.
Rev., submitted (this issue), 2001.
Williams, E. R., S. A. Rutledge, S. G. Geotis, N. Renno, E. Rasmussen, and T.
Rickenbach, A radar and electrical study of tropical "hot towers", J. Atmos. Sci.,
49, 1386-1395, 1992.
Yuter, S. E. and R. A. Houze, Jr., Three-dimensional kinematic and microphysical
evolution of Florida cumulonimbus. Part II: Frequency distributions of vertical
velocity, reflectivity, and differential reflectivity, Mon.Wea. Rev., 123, 1941-
1963, 1995.
Zhao, Y. and B. C. Weare, The effect of diurnal variation of cumulus convection on
large-scale low-frequency oscillations in the Tropics, J. Atmos.
Sci., 51, 2653-2663, 1994.

27
27
FIGURE CAPTIONS
Figure 1: Scanning radar network and Abracos sounding location for the TRMM-LBA
experiment. Circles indicate 150 km range from the TOGA C-band and SPOL S-
band radars and "x" marks the location of each radar with respect to the South
American continent and the TRMM-LBA domain. The triangle shows the
location of the Abracos sounding site.
Figure 2: Time series of the a) zonal wind (westerlies shaded) and b) meridional wind
(southerlies shaded) from the Abracos site sounding data. Regime periods (see
text) are indicated with dashed vertical lines and labels. Units are m s-1, contour
interval is 5 m s-1.
Figure 3: Time series of the daily movement of frontal systems, observed at various
locations along the coast of southeastern Brazil between 35oS and 20oS latitude
(based on analysis presented in Climanalise, 1999). Regime periods are shown
with dashed vertical lines and labels.
Figure 4: Composite of DAO wind data at 200 mb and 850 mb for the SACZ regime
periods. Scale indicates, for 200 mb and 850 mb, the length of a 50 m s-1 and 25 m
s-1 wind vector, respectively. The TRMM-LBA radar domain is located at
approximately 10oS, 62.5oW and is shown by an open circle.
Figure 5: As in Figure 4, but composited for the non-SACZ regime periods.
Figure 6: Composites of vertically integrated moisture convergence (10-5 mm s-1) from
the DAO reanalysis for a) the SACZ regime periods, and b) the non-SACZ regime
periods. The TRMM-LBA radar domain is located at approximately 10oS, 62.5oW
and is shown by an open circle.

28
28
Figure 7: Composites of infrared cloudiness over South America for a) the non-SACZ
regime periods, and b) the SACZ regime periods. Latitude and longitude lines are
shown every 5o.
Figure 8: Time series of conditional rainfall intensity (mm hr-1), from TOGA radar data.
Thick line is the time series with variations of less than 8 days removed. Regime
periods are shown with dashed vertical lines and labels.
Figure 9: As in Figure 8, but for rainfall areal coverage, defined by the area covered by
radar reflectivity values greater than or equal to 10 dBZ. Rain area is normalized
by the areal coverage of the radar scans.
Figure 10: As in Figure 8, but for the fraction of rainfall associated with convective cells
(in contrast with stratiform rain).
Figure 11: Mean vertical profiles of radar reflectivity for the entire experiment (solid
line), the SACZ regime (dotted line) and the non-SACZ regime (dashed line). The
three panels show profiles for total, convective, and stratiform radar echo.
Figure 12: Diurnal variation of conditional rainfall rate (mm hr-1) for a) the SACZ regime
and b) the non-SACZ regime. Solid line is total rain, dotted line is convective
rain, dashed line is stratiform rain.
Figure 13: As in Figure 12, but for the fraction of the radar scan area covered by rain.

29
29
Table 1: List of periods defined by lower tropospheric zonal flow direction, where 'E' is
easterly flow and 'W' is westerly flow. The 'SACZ' and 'non-SACZ' description is based
on discussion in Section 3.2.
ZONAL WIND REGIME PERIODS
Period Date
E1 - 'non-SACZ' period 11 Jan 00Z - 14 Jan 00Z
W1 - 'SACZ' period 14 Jan 00Z - 19 Jan 00Z
E2 - 'non-SACZ' period 19 Jan 00Z - 29 Jan 00Z
W2 - 'non-SACZ' period 29 Jan 00Z - 8 Feb 00Z
E3 - 'non-SACZ' period 8 Feb 00Z - 22 Feb 00Z
W3 - 'SACZ' period 22 Feb 00Z - 1 Mar 00Z
30
30
Table 2: TOGA radar composite means of rainfall intensity, convective rain fraction, and
raining area for SACZ and non-SACZ regimes, from TOGA radar data. Values of rain
intensity (mm hr-1) and rain area (km2) were normalized to the means for the non-SACZ
regime.
COMPOSITE RAINFALL AND RAIN AREA VALUES
SACZ Non-SACZ
Total 0.73 1
Convective 0.53 1Rain Intensity
Stratiform 1.1 1
Convective Rain
Fraction 49% 66%
Total 1.9 1
Convective 1.3 1Rain Area
Stratiform 2.0 1

31
31
Figure 1: Scanning radar network and Abracos sounding location for the TRMM-LBA
experiment. Circles indicate 150 km range from the TOGA C-band and SPOL S-
band radars and "x" marks the location of each radar with respect to the South
American continent and the TRMM-LBA domain. The triangle shows the
location of the Abracos sounding site.

32
32
Figure 2: Time series of the a) zonal wind (westerlies shaded) and b) meridional wind
(southerlies shaded) from the Abracos site sounding data. Regime periods (see
text) are indicated with dashed vertical lines and labels. Units are m s-1, contour
interval is 5 m s-1.
E1 W1 E2 W2 E3 W3
11 Jan 18 Jan 25 Jan 1 Feb 8 Feb 15 Feb 22 Feb 1 Mar
a)

33
33
Figure 2: Time series of the a) zonal wind (westerlies shaded) and b) meridional wind
(southerlies shaded) from the Abracos site sounding data. Regime periods (see
text) are indicated with dashed vertical lines and labels. Units are m s-1, contour
interval is 5 m s-1.
E1 W1 E2 W2 E3 W3
11 Jan 18 Jan 25 Jan 1 Feb 8 Feb 15 Feb 22 Feb 1 Mar
b)
34
34
Figure 3: Time series of the daily movement of frontal systems, observed at various
locations along the coast of southeastern Brazil between 35oS and 20oS latitude
(based on analysis presented in Climanalise, 1999). Regime periods are shown
with dashed vertical lines and labels.
E1 W1 E2 W2 E3 W3
11 Jan 18 Jan 25 Jan 1 Feb 8 Feb 15 Feb 22 Feb 1 Mar
SACZ SACZ

35
35
Figure 4: Composite of DAO wind data at 200 mb and 850 mb for the SACZ regime
periods. Scale indicates, for 200 mb and 850 mb, the length of a 50 m s-1 and 25 m
s-1 wind vector, respectively. The TRMM-LBA radar domain is located at
approximately 10oS, 62.5oW and is shown by an open circle.
36
36
Figure 5: As in Figure 4, but composited for the non-SACZ regime periods.
37
37
Figure 6: Composites of vertically integrated moisture convergence (10-5 mm s-1) from
the DAO reanalysis for a) the SACZ regime periods, and b) the non-SACZ regime
periods. The TRMM-LBA radar domain is located at approximately 10oS, 62.5oW
and is shown by an open circle.
a)

38
38
Figure 6: Composites of vertically integrated moisture convergence (10-5 mm s-1) from
the DAO reanalysis for a) the SACZ regime periods, and b) the non-SACZ regime
periods. The TRMM-LBA radar domain is located at approximately 10oS, 62.5oW
and is shown by an open circle.
b)
39
39
Figure 7: Composites of infrared cloudiness over South America for a) the non-SACZ
regime periods, and b) the SACZ regime periods. Latitude and longitude lines are
shown every 5o.
a)
b)
-80 -70 -60 -50 -40 -30 -20 -10
-80 -70 -60 -50 -40 -30 -20 -10
5
-5
-15
-25
-35
5
-5
-15
-25
-35

40
40
Figure 8: Time series of conditional rainfall intensity (mm hr-1), from TOGA radar data.
Thick line is the time series with variations of less than 8 days removed. Regime
periods are shown with dashed vertical lines and labels.
11 Jan 18 Jan 25 Jan 1 Feb 8 Feb 15 Feb 22 Feb 1 Mar
E1 W1 E2 W2 E3 W3
SACZ SACZ

41
41
Figure 9: As in Figure 8, but for rainfall areal coverage, defined by the area covered by
radar reflectivity values greater than or equal to 10 dBZ. Rain area is normalized
by the areal coverage of the radar scans.
11 Jan 18 Jan 25 Jan 1 Feb 8 Feb 15 Feb 22 Feb 1 Mar
E1 W1 E2 W2 E3 W3
SACZ SACZ
42
42
Figure 10: As in Figure 8, but for the fraction of rainfall associated with convective cells
(in contrast with stratiform rain).
E1 W1 E2 W2 E3 W3
11 Jan 18 Jan 25 Jan 1 Feb 8 Feb 15 Feb 22 Feb 1 Mar
SACZ SACZ
43
43
Figure 11: Mean vertical profiles of radar reflectivity for the entire experiment (solid
line), the SACZ regime (dotted line) and the non-SACZ regime (dashed line). The
three panels show profiles for total, convective, and stratiform radar echo.
Solid: All DaysDashed: No SACZDotted: SACZ

44
44
Figure 12: Diurnal variation of conditional rainfall rate (mm hr-1) for a) the SACZ regime
and b) the non-SACZ regime. Solid line is total rain, dotted line is convective
rain, dashed line is stratiform rain.
a)
b)

45
45
Figure 13: As in Figure 12, but for the fraction of the radar scan area covered by rain.
a)
b)
Copyright © 2022 FDOKUMEN