Wild barley introgression lines revealed novel QTL alleles for ...
Braz. J. Plant Physiol., 18(2):281-290, 2006
RESEARCH ARTICLE
Use of the QTL approach to the study of soybean trait relationships in two populations of recombinant inbred lines at the F7 and F8 generations
Antonio José Dias Vieira1, Dario Alves de Oliveira2, Taís Cristina Bastos Soares2, Ivan Schuster2, Newton Deniz Piovesan2, Carlos Alberto Martínez3, Everaldo Gonçalves de Barros2 and Maurílio Alves Moreira2*
1Departamento de Biologia Vegetal, Programa de Pós-Graduação em Fisiologia Vegetal, Instituto de Biotecnologia Aplicada a Agro-pecuária, Unidade de Crescimento de Plantas, Universidade Federal de Viçosa, Viçosa, Av. PH Rolfs s/n - Campus Universitário, Viçosa, MG, Brasil; 2Instituto de Biotecnologia Aplicada à Agropecuária, Universidade Federal de Viçosa, Viçosa, Av. PH Rolfs s/n - Campus Universitário, Viçosa, MG, Brasil; 3Departamento de Biologia, FFCLRP, Universidade de São Paulo, Av. Bandeirantes 3900, 14040-901, Ribeirão Preto, SP, Brasil. *Corresponding author: [email protected]
Received: 14/02/2006, Accepted: 26/06/2006
This work aimed to identify the quantitative trait loci (QTL) associated with photosynthesis and growth and productivity traits
of soybean and to study possible associations between these traits by the analysis of coincidence of QTL in linkage groups
(LGs). Thus, populations of recombinant inbred lines (RILs) of the F7 and F8 generations derived from the cross between the
varieties BARC-8 and Garimpo were used. The traits evaluated were net assimilation rate of CO2 under saturating light (Asat),
potential photosynthesis rate (Pmax), leaf area (A), specific leaf area (SLA), specific leaf nitrogen (N); root (WR), nodule (WN),
stem (WST), leaf (WL), pod (WP) and plant dry mass (WT); nodule (nN), seed (nS), and pod number (nP); seed fresh mass per plant
(WS), one-hundred seed fresh mass (WHS) and seed protein percentage (P%). It was possible to identify the following QTL as-
sociated with the following soybean traits: SLA, Asat, N, WR, WST, WL, WT, WP, WHS, nS and nP, indicating that the RIL popula-
tion has a great potential for mapping loci associated with quantitative traits of the soybean crop. The correlations between the
soybean traits were partially confirmed by coincidence of QTL.
Key words: Glycine max, correlation, genes, photosynthesis, quantitative trait loci.
Identificação e uso de QTL no estudo de correlações entre carateres quantitativos em populações RILs de soja nas gerações
F7 e F8: Este trabalho objetivou identificar locos de carateres quantitativos (QTLs) assosciados com fotossíntese, crescimento e
produtividade de soja com a finalidade de identificar possíveis associações entre estas características pela análise de coicindência
de QTLs nos respectivos grupos de ligação (GL). Para isto, foram usadas populações de linhagens recombinantes endogâmicas
(RILs) das gerações F7 e F8 derivadas dos cruzamentos entre as variedades BARC-8 e Garimpo. As características avaliadas
foram taxa de assimilação líquida de CO2 sob luz saturante (Asat), taxa de fotossíntese potencial (Pmax), área foliar (A), área
foliar específica (SLA), nitrogênio foliar específico (N); número de nódulos (nN), sementes (nS) e vagens (nP); massa fresca
de sementes por planta (WS), massa fresca de 100 sementes (WHS) e percentagem de proteína da semente (P%). Foi possível
identificar os seguintes QTLs associados com as características: SLA, Asat, N, WR, WST, WL, WT, WP, WHS, nS e nP, indicando que
as populações de RIL apresentam grande potencial para mapeamento de locos associados com caracteres quantitativos em
soja. As correlações entre os caracteres analisados foram parcialmente confirmadas pela coincidência de QTL.
Palavras-chaves: Glycine max, correlações, genes, fotossíntese, locos de caracteres quantitativos.
282
Braz. J. Plant Physiol., 18(2):281-290, 2006
A. J. D. VIEIRA et al. QTL ANALYSIS OF PHOTOSYNTHETIC TRAITS IN SOYBEAN
Braz. J. Plant Physiol., 18(2):281-290, 2006
283
INTRODUCTION
Identification of QTL (“Quantitative Trait Loci”) or controllers of quantitative traits associated with production and the conditions where such an association is lacking, may help develop gene-based simulation production models for a particular crop (Boote et al., 2001). Thus, the positioning of QTL directly associated with production can be compared with those associated with dry mass accumulation in other parts of the plant.
Few studies have been carried out aimed at identifying QTL associated with important physiological traits, such as photosynthetic rate, and soybean growth and productivity traits, simultaneously.
Traditional physiological studies approach the relationships between physiological traits without taking into account the genetic basis. Prioul et al. (1997) points out that if any association inconsistency is established in these studies it cannot be explained in terms of compartmentalization or interactions. Besides, it cannot be determined whether such correlations are induced by causal relationships between the traits or by other factors, such as linkage proximity between genes with opposing actions. Lebreton et al. (1995) and Price et al. (2002) used the analysis of coincidence of QTL to test causal relationships between plant traits associated with plant resistance to drought.
Physiological studies may benefit from the understanding of how quantitative traits are genetically controlled. Thus, it is necessary to identify various QTL along the genome for a simultaneous test of coincidence between various traits. One should also look for significant QTL for the traits under different environmental conditions. If two traits are correlated, there is a great chance of having QTL associated in the same chromosome region (Prioul et al., 1997).
This work aimed to: (i) identify QTL associated with photosynthesis, growth and productivity traits of the soybean; (ii) identify likely associations between these soybean traits by using the analysis of coincidence of QTL and (iii) evaluate the population of RILs to use it as a mapping population of loci associated with different soybean traits.
MATERIAL AND METHODS
This study involved 118 Recombinant Inbred Lines (RILs) derived from a cross between the soybean varieties BARC-8 and Garimpo.
The F6 generation of the RILs was obtained by Soares (2000), by single seed descent from the F2 generation. The F7 and F8 generations were obtained from the F6 generation
by self-pollination. The F7 and F8 generations together with the parental lines constituted the genetic material used in this work. Each RIL and the parental lines were represented by five plants, cultivated in a greenhouse. The F7 and F8 generations of the RILs and the parental lines were cultivated in a nursery. Sowing was carried out in December 1999 and 2000 for the F7 and F8 generations, respectively. Plastic pots containing a 2.5 L of a soil:manure:sand (3:1:1, w/w/w) mixture were used. Approximately 330 kg N.ha-1, 64 kg P2O5.ha-1 and 141 kg K2O.ha-1 were incorporated into the soil mixture in 1999. In order to evaluate whether a significant interaction exists between the genotype and the environment with respect to the identification of QTL, nitrogen fertilization was suppressed for the F8 generation in the year 2000.
Net photosynthesis under saturating light (Asat) conditions was measured in fully-expanded leaves, located at the upper third of the plant, containing at least one pod at the seed filling stage (between R5 and R6), using an infrared gas analysis system (IRGA), model Li-6400 (Li-Cor, Lincoln, NE), at 1500 µmol m-2 s-1 of photosynthetic photon flux (PPF) and a temperature of 25oC, as described by Griffin and Luo (1999). Leaf disc samples of 10 cm2 of area were removed for determination of the O2 evolution rate under saturating CO2 and light conditions, i.e., the potential photosynthetic rate (Pmax), expressed in µmol O2.m-2.s-1, using a LD2 oxygen electrode (Hansatech Ltd, King’s Lynn, U.K.) regulated to maintain radiation intensity on the leaf disc between 1500 and 1800 µmol.m-2.s-1 of PPF, and a CO2 saturating condition using a 2 M solution of potassium carbonate at 25oC. An additional leaf disc sample was removed from the F8 generation, which, combined with the first sample, constituted the material for analysis of specific leaf nitrogen, expressed as g N.m-2 (N), using the Kjeldahl method, as described by Lugg and Sinclair (1981).
During the seed filling period (between R5 and R6) for two plants of each RIL, following leaf disc sample collection, leaf area (A) was estimated using a leaf area integrator ΔT area meter, model MK2 (AT Delta-T Devices Ltd.). After 48 h of drying at 70oC until constant mass, dry mass was determined using a precision balance and expressed in grams of the following plant parts: stem (WST), leaves (WL), roots (WR), pods (WP), nodules (WN) and total (WT) and number of nodules (nN), seeds (nS), and pods (nP); seed fresh mass per plant (WS), one-hundred seed fresh mass (WHS), with WN and nN being evaluated only in the F8 generation. Based on the primary data of leaf dry mass and leaf area, specific leaf
282
Braz. J. Plant Physiol., 18(2):281-290, 2006
A. J. D. VIEIRA et al. QTL ANALYSIS OF PHOTOSYNTHETIC TRAITS IN SOYBEAN
Braz. J. Plant Physiol., 18(2):281-290, 2006
283
area (SLA) was calculated representing the leaf area (m2) per Kg leaf weight. Productivity traits were measured (Fehr and Caviness, 1977) on the three remaining plants at the R8 development stage plus 10 days, and expressed as fresh mass of the seeds per plant in grams (WS), one-hundred seed fresh mass in grams (WHS) and production quality in protein content (%P), using the Kjeldahl method (Instituto Adolfo Lutz, 1985).
The experiment was arranged in a completely randomized design. Phenotypic variance ( ) was estimated by the ratio between the mean square of the treatments or genotypes (MSG) and the number of replicates (k) considered for each trait while the genotypic variance ( ) was estimated using the following equation:
= (MSG – MSR) / k, where MSR is the mean square of the residue.Heritability in its broadest sense (h2) was estimated by
the equation: ( / ) x 100.Variance analysis of the phenotypic data was performed
for the traits evaluated in the generations and for different environments to determine the existence of significant genetic variability between the lines and interaction with the environment.
Phenotypic correlation matrices were built between the traits evaluated. The phenotypic correlations between the traits were compared with the coincidence, or not, of QTL identified for the respective phenotypes.
For the mapping of the QTL to the soybean traits, the phenotypic values were associated with a molecular linkage map initially defined by Soares (2000) using microsatellite markers, which was later partially saturated with microsatellite markers (Oliveira, 2002) and RAPD markers (Miranda, 2002). This map used as reference the nomenclature for the linkage groups (LGs) described by Cregan et al. (1999) working with F2 populations of an interspecific cross of G. soja and G. max. This map has 24 LGs totalizing 523.17cM containing 75 molecular markers. Of these, 54 markers are microsatellite types while 21 are RAPD types.
The mapping of microsatellite and RAPD markers and the establishment of the linkage groups were carried out using the program GQMol (Cruz and Schuster, 2000). The markers were grouped by using a LOD minimum score of 3.0 and a maximum recombination frequency of 0.40. Kosambi mapping distance was used for the conversion of the recombination frequency into centiMorgans (cM).
The linkage map data were used to map the QTL along the linkage groups by means of compound interval mapping
(Zeng, 1994), using the Windows QTL Cartographer version 2.0 (Basten et al., 2002).
The cut-off point of maximum likelihood ratio to consider the presence of QTL by using the compound interval mapping was obtained by a permutation test, as reported by Deorge and Churchill (1996).
RESULTS
The individual variance analyses of each trait and the estimates of different genetic parameters in the F8 generation (table 1) of the seventeen traits evaluated, shows that only one failed to present significant genetic variability. This is important, since the occurrence of genetic variability in a mapping population is one of the requirements for detecting QTL. Also, it can be seen in table 1 that the heritability values ranged from 18.73%, for nodule number, to 99.86%, for seed protein content.
QTL associated with 9 of the 14 traits studied were identified in the F7 generation. These QTL were located at intervals within 10 of the 24 linkage groups named according to Cregan et al. (1999). A single interval was associated with SLA in the LG C1 whereas only 7.8% of the phenotypic variation of Asat was explained by a locus located in the LG O (table 2). Overall, the QTL found to be associated with A and with traits related to biomass in the seed filling stage (SLA, WST, WR, WT and WP) are located at five intervals in linkage groups A1, C1, C2, D1b + W and O (table 2). Besides, QTL located in other linkage groups (G, O, L, F and N) also explain a fraction of phenotypic variation of A, WST, WR, WT and WP (table 2). Also in table 2, it can be observed that in the LG L, a QTL was found associated with WST. Moreover, a coincidence of QTL is noted in two linkage groups for the traits WHS and nS, a fact only observed for this association (table 2). On the other hand, it was not possible to identify coincident QTL between Asat and the traits Pmax, SLA, nS and WS despite the significant correlations shown in table 4. In the F8 generation, QTL were identified associated with 10 of the 17 traits studied, at intervals located in 8 of the 24 linkage groups considered (table 3). A single molecular interval in LG A1 was identified as being associated with specific leaf nitrogen (N), while 14.72% of the phenotypic variation of Asat was explained by the loci positioned in the LG J (table 3).
The traits A, WL, WST, WT and WHS have compatible QTL, located in LG M, explaining 10.47, 8.86, 8.43, 13.78 and 20.73% of the phenotypic variations of these traits, respectively (table 3).

284
Braz. J. Plant Physiol., 18(2):281-290, 2006
A. J. D. VIEIRA et al. QTL ANALYSIS OF PHOTOSYNTHETIC TRAITS IN SOYBEAN
Braz. J. Plant Physiol., 18(2):281-290, 2006
285
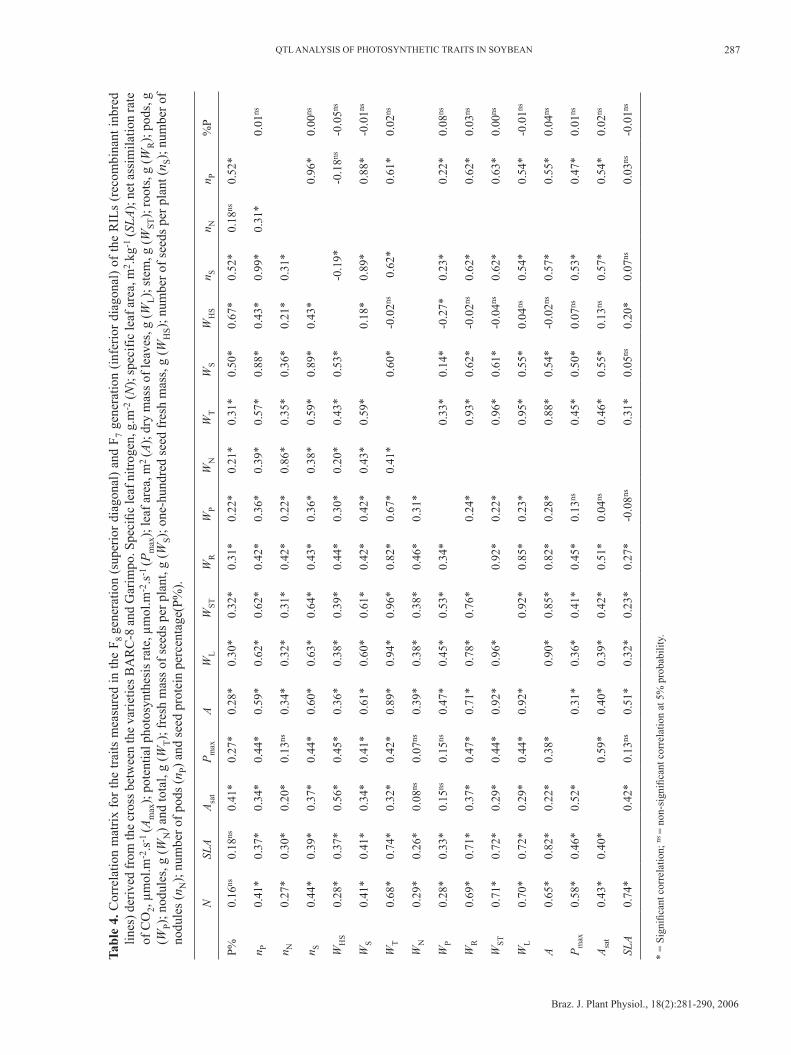
The coincidence of the QTL in LG M, associated with the leaf area and biomass-related traits (WL, WST e WT), as well as to one-hundred seed dry mass (WHS), could explain the significant correlations between these traits, as shown in table 4, ranging from 0.96 (WST x WT) to 0.39 (WST x WHS).
Productivity-related traits such as WS, nS and nP, in general, do not have QTL in common with those identified for the other variables, except for one present in LG M associated with WHS, as previously discussed. However, the likelihood of one interval located in the LG K, explaining 13.23, 24.51 and 7.6% of the phenotypic variation of WS, nS and nP, respectively, was observed (table 3). Significant correlations above 0.88 observed among these traits (table 4) may be attributed to the coincidence of the QTL in the LG K. It should be taken into account that the nature of this correlation is phenotypic, thus, one portion may have an environmental basis.
When comparing tables 2, 3 and 4, it is not possible to identify coincident QTL among some traits with physiological associations described in the literature, namely: significant correlations between Asat x Pmax, N x Asat, N x SLA, SLA x Asat and Asat with productivity components such as nS and WS.
DISCUSSION
The heritability for P% in the F8 generation was above the value of 73.40% estimated for this population in the F6
generation under field conditions (Soares, 2000) while the heritability for Asat of 50% shown in table 1 is above the value of 41% estimated by Harrison et al. (1981) for canopy-apparent photosynthesis during seed filling in G. max. On the other hand, Wiebold et al. (1981) observed a low to moderate (36% to 56%) heritability in the broad sense, for net photosynthesis of individual leaves, in the initial F3 and F4 generations using an infrared gas analysis system at temperatures varying from 29 to 31oC.
Table 1 shows heritability values for WST, nN e WN of 87.47%, 18.70% e 32.02%, respectively. These values are in agreement with the observations of Santos et al. (2006) who estimated heritability values of 49% for stem dry mass, 30% for nodule number, and 33% for nodule dry mass, in a segregating population composed of 157 recombinant inbred lines derived from the cross between two soybean cultivars identified as contrasting for biological nitrogen fixation capacity. Therefore, it can be concluded that the evaluated traits are under environment effects, as well as that the present population can be used in studies aimed at evaluating heritability of such traits.T
able
1. G
enot
ype
(MSG
) an
d re
sidu
e(M
SR) m
ean
squa
re, e
stim
ate
of p
heno
typi
c va
rian
ce (
), g
enot
ypic
var
ianc
e (
), h
erita
bilit
y va
lues
(h2 )
est
imat
ed in
the
F 8 ge
nera
tion
of a
pop
ulat
ion
of r
ecom
bina
nt in
bred
line
s (R
ILs)
, not
sub
mitt
ed to
nitr
ogen
fer
tiliz
atio
n an
d m
ean
phen
otyp
ic v
alue
s of
the
pare
ntal
line
s B
AR
C-8
an
d G
arim
po.
NSL
A
Asa
tP
max
A
WL
WST
WR
WP
WN
WT
WS
WH
Sn S
n Nn P
%P
MSG
0.43
387.
0095
.58
289.
450.
0150
.50
70.6
514
.34
62.5
00.
3747
9.55
125.
7813
.68
5816
.034
81.9
1254
.07
20.4
4
MSR
0.20
127.
0047
.59
193.
641.
0x10
-38.
258.
859.
3228
.86
0.25
99.5
433
.22
4.49
1594
.828
29.7
322.
430.
03
F2.
22*
3.04
*2.
00*
1.49
*5.
43*
6.12
*7.
98*
1.54
*2.
17*
1.47
*4.
81*
3.79
*3.
05*
3.65
*1.
23ns
3.89
*73
9.69
*
0.06
12.9
013
.65
41.3
52.
7x10
-325
.25
35.3
27.
1731
.25
0.19
239.
7841
.93
4.56
1938
.617
40.9
418.
0210
.22
0.03
48.
676.
8613
.69
2.0x
10-3
21.1
230
.90
2.51
16.8
20.
0619
0.00
30.8
53.
0614
07.0
326.
131
0.55
10.2
1
h2 (%
)55
.01
67.1
450
.22
33.1
081
.60
83.6
687
.47
35.0
253
.83
32.0
279
.24
73.5
967
.19
72.5
18.7
74.2
999
.86
BA
RC
-81.
3365
.30
12.5
229
.54
0.01
65.
224.
524.
300.
500.
3842
.99
11.9
910
.52
83.0
24.0
37.5
049
.09
Gar
impo
1.83
70.1
522
.25
44.6
40.
025
11.1
38.
979.
133.
211.
5155
.47
22.7
914
.97
116.
034
9.5
49.0
040
.49
* =
Sign
ifica
nt F
val
ue; ns
= n
on s
igni
fican
t F v
alue
at 5
% p
roba
bilit
y. S
peci
fic le
af n
itrog
en c
onte
nt, g
N.m
-2 (
N);
spe
cifi
c le
af a
rea
m2 .
kg-1
(SL
A);
net
ass
imila
tion
rate
of
CO
2, µ
mol
.m-2
.s-1
(Asa
t); p
oten
tial
phot
osyn
thes
is r
ate,
µm
ol d
e O
2.m
-2.s
-1 (P
max
); le
af a
rea,
m2
(A);
dry
mas
s of
leav
es, g
(W
L);
ste
m, g
(W
ST);
roo
ts, g
(W
R);
pod
s, g
(W
P); n
odul
es, g
(W
N)
and
tota
l, g
(WT);
fre
sh m
ass
of s
eeds
per
pla
nt, g
(W
S); o
ne-h
undr
ed s
eed
fres
h m
ass,
g (
WH
S); n
umbe
r of
see
ds p
er p
lant
(n S)
; num
ber
of n
odul
es (
n N);
num
ber
of p
ods
(nP)
and
see
d pr
otei
n pe
rcen
tage
(P%
)
284
Braz. J. Plant Physiol., 18(2):281-290, 2006
A. J. D. VIEIRA et al. QTL ANALYSIS OF PHOTOSYNTHETIC TRAITS IN SOYBEAN
Braz. J. Plant Physiol., 18(2):281-290, 2006
285
Nicolás et al. (2006) studying QTL associated with nodulation and stem dry mass of soybean plants in F2 and F3
generations observed a positive and significant correlation (0.91**) with WN and nitrogen (N) content of the whole plants and a coincidence of QTL for WN, WST e nN in LG D1b+W, B2 and H/J. In this work we observed a positive and significant correlation of 0.29* between WST and N (table 4). However, as shown in table 3, we identified only one QTL associated with leaf area in LG D1b+W. A QTL associated with WST was identified in LG M and no QTL was identified for traits such as nN and WN.
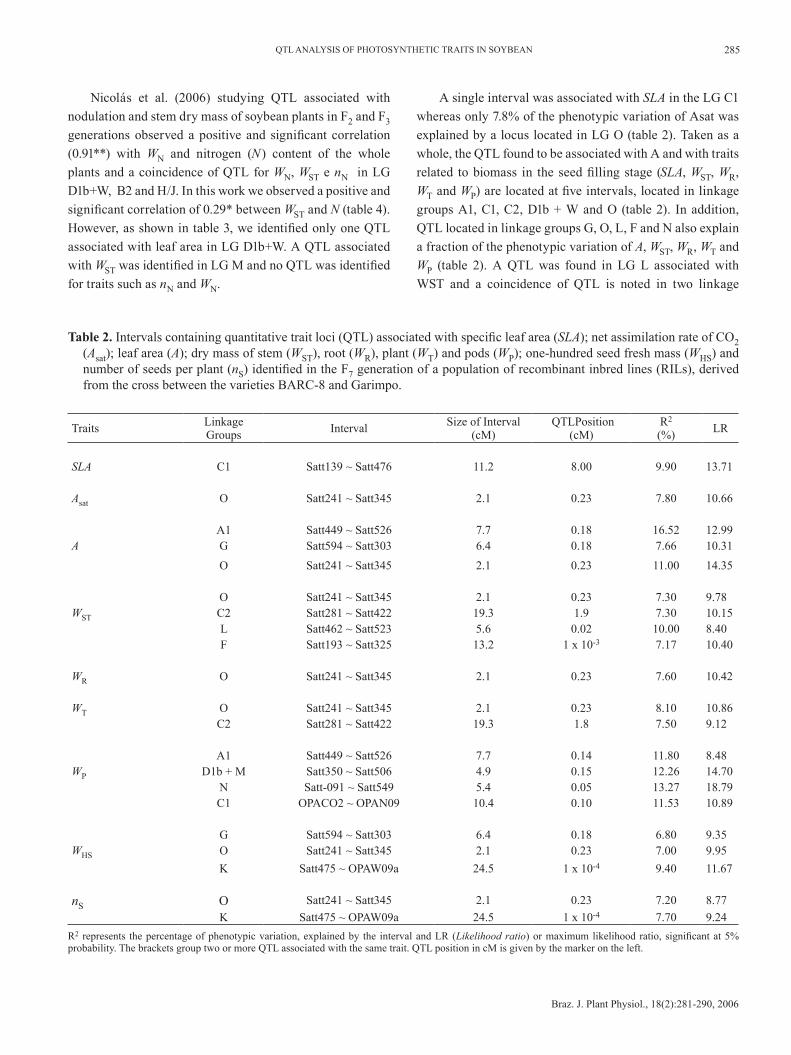
A single interval was associated with SLA in the LG C1 whereas only 7.8% of the phenotypic variation of Asat was explained by a locus located in LG O (table 2). Taken as a whole, the QTL found to be associated with A and with traits related to biomass in the seed filling stage (SLA, WST, WR, WT and WP) are located at five intervals, located in linkage groups A1, C1, C2, D1b + W and O (table 2). In addition, QTL located in linkage groups G, O, L, F and N also explain a fraction of the phenotypic variation of A, WST, WR, WT and WP (table 2). A QTL was found in LG L associated with WST and a coincidence of QTL is noted in two linkage
Table 2. Intervals containing quantitative trait loci (QTL) associated with specific leaf area (SLA); net assimilation rate of CO2 (Asat); leaf area (A); dry mass of stem (WST), root (WR), plant (WT) and pods (WP); one-hundred seed fresh mass (WHS) and number of seeds per plant (nS) identified in the F7 generation of a population of recombinant inbred lines (RILs), derived from the cross between the varieties BARC-8 and Garimpo.
Traits Linkage Groups Interval Size of Interval
(cM) QTLPosition
(cM)R2
(%) LR
SLA C1 Satt139 ~ Satt476 11.2 8.00 9.90 13.71
Asat O Satt241 ~ Satt345 2.1 0.23 7.80 10.66
A1 Satt449 ~ Satt526 7.7 0.18 16.52 12.99A G Satt594 ~ Satt303 6.4 0.18 7.66 10.31
O Satt241 ~ Satt345 2.1 0.23 11.00 14.35
O Satt241 ~ Satt345 2.1 0.23 7.30 9.78WST C2 Satt281 ~ Satt422 19.3 1.9 7.30 10.15
L Satt462 ~ Satt523 5.6 0.02 10.00 8.40F Satt193 ~ Satt325 13.2 1 x 10⁻³ 7.17 10.40
WR O Satt241 ~ Satt345 2.1 0.23 7.60 10.42
WT O Satt241 ~ Satt345 2.1 0.23 8.10 10.86C2 Satt281 ~ Satt422 19.3 1.8 7.50 9.12
A1 Satt449 ~ Satt526 7.7 0.14 11.80 8.48WP D1b + M Satt350 ~ Satt506 4.9 0.15 12.26 14.70
N Satt-091 ~ Satt549 5.4 0.05 13.27 18.79C1 OPACO2 ~ OPAN09 10.4 0.10 11.53 10.89
G Satt594 ~ Satt303 6.4 0.18 6.80 9.35WHS O Satt241 ~ Satt345 2.1 0.23 7.00 9.95
K Satt475 ~ OPAW09a 24.5 1 x 10⁻⁴ 9.40 11.67
nS O Satt241 ~ Satt345 2.1 0.23 7.20 8.77
K Satt475 ~ OPAW09a 24.5 1 x 10⁻⁴ 7.70 9.24
R2 represents the percentage of phenotypic variation, explained by the interval and LR (Likelihood ratio) or maximum likelihood ratio, significant at 5% probability. The brackets group two or more QTL associated with the same trait. QTL position in cM is given by the marker on the left.

286
Braz. J. Plant Physiol., 18(2):281-290, 2006
A. J. D. VIEIRA et al. QTL ANALYSIS OF PHOTOSYNTHETIC TRAITS IN SOYBEAN
Braz. J. Plant Physiol., 18(2):281-290, 2006
287
groups for the traits WHS and nS, a fact only observed for this association (table 2). On the other hand, it was not possible to identify coincident QTL between Asat and the traits Pmax, SLA, nS and WS despite the significant correlations shown in table 4. A single molecular interval in LG A1 was identified as being associated with specific leaf nitrogen (N), while 14.72% of the phenotypic variation of Asat was explained by the loci located in the LG J (table 3).
The traits A, WL, WST, WT and WHS have compatible QTL, located in the LG M, explaining the values 10.47, 8.86, 8.43, 13.78 and 20.73% for the phenotypic variations of these traits, respectively (table 3).
The identification of QTL associated with A and biomass-related traits during seed filling (WST, WR, WT) in the linkage groups A1, C1, C2, D1b + W and O confirms, in part, the observation made by Mansur et al. (1993) that the LGs C1, C2 and D1 have loci associated with the traits leaf area
and maturity of the soybean. The identification of a QTL associated with WST in the LG L confirms the observation that in this LG there is a QTL associated with WST (Santos et al., 2006) and plant height of G. max (Lee et al., 1996).
The coincidence between QTL associated with leaf area and biomass related traits could explain the significant phenotypic correlations ranging from 0.22 (between WST and WP) to 0.96 for WST and WT (table 2). Except for an interval located in the LG O associated with seven of the nine traits, a separation of the QTL associated with WHS and nS from those related to the other traits was observed (table 2). The QTL grouping associated with nS and WHS may partially explain the negative correlation of -0.19 shown in table 4.
Another fact that must be emphasized concerns the P% correlations which were significant for various traits in the F7 generation (table 4). However, these correlations were not confirmed for the F8 generation. This fact may be explained,
Table 3. Intervals containing quantitative trait loci (QTL) associated with specific leaf nitrogen (N); net assimilation rate of CO2 (Asat); leaf area (A); dry mass of leaves (WL), stem (WST) and total (WT); fresh mass of seeds per plant (WS); one-hundred seed fresh mass (WHS); number of seeds per plant (nS) and number of pods (nP) identified in the F8 generation of a population of recombinant inbred lines (RILs), derived from a cross between the varieties BARC-8 and Garimpo. This population was not submitted to nitrogen fertilization.
Traits Linkage Groups Interval Size of interval
(cM)QTL
Position(cM)R2
(%) LR
N A1 Satt449 ~ Satt526 7.7 1.70 16.85 10.73
Asat J Satt215 ~ Satt183 4.4 2.00 14.72 12.82
A D1b + W Satt350 ~ Satt506 4.9 0.12 11.33 8.39M OPAPO4a ~ OPAPO4b 16.1 0.02 10.47 10.48
WL M OPAPO4a ~ OPAPO4b 16.1 1 x 10⁻⁴ 8.86 11.28
WST M OPAPO4a ~ OPAPO4b 16.1 0.01 8.43 9.97
WT N Sat-091 ~ Satt594 5.4 0.05 7.30 8.46M OPAPO4a ~ OPAPO4b 16.1 0.03 13.78 11.93
WS K Satt475 ~ OPAW09a 24.5 0.20 13.23 8.68
WHS M OPAPO4a ~ OPAPO4b 16.1 0.09 20.73 11.11
nS K Satt475 ~ OPAW09a 24.5 0.24 24.51 10.87
nP C1 Satt139 ~ Satt476 11.2 5.00 7.30 9.71K Satt475 ~ OPAW09a 24.5 0.24 7.60 9.48
R2 represents the percentage of phenotypic variation explained by the interval and the LR (Likelihood ratio) or maximum likelihood ratio significant at 5% probability. The brackets group two QTL associated with the same trait. The position of QTL in cM is given by the marker on the left.
286
Braz. J. Plant Physiol., 18(2):281-290, 2006
A. J. D. VIEIRA et al. QTL ANALYSIS OF PHOTOSYNTHETIC TRAITS IN SOYBEAN
Braz. J. Plant Physiol., 18(2):281-290, 2006
287
Tab
le 4
. Cor
rela
tion
mat
rix
for
the
trai
ts m
easu
red
in t
he F
8 ge
nera
tion
(sup
erio
r di
agon
al)
and
F 7 ge
nera
tion
(inf
erio
r di
agon
al)
of t
he R
ILs
(rec
ombi
nant
inb
red
lines
) der
ived
from
the
cros
s be
twee
n th
e va
riet
ies
BA
RC
-8 a
nd G
arim
po. S
peci
fic le
af n
itrog
en, g
.m-2
(N);
spe
cifi
c le
af a
rea,
m2 .
kg-1
(SLA
); n
et a
ssim
ilatio
n ra
te
of C
O2,
µm
ol.m
-2.s
-1 (A
max
); p
oten
tial p
hoto
synt
hesi
s ra
te, µ
mol
.m-2
.s-1
(Pm
ax);
leaf
are
a, m
2 (A
); d
ry m
ass
of le
aves
, g (
WL);
ste
m, g
(W
ST);
roo
ts, g
(W
R);
pod
s, g
(W
P); n
odul
es, g
(W
N)
and
tota
l, g
(WT);
fre
sh m
ass
of s
eeds
per
pla
nt, g
(W
S); o
ne-h
undr
ed s
eed
fres
h m
ass,
g (
WH
S); n
umbe
r of
see
ds p
er p
lant
(n S)
; num
ber
of
nodu
les
(nN
); n
umbe
r of
pod
s (n
P) a
nd s
eed
prot
ein
perc
enta
ge(P
%).
NSL
AA
sat
Pm
axA
WL
WST
WR
WP
WN
WT
WS
WH
Sn S
n Nn P
%P
P%0.
16ns
0.18
ns0.
41*
0.27
*0.
28*
0.30
*0.
32*
0.31
*0.
22*
0.21
*0.
31*
0.50
*0.
67*
0.52
*0.
18ns
0.52
*
n P0.
41*
0.37
*0.
34*
0.44
*0.
59*
0.62
*0.
62*
0.42
*0.
36*
0.39
*0.
57*
0.88
*0.
43*
0.99
*0.
31*
0.01
ns
n N0.
27*
0.30
*0.
20*
0.13
ns0.
34*
0.32
*0.
31*
0.42
*0.
22*
0.86
*0.
35*
0.36
*0.
21*
0.31
*
n S0.
44*
0.39
*0.
37*
0.44
*0.
60*
0.63
*0.
64*
0.43
*0.
36*
0.38
*0.
59*
0.89
*0.
43*
0.96
*0.
00ns
WH
S0.
28*
0.37
*0.
56*
0.45
*0.
36*
0.38
*0.
39*
0.44
*0.
30*
0.20
*0.
43*
0.53
*-0
.19*
-0.1
8ns-0
.05ns
WS
0.41
*0.
41*
0.34
*0.
41*
0.61
*0.
60*
0.61
*0.
42*
0.42
*0.
43*
0.59
*0.
18*
0.89
*0.
88*
-0.0
1ns
WT
0.68
*0.
74*
0.32
*0.
42*
0.89
*0.
94*
0.96
*0.
82*
0.67
*0.
41*
0.60
*-0
.02ns
0.6
2*0.
61*
0.02
ns
WN
0.29
*0.
26*
0.08
ns0.
07ns
0.39
*0.
38*
0.38
*0.
46*
0.31
*
WP
0.28
*0.
33*
0.15
ns0.
15ns
0.47
*0.
45*
0.53
*0.
34*
0.33
*0.
14*
-0.2
7*0.
23*
0.22
*0.
08ns
WR
0.69
*0.
71*
0.37
*0.
47*
0.71
*0.
78*
0.76
*0.
24*
0.93
*0.
62*
-0.0
2ns0.
62*
0.62
*0.
03ns
WST
0.71
*0.
72*
0.29
*0.
44*
0.92
*0.
96*
0.92
*0.
22*
0.96
*0.
61*
-0.0
4ns0.
62*
0.63
*0.
00ns
WL
0.70
*0.
72*
0.29
*0.
44*
0.92
*0.
92*
0.85
*0.
23*
0.95
*0.
55*
0.04
ns0.
54*
0.54
*-0
.01ns
A0.
65*
0.82
*0.
22*
0.38
*0.
90*
0.85
*0.
82*
0.28
*0.
88*
0.54
*-0
.02ns
0.57
*0.
55*
0.04
ns
Pm
ax0.
58*
0.46
*0.
52*
0.31
*0.
36*
0.41
*0.
45*
0.13
ns0.
45*
0.50
*0.
07ns
0.53
*0.
47*
0.01
ns
Asa
t0.
43*
0.40
*0.
59*
0.40
*0.
39*
0.42
*0.
51*
0.04
ns0.
46*
0.55
*0.
13ns
0.57
*0.
54*
0.02
ns
SLA
0.74
*0.
42*
0.13
ns0.
51*
0.32
*0.
23*
0.27
*-0
.08ns
0.31
*0.
05ns
0.20
*0.
07ns
0.03
ns-0
.01ns
* =
Sign
ifica
nt c
orre
latio
n; ns
= n
on-s
igni
fican
t cor
rela
tion
at 5
% p
roba
bilit
y.
288
Braz. J. Plant Physiol., 18(2):281-290, 2006
A. J. D. VIEIRA et al. QTL ANALYSIS OF PHOTOSYNTHETIC TRAITS IN SOYBEAN
Braz. J. Plant Physiol., 18(2):281-290, 2006
289
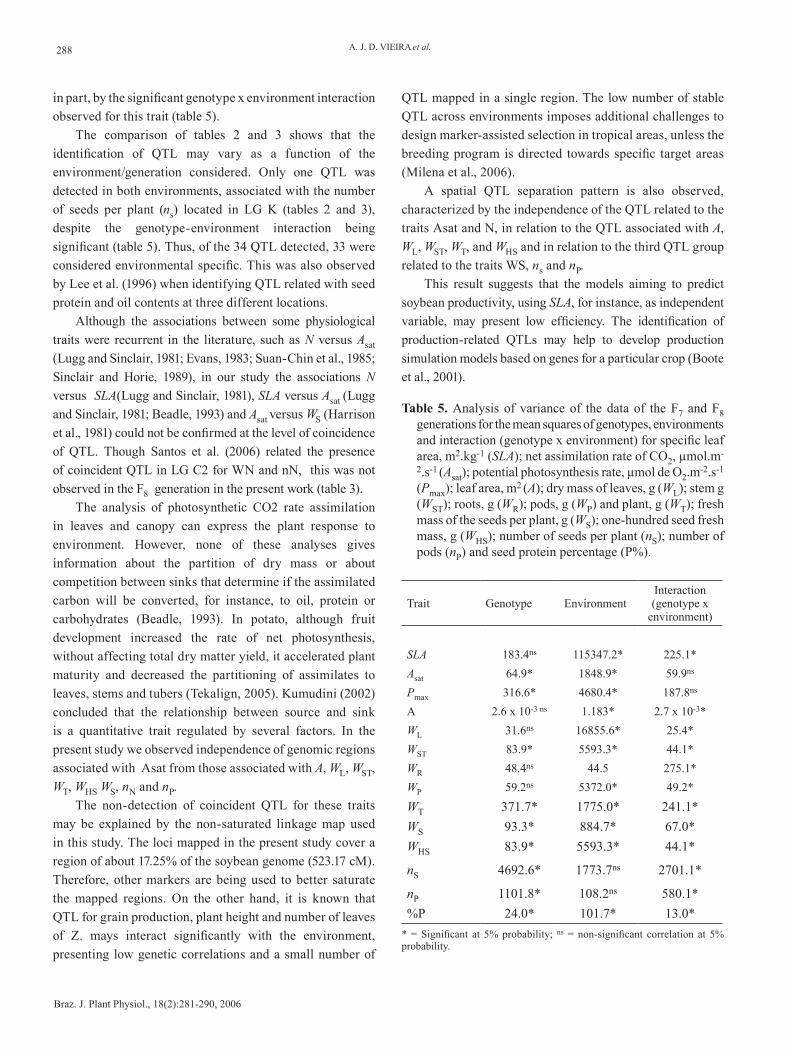
in part, by the significant genotype x environment interaction observed for this trait (table 5).
The comparison of tables 2 and 3 shows that the identification of QTL may vary as a function of the environment/generation considered. Only one QTL was detected in both environments, associated with the number of seeds per plant (ns) located in LG K (tables 2 and 3), despite the genotype-environment interaction being significant (table 5). Thus, of the 34 QTL detected, 33 were considered environmental specific. This was also observed by Lee et al. (1996) when identifying QTL related with seed protein and oil contents at three different locations.
Although the associations between some physiological traits were recurrent in the literature, such as N versus Asat
(Lugg and Sinclair, 1981; Evans, 1983; Suan-Chin et al., 1985; Sinclair and Horie, 1989), in our study the associations N versus SLA(Lugg and Sinclair, 1981), SLA versus Asat (Lugg and Sinclair, 1981; Beadle, 1993) and Asat versus WS (Harrison et al., 1981) could not be confirmed at the level of coincidence of QTL. Though Santos et al. (2006) related the presence of coincident QTL in LG C2 for WN and nN, this was not observed in the F8 generation in the present work (table 3).
The analysis of photosynthetic CO2 rate assimilation in leaves and canopy can express the plant response to environment. However, none of these analyses gives information about the partition of dry mass or about competition between sinks that determine if the assimilated carbon will be converted, for instance, to oil, protein or carbohydrates (Beadle, 1993). In potato, although fruit development increased the rate of net photosynthesis, without affecting total dry matter yield, it accelerated plant maturity and decreased the partitioning of assimilates to leaves, stems and tubers (Tekalign, 2005). Kumudini (2002) concluded that the relationship between source and sink is a quantitative trait regulated by several factors. In the present study we observed independence of genomic regions associated with Asat from those associated with A, WL, WST, WT, WHS WS, nN and nP.
The non-detection of coincident QTL for these traits may be explained by the non-saturated linkage map used in this study. The loci mapped in the present study cover a region of about 17.25% of the soybean genome (523.17 cM). Therefore, other markers are being used to better saturate the mapped regions. On the other hand, it is known that QTL for grain production, plant height and number of leaves of Z. mays interact significantly with the environment, presenting low genetic correlations and a small number of
Table 5. Analysis of variance of the data of the F7 and F8 generations for the mean squares of genotypes, environments and interaction (genotype x environment) for specific leaf area, m2.kg-1 (SLA); net assimilation rate of CO2, µmol.m-
2.s-1 (Asat); potential photosynthesis rate, µmol de O2.m
-2.s-1
(Pmax); leaf area, m2 (A); dry mass of leaves, g (WL); stem g (WST); roots, g (WR); pods, g (WP) and plant, g (WT); fresh mass of the seeds per plant, g (WS); one-hundred seed fresh mass, g (WHS); number of seeds per plant (nS); number of pods (nP) and seed protein percentage (P%).
Trait Genotype EnvironmentInteraction (genotype x
environment)
SLA 183.4ns 115347.2* 225.1*
Asat 64.9* 1848.9* 59.9ns
Pmax 316.6* 4680.4* 187.8ns
A 2.6 x 10⁻³ ns 1.183* 2.7 x 10-3*
WL 31.6ns 16855.6* 25.4*
WST 83.9* 5593.3* 44.1*
WR 48.4ns 44.5 275.1*
WP 59.2ns 5372.0* 49.2*
WT 371.7* 1775.0* 241.1*
WS 93.3* 884.7* 67.0*
WHS 83.9* 5593.3* 44.1*
nS 4692.6* 1773.7ns 2701.1*
nP 1101.8* 108.2ns 580.1*
%P 24.0* 101.7* 13.0*
* = Significant at 5% probability; ns = non-significant correlation at 5% probability.
QTL mapped in a single region. The low number of stable QTL across environments imposes additional challenges to design marker-assisted selection in tropical areas, unless the breeding program is directed towards specific target areas (Milena et al., 2006).
A spatial QTL separation pattern is also observed, characterized by the independence of the QTL related to the traits Asat and N, in relation to the QTL associated with A, WL, WST, WT, and WHS and in relation to the third QTL group related to the traits WS, ns and nP.
This result suggests that the models aiming to predict soybean productivity, using SLA, for instance, as independent variable, may present low efficiency. The identification of production-related QTLs may help to develop production simulation models based on genes for a particular crop (Boote et al., 2001).
288
Braz. J. Plant Physiol., 18(2):281-290, 2006
A. J. D. VIEIRA et al. QTL ANALYSIS OF PHOTOSYNTHETIC TRAITS IN SOYBEAN
Braz. J. Plant Physiol., 18(2):281-290, 2006
289
Therefore, only in the case of having coincident QTL for different populations/environments, saturated maps and confirmation between association of QTL with different traits could one foresee the use of these tools in breeding programs based, for instance, on marker-assisted selection. The use of RILs is of particular interest, as they could be replicated in many different environmental conditions. This work constitutes the first genetic study of photosynthesis-related traits upon soybean productivity, and has led to the description of important markers for breeding programs.
Therefore, there is a great potential for improving the integration of physiological studies with breeding programs, using mathematical models to predict soybean production, mainly based on the coincidence of QTL associated with production and physiological traits, such as CO2 net assimilation rate.
Thus, under the conditions this experiment was carried out, it can be concluded that:
a) It was possible to identify QTL associated with various soybean traits, namely: specific leaf area, net CO2 assimilation rate under saturating light, specific leaf nitrogen, dry mass of roots, stem, leaves, total plant, one-hundred seed fresh mass, and number of seeds and pods per plant;
b) The correlations between the soybean traits were confirmed partially by the coincidence of the QTL;
c) The RIL population evaluated shows a great potential for mapping loci associated with quantitative traits of the soybean.
Acknowledgements: To the Conselho Nacional de Desen-volvimento Científico e Tecnológico (CNPq), Fundação de Amparo à Pesquisa do Estado de Minas Gerais (FAPEMIG) and Coordenação de Aperfeiçoamento de Pessoal de Nível Superior (CAPES). To the Universidade Federal de Viçosa (UFV), particularly, to the Instituto de Biotecnologia Apli-cada à Agropecuária (BIOAGRO), Unidade de Crescimento de Plantas (UCP) and the Graduate Program in Plant Physi-ology for the opportunity to develop this work. To Gerardo Cervigni, for his valuable help with the statistical analyses. To Mercês Bustamante, for her dedication and precious help with the determination of potential photosynthesis rate.
REFERENCES
Basten CJ, Zeng ZB, Wang S (2002) Windows QTL Carthog-rapher, version 2.0. Raleigh, NC: Department of Statistics; North Carolina State University.
Beadle CL (1993) Growth analysis In: Hall DO, Scurlock JMO, Bolhár-Nordenkampf RCL, Long S P (eds), Photosynthesis
and production in a changing environment: a field and labo-ratory manual, pp.36-46. Chapman & Hall, London.
Boote KJ, Krop MJ, Bindraban PS (2001) Physiology and modelling of traits in crop plants: implications for genetic improvement. Agric. Systems 70:395-420.
Cregan PB, Jarvik T, Bush AL, Shoemaker KC, Lark KG, Kahler AL, Kaya N, Van Toai TT, Lohnes DG, Chung J, Specht JE (1999) An integrated genetic linkage map of the soybean genome. Crop Sci. 39:1464 - 1490.
Cruz CD, Shuster I (2000) Software GQMol (Viçosa, Bras-il). Universidade Federal de Viçosa. Available at http://www.ufv.br/dbg/gqmol/gqmol.htm. Accessed May, 9th 2005.
Deorge RW, Churchill GA (1996) Permutation tests for mul-tiple loci affecting a quantitative character. Genetics 142:285-294.
Evans JR (1983) Nitrogen and photosynthesis in the flag leaf of wheat (Triticum aestivum L.). Plant Physiol. 72:297-302.
Fehr WR, Caviness CE (1977) Stage of soybean development. Special Report 80. Ames, Iowa, Cooperative Extension Service. Iowa State University, 11p.
Griffin KL, Luo Y (1999) Sensitivity and acclimation of Gly-cine max (L.) Merr. Leaf gas exchange to CO2 partial pres-sure. Environ. Exp. Bot. 42:141-143.
Harrison SA, Boerma HR, Ashley DA (1981) Heritability of canopy-apparent photosynthesis and its relationship to seed yield in soybeans. Crop Sci. 21:222-226.
Instituto Adolfo Lutz (1985) Normas analíticas do Instituto Adolfo Lutz; métodos químicos e físicos para análise de alimentos. 3rd ed., São Paulo,. v.1, 533p.
Kumudini S (2002) Trials and tribulations: a review of the role of assimilate supply in soybean genetic yield improve-ment. Field Crops Res. 75:211–222
Lebreton C, Lazic-Jancic V, Steed A, Pekic S, Quarrie S. A. (1995) Identification of QTL for drought responses in maize and their use in testing causal relationships between traits. J. Exp. Bot. 46:853-86.
Lee SH, Bailey MA, Mian MAR, Shipe ER, Ashley DA, Par-rott WA, Hussey RS, Boerma HR (1996) Identification of quantitative trait loci for plant height, lodging and matu-rity in a soybean population segregating for growth habit. Theor. Appl. Genet. 92:516-523.
Lugg DG, Sinclair TR (1981) Seasonal changes in photosyn-thesis of field-grown soybean leaflets 2. relation to nitro-gen. Photosynthetica 15(1):138-144.
Mansur LM, Lark KG, Kross H, Oliveira A (1993) Interval mapping of quantitative trait loci for reproductive, mor-phological, and seed traits of soybean (Glycine max L.). Theor. Appl. Genet. 86:907-913.
Milena L, Souza C, Bento D, Souza A, Carlini-Gracia L. (2006) Mapping QTL for Grain Yield and Plant Traits in a Tropical Maize Population. Mol. Breed. 17:227-239
Miranda FD de (2002) Uso de marcadores RAPD para mapea-mento de QTLs que determinam teor de proteína em soja. Viçosa, Universidade Federal de Viçosa. MSc thesis.
Nicolás MF, Hungria M, Arias CAA (2006) Identification of quantitative trait loci controlling nodulation and shoot
290
Braz. J. Plant Physiol., 18(2):281-290, 2006
A. J. D. VIEIRA et al.
mass in progenies from two Brazilian soybean cultivars. Field Crops Res. 95:355-366
Oliveira DA de (2002) Mapeamento de QTLs para caracterís-ticas agronômicas e relação entre lipoxigenases e teor linolênico com a qualidade fisiológica de sementes de soja. Viçosa, Universidade Federal de Viçosa. MSc thesis.
Price AH, Cairns JE, Horton P, Jone HG, Griffths H (2002) Linking drought-resistance mechanisms to drought avoid-ance in upland rice using a QTL approach: progress and new opportunities to integrate stomatal and mesophyll re-sponses. J. Exp. Bot. 53:989-1004.
Prioul JL, Quarrie S, Causse M, Vienne D (1997) Dissecting complex physiological functions (?) through the use of mo-lecular quantitative genetics. J. Exp. Bot. 48:1151-1163.
Santos MA, Nicolas MF, Hungria M (2006) Identificação de QTL associados à simbiose entre Bradyrhizobium japon-icum, B. elkanii e soja. Pesq. Agropec. Bras. 41:67-75
Sinclair TR, Horie T (1989) Leaf nitrogen, photosynthesis, and crop radiation use efficiency: a review. Crop Sci. 29:90-98.
Soares TCB (2000) Mapeamento de locos que controlam o conteúdo de proteína em soja. Viçosa, Universidade Fed-eral de Viçosa. MSc thesis.
Suan-Chin W, Cowan IR, Farquiar GD (1985) Leaf conduct-ance in relation to rate of CO2 assimilation. Plant Physi-ol. 78:821-825.
Tekalign T, Hammes PS (2005) Growth and productivity of potato as influenced by cultivar and reproductive growth I. Stomatal conductance, rate of transpiration, net photo-synthesis, and dry matter production and allocation. Sci. Hortic. 105:13-27
Wiebold WJ, Schibles R, Green DE (1981) Selection for ap-parent photosynthesis and related leaf traits in early gen-erations of soybean. Crop Sci. 21:969-973
Zeng ZB (1994) Precision mapping quantitative trait loci. Ge-netics 136:1457-1468.
Copyright © 2022 FDOKUMEN