Quantitative trait loci that determine plasma lipids and obesity in C57BL/6J and 129S1/SvImJ inbred...
9
Copyright © 2004 by the American Society for Biochemistry and Molecular Biology, Inc. 1624 Journal of Lipid Research Volume 45, 2004 This article is available online at http://www.jlr.org Quantitative trait loci that determine plasma lipids and obesity in C57BL/6J and 129S1/SvImJ inbred mice Naoki Ishimori,* Renhua Li,* Peter M. Kelmenson,* Ron Korstanje,* Kenneth A. Walsh,* Gary A. Churchill,* Kristina Forsman-Semb, † and Beverly Paigen 1, * The Jackson Laboratory,* Bar Harbor, ME; and AstraZeneca R&D Mölndal, † Mölndal, Sweden Abstract The plasma lipid concentrations and obesity of C57BL/6J (B6) and 129S1/SvImJ (129) inbred mouse strains fed a high-fat diet containing 15% dairy fat, 1% cho- lesterol, and 0.5% cholic acid differ markedly. To identify the loci controlling these traits, we conducted a quantitative trait loci (QTL) analysis of 294 (B6 129) F 2 females fed a high-fat diet for 14 weeks. Non-HDL cholesterol concentra- tions were affected by five significant loci: Nhdlq1 [chromo- some 8, peak centimorgan (cM) 38, logarithm of odds [LOD] 4.4); Nhdlq4 (chromosome 10, cM 70, LOD 4.0); Nhdlq5 (chromosome 6, cM 0) interacting with Nhdlq4; Nhdlq6 (chromosome 7, cM 10) interacting with Nhdlq1; and Nhdlq7 (chromosome 15, cM 0) interacting with Nhdlq4. Tri- glyceride (TG) concentrations were affected by three signif- icant loci: Tgq1 (chromosome 18, cM 42, LOD 3.2) and Tgq2 (chromosome 9, cM 66) interacting with Tgq3 (chro- mosome 4, cM 58). Obesity measured by percentage of body fat mass and body mass index was affected by two sig- nificant loci: Obq16 (chromosome 8, cM 48, LOD 10.0) in- teracting with Obq18 (chromosome 9, cM 65). Knowing the genes for these QTL will enhance our understanding of obesity and lipid metabolism.—Ishimori, N., R. Li, P. M. Kelmenson, R. Korstanje, K. A. Walsh, G. A. Churchill, K. Forsman-Semb, and B. Paigen. Quantitative trait loci that determine plasma lipids and obesity in C57BL/6J and 129S1/ SvImJ inbred mice. J. Lipid Res. 2004. 45: 1624–1632. Supplementary key words body fat mass • body mass index • high-fat diet • non-high density lipoprotein cholesterol • quantitative trait loci • triglyceride Cardiovascular disease is often coincident with dyslipi- demia, obesity, hypertension, and diabetes, which are often clustered in some individuals and recognized as meta- bolic syndrome (1). These disorders are complex, multi- factorial, and controlled by both environmental and ge- netic factors. The causal relationship between the risk of cardiovascular disease and either obesity or increased LDL cholesterol or triglyceride (TG) is definitively estab- lished. Much is known about the nature and effect of envi- ronmental factors, yet relatively little is known about the genetic basis of these disorders. Thus, knowledge of the primary genetic determinants of plasma lipoprotein levels and obesity will enhance our understanding of the patho- physiological background and may provide novel molecu- lar targets for intervention. Mouse crosses have helped to localize and identify genes underlying these complex traits (2–5). When ex- posed to a high-fat diet, mice of different inbred strains exhibit great variation in plasma lipoproteins and obesity (6). Our laboratory has used quantitative trait loci (QTL) analysis to investigate the genetics underlying lipoprotein metabolism and atherosclerosis (5, 7). The number of ge- netic loci that differ between C57BL/6J (B6) and 129S1/ SvImJ (129) mice underscores the importance of strain background when evaluating the impact of a gene defi- ciency in targeted mutant mice. In most cases, targeted mutant mice are derived from embryonic stem cells of 129 mouse substrains. A target gene in these cells is “knocked out” by homologous recombination, and the resulting cells are microinjected into B6 blastocysts, which develop into B6/129 chimeras. These in turn are mated to B6 mice to produce mice heterozygous for B6 and 129 alleles at all loci for which these strains differ. These mice are in- tercrossed to generate mice homozygous for 129 alleles at the target locus (/) and a small region surrounding it, but the remainder of their genomes are a random mix- ture of B6 and 129 alleles (8). If littermates of such mixed- background targeted mutant stocks differ in their allelic combinations, they could yield different experimental re- sults. Thus, to evaluate gene function in targeted mutant mice, the genetic background must be carefully con- trolled by constructing B6/129 congenic strains. This is carried out by successively backcrossing carriers of the tar- geted mutation to B6 mice until the only 129 alleles left Abbreviations: BMI, body mass index; cM, centimorgan; LOD, log- arithm of odds; % fat, percentage of body fat mass; PLTP, phospholipid transfer protein; QTL, quantitative trait loci; SSLP, simple sequence length polymorphic; TG, triglyceride. 1 To whom correspondence should be addressed. e-mail: [email protected] Manuscript received 9 March 2004 and in revised form 26 April 2004. Published, JLR Papers in Press, June 21, 2004. DOI 10.1194/jlr.M400098-JLR200 by guest, on May 26, 2016 www.jlr.org Downloaded from
-
Upload
independent -
Category
Documents
-
view
2 -
download
0
Transcript of Quantitative trait loci that determine plasma lipids and obesity in C57BL/6J and 129S1/SvImJ inbred...

Copyright © 2004 by the American Society for Biochemistry and Molecular Biology, Inc.
1624 Journal of Lipid Research
Volume 45, 2004
This article is available online at http://www.jlr.org
Quantitative trait loci that determine plasma lipids and obesity in C57BL/6J and 129S1/SvImJ inbred mice
Naoki Ishimori,* Renhua Li,* Peter M. Kelmenson,* Ron Korstanje,* Kenneth A. Walsh,*
Gary A. Churchill,* Kristina Forsman-Semb,
†
and Beverly Paigen
1,
*
The Jackson Laboratory,* Bar Harbor, ME; and AstraZeneca R&D Mölndal,
†
Mölndal, Sweden
Abstract The plasma lipid concentrations and obesity ofC57BL/6J (B6) and 129S1/SvImJ (129) inbred mousestrains fed a high-fat diet containing 15% dairy fat, 1% cho-lesterol, and 0.5% cholic acid differ markedly. To identifythe loci controlling these traits, we conducted a quantitative
trait loci (QTL) analysis of 294 (B6
�
129) F
2
females fed ahigh-fat diet for 14 weeks. Non-HDL cholesterol concentra-
tions were affected by five significant loci:
Nhdlq1
[chromo-some 8, peak centimorgan (cM) 38, logarithm of odds[LOD] 4.4);
Nhdlq4
(chromosome 10, cM 70, LOD 4.0);
Nhdlq5
(chromosome 6, cM 0) interacting with
Nhdlq4
;
Nhdlq6
(chromosome 7, cM 10) interacting with
Nhdlq1
; and
Nhdlq7
(chromosome 15, cM 0) interacting with
Nhdlq4
. Tri-glyceride (TG) concentrations were affected by three signif-icant loci:
Tgq1
(chromosome 18, cM 42, LOD 3.2) and
Tgq2
(chromosome 9, cM 66) interacting with
Tgq3
(chro-mosome 4, cM 58). Obesity measured by percentage ofbody fat mass and body mass index was affected by two sig-nificant loci:
Obq16
(chromosome 8, cM 48, LOD 10.0) in-teracting with
Obq18
(chromosome 9, cM 65). Knowingthe genes for these QTL will enhance our understanding of
obesity and lipid metabolism.
—Ishimori, N., R. Li, P. M.Kelmenson, R. Korstanje, K. A. Walsh, G. A. Churchill, K.Forsman-Semb, and B. Paigen.
Quantitative trait loci that
determine plasma lipids and obesity in C57BL/6J and 129S1/SvImJ inbred mice.
J. Lipid Res.
2004.
45:
1624–1632.
Supplementary key words
body fat mass
•
body mass index
•
high-fat
diet
•
non-high density lipoprotein cholesterol
•
quantitative traitloci
•
triglyceride
Cardiovascular disease is often coincident with dyslipi-demia, obesity, hypertension, and diabetes, which are
often clustered in some individuals and recognized as meta-bolic syndrome (1). These disorders are complex, multi-factorial, and controlled by both environmental and ge-netic factors. The causal relationship between the risk ofcardiovascular disease and either obesity or increasedLDL cholesterol or triglyceride (TG) is definitively estab-lished. Much is known about the nature and effect of envi-
ronmental factors, yet relatively little is known about thegenetic basis of these disorders. Thus, knowledge of theprimary genetic determinants of plasma lipoprotein levelsand obesity will enhance our understanding of the patho-physiological background and may provide novel molecu-lar targets for intervention.
Mouse crosses have helped to localize and identifygenes underlying these complex traits (2–5). When ex-posed to a high-fat diet, mice of different inbred strainsexhibit great variation in plasma lipoproteins and obesity(6). Our laboratory has used quantitative trait loci (QTL)analysis to investigate the genetics underlying lipoproteinmetabolism and atherosclerosis (5, 7). The number of ge-netic loci that differ between C57BL/6J (B6) and 129S1/SvImJ (129) mice underscores the importance of strainbackground when evaluating the impact of a gene defi-ciency in targeted mutant mice. In most cases, targetedmutant mice are derived from embryonic stem cells of 129mouse substrains. A target gene in these cells is “knockedout” by homologous recombination, and the resultingcells are microinjected into B6 blastocysts, which developinto B6/129 chimeras. These in turn are mated to B6mice to produce mice heterozygous for B6 and 129 allelesat all loci for which these strains differ. These mice are in-tercrossed to generate mice homozygous for 129 alleles atthe target locus (
�
/
�
) and a small region surrounding it,but the remainder of their genomes are a random mix-ture of B6 and 129 alleles (8). If littermates of such mixed-background targeted mutant stocks differ in their alleliccombinations, they could yield different experimental re-sults. Thus, to evaluate gene function in targeted mutantmice, the genetic background must be carefully con-trolled by constructing B6/129 congenic strains. This iscarried out by successively backcrossing carriers of the tar-geted mutation to B6 mice until the only 129 alleles left
Abbreviations: BMI, body mass index; cM, centimorgan; LOD, log-arithm of odds; % fat, percentage of body fat mass; PLTP, phospholipidtransfer protein; QTL, quantitative trait loci; SSLP, simple sequencelength polymorphic; TG, triglyceride.
1
To whom correspondence should be addressed.e-mail: [email protected]
Manuscript received 9 March 2004 and in revised form 26 April 2004.
Published, JLR Papers in Press, June 21, 2004.DOI 10.1194/jlr.M400098-JLR200
by guest, on May 26, 2016
ww
w.jlr.org
Dow
nloaded from

Ishimori et al.
Genetics of murine plasma lipids and obesity 1625
on a nearly pure B6 background are the target locus(
�
/
�
) and the surrounding genetic materials (9).We report here the results of our investigation of
plasma non-HDL cholesterol levels, TG concentrations,and obesity among (B6
�
129) F
2
females that had for 14weeks consumed a high-fat diet containing 15% dairy fat,1% cholesterol, and 0.5% of the hydrophobic bile acidcholic acid, which promotes cholesterol absorption. Previ-ously, we reported QTL detected with this intercross thatdetermine plasma HDL-cholesterol levels and atheroscle-rosis susceptibility (10). In this study, we identified severalQTL for non-HDL cholesterol, TG, percentage of body fatmass (% fat), and body mass index (BMI).
MATERIALS AND METHODS
Animals and diet
B6 and 129 mice were obtained from The Jackson Laboratory(Bar Harbor, ME) and mated to produce the (B6
�
129) F
1
prog-eny, which were intercrossed to produce an F
2
population ofwhich the 301 female F
2
progeny were used in this investigation.Mice were maintained in a temperature- and humidity-con-trolled environment with a 14 h light/10 h dark cycle and givenunrestricted access to food and acidified water. The cages werecovered with polyester filters and contained pine shavings bed-ding. Six week old mice were fed a high-fat diet (11, 12) contain-ing 15% dairy fat, 1% cholesterol, and 0.5% cholic acid for 14weeks, after which they were killed by cervical dislocation. Exper-iments were approved by the Institutional Animal Care and UseCommittee of The Jackson Laboratory.
Quantitative phenotype measurements
After consuming the high-fat diet for 14 weeks, mice werefasted for 4 h before blood samples were collected in plasma sep-arator tubes containing EDTA, placed on ice, and centrifuged.Plasma lipid concentrations were measured using an enzymaticassay (Beckman, Fullerton, CA) as previously described (12). Be-cause mice were fasted before blood was collected and becausechylomicrons display very short half-lives (13), non-HDL was pre-sumed to comprise predominantly VLDL and LDL. Non-HDLconcentrations were obtained by subtracting HDL from totalcholesterol concentrations. The % fat of each mouse was mea-sured using peripheral dual-energy X-ray absorptiometry (PIXI-mus; GE-Lunar, Madison, WI), a method that has been validatedin mice as an accurate measure (14). The BMI of each mousewas calculated by dividing its body weight (grams) by the squareof its anal-nasal length (meters).
Genotyping
We genotyped 294 F
2
progeny initially with 88 simple se-quence length polymorphic (SSLP) markers (Research Genetics,Huntsville, AL) spaced
�
20 centimorgan (cM) apart and lateradded 23 additional SSLP markers in the QTL regions as previ-ously described (10). The average spacing between these mark-ers (
�
SD) was 14
�
12 cM. DNA isolation, PCR amplification,and subsequent gel electrophoresis have been described previ-ously (15). Reported genetic map positions were retrieved fromthe Mouse Genome Informatics database (http://www.informatics.jax.org).
Statistics
One-way ANOVAs with Tukey’s correction for multiple pair-wise compositions were used to determine statistically significant
differences in plasma lipid levels, BMI, and % fat between mousegroups. Data were analyzed using Graphpad Prism (Windowsversion 3.00; GraphPad Software, San Diego, CA). Phenotypeswere associated using Pearson’s correlation. As described previ-ously (16, 17), a three-step QTL analysis was conducted to searchfor main effects and pairwise gene interactions and then to inte-grate all of the main and interacting QTL phenotype associa-tions into a multiple regression. In the regression analysis, wecombined all significant and suggestive QTL and interactions ina multiple regression model. Terms that did not meet the nomi-nal 0.02 level in the regression were eliminated in a backwardstepwise manner with the exception that main effect terms in-volved in a significant interaction were retained. Final modelswere reported for each trait. Some traits were log transformedbefore analysis. This resulted in approximate normality for non-HDL and BMI. QTL were deemed significant if they either metor exceeded the 95% genome-wide adjusted threshold, whichwas assessed by permutation analysis for each trait [logarithm ofodds (LOD)
�
3.0 for log-transformed non-HDL, LOD
�
3.1 forTG and log-transformed BMI, and LOD
�
3.2 for % fat]; theywere deemed suggestive if they either met or exceeded the 37%genome-wide adjusted threshold (LOD
�
1.8 for TG and LOD
�
1.9 for other traits) but were not significant. QTL confidence in-tervals were calculated according to the posterior probabilitydensity of QTL locations, as described previously (16). Varianceindicates the percentage of the total F
2
phenotypic variance asso-ciated with each marker. Analyses were carried out using Pseudo-marker 0.9 software (Sen and Churchill; http://www.jax.org/staff/churchill/labsite).
Naming QTL
In accordance with the International Committee on Standard-ized Genetic Nomenclature for Mice (http://www.informatics.jax.org/mgihome/nomen) and the Complex Traits Consortium(18), we have named QTL as follows. QTL are named if signifi-cant or if suggestive but confirm a QTL reported previously. If aQTL substantially overlaps a previously discovered QTL, it isgiven the same name if the crosses share at least one parent incommon (i.e., B6
�
129 and CAST
�
129) and it is given a newname if the strains are all different.
TABLE 1. Plasma lipid concentrations, % fat, and BMI of 10 female B6, 10 female 129, 8 female F
1
, and 294 female F
2
progeny fed a high-fat diet for 14 weeks
Mice n
Plasma
a
% Fat BMINon-HDL TG
mg/dl %
�
10
�
4
g/m
2
B6 10 140
�
9
b,c
45
�
2
d
19
�
0
b,e
23
�
1
b,c
129 10 71
�
3
c
64
�
5 36
�
1
c
29
�
0F
1
8 107
�
6 38
�
1
b
29
�
2 27
�
1F
2
294
f
123
�
5 51
�
1 25
�
0 27
�
0
BMI, body mass index; % fat, percentage of body fat mass; TG, tri-glyceride. Data are presented as means
�
SEM.
a
Plasma lipid concentrations were measured in mice fasted for 4 h.
b
Significant difference (
P
�
0.001, by ANOVA) versus 129.
c
Significant difference (
P
�
0.01, by ANOVA) versus F
1.
d
Significant difference (
P
�
0.01, by ANOVA) versus 129.
e
Significant difference (
P
�
0.001, by ANOVA) versus F
1
.
f
The number of F
2
mice is 292 for plasma lipid concentrationsand 291 for % fat. Because it is the distribution and not the meanamong the F
2
population that is most important for detecting geneticlinkage to a phenotype, we did not test for significant differences be-tween F
2
progeny and either the parental strains or F
1
progeny.
by guest, on May 26, 2016
ww
w.jlr.org
Dow
nloaded from

1626 Journal of Lipid Research
Volume 45, 2004
RESULTS
Inheritance of plasma non-HDL and TG levels, % fat, and BMI
Plasma non-HDL and TG concentrations, % fat, andBMI were measured after animals had been fed the high-fat diet for 14 weeks (
Table 1
). Compared with 129, B6mice displayed significantly increased non-HDL levels.The F
1
mice displayed non-HDL levels intermediate be-tween and significantly different from those of the paren-tal strains; thus, high non-HDL cholesterol levels were in-herited in an additive manner. Compared with 129, B6mice displayed significantly decreased plasma TG levels.The F
1
mice displayed TG levels comparable to those ofstrain B6 and significantly lower than those of strain 129;thus, high TG levels were inherited in a recessive manner.B6 mice displayed significantly lower % fat than did 129mice, and the F
1
mice displayed intermediate values be-tween those of the parental strains. The BMI distributionwas similar to that for % fat; B6 mice displayed signifi-cantly lower BMI compared with 129 mice. The F
1
mice
displayed BMI values intermediate between the parentsbut closer in value to those of strain 129. We started with301 F
2
females and quantified each trait of 294 females af-ter the 14 week high-fat diet. Log-transformed non-HDL,TG, % fat, and log-transformed BMI were normally dis-tributed among the F
2
progeny (
Fig. 1A–D
). The log BMIwas positively correlated with TG and % fat but negativelycorrelated with log-transformed non-HDL (
Table 2
).
Identification of genetic loci affecting non-HDL and TG concentrations, % fat, and BMI
The genome-wide scans for single QTL are presented inFig. 1 and summarized in
Table 3
, which provides theQTL peak, 95% confidence interval, LOD score, alleleconferring the high value, nearest SSLP marker to QTLpeak, overlapping QTL reported previously, and candi-date genes for each QTL. The QTL were named if theywere significant either as single QTL or interacting QTL.Suggestive QTL in this cross that were found previouslywere also named. We named the loci
Nhdlq
for non-HDLQTL,
Tgq
for TG QTL, and
Obq
for obesity QTL, in each
Fig. 1. Distributions and genome-wide scans for the traits. A–D: Log-transformed plasma non-HDL concentrations, plasma triglyceride(TG) concentrations, percentage of body fat mass (% fat), and log-transformed body mass index (BMI), respectively, in (B6 � 129) F2 prog-eny fed a high-fat diet for 14 weeks. The number of mice is 292 for plasma lipid concentrations, 291 for % fat, and 294 for BMI. Chromo-somes 1 through X are represented numerically on the ordinate. The relative width of the space allotted for each chromosome reflects therelative length of each chromosome. The abscissa represents the logarithm of odds (LOD) score, the traditional metric of genetic linkage.The significant (P � 0.05) and suggestive (P � 0.63) levels of linkage were determined by permutation testing (17).
by guest, on May 26, 2016
ww
w.jlr.org
Dow
nloaded from

Ishimori et al. Genetics of murine plasma lipids and obesity 1627
case followed by a number. Figure 2 shows the allele ef-fects, which demonstrate the magnitude of the effect andthe inheritance pattern (dominant, recessive, or additive).
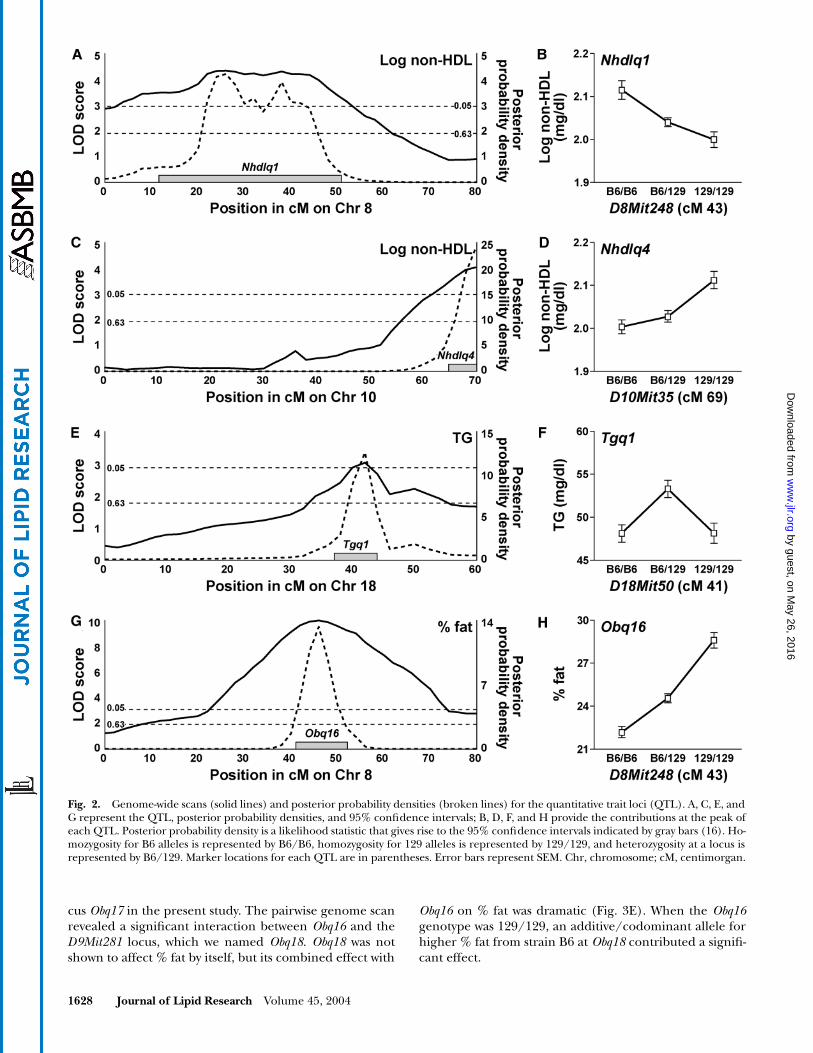
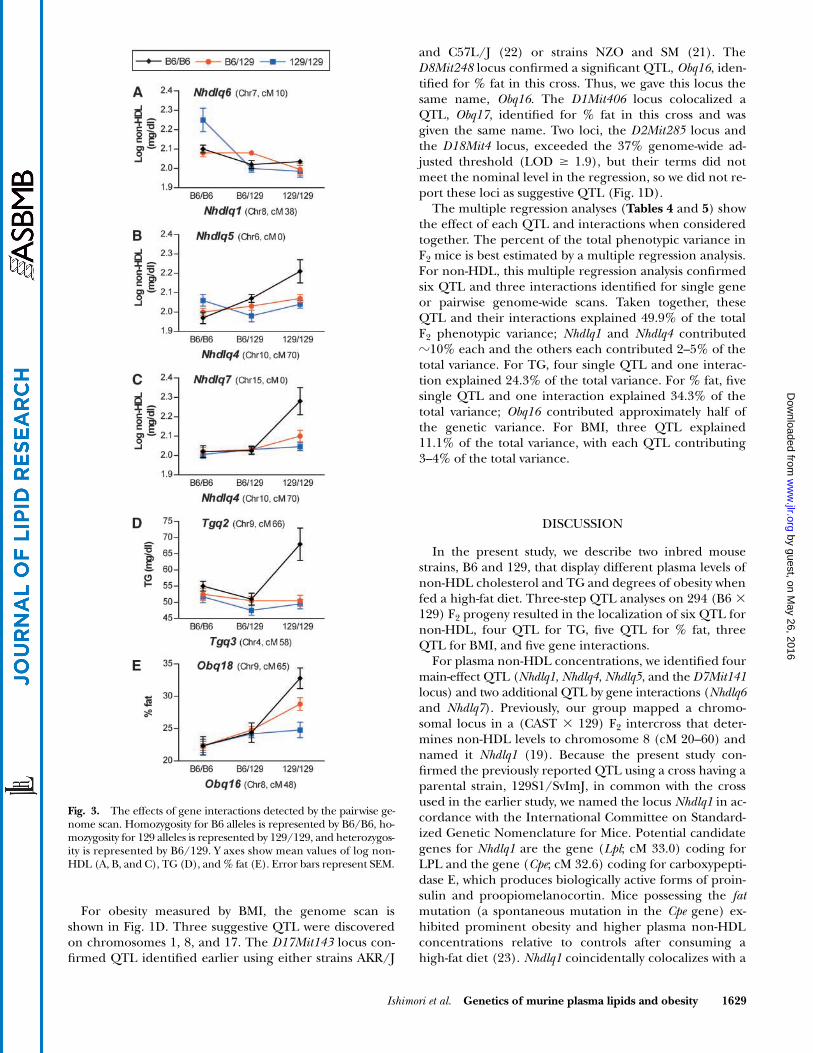
For plasma non-HDL concentrations, the genome scanis shown in Fig. 1A. The significant chromosome 8 QTL(Fig. 2A; peak LOD 4.4), named Nhdlq1, had a dominantB6 allele for increased non-HDL concentrations (Fig. 2B).This locus confirmed a QTL identified earlier using strainsCAST and 129 (19). Nhdlq4, on chromosome 10 (Fig. 2C;peak LOD 4.0), caused higher non-HDL when homozy-gous for a recessive 129 allele (Fig. 2D). Two suggestive QTLwere discovered at the D6Mit86 locus and the D7Mit141locus. The pairwise genome scan revealed three significantinteractions. Nhdlq1 interacted with the D7Mit294 locus,which we named Nhdlq6. Nhdlq6 did not affect non-HDLconcentrations by itself, but its effect in combination withNhdlq1 on non-HDL was strong (Fig. 3A). When the Nhdlq1genotype was B6/B6, homozygosity for a recessive allelefrom strain 129 at Nhdlq6 contributed significantly to in-crease non-HDL. A second significant interaction was found
between Nhdlq4 and the D6Mit86 locus, named Nhdlq5,which was suggestive as a single QTL (Fig. 3B). When theNhdlq4 genotype was 129/129, the contribution of a reces-sive B6 allele for increased non-HDL at Nhdlq5 became sig-nificant. A third interaction was found between Nhdlq4 andthe D15Mit13 locus, which we named Nhdlq7. Nhdlq7 didnot affect non-HDL by itself, but its combined effect withNhdlq4 on non-HDL was dramatic (Fig. 3C). When theNhdlq4 genotype was 129/129, homozygosity for a recessiveB6 allele at Nhdlq7 significantly increased plasma non-HDL.
For plasma TG concentrations, we found a significantlocus on chromosome 18, which we named Tgq1 (Fig. 2E;peak LOD 3.2) and two suggestive loci on chromosomes 9and 14. At Tgq1, the heterozygous B6/129 genotype wasassociated with significantly increased TG concentrations(Fig. 2F). The pairwise genome scan revealed that an in-teraction at D9Mit281 and D4Mit308, which we namedTgq2 and Tgq3, respectively, affected plasma TG concen-trations with statistical significance (Fig. 3D). When the Tgq3genotype was 129/129, homozygosity for a recessive strainB6 allele at Tgq2 contributed significantly increased TG.
For obesity measured by % fat, the genome scan isshown in Fig. 1C. The significant chromosome 8 QTLnamed Obq16 (Fig. 2G; peak LOD 10.0) had an additive129 allele for higher % fat (Fig. 2H). Three suggestiveQTL were discovered on chromosomes 1, 6, and 12. TheD6Mit86 locus confirmed a QTL, Mob2, identified earlierusing strains B6 and SPRET (20). We named this locusMob2 in the present cross, which shared the parentalstrain B6 in common with the earlier cross. The D1Mit495locus confirmed adjacent QTL, Obq8 and Obq9, identifiedearlier using strains NZO and SM (21). We named this lo-
TABLE 2. Pearson correlation coefficients among plasma lipid concentrations, % fat, and BMI in the F2 progeny fed a high-fat diet
for 14 weeks
Variable Log Non-HDL TG % Fat
TG 0.14a
% fat �0.23b 0.21c
Log BMI �0.23b 0.22c 0.40b
The number of mice for each analysis was from 289 to 292.a P � 0.05.b P � 0.0001.c P � 0.001.
TABLE 3. QTL identified for single gene or pairwise genome-wide scans of 294 (B6 � 129) F2 females
TraitsChromosomal (Chr)
Location95% Confidence
IntervalLocus Name
Logarithm of Odds Score
High Allele
Nearest Marker
Overlapping QTLa (Reference)
Candidate Genes (cM)
cM
Non-HDL Chr 8 (38)b 15–52 Nhdlq1 4.4 B6 D8Mit248 Nhdlq1 (19) Cpe (32.6), Lpl (33.0)Chr 10 (70)b 65–70 Nhdlq4 4.0 129 D10Mit35 Pltp2 (25) Apof (73.0)Chr 6 (0)b 0–24 Nhdlq5 2.4c B6 D6Mit86Chr 7 (70) 50–80 –d 2.4c 129 D7Mit141Chr 7 (10)b 5–20 Nhdlq6 — — D7Mit294 Unnamed QTL (19) Apoc2 (4.0)Chr 15 (0)b 0–20 Nhdlq7 — — D15Mit13 Unnamed QTL (19)
TG Chr 18 (42) 37–44 Tgq1 3.2 B6/129 D18Mit50Chr 9 (66)b 44–68 Tgq2 2.2c B6 D9Mit281 Unnamed QTL (28)Chr 14 (14) 6–48 –d 2.0c B6 D14Mit60Chr 4 (58)b 30–90 Tgq3 — — D4Mit308 Lepr (46.7), Angptl3
(48.5), Cpt2 (54.4)% fat Chr 8 (48)b 42–53 Obq16 10.0 129 D8Mit248
Chr 12 (2) 0–16 –d 2.9c 129 D12Mit182 Pomc1 (4.0)Chr 6 (0) 0–10 Mob2 2.6c 129 D6Mit86 Mob2 (20) Lep (10.5)Chr 1 (74) 48–108 Obq17 2.3c 129 D1Mit495 Obq8 (21), Obq9 (21)Chr 9 (65)b 0–75 Obq18 — — D9Mit281 Dob2 (30), Mob8 (31),
Obq5 (32), Adip5 (33)BMI Chr 17 (8) 0–25 Obq19 2.9c B6 D17Mit143 Unnamed QTL (21),
Obq4 (22)Igf2r (7.35), Acat2
(7.5), Ppard (13.5)Chr 8 (52) 38–72 Obq16 2.5c 129 D8Mit248 Obq16 (this study)Chr 1 (102) 56–108 Obq17 2.4c 129 D1Mit406 Obq8 (21), Obq9 (21)
cM, centimorgan; QTL, quantitative trait loci. The number of F2 mice is 292 for plasma lipid concentrations and 291 for % fat.a Overlapping QTL identified in previous studies.b Interacting QTL.c Suggestive QTL.d We did not name this QTL because it is below the statistically significant level and overlaps no previously discovered QTL.
by guest, on May 26, 2016
ww
w.jlr.org
Dow
nloaded from
1628 Journal of Lipid Research Volume 45, 2004
cus Obq17 in the present study. The pairwise genome scanrevealed a significant interaction between Obq16 and theD9Mit281 locus, which we named Obq18. Obq18 was notshown to affect % fat by itself, but its combined effect with
Obq16 on % fat was dramatic (Fig. 3E). When the Obq16genotype was 129/129, an additive/codominant allele forhigher % fat from strain B6 at Obq18 contributed a signifi-cant effect.
Fig. 2. Genome-wide scans (solid lines) and posterior probability densities (broken lines) for the quantitative trait loci (QTL). A, C, E, andG represent the QTL, posterior probability densities, and 95% confidence intervals; B, D, F, and H provide the contributions at the peak ofeach QTL. Posterior probability density is a likelihood statistic that gives rise to the 95% confidence intervals indicated by gray bars (16). Ho-mozygosity for B6 alleles is represented by B6/B6, homozygosity for 129 alleles is represented by 129/129, and heterozygosity at a locus isrepresented by B6/129. Marker locations for each QTL are in parentheses. Error bars represent SEM. Chr, chromosome; cM, centimorgan.
by guest, on May 26, 2016
ww
w.jlr.org
Dow
nloaded from
Ishimori et al. Genetics of murine plasma lipids and obesity 1629
For obesity measured by BMI, the genome scan isshown in Fig. 1D. Three suggestive QTL were discoveredon chromosomes 1, 8, and 17. The D17Mit143 locus con-firmed QTL identified earlier using either strains AKR/J
and C57L/J (22) or strains NZO and SM (21). TheD8Mit248 locus confirmed a significant QTL, Obq16, iden-tified for % fat in this cross. Thus, we gave this locus thesame name, Obq16. The D1Mit406 locus colocalized aQTL, Obq17, identified for % fat in this cross and wasgiven the same name. Two loci, the D2Mit285 locus andthe D18Mit4 locus, exceeded the 37% genome-wide ad-justed threshold (LOD � 1.9), but their terms did notmeet the nominal level in the regression, so we did not re-port these loci as suggestive QTL (Fig. 1D).
The multiple regression analyses (Tables 4 and 5) showthe effect of each QTL and interactions when consideredtogether. The percent of the total phenotypic variance inF2 mice is best estimated by a multiple regression analysis.For non-HDL, this multiple regression analysis confirmedsix QTL and three interactions identified for single geneor pairwise genome-wide scans. Taken together, theseQTL and their interactions explained 49.9% of the totalF2 phenotypic variance; Nhdlq1 and Nhdlq4 contributed�10% each and the others each contributed 2–5% of thetotal variance. For TG, four single QTL and one interac-tion explained 24.3% of the total variance. For % fat, fivesingle QTL and one interaction explained 34.3% of thetotal variance; Obq16 contributed approximately half ofthe genetic variance. For BMI, three QTL explained11.1% of the total variance, with each QTL contributing3–4% of the total variance.
DISCUSSION
In the present study, we describe two inbred mousestrains, B6 and 129, that display different plasma levels ofnon-HDL cholesterol and TG and degrees of obesity whenfed a high-fat diet. Three-step QTL analyses on 294 (B6 �129) F2 progeny resulted in the localization of six QTL fornon-HDL, four QTL for TG, five QTL for % fat, threeQTL for BMI, and five gene interactions.
For plasma non-HDL concentrations, we identified fourmain-effect QTL (Nhdlq1, Nhdlq4, Nhdlq5, and the D7Mit141locus) and two additional QTL by gene interactions (Nhdlq6and Nhdlq7). Previously, our group mapped a chromo-somal locus in a (CAST � 129) F2 intercross that deter-mines non-HDL levels to chromosome 8 (cM 20–60) andnamed it Nhdlq1 (19). Because the present study con-firmed the previously reported QTL using a cross having aparental strain, 129S1/SvImJ, in common with the crossused in the earlier study, we named the locus Nhdlq1 in ac-cordance with the International Committee on Standard-ized Genetic Nomenclature for Mice. Potential candidategenes for Nhdlq1 are the gene (Lpl; cM 33.0) coding forLPL and the gene (Cpe; cM 32.6) coding for carboxypepti-dase E, which produces biologically active forms of proin-sulin and proopiomelanocortin. Mice possessing the fatmutation (a spontaneous mutation in the Cpe gene) ex-hibited prominent obesity and higher plasma non-HDLconcentrations relative to controls after consuming ahigh-fat diet (23). Nhdlq1 coincidentally colocalizes with a
Fig. 3. The effects of gene interactions detected by the pairwise ge-nome scan. Homozygosity for B6 alleles is represented by B6/B6, ho-mozygosity for 129 alleles is represented by 129/129, and heterozygos-ity is represented by B6/129. Y axes show mean values of log non-HDL (A, B, and C), TG (D), and % fat (E). Error bars represent SEM.
by guest, on May 26, 2016
ww
w.jlr.org
Dow
nloaded from

1630 Journal of Lipid Research Volume 45, 2004
QTL for % fat, Obq16, in the present cross. Nhdlq6 maps tothe region containing the apolipoprotein gene cluster(Apoc1, Apoc2, Apoc4, and Apoe; cM 4.0). Interestingly,APOC2 is a cofactor for LPL (24). The gene interactionbetween Nhdlq1 and Nhdlq6 makes Lpl and Apoc2 excellentcandidates for genes underlying these QTL. Likewise,Nhdlq4 interacted independently with Nhdlq5 and Nhdlq7.These gene interactions may give clues to the candidategenes. Nhdlq4 colocalized with a QTL for phospholipidtransfer protein (PLTP) activity, Pltp2, found previouslyusing an (SM � NZB) F2 intercross (25). PLTP is responsi-ble for the transfer of phospholipids from VLDL to HDL(26), suggesting that the gene underlying Nhdlq4 mightdetermine plasma non-HDL levels by regulating PLTP ac-tivity. An excellent candidate gene for Nhdlq4 is the gene(Apof; cM 73.0) coding for a lipid transfer inhibitor pro-
tein, Apo F (27). Previously, our group reported a sin-gle nucleotide polymorphism that causes an amino acidchange in the protein between B6 and 129 strains (25).
For TG levels, we identified three main-effect QTL(Tgq1, Tgq2, and the D14Mit60 locus) and, by gene inter-actions, an additional QTL (Tgq3). Potential candidategenes for Tgq3 are the gene (Lepr; cM 46.7) coding for thereceptor of leptin; the gene (Cpt2, cM 54.4) coding for amitochondrial fatty acid transporter, carnitine palmitoyl-transferase 2; and the gene (Angptl3, cM 48.5) coding forangiopoietin-like 3. Tgq2 colocalized with a QTL previ-ously identified in a (B6 � KK-Ay) F2 intercross (28) butdid not map near any genes known to play a prominentrole in lipoprotein or lipid metabolism. Alternatively,genes underlying Tgq2 are entirely novel genes that mightotherwise not have been considered. The interaction be-
TABLE 4. Multiple regression analyses of variance for non-HDL and TG in 292 (B6 � 129) F2 females
TraitsChromosomal (Chr)
Location Nearest Marker DFa Type III SSb Variance (%)c F Value P Value Locus Name
cM
Non-HDL Chr 8 (38)d D8Mit248 6 0.784 10.0 6.61 1.58 � 10�6 Nhdlq1Chr 10 (70)d D10Mit35 10 1.063 13.5 5.38 2.99 � 10�7 Nhdlq4Chr 6 (0)d D6Mit86 6 0.380 4.8 3.21 0.0047 Nhdlq5Chr 7 (70) D7Mit141 2 0.178 2.3 4.51 0.0118Chr 7 (10)d D7Mit294 6 0.276 3.5 2.33 0.0329 Nhdlq6Chr 15 (0)d D15Mit13 6 0.375 4.8 3.16 0.0051 Nhdlq7Chr 8 (38):Chr 7 (10) D8Mit248:D7Mit294 4 0.251 3.2 3.17 0.0144 Nhdlq1:Nhdlq6Chr 10 (70):Chr 6 (0) D10Mit35:D6Mit86 4 0.268 3.4 3.39 0.0101 Nhdlq4:Nhdlq5Chr 10 (70):Chr 15 (0) D10Mit35:D15Mit13 4 0.344 4.4 4.35 0.0020 Nhdlq4:Nhdlq7
Totals 291 7.871 49.9
TG Chr 18 (42) D18Mit50 2 1,351 3.4 5.59 0.0042 Tgq1Chr 9 (66)d D9Mit281 6 2,850 7.1 3.93 0.0009 Tgq2Chr14 (14) D14Mit60 2 1,055 2.6 4.37 0.0135Chr 4 (58)d D4Mit308 6 2,596 6.5 3.58 0.0019 Tgq3Chr 9 (66):Chr 4 (58) D9Mit281:D4Mit308 4 1,900 4.7 3.93 0.0040 Tgq2:Tgq3
Totals 291 40,249 24.3
a DF indicates degrees of freedom; it includes main effect and any interactions.b SS, sum of squares.c Variance indicates the percentage of the total F2 phenotypic variance associated with each marker.d Interacting QTL.
TABLE 5. Multiple regression analyses of variance for % fat and BMI in 294 (B6 � 129) F2 females
TraitsChromosomal (Chr)
Location Nearest Marker DFa Type III SSb Variance (%)c F Value P Value Locus Name
cM
% fat Chr 8 (48)d D8Mit248 6 1,606 16.2 10.60 1.36 � 10�10 Obq16Chr 12 (2) D12Mit182 2 400 4.0 7.91 0.0005Chr 6 (0) D6Mit86 2 229 2.3 4.52 0.0117 Mob2Chr 1 (74) D1Mit495 2 272 2.8 5.39 0.0050 Obq17Chr 9 (65)d D9Mit281 6 504 5.1 3.32 0.0036 Obq18Chr 8 (48):Chr 9 (65) D8Mit248:D9Mit281 4 355 3.6 3.52 0.0081 Obq16:Obq18
Totals 290 9,909 34.3
BMI Chr 17 (8) D17Mit143 2 0.036 4.3 6.91 0.0012 Obq19Chr 8 (52)d D8Mit248 2 0.027 3.2 5.19 0.0061 Obq16Chr 1 (102)d D1Mit406 2 0.031 3.6 5.88 0.0031 Obq17
Totals 293 0.844 11.1
The number of F2 mice is 291 for % fat.a DF indicates degrees of freedom; it includes main effect and any interactions.b SS, sum of squares.c Variance indicates the percentage of the total F2 phenotypic variance associated with each marker.d Interacting QTL.
by guest, on May 26, 2016
ww
w.jlr.org
Dow
nloaded from

Ishimori et al. Genetics of murine plasma lipids and obesity 1631
tween Tgq2 and Tgq3 may give clues to the underlyinggenes’ identities.
To identify genetic loci that affect the development ofobesity in response to the high-fat diet, we measured twodifferent traits that reflect obesity, % fat and BMI. For %fat, we identified four main-effect QTL (Obq16, Obq17,Mob2, and the D12Mit182 locus) and one additional QTL(Obq18) by its interaction with Obq16. For BMI, we identi-fied three suggestive main-effect QTL (Obq16, Obq17, andObq19). Because log BMI was positively correlated with %fat (P � 0.0001), two of three QTL for BMI, the D8Mit248locus and the D1Mit406 locus, colocalized with QTL for %fat and for Obq16 and Obq17, respectively. The discrepancybetween QTL obtained from these traits might be re-flected from variations in body length. The suggestiveD12Mit182 locus maps to the region of the gene (Pomc1;cM 4.0) coding for proopiomelanocortin-�, mutation ofwhich causes monogenic obesity through the liptin-mel-anocortin signaling pathway (29). The suggestive QTL onchromosome 6 colocalized with a QTL for fat pad weight,Mob2, found previously using a (B6 � SPRET) � B6 back-cross (20). This genetic locus maps to the region of thegene (Lep; cM 10.5) coding for leptin. The Obq17 locuscolocalized with an adjacent QTL for obesity, Obq8 andObq9, which were discovered previously using progeny of(SM � NZO) F2 intercrosses (21). The Obq18 locus hasbeen found repeatedly using (SWR � AKR) F2, (B6 �CAST) F2, and (B6 � KK) F2 intercross progeny fed a high-fat diet (30–32). Obq19 colocalized with a QTL found pre-viously using progeny of (AKR � C57L) and (SM � NZO)F2 intercrosses fed a high-fat diet (21, 22). Potential candi-date genes for Obq19 are the gene Ppard (cM 13.5), codingfor an important transcriptional factor that regulates glu-cose and fatty acid metabolism; the gene Igf2r (cM 7.35),coding for an insulin-like growth factor II receptor; andthe gene Acat2 (cM 7.5), coding for an acetyl-CoA acetyl-transferase 2 that catalyzes the synthesis of cytosolic ace-toacetyl-CoA, a precursor of cholesterol and other steroids.However, high-fat diets in the most previous reports donot contain substantial amounts of cholesterol or any cho-late, and this difference in diets might affect the identitiesof colocalizing QTL between this study and previous studies.
Reed and colleagues (33) carried out a study of bothmale and female progeny of an F2 intercross betweenmice of the C57BL/6ByJ and 129P3/J strains to identifyQTL for body weight, body length, and adiposity. Of theQTL found in the present study, only Obq18 colocalizedwith a QTL for adiposity, Adip5, reported by Reed et al.However, these investigators reported that the effect ofAdip5 is limited to F2 males and is not found in females(peak LOD � 1.0). Whereas a QTL on chromosome 16,Adip9, was found to interact with Adip5 by Reed et al.,Obq18 interacted with Obq16 on chromosome 8 in thepresent study, suggesting that the gene underlying Adip5is not identical to the one underlying Obq16. The QTLidentified by Reed et al. in the (C57BL/6ByJ � 129P3/J)F2 cross are based on analyses of mice fed a normal chowdiet, and it is unlikely that these loci would similarly affectthe development of obesity in response to a high-fat diet.
Indeed, obesity is a complex trait, reflecting the effect of anetwork of genes, and it is affected by diet, age, gender,and exercise (4).
Several spontaneous single-gene mutations causing obe-sity, such as agouti yellow (Ay), obese (Lepob), diabetes (Leprdb),fat (Cpefat), tubby (Tubtub), and mahogany (Atrnmg), havebeen identified in inbred mice (34, 35). These mutations,however, do not account for the wide variation of obesityin the general human population. Some human pedigreestudies provide clear genetic evidence of oligogenic orpolygenic predisposition for obesity, indicating that obe-sity is a complex trait (36). Indeed, mice of different in-bred strains exhibit wide variation in body weight and pre-disposition to spontaneous or diet-induced obesity. Multiplemodifier genes likely contribute to the variation. Crossesbetween mice of various strains have identified �100chromosomal loci that contribute to obesity (4).
The present study discovered five epistatic interactionsfor plasma non-HDL and TG concentrations and % fat(Fig. 3). The pairwise genome scans revealed four signifi-cant QTL, Nhdlq6, Nhdlq7, Tgq3, and Obq18, that did notaffect traits by a single locus but affected the traits with thecounterpart locus. When a genotype of one locus was B6/B6, homozygosity for a 129 allele at the counterpart locuscontributed significantly to the effect on the trait. This ev-idence might facilitate in vitro assays to test candidategenes.
In summary, by performing a QTL analysis of a (B6 �129) F2 female cohort, we identified chromosomal re-gions that affect plasma non-HDL and TG concentrationsand obesity in mice with backgrounds that are a combina-tion of B6 and 129. Knowledge of the primary genetic de-terminants of plasma lipid concentrations and obesity willenhance our understanding of lipoprotein metabolismand likely provide novel molecular targets for metabolicobesity.
This work was funded by AstraZeneca, Sweden, and the Na-tional Institutes of Health (Grant CA-34196). The authorsthank Eric F. Taylor for excellent technical assistance and RayA. Lambert and Jennifer L. Smith for helping to prepare themanuscript. N.I. is supported by the Japan Heart Foundation/Bayer Yakuhin Research Grant Abroad and by a Japan HeartFoundation/Pfizer Grant for Research on Hypertension, Hy-perlipidemia, and Vascular Metabolism.
REFERENCES
1. Isomaa, B., P. Almgren, T. Tuomi, B. Forsen, K. Lahti, M. Nissen,M. R. Taskinen, and L. Groop. 2001. Cardiovascular morbidity andmortality associated with the metabolic syndrome. Diabetes Care.24: 683–689.
2. Allayee, H., A. Ghazalpour, and A. J. Lusis. 2003. Using mice to dis-sect genetic factors in atherosclerosis. Arterioscler. Thromb. Vasc. Biol.23: 1501–1509.
3. Smith, J. 2003. Quantitative trait locus mapping for atherosclerosissusceptibility. Curr. Opin. Lipidol. 14: 499–504.
4. Brockmann, G. A., and M. R. Bevova. 2002. Using mouse modelsto dissect the genetics of obesity. Trends Genet. 18: 367–376.
5. Wang, X., and B. Paigen. 2002. Quantitative trait loci and candi-
by guest, on May 26, 2016
ww
w.jlr.org
Dow
nloaded from

1632 Journal of Lipid Research Volume 45, 2004
date genes regulating HDL cholesterol: a murine chromosomemap. Arterioscler. Thromb. Vasc. Biol. 22: 1390–1401.
6. Paigen, B., K. L. Svenson, and L. L. Peters. Diet effects on plasmalipids and susceptibility to atherosclerosis. MPD:99. Mouse Phe-nome Database (MPD), Bar Harbor, ME: The Jackson Laboratory.(Accessed December 2003 at http://www.jax.org/phenome).
7. Korstanje, R., and B. Paigen. 2002. From QTL to gene: the harvestbegins. Nat. Genet. 31: 235–236.
8. Smithies, O., and N. Maeda. 1995. Gene targeting approaches tocomplex genetic diseases: atherosclerosis and essential hyperten-sion. Proc. Natl. Acad. Sci. USA. 92: 5266–5272.
9. Sigmund, C. D. 2000. Viewpoint: are studies in genetically alteredmice out of control? Arterioscler. Thromb. Vasc. Biol. 20: 1425–1429.
10. Ishimori, N., R. Li, P. M. Kelmenson, R. Korstanje, K. A. Walsh,G. A. Churchill, K. Forsman-Semb, and B. Paigen. 2004. Quantita-tive trait loci analysis for plasma HDL-cholesterol concentrationsand atherosclerosis susceptibility between inbred mouse strainsC57BL/6J and 129S1/SvImJ. Arterioscler. Thromb. Vasc. Biol. 24:161–166.
11. Nishina, P. M., J. Verstuyft, and B. Paigen. 1990. Synthetic low andhigh fat diets for the study of atherosclerosis in the mouse. J. LipidRes. 31: 859–869.
12. Nishina, P. M., S. Lowe, J. Verstuyft, J. K. Naggert, F. A. Kuypers,and B. Paigen. 1993. Effects of dietary fats from animal and plantsources on diet-induced fatty streak lesions in C57BL/6J mice. J.Lipid Res. 34: 1413–1422.
13. de Faria, E., L. G. Fong, M. Komaromy, and A. D. Cooper. 1996.Relative roles of the LDL receptor, the LDL receptor-like protein,and hepatic lipase in chylomicron remnant removal by the liver. J.Lipid Res. 37: 197–209.
14. Nagy, T. R., and A. L. Clair. 2000. Precision and accuracy of dual-energy X-ray absorptiometry for determining in vivo body compo-sition of mice. Obes. Res. 8: 392–398.
15. Mu, J. L., J. K. Naggert, K. L. Svenson, G. B. Collin, J. H. Kim, C.McFarland, P. M. Nishina, D. M. Levine, K. J. Williams, and B.Paigen. 1999. Quantitative trait loci analysis for the differences insusceptibility to atherosclerosis and diabetes between inbredmouse strains C57BL/6J and C57BLKS/J. J. Lipid Res. 40: 1328–1335.
16. Sen, S., and G. A. Churchill. 2001. A statistical framework forquantitative trait mapping. Genetics. 159: 371–387.
17. Churchill, G. A., and R. W. Doerge. 1994. Empirical threshold val-ues for quantitative trait mapping. Genetics. 138: 963–971.
18. Biola, O., J. M. Angel, P. Avner, A. A. Bachmanov, J. K. Belknap, B.Bennett, E. P. Blankenhorn, D. A. Blizard, V. Bolivar, G. A. Brock-mann, K. J. Buck, J. F. Bureau, W. L. Casley, E. J. Chesler, J. M.Cheverud, G. A. Churchill, M. Cooke, J. C. Crabbe, W. E. Crusio,A. Darvasi, G. de Haan, P. Dermant, R. W. Doerge, R. W. Elliot,C. R. Farber, L. Flaherty, J. Flint, H. Gershenfeld, J. P. Gibson, J. Gu,W. Gu, H. Himmelbauer, R. Hitzemann, H. C. Hsu, K. Hunter, F. F.Iraqi, R. C. Jansen, T. E. Johnson, B. C. Jones, G. Kempermann, F.Lammer, L. Lu, K. F. Manly, D. B. Matthews, J. F. Medrano, M.Mehrabian, G. Mittlemann, B. A. Mock, J. S. Mogil, X. Montagutelli,G. Morahan, J. D. Mount, H. Nagase, R. S. Nowakowski, B. F.O’Hara, A. V. Osadchuck, B. Paigen, A. A. Palmer, J. L. Pierce, D.Pomp, M. Rosemann, G. D. Rosen, L. C. Schalkwyk, Z. Seltzer, S.Settle, K. Shimomura, S. Shou, J. M. Sikela, L. D. Siracusa, J. L.Spearow, C. Teuscher, D. W. Threadgill, L. A. Toth, A. A. Toye, C.Vadasz, G. Van Zant, E. Wakeland, R. W. Williams, H. G. Zhang,and F. Zou. 2003. The nature and identification of quantitativetrait loci: a community’s view. Nat. Rev. Genet. 4: 911–916.
19. Lyons, M. A., H. Wittenburg, R. Li, K. A. Walsh, R. Korstanje, G. A.
Churchill, M. C. Carey, and B. Paigen. 2004. Quantitative trait locithat determine lipoprotein cholesterol levels in an intercross of129S1/SvImJ and CAST/Ei inbred mice. Physiol. Genomics. 17: 60–68.
20. Warden, C. H., J. S. Fisler, S. M. Shoemaker, P. Z. Wen, K. L. Sven-son, M. J. Pace, and A. J. Lusis. 1995. Identification of four chro-mosomal loci determining obesity in a multifactorial mouse model.J. Clin. Invest. 95: 1545–1552.
21. Taylor, B. A., C. Wnek, D. Schroeder, and S. J. Phillips. 2001. Multi-ple obesity QTLs identified in an intercross between the NZO(New Zealand obese) and the SM (small) mouse strains. Mamm.Genome. 12: 95–103.
22. Taylor, B. A., and S. J. Phillips. 1997. Obesity QTLs on mouse chro-mosomes 2 and 17. Genomics. 43: 249–257.
23. Bouchard, G., D. Johnson, T. Carver, B. Paigen, and M. C. Carey.2002. Cholesterol gallstone formation in overweight mice estab-lishes that obesity per se is not linked directly to cholelithiasis risk.J. Lipid Res. 43: 1105–1113.
24. Merkel, M., R. H. Eckel, and I. J. Goldberg. 2002. Lipoprotein li-pase: genetics, lipid uptake, and regulation. J. Lipid Res. 43: 1997–2006.
25. Korstanje, R., J. J. Albers, G. Wolfbauer, R. Li, A. Y. Tu, G. A.Churchill, and B. J. Paigen. 2004. Quantitative trait locus mappingof genes that regulate phospholipid transfer activity in SM/J andNZB/BlNJ inbred mice. Arterioscler. Thromb. Vasc. Biol. 24: 155–160.
26. Tall, A. R., S. Krumholz, T. Olivecrona, and R. J. Deckelbaum.1985. Plasma phospholipid transfer protein enhances transfer andexchange of phospholipids between very low density lipoproteinsand high density lipoproteins during lipolysis. J. Lipid Res. 26: 842–851.
27. Wang, X., D. M. Driscoll, and R. E. Morton. 1999. Molecular clon-ing and expression of lipid transfer inhibitor protein reveals itsidentity with apolipoprotein F. J. Biol. Chem. 274: 1814–1820.
28. Suto, J., S. Matsuura, H. Yamanaka, and K. Sekikawa. 1999. Quanti-tative trait loci that regulate plasma lipid concentration in heredi-tary obese KK and KK-Ay mice. Biochim. Biophys. Acta. 1453: 385–395.
29. Cummings, D. E., and M. W. Schwartz. 2003. Genetics and patho-physiology of human obesity. Annu. Rev. Med. 54: 453–471.
30. West, D. B., J. Goudey-Lefevre, B. York, and G. E. Truett. 1994. Di-etary obesity linked to genetic loci on chromosomes 9 and 15 in apolygenic mouse model. J. Clin. Invest. 94: 1410–1416.
31. Mehrabian, M., P. Z. Wen, J. Fisler, R. C. Davis, and A. J. Lusis.1998. Genetic loci controlling body fat, lipoprotein metabolism,and insulin levels in a multifactorial mouse model. J. Clin. Invest.101: 2485–2496.
32. Taylor, B. A., L. M. Tarantino, and S. J. Phillips. 1999. Gender-influenced obesity QTLs identified in a cross involving the KK typeII diabetes-prone mouse strain. Mamm. Genome. 10: 963–968.
33. Reed, D. R., X. Li, A. H. McDaniel, K. Lu, S. Li, M. G. Tordoff,R. A. Price, and A. A. Bachmanov. 2003. Loci on chromosomes 2,4, 9, and 16 for body weight, body length, and adiposity identifiedin a genome scan of an F2 intercross between the 129P3/J andC57BL/6ByJ mouse strains. Mamm. Genome. 14: 302–313.
34. Justice, M. J. 2000. Capitalizing on large-scale mouse mutagenesisscreens. Nat. Rev. Genet. 1: 109–115.
35. Butler, A. A., and R. D. Cone. 2001. Knockout models resulting inthe development of obesity. Trends Genet. 17: S50–S54.
36. Perusse, L., T. Rice, Y. C. Chagnon, J. P. Despres, S. Lemieux, S.Roy, M. Lacaille, M. A. Ho-Kim, M. Chagnon, M. A. Province, D. C.Rao, and C. Bouchard. 2001. A genome-wide scan for abdominalfat assessed by computed tomography in the Quebec Family Study.Diabetes. 50: 614–621.
by guest, on May 26, 2016
ww
w.jlr.org
Dow
nloaded from