QTL mapping of grain quality traits from the interspecific cross Oryza sativa × O. glaberrima
10
Theor Appl Genet (2004) 109: 630–639 DOI 10.1007/s00122-004-1668-y ORIGINAL PAPER G. Aluko . C. Martinez . J. Tohme . C. Castano . C. Bergman . J. H. Oard QTL mapping of grain quality traits from the interspecific cross Oryza sativa × O. glaberrima Received: 5 December 2003 / Accepted: 20 March 2004 / Published online: 23 April 2004 # Springer-Verlag 2004 Abstract International rice export markets are increasing demands for rapid improvements in grain quality char- acteristics. The African rice Oryza glaberrima is a new potential source of genes that will enhance the eating, cooking, and milling properties of the rice grain. The objective of this research was to identify and characterize quantitative trait loci (QTLs) among 312 doubled haploid lines derived from the BC 3 F 1 of an interspecific cross of O. sativa × O. glaberrima. Genetic material was planted in replicated plots and evaluated for ten grain quality traits in 2001 in Colombia. A linkage map was constructed with 100 polymorphic microsatellite markers using the MAPDIS- TO software program to adjust for segregation distortion. Transgressive segregation was observed for all traits. Interval and composite interval analyses identified 27 QTLs for nine characters located on 11/12 chromosomes. The chromosomal positions of QTLs for percentage amylose, alkali-spreading score, and percentage protein were in agreement with data reported by others, whereas QTL markers for percentage head rice, percentage milled rice, percentage protein, and percentage brown rice were different in our mapping population. Five major QTLs were found to be associated with improved percentage rice bran, percentage amylose, and alkali-spreading score. Seven QTLs for improved percentage rice bran, percen- tage milled rice, alkali-spreading score, percentage pro- tein, and grain length/width ratio were derived from the O. glaberrima accession. Three new QTLs for percentage rice bran are reported here for the first time. Results from this study suggest that the African rice might be a valuable new source for introgression and improvement of several traits that affect quality traits demanded by the different rice export markets. Introduction The demand for superior grain quality is increasingly becoming a priority for international export markets in all of the cultivated rice-producing areas worldwide (Juliano et al. 1990; Unnevehr et al. 1992). The primary components of rice grain quality include appearance, eating, cooking, and milling quality, and nutritional qualities, all values that are determined by their physi- cal–chemical properties and other socio-cultural factors. The quality of appearance is determined by grain length, width, width-length ratio, grain size and shape, and translucency of the endosperm (Unnevehr et al. 1992; Juliano and Villareal 1993). The amylose content of rice, recognized as one of the most important determinants of eating and cooking quality (Bao et al. 2002), has been reported to be governed by the waxy (Wx) locus and mapped to chromosome 6 (Tan et al. 1999; Septiningsih et al. 2003; Zhou et al. 2003). Other investigators have found amylose content to be specified by a single major gene with modifications by minor genes (McKenzie and Rutger 1983; Kumar and Khush 1988). Three independent studies have indicated that the Wx locus is linked to a gene for alkali-spreading score, an indicator of the temperature at which the rice grain becomes gelatinous during cooking (McKenzie and Rutger 1983; Sano 1984). Communicated by D.J. Mackill Approved for publication by the Director of the Louisiana Agricultural Experiment Station as paper no. 04-14-0054. G. Aluko . J. H. Oard (*) Department of Agronomy, LSU AgCenter, Louisiana State University, 104 Sturgis Hall, Baton Rouge, LA, 70803, USA e-mail: [email protected] Fax: +1-225-5781403 C. Martinez . J. Tohme . C. Castano Centro Internacional de Agricultura Tropical, Apdo aereo 6713, Cali, Columbia C. Bergman USDA-ARS Rice Research Unit, 1509 Aggie Drive, Beaumont, TX, 77713, USA
-
Upload
independent -
Category
Documents
-
view
2 -
download
0
Transcript of QTL mapping of grain quality traits from the interspecific cross Oryza sativa × O. glaberrima
Theor Appl Genet (2004) 109: 630–639DOI 10.1007/s00122-004-1668-y
ORIGINAL PAPER
G. Aluko . C. Martinez . J. Tohme . C. Castano .C. Bergman . J. H. Oard
QTL mapping of grain quality traits from the interspecific cross
Oryza sativa × O. glaberrima
Received: 5 December 2003 / Accepted: 20 March 2004 / Published online: 23 April 2004# Springer-Verlag 2004
Abstract International rice export markets are increasingdemands for rapid improvements in grain quality char-acteristics. The African rice Oryza glaberrima is a newpotential source of genes that will enhance the eating,cooking, and milling properties of the rice grain. Theobjective of this research was to identify and characterizequantitative trait loci (QTLs) among 312 doubled haploidlines derived from the BC3F1 of an interspecific cross ofO. sativa × O. glaberrima. Genetic material was planted inreplicated plots and evaluated for ten grain quality traits in2001 in Colombia. A linkage map was constructed with100 polymorphic microsatellite markers using the MAPDIS-
TO software program to adjust for segregation distortion.Transgressive segregation was observed for all traits.Interval and composite interval analyses identified 27QTLs for nine characters located on 11/12 chromosomes.The chromosomal positions of QTLs for percentageamylose, alkali-spreading score, and percentage proteinwere in agreement with data reported by others, whereasQTL markers for percentage head rice, percentage milledrice, percentage protein, and percentage brown rice weredifferent in our mapping population. Five major QTLs
were found to be associated with improved percentage ricebran, percentage amylose, and alkali-spreading score.Seven QTLs for improved percentage rice bran, percen-tage milled rice, alkali-spreading score, percentage pro-tein, and grain length/width ratio were derived from the O.glaberrima accession. Three new QTLs for percentagerice bran are reported here for the first time. Results fromthis study suggest that the African rice might be a valuablenew source for introgression and improvement of severaltraits that affect quality traits demanded by the differentrice export markets.
Introduction
The demand for superior grain quality is increasinglybecoming a priority for international export markets in allof the cultivated rice-producing areas worldwide (Julianoet al. 1990; Unnevehr et al. 1992). The primarycomponents of rice grain quality include appearance,eating, cooking, and milling quality, and nutritionalqualities, all values that are determined by their physi-cal–chemical properties and other socio-cultural factors.The quality of appearance is determined by grain length,width, width-length ratio, grain size and shape, andtranslucency of the endosperm (Unnevehr et al. 1992;Juliano and Villareal 1993).
The amylose content of rice, recognized as one of themost important determinants of eating and cooking quality(Bao et al. 2002), has been reported to be governed by thewaxy (Wx) locus and mapped to chromosome 6 (Tan et al.1999; Septiningsih et al. 2003; Zhou et al. 2003). Otherinvestigators have found amylose content to be specifiedby a single major gene with modifications by minor genes(McKenzie and Rutger 1983; Kumar and Khush 1988).Three independent studies have indicated that the Wxlocus is linked to a gene for alkali-spreading score, anindicator of the temperature at which the rice grainbecomes gelatinous during cooking (McKenzie andRutger 1983; Sano 1984).
Communicated by D.J. Mackill
Approved for publication by the Director of the LouisianaAgricultural Experiment Station as paper no. 04-14-0054.
G. Aluko . J. H. Oard (*)Department of Agronomy, LSU AgCenter, Louisiana StateUniversity,104 Sturgis Hall,Baton Rouge, LA, 70803, USAe-mail: [email protected]: +1-225-5781403
C. Martinez . J. Tohme . C. CastanoCentro Internacional de Agricultura Tropical,Apdo aereo 6713,Cali, Columbia
C. BergmanUSDA-ARS Rice Research Unit,1509 Aggie Drive,Beaumont, TX, 77713, USA

Milling quality is assessed using three principalcharacteristics—brown rice percentage, milled rice per-centage, and head-milled rice. Brown rice consists ofgrains from which the bran has not been removed bymilling, while milled rice is made up of whole and brokenrice grains that have had the bran removed. Head rice, orthe proportion of whole kernels, which includes brokenkernels that are 75–80% of a whole rice grain, is a majorfactor determining rice market value and one of the mostimportant criterium of milled rice. Zhou et al. (2003)recently demonstrated the potential for marker-basedbreeding approaches in modifying milling quality bydeveloping rice grains in hybrid rice with enhanced eatingcharacteristics.
Undomesticated rice harbors useful genes as quantita-tive trait locus (QTL) analysis has revealed amongprogeny of Oryza sativa × O. rufipogon crosses (Xiao etal. 1996, 1998; Moncada et al. 2001). However, QTLmapping studies of grain and milling quality have beenfocused primarily within the O. sativa germplasm (He etal. 1999; Tan et al. 1999, 2000, 2001; Zhou et al. 2003).QTLs associated with various grain quality traits haverecently been identified from an interspecific crossbetween O. sativa and a wild relative O. rufipogon(Septiningsih et al. 2003). Undesirable effects on themajority of grain quality QTLs were contributed by O.rufipogon, but the results may have been influenced byenvironmental effects and grain quality characteristics ofthe adapted recurrent parent.
Oryza glaberrima Steud., the native cultivated rice ofeconomic importance in West Africa, is believed to bedomesticated from the ancestral Oryza barthii A. Chev.(Second 1982). Sterility barriers between O. sativa and O.glaberrima in early hybrid generations have limited thetransfer of useful genes between these species (Jones et al.1997a,b). The distortion of markers segregating indifferent mapping populations has been found to beassociated with previously characterized gametophyte andsterility genes, particularly in wide crosses (Xu et al.1997). Recent analyses of O. glaberrima × O. sativahybrids have revealed strong marker distortion near theWxand S1 sterility loci on chromosome 6 (Lorieux et al. 2000;Heuer and Miezan 2003). Despite these occurrences ofdistorted gene segregation associated with sterility barriersin O. sativa × O. glaberrima crosses, several useful traitsfrom O. glaberrima have been successfully introgressedinto adapted O. sativa cultivars (Jones et al. 1997a, b;Heuer et al. 2003).
The primary objective of the investigation reported herewas to map QTLs for milling, eating, and cookingqualities of rice using a population of doubled-haploid(DH) lines derived from the interspecific cross betweenAfrican and Asian rice. QTLs for grain quality mightfacilitate the development of strategies for the improve-ment of milling and cooking of African rice by providingnew genetic sources of enhanced grain quality character-istics.
Materials and methods
Caiapo, an indica commercial rice variety developed by theBrazilian national rice program for upland acid soil conditions(Anonymous, EMBRAPA 1997), was used as the recurrent parent inthis study. This variety is characterized by good milling and eatingcharacteristics, a long grain type (9–10 mm), early maturity (110–120 days), low tiller number (4–8), a 80-cm height, and typicalyields of 2.5 t/ha under upland conditions (Anonymous, EPAMIG1994). Oryza glaberrima, IRGC 103544, originally collected in thewild from Mali, Africa, grows to a height of approximately 95 cmand shows resistance to several biotic and abiotic stresses (Dr. Brar,International Rice Research Institute, personal communication).IRGC 103544 served as the male parent in crosses to Caiapo. F1
plants were grown in 1997 in the greenhouse at the CentroInternacional de Agricultura Tropical (CIAT) in Cali, Colombia. Atotal of 200 F1 seeds were produced. All F1 plants were completelysterile, and 20 individuals were selected randomly as females inbackcrosses to Caiapo. A total of 154 BC1F1 plants were producedand transplanted to irrigated field conditions in 1998 to ensuresurvival and good plant development. All plants were sterile, and103 BC1F1 plants were randomly selected and backcrossed toCaiapo to generate the BC2 generation in which a high level ofsterility was observed. The final backcrosses to Caiapo werecompleted in 1999, and these generated 97 BC3F1 plants. Antherswere collected from each BC3F1 plant and used in anther culture asdescribed by Lentini et al. (1995). A total of 695 DH plants wereobtained and grown under irrigated field conditions in 2000. A set of312 DH lines representing the observed genetic variability waschosen for further agronomic and molecular characterization. Seedfrom each DH line was grown in one generation to producesufficient seed for subsequent phenotypic and genetic analyses.The first field trial was conducted at Palmira, Colombia in
August 2001. The 312 DH lines were planted under irrigatedconditions in a randomized complete block design, in two-row plots,each row 5-m-long, with three replications. Twenty-five-day-oldseedlings were transplanted at a spacing of 30×30 cm. Caiapo andIRGC 103544 were also included as controls. Fertilizer was appliedat the rate of 120 kg N ha−1, 73 kg K2O ha−1, 63 kg P2O5 ha
−1, and4 kg ZnSO4 ha−1. A post-emergence application of Butaclor andBentazol, each at the rate of 3 l ha−1, was used to control weedssupplemented by manual weeding as needed. Experimental plotswere harvested in December 2001.Rice grown at the Colombia location was harvested and stored at
room temperature for at least 3 months before processing. Thelength and width of 20 fully formed paddy rice grains from each DHline were measured using a vernier caliper. Hulls were removedfrom 50 g of rough rice from each line using a Model TH035ASatake huller (Houston, Tex.) to yield brown rice. The embryo andthe bran layer were removed from the brown rice by passing thegrains through a McGill miller, model no. 1 (Phillip Rahm). Longgrains (length/width ratio of greater than 3) and medium grains(length/width ratio of greater than 2) were milled separately for 30 seach. The whole plus broken kernels obtained after milling weredefined as the total milling yield. The hull and bran were collectedduring milling and weighed. Total milled rice was separated into abatch consisting of whole rice grains plus grains that were at least75% of the whole rice grain to constitute the head rice, while theremainder was regarded as broken rice. For percentage amylose,well-mixed samples and standards were ground through a 0.40-mmscreen using a model no. 3010-018 UDY mill (UDY, Fort Collins,Colo.) and allowed to equilibrate overnight at room temperature in asample-holding cabinet. Samples (60 mg) of milled ground ricewere weighed and transferred to sample culture tubes (item no.T3062-8; Fisher Scientific, Norcross, Ga.), 1 ml of 100% ethanolwas added to each sample, and the tubes were shaken gently for5 min. The samples were covered with plastic wrap and allowed tostand at room temperature overnight in 1 N NaOH. Distilled,deionized water (54 ml) was added to each sample, and the mixturewas then vortexed for 10–15 s using a Maxi-Mix 1 mixer (type16700; Barnstead/Thermolyne, Dubuque, Iowa). The samples wereheld overnight at room temperature, and percentage amylose was
631
determined on an auto-analyzer 3 (model AA3; Bran and Luebbe,Roselle, Ill. ) using automated analyzer control and evaluationsoftware AACE ver. 5.24 (Bran and Luebbe). The method of Little etal. (1958) was used to determine the alkali-spreading score. Tenmilled rice grains from each parent or DH line were immersed in1.7% potassium hydroxide solution at room temperature for 23 h.The grains were carefully separated using forceps, and the spreadingvalue of the grains was scored by visual assessment using themethod of Jennings et al. (1979). Protein content was determined bya nitrogen gas analyzer (model 528; LECO). Samples of 1 mg wereplaced into a quartz combustion tube in an induction furnace at900°C. Total crude protein was calculated from the nitrogen contentof the processed grain where percentage nitrogen × 5.95 =percentage protein.A total of 125 randomly selected microsatellite markers located
across the 12 chromosomes were screened for polymorphismbetween the Caiapo and IRGC 103544 parents. The population of
312 DH lines was analyzed using a total of 100 polymorphicmicrosatellite markers located an average distance of every 10.5 cM.PCR protocol was performed as described by Chen et al. (1997)with silver staining carried out following the Promega (Madison,Wis.) technical manual (Silver sequence, DNA sequencing system1995).Correlation among traits was evaluated using PROC CORR ver. 8.2
of the SAS Institute (SAS 1998). Mean values for phenotypic traitswere separated by Duncan’s multiple range test usingPROC GLM ver. 9.0 of the SAS Institute (SAS 2003). Mean valuesfor each parent were derived from four to five plants. QTL analysesassociated with markers for each trait were performed usingMAPMAKER ver. 3.1, F2 backcross scheme (Lander et al. 1987;Lincoln et al. 1992). Linkage groups were created with a minimumLOD score of 3.0 and a recombination fraction of 0.4 using the“group” command. Marker order within the linkage groups wasdetermined using the “compare,” “try,” and “ripple” commands.
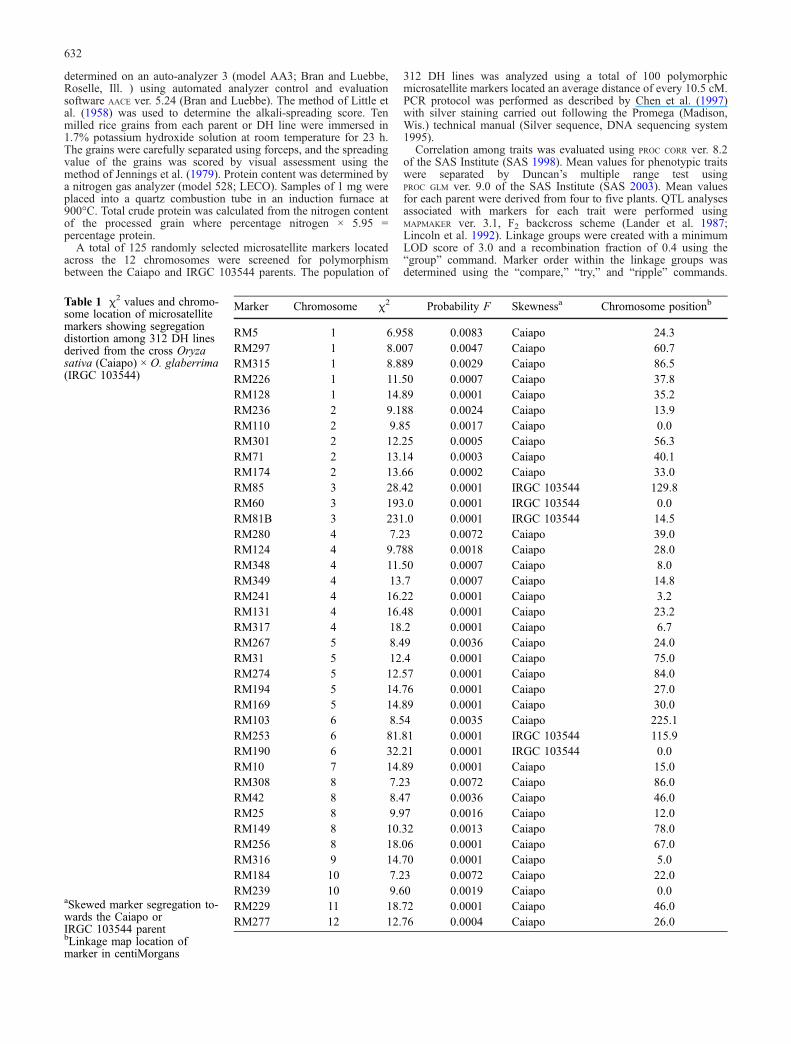
Table 1 χ2 values and chromo-some location of microsatellitemarkers showing segregationdistortion among 312 DH linesderived from the cross Oryzasativa (Caiapo) × O. glaberrima(IRGC 103544)
aSkewed marker segregation to-wards the Caiapo orIRGC 103544 parentbLinkage map location ofmarker in centiMorgans
Marker Chromosome χ2 Probability F Skewnessa Chromosome positionb
RM5 1 6.958 0.0083 Caiapo 24.3RM297 1 8.007 0.0047 Caiapo 60.7RM315 1 8.889 0.0029 Caiapo 86.5RM226 1 11.50 0.0007 Caiapo 37.8RM128 1 14.89 0.0001 Caiapo 35.2RM236 2 9.188 0.0024 Caiapo 13.9RM110 2 9.85 0.0017 Caiapo 0.0RM301 2 12.25 0.0005 Caiapo 56.3RM71 2 13.14 0.0003 Caiapo 40.1RM174 2 13.66 0.0002 Caiapo 33.0RM85 3 28.42 0.0001 IRGC 103544 129.8RM60 3 193.0 0.0001 IRGC 103544 0.0RM81B 3 231.0 0.0001 IRGC 103544 14.5RM280 4 7.23 0.0072 Caiapo 39.0RM124 4 9.788 0.0018 Caiapo 28.0RM348 4 11.50 0.0007 Caiapo 8.0RM349 4 13.7 0.0007 Caiapo 14.8RM241 4 16.22 0.0001 Caiapo 3.2RM131 4 16.48 0.0001 Caiapo 23.2RM317 4 18.2 0.0001 Caiapo 6.7RM267 5 8.49 0.0036 Caiapo 24.0RM31 5 12.4 0.0001 Caiapo 75.0RM274 5 12.57 0.0001 Caiapo 84.0RM194 5 14.76 0.0001 Caiapo 27.0RM169 5 14.89 0.0001 Caiapo 30.0RM103 6 8.54 0.0035 Caiapo 225.1RM253 6 81.81 0.0001 IRGC 103544 115.9RM190 6 32.21 0.0001 IRGC 103544 0.0RM10 7 14.89 0.0001 Caiapo 15.0RM308 8 7.23 0.0072 Caiapo 86.0RM42 8 8.47 0.0036 Caiapo 46.0RM25 8 9.97 0.0016 Caiapo 12.0RM149 8 10.32 0.0013 Caiapo 78.0RM256 8 18.06 0.0001 Caiapo 67.0RM316 9 14.70 0.0001 Caiapo 5.0RM184 10 7.23 0.0072 Caiapo 22.0RM239 10 9.60 0.0019 Caiapo 0.0RM229 11 18.72 0.0001 Caiapo 46.0RM277 12 12.76 0.0004 Caiapo 26.0
632
Map distances were calculated by utilizing the Kosambi function.Due to distorted marker segregation detected on all chromosomes,the MAPISTO software program by Lorieux et al. (2000) was used withthe “doubled haploid population model” to adjust for non-Mende-lian inheritance of certain microsatelllite markers. The transforma-tion of data for normality of each grain quality trait was performedusing inverse or log transformations in MICROSOFT EXCEL ver. 2002),and normality was checked using PROC UNIVARIATE ver. 8.2 of theSAS Institute (SAS 1998). QTLs were detected by interval (Landerand Botstein 1989) and composite interval mapping (Zeng 1994)procedures. Default LOD threshold values of 2.5 fromMAPMAKER ver. 3.1 and the QTL CARTOGRAPHER software program(Basten et al. 1994) were used to declare the presence of a QTL. Amodel using five co-factors was selected in QTL CARTOGRAPHER tocontrol for genetic background and applied to the composite intervalmapping procedure. Only QTLs detected both by interval andcomposite interval mapping were used in the analysis. Epistatic
interactions were determined using EPISTAT SOFTWARE (Chase et al.1997).
Results and discussion
Correlations among the majority of traits in this study wereconsistent with those obtained from previous investiga-tions using both inter-sub-specific and O. sativa × O.rufipogon crosses (McKenzie and Rutger 1983; Tan et al.2000). Significant negative correlations were detected inour study between protein content and the length-widthratio (−0.33, P≤0.01**) and between rice bran percentageand milled rice percentage (−0.84, P≤0.01**).
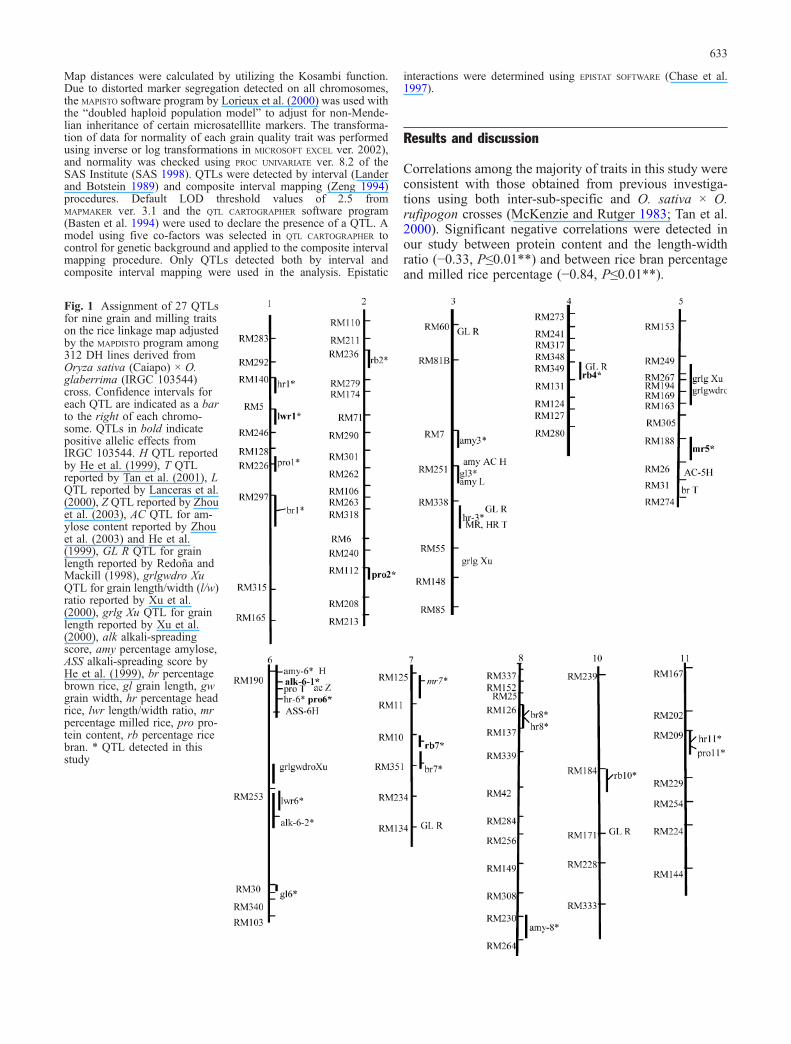
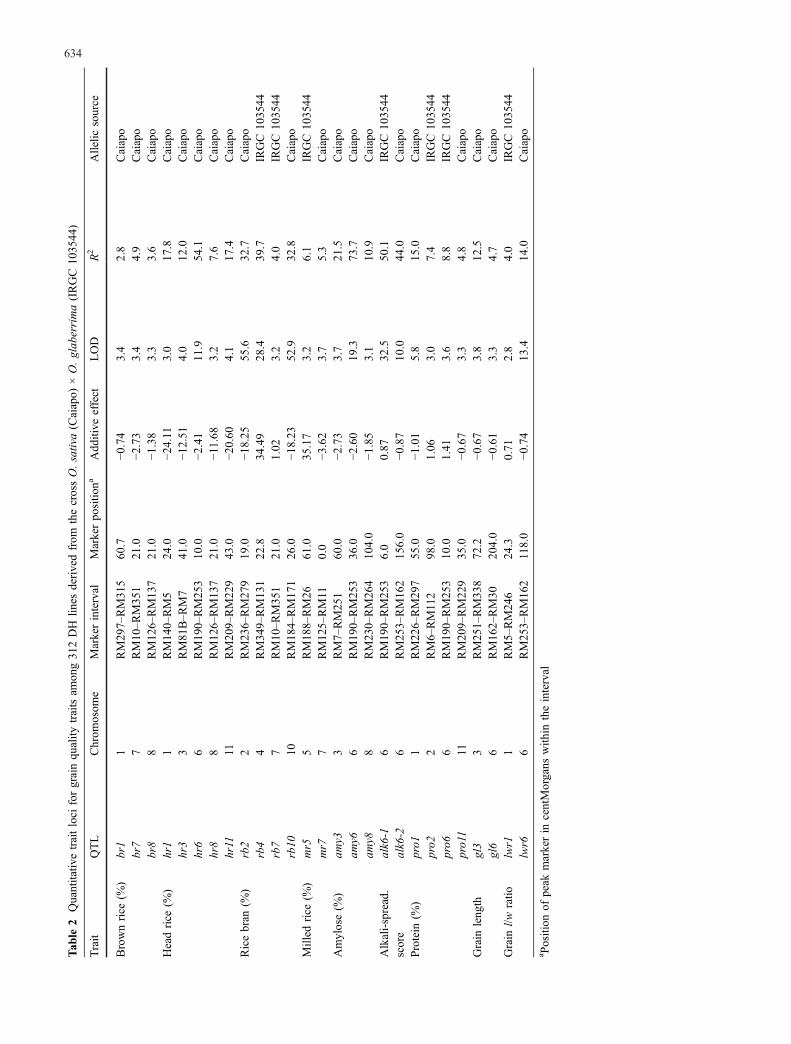
Fig. 1 Assignment of 27 QTLsfor nine grain and milling traitson the rice linkage map adjustedby the MAPDISTO program among312 DH lines derived fromOryza sativa (Caiapo) × O.glaberrima (IRGC 103544)cross. Confidence intervals foreach QTL are indicated as a barto the right of each chromo-some. QTLs in bold indicatepositive allelic effects fromIRGC 103544. H QTL reportedby He et al. (1999), T QTLreported by Tan et al. (2001), LQTL reported by Lanceras et al.(2000), Z QTL reported by Zhouet al. (2003), AC QTL for am-ylose content reported by Zhouet al. (2003) and He et al.(1999), GL R QTL for grainlength reported by Redoña andMackill (1998), grlgwdro XuQTL for grain length/width (l/w)ratio reported by Xu et al.(2000), grlg Xu QTL for grainlength reported by Xu et al.(2000), alk alkali-spreadingscore, amy percentage amylose,ASS alkali-spreading score byHe et al. (1999), br percentagebrown rice, gl grain length, gwgrain width, hr percentage headrice, lwr length/width ratio, mrpercentage milled rice, pro pro-tein content, rb percentage ricebran. * QTL detected in thisstudy
633
Tab
le2
Quantitativ
etraitloci
forgrainqu
ality
traitsam
ong31
2DH
lines
derivedfrom
thecrossO.sativa(Caiapo)
×O.glab
errima(IRGC
1035
44)
Trait
QTL
Chrom
osom
eMarkerinterval
Markerpo
sitio
naAdd
itive
effect
LOD
R2
Allelic
source
Brownrice
(%)
br1
1RM29
7–RM31
560
.7−0
.74
3.4
2.8
Caiapo
br7
7RM10–R
M35
121
.0−2
.73
3.4
4.9
Caiapo
br8
8RM12
6–RM13
721
.0−1
.38
3.3
3.6
Caiapo
Headrice
(%)
hr1
1RM14
0–RM5
24.0
−24.11
3.0
17.8
Caiapo
hr3
3RM81
B–R
M7
41.0
−12.51
4.0
12.0
Caiapo
hr6
6RM19
0–RM25
310
.0−2
.41
11.9
54.1
Caiapo
hr8
8RM12
6–RM13
721
.0−1
1.68
3.2
7.6
Caiapo
hr11
11RM20
9–RM22
943
.0−2
0.60
4.1
17.4
Caiapo
Ricebran
(%)
rb2
2RM23
6–RM27
919
.0−1
8.25
55.6
32.7
Caiapo
rb4
4RM34
9–RM13
122
.834
.49
28.4
39.7
IRGC
1035
44rb7
7RM10–R
M35
121
.01.02
3.2
4.0
IRGC
1035
44rb10
10RM18
4–RM17
126
.0−1
8.23
52.9
32.8
Caiapo
Milled
rice
(%)
mr5
5RM18
8–RM26
61.0
35.17
3.2
6.1
IRGC
1035
44mr7
7RM12
5–RM11
0.0
−3.62
3.7
5.3
Caiapo
Amylose(%
)am
y33
RM7–RM25
160
.0−2
.73
3.7
21.5
Caiapo
amy6
6RM19
0–RM25
336
.0−2
.60
19.3
73.7
Caiapo
amy8
8RM23
0–RM26
410
4.0
− 1.85
3.1
10.9
Caiapo
Alkali-spread.
score
alk6-1
6RM19
0–RM25
36.0
0.87
32.5
50.1
IRGC
1035
44alk6-2
6RM25
3–RM16
215
6.0
−0.87
10.0
44.0
Caiapo
Protein
(%)
pro1
1RM22
6–RM29
755
.0−1
.01
5.8
15.0
Caiapo
pro2
2RM6–RM112
98.0
1.06
3.0
7.4
IRGC
1035
44pro6
6RM19
0–RM25
310
.01.41
3.6
8.8
IRGC
1035
44pro11
11RM20
9–RM22
935
.0−0
.67
3.3
4.8
Caiapo
Grain
leng
thgl3
3RM25
1–RM33
872
.2−0
.67
3.8
12.5
Caiapo
gl6
6RM16
2–RM30
204.0
−0.61
3.3
4.7
Caiapo
Grain
l/wratio
lwr1
1RM5–RM24
624
.30.71
2.8
4.0
IRGC
1035
44lwr6
6RM25
3–RM16
2118.0
−0.74
13.4
14.0
Caiapo
a Position
ofpeak
markerin
centMorgans
with
intheinterval
634

Of the 100 markers used in this study 39 showedvarying degrees of segregation distortion on all 12 chro-mosomes (Table 1). The majority of markers (34/39) wereskewed toward Caiapo, which may be explained by thethree backcrosses that were carried out and subsequentselection against sterile plants during population develop-ment. However, five of the most distorted markers—detected on chromosomes 3 (RM85, RM60, RM81B) and6 (RM190, RM253)—were unexpectedly skewed toward
the O. glaberrima parent. RM60 and RM81B, showing thehighest level of distortion among all markers, mapped nearthe top of chromosome 3 (Fig. 1). A different pattern wasfound with distorted markers RM103, RM253, andRM190, which mapped to different positions on chromo-some 6, where the QTL for percentage amylose (amy-6)detected in this study and the previously reported waxy(Wx) QTL (He et al. 1999) also map. The hybrid sterilityof QTL SA1 has been previously mapped to this same
Fig. 2 Distribution of millingand grain quality characteristicsamong 312 DH rice lines eval-uated at CIAT, Colombia, 2001.Filled arrows represent meanvalues for the Caiapo parent,empty arrows represent meanvalues for the O. glaberrimaparent IRGC 103544
635
region on chromosome 6 (Gramene website: http://www.gramene.org/db/cmap/map_details?ref_map_set_aid=morph-2000;ref_map_aid=morph-2000-6). The orderand position of the distorted markers on our linkage mapwere unclear or switched in position when compared to adifferent O. sativa × O. glaberrima population (Lorieux etal. (2000) or previously published maps (data not shown).The MAPDISTO program used in the present study success-fully restored marker order relative to the map of Lorieuxet al. (2000). The adjusted map in our study showed anaverage interval length of 10.5 cM between markers, witha total length of 1,050 cM (Fig. 1), which is 1.3–foldshorter than the lengths of previous maps constructed fromother populations (Causse et al. 1994; Panaud et al. 1996;Chen et al. 1997; Lorieux et al. 2000; Temnykh et al.2000). Nevertheless, subsequent QTL analysis of the DHlines (see below) showed similar mapping results fordifferent grain quality traits as previously reported(Redoña and Mackill 1998; Tan et al. 1999, 2001;Lanceras et al. 2000; Xu et al. 2000).
We detected three QTLs—br1, br7, and br8—forpercentage brown rice on chromosomes 1, 7, and 8 inthe intervals RM297–RM315, RM10–RM351, andRM126–RM13 that explained 3%, 5%, and 4% of thephenotypic variance, respectively (Table 2). Alleles fromthe Caiapo parent were associated with increased percen-tage brown rice at all three loci. In contrast to these results,Tan et al. (2001) detected one QTL for brown rice onchromosome 5 in an O. sativa × O. sativa cross thatexplained 10% of the phenotypic variation. The frequencydistribution of percentage brown rice among the 312 DHlines shown in Fig. 2a suggests simple inheritance of thistrait, but the distribution was skewed toward Caiapo, mostlikely due to the three backcrosses made to this parent. Thelarge variation in percentage brown rice among the DHlines indicates that there is ample opportunity forimprovement of this trait. Of the DH lines 6% showedtransgressive segregation over the high parent forpercentage brown rice based on Duncan’s multiple rangetest. Three QTLs were detected on chromosomes 1, 7, and8 that represent potentially new chromosomal regions
associated with percentage brown rice, but additionalexperiments are needed to confirm these results.
As was the case for percentage brown rice, thefrequency distribution of percentage head rice was skewedtowards Caiapo (Fig. 2b). The continuous pattern of thedistribution suggests quantitative inheritance, a resultsimilar to that of Tan et al. (2001) who observed a widerange among the recombinant inbred lines (RILs) tested.Five chromosomal regions were associated with QTLs forpercent head rice (Table 2). The Caiapo parent contributedall five QTLs for this trait. QTL hr1 on chromosome 1 wasdetected in the interval RM140–RM5 that explained17.8% of phenotypic variation with a LOD score of 3.4.The QTL hr3 in the interval RM338–RM55 accounted for12% of the variation and mapped approximately 8 cMfrom the head rice QTL interval C1087–RZ403 asreported by Tan et al. (2001). A major QTL, hr6, with aLOD value of 11.9, was located on chromosome 6 in theinterval RM190–RM253 and accounted for 54.1% of thetotal variation. On chromosome 8, hr8 was detected with aLOD score of 3.2 that explained 7.6% of the variation.QTL hr11 mapped to chromosome 11 in the intervalRM209–RM229 with a LOD of 4.0 and explained 17.4%of the phenotypic variation. The high performance of someof the DH lines could have resulted from epistaticinteractions found on chromosomes 1, 3, and 6 associatedwith head rice (Table 3). Non-additive interactions havebeen shown to be correlated with transgressive segregationin rice (Moncada et al. 2001; Tan et al. 2001). The headrice QTL hr3 in our study mapped to the same chromo-somal region as in intraspecific crosses with O. sativa (Tanet al. 2001), suggesting that these QTLs may be commonamong other rice species. Finally, one QTL for percentagehead rice and brown rice mapped to the same interval onchromosome 8, a result that may be due to linkage orpleiotropy, even though these two traits were not highlycorrelated.
Four QTLs—rb2, rb4, rb7, and rb10—were signifi-cantly associated with percentage rice bran (Table 2).Positive alleles rb4 and rb7 were contributed byIRGC 103544 while rb2 and rb10 were derived from theCaiapo parent. QTLs identified for percentage rice bran in
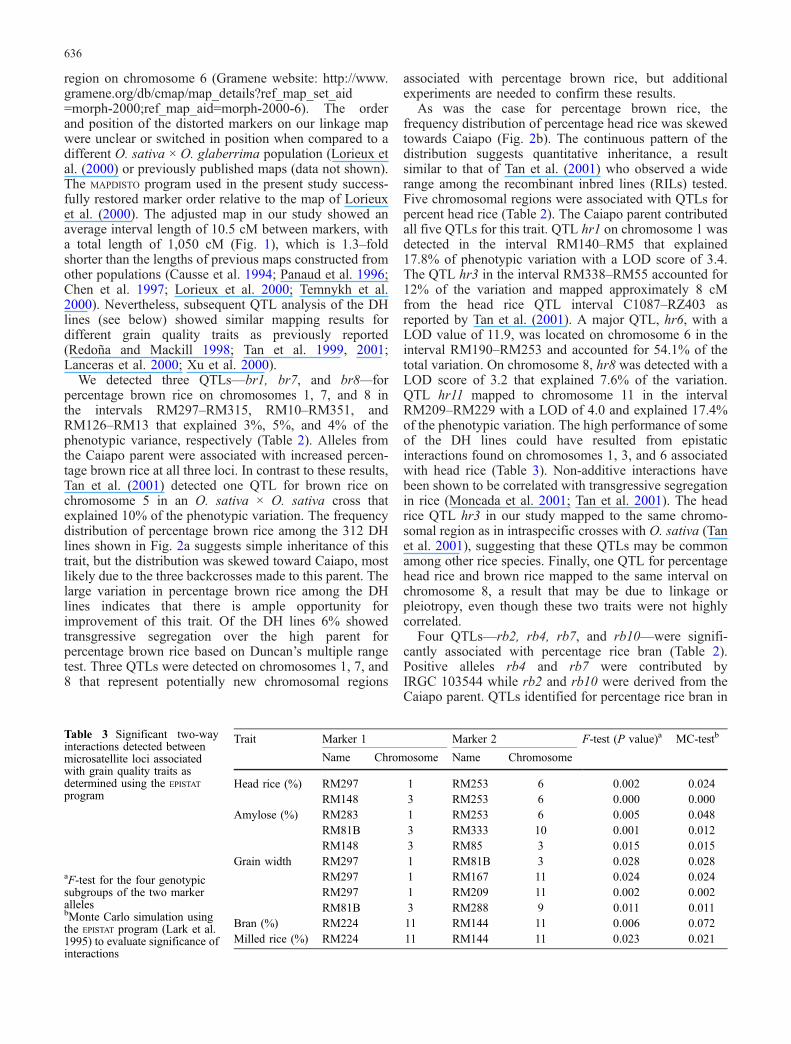
Table 3 Significant two-wayinteractions detected betweenmicrosatellite loci associatedwith grain quality traits asdetermined using the EPISTAT
program
aF-test for the four genotypicsubgroups of the two markerallelesbMonte Carlo simulation usingthe EPISTAT program (Lark et al.1995) to evaluate significance ofinteractions
Trait Marker 1 Marker 2 F-test (P value)a MC-testb
Name Chromosome Name Chromosome
Head rice (%) RM297 1 RM253 6 0.002 0.024RM148 3 RM253 6 0.000 0.000
Amylose (%) RM283 1 RM253 6 0.005 0.048RM81B 3 RM333 10 0.001 0.012RM148 3 RM85 3 0.015 0.015
Grain width RM297 1 RM81B 3 0.028 0.028RM297 1 RM167 11 0.024 0.024RM297 1 RM209 11 0.002 0.002RM81B 3 RM288 9 0.011 0.011
Bran (%) RM224 11 RM144 11 0.006 0.072Milled rice (%) RM224 11 RM144 11 0.023 0.021
636

this study are the first to be reported for this trait. A smallproportion (7%) of the DH lines showed transgressivesegregation for high percentage bran while 10% displayedvalues lower than that of Caiapo.
The majority of the 312 DH lines produced approxi-mately 6% more milled rice than the IRGC 103544 parent(62%) and approximately 2% less than the Caiapo parent(70%). The percentage milled rice trait of the DH linesexhibited a wide range of values—from 33% to 89%—which was similar to the range of values found in the RILsof Tan et al. (2001) and Septiningsih et al. (2003). Tworegions were found to be associated with the QTLs forpercentage milled rice on chromosomes 5 and 7 (Table 2).The QTL mr5 on chromosome 5 was located a distant47 cM from a milled rice locus reported by Tan et al.(2001). The second QTL, mr7 from Caiapo, was detectedon chromosome 7. Tan et al. (2000) detected minor QTLson chromosomes 3 and 5, respectively.
Fifty of the the DH lines (16%) developed in the currentstudy produced a higher percentage of amylose than thehigh-amylose-producing IRGC 103544 parent (Fig. 2e).One major QTL, amy6, was detected on chromosome 6 inthe interval RM190–RM253 with a LOD score of 19.3;this QTL accounted for 73.7% of the phenotypic variation.Other researchers have also detected a QTL for amylosecontent at the same region near the waxy gene onchromosome 6 (He et al. 1999; Tan et al. 1999; Lanceraset al. 2000; Septiningsih et al. 2003). Two additional QTLshave also been detected on chromosomes 3 and 8—amy3and amy8, respectively. Earlier studies based on mappingpopulations derived from O. sativa × O. sativa crossesidentified QTLs controlling amylose content on chromo-somes other than chromosome 6 (He et al. 1999; Lanceraset al. 2000). These results support the idea that both themajor waxy gene and modifying genes control amylosecontent, as previously reported by McKenzie and Rutger(1983).
A low alkali-spreading score was predominant as 60%of the DH lines produced scores between 3.2 and 5.7,although 1% of the DH lines showed values greater thanthat of IRGC 103544. In contrast to most of the othertraits, the distribution of alkali-spreading scores wasskewed towards IRGC 103544. The two QTLs detectedfor alkali-spreading score mapped to chromosome 6 (alk6-1 and alk6-2) (Table 2). The alleles of alk6-1 fromIRGC 103544 were associated with an increased traitvalue at this locus. He et al. (1999) also detected a QTL foralkali-spreading score in this region. Alleles associatedwith an increase in alkali-spreading scores were con-tributed by both IRGC 103544 and Caiapo. Lanceras et al.(2000) detected two QTLs on chromosomes 6 and 7 foralkali-spreading score that accounted for 57% of the totalvariation. QTL alk6-1 in our study was detected in thesame region as the major QTL controlling amylosecontent. Similar results by other researchers (Tan et al.1999; He et al. 1999) showed a single QTL for amylosecontent and alkali-spreading score at the same locus onchromosome 6. The same observation was made by Bao et
al. (2002). These results may be due to linkage orpleiotropic effects of a single gene.
Four QTLs were identified for percentage proteincontent. Tan et al. (2001) detected a QTL in the intervalC962–Wx for protein content on chromosome 6 near thewaxy locus, and the QTL pro6 mapped at this position inthis study.
The mean grain length of the DH lines—9.0 mm—wasintermediate between both parents. Grain length showed anormal distribution, indicating quantitative inheritancewith a positive skewness observed toward Caiapo, thelong-grained parent. Of all the DH lines, 6% showedtransgressive segregation for longer grains. Both QTLsreported for grain length were contributed by alleles fromthe Caiapo parent. The QTL gl3 for grain length detectedin our study has been found in the same region onchromosome 3 in other populations (Redoña and Mackill1998; Xu et al. 2000). The Fusayoshi long-grain gene Lk-fwas mapped to chromosome 3 by Takeda and Saito (1980)and Takamure and Kinoshita (1991). It is possible that gl3might be linked to the Lk-f gene or represents it.
No statistical difference for grain width was observedbetween the two parents (Fig. 2I). Mean grain width of theDH lines was 0.6 mm less than that of either parents, withapproximately 80% of the DH lines exhibiting grainwidths between 1.4 mm and 2.8 mm. The frequencydistribution was unimodal with 2% of the lines showingtransgressive segregation for wider grains. No QTLs weredetected for grain width, a result most likely associatedwith the similar phenotypic values for both parents. Incontrast, Tan et al. (2000) detected a major QTL for grainwidth on chromosome 5 and a minor locus on chromo-some 6 in both F2,3 and RIL populations.
The mean grain size of the DH lines, as indicated bytheir length/width ratio of 4.1, was approximately 25%greater than that of Caiapo and 40% greater than that ofthe IRGC 103544 parent (Fig. 2j) The smallest grainsamong the DH lines were similar in size to those ofIRGC 103544. The frequency distribution of this traitindicates a quantitative inheritance with 36% of the linesshowing transgressive segregation for high length/widthratio. Two chromosomal regions were significantlyassociated in our study with grain length/width ratio.
In this study, 27 QTLs for nine economically importantgrain quality traits were detected on all linkage groupsexcept chromosome 9. It is important to note that evenwith segregation distortion detected among the DH lines,marker order was restored by the MAPDISTO software, and18% (5/28) of the QTLs detected in this study (hr3, amy6,alk6-2, pro6, and gl3) mapped to positions within 10 cMof the positions of these grain quality traits evaluated inother populations (He et al. 1999; Xu et al. 2000; Tan et al.2001). The majority of the positive alleles for these QTLs(21/28; 75%) were detected as coming from the adaptedindica variety Caiapo, which exhibited high grain qualityin our study. On the basis of LOD scores of 19.3–55.6, wedetected five major QTLs for quality—rb2, rb4, rb10,amy6, and alk6-1—with the three QTLs associated withpercentage rice bran being reported here for the first time.
637

Two of the major QTLs that contributed to enhancedpercentage rice bran and alkali-spreading score (rb4, alk6-1, respectively) were derived from the O. glaberrimaaccession. Minor QTLs from the African rice accessionalso contributed to greater protein content and graindimension. Multiple location trials are required to confirmthe map positions and relative effects of the QTLs reportedhere.
Segregation distortion has been documented in crossesbetween rice sub-species (Xu et al. 1997; Xu and Shen1992) and species (Causse et al. 1994; Xu et al. 1995;Yamagishi et al. 1996; McCouch et al. 1998; Lorieux et al.2000; Heuer and Miezan 2003; Septiningsih et al. 2003).The presence of the putative ga-2 gametophyte gene(Nakagahra et al. 1972) on chromosome 3 and the S locuson chromosome 6 in O. glaberrima (Heuer and Miezan2003) may have affected pollen fertility, gene segregation,and the observed skewness toward the IRGC 103544parent (Table 1). Distortion detected in our study withmarkers RM315, RM 280, and RM281 on chromosomes 1and 4 were interestingly the same marker (RM315) orwere linked to another (RZ590) displaying non-Mendeliansegregation in the O. sativa × O. rufipogon backcrosspopulation (Septiningsih et al. 2003).
A test of epistatic effects was carried out to identifychromosomal regions that by themselves expressed nodiscernible effects but interacted with other loci to producean observable phenotype. Table 3 shows the list of digenicinteractions we obtained using the EPISTAT software (Chaseet al. 1997). A total of 12 markers were detected on sixchromosomes that produced 11 two-way interactions.Eight of the 11 interactions consisted of markers thatmapped to six different chromosomes. An interactionbetween RM253 and RM297 was detected that may affectthe variation detected for percentage head rice. RM297also interacted with RM81B, RM167, and RM209 onchromosomes 3 and 11 for grain width. This interactionmay bias the variation explained by the QTL in theinterval containing RM253. It is interesting to note that atwo-way interaction for markers RM297 and RM253associated with percentage head rice was detected onchromosomes 1 and 6 in our study (Table 3) and that adigenic interaction between RM265 and RM3 on the samechromosomes associated with percentage head rice wasdetected among BC2F2 families derived from an O. sativa× O. rufipogon cross (Septiningsih et al. 2003).
The results presented here suggest that hybridization ofO. sativa and O. glaberrima can be successfully exploitedto improve the milling, cooking, and eating properties ofrice for international export markets in Africa, Asia, SouthAmerica, and other rice-growing regions. High levels oftransgressive segregation for most of the charactersexamined in our study provide the potential for improve-ment of these economically important traits. Moreover, thedetection of new QTLs from O. glaberrima that enhancedgrain quality underscores the potential value of Africanrice as a useful source for germplasm improvement.Certain QTLs, especially hr3, amy6, and alk6-1 thatmapped to regions consistent with map locations in other
studies, may be useful in marker-assisted selectionexperiments. Finally, the new QTLs detected in thisstudy for milling quality that are derived from O.glaberrima could serve as candidates for future fine-mapping and positional cloning projects.
Acknowledgements We thank both the Rockefeller Foundationfor the granting of a Postdoctoral Fellowship to G. Aluko and theMinistry of Agriculture of Colombia and CIAT for core funding ofthis project. We acknowledge the assistance of Z. Lentini, CIAT, forthe production of DH lines and A. Almeida and O. Giraldo, CIAT,for assistance in the development of marker data.
References
Anonymous, EMBRAPA (Empresa Brasileira do Pesquisa Agrope-cuaria) (1997) A producao de sementes no Brasil. Relatorio daSafra 1995–1996
Anonymous, EPAMIG (Empresa do Pesquisa Agropecuaria deMinas Gerais) (1994) Caiapo. Nova apcao de arroz de sequeiro,Belo Horizonte, Epamig, Embrapa
Bao JS, Sun M, Corke H (2002) Analysis of genetic behavior ofsome starch properties in indica rice (Oryza sativa L.): thermalproperties, gel texture, swelling volume. Theor Appl Genet104:408–413
Basten CJ, Weir BS, Zeng ZB (1994) ZMAP—a QTL CARTOGRAPHER: areference manual and tutorial for QTL mapping. Department ofStatistics, North Carolina State University, Raleigh
Causse MA, Fulton TM, Cho YG, Ahn SN, Chunwongse J, Wu K,Xiao J, Yu Z, Ronald PC, Harrington SE, Second G, McCouchSR, Tanksley SD (1994) Saturated molecular map of the ricegenome based on an interspecific backcross population.Genetics 138:1251–1274
Chase K, Adler FR, Lark KG (1997) EPISTAT: a computer program foridentifying and testing interactions between pairs of quantita-tive trait loci. Theor Appl Genet 94:724–730
Chen X, Temnykh S, Xu Y, Cho YG, McCouch SR (1997)Development of a microsatellite framework map providinggenome-wide coverage in rice (Oryza sativa L.) Theor ApplGenet 95:553–567
He P, Li SG, Qian Q, Ma YQ, Li JZ, Wang WM, Chen Y, Zhu LH(1999) Genetic analysis of rice grain quality. Theor Appl Genet98:502–508
Heuer S, Miezan K (2003) Assessing hybrid sterility in Oryzaglaberrima × O. sativa hybrid progenies by PCR markeranalysis and crossing with wide compatibility varieties. TheorAppl Genet 107:902–909
Heuer S, Miezan KM, Sie M, Gaye S (2003) Increasing biodiversityof irrigated rice in Africa by interspecific crossing of Oryzaglaberrima (Steud.) × O. sativa indica (L.). Euphytica 132:31–40
Jennings PR, Coffman WR, Kauffman HE (1979) Rice improve-ment. International Rice Research Institute, Manila
Jones MP, Mande S, Aluko K (1997a) Diversity and potential ofOryza glaberrima Steud. in upland rice breeding. Breed Sci47:395–398
Jones MP, Dingkuhn M, Aluko GK, Mande S (1997b) InterspecificO. sativa L. × O. glaberrima Steud. progenies in upland riceimprovement. Euphytica 92:237–246
Juliano BO, Villareal CP (1993) Grain quality evaluation of worldrices. International Rice Research Institute, Manila
Juliano BO, Perez CM, Kaosa-Ard M (1990) Grain qualitycharacteristics of export rice in selected markets. CerealChem 67:192–197
Kumar I, Khush GS (1988) Inheritance of amylose content in rice(Oryza sativa L.). Euphytica 38:261–269
638

Lanceras JC, Huang ZL, Naivikul O, Vanavichit A, Ruanjaichon V,Tragoonrung S (2000) Mapping of genes for cooking andeating qualities in Thai Jasmine rice (KDML105). DNA Res7:93–101
Lander ES, Botstein D (1989) Mapping Mendelian factors under-lying quantitative traits using RFLP linkage maps. Genetics121:185–199
Lander ES, Green P, Abrahamson J, Barlow A, Daley M (1987)MAPMAKER: an interactive computer package for constructingprimary genetic linkage maps of experimental and naturalpopulations. Genomics 1:174–181
Lark KG, Chase K, Alder F, Mansur LM, Orf J (1995) Interactionsbetween quantitative trait loci in which trait variation at onelocus is conditional upon a specific allele at another. Proc NatlAcad Sci USA 92:4656–4660
Lentini Z, Reyes P, Martinez CP, Roca WM (1995) Androgenesis ofhighly recalcitrant rice genotypes with maltose and silvernitrate. Plant Sci 110:127–138
Lincoln S, Daly M, Lander E (1992) Constructing genetic linkagemaps with MAPMAKER/EXP. Whitehead Institute TechnicalReport, Cambridge, Mass. http://www-genome.wi.mit.edu/ftp/distribution/software
Little RR, Hilder GB, Dawson EH (1958) Differential effect ofdilute alkali on 25 varieties of milled white rice. Cereal Chem35:111–126
Lorieux M, Ndjiondjop MN, Ghesquiere A (2000) A first interspe-cific O. sativa × O. glaberrima microsatellite genetic linkagemap. Theor Appl Genet 100:593–601
McCouch SR, Kochert G, Yu ZH, Wang ZY, Khush GS (1988)Molecular mapping of rice chromosomes. Theor Appl Genet76:815–829
McKenzie KS, Rutger JN (1983) Genetic analysis of amylosecontent, alkali spreading score, and grain dimensions in rice.Crop Sci 23:306–311
Moncada P, Martinez CP, Borrero J, Chatel M, Gauch H, GuimaraesE, Tohme J, McCouch SR (2001) Quantitative trait loci foryield and yield components in an Oryza sativa × Oryzarufipogon BC2F2 population evaluated in an upland environ-ment. Theor Appl Genet 102:41–52
Nakagahra M, Omura T, Iwata N (1972) Gametophyte genes andtheir loci on the eleventh linkage group of cultivated rice. Jpn JBreed 22:305–312
Panaud O, Chen X, McCouch SR (1996) Development ofmicrosatellite markers and characterization of sequence lengthpolymorphism (SSLP) in rice (Oryza sativa L.). Mol Gen Genet252:597–607
Redoña E, Mackill DJ (1998) Quantitative trait locus analysis forrice panicle and grain characteristics. Theor Appl Genet96:957–963
Sano Y (1984) Differential regulation of waxy gene expression inrice endosperm. Theor Appl Genet 68:467–473
SAS Institute (1998) Users guide to statistics, ver. 8.2. SAS Institute,Cary, N.C.
SAS Institute (2003) SAS ver. 9. SAS Institute, Cary, N.C.Second G (1982) Origin of the genetic diversity of cultivated rice
(Oryza spp.): study of the polymorphism scored at 40 isozymeloci. Jap J Genet 57:25–58
Septiningsih EM, Trijatmiko KR, Moeljopawiro S, McCouch SR(2003) Identification of quantitative trait loci for grain quality inan advanced backcross population derived from the Oryzasativa variety IR64 and the wild relative O. rufipogon. TheorAppl Genet 107:1433–1441
Takamure I, Kinoshita T (1991) Linkage analysis in chromosomes 3and 6. Rice Genet Newsl 8:98–100
Takeda K, Saito K (1980) Major genes controlling grain size inJapan. Jpn J Breed 30:280–282
Tan YF, Li JX, Yu SB, Xing YZ, Xu CG, Zhang QF (1999) Thethree important traits for cooking and eating qualities of ricegrain are controlled by a single locus. Theor Appl Genet99:642–648
Tan YF, Xing YZ, Li JX, Yu SB, Xu CG, Zhang QF (2000) Geneticbases of appearance quality of rice grains in Shanyou 63, anelite rice hybrid. Theor Appl Genet 101:823–829
Tan YF, Sun M, Xing YZ, Hua JP, Sun XL, Zhang QF, Corke H(2001) Mapping quantitative trait loci for milling quality,protein content and color characteristics of rice using arecombinant inbred line population derived from an elite ricehybrid. Theor Appl Genet 103:1037–1045
Temnykh S, Park WD, Ayres N, Cartinhour S, Hauck N, Lipovich L,Cho YG, Ishii T, McCouch SR (2000) Mapping and genomeorganization of microsatellite sequences in rice (Oryza sativaL.). Theor Appl Genet 100:698–712
Unnevehr LJ, Duff B, Juliano BO (1992) Consumer demand for ricegrain quality. International Rice Research Institute, Manila, andInternational Development Research Center, Ottawa
Xiao J, Li J, Yuan L, Tanksley SD (1996) Identification of QTLaffecting traits of agronomic importance in a recombinantinbred population derived from sub-specific rice cross. TheorAppl Genet 92:230–244
Xiao J, Li J, Grandillo S, Ahn SN, Yuan L, Tanksley SD, McCouchSR (1998) Identification of trait improving quantitative traitloci alleles from a wild rice relative Oryza rufipogon. Genetics150:899–909
Xu Y, Shen ZT (1992) Distorted segregation of waxy gene and itscharacterization in indica-japonica hybrids. Chin J Rice Sci6:89–92
Xu Y, Shen ZT, Chen Y, Zhu LH (1995) Distorted segregations ofRFLP markers and their distribution on chromosomes in anindica-japonica F2 population of rice (Oryza sativa L.). ActaBot Sin 37:91–96
Xu Y, Zhu L, Xiao J, Huang N, McCouch S (1997) Chromosomalregions associated with segregation distortion of molecularmarkers in F2, backcross, doubled haploid, and recombinantinbred populations in rice (Oryza sativa L.). Mol Gen Genet253:535–545
Xu GG, Yu SB, Zhang Q, Li JX, Xing YZ, Tan YF (2000) Geneticbases of appearance quality of rice grains in Shanyou 63, anelite hybrid. Theor Appl Genet 101:823–829
Yamagishi M, Yano M, Fukui Y, Otani M, Shimada M (1996)Distorted segregation of RFLP markers in regenerated plantsderived from anther culture of an F1 hybrid rice. Gene GenetSyst 71:37–41
Zeng ZB (1994) Precision mapping of quantitative trait loci.Genetics 136:1457–1468
Zhou PH, Tan YF, He YQ, Xu CG, Zhang Q (2003) Simultaneousimprovement for four quality traits of Zhenshan 97, an eliteparent of hybrid rice, by molecular marker-assisted selection.Theor Appl Genet 106:326–331
639