Diet of four annual killifishes: an intra and interspecific comparison
10
77 Neotropical Ichthyology, 7(1):77-86, 2009 Copyright © 2009 Sociedade Brasileira de Ictiologia Diet of four annual killifishes: an intra and interspecific comparison Gabriel Laufer 1 , Matías Arim 1,2 , Marcelo Loureiro 1,3 , Juan Manuel Piñeiro-Guerra 1 , Sabrina Clavijo-Baquet 2 and César Fagúndez 4 We examined the diet of 4 annual fishes, Austrolebias viarius, Austrolebias cheradophilus, Austrolebias luteoflammulatus and Cynopoecilus melanotaenia inhabiting temporal ponds of southeastern Uruguay, by analysis of stomach contents. Fishes were captured from fifty ephemeral ponds of Castillos Lagoon basin, in the region of the Humedales del Este. We identified 13099 individual prey items extracted from 669 stomachs of the four captured species. In the studied system, annual killifishes represents the most abundant and conspicuous top predators. Killifishes are generalist key predators at the ephemeral ponds of the studied system, consuming mostly aquatic items. Zooplancton represented the bulk of the diet in the four analyzed species, followed by eggs, algae and diatoms. Insects are the next group in prey number, as follows: Diptera larvae (especially Chironomidae and Cullicidae), Ephemeroptera (especially Betidae), and coleopteran larvae (especially Dytiscidae). Acari are also important prey in number. The four fish species differ in diet composition and in diet richness. A general pattern of differences in diet richness among killifish species and demographic groups could be related to variations in body sizes. As top predators annual killifishes are an important component of the temporal pond ecosystems. Understanding the natural history of this species and their communities is necessary in order to conserve them. Nós examinamos a dieta de 4 peixes anuais, Austrolebias viarius, Austrolebias cheradophilus, Austrolebias luteoflammulatus e Cynopoecilus melanotaenia, que habitam poças temporárias do sudeste do Uruguai, através da análise de conteúdo estomacal. Os peixes foram capturados em cinco poças temporárias da bacia da lagoa Castillos, na região de Humedales del Este. Nós identificamos 13099 itens de presas estraídos de 669 estômagos das quatro espécies. No sistema estudado, peixes anuais representam os predadores de topo mais abundantes e conspícuos. Os rivulídeos são predadores generalistas nas poças temporaries estudadas, consumindo principalmente itens aquáticos. Zooplâncton representou o item principal da dieta para as quatro espécies, seguido de ovos, algas e diatomáceas. Insetos compoem o próximo grupo em número de presas, como segue: larvas de Diptera (especialmente Chironomidae e Cullicidae), Ephemeroptera (especialmente Betidae), e larvas de Coleoptera (especialmente Dytiscidae). Ácaros foram também presas importantes em número. As quatro espécies de peixes diferem na composição e riqueza das dietas. O padrão geral de diferenciação da dieta entre espécies e grupos demográficos de rivulídeos pode ser relacionado à variação do tamanho corporal. Como predadores de topo, os rivulídeos anuais são um componente importante dos ecossistemas de poças temporárias. A compreensão da história natural destas espécies e de suas comunidades é necessária a sua conservação. Key words: Annual fishes, Foraging behavior, Predators, Food analysis. 1 Sección Zoología Vertebrados, 4 Sección Ecología, Facultad de Ciencias, Universidad de la República, Uruguay, Iguá 4225 Piso 9 Sur, Montevideo, Uruguay. 2 Center for Advanced Studies in Ecology & Biodiversity (CASEB) and Departamento de Ecología, Facultad de Ciencias Biológicas, Pontificia Universidad Católica de Chile, Santiago, CP 6513677, Chile. 3 Departamento de Ictiología, Museo Nacional de Historia Natural y Antropología, Juan Carlos Gómez 582, Montevideo, Uruguay.
-
Upload
independent -
Category
Documents
-
view
0 -
download
0
Transcript of Diet of four annual killifishes: an intra and interspecific comparison

77
Neotropical Ichthyology, 7(1):77-86, 2009Copyright © 2009 Sociedade Brasileira de Ictiologia
Diet of four annual killifishes:an intra and interspecific comparison
Gabriel Laufer1, Matías Arim1,2, Marcelo Loureiro1,3, Juan Manuel Piñeiro-Guerra1,Sabrina Clavijo-Baquet2 and César Fagúndez4
We examined the diet of 4 annual fishes, Austrolebias viarius, Austrolebias cheradophilus, Austrolebias luteoflammulatusand Cynopoecilus melanotaenia inhabiting temporal ponds of southeastern Uruguay, by analysis of stomach contents.Fishes were captured from fifty ephemeral ponds of Castillos Lagoon basin, in the region of the Humedales del Este. Weidentified 13099 individual prey items extracted from 669 stomachs of the four captured species. In the studied system, annualkillifishes represents the most abundant and conspicuous top predators. Killifishes are generalist key predators at the ephemeralponds of the studied system, consuming mostly aquatic items. Zooplancton represented the bulk of the diet in the fouranalyzed species, followed by eggs, algae and diatoms. Insects are the next group in prey number, as follows: Diptera larvae(especially Chironomidae and Cullicidae), Ephemeroptera (especially Betidae), and coleopteran larvae (especially Dytiscidae).Acari are also important prey in number. The four fish species differ in diet composition and in diet richness. A general patternof differences in diet richness among killifish species and demographic groups could be related to variations in body sizes. Astop predators annual killifishes are an important component of the temporal pond ecosystems. Understanding the naturalhistory of this species and their communities is necessary in order to conserve them.
Nós examinamos a dieta de 4 peixes anuais, Austrolebias viarius, Austrolebias cheradophilus, Austrolebias luteoflammulatuse Cynopoecilus melanotaenia, que habitam poças temporárias do sudeste do Uruguai, através da análise de conteúdoestomacal. Os peixes foram capturados em cinco poças temporárias da bacia da lagoa Castillos, na região de Humedales delEste. Nós identificamos 13099 itens de presas estraídos de 669 estômagos das quatro espécies. No sistema estudado, peixesanuais representam os predadores de topo mais abundantes e conspícuos. Os rivulídeos são predadores generalistas naspoças temporaries estudadas, consumindo principalmente itens aquáticos. Zooplâncton representou o item principal da dietapara as quatro espécies, seguido de ovos, algas e diatomáceas. Insetos compoem o próximo grupo em número de presas, comosegue: larvas de Diptera (especialmente Chironomidae e Cullicidae), Ephemeroptera (especialmente Betidae), e larvas deColeoptera (especialmente Dytiscidae). Ácaros foram também presas importantes em número. As quatro espécies de peixesdiferem na composição e riqueza das dietas. O padrão geral de diferenciação da dieta entre espécies e grupos demográficos derivulídeos pode ser relacionado à variação do tamanho corporal. Como predadores de topo, os rivulídeos anuais são umcomponente importante dos ecossistemas de poças temporárias. A compreensão da história natural destas espécies e de suascomunidades é necessária a sua conservação.
Key words: Annual fishes, Foraging behavior, Predators, Food analysis.
1Sección Zoología Vertebrados, 4Sección Ecología, Facultad de Ciencias, Universidad de la República, Uruguay, Iguá 4225 Piso 9 Sur,Montevideo, Uruguay.2Center for Advanced Studies in Ecology & Biodiversity (CASEB) and Departamento de Ecología, Facultad de Ciencias Biológicas,Pontificia Universidad Católica de Chile, Santiago, CP 6513677, Chile.3Departamento de Ictiología, Museo Nacional de Historia Natural y Antropología, Juan Carlos Gómez 582, Montevideo, Uruguay.

Diet of four annual killifishes78
Introduction
Diet is a basic determinant of organism biology, beingrelated with most of the ecological attributes (Hughes, 1993).Diet has been associated with morphology (Winemiller, 1991),physiology (McNab, 2002), behaviour (Ward et al., 2004),population abundances (Brown et al., 2004) and dynamics(Berryman, 1999), community structure (Arim et al., 2007) andeven ecosystem processes (Thébault & Loreau, 2006). As aconsequence, knowing species trophic behavior representsa central step in order to advance in understanding its naturalhistory.
Living in time-constrained habitats, such as ephemeralponds with periodic drying, imposes several constrains tospecies behaviour, development, and life history (Ludwig &Rowe, 1990). Biological and environmental factors interact todetermine the structure of the temporary pond communities(Wilbur, 1987). Mortality risk can be high in these habitatsdue to desiccation and predation by odonates, beetles andhemipterans (Wilbur, 1987). Animals found in that habitats—mostly macroinvertebrate and amphibian larvae—showadaptations to deal with that particular hydrological regime,such as rapid colonization and growth rate, high phenotypicplasticity (Wilbur, 1987; Marcus & Weeks, 1997; Relyea &Werner, 2000; Mura et al., 2003) or the presence of a resistancephase in their life cycle (e.g. diapause). Periodic dryingexcludes species unable to cope with that physical stress,preventing the colonization of key predators such as fishesand some invertebrate (Skelly, 1995). In fact, many amphibianswith no anti-fish predator defenses are restricted to ephemeralpools (Kats et al., 1988; Peltzer & Lajmanovich, 2004).However, the annual killifishes (Cyprinodontiformes,Aplocheiloidei) are fish species that evolved in that particularhabitat, having a resistance phase in their life cycle (Wourms,1972).
Annual killifishes originated independently in Africa andSouth America and have evolved to tolerate the desiccationconstrains by completion of their entire cycle within less thanone year (Costa, 1995a; Nelson, 2006). This adaptationrequires notable high growing and development rates (Errea& Danulat, 2001). When ponds dry out, adults die and theireggs remain in diapause buried in the substrate, hatching onthe next year, with the return of favorable conditions (Wourms,1972; Arezzo et al., 2005). While tadpoles have the possibilityof regulating their metamorphosis time (exit of the temporarypond) based on the environmental conditions, for annualfishes the only option is the fast growth and maturationbecause its whole cycle passes in ephemeral ponds. Thisfishes require lying eggs before the pond dries (Scheel, 1962),so energetic budgets imply growing and reproductionrequirements, probably with a great ingestion necessity.
Despite the uniqueness of this life cycle, there is littleinformation about their life history and diet (Costa, 1995a;Arenzon et al., 2001). The ecological and evolutionarycontexts of temporal ponds have profound implications inspecies biology, well studied in amphibians and invertebrates,but not in fishes. The objective of this study was to describeand analyze the diet of four killifish species that coexist in atemporary pond system, in southeastern Uruguay:Cynopoecilus melanotaenia (Regan, 1912), Austrolebiasluteoflammulatus (Vaz-Ferreira, Sierra de Soriano & Scagliade Paulete, 1964), A. viarius (Vaz-Ferreira, Sierra de Soriano &Scaglia de Paulete, 1964) and A. cheradophilus (Vaz-Ferreira,Sierra de Soriano & Scaglia de Paulete, 1964).
Material and Methods
Study Area. The present study is based on diet analysis ofindividuals collected in a costal lagoon basin which outflowsinto the Atlantic ocean, southeastern Uruguay, in the region
Fig. 1. Map of the study site area. The sampled temporary pools are located in the Castillos Lagoon Basin, about 60 km fromBrazilian border.

G. Laufer, M. Arim, M. Loureiro, J. M. Piñeiro-Guerra, S. Clavijo-Baquet & C. Fagúndez 79
of the Humedales del Este (Eastern Wetlands), Rocha;declared Biosphere Reserve by UNESCO, program MAB (Fig.1). A system of 50 temporal ponds was studied, located ingrasslands (private farms used for cattle). Ponds consist ofground depressions with a depth that does not surpass 30cm and a very variable area (from 1 to 25000 m2). Duringautumn and winter, these pools are usually water plenty, timeat which the pluvial water contributions surpass the lossesby evaporation; quickly dried in the beginning of higherspring temperatures. Ponds display an important diversity oforganisms, macrophytes and invertebrates as well withdifferent adaptations to this particular hydrological regime.Present vertebrates are fishes and anurans (larvae and adults).
Fish sampling and diet analysis. Fishes were collected inwinter of 2006 with hand-net (15 x 20 cm, 1 mm mesh). Fisheswere captured and euthanized with a lethal dose of 2-phenoxyethanol and immediately fixed in formaldehydesolution (4%). At laboratory, specimens were identified atthe species level, measured with a digital caliper (to the nearestof 0.01 mm) for standard length (STL), and classified indemographic groups according to the presence of visiblesexual characters (coloration pattern and fin configuration;Costa, 2006) as follows: juveniles (J), females (F), males (M)or not identified (Ni). The data from those individuals thatcould not be identified were used for species level analysis,but not for demographic comparisons. All specimensanalyzed were placed in the Fish Collection of Facultad deCiencias, Montevideo (Institutional Code: ZVC-P).
Preserved specimens were dissected and all foodcontained in their stomach was removed and spread on aglass slide for identification under stereomicroscope.References on aquatic invertebrates and zooplankton wereconsulted for prey identification (Burgis & Morris, 1987;Consoli & Olivera, 1994; Peña, 2001; Thorp & Covich, 2001;Motta & Uieda, 2004; Costa et al., 2006).
Statistical Analysis. For each species the number ofindividuals, mean length, number of prey and prey richnesswere analyzed, discriminating among males, females andjuvenile individuals. Differences between frequency variables(fish individuals, prey number and prey richness) wereevaluated by G-test at two different levels (Sokal & Rohlf,1995). First, data were compared between M, F and J of eachspecies. If significant differences were detected, a G-test wasrealized for each pair of demographic groups (M-F, M-J, F-J).In all G-tests the null hypothesis was an equal distributionamong demographic groups (Sokal & Rohlf, 1995). Thesignificance of standard length difference betweendemographic groups was evaluated by a one-way ANOVA,using Fisher LSD post hoc analysis to evaluate differencesbetween pair of species (Sokal & Rohlf, 1995). STL of A.viarius was transformed (STL’ = sin-1 STL) in order to obtainthe necessary test assumptions.
Diversity patterns are strongly affected by the number ofobservations used in its estimation (Gotelli & Graves, 1996).
Rarefaction is a robust method to describe and contrastdiversity patterns when different sample sizes are involved(Arim & Barbosa, 2002). Further, rarefaction is the onlydiversity measure that is sensitive to rare species and isunbiased by sample size (Magurran, 1988). In the analysis oftemporal or interspecific diet patterns, the use of rarefactionrepresents a robust approach (Arim & Jaksic, 2005) that bringsa better insight about diet patterns than diversity indices(Naya et al., 2002). Rarefaction involves the estimation of theexpected richness for a series of subsamples from the preyabundance distribution (Gotelli & Graves, 1996). For eachspecies rarefaction diversity curves were estimated for thethree demographic groups (M, F, and J). Subsamples whereconstructed with individual fishes (Gotelli & Colwell, 2001)rather than with individual preys (e.g. Naya et al., 2002). Foreach rarefaction curve, sub-samples from one fish to theeffectively observed fish number were taken and speciesrichness retained. This procedure was repeated 10000 timesestimating the median richness and confidence interval at95% with percentiles 0.025, 0.5 and 0.975 (Manly, 1997). Thisre-sampling method eliminates the assumption of underlingdistributions in rarefaction estimation (e.g. Rosenzweig, 1999).Rarefaction curves where used to contrast diet diversitywithin species—among demographic groups—and amongspecies—considering species diet as a whole.
Differences in standard length (STL) between species werestudied with ANOVA analysis. In order to get normality STLwas log10-transformed. A Fisher LSD test was performed tolook for differences between species pairs (Sokal & Rohlf,1995).
For the analysis of differences in diet compositionbetween species, consumed items were categorized in sevenclasses: Basal items, Primary Consumers (PC: Zooplankton,Molluscs and Other), Predators (P: Adult and Larva), andNon Aquatic items. Differences among species were evaluatedby G-test for each item class (Sokal & Rohlf, 1995) andassociation of killifishes species with diet item categories wasanalyzed by a Canonical Correspondence Analysis (CCA),using frequencies (Greenacre, 1984). Diet richnesscomposition was contrasted with a rarefaction procedure(Gotelli & Graves, 1996).
Results
We identified 13099 individual prey items extracted fromstomachs of the 669 collected individuals of the four fishspecies. Zooplancton represented the bulk of their diet, followedby eggs, algae and diatoms (Table 1). Insects were the nextgroup in prey number, as follows: Diptera larvae (especiallyChironomidae and Culicidae), Ephemeroptera (mostlyrepresented by Baetidae larvae), and coleopteran larvae(especially Dytiscidae). Acari (Hydracarina) were also importantprey in number. Other preys such as mollusks and Malacostracaalso appear in relative important quantities in the gut content.Non aquatic preys were represented by adult dipterans,Collembolla and Aranea, in relatively low frequencies.

Diet of four annual killifishes80
Intraspecific analysis. Austrolebias viarius has been thedominant species in the system representing 71.21 % of thetotal number of individuals collected. The proportion ofindividuals observed in demographic groups differed(G2=93.10, p<0.05, Fig. 2a), being F most frequent than Jfollowed by M. Males were larger than F, followed by J (F2,420=77.92, p<0.05, Fig. 2b). Total number of prey were higher in F,followed by J an then M (G2=2441, p<0.05, Fig. 2c) and prey
richness was equal for all stages (G2=3.575, p=0.17, Fig. 2d).The rarefaction curves shows differences betweendemographic groups (Fig. 2). Males show the richest diet,followed by F, and then J.
Austrolebias luteoflammulatus were 18.18 % of the totalsample. The proportion between F and J did not differ, but Mwere the most numerous demographic group (G2=20.60,p<0.05, Fig. 3a). Demographic groups differ at STL
A v A l A c C m F J M N i F J M N i F J M F J M N i N 23 4 1 13 7 6 63 2 5 2 4 5 9 3 16 4 18 9 9 2 1 4 A lg ae 20 3 1 09 4 7 33 7 5 3 4 0 3 0 0 2 0 8 0 D ia tom 24 8 3 3 8 1 1 0 7 0 0 0 0 0 0 1 0 S eed 1 3 3 0 0 0 0 0 0 0 0 0 0 0 0 N em atod a 1 2 1 0 6 1 3 0 4 0 0 0 0 0 0 1 0 O s tracoda 28 3 1 44 1 28 77 9 4 4 8 1 75 2 2 2 23 1 2 1 45 2 C lad ocera 2 6 43 11 6 7 7 23 7 1 9 8 2 1 2 1 2 64 20 61 1 0 30 3 2 1 4 56 5 8 C op ep od a 3 7 2 6 1 5 3 4 2 5 4 3 0 0 0 0 0 0 C yclop oid a 19 5 8 6 4 4 1 3 3 6 0 0 0 1 2 9 0 38 1 C a lan oid a 99 0 3 99 4 27 3 7 6 30 9 1 2 9 2 77 10 55 6 22 2 6 2 85 3 4 B iva lvia 2 0 0 3 0 0 0 0 1 0 5 0 0 0 0 A n cylid ae 4 0 0 0 0 0 0 0 0 0 0 0 0 0 0 P lanorb id ae 2 2 0 2 1 0 0 1 0 3 0 6 2 0 0 0 A m pu lla ridae 5 0 6 0 0 0 3 0 1 0 0 1 0 0 0 O p ercu lu m 5 3 3 1 0 0 0 0 0 1 1 0 0 0 2 O ligoch aeta 1 0 0 0 3 0 0 0 1 0 1 0 0 0 0 A rth ropod a 1 8 2 5 2 1 0 2 1 0 0 2 0 0 0 0 A m ph ipod a 9 3 4 3 2 1 1 0 0 0 1 3 0 0 0 0 Pa ra s ta cu s 2 0 0 0 0 0 0 0 1 0 1 0 0 0 0 A ranea 0 0 0 1 0 0 0 0 0 0 1 0 0 0 0 H yd raca rin a 6 6 1 6 1 7 10 1 1 4 1 2 0 0 1 3 1 0 3 0 In secta 1 0 5 5 3 1 0 1 0 0 0 1 0 0 0 0 D ytiscid ae (la rva ) 1 6 7 9 8 6 4 9 0 0 1 5 0 0 5 0 H a lip lid ae (la rva ) 0 0 1 0 0 0 0 0 0 0 0 0 0 0 0 C hrysom elid ae (la rva ) 0 0 2 0 0 0 0 0 0 0 0 0 0 0 0 H yd rop h ilid ae (la rva ) 3 4 2 3 0 0 1 0 1 0 1 0 0 1 0 E ph em erop tera (la rva ) 0 2 0 0 0 0 0 0 0 0 0 0 0 0 0 B aetid ae (la rva ) 3 4 9 2 8 18 3 6 8 0 12 0 14 2 0 2 0 D ip tera 0 0 0 0 0 0 0 0 0 0 1 0 0 0 0 Tach in ida e 1 0 0 0 0 0 0 0 0 0 0 0 0 0 0 C h ironom id ae (la rva ) 11 3 2 1 3 4 3 1 1 8 0 1 0 1 5 0 11 0 Tip u lidae (la rva ) 0 0 0 0 0 0 0 0 1 0 0 0 0 1 0 C u licid ae (la rva ) 1 7 1 8 3 0 7 3 2 0 5 1 2 2 0 0 1 C u licid ae (p u pa ) 3 0 0 1 0 0 1 0 0 0 0 0 0 1 0 C u licid ae 1 1 0 0 0 0 0 1 3 0 0 0 0 0 0 0 0 C era topog on id ae (la rva ) 1 2 1 1 4 11 2 2 9 0 1 0 3 2 0 2 1 Tab an id ae (la rva ) 2 5 5 9 1 0 0 9 0 2 0 1 2 0 2 0 C orixid ae 0 0 2 1 0 0 1 0 0 0 1 0 0 0 0 N otonectid ae 0 0 1 0 0 0 0 0 0 0 0 0 0 0 0 H ym en op tera 0 0 1 1 0 0 0 0 0 0 0 0 0 0 0 O d on a ta (la rva ) 0 0 1 0 0 0 0 0 0 0 0 0 0 0 0 Z ygop tera (la rva ) 2 0 1 2 0 0 1 0 0 0 0 0 0 0 0 A n isop tera (la rva ) 3 0 1 1 0 0 2 0 1 0 0 0 0 0 0 A p h id ae 1 0 1 2 0 0 1 0 0 0 0 0 0 0 0 Trich op tera (la rva ) 4 1 2 1 0 1 0 0 0 0 4 0 0 0 0 Lep ydop tera (la rva ) 0 0 1 0 0 0 1 0 0 0 0 0 0 0 0 P socop tera 2 0 0 0 0 0 0 0 0 0 0 0 0 0 0 C ollem b ola 8 8 0 1 0 0 0 1 1 0 0 0 0 0 0 0 E gg 9 9 2 9 8 3 12 4 3 2 4 9 6 18 71 0 10 1 0 3 0 E gg m ass 3 0 0 0 0 0 0 0 0 0 0 0 0 0 0 C yno p oec ilu s m e la no ta en ia 0 0 0 0 0 0 0 0 1 0 0 0 0 0 0 U n iden tified 1 7 1 4 2 1 0 1 3 0 3 0 1 3 1 2 1
Table 1. Diet of A. viarius (Av), A. luteoflamulatus (Al), A. cheradophilus (Ac) and C. melanotaenia (Cm) from temporarypools at Castillos lagoon basin, southeastern Uruguay. Gut content is presented for females (F), males (M), juveniles (J) andnot identified individuals (Ni). The first line (N) details the number of analyzed fishes for each species and demographic group.

G. Laufer, M. Arim, M. Loureiro, J. M. Piñeiro-Guerra, S. Clavijo-Baquet & C. Fagúndez 81
Fig. 2. Sampled fishes of A. viarius and differences betweendemographic groups (F, J and M) in: (a) number of collectedindividuals, (b) body sizes measured as STL, (c) total numberof prey recorded at gut analysis, and (d) prey richness at thetaxonomic level detailed in Table 1. (e) Rarefaction curves foreach class. Dashed lines indicate the confident interval at95%.
Fig. 3. Sampled fishes of A. luteoflammulatus and differencesbetween demographic groups (F, J and M) in: (a) number ofcollected individuals, (b) body sizes measured as STL, (c)total number of prey recorded at gut analysis, and (d) preyrichness at the taxonomic level detailed in Table 1. (e)Rarefaction curves for each class. Dashed lines indicate theconfident interval at 95%.
(F2,105=24.24, p<0.05, Fig. 3b), being M the largest, followedby F and then J. Prey number was significantly higher at adultstages, specially at males (G2=359.1, p<0.05, Fig. 3c).Differences in prey richness showed the same tendency butit was marginally significant (G2=5.83, p=0.0541, Fig. 3d). Therarefaction curves show differences between demographicgroups, indicating a greater richness for M followed by F andJ (Fig. 3).
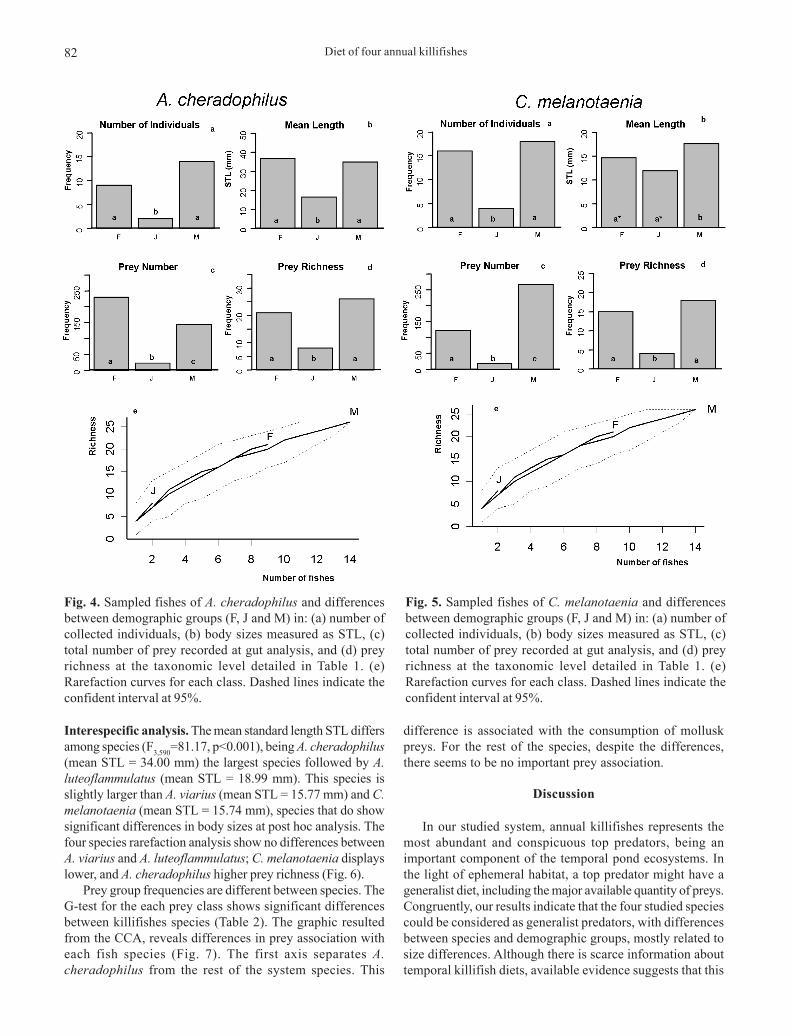
Austrolebias cheradophilus were 4.21 % of the totalsample. M and F were the most frequent demographic groups(G2=10.20, p<0.05, Fig. 4a). There was no significant differencebetween M and F number of individuals, and the same patternis observed in body size (F2,22=4.44, p<0.05, Fig. 4b). Preynumber was significantly higher at adult stages, especially atF (G2=198.1, p<0.05, Fig. 4c), but considering prey richness,M and F are equal and J have lower level (G2=10.60, p<0.05,Fig. 4d). The rarefaction analysis did not show significant
differences for each demographic group, probably due to thesmall sample size (Fig. 4).
Cynopoecilus melanotaenia were 6.4 % of the totalsample. The proportion between demographic groups showssignificant differences (G2=10.90, p<0.05, Fig. 5a) being theadults the predominant classes. In addition, proportions ofM and F individuals did not differ. Males presented largersize than females (F2,35=10.96, p<0.05, Fig. 5b) and bothpresented larger sizes than juveniles. A significant largenumber of prey was observed for M, followed by F and J(G2=262.9, p<0.05, Fig. 5c). Considering prey richness, M andF did not presented significant differences, while J presentedand inferior richness (G2=10.47, p<0.05, Fig. 5d). Therarefaction analysis did not show significant differences foreach demographic group, probably due to the small samplesize (Fig. 5).
Diet of four annual killifishes82
Interespecific analysis. The mean standard length STL differsamong species (F3,590=81.17, p<0.001), being A. cheradophilus(mean STL = 34.00 mm) the largest species followed by A.luteoflammulatus (mean STL = 18.99 mm). This species isslightly larger than A. viarius (mean STL = 15.77 mm) and C.melanotaenia (mean STL = 15.74 mm), species that do showsignificant differences in body sizes at post hoc analysis. Thefour species rarefaction analysis show no differences betweenA. viarius and A. luteoflammulatus; C. melanotaenia displayslower, and A. cheradophilus higher prey richness (Fig. 6).
Prey group frequencies are different between species. TheG-test for the each prey class shows significant differencesbetween killifishes species (Table 2). The graphic resultedfrom the CCA, reveals differences in prey association witheach fish species (Fig. 7). The first axis separates A.cheradophilus from the rest of the system species. This
difference is associated with the consumption of molluskpreys. For the rest of the species, despite the differences,there seems to be no important prey association.
Discussion
In our studied system, annual killifishes represents themost abundant and conspicuous top predators, being animportant component of the temporal pond ecosystems. Inthe light of ephemeral habitat, a top predator might have ageneralist diet, including the major available quantity of preys.Congruently, our results indicate that the four studied speciescould be considered as generalist predators, with differencesbetween species and demographic groups, mostly related tosize differences. Although there is scarce information abouttemporal killifish diets, available evidence suggests that this
Fig. 4. Sampled fishes of A. cheradophilus and differencesbetween demographic groups (F, J and M) in: (a) number ofcollected individuals, (b) body sizes measured as STL, (c)total number of prey recorded at gut analysis, and (d) preyrichness at the taxonomic level detailed in Table 1. (e)Rarefaction curves for each class. Dashed lines indicate theconfident interval at 95%.
Fig. 5. Sampled fishes of C. melanotaenia and differencesbetween demographic groups (F, J and M) in: (a) number ofcollected individuals, (b) body sizes measured as STL, (c)total number of prey recorded at gut analysis, and (d) preyrichness at the taxonomic level detailed in Table 1. (e)Rarefaction curves for each class. Dashed lines indicate theconfident interval at 95%.

G. Laufer, M. Arim, M. Loureiro, J. M. Piñeiro-Guerra, S. Clavijo-Baquet & C. Fagúndez 83
Fig. 6. Rarefaction curves applied for the categorized diet items of Cynopoecilus melanotaenia, Austrolebias luteoflammulatus,A. viarius and A. cheradophilus. Dashed lines indicate the confident interval at 95%.
Fig. 7. Correspondence analysis of diet items (%) and the studied killifish species (%): Cynopoecilus melanotaenia, Austrolebiasluteoflammulatus, A. viarius and A. cheradophilus. The preys were classified in Basal items, Primary Consumers (PC:Zooplankton, Molluscs and Other), Predators (P: Adult and Larva), and Non Aquatic items.

Diet of four annual killifishes84
probably represents a common attribute of the group biology(e.g. Simpsonichthys constanciae and Leptolebias cruzi atRio das Ostras, Brazil, Costa, 1995).
Observed differences in diet richness among killifishspecies and demographic groups could be related to variationsin body sizes (McLaughlin, 1989; Woodward et al., 2005).Among the studied species, larger killifishes presented morediverse diets (Fig. 6). Within species, males typically presenteda more diverse diet than females, and juveniles a poorer dietthan adults (Figs. 2e-3e-4e-5e). Evidence suggests that aspredator body size increases, larger prey items areprogressively added to diet (e.g. insect larvae), faster thansmaller species (e.g. zooplankton) are eliminated (Woodward& Hildrew, 2002). As a result, a larger predator eats virtuallyall the prey species consumed by smaller predators, addingbigger items available at the system (Woodward & Hildrew,2002). Observed patterns in all the species herein studied arecongruent with an increase in diet richness with body size.
Size dimorphism between sexes has been suggested as amain determinant of diet variation (Shine, 1989; Pearson etal., 2002). Concordant with previous reports, males ofAustrolebias and Cynopoecilus are larger than females (VazFerreira et al., 1964; Costa, 1995; Arenzon et al., 2001). Further,sexual differences in diet are suggested to be favored bynatural selection, when morphology or behavior constrainseach species to a limited range of resource (Colwell, 2000).The lack of significant differences between the size of thedifferent sexes in A. cheradophilus could be related with thereduced statistical power from the low number of individualscollected.
In the studied system, the most common species was A.viarius, followed by A. luteoflammulatus comprising bothspecies 89.4% of the observed individuals (Table 1). Thesespecies were mainly represented by juvenile individuals (Figs.2a-3a), while less abundant species—A. cheradophilus andC. melanotaenia—presented greater incidences of adultindividuals (Figs. 4a- 5a). These different patterns couldoriginate from asynchrony in hatching times and/or by inter-specific differences in growth rates. Samples were taken atthe initial phase of pond life, suggesting that temporalseparation in life cycles among species is probably occurring.
This suggest that the largest—A. cheradophilus—and thesmallest—C. melanotaenia—killifish species appeared earlyin the hydrological period while the middle size speciesdevelop later. Inter-specific differences in developing timeshave not been previously evaluated in annual killifishes. Itsconsequences could be the strong constraining of developingtime, being actually less than the short pond life. This factreinforces temporal limitations, and so, this cost shouldsurpass costs related to competition or predation (Houstonand McNamara, 1999). These strategies could maintainkillifishes diversity, despite of the occurrence of four generalistvertebrate predators in a small, time constrained ecosystem(Wilbur, 1987).
Temporal systems are generally identified as a refuge forfish where species sensitive to predation reproduce. Theannual killifishes are giving a singular community structure,coexisting with anuran larvae (Hypsiboas pulchellus,Odontophrynus americanus, Scinax squalirostris and S.granulatus, unpublished data). The absences of tadpoles infish gut content, suggests that predation is not a maindeterminant of this taxa coexistence, as is the case in othercommunities (Kats et al., 1988; Alford, 1999). The existenceof anti-predation defenses has identified elsewhere as afrequent mechanism of predation avoidance by amphibians(Alford, 1999; Ruxton et al., 2004). However, the large size ofthe observed tadpoles, always larger than killifishes, indicatethat size refuge to predation could be the most important antipredation mechanism in this system (Chase, 1999).
The present article represents the first report of the trophicecology of four annual killifishes that coexist at the same wetlandsystem. The study attempts to advance in the understandingthe natural history of these species and their ecologicalcommunities, as a basic tool for conservation and future lifehistory studies. The three Austrolebias species are endemic tothis region, only having C. melanotaenia a wider distribution(D’Anatro & Loureiro, 2005; Costa, 2006). Although beinglocated in a MAB reserve, the system is located in privatefarms, and future land management practices, can affect theponds and their dynamics. Further studies concerning speciesand their communities are necessary in order to conserve thisspecies and their ecosystem.
Av Al Cm Ac G df P Adult Predator 113 28 4 6 263.8 3 < 0.0001 Larva Predator 144 45 15 16 425.3 3 < 0.0001 Non Aquatic preys 133 54 3 10 428.0 3 < 0.0001 Molluscs Primary Consumers 60 4 5 18 32.7 3 < 0.0001 Zooplankton Primary Consumers 8428 1586 435 215 111033.6 3 < 0.0001 Other Primary Consumers 264 59 22 41 1248.7 3 < 0.0001 Basal Items 689 54 11 3 4363.2 3 < 0.0001
Table 2. Categorized diet items for A. viarius (Av), A. luteoflamulatus (Al), C. melanotaenia (Cm) and A. cheradophylus (Ac).The preys were classified in Basal items, Primary Consumers (PC: Zooplankton, Molluscs and Other), Predators (P: Adult andLarva), and Non Aquatic items. For each item it is provided the result of G-test (G), the freedom degree (df) and the probability(P), for differences in frequency.

G. Laufer, M. Arim, M. Loureiro, J. M. Piñeiro-Guerra, S. Clavijo-Baquet & C. Fagúndez 85
Acknowledgements
This study was funded by Fondo Clemente Estable grant05-076 to M. A., G. L. and S. C. and by FONDECYTFONDAPgrant 1501-0001 (Programs 2) to M.A. Authors thanks thehelp during field work to Tito Olivera, Octavio, MauroBerazategui & Andrés Canavero, and to field owners of BarraGrande and El Gurí Ranchs that allowed us to work in theirlands.
Literature Cited
Alford, R. A. 1999. Ecology: resource use, competition, andpredation. Pp. 240-278. In: McDiarmid, R. W. & R. Altig (Eds.).Tadpoles: The Biology of Anuran Larvae. Chicago, Universityof Chicago Press, 444p.
Arenzon, A., A. C. Peret & M. B. C. Bohrer. 2001 Growth of theannual fish Cynopoecilus melanotaenia (Regan, 1912) based ina temporary water body population in Rio Grande Do Sul State,Brazil (Cyprinodontiformes, Rivulidae). Revista Brasileira deBiologia, 61(1): 117-123.
Arezzo, M. J., L. Pereiro & N. Berois. 2005. Early development inthe annual fish Cynolebias viarius. Journal of Fish Biology,66(5): 1357-1370.
Arim, M. & O. Barbosa. 2002. Humped pattern of diversity: factor artifact? Science, 297:1763.
Arim, M. & F. M. Jaksic. 2005. Productivity and food web structure:association between productivity and link richness among toppredators. Journal of Animal Ecology, 74: 31-40.
Arim, M., P. A. Marquet & F. M. Jaksic. 2007. On the relationshipbetween productivity and food chain length at different ecologicallevels. American Naturalist, 169: 62-72.
Berryman, A. A. 1999. Principles of population dynamics and theirapplication. Cheltenham, Stanley Thornes, 243p.
Brown, J. H., J. F. Gillooly, A. P. Allen, V. M. Savage & G. B. West. 2004.Toward a metabolic theory of ecology. Ecology, 85: 1771-1789.
Burgis, M. J. & P. Morris. 1987. The natural history of lakes.Cambridge Cambridge University Press, 218p.
Chase, J. M. 1999. Food web effects of prey size-refugia: variableinteractions and alternative stable equilibria. AmericanNaturalist, 154: 559-570.
Colwell, R. K. 2000. Rensch’s rule crosses the line: convergentallometry of sexual size dimorphism in hummingbirds and flowermites. American Naturalist, 156: 495-510.
Consoli, R. A. G. B. & R. L. de Olivera. 1994. Principais mosquitosde importancia sanitaria no Brasil. Rio de Janeiro, Fiocruz. 225p.
Costa, C., S. Ide & C. E. Simonka. 2006. Insetos imaturos. Meta-morfose e identificação. Ribeirão Preto, Holos Editora, 249p.
Costa, W. J. E. M. 1995a. Pearl Killifishes: The Cynolebiatinae:systematics and biogeography of the Neotropical annual fishsubfamily (Cyprinodontiformes: Rivulidae). Neptune City,TFH Publications, 128p.
Costa, W. J. E. M. 1995b. Revision of the Neotropical Annual FishGenus Cynopoecilus (Cyprinodontiformes: Rivulidae). Copeia,1995(2): 456-465.
Costa, W. J. E. M. 2006. The South American annual killifish genusAustrolebias (Teleostei: Cyprinodontiformes: Rivulidae):phylogenetic relationships, descriptive morphology andtaxonomic revision. Zootaxa, 1213: 1-162.
D’Anatro, A. & M. Loureiro. 2005. Geographic variation in Austrolebias
luteoflamulatus Vaz Ferreira, Sierra & Scaglia (Cyprinodontiformes,Rivulidae). Journal of Fish Biology, 67(3): 849–865.
Errea, A. & E. Danulat. 2001. Growth of the annual fish, Cynolebiasviarius (Cyrinodontiformes), in the natural habitat comparedto laboratory conditions. Environmental Biology of Fishes.61:261-268.
Houston, A. I. & J. M. McNamara. 1999. Models of adaptivebehaviour: an approach based on state. Cambridge, CambridgeUniversity Press, 378p.
Hughes, R. N. 1993. Introduction. Pp. 1-9. In: Hughes, R. N. (Ed.).Diet selection, an interdisciplinary approach to foragingbehaviour. Oxford, Blackwell Scientific Publications, 221p.
Kats, L. B., J. W. Petranka & A. Sih. 1988. Antipredator defensesand the persistence of amphibian larvae with fishes. Ecology,69(6): 1865-1870.
Gotelli, N. J. & R. K. Colwell. 2001. Quantifying biodiversity:procedures and pitfalls in the measurement and comparison ofspecies richness. Ecology Letters, 4: 379-391.
Gotelli, N. J. & G. R. Graves. 1996. Null models in ecology. Wa-shington DC, Smithsonian Institution Press, 368p.
Greenacre, M. J. 1984. Theory and applications of correspondenceanalysis. London, London Academic Press, 223p.
Ludwig, D. & L. Rowe. 1990. Life history strategies for energy gainand predator avoidance under time constraints. AmericanNaturalist, 135: 686-707.
McLaughlin, R. L. 1989. Search modes of birds and lizards: evidence foralternative movement patterns. American Naturalist, 133: 654-670.
McNAB, B. K. 2002. The physiological ecology of vertebrates.Ithaca, Cornell University Press, 576p.
Manly, B. F. J. 1997. Randomization, bootstrap and Monte Carlomethods in biology. New York, Chapman & Hall, 399p.
Magurran, A. E. 1988. Ecological diversity and its measurement.Princeton, Princeton University, 192p.
Marcus, V. & S.C. Weeks. 1997. The effects of pond duration onthe life history of an ephemeral pond crustacean, Eulimnadiatexana. Hydrobiologia, 359: 213-221.
Motta, R. L. & V. S. Uieda. 2004. Diet and trophic groups of anaquatic insect community in a tropical stream. Revista Brasilei-ra de Biologia, 64: 809-817.
Mura, G., G. Fancello & S. Di Giuseppe. 2003. Adaptive strategiesin populations of Chirocephalus diaphanus (Crustacea,Anostraca) from temporary waters in the Reatine Apennines(Central Italy). Journal of Limnology, 62(1): 35-40.
Naya, D. E., M. Arim & R. Vargas. 2002. Diet of South Americanfur seals (Arctocephalus australis) in Isla de Lobos, Uruguay.Marine Mammal Science, 18: 734-745.
Nelson, J. S. 2006. Fishes of the world. 4th Edition. New York,John Wiley and Sons, 601p.
Pearson, D., R. Shine & R. How. 2002. Sex-specific niche partitioningand sexual size dimorphism in Australian pythons (Moreliaspilota imbricata). Biological Journal of the Linnean Society,77(1): 113-125.
Peña, L. E. 2001. Introducción al estudio de los insectos de Chile.Santiago Editorial Universitaria, 256p.
Peltzer, P. M. & R. C. Lajmanovich. 2004. Anuran tadpoleassemblages in riparian areas of the Middle Parana River, Ar-gentina. Biodiversity and Conservation 13: 1833-1842.
Relyea, R. A. & E. E. Werner. 2000. Morphological plasticity infour larval anurans distributed along an environmental gradient.Copeia, 2000: 178-190.
Rosenzweig, M. L. 1999. Species diversity. Pp. 249-281. In: J.

Diet of four annual killifishes86
McGlade (Ed.). Advanced ecological theory principles andapplications. Oxford, Blackwell Science, 354p.
Ruxton, G. D., T. N. Sherratt & M. P. Speed. 2004. Avoiding attack:the evolutionary ecology of crypsis, warning signals andmimicry. Oxford, Oxford University Press, 249p.
Scheel, J. J. 1962. Factors governing development of killie eggs.Tropicals, 7(2): 9-15.
Shine, R. 1989. Ecological Causes for the Evolution of SexualDimorphism: A Review of the Evidence. The Quarterly Reviewof Biology, 64(4): 419-461.
Skelly, D.K. 1995. A Behavioral Trade-Off and Its Consequencesfor the Distribution of Pseudacris Treefrog Larvae. Ecology,76(1): 150-164.
Sokal, R. R. & F. J. Rohlf. 1995. Biometry. 3rd edition. New York,W.H. Freeman and Co, 887p.
Thébault, E. & M. Loreau. 2006. The relationship betweenbiodiversity and ecosystem functioning in food webs. EcologicalResearch, 21: 17-25.
Thorp, J. H. & A. P. Covich. 2001. Ecology and classification ofNorth American freshwater invertebrates. 2nd edition. San Diego,Academic Press, 1056p.
Vaz-Ferreira, R., B. Sierra de Soriano & S. Scaglia de Paulete. 1964.Tres especies nuevas del Genera Cynolebias Steindachner 1876(Teleostomi, Cyprinodontidae). Comunicaciones Zoológicas delMuseo de Historia Natural Montevideo, 8: 1–36.
Ward, A. J. W., P. J. B. Hart & J. Krauseb. 2004. The effects ofhabitat- and diet-based cues on association preferences in three-spined sticklebacks. Behavioral Ecology, 15(6): 925-929.
Wilbur, H. M. 1987. Regulation of structure in complex systems:experimental temporary pond communities. Ecology, 68(5):1437-1452.
Winemiller, K. O. 1991. Ecomorphological diversification offreshwater fish assemblages from five biotic regions. EcologicalMonographs, 61: 343-365.
Woodward, G., B. Ebenman, M. Emmerson, J. M. Montoya, J. M.Olesen, A. Valido & P. H. Warren. 2005. Body size in ecologicalnetworks. Trends in Ecology and Evolution, 20: 402-409.
Woodward, G. & A. G. Hildrew. 2002. Body size determinants ofniche overlap and intraguild predation within a complex foodweb. Journal of Animal Ecology, 71: 1063-1074.
Wourms, J. P. 1972. The developmental biology of the annual fishes.pre-embryonic and embryonic diapause of variable duration inthe eggs of annual fishes. Journal of Experimental Zoology,182: 169-200.
Accepted January 2009Published March 31, 2009