Phenotypic taxonomy and metabolite profiling in microbial drug discovery
Upload
khangminh22Category
view
0download
0
Journal of Experimental Botany, Vol. 70, No. 6 pp. 1843–1858, 2019doi:10.1093/jxb/erz051 Advance Access Publication 18 February 2019This paper is available online free of all access charges (see https://academic.oup.com/jxb/pages/openaccess for further details)
Abbreviations: C, carbon;CAM, Crassulacean acid metabolism; CBC, Calvin–Benson cycle; CCM, carbon-concentrating mechanism; CV, coefficient of variance; DHAP, dihydroxyacetone phosphate; E4P, erythrose 4-phosphate;FBP, fructose 1,6-bisphosphate; FBPase, fructose-1,6-bisphosphatase; F6P, fructose 6-phosphate; GAP, glyceraldehyde 3-phosphate; NADP-GAPDH, NADP-glyceraldehyde-3-phosphate dehydrogenase; PC, principal component; PEP, phosphoenolpyruvate;2PG, 2-phosphoglycolate; 3PGA, 3-phosphoglycerate; PRK, phosphoribulokinase; R5P, ribose 5-phosphate; RuBP, ribulose 1,5-bisphosphate;Ru5P, ribulose 5-phosphate; SBP, sedoheptulose 1,7-bisphosphate; SBPase, sedoheptulose-1,7-bisphosphatase; S7P, sedoheptulose 7-phosphate; TK, transketolase; triose-P, triose phosphate; Xu5P, xylulose 5-phosphate.
© The Author(s) 2019. Published by Oxford University Press on behalf of the Society for Experimental Biology.
This is an Open Access article distributed under the terms of the Creative Commons Attribution License (http://creativecommons.org/licenses/by/4.0/), which permits unrestricted reuse, distribution, and reproduction in any medium, provided the original work is properly cited.
RESEARCH PAPER
Metabolite profiles reveal interspecific variation in operation of the Calvin–Benson cycle in both C4 and C3 plants
Stéphanie Arrivault1, , Thiago Alexandre Moraes1, , Toshihiro Obata1,*, , David B. Medeiros1, , Alisdair R. Fernie1, , Alix Boulouis1,†, Martha Ludwig2, , John E. Lunn1, , Gian Luca Borghi1, , Armin Schlereth1, , Manuela Guenther1, and Mark Stitt1,‡,
1 Max Planck Institute of Molecular Plant Physiology, Am Muehlenberg 1, D-14476 Potsdam-Golm, Germany2 School of Molecular Sciences, The University of Western Australia, 35 Stirling Hwy, Crawley WA 6009, Australia
* Present address: Department of Biochemistry, Center for Plant Science Innovation, University of Nebraska-Lincoln, 1901 Vine Str, Lincoln, NE 68588, USA.† Present address:Institut de Biologie Physico-Chimique, CNRS - Sorbonne Université, Paris, France.‡ Correspondence: [email protected]
Received 2 October 2018; Editorial decision 22 January 2019; Accepted 29 January 2019
Editor: Christine Raines, University of Essex, UK
Abstract
Low atmospheric CO2 in recent geological time led to the evolution of carbon-concentrating mechanisms (CCMs) such as C4 photosynthesis in >65 terrestrial plant lineages. We know little about the impact of low CO2 on the Calvin–Benson cycle (CBC) in C3 species that did not evolve CCMs, representing >90% of terrestrial plant species. Metabolite profiling provides a top-down strategy to investigate the operational balance in a pathway. We profiled CBC intermediates in a panel of C4 (Zea mays, Setaria viridis, Flaveria bidentis, and F. trinervia) and C3 species (Oryza sativa, Triticium aestivum, Arabidopsis thaliana, Nicotiana tabacum, and Manihot esculenta). Principal component analysis revealed differences between C4 and C3 species that were driven by many metabolites, including lower ribulose 1,5-bisphosphate in C4 species. Strikingly, there was also considerable variation between C3 species. This was partly due to different chlorophyll and protein contents, but mainly to differences in relative levels of metabolites. Correlation analysis indicated that one contributory factor was the balance between fructose-1,6-bisphosphatase, sedoheptulose-1,7-bisphosphatase, phosphoribulokinase, and Rubisco. Our results point to the CBC having experienced different evolutionary trajectories in C3 species since the ancestors of modern plant lineages diverged. They underline the need to understand CBC operation in a wide range of species.
Keywords: C4, C3, Calvin–Benson cycle, interspecies variation, metabolite profiles, photosynthesis.
Introduction
The Calvin–Benson cycle (CBC) evolved ~2 billion years ago (Rasmussen et al., 2008), is the most abundant biochemi-cal pathway on Earth in terms of nitrogen investment (Ellis,
1979; Raven, 2013), and plays a dominant role in the global carbon (C) and O2 cycles. The CBC can be divided into three partial processes; fixation of CO2 (ribulose-1,5-bisphosphate
HeadA=HeadB=HeadA=HeadB/HeadAHeadB=HeadC=HeadB=HeadC/HeadBHeadA=Materials_HeadB=HeadA=Materials_HeadB/HeadAMaterials_HeadB=Materials_HeadC=Materials_HeadB=Materials_HeadC/HeadBExtract2=HeadB=Extract=HeadBExtract2=HeadA=Extract=HeadAExtract3=HeadA=Extract1=HeadAExtract3=HeadB=Extract1=HeadBBList1=SubBList1=BList1=SubBListBList1=SubBList3=BList1=SubBList2SubBList1=SubSubBList3=SubBList1=SubSubBList2SubSubBList3=SubBList=SubSubBList=SubBListSubSubBList2=SubBList=SubSubBList=SubBListSubBList2=BList=SubBList=BListKeywords=Keywords=Keywords_First=KeywordsHeadA=HeadB=HeadA=HeadB/HeadAHeadB=HeadC=HeadB=HeadC/HeadBHeadC=HeadD=HeadC=HeadD/HeadCExtract3=HeadA=Extract1=HeadAREV_HeadA=REV_HeadB=REV_HeadA=REV_HeadB/HeadAREV_HeadB=REV_HeadC=REV_HeadB=REV_HeadC/HeadBREV_HeadC=REV_HeadD=REV_HeadC=REV_HeadD/HeadCREV_Extract3=REV_HeadA=REV_Extract1=REV_HeadAEDI_HeadA=EDI_HeadB=EDI_HeadA=EDI_HeadB/HeadAEDI_HeadB=EDI_HeadC=EDI_HeadB=EDI_HeadC/HeadBEDI_HeadC=EDI_HeadD=EDI_HeadC=EDI_HeadD/HeadCEDI_Extract3=EDI_HeadA=EDI_Extract1=EDI_HeadACORI_HeadA=CORI_HeadB=CORI_HeadA=CORI_HeadB/HeadACORI_HeadB=CORI_HeadC=CORI_HeadB=CORI_HeadC/HeadBCORI_HeadC=CORI_HeadD=CORI_HeadC=CORI_HeadD/HeadCCORI_Extract3=CORI_HeadA=CORI_Extract1=CORI_HeadAERR_HeadA=ERR_HeadB=ERR_HeadA=ERR_HeadB/HeadAERR_HeadB=ERR_HeadC=ERR_HeadB=ERR_HeadC/HeadBERR_HeadC=ERR_HeadD=ERR_HeadC=ERR_HeadD/HeadCERR_Extract3=ERR_HeadA=ERR_Extract1=ERR_HeadAEDI_Affiliation_Last=EDI_Affiliation_rLast=EDI_Affiliation=EDI_Affiliation_LastAffiliation_Last=OPI_Affiliation_Last=Affiliation=OPI_AffiliationAffiliation=OPI_Affiliation=Affiliation_Last=OPI_AffiliationCORI_Text_First=CORI_Text=CORI_Text_First=CORI_TextIndBox_Head=Box_AHead=Box_Head=Box_AHead/Head
Dow
nloaded from https://academ
ic.oup.com/jxb/article/70/6/1843/5324484 by guest on 15 February 2022
1844 | Arrivault et al.
carboxylase-oxygenase) RuBisCO into a 3-C compound, 3-phosphoglycerate (3PGA), reduction of 3PGA to triose phosphate (triose-P) using ATP and NADPH from the light reactions, and a series of reactions that use triose-P to regener-ate ribulose 1,5-bisphosphate (RuBP) (von Caemmerer and Farquhar, 1981; Heldt, 2005; Stitt et al., 2010; Adam, 2017). The net gain in C exits the CBC and is converted into end-products. Despite its evolutionary age, the pathway’s structure is essentially unchanged from cyanobacteria to angiosperms.
This conservation of the CBC pathway structure is remark-able. The CBC evolved in a world in which CO2 concentra-tions were very high and O2 concentrations were very low. Over geological time, there has been a dramatic rise in atmos-pheric O2 and decline in atmospheric CO2. This uncovered a side reaction with O2, which competes with CO2 as a substrate for RuBisCO, leading to the formation of 2-phosphoglycolate (2PG) (Lorimer and Andrews, 1973; Lorimer, 1981; Tcherkez et al., 2006). 2PG is recycled via an energetically wasteful pro-cess termed photorespiration that results in the loss of 0.5 CO2 per scavenged molecule of 2PG (Somerville, 2001; Heldt, 2005). In the current atmosphere with 0.04% CO2 and 21% O2, in C3 plants about every fourth reaction is with O2 instead of CO2, leading to a 20–30% decrease in the net rate of pho-tosynthesis (Osmond, 1981; Sharkey, 1988; Long et al., 2006; Betti et al., 2016). This side reaction decreases nitrogen use effi-ciency, because higher amounts of protein must be invested in the photosynthetic apparatus. This includes an especially large investment in RuBisCO, which has a relatively low catalytic rate and represents up to half of leaf protein (Ellis, 1979; Betti et al., 2016). It negatively impacts water use efficiency because a higher internal CO2 concentration is required to support a given net rate of photosynthesis, which in turn requires higher stomatal conductance and higher evaporative water loss (Ort et al., 2015; Betti et al., 2016).
Cyanobacteria and eukaryotic algae possess C-concentrating mechanisms (CCMs) that accumulate CO2 in RuBisCO-containing microstructures, the carboxysome in cyanobacte-ria and the pyrenoid in eukaryotic algae (Badger et al., 1998; Giordano et al., 2005; Kerfeld and Melnicki, 2016; Raven et al., 2017). These microstructures were lost in plant lineages that colonized the land. A second type of CCM evolved in ter-restrial plants in the last 30 million years (Sage et al., 2012; Raven et al., 2017), coinciding with the decline of CO2 from ~1000 ppm to <300 ppm during the Oligocene (Christin et al., 2008; Zachos et al., 2008; Edwards et al., 2010). These CCMs are in essence biochemical CO2 pumps, in which bicar-bonate is fixed into 4-C acids that are subsequently decarboxy-lated to generate a high internal CO2 concentration. In C4 plants, bicarbonate is typically captured by phosphenolpyruvate (PEP) carboxylase in mesophyll cells, and 4-C acids diffuse to bundle sheath cells, which are located internally within the leaf and contain RuBisCO and the rest of the CBC (Hatch, 2002; von Caemmerer and Furbank, 2003; Sage et al., 2012; Sage, 2017). There is substantial diversity in the pathway of C4 pho-tosynthesis; for example, which 4-C and 3-C metabolites are involved in the CCM, how the 4-C acid is decarboxylated, and to what extent PSII activity is lost in the bundle sheath chloro-plasts. C4 photosynthesis evolved independently >65 times in
separate lineages among the angiosperms, and C4 species cur-rently represent ~3% of terrestrial plant species and account for 23% of total terrestrial C gain (Still et al., 2003; Sage et al., 2011; Sage, 2017). An analogous biochemical CO2 pump evolved in plants with Crassulacean acid metabolism (CAM); bicarbonate is assimilated in the dark into 4-C acids, which are decarboxy-lated in the light to provide CO2 for the CBC (Shameer et al., 2018). CAM evolved in at least 35 independent lineages and is found in ~6% of current terrestrial plant species (Silvera et al., 2010). Parallel evolution of C4 and CAM in many lineages underlines the strong selective pressure exerted by low CO2 in the recent geological past.
CCMs are complex traits. For example, C4 photosynthe-sis requires major changes in leaf development and anatomy, gene expression patterns, and the location, levels, and proper-ties of hundreds of enzymes and transporters (Sage et al., 2012; Heckmann et al., 2013; Sage, 2017). It is likely that its evolution involved successive steps, including the development of denser venation, modification of the size and functionality of bun-dle sheath cells, and stepwise specialization of metabolism in the bundle sheath and mesophyll cells (McKown and Dengler, 2007; Kocacinar et al., 2008; Nelson, 2011; Sage et al., 2013; Mallmann et al., 2014). This multistep evolutionary trajectory may explain why CCMs evolved in only a relatively small frac-tion of terrestrial plant lineages (Heckmann, 2016).
Low CO2 will have exerted massive selective pressure on the CBC in species that did not evolve a CCM, representing ~90% of existing terrestrial plant species (Silvera et al., 2010; Sage, 2017). Pressure will also have been exerted by other envi-ronmental factors such as water availability, temperature, and nutrient availability (Raven et al., 2017). Indeed, terrestrial C3 plants exhibit substantial variation in photosynthetic rate, with large differences between annuals and perennials, and consider-able differences within these groups (Evans, 1989; Wullschleger, 1993). This includes variation in photosynthetic rate between phylogenetically related species (Galmés et al., 2014b) and within species (Driever et al., 2014). Factors contributing to variation in photosynthetic rate include differences in the rate of electron transport and carboxylation (Wullschleger, 1993), leaf nitrogen content and photosynthetic nitrogen use effi-ciency (Field and Mooney, 1986; Evans, 1989; Hikosaka, 2010), and differing investment strategies in short-lived (deciduous) and long-lived (evergreen) leaves (Wright et al., 2004; Donovan et al., 2011).
We know relatively little about whether there is interspecific variation in the CBC in C3 plants (Lawson et al., 2012). It is well established that RuBisCO kinetics have evolved over a long geological time scale, with selectivity for CO2 rising and cata-lytic rate declining between cyanobacteria and higher plants (Jordan and Ogren, 1981; Badger et al., 1998; Tcherkez et al., 2006; Savir et al., 2010; Sharwood et al., 2016a, b). Intriguingly, there is also variance over shorter evolutionary time scales. RuBisCO kinetics vary between quite closely related C3 spe-cies (Yeoh et al., 1980; Galmés et al., 2014a; Prins et al., 2016). In perennial oak, ecological adaptations have been linked to specific amino acid polymorphisms in RuBisCO (Hermida-Carrera et al., 2017). RuBisCO is inhibited by RuBP and low molecular weight inhibitors that derive from catalytic
Dow
nloaded from https://academ
ic.oup.com/jxb/article/70/6/1843/5324484 by guest on 15 February 2022
Metabolite profiles reveal diversity in the Calvin–Benson cycle | 1845
infidelities of RuBisCO or, like 2-carboxyarabinitol 1-phos-phate, are synthesized by other enzymes (Yeoh et al., 1980; Parry et al., 2008). There is surprising diversity in the levels and dynamics of these low molecular weight inhibitors in different C3 species (Servaites et al., 1986; Moore et al., 1993; Charlet et al., 1997; Parry et al., 2008) and, incidentally, different C4 spe-cies (Carmo-Silva et al., 2010). CP12 is a small regulatory pro-tein that interacts with NADP-glyceraldehyde-3-phosphate dehydrogenase (NADP-GAPDH) and phosphoribulokinase (PRK) (Gontero and Maberly, 2012; López-Calcagno et al., 2014). The action of CP12 varies between C3 species (Howard et al., 2011; López-Calcagno et al., 2014), again pointing to interspecies variation in CBC regulation.
Some of the strongest evidence that the CBC can adapt to selection or relaxation of selection in a relatively short evo-lutionary time comes from studies of C4 species. Compared with C3 species, C4 species contain forms of RuBisCO with a lower affinity for CO2 and faster catalytic turnover (Yeoh et al., 1980; Sage and Seemann, 1993; Kapralov et al., 2011; Galmés et al., 2014b; Sharwood et al., 2016a, b), allowing a substan-tial decrease in RuBisCO abundance (Long, 1999; Ghannoum et al., 2005; Sharwood et al., 2016a, b, c). Such changes are found even within the tribe Paniceae in which C4 photosynthesis evolved recently (Sharwood et al., 2016a).
The operation of a pathway depends on many factors, including the abundance of the participating enzymes, their kinetic properties, and the action of regulatory mechanisms on individual enzymes and sets of enzymes. It is laborious to characterize variation in all these potential factors. Analyses of steady-state metabolite levels provide a top-down strategy to search for variation in pathway operation. This is because changes in enzyme abundance, properties, or regulation will all lead to changes in the relative levels of the metabolic interme-diates in a pathway.
Information about CBC intermediate levels in different C3 species is rather sparse. Most previous studies in C3 plants focused on RuBP (e.g. Sage and Seemann, 1993) or a handful of metabolites such as 3PGA, triose-P, and fructose 1,6-bis-phosphate (FBP), and were restricted to single species (see Stitt et al., 2010 for references). A similar picture holds for C4 plants (Stitt and Heldt, 1985; Usuda, 1987; Leegood and von Caemmerer, 1988, 1989). The reason was partly conceptual, reflecting the idea that photosynthesis is usually limited by the light reactions or RuBisCO (Farquhar et al., 1980). Subsequent work has highlighted that photosynthesis can also be limited by reactions in the remainder of the CBC (see Stitt et al., 2010 for a review), especially sedoheptulose-1,7-bisphosphatase (SBPase) (Raines et al., 2000; Lefebvre et al., 2005; Zhu et al., 2007; Ding et al., 2016; Driever et al., 2017; Simkin et al., 2017). There were also technical reasons; until ~10 years ago it was impossible to quantify many CBC intermediates routinely. This is now possible using HPLC-MS/MS (Cruz et al., 2008; Arrivault et al., 2009; Hasunuma et al., 2010; Ma et al., 2014).
In this study, we have profiled CBC intermediates in four C4 species and five C3 species, representing diverse plant lineages including eudicots and monocots. We used these data to address two questions. The first is whether CBC intermediates display different profiles in C3 and C4 species, as would be expected if
the presence of a CCM allows a different mode of CBC opera-tion. This question provides a check that expected differences in CBC operation can be detected as changes in CBC metabo-lite profiles. In particular, we might expect that the lower abun-dance of RuBisCO (see above) results in lower levels of RuBP. Furthermore, C4 species with dimorphic chloroplasts might have enhanced levels of 3PGA and triose-P to support an intercellular shuttle that transfers energy from the mesophyll to the bundle sheath cells. The second and major question is whether there are interspecific differences between C3 species. This would have important implications for the evolution of the CBC and the need for a better understanding of the pathway in a broader range of C3 species, including many of our major crops.
Materials and methods
ChemicalsCarbon dioxide (13CO2, isotopic purity 99 atom%) was from Campro Scientific GmbH (Berlin, Germany; www.campro.eu), N2, O2, and unla-belled CO2 from Air Liquide (Germany; https://industrie.airliquide.de/), and chemicals were obtained from Sigma-Aldrich (Darmstadt, Germany; www.sigmaaldrich.com), Roche Applied Science (Mannheim, Germany; lifescience.roche.com), or Merck (www.merckmillipore.com).
Plant growth and harvestNine species (of which eight were phylogenetically diverse; Supplementary Fig. S1 at JXB online) were grown as described in Supplementary Table S1. Material was harvested by cutting leaves and quenching them imme-diately in a bath of liquid N2 under growth irradiance, avoiding shading.
Metabolite analysesPlant material was ground to a fine powder by hand in a mortar pre-cooled with liquid N2 or in a cryo-robot (Stitt et al., 2007) and stored at –80 °C. Metabolites were extracted and quantified by LC-MS/MS (Arrivault et al., 2009). All samples were spiked with stable isotope-labelled internal standards for correction of ion suppression and other matrix effects (Arrivault et al., 2015). 3PGA gives a broad, poorly defined peak in LC-MS/MS and was therefore quantified enzymatically (Merlo et al., 1993).
Chlorophyll and proteinChl a and b were extracted and quantified as in Gibon et al. (2002). Protein was extracted from 20 mg FW ground plant material in 750 µl of buffer [0.1 M Tris–HCl, pH 8, 0.2 M NaCl, 5 mM EDTA, 2% (w/v) SDS, 0.2% (v/v) β-mercaptoethanol, and protease inhibitor cocktail (P9599, Sigma, Germany)]. The suspension was mixed well, incubated (30 min, room temperature), re-mixed, centrifuged (10 min, 1500 g, 4 °C), and the supernatant collected. Supernatants were pooled from two or (Oryza sativa and Manihot esculenta) three successive extractions. Protein was quantified colorimetrically with bicinchoninic acid (BCA Protein Assay-Reducing Agent Compatible, Thermo Fisher Scientific, Germany; www.thermofisher.com) with BSA as standard.
Gas exchangeCO2 assimilation was measured using the fourth fully expanded Zea mays leaf or 5-week-old Arabidopsis thaliana rosettes using an open-flow infrared gas exchange analyser system (LI-COR Inc., Lincoln, NE, USA; www.licor.com) equipped with an integrated fluorescence chamber head (LI-6400-40, 2 cm2 leaf chamber for Z. mays; LI-6400-17 whole-plant Arabidopsis chamber for A. thaliana; LI-COR Inc.). CO2 was kept at 400 µmol mol–1, leaf temperature at 29 °C for Z. mays and at 20 °C for A. thaliana, and relative humidity at 65%.
Dow
nloaded from https://academ
ic.oup.com/jxb/article/70/6/1843/5324484 by guest on 15 February 2022
1846 | Arrivault et al.
13CO2 labelling with M. esculentaThe fifth or sixth fully expanded leaf from the top of a 9-week-old plant was labelled (Supplementary Fig. S2A), starting 2 h into the light period. The leaf was placed in the labelling chamber (Supplementary Fig. S2B, C; see Arrivault et al., 2017). Gases were supplied from individual bot-tles and controlled by gas-flow controllers (Brooks instruments; www. brooksinstrument.com). The labelling chamber was initially supplied with 79% N2, 21% O2, and 420 ppm 12CO2. After 1 min, 12CO2 was replaced by 13CO2. Samples were collected after 10, 20, 40, or 60 s, or 2, 5, 10, 30, or 60 min, in random order. Gas flow was 10 l min−1 for pulses of up to 1 min, and 5 l min−1 for longer pulses. Unlabelled samples (t=0) were collected after 1 min in unlabelled gas mixture. The cham-ber was maintained at growth cabinet temperature (28 °C) by circulat-ing water from a water bath. Gases were passed through a humidifier in the water bath after mixing and before entering the measuring cham-ber. Light intensity at the leaf surface was kept as in the growth cabinet (250 µmol m−2 s−1) by supplying additional light (FL-460 Lighting Unit, Walz, Effeltrich, Germany). Material was quenched by dropping a copper rod, pre-cooled in liquid N2, down a hollow tube incorporated in the chamber lid, thereby freeze-clamping a 1.9 cm diameter (~40 mg FW) leaf disc (Supplementary Fig. S2C, D). 13CO2-labelled samples were ana-lysed by LC-MS/MS and GC-MS, and isotopomer distribution (%) and enrichment (%) were calculated as in Arrivault et al. (2017).
Statistical analysesStatistical analysis was performed in R Studio Version 0.99.896 (www.rstudio.com) with R version 3.3.0 (https://cran.r-project.org/) using either Student’s t-test (R default package stats) or an ANOVA (Sums of Squares Type II) followed by the Tukey’s Honest Significant Differences (HSD) post-test (R package agricolae). Details are provided in the figure legends.
Results
Metabolite levels at growth irradiance
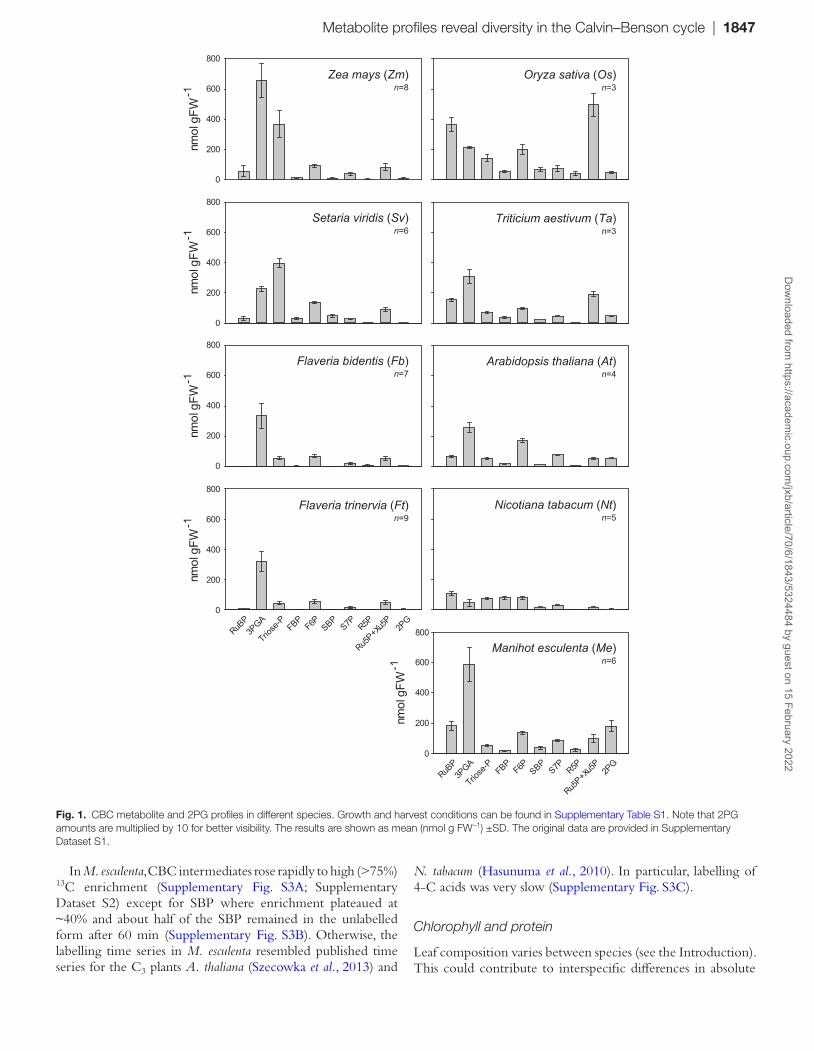
We profiled CBC metabolites in four C4 species from the NADP-malic enzyme subtype including two monocots (Zea mays and Setaria viridis) and two eudicots (Flaveria bidentis and F. trinervia), and five C3 species including two monocots (Oryza sativa, Triticium aestivum) and three eudicots (Arabidopsis thaliana, Nicotiana tabacum, and Manihot esculenta). Each species was grown with non-saturating irradiance (range of 60–133% of that required for half-maximal rates of photosynthesis) and appropriate temperature for rapid, healthy growth, and harvested under growth irradiance at least 2 h after the beginning of the light period (for details, see Supplementary Table S1). CBC inter-mediates and 2PG levels were determined by LC-MS/MS, using isotope-labelled internal standards to obtain reliable quantifica-tion, or enzymatically (3PGA). The signals for ribulose-5-phos-phate (Ru5P) and xylulose-5-phosphate (Xu5P) overlapped, so they were combined (‘Ru5P+Xu5P’). Otherwise, we were able to quantify all CBC intermediates except 1,3-bisphosphoglyc-erate, glyceraldehyde 3-phosphate, and erythrose 4-phosphate. Metabolites were initially normalized on FW.
CBC metabolite levels varied greatly between species (Fig. 1; Supplementary Dataset S1). This involved differences in the absolute and the relative levels of metabolites. Some of the observed changes were expected, for example the low levels of 2PG in C4 compared with C3 species, reflecting the lower rate of photorespiration in the C4 plants (note, 2PG amounts are
multiplied by 10 for better visualization in Fig. 1). RuBP levels were lower in C4 compared with C3 species, probably reflect-ing lower abundance of RuBisCO in C4 plants. However, other interspecies differences were unexpected, in particular the rather diverse profiles in the five C3 species. Features that varied between the C3 species included the absolute levels of individual metabolites such as 3PGA, triose-P, Ru5P+Xu5P, the level of RuBP compared with metabolites involved in RuBP regeneration, and the relative levels of metabo-lite pairs, for example FBP and fructose 6-phosphate (F6P) or sedoheptulose 1,7-bisphosphate (SBP) and sedoheptulose 7-phosphate (S7P).
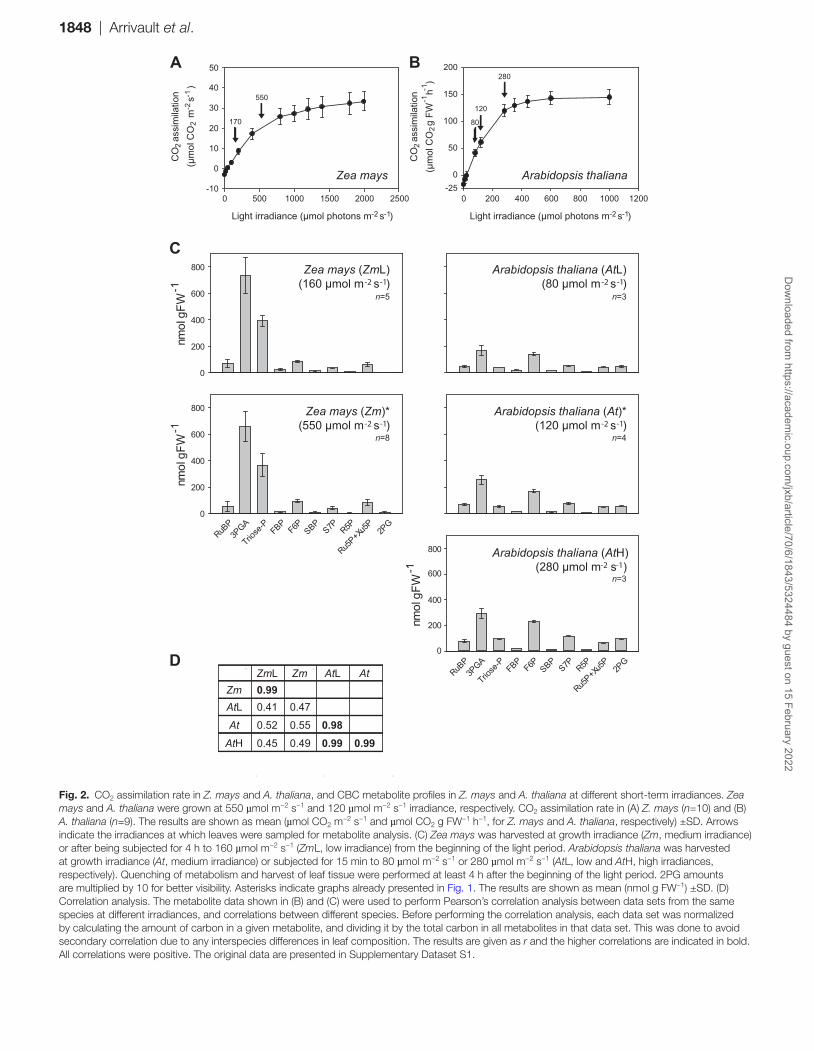
Metabolite levels in Z. mays and A. thaliana at different irradiances
One potential complication of a cross-species comparison is that each species has a different light saturation response, making it difficult to standardize growth and harvest con-ditions across species. We grew and harvested all species at moderate and limiting irradiance, using lower irradiance for species whose photosynthesis saturates at lower light intensi-ties (Supplementary Table S1). In addition, for Z. mays and A. thaliana, we asked whether short-term changes in irradiance lead to major changes in the metabolite profile, using an addi-tional lower irradiance for Z. mays (Fig. 2A, covering the range from 40% to 133% of that required for half-maximal rates of photosynthesis), and a lower and a higher near-saturating irra-diance for A. thaliana (Fig. 2B, covering the range from 67% to 233% of that required for half-maximal rates of photosynthe-sis). The metabolite profiles were not greatly altered for either species (Fig. 2C), except that higher irradiance tended to lead to a general increase in metabolite levels. Metabolite levels in a given species were strongly correlated irrespective of irradi-ance (r>0.98), whereas metabolite levels were poorly corre-lated between species (Fig. 2D).
Participation of pools in photosynthesis
Our approach assumes that the investigated metabolites are predominantly involved in the CBC. If they are also involved in another pathway, the total content will not provide reli-able information about the size of the CBC pool. Published 13C labelling kinetics validate this assumption for N. tabacum, A. thaliana, and Z. mays (Hasunuma et al., 2010; Szecowka et al., 2013; Arrivault et al., 2017); after pulsing with 13CO2, all of the CBC metabolites showed a rapid rise in 13C enrich-ment to reach a final value of ≥80%. One exception was SBP in maize, where 13C enrichment plateaued at ~14%. We per-formed analogous 13CO2 labelling experiments for M. esculenta which, like Z. mays, is a subtropical species adapted to high-light conditions. We also chose M. esculenta because it has been suggested to be a C4 or C3–C4 intermediate species (Cock et al., 1987; El-Sharkawy and Cock, 1987). A subsequent study showed that M. esculenta performs C3 photosynthesis (Edwards et al., 1990; see also De Souza et al., 2017; De Souza and Long, 2018). Time-resolved 13CO2 labelling would provide a further test that M. esculenta is a C3 species
Dow
nloaded from https://academ
ic.oup.com/jxb/article/70/6/1843/5324484 by guest on 15 February 2022
Metabolite profiles reveal diversity in the Calvin–Benson cycle | 1847
In M. esculenta, CBC intermediates rose rapidly to high (>75%) 13C enrichment (Supplementary Fig. S3A; Supplementary Dataset S2) except for SBP where enrichment plateaued at ~40% and about half of the SBP remained in the unlabelled form after 60 min (Supplementary Fig. S3B). Otherwise, the labelling time series in M. esculenta resembled published time series for the C3 plants A. thaliana (Szecowka et al., 2013) and
N. tabacum (Hasunuma et al., 2010). In particular, labelling of 4-C acids was very slow (Supplementary Fig. S3C).
Chlorophyll and protein
Leaf composition varies between species (see the Introduction). This could contribute to interspecific differences in absolute
nmol
gFW
-1
RuBP
3PGA
Triose
-P FBPF6P SBP
S7P R5P
Ru5P+X
u5P
2PG
Zea mays (Zm)
Setaria viridis (Sv)
Flaveria bidentis (Fb)
Flaveria trinervia (Ft)
nmol
gFW
-1nm
ol g
FW-1
nmol
gFW
-1
nmol
gFW
-1
RuBP
3PGA
Triose
-P FBPF6P SBP
S7P R5P
Ru5P+X
u5P
2PG
0
200
400
600
800
0
200
400
600
800
0
200
400
600
800
0
200
400
600
800
0
200
400
600
800
n=8
Arabidopsis thaliana (At)n=4
n=6
n=7
Manihot esculenta (Me)n=6
n=9
Triticium aestivum (Ta)n=3
Nicotiana tabacum (Nt)n=5
Oryza sativa (Os)n=3
Fig. 1. CBC metabolite and 2PG profiles in different species. Growth and harvest conditions can be found in Supplementary Table S1. Note that 2PG amounts are multiplied by 10 for better visibility. The results are shown as mean (nmol g FW−1) ±SD. The original data are provided in Supplementary Dataset S1.
Dow
nloaded from https://academ
ic.oup.com/jxb/article/70/6/1843/5324484 by guest on 15 February 2022
1848 | Arrivault et al.
0
200
400
600
800
nmol
gFW
-1
RuBP
3PGA
FBPF6P SBP
S7P R5P
Ru5P+X
u5P
2PG
n=3
n=4
n=3
Triose
-P
(80 µmol m s )-2 -1Arabidopsis thaliana (AtL)
(120 µmol m s )-2 -1Arabidopsis thaliana (At)*
(280 µmol m s )-2 -1Arabidopsis thaliana (AtH)
(µm
ol C
O g
FW
h
)-1-1
CO
ass
imila
tion
2
2
Light irradiance (µmol photons m s )-2 -1
BA
RuBP
Triose
-P FBPF6P SBP
S7P R5P
Ru5P+X
u5P
2PG
nmol
gFW
-1
0
200
400
600
800
nmol
gFW
-1
0
200
400
600
800
n=5
n=8
3PGA
(160 µmol m s )-2 -1Zea mays (ZmL)
(550 µmol m s )-2 -1Zea mays (Zm)*
C
Arabidopsis thaliana
0 200 400 600 800 1000 1200-25
0
50
100
150
200
0 500 1000 1500 2000 2500-10
0
10
20
30
40
50
(µm
ol C
O
m
s )-1
-2C
O a
ssim
ilatio
n
2
2
Light irradiance (µmol photons m s )-2 -1
Zea mays
280
550
80
120
170
D
AtHAt
AtLZm
AtAtLZmZmL0.990.410.520.45
0.470.550.49
0.980.99 0.99
Fig. 2. CO2 assimilation rate in Z. mays and A. thaliana, and CBC metabolite profiles in Z. mays and A. thaliana at different short-term irradiances. Zea mays and A. thaliana were grown at 550 µmol m−2 s−1 and 120 µmol m−2 s−1 irradiance, respectively. CO2 assimilation rate in (A) Z. mays (n=10) and (B) A. thaliana (n=9). The results are shown as mean (µmol CO2 m−2 s−1 and µmol CO2 g FW−1 h−1, for Z. mays and A. thaliana, respectively) ±SD. Arrows indicate the irradiances at which leaves were sampled for metabolite analysis. (C) Zea mays was harvested at growth irradiance (Zm, medium irradiance) or after being subjected for 4 h to 160 µmol m−2 s−1 (ZmL, low irradiance) from the beginning of the light period. Arabidopsis thaliana was harvested at growth irradiance (At, medium irradiance) or subjected for 15 min to 80 µmol m−2 s−1 or 280 µmol m−2 s−1 (AtL, low and AtH, high irradiances, respectively). Quenching of metabolism and harvest of leaf tissue were performed at least 4 h after the beginning of the light period. 2PG amounts are multiplied by 10 for better visibility. Asterisks indicate graphs already presented in Fig. 1. The results are shown as mean (nmol g FW−1) ±SD. (D) Correlation analysis. The metabolite data shown in (B) and (C) were used to perform Pearson’s correlation analysis between data sets from the same species at different irradiances, and correlations between different species. Before performing the correlation analysis, each data set was normalized by calculating the amount of carbon in a given metabolite, and dividing it by the total carbon in all metabolites in that data set. This was done to avoid secondary correlation due to any interspecies differences in leaf composition. The results are given as r and the higher correlations are indicated in bold. All correlations were positive. The original data are presented in Supplementary Dataset S1.
Dow
nloaded from https://academ
ic.oup.com/jxb/article/70/6/1843/5324484 by guest on 15 February 2022

Metabolite profiles reveal diversity in the Calvin–Benson cycle | 1849
metabolite levels; in particular, differences in leaf composition could lead to systematically higher or lower levels of all metab-olites. We therefore determined total chlorophyll and protein contents in the leaf material used for metabolite analyses. Total chlorophyll content (Fig. 3A) was similar on a FW basis in all species except for O. sativa and M. esculenta, which had consid-erably higher values. Protein content on a FW basis (Fig. 3B) was similar in all species except for lower values in N. tabacum, and higher values in O. sativa and, especially, M. esculenta. These results partly explain why CBC metabolite levels on a FW basis tended to be low in N. tabacum and high in O. sativa and M. esculenta (Fig. 1).
Principal component analysis
We performed principal component (PC) analyses to provide an integrated overview of the CBC metabolite profiles in the nine species. PC analysis gives information about which sam-ples (here, different species) are closely related or separated, and which variables (here, metabolites) contribute to this rela-tionship. The analysis was performed with z-scored data (i.e. normalizing the individual values of a given variable on the
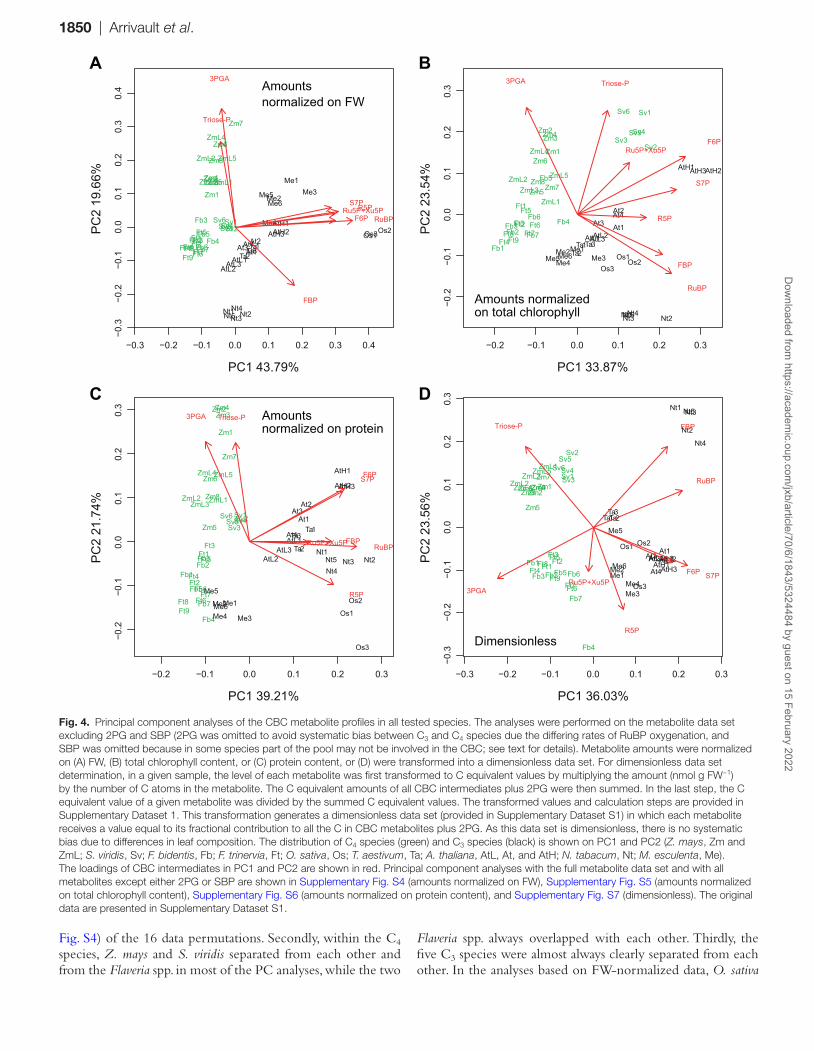
mean value for that variable) to ensure that each metabolite adopted an equally important role in the analysis, independ-ent of its absolute abundance. Each individual sample was included separately in the analysis to provide an overview of the quality of within-species replication. We included the low light maize and the low and high light Arabidopsis samples to further test the impact of prevailing irradiance. In the analy-ses shown in Fig. 4, we omitted 2PG to focus solely on the CBC and exclude effects due to lower photorespiration in C4 plants. We also omitted SBP because of the labelling data (Supplementary Fig. S3; Arrivault et al., 2017) indicating that in some species part of the SBP pool is not involved in the CBC. For comparison, analyses including 2PG and SBP are provided in Supplementary Figs S4–S7.
As previously mentioned, some cross-species variation in metabolite levels may be driven by changes in leaf composition. We therefore performed PC analyses on data sets in which the metabolites were normalized on FW (Fig. 4A; Supplementary Fig. S4), total chlorophyll content (Fig. 4B; Supplementary Fig. S5), or protein content (Fig. 4C; Supplementary Fig. S6). We also performed PC analysis on a dimensionless data set in which, for a given species, the amount of C in a given metabo-lite was divided by the total amount of C in all CBC inter-mediates plus 2PG (Fig. 4D; Supplementary Fig. S7). In total, we performed 16 PC analyses with different metabolite data sets and normalizations. In interpreting the plots, we focused on features that were seen in all or the vast majority of these analyses.
In analyses with the FW-, chlorophyll-, and protein-normal-ized data sets and the dimensionless data set, PC1 accounted for 44–46, 33–35, 34–36, and 39–40%, respectively, of the total variance, while PC2 accounted for 17–20, 20–23, 21–22, and 19–22%, respectively (Fig. 4A–C; Supplementary Figs S4–S6). In all cases, replicates for a given species grouped together, showing that within-species variance was smaller than inter-species differences. This included samples harvested at low and ambient light intensities for Z. mays and for A. thaliana. The A. thaliana samples collected at high light grouped separately from the other A. thaliana samples, but well removed from the other species in PC analyses with the FW-, chlorophyll-, and protein-normalized data sets. In PC analyses with the dimensionless data set, A. thaliana samples from all three light intensities grouped together (Fig. 4D; Supplementary Fig. S7), showing that increasing light intensity led mainly to a general increase in metabolite levels rather than to changes in their relative levels.
Inspection of the species distribution in the PC plots leads to three main conclusions. First, the PC analyses almost always separated C4 species from C3 species; this holds irrespective of how the metabolite data are normalized, and whether 2PG and SBP were excluded (Fig. 4) or included (Supplementary Figs S4–S7). Manihot esculenta showed a slight overlap with the Flaveria spp. in the analyses using metabolites minus SBP and 2PG, when the data set was normalized on protein (Fig. 4C), but was fully separated from all of the C4 species in the 15 other PC analyses. A. thaliana in low light showed a slight overlap with Z. mays or S. viridis in two (all metabolites normalized on FW, metabolites minus SBP normalized on FW; Supplementary
0
1
2
3
4
5
ZmLZm Sv Fb Ft Os Ta AtL At AtH Nt Me
mg
gFW
-1
Total chlorophyll
mg
gFW
-1
ZmLZm Sv Fb Ft Os Ta AtL At AtH Nt Me0
20
40
60
80
100
120
140
Protein
A
B
Fig. 3. Total chlorophyll (A) and protein (B) content in different species. Measurements were performed in Z. mays at low and medium irradiance (ZmL and Zm, respectively), S. viridis (Sv), F. bidentis (Fb), F. trinervia (Ft), O. sativa (Os), T. aestivum (Ta), and A. thaliana at low, medium, and high irradiance (AtL, At, and AtH, respectively), N. tabacum (Nt) and M. esculenta (Me). Growth and harvest conditions can be found in Supplementary Table S1. The results are shown as mean (mg g FW−1) ±SD. The original data are presented in Supplementary Dataset S1.
Dow
nloaded from https://academ
ic.oup.com/jxb/article/70/6/1843/5324484 by guest on 15 February 2022
1850 | Arrivault et al.
Fig. S4) of the 16 data permutations. Secondly, within the C4 species, Z. mays and S. viridis separated from each other and from the Flaveria spp. in most of the PC analyses, while the two
Flaveria spp. always overlapped with each other. Thirdly, the five C3 species were almost always clearly separated from each other. In the analyses based on FW-normalized data, O. sativa
−0.3 −0.2 −0.1 0.0 0.1 0.2 0.3 0.4
−0.3
−0.2
−0.1
0.0
0.1
0.2
0.3
0.4
PC1 43.79%
PC2
19.6
6% ZmL1
ZmL2
ZmL3
ZmL4
ZmL5
Zm1
Zm2Zm3Zm4Zm5
Zm6
Zm7
Zm8
Fb1Fb2
Fb3
Fb4Fb5
Fb6Fb7Ft1Ft2Ft3
Ft4
Ft5
Ft6Ft7Ft8Ft9
Sv1Sv2Sv3Sv4Sv5
Sv6
AtL1AtL2AtL3
At1At2
At3At4
AtH1AtH2AtH3 Os1
Os2Os3Ta1
Ta2Ta3
Nt1 Nt2Nt3Nt4
Nt5
Me1
Me2Me3
Me4
Me5Me6
3PGA
FBP
F6P
S7PR5PRu5P+Xu5PRuBP
Amounts
−0.2 −0.1 0.0 0.1 0.2 0.3
−0.2
−0.1
0.0
0.1
0.2
0.3
PC1 33.87%
PC2
23.5
4%
ZmL1
ZmL2ZmL3
ZmL4
ZmL5
Zm1
Zm2Zm3Zm4
Zm5
Zm6
Zm7Zm8
Fb1
Fb2Fb3 Fb4
Fb5
Fb6
Fb7
Ft1
Ft2Ft3
Ft4
Ft5
Ft6Ft7Ft8
Ft9
Sv1
Sv2Sv3
Sv4Sv5
Sv6
AtL1AtL2AtL3At1
At2At3
At4
AtH1 AtH2AtH3
Os1Os2
Os3
Ta1Ta2
Ta3
Nt1 Nt2Nt3Nt4Nt5
Me1Me2Me3Me4Me5Me6
3PGA
FBP
F6P
S7P
R5P
Ru5P+Xu5P
RuBP
on total chlorophyll
−0.2 −0.1 0.0 0.1 0.2 0.3
−0.2
−0.1
0.0
0.1
0.2
0.3
PC1 39.21%
PC2
21.7
4% ZmL1ZmL2ZmL3
ZmL4ZmL5
Zm1
Zm2Zm3Zm4
Zm5
Zm6
Zm7
Zm8
Fb1Fb2Fb3
Fb4
Fb5Fb6
Fb7
Ft1
Ft2
Ft3
Ft4
Ft5
Ft6Ft7
Ft8Ft9
Sv1Sv2Sv3
Sv4Sv5Sv6
AtL1
AtL2AtL3
At1
At2At3
At4
AtH1
AtH2AtH3
Os1
Os2
Os3
Ta1
Ta2
Ta3
Nt1Nt2Nt3
Nt4Nt5
Me1Me2
Me3Me4
Me5
Me6
3PGA
FBP
F6PS7P
R5P
Ru5P+Xu5P RuBP
A B
C
Triose-P
Triose-P
Triose-P
−0.3 −0.2 −0.1 0.0 0.1 0.2 0.3
−0.3
−0.2
−0.1
0.0
0.1
0.2
0.3
PC1 36.03%
PC2
23.5
6%
ZmL1
ZmL2ZmL3
ZmL4
ZmL5
Zm1Zm2Zm3Zm4
Zm5
Zm6Zm7
Zm8
Fb1Fb2Fb3
Fb4
Fb5Fb6
Fb7
Ft1Ft2
Ft3
Ft4
Ft5
Ft6Ft7
Ft8
Ft9
Sv1
Sv2
Sv3Sv4
Sv5Sv6
AtL1AtL2AtL3At1
At2At3
At4AtH1
AtH2AtH3
Os1 Os2
Os3
Ta1Ta2Ta3
Nt1
Nt2
Nt3
Nt4
Nt5
Me1Me2
Me3Me4
Me5
Me6
3PGA
FBP
F6P S7P
R5P
Ru5P+Xu5P
RuBP
Dimensionless
Triose-P
D
Amounts normalized
normalized on proteinAmounts
normalized on FW
Fig. 4. Principal component analyses of the CBC metabolite profiles in all tested species. The analyses were performed on the metabolite data set excluding 2PG and SBP (2PG was omitted to avoid systematic bias between C3 and C4 species due the differing rates of RuBP oxygenation, and SBP was omitted because in some species part of the pool may not be involved in the CBC; see text for details). Metabolite amounts were normalized on (A) FW, (B) total chlorophyll content, or (C) protein content, or (D) were transformed into a dimensionless data set. For dimensionless data set determination, in a given sample, the level of each metabolite was first transformed to C equivalent values by multiplying the amount (nmol g FW−1) by the number of C atoms in the metabolite. The C equivalent amounts of all CBC intermediates plus 2PG were then summed. In the last step, the C equivalent value of a given metabolite was divided by the summed C equivalent values. The transformed values and calculation steps are provided in Supplementary Dataset 1. This transformation generates a dimensionless data set (provided in Supplementary Dataset S1) in which each metabolite receives a value equal to its fractional contribution to all the C in CBC metabolites plus 2PG. As this data set is dimensionless, there is no systematic bias due to differences in leaf composition. The distribution of C4 species (green) and C3 species (black) is shown on PC1 and PC2 (Z. mays, Zm and ZmL; S. viridis, Sv; F. bidentis, Fb; F. trinervia, Ft; O. sativa, Os; T. aestivum, Ta; A. thaliana, AtL, At, and AtH; N. tabacum, Nt; M. esculenta, Me). The loadings of CBC intermediates in PC1 and PC2 are shown in red. Principal component analyses with the full metabolite data set and with all metabolites except either 2PG or SBP are shown in Supplementary Fig. S4 (amounts normalized on FW), Supplementary Fig. S5 (amounts normalized on total chlorophyll content), Supplementary Fig. S6 (amounts normalized on protein content), and Supplementary Fig. S7 (dimensionless). The original data are presented in Supplementary Dataset S1.
Dow
nloaded from https://academ
ic.oup.com/jxb/article/70/6/1843/5324484 by guest on 15 February 2022
Metabolite profiles reveal diversity in the Calvin–Benson cycle | 1851
and M. esculenta separated strongly from other C3 species in PC1 (Fig. 4A; Supplementary Fig. S4). This was less marked in the PC analysis based on chlorophyll- or protein-normalized data (Fig. 4B, C; Supplementary Figs S5, S6), indicating that the strong separation in the analysis with FW-normalized data is partly driven by secondary effects due to leaf composition. Similarly, N. tabacum was less strongly separated from the other four C3 species in the PC analysis with protein-normalized data than with FW- or chlorophyll-normalized data. Despite these small shifts in the relationships, the five C3 species still separated from each other in the PC analyses with the chlo-rophyll- and protein-normalized data sets, as well as with the dimensionless data set (Fig. 4D; Supplementary Fig. S7).
The metabolite loadings (Fig. 4; Supplementary Figs S4–S7) reveal that the separation of C4 from C3 species was driven not only by lower levels of RuBP and (when included) 2PG, but also by other CBC metabolites. 3PGA and triose-P con-tributed to the separation of the C4 species Z. mays and S. vir-idis from F. trinervia and F. bidentis (see the Discussion). Almost every metabolite contributed to the separation between the five C3 species, with large contributions from RuBP, FBP, F6P, S7P, ribose 5-phosphate (R5P), triose-P, and 3PGA.
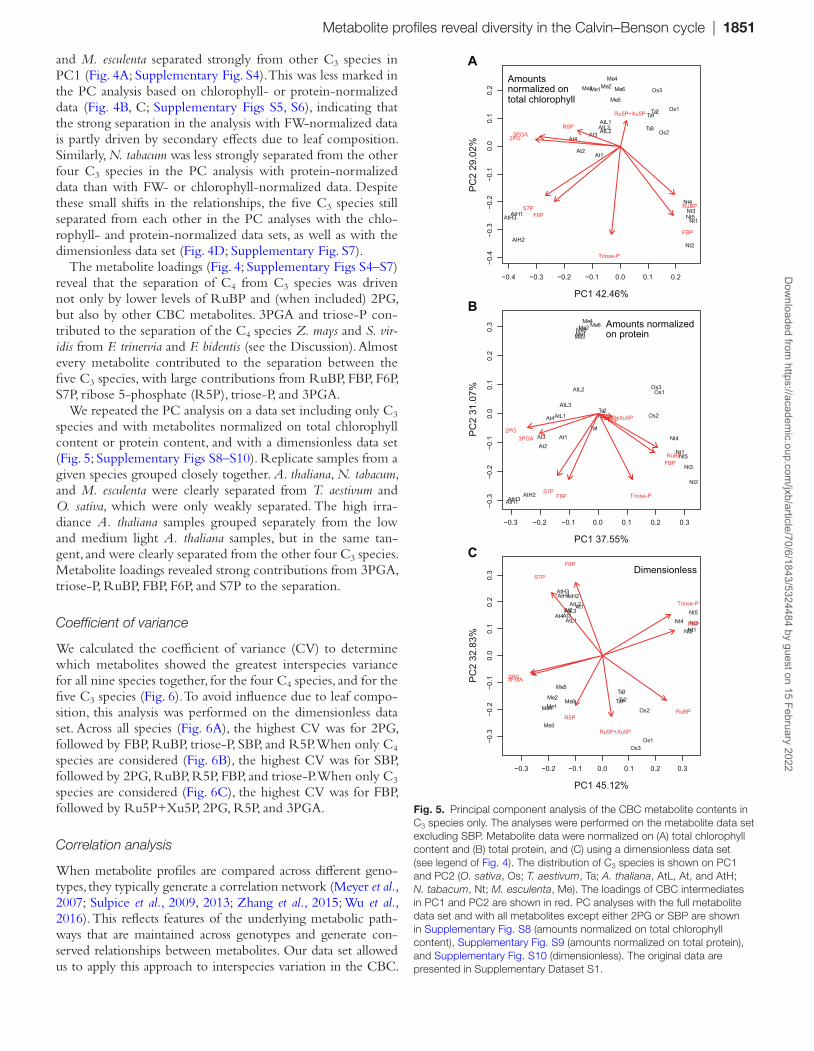
We repeated the PC analysis on a data set including only C3 species and with metabolites normalized on total chlorophyll content or protein content, and with a dimensionless data set (Fig. 5; Supplementary Figs S8–S10). Replicate samples from a given species grouped closely together. A. thaliana, N. tabacum, and M. esculenta were clearly separated from T. aestivum and O. sativa, which were only weakly separated. The high irra-diance A. thaliana samples grouped separately from the low and medium light A. thaliana samples, but in the same tan-gent, and were clearly separated from the other four C3 species. Metabolite loadings revealed strong contributions from 3PGA, triose-P, RuBP, FBP, F6P, and S7P to the separation.
Coefficient of variance
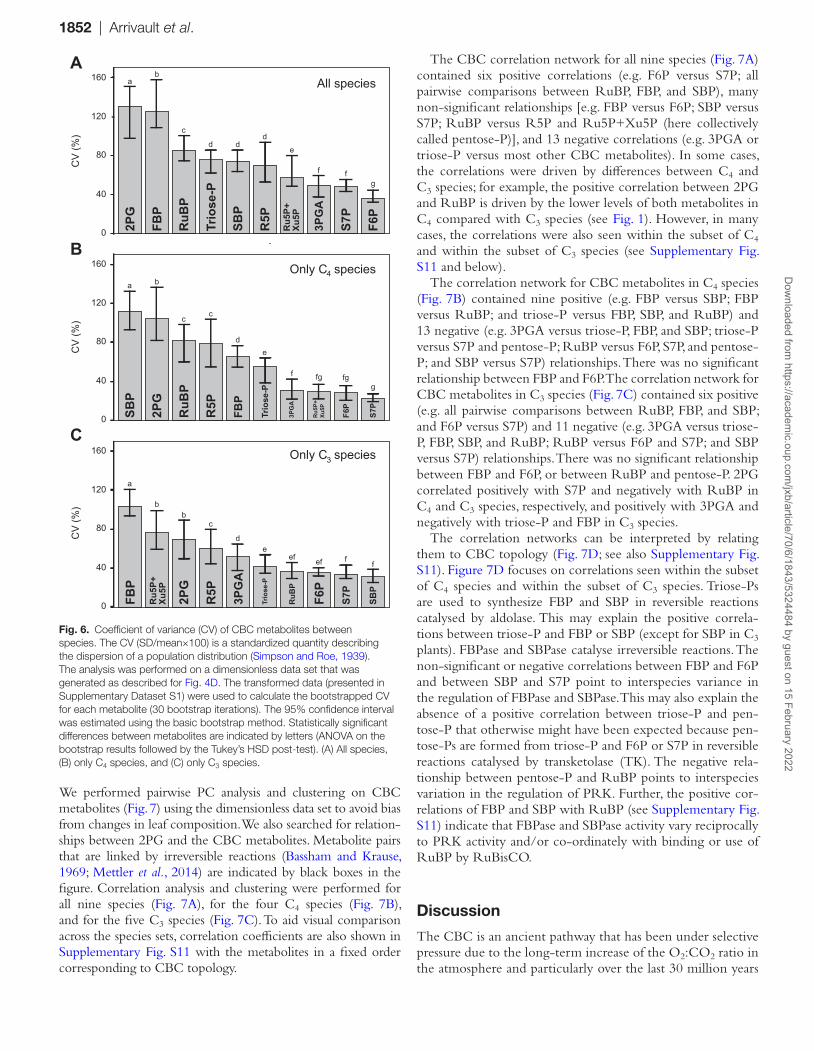
We calculated the coefficient of variance (CV) to determine which metabolites showed the greatest interspecies variance for all nine species together, for the four C4 species, and for the five C3 species (Fig. 6). To avoid influence due to leaf compo-sition, this analysis was performed on the dimensionless data set. Across all species (Fig. 6A), the highest CV was for 2PG, followed by FBP, RuBP, triose-P, SBP, and R5P. When only C4 species are considered (Fig. 6B), the highest CV was for SBP, followed by 2PG, RuBP, R5P, FBP, and triose-P. When only C3 species are considered (Fig. 6C), the highest CV was for FBP, followed by Ru5P+Xu5P, 2PG, R5P, and 3PGA.
Correlation analysis
When metabolite profiles are compared across different geno-types, they typically generate a correlation network (Meyer et al., 2007; Sulpice et al., 2009, 2013; Zhang et al., 2015; Wu et al., 2016). This reflects features of the underlying metabolic path-ways that are maintained across genotypes and generate con-served relationships between metabolites. Our data set allowed us to apply this approach to interspecies variation in the CBC.
−0.4 −0.3 −0.2 −0.1 0.0 0.1 0.2
−0.4
−0.3
−0.2
−0.1
0.0
0.1
0.2
PC1 42.46%
PC2
29.0
2%
AtL1AtL2AtL3
At1At2
At3At4
AtH1
AtH2
AtH3
Os1
Os2
Os3
Ta1Ta2
Ta3
Nt1
Nt2
Nt3Nt4
Nt5
Me1Me2Me3Me4
Me5
Me6
3PGA
FBP
F6PS7P
R5P
Ru5P+Xu5P
RuBP
2PG
Triose-P
normalized on Amounts
−0.3 −0.2 −0.1 0.0 0.1 0.2 0.3
−0.3
−0.2
−0.1
0.0
0.1
0.2
0.3
PC1 37.55%
PC2
31.0
7%
AtL1
AtL2
AtL3
At1At2
At3
At4
AtH1AtH2
AtH3
Os1
Os2
Os3
Ta1
Ta2Ta3
Nt1
Nt2
Nt3
Nt4
Nt5
Me1Me2
Me3
Me4Me5
Me6
3PGA
FBP
F6PS7P
R5PRu5P+Xu5P
RuBP
2PG
Triose-P
on proteinAmounts normalized
A
B
CDimensionless
−0.3 −0.2 −0.1 0.0 0.1 0.2 0.3
−0.3
−0.2
−0.1
0.0
0.1
0.2
0.3
PC1 45.12%
PC2
32.8
3%
AtL1
AtL2AtL3
At1At2At3At4
AtH1AtH2AtH3
Os1
Os2
Os3
Ta1Ta2Ta3
Nt1Nt2Nt3Nt4Nt5
Me1Me2
Me3
Me4
Me5
Me6
3PGA
FBP
F6P
S7P
R5P
Ru5P+Xu5P
RuBP
2PG
Triose-P
total chlorophyll
Fig. 5. Principal component analysis of the CBC metabolite contents in C3 species only. The analyses were performed on the metabolite data set excluding SBP. Metabolite data were normalized on (A) total chlorophyll content and (B) total protein, and (C) using a dimensionless data set (see legend of Fig. 4). The distribution of C3 species is shown on PC1 and PC2 (O. sativa, Os; T. aestivum, Ta; A. thaliana, AtL, At, and AtH; N. tabacum, Nt; M. esculenta, Me). The loadings of CBC intermediates in PC1 and PC2 are shown in red. PC analyses with the full metabolite data set and with all metabolites except either 2PG or SBP are shown in Supplementary Fig. S8 (amounts normalized on total chlorophyll content), Supplementary Fig. S9 (amounts normalized on total protein), and Supplementary Fig. S10 (dimensionless). The original data are presented in Supplementary Dataset S1.
Dow
nloaded from https://academ
ic.oup.com/jxb/article/70/6/1843/5324484 by guest on 15 February 2022
1852 | Arrivault et al.
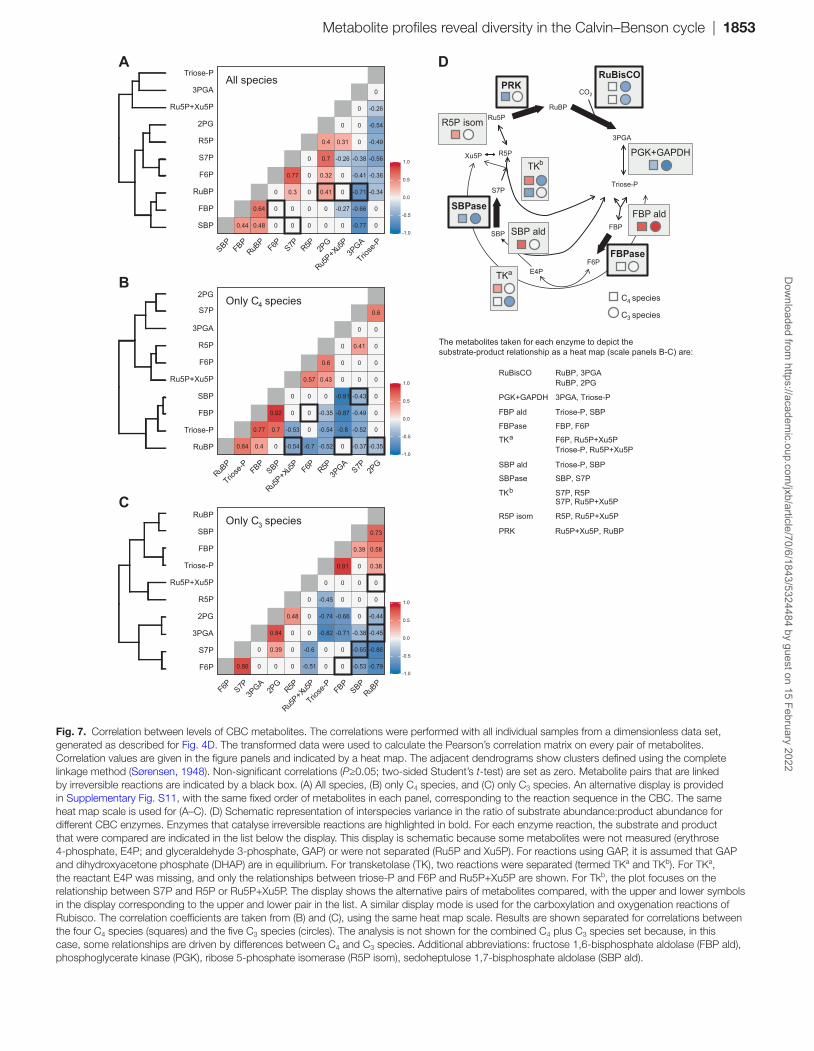
We performed pairwise PC analysis and clustering on CBC metabolites (Fig. 7) using the dimensionless data set to avoid bias from changes in leaf composition. We also searched for relation-ships between 2PG and the CBC metabolites. Metabolite pairs that are linked by irreversible reactions (Bassham and Krause, 1969; Mettler et al., 2014) are indicated by black boxes in the figure. Correlation analysis and clustering were performed for all nine species (Fig. 7A), for the four C4 species (Fig. 7B), and for the five C3 species (Fig. 7C). To aid visual comparison across the species sets, correlation coefficients are also shown in Supplementary Fig. S11 with the metabolites in a fixed order corresponding to CBC topology.
The CBC correlation network for all nine species (Fig. 7A) contained six positive correlations (e.g. F6P versus S7P; all pairwise comparisons between RuBP, FBP, and SBP), many non-significant relationships [e.g. FBP versus F6P; SBP versus S7P; RuBP versus R5P and Ru5P+Xu5P (here collectively called pentose-P)], and 13 negative correlations (e.g. 3PGA or triose-P versus most other CBC metabolites). In some cases, the correlations were driven by differences between C4 and C3 species; for example, the positive correlation between 2PG and RuBP is driven by the lower levels of both metabolites in C4 compared with C3 species (see Fig. 1). However, in many cases, the correlations were also seen within the subset of C4 and within the subset of C3 species (see Supplementary Fig. S11 and below).
The correlation network for CBC metabolites in C4 species (Fig. 7B) contained nine positive (e.g. FBP versus SBP; FBP versus RuBP; and triose-P versus FBP, SBP, and RuBP) and 13 negative (e.g. 3PGA versus triose-P, FBP, and SBP; triose-P versus S7P and pentose-P; RuBP versus F6P, S7P, and pentose-P; and SBP versus S7P) relationships. There was no significant relationship between FBP and F6P. The correlation network for CBC metabolites in C3 species (Fig. 7C) contained six positive (e.g. all pairwise comparisons between RuBP, FBP, and SBP; and F6P versus S7P) and 11 negative (e.g. 3PGA versus triose-P, FBP, SBP, and RuBP; RuBP versus F6P and S7P; and SBP versus S7P) relationships. There was no significant relationship between FBP and F6P, or between RuBP and pentose-P. 2PG correlated positively with S7P and negatively with RuBP in C4 and C3 species, respectively, and positively with 3PGA and negatively with triose-P and FBP in C3 species.
The correlation networks can be interpreted by relating them to CBC topology (Fig. 7D; see also Supplementary Fig. S11). Figure 7D focuses on correlations seen within the subset of C4 species and within the subset of C3 species. Triose-Ps are used to synthesize FBP and SBP in reversible reactions catalysed by aldolase. This may explain the positive correla-tions between triose-P and FBP or SBP (except for SBP in C3 plants). FBPase and SBPase catalyse irreversible reactions. The non-significant or negative correlations between FBP and F6P and between SBP and S7P point to interspecies variance in the regulation of FBPase and SBPase. This may also explain the absence of a positive correlation between triose-P and pen-tose-P that otherwise might have been expected because pen-tose-Ps are formed from triose-P and F6P or S7P in reversible reactions catalysed by transketolase (TK). The negative rela-tionship between pentose-P and RuBP points to interspecies variation in the regulation of PRK. Further, the positive cor-relations of FBP and SBP with RuBP (see Supplementary Fig. S11) indicate that FBPase and SBPase activity vary reciprocally to PRK activity and/or co-ordinately with binding or use of RuBP by RuBisCO.
Discussion
The CBC is an ancient pathway that has been under selective pressure due to the long-term increase of the O2:CO2 ratio in the atmosphere and particularly over the last 30 million years
CV
(%)
CV
(%)
CV
(%)
A
B
C
Only C4 species
Only C3 species
a
bb
c
ef
d
efeff
fg
a b
c c
de
fg
fg
SBP
RuBP
2PG
R5P
FBP
3PGA
Triose-P
Xu5P
Ru5P+
F6P
S7P
2PG
All speciesab
c
de
f fg
dd
Triose-P
FBP
SBP
RuBP
S7P
F6P
R5P
3PGA
Xu5P
Ru5P+
FBP
2PG
SBP
S7P
Triose-P
F6P
3PGA
R5P
RuBP
Xu5P
Ru5P+
120
80
40
0
160
120
80
40
0
160
120
80
40
0
160
Fig. 6. Coefficient of variance (CV) of CBC metabolites between species. The CV (SD/mean×100) is a standardized quantity describing the dispersion of a population distribution (Simpson and Roe, 1939). The analysis was performed on a dimensionless data set that was generated as described for Fig. 4D. The transformed data (presented in Supplementary Dataset S1) were used to calculate the bootstrapped CV for each metabolite (30 bootstrap iterations). The 95% confidence interval was estimated using the basic bootstrap method. Statistically significant differences between metabolites are indicated by letters (ANOVA on the bootstrap results followed by the Tukey’s HSD post-test). (A) All species, (B) only C4 species, and (C) only C3 species.
Dow
nloaded from https://academ
ic.oup.com/jxb/article/70/6/1843/5324484 by guest on 15 February 2022
Metabolite profiles reveal diversity in the Calvin–Benson cycle | 1853
A
B
C
All species
Only C4 species
Only C3 species
-1.0
-0.5
0.0
0.5
1.0
-1.0
-0.5
0.0
0.5
1.0
R5P
Triose-P
SBP
RuBP
Triose
-P FBPF6P SBP
S7P R5P
Ru5P+X
u5P
2PG
-1.0
-0.5
0.0
0.5
1.0
F6P
S7P
3PGA
Ru5P+Xu5P
FBP
RuBP
3PGA
2PG
R5P
Triose-P
SBP
F6P
S7P
3PGA
Ru5P+Xu5P
FBP
RuBP
2PG
RuBP
Triose
-P FBPF6PSBP
S7PR5P
Ru5P+X
u5P
2PG
3PGA
R5P
Triose-P
SBP
F6P
S7P
3PGA
Ru5P+Xu5P
FBP
RuBP
2PG
RuBP
Triose
-PFBPF6PSBP
S7P R5P
Ru5P+X
u5P
2PG
3PGA
C species
The metabolites taken for each enzyme to depict the substrate-product relationship as a heat map (scale panels B-C) are:
RuBisCO RuBP, 3PGA
PGK+GAPDH 3PGA, Triose-P
FBP ald
FBPase FBP, F6P
Triose-P, Ru5P+Xu5P
SBPase SBP, S7P
R5P isom
PRK
RuBP, 2PG
Triose-P, SBP
TKa F6P, Ru5P+Xu5P
SBP ald Triose-P, SBP
TKbS7P, Ru5P+Xu5PS7P, R5P
R5P, Ru5P+Xu5P
Ru5P+Xu5P, RuBP
RuBP
3PGA
FBP
F6PE4P
Ru5P
R5PXu5P
SBP
S7P
CO2
Triose-P
FBPase
SBPase
PRKRuBisCO
PGK+GAPDH
FBP ald
SBP ald
TK
R5P isom
TK b
a
D
C species
4
3
Fig. 7. Correlation between levels of CBC metabolites. The correlations were performed with all individual samples from a dimensionless data set, generated as described for Fig. 4D. The transformed data were used to calculate the Pearson’s correlation matrix on every pair of metabolites. Correlation values are given in the figure panels and indicated by a heat map. The adjacent dendrograms show clusters defined using the complete linkage method (Sørensen, 1948). Non-significant correlations (P≥0.05; two-sided Student’s t-test) are set as zero. Metabolite pairs that are linked by irreversible reactions are indicated by a black box. (A) All species, (B) only C4 species, and (C) only C3 species. An alternative display is provided in Supplementary Fig. S11, with the same fixed order of metabolites in each panel, corresponding to the reaction sequence in the CBC. The same heat map scale is used for (A–C). (D) Schematic representation of interspecies variance in the ratio of substrate abundance:product abundance for different CBC enzymes. Enzymes that catalyse irreversible reactions are highlighted in bold. For each enzyme reaction, the substrate and product that were compared are indicated in the list below the display. This display is schematic because some metabolites were not measured (erythrose 4-phosphate, E4P; and glyceraldehyde 3-phosphate, GAP) or were not separated (Ru5P and Xu5P). For reactions using GAP, it is assumed that GAP and dihydroxyacetone phosphate (DHAP) are in equilibrium. For transketolase (TK), two reactions were separated (termed TKa and TKb). For TKa, the reactant E4P was missing, and only the relationships between triose-P and F6P and Ru5P+Xu5P are shown. For Tkb, the plot focuses on the relationship between S7P and R5P or Ru5P+Xu5P. The display shows the alternative pairs of metabolites compared, with the upper and lower symbols in the display corresponding to the upper and lower pair in the list. A similar display mode is used for the carboxylation and oxygenation reactions of Rubisco. The correlation coefficients are taken from (B) and (C), using the same heat map scale. Results are shown separated for correlations between the four C4 species (squares) and the five C3 species (circles). The analysis is not shown for the combined C4 plus C3 species set because, in this case, some relationships are driven by differences between C4 and C3 species. Additional abbreviations: fructose 1,6-bisphosphate aldolase (FBP ald), phosphoglycerate kinase (PGK), ribose 5-phosphate isomerase (R5P isom), sedoheptulose 1,7-bisphosphate aldolase (SBP ald).
Dow
nloaded from https://academ
ic.oup.com/jxb/article/70/6/1843/5324484 by guest on 15 February 2022

1854 | Arrivault et al.
due to falling CO2 concentrations, which led to independ-ent evolution of a CCM in >100 terrestrial plant lineages. However, the vast majority of terrestrial species did not evolve a CCM, probably because they were unable to follow the multistep evolutionary trajectory that was required to acquire this complex trait (Sage et al., 2012; Christin and Osborne, 2013; Heckmann et al., 2013). Present-day C3 plants never-theless will have been subject to similar selective pressures to those that drove the evolution of C4 or CAM photosynthe-sis. Indeed, in the absence of a CCM, the selective pressures on the CBC may have been even greater than in plants that did evolve a CCM. In addition to low CO2, it is likely that environmental factors such as irradiance, temperature, and nutrient and water availability exerted more or less selective pressure, depending on the local environment, and leading to different evolutionary trajectories in different populations. While it is well documented that there is large variation in photosynthetic rate between terrestrial species (Evans, 1989; Wullschleger, 1993; Lawson et al., 2012), previous studies of the underlying causes have focused on leaf morphology and composition (Field and Mooney, 1986; Evans, 1989; Hikosaka, 2010; Poorter et al., 2015; Díaz et al., 2016), stomatal con-ductance (Lawson et al., 2012), and the kinetic characteristics of RuBisCO (Yeoh et al., 1980; Jordan and Ogren, 1981; Badger et al., 1998; Tcherkez et al., 2006; Galmés et al., 2014b; Prins et al., 2016; Sharwood et al., 2016a, b). Little is known about whether the CBC operates in a highly conserved man-ner or in different modes in different C3 species.
We have used metabolite profiling as an unbiased strategy to search for interspecific variance in CBC operation. The under-lying assumption is that changes in the balance between differ-ent enzymatic steps will lead to changes in the relative levels of pathway intermediates. This approach is top down, in the sense that it does not make assumptions about whether the observed variance is due to changes in gene expression and protein abundance, enzyme kinetics, or regulatory networks that act on the enzymes. We applied it to search for differences in CBC operation between C4 and C3 plants, and within C3 species. As our aim was to compare CBC operation across species, we focused exclusively on the metabolites that are involved in the CBC plus 2PG, the immediate product of the RuBisCO oxy-genation reaction. We excluded metabolites involved further downstream in photorespiration and metabolites involved in the CO2-concentrating shuttle in C4 plants, which have non-photosynthetic functions in C3 plants.
Our interspecies comparison required important control experiments and cross-checks during data analysis. First, plant species differ in their photosynthetic rate and its dependence on light, temperature, and the availability of water, nutrients, and CO2 (see the Introduction). We grew and harvested plants in a light regime that was limiting for that species, rather than using identical conditions for all species. In these conditions, RuBP regeneration is likely to be limiting, and effects of light stress are avoided. Importantly, we showed for one C4 spe-cies (Z. mays) and one C3 species (A. thaliana) that although increased harvest irradiance led to higher levels of metabolites, it did not strongly alter their relative levels (Fig. 2). Secondly, it is important that the CBC pool accounts for most or all of
the total content of a given metabolite. Analysis of published data for two C3 (N. tabacum and A. thaliana), one C4 (Z. mays) species (Hasunuma et al., 2010; Szecowka et al., 2013; Arrivault et al., 2017), and a new data set for the C3 species M. escu-lenta (Supplementary Fig. S3) showed that CBC intermediates exhibit a rapid rise in 13C enrichment to a high level after supplying 13CO2. This provides evidence that most of the total pool is indeed involved in the CBC. This conclusion is sup-ported by published subcellular fractionation studies, in which most CBC intermediates are exclusively or largely confined to the plastid (Gerhardt et al., 1987; Szecowka et al., 2013). The only exception was SBP, which was only partially labelled in Z. mays and M. esculenta. We do not know whether there is a separate pool of SBP that is not involved in CO2 fixation, or if these plant species contain an unknown metabolite with an identical chromatographic behaviour, mass, and fragmentation pattern to SBP. In our interpretation of the metabolite profiles, we took care that our conclusions did not depend on inclusion of SBP. A third set of controls addressed the issue that leaf com-position varies between species, with the result that absolute values for metabolite content will depend on the unit in which they are given. We analysed metabolite data normalized on FW, chlorophyll, or protein content, and also used a dimensionless data set in which metabolite levels were expressed relative to each other. Our interpretation focused on results that were independent of how the data were normalized. Importantly, inclusion of the dimensionless data set eliminated secondary correlations due to differences in leaf composition, and placed the emphasis on relative rather than absolute levels of metabo-lites. It minimizes contributions from differing light regimes, which had less effect on relative than on absolute metabolite levels (see above).
We included four C4 species in our panel to test if CBC profiles could distinguish between species in which it is known that the CBC operates in a different context from that of C3 plants. The CBC operates at a much higher intercellular CO2 concentration in C4 than in C3 plants, and RuBisCO has a higher affinity for CO2, and an increased catalytic rate in C4 compared with C3 species (see the Introduction). PC analysis confirmed that CBC metabolite profiles allow C4 and C3 spe-cies to be distinguished (Fig. 4; Supplementary Figs S4–S7). As expected, C4 species had lower 2PG and RuBP than C3 species (Fig. 1). However, the separation in the PC analysis was also seen when 2PG was excluded, and was driven by sev-eral other CBC intermediates, pointing to broader changes in CBC operation between C4 and C3 species.
The four C4 species belong to the NADP-malic enzyme C4 subtype. Interestingly, PC analysis separated Z. mays and S. viridis from the two Flaveria spp. Whilst this might reflect a difference between monocots and eudicots, the PC vectors indicated that this separation reflected higher levels of 3PGA and, in particular, triose-P in Z. mays and S. viridis (Fig. 4; Supplementary Figs S4–S7; see also Fig. 1). Most NADP-malic enzyme C4 subtypes, including Z. mays, have dimor-phous chloroplasts with little or no PSII activity in the bundle sheath cells (Munekage, 2016). They operate an intercellular shuttle in which 3PGA moves from the bundle sheath to the mesophyll cells and is reduced to triose-P, which returns to the
Dow
nloaded from https://academ
ic.oup.com/jxb/article/70/6/1843/5324484 by guest on 15 February 2022
Metabolite profiles reveal diversity in the Calvin–Benson cycle | 1855
bundle sheath. Intercellular movement is thought to occur by diffusion (Hatch and Osmond, 1976), driven by concentration gradients that require the build-up of large pools of 3PGA and triose-P in the bundle sheath and mesophyll cells, respec-tively (Leegood, 1985; Stitt and Heldt, 1985; Arrivault et al., 2017). Flaveria bidentis and F. trinervia can have PSII activity in the bundle sheath chloroplasts, although to a varying extent depending on conditions (Laetsch and Price, 1969; Höfer et al., 1992; Meister et al., 1996; Nakamura et al., 2013). Their separa-tion in the PC analysis from Z. mays and S. viridis might reflect decreased reliance on this intercellular shuttle.
Our panel included five C3 species, two monocots (O. sativa and T. aestivum) and three eudicots (A. thaliana, N. tabacum, and M. esculenta), with the individual species representing different phylogenetic lineages (Supplementary Fig. S1) and originating in differing climatic zones. The three C3 eudicot species rep-resent two of the major lineages within the eudicots, namely the asterids (N. tabacum) and rosids (A. thaliana and M. escu-lenta), that contain 41% and 24% of all angiosperms, respec-tively. There was considerable interspecies variation in CBC metabolite profiles. This was evident from visual inspection of the metabolite levels (Fig. 1) and was confirmed by PC (Figs 4, 5; Supplementary Figs S4–S10) and variance (Fig. 6) analyses.
When metabolites were expressed on a FW basis, some of the variation was due to differences in leaf composition, with a strong trend to higher absolute levels in O. sativa and M. escu-lenta, reflecting their high chlorophyll and protein content. The high protein content in O. sativa may be linked to changes in leaf anatomy that enhance mesophyll transfer conductance, including small deeply lobed cells and densely arranged chlo-roplasts and stromules at the cell surface (Sage and Sage, 2009; Busch et al., 2013). This high mesophyll transfer conductance may prevent internal CO2 from being drawn down by the high CBC activity that results from the high protein and metabo-lite content per unit FW in O. sativa. The high protein con-tent in M. esculenta resembles the findings of previous reports (Awoyinka et al., 1995; Nassar and Marques, 2006), and could explain the high rates of photosynthesis in this species.
However, the five C3 species still showed differing CBC metabolite profiles when metabolites were expressed on a chlorophyll or protein basis, or when the analyses were per-formed with a dimensionless data set. Variation was driven by many metabolites including RuBP, 3PGA, triose-P, FBP, F6P, S7P, and Ru5P+Xu5P. This variation points to different oper-ating modes of the CBC in different C3 species. There were also differences in 2PG content; this might be related to the rate of RuBisCO oxygenation or removal of 2PG by 2-phos-phoglycolate phosphatase.
Cross-species correlation analysis (Fig. 7; Supplementary Fig. S11) revealed that in both C4 and C3 species, the inter-species variance often included parallel changes of FBP, SBP, and RuBP, and unrelated or even reciprocal changes of these metabolites to F6P, S7P, and pentose-P. This is consistent with interspecies variation in the balance between FBPase, SBPase, PRK, and RuBisCO activity. It could reflect differences in the abundance or the regulation of these enzymes, both within C3 species and within C4 species, and between C3 and C4 spe-cies. Little is known about the expression, characteristics, and
regulation of CBC enzymes in different species, with (see the Introduction) the exception of RuBisCO.
Our results do not reveal when and under what circum-stances the variation in CBC function in C3 species appeared. It is tempting to link it with the selection pressure that led to the appearance of C4 and CAM photosynthesis, but it is likely to have started even earlier. Further, as pointed out by Zhu et al. (2007), it is possible that different C3 species are following different trajectories during the increase in CO2 levels in very recent evolutionary time. Our results also indicate that there is no strong connection between phylogeny and the diversity in CBC metabolite profiles in C3 species. In the PC analyses (Figs 4, 5; Supplementary Figs S4–S10), the two monocot species are often closely related, but the three eudicot species are highly diverse, and a given eudicot is often more closely related to the monocot species than to the other eudicot species. Unlike changes in genome sequence, complex emergent phenotypes may not accrue in a linear manner, and phylogenetically dis-tinct species may undergo convergent evolution whilst phylo-genetically related species may undergo divergent evolution, depending on the selective pressure they experience. Better understanding of the relationship between diversity in CBC profile, phylogeny, and evolution will require studies both with more phylogenetically diverse species and with more dense sampling in short evolutionary space.
In conclusion, marked differences in CBC metabolite pro-files between five C3 species, including the major crop plants O. sativum, T. aestivum, and M. esculenta, and the important model plants A. thaliana and N. tabacum, reveal interspecies variation in the operating mode of the CBC in C3 plants. This probably reflects independent evolution of CBC regulation in different plant lineages, in analogy to the independent evo-lution of a CCM in different plant lineages. These findings, together with emerging evidence for interspecies variation in the properties of specific CBC enzymes (see the Introduction) and the growing realization that efficient photosynthesis requires integrated operation of the CBC (Stitt et al., 2010; Raines, 2011; Simkin et al., 2017), highlight the need for a mechanistic understanding of CBC regulation in a wider range of species. This will be an important step towards improving C3 photosynthesis and crop productivity.
Supplementary data
Supplementary data are available at JXB online.Fig. S1. Phylogenetic distribution based on APGIII of the
tested plant species.Fig. S2. Experimental set-up for 13CO2 labelling of
M. esculenta.Fig. S3. 13C enrichment (%) of CBC metabolites, relative
abundance (%) of SBP isotopomers, and 13C enrichment (%) of malate, aspartate, pyruvate, and alanine in M. esculenta.
Fig. S4. PC analyses of all species using metabolite data nor-malized on FW (supplementary analyses to Fig. 4A).
Fig. S5. PC analyses on all species using metabolite data nor-malized on total chlorophyll content (supplementary analyses to Fig. 4B).
Dow
nloaded from https://academ
ic.oup.com/jxb/article/70/6/1843/5324484 by guest on 15 February 2022
1856 | Arrivault et al.
Fig. S6. PC analyses on all species using metabolite data nor-malized on protein content (supplementary analyses to Fig. 4C).
Fig. S7. PC analyses on all species using a dimensionless data set (supplementary analyses to Fig. 4D).
Fig. S8. PC analyses on C3 species only, using metabolite data normalized on total chlorophyll content (supplementary analyses to Fig. 5A).
Fig. S9. PC analyses on C3 species only, using metabolite data normalized on protein content (supplementary analyses to Fig. 5B).
Fig. S10. PC analyses on C3 species only, using a dimension-less data set (supplementary analyses to Fig. 5C).
Fig. S11. Correlation between levels of CBC metabolites, with metabolites shown in a fixed order reflecting the reaction sequence in the CBC.
Table S1. Growth conditions and photosynthetic rates.Dataset S1. Metabolite levels, total chlorophyll, and protein
contents in different species.Dataset S2. Labelling kinetics of CBC and other intermedi-
ates after exposing M. esculenta to 13CO2 (supplementary data to Supplementary Fig. S3).
Acknowledgements
This research was supported by the Max Planck Society (TAM, ARF, AB, JEL, AS, MG, and MS), the Bill and Melinda Gates Foundation (CASS to SA and TO; C4 Rice to GLB), the German Ministry of Education and Research (FullThrottle, grant 031B0205A to DBM), CNPq (to TAM), and the Australian Research Council (to ML, JEL, and MS). We thank Christin Abel, Ina Krahnert, and Dr Mark Aurel Schöttler for help with plant growth.
ReferencesAdam NR. 2017. C3 carbon reduction cycle: eLS. Chichester: John Wiley & Sons, Ltd.
Arrivault S, Guenther M, Fry SC, Fuenfgeld MM, Veyel D, Mettler-Altmann T, Stitt M, Lunn JE. 2015. Synthesis and use of stable-isotope-labeled internal standards for quantification of phosphorylated metabolites by LC-MS/MS. Analytical Chemistry 87, 6896–6904.
Arrivault S, Guenther M, Ivakov A, Feil R, Vosloh D, van Dongen JT, Sulpice R, Stitt M. 2009. Use of reverse-phase liquid chromatography, linked to tandem mass spectrometry, to profile the Calvin cycle and other metabolic intermediates in Arabidopsis rosettes at different carbon dioxide concentrations. The Plant Journal 59, 824–839.
Arrivault S, Obata T, Szecówka M, Mengin V, Guenther M, Hoehne M, Fernie AR, Stitt M. 2017. Metabolite pools and carbon flow during C4 photosynthesis in maize: 13CO2 labeling kinetics and cell type fractionation. Journal of Experimental Botany 68, 283–298.
Awoyinka AF, Abegunde VO, Adewusi SR. 1995. Nutrient content of young cassava leaves and assessment of their acceptance as a green veg-etable in Nigeria. Plant Foods for Human Nutrition 47, 21–28.
Badger MR, Andrews TJ, Whitney SM, Ludwig M, Yellowlees DC, Leggat W, Price GD. 1998. The diversity and coevolution of Rubisco, plas-tids, pyrenoids, and chloroplast-based CO2-concentrating mechanisms in algae. Canadian Journal of Botany 76, 1052–1071.
Bassham JA, Krause GH. 1969. Free energy changes and metabolic regulation in steady-state photosynthetic carbon reduction. Biochimica et Biophysica Acta 189, 207–221.
Betti M, Bauwe H, Busch FA, et al. 2016. Manipulating photorespiration to increase plant productivity: recent advances and perspectives for crop improvement. Journal of Experimental Botany 67, 2977–2988.
Busch FA, Sage TL, Cousins AB, Sage RF. 2013. C3 plants enhance rates of photosynthesis by reassimilating photorespired and respired CO2. Plant, Cell & Environment 36, 200–212.
Carmo-Silva AE, Keys AJ, Andralojc PJ, Powers SJ, Arrabaça MC, Parry MA. 2010. Rubisco activities, properties, and regulation in three different C4 grasses under drought. Journal of Experimental Botany 61, 2355–2366.
Charlet T, Moore BD, Seemann JR. 1997. Carboxyarabinitol 1-phos-phate phosphatase from leaves of Phaseolus vulgaris and other species. Plant & Cell Physiology 38, 511–517.
Christin PA, Besnard G, Samaritani E, Duvall MR, Hodkinson TR, Savolainen V, Salamin N. 2008. Oligocene CO2 decline promoted C4 pho-tosynthesis in grasses. Current Biology 18, 37–43.
Christin PA, Osborne CP. 2013. The recurrent assembly of C4 photosyn-thesis, an evolutionary tale. Photosynthesis Research 117, 163–175.
Cock JH, Riaño NM, El-Sharkawy MA, Yamel LF, Bastidas G. 1987. C3–C4 intermediate photosynthetic characteristics of cassava (Manihot esculenta Crantz): II. Initial products of 14CO2 fixation. Photosynthesis Research 12, 237–241.
Cruz JA, Emery C, Wüst M, Kramer DM, Lange BM. 2008. Metabolite profiling of Calvin cycle intermediates by HPLC-MS using mixed-mode sta-tionary phases. The Plant Journal 55, 1047–1060.
De Souza AP, Long SP. 2018. Toward improving photosynthesis in cas-sava: characterizing photosynthetic limitations in four current African culti-vars. Food and Energy Security 7, e00130.
De Souza AP, Massenburg LN, Jaiswal D, Cheng S, Shekar R, Long SP. 2017. Rooting for cassava: insights into photosynthesis and associated physiology as a route to improve yield potential. New Phytologist 213, 50–65.
Díaz S, Kattge J, Cornelissen JH, et al. 2016. The global spectrum of plant form and function. Nature 529, 167–171.
Ding F, Wang M, Zhang S, Ai X. 2016. Changes in SBPase activity influ-ence photosynthetic capacity, growth, and tolerance to chilling stress in transgenic tomato plants. Scientific Reports 6, 32741.
Donovan LA, Maherali H, Caruso CM, Huber H, de Kroon H. 2011. The evolution of the worldwide leaf economics spectrum. Trends in Ecology & Evolution 26, 88–95.
Driever SM, Lawson T, Andralojc PJ, Raines CA, Parry MA. 2014. Natural variation in photosynthetic capacity, growth, and yield in 64 field-grown wheat genotypes. Journal of Experimental Botany 65, 4959–4973.
Driever SM, Simkin AJ, Alotaibi S, et al. 2017. Increased SBPase activ-ity improves photosynthesis and grain yield in wheat grown in greenhouse conditions. Philosophical Transactions of the Royal Society B: Biological Sciences 372, 1730.
Edwards EJ, Osborne CP, Strömberg CA, et al. 2010. The origins of C4 grasslands: integrating evolutionary and ecosystem science. Science 328, 587–591.
Edwards GE, Sheta E, Moore BD, Dai Z, Franceschi VR, Cheng S-H, Lin C-H, Ku MSB. 1990. Photosynthetic characteristics of cassava (Manihot esculenta Crantz), a C3 species with chlorenchymatous bundle sheath cells. Plant & Cell Physiology 31, 1199–1206.
El-Sharkawy MA, Cock JH. 1987. C3–C4 intermediate photosynthetic characteristics of cassava (Manihot esculenta Crantz): I. Gas exchange. Photosynthesis Research 12, 219–235.
Ellis RJ. 1979. The most abundant protein in the world. Trends in Biochemical Sciences 4, 241–244.
Evans JR. 1989. Photosynthesis and nitrogen relationships in leaves of C3 plants. Oecologia 78, 9–19.
Farquhar GD, von Caemmerer S, Berry JA. 1980. A biochemical model of photosynthetic CO2 assimilation in leaves of C3 species. Planta 149, 78–90.
Field C, Mooney HA. 1986. The photosynthesis–nitrogen relationship in wild plants. In: Givnish T, ed. On the economy of plant form and function. Cambridge: Cambridge University Press, 25–55.
Galmés J, Andralojc PJ, Kapralov MV, Flexas J, Keys AJ, Molins A, Parry MA, Conesa MÀ. 2014a. Environmentally driven evolution of Rubisco and improved photosynthesis and growth within the C3 genus Limonium (Plumbaginaceae). New Phytologist 203, 989–999.
Dow
nloaded from https://academ
ic.oup.com/jxb/article/70/6/1843/5324484 by guest on 15 February 2022
Metabolite profiles reveal diversity in the Calvin–Benson cycle | 1857
Galmés J, Kapralov MV, Andralojc PJ, Conesa MÀ, Keys AJ, Parry MA, Flexas J. 2014b. Expanding knowledge of the Rubisco kinetics variability in plant species: environmental and evolutionary trends. Plant, Cell & Environment 37, 1989–2001.
Gerhardt R, Stitt M, Heldt HW. 1987. Subcellular metabolite levels in spinach leaves: regulation of sucrose synthesis during diurnal alterations in photosynthetic partitioning. Plant Physiology 83, 399–407.
Ghannoum O, Evans JR, Chow WS, Andrews TJ, Conroy JP, von Caemmerer S. 2005. Faster Rubisco is the key to superior nitrogen-use efficiency in NADP-malic enzyme relative to NAD-malic enzyme C4 grasses. Plant Physiology 137, 638–650.
Gibon Y, Vigeolas H, Tiessen A, Geigenberger P, Stitt M. 2002. Sensitive and high throughput metabolite assays for inorganic pyrophos-phate, ADPGlc, nucleotide phosphates, and glycolytic intermediates based on a novel enzymic cycling system. The Plant Journal 30, 221–235.
Giordano M, Beardall J, Raven JA. 2005. CO2 concentrating mecha-nisms in algae: mechanisms, environmental modulation, and evolution. Annual Review of Plant Biology 56, 99–131.
Gontero B, Maberly SC. 2012. An intrinsically disordered protein, CP12: jack of all trades and master of the Calvin cycle. Biochemical Society Transactions 40, 995–999.
Hasunuma T, Harada K, Miyazawa S, Kondo A, Fukusaki E, Miyake C. 2010. Metabolic turnover analysis by a combination of in vivo 13C-labelling from 13CO2 and metabolic profiling with CE-MS/MS reveals rate-limiting steps of the C3 photosynthetic pathway in Nicotiana tabacum leaves. Journal of Experimental Botany 61, 1041–1051.
Hatch MD. 2002. C4 photosynthesis: discovery and resolution. Photosynthesis Research 73, 251–256.
Hatch MD, Osmond CB. 1976. Compartmentation and transport in C4 photosynthesis. In: Stocking CR, Heber U, eds. Encyclopedia of Plant Physiology, Vol. 3. Berlin: Springer-Verlag, 144–184.
Heckmann D. 2016. C4 photosynthesis evolution: the conditional Mt. Fuji. Current Opinion in Plant Biology 31, 149–154.
Heckmann D, Schulze S, Denton A, Gowik U, Westhoff P, Weber AP, Lercher MJ. 2013. Predicting C4 photosynthesis evolution: modular, individually adaptive steps on a Mount Fuji fitness landscape. Cell 153, 1579–1588.
Heldt HW. 2005. Plant biochemistry. Oxford: Elsevier Academic Press.
Hermida-Carrera C, Fares MA, Fernández Á, et al. 2017. Positively selected amino acid replacements within the RuBisCO enzyme of oak trees are associated with ecological adaptations. PLoS One 12, e0183970.
Hikosaka K. 2010. Mechanisms underlying interspecific variation in pho-tosynthetic capacity across wild plant species. Plant Biotechnology 27, 223–229.
Höfer MU, Santore UJ, Westhoff P. 1992. Differential accumulation of the 10-, 16- and 23-kDa peripheral components of the water-splitting com-plex of photosystem II in mesophyll and bundle-sheath chloroplasts of the dicotyledonous C4 plant Flaveria trinervia (Spreng.) C. Mohr. Planta 186, 304–312.
Howard TP, Lloyd JC, Raines CA. 2011. Inter-species variation in the oligomeric states of the higher plant Calvin cycle enzymes glyceralde-hyde-3-phosphate dehydrogenase and phosphoribulokinase. Journal of Experimental Botany 62, 3799–3805.
Jordan DB, Ogren WL. 1981. Species variation in the specificity of ribu-lose biphosphate carboxylase/oxygenase. Nature 291, 513.
Kapralov MV, Kubien DS, Andersson I, Filatov DA. 2011. Changes in Rubisco kinetics during the evolution of C4 photosynthesis in Flaveria (Asteraceae) are associated with positive selection on genes encoding the enzyme. Molecular Biology and Evolution 28, 1491–1503.
Kerfeld CA, Melnicki MR. 2016. Assembly, function and evolution of cyanobacterial carboxysomes. Current Opinion in Plant Biology 31, 66–75.
Kocacinar F, McKown AD, Sage TL, Sage RF. 2008. Photosynthetic pathway influences xylem structure and function in Flaveria (Asteraceae). Plant, Cell & Environment 31, 1363–1376.
Laetsch WM, Price I. 1969. Development of the dimorphic chloroplasts of sugar cane. American Journal of Botany 56, 77–87.
Lawson T, Kramer DM, Raines CA. 2012. Improving yield by exploiting mechanisms underlying natural variation of photosynthesis. Current Opinion in Biotechnology 23, 215–220.
Leegood RC. 1985. The intercellular compartmentation of metabolites in leaves of Zea mays L. Planta 164, 163–171.
Leegood RC, von Caemmerer S. 1988. The relationship between con-tents of photosynthetic metabolites and the rate of photosynthetic carbon assimilation in leaves of Amaranthus edulis L. Planta 174, 253–262.
Leegood RC, von Caemmerer S. 1989. Some relationships between contents of photosynthetic intermediates and the rate of photosynthetic carbon assimilation in leaves of Zea mays L. Planta 178, 258–266.
Lefebvre S, Lawson T, Zakhleniuk OV, Lloyd JC, Raines CA, Fryer M. 2005. Increased sedoheptulose-1,7-bisphosphatase activity in transgenic tobacco plants stimulates photosynthesis and growth from an early stage in development. Plant Physiology 138, 451–460.
Long SP. 1999. Environmental responses. In: Sage RF, Monson R, eds. C4 plant biology. San Diego: Academic Press, 215–249.
Long SP, Ainsworth EA, Leakey AD, Nösberger J, Ort DR. 2006. Food for thought: lower-than-expected crop yield stimulation with rising CO2 con-centrations. Science 312, 1918–1921.
López-Calcagno PE, Howard TP, Raines CA. 2014. The CP12 protein family: a thioredoxin-mediated metabolic switch? Frontiers in Plant Science 5, 9.
Lorimer G. 1981. The carboxylation and oxygenation of ribulose 1,5-bis-phosphate: the primary events in photosynthesis and photorespiration. Annual Review of Plant Physiology 32, 349–382.
Lorimer GH, Andrews TJ. 1973. Plant photorespiration—an inevitable consequence of the existence of atmospheric oxygen. Nature 243, 359.
Ma F, Jazmin LJ, Young JD, Allen DK. 2014. Isotopically nonstationary 13C flux analysis of changes in Arabidopsis thaliana leaf metabolism due to high light acclimation. Proceedings of the National Academy of Sciences, USA 111, 16967–16972.
Mallmann J, Heckmann D, Brautigam A, Lercher MJ, Weber AP, Westhoff P, Gowik U. 2014. The role of photorespiration during the evolu-tion of C4 photosynthesis in the genus Flaveria. eLife 16, 02478.
McKown AD, Dengler NG. 2007. Key innovations in the evolution of Kranz anatomy and C4 vein pattern in Flaveria (Asteraceae). American Journal of Botany 94, 382–399.
Meister M, Agostino A, Hatch MD. 1996. The roles of malate and aspar-tate in C4 photosynthetic metabolism of Flaveria bidentis (L.). Planta 199, 262–269.
Merlo L, Geigenberger P, Hajirezaei M, Stitt M. 1993. Changes of carbohydrates, metabolites and enzyme activities in potato tubers during development, and within a single tuber along a stolon–apex gradient. Plant Physiology 142, 392–402.
Mettler T, Mühlhaus T, Hemme D, et al. 2014. Systems analysis of the response of photosynthesis, metabolism, and growth to an increase in irra-diance in the photosynthetic model organism Chlamydomonas reinhardtii. The Plant Cell 26, 2310–2350.
Meyer RC, Steinfath M, Lisec J, et al. 2007. The metabolic signature related to high plant growth rate in Arabidopsis thaliana. Proceedings of the National Academy of Sciences, USA 104, 4759–4764.
Moore BD, Isidoro E, Seemann JR. 1993. Distribution of 2-carboxyara-binitol among plants. Phytochemistry 34, 703–707.
Munekage NY. 2016. Light harvesting and chloroplast electron transport in NADP-malic enzyme type C4 plants. Current Opinion in Plant Biology 31, 9–15.
Nakamura N, Iwano M, Havaux M, Yokota A, Munekage YN. 2013. Promotion of cyclic electron transport around photosystem I during the evo-lution of NADP-malic enzyme-type C4 photosynthesis in the genus Flaveria. New Phytologist 199, 832–842.
Nassar NMA, Marques AO. 2006. Cassava leaves as a source of protein. Journal of Food, Agriculture and Environment 4, 187–188.
Nelson T. 2011. The grass leaf developmental gradient as a platform for a systems understanding of the anatomical specialization of C4 leaves. Journal of Experimental Botany 62, 3039–3048.
Ort DR, Merchant SS, Alric J, et al. 2015. Redesigning photosynthesis to sustainably meet global food and bioenergy demand. Proceedings of the National Academy of Sciences, USA 112, 8529–8536.
Osmond CB. 1981. Photorespiration and photoinhibition: some implica-tions for the energetics of photosynthesis. Biochimica et Biophysica Acta 639, 77–98.
Dow
nloaded from https://academ
ic.oup.com/jxb/article/70/6/1843/5324484 by guest on 15 February 2022
1858 | Arrivault et al.
Parry MA, Keys AJ, Madgwick PJ, Carmo-Silva AE, Andralojc PJ. 2008. Rubisco regulation: a role for inhibitors. Journal of Experimental Botany 59, 1569–1580.
Poorter H, Jagodzinski AM, Ruiz-Peinado R, Kuyah S, Luo Y, Oleksyn J, Usoltsev VA, Buckley TN, Reich PB, Sack L. 2015. How does biomass distribution change with size and differ among species? An analysis for 1200 plant species from five continents. New Phytologist 208, 736–749.
Prins A, Orr DJ, Andralojc PJ, Reynolds MP, Carmo-Silva E, Parry MA. 2016. Rubisco catalytic properties of wild and domesticated relatives pro-vide scope for improving wheat photosynthesis. Journal of Experimental Botany 67, 1827–1838.
Raines CA. 2011. Increasing photosynthetic carbon assimilation in C3 plants to improve crop yield: current and future strategies. Plant Physiology 155, 36–42.
Raines CA, Harrison EP, Ölçer H, Lloyd JC. 2000. Investigating the role of the thiol-regulated enzyme sedoheptulose-1,7-bisphosphatase in the control of photosynthesis. Physiologia Plantarum 110, 303–308.
Rasmussen B, Fletcher IR, Brocks JJ, Kilburn MR. 2008. Reassessing the first appearance of eukaryotes and cyanobacteria. Nature 455, 1101–1104.
Raven JA. 2013. Rubisco: still the most abundant protein of Earth? New Phytologist 198, 1–3.
Raven JA, Beardall J, Sánchez-Baracaldo P. 2017. The possible evolu-tion and future of CO2-concentrating mechanisms. Journal of Experimental Botany 68, 3701–3716.
Sage RF. 2017. A portrait of the C4 photosynthetic family on the 50th anni-versary of its discovery: species number, evolutionary lineages, and Hall of Fame. Journal of Experimental Botany 68, 4039–4056.
Sage RF, Christin PA, Edwards EJ. 2011. The C4 plant lineages of planet Earth. Journal of Experimental Botany 62, 3155–3169.
Sage RF, Sage TL, Kocacinar F. 2012. Photorespiration and the evolution of C4 photosynthesis. Annual Review of Plant Biology 63, 19–47.
Sage RF, Seemann JR. 1993. Regulation of ribulose-1,5-bisphosphate carboxylase/oxygenase activity in response to reduced light intensity in C4 plants. Plant Physiology 102, 21–28.
Sage TL, Busch FA, Johnson DC, Friesen PC, Stinson CR, Stata M, Sultmanis S, Rahman BA, Rawsthorne S, Sage RF. 2013. Initial events during the evolution of C4 photosynthesis in C3 species of Flaveria. Plant Physiology 163, 1266–1276.
Sage TL, Sage RF. 2009. The functional anatomy of rice leaves: implica-tions for refixation of photorespiratory CO2 and efforts to engineer C4 photo-synthesis into rice. Plant & Cell Physiology 50, 756–772.
Savir Y, Noor E, Milo R, Tlusty T. 2010. Cross-species analysis traces adaptation of Rubisco toward optimality in a low-dimensional landscape. Proceedings of the National Academy of Sciences, USA 107, 3475–3480.
Servaites JC, Parry MA, Gutteridge S, Keys AJ. 1986. Species variation in the predawn inhibition of ribulose-1,5-bisphosphate carboxylase/oxyge-nase. Plant Physiology 82, 1161–1163.
Shameer S, Baghalian K, Cheung CYM, Ratcliffe RG, Sweetlove LJ. 2018. Computational analysis of the productivity potential of CAM. Nature Plants 4, 165–171.
Sharkey TD. 1988. Estimating the rate of photorespiration in leaves. Physiologia Plantarum 73, 147–152.
Sharwood RE, Ghannoum O, Kapralov MV, Gunn LH, Whitney SM. 2016a. Temperature responses of Rubisco from Paniceae grasses provide opportunities for improving C3 photosynthesis. Nature Plants 2, 16186.
Sharwood RE, Ghannoum O, Whitney SM. 2016b. Prospects for improv-ing CO2 fixation in C3-crops through understanding C4-Rubisco biogenesis and catalytic diversity. Current Opinion in Plant Biology 31, 135–142.
Sharwood RE, Sonawane BV, Ghannoum O, Whitney SM. 2016c. Improved analysis of C4 and C3 photosynthesis via refined in vitro assays of their carbon fixation biochemistry. Journal of Experimental Botany 67, 3137–3148.
Silvera K, Neubig KM, Whitten WM, Williams NH, Winter K, Cushman JC. 2010. Evolution along the crassulacean acid metabolism continuum. Functional Plant Biology 37, 995–1010.
Simkin AJ, Lopez-Calcagno PE, Davey PA, Headland LR, Lawson T, Timm S, Bauwe H, Raines CA. 2017. Simultaneous stimulation of
sedoheptulose 1,7-bisphosphatase, fructose 1,6-bisphophate aldolase and the photorespiratory glycine decarboxylase-H protein increases CO2 assimilation, vegetative biomass and seed yield in Arabidopsis. Plant Biotechnology Journal 15, 805–816.
Simpson G, Roe A. 1939. Quantitative zoology, numerical concepts and methods in thestudy of recent and fossil animals. New York and London: McGraw-Hill Book Co.
Somerville CR. 2001. An early Arabidopsis demonstration. Resolving a few issues concerning photorespiration. Plant Physiology 125, 20–24.
Sørensen T. 1948. A method of establishing groups of equal amplitude in plant sociology based on similarity of species and its application to analyses of the vegetation on Danish commons. Biologiske Skrifter 5, 1–34.
Still CJ, Berry JA, Collatz GJ, DeFries RS. 2003. Global distribution of C3 and C4 vegetation: carbon cycle implications. Global Biogeochemical Cycles 17, 6-1–6-14.
Stitt M, Heldt HW. 1985. Generation and maintenance of concentra-tion gradients between the mesophyll and bundle sheath in maize leaves. Biochimica et Biophysica Acta 808, 400–414.
Stitt M, Lunn J, Usadel B. 2010. Arabidopsis and primary photosyn-thetic metabolism—more than the icing on the cake. The Plant Journal 61, 1067–1091.
Stitt M, Sulpice R, Gibon Y, Whitwell A, Skilbeck R, Parker S, Ellison R. 2007. Cryogenic Grinder System. Vol. German Patent No. 08146.0025U1. MPG/SFX Link Resolver.
Sulpice R, Nikoloski Z, Tschoep H, et al. 2013. Impact of the carbon and nitrogen supply on relationships and connectivity between metabolism and biomass in a broad panel of Arabidopsis accessions. Plant Physiology 162, 347–363.
Sulpice R, Pyl E-T, Ishihara H, et al. 2009. Starch as a major integrator in the regulation of plant growth. Proceedings of the National Academy of Sciences, USA 106, 10348–10353.
Szecowka M, Heise R, Tohge T, et al. 2013. Metabolic fluxes in an illumi-nated Arabidopsis rosette. The Plant Cell 25, 694–714.
Tcherkez GG, Farquhar GD, Andrews TJ. 2006. Despite slow catalysis and confused substrate specificity, all ribulose bisphosphate carboxylases may be nearly perfectly optimized. Proceedings of the National Academy of Sciences, USA 103, 7246–7251.
Usuda H. 1987. Changes in levels of intermediates of the C4 cycle and reductive pentose phosphate pathway under various light intensities in maize leaves. Plant Physiology 84, 549–554.
von Caemmerer S, Farquhar GD. 1981. Some relationships between the biochemistry of photosynthesis and the gas exchange of leaves. Planta 153, 376–387.
von Caemmerer S, Furbank RT. 2003. The C4 pathway: an efficient CO2 pump. Photosynthesis Research 77, 191–207.
Wright IJ, Reich PB, Westoby M, et al. 2004. The worldwide leaf eco-nomics spectrum. Nature 428, 821–827.
Wu S, Alseekh S, Cuadros-Inostroza Á, Fusari CM, Mutwil M, Kooke R, Keurentjes JB, Fernie AR, Willmitzer L, Brotman Y. 2016. Combined use of genome-wide association data and correlation networks unravels key regulators of primary metabolism in Arabidopsis thaliana. PLoS Genetics 12, e1006363.
Wullschleger SD. 1993. Biochemical limitations to carbon assimilation in C3 plants—a retrospective analysis of the A/Ci curves from 109 species. Journal of Experimental Botany 44, 907–920.
Yeoh HH, Badger MR, Watson L. 1980. Variations in Km(CO2) of ribu-lose-1,5-bisphosphate carboxylase among grasses. Plant Physiology 66, 1110–1112.
Zachos JC, Dickens GR, Zeebe RE. 2008. An early Cenozoic perspec-tive on greenhouse warming and carbon-cycle dynamics. Nature 451, 279–283.
Zhang N, Gibon Y, Wallace JG, et al. 2015. Genome-wide association of carbon and nitrogen metabolism in the maize nested association mapping population. Plant Physiology 168, 575–583.
Zhu XG, de Sturler E, Long SP. 2007. Optimizing the distribution of resources between enzymes of carbon metabolism can dramatically increase photosynthetic rate: a numerical simulation using an evolutionary algorithm. Plant Physiology 145, 513–526.
Dow
nloaded from https://academ
ic.oup.com/jxb/article/70/6/1843/5324484 by guest on 15 February 2022
Copyright © 2022 FDOKUMEN