A Wavelet-based Method for the Metabolite Detection and ...
21
HAL Id: hal-02042878 https://hal.archives-ouvertes.fr/hal-02042878 Submitted on 20 Feb 2019 HAL is a multi-disciplinary open access archive for the deposit and dissemination of sci- entific research documents, whether they are pub- lished or not. The documents may come from teaching and research institutions in France or abroad, or from public or private research centers. L’archive ouverte pluridisciplinaire HAL, est destinée au dépôt et à la diffusion de documents scientifiques de niveau recherche, publiés ou non, émanant des établissements d’enseignement et de recherche français ou étrangers, des laboratoires publics ou privés. A Wavelet-based Method for the Metabolite Detection and Quantification in Proton Magnetic Resonance Spectroscopy Jessica Hanna, Sandy Rihana, David Helbert, Rita Zrour, Philippe Carré, Carole Guillevin To cite this version: Jessica Hanna, Sandy Rihana, David Helbert, Rita Zrour, Philippe Carré, et al.. A Wavelet-based Method for the Metabolite Detection and Quantification in Proton Magnetic Resonance Spectroscopy. [Research Report] Université de Poitiers (France). 2015. hal-02042878
-
Upload
khangminh22 -
Category
Documents
-
view
1 -
download
0
Transcript of A Wavelet-based Method for the Metabolite Detection and ...

HAL Id: hal-02042878https://hal.archives-ouvertes.fr/hal-02042878
Submitted on 20 Feb 2019
HAL is a multi-disciplinary open accessarchive for the deposit and dissemination of sci-entific research documents, whether they are pub-lished or not. The documents may come fromteaching and research institutions in France orabroad, or from public or private research centers.
L’archive ouverte pluridisciplinaire HAL, estdestinée au dépôt et à la diffusion de documentsscientifiques de niveau recherche, publiés ou non,émanant des établissements d’enseignement et derecherche français ou étrangers, des laboratoirespublics ou privés.
A Wavelet-based Method for the Metabolite Detectionand Quantification in Proton Magnetic Resonance
SpectroscopyJessica Hanna, Sandy Rihana, David Helbert, Rita Zrour, Philippe Carré,
Carole Guillevin
To cite this version:Jessica Hanna, Sandy Rihana, David Helbert, Rita Zrour, Philippe Carré, et al.. A Wavelet-basedMethod for the Metabolite Detection and Quantification in Proton Magnetic Resonance Spectroscopy.[Research Report] Université de Poitiers (France). 2015. �hal-02042878�

A Wavelet-based Method for the Metabolite Detection and
Quantification in Proton Magnetic Resonance Spectroscopy
Jessica Hanna, Sandy Rihana, David Helbert, Rita Zrour, Philippe Carre, Carole Guillevin
Institution:
J. Hanna and S. Rihana are from Biomedical Engineering Department, Holy Spirit University of
Kaslik, Lebanon
D. Helbert, R. Zrour and P. Carre are from Xlim, CNRS, University of Poitiers, France
C. Guillevin is from DACTIM Laboratory, University of Poitiers and Poitiers University Hospital,
Department of Radiology, France
Corresponding author:
D. Helbert
Xlim UMR CNRS 7252
11 Bvd Marie et Pierre Curie, BP 30179,
86962 Futuroscope Chasseneuil Cedex
France
Tel : +33 (0)549 496 580,
Email: [email protected]
Short running title: A Wavelet-based Method for the Metabolite Detection and Quantification
in Proton Magnetic Resonance Spectroscopy
Word count: 3592
1

Abstract
Purpose: In healthy tissue, metabolites are present in steady-state concentrations typical for
that specific tissue. Metabolite concentrations may shift due to stress, functional disturbances,
tumors or metabolic diseases. These changes are detectable with MRS, and provide valuable in-
formation for both diagnosis and therapeutic surveillance. Various methods have been developed
to quantify the metabolite concentrations using methods ranging from the simple integration of
spectral peak to complex algorithms.
Theory and Methods: The purpose of this work is to develop an analysis system for in vivo
NMR spectroscopy for brain metabolites quantification based on continuous wavelet transforms
without prior knowledge. Tests are done on both simulated and real in vivo MRS signals using
spectroscopic data acquired in 16 healthy subjects (range 20-50) using 3T MR system.
Results: Results show that even with the presence of low SNRs and baseline, the proposed
method is able to derive the parameters such as the frequencies, the amplitudes and the damping
factors of metabolites directly from the raw data and without any beforehand preprocessing or
prior knowledge.
Conclusion: The CWT analysis has shown to be accurate, robust and in agreement with the
time domain fitting method AMARES for the quantification of short echo time in vivo MRS
data.
Keywords: Magnetic resonance spectroscopy (MRS), signal processing, continuous wavelet
transforms, quantification, peak detection.
Introduction
Nowadays, Magnetic Resonance Spectroscopy is a non-invasive diagnostic test commonly used in
medicine for measuring the biochemical changes in the brain, precisely in localizing tumors and
consequently helping clinicians to detect tissue changes in stroke and epilepsy and to optimize the
appropriate treatment. The first in vivo MRS was applied on Phosphorus, 31P, but now many other
nuclei are detected by this modality such as Proton, 1H, Carbon, 13C, Fluorine, 19F, Sodium, 23Na
and others, however 1H MRS predominates because of the high natural abundance of protons in
human body, and also due to the high number of information contained in 1H MRS spectrum [12].
There are different metabolites, or products of metabolism, that can be measured to differen-
tiate between tumor types: Amino Acids, Lipid, Lactate, Alanine, N-acetyl aspartate, Choline,
Creatinine, Myoionisotol.
2

In order to use the MRS tool in clinical environment, a reliable quantization method is funda-
mental. Unfortunately, in vivo studies of MRS has a number of drawbacks such as low Signal to
Noise Ratio (SNR) due to the weak concentrations of the detected metabolites, poor homogeneity
of the magnetic fields, macromolecular baseline and many other imperfections which make it very
difficult to achieve accurate measurements [8].
The choice of an appropriate quantification method is crucial to estimate the intrinsic param-
eters of the signals and convert them into biochemical quantities. In fact the quantification meth-
ods can be divided into three main categories: time-domain methods, frequency-domain methods
[19, 14] and time-frequency domain methods [25]. In the time domain, the quantification methods
can be classified into two main categories: iterative and non-iterative methods [18]. The iterative
approaches, such as the NLLS (Non-linear least square) methods, use the local or global optimiza-
tion to reduce the difference between the model function and the MRS data. These methods allow
the inclusion of prior knowledge such as the frequencies, the damping factors and the phases of
certain metabolites. VARPRO (VARiable PROjection) is one of these time-domain methodolo-
gies [27] which in turn was improved by AMARES (Advanced Method for Accurate, Robust and
Efficient Spectral) [28, 15]. This latter allows the inclusion of more prior knowledge, extracted
either from phantoms or in vitro data, in order to enhance the efficiency and the overall accuracy.
AMARES performs fitting of Lorentzian, Gaussian or Voigt models to the signal [26]. This method
is supposed to give good results for a spectrum where the peaks are well separated. However if the
spectrum is corrupted with noise and the nuisance peaks have large amplitude or are close to the
metabolic peaks, this method will fail [9]. Other iterative methods exists, they rely on a metabolic
basis set [21] for example the AQSES (Accurate Quantitation of Short Echo time domain Signals)
[17] or QUEST (QUantum ESTimation). On the other hand, the non-iterative methods use either
the linear prediction principle or the state space theory to derive the amplitudes of the metabolites
present in the MRS spectrum [3].
In the frequency domain, the quantification of metabolites can be also divided into two classes:
the non-interactive methods which are based on the integration of areas under the peaks of interest;
these tools allow good quantification when the peaks in the spectrum are well separated, however
this is not the case in the in vivo studies. Therefore, in the frequency domain, the interactive
methods which use the nonlinear least square fitting approach are more used [20]. Many frequency
domain fitting algorithm exist, such as the LC-Model, which also allow the inclusion of prior
knowledge [11, 6].
3

All the time domain and frequency domain methods require lots of preprocessing steps and
strong prior knowledge to provide good quantification of the metabolites and many of them are
user dependent. Therefore the main goal of this work is to develop an automatic analysis system for
in vivo MRS based on continuous wavelet transform allowing good quantification of the metabolites
and operating directly on the raw data without any preprocessing beforehand or user interaction.
This method is divided into two main parts: peak detection and quantification. To evaluate its
performance both simulated and real MRS signals were used. Note that this tool is totally automatic
and does not require any prior knowledge.
The paper is organized as follows. In the next section, the proposed automatic peak detection
algorithm is introduced along with the mathematics behind the Continuous Wavelet transform used
for MRS quantification and the result obtained for some simulated MRS signals used to evaluate
the robustness of this method in different conditions. In the following section, the results for in
vivo MRS signals are presented and discussed. These tests were conducted in order to validate the
proposed algorithm. Finally the main conclusion and the perspectives were formulated.
Theory
Time-Frequency Methods
Methods based on the time-frequency domain have been developed for analyzing MRS signals and
present some advantages over the previous mentioned methods. These techniques are based either
on the WT (Wavelet Transform) or on the STFT (short time Fourier transform); both will give
a time-frequency representation of the FID signal [24]. A number of methods based on wavelet
transform have been suggested for MRS quantification by different authors; Continuous wavelet
transform (CWT) have been proposed by [1, 25] and discrete wavelet transform (DWT) such as
the wavelet packet decomposition has been proposed by [13]. Nevertheless the DWT is not well
adjusted to the underling physics of MRS, using it will lead to some difficulties. The principle
of the discrete wavelet transform computation is indeed based on downsampling and upsampling
operators in a filter bank. This operators do not allow to the transform to be translation-invariant
[22].
While the CWT is primarily a tool for analysis and feature determination, the DWT is the
preferred technique for data compression and signal synthesis. Since the applications in NMR
spectroscopy consist mainly in detecting particular features in the spectra, the CWT will be in
4

general better adapted than the DWT [5, 2].
Wavelets Principles
A wavelet is a normalized function ψ ∈ L2(R) with a null mean. A family of time-frequency
elements can be obtained by dilating with a factor a and by translating the wavelet with a factor
τ :
ψa,τ (t) =1√aψ
(t− τa
)(1)
The wavelet coefficient Ws(a, τ) of s ∈ L2(R) at time a and scale τ is obtained by projecting the
signal s onto the family {ψa,τ (t)} of functions obtained by dilatation of a and by translation of τ
of the mother wavelet ψ :
Ws(a, τ) =
∫Rs(t)ψ∗a,τ (t)dt (2)
The wavelet transform denoted in the Eq. 1 is equivalent to a filter process. And the obtained
coefficients indicate the correlation between the signal and the selected mother wavelet. Several
families of mother wavelets exist and each type has its own time-frequency structure.
Simulated MRS Signals
To assess the performance of the suggested method in both ideal and contaminated environment
where noise and baseline are present, we used simulated MRS signals with a Lorentzian lineshape
denoted by Eq. 3.
s(t) = Ae−Dte−i(ωt+φ), (3)
where A is the amplitude, D the damping factor, φ and ω are the phase and the frequency of the
signal respectively.
Methods
Theoretically, the spectrum of MRS is composed of pure Lorentzian profiles. Nevertheless, in real
environment, the MRS spectrum might be corrupted by a wideband baseline signal generated by
macromolecules and by the noise. Therefore the actual equation of the MRS signal containing one
frequency component, in time domain, is represented by the following equation Eq. 4:
y(t) = s(t) +B(t) + ε(t), (4)
5

where y(t) is the experimental MRS signal in time domain, s(t) is the Lorentzian signal containing
one frequency component, B(t) is the modeled baseline and ε(t) is the added Noise.
The baseline is characterized by a wide range of frequency in the MRS spectrum caused by the
contribution of the macromolecules and thus it is supposed to decay faster than the pure signal. It
can be modeled using 50 Lorentzian profiles with random amplitudes and large damping factor or
using the cubic spline interpolation.
MRS signals quality could be affected by several sources of noise, such as the body noise, the
noise originating from the electronics of the receiver and the thermal noise created by the coils.
The body noise, which is the result of electrolytes thermal variations inside the body, is considered
as the main source of noise in MRS. This type of noise is usually characterized as being white,
additive and Gaussian distributed [16].
Real in vivo MRS Signals
In order to validate the proposed algorithm, real in vivo signals are tested. 1H-MRS were performed
on a sample of 16 healthy subjects (7 women, 9 men), their age was 32 years (range 20-50) for three
different brain regions: Posterior Cerebral Cortex (CCP), Anterior Cerebral Cortex (CCA) and
Striatum.
The MRS data considered in this project were acquired by a 3T whole-body system (Verio,
Siemens, Erlangen, Germany) and were provided by the radiology department of CHU Poitiers
(France). The MRS sequence was performed with a monovoxel short TE (TE: 35ms, TR: 1500ms)
using a point-resolved single voxel spectroscopy (PRESS). A multiplanar reconstruction of 3D T1
volume was used to position the voxel in the region of interest. The sequence parameters were 156
signal averages, a number of samples of 1024, and a bandwidth of 1200 Hz. The voxel size was
of 3.375 cm3. The common measures usually done in MRS studies, such as automatic shimming
and eddy-currents compensation, were carried out for these acquisitions. Note that this data type
is ideal for comparing and validating the proposed algorithm. Quantification for MRS data was
attempted for N-acetylaspartate (NAA), Creatine (Cr), Choline (Cho) and Myo-inositol (Myo).In
this study we examined the ratio of these metabolite to compare at the real value.
6

Automatic Peak Detection
The frequencies of the different metabolites could be considered as prior knowledge, however, in
order to make the quantification method more suitable for real MRS signals analysis, where the
frequency of each peak could slightly drift from the theoretical one, an automatic peak detection
algorithm was proposed.
The aim of this method is to identify the location of each peak, using the continuous wavelet
transform. For peak detection, the mother wavelet needs to have the main characteristics of a peak
which consists of:
• Approximate symmetry,
• One main positive peak.
So for this analysis, we picked the Mexican hat wavelet (or Ricker wavelet) as mother wavelet
[7]. In fact the Mexican Hat is very suitable for edge detection, it is widely used to characterize the
singularities of a signal and therefore it allows a geometric analysis. It is defined as the negative
normalized second derivative of a Gaussian function.
The procedure of the peak detection is described as follow: First a continuous wavelet transform
of the MRS spectrum is performed using the Mexican hat as mother wavelet and well-adapted scales
to detect the peaks of interests then the scalogram is constructed and for every indices column the
sum of the coefficients is calculated. The obtained values are used to build a 1D function. After
that a standard peak detection is performed on this 1D function with one threshold: the peak
height.
To choose the threshold, we used the noise level calculation method proposed by AUTOPSY
[10]; all the peaks with an amplitude below this level are ignored. The noise level calculation
algorithm is described as follow: First, the 1D function is splitted into small windows and for
each window a noise level value is computed. The length of each slice is usually 5 percent of the
total length of the spectrum so that the standard deviation inside the window takes minimal value.
After that we distinguish between two noise levels: the base noise level θb = min(θi), where θi is
the standard deviation of slice i, and the additional noise levels, θ′i =√θ2i − θ2b . The first exist
in the entire spectrum and the latter can exist in each window. Next, the noise level is computed
from the base noise level and the additional noise levels, and this value is considered the threshold
7

for the peak detection:
∆ =
√√√√ n∑i=1
θ′2i + θ2b , (5)
where n is the number of slices.
Note that, this peak detection algorithm, based on the CWT, could be used directly on the
raw MRS signals without any preprocessing steps and without removing the baseline. In fact, the
baseline is assumed to be slow changing and monotonic around the peak area, therefore it will be
directly suppressed while computing the CWT coefficients using a symmetric and zero-mean wavelet
function, such as the Mexican Hat wavelet [7]. To evaluate the robustness and the accuracy of this
peak detection algorithm, a simulated signal of known frequency components was used.
The different steps of the proposed algorithm are summarized in the following Fig. 1 shows a
simulated signal S(t) in the frequency domain, composed of 11 peaks with frequency values of 15,
250, 320, 380, 500, 643, 950, 1332, 2000, 3037 and 4000 rad/sec and contaminated with noise (low
SNR=10) and baseline, along with its scalogram where the peaks are clearly observed.
By comparing the known frequencies of the 11 peaks and the identified one, as shown in Tab. 1,
we can clearly see that the we were able to identified all the peak with an error range between 0.03
% and 23 %. Even with the high level of error (23 %), which occurs when the frequency of the
peak is very low (at 15 rad/s), the algorithm seems to be applicable even when the MRS signals are
buried in noise and contaminated with macromolecular baseline. Note that the statistics were done
on 50 simulated MRS signals corrupted with random white Gaussian noise and baseline modeled
using the cubic spline interpolation.
Quantification of a Lorentzian Signal
Identification of the Lorentzian signal by the Morlet wavelet
Among the different types of wavelet transforms, using the continuous wavelet transform will allow
the estimation of signals amplitudes directly from the modulus and the phase of the WT [24] and
thus no linear model will be required as in the discrete wavelet transform [4] . Next we will explain
the mathematics behind the Morlet wavelet transform and how it is used to extract the different
parameters of in vivo MRS signals [25].
Lets take a Lorentzian signal s(t), that models the time decay signal for one a specific metabolite
8

which has only one frequency:
s(t) = Ae−Dte−i(ωst+φ). (6)
The 1D Fourier transform of the time signal is represented in Eq. 7 as
S(ω) = 2πAeiφδ (ω − ωs + iD)) , (7)
where D is the damping factor, φ the phase of the signal, ωs the frequency of the signal, A the
amplitude of the signal and δ the Dirac delta function1.
The Morlet wavelet denoted in Eq. 8 by gM (t):
gM (t) =1
2πσe−
t2
2σ2 eiω0t, (8)
and
GM (ω) = eσ2
2(ω−ω0)
2
(9)
where gM (t) is Morlet wavelet equation in time domain, GM (ω) is Morlet wavelet equation in
frequency domain, ω0 its frequency and σ its width. Morlet is considered among the wavelets
which are well localized in the frequency space, it is build form a windowed Fourier atom and is
very adapted to analyse the local energy distribution along the time or signal indice. The wavelet
transform of a signal s(t) is given by the following equation Eq. 10:
S(τ, a) =1
2π
√a
∫RS(ω)G∗M (aω)e−iωτdω, (10)
where a is the dilation parameter that represents the frequency of the signal, τ ∈ R is the trans-
lation parameter that specifies the time localization and G∗M is the complex conjugate of GM (ω).
Suvichakorn et al prove in [25] that the modulus of the WT at ar is defined by:
|Sar(τ)| =√are
(σarD√
2
)2
|s(τ)| , (11)
where |s(τ)| = Ae−Dτ . Note that the scale here is computed according to the frequency of the
metabolite.
1The Dirac delta function is defined by: δ(x) = +∞ if x = 0 else δ(x) = 0 and∫R δ(x)dx = 1.
9
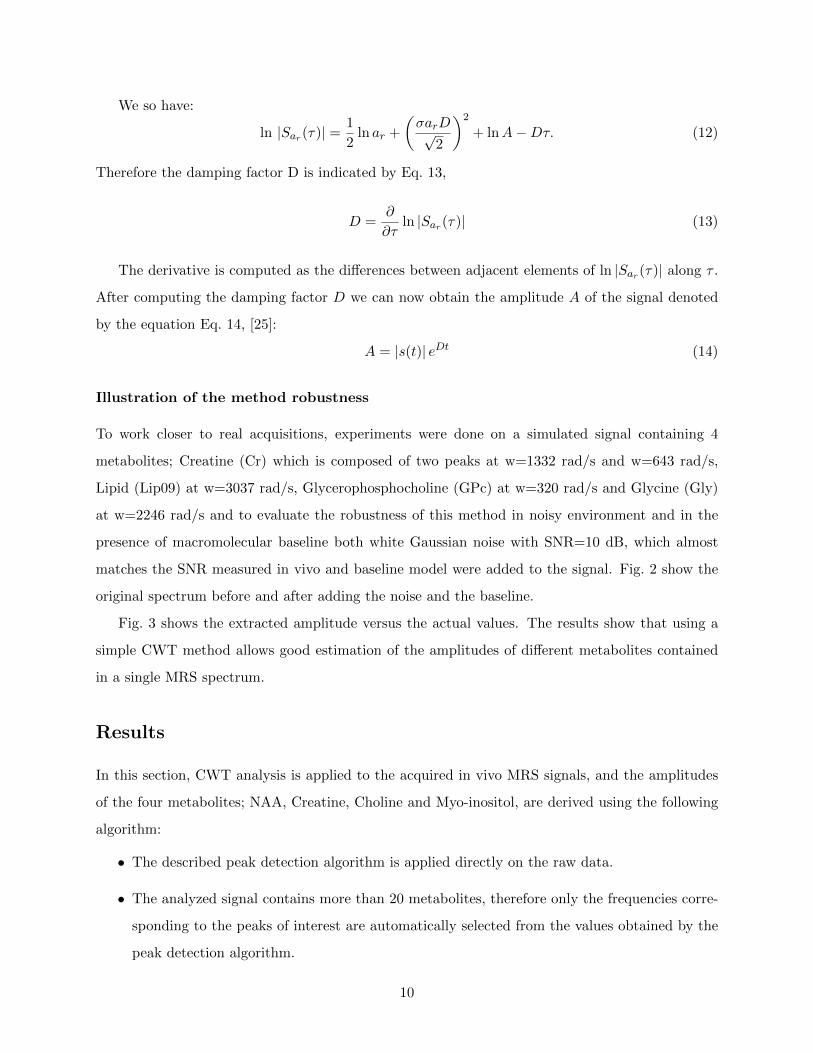
We so have:
ln |Sar(τ)| = 1
2ln ar +
(σarD√
2
)2
+ lnA−Dτ. (12)
Therefore the damping factor D is indicated by Eq. 13,
D =∂
∂τln |Sar(τ)| (13)
The derivative is computed as the differences between adjacent elements of ln |Sar(τ)| along τ .
After computing the damping factor D we can now obtain the amplitude A of the signal denoted
by the equation Eq. 14, [25]:
A = |s(t)| eDt (14)
Illustration of the method robustness
To work closer to real acquisitions, experiments were done on a simulated signal containing 4
metabolites; Creatine (Cr) which is composed of two peaks at w=1332 rad/s and w=643 rad/s,
Lipid (Lip09) at w=3037 rad/s, Glycerophosphocholine (GPc) at w=320 rad/s and Glycine (Gly)
at w=2246 rad/s and to evaluate the robustness of this method in noisy environment and in the
presence of macromolecular baseline both white Gaussian noise with SNR=10 dB, which almost
matches the SNR measured in vivo and baseline model were added to the signal. Fig. 2 show the
original spectrum before and after adding the noise and the baseline.
Fig. 3 shows the extracted amplitude versus the actual values. The results show that using a
simple CWT method allows good estimation of the amplitudes of different metabolites contained
in a single MRS spectrum.
Results
In this section, CWT analysis is applied to the acquired in vivo MRS signals, and the amplitudes
of the four metabolites; NAA, Creatine, Choline and Myo-inositol, are derived using the following
algorithm:
• The described peak detection algorithm is applied directly on the raw data.
• The analyzed signal contains more than 20 metabolites, therefore only the frequencies corre-
sponding to the peaks of interest are automatically selected from the values obtained by the
peak detection algorithm.
10

• MWT analysis is performed using Lorentzian lineshape.
• The parameters are derived and averaged in time in order to obtain smoother results. Then
the amplitude of each metabolite is estimated.
• The metabolites ratios are calculated.
The bar charts in Fig. 4 show the metabolite ratios for the 16 patients obtained using the CWT
approach and the mean value of these metabolite ratios along with their normal values in these
three brain regions [23]. Statistics are provided for comparison in Tab. 2.
Discussions
The values of the metabolite ratios extracted using the CWT analysis from the 16 healthy volunteers
are very homogeneous and very closed to the normal values. Here the CWT analysis shows its
ability to extract the physical parameters directly from the raw in vivo MRS data without any
preprocessing steps even when contaminated with noise and macromolecular baseline.
In the Tab. 2 we observe that standard deviations of computed metabolite ratios in the CCP
and the Striatum are low. The t-tests shows that the distributions of patient values are similar at
the distributions of the normal values except for Naa/CR in the CCP.
In addition this method is totally automatic and does not require any user interaction therefore
it is well suitable for clinical applications and it has many advantages over the other MRS quantifi-
cation methods such as the AMARES. In fact an AMARES analysis of the same data for the CCA
region, presented in Tab. 3 and Fig. 5, shows less homogeneity compared with the CWT approach.
Note that strong prior knowledge is required by AMARES to obtain these ratios estimation along
with numerous pre-processing steps. We also observe in Tab. 2 that the standard deviations of
metabolite ratios in the CCA with our method is lower than those computed with AMARES pre-
sented in Tab. 3. Note that our method allows a good estimation for Naa/CR unlike AMARES
which t-test rejects its estimation.
In addition, it is important to mention that these preprocessing steps used before the quantifica-
tion might severely affect the analysis process, furthermore, removing the baseline beforehand and
reducing the noise are unrecoverable, therefore if one of the peaks of interest in the MRS spectrum
was removed by these preprocessing tools, it can never be recuperated in the later analysis, during
11

the quantification.
In some cases, such as in the Striatum results for patient no5, the ratios diverge severely from
the normal values and this is normal because in this spectrum the peaks are buried in noise. Note
that, all the quantification method will give similar results in this case and the noise level here
is considered unacceptable. So even though the analysis using this method could be performed
automatically, this doesnt assure good results for severely distorted MRS acquisitions, hence the
examination of results by a qualified spectroscopist or radiologist is necessary before interpreting
the metabolic ratios.
1 Conclusions
In this work, an automatic MRS analysis system based on the Continuous Wavelet Transform was
proposed. This method starts with a peak detection algorithm that identifies the location of each
peak in the MRS spectrum. After that, the amplitudes of the metabolites of interest are estimated
and the ratios are computed. Note that to select the right mother wavelet, the Mean Square Error
(MSE) was computed and based on the results, two different mother wavelets were considered,
which gave the lowest values of the MSE: Mexican Hat for peak detection and Morlet for the
quantification. According to the results, the CWT analysis has shown to be accurate, robust and
in agreement with the time domain fitting method AMARES for the quantification of short echo
time in vivo MRS data without any preprocessing beforehand or user interaction. As future work,
we aim to compare this method to other existing methods such as Tarquin, AMARES, QUEST
using data acquired from healthy patients and patients suffering from different pathologies and
finally we aim to improve this method and make it suitable for Multivoxel studies. Moreover we
propose introducing an adapted denoising method to increase the robustness of this method against
the noise.
References
[1] Jean-Pierre Antoine, Alain Coron, et al. Time-frequency and time-scale approach to magnetic
resonance spectroscopy. Journal of Computational Methods in Sciences and Engineering, 1(2-
3):327–352, 2001.
12

[2] Jean-Pierre Antoine, Romain Murenzi, Pierre Vandergheynst, and Syed Twareque Ali. Two-
dimensional wavelets and their relatives. Cambridge University Press, 2004.
[3] H Barkhuijsen, R De Beer, WMMJ Bovee, JHN Creyghton, and D Van Ormondt. Application
of linear prediction and singular value decomposition (lpsvd) to determine nmr frequencies
and intensities from the fid. Magnetic Resonance in Medicine, 2(1):86–89, 1985.
[4] Felician Dancea and Ulrich Gunther. Automated protein nmr structure determination using
wavelet de-noised noesy spectra. Journal of biomolecular NMR, 33(3):139–152, 2005.
[5] Ingrid Daubechies et al. Ten lectures on wavelets, volume 61. SIAM, 1992.
[6] AA De Graaf and WMMJ Bovee. Improved quantification of in vivo1h nmr spectra by opti-
mization of signal acquisition and processing and by incorporation of prior knowledge into the
spectral fitting. Magnetic Resonance in Medicine, 15(2):305–319, 1990.
[7] Pan Du, Warren A Kibbe, and Simon M Lin. Improved peak detection in mass spec-
trum by incorporating continuous wavelet transform-based pattern matching. Bioinformatics,
22(17):2059–2065, 2006.
[8] Filip Jiru. Introduction to post-processing techniques. European journal of radiology,
67(2):202–217, 2008.
[9] A Knijn, R De Beer, and D Van Ormondt. Frequency-selective quantification in the time
domain. Journal of Magnetic Resonance (1969), 97(2):444–450, 1992.
[10] Reto Koradi, Martin Billeter, Max Engeli, Peter Guntert, and Kurt Wuthrich. Automated
peak picking and peak integration in macromolecular nmr spectra using autopsy. Journal of
Magnetic Resonance, 135(2):288–297, 1998.
[11] Luigi Landini, Vincenzo Positano, and Maria Santarelli. Advanced image processing in mag-
netic resonance imaging. CRC press, 2005.
[12] Teresa Laudadio. Subspace-based quantification of magnetic resonance spectroscopy data using
biochemical prior knowledge. PhD thesis, Faculty of Engineering, KU Leuven, 2005.
[13] Luca T Mainardi, Daniela Origgi, Pietro Lucia, Giuseppe Scotti, and Sergio Cerutti. A wavelet
packets decomposition algorithm for quantification of in vivo 1 h-mrs parameters. Medical
engineering & physics, 24(3):201–208, 2002.
13
[14] Pravat K Mandal. In vivo proton magnetic resonance spectroscopic signal processing for the
absolute quantitation of brain metabolites. European Journal of Radiology, 81(4):e653–e664,
2012.
[15] A Naressi, C Couturier, JM Devos, M Janssen, C Mangeat, R De Beer, and D Graveron-
Demilly. Java-based graphical user interface for the mrui quantitation package. Magnetic
Resonance Materials in Physics, Biology and Medicine, 12(2-3):141–152, 2001.
[16] Dwight G Nishimura. Principles of magnetic resonance imaging. Standford Univ., 2010.
[17] Jean-Baptiste Poullet, Diana M Sima, Arjan W Simonetti, Bart De Neuter, Leentje Van-
hamme, Philippe Lemmerling, and Sabine Van Huffel. An automated quantitation of short
echo time mrs spectra in an open source software environment: Aqses. NMR in Biomedicine,
20(5):493–504, 2007.
[18] Jean-Baptiste Poullet, Diana M Sima, and Sabine Van Huffel. Mrs signal quantitation: a
review of time-and frequency-domain methods. Journal of Magnetic Resonance, 195(2):134–
144, 2008.
[19] Jean-Baptiste Poullet, Diana M Sima, Sabine Van Huffel, and Paul Van Hecke. Frequency-
selective quantitation of short-echo time 1 h magnetic resonance spectra. Journal of Magnetic
Resonance, 186(2):293–304, 2007.
[20] Stephen W Provencher. Automatic quantitation of localized in vivo1h spectra with lcmodel.
NMR in Biomedicine, 14(4):260–264, 2001.
[21] H Ratiney, M Sdika, Y Coenradie, S Cavassila, D van Ormondt, and D Graveron-
Demilly. Time-domain semi-parametric estimation based on a metabolite basis set. NMR
in Biomedicine, 18(1):1–13, 2005.
[22] Mark J Shensa. The discrete wavelet transform: wedding the a trous and mallat algorithms.
Signal Processing, IEEE Transactions on, 40(10):2464–2482, 1992.
[23] Truda Shonk and Brian D Ross. Role of increased cerebral myo-inositol in the dementia of
down syndrome. Magnetic resonance in medicine, 33(6):858–861, 1995.
[24] Aimamorn Suvichakorn, Helene Ratiney, Adriana Bucur, Sophie Cavassila, and Jean-Pierre
Antoine. Quantification method using the morlet wavelet for magnetic resonance spectroscopic
14

signals with macromolecular contamination. In Engineering in Medicine and Biology Society,
2008. EMBS 2008. 30th Annual International Conference of the IEEE, pages 2681–2684. IEEE,
2008.
[25] A Suvichakorna, H Ratiney, JP Antoine, and S Cavassila. Wavelet-based Techniques in MRS.
INTECH Open Access Publisher, 2010.
[26] A Van den Boogaart. Quantitative data analysis of in vivo mrs data sets. Magnetic resonance
in chemistry, 35(13):S146–S152, 1997.
[27] JWC Van der Veen, R De Beer, PR Luyten, and D Van Ormondt. Accurate quantification of
in vivo31p nmr signals using the variable projection method and prior knowledge. Magnetic
Resonance in Medicine, 6(1):92–98, 1988.
[28] Leentje Vanhamme, Aad van den Boogaart, and Sabine Van Huffel. Improved method for
accurate and efficient quantification of mrs data with use of prior knowledge. Journal of
Magnetic Resonance, 129(1):35–43, 1997.
Figure 1:
15

Figure 2:
Figure 3:
16

Figure 4:
17

Figure 5:
18

Table 1: Comparison between the real values of the frequencies of the peaks and the detected ones.
Detected Values 2 Real Values Error (in %)
1 18.4462749 15 22.962 239.801573 250 4.083 313.586673 320 2.004 387.371772 380 1.945 510.346938 500 2.076 657.917137 643 2.327 953.057535 950 0.3228 1346.57807 1332 2.109 2000.559998 2000 0.0310 3043.881305 3037 0.2711 4002.841648 4000 0.07
Table 2: Metabolite ratios for the 16 healthy subjects in the CCP, Striatum and CCA, obtainedusing the CWT algorithm.
CCP Striatum
Patients Normal Simi- Patients Normal Simi-Values Values T-test larity Values Values T-test la rity
Mean ± SD Mean ± SD 99% Mean ± SD Mean ± SD 99%
Cho/Naa 0.42 ± 0.05 0.45 ± 1.12 0.07694 True 0.61 ± 0.17 0.65 ± 1 0.1060 TrueCho/Cr 0.67 ± 0.07 0.61 ± 0.09 1.3989 True 0.74 ± 0.08 0.73 ± 0.06 0.4085 TrueNaa/Cr 1.61 ± 0.17 1.36 ± 0.08 3.6180 False 1.35 ± 0.58 1.13 ± 0.06 1.0240 TrueNaa/Cho 2.42 ± 0.28 2.23 ± 0.8 0.6118 True 1.82 ± 0.81 1.5 0.9084 TrueMyo/Cr 0.51 ± 0.07 0.57 ± 0.05 1.7113 True 0.6 ± 0.18 0.44 ± 0.04 2.3646 True
CCA
Patients Normal Simi-Values Values T-test larity
Mean ± SD Mean ± SD 99%
Cho/Naa 0.66 ± 0.10 0.45 ± 1.12 0.5078 TrueCho/Cr 0.86 ± 0.10 0.61 ± 0.09 5.1142 FalseNaa/Cr 1.32 ± 0.18 1.36 ± 0.08 0.4892 TrueNaa/Cho 1.55 ± 0.25 2.23 ± 0.8 2.2158 TrueMyo/Cr 0.67 ± 0.14 0.57 ± 0.05 1.9387 True
Table 3: Metabolite ratios for the 16 healthy subjects in the CCA, obtained using the AMARES.Patient Normal Simi-Values Values T-test larity
Mean ± SD Mean ± SD 99%
Cho/Naa 0.54 ± 0.14 0.45 ± 1.12 0.2266 TrueCho/Cr 0.88 ± 0.1 0.61 ± 0.09 5.5856 FalseNaa/Cr 1.69 ± 0.32 1.36 ± 0.08 2.7402 FalseNaa/Cho 1.94 ± 0.47 2.23 ± 0.8 0.8634 TrueMyo/Cr 1.05 ± 1.1 0.57 ± 0.05 1.2015 True
19

List of Figures
1 Analyzed signal s(t) in the frequency domain containing eleven different frequencies
and its scalogram which represents the percentage of energy for each wavelet coefficient. 15
2 Simulated MRS spectrum before and after adding baseline and noise: (a) signal in
the frequency domain, (b) signal with the modelled baseline in the frequency domain. 16
3 Extracted values of amplitudes versus the real values for each metabolite from a
model signal with noise (SNR=10) and modeled baseline. . . . . . . . . . . . . . . . 16
4 Metabolite ratios from the (a) CCP, (b) Striatum and (c) CCA in each patient using
the CWT. . . . . . . . . . . . . . . . . . . . . . . . . . . . . . . . . . . . . . . . . . . 17
5 Metabolite ratios from the CCA in each patient using AMARES. . . . . . . . . . . . 18
20