Bearing fault detection of induction motor using wavelet and Support Vector Machines (SVMs)
9
Applied Soft Computing 11 (2011) 4203–4211 Contents lists available at ScienceDirect Applied Soft Computing journal homepage: www.elsevier.com/locate/asoc Bearing fault detection of induction motor using wavelet and Support Vector Machines (SVMs) P. Konar, P. Chattopadhyay ∗ Electrical Engineering Department, Bengal Engineering and Science University, Shibpur, Howrah, West Bengal 711103, India article info Article history: Received 1 October 2009 Received in revised form 22 November 2010 Accepted 20 March 2011 Available online 25 March 2011 Keywords: Condition monitoring Induction motor Bearing fault Continuous wavelet transform (CWT) Support Vector Machine (SVM) abstract Condition monitoring of induction motors is a fast emerging technology in the field of electrical equip- ment maintenance and has attracted more and more attention worldwide as the number of unexpected failure of a critical system can be avoided. Keeping this in mind a bearing fault detection scheme of three-phase induction motor has been attempted. In the present study, Support Vector Machine (SVM) is used along with continuous wavelet transform (CWT), an advanced signal-processing tool, to analyze the frame vibrations during start-up. CWT has not been widely applied in the field of condition monitoring although much better results can been obtained compared to the widely used DWT based techniques. The encouraging results obtained from the present analysis is hoped to set up a base for condition monitor- ing technique of induction motor which will be simple, fast and overcome the limitations of traditional data-based models/techniques. © 2011 Elsevier B.V. All rights reserved. 1. Introduction Induction motors known as workhorse of modern industries are subjected to some undesirable stresses during their operating lifetime, causing some faults to develop leading to failures [5,16]. Heavy reliance of industry on these machines in critical applications makes catastrophic motor failures very expensive. Thus, finding an efficient and reliable fault diagnostic technique, especially for induction motors, is extremely important due to widespread use of automation and consequent reduction in direct man–machine interface to supervise the system operation. During the last decade different kinds of data-based models such as Neural Networks (NNs) have established a firm position in condition monitoring of electrical machinery. Vibration analysis has been used in rotating machines fault diag- nosis for decades [2–4,19,22]. In [4], it is claimed that vibration monitoring is the most reliable method of assessing the overall health of rotor system. Each fault in a rotating machine produces vibrations with distinctive characteristics that can be measured and compared with reference ones in order to perform the fault detection and diagnosis. Traditional techniques like Fast Fourier Transform (FFT) used for analysis of the vibration signal is not appropriate to analyze sig- ∗ Corresponding author. Tel.: +91 9231664811. E-mail addresses: [email protected] (P. Konar), paramita [email protected] (P. Chattopadhyay). nals that have a transitory characteristic. Moreover, the analysis is greatly dependent on the machine load and correct identification of very closed fault frequency components requires a very high- resolution data [10]. Wavelet a very powerful signal-processing tool can be used to analyze transients signal and thus eliminating load dependency. Variable window size allows the possibility to extract both low frequency as well as high frequency information as per requirement. Keeping these points in mind the investigation aims to design and develop an on-line monitoring and incipient fault detection scheme of induction motors by assessing the signa- ture of the motor frame vibrations (g frame ) signals during start-up [4,11]. Continuous wavelet transform (CWT) used to extract the local information content of the data has several advantages over the more commonly used DWT [28,29] which uses a set of orthogonal wavelet bases to obtain the most compact representation of the data mainly useful for image compression. The CWT on the other hand uses a set of non-orthogonal wavelet frames to provide highly redundant information that is very good for detection of various types of faults. Wavelet coefficient at each analysis scale can be obtained allowing us to characterize the local information content. Moreover, CWT is easier to interpret since its redundancy tends to reinforce the traits and makes all information more visible which is especially true for very subtle information. Thus, CWT analysis gains in “readability” and in ease of interpretation, what it losses in terms of saving space, which is immaterial in signal process- ing technique where very important distinct informative feature extraction is the most important. 1568-4946/$ – see front matter © 2011 Elsevier B.V. All rights reserved. doi:10.1016/j.asoc.2011.03.014
Transcript of Bearing fault detection of induction motor using wavelet and Support Vector Machines (SVMs)

Journal Identification = ASOC Article Identification = 1146 Date: May 12, 2011 Time: 4:26 pm
BM
PE
a
ARR2AA
KCIBCS
1
alHmaioid(e
nmhvad
f
p
1d
Applied Soft Computing 11 (2011) 4203–4211
Contents lists available at ScienceDirect
Applied Soft Computing
journa l homepage: www.e lsev ier .com/ locate /asoc
earing fault detection of induction motor using wavelet and Support Vectorachines (SVMs)
. Konar, P. Chattopadhyay ∗
lectrical Engineering Department, Bengal Engineering and Science University, Shibpur, Howrah, West Bengal 711103, India
r t i c l e i n f o
rticle history:eceived 1 October 2009eceived in revised form2 November 2010ccepted 20 March 2011vailable online 25 March 2011
a b s t r a c t
Condition monitoring of induction motors is a fast emerging technology in the field of electrical equip-ment maintenance and has attracted more and more attention worldwide as the number of unexpectedfailure of a critical system can be avoided. Keeping this in mind a bearing fault detection scheme ofthree-phase induction motor has been attempted. In the present study, Support Vector Machine (SVM) isused along with continuous wavelet transform (CWT), an advanced signal-processing tool, to analyze theframe vibrations during start-up. CWT has not been widely applied in the field of condition monitoring
eywords:ondition monitoring
nduction motorearing faultontinuous wavelet transform (CWT)
although much better results can been obtained compared to the widely used DWT based techniques. Theencouraging results obtained from the present analysis is hoped to set up a base for condition monitor-ing technique of induction motor which will be simple, fast and overcome the limitations of traditionaldata-based models/techniques.
© 2011 Elsevier B.V. All rights reserved.
upport Vector Machine (SVM). Introduction
Induction motors known as workhorse of modern industriesre subjected to some undesirable stresses during their operatingifetime, causing some faults to develop leading to failures [5,16].eavy reliance of industry on these machines in critical applicationsakes catastrophic motor failures very expensive. Thus, finding
n efficient and reliable fault diagnostic technique, especially fornduction motors, is extremely important due to widespread usef automation and consequent reduction in direct man–machinenterface to supervise the system operation. During the last decadeifferent kinds of data-based models such as Neural NetworksNNs) have established a firm position in condition monitoring oflectrical machinery.
Vibration analysis has been used in rotating machines fault diag-osis for decades [2–4,19,22]. In [4], it is claimed that vibrationonitoring is the most reliable method of assessing the overall
ealth of rotor system. Each fault in a rotating machine producesibrations with distinctive characteristics that can be measurednd compared with reference ones in order to perform the fault
etection and diagnosis.Traditional techniques like Fast Fourier Transform (FFT) usedor analysis of the vibration signal is not appropriate to analyze sig-
∗ Corresponding author. Tel.: +91 9231664811.E-mail addresses: [email protected] (P. Konar),
aramita [email protected] (P. Chattopadhyay).
568-4946/$ – see front matter © 2011 Elsevier B.V. All rights reserved.oi:10.1016/j.asoc.2011.03.014
nals that have a transitory characteristic. Moreover, the analysis isgreatly dependent on the machine load and correct identificationof very closed fault frequency components requires a very high-resolution data [10]. Wavelet a very powerful signal-processingtool can be used to analyze transients signal and thus eliminatingload dependency. Variable window size allows the possibility toextract both low frequency as well as high frequency informationas per requirement. Keeping these points in mind the investigationaims to design and develop an on-line monitoring and incipientfault detection scheme of induction motors by assessing the signa-ture of the motor frame vibrations (gframe) signals during start-up[4,11].
Continuous wavelet transform (CWT) used to extract the localinformation content of the data has several advantages over themore commonly used DWT [28,29] which uses a set of orthogonalwavelet bases to obtain the most compact representation of thedata mainly useful for image compression. The CWT on the otherhand uses a set of non-orthogonal wavelet frames to provide highlyredundant information that is very good for detection of varioustypes of faults. Wavelet coefficient at each analysis scale can beobtained allowing us to characterize the local information content.Moreover, CWT is easier to interpret since its redundancy tends toreinforce the traits and makes all information more visible whichis especially true for very subtle information. Thus, CWT analysis
gains in “readability” and in ease of interpretation, what it lossesin terms of saving space, which is immaterial in signal process-ing technique where very important distinct informative featureextraction is the most important.
Journal Identification = ASOC Article Identification = 1146 Date: May 12, 2011 Time: 4:26 pm
4204 P. Konar, P. Chattopadhyay / Applied Soft Computing 11 (2011) 4203–4211
rti
fSphiAbttwcSt
2
TonFs
2
t
Fig. 1. Percentage occurrence of induction motor faults [1].
Among various motor faults the proposed investigation has beenestricted to bearing faults only since motor reliability studies showshat bearing faults accounts for 44% of the faults occurring in annduction motor as shown in Fig. 1.
In recent years, Support Vector Machines (SVMs) have beenound to be remarkably effective in many real-world applications.VMs have been successfully applied in various classification andattern recognition tasks, but in the area of fault diagnostics theyave not been widely studied. SVMs are based on statistical learn-
ng theory and they specialize for smaller number of samples [13].s it is hard to obtain sufficient fault samples in practice, SVMs haveeen applied for machinery fault diagnosis. It is believed that theseechniques along with advanced signal processing tools like instan-aneous power FFT, Park’s transformation, bispectrum, waveletsill have significant role in electric drive system diagnosis. The
urrent research works have obtained encouraging results by usingupport Vector Machine (SVM) [18] as a fault classifier to identifyhe machine faults.
. Proposed method
The schematic representation of the work is shown in Fig. 3.he scheme consists of four major parts, namely (i) simulationf different induction motor faults, (ii) data acquisition, (iii) sig-al processing and (iv) Post Processing and Diagnosis using SVM.or identifying the faults motor frame vibration (gframe) signals attart-up are monitored and diagnosed.
Photograph of the experimental setup is presented in Fig. 2.
.1. Simulation of faults
Machinery Fault Simulator (MFS), a tool for simulating variousypes of induction motor faults initially fitted with a healthy motor
Fig. 2. Photograph of Machinery Fault Simulator (MFS).
Fig. 3. Schematic diagram of the work.
and a motor with faulted bearings of same specification has beenused for the fault simulation [24].
2.2. Data acquisition
The generated data corresponding to a particular motor con-dition were collected using an accelerometer probe, recorded andstored using a computer with four-channel data acquisition system(DAQ) [24]. The collection was done for both healthy motor and amotor with faulted bearings under the same running conditions.Time domain frame vibration signal for healthy motor and faultymotor with faulted bearing are shown in Fig. 4(a) and (b).
2.3. Signal processing
2.3.1. Continuous wavelet transform (CWT)The wavelet transform or wavelet analysis is probably the most
recent solution to overcome the shortcomings of the tradition-ally used Fourier transform [17,20,21]. Wavelets are well suitedfor approximating data with sharp discontinuities. Motor startingvibration contains numerous non-stationary or transitory charac-teristics: drift, trends, abrupt changes, and beginnings and ends ofevents. These characteristics are often the most important part ofthe signal, and traditional tools like Fourier analysis are not suitedfor analyzing non-stationary or transitory signals. Fourier analysisis only suitable for steady state analysis consisting of stationary sig-nals – where only the signal’s frequency content is needed. Whenlooking at Fourier transform of a signal, it is impossible to tell whena particular event took place, since in transforming to the frequencydomain, time information is lost. While in short time Fourier trans-form (STFT) compromises between time and frequency informationcan be useful, the drawback is that once a particular size timewindow is chosen, that window is the same for all frequencies.In wavelet analysis the use of a fully scalable modulated windowsolves the signal-cutting problem. The window is shifted along thesignal and for every position the spectrum is calculated. Then thisprocess is repeated many times with a slightly shorter (or longer)
window for every new cycle. In wavelet analysis, the scale plays aspecial role. Wavelet algorithms process data at different scales orresolutions. If we look at a signal with a large “window”, we wouldnotice gross features. Similarly, if we look at a signal with a small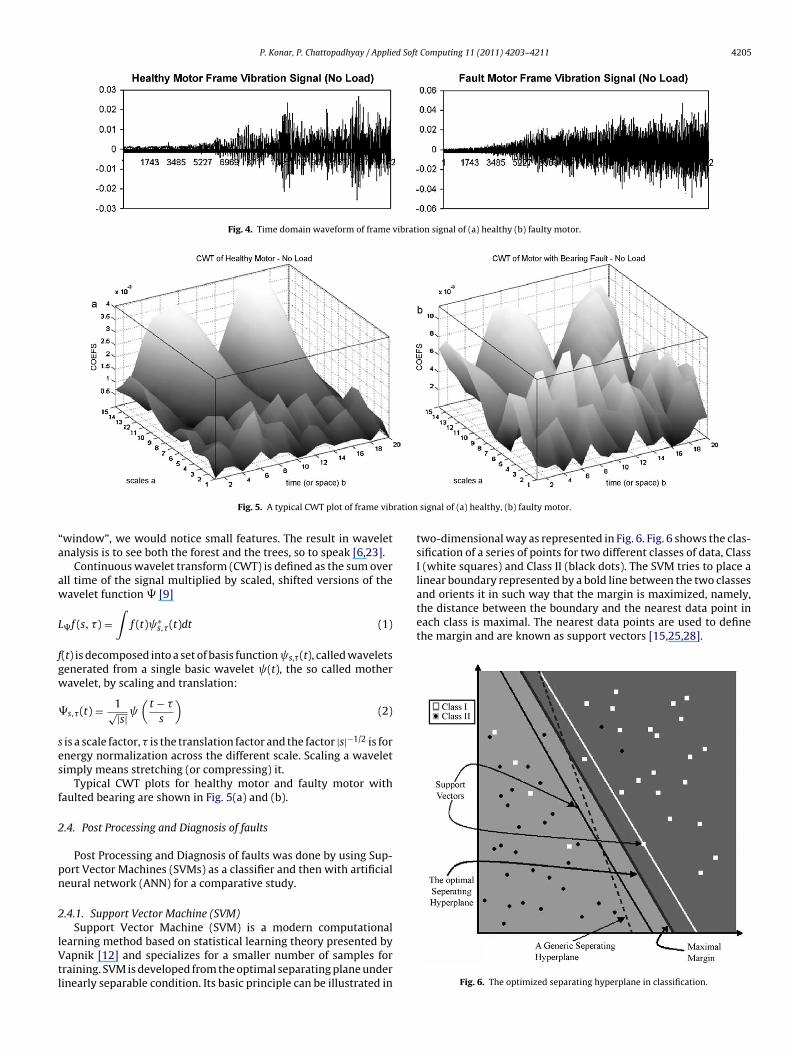
Journal Identification = ASOC Article Identification = 1146 Date: May 12, 2011 Time: 4:26 pm
P. Konar, P. Chattopadhyay / Applied Soft Computing 11 (2011) 4203–4211 4205
Fig. 4. Time domain waveform of frame vibration signal of (a) healthy (b) faulty motor.
ration
“a
aw
L
fgw
�
ses
f
2
pn
2
lVtl
and orients it in such way that the margin is maximized, namely,the distance between the boundary and the nearest data point ineach class is maximal. The nearest data points are used to definethe margin and are known as support vectors [15,25,28].
Fig. 5. A typical CWT plot of frame vib
window”, we would notice small features. The result in waveletnalysis is to see both the forest and the trees, so to speak [6,23].
Continuous wavelet transform (CWT) is defined as the sum overll time of the signal multiplied by scaled, shifted versions of theavelet function� [9]
�f (s, �) =∫f (t) ∗
s,�(t)dt (1)
(t) is decomposed into a set of basis function s,�(t), called waveletsenerated from a single basic wavelet (t), the so called motheravelet, by scaling and translation:
s,�(t) = 1√|s| (t − �s
)(2)
is a scale factor, � is the translation factor and the factor |s|−1/2 is fornergy normalization across the different scale. Scaling a waveletimply means stretching (or compressing) it.
Typical CWT plots for healthy motor and faulty motor withaulted bearing are shown in Fig. 5(a) and (b).
.4. Post Processing and Diagnosis of faults
Post Processing and Diagnosis of faults was done by using Sup-ort Vector Machines (SVMs) as a classifier and then with artificialeural network (ANN) for a comparative study.
.4.1. Support Vector Machine (SVM)Support Vector Machine (SVM) is a modern computational
earning method based on statistical learning theory presented byapnik [12] and specializes for a smaller number of samples for
raining. SVM is developed from the optimal separating plane underinearly separable condition. Its basic principle can be illustrated in
signal of (a) healthy, (b) faulty motor.
two-dimensional way as represented in Fig. 6. Fig. 6 shows the clas-sification of a series of points for two different classes of data, ClassI (white squares) and Class II (black dots). The SVM tries to place alinear boundary represented by a bold line between the two classes
Fig. 6. The optimized separating hyperplane in classification.

Journal Identification = ASOC Article Identification = 1146 Date: May 12, 2011 Time: 4:26 pm
4 d Soft Computing 11 (2011) 4203–4211
btoe
f
wt
ttimo
iltmfrApt
2
denaascao
efppkbseopimwft
˛
(m
tions and implemented in MATLAB 6.5 environment [14]. The CWTcoefficients thus obtained were prepared and analyzed with thehelp of SVM/ANN as a fault classifier.
206 P. Konar, P. Chattopadhyay / Applie
Let Xi = (x1i, x2i,. . .,xni)T, i = 1,. . .,M, be a sample of x∈Rn andelong to Class I or Class II. For linearly separable data, it is possibleo determine a hyperplane that separates the data leaving one classn each side of the hyperplane. This plane can be described by thequation [18]:
(x) = wT x + b =n∑j=1
wjxj + b = 0 (3)
here w ∈Rn is a weight vector and b is a scalar. The vector w andhe scalar b determine the position of the separating hyperplane.
Let us define the label yi associated to xi as yi = 1 if xi belongso Class I, yi = −1 for Class II. A separating hyperplane satisfieshe constraints f(xi) ≥ 0, if yi = +1 and f(xi) < 0, if yi = −1. If thisnequality condition holds that is for linearly separable case opti-
al hyperplane is found by solving the following convex quadraticptimization problem:
minimize � = 12
||w||2subject to yi(wTxi + b) ≥ 1
(4)
For non-linear classification problem, the linear boundary in thenput space is not enough to separate the two classes properly. Non-inear mapping is used to generate the classification features fromhe original data. The non-linearly separable data to be classified is
apped by using a transformation �(x) onto a high-dimensionaleature space, where the data can be linearly classified or sepa-ated [12]. A kernel function is used to perform the transformation.mong the kernel functions in common use are linear functions,olynomials functions, radial basis functions multi layered percep-ron and sigmoid functions.
.4.2. Artificial neural network (ANN)Artificial neural networks (ANNs) are among the widely studied
ata-based model which has generated considerable interest in thengineering field as a problem solving tool. In engineering, neuraletworks serve two important functions: as pattern classifiers ands nonlinear adaptive filters. At present, artificial neural networksre emerging as the technology of choice for many applications,uch as pattern recognition, prediction, system identification, andontrol. An artificial neural network is a system based on the oper-tion of biological neural networks, in other words, is an emulationf biological neural system [26,31,32].
An artificial neural network is an adaptive, most often nonlin-ar system that learns to perform a function (an input/output map)rom data and does not need to be reprogrammed once it is com-letely trained. A neural network is a massively parallel distributedrocessor that has a natural propensity for storing experientialnowledge and making it available for use. Knowledge is acquiredy the network through a learning process. The interconnectiontrengths known as synaptic weights are used to store the knowl-dge. A model of a neuron is shown in Fig. 7. A single neuron consistsf synapses, adder and an activation function. Bias is an externalarameter of neural network. Each node in a layer (except the ones
n the input layer) provides a threshold of a single value by sum-ing up their input value xi with the corresponding weight valuei. This weighted value �wixi is added up with the bias term b to
orm the net input which goes into transfer function f to produceshe neuron output a [28].
= f(
r∑wi.pi + b
)(5)
i=
In this study, multilayer feed-forward back-propagation NNFFBPN) is used as shown in Fig. 8 [27]. This is a supervised learning
ethod where an input (xi) is presented to the neural network and
Fig. 7. A neuron.
a corresponding desired output or target (tn) response set at theoutput:
{x1, t1}, { x2, t2}, . . . , {xn, tn}
where xn is an input to network and tn is the corresponding outputtarget.
The resultant outputs produced by the network are comparedwith that of the desired ones (targets) and normalized mean squareerror (MSE) is calculated and propagated backwards to adjust thevalue of the weights on the neural connection in the multiple layers.The process is repeated until the MSE is reduced to an acceptablylow value suitable to classify the test set correctly [28].
For supervised learning the performance of the network hingesheavily on the training data. If one does not have data that cover asignificant portion of the operating conditions or if they are noisy,then neural network technology is probably not the right solution.On the other hand, if there is plenty of data and the problem ispoorly understood to derive an approximate model, then neuralnetwork technology is a good choice.
3. Results and analysis
The frame vibrations signal of the healthy and the faulty motorsat the time of starting were collected through DAQ at a samplingfrequency of 7680 Hz. The supply frequency was set to 50 Hz. Theexperiments were carried out under three different loading con-ditions: no-load, half load and full load. The recorded data weredecomposed using CWT [6,8]. In this investigation ‘morlet’ and‘daubechies10’ have been used as mother wavelet for all CWT opera-
Fig. 8. Artificial neural network.

Journal Identification = ASOC Article Identification = 1146 Date: May 12, 2011 Time: 4:26 pm
P. Konar, P. Chattopadhyay / Applied Soft Computing 11 (2011) 4203–4211 4207
3
uf5apc
Fmtwm(lasc
3
ifi
Fig. 9. The impact of mother wavelet selection in faulty motor detection.
.1. Data preparation
Training and testing data files were created for analysis of start-p frame vibration signal. 50 (25 + 25) feature samples were takenrom each motor condition and each loading situation (in total:0 × 3 = 150 samples). 60 (20 × 3) of the samples from both healthynd faulty motors were used in training the classifier (120 sam-les) and 30 (15 + 15) remaining samples left were used to test thelassifier’s generalization ability.
Each of the 150 feature samples was decomposed using CWT.rom the results presented in Fig. 9, it is obvious that the choice ofother wavelet is crucial to the development of a good fault detec-
ion algorithm. Analysis was carried out with different waveletsith a scale range of (1–15), to account for the high frequency infor-ation, while selecting the best wavelet. A wavelet scale range of
1–8) was also taken to study the effect of scale. From Fig. 9 ‘mor-et’ and ‘daubechies10’ wavelets were found to be the best choicend used for further study. Three types of statistical data: root meanquare (RMS), crest and kurtosis values were evaluated from the CWToefficients for each loading condition and treated as attributes.
.2. Training
The training of the SVM model with real time data sets wasmplemented with the help of LIBSVM software [33]. In SVM classi-cation, radial basis kernel functions (RBFs) were considered. The
Fig. 10. Classification accuracy for different values of c
Fig. 11. The SVM model for Two Class Classification [C = 106, g = 10−6].
optimized model with minimum the number of SVs was consid-ered, since lesser the number of SVs better the generalization [18].The cost (c) gamma (g) parameters were varied for determining theoptimized model. It was found the optimized model was obtainedfor cost value c = 2 and gamma value g = 0.5 (Fig. 10).
The SVM models obtained (neglecting kurtosis attributes, sinceonly two dimensional can be represented) for different values ofcost (c) and gamma (g) after training for two-class classification are
shown in Figs. 11–13. The models were obtained using KSVM Mat-lab toolbox [34] and implemented in Matlab 6.5. Fig. 11 shows themost optimized result for cost c = 106 and gamma g = 10−6. All datawhich are on the left of the separating hyperplane were detectedost function (a) C = 1, (b) C = 2, (c) C = 4, (d) C = 4.

Journal Identification = ASOC Article Identification = 1146 Date: May 12, 2011 Time: 4:26 pm
4208 P. Konar, P. Chattopadhyay / Applied Soft Computing 11 (2011) 4203–4211
ab
ovtots
i
Fig. 12. The SVM model for Two Class Classification [C = 103, g = 10−6].
s healthy and that on the right hand as faulty motor with faultedearings.
It can be seen from Fig. 11 that the number of SVs for the mostptimized two-class model is eight. Figs. 12 and 13 were obtainedarying cost function (c) to 103 and gamma (g) to 10−3, respec-ively. In both of this model the number of SVs increased and theptimized model could not be achieved. Thus it can be seen that
he cost and gamma parameters should be selected in such a wayo as to minimize the number of SVs.The training of the NN with real time data sets was implementedn MATLAB (6.5) with the help of ANN toolbox [7]. A three layer feed
Fig. 13. The SVM model for Two Class Classification [C = 106, g = 10−3].
Fig. 14. ANN structure used in classification.
forward neural network was trained by back propagation trainingalgorithm. Training has been tried with different number of lay-ers and types of layers. The optimized results were obtained withthree layer feed forward neural network as shown in Fig. 14. Backpropagation algorithm has been implemented because this algo-rithm is most popular and successful neural network architecturefor supervised learning. It is based on the weight error correctionrules. It is considered a generalization of the delta rule for nonlinearactivation functions and multilayer networks. The NN architectureused is presented in Fig. 14, the activation functions at the hid-den layers and output layer in the network are tan sigmoid andlog sigmoid respectively. The log-sigmoid transfer function is cho-sen because its output range (from zero to one) suits to outputBoolean values. The number of neurons in a hidden layer has astrong impact on the performance of the network. With a largenumber of hidden neurons, it is possible to achieve excellent perfor-mance in the training set, but this does not necessarily lead to goodgeneralization ability and high accuracy in the evaluation set. Aftera number trails the network with three (8 × 9 × 8) hidden neuronswas selected as the most optimized model giving the best overallaccuracy.
3.3. Testing
After successful training the optimized SVM model obtained wasused to test the testing file to test the generalization ability of theclassifier. The testing file consists of data points unknown to theSVM model. The classification ability of SVM for fault predictionusing ‘morlet’ and ‘daubechies10’ are summarized in Tables 1 and 2for a wavelet scale range of (1–15). The classification ability forscale range of (1–8) is presented in Tables 3 and 4. These resultshave been compared with ANN model [30]. The data distributionsare depicted in Figs. 15–17.
Figs. 15–17 shows the 3D data distribution plots of the samplesunder study. As seen in Fig. 15 the training dataset of faulty sam-ples with bearing fault were found to be scattered in the right halfwhereas the healthy motor data are scattered on the left half. Thehealthy data are represented by squares and bearing fault by boldcircles.
In Figs. 16 and 17 the data distribution for training as well test-
ing/predicted data are shown. Squares and bold circles show thetraining data. The triangles represent healthy test data and circlesrepresent bearing fault test/predicted data.
Journal Identification = ASOC Article Identification = 1146 Date: May 12, 2011 Time: 4:26 pm
P. Konar, P. Chattopadhyay / Applied Soft Computing 11 (2011) 4203–4211 4209
Fig. 15. The 3D plot showing training data distribution for morlet wavelet scale (a) 1–15, (b) 1–8.
Fig. 16. The 3D plot showing training and testing data distribution morlet wavelet for scale (a) 1–15, (b) 1–8.
Table 1Correct level of classification using frame vibration as the medium of fault detection. Wavelet scale: 1–15, classifier: SVM.
Testing success (%)Mother wavelet: morlet
Testing success (%)Mother wavelet: daubechies10
Healthymotor (%)
Faultymotor (%)
Total (%) Healthymotor(%)
Faultymotor (%)
Total (%)
No load 100 100 100 100 100 100Half load 100 100 100 100 100 100Full load 100 80 90 100 80 90Total 100 93.33 96.67 100 93.33 96.67

Journal Identification = ASOC Article Identification = 1146 Date: May 12, 2011 Time: 4:26 pm
4210 P. Konar, P. Chattopadhyay / Applied Soft Computing 11 (2011) 4203–4211
Fig. 17. The 3D plot showing training and predicted data distribution morlet wavelet for scale (a) 1–15, (b) 1–8.
Table 2Correct level of classification using frame vibration as the medium of fault detection. Wavelet scale: 1–15, classifier: ANN.
Testing success (%)Mother wavelet: morlet
Testing success (%)Mother wavelet: daubechies10
Healthymotor (%)
Faultymotor (%)
Total (%) Healthymotor(%)
Faultymotor (%)
Total (%)
No load 80 80 80 60 60 60Half load 100 100 100 80 60 70Full load 100 80 90 80 100 90Total 93.33 86.67 90 73.33 73.33 73.33
Table 3Correct level of classification using frame vibration as the medium of fault detection. Wavelet scale: 1–8, classifier: SVM.
Testing success (%)Mother wavelet: morlet
Testing success (%)Mother wavelet: daubechies10
Healthymotor (%)
Faultymotor (%)
Total (%) Healthymotor(%)
Faultymotor (%)
Total (%)
No load 100 100 100 100 100 100Half load 100 100 100 100 100 100Full load 100 100 100 100 100 100Total 100 100 100 100 100 100
Table 4Correct level of classification using frame vibration as the medium of fault detection. Wavelet scale: 1–8, classifier: ANN.
Testing success (%)Mother wavelet: morlet
Testing success (%)Mother wavelet: daubechies10
Healthymotor (%)
Faultymotor (%)
Total (%) Healthymotor(%)
Faultymotor (%)
Total (%)
No load 80 100 90 100 100 80Half load 100 100 100 80 100 100
06.67
4
ms
Full load 100 100 10Total 93.33 100 9
. Conclusion
In this paper bearing fault detection algorithm of an inductionotor using CWT as an advanced signal-processing tool is pre-
ented. With scale variation excellent results were obtained as
100 80 10093.33 93.33 93.33
compared to widely studied DWT based fault detection techniques[28–30]. CWT can be applied with higher resolution to extract infor-
mation with higher redundancy, that is, a very narrow range ofscales can be used to pull details from a particular frequency band.The choice of mother wavelet also plays a crucial role in the fault
Journal Identification = ASOC Article Identification = 1146 Date: May 12, 2011 Time: 4:26 pm
d Soft
dto
aricf
A
uwpat
R
[
[
[
[
[
[
[
[
[
[
[
[
[
[
[
[
[
[
[
[
[
[
[
[
[
tem protection and power system transient analysis. Her
P. Konar, P. Chattopadhyay / Applie
etection algorithm. The results obtained are very encouraging andhere is a great scope for extending this technique in identifyingther types of induction motor faults.
As a classifier SVM gives excellent result, which is very simplend easy to implement, compared to ANN based approach, whichequires an exhaustive task of trial and error process for determin-ng the most optimum model. Hence, a hybrid CWT–SVM approachan definitely be used as a better alternative to DWT/ANN basedault classification algorithm, which will be quite fast and efficient.
cknowledgments
The authors are thankful to AICTE and TEQIP (BESU, Shibpurnit), Govt. of India for their financial support toward the projectithout which it would have not been possible to carry out theresent work. The authors are also thankful to Council of Scientificnd Industrial Research (CSIR) for their support for continuation ofhis project.
eferences
[1] EPRI Publication EL-2678, Improved Motors for Utility Applications, vol. 1,October 1982.
[2] P.J. Tavner, B.G. Gaydon, D.M. Word, Monitoring generators and large motors,IEE Proceedings 133 (3) (1986) 181–189 (Part B).
[3] P.J. Tavner, J. Penman, Condition Monitoring of Electrical Machines, ResearchStudies Press Ltd., 1987.
[4] F. Nour, J.F. Watson, The monitoring and analysis of transient vibration signalsas a means of detecting faults in the three phase Induction Motor, in: Proceed-ings of 28th University Power Engineering Conference, vol. 1, 21–23 September,1993, pp. 178–181.
[5] R.R. Schoen, T.G. Habetlar, F. Kamran, Motor bearing damage detection usingstator current monitoring, IEEE Transactions on Industry Applications 31(1995) 1280–1286.
[6] A. Graps, An introduction to wavelets, IEEE Computational Science and Engi-neering 2 (2) (1995) 50–61.
[7] H. Demuth, M. Beale, User’s Guide for neural Network Toolbox for Use withMatlab, The Mathworks Inc., Natick, MA, 1998.
[8] J.S. Walker, A Primer on Wavelets and their Scientific Applications, Chapman& Hall/CRC, 1999.
[9] S. Nandi, H. Toliyat, Condition monitoring and fault diagnosis of electricalmachines – a review, in: IEEE-IAS Annual Meeting, vol. v1, 1999, pp. 197–204.
10] W.R. Finley, M.M. Hodowance, W.G. Holter, An analytical approach to solv-ing motor vibration problems, IEEE Transactions on Industry Applications 36(September/October (5)) (2000) 1467–1480.
11] M.E.H. Benbouzid, A review of induction motors signature analysis as a mediumfor faults detection, IEEE Transactions on Industrial Electronics 47 (October (5))(2000) 984–993.
12] V.N. Vapnik, The Nature of Statistical Learning Theory, Springer-Verlag, NewYork, 2000.
13] N. Cristianini, J. Shawe-Taylor, Support Vector Machines and other Kernel-Based Learning Methods, Cambridge University Press, 2000.
14] M. Misiti, Y. Misiti, G. Oppenheim, J.M. Misiti, Wavelet Toolbox User’s Guide,2001 (online). Available from: http://www.mathworks.com.
15] C-W Hsu, C-J Lin, A comparison of methods for multi-class support vectormachines, IEEE Transactions on Neural Networks 13 (2) (2002) 415–425.
16] V.G. Manohar, P. Kumar, Comprehensive predictive maintenance of electricalmotors in Indian nuclear plants, An International Journal of Nuclear Power 17(1–3) (2003) 39–44.
17] G.K. Singh, Saleh Al Kazzaz Sa’ad Ahmed, Vibration signal analysis usingwavelet transform for isolation and identification of electrical faults in induc-
tion machine, Electric Power System Research 68 (2004) 119–136, Availablefrom: www.sciencedirect.com.18] Twknillinen Korkeakoulu, Telniska Hogskola, Support Vector Machine BasedClassification in Condition Monitoring of Induction Motors, Helsinki Universityof Technology Control Engg. Lab, ESPOO, June, 2004.
Computing 11 (2011) 4203–4211 4211
19] H. Douglas, P. Pillay, A new algorithm for transient motor current signatureanalysis using wavelet, IEEE Transactions on Industrial Applications 40 (5)(2004) 1361–1368.
20] L. Zhang, W. Zhou, L. Jiao, Wavelet support vector machine, IEEE Transactionson System, Man and Cybernetics – Part B: Cybernetics 34 (1) (2004) 34–39.
21] L. Eren, M.J. Devaney, Bearing damage detection via wavelet packet decom-position of the stator current, IEEE Transactions on Instrumentation andMeasurement 53 (2) (2004).
22] S. Poyhonen, P. Jover, H. Hyotyniemi, Signal processing of vibrations for condi-tion monitoring of an induction motor, in: Control, Communications and SignalProcessing, 2004, First International Symposium on Digital Object Identifier,2004, pp. 499–502.
23] K.P. Soman, K.I. Ramachandran, Insight into Wavelets: From Theory to Practice,Prentice-Hall of India, 2004.
24] Spectra Quest Inc., User’s Manual, Machinery Fault Simulator, Spectra QuestInc., USA, 2005.
25] B.-S. Yang, T. Han, Z.-J. Yin, Fault diagnosis of rotating machinery based onmulti-class support vector machines, Journal of Mechanical Science and Tech-nology 19 (2005) 845–858.
26] B.-S. Yang, T. Han, Z.-J. Yin, Fault diagnosis system of induction motors usingfeature extraction, feature selection and classification algorithm, JSME Inter-national Journal Series C 49 (2006) 734–741.
27] I. Jung, G. Wang, Pattern classification of back-propagation algorithm usingexclusive connecting network, in: Proceedings of World Academy of Science,Engineering and Technology, vol. 26, December, 2007.
28] Commander Sunil Tyagi, A comparative study of SVM classifiers and artifi-cial neural networks application for rolling element bearing fault diagnosisusing wavelet transform preprocessing, in: Proceedings of World Academy ofScience, Engineering and Technology, vol. 33, September, 2008, pp. 319–327.
29] S. Abbasion, A. Rafsanjani, A. Farshidianfar, N. Irani, Rooling element Bear-ings multi-fault classification based on the wavelet denoising and supportvector machine, Mechanical Systems and Signal Processing Journal 21 (2007)2933–2945.
30] P. Konar, R. Bandyopadhyay, P. Chattopadhyay, Bearing fault detection of induc-tion motor using wavelet and ANN, in: 4th Indian International Conference onArtificial Intelligence, IICAI-2009, 2009.
31] V. Purushotham, S. Narayanan, S.A.N. Prasad, Multi-fault diagnosis of rollingbearing elements using wavelet analysis and hidden Markov model based faultrecognition, NDT&E International Journal 38 (2005) 654–664.
32] Neural Networks – Training Models and Algorithms. Available from:http://www.learnartificialneuralnetworks.com.
33] LIBSVM – A Library for Support Vector Machines. Available from:http://www.csie.ntu.edu.tw/∼cjlin/libsvm.
34] SVM and Kernel Methods Matlab Toolbox. Available from: http://asi.insa-rouen.fr/enseignants/∼arakotom/toolbox/index.html.
Pratyay Konar received B.Tech. in Electrical Engineeringfrom Asansol Engineering College under West Bengal Uni-versity of Technology, India in 2007 and M.E. in ElectricalEngineering with Electrical Machine specialization fromBengal Engineering and Science University, Shibpur, Indiain 2009. He is currently working to pursue Ph.D. in Ben-gal Engineering College and Science University, Shibpur,India. His research interests include image processing andapplication of advanced signal processing and applied softcomputing technique to condition monitoring of electricalmachines.
Paramita Chattopadhyay received the B.E., M.E., andPh.D. in Electrical Engineering from Bengal EngineeringCollege and Science University, Shibpur, India in 1993,1996, and 2002, respectively. she is an assistant profes-sor at Bengal Engineering and Science University, Shibpur,India in electrical engineering department where shespecializes in the fields condition monitoring., power sys-
research interests are applications of advanced signalprocessing and soft computing technique in the area ofcondition monitoring of electrical machines, power sys-tems and nano material applications in power sectors.