Classification of power quality disturbances using wavelet and fuzzy support vector machines
12
302 IEEE TRANSACTIONS ON SUSTAINABLE ENERGY, VOL. 4, NO. 2, APRIL 2013 Classification of Power Quality Disturbances Due to Environmental Characteristics in Distributed Generation System Prakash K. Ray, Member, IEEE, Soumya R. Mohanty, Member, IEEE, and Nand Kishor, Member, IEEE Abstract—The interconnection of the renewable-resources- based distributed generation (DG) system to the existing power system could lead to power quality (PQ) problems, degradation in system reliability, and other associated issues. This paper presents the classification of PQ disturbances caused not only by change in load but also by environmental characteristics such as change in solar insolation and wind speed. Various forms of sag and swell occurrences caused by change in load, variation in wind speed, and solar insolation are considered in the study. Ten different statistical features extracted through S-transform are used in the classification step. The PQ disturbances in terms of statistical features are classified distinctly by use of modular probabilistic neural network (MPNN), support vector machines (SVMs), and least square support vector machines (LS-SVMs) techniques. The classification study is further supported by experimental signals obtained on a prototype setup of wind energy system and PV system. The accuracy and reliability of classification techniques is also assessed on signals corrupted with noise. Index Terms—Classification, least square support vector machines (LS-SVMs), modular probabilistic neural network (MPNN), power quality (PQ), S-transform, support vector ma- chines (SVMs). I. INTRODUCTION T HE interconnection of distributed generation (DG) sys- tems to existing power systems influence power quality (PQ), degrade system reliability, and cause over-voltage and safety issues. The widely popular generation resources are wind, photovoltaic (PV), fuel cell, etc., which can be operated in iso- lated or grid-connected mode depending upon the requirements [1]. Due to some operational issues and uncertainties in power generation from wind and PV systems, these resources need to be integrated along with energy storing devices like battery, fly- wheel, ultracapacitors (UCs), etc., to enhance the quality and reliability of the power supply [2], [3]. The efficient and proper Manuscript received September 10, 2011; revised September 11, 2012; ac- cepted October 09, 2012. Date of publication November 12, 2012; date of cur- rent version March 18, 2013. P. K. Ray is with the Department of Electrical and Electronics Engineering, International Institute of Information Technology, Bhubaneswar 751003, India. S. R. Mohanty and N. Kishor are with the Department of Electrical En- gineering, Motilal Nehru National Institute of Technology Allahabad, Uttar Pradesh 211004, India. Color versions of one or more of the figures in this paper are available online at http://ieeexplore.ieee.org. Digital Object Identifier 10.1109/TSTE.2012.2224678 operation of a PV system depends upon many factors that in- clude solar intensity, cell temperature, cloud/partial shading, and selection of power semiconductor devices [4], [5]. A sim- ilar condition exists even in the operation of a wind farm with any configuration used in design. The power fluctuation at each wind turbine is affected by the turbine type, control algorithm, variation in wind speed, and the tower shadow effect [6]. Thus, power density of these renewable resources that varies over the period potentially lead to unpredictable PQ disturbances like voltage sag/swell along with power flow. They are apart from those caused by load acceptance/rejection, capacitor switching, etc. In conventional power systems, usually, sag/swell in the voltage signal is caused by sudden acceptance/rejection of large nonlinear load, induction motors, transformers, etc. It may be argued here, though, that the PQ disturbances caused by environmental factors seeks importance against those of load change. In fact, PQ disturbances arisen either from the source side or the load side may lead to various operational issues such as malfunctions, failure of electrical equipment, instabilities, and so on [7]. A high penetration of PV arrays whose power pattern is dependent on weather conditions, in future can significantly cause power disturbances like voltage variation, frequency variation, and the harmonics presence in the utility [8]. The authors present a study to suppress the variation of voltage and its frequency caused by loss of periodic cycle at the point of common coupling (PCC). In a PV grid-connected system, power electronics converter and pulsewidth modulated inverter are used to interface the varying power density generated by the PV system. In a PV inverter operation, various functions are incorporated like PV output adjustment to meet inverter voltage, maximum power point tracking to produce an output current in phase with grid voltage for unity power factor, etc. This in turn increases considerably the complexity of the control scheme. The new grid codes put more stringent demand for grid tied PV inverters to track voltage amplitude and its frequency [9]. Again, the large grid impedance variation due to long distribution lines from a low power transformer pose a challenging task in the control of the PV-inverter and the grid filter design [10]. Also, grid impedance depends on load capacity connected to the power distribution network and grid failure. If PQ disturbances caused by environmental characteristic are classified distinctly and known in advance, a suitable mitigation approach may be adopted and thereby enhance the performance of the inverter. Therefore, these disturbances need to be effectively detected and classified for effective operation, control, and protection 1949-3029/$31.00 © 2012 IEEE
-
Upload
independent -
Category
Documents
-
view
0 -
download
0
Transcript of Classification of power quality disturbances using wavelet and fuzzy support vector machines
302 IEEE TRANSACTIONS ON SUSTAINABLE ENERGY, VOL. 4, NO. 2, APRIL 2013
Classification of Power Quality Disturbances Dueto Environmental Characteristics in Distributed
Generation SystemPrakash K. Ray, Member, IEEE, Soumya R. Mohanty, Member, IEEE, and Nand Kishor, Member, IEEE
Abstract—The interconnection of the renewable-resources-based distributed generation (DG) system to the existing powersystem could lead to power quality (PQ) problems, degradation insystem reliability, and other associated issues. This paper presentsthe classification of PQ disturbances caused not only by change inload but also by environmental characteristics such as change insolar insolation and wind speed. Various forms of sag and swelloccurrences caused by change in load, variation in wind speed,and solar insolation are considered in the study. Ten differentstatistical features extracted through S-transform are used in theclassification step. The PQ disturbances in terms of statisticalfeatures are classified distinctly by use of modular probabilisticneural network (MPNN), support vector machines (SVMs), andleast square support vector machines (LS-SVMs) techniques. Theclassification study is further supported by experimental signalsobtained on a prototype setup of wind energy system and PVsystem. The accuracy and reliability of classification techniques isalso assessed on signals corrupted with noise.
Index Terms—Classification, least square support vectormachines (LS-SVMs), modular probabilistic neural network(MPNN), power quality (PQ), S-transform, support vector ma-chines (SVMs).
I. INTRODUCTION
T HE interconnection of distributed generation (DG) sys-tems to existing power systems influence power quality
(PQ), degrade system reliability, and cause over-voltage andsafety issues. The widely popular generation resources are wind,photovoltaic (PV), fuel cell, etc., which can be operated in iso-lated or grid-connected mode depending upon the requirements[1]. Due to some operational issues and uncertainties in powergeneration from wind and PV systems, these resources need tobe integrated along with energy storing devices like battery, fly-wheel, ultracapacitors (UCs), etc., to enhance the quality andreliability of the power supply [2], [3]. The efficient and proper
Manuscript received September 10, 2011; revised September 11, 2012; ac-cepted October 09, 2012. Date of publication November 12, 2012; date of cur-rent version March 18, 2013.P. K. Ray is with the Department of Electrical and Electronics Engineering,
International Institute of Information Technology, Bhubaneswar 751003, India.S. R. Mohanty and N. Kishor are with the Department of Electrical En-
gineering, Motilal Nehru National Institute of Technology Allahabad, UttarPradesh 211004, India.Color versions of one or more of the figures in this paper are available online
at http://ieeexplore.ieee.org.Digital Object Identifier 10.1109/TSTE.2012.2224678
operation of a PV system depends upon many factors that in-clude solar intensity, cell temperature, cloud/partial shading,and selection of power semiconductor devices [4], [5]. A sim-ilar condition exists even in the operation of a wind farm withany configuration used in design. The power fluctuation at eachwind turbine is affected by the turbine type, control algorithm,variation in wind speed, and the tower shadow effect [6]. Thus,power density of these renewable resources that varies over theperiod potentially lead to unpredictable PQ disturbances likevoltage sag/swell along with power flow. They are apart fromthose caused by load acceptance/rejection, capacitor switching,etc. In conventional power systems, usually, sag/swell in thevoltage signal is caused by sudden acceptance/rejection of largenonlinear load, induction motors, transformers, etc.It may be argued here, though, that the PQ disturbances
caused by environmental factors seeks importance againstthose of load change. In fact, PQ disturbances arisen eitherfrom the source side or the load side may lead to variousoperational issues such as malfunctions, failure of electricalequipment, instabilities, and so on [7]. A high penetrationof PV arrays whose power pattern is dependent on weatherconditions, in future can significantly cause power disturbanceslike voltage variation, frequency variation, and the harmonicspresence in the utility [8]. The authors present a study tosuppress the variation of voltage and its frequency caused byloss of periodic cycle at the point of common coupling (PCC).In a PV grid-connected system, power electronics converterand pulsewidth modulated inverter are used to interface thevarying power density generated by the PV system. In a PVinverter operation, various functions are incorporated like PVoutput adjustment to meet inverter voltage, maximum powerpoint tracking to produce an output current in phase withgrid voltage for unity power factor, etc. This in turn increasesconsiderably the complexity of the control scheme. The newgrid codes put more stringent demand for grid tied PV invertersto track voltage amplitude and its frequency [9]. Again, thelarge grid impedance variation due to long distribution linesfrom a low power transformer pose a challenging task in thecontrol of the PV-inverter and the grid filter design [10]. Also,grid impedance depends on load capacity connected to thepower distribution network and grid failure. If PQ disturbancescaused by environmental characteristic are classified distinctlyand known in advance, a suitable mitigation approach may beadopted and thereby enhance the performance of the inverter.Therefore, these disturbances need to be effectively detectedand classified for effective operation, control, and protection
1949-3029/$31.00 © 2012 IEEE
RAY et al.: CLASSIFICATION OF PQ DISTURBANCES DUE TO ENVIRONMENTAL CHARACTERISTICS IN DG SYSTEM 303
of the DG system from any unwanted operation. The PQ dis-turbances need to be classified by use of some suitable patternrecognition/classification techniques.In the past, some studies [11], [12] on islanding detection
in grid-connected PV systems have been considered based onfrequency variation at the PCC. In addition to these, there arevarious research works available in the literature for detectionand classification of PQ disturbances. Of course most of theworks are related to the conventional power system. However,few works are available wherein study of such disturbances hasbeen discussed in wind, PV, or hybrid DG systems.The presence of the DG system opens a new challenging task
to researchers in the study of the detection and classificationproblem.Many of the studies proposed in the literature are based on
artificial intelligence techniques such as artificial neural net-work (ANN), fuzzy logic, expert system, etc. [13]–[15]. Again,Kalman filters and Fourier transform are used for the featureextraction, but these techniques lack the ability to decomposethe signal in both time and frequency domains [16]. In this con-text, wavelet transform (WT) is used along with ANN to detect,localize, and classify the nonstationary due to better time-fre-quency resolution property [17], [18]. But, the main disadvan-tage of WT is its inability to detect the disturbances under thepresence of noise in the voltage/current signal at PCC [19]. Asa result, modified wavelet transform in the form of S-transform[20] along with modular neural network (MNN) and proba-bilistic neural network (PNN) is used due to its improved time-frequency multiresolution analysis for achieving better detec-tion and classification of PQ disturbances even under noisy con-ditions.In this paper, features are extracted by use of S-transform and
techniques like modular probabilistic neural network (MPNN)[21], support vector machine (SVM) [22]–[24], or least squaresupport vector machine (LS-SVM) [25] are applied for classifi-cation of sag/swell disturbances in hybrid DG systems. The tensuitably chosen features are fed to these classifier algorithms.In case of MPNN, each module of neural network (NN) is usedto identify a single class of PQ disturbance. The parameters ofSVMs for classification are selected through cross validation,i.e., a parameter resulting in highest accuracy for successfulclassification over the chosen parameter range. Also, the per-formance of LS-SVM, which retains all the advantages of SVMwith lesser computational burden, is also discussed.This paper is organized as follows: Hybrid DG power system
configuration is introduced in Section II and the classificationapproach in Section III. The effect of the environmental char-acteristic on voltage waveform distortion at PCC is discussedin Section IV followed by feature extraction in Section V. Theclassification results by use of MPNN, SVM, and LS-SVM aregiven in Section VI. Finally, the conclusions drawn from thestudy are given in Section VII.
II. CONFIGURATION OF HYBRID DG SYSTEM
In general, renewable-energy-based resources are intercon-nected at PCC to the main electric grid with an aim to improvereliability in power supply against the load demand. However,the DG penetration in the grid offers new technical challenges
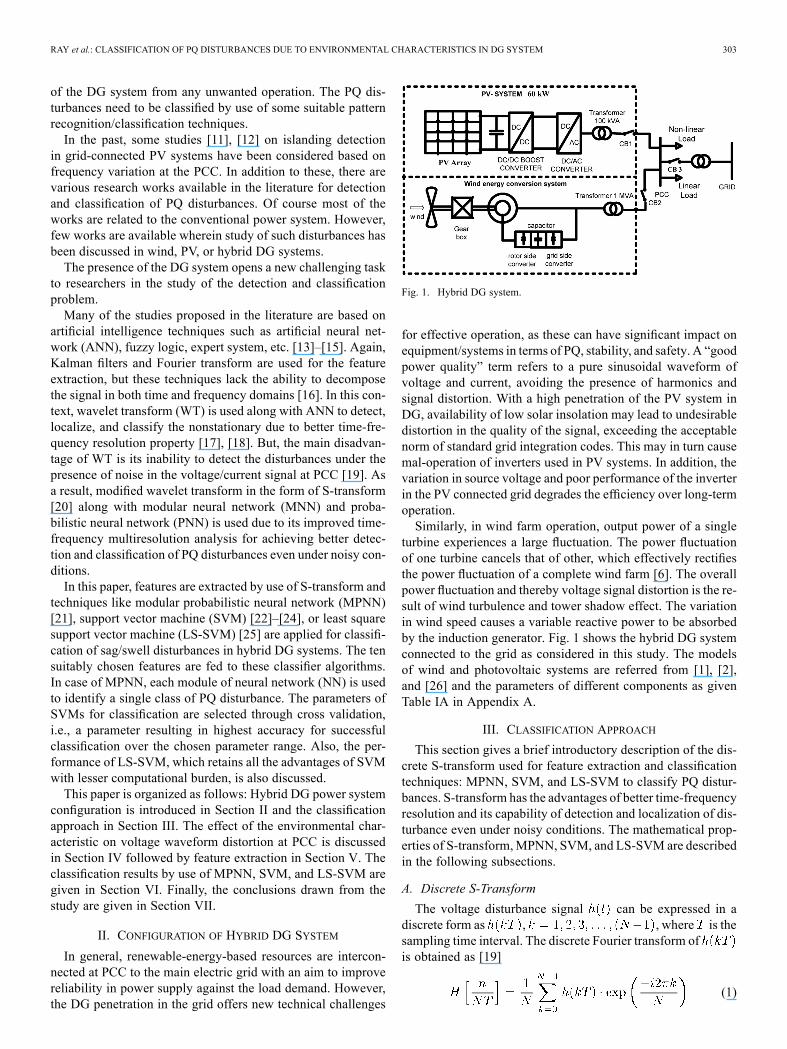
Fig. 1. Hybrid DG system.
for effective operation, as these can have significant impact onequipment/systems in terms of PQ, stability, and safety. A “goodpower quality” term refers to a pure sinusoidal waveform ofvoltage and current, avoiding the presence of harmonics andsignal distortion. With a high penetration of the PV system inDG, availability of low solar insolation may lead to undesirabledistortion in the quality of the signal, exceeding the acceptablenorm of standard grid integration codes. This may in turn causemal-operation of inverters used in PV systems. In addition, thevariation in source voltage and poor performance of the inverterin the PV connected grid degrades the efficiency over long-termoperation.Similarly, in wind farm operation, output power of a single
turbine experiences a large fluctuation. The power fluctuationof one turbine cancels that of other, which effectively rectifiesthe power fluctuation of a complete wind farm [6]. The overallpower fluctuation and thereby voltage signal distortion is the re-sult of wind turbulence and tower shadow effect. The variationin wind speed causes a variable reactive power to be absorbedby the induction generator. Fig. 1 shows the hybrid DG systemconnected to the grid as considered in this study. The modelsof wind and photovoltaic systems are referred from [1], [2],and [26] and the parameters of different components as givenTable IA in Appendix A.
III. CLASSIFICATION APPROACH
This section gives a brief introductory description of the dis-crete S-transform used for feature extraction and classificationtechniques: MPNN, SVM, and LS-SVM to classify PQ distur-bances. S-transform has the advantages of better time-frequencyresolution and its capability of detection and localization of dis-turbance even under noisy conditions. The mathematical prop-erties of S-transform,MPNN, SVM, and LS-SVM are describedin the following subsections.
A. Discrete S-Transform
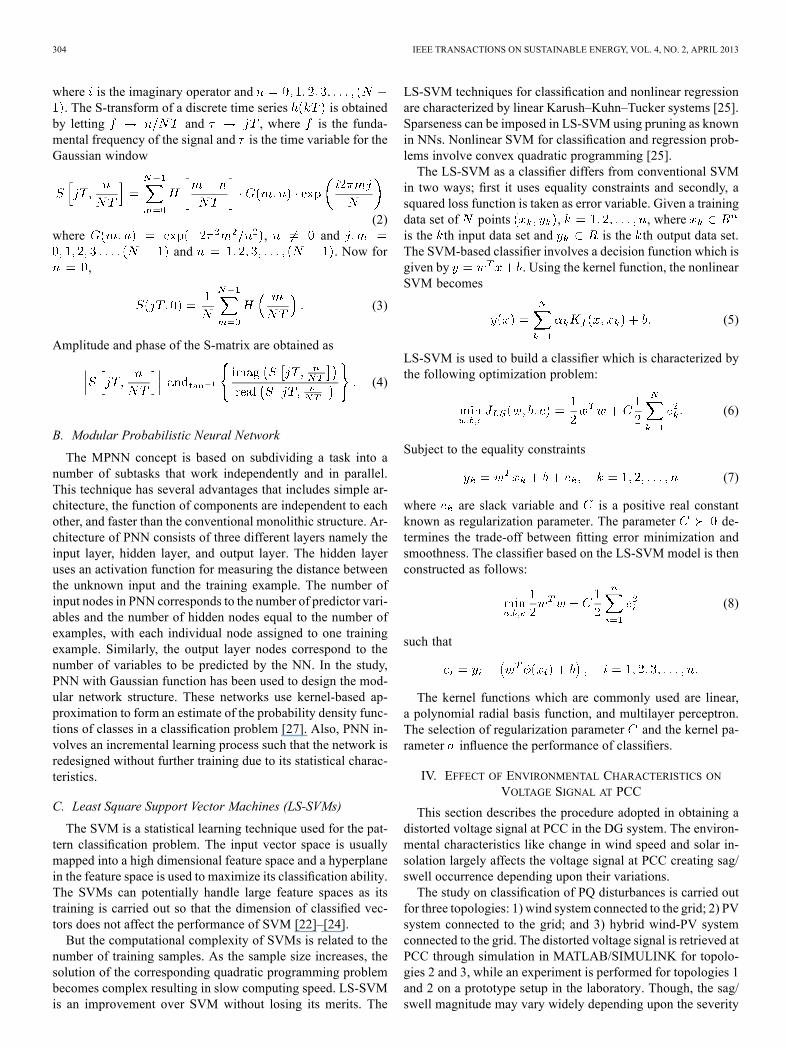
The voltage disturbance signal can be expressed in adiscrete form as , , where is thesampling time interval. The discrete Fourier transform ofis obtained as [19]
(1)
304 IEEE TRANSACTIONS ON SUSTAINABLE ENERGY, VOL. 4, NO. 2, APRIL 2013
where is the imaginary operator and. The S-transform of a discrete time series is obtained
by letting and , where is the funda-mental frequency of the signal and is the time variable for theGaussian window
(2)where , and
and . Now for,
(3)
Amplitude and phase of the S-matrix are obtained as
(4)
B. Modular Probabilistic Neural Network
The MPNN concept is based on subdividing a task into anumber of subtasks that work independently and in parallel.This technique has several advantages that includes simple ar-chitecture, the function of components are independent to eachother, and faster than the conventional monolithic structure. Ar-chitecture of PNN consists of three different layers namely theinput layer, hidden layer, and output layer. The hidden layeruses an activation function for measuring the distance betweenthe unknown input and the training example. The number ofinput nodes in PNN corresponds to the number of predictor vari-ables and the number of hidden nodes equal to the number ofexamples, with each individual node assigned to one trainingexample. Similarly, the output layer nodes correspond to thenumber of variables to be predicted by the NN. In the study,PNN with Gaussian function has been used to design the mod-ular network structure. These networks use kernel-based ap-proximation to form an estimate of the probability density func-tions of classes in a classification problem [27]. Also, PNN in-volves an incremental learning process such that the network isredesigned without further training due to its statistical charac-teristics.
C. Least Square Support Vector Machines (LS-SVMs)
The SVM is a statistical learning technique used for the pat-tern classification problem. The input vector space is usuallymapped into a high dimensional feature space and a hyperplanein the feature space is used to maximize its classification ability.The SVMs can potentially handle large feature spaces as itstraining is carried out so that the dimension of classified vec-tors does not affect the performance of SVM [22]–[24].But the computational complexity of SVMs is related to the
number of training samples. As the sample size increases, thesolution of the corresponding quadratic programming problembecomes complex resulting in slow computing speed. LS-SVMis an improvement over SVM without losing its merits. The
LS-SVM techniques for classification and nonlinear regressionare characterized by linear Karush–Kuhn–Tucker systems [25].Sparseness can be imposed in LS-SVM using pruning as knownin NNs. Nonlinear SVM for classification and regression prob-lems involve convex quadratic programming [25].The LS-SVM as a classifier differs from conventional SVM
in two ways; first it uses equality constraints and secondly, asquared loss function is taken as error variable. Given a trainingdata set of points , , whereis the th input data set and is the th output data set.The SVM-based classifier involves a decision function which isgiven by . Using the kernel function, the nonlinearSVM becomes
(5)
LS-SVM is used to build a classifier which is characterized bythe following optimization problem:
(6)
Subject to the equality constraints
(7)
where are slack variable and is a positive real constantknown as regularization parameter. The parameter de-termines the trade-off between fitting error minimization andsmoothness. The classifier based on the LS-SVM model is thenconstructed as follows:
(8)
such that
The kernel functions which are commonly used are linear,a polynomial radial basis function, and multilayer perceptron.The selection of regularization parameter and the kernel pa-rameter influence the performance of classifiers.
IV. EFFECT OF ENVIRONMENTAL CHARACTERISTICS ONVOLTAGE SIGNAL AT PCC
This section describes the procedure adopted in obtaining adistorted voltage signal at PCC in the DG system. The environ-mental characteristics like change in wind speed and solar in-solation largely affects the voltage signal at PCC creating sag/swell occurrence depending upon their variations.The study on classification of PQ disturbances is carried out
for three topologies: 1) wind system connected to the grid; 2) PVsystem connected to the grid; and 3) hybrid wind-PV systemconnected to the grid. The distorted voltage signal is retrieved atPCC through simulation in MATLAB/SIMULINK for topolo-gies 2 and 3, while an experiment is performed for topologies 1and 2 on a prototype setup in the laboratory. Though, the sag/swell magnitude may vary widely depending upon the severity
RAY et al.: CLASSIFICATION OF PQ DISTURBANCES DUE TO ENVIRONMENTAL CHARACTERISTICS IN DG SYSTEM 305
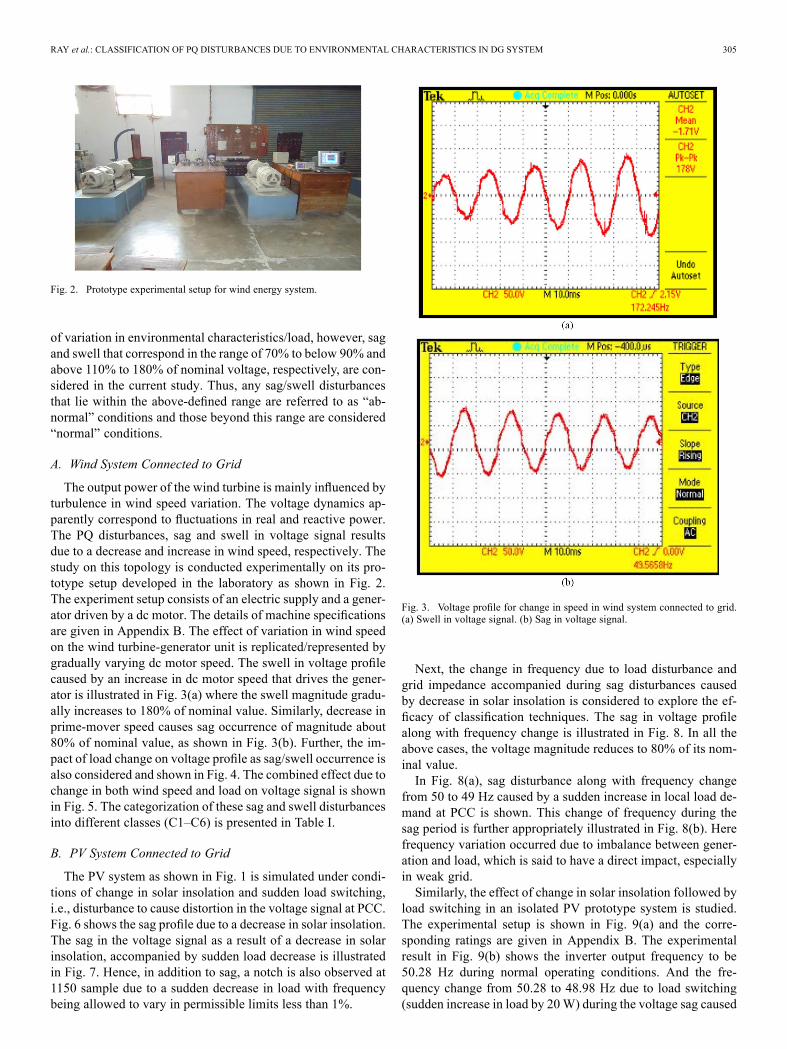
Fig. 2. Prototype experimental setup for wind energy system.
of variation in environmental characteristics/load, however, sagand swell that correspond in the range of 70% to below 90% andabove 110% to 180% of nominal voltage, respectively, are con-sidered in the current study. Thus, any sag/swell disturbancesthat lie within the above-defined range are referred to as “ab-normal” conditions and those beyond this range are considered“normal” conditions.
A. Wind System Connected to Grid
The output power of the wind turbine is mainly influenced byturbulence in wind speed variation. The voltage dynamics ap-parently correspond to fluctuations in real and reactive power.The PQ disturbances, sag and swell in voltage signal resultsdue to a decrease and increase in wind speed, respectively. Thestudy on this topology is conducted experimentally on its pro-totype setup developed in the laboratory as shown in Fig. 2.The experiment setup consists of an electric supply and a gener-ator driven by a dc motor. The details of machine specificationsare given in Appendix B. The effect of variation in wind speedon the wind turbine-generator unit is replicated/represented bygradually varying dc motor speed. The swell in voltage profilecaused by an increase in dc motor speed that drives the gener-ator is illustrated in Fig. 3(a) where the swell magnitude gradu-ally increases to 180% of nominal value. Similarly, decrease inprime-mover speed causes sag occurrence of magnitude about80% of nominal value, as shown in Fig. 3(b). Further, the im-pact of load change on voltage profile as sag/swell occurrence isalso considered and shown in Fig. 4. The combined effect due tochange in both wind speed and load on voltage signal is shownin Fig. 5. The categorization of these sag and swell disturbancesinto different classes (C1–C6) is presented in Table I.
B. PV System Connected to Grid
The PV system as shown in Fig. 1 is simulated under condi-tions of change in solar insolation and sudden load switching,i.e., disturbance to cause distortion in the voltage signal at PCC.Fig. 6 shows the sag profile due to a decrease in solar insolation.The sag in the voltage signal as a result of a decrease in solarinsolation, accompanied by sudden load decrease is illustratedin Fig. 7. Hence, in addition to sag, a notch is also observed at1150 sample due to a sudden decrease in load with frequencybeing allowed to vary in permissible limits less than 1%.
Fig. 3. Voltage profile for change in speed in wind system connected to grid.(a) Swell in voltage signal. (b) Sag in voltage signal.
Next, the change in frequency due to load disturbance andgrid impedance accompanied during sag disturbances causedby decrease in solar insolation is considered to explore the ef-ficacy of classification techniques. The sag in voltage profilealong with frequency change is illustrated in Fig. 8. In all theabove cases, the voltage magnitude reduces to 80% of its nom-inal value.In Fig. 8(a), sag disturbance along with frequency change
from 50 to 49 Hz caused by a sudden increase in local load de-mand at PCC is shown. This change of frequency during thesag period is further appropriately illustrated in Fig. 8(b). Herefrequency variation occurred due to imbalance between gener-ation and load, which is said to have a direct impact, especiallyin weak grid.Similarly, the effect of change in solar insolation followed by
load switching in an isolated PV prototype system is studied.The experimental setup is shown in Fig. 9(a) and the corre-sponding ratings are given in Appendix B. The experimentalresult in Fig. 9(b) shows the inverter output frequency to be50.28 Hz during normal operating conditions. And the fre-quency change from 50.28 to 48.98 Hz due to load switching(sudden increase in load by 20W) during the voltage sag caused
306 IEEE TRANSACTIONS ON SUSTAINABLE ENERGY, VOL. 4, NO. 2, APRIL 2013
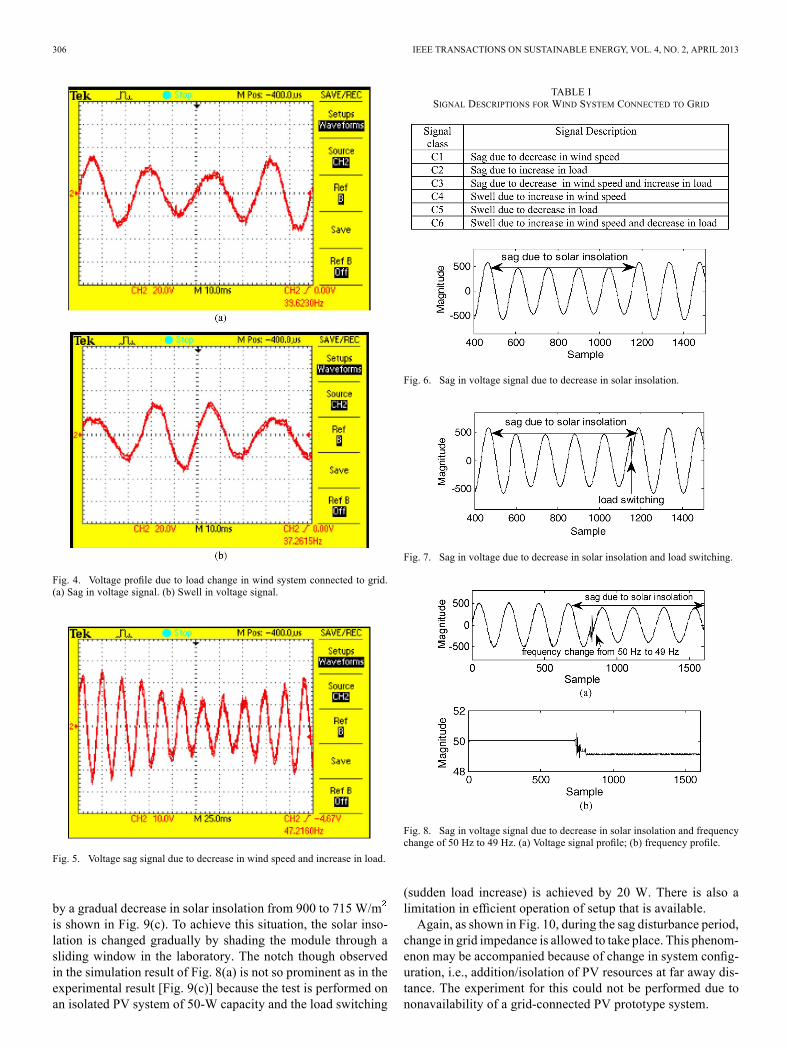
Fig. 4. Voltage profile due to load change in wind system connected to grid.(a) Sag in voltage signal. (b) Swell in voltage signal.
Fig. 5. Voltage sag signal due to decrease in wind speed and increase in load.
by a gradual decrease in solar insolation from 900 to 715 W/mis shown in Fig. 9(c). To achieve this situation, the solar inso-lation is changed gradually by shading the module through asliding window in the laboratory. The notch though observedin the simulation result of Fig. 8(a) is not so prominent as in theexperimental result [Fig. 9(c)] because the test is performed onan isolated PV system of 50-W capacity and the load switching
TABLE ISIGNAL DESCRIPTIONS FOR WIND SYSTEM CONNECTED TO GRID
Fig. 6. Sag in voltage signal due to decrease in solar insolation.
Fig. 7. Sag in voltage due to decrease in solar insolation and load switching.
Fig. 8. Sag in voltage signal due to decrease in solar insolation and frequencychange of 50 Hz to 49 Hz. (a) Voltage signal profile; (b) frequency profile.
(sudden load increase) is achieved by 20 W. There is also alimitation in efficient operation of setup that is available.Again, as shown in Fig. 10, during the sag disturbance period,
change in grid impedance is allowed to take place. This phenom-enon may be accompanied because of change in system config-uration, i.e., addition/isolation of PV resources at far away dis-tance. The experiment for this could not be performed due tononavailability of a grid-connected PV prototype system.

RAY et al.: CLASSIFICATION OF PQ DISTURBANCES DUE TO ENVIRONMENTAL CHARACTERISTICS IN DG SYSTEM 307
Fig. 9. Experimental setup and voltage profile for PV system. (a) Prototypeexperimental setup; (b) voltage profile during normal operating condition(50.28 Hz); (c) voltage profile due to decrease in solar insolation along withswitching (48.98 Hz).
The main objective here is to create different types of distur-bances, though rare ones in the voltage at PCC and their clas-sification using pattern recognition techniques: MPNN, SVM,and LS-SVM. These PQ disturbances represented into differentclasses (C1–C9) are given in Table II.
Fig. 10. Sag in voltage signal due to decrease in solar insolation and gridimpedance change from 0.8 to 1.1 Ohms.
TABLE IISIGNAL DESCRIPTIONS FOR PV SYSTEM CONNECTED TO GRID
TABLE IIISIGNAL DESCRIPTIONS FOR HYBRID DG SYSTEM CONNECTED
TO GRID
C. Hybrid Wind-PV System Connected to Grid
The PQ disturbances, sag and swell as a result of variationin solar insolation, wind speed and load are simulated for thehybrid system, as shown in Fig. 1. A similar characteristic ofvoltage profile corresponding to sag and swell occurrence is ob-served, but these are not given in the manuscript due to space/page restrictions. The PQ disturbances represented in differentclasses is given in Table III. In all these cases, the sag/swellmagnitude remains in the range as defined above.
V. FEATURE EXTRACTION OF DIFFERENT CLASSES
The PQ disturbance signals, sag and swell caused by changein wind speed, solar insolation and load as discussed in theabove section are simulated in MATLAB/SIMULINK as wellas experimentally performed on a prototype setup. By use ofthese signals, the following ten different statistical features areextracted through passage of S-transform:
Feature 1: energy of the magnitude contour (EMC) corre-sponding to maximum magnitude of each column of theS-matrix;
308 IEEE TRANSACTIONS ON SUSTAINABLE ENERGY, VOL. 4, NO. 2, APRIL 2013
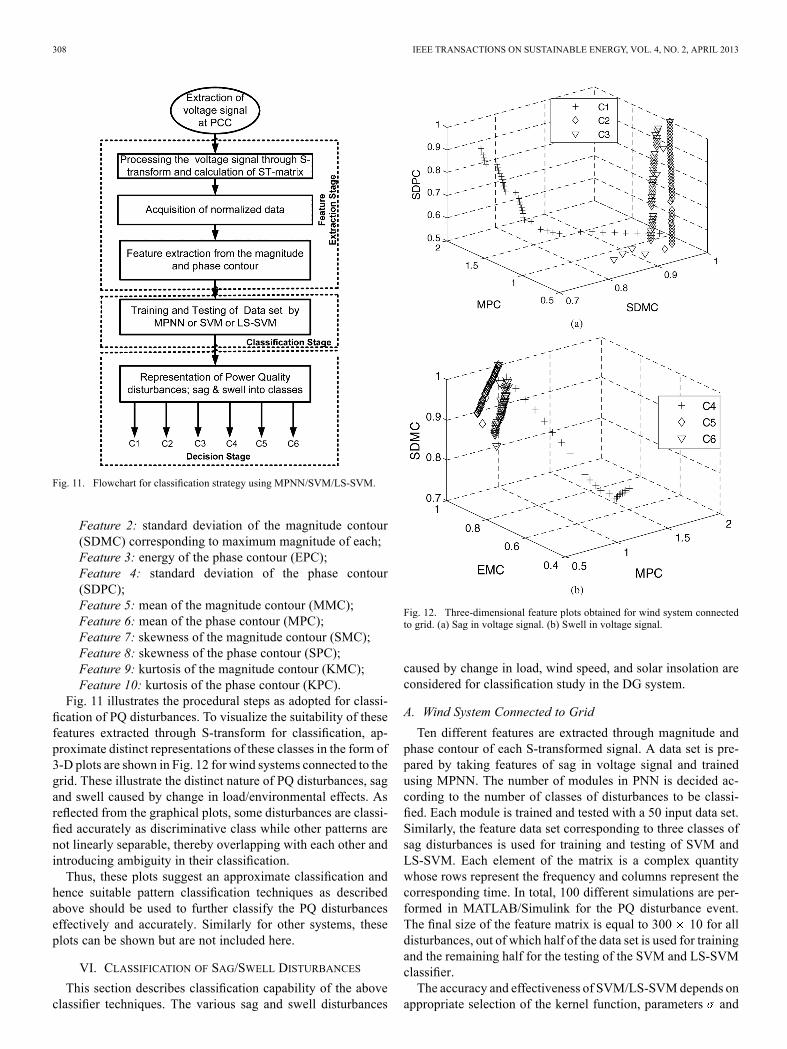
Fig. 11. Flowchart for classification strategy using MPNN/SVM/LS-SVM.
Feature 2: standard deviation of the magnitude contour(SDMC) corresponding to maximum magnitude of each;Feature 3: energy of the phase contour (EPC);Feature 4: standard deviation of the phase contour(SDPC);Feature 5: mean of the magnitude contour (MMC);Feature 6: mean of the phase contour (MPC);Feature 7: skewness of the magnitude contour (SMC);Feature 8: skewness of the phase contour (SPC);Feature 9: kurtosis of the magnitude contour (KMC);Feature 10: kurtosis of the phase contour (KPC).
Fig. 11 illustrates the procedural steps as adopted for classi-fication of PQ disturbances. To visualize the suitability of thesefeatures extracted through S-transform for classification, ap-proximate distinct representations of these classes in the form of3-D plots are shown in Fig. 12 for wind systems connected to thegrid. These illustrate the distinct nature of PQ disturbances, sagand swell caused by change in load/environmental effects. Asreflected from the graphical plots, some disturbances are classi-fied accurately as discriminative class while other patterns arenot linearly separable, thereby overlapping with each other andintroducing ambiguity in their classification.Thus, these plots suggest an approximate classification and
hence suitable pattern classification techniques as describedabove should be used to further classify the PQ disturbanceseffectively and accurately. Similarly for other systems, theseplots can be shown but are not included here.
VI. CLASSIFICATION OF SAG/SWELL DISTURBANCES
This section describes classification capability of the aboveclassifier techniques. The various sag and swell disturbances
Fig. 12. Three-dimensional feature plots obtained for wind system connectedto grid. (a) Sag in voltage signal. (b) Swell in voltage signal.
caused by change in load, wind speed, and solar insolation areconsidered for classification study in the DG system.
A. Wind System Connected to Grid
Ten different features are extracted through magnitude andphase contour of each S-transformed signal. A data set is pre-pared by taking features of sag in voltage signal and trainedusing MPNN. The number of modules in PNN is decided ac-cording to the number of classes of disturbances to be classi-fied. Each module is trained and tested with a 50 input data set.Similarly, the feature data set corresponding to three classes ofsag disturbances is used for training and testing of SVM andLS-SVM. Each element of the matrix is a complex quantitywhose rows represent the frequency and columns represent thecorresponding time. In total, 100 different simulations are per-formed in MATLAB/Simulink for the PQ disturbance event.The final size of the feature matrix is equal to 300 10 for alldisturbances, out of which half of the data set is used for trainingand the remaining half for the testing of the SVM and LS-SVMclassifier.The accuracy and effectiveness of SVM/LS-SVMdepends on
appropriate selection of the kernel function, parameters and
RAY et al.: CLASSIFICATION OF PQ DISTURBANCES DUE TO ENVIRONMENTAL CHARACTERISTICS IN DG SYSTEM 309
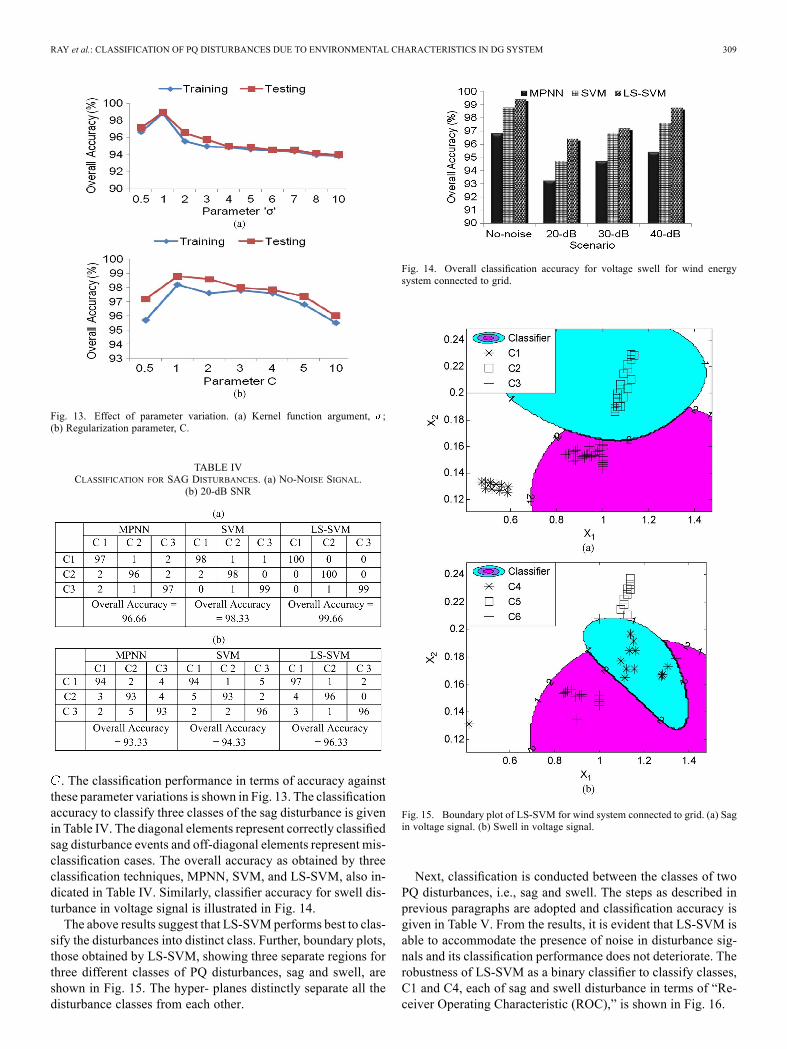
Fig. 13. Effect of parameter variation. (a) Kernel function argument, ;(b) Regularization parameter, C.
TABLE IVCLASSIFICATION FOR SAG DISTURBANCES. (a) NO-NOISE SIGNAL.
(b) 20-dB SNR
. The classification performance in terms of accuracy againstthese parameter variations is shown in Fig. 13. The classificationaccuracy to classify three classes of the sag disturbance is givenin Table IV. The diagonal elements represent correctly classifiedsag disturbance events and off-diagonal elements represent mis-classification cases. The overall accuracy as obtained by threeclassification techniques, MPNN, SVM, and LS-SVM, also in-dicated in Table IV. Similarly, classifier accuracy for swell dis-turbance in voltage signal is illustrated in Fig. 14.The above results suggest that LS-SVMperforms best to clas-
sify the disturbances into distinct class. Further, boundary plots,those obtained by LS-SVM, showing three separate regions forthree different classes of PQ disturbances, sag and swell, areshown in Fig. 15. The hyper- planes distinctly separate all thedisturbance classes from each other.
Fig. 14. Overall classification accuracy for voltage swell for wind energysystem connected to grid.
Fig. 15. Boundary plot of LS-SVM for wind system connected to grid. (a) Sagin voltage signal. (b) Swell in voltage signal.
Next, classification is conducted between the classes of twoPQ disturbances, i.e., sag and swell. The steps as described inprevious paragraphs are adopted and classification accuracy isgiven in Table V. From the results, it is evident that LS-SVM isable to accommodate the presence of noise in disturbance sig-nals and its classification performance does not deteriorate. Therobustness of LS-SVM as a binary classifier to classify classes,C1 and C4, each of sag and swell disturbance in terms of “Re-ceiver Operating Characteristic (ROC),” is shown in Fig. 16.
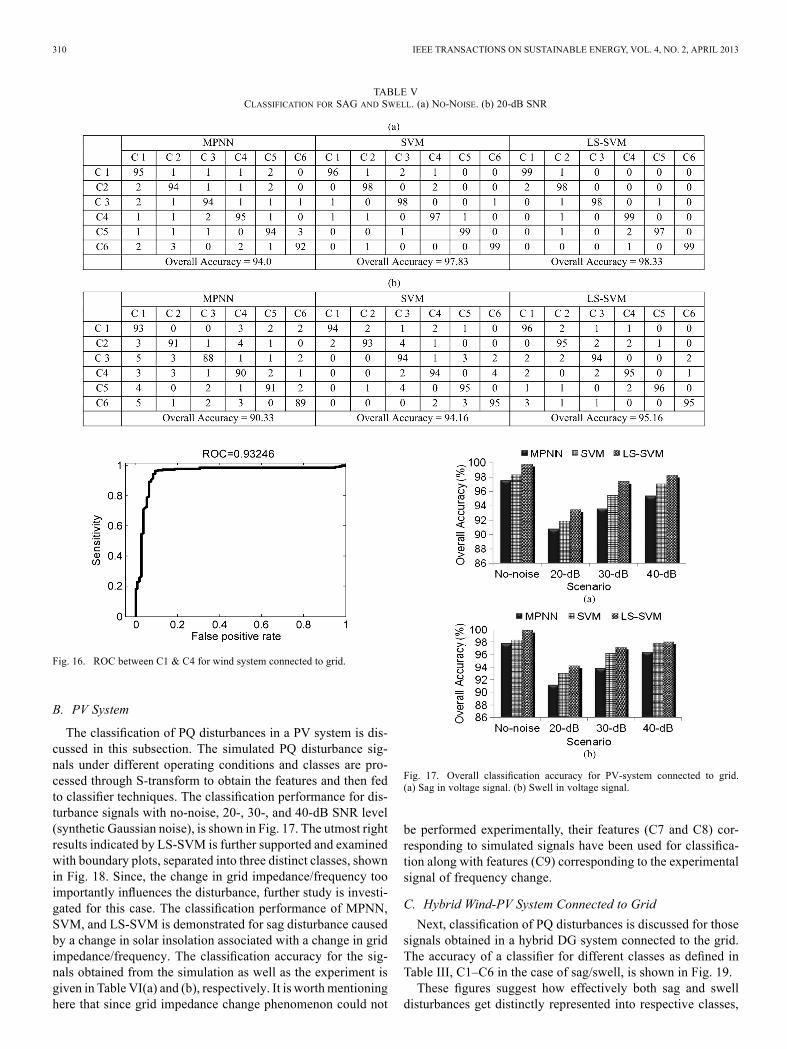
310 IEEE TRANSACTIONS ON SUSTAINABLE ENERGY, VOL. 4, NO. 2, APRIL 2013
TABLE VCLASSIFICATION FOR SAG AND SWELL. (a) NO-NOISE. (b) 20-dB SNR
Fig. 16. ROC between C1 & C4 for wind system connected to grid.
B. PV System
The classification of PQ disturbances in a PV system is dis-cussed in this subsection. The simulated PQ disturbance sig-nals under different operating conditions and classes are pro-cessed through S-transform to obtain the features and then fedto classifier techniques. The classification performance for dis-turbance signals with no-noise, 20-, 30-, and 40-dB SNR level(synthetic Gaussian noise), is shown in Fig. 17. The utmost rightresults indicated by LS-SVM is further supported and examinedwith boundary plots, separated into three distinct classes, shownin Fig. 18. Since, the change in grid impedance/frequency tooimportantly influences the disturbance, further study is investi-gated for this case. The classification performance of MPNN,SVM, and LS-SVM is demonstrated for sag disturbance causedby a change in solar insolation associated with a change in gridimpedance/frequency. The classification accuracy for the sig-nals obtained from the simulation as well as the experiment isgiven in Table VI(a) and (b), respectively. It is worthmentioninghere that since grid impedance change phenomenon could not
Fig. 17. Overall classification accuracy for PV-system connected to grid.(a) Sag in voltage signal. (b) Swell in voltage signal.
be performed experimentally, their features (C7 and C8) cor-responding to simulated signals have been used for classifica-tion along with features (C9) corresponding to the experimentalsignal of frequency change.
C. Hybrid Wind-PV System Connected to Grid
Next, classification of PQ disturbances is discussed for thosesignals obtained in a hybrid DG system connected to the grid.The accuracy of a classifier for different classes as defined inTable III, C1–C6 in the case of sag/swell, is shown in Fig. 19.These figures suggest how effectively both sag and swell
disturbances get distinctly represented into respective classes,
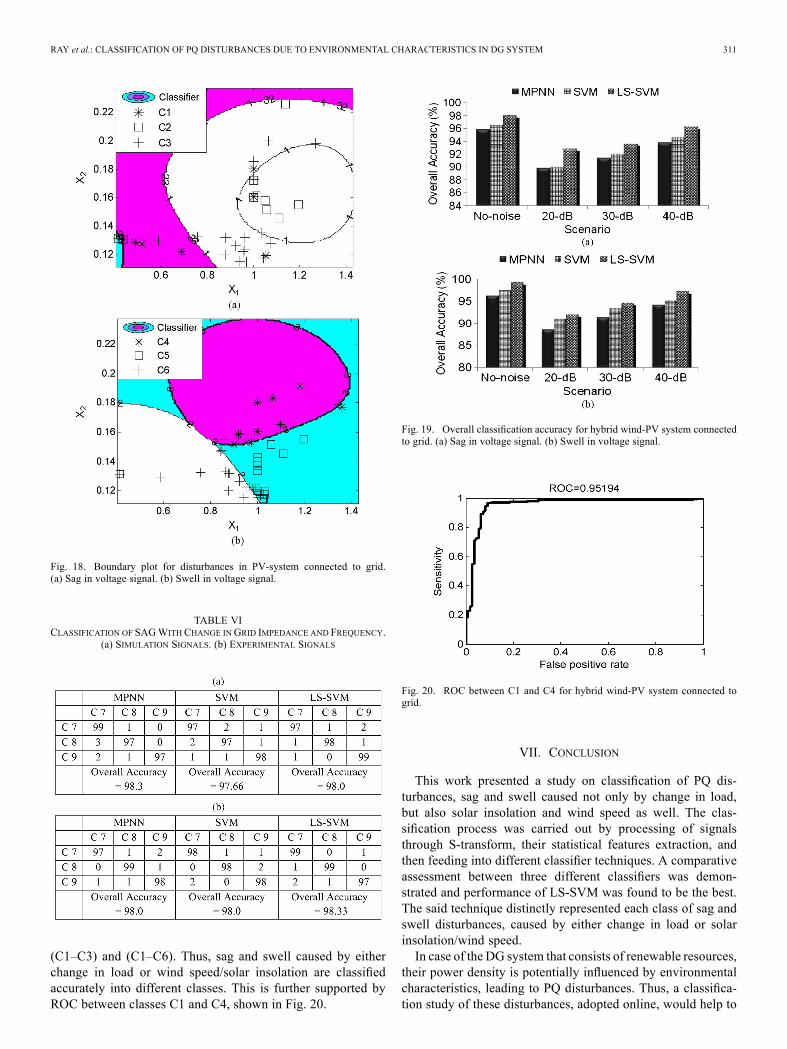
RAY et al.: CLASSIFICATION OF PQ DISTURBANCES DUE TO ENVIRONMENTAL CHARACTERISTICS IN DG SYSTEM 311
Fig. 18. Boundary plot for disturbances in PV-system connected to grid.(a) Sag in voltage signal. (b) Swell in voltage signal.
TABLE VICLASSIFICATION OF SAGWITH CHANGE IN GRID IMPEDANCE AND FREQUENCY.
(a) SIMULATION SIGNALS. (b) EXPERIMENTAL SIGNALS
(C1–C3) and (C1–C6). Thus, sag and swell caused by eitherchange in load or wind speed/solar insolation are classifiedaccurately into different classes. This is further supported byROC between classes C1 and C4, shown in Fig. 20.
Fig. 19. Overall classification accuracy for hybrid wind-PV system connectedto grid. (a) Sag in voltage signal. (b) Swell in voltage signal.
Fig. 20. ROC between C1 and C4 for hybrid wind-PV system connected togrid.
VII. CONCLUSION
This work presented a study on classification of PQ dis-turbances, sag and swell caused not only by change in load,but also solar insolation and wind speed as well. The clas-sification process was carried out by processing of signalsthrough S-transform, their statistical features extraction, andthen feeding into different classifier techniques. A comparativeassessment between three different classifiers was demon-strated and performance of LS-SVM was found to be the best.The said technique distinctly represented each class of sag andswell disturbances, caused by either change in load or solarinsolation/wind speed.In case of the DG system that consists of renewable resources,
their power density is potentially influenced by environmentalcharacteristics, leading to PQ disturbances. Thus, a classifica-tion study of these disturbances, adopted online, would help to
312 IEEE TRANSACTIONS ON SUSTAINABLE ENERGY, VOL. 4, NO. 2, APRIL 2013
apply mitigation techniques to improve system operation, forexample, in inverter control of a grid-connected PV system.
APPENDIX A
TABLE IAPARAMETERS OF THE HYBRID SYSTEM
APPENDIX B
Experimental Setup Details
Wind energy system: Motor-alternator Set-.
DC Motor: 220 V, 45 amp, 1500 rpm, 6 kW; Alternator:3-ph, 440 V, 13.9 amp (per line), 9 kVA, 50 Hz, 1500 rpm.
Three phase load—4.5 kW, 440 V(L-L), 10 amp (per line,maximum), 50 Hz; Digital storage oscilloscope—TDS2002, two-channel, 60 MHz with RS 232 communicationkit and Tektronix data transfer software; Personal com-puter: Pentium-IV, 2.2 GHz, 1-GB RAM, 160-GB HardDisk.
PV system: 50 W, 17 V (maximum voltage), 24 V (O.C.voltage), 3 amp (maximum current), 5 amp (S.C. current),25 C.
Battery back-up system—12 V, 7.2 Ah; Inverter: 12-V dc(input); 230-V ac (output), 50 Hz.
Load—0-60 W, 230 V, 50 Hz, 5 amp, Resistive load (Elec-tric Bulb Loads).
ACKNOWLEDGMENT
The authors would like to thank Mr. M. Das (IIIT,Bhubaneswar) and technical experts from Orissa Renew-able Energy Development Association along with NextronicsSolar Technology Pvt. Ltd., Orissa for their technical sup-port and encouragements during the experimental work atPV system. The experimental study was performed in theRenewable Energy Research Laboratory of the Electrical andElectronics Engineering Department, International Institute ofInformation Technology, Bhubaneswar, Orissa, India.
REFERENCES
[1] T. Ackermann, Wind Power in Power Systems. Chichester: Wiley,2005.
[2] S.-K. Kim, J.-H. Jeon, C.-H. Cho, J.-B. Ahn, and S.-H. Kwon, “Dy-namic modeling and control of a grid-connected hybrid generationsystem with versatile power transfer,” IEEE Trans. Ind. Electron., vol.55, no. 4, pp. 1677–1688, Apr. 2008.
[3] P. K. Ray, S. R. Mohanty, and N. Kishor, “Proportional-integral con-troller based small-signal analysis of hybrid distributed generation sys-tems,” Energy Convers. Manage., vol. 52, pp. 1943–1954, 2011.
[4] G. Chicco, J. Schlabbach, and F. Spertino, “Experimental assessmentof the waveform distortion in grid connected photovoltaic installa-tions,” Solar Energy, vol. 83, pp. 1026–1039, 2009.
[5] M. Patsalides, D. Evagorou, G. Makrides, Z. Achillides, G. E.Georghiou, A. Stavrou, V. Efthimiou, B. Zinsser, W. Schmitt, andJ. H. Werner, “The effect of solar irradiance on the power qualitybehaviour of grid connected photovoltaic systems,” in Proc. Conf.Renewable Energy and Power Quality, 2007, pp. 28–35.
[6] J. T. Bialasiewicz and E. Muljadi, “The wind farm aggregation im-pact on power quality,” in Proc. 32nd IEEE Ann. Conf. Industrial Elec-tronics (IECON), Paris, France, Nov. 2006, pp. 4195–4200.
[7] F. A. Viawan, D. Karlsson, A. Sannino, and J. Daalder, “Protectionscheme for meshed distribution systems with high penetration of dis-tributed generation,” in Proc. IEEE Power System Conf. Expositioin,2006, pp. 99–104.
[8] H. S. Kim, “A study of utility interactive PV system in harmony withutility,” in Proc. IEEE 31st Ann. Power Electronics Specialists Conf.(PESC’00), 2000, pp. 1179–1184.
[9] A. Nagliero, R. A. Mastromauro, M. Liserre, and A. Dell’Aquila,“Monitoring and synchronization techniques for single-phase PVsystems,” in Proc. Int. Symp. Power Electronics Electrical Drives,Automation and Motion (SPEEDAM), 2010, pp. 1404–1409.
[10] M. Liserre, R. Teodorescu, and F. Blaabjerg, “Stability of grid-con-nected PV inverters with large grid impedance variation,” in Proc.IEEE 35th Ann. Power Electronics Specialists Conf. (PESC’04), 2004,pp. 4773–4779.
[11] G. H. Choe, H. S. Kim, H. G. Kim, Y. H. Choi, and J. C. Kim, “Thecharacteristic analysis of grid frequency variation under islandingmode for utility interactive PV system with reactive power variationscheme for anti-islanding,” in Proc. IEEE 37th Ann. Power ElectronicsSpecialists Conf. (PESC’06), Jun. 18–22, 2006, pp. 1–5.
[12] Z. Y. Wang, B. C. Zhao, X. C. Shi, and Y. W. Zhu, “A new method ofdetecting PV grid connected inverter islanding based on the frequencyvariation,” in Proc. Int. Conf. Materials for Renewable Energy & En-vironmental (CMREE), May 20–22, 2011, pp. 44–48.
[13] A. K. Ghosh and D. L. Lubkeman, “The classification of power systemdisturbance waveforms using a neural network approach,” IEEE Trans.Power Del., vol. 10, no. 1, pp. 109–115, Jan. 1995.
[14] T. X. Zhu, S. K. Tso, and K. L. Lo, “Wavelet-based fuzzy reasoning ap-proach to power quality disturbance recognition,” IEEE Trans. PowerDel., vol. 19, no. 4, pp. 1928–1935, Oct. 2004.
[15] M. B. I. Reaz, F. Choong, M. S. Sulaiman, F. Mohd-Yasin, and M. Ka-mada, “Expert system for power quality disturbance classifier,” IEEETrans. Power Del., vol. 22, no. 3, pp. 1979–1988, Jul. 2007.
[16] M. H. J. Bollen and I. Gu, Signal Processing of Power Quality Distur-bances. Hoboken, NJ: Wiley-IEEE Press, 2006.
[17] S. Santoso, E. J. Powers, W. M. Grady, and P. Hofmann, “Powerquality assessment via wavelet transform analysis,” IEEE Trans.Power Del., vol. 11, no. 2, pp. 924–930, Apr. 1996.
[18] S. Santoso, E. J. Powers, W. M. Grady, and A. Parsons, “Powerquality disturbance waveform recognition using wavelet-based neuralclassifier, part 1: Theoretical foundation,” in Proc. IEEE/PES WinterMeeting, New York, 1997.
[19] P. K. Dash, B. K. Panigrahi, and G. Panda, “Power quality analysisusing S-transform,” IEEE Trans. Power Del., vol. 18, no. 2, pp.406–411, Apr. 2003.
[20] C. N. Bhende, S. Mishra, and B. K. Panigrahi, “Detection and classi-fication of power quality disturbances using S-transform and modularneural network,” Elect. Power Syst. Res., vol. 78, pp. 122–128, 2008.
[21] A. K. Pradhan, S. R. Mohanty, and A. Routray, “Neural fault classi-fier for transmission line protection—A modular approach,” in Proc.IEEE/PES Meeting, Montreal, Canada, Jun. 18–22, 2006.
[22] R. Salat and S. Osowski, “Accurate fault location in the power trans-mission line using support vector machine approach,” IEEE Trans.Power Syst., vol. 19, no. 2, pp. 979–986, May 2004.
[23] P. K. Dash, S. R. Samantaray, and G. Panda, “Fault classification andsection identification of an advanced series-compensated transmissionline using support vector machine,” IEEE Trans. Power Del., vol. 22,no. 1, pp. 67–73, Jan. 2007.
RAY et al.: CLASSIFICATION OF PQ DISTURBANCES DUE TO ENVIRONMENTAL CHARACTERISTICS IN DG SYSTEM 313
[24] S. Ekici, “Classification of power system disturbances using supportvector machines,” Expert Syst. With Applicat., vol. 36, pp. 9859–9868,2009.
[25] J. A. K. Suykens, T. V. Gestel, J. D. Brabanter, B. DeMoor, and J. Van-dewalle, Least Square Support Vector Machine, 1st ed. Singapore:World Scientific, 2002, 981-238-151-1.
[26] P. K. Ray, S. R.Mohanty, and N. Kishor, “Disturbance detection in gridconnected distributed generation system using wavelet and S-trans-form,” Elect. Power Syst. Res., vol. 81, pp. 805–819, 2011.
[27] S. Haykin, Neural Networks: A Comprehensive Foundation. Engle-wood Cliffs, NJ: Prentice-Hall, 1995.
Prakash K. Ray (S’10–M’12) is working towardthe Ph.D. degree in the Department of ElectricalEngineering, Motilal Nehru National Institute ofTechnology, Allahabad, India.He also serves on the faculty in the Department of
Electrical and Electronics Engineering, InternationalInstitute of Information Technology, Bhubaneswar,India. His research area includes distributed genera-tions, renewable energy resources, and digital signalprocessing applications in power quality.
Soumya R. Mohanty (M’08) received the Ph.D. de-gree from Indian Institute of Technology, Kharagpur,India.Currently he is an Assistant Professor in the De-
partment of Electrical Engineering, Motilal NehruNational Institute of Technology, Allahabad, India.He was as postdoctoral fellow from February toJuly, 2012 at the Department of ElectromechanicalEngineering, University of Beira Interior (UBI).His research area includes digital signal processingapplications in power system relaying and power
quality, and pattern recognition applications to distributed generation-basedpower systems.
Nand Kishor (S’05–M’06) received the Ph.D. de-gree from Indian Institute of Technology, Roorkee,India.He is an Associate Professor in the Department of
Electrical Engineering, Motilal Nehru National Insti-tute of Technology, Allahabad, India. Since August2012, he has worked as a Marie Curie ExperiencedResearcher (Marie Curie Fellow) at the Electrical En-gineering Department, Aalto University, Finland. Hisresearch area includes Artificial Intelligence (AI) ap-plications in power systems, distributed generations,
wireless sensor network, and digital signal processing applications in power sys-tems.